UNITED STATES
SECURITIES AND EXCHANGE COMMISSION
Washington, D.C. 20549
FORM 10-Q
(Mark One)
| | | | | |
| ☒ | QUARTERLY REPORT PURSUANT TO SECTION 13 OR 15(d) OF THE SECURITIES EXCHANGE ACT OF 1934 |
For the quarterly period ended September 30, 2023March 31, 2024 |
| or |
| ☐ | TRANSITION REPORT PURSUANT TO SECTION 13 OR 15(d) OF THE SECURITIES EXCHANGE ACT OF 1934 |
| For the transition period from to |
Commission file number 001-39606
SoFi Technologies, Inc.
(Exact name of registrant as specified in its charter)
| | | | | | | | |
| Delaware | | 98-1547291 |
| (State or other jurisdiction of incorporation or organization) | | (I.R.S. Employer Identification No.) |
234 1st Street San Francisco, California | | 94105 |
| (Address of principal executive offices) | | (Zip Code) |
(855) 456-7634
(Registrant’s telephone number, including area code)
Securities registered pursuant to Section 12(b) of the Act:
| | | | | | | | | | | | | | |
| Title of each class | | Trading Symbol(s) | | Name of each exchange on which registered |
| Common stock, $0.0001 par value per share | | SOFI | | The Nasdaq Global Select Market |
Indicate by check mark whether the registrant (1) has filed all reports required to be filed by Section 13 or 15(d) of the Securities Exchange Act of 1934 during the preceding 12 months (or for such shorter period that the registrant was required to file such reports), and (2) has been subject to such filing requirements for the past 90 days. Yes ☒ No ☐
Indicate by check mark whether the registrant has submitted electronically every Interactive Data File required to be submitted and posted pursuant to Rule 405 of Regulation S-T (§232.405 of this chapter) during the preceding 12 months (or for such shorter period that the registrant was required to submit such files). Yes ☒ No ☐
Indicate by check mark whether the registrant is a large accelerated filer, an accelerated filer, a non-accelerated filer, a smaller reporting company, or an emerging growth company. See the definitions of “large accelerated filer,” “accelerated filer,” “smaller reporting company,” and “emerging growth company” in Rule 12b-2 of the Exchange Act.
| | | | | | | | | | | |
| Large accelerated filer | ☒ | Accelerated filer | ☐ |
| Non-accelerated filer | ☐ | Smaller reporting company | ☐ |
| | Emerging growth company | ☐ |
If an emerging growth company, indicate by check mark if the registrant has elected not to use the extended transition period for complying with any new or revised financial accounting standards provided pursuant to Section 13(a) of the Exchange Act. ☐
Indicate by check mark whether the registrant is a shell company (as defined in Rule 12b-2 of the Exchange Act). Yes ☐ No ☒
The number of shares of the registrant’s common stock, par value $0.0001 per share, outstanding as of October 31, 2023April 30, 2024 was 958,742,7171,057,223,164 shares.
SOFI TECHNOLOGIES, INC.
TABLE OF CONTENTS
| | | | | | | | |
| | Page |
| Page |
| |
| PART I – FINANCIAL INFORMATION | |
| Item 1. | | |
| | |
| | |
| | |
| | |
| | |
| | |
| | |
| | |
| | |
| | |
| | |
| | |
| | |
| | |
| | |
| | |
| | |
| | |
| | |
| | |
| | |
| | |
| | |
| Item 2. | | |
| Item 3. | | |
| Item 4. | | |
| | |
| PART II – OTHER INFORMATION | |
| Item 1. | | |
| Item 1A. | | |
| Item 2. | | |
| Item 3. | | |
| Item 4. | | |
| Item 5. | | |
| Item 6. | | |
| | |
| |
Glossary of Terms and Acronyms
| | | | | |
ACH: Automated clearing house | GAAP: U.S. Generally Accepted Accounting Principles |
AFS: Available-for-sale | GLBA: Gramm-Leach-Bliley Act |
ALCO: Asset Liability Committee | Golden Pacific: Golden Pacific Bancorp, Inc. |
AWS: Amazon Web Services | GSE: Government-Sponsored Enterprise |
AOCI: Accumulated other comprehensive income (loss) | HFI: Held for investment |
ASU: Accounting Standards Update | HFS: Held for sale |
ATDS: Automatic telephone dialing systems | HMDA: Home Mortgage Disclosure Act |
BHCA: Bank Holding Company Act of 1956, as amended | IRLC: Interest rate lock commitment |
BPS: Basis points | IRS: Internal Revenue Service |
BSA: Bank Secrecy Act | LIBOR: London Inter-Bank Offered Rate |
CALM: Capital and Asset Liability Management policy | MLA: Military Lending Act |
CARES Act: Coronavirus Aid, Relief, and Economic Security Act | MOHELA: Missouri Higher Education Loan Authority |
CCPA: California Consumer Privacy Act | MSB: Money services business |
CD: Community Development | MSRB: Municipal Securities Rulemaking Board |
CET1: Common Equity Tier 1 | NACHA: National Automated Clearinghouse Association |
CFP: Certified financial planners | Nasdaq: The Nasdaq Global Select Market |
CFPA: Consumer Financial Protection Act | OCC: Office of the Comptroller of the Currency |
CFPB: Consumer Financial Protection Bureau | OFAC: Office of Foreign Assets Control |
CFTC: Commodity Futures Trading Commission | PCD: Purchased credit deteriorated |
CISO: Chief Information Security Officer | PFOF: Payment for order flow |
CODM: Chief Operating Decision Maker | PSU: Performance stock units |
CPA: Colorado Privacy Act | QIA: Qatar Investment Authority |
CPPA: California Privacy Protection Act | RESPA: Real Estate Settlement Procedures Act |
CPRA: California Privacy Rights Act | ROU: Right-of-use |
CRA: Community Reinvestment Act | RSU: Restricted stock units |
DACA: Deferred Access for Childhood Arrival | SCH: Social Capital Hedosophia Holdings Corp. V |
DCF: Discounted cash flow | SCRA: Servicemembers’ Civil Relief Act |
DE&I: Diversity, Equity and Inclusion | SEC: U.S. Securities and Exchange Commission |
DEP: Digital engagement practices | SPAC: Special purpose acquisition company |
Dodd-Frank Act: Dodd-Frank Wall Street Reform and Consumer | Social Finance: Social Finance, Inc. |
| Protection Act of 2010 | SoFi Bank: SoFi Bank, National Association |
DSU: Deferred stock units | SoFi Capital Advisors: SoFi Capital Advisors, LLC |
EC: European Commission | SoFi Securities: SoFi Securities LLC |
ECOA: Equal Credit Opportunity Act | SoFi Stadium: The LA Stadium and Entertainment District at Hollywood |
EFTA: Electronic Fund Transfer Act | Park in Inglewood, California |
ESG: Environmental, social and corporate governance | SoFi Wealth: SoFi Wealth LLC |
ESIGN: Electronic Signatures in Global and National Commerce Act | SOFR: Secured Overnight Financing Rate |
ETF: Exchange-Traded Funds | SPE: Special purpose entity |
FCA: Financial Conduct Authority | SRO: Self-regulatory organizations |
FCRA: Fair Credit Reporting Act | TBA: To-be-announced security |
FDCPA: Fair Debt Collection Practices Act | TCJA: Tax Cuts and Jobs Act |
FDIA: Federal Deposit Insurance Act | TCPA: Federal Telephone Consumer Protection Act |
FDIC: Federal Deposit Insurance Corporation | Technisys: Technisys S.A., a Luxembourg société anonyme |
Federal Reserve: Board of Governors of the Federal Reserve System | TDR: Troubled debt restructuring |
FHA: Fair Housing Act | TILA: Truth in Lending Act |
FHFA: Federal Housing Finance Agency | UDAAP: Unfair, deceptive or abusive acts or practices |
FHLB: Federal Home Loan Bank | UETA: Uniform Electronic Transactions Act |
FinCEN: Financial Crimes Enforcement Network | URG: Underrepresented Group |
FINRA: Financial Industry Regulatory Authority | VA: United Stated Department of Veterans Affairs |
FRB: Federal Reserve Bank of San Francisco | VIE: Variable interest entity |
FTC: Federal Trade Commission | Wyndham: Wyndham Capital Mortgage |
FTP: Fund transfer pricing | |
SoFi Technologies, Inc.
As used in this Quarterly Report on Form 10-Q, unless the context requires otherwise, references to “SoFi”, the “Company”, “we”, “us”, and “our”, and similar references refer to SoFi Technologies, Inc. and its wholly-owned subsidiaries following the Business Combination (as defined herein) and to Social Finance, Inc. prior to the Business Combination.
Social Finance, Inc. (“Social Finance”) entered into a merger agreement (the “Agreement”) with Social Capital Hedosophia Holdings Corp. V (“SCH”) on January 7, 2021. The transactions contemplated by the terms of the Agreement were completed on May 28, 2021 (the “Closing”), in conjunction with which SCH changed its name to SoFi Technologies, Inc. (hereafter referred to, collectively with its subsidiaries, as “SoFi”, the “Company”, “we”, “us” or “our”, unless the context otherwise requires). The transactions contemplated in the Agreement are collectively referred to as the “Business Combination”.
In March 2021,February 2022, we entered into an agreement to acquireacquired Golden Pacific Bancorp, Inc. (“Golden Pacific”), a bank holding company, and its wholly-owned subsidiary, Golden Pacific Bank, National Association, a national bank (the “Bank Merger”). The Bank Merger closed in February 2022,, after which we became a bank holding company and renamed Golden Pacific Bank as SoFi Bank, National Association (“SoFi Bank”).
In FebruaryMarch 2022, we entered into an agreement to acquireacquired Technisys S.A. (“Technisys”), a Luxembourg société anonyme and a cloud-native digital multi-product core banking platform (the “Technisys Merger”). The Technisys Merger closed in March 2022.
In April 2023, we acquired Wyndham, Capital Mortgage (“Wyndham”), a leading fintech mortgage lender.
See Note 2. Business Combinations to the Notes to Condensed Consolidated Financial Statements within Part I, Item 1. for additional information on our business combinations.
Refer to Glossary of Terms and Acronyms for the definitions of certain terms, acronyms and abbreviations used in this document.
CAUTIONARY STATEMENT REGARDING FORWARD-LOOKING STATEMENTS
This Quarterly Report on Form 10-Q contains statements that are forward-looking and as such are not historical facts. This includes, without limitation, statements regarding the financial position, business strategy and the plans and objectives of management for our future operations; anticipated trends and prospects in the industries in which our business operates; new products, services and related strategies; anticipated actions by governmental authorities; and macroeconomic conditions. These statements constitute projections, forecasts and forward-looking statements, and are not guarantees of performance. Such statements can be identified by the fact that they do not relate strictly to historical or current facts. When used in this Quarterly Report on Form 10-Q, words such as “aim”, “allow”, “anticipate”, “believe”, “can”, “continue”, “could”, “estimate”, “expect”, “if”, “intend”, “likely”, “may”, “might”, “opportunity”, “plan”, “possible”, “potential”, “predict”, “project���“project”, “should”, “strive”, “will”, “would” and similar expressions may identify forward-looking statements, but the absence of these words does not mean that a statement is not forward-looking.
Forward-looking statements are subject to risks, uncertainties, and other factors described in Part II, Item 1A. “Risk Factors” and elsewhere in this Quarterly Report on Form 10-Q and our other filings with the Securities and Exchange Commission (“SEC”)SEC and include, among other things:
•our ability to achieve and maintain profitability in the future;
•the impact on our business of the regulatory environment and complexities with compliance;
•the effect and impact of evolving laws, rules, regulations and government enforcement policies, including any federal or state loan forgiveness programs;
•the impact of adverse developments affecting the U.S. or global banking industry, including bank failures and liquidity concerns, which could cause economic and market volatility, and regulatory responses thereto;
•our ability to manage our growth effectively and our expectations regarding the development and expansion of our business;
•our ability to continue to originate and sell loans to third parties, and the impact of the performance of loans held on our balance sheet;
•our ability to access sources of capital on favorable terms, if at all, including debt financing, deposits and other sources of capital to finance operations and growth;
•the impact of and our ability to respond to general economic conditions and other macroeconomic and geopolitical factors, such as elevated and fluctuating interest rates, inflationary pressures, counterparty risk, changing customer demand, capital markets volatility, instability in the financial services industry, a potential U.S. government shutdown,
the upcoming U.S. presidential elections, the possibility of a recession, and domestic or international conflicts or disputes;
•the success of our marketing efforts and our ability to expand our member base;
•our ability to grow market share in existing markets or any new markets we may enter;
•our ability to develop new products, features and functionality that are competitive and meet market needs;
•our ability to diversify our business and broaden our suite of financial services offerings;
•our ability to realize the benefits of our strategy, including what we refer to as our Financial Services Productivity Loop, and achieve scale in our Financial Services segment;
•our ability to successfully operate as a bank holding company, and to operate SoFi Bank;
•our ability to make accurate credit and pricing decisions or effectively forecast our loss rates;
•our ability to establish and maintain an effective system of internal controls over financial reporting;
•our ability to maintain the listing of our securities on The Nasdaq Global Select Market (“Nasdaq”);the Nasdaq;
•our ability to realize the anticipated benefits of the Bank Merger, the Technisys Merger, our acquisition of Wyndham, and any other acquisitions we undertake, including our expectations with regards to such acquisitions;
•our ability to successfully expand our operations into foreign jurisdictions, including compliance with a variety of foreign laws; and
•the outcome of any legal or governmental proceedings that may be instituted against us.
Forward-looking statements are based on information available as of the date of this Quarterly Report on Form 10-Q and reflect current expectations, forecasts and assumptions, and involve a number of judgments, risks and uncertainties. New risks and uncertainties emerge from time to time, and it is not possible for us to predict all risks and uncertainties that could have an impact on the forward-looking statements contained in this Quarterly Report on Form 10-Q. The results, events, and circumstances reflected in the forward-looking statements may not be achieved or occur, and actual results, events, or circumstances could differ materially from those described in the forward-looking statements. Accordingly, forward-looking statements should not be relied upon as representing our views as of any subsequent date, and we do not undertake any obligation to update forward-looking statements to reflect events or circumstances after the date they were made, whether as a result of new information, future events or otherwise, except as may be required under applicable securities laws.
TRADEMARKS
This document contains references to trademarks, service marks and trade names owned by us or belonging to other entities. Solely for convenience, trademarks, service marks and trade names referred to in this document may appear without the ® or ™ symbols, but such references are not intended to indicate, in any way, that we or the applicable licensor will not assert, to the fullest extent under applicable law, our or its rights to these trademarks, service marks and trade names. SoFi Technologies does not intend its use or display of other companies’ trademarks, service marks or trade names to imply a relationship with, or endorsement or sponsorship of it by, any other companies. All trademarks, service marks and trade names included in this document are the property of their respective owners.
PART I – FINANCIAL INFORMATION
Item 1. Financial Statements
SoFi Technologies, Inc.
Condensed Consolidated Balance Sheets
(Unaudited)
(In Thousands, Except for Share Data)
| | September 30,
2023 | | December 31,
2022 |
| March 31,
2024 | | | March 31,
2024 | | December 31,
2023 |
| Assets | Assets | | | |
| Cash and cash equivalents | Cash and cash equivalents | $ | 2,813,876 | | | $ | 1,421,907 | |
| Cash and cash equivalents | |
| Cash and cash equivalents | |
| Restricted cash and restricted cash equivalents | Restricted cash and restricted cash equivalents | 483,141 | | | 424,395 | |
| Investment securities (includes available-for-sale securities of $486,091 and $195,438 at fair value with associated amortized cost of $486,999 and $203,418, as of September 30, 2023 and December 31, 2022, respectively) | 579,738 | | | 396,769 | |
| Investment securities (includes available-for-sale securities of $838,506 and $595,187 at fair value with associated amortized cost of $839,936 and $596,757, as of March 31, 2024 and December 31, 2023, respectively) | |
| Loans held for sale, at fair value | Loans held for sale, at fair value | 20,993,836 | | | 13,557,074 | |
| Loans held for investment (less allowance for credit losses on loans at amortized cost of $51,923 and $40,788, as of September 30, 2023 and December 31, 2022, respectively) | 361,248 | | | 307,957 | |
| Loans held for investment, at fair value | |
| Loans held for investment, at amortized cost (less allowance for credit losses of $51,313 and $54,695, as of March 31, 2024 and December 31, 2023, respectively) | |
| Servicing rights | Servicing rights | 142,654 | | | 149,854 | |
| | Property, equipment and software | Property, equipment and software | 201,931 | | | 170,104 | |
| Goodwill | Goodwill | 1,393,505 | | | 1,622,991 | |
| Intangible assets | Intangible assets | 387,307 | | | 442,155 | |
| Operating lease right-of-use assets | Operating lease right-of-use assets | 93,379 | | | 97,135 | |
| Other assets (less allowance for credit losses of $1,581 and $2,785, as of September 30, 2023 and December 31, 2022, respectively) | 526,538 | | | 417,334 | |
| Other assets (less allowance for credit losses of $2,109 and $1,837, as of March 31, 2024 and December 31, 2023, respectively) | |
| Total assets | Total assets | $ | 27,977,153 | | | $ | 19,007,675 | |
| Liabilities, temporary equity and permanent equity | Liabilities, temporary equity and permanent equity | | | |
| Liabilities: | Liabilities: | |
| Liabilities: | |
| Liabilities: | |
| Deposits: | Deposits: | |
| Deposits: | |
| Deposits: | |
| Interest-bearing deposits | |
| Interest-bearing deposits | |
| Interest-bearing deposits | Interest-bearing deposits | $ | 15,607,349 | | | $ | 7,265,792 | |
| Noninterest-bearing deposits | Noninterest-bearing deposits | 64,624 | | | 76,504 | |
| Total deposits | Total deposits | 15,671,973 | | | 7,342,296 | |
| Accounts payable, accruals and other liabilities | Accounts payable, accruals and other liabilities | 566,477 | | | 516,215 | |
| Operating lease liabilities | Operating lease liabilities | 113,361 | | | 117,758 | |
| Debt | Debt | 6,241,386 | | | 5,485,882 | |
| Residual interests classified as debt | Residual interests classified as debt | 10,194 | | | 17,048 | |
| Total liabilities | Total liabilities | 22,603,391 | | | 13,479,199 | |
| Commitments, guarantees, concentrations and contingencies (Note 15) | Commitments, guarantees, concentrations and contingencies (Note 15) | | | | Commitments, guarantees, concentrations and contingencies (Note 15) | | | |
Temporary equity(1): | Temporary equity(1): | |
| Redeemable preferred stock, $0.00 par value: 100,000,000 and 100,000,000 shares authorized; 3,234,000 and 3,234,000 shares issued and outstanding, as of September 30, 2023 and December 31, 2022, respectively | 320,374 | | | 320,374 | |
| Redeemable preferred stock, $0.00 par value: 100,000,000 and 100,000,000 shares authorized; 3,234,000 and 3,234,000 shares issued and outstanding, as of March 31, 2024 and December 31, 2023, respectively | |
| Redeemable preferred stock, $0.00 par value: 100,000,000 and 100,000,000 shares authorized; 3,234,000 and 3,234,000 shares issued and outstanding, as of March 31, 2024 and December 31, 2023, respectively | |
| Redeemable preferred stock, $0.00 par value: 100,000,000 and 100,000,000 shares authorized; 3,234,000 and 3,234,000 shares issued and outstanding, as of March 31, 2024 and December 31, 2023, respectively | |
| Permanent equity: | Permanent equity: | |
Common stock, $0.00 par value: 3,100,000,000 and 3,100,000,000 shares authorized; 957,860,430 and 933,896,120 shares issued and outstanding, as of September 30, 2023 and December 31, 2022, respectively(2) | 95 | | | 93 | |
Common stock, $0.00 par value: 3,100,000,000 and 3,100,000,000 shares authorized; 1,056,491,365 and 975,861,793 shares issued and outstanding, as of March 31, 2024 and December 31, 2023, respectively(2) | |
Common stock, $0.00 par value: 3,100,000,000 and 3,100,000,000 shares authorized; 1,056,491,365 and 975,861,793 shares issued and outstanding, as of March 31, 2024 and December 31, 2023, respectively(2) | |
Common stock, $0.00 par value: 3,100,000,000 and 3,100,000,000 shares authorized; 1,056,491,365 and 975,861,793 shares issued and outstanding, as of March 31, 2024 and December 31, 2023, respectively(2) | |
| Additional paid-in capital | Additional paid-in capital | 6,904,869 | | | 6,719,826 | |
| | Accumulated other comprehensive income (loss) | 600 | | | (8,296) | |
| Accumulated other comprehensive loss | |
| Accumulated other comprehensive loss | |
| Accumulated other comprehensive loss | |
| Accumulated deficit | Accumulated deficit | (1,852,176) | | | (1,503,521) | |
| Total permanent equity | Total permanent equity | 5,053,388 | | | 5,208,102 | |
| Total liabilities, temporary equity and permanent equity | Total liabilities, temporary equity and permanent equity | $ | 27,977,153 | | | $ | 19,007,675 | |
______________
(1)Redemption amount is $323,400 as of September 30, 2023March 31, 2024 and December 31, 2022.2023.
(2)Includes 100,000,000 non-voting common shares authorized and no non-voting common shares issued and outstanding as of September 30, 2023March 31, 2024 and December 31, 2022.2023. See Note 10. Equity for additional information.
The accompanying notes are an integral part of these condensed consolidated financial statements.
45
SoFi Technologies, Inc.
Condensed Consolidated Balance Sheets (Continued)
(Unaudited)
(In Thousands, Except for Share Data)
The following table presents the assets and liabilities of consolidated variable interest entities (“VIEs”)VIEs which are included in our condensed consolidated balance sheets. The assets in the below table may only be used to settle obligations of consolidated VIEs and are in excess of those obligations as of the dates presented. Additionally, the assets and liabilities in the table below exclude intercompany balances, which eliminate upon consolidation.
| | | September 30,
2023 | | December 31,
2022 | | March 31,
2024 | | December 31,
2023 |
| Assets | Assets | | | | Assets | | | |
| Restricted cash and restricted cash equivalents | Restricted cash and restricted cash equivalents | $ | 63,260 | | | $ | 68,151 | |
| Loans held for sale, at fair value | Loans held for sale, at fair value | 894,073 | | | 931,701 | |
| Loans held for investment, at fair value | |
| Total assets | Total assets | $ | 957,333 | | | $ | 999,852 | |
| Liabilities | Liabilities | | | |
| Accounts payable, accruals and other liabilities | |
| Accounts payable, accruals and other liabilities | |
| Accounts payable, accruals and other liabilities | Accounts payable, accruals and other liabilities | $ | 1,458 | | | $ | 3,053 | |
| Debt | Debt | 619,574 | | | 771,454 | |
| Residual interests classified as debt | Residual interests classified as debt | 10,194 | | | 17,048 | |
| Total liabilities | Total liabilities | $ | 631,226 | | | $ | 791,555 | |
The accompanying notes are an integral part of these condensed consolidated financial statements.
56
SoFi Technologies, Inc.
Condensed Consolidated Statements of Operations and Comprehensive LossIncome (Loss)
(Unaudited)
(In Thousands, Except for Share and Per Share Data)
| | | | | Three Months Ended September 30, | | Nine Months Ended September 30, | | | Three Months Ended March 31, |
| | 2023 | | 2022 | | 2023 | | 2022 | | | | | | 2024 | | 2023 |
| Interest income | Interest income | | | | | | | | Interest income | | | | | | | |
| Loans | $ | 537,947 | | | $ | 191,525 | | | $ | 1,337,476 | | | $ | 451,247 | |
| Securitizations | 1,980 | | | 2,633 | | | 7,693 | | | 7,958 | |
| | Loans and securitizations | |
| Other | Other | 24,343 | | | 3,881 | | | 60,661 | | | 6,758 | |
| Total interest income | Total interest income | 564,270 | | | 198,039 | | | 1,405,830 | | | 465,963 | |
| Interest expense | Interest expense | | | | | | | |
| Securitizations and warehouses | |
| Securitizations and warehouses | |
| Securitizations and warehouses | Securitizations and warehouses | 63,847 | | | 20,653 | | | 181,231 | | | 59,158 | |
| Deposits | Deposits | 145,563 | | | 14,149 | | | 325,208 | | | 19,123 | |
| Corporate borrowings | Corporate borrowings | 9,784 | | | 5,270 | | | 26,951 | | | 11,369 | |
| Other | Other | 113 | | | 117 | | | 341 | | | 801 | |
| Total interest expense | Total interest expense | 219,307 | | | 40,189 | | | 533,731 | | | 90,451 | |
| Net interest income | Net interest income | 344,963 | | | 157,850 | | | 872,099 | | | 375,512 | |
| Noninterest income | Noninterest income | |
| Loan origination and sales | 81,683 | | | 163,697 | | | 311,258 | | | 465,815 | |
| Securitizations | (6,298) | | | (8,772) | | | (22,375) | | | (31,790) | |
| Loan origination, sales, and securitizations | |
| Loan origination, sales, and securitizations | |
| Loan origination, sales, and securitizations | |
| Servicing | Servicing | 8,009 | | | 7,296 | | | 29,803 | | | 30,003 | |
| Technology products and solutions | Technology products and solutions | 81,856 | | | 82,035 | | | 236,946 | | | 223,562 | |
| Other | Other | 26,996 | | | 21,879 | | | 79,654 | | | 53,754 | |
| Total noninterest income | Total noninterest income | 192,246 | | | 266,135 | | | 635,286 | | | 741,344 | |
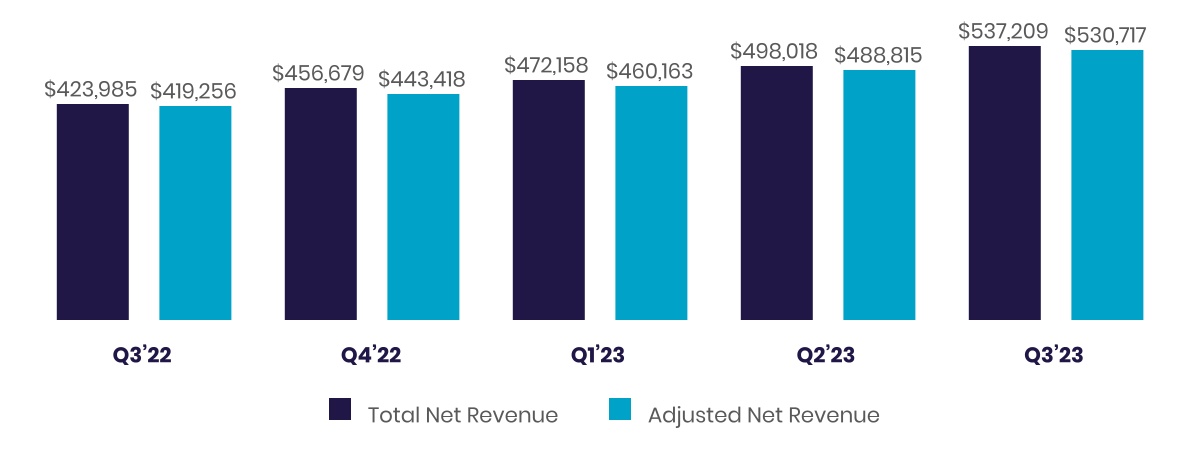
| Total net revenue | Total net revenue | 537,209 | | | 423,985 | | | 1,507,385 | | | 1,116,856 | |
| Noninterest expense | Noninterest expense | | | | | | | |
| Technology and product development | Technology and product development | 125,698 | | | 110,702 | | | 369,602 | | | 291,976 | |
| Technology and product development | |
| Technology and product development | |
| Sales and marketing | Sales and marketing | 186,719 | | | 162,129 | | | 544,695 | | | 444,121 | |
| Cost of operations | Cost of operations | 98,258 | | | 83,083 | | | 276,051 | | | 232,611 | |
| General and administrative | General and administrative | 124,457 | | | 126,199 | | | 379,326 | | | 388,533 | |
| Goodwill impairment | 247,174 | | | — | | | 247,174 | | | — | |
| | Provision for credit losses | |
| Provision for credit losses | |
| Provision for credit losses | Provision for credit losses | 21,831 | | | 16,323 | | | 42,853 | | | 39,387 | |
| Total noninterest expense | Total noninterest expense | 804,137 | | | 498,436 | | | 1,859,701 | | | 1,396,628 | |
| Loss before income taxes | (266,928) | | | (74,451) | | | (352,316) | | | (279,772) | |
| Income tax benefit (expense) | 244 | | | 242 | | | 3,661 | | | (629) | |
| Net loss | $ | (266,684) | | | $ | (74,209) | | | $ | (348,655) | | | $ | (280,401) | |
| Income (loss) before income taxes | |
| Income tax (expense) benefit | |
| Net income (loss) | |
| Other comprehensive income (loss) | Other comprehensive income (loss) | | | | | | | |
| Unrealized gains (losses) on available-for-sale securities, net | 5,616 | | | (1,914) | | | 8,694 | | | (8,360) | |
| Unrealized (losses) gains on available-for-sale securities, net | |
| Unrealized (losses) gains on available-for-sale securities, net | |
| Unrealized (losses) gains on available-for-sale securities, net | |
| Foreign currency translation adjustments, net | Foreign currency translation adjustments, net | 103 | | | 325 | | | 202 | | | 231 | |
| Total other comprehensive income (loss) | Total other comprehensive income (loss) | 5,719 | | | (1,589) | | | 8,896 | | | (8,129) | |
| Comprehensive loss | $ | (260,965) | | | $ | (75,798) | | | $ | (339,759) | | | $ | (288,530) | |
| Loss per share (Note 16) | | | | | | | |
| Loss per share – basic | $ | (0.29) | | | $ | (0.09) | | | $ | (0.40) | | | $ | (0.35) | |
| Loss per share – diluted | $ | (0.29) | | | $ | (0.09) | | | $ | (0.40) | | | $ | (0.35) | |
| Comprehensive income (loss) | |
| Earnings (loss) per share (Note 16) | |
| Earnings (loss) per share – basic | |
| Earnings (loss) per share – basic | |
| Earnings (loss) per share – basic | |
| Earnings (loss) per share – diluted | |
| Weighted average common stock outstanding – basic | Weighted average common stock outstanding – basic | 951,183,107 | | | 916,762,973 | | | 939,070,185 | | | 893,455,206 | |
| Weighted average common stock outstanding – diluted | Weighted average common stock outstanding – diluted | 951,183,107 | | | 916,762,973 | | | 939,070,185 | | | 893,455,206 | |
The accompanying notes are an integral part of these condensed consolidated financial statements.
67
SoFi Technologies, Inc.
SoFi Technologies, Inc.
Condensed Consolidated Statements of Changes in Temporary Equity and Permanent Equity
(Unaudited)
(In Thousands, Except for Share Data)
|
|
| Common Stock | | Additional Paid-In Capital | | Accumulated Other Comprehensive Income (Loss) | | Accumulated Deficit | | Permanent Equity | | | Temporary Equity |
| | Shares | | Amount | | Shares | | Amount |
| Balance at June 30, 2023 | 948,912,761 | | | $ | 94 | | | $ | 6,848,178 | | | $ | (5,119) | | | $ | (1,585,492) | | | $ | 5,257,661 | | | | 3,234,000 | | | $ | 320,374 | |
| | Common Stock | |
| | Common Stock | |
| | Common Stock | | | Additional Paid-In Capital | | Accumulated Other Comprehensive Loss | | Accumulated Deficit | | Permanent Equity | | | Temporary Equity |
| Shares | | | Shares | | Amount | | Shares | | Amount |
| Balance at January 1, 2024 | |
| Share-based compensation expense | Share-based compensation expense | — | | | — | | | 70,065 | | | — | | | — | | | 70,065 | | | | — | | | — | |
| | Vesting of RSUs | |
| Vesting of RSUs | |
| Vesting of RSUs | Vesting of RSUs | 8,921,924 | | | 1 | | | (1) | | | — | | | — | | | — | | | | — | | | — | |
| Stock withheld related to taxes on vested RSUs | Stock withheld related to taxes on vested RSUs | (469,874) | | | — | | | (3,614) | | | — | | | — | | | (3,614) | | | | — | | | — | |
| Exercise of common stock options | Exercise of common stock options | 495,619 | | | — | | | 430 | | | — | | | — | | | 430 | | | | — | | | — | |
| | Extinguishment of convertible notes by issuance of common stock | |
| Extinguishment of convertible notes by issuance of common stock | |
| Extinguishment of convertible notes by issuance of common stock | |
| Purchases of capped calls | |
| Unwind of capped calls | |
| Redeemable preferred stock dividends | Redeemable preferred stock dividends | — | | | — | | | (10,189) | | | — | | | — | | | (10,189) | | | | — | | | — | |
| Net loss | — | | | — | | | — | | | — | | | (266,684) | | | (266,684) | | | | — | | | — | |
| Other comprehensive income, net of taxes | — | | | — | | | — | | | 5,719 | | | — | | | 5,719 | | | | — | | | — | |
| Balance at September 30, 2023 | 957,860,430 | | | $ | 95 | | | $ | 6,904,869 | | | $ | 600 | | | $ | (1,852,176) | | | $ | 5,053,388 | | | | 3,234,000 | | | $ | 320,374 | |
| | Common Stock | | Additional Paid-In Capital | | Accumulated Other Comprehensive Income (Loss) | | Accumulated Deficit | | Permanent Equity | | | Temporary Equity |
| Shares | | Amount | | Shares | | Amount |
| Balance at January 1, 2023 | 933,896,120 | | | $ | 93 | | | $ | 6,719,826 | | | $ | (8,296) | | | $ | (1,503,521) | | | $ | 5,208,102 | | | | 3,234,000 | | | $ | 320,374 | |
| Share-based compensation expense | — | | | — | | | 224,926 | | | — | | | — | | | 224,926 | | | | — | | | — | |
| | Vesting of RSUs | 24,621,235 | | | 2 | | | (2) | | | — | | | — | | | — | | | | — | | | — | |
| Stock withheld related to taxes on vested RSUs | (1,396,562) | | | — | | | (10,660) | | | — | | | — | | | (10,660) | | | | — | | | — | |
| Exercise of common stock options | 747,930 | | | — | | | 1,015 | | | — | | | — | | | 1,015 | | | | — | | | — | |
| Common stock retired | (8,293) | | | — | | | — | | | — | | | — | | | — | | | | — | | | — | |
| Redeemable preferred stock dividends | — | | | — | | | (30,236) | | | — | | | — | | | (30,236) | | | | — | | | — | |
| Net loss | — | | | — | | | — | | | — | | | (348,655) | | | (348,655) | | | | — | | | — | |
| Other comprehensive income, net of taxes | — | | | — | | | — | | | 8,896 | | | — | | | 8,896 | | | | — | | | — | |
| Balance at September 30, 2023 | 957,860,430 | | | $ | 95 | | | $ | 6,904,869 | | | $ | 600 | | | $ | (1,852,176) | | | $ | 5,053,388 | | | | 3,234,000 | | | $ | 320,374 | |
| Net income | |
| Other comprehensive loss, net of taxes | |
| Balance at March 31, 2024 | |
| | | Common Stock | | Additional Paid-In Capital | | Accumulated Other Comprehensive Loss | | Accumulated Deficit | | Permanent Equity | | | Temporary Equity |
| | Shares | | Amount | | Shares | | Amount |
| Balance at June 30, 2022 | 922,103,100 | | | $ | 92 | | | $ | 6,583,405 | | | $ | (8,011) | | | $ | (1,389,306) | | | $ | 5,186,180 | | | | 3,234,000 | | | $ | 320,374 | |
| | | | | | | Common Stock | | Additional Paid-In Capital | | Accumulated Other Comprehensive Loss | | Accumulated Deficit | | Permanent Equity | | | Temporary Equity |
| | | Shares | | Amount | | | Shares | | Amount | | Accumulated Deficit |
| Balance at January 1, 2023 | |
| Share-based compensation expense | Share-based compensation expense | — | | | — | | | 83,676 | | | — | | | — | | | 83,676 | | | | — | | | — | |
| | Vesting of RSUs | Vesting of RSUs | 5,434,536 | | | — | | | — | | | — | | | — | | | — | | | | — | | | — | |
| Vesting of RSUs | |
| Vesting of RSUs | |
| Stock withheld related to taxes on vested RSUs | Stock withheld related to taxes on vested RSUs | (270,487) | | | — | | | (1,630) | | | — | | | — | | | (1,630) | | | | — | | | — | |
| Exercise of common stock options | Exercise of common stock options | 234,622 | | | — | | | 429 | | | — | | | — | | | 429 | | | | — | | | — | |
| Issuance of common stock in acquisition | (155,794) | | | — | | | (1,665) | | | — | | | — | | | (1,665) | | | | — | | | — | |
| | Redeemable preferred stock dividends | |
| | Redeemable preferred stock dividends | |
| | | Redeemable preferred stock dividends | Redeemable preferred stock dividends | — | | | — | | | (10,189) | | | — | | | — | | | (10,189) | | | | — | | | — | |
| Net loss | Net loss | — | | | — | | | — | | | — | | | (74,209) | | | (74,209) | | | | — | | | — | |
| Other comprehensive loss, net of taxes | — | | | — | | | — | | | (1,589) | | | — | | | (1,589) | | | | — | | | — | |
| Balance at September 30, 2022 | 927,345,977 | | | $ | 92 | | | $ | 6,654,026 | | | $ | (9,600) | | | $ | (1,463,515) | | | $ | 5,181,003 | | | | 3,234,000 | | | $ | 320,374 | |
| | Common Stock | | Additional Paid-In Capital | | Accumulated Other Comprehensive Loss | | Accumulated Deficit | | Permanent Equity | | | Temporary Equity |
| Shares | | Amount | | Shares | | Amount |
| Balance at January 1, 2022 | 828,154,462 | | | $ | 83 | | | $ | 5,561,831 | | | $ | (1,471) | | | $ | (1,183,114) | | | $ | 4,377,329 | | | | 3,234,000 | | | $ | 320,374 | |
| Share-based compensation expense | — | | | — | | | 251,195 | | | — | | | — | | | 251,195 | | | | — | | | — | |
| | Vesting of RSUs | 16,746,634 | | | 1 | | | (1) | | | — | | | — | | | — | | | | — | | | — | |
| Stock withheld related to taxes on vested RSUs | (932,949) | | | — | | | (7,476) | | | — | | | — | | | (7,476) | | | | — | | | — | |
| Exercise of common stock options | 1,677,512 | | | — | | | 2,489 | | | — | | | — | | | 2,489 | | | | — | | | — | |
| Issuance of common stock in acquisition | 81,700,318 | | | 8 | | | 873,369 | | | — | | | — | | | 873,377 | | | | — | | | — | |
| Vested awards assumed in acquisition | — | | | — | | | 2,855 | | | — | | | — | | | 2,855 | | | | — | | | — | |
| Redeemable preferred stock dividends | — | | | — | | | (30,236) | | | — | | | — | | | (30,236) | | | | — | | | — | |
| Net loss | — | | | — | | | — | | | — | | | (280,401) | | | (280,401) | | | | — | | | — | |
| Other comprehensive loss, net of taxes | — | | | — | | | — | | | (8,129) | | | — | | | (8,129) | | | | — | | | — | |
| Balance at September 30, 2022 | 927,345,977 | | | $ | 92 | | | $ | 6,654,026 | | | $ | (9,600) | | | $ | (1,463,515) | | | $ | 5,181,003 | | | | 3,234,000 | | | $ | 320,374 | |
| Other comprehensive income, net of taxes | |
| Balance at March 31, 2023 | |
The accompanying notes are an integral part of these condensed consolidated financial statements.
78
SoFi Technologies, Inc.
SoFi Technologies, Inc.
Condensed Consolidated Statements of Cash Flows
(Unaudited)
(In Thousands)
| | | Nine Months Ended September 30, | | Three Months Ended March 31, |
| | 2023 | | 2022 | | 2024 | | 2023 |
| Operating activities | Operating activities | | | |
| Net loss | $ | (348,655) | | | $ | (280,401) | |
| Adjustments to reconcile net loss to net cash used in operating activities: | |
| Net income (loss) | |
| Net income (loss) | |
| Net income (loss) | |
| Adjustments to reconcile net income (loss) to net cash provided by (used in) operating activities: | |
| Share-based compensation expense | |
| Share-based compensation expense | |
| Share-based compensation expense | Share-based compensation expense | 202,109 | | | 235,018 | |
| Depreciation and amortization | Depreciation and amortization | 147,967 | | | 109,007 | |
| Goodwill impairment | 247,174 | | | — | |
| | Deferred debt issuance and discount expense | Deferred debt issuance and discount expense | 15,049 | | | 12,106 | |
| Deferred debt issuance and discount expense | |
| Deferred debt issuance and discount expense | |
| Gain on extinguishment of convertible debt | |
| Provision for credit losses | Provision for credit losses | 42,853 | | | 39,387 | |
| Deferred income taxes | Deferred income taxes | (6,333) | | | (4,420) | |
| Fair value changes in residual interests classified as debt | 414 | | | 7,078 | |
| Fair value changes in loans held for investment | |
| Fair value changes in securitization investments | Fair value changes in securitization investments | 1,067 | | | 13,256 | |
| Other | Other | (2,613) | | | 11,635 | |
| Changes in operating assets and liabilities: | Changes in operating assets and liabilities: | |
| Changes in loans held for sale, net | Changes in loans held for sale, net | (7,315,543) | | | (4,971,084) | |
| Changes in loans held for sale, net | |
| Changes in loans held for sale, net | |
| Changes in loans previously classified as held for sale, net | |
| Servicing assets | Servicing assets | 6,210 | | | (179) | |
| Other assets | Other assets | 15,052 | | | (36,691) | |
| Accounts payable, accruals and other liabilities | Accounts payable, accruals and other liabilities | 16,051 | | | 28,265 | |
| Net cash used in operating activities | $ | (6,979,198) | | | $ | (4,837,023) | |
| Net cash provided by (used in) operating activities | |
| Investing activities | Investing activities | | | |
| Purchases of property, equipment and software | |
| Purchases of property, equipment and software | |
| Purchases of property, equipment and software | Purchases of property, equipment and software | $ | (77,115) | | | $ | (70,460) | |
| Capitalized software development costs | Capitalized software development costs | (7,429) | | | (5,516) | |
| Purchases of available-for-sale investments | Purchases of available-for-sale investments | (634,020) | | | (44,974) | |
| Proceeds from sales of available-for-sale investments | Proceeds from sales of available-for-sale investments | 265,634 | | | 23,497 | |
| Proceeds from maturities and paydowns of available-for-sale investments | Proceeds from maturities and paydowns of available-for-sale investments | 87,463 | | | 14,327 | |
| Changes in loans held for investment, net | Changes in loans held for investment, net | (97,105) | | | (130,100) | |
| Proceeds from securitization investments | Proceeds from securitization investments | 101,292 | | | 99,760 | |
| Proceeds from non-securitization investments | Proceeds from non-securitization investments | 3,163 | | | — | |
| Purchases of non-securitization investments | Purchases of non-securitization investments | (45,917) | | | — | |
| Acquisition of businesses, net of cash acquired | Acquisition of businesses, net of cash acquired | (72,301) | | | 58,540 | |
| Net cash used in investing activities | Net cash used in investing activities | $ | (476,335) | | | $ | (54,926) | |
The accompanying notes are an integral part of these condensed consolidated financial statements.
89
SoFi Technologies, Inc.
SoFi Technologies, Inc.
Condensed Consolidated Statements of Cash Flows (Continued)
(Unaudited)
(In Thousands)
| | | Nine Months Ended September 30, | | Three Months Ended March 31, |
| | 2023 | | 2022 | | 2024 | | 2023 |
| Financing activities | Financing activities | | | |
| Net change in deposits | Net change in deposits | $ | 8,296,657 | | | $ | 4,859,240 | |
| Net change in deposits | |
| Net change in deposits | |
| Net change in debt facilities | Net change in debt facilities | 902,777 | | | 821,096 | |
| Proceeds from other debt issuances | Proceeds from other debt issuances | 339,995 | | | — | |
| Repayment of other debt | Repayment of other debt | (595,233) | | | (266,148) | |
| Payment of debt issuance costs | Payment of debt issuance costs | (8,078) | | | (4,076) | |
| Purchase of capped calls | |
| Unwind of capped calls | |
| Taxes paid related to net share settlement of share-based awards | Taxes paid related to net share settlement of share-based awards | (10,660) | | | (7,476) | |
| Proceeds from stock option exercises | Proceeds from stock option exercises | 1,015 | | | 2,489 | |
| Payment of redeemable preferred stock dividends | (20,047) | | | (20,047) | |
| | Finance lease principal payments | |
| Finance lease principal payments | |
| Finance lease principal payments | Finance lease principal payments | (380) | | | (364) | |
| Net cash provided by financing activities | Net cash provided by financing activities | $ | 8,906,046 | | | $ | 5,384,714 | |
| Effect of exchange rates on cash and cash equivalents | Effect of exchange rates on cash and cash equivalents | 202 | | | 231 | |
| Net increase in cash, cash equivalents, restricted cash and restricted cash equivalents | Net increase in cash, cash equivalents, restricted cash and restricted cash equivalents | $ | 1,450,715 | | | $ | 492,996 | |
| Cash, cash equivalents, restricted cash and restricted cash equivalents at beginning of period | Cash, cash equivalents, restricted cash and restricted cash equivalents at beginning of period | 1,846,302 | | | 768,437 | |
| Cash, cash equivalents, restricted cash and restricted cash equivalents at end of period | Cash, cash equivalents, restricted cash and restricted cash equivalents at end of period | $ | 3,297,017 | | | $ | 1,261,433 | |
| | Reconciliation to amounts on condensed consolidated balance sheets (as of period end) | Reconciliation to amounts on condensed consolidated balance sheets (as of period end) | |
| Reconciliation to amounts on condensed consolidated balance sheets (as of period end) | |
| Reconciliation to amounts on condensed consolidated balance sheets (as of period end) | |
| Cash and cash equivalents | |
| Cash and cash equivalents | |
| Cash and cash equivalents | Cash and cash equivalents | $ | 2,813,876 | | | $ | 935,159 | |
| Restricted cash and restricted cash equivalents | Restricted cash and restricted cash equivalents | 483,141 | | | 326,274 | |
| Total cash, cash equivalents, restricted cash and restricted cash equivalents | Total cash, cash equivalents, restricted cash and restricted cash equivalents | $ | 3,297,017 | | | $ | 1,261,433 | |
| | Supplemental non-cash investing and financing activities | Supplemental non-cash investing and financing activities | |
| Supplemental non-cash investing and financing activities | |
| Supplemental non-cash investing and financing activities | |
| | Derecognition of securitization investments | $ | 5,325 | | | $ | — | |
| Loans held for investment received in acquisition | — | | | 84,485 | |
| Available-for-sale securities received in acquisition | — | | | 10,014 | |
| Deconsolidation of securitization and residual debt | 92,914 | | | — | |
| | Extinguishment of convertible notes by issuance of common stock | |
| | Extinguishment of convertible notes by issuance of common stock | |
| | Extinguishment of convertible notes by issuance of common stock | |
| Deposits credited but not yet received in cash | Deposits credited but not yet received in cash | 81,116 | | | 14,374 | |
| Share-based compensation capitalized related to internally-developed software | Share-based compensation capitalized related to internally-developed software | 22,817 | | | 16,177 | |
| Deposits assumed in acquisition | — | | | 158,016 | |
| |
The accompanying notes are an integral part of these condensed consolidated financial statements.
910
SoFi Technologies, Inc.
SoFi Technologies, Inc.
Notes to Condensed Consolidated Financial Statements
(Unaudited)
(In Thousands, Unless Otherwise Stated and Except for Share and Per Share Data)
Note 1. Organization, Summary of Significant Accounting Policies and New Accounting Standards Organization
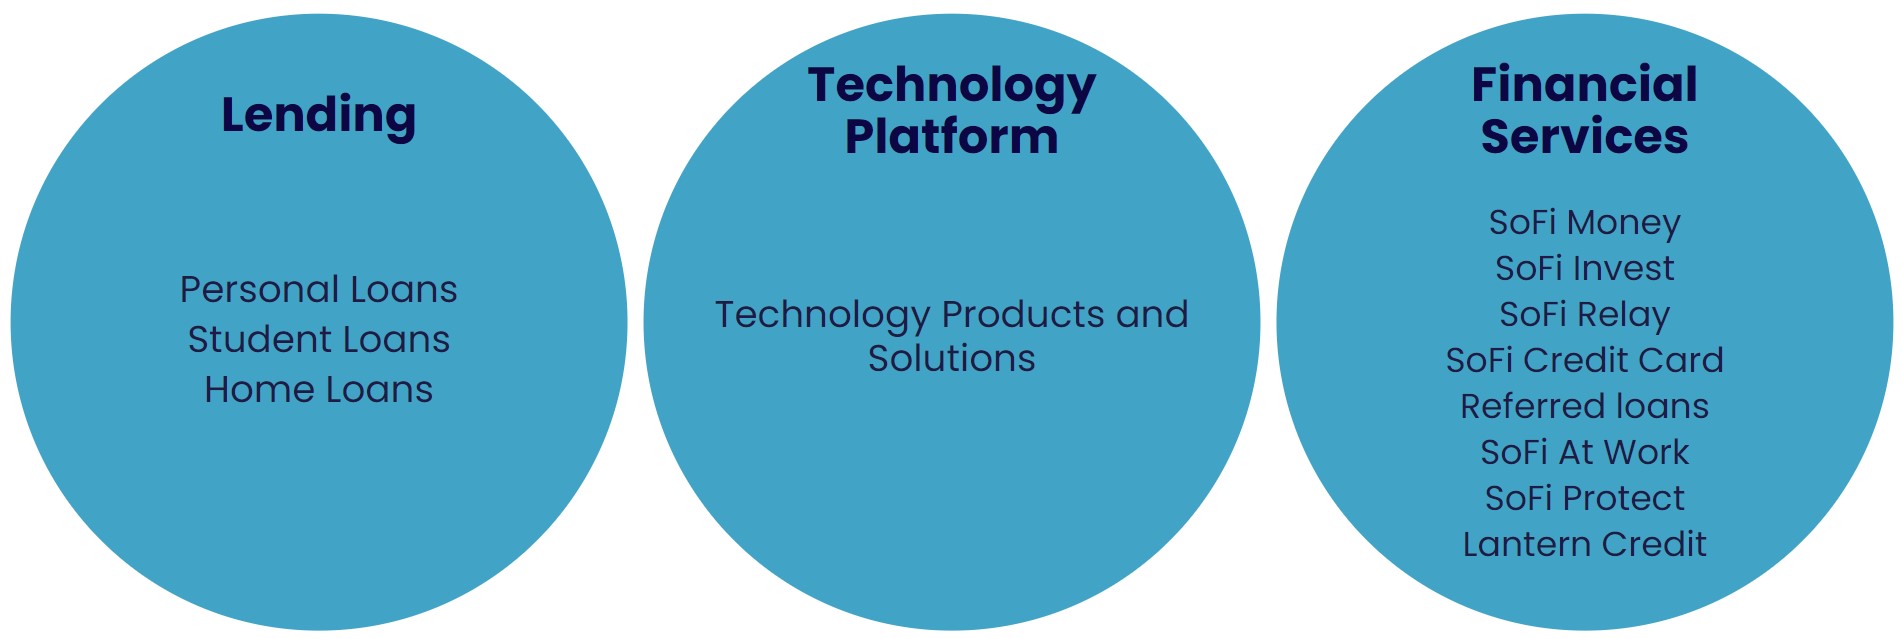
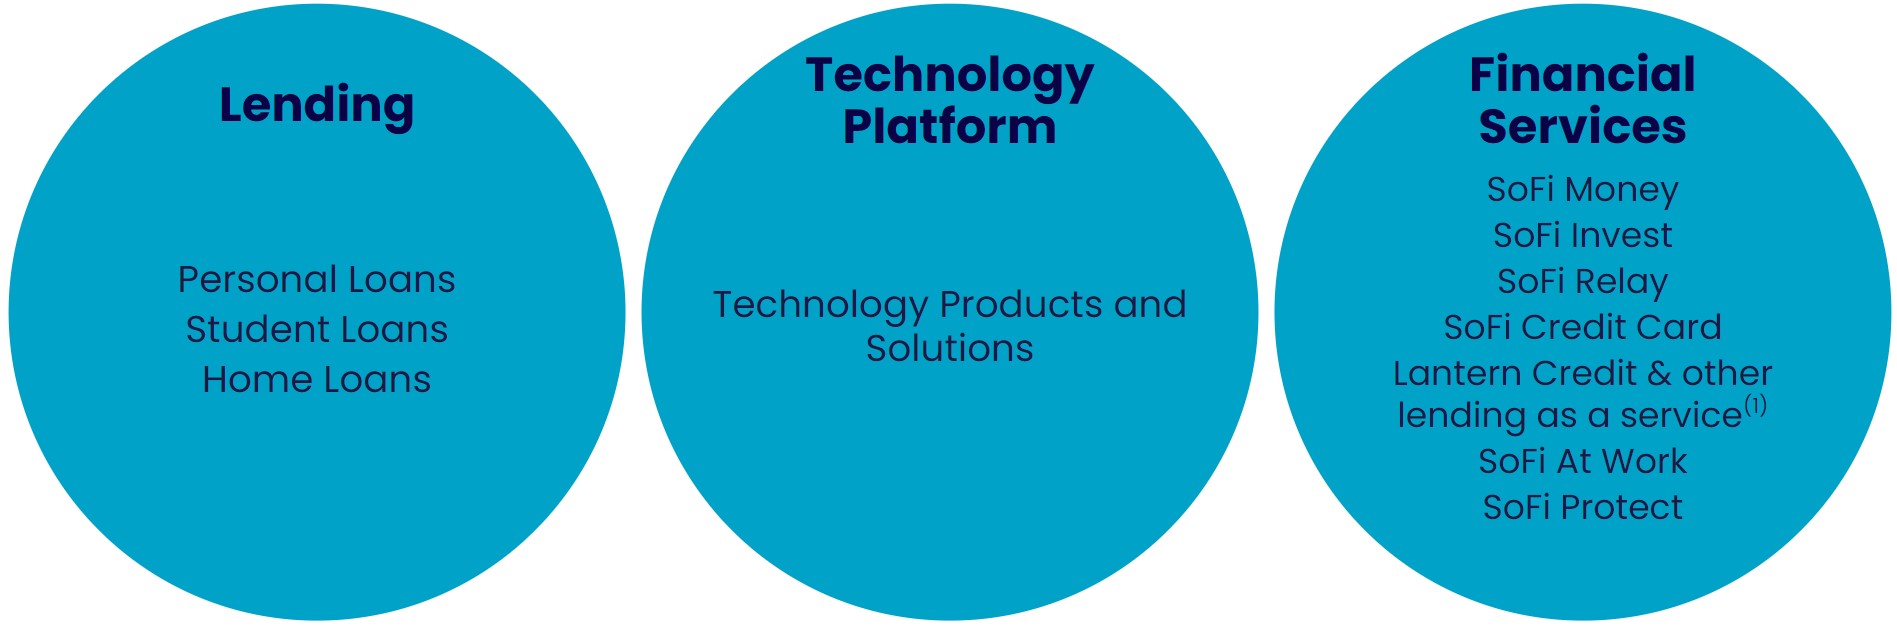
SoFi is a financial services platform that was founded in 2011 to offer an innovative approach to the private student loan market by providing student loan refinancing options. The Company conducts its business through three reportable segments: Lending, Technology Platform and Financial Services. Since its founding, SoFi has expanded its lending and financial services strategy to offer personal loans, home loans and credit cards. The Company has also developed additional financial products, such as money management and investment product offerings, and has also leveraged its financial services platform to empower other businesses. The Company has continued to expand its product offerings through strategic acquisitions. During 2020, the Company expanded its investment product offerings into Hong Kong through the acquisition of 8 Limited, and also began to operate as a platform-as-a-serviceplatform as a service for a variety of financial service providers, providing the infrastructure to facilitate core client-facing and back-end capabilities, such as account setup, account funding, direct deposit, authorizations and processing, payments functionality and check account balance features through the acquisition of Galileo. During 2022, the Company became a bank holding company and began operating as SoFi Bank, National Association, through the Bank Merger,its acquisition of Golden Pacific Bancorp, Inc., and expanded its platform to include a cloud-native digital and core banking platform with customers in Latin America through theits acquisition of Technisys, Merger, allowing the Company to expand its technology platform services to a broader international market. During 2023, the Company acquired Wyndham Capital Mortgage, a fintech mortgage lender. For additional information on our recent business combinations, see Note 2. Business Combinations. For additional information on our reportable segments, see Note 17. Business Segment Information.
Summary of Significant Accounting Policies
Basis of Presentation
The condensed consolidated financial statements include the accounts of the Company, its wholly-owned and majority-owned subsidiaries and certain consolidated VIEs. All intercompany accounts arewere eliminated in consolidation. The condensed consolidated financial statements arewere prepared in conformity with accounting principles generally accepted in the United States (“GAAP”)GAAP and in accordance with the rules and regulations of the SEC. We condensed or omitted certain notes and other financial information from the interim financial statements presented herein.
These condensed consolidated financial statements should be read in conjunction with the consolidated statements included in our annual filing on Form 10-K filed with the SEC on March 1, 2023February 27, 2024 (“Form 10-K”). In the opinion of management, the condensed consolidated financial statements reflect all adjustments, which are of a normal recurring nature, necessary for a fair statementpresentation of the Company’s financial condition and results of operations and cash flows for the interim periods presented. The results for the three and nine months ended September 30, 2023March 31, 2024 are not necessarily indicative of the results to be expected for the full year ending December 31, 2023.2024.
In our unaudited condensed consolidated statements of cash flows, we reclassified amounts related to fair value changes in residual interests classified as debt into other within the adjustments to reconcile net income (loss) to net cash provided by (used in) operating activities. The prior period amount was recast to conform to the current period presentation. There was no impact to net cash provided by (used in) operating activities.
Use of Judgments, Assumptions and Estimates
The preparation of our condensed consolidated financial statements and related disclosures in conformity with GAAP requires management to make assumptions and estimates that affect the reported amounts of assets, liabilities, revenue and expenses andas well as the disclosures of contingent assets and liabilities. These estimates and assumptions are inherently subjective in nature and,nature; therefore, actual results may differ from our estimates and assumptions, and the differences could be material. Management bases its estimates on historical experience and on various other factors it believes to be reasonable under the circumstances. These assumptions and estimates include, but are not limited to, the following: (i) fair value measurements;measurements, (ii) business combinations;combinations, and (iii) goodwill.
Restructuring
During the nine months ended September 30, 2023, we recognized restructuring charges of $4,953 within noninterest expense in the condensed consolidated statements of operations and comprehensive loss associated with a small reduction in headcount in the Technology Platform segment in the first quarter of 2023, which primarily included employee-related wages, benefits and severance.
SoFi Technologies, Inc.
SoFi Technologies, Inc.
Notes to Condensed Consolidated Financial Statements (Continued)
(Unaudited)
(In Thousands, Unless Otherwise Stated and Except for Share and Per Share Data)
Recently AdoptedBorrowings and Financing Costs
Convertible Senior Notes
In March 2024, we issued $862.5 million aggregate principal amount of convertible senior notes due 2029 (the “2029 convertible notes”). The 2029 convertible notes will mature on March 15, 2029, unless earlier repurchased, redeemed or converted. We will settle conversions by paying or delivering cash, and if applicable, shares of our common stock, based on the applicable conversion rate. The 2029 convertible notes will also be redeemable, in whole or in part, at our option at any time, and from time to time, on or after March 15, 2027 through the 30th scheduled trading day immediately before the maturity date, at a cash redemption price equal to the principal amount of the convertible notes to be redeemed, plus accrued and unpaid interest, if any, thereon to, but excluding, the redemption date, but only if certain liquidity conditions described in the indenture are satisfied and certain conditions are met with respect to the last reported sale price per share of our common stock prior to conversion. See Note 9. Debt for more detailed disclosure of the term and features of the 2029 convertible notes.
We concluded that the conversion rights, optional redemption rights, and contingent repurchase rights did not require bifurcation as derivative instruments, which we reevaluate each reporting period. The additional interest and special interest that accrue on the notes in the event of our failure to comply with certain registration or reporting requirements are required to be bifurcated from the host contract, as the reporting requirement triggering event is not clearly and closely related to the host convertible debt contract. The value was determined to be immaterial; therefore, we accounted for the 2029 convertible notes wholly as debt, which was recognized on the settlement date. Accordingly, we allocated all debt issuance costs to the debt instrument.
In connection with the pricing of the 2029 convertible notes, we entered into privately negotiated capped call transactions with certain financial institutions, as defined and further discussed below.
Capped Call Transactions
In March 2024, we entered into privately negotiated capped call transactions (the “2029 capped call transactions”) with certain financial institutions (the “capped call counterparties”). The 2029 capped call transactions initially cover, subject to customary anti-dilution adjustments, the number of shares of our common stock that initially underlie the convertible notes. The capped call transactions are net purchased call options on our own common stock. The 2029 capped call transactions are separate transactions entered into by the Company with each of the capped call counterparties, are not part of the terms of the 2029 convertible notes, and do not affect any holder’s rights under the 2029 convertible notes. Holders of the 2029 convertible notes do not have any rights with respect to the 2029 capped call transactions. See Note 10. Equity for additional information.
As the 2029 capped call transactions are legally detachable and separately exercisable from the 2029 convertible notes, they were evaluated as freestanding instruments. We concluded that the 2029 capped call transactions meet the scope exceptions for derivative instruments, and as such, the capped call transactions meet the criteria for classification in equity and are included as a reduction to additional paid-in capital.
Recent Accounting Standards Issued, But Not Yet Adopted
Troubled Debt Restructurings and VintageImprovements to Reportable Segment Disclosures
In March 2022,November 2023, the FASB issued Accounting Standards Update (“ASU”) 2022-02,ASU 2023-07, Financial InstrumentsSegment Reporting (Topic 280) — Credit Losses (Topic 326): Troubled Debt Restructurings and VintageImprovements to Reportable Segment Disclosures. The ASU addresses two topics: (i) troubled debt restructuring (“TDR”) by creditors, and (ii) vintage disclosures for gross write offs. Under the TDR provisions, the ASU eliminates the recognition and measurement guidance under ASC 310-40, Receivables — Troubled Debt Restructurings by Creditors, and instead requires that an entity evaluate whether the modification represents a new loan or a continuation of an existing loan, consistent with the accounting for other loan modifications. Additionally, the ASU enhances existingimproves reportable segment disclosure requirements, around TDRsprimarily through enhanced disclosures about significant segment expenses. The standard is effective for fiscal years beginning after December 15, 2023, and introduces new requirements related to certain modifications of receivables made to borrowers experiencing financial difficulty. Under the vintage disclosure provisions, the ASU requires the entity to disclose current period gross write offs by year of origination for financing receivables and net investments in leasesinterim periods within the scope of ASC 326-20, Financial Instruments — Credit Losses — Measured at Amortized Cost.fiscal years beginning after December 15, 2024. The standard should be applied prospectively; however, forretrospectively to all prior periods presented in the TDR provisions, an entity hasfinancial statements. We are currently evaluating the option to apply a modified retrospective transition method. We adopted the standard effective January 1, 2023. The adoptionimpact of this standard did not have a material impactamendment on our consolidated financial statements.
Improvements to Income Tax Disclosures
In December 2023, the FASB issued ASU 2023-09, Income Taxes (Topic 740) — Improvements to Income Tax Disclosures. The ASU improves income tax disclosures primarily related to enhancements of the rate reconciliation and income taxes paid information. The standard is effective for annual periods beginning after December 15, 2024. The standard should be
SoFi Technologies, Inc.
SoFi Technologies, Inc.
Notes to Condensed Consolidated Financial Statements (Continued)
(Unaudited)
(In Thousands, Unless Otherwise Stated and Except for Share and Per Share Data)
applied on a prospective basis with the option to apply the standard retrospectively. We are currently evaluating the impact of this amendment on our consolidated financial statements.
Note 2. Business Combinations
Acquisition of Wyndham Capital Mortgage
On April 3, 2023, we acquired all of the outstanding equity interests in Wyndham for cash consideration. With the acquisition of Wyndham, a leading fintech mortgage lender, we broadened our suite of home loan products and now manage the technology for a digitized mortgage experience. The acquisition is beingwas accounted for as a business combination. The purchase consideration is beingwas allocated to the tangible and intangible assets acquired and liabilities assumed based on the estimated fair values as of the acquisition date. The excess of the total purchase consideration over the fair value of the net assets acquired is allocated to goodwill, which is expected to be deductible for tax purposes. TheNo adjustments were made to the fair value estimates are subjectof the net assets during the year subsequent to change for up to one year after the acquisition date as additional information becomes available.acquisition. The acquisition was not determined to be a significant acquisition.
Acquisition of Technisys S.A.
During the nine months ended September 30, 2023, we made payments of $17,946 related to settlements of vested employee performance awards, which was a component of the purchase consideration in the Technisys Merger. There were 6,305,595 shares issued in the acquisition of Technisys that were held in escrow. During the second quarter ofyear ended December 31, 2023, we released 6,244,4506,259,736 of the escrow shares. The remaining 61,14545,859 shares continue to be held in escrow pending resolution of outstanding indemnification claims by SoFi.
AcquisitionGoodwill and Intangible Assets
Goodwill as of Golden Pacific Bancorp, Inc.
both March 31, 2024 and December 31, 2023 was $1,393,505. As of September 30, 2023, a portionMarch 31, 2024, goodwill attributable to the Lending, Technology Platform and Financial Services reportable segments was $17,688, $1,338,658 and $37,159, respectively. Management does not believe that the goodwill in any of the total cash purchase consideration ($3.3 million) related to our acquisitionreporting units is impaired as of Golden Pacific remained held back, representing an amount payable to a dissenting Golden Pacific shareholder pending resolution of the shareholder’s dissenter’s rights appraisal claim, which could possibly result in a lower or higher amount paid to the dissenting shareholder once a ruling is made regarding the appraisal claim.March 31, 2024.
SoFi Technologies, Inc.
SoFi Technologies, Inc.
Notes to Condensed Consolidated Financial Statements (Continued)
(Unaudited)
(In Thousands, Unless Otherwise Stated and Except for Share and Per Share Data)
Goodwill and Intangible Assets
A rollforward of our goodwill balance is presented below:
| | | | | |
| Nine Months Ended September 30, |
| 2023 |
Beginning balance | $ | 1,622,991 | |
Less: accumulated impairment | — | |
Beginning balance, net | 1,622,991 | |
Additional goodwill recognized(1)
| 17,688 | |
| |
Goodwill impairment(2)
| (247,174) | |
Ending balance(3)
| $ | 1,393,505 | |
_____________________
(1) Related to the acquisition of Wyndham, which is attributable to our Lending reportable segment.
(2) During the three and nine months ended September 30, 2023, we recognized goodwill impairment losses related to our Technology Platform reportable segment, which were reported within noninterest expense—goodwill impairment in the condensed consolidated statements of operations and comprehensive loss. These goodwill impairment losses represent non-cash charges and did not affect our liquidity position or regulatory capital ratios.
(3) As of September 30, 2023, goodwill attributable to the Lending, Technology Platform and Financial Services reportable segments was $17,688, $1,338,658 and $37,159, respectively.
An impairment of a reporting unit’s goodwill is determined based on the amount by which the reporting unit’s carrying value exceeds its fair value, limited to the amount of goodwill allocated to the reporting unit. An interim test is performed when events or circumstances occur that may indicate that it is more likely than not that the fair value of any reporting unit may be less than its carrying value. During the third quarter of 2023, the Technology Platform segment continued to experience slower growth rates than expected at the time of acquisition due to: (i) the uncertain macroeconomic environment, which has continued to impact customer spend volume, and (ii) continued longer sales cycles as a result of our shift in strategy to focus on diversified durable growth driven by potential new partners with scaled customer bases and interest in multiple Technology Platform products. These factors constituted a triggering event for goodwill testing purposes. As a result, we performed an interim quantitative test on the Galileo and Technisys reporting units to determine the existence and magnitude of potential goodwill impairment. We determined it was not necessary to perform an interim goodwill impairment test for our other reporting units.
Management calculated the fair value amount of the Galileo and Technisys reporting units using a combination of a discounted cash flow (“DCF”) calculation, which is a form of the income approach, and a market multiples calculation, which is a form of the market approach. The discount rates used for the Galileo and Technisys reporting units in our interim quantitative assessment were 14.0% and 23.5%, respectively. The higher discount rate at Technisys was primarily driven by macroeconomic factors in Latin America, specifically the highly inflationary economic environment in Argentina. We applied a terminal year long-term growth rate of 3.5% to both reporting units, which is consistent with rates used in previous assessments of the reporting units. As a result of this assessment, the fair values of the Galileo and Technisys reporting units were determined to be below their carrying values by 9.9% and 14.8%, respectively, resulting in goodwill impairment charges of $124.5 million and $122.7 million, respectively.
Determining the fair value of a reporting unit is subject to uncertainty as it is reliant on estimates of cash flows that extend far into the future, and, by their nature, are difficult to estimate over such an extended time frame. The cash flow estimates for the Galileo and Technisys reporting units are impacted by projections, and in the future, changes in the assumptions or the discount rates could produce an additional material goodwill impairment.
Note 3. Revenue
In each of our revenue arrangements, revenue is recognized when control of the promised goods or services is transferred to the customer in an amount that reflects our expected consideration in exchange for those goods or services. Our arrangements are discussed in our Annual Report on Form 10-K, with notable updates provided herein.
SoFi Technologies, Inc.
SoFi Technologies, Inc.
Notes to Condensed Consolidated Financial Statements (Continued)
(Unaudited)
(In Thousands, Unless Otherwise Stated and Except for Share and Per Share Data)
Disaggregated Revenue
The table below presents revenue from contracts with customers disaggregated by type of service, which best depicts how the revenue and cash flows are affected by economic factors, and by the reportable segment to which each revenue stream relates, as well as a reconciliation of total revenue from contracts with customers to total noninterest income. Revenue from contracts with customers is presented within noninterest income—technology products and solutions and noninterest income—other in the condensed consolidated statements of operations and comprehensive loss.income (loss). There were no revenues from contracts with customers attributable to our Lending segment for any of the periods presented.
| | Three Months Ended September 30, | | Nine Months Ended September 30, |
| | | Three Months Ended March 31, | |
| | | Three Months Ended March 31, | |
| | | Three Months Ended March 31, | |
| | 2023 | | 2022 | | 2023 | | 2022 | | | | | | 2024 | | 2023 |
| Financial Services | Financial Services | | | | | | | |
| Referrals | |
| Referrals | |
| Referrals | Referrals | $ | 9,983 | | | $ | 10,210 | | | $ | 27,832 | | | $ | 26,783 | |
| Interchange | Interchange | 6,029 | | | 4,225 | | | 21,961 | | | 11,518 | |
| Brokerage | Brokerage | 6,084 | | | 3,854 | | | 16,187 | | | 12,740 | |
Other(1) | Other(1) | 1,395 | | | 1,562 | | | 2,230 | | | 1,990 | |
| Total financial services | Total financial services | 23,491 | | | 19,851 | | | 68,210 | | | 53,031 | |
Technology Platform(2) | Technology Platform(2) | | | | | | | |
| Technology services | Technology services | 81,419 | | | 81,474 | | | 233,876 | | | 221,742 | |
| Technology services | |
| Technology services | |
Other(1) | Other(1) | 34 | | | 679 | | | 3,033 | | | 2,674 | |
| Total technology platform | Total technology platform | 81,453 | | | 82,153 | | | 236,909 | | | 224,416 | |
Total revenue from contracts with customers | Total revenue from contracts with customers | 104,944 | | | 102,004 | | | 305,119 | | | 277,447 | |
| Other Sources of Revenue | Other Sources of Revenue | | | | | | | |
| Loan origination and sales | 81,683 | | | 163,697 | | | 311,258 | | | 465,815 | |
| Securitizations | (6,298) | | | (8,772) | | | (22,375) | | | (31,790) | |
| Loan origination, sales, and securitizations | |
| Loan origination, sales, and securitizations | |
| Loan origination, sales, and securitizations | |
| Servicing | Servicing | 8,009 | | | 7,296 | | | 29,803 | | | 30,003 | |
| Other | Other | 3,908 | | | 1,910 | | | 11,481 | | | (131) | |
Total other sources of revenue | Total other sources of revenue | 87,302 | | | 164,131 | | | 330,167 | | | 463,897 | |
| Total noninterest income | Total noninterest income | $ | 192,246 | | | $ | 266,135 | | | $ | 635,286 | | | $ | 741,344 | |
(1) Financial Services includes revenues from enterprise services and equity capital markets services. Technology Platform includes revenues from software licenses and associated services, and payment network fees for serving as a transaction card program manager for enterprise customers that are the program marketers for separate card programs.
(2) Related to these technology products and solutions arrangements,platform services, we had deferred revenuesrevenue of $5,418$5,655 and $10,028$5,718 as of September 30, 2023March 31, 2024 and December 31, 2022,2023, respectively, which are presented within accounts payable, accruals and other liabilities in the condensed consolidated balance sheets. We recognized revenue of $1,778$1,300 and $3,925$2,340 during the three months ended September 30,March 31, 2024 and 2023, and 2022, respectively, and $6,562 and $6,699 during the nine months ended September 30, 2023 and 2022, respectively, associated with deferred revenuesrevenue within noninterest income—technology products and solutions in the condensed consolidated statements of operations and comprehensive loss.income (loss).
Contract Balances
As of September 30, 2023March 31, 2024 and December 31, 2022,2023, accounts receivable, net associated with revenue from contracts with customers was $63,301$66,323 and $61,226,$60,466, respectively, which were reported within other assets in the condensed consolidated balance sheets.
SoFi Technologies, Inc.
SoFi Technologies, Inc.
Notes to Condensed Consolidated Financial Statements (Continued)
(Unaudited)
(In Thousands, Unless Otherwise Stated and Except for Share and Per Share Data)
Note 4. Loans
As of September 30, 2023,March 31, 2024, our loan portfolio consisted of (i) loans held for sale, including personal loans, student loans and home loans, which are measured at fair value under the fair value option, and(ii) loans held for investment, including student loans, which are measured at fair value under the fair value option, and (iii) loans held for investment, including senior secured loans, credit cards, and commercial and consumer banking loans, which are measured at amortized cost. Below is a disaggregated presentation of our loans, inclusive of fair market value adjustments and accrued interest income and net of the allowance for credit losses, as applicable:
| | September 30,
2023 | | December 31,
2022 |
| March 31,
2024 | | | March 31,
2024 | | December 31,
2023 |
| Loans held for sale | Loans held for sale | | | |
Personal loans(1) | Personal loans(1) | $ | 14,850,996 | | | $ | 8,610,434 | |
Student loans(2) | 6,041,544 | | | 4,877,177 | |
Personal loans(1) | |
Personal loans(1) | |
| | Home loans | |
| Home loans | |
| Home loans | Home loans | 101,296 | | | 69,463 | |
| Total loans held for sale, at fair value | Total loans held for sale, at fair value | 20,993,836 | | | 13,557,074 | |
Loans held for investment(3) | | | |
Credit card(4) | 247,241 | | | 209,164 | |
Loans held for investment(2) | |
Student loans(3) | |
Student loans(3) | |
Student loans(3) | |
| Total loans held for investment, at fair value | |
| Senior secured loans | |
| Credit card | |
| Commercial and consumer banking: | Commercial and consumer banking: | |
| Commercial real estate | |
| Commercial real estate | |
| Commercial real estate | Commercial real estate | 104,743 | | | 88,652 | |
| Commercial and industrial | Commercial and industrial | 5,917 | | | 7,179 | |
| Residential real estate and other consumer | Residential real estate and other consumer | 3,347 | | | 2,962 | |
| Total commercial and consumer banking | Total commercial and consumer banking | 114,007 | | | 98,793 | |
| Total loans held for investment, at amortized cost | Total loans held for investment, at amortized cost | 361,248 | | | 307,957 | |
| Total loans held for investment | |
| Total loans | Total loans | $ | 21,355,084 | | | $ | 13,865,031 | |
_____________________
(1) Includes $618,829$388,980 and $663,004$502,757 of personal loans in consolidated VIEs as of September 30, 2023March 31, 2024 and December 31, 2022,2023, respectively.
(2)Includes $275,244 and $268,697 of student loans in consolidated VIEs as of September 30, 2023 and December 31, 2022, respectively.
(3) See Note 5. Allowance for Credit Losses for additional information on our loans at amortized cost as it pertains to the allowance for credit losses.
(4)(3) For credit cards, loan origination costs are expensedIncludes $2,343,557 and $2,459,103 of student loans covered by financial guarantee, and $158,191 and $221,461 of student loans in consolidated VIEs as incurred primarily within noninterest expense—salesof March 31, 2024 and marketing in the condensed consolidated statements of operations and comprehensive loss.December 31, 2023, respectively.
Loans Held for Sale
The following table summarizes the aggregate fair value of our loans held for sale, for which we elected the fair value option. See Note 12. Fair Value Measurements for the assumptions used in our fair value model.
| | | | | | | | | | | | | | | | | | | | | | | |
| Personal Loans | | Student Loans | | Home Loans | | Total |
| September 30, 2023 | | | | | | | |
| Unpaid principal | $ | 14,177,004 | | | $ | 5,929,047 | | | $ | 110,320 | | | $ | 20,216,371 | |
| Accumulated interest | 105,156 | | | 26,497 | | | 163 | | | 131,816 | |
Cumulative fair value adjustments(1) | 568,836 | | | 86,000 | | | (9,187) | | | 645,649 | |
Total fair value of loans(2) | $ | 14,850,996 | | | $ | 6,041,544 | | | $ | 101,296 | | | $ | 20,993,836 | |
| December 31, 2022 | | | | | | | |
| Unpaid principal | $ | 8,283,400 | | | $ | 4,794,517 | | | $ | 77,705 | | | $ | 13,155,622 | |
| Accumulated interest | 55,673 | | | 19,433 | | | 151 | | | 75,257 | |
Cumulative fair value adjustments(1) | 271,361 | | | 63,227 | | | (8,393) | | | 326,195 | |
Total fair value of loans(2) | $ | 8,610,434 | | | $ | 4,877,177 | | | $ | 69,463 | | | $ | 13,557,074 | |
SoFi Technologies, Inc.
SoFi Technologies, Inc.
Notes to Condensed Consolidated Financial Statements (Continued)
(Unaudited)
(In Thousands, Unless Otherwise Stated and Except for Share and Per Share Data)
Loans Measured at Fair Value
The following table summarizes the aggregate fair value of our loans, for which we elected the fair value option. See Note 12. Fair Value Measurements for the assumptions used in our fair value model.
| | | | | | | | | | | | | | | | | | | | | | | |
| Personal Loans | | Student Loans | | Home Loans | | Total |
| March 31, 2024 | | | | | | | |
| Unpaid principal | $ | 14,332,874 | | | $ | 6,559,211 | | | $ | 58,304 | | | $ | 20,950,389 | |
| Accumulated interest | 116,366 | | | 27,414 | | | 22 | | | 143,802 | |
| Cumulative fair value adjustments | 607,765 | | | 247,536 | | | 1,151 | | | 856,452 | |
Total fair value of loans(1) | $ | 15,057,005 | | | $ | 6,834,161 | | | $ | 59,477 | | | $ | 21,950,643 | |
| December 31, 2023 | | | | | | | |
| Unpaid principal | $ | 14,498,629 | | | $ | 6,445,586 | | | $ | 67,406 | | | $ | 21,011,621 | |
| Accumulated interest | 114,541 | | | 34,357 | | | 92 | | | 148,990 | |
| Cumulative fair value adjustments | 717,403 | | | 245,541 | | | (1,300) | | | 961,644 | |
Total fair value of loans(1) | $ | 15,330,573 | | | $ | 6,725,484 | | | $ | 66,198 | | | $ | 22,122,255 | |
__________________
(1)During the nine months ended September 30, 2023, the cumulative fair value adjustments for personal loans were primarily impacted by higher origination volume and higher coupon rates, partially offset by higher benchmark rates.
(2) Each component of the fair value of loans is impacted by charge-offs during the period. Our fair value assumption for annual default rate incorporates fair value markdowns on loans beginning when they are 10 days or more delinquent, with additional markdowns at 30, 60 and 90 days past due.
The following table summarizes the aggregate fair value of loans 90 days or more delinquent. As delinquent personal loans and student loans are charged off after 120 days of delinquency, amounts presented below represent the fair value of loans that are 90 to 120 days delinquent.
| | | Personal Loans | | Student Loans | | Home Loans | | Total | | Personal Loans | | Student Loans | | Home Loans | | Total |
| September 30, 2023 | | | | | | | |
| March 31, 2024 | |
| Unpaid principal balance | |
| Unpaid principal balance | |
| Unpaid principal balance | Unpaid principal balance | $ | 68,432 | | | $ | 8,502 | | | $ | 213 | | | $ | 77,147 | |
| Accumulated interest | Accumulated interest | 3,400 | | | 335 | | | — | | | 3,735 | |
Cumulative fair value adjustments(1) | Cumulative fair value adjustments(1) | (58,676) | | | (5,104) | | | (140) | | | (63,920) | |
| Fair value of loans 90 days or more delinquent | $ | 13,156 | | | $ | 3,733 | | | $ | 73 | | | $ | 16,962 | |
| December 31, 2022 | | | | | | | |
Fair value of loans 90 days or more delinquent (2) | |
| December 31, 2023 | |
| Unpaid principal balance | |
| Unpaid principal balance | |
| Unpaid principal balance | Unpaid principal balance | $ | 27,989 | | | $ | 6,435 | | | $ | — | | | $ | 34,424 | |
| Accumulated interest | Accumulated interest | 1,207 | | | 304 | | | — | | | 1,511 | |
Cumulative fair value adjustments(1) | Cumulative fair value adjustments(1) | (25,022) | | | (3,332) | | | — | | | (28,354) | |
| Fair value of loans 90 days or more delinquent | $ | 4,174 | | | $ | 3,407 | | | $ | — | | | $ | 7,581 | |
Fair value of loans 90 days or more delinquent (2) | |
(1) Our fair value assumption for annual default rate incorporates fair value markdowns on loans beginning when they are 10 days or more delinquent, with additional markdowns at 30, 60 and 90 days past due. We record the initial fair value measurement and subsequent measurement changes in fair value in the period in which the changes occur within noninterest income—loan origination, sales, and securitizations in the consolidated statements of operations and comprehensive loss. As such, the $93.1 million fair value adjustment as of March 31, 2024 has been recorded in noninterest income—loan origination, sales, and securitizations in the respective periods in which 10, 30, 60, and 90 days of delinquency occurred. See our Annual Report on Form 10-K for further discussion of the policies for determining the fair value of our loan portfolios.
(2) The fair value incorporates the expected price to be paid by buyers of these delinquent loans after charge-off occurs, implying that potential recoveries are expected to be in excess of these levels based on consistent demonstrated recoverability after a loan becomes delinquent and gets charged off.
Transfers of Financial Assets
We regularly transfer financial assets and account for such transfers as either sales or secured borrowings depending on the facts and circumstances of the transfer. When a transfer of financial assets qualifies as a sale, in many instances we have continuing involvement as the servicer of those financial assets. As we expect the benefits of servicing to be more than just adequate, we recognize a servicing asset. Further, in the case of securitization-related transfers that qualify as sales, we have additional continuing involvement as an investor, albeit at insignificant levels relative to the expected gains and losses of the securitization. In instances where a transfer is accounted for as a secured borrowing, we perform servicing (but we do not
SoFi Technologies, Inc.
SoFi Technologies, Inc.
Notes to Condensed Consolidated Financial Statements (Continued)
(Unaudited)
(In Thousands, Unless Otherwise Stated and Except for Share and Per Share Data)
recognize a servicing asset) and typically maintain a significant investment relative to the expected gains and losses of the securitization. In whole loan sales, we do not have a residual financial interest in the loans, nor do we have any other power over the loans that would constrain us from recognizing a sale. Additionally, we generally have no repurchase requirements related to transfers of personal loans, student loans and non-government-sponsored enterprisenon-GSE home loans other than standard origination representations and warranties, for which we record a liability based on expected repurchase obligations. For government-sponsored enterprise (“GSE”)GSE home loans, we have customary GSE repurchase requirements, which do not constrain sale treatment but result in a liability for the expected repurchase requirement.
The following table summarizes our personal loan securitization transfers qualifying for sale accounting treatment during the three months ended March 31, 2024. There were no loan securitization transfers qualifying for sale accounting treatment during the ninethree months ended September 30, 2023 and 2022.March 31, 2023.
| | | | | | | | | |
| | | | | Three Months Ended
March 31, 2024 |
| Personal loans | | | | | |
| Fair value of consideration received: | | | | | |
| Cash | | | | | $ | 674,036 | |
| Securitization investments | | | | | 35,615 | |
| | | | | |
| Servicing assets recognized | | | | | 27,524 | |
| Repurchase liabilities recognized | | | | | (280) | |
| Total consideration | | | | | 736,895 | |
| Aggregate unpaid principal balance and accrued interest of loans sold | | | | | 701,601 | |
| Gain from loan sales | | | | | $ | 35,294 | |
| | | | | |
| | | | | |
| | | | | |
| | | | | |
| | | | | |
| | | | | |
| | | | | |
| | | | | |
| | | | | |
Deconsolidation of debt reflects the impacts of previously consolidated VIEs that became deconsolidated during the period because we no longer hold a significant financial interest in the underlying securitization entity, which can fluctuate from period to period. Gains and losses on deconsolidations are presented within noninterest income—loan origination, sales, and securitizations in the condensed consolidated statements of operations and comprehensive loss.income (loss). During the ninethree months ended September 30, 2023,March 31, 2024, we had deconsolidation of debt on student loans of $45.9$42.1 million. The impact on earnings from thethis deconsolidation was immaterial.immaterial. During the three months ended September 30,March 31, 2023, we did not have any deconsolidation of debt. During the three and nine months ended September 30, 2022, we did not have any deconsolidations of debt.
SoFi Technologies, Inc.
SoFi Technologies, Inc.
Notes to Condensed Consolidated Financial Statements (Continued)
(Unaudited)
(In Thousands, Unless Otherwise Stated and Except for Share and Per Share Data)
The following table summarizes our current whole loan sales:
| | | | | | | | | | | | | | | | | | | | | | | |
| Three Months Ended September 30, | | Nine Months Ended September 30, |
| 2023 | | 2022 | | 2023 | | 2022 |
| Personal loans | | | | | | | |
| Fair value of consideration received: | | | | | | | |
| Cash | $ | 15,098 | | | $ | 773,005 | | | $ | 66,571 | | | $ | 2,954,723 | |
| Servicing assets recognized | 767 | | | 6,789 | | | 1,655 | | | 20,872 | |
| Repurchase liabilities recognized | (45) | | | (2,074) | | | (405) | | | (7,161) | |
| Total consideration received | 15,820 | | | 777,720 | | | 67,821 | | | 2,968,434 | |
| Aggregate unpaid principal balance and accrued interest of loans sold | 15,098 | | | 753,259 | | | 65,420 | | | 2,864,351 | |
| Gain from loan sales | $ | 722 | | | $ | 24,461 | | | $ | 2,401 | | | $ | 104,083 | |
Sale execution(1) | 105.1 | % | | 103.5 | % | | 104.3 | % | | 103.9 | % |
| Student loans | | | | | | | |
| Fair value of consideration received: | | | | | | | |
| Cash | $ | — | | | $ | 77,089 | | | $ | 98,624 | | | $ | 883,859 | |
| Servicing assets recognized | — | | | 460 | | | 2,792 | | | 9,275 | |
| Repurchase liabilities recognized | — | | | (13) | | | (16) | | | (134) | |
| Total consideration | — | | | 77,536 | | | 101,400 | | | 893,000 | |
| Aggregate unpaid principal balance and accrued interest of loans sold | — | | | 74,311 | | | 99,916 | | | 881,922 | |
| Gain from loan sales | $ | — | | | $ | 3,225 | | | $ | 1,484 | | | $ | 11,078 | |
Sale execution(1) | — | % | | 104.4 | % | | 101.5 | % | | 101.3 | % |
| | | | | | | |
| Home loans | | | | | | | |
| Fair value of consideration received: | | | | | | | |
| Cash | $ | 331,364 | | | $ | 244,788 | | | $ | 676,235 | | | $ | 926,707 | |
| Servicing assets recognized | 3,376 | | | 3,432 | | | 7,133 | | | 12,152 | |
| Repurchase liabilities recognized | (468) | | | (269) | | | (1,315) | | | (1,004) | |
| Total consideration | 334,272 | | | 247,951 | | | 682,053 | | | 937,855 | |
| Aggregate unpaid principal balance and accrued interest of loans sold | 333,951 | | | 252,168 | | | 678,561 | | | 960,680 | |
| Gain (loss) from loan sales | $ | 321 | | | $ | (4,217) | | | $ | 3,492 | | | $ | (22,825) | |
Sale execution(1) | 100.2 | % | | 98.4 | % | | 100.7 | % | | 97.7 | % |
_____________________ | | | | | | | | | | | | | | | |
| | | Three Months Ended March 31, |
| | | | | 2024 | | 2023 |
| Personal loans | | | | | | | |
| Fair value of consideration received: | | | | | | | |
| Cash | | | | | $ | 499,751 | | | $ | — | |
| Receivable | | | | | 3,036 | | | — | |
| Servicing assets recognized | | | | | 33,549 | | | — | |
| Repurchase liabilities recognized | | | | | (1,800) | | | — | |
| Total consideration | | | | | 534,536 | | | — | |
| Aggregate unpaid principal balance and accrued interest of loans sold | | | | | 503,037 | | | — | |
| Realized gain | | | | | $ | 31,499 | | | $ | — | |
| Student loans | | | | | | | |
| Fair value of consideration received: | | | | | | | |
| Cash | | | | | $ | 310,331 | | | $ | — | |
| Servicing assets recognized | | | | | 8,249 | | | — | |
| Repurchase liabilities recognized | | | | | (46) | | | — | |
| Total consideration | | | | | 318,534 | | | — | |
| Aggregate unpaid principal balance and accrued interest of loans sold | | | | | 303,578 | | | — | |
| Realized gain | | | | | $ | 14,956 | | | $ | — | |
| Home loans | | | | | | | |
| Fair value of consideration received: | | | | | | | |
| Cash | | | | | $ | 344,678 | | | $ | 77,819 | |
| Servicing assets recognized | | | | | 2,832 | | | 954 | |
| Repurchase liabilities recognized | | | | | (505) | | | (96) | |
| Total consideration | | | | | 347,005 | | | 78,677 | |
| Aggregate unpaid principal balance and accrued interest of loans sold | | | | | 344,258 | | | 77,976 | |
| Realized gain | | | | | $ | 2,747 | | | $ | 701 | |
The following table summarizes our delinquent whole loan sales during the three months ended March 31, 2024. There were no delinquent whole loan sales during the three months ended March 31, 2023.
| | | | | | | | | | | |
| | | | | Three Months Ended March 31, | | |
| | | | | 2024 | | |
| Personal loans | | | | | | | |
| Fair value of consideration received: | | | | | | | |
| Cash | | | | | $ | 5,000 | | | |
| Servicing assets recognized | | | | | 3,400 | | | |
| Repurchase liabilities recognized | | | | | (25) | | | |
| Total consideration | | | | | 8,375 | | | |
Aggregate unpaid principal balance and accrued interest of loans sold(1) | | | | | 66,411 | | | |
| Realized loss | | | | | $ | (58,036) | | | |
__________________
(1)Sale execution represents the ratioIncludes $62.5 million of cash proceeds and servicing assets recognized to the aggregate unpaid principal balance sold, related to late-stage delinquent loans for which we retained servicing and accrued interestportions of recoveries. $43.2 million of the $62.5 million of unpaid principal balance was recorded in prior periods as a write down in noninterest income—loan origination, sales, and securitizations in the condensed consolidated statements of operations and comprehensive income (loss). These loans sold. Amounts included in repurchase liabilities are excluded fromwere sold prior to charge-off during the calculation,three months ended March 31, 2024, and otherwise would have been charged off as theyof March 31, 2024 consistent with our policy. In our other charged off whole loan sales, we typically woulddo not materially differ from the fair value markdown on the loans over the repurchase period had they been held on balance sheetretain servicing or recoveries.
SoFi Technologies, Inc.
SoFi Technologies, Inc.
Notes to Condensed Consolidated Financial Statements (Continued)
(Unaudited)
(In Thousands, Unless Otherwise Stated and entered delinquency.Except for Share and Per Share Data)
For certain transferred loans that qualified for sale accounting and are, therefore, off-balance sheet, we have continuing involvement through our servicing agreements. For such loans, our exposure to loss is generally limited to the extent we would be required to repurchase such a loan due to a breach of representations and warranties associated with the loan transfer or servicing contract.
SoFi Technologies, Inc.
SoFi Technologies, Inc.
Notes to Condensed Consolidated Financial Statements (Continued)
(Unaudited)
(In Thousands, Unless Otherwise Stated and Except for Share and Per Share Data)
The following table presents information about the unpaid principal balances of loans originated by us and subsequently transferred, but with which we have continuing involvement:
| | | Personal Loans | | Student Loans | | Home Loans | | Total | | Personal Loans | | Student Loans | | Home Loans | | Total |
| September 30, 2023 | | | | | | | |
| | March 31, 2024 | |
| Loans in delinquency (30+ days past due) | |
| Loans in delinquency (30+ days past due) | |
| Loans in delinquency (30+ days past due) | Loans in delinquency (30+ days past due) | $ | 60,634 | | | $ | 58,308 | | | $ | 26,382 | | | $ | 145,324 | |
| Total loans in delinquency | Total loans in delinquency | 96,718 | | | 130,497 | | | 26,382 | | | 253,597 | |
Total transferred loans serviced(1) | Total transferred loans serviced(1) | 1,696,118 | | | 6,462,082 | | | 5,457,959 | | | 13,616,159 | |
| December 31, 2022 | | | | | | | |
| | December 31, 2023 | | December 31, 2023 | | | |
| Loans in delinquency (30+ days past due) | Loans in delinquency (30+ days past due) | $ | 64,654 | | | $ | 46,986 | | | $ | 16,510 | | | $ | 128,150 | |
| Total loans in delinquency | Total loans in delinquency | 108,991 | | | 115,818 | | | 16,510 | | | 241,319 | |
Total transferred loans serviced(1) | Total transferred loans serviced(1) | 2,995,601 | | | 7,586,031 | | | 5,134,306 | | | 15,715,938 | |
(1)Total transferred loans serviced includes loans in delinquency, as well as loans in repayment, loans in-school/grace period/deferment (related to student loans), and loans in forbearance. The vast majority of total transferred loans serviced represent loans in repayment as of the dates indicated.
The following table presents additional information about the servicing cash flows received and net charge-offs related to loans originated by us and subsequently transferred, but with which we have a continuing involvement:
| | | | | | | | | | | | | | | | | | | | | | | |
| Three Months Ended September 30, | | Nine Months Ended September 30, |
| 2023 | | 2022 | | 2023 | | 2022 |
| Personal loans | | | | | | | |
| Servicing fees collected from transferred loans | $ | 4,033 | | | $ | 9,020 | | | $ | 15,080 | | | $ | 25,845 | |
Charge-offs, net of recoveries, of transferred loans(1) | 40,916 | | | 24,190 | | | 128,442 | | | 62,852 | |
| Student loans | | | | | | | |
| Servicing fees collected from transferred loans | 5,375 | | | 8,224 | | | 20,967 | | | 28,437 | |
Charge-offs, net of recoveries, of transferred loans(1) | 10,139 | | | 7,372 | | | 29,297 | | | 24,784 | |
| Home loans | | | | | | | |
| Servicing fees collected from transferred loans | 3,662 | | | 3,686 | | | 10,481 | | | 9,252 | |
| | | | | | | |
| Total | | | | | | | |
| Servicing fees collected from transferred loans | $ | 13,070 | | | $ | 20,930 | | | $ | 46,528 | | | $ | 63,534 | |
Charge-offs, net of recoveries, of transferred loans(1) | 51,055 | | | 31,562 | | | 157,739 | | | 87,636 | |
_____________________
(1)Personal loan and student loan charge-offs, net of recoveries, are impacted by the timing of charge-off sales performed on behalf of the purchasers of our loans, which lower the net amount disclosed. | | | | | | | | | | | | | | | | | |
| | | Three Months Ended March 31, |
| | | | | 2024 | | 2023 |
| Personal loans | | | | | | | |
| Servicing fees collected from transferred loans | | | | | $ | 9,445 | | | $ | 6,177 | |
| Charge-offs, net of recoveries, of transferred loans | | | | | 85,333 | | | 46,115 | |
| Student loans | | | | | | | |
| Servicing fees collected from transferred loans | | | | | 6,146 | | | 9,190 | |
| Charge-offs, net of recoveries, of transferred loans | | | | | 10,853 | | | 9,153 | |
| Home loans | | | | | | | |
| Servicing fees collected from transferred loans | | | | | 4,039 | | | 3,160 | |
| | | | | | | |
| Total | | | | | | | |
| Servicing fees collected from transferred loans | | | | | $ | 19,630 | | | $ | 18,527 | |
| Charge-offs, net of recoveries, of transferred loans | | | | | 96,186 | | | 55,268 | |
SoFi Technologies, Inc.
SoFi Technologies, Inc.
Notes to Condensed Consolidated Financial Statements (Continued)
(Unaudited)
(In Thousands, Unless Otherwise Stated and Except for Share and Per Share Data)
Loans Held for InvestmentMeasured at Amortized Cost
Loan Portfolio Composition and Aging
The following table presents the amortized cost basis of our credit card and commercial and consumer banking portfolios (excluding accrued interest and before the allowance for credit losses) by either current status or delinquency status:
| | Delinquent Loans | |
| Current | | 30–59 Days | | 60–89 Days | | ≥ 90 Days(1) | | Total Delinquent Loans | | Total Loans(2) |
| September 30, 2023 | | | | | | | | | | | |
| | | Delinquent Loans | |
| Current | |
| Current | |
| Current | | | 30–59 Days | | 60–89 Days | | ≥ 90 Days(1) | | Total Delinquent Loans | | Total Loans(2) |
| March 31, 2024 | |
| Senior secured loans | |
| Senior secured loans | |
| Senior secured loans | |
| Credit card | Credit card | $ | 271,827 | | | $ | 5,005 | | | $ | 4,078 | | | $ | 11,294 | | | $ | 20,377 | | | $ | 292,204 | |
| Commercial and consumer banking: | Commercial and consumer banking: | |
| Commercial real estate | |
| Commercial real estate | |
| Commercial real estate | Commercial real estate | 105,709 | | | — | | | — | | | — | | | — | | | 105,709 | |
| Commercial and industrial | Commercial and industrial | 5,684 | | | 288 | | | — | | | 466 | | | 754 | | | 6,438 | |
Residential real estate and other consumer(3) | Residential real estate and other consumer(3) | 3,342 | | | — | | | — | | | — | | | — | | | 3,342 | |
| Total commercial and consumer banking | Total commercial and consumer banking | 114,735 | | | 288 | | | — | | | 466 | | | 754 | | | 115,489 | |
| Total loans | Total loans | $ | 386,562 | | | $ | 5,293 | | | $ | 4,078 | | | $ | 11,760 | | | $ | 21,131 | | | $ | 407,693 | |
| December 31, 2022 | | | | | | | | | | | |
| December 31, 2023 | |
| Senior secured loans | |
| Senior secured loans | |
| Senior secured loans | |
| Credit card | Credit card | $ | 225,165 | | | $ | 4,670 | | | $ | 3,626 | | | $ | 10,498 | | | $ | 18,794 | | | $ | 243,959 | |
| Commercial and consumer banking: | Commercial and consumer banking: | |
| Commercial real estate | |
| Commercial real estate | |
| Commercial real estate | Commercial real estate | 89,544 | | | — | | | — | | | — | | | — | | | 89,544 | |
| Commercial and industrial | Commercial and industrial | 7,636 | | | — | | | 1 | | | — | | | 1 | | | 7,637 | |
Residential real estate and other consumer(3) | Residential real estate and other consumer(3) | 2,966 | | | — | | | — | | | — | | | — | | | 2,966 | |
| Total commercial and consumer banking | Total commercial and consumer banking | 100,146 | | | — | | | 1 | | | — | | | 1 | | | 100,147 | |
| Total loans | Total loans | $ | 325,311 | | | $ | 4,670 | | | $ | 3,627 | | | $ | 10,498 | | | $ | 18,795 | | | $ | 344,106 | |
(1)All of the credit cards ≥ 90 days past due continued to accrue interest. As of the dates indicated, there were no credit cards on nonaccrual status. As of the dates indicated, commercial and consumer banking loans on nonaccrual status were immaterial.
(2)For credit card, the balance is presented before allowance for credit losses of $50,055$49,092 and $39,110$52,385 as of September 30, 2023March 31, 2024 and December 31, 2022,2023, respectively, and accrued interest of $5,092$4,937 and $4,315,$5,288, respectively. For senior secured loans, the balance is presented before accrued interest of $1,292 and $730 as of March 31, 2024 and December 31, 2023, respectively. For commercial and consumer banking, the balance is presented before allowance for credit losses of $1,868$2,221 and $1,678,$2,310 as of March 31, 2024 and December 31, 2023, respectively, and accrued interest of $386$479 and $324,$415, respectively.
(3)Primarily includesIncludes residential real estate loans acquired in the Bank Merger,originated by Golden Pacific for which we did not elect the fair value option.
SoFi Technologies, Inc.
SoFi Technologies, Inc.
Notes to Condensed Consolidated Financial Statements (Continued)
(Unaudited)
(In Thousands, Unless Otherwise Stated and Except for Share and Per Share Data)
Credit Quality Indicators
Credit Card
The following table presents the amortized cost basis of our credit card portfolio (excluding accrued interest and before the allowance for credit losses) based on FICO scores, which are obtained at origination of the account and are refreshed monthly thereafter. The pools estimate the likelihood of borrowers with similar FICO scores to pay credit obligations based on aggregate credit performance data.
| | FICO | FICO | | September 30, 2023 | | December 31, 2022 | FICO | | March 31, 2024 | | December 31, 2023 |
| ≥ 800 | ≥ 800 | | $ | 22,999 | | | $ | 14,421 | |
| 780 – 799 | 780 – 799 | | 15,905 | | | 11,327 | |
| 760 – 779 | 760 – 779 | | 18,180 | | | 12,179 | |
| 740 – 759 | 740 – 759 | | 20,179 | | | 14,501 | |
| 720 – 739 | 720 – 739 | | 25,172 | | | 19,343 | |
| 700 – 719 | 700 – 719 | | 30,789 | | | 26,239 | |
| 680 – 699 | 680 – 699 | | 36,490 | | | 31,543 | |
| 660 – 679 | 660 – 679 | | 34,714 | | | 31,958 | |
| 640 – 659 | 640 – 659 | | 25,265 | | | 25,959 | |
| 620 – 639 | 620 – 639 | | 15,922 | | | 15,566 | |
| 600 – 619 | 600 – 619 | | 9,625 | | | 8,968 | |
| ≤ 599 | ≤ 599 | | 36,964 | | | 31,955 | |
| Total credit card | Total credit card | | $ | 292,204 | | | $ | 243,959 | |
Commercial and Consumer Banking
We analyze loans in our commercial and consumer banking portfolio by classification based on their associated credit risk, and perform an analysis on an ongoing basis as new information is obtained. Risk rating classifications are further described below. Loans with a lower expectation of credit losses are classified as Pass, while loans with a higher expectation of credit losses are classified as Substandard.
•Pass — Loans that management believes will fully repay in accordance with the contractual loan terms.
•Watch — Loans that management believes will fully repay in accordance with the contractual loan terms, but for which certain credit attributes have changed from origination and warrant further monitoring.
•Special mention — Loans with a potential weakness or weaknesses that deserves management’s close attention. If left uncorrected, the potential weaknesses may result in deterioration of the repayment prospects for the loan or our credit position at some future date.
•Substandard — Loans that are inadequately protected by the current net worth and paying capacity of the obligor or of the collateral pledged, if any. Loans so classified have a well-defined weakness or weaknesses that jeopardize the full repayment. They are characterized by the distinct possibility that we will sustain some loss if the deficiencies are not corrected.
SoFi Technologies, Inc.
SoFi Technologies, Inc.
Notes to Condensed Consolidated Financial Statements (Continued)
(Unaudited)
(In Thousands, Unless Otherwise Stated and Except for Share and Per Share Data)
The following table presents the amortized cost basis of our commercial and consumer banking portfolio (excluding accrued interest and before the allowance for credit losses) by origination year and credit quality indicator:
| | Term Loans by Origination Year | |
| September 30, 2023 | | 2023 | | 2022 | | 2021 | | 2020 | | 2019 | | Prior | | Total Term Loans | | Revolving Loans |
| | Term Loans by Origination Year | |
| March 31, 2024 | |
| March 31, 2024 | |
| March 31, 2024 | | | 2024 | | 2023 | | 2022 | | 2021 | | 2020 | | Prior | | Total Term Loans | | Revolving Loans |
Commercial real estate | Commercial real estate | | | | | | | | | | | | | | | | |
| Pass | |
| Pass | |
| Pass | Pass | | $ | 20,550 | | | $ | 34,042 | | | $ | 5,667 | | | $ | 4,577 | | | $ | 9,396 | | | $ | 18,846 | | | $ | 93,078 | | | $ | 190 | |
| Watch | Watch | | 1,238 | | | 4,609 | | | 1,658 | | | — | | | 217 | | | 2,760 | | | 10,482 | | | — | |
| Special mention | Special mention | | — | | | — | | | — | | | — | | | — | | | 1,577 | | | 1,577 | | | — | |
| Substandard | Substandard | | — | | | — | | | — | | | — | | | — | | | 382 | | | 382 | | | — | |
| Total commercial real estate | Total commercial real estate | | 21,788 | | | 38,651 | | | 7,325 | | | 4,577 | | | 9,613 | | | 23,565 | | | 105,519 | | | 190 | |
| Commercial and industrial | Commercial and industrial | | | | | | | | | | | | | | | | |
| Pass | Pass | | 56 | | | — | | | — | | | 67 | | | 100 | | | 4,950 | | | 5,173 | | | 50 | |
| Pass | |
| Pass | |
| Watch | Watch | | 48 | | | — | | | — | | | — | | | 18 | | | 11 | | | 77 | | | — | |
| | Substandard | Substandard | | — | | | — | | | — | | | — | | | — | | | 1,138 | | | 1,138 | | | — | |
| Substandard | |
| Substandard | |
| Total commercial and industrial | Total commercial and industrial | | 104 | | | — | | | — | | | 67 | | | 118 | | | 6,099 | | | 6,388 | | | 50 | |
| Residential real estate and other consumer | Residential real estate and other consumer | | | | | | | | | | | | | | | | |
| Pass | |
| Pass | |
| Pass | Pass | | 735 | | | — | | | — | | | — | | | — | | | 2,480 | | | 3,215 | | | 87 | |
| Watch | Watch | | — | | | — | | | — | | | — | | | — | | | 40 | | | 40 | | | — | |
| | Total residential real estate and other consumer | Total residential real estate and other consumer | | 735 | | | — | | | — | | | — | | | — | | | 2,520 | | | 3,255 | | | 87 | |
| | Total residential real estate and other consumer | |
| | Total residential real estate and other consumer | |
Total commercial and consumer banking | Total commercial and consumer banking | | $ | 22,627 | | | $ | 38,651 | | | $ | 7,325 | | | $ | 4,644 | | | $ | 9,731 | | | $ | 32,184 | | | $ | 115,162 | | | $ | 327 | |
Note 5. Allowance for Credit Losses
Our allowance for credit losses represents our current estimate of expected credit losses over the remaining contractual life of certain financial assets, including credit cards as well as commercial and consumer banking loans acquired in the Bank Merger, which relate to our Financial Services segment, and accounts receivables primarily related to our Technology Platform segment. Given our methods of collecting funds on servicing receivables, our historical experience of infrequent write offs, and that we have not observed meaningful changes in our counterparties’ abilities to pay, we determined that the future exposure to credit losses on servicing related receivables was immaterial.
In estimating expected See our Annual Report on Form 10-K for further discussion of the methodology and policies for determining our allowance for credit losses for credit cards, we segment loans based on credit quality indicators and reassesseach of our pools periodically to confirm that all loans within each pool continue to share similar risk characteristics. We establish an allowance within each pool utilizing a proprietary risk model that relies on assumptions such as average annual percentage rate, payment rate, utilization, delinquency status and default probability. loan portfolios.
The model may then be adjusted for current conditions and reasonable and supportable forecasts of future conditions, including economic conditions. We apply the aforementioned assumptions to the drawn balance of credit cards within each pool to estimate the lifetime expected credit losses within each pool, which are then aggregated to determine thefollowing table presents changes in our allowance for credit losses.losses:
We further consider an evaluation of overall portfolio credit quality based on indicators such as changes in our credit decisioning process, underwriting and collection management policies; the effects of external factors, such as regulatory requirements; general economic conditions; and inherent uncertainties in applying the methodology. When a credit card balance is charged off, we record a reduction to the allowance and the credit card balance. | | | | | | | | | | | | | | | | | |
| Credit Card(1) | | Commercial and Consumer Banking(1) | | Accounts Receivable(1) |
| | | | | |
| | | | | |
| | | | | |
| | | | | |
| | | | | |
| | | | | |
| | | | | |
| | | | | |
| | | | | |
| | | | | |
| Three Months Ended March 31, 2024 | | | | | |
| Balance at December 31, 2023 | $ | 52,385 | | | $ | 2,310 | | | $ | 1,837 | |
Provision for credit losses(2) | 7,253 | | | (71) | | | 2,411 | |
| Write-offs charged against the allowance | (10,546) | | | (18) | | | (2,139) | |
| Balance at March 31, 2024 | $ | 49,092 | | | $ | 2,221 | | | $ | 2,109 | |
| Three Months Ended March 31, 2023 | | | | | |
| Balance at December 31, 2022 | $ | 39,110 | | | $ | 1,678 | | | $ | 2,785 | |
Provision for credit losses(2) | 8,237 | | | 170 | | | (854) | |
| Write-offs charged against the allowance | (10,258) | | | — | | | (286) | |
| Balance at March 31, 2023 | $ | 37,089 | | | $ | 1,848 | | | $ | 1,645 | |
_____________________
SoFi Technologies, Inc.
SoFi Technologies, Inc.
Notes to Condensed Consolidated Financial Statements (Continued)
(Unaudited)
(In Thousands, Unless Otherwise Stated and Except for Share and Per Share Data)
The following table presents changes in our allowance for credit losses:
| | | | | | | | | | | | | | | | | |
| Credit Card(1) | | Commercial and Consumer Banking(1) | | Accounts Receivable(1) |
| Three Months Ended September 30, 2023 | | | | | |
| Balance at June 30, 2023 | $ | 39,361 | | | $ | 1,866 | | | $ | 1,937 | |
Provision for credit losses(2) | 21,821 | | | 10 | | | (148) | |
Write-offs charged against the allowance(3) | (11,127) | | | (8) | | | (208) | |
| Balance at September 30, 2023 | $ | 50,055 | | | $ | 1,868 | | | $ | 1,581 | |
| Three Months Ended September 30, 2022 | | | | | |
| Balance at June 30, 2022 | $ | 21,974 | | | $ | 1,204 | | | $ | 2,720 | |
Provision for credit losses(2) | 16,119 | | | 204 | | | (929) | |
| Write-offs charged against the allowance | (5,133) | | | 2 | | | — | |
| Balance at September 30, 2022 | $ | 32,960 | | | $ | 1,410 | | | $ | 1,791 | |
| Nine Months Ended September 30, 2023 | | | | | |
| Balance at December 31, 2022 | $ | 39,110 | | | $ | 1,678 | | | $ | 2,785 | |
Provision for credit losses(2) | 42,658 | | | 195 | | | 94 | |
Write-offs charged against the allowance(3) | (31,713) | | | (5) | | | (1,298) | |
| Balance at September 30, 2023 | $ | 50,055 | | | $ | 1,868 | | | $ | 1,581 | |
| Nine Months Ended September 30, 2022 | | | | | |
| Balance at December 31, 2021 | $ | 7,037 | | | $ | — | | | $ | 2,292 | |
Provision for credit losses(2) | 38,361 | | | 1,026 | | | (408) | |
Allowance for PCD loans(4) | — | | | 382 | | | — | |
| Write-offs charged against the allowance | (12,438) | | | 2 | | | (93) | |
| Balance at September 30, 2022 | $ | 32,960 | | | $ | 1,410 | | | $ | 1,791 | |
_____________________
(1)Credit cards and commercial and consumer banking loans measured at amortized cost, net of allowance for credit losses, are presented within loans held for investment, at amortized cost in the condensed consolidated balance sheets. Accounts receivable balances, net of allowance for credit losses, are presented within other assets in the condensed consolidated balance sheets.
(2)The provision for credit losses on credit cards and commercial and consumer banking loans is presented within noninterest expense—provision for credit losses in the condensed consolidated statements of operations and comprehensive lossincome (loss). During the three months ended March 31, 2024, recoveries of amounts previously reserved related to credit cards were $1,083, and immaterial during the three months ended March 31, 2023. There were immaterial recoveries of amounts previously reserved related to credit cards and commercial and consumer banking loans during the three and nine months ended September 30, 2023March 31, 2024 and 2022.2023. The provision for credit losses on accounts receivable is presented within noninterest expense—general and administrative in the condensed consolidated statements of operations and comprehensive loss.income (loss). During the three and nine months ended September 30,March 31, 2024 and 2023, recoveries of amounts previously reserved related to accounts receivable were $45$497 and $1,224,$1,161, respectively. During the three and nine months ended September 30, 2022, recoveries of amounts previously reserved related to accounts receivable were $937 and $2,697, respectively.
(3)The increases in credit card write-offs charged against the allowance during the three and nine months ended September 30, 2023 relative to the corresponding periods in 2022 were primarily related to our maturing portfolio.
(4)In connection with the Bank Merger, we obtained purchased credit deteriorated (“PCD”) loans, for which we measured an allowance, with a corresponding increase to the amortized cost basis as of the acquisition date. Therefore, recognition of the initial allowance for credit losses did not impact earnings.
Credit card: Accrued interest receivables written off by reversing interest income were immaterial$2.5 million and $2.2 million during the three and nine months ended September 30,March 31, 2024 and 2023, and 2022.respectively.
SoFi Technologies, Inc.
SoFi Technologies, Inc.
Notes to Condensed Consolidated Financial Statements (Continued)
(Unaudited)
(In Thousands, Unless Otherwise Stated and Except for Share and Per Share Data)
Note 6. Investment Securities
Investments in AFS Debt Securities
The following table presents our investments in available-for-sale (“AFS”)AFS debt securities:
| | | Amortized Cost | | | | Amortized Cost | | Accrued Interest | | Gross Unrealized Gains | | Gross Unrealized Losses(1) | | Fair Value |
| March 31, 2024 | |
| U.S. Treasury securities | |
| U.S. Treasury securities | |
| U.S. Treasury securities | |
| | Amortized Cost | | Accrued Interest | | Gross Unrealized Gains | | Gross Unrealized Losses(1) | | Fair Value |
| September 30, 2023 | | | | | | | | | | |
| U.S. Treasury securities | | $ | 419,380 | | | $ | 187 | | | $ | 3,440 | | | $ | (1,230) | | | $ | 421,777 | |
Multinational securities(2) | | 15,606 | | | 55 | | | — | | | (147) | | | 15,514 | |
| Corporate bonds | |
| Corporate bonds | |
| Corporate bonds | Corporate bonds | | 34,751 | | | 175 | | | — | | | (1,701) | | | 33,225 | |
| Agency mortgage-backed securities | Agency mortgage-backed securities | | 8,059 | | | 19 | | | — | | | (1,228) | | | 6,850 | |
| Other asset-backed securities | Other asset-backed securities | | 8,263 | | | 5 | | | — | | | (267) | | | 8,001 | |
Other(3) | | 940 | | | 7 | | | — | | | (223) | | | 724 | |
Other(2) | |
| Total investments in AFS debt securities | Total investments in AFS debt securities | | $ | 486,999 | | | $ | 448 | | | $ | 3,440 | | | $ | (4,796) | | | $ | 486,091 | |
| December 31, 2022 | | | | | | | | | | |
| December 31, 2023 | |
| U.S. Treasury securities | U.S. Treasury securities | | $ | 121,282 | | | $ | 217 | | | $ | — | | | $ | (3,510) | | | $ | 117,989 | |
Multinational securities(2) | | 19,658 | | | 109 | | | — | | | (724) | | | 19,043 | |
| U.S. Treasury securities | |
| U.S. Treasury securities | |
Multinational securities(3) | |
| Corporate bonds | Corporate bonds | | 41,890 | | | 257 | | | — | | | (2,644) | | | 39,503 | |
| Agency mortgage-backed securities | Agency mortgage-backed securities | | 8,899 | | | 22 | | | — | | | (991) | | | 7,930 | |
| Other asset-backed securities | Other asset-backed securities | | 9,556 | | | 5 | | | — | | | (514) | | | 9,047 | |
Other(3) | | 2,133 | | | 21 | | | — | | | (228) | | | 1,926 | |
Other(2) | |
| Total investments in AFS debt securities | Total investments in AFS debt securities | | $ | 203,418 | | | $ | 631 | | | $ | — | | | $ | (8,611) | | | $ | 195,438 | |
_____________________
(1) As of September 30, 2023March 31, 2024 and December 31, 2022,2023, we concluded that there was no credit loss attributable to securities in unrealized loss positions, as (i) 89%97% and 67%92% of the amortized cost basis of our investments as of September 30, 2023March 31, 2024 and December 31, 2022,2023, respectively, was composed of U.S. Treasury securities and agency mortgage-backed securities, and sovereign foreign bonds, which are of high credit quality and have no risk of credit-related impairment due to the nature of the counterparties and history of no credit losses, and (ii) we have not identified factors indicating credit-related impairment for the remaining investments and expect that the contractual principal and interest payments will be received. Additionally, we do not intend to sell the securities in loss positions nor is it more likely than not that we will be required to sell the securities prior to recovery of the amortized cost basis.
(2) Includes sovereign foreign and supranational bonds.state municipal bond securities.
(3) Includes state and city municipal bond securities.supranational bonds.
SoFi Technologies, Inc.
SoFi Technologies, Inc.
Notes to Condensed Consolidated Financial Statements (Continued)
(Unaudited)
(In Thousands, Unless Otherwise Stated and Except for Share and Per Share Data)
The following table presents information about our investments in AFS debt securities with gross unrealized losses and the length of time that individual securities have been in a continuous unrealized loss position as of September 30, 2023March 31, 2024 and December 31, 2022.2023.
| | | | | | | | | | | | | | | | | | | | | | | | | | | | | | | | | | | | | | |
| | Less than 12 Months | | 12 Months or Longer | | Total |
| | Fair Value | | Gross Unrealized Losses | | Fair Value | | Gross Unrealized Losses | | Fair Value | | Gross Unrealized Losses |
| September 30, 2023 | | | | | | | | | | | | |
| U.S. Treasury securities | | $ | 377,149 | | | $ | (2) | | | $ | 44,628 | | | $ | (1,228) | | | $ | 421,777 | | | $ | (1,230) | |
| Multinational securities | | — | | | — | | | 15,514 | | | (147) | | | 15,514 | | | (147) | |
| Corporate bonds | | — | | | — | | | 33,225 | | | (1,701) | | | 33,225 | | | (1,701) | |
| Agency mortgage-backed securities | | — | | | — | | | 6,850 | | | (1,228) | | | 6,850 | | | (1,228) | |
| Other asset-backed securities | | — | | | — | | | 8,001 | | | (267) | | | 8,001 | | | (267) | |
| Other | | — | | | — | | | 724 | | | (223) | | | 724 | | | (223) | |
| Total investments in AFS debt securities | | $ | 377,149 | | | $ | (2) | | | $ | 108,942 | | | $ | (4,794) | | | $ | 486,091 | | | $ | (4,796) | |
| | | | | | | | | | | | |
| December 31, 2022 | | | | | | | | | | | | |
| U.S. Treasury securities | | $ | 27,759 | | | $ | (1,171) | | | $ | 90,230 | | | $ | (2,339) | | | $ | 117,989 | | | $ | (3,510) | |
| Multinational securities | | — | | | — | | | 19,043 | | | (724) | | | 19,043 | | | (724) | |
| Corporate bonds | | 4,480 | | | (313) | | | 35,023 | | | (2,331) | | | 39,503 | | | (2,644) | |
| Agency mortgage-backed securities | | 6,448 | | | (814) | | | 1,482 | | | (177) | | | 7,930 | | | (991) | |
| Other asset-backed securities | | — | | | — | | | 9,047 | | | (514) | | | 9,047 | | | (514) | |
| Other | | 745 | | | (200) | | | 1,181 | | | (28) | | | 1,926 | | | (228) | |
| Total investments in AFS debt securities | | $ | 39,432 | | | $ | (2,498) | | | $ | 156,006 | | | $ | (6,113) | | | $ | 195,438 | | | $ | (8,611) | |
SoFi Technologies, Inc.
SoFi Technologies, Inc.
Notes to Condensed Consolidated Financial Statements (Continued)
(Unaudited)
(In Thousands, Unless Otherwise Stated and Except for Share and Per Share Data)
| | | | | | | | | | | | | | | | | | | | | | | | | | | | | | | | | | | | | | |
| | Less than 12 Months | | 12 Months or Longer | | Total |
| | Fair Value | | Gross Unrealized Losses | | Fair Value | | Gross Unrealized Losses | | Fair Value | | Gross Unrealized Losses |
| March 31, 2024 | | | | | | | | | | | | |
| U.S. Treasury securities | | $ | 337,363 | | | $ | (97) | | | $ | 29,502 | | | $ | (487) | | | $ | 366,865 | | | $ | (584) | |
| | | | | | | | | | | | |
| Corporate bonds | | — | | | — | | | 22,425 | | | (911) | | | 22,425 | | | (911) | |
| Agency mortgage-backed securities | | 262,792 | | | (563) | | | 6,680 | | | (892) | | | 269,472 | | | (1,455) | |
| Other asset-backed securities | | — | | | — | | | 4,001 | | | (92) | | | 4,001 | | | (92) | |
| Other | | — | | | — | | | 775 | | | (171) | | | 775 | | | (171) | |
| Total investments in AFS debt securities | | $ | 600,155 | | | $ | (660) | | | $ | 63,383 | | | $ | (2,553) | | | $ | 663,538 | | | $ | (3,213) | |
| | | | | | | | | | | | |
| December 31, 2023 | | | | | | | | | | | | |
| U.S. Treasury securities | | $ | 480,012 | | | $ | (58) | | | $ | 39,065 | | | $ | (722) | | | $ | 519,077 | | | $ | (780) | |
| Multinational securities | | — | | | — | | | 8,634 | | | (17) | | | 8,634 | | | (17) | |
| Corporate bonds | | — | | | — | | | 31,724 | | | (1,092) | | | 31,724 | | | (1,092) | |
| Agency mortgage-backed securities | | 20,930 | | | (157) | | | 6,912 | | | (859) | | | 27,842 | | | (1,016) | |
| Other asset-backed securities | | — | | | — | | | 7,122 | | | (154) | | | 7,122 | | | (154) | |
| Other | | — | | | — | | | 788 | | | (161) | | | 788 | | | (161) | |
| Total investments in AFS debt securities | | $ | 500,942 | | | $ | (215) | | | $ | 94,245 | | | $ | (3,005) | | | $ | 595,187 | | | $ | (3,220) | |
The following table presents the amortized cost and fair value of our investments in AFS debt securities by contractual maturity: | | Due Within One Year | | Due After One Year Through Five Years | | Due After Five Years Through Ten Years | | Due After Ten Years | | Total |
| September 30, 2023 | | | | | | | | | | |
| | Due Within One Year | | | | Due Within One Year | | Due After One Year Through Five Years | | Due After Five Years Through Ten Years | | Due After Ten Years | | Total |
| March 31, 2024 | |
| Investments in AFS debt securities—Amortized cost: | |
| Investments in AFS debt securities—Amortized cost: | |
| Investments in AFS debt securities—Amortized cost: | Investments in AFS debt securities—Amortized cost: | |
| U.S. Treasury securities | U.S. Treasury securities | | $ | 404,071 | | | $ | 15,309 | | | $ | — | | | $ | — | | | $ | 419,380 | |
| Multinational securities | | 15,606 | | | — | | | — | | | — | | | 15,606 | |
| U.S. Treasury securities | |
| U.S. Treasury securities | |
| | Corporate bonds | |
| Corporate bonds | |
| Corporate bonds | Corporate bonds | | 15,922 | | | 15,514 | | | 3,315 | | | — | | | 34,751 | |
| Agency mortgage-backed securities | Agency mortgage-backed securities | | — | | | 149 | | | 720 | | | 7,190 | | | 8,059 | |
| Other asset-backed securities | Other asset-backed securities | | 1,935 | | | 4,412 | | | 1,916 | | | — | | | 8,263 | |
| Other | Other | | — | | | — | | | — | | | 940 | | | 940 | |
| Total investments in AFS debt securities | Total investments in AFS debt securities | | $ | 437,534 | | | $ | 35,384 | | | $ | 5,951 | | | $ | 8,130 | | | $ | 486,999 | |
Weighted average yield for investments in AFS debt securities(1) | Weighted average yield for investments in AFS debt securities(1) | | 4.40 | % | | 3.50 | % | | 0.13 | % | | (1.51) | % | | 3.92 | % | Weighted average yield for investments in AFS debt securities(1) | | 6.14 | % | | 1.33 | % | | 1.47 | % | | 2.80 | % | | 5.11 | % |
| Investments in AFS debt securities—Fair value(2): | Investments in AFS debt securities—Fair value(2): | | | | | | | | | | |
Investments in AFS debt securities—Fair value(2): | |
Investments in AFS debt securities—Fair value(2): | |
| U.S. Treasury securities | U.S. Treasury securities | | $ | 406,933 | | | $ | 14,657 | | | $ | — | | | $ | — | | | $ | 421,590 | |
| Multinational securities | | 15,459 | | | — | | | — | | | — | | | 15,459 | |
| U.S. Treasury securities | |
| U.S. Treasury securities | |
| | Corporate bonds | |
| Corporate bonds | |
| Corporate bonds | Corporate bonds | | 15,503 | | | 14,670 | | | 2,877 | | | — | | | 33,050 | |
| Agency mortgage-backed securities | Agency mortgage-backed securities | | — | | | 140 | | | 633 | | | 6,058 | | | 6,831 | |
| Other asset-backed securities | Other asset-backed securities | | 1,864 | | | 4,245 | | | 1,887 | | | — | | | 7,996 | |
| Other | Other | | — | | | — | | | — | | | 717 | | | 717 | |
| Total investments in AFS debt securities | Total investments in AFS debt securities | | $ | 439,759 | | | $ | 33,712 | | | $ | 5,397 | | | $ | 6,775 | | | $ | 485,643 | |
_____________________
(1) The weighted average yield represents the effective yield for the investment securities owned at the end of the period and is computed based on the amortized cost of each security.
SoFi Technologies, Inc.
SoFi Technologies, Inc.
Notes to Condensed Consolidated Financial Statements (Continued)
(Unaudited)
(In Thousands, Unless Otherwise Stated and Except for Share and Per Share Data)
(2) Presentation of fair values of our investments in AFS debt securities by contractual maturity excludes total accrued interest of $448$1,476 as of September 30, 2023.March 31, 2024.
There were no realized gains and losses on our investments in AFS debt securities during the three months ended September 30, 2023. Gross realized gains and losses on our investments in AFS debt securities were immaterial during the three months ended March 31, 2024, and were $3,356 and $509, respectively, during the ninethree months ended September 30, 2023, and were immaterial during the three and nine months ended September 30, 2022.March 31, 2023. During the three and nine months ended September 30,March 31, 2024 and 2023, and 2022, there were no transfers between classifications of our investments in AFS debt securities. See Note 10. Equity for unrealized gains and losses on our investments in AFS debt securities and amounts reclassified out of accumulated other comprehensive income (loss) (“AOCI”).AOCI.
Securitization Investments
The following table presents the aggregate outstanding value of asset-backed bonds and residual interests owned by the Company in nonconsolidated VIEs, which are presented within investment securities in the condensed consolidated balance sheets:
| | | September 30,
2023 | | December 31,
2022 | | March 31,
2024 | | December 31,
2023 |
| Personal loans | Personal loans | $ | 9,934 | | | $ | 20,172 | |
| Student loans | Student loans | 83,713 | | | 181,159 | |
| Securitization investments | Securitization investments | $ | 93,647 | | | $ | 201,331 | |
SoFi Technologies, Inc.
SoFi Technologies, Inc.
Notes to Condensed Consolidated Financial Statements (Continued)
(Unaudited)
(In Thousands, Unless Otherwise Stated and Except for Share and Per Share Data)
Note 7. Securitization and Variable Interest Entities
Consolidated VIEs
We consolidate certain securitization trusts in which we have a variable interest and are deemed to be the primary beneficiary.
The VIEs are special purpose entities (“SPEs”)SPEs with portfolio loans securing debt obligations. The SPEs were created and designed to transfer credit and interest rate risk associated with consumer loans through the issuance of collateralized notes and trust certificates. We make standard representations and warranties to repurchase or replace qualified portfolio loans. Aside from these representations, the holders of the asset-backed debt obligations have no recourse to the Company if the cash flows from the underlying portfolio loans securing such debt obligations are not sufficient to pay all principal and interest on the asset-backed debt obligations. We hold a significant interest in these financing transactions through our ownership of a portion of the residual interest in certain VIEs. In addition, in some cases, we invest in the debt obligations issued by the VIE. Our investments in consolidated VIEs eliminate in consolidation. The residual interest is the first VIE interest to absorb losses should the loans securing the debt obligations not provide adequate cash flows to satisfy more senior claims and is the interest that we expect to absorb the expected gains and losses of the VIE. Our exposure to credit risk in sponsoring SPEs is limited to our investment in the VIE. VIE creditors have no recourse against our general credit.
As of September 30, 2023March 31, 2024 and December 31, 2022,2023, we had sevenfive and six consolidated VIEs, respectively, on our condensed consolidated balance sheets. During the ninethree months ended September 30, 2023,March 31, 2024, we established two consolidated VIEs, and exercised a securitization clean up call related to one consolidated VIE. The assets of consolidated VIEs that were included in our condensed consolidated balance sheets may only be used to settle obligations of consolidated VIEs and were in excess of those obligations as of September 30, 2023March 31, 2024 and December 31, 2022.2023. Intercompany balances are eliminated upon consolidation.
Nonconsolidated VIEs
We have created and designed personal loan and student loan trusts to transfer associated credit and interest rate risk associated with the loans through the issuance of collateralized notes and residual certificates. We have a variable interest in the nonconsolidated loan trusts, as we own collateralized notes and residual certificates in the loan trusts that absorb variability. We also have continuing, non-controlling involvement with the trusts as the servicer. As servicer, we may have the power to perform the activities which most impact the economic performance of the VIE, but since either we hold an insignificant financial interest in the trusts or rights held by other variable interest holders convey power, we are not the primary beneficiary. This financial interest represents the equity ownership interest in the loan trusts, wherein there is an obligation to absorb losses
SoFi Technologies, Inc.
SoFi Technologies, Inc.
Notes to Condensed Consolidated Financial Statements (Continued)
(Unaudited)
(In Thousands, Unless Otherwise Stated and Except for Share and Per Share Data)
and the right to receive benefits from residual certificate ownership. The maximum exposure to loss as a result of our involvement with the nonconsolidated VIEs is limited to our investment. We did not provide financial support to any nonconsolidated VIEs beyond our initial equity investment. There are no liquidity arrangements, guarantees or other commitments by third parties that may affect the fair value or risk of our variable interests in nonconsolidated VIEs.
As of September 30, 2023March 31, 2024 and December 31, 2022,2023, we had investments in 2124 and 2322 nonconsolidated VIEs, respectively. During the ninethree months ended September 30, 2023,March 31, 2024, we exercised a securitization clean up call on oneestablished two nonconsolidated VIE and collapsed the associated trust, as well as consolidated one previously nonconsolidated VIE.trusts.
Note 8. Deposits
We offer deposit accounts (referred to as “checking and savings” accounts within SoFi Money) to our members through SoFi Bank, which include interest-bearing deposits and noninterest-bearing deposits.
The following table presents a detail of interest-bearing deposits:
| | | | | | | | | | | | | | |
| | March 31, 2024 | | December 31, 2023 |
| Savings deposits | | $ | 16,583,020 | | | $ | 12,902,033 | |
Demand deposits(1) | | 2,480,456 | | | 2,663,335 | |
Time deposits(1)(2) | | 2,486,661 | | | 3,003,625 | |
| Total interest-bearing deposits | | $ | 21,550,137 | | | $ | 18,568,993 | |
_____________________(1) As of March 31, 2024 and December 31, 2023, includes brokered deposits of $2,644,040 and $3,160,414, respectively, of which $2,447,328 and $2,971,462, respectively, are time deposits and $196,712 and $188,952, respectively, are demand deposits.
(2) As of March 31, 2024 and December 31, 2023, the amount of time deposits that exceeded the insured limit (referred to as “uninsured deposits”) totaled $15,767 and $21,268, respectively.
As of March 31, 2024, future maturities of our total time deposits were as follows:
| | | | | |
| Remainder of 2024 | $ | 1,899,335 | |
| 2025 | 585,066 | |
| 2026 | 2,009 | |
| 2027 | — | |
| 2028 | 251 | |
| Thereafter | — | |
| Total | $ | 2,486,661 | |
SoFi Technologies, Inc.
SoFi Technologies, Inc.
Notes to Condensed Consolidated Financial Statements (Continued)
(Unaudited)
(In Thousands, Unless Otherwise Stated and Except for Share and Per Share Data)
The following table presents a detail of interest-bearing deposits:
| | | | | | | | | | | | | | |
| | September 30, 2023 | | December 31, 2022 |
| Savings deposits | | $ | 10,595,108 | | | $ | 4,383,953 | |
Demand deposits(1) | | 2,546,978 | | | 1,912,452 | |
Time deposits(1)(2) | | 2,465,263 | | | 969,387 | |
| Total interest-bearing deposits | | $ | 15,607,349 | | | $ | 7,265,792 | |
_____________________(1) As of September 30, 2023 and December 31, 2022, includes brokered deposits of $2,618,186 and $1,026,400, respectively, of which $2,432,679 and $940,000, respectively, are time deposits and $185,507 and $86,400, respectively, are demand deposits.
(2) As of September 30, 2023 and December 31, 2022, the amount of time deposits that exceeded the insured limit (referred to as “uninsured deposits”) totaled $21,524 and $20,842, respectively.
As of September 30, 2023, future maturities of our total time deposits were as follows:
| | | | | |
| Remainder of 2023 | $ | 636,473 | |
| 2024 | 1,535,209 | |
| 2025 | 292,989 | |
| 2026 | 291 | |
| 2027 | — | |
| Thereafter | 301 | |
| Total | $ | 2,465,263 | |
The following table summarizes the components of our debt:
| | September 30, 2023 |
| December 31, 2022 |
| | March 31, 2024 | | | | March 31, 2024 |
| December 31, 2023 |
| Borrowing Description | Borrowing Description | | Total Collateral(1) | | Stated Interest Rate(2) | | Termination/Maturity(3) | | Total Capacity | | Total Outstanding(4) | | Total Outstanding | Borrowing Description | | Total Collateral(1) | | Stated Interest Rate(2) | | Termination/Maturity(3) | | Total Capacity | | Total Outstanding(4) | | Total Outstanding |
| Debt Facilities | Debt Facilities |
| |
| |
| |
| |
| |
| |
| Personal loan warehouse facilities | Personal loan warehouse facilities |
| $ | 2,118,409 | |
| 5.56% – 7.29% |
| January 2024 – January 2032 |
| $ | 4,725,000 | |
| $ | 1,778,474 | |
| $ | 1,452,085 | |
| Personal loan warehouse facilities | |
| Personal loan warehouse facilities | |
| Student loan warehouse facilities | Student loan warehouse facilities |
| 2,557,824 | |
| 5.86% – 7.16% |
| April 2024 – June 2026 |
| 3,395,000 | |
| 2,111,532 | |
| 1,504,926 | |
| | Credit card warehouse facility |
| — | |
| 6.75% |
| March 2025 |
| 100,000 | |
| — | |
| — | |
| Risk retention warehouse facilities(5) | |
| Risk retention warehouse facilities(5) | |
| Risk retention warehouse facilities(5) | Risk retention warehouse facilities(5) |
| 87,818 | |
| 5.43% – 7.42% |
| January 2024 – October 2027 |
| 200,000 | |
| 71,745 | |
| 101,964 | |
Revolving credit facility(6) | Revolving credit facility(6) |
| |
| 6.92% |
| April 2028 |
| 645,000 | |
| 486,000 | |
| 486,000 | |
| Other Debt | Other Debt |
|
|
|
|
|
| Other Debt |
|
|
|
|
|
|
Convertible senior notes(7) |
|
|
| —% |
| October 2026 |
| |
| 1,200,000 | |
| 1,200,000 | |
Other financing(8) |
| 158,910 | |
| |
| |
| 200,247 | |
| — | |
| — | |
Convertible senior notes, due 2026(7) | |
Convertible senior notes, due 2029(8) | |
Other financing(9) | |
| Securitizations | Securitizations |
| |
| |
| |
| |
|
|
| | Securitizations |
| |
| |
| |
| |
|
|
| |
| Personal loan securitizations | Personal loan securitizations |
| 620,863 | |
| 0.49% – 6.21% |
| September 2030 – May 2031 |
| |
| 374,172 | |
| 529,132 | |
| Student loan securitizations | Student loan securitizations |
| 286,181 | |
| 1.83% – 4.44% |
| March 2040 – August 2048 |
| |
| 247,911 | |
| 246,856 | |
|
|
|
|
|
|
|
| Total, before unamortized debt issuance costs, premiums and discounts | Total, before unamortized debt issuance costs, premiums and discounts |
| |
| |
| |
| |
| $ | 6,269,834 | |
| $ | 5,520,963 | |
| Less: unamortized debt issuance costs, premiums and discounts | Less: unamortized debt issuance costs, premiums and discounts |
| |
| |
| |
| |
| (28,448) | |
| (35,081) | |
| Total debt | Total debt |
| |
| |
| |
| |
| $ | 6,241,386 | |
| $ | 5,485,882 | |
(1)As of September 30, 2023,March 31, 2024, represents the total of the unpaid principal balances within each debt category, with the exception of the risk retention warehouse facilities, which include securitization-related investments carried at fair value. In addition, certain securitization interests that eliminate in
SoFi Technologies, Inc.
SoFi Technologies, Inc.
Notes to Condensed Consolidated Financial Statements (Continued)
(Unaudited)
(In Thousands, Unless Otherwise Stated and Except for Share and Per Share Data)
consolidation are pledged to risk retention warehouse facilities. Collateral balances relative to debt balances may vary period to period due to the timing of the next scheduled payment to the warehouse facility.
(2)For variable-rate debt, the ranges of stated interest rates are based on the interest rates in effect as of September 30, 2023.March 31, 2024. The interest on our variable-rate debt is typically designed as a reference rate plus a spread. Reference rates as of September 30, 2023March 31, 2024 included overnight Secured Overnight Financing Rate (“SOFR”),SOFR, one-month SOFR three-month SOFR, prime rate and commercial paper rates determined by the facility lenders. As debt arrangements are renewed, the reference rate and/or spread are subject to change. Unused commitment fees ranging from 0 to 65 basis points (“bps”)bps on our various warehouse facilities are recognized within noninterest expense—general and administrative in our condensed consolidated statements of operations and comprehensive loss.income (loss).
(3)For securitization debt, the maturity of the notes issued by the various trusts occurs upon either the maturity of the loan collateral or full payment of the loan collateral held in the trusts. Our maturity date represents the legal maturity of the last class of maturing notes. Securitization debt matures as loan collateral payments are made.
(4)There were no$17.3 million of debt discounts or premiums issued during the ninethree months ended September 30, 2023.March 31, 2024.
(5)For risk retention warehouse facilities, we only state capacity amounts for facilities wherein we can pledge additional asset-backed bonds and residual investments as of the balance sheet date.
(6)As of September 30, 2023, $5.1March 31, 2024, $13.1 million of the revolving credit facility total capacity was not available for general borrowing purposes because it was utilized to secure a letterletters of credit. Refer to our letter of credit disclosures in Note 15. Commitments, Guarantees, Concentrations and Contingencies for more details. Additionally, the interest rate presented is the interest rate on standard withdrawals on our revolving credit facility, while same-day withdrawals incur interest based on the prime rate.
(7)The original issue discount and debt issuance costs related to the convertible senior notes due 2026 are amortized into interest expense—corporate borrowings in the condensed consolidated statements of operations and comprehensive lossincome (loss) using the effective interest method over the contractual term of the notes. For the three and nine months ended September 30,March 31, 2024 and March 31, 2023, total interest expense on the convertible notes was $1,274$1.2 million and $3,819,$1.3 million, respectively. For the three and nine months ended September 30, 2022, total interest expense on the convertible notes was $1,270March 31, 2024 and $3,805, respectively. For all periods,March 31, 2023, interest expense was related to amortization of debt discount and issuance costs, and the effective interest rate was 0.92% and 0.42%., respectively. As of September 30, 2023March 31, 2024 and December 31, 2022,2023, unamortized debt discount and issuance costs were $15.6$5.7 million and $19.4$13.3 million, respectively, and the net carrying amount was $1.18 billion$506.3 million and $1.18$1.1 billion, respectively.
(8)The original issue discount and debt issuance costs related to the convertible senior notes due 2029 are amortized into interest expense—corporate borrowings in the condensed consolidated statements of operations and comprehensive income (loss) using the effective interest method over the contractual term of the notes. For the three months ended March 31, 2024, total interest expense on the convertible notes was $1.0 million and the effective interest rate was 1.37%. As of March 31, 2024, unamortized debt discount and issuance costs were $21.5 million, and the net carrying amount was $841.0 million.
SoFi Technologies, Inc.
SoFi Technologies, Inc.
Notes to Condensed Consolidated Financial Statements (Continued)
(Unaudited)
(In Thousands, Unless Otherwise Stated and Except for Share and Per Share Data)
(9)Includes $23.0$54.3 million of loans and $135.9$115.7 million of investment securities pledged as collateral to secure $150.2$151.0 million of available borrowing capacity with the Federal Home Loan Bank (“FHLB”),FHLB, of which $13.7$27.2 million was not available as it was utilized to secure letters of credit. Refer to our letter of credit disclosures in Note 15. Commitments, Guarantees, Concentrations and Contingencies for more details. Also includes unsecured available borrowing capacity of $50.0 million with correspondent banks.
Convertible Senior Notes
Convertible Senior Notes, Due 2026
In October 2021, we issued $1.2 billion aggregate principal amount of convertible notes, pursuant to an indenture, dated October 4, 2021, between the Company and U.S. Bank National Association, as trustee (“2026 convertible notes”). The 2026 convertible notes are unsecured, unsubordinated obligations. The 2026 convertible notes do not bear regular interest. The 2026 convertible notes will mature on October 15, 2026, unless earlier repurchased, redeemed or converted.
In December 2023, the Company entered into separate, privately negotiated repurchase agreements with a limited number of holders of the 2026 convertible notes to repurchase $88.0 million aggregate principal amount of the 2026 convertible notes, which were settled through the issuance of 9,490,000 shares of common stock. In March 2024, the Company entered into separate, privately negotiated repurchase agreements with a limited number of holders of the 2026 convertible notes to repurchase $600.0 million aggregate principal amount of the 2026 convertible notes, which were settled through the issuance of 72,621,879 shares of common stock. Following these repurchases, $512.0 million aggregate principal amount of the 2026 convertible notes remain outstanding. These transactions were determined to be an extinguishment of debt.
The difference between the consideration used to repurchase the convertible notes and the carrying value of the convertible notes, less retirement of discount and issuance costs, resulted in a gain on extinguishment of $59.2 million recorded within noninterest income—other in the condensed consolidated statements of operations and comprehensive income (loss) for the three months ended March 31, 2024.
We used a portion of the net proceeds from the October 2021 offering to fund the cost of entering into the 2026 capped call transactions. In connection with the March 2024 repurchase agreements, the Company entered into unwind agreements to terminate a portion of the 2026 capped call transactions. Refer to Note 10. Equity for additional detail.
As of March 31, 2024, the 2026 convertible notes are potentially convertible into 22,841,631 shares of common stock.
Convertible Senior Notes, Due 2029
In March 2024, we issued $862.5 million aggregate principal amount of convertible notes, pursuant to an indenture, dated March 8, 2024, between the Company and U.S. Bank National Association, as trustee (“2029 convertible notes”). The 2029 convertible notes are unsecured, unsubordinated obligations. The 2029 convertible notes will pay interest at a rate of 1.25%, payable semi-annually beginning in September 2024. The 2029 convertible notes will mature on March 15, 2029, unless earlier repurchased, redeemed or converted.
The net proceeds from the offering were $845.3 million, after deducting the 2% initial purchasers’ discount of $17.3 million, and before the cost of the 2029 capped call transactions, as described below, and offering expenses payable by the Company. The debt issuance costs of $4.6 million included third-party legal and accounting fees. The original issue discount and debt issuance costs are amortized into interest expense—corporate borrowings in the condensed consolidated statements of operations and comprehensive income (loss) using the effective interest method over the contractual term of the 2029 convertible notes.
We used a portion of the net proceeds from the March 2024 offering to fund the cost of entering into 2029 capped call transactions, as described in Note 10. Equity. The remainder of the net proceeds from the offering, together with cash on hand, were used (i) to pay expenses relating to this offering, (ii) to redeem Series 1 Preferred Stock and (iii) for general corporate purposes.
Conversion
The 2029 convertible notes are convertible by the noteholders prior to the close of business on the business day immediately preceding September 15, 2028 if certain conditions related to the Company’s share price are met, upon the occurrence of certain corporate events or distributions of the Company’s stock, or the Company calls the notes for redemption,
SoFi Technologies, Inc.
SoFi Technologies, Inc.
Notes to Condensed Consolidated Financial Statements (Continued)
(Unaudited)
(In Thousands, Unless Otherwise Stated and Except for Share and Per Share Data)
each as set forth in the indenture. On and after September 15, 2028 until the close of business on the second scheduled trading day immediately preceding the maturity date, the 2029 convertible notes are freely convertible by the noteholders. The conversion rate is 105.8089 shares of our common stock per $1,000 principal amount of 2029 convertible notes, which represents an initial conversion price of approximately $9.45 per share of our common stock.
Settlement
We will settle conversions of the 2029 convertible notes by paying or delivering, cash, and if applicable, shares of our common stock for the amount in excess of the cash redemption price, based on the applicable conversion rate. Consideration due upon conversion will be determined over an observation period consisting of 30 “VWAP Trading Days” (as defined in the indenture). The conversion rate and conversion price will be subject to customary adjustments upon the occurrence of certain events. In addition, if certain corporate events that constitute a “Make-Whole Fundamental Change” (as defined in the indenture) occur, then the conversion rate will, in certain circumstances, be increased for a specified period of time.
Redemption
The 2029 convertible notes will also be redeemable, in whole or in part, at our option at any time, and from time to time, on or after March 15, 2027 through the 30th scheduled trading day immediately before the maturity date, at a cash redemption price equal to the principal amount of the 2029 convertible notes to be redeemed, plus accrued and unpaid interest, if any, thereon to, but excluding, the redemption date, but only if certain liquidity conditions described in the indenture are satisfied and certain conditions are met with respect to the last reported sale price per share of our common stock prior to conversion. In addition, calling any note for redemption will also constitute a Make-Whole Fundamental Change with respect to that 2029 convertible note, in which case the conversion rate applicable to the conversion of that 2029 convertible note will be increased in certain circumstances if it is converted after it is called for redemption.
See Note 1. Organization, Summary of Significant Accounting Policies and New Accounting Standards for our accounting policy as it relates to the convertible notes.
Material Changes to Debt Arrangements
On April 28, 2023, we entered into an Amended and Restated Revolving Credit Agreement (“Amended and Restated Credit Agreement”), which amended and restated the Revolving Credit Agreement (“Original Credit Agreement”), dated as of September 27, 2018, among Social Finance, Inc., the lenders party thereto, the issuing banks party thereto and Goldman Sachs Bank USA, as administrative agent. The Amended and Restated Credit Agreement amended and restated the Original Credit Agreement to, among other things, (i) increase the initial aggregate commitment to $645 million, (ii) extend the maturity date of the revolving credit facility to the date that is five years after the closing date, (iii) change the borrower entity under the revolving credit facility to SoFi Technologies, Inc., (iv) replace LIBOR as the term benchmark rate applicable to revolving loans denominated in U.S. dollars with a benchmark rate equal to Term SOFR plus a credit spread adjustment of 0.10%, and (v) effect certain other changes. The Amended and Restated Credit Agreement also contains financial covenants that require the Company to maintain a certain amount of unrestricted cash and cash equivalents and to meet certain risk-based capital ratios and a leverage ratio.
During the ninethree months ended September 30, 2023,March 31, 2024, we openedclosed two personal loan warehouse facilities withwhich had an aggregate maximum available capacity of $1.0 billion,$400.0 million, and closed one risk retention warehouse facility. We did not open any warehouse facilities.
Our warehouse and securitization debt is secured by a continuing lien and security interest in the loans financed by the proceeds. Within each of our debt facilities, we must comply with certain operating and financial covenants. These financial covenants include, but are not limited to, maintaining: (i) a certain minimum tangible net worth, (ii) minimum unrestricted cash and cash equivalents, (iii) a maximum leverage ratio of total debt to tangible net worth, and (iv) minimum risk-based capital and leverage ratios. Our debt covenants can lead to restricted cash classifications in our condensed consolidated balance sheets. Our subsidiaries are restricted in the amount that can be distributed to the parent company only to the extent that such distributions would cause the financial covenants to not be met. We were in compliance with all financial covenants.
We act as a guarantor for our wholly-owned subsidiaries in several arrangements in the case of default. As of September 30, 2023,March 31, 2024, we have not identified any risks of nonpayment by our wholly-owned subsidiaries.
SoFi Technologies, Inc.
SoFi Technologies, Inc.
Notes to Condensed Consolidated Financial Statements (Continued)
(Unaudited)
(In Thousands, Unless Otherwise Stated and Except for Share and Per Share Data)
Maturities of Borrowings
Future maturities of our outstanding debt with scheduled payments, which included our revolving credit facility and convertible notes, were as follows:
| | | | | |
| September 30, 2023 |
| Remainder of 2023 | $ | — | |
| 2024 | — | |
| 2025 | — | |
| 2026 | 1,200,000 | |
| 2027 | — | |
| Thereafter | 486,000 | |
| Total | $ | 1,686,000 | |
| | | | | |
| March 31, 2024 |
| Remainder of 2024 | $ | — | |
| 2025 | — | |
| 2026 | 511,972 | |
| 2027 | — | |
| 2028 | 486,000 | |
| Thereafter | 862,500 | |
| Total | $ | 1,860,472 | |
Temporary Equity
Pursuant to SoFi Technologies’ Certificate of Incorporation dated May 28, 2021, the Company is authorized to issue 100,000,000 shares of preferred stock having a par value of $0.0001 per share (“SoFi Technologies Preferred Stock”) and 100,000,000 shares of redeemable preferred stock having a par value of $0.0000025 per share (“SoFi Technologies Redeemable Preferred Stock”). The Company’s Board of Directors has the authority to issue SoFi Technologies Preferred Stock and SoFi Technologies Redeemable Preferred Stock and to determine the rights, preferences, privileges and restrictions, including voting rights, of those shares. The authorized shares of SoFi Technologies Redeemable Preferred Stock is inclusive of 4,500,000 shares of Series 1 redeemable preferred stock (“Series 1 Redeemable Preferred Stock”), which reflect the conversion on a one-for-one basis of shares of Social Finance Series 1 preferred stock in conjunction with the Business Combination. Shares of SoFi Technologies Series 1 Redeemable Preferred Stock that are redeemed, purchased or otherwise acquired by the Company will be canceled and may not be reissued by the Company. The Series 1 Redeemable Preferred Stock remains classified as temporary equity because the Series 1 Redeemable Preferred Stock is not fully controlled by the issuer, SoFi Technologies.
As of September 30, 2023,March 31, 2024, there were 3,234,000 shares of Series 1 Redeemable Preferred Stock issued and outstanding, which had an original issuance price of $100.00. See Note 18. Subsequent Events for additional information.
Dividends
During each of the three months ended September 30,March 31, 2024 and 2023, and 2022 and each of the nine months ended September 30, 2023 and 2022, the Series 1 preferred stockholders were entitled to dividends of $10,189$10,079 and $30,236,$9,968, respectively. Dividends payable were $10,189$10,079 as of September 30, 2023.March 31, 2024. There were no dividends payable as of December 31, 2022.2023.
Permanent Equity
On June 1, 2021, the Company’s common stock began trading on the Nasdaq Global Select Market under the ticker symbol “SOFI”. Pursuant to SoFi Technologies’ Certificate of Incorporation, the Company is authorized to issue 3,000,000,000 shares of common stock, with a par value of $0.0001 per share, and 100,000,000 shares of non-voting common stock, with a par value of $0.0001 per share. As of September 30, 2023,March 31, 2024, the Company had 957,860,4301,056,491,365 shares of common stock and no shares of non-voting common stock issued and outstanding.
SoFi Technologies, Inc.
SoFi Technologies, Inc.
Notes to Condensed Consolidated Financial Statements (Continued)
(Unaudited)
(In Thousands, Unless Otherwise Stated and Except for Share and Per Share Data)
The Company reserved the following common stock for future issuance:
| | | September 30,
2023 | | December 31,
2022 | | | March 31,
2024 | | December 31,
2023 |
| Outstanding stock options, restricted stock units and performance stock units | Outstanding stock options, restricted stock units and performance stock units | 106,885,503 | | | 107,851,565 | | |
| Outstanding common stock warrants | Outstanding common stock warrants | 12,170,990 | | | 12,170,990 | | |
Conversion of convertible notes(1) | Conversion of convertible notes(1) | 53,538,000 | | | 53,538,000 | | |
| Possible future issuance under stock plans | Possible future issuance under stock plans | 46,057,407 | | | 26,434,957 | | |
| | Total common stock reserved for future issuance | Total common stock reserved for future issuance | 218,651,900 | | | 199,995,512 | | |
____________________
(1)Represents the number of common stock issuable upon conversion of all convertible notes at the conversion rate in effect at the balance sheet date. As of March 31, 2024, the 2026 convertible notes are potentially convertible into 22,841,631 shares of common stock, and there are no shares of common stock expected to be issued relating to the 2029 convertible notes, as there was no amount in excess of the expected cash redemption price which would require share settlement. See Note 9. Debt for additional information.
Dividends
Common stockholders and non-voting common stockholders are entitled to dividends when and if declared by the Board of Directors and subject to government regulation over banks and bank holding companies. There were no dividends declared or paid to common stockholders during the ninethree months ended March 31, 2024 and 2023.
Capped Call Transactions
Capped Call Transactions, Due 2026
During 2021, we entered into privately negotiated capped call transactions (“2026 capped call transactions”) for a total cost of $113.8 million. In connection with the March 2024 repurchase agreements of a portion of 2026 convertible notes, the Company entered into unwind agreements to terminate a portion of the 2026 capped call transactions up to the notional amount corresponding to the amount of 2026 convertible notes exchanged of $600.0 million.
The 2026 capped call transactions initially cover, subject to customary anti-dilution adjustments, the number of shares of our common stock that initially underlie the 2026 convertible notes. The 2026 capped call transactions are expected generally to reduce the potential dilutive effect on the common stock upon any conversion of 2026 convertible notes and/or offset any potential cash payments we are required to make in excess of the principal amount of converted 2026 convertible notes, as the case may be, with such reduction and/or offset subject to a cap, subject to certain adjustments under the terms of the 2026 capped call transactions. The 2026 capped call transactions allow the Company to purchase shares of our common stock at a strike price equal to the initial conversion price of approximately $22.41 per share, and are subject to a cap of $32.02 per share, subject to certain adjustments under the terms of the 2026 capped call transactions. 2026 capped call transactions are subject to automatic exercise if they are in-the-money as of certain expiration dates during September 30, 2023 and 2022.October 2026. Settlement is subject to acceleration pursuant to the occurrence of certain corporate events, as well as postponement no later than January 12, 2027.
Capped Call Transactions, Due 2029
During 2024, we entered into privately negotiated capped call transactions (“2029 capped call transactions”) for a total cost of $90.6 million. The 2029 capped call transactions initially cover, subject to customary anti-dilution adjustments, the number of shares of our common stock that initially underlie the 2029 convertible notes. The 2029 capped call transactions are expected generally to reduce the potential dilutive effect on the common stock upon any conversion of 2029 convertible notes and/or offset any potential cash payments we are required to make in excess of the principal amount of converted 2029 convertible notes, as the case may be, with such reduction and/or offset subject to a cap, subject to certain adjustments under the terms of the 2029 capped call transactions. The 2029 capped call transactions allow the Company to purchase shares of our common stock at a strike price equal to the initial conversion price of approximately $9.45 per share, and are subject to a cap of $14.54 per share, subject to certain adjustments under the terms of the 2029 capped call transactions. 2029 capped call transactions are subject to automatic exercise if they are in-the-money as of certain expiration dates during 2029. Settlement is subject to acceleration pursuant to the occurrence of certain corporate events, as well as postponement no later than June 6, 2029.
SoFi Technologies, Inc.
SoFi Technologies, Inc.
Notes to Condensed Consolidated Financial Statements (Continued)
(Unaudited)
(In Thousands, Unless Otherwise Stated and Except for Share and Per Share Data)
See Note 1. Organization, Summary of Significant Accounting Policies and New Accounting Standards for our accounting policy as it relates to our capped call transactions.
Accumulated Other Comprehensive Income (Loss)
AOCI primarily consists of accumulated net unrealized gains or losses associated with our investments in AFS debt securities and foreign currency translation adjustments. The following table presents the rollforward of AOCI, inclusive of the changes in the components of other comprehensive income (loss):
| | | | | | | | | | | | | | | | | |
| AFS Debt Securities | | Foreign Currency Translation Adjustments | | Total |
| Three Months Ended September 30, 2023 | | | | | |
| AOCI, beginning balance | $ | (5,533) | | | $ | 414 | | | $ | (5,119) | |
| Other comprehensive income before reclassifications | 5,616 | | | 103 | | | 5,719 | |
| | | | | |
Net current-period other comprehensive income(1)(2) | 5,616 | | | 103 | | | 5,719 | |
| AOCI, ending balance | $ | 83 | | | $ | 517 | | | $ | 600 | |
| Three Months Ended September 30, 2022 | | | | | |
| AOCI, beginning balance | $ | (7,797) | | | $ | (214) | | | $ | (8,011) | |
| Other comprehensive loss before reclassifications | (1,787) | | | 325 | | | (1,462) | |
| Amounts reclassified from AOCI into earnings | (127) | | | — | | | (127) | |
Net current-period other comprehensive loss(1)(2) | (1,914) | | | 325 | | | (1,589) | |
| AOCI, ending balance | $ | (9,711) | | | $ | 111 | | | $ | (9,600) | |
| Nine Months Ended September 30, 2023 | | | | | |
| AOCI, beginning balance | $ | (8,611) | | | $ | 315 | | | $ | (8,296) | |
| Other comprehensive income before reclassifications | 8,522 | | | 202 | | | 8,724 | |
| Amounts reclassified from AOCI into earnings | 172 | | | — | | | 172 | |
Net current-period other comprehensive income(1)(2) | 8,694 | | | 202 | | | 8,896 | |
| AOCI, ending balance | $ | 83 | | | $ | 517 | | | $ | 600 | |
| Nine Months Ended September 30, 2022 | | | | | |
| AOCI, beginning balance | $ | (1,351) | | | $ | (120) | | | $ | (1,471) | |
| Other comprehensive loss before reclassifications | (8,518) | | | 231 | | | (8,287) | |
| Amounts reclassified from AOCI into earnings | 158 | | | — | | | 158 | |
Net current-period other comprehensive loss(1)(2) | (8,360) | | | 231 | | | (8,129) | |
| AOCI, ending balance | $ | (9,711) | | | $ | 111 | | | $ | (9,600) | |
| | | | | | | | | | | | | | | | | |
| AFS Debt Securities | | Foreign Currency Translation Adjustments | | Total |
| | | | | |
| | | | | |
| | | | | |
| | | | | |
| | | | | |
| | | | | |
| | | | | |
| | | | | |
| | | | | |
| | | | | |
| | | | | |
| | | | | |
| Three Months Ended March 31, 2024 | | | | | |
| AOCI, beginning balance | $ | (2,201) | | | $ | 992 | | | $ | (1,209) | |
Other comprehensive loss before reclassifications(1) | (700) | | | (179) | | | (879) | |
| Amounts reclassified from AOCI into earnings | — | | | — | | | — | |
Net current-period other comprehensive loss(2) | (700) | | | (179) | | | (879) | |
| AOCI, ending balance | $ | (2,901) | | | $ | 813 | | | $ | (2,088) | |
| Three Months Ended March 31, 2023 | | | | | |
| AOCI, beginning balance | $ | (8,611) | | | $ | 315 | | | $ | (8,296) | |
Other comprehensive income (loss) before reclassifications(1) | 2,076 | | | (293) | | | 1,783 | |
| Amounts reclassified from AOCI into earnings | 172 | | | — | | | 172 | |
Net current-period other comprehensive income (loss)(2) | 2,248 | | | (293) | | | 1,955 | |
| AOCI, ending balance | $ | (6,363) | | | $ | 22 | | | $ | (6,341) | |
____________________
(1)Gross realized gains and losses from sales of our investments in AFS debt securities that were reclassified from AOCI to earnings are recorded within noninterest income—other in the condensed consolidated statements of operations and comprehensive loss.income (loss). There were no reclassifications related to foreign currency translation adjustments during the three and nine months ended September 30, 2023March 31, 2024 and 2022.2023.
(2)There were no material tax impacts during any of the periods presented due to reserves against deferred tax assets in jurisdictions where other comprehensive loss activity was generated.
Note 11. Derivative Financial Instruments The following table presents the gains (losses) recognized on our derivative instruments:
| | | | | | | | | | | | | | | |
| | | Three Months Ended March 31, |
| | | | | 2024 | | 2023 |
Interest rate swaps(1) | | | | | $ | 201,285 | | | $ | (28,456) | |
Interest rate caps(1) | | | | | (2,283) | | | (1,695) | |
Home loan pipeline hedges(1) | | | | | 856 | | | (1,077) | |
| Derivative contracts to manage future loan sale execution risk | | | | | 199,858 | | | (31,228) | |
Interest rate swaps(2) | | | | | 6,063 | | | (1,108) | |
IRLCs(1) | | | | | 281 | | | 418 | |
Interest rate caps(1) | | | | | 2,290 | | | 1,771 | |
Purchase price earn-out(1)(3) | | | | | — | | | 9 | |
Third party warrants(4) | | | | | — | | | 24 | |
| Total | | | | | $ | 208,492 | | | $ | (30,114) | |
_____________________
(1) Recorded within noninterest income—loan origination. sales, and securitizations in thecondensed consolidated statements of operations and comprehensive income (loss).
(2) Represents derivative contracts to manage securitization investment interest rate risk, which are recorded within noninterest income—loan origination, sales, and securitizations in the condensed consolidated statements of operations and comprehensive income (loss).
SoFi Technologies, Inc.
SoFi Technologies, Inc.
Notes to Condensed Consolidated Financial Statements (Continued)
(Unaudited)
(In Thousands, Unless Otherwise Stated and Except for Share and Per Share Data)
(2)There were no material tax impacts during the periods presented due to reserves against deferred tax assets in jurisdictions where other comprehensive loss activity was generated.
Note 11. Derivative Financial InstrumentsThe following table presents the gains (losses) recognized on our derivative instruments:
| | | | | | | | | | | | | | | | | | | | | | | |
| Three Months Ended September 30, | | Nine Months Ended September 30, |
| 2023 | | 2022 | | 2023 | | 2022 |
Interest rate swaps(1) | $ | 77,587 | | | $ | 95,333 | | | $ | 163,472 | | | $ | 283,266 | |
Interest rate caps(1) | (2,031) | | | 4,072 | | | (3,398) | | | 7,562 | |
Home loan pipeline hedges(1) | 4,473 | | | 6,835 | | | 5,457 | | | 45,554 | |
| Derivative contracts to manage future loan sale execution risk | 80,029 | | | 106,240 | | | 165,531 | | | 336,382 | |
Interest rate swaps(2) | 1,167 | | | 5,119 | | | 3,351 | | | 14,187 | |
Interest rate lock commitments (“IRLCs”)(1) | 193 | | | (2,027) | | | 966 | | | (4,666) | |
Interest rate caps(1) | 1,987 | | | (4,112) | | | 3,468 | | | (7,139) | |
Purchase price earn-out(1)(3) | — | | | 52 | | | 9 | | | 1,094 | |
Third party warrants(4) | — | | | 81 | | | 78 | | | (88) | |
| Total | $ | 83,376 | | | $ | 105,353 | | | $ | 173,403 | | | $ | 339,770 | |
_____________________
(1) Recorded within noninterest income—loan origination and sales in thecondensed consolidated statements of operations and comprehensive loss.
(2) Represents derivative contracts to manage securitization investment interest rate risk, which are recorded within noninterest income—securitizations in the condensed consolidated statements of operations and comprehensive loss.
(3) In conjunction with a loan sale agreement, we are entitled to receive payments from the buyer of the loans underlying the agreement if the internal rate of return (as defined in the loan sale agreement) on such loans exceeds a specified hurdle, subject to a dollar cap.
(4) Includes amounts recorded within noninterest income—other, noninterest expense—cost of operations and noninterest expense—general and administrative in the condensed consolidated statements of operations and comprehensive loss,income (loss), the latter of which represents the amortization of a deferred liability recognized at the initial fair value of the third party warrants acquired, as we are also a customer of the third party.
Certain derivative instruments are subject to enforceable master netting arrangements. Accordingly, we present our net asset or liability position by counterparty in the condensed consolidated balance sheets. Additionally, since our cash collateral balances do not approximate the fair value of the derivative position, we do not offset our right to reclaim cash collateral or obligation to return cash collateral against recognized derivative assets or liabilities. The following table presents information about derivative instruments subject to enforceable master netting arrangements:
| | September 30, 2023 | | December 31, 2022 |
| Gross Derivative Assets | | Gross Derivative Liabilities | | Gross Derivative Assets | | Gross Derivative Liabilities |
| March 31, 2024 | | | March 31, 2024 | | December 31, 2023 |
| Gross Derivative Assets | | | Gross Derivative Assets | | Gross Derivative Liabilities | | Gross Derivative Assets | | Gross Derivative Liabilities |
| Interest rate swaps | Interest rate swaps | $ | — | | | $ | (7,292) | | | $ | 23,128 | | | $ | — | |
| Interest rate caps | Interest rate caps | — | | | (5,783) | | | — | | | (9,251) | |
| Home loan pipeline hedges | Home loan pipeline hedges | 3,529 | | | (715) | | | 1,484 | | | (80) | |
| Total, gross | Total, gross | 3,529 | | | (13,790) | | | 24,612 | | | (9,331) | |
| Derivative netting | Derivative netting | (715) | | | 715 | | | (80) | | | 80 | |
Total, net(1) | Total, net(1) | $ | 2,814 | | | $ | (13,075) | | | $ | 24,532 | | | $ | (9,251) | |
_____________________
(1) As of September 30, 2023,March 31, 2024, we had a cash collateral requirement related to these instruments of $7,292.$2,970. We did not have a cash collateral requirement related to these instruments as of December 31, 2022.2023.
SoFi Technologies, Inc.
SoFi Technologies, Inc.
Notes to Condensed Consolidated Financial Statements (Continued)
(Unaudited)
(In Thousands, Unless Otherwise Stated and Except for Share and Per Share Data)
The following table presents the notional amount of derivative contracts outstanding:
| | September 30, 2023 | | December 31, 2022 |
| March 31, 2024 | | | March 31, 2024 | | December 31, 2023 |
| Derivative contracts to manage future loan sale execution risk: | Derivative contracts to manage future loan sale execution risk: | | | |
| Interest rate swaps | |
| Interest rate swaps | |
| Interest rate swaps | Interest rate swaps | $ | 8,322,000 | | | $ | 5,638,177 | |
| Interest rate caps | Interest rate caps | 405,000 | | | 405,000 | |
| Home loan pipeline hedges | Home loan pipeline hedges | 349,000 | | | 126,000 | |
Interest rate caps(1) | Interest rate caps(1) | 405,000 | | | 405,000 | |
Interest rate swaps(2) | Interest rate swaps(2) | 123,000 | | | 171,823 | |
IRLCs(3) | IRLCs(3) | 152,800 | | | 82,335 | |
| Total | Total | $ | 9,756,800 | | | $ | 6,828,335 | |
(1) We sold an interest rate cap that was subject to master netting to offset an interest rate cap purchase made in conjunction with a contract to manage future loan sale execution risk.
(2) Represents interest rate swaps utilized to manage interest rate risk associated with certain of our securitization investments.
(3) Amounts correspond with home loan funding commitments subject to IRLC agreements.
While the notional amounts of derivative instruments give an indication of the volume of our derivative activity, they do not necessarily represent amounts exchanged by parties and are not a direct measure of our financial exposure. See Note 12. Fair Value Measurements for additional information on our derivative assets and liabilities.
SoFi Technologies, Inc.
SoFi Technologies, Inc.
Notes to Condensed Consolidated Financial Statements (Continued)
(Unaudited)
(In Thousands, Unless Otherwise Stated and Except for Share and Per Share Data)
Note 12. Fair Value Measurements Recurring Fair Value Measurements
The following table summarizes, by level within the fair value hierarchy, the estimated fair values of our assets and liabilities measured at fair value on a recurring basis in the condensed consolidated balance sheets:
| | | | | | | | | | | | | | | | | | | | | | | | | | | | | | | | | | | | | | | | | | | | | | | |
| September 30, 2023 | | December 31, 2022 |
| Fair Value | | Fair Value |
| Level 1 | | Level 2 | | Level 3 | | Total | | Level 1 | | Level 2 | | Level 3 | | Total |
| Assets | | | | | | | | | | | | | | | |
Investments in AFS debt securities(1)(2) | $ | 437,291 | | | $ | 48,800 | | | $ | — | | | $ | 486,091 | | | $ | 137,032 | | | $ | 58,406 | | | $ | — | | | $ | 195,438 | |
Asset-backed bonds(2)(3) | — | | | 58,191 | | | — | | | 58,191 | | | — | | | 155,093 | | | — | | | 155,093 | |
Residual investments(2)(3) | — | | | — | | | 35,456 | | | 35,456 | | | — | | | — | | | 46,238 | | | 46,238 | |
| Loans at fair value | — | | | — | | | 20,993,836 | | | 20,993,836 | | | — | | | — | | | 13,557,074 | | | 13,557,074 | |
| Servicing rights | — | | | — | | | 142,654 | | | 142,654 | | | — | | | — | | | 149,854 | | | 149,854 | |
| | | | | | | | | | | | | | | |
Third party warrants(4)(5) | — | | | — | | | 630 | | | 630 | | | — | | | — | | | 630 | | | 630 | |
Derivative assets(4)(6)(7) | — | | | 3,529 | | | — | | | 3,529 | | | — | | | 24,612 | | | — | | | 24,612 | |
Purchase price earn-out(4)(8) | — | | | — | | | — | | | — | | | — | | | — | | | 54 | | | 54 | |
IRLCs(4)(9) | — | | | — | | | 1,545 | | | 1,545 | | | — | | | — | | | 216 | | | 216 | |
Student loan commitments(4)(9) | — | | | — | | | 1,751 | | | 1,751 | | | — | | | — | | | — | | | — | |
Interest rate caps(4)(7) | — | | | 5,781 | | | — | | | 5,781 | | | — | | | 9,178 | | | — | | | 9,178 | |
Digital assets safeguarding asset(4)(10) | — | | | 139,359 | | | — | | | 139,359 | | | — | | | 106,826 | | | — | | | 106,826 | |
| Total assets | $ | 437,291 | | | $ | 255,660 | | | $ | 21,175,872 | | | $ | 21,868,823 | | | $ | 137,032 | | | $ | 354,115 | | | $ | 13,754,066 | | | $ | 14,245,213 | |
| Liabilities | | | | | | | | | | | | | | | |
Debt(11) | $ | — | | | $ | 131,863 | | | $ | — | | | $ | 131,863 | | | $ | — | | | $ | 89,142 | | | $ | — | | | $ | 89,142 | |
| Residual interests classified as debt | — | | | — | | | 10,194 | | | 10,194 | | | — | | | — | | | 17,048 | | | 17,048 | |
Derivative liabilities(4)(6)(7) | — | | | 13,790 | | | — | | | 13,790 | | | — | | | 9,331 | | | — | | | 9,331 | |
| | | | | | | | | | | | | | | |
Student loan commitments(4)(9) | — | | | — | | | — | | | — | | | — | | | — | | | 236 | | | 236 | |
Digital assets safeguarding liability(4)(10) | — | | | 139,359 | | | — | | | 139,359 | | | — | | | 106,826 | | | — | | | 106,826 | |
| Total liabilities | $ | — | | | $ | 285,012 | | | $ | 10,194 | | | $ | 295,206 | | | $ | — | | | $ | 205,299 | | | $ | 17,284 | | | $ | 222,583 | |
| | | | | | | | | | | | | | | | | | | | | | | | | | | | | | | | | | | | | | | | | | | | | | | |
| March 31, 2024 | | December 31, 2023 |
| Fair Value | | Fair Value |
| Level 1 | | Level 2 | | Level 3 | | Total | | Level 1 | | Level 2 | | Level 3 | | Total |
| Assets | | | | | | | | | | | | | | | |
Investments in AFS debt securities(1)(2) | $ | 465,491 | | | $ | 373,015 | | | $ | — | | | $ | 838,506 | | | $ | 527,711 | | | $ | 67,476 | | | $ | — | | | $ | 595,187 | |
Asset-backed bonds(2)(3) | — | | | 98,739 | | | — | | | 98,739 | | | — | | | 70,828 | | | — | | | 70,828 | |
Residual investments(2)(3) | — | | | — | | | 35,853 | | | 35,853 | | | — | | | — | | | 35,920 | | | 35,920 | |
Loans at fair value(4) | — | | | 59,477 | | | 21,891,166 | | | 21,950,643 | | | — | | | 66,198 | | | 22,056,057 | | | 22,122,255 | |
| Servicing rights | — | | | — | | | 240,752 | | | 240,752 | | | — | | | — | | | 180,469 | | | 180,469 | |
Third party warrants(5)(6) | — | | | — | | | 630 | | | 630 | | | — | | | — | | | 630 | | | 630 | |
Derivative assets(5)(7)(8) | — | | | 1,537 | | | — | | | 1,537 | | | — | | | 2,209 | | | — | | | 2,209 | |
| | | | | | | | | | | | | | | |
IRLCs(5)(9) | — | | | — | | | 2,436 | | | 2,436 | | | — | | | — | | | 2,155 | | | 2,155 | |
Student loan commitments(5)(9) | — | | | — | | | 314 | | | 314 | | | — | | | — | | | 5,465 | | | 5,465 | |
Interest rate caps(5)(8) | — | | | 986 | | | — | | | 986 | | | — | | | 3,269 | | | — | | | 3,269 | |
Digital assets safeguarding asset(5)(10) | — | | | — | | | — | | | — | | | — | | | 9,292 | | | — | | | 9,292 | |
| Total assets | $ | 465,491 | | | $ | 533,754 | | | $ | 22,171,151 | | | $ | 23,170,396 | | | $ | 527,711 | | | $ | 219,272 | | | $ | 22,280,696 | | | $ | 23,027,679 | |
| Liabilities | | | | | | | | | | | | | | | |
Debt(11) | $ | — | | | $ | 107,409 | | | $ | — | | | $ | 107,409 | | | $ | — | | | $ | 119,641 | | | $ | — | | | $ | 119,641 | |
| Residual interests classified as debt | — | | | — | | | 4,129 | | | 4,129 | | | — | | | — | | | 7,396 | | | 7,396 | |
Derivative liabilities(5)(7)(8) | — | | | 5,943 | | | — | | | 5,943 | | | — | | | 5,951 | | | — | | | 5,951 | |
| | | | | | | | | | | | | | | |
| | | | | | | | | | | | | | | |
Digital assets safeguarding liability(5)(10) | — | | | — | | | — | | | — | | | — | | | 9,292 | | | — | | | 9,292 | |
| Total liabilities | $ | — | | | $ | 113,352 | | | $ | 4,129 | | | $ | 117,481 | | | $ | — | | | $ | 134,884 | | | $ | 7,396 | | | $ | 142,280 | |
_____________________(1)The investments in AFS debt securities that were classified as Level 2 rely upon observable inputs other than quoted prices, dealer quotes in markets that are not active and implied pricing derived from new issuances of similar securities. See Note 6. Investment Securities for additional information.
(2)These assets are presented within investment securities in the condensed consolidated balance sheets.
(3)These assets represent the carrying value of our holdings in VIEs wherein we were not deemed the primary beneficiary. See Note 7. Securitization and Variable Interest Entities for additional information. We classify asset-backed bonds as Level 2 due to the use of quoted prices for similar assets in markets that are not active, as well as certain factors specific to us. The key inputs used to value the asset-backed bonds include the discount rate and conditional prepayment rate. The fair value of our asset-backed bonds was not materially impacted by default assumptions on the underlying securitization loans, as the subordinate residual interests are expected to absorb all estimated losses based on our default assumptions for the period. We classify the residual investments as Level 3 due to the reliance on significant unobservable valuation inputs.
(4)Home loans are classified as Level 2 due to observable pricing sources utilized by management. Personal loans and student loans classified as Level 3 do not trade in an active market with readily observable prices. Personal loans and home loans are presented within loans held for sale, at fair value, and student loans are presented within loans held for investment, at fair value.
(5)These assets and liabilities are presented within other assets and accounts payable, accruals and other liabilities, respectively, in the condensed consolidated balance sheets.
(5)(6)The key unobservable assumption used in the fair value measurement of the third party warrants was the price of the stock underlying the warrants. The fair value was measured as the difference between the stock price and the strike price of the warrants. As the strike price was insignificant, we concluded that the impact of time value on the fair value measure was immaterial.
(6)(7)For certain derivative instruments for which an enforceable master netting agreement exists, we elected to net derivative assets and derivative liabilities by counterparty. These instruments are presented on a gross basis herein. See Note 11. Derivative Financial Instruments for additional information.
(7)(8)Home loan pipeline hedges represent to-be-announced (“TBA”) securitiesTBAs used as economic hedges of loan fair values and are classified as Level 2, as we rely on quoted market prices from similar loan pools that transact in the marketplace. Interest rate swaps and interest rate caps are classified as Level 2, because these financial instruments do not trade in active markets with observable prices, but rely on observable inputs other than quoted prices. As of September 30, 2023March 31, 2024 and December 31, 2022,2023, interest rate swaps and interest rate caps were valued using the overnight SOFR curve and the implied volatilities suggested by the SOFR rate curve. These were determined to be observable inputs from active markets.
(8)The purchase price earn-out provision is classified as Level 3 because of our reliance on unobservable inputs related to the underlying loan portfolio performance, such as conditional prepayment rates, annual default rates and discount rates.
SoFi Technologies, Inc.
SoFi Technologies, Inc.
Notes to Condensed Consolidated Financial Statements (Continued)
(Unaudited)
(In Thousands, Unless Otherwise Stated and Except for Share and Per Share Data)
(9)IRLCs and student loan commitments are classified as Level 3 because of our reliance on assumed loan funding probabilities. The assumed probabilities are based on our internal historical experience with home loans and student loans similar to those in the funding pipelines on the measurement date.
SoFi Technologies, Inc.
SoFi Technologies, Inc.
Notes to Condensed Consolidated Financial Statements (Continued)
(Unaudited)
(In Thousands, Unless Otherwise Stated and Except for Share and Per Share Data)
(10)The digital assets safeguarding liability and corresponding safeguarding asset are classified as Level 2, because they do not trade in active markets, and are valued using quoted prices on an active exchange that has been identified as the principal market for the underlying digital assets that arewere being held by our third-party custodians for the benefit of our members. In the fourth quarter of 2023, we transferred the crypto services provided by SoFi Digital Assets, LLC, and began closing existing digital assets accounts. This process was completed in the first quarter of 2024, subsequent to which we have no digital assets safeguarding liability and safeguarding asset.
(11)The fair value of our securitization debt was classified as Level 2 and valued using a discounted cash flow model, with key inputs relating to the underlying contractual coupons, terms, discount rate and expectations for defaults and prepayments. As of September 30, 2023March 31, 2024 and December 31, 2022,2023, the unpaid principal related to debt measured at fair value was $142,660$114,960 and $98,868,$128,619, respectively. For the three and nine months ended September 30, 2023,March 31, 2024, losses from changes in fair value were $517 and $1,150, respectively.$1,427. The estimated amounts of gains (losses) included in earnings attributable to changes in instrument-specific credit risk, which were derived principally from observable changes in credit spread as observed in the bond market and default assumptions, were immaterial.immaterial for the three months ended March 31, 2024 and March 31, 2023.
Level 3 Recurring Fair Value Rollforward
The following tables present the changes in our assets and liabilities measured at fair value on a recurring basis using significant unobservable inputs (Level 3). We did not have any transfers into or out of Level 3 during the periods presented.
| | | Fair Value at | | Fair Value at |
| | June 30,
2023 | Impact on Earnings | Purchases | Sales | Issuances | Settlements | Other Changes | September 30,
2023 |
| | Fair Value at | |
| | Fair Value at | |
| | Fair Value at | | | | | | | | Fair Value at |
| January 1,
2024 | | | January 1,
2024 | Impact on Earnings | Purchases | Sales | Issuances | Settlements | Other Changes | March 31,
2024 |
| Assets | Assets | |
| Personal loans | Personal loans | $ | 12,751,163 | | $ | (45,072) | | $ | 20,724 | | $ | (15,006) | | $ | 3,885,967 | | $ | (1,746,760) | | $ | (20) | | $ | 14,850,996 | |
| Personal loans | |
| Personal loans | |
| Student loans | Student loans | 5,383,921 | | (14,615) | | — | | — | | 919,330 | | (247,751) | | 659 | | 6,041,544 | |
| Home loans | 78,583 | | 362 | | 1,593 | | (333,843) | | 355,698 | | (1,056) | | (41) | | 101,296 | |
| Loans at fair value(1) | |
Loans at fair value(1) | |
Loans at fair value(1) | Loans at fair value(1) | 18,213,667 | | (59,325) | | 22,317 | | (348,849) | | 5,160,995 | | (1,995,567) | | 598 | | 20,993,836 | |
Servicing rights(2) | Servicing rights(2) | 145,663 | | 7,419 | | 549 | | (132) | | 4,143 | | (14,988) | | — | | 142,654 | |
Residual investments(3) | Residual investments(3) | 38,389 | | 434 | | — | | — | | — | | (3,367) | | — | | 35,456 | |
| IRLCs(4) | IRLCs(4) | 1,352 | | 1,545 | | — | | — | | — | | (1,352) | | — | | 1,545 | |
IRLCs(4) | |
IRLCs(4) | |
Student loan commitments(4) | Student loan commitments(4) | 189 | | 1,751 | | — | | — | | — | | (189) | | — | | 1,751 | |
| Third party warrants | 630 | | — | | — | | — | | — | | — | | — | | 630 | |
Third party warrants(5) | |
| Liabilities | Liabilities | |
Residual interests classified as debt(3) | |
Residual interests classified as debt(3) | |
Residual interests classified as debt(3) | Residual interests classified as debt(3) | (11,332) | | (927) | | — | | — | | — | | 2,065 | | — | | (10,194) | |
| | Net impact on earnings | Net impact on earnings | | (49,103) | | |
| | Fair Value at | | Fair Value at |
| January 1,
2023 | Impact on Earnings | Purchases | Sales | Issuances | Settlements | Other Changes | September 30,
2023 |
| Assets | |
| Personal loans | $ | 8,610,434 | | $ | 16,083 | | $ | 61,053 | | $ | (65,019) | | $ | 10,578,306 | | $ | (4,349,646) | | $ | (215) | | $ | 14,850,996 | |
| Student loans | 4,877,177 | | 17,278 | | 111,923 | | (96,678) | | 1,840,070 | | (706,429) | | (1,797) | | 6,041,544 | |
| Home loans | 69,463 | | (1,122) | | 24,508 | | (678,136) | | 688,608 | | (2,364) | | 339 | | 101,296 | |
Loans at fair value(1) | 13,557,074 | | 32,239 | | 197,484 | | (839,833) | | 13,106,984 | | (5,058,439) | | (1,673) | | 20,993,836 | |
Servicing rights(2) | 149,854 | | 28,428 | | 1,570 | | (1,257) | | 11,580 | | (47,521) | | — | | 142,654 | |
Residual investments(3) | 46,238 | | 1,240 | | — | | (807) | | — | | (11,215) | | — | | 35,456 | |
Purchase price earn out(5) | 54 | | 9 | | — | | — | | — | | (63) | | — | | — | |
IRLCs(4) | 216 | | 3,168 | | 363 | | — | | — | | (2,202) | | — | | 1,545 | |
Student loan commitments(4) | (236) | | 2,015 | | — | | — | | — | | (28) | | — | | 1,751 | |
| Third party warrants | 630 | | — | | — | | — | | — | | — | | — | | 630 | |
| Liabilities | |
Residual interests classified as debt(3) | (17,048) | | (414) | | (1,203) | | — | | — | | 8,471 | | — | | (10,194) | |
| | Net impact on earnings | |
| | Net impact on earnings | Net impact on earnings | | 66,685 | | |
SoFi Technologies, Inc.
SoFi Technologies, Inc.
Notes to Condensed Consolidated Financial Statements (Continued)
(Unaudited)
(In Thousands, Unless Otherwise Stated and Except for Share and Per Share Data)
| | | Fair Value at | | Fair Value at |
| | June 30,
2022 | Impact on Earnings | Purchases | Sales | Issuances | Settlements | Other Changes | September 30,
2022 |
| | Fair Value at | |
| | Fair Value at | |
| | Fair Value at | | | | | | | | Fair Value at |
| January 1,
2023 | | | January 1,
2023 | Impact on Earnings | Purchases | Sales | Issuances | Settlements | Other Changes | March 31,
2023 |
| Assets | Assets | |
| Personal loans | Personal loans | $ | 4,109,745 | | $ | 65,463 | | $ | 1,276,175 | | $ | (749,648) | | $ | 2,809,759 | | $ | (582,188) | | $ | (28,102) | | $ | 6,901,204 | |
| Personal loans | |
| Personal loans | |
| Student loans | Student loans | 3,714,375 | | (23,895) | | 34 | | (74,080) | | 457,184 | | (148,913) | | 343 | | 3,925,048 | |
| Home loans | 135,262 | | (2,209) | | 1,260 | | (251,821) | | 216,246 | | (934) | | — | | 97,804 | |
Home loans(6) | |
Loans at fair value(1) | Loans at fair value(1) | 7,959,382 | | 39,359 | | 1,277,469 | | (1,075,549) | | 3,483,189 | | (732,035) | | (27,759) | | 10,924,056 | |
Servicing rights(2) | Servicing rights(2) | 176,964 | | 6,182 | | 1,062 | | (3,965) | | 10,681 | | (22,486) | | — | | 168,438 | |
Residual investments(3) | Residual investments(3) | 94,978 | | 664 | | — | | (490) | | — | | (8,318) | | — | | 86,834 | |
Purchase price earn out(5) | 625 | | 52 | | — | | — | | — | | (553) | | — | | 124 | |
Purchase price earn out(7’) | |
IRLCs(4) | |
Student loan commitments(4) | |
Third party warrants(5) | |
| Liabilities | |
Residual interests classified as debt(3) | |
Residual interests classified as debt(3) | |
Residual interests classified as debt(3) | |
| Third party warrants(6) | 766 | | (136) | | — | | — | | — | | — | | — | | 630 | |
| Liabilities | |
Residual interests classified as debt(3) | (54,436) | | (1,453) | | — | | — | | — | | 10,155 | | — | | (45,734) | |
IRLCs(4) | 1,120 | | (927) | | — | | — | | — | | (1,120) | | — | | (927) | |
Student loan commitments(4) | (254) | | (1,409) | | — | | — | | — | | 254 | | — | | (1,409) | |
| Net impact on earnings | Net impact on earnings | | 42,332 | | |
| | Net impact on earnings | |
| | Fair Value at | | Fair Value at |
| January 1,
2022 | Impact on Earnings | Purchases | Sales | Issuances | Settlements | Other Changes | September 30,
2022 |
| Assets | |
| Personal loans | $ | 2,289,426 | | $ | 92,332 | | $ | 1,504,112 | | $ | (2,851,466) | | $ | 7,307,612 | | $ | (1,415,820) | | $ | (24,992) | | $ | 6,901,204 | |
| Student loans | 3,450,837 | | (68,541) | | 121,741 | | (877,920) | | 1,839,710 | | (543,077) | | 2,298 | | 3,925,048 | |
| Home loans | 212,709 | | (11,663) | | 2,088 | | (959,971) | | 860,676 | | (6,035) | | — | | 97,804 | |
Loans at fair value(1) | 5,952,972 | | 12,128 | | 1,627,941 | | (4,689,357) | | 10,007,998 | | (1,964,932) | | (22,694) | | 10,924,056 | |
Servicing rights(2) | 168,259 | | 26,860 | | 3,008 | | (5,552) | | 42,299 | | (66,436) | | — | | 168,438 | |
Residual investments(3) | 121,019 | | 1,716 | | — | | (710) | | — | | (35,191) | | — | | 86,834 | |
Purchase price earn out(5) | 4,272 | | 1,094 | | — | | — | | — | | (5,242) | | — | | 124 | |
| Third party warrants(6) | 1,369 | | (739) | | — | | — | | — | | — | | — | | 630 | |
| Liabilities | |
Residual interests classified as debt(3) | (93,682) | | (7,078) | | — | | — | | — | | 55,026 | | — | | (45,734) | |
IRLCs(4) | 3,759 | | (2,846) | | — | | — | | — | | (1,840) | | — | | (927) | |
Student loan commitments(4) | 2,220 | | (1,640) | | — | | — | | — | | (1,989) | | — | | (1,409) | |
| Net impact on earnings | Net impact on earnings | | 29,495 | | |
(1)For loans at fair value, purchases reflect unpaid principal balance and relate to previously transferred loans. Purchase activity included securitization clean-up callselective repurchases of $39,936 during the nine months ended September 30, 2023, and $129,733 and $465,472 during the three and nine months ended September 30, 2022, respectively. There were no securitization clean-up calls$16.6 million during the three months ended September 30,March 31, 2024, and securitization clean-up calls of $39.9 million during the three months ended March 31, 2023. The remaining purchases during the periods presented related to standard representations and warranties pursuant to our various loan sale agreements. Issuances represent the principal balance of loans originated during the period. Settlements represent principal payments made on loans during the period. Other changes represent fair value adjustments that impact the balance sheet primarily associated with whole loan strategic repurchases, clean up calls and consolidated securitizations. Impacts on earnings for loans at fair value are recorded within interest income—loans and
SoFi Technologies, Inc.
SoFi Technologies, Inc.
Notes to Condensed Consolidated Financial Statements (Continued)
(Unaudited)
(In Thousands, Unless Otherwise Stated and Except for Share and Per Share Data)
securitizations, within noninterest income—loan origination, and sales, and —securitizationssecuritizations, and within noninterest expense—general and administrative in the condensed consolidated statements of operations and comprehensive loss.income (loss).
(2)For servicing rights, impacts on earnings are recorded within noninterest income—servicing in the condensed consolidated statements of operations and comprehensive loss.income (loss).
(3)For residual investments, sales include the derecognition of investments associated with securitization clean up calls. The estimated amounts of gains and losses for residual investments included in earnings attributable to changes in instrument-specific credit risk were immaterial during the periods presented. For residual investments and residual interests classified as debt, impacts on earnings are recorded within noninterest income—loan origination, sales, and securitizations in the condensed consolidated statements of operations and comprehensive loss,income (loss), a portion of which is subsequently reclassified to interest expense—securitizations and warehouses for residual interests classified as debt and to interest income—loans and securitizations for residual investments, but does not impact the liability or asset balance, respectively.
(4)For IRLCs and student loan commitments, settlements reflect funded and unfunded adjustments representing the unpaid principal balance of funded and unfunded loans during the quarter multiplied by the IRLC or student loan commitment price in effect at the beginning of the quarter. Purchases of IRLCs during the ninethree months ended September 30, 2023March 31, 2024 were associated with our acquisition of Wyndham. For year-to-date periods, amounts represent the
SoFi Technologies, Inc.
SoFi Technologies, Inc.
Notes to Condensed Consolidated Financial Statements (Continued)
(Unaudited)
(In Thousands, Unless Otherwise Stated and Except for Share and Per Share Data)
summation of the per-quarter effects. For IRLCs and student loan commitments, impacts on earnings are recorded within noninterest income—loan origination, sales, and salessecuritizations in the condensed consolidated statements of operations and comprehensive loss.income (loss).
(5)For purchase price earn out, impacts on earnings are recorded within noninterest income—loan origination and sales in the condensed consolidated statements of operations and comprehensive loss.
(6)For third party warrants, impacts on earnings are recorded within noninterest income—other in the condensed consolidated statements of operations and comprehensive loss.income (loss).
(6)During the fourth quarter of 2023, we transferred home loans out of Level 3 into Level 2 relating to an update to observable pricing sources utilized by management, as part of the integration of Wyndham.
(7)For purchase price earn out, impacts on earnings are recorded within noninterest income—loan origination, sales, and securitizations in the condensed consolidated statements of operations and comprehensive income (loss).
Loans at Fair Value
Gains and losses recognized in earnings include changes in accumulated interest and fair value adjustments on loans originated during the period and on loans held at the balance sheet date, as well as loan charge-offs. Changes in fair value are primarily impacted by valuation assumption changes as well as sales price execution. The estimated amount of gains (losses) included in earnings attributable to changes in instrument-specific credit risk were $24,846 and $(22,942)$40,824 during the three and nine months ended September 30, 2023, respectively,March 31, 2024, and $(15,249) and $(31,974)$(50,529) during the three and nine months ended September 30, 2022, respectively.March 31, 2023. The gains (losses) attributable to instrument-specific credit risk were estimated by incorporating our current default and loss severity assumptions for the loans. These assumptions are based on historical performance, market trends and performance expectations over the term of the underlying instrument.
Level 3 Significant Inputs
Fair value is defined as the price that would be received for an asset or paid to transfer a liability (an exit price) in the principal or most advantageous market for the asset or liability in an orderly transaction between market participants on the measurement date. Level 3 fair value measurements include unobservable inputs for assets or liabilities for which there is little or no market data, which requires us to develop our own assumptions. These unobservable assumptions reflect estimates of inputs that market participants would use in pricing the asset or liability. Valuation techniques include the use of option pricing models, discounted cash flow models, or similar techniques, which incorporate management’s own estimates of assumptions that market participants would use in pricing the asset or liability.
Loans
The following key unobservable assumptions were used in the fair value measurement of our loans:
| | | | | September 30, 2023 | | December 31, 2022 | |
| | Range | | Weighted Average | | Range | | Weighted Average | |
| Personal loans | Personal loans | | | | | | | | |
| Personal loans | |
| Personal loans | |
| Conditional prepayment rate | |
| Conditional prepayment rate | |
| Conditional prepayment rate | Conditional prepayment rate | 15.3% – 28.7% | | 20.3% | | 17.3% – 25.5% | | 19.1% | |
| Annual default rate | Annual default rate | 4.3% – 40.0% | | 4.6% | | 3.8% – 37.7% | | 4.4% | |
| Annual default rate | |
| Annual default rate | |
| Discount rate | |
| Discount rate | |
| Discount rate | Discount rate | 6.4% – 9.4% | | 6.6% | | 5.4% – 8.3% | | 6.1% | |
| Student loans | Student loans | | | | | |
| Student loans | |
| Student loans | |
| Conditional prepayment rate | |
| Conditional prepayment rate | |
| Conditional prepayment rate | Conditional prepayment rate | 8.6% – 13.0% | | 10.5% | | 16.3% – 21.8% | | 20.4% | |
| Annual default rate | Annual default rate | 0.3% – 5.8% | | 0.5% | | 0.2% – 4.5% | | 0.5% | |
| Discount rate | 4.5% – 9.1% | | 4.8% | | 3.6% – 8.7% | | 4.0% | |
| Home loans | | |
| Conditional prepayment rate | 1.7% – 9.8% | | 7.2% | | 2.0% – 10.2% | | 7.0% | |
| Annual default rate | |
| Annual default rate | Annual default rate | 0.1% – 0.9% | | 0.1% | | 0.1% – 1.3% | | 0.1% | |
| Discount rate | Discount rate | 6.3% – 9.2% | | 6.7% | | 5.7% – 14.1% | | 5.9% | |
| Discount rate | |
| Discount rate | |
SoFi Technologies, Inc.
SoFi Technologies, Inc.
Notes to Condensed Consolidated Financial Statements (Continued)
(Unaudited)
(In Thousands, Unless Otherwise Stated and Except for Share and Per Share Data)
The key assumptions are defined as follows:
•Conditional prepayment rate — The monthly annualized proportion of the principal of a pool of loans that is assumed to be paid off prematurely in each period. An increase in the conditional prepayment rate, in isolation, would result in a decrease in a fair value measurement. The weighted average assumption was weighted based on relative fair value.
•Annual default rate — The annualized rate of borrowers who do not make loan payments on time. An increase in the annual default rate, in isolation, would result in a decrease in a fair value measurement. The weighted average assumption was weighted based on relative fair value.
SoFi Technologies, Inc.
SoFi Technologies, Inc.
Notes to Condensed Consolidated Financial Statements (Continued)
(Unaudited)
(In Thousands, Unless Otherwise Stated and Except for Share and Per Share Data)
•Discount rate — The weighted average rate at which the expected cash flows are discounted to arrive at the net present value of the loans. The discount rate is primarily determined based on an underlying benchmark rate curve and spread(s), the latter of which is determined based on factors including, but not limited to, weighted average coupon rate, prepayment rate, default rate and resulting expected duration of the assets. An increase in the discount rate, in isolation, would result in a decrease in a fair value measurement. The weighted average assumption was weighted based on relative fair value.
See Note 4. Loans for additional loan fair value disclosures.
Servicing Rights
Servicing rights for personal loans and student loans do not trade in an active market with readily observable prices. Similarly, home loan servicing rights infrequently trade in an active market. At the time of the underlying loan sale or the assumption of servicing rights, the fair value of servicing rights is determined using a discounted cash flow methodology based on observable and unobservable inputs. Management classifies servicing rights as Level 3 due to the use of significant unobservable inputs in the fair value measurement.
The following key unobservable inputs were used in the fair value measurement of our classes of servicing rights:
| | | | | September 30, 2023 | | December 31, 2022 | |
| | Range | | Weighted Average | | Range | | Weighted Average | |
| Personal loans | Personal loans | | | | | | | | |
| Personal loans | |
| Personal loans | |
| Market servicing costs | |
| Market servicing costs | |
| Market servicing costs | Market servicing costs | 0.1% – 0.6% | | 0.3% | | 0.2% – 0.5% | | 0.3% | |
| Conditional prepayment rate | Conditional prepayment rate | 16.8% – 32.5% | | 25.2% | | 17.9% – 31.3% | | 22.7% | |
| Conditional prepayment rate | |
| Conditional prepayment rate | |
| Annual default rate | |
| Annual default rate | |
| Annual default rate | Annual default rate | 3.2% – 18.0% | | 7.1% | | 3.4% – 7.9% | | 4.9% | |
| Discount rate | Discount rate | 8.5% – 8.5% | | 8.5% | | 7.8% – 7.8% | | 7.8% | |
| Discount rate | |
| Discount rate | |
| Student loans | |
| Student loans | |
| Student loans | Student loans | | | | | |
| Market servicing costs | Market servicing costs | 0.1% – 0.2% | | 0.1% | | 0.1% – 0.2% | | 0.1% | |
| Market servicing costs | |
| Market servicing costs | |
| Conditional prepayment rate | |
| Conditional prepayment rate | |
| Conditional prepayment rate | Conditional prepayment rate | 10.6% – 16.3% | | 12.2% | | 15.4% – 21.9% | | 17.8% | |
| Annual default rate | Annual default rate | 0.3% – 3.6% | | 0.6% | | 0.3% – 4.3% | | 0.4% | |
| Annual default rate | |
| Annual default rate | |
| Discount rate | |
| Discount rate | |
| Discount rate | Discount rate | 8.5% – 8.5% | | 8.5% | | 7.8% – 7.8% | | 7.8% | |
| Home loans | Home loans | | |
| Home loans | |
| Home loans | |
| Market servicing costs | |
| Market servicing costs | |
| Market servicing costs | Market servicing costs | 0.1% – 0.1% | | 0.1% | | 0.1% – 0.1% | | 0.1% | |
| Conditional prepayment rate | Conditional prepayment rate | 5.1% – 13.2% | | 5.4% | | 4.9% – 11.0% | | 5.2% | |
| Conditional prepayment rate | |
| Conditional prepayment rate | |
| Annual default rate | |
| Annual default rate | |
| Annual default rate | Annual default rate | 0.1% – 0.2% | | 0.1% | | 0.1% – 0.1% | | 0.1% | |
| Discount rate | Discount rate | 9.3% – 9.3% | | 9.3% | | 9.0% – 9.0% | | 9.0% | |
| Discount rate | |
| Discount rate | |
The key assumptions are defined as follows:
•Market servicing costs — The fee a willing market participant, which we validate through actual third-party bids for our servicing, would require for the servicing of personal loans, student loans and home loans with similar characteristics as those in our serviced portfolio. An increase in the market servicing cost, in isolation, would result in a decrease in a fair value measurement. The weighted average assumption was weighted based on relative fair value.
•Conditional prepayment rate — The monthly annualized proportion of the principal of a pool of loans that is assumed to be paid off prematurely in each period. An increase in the conditional prepayment rate, in isolation, would result in a decrease in a fair value measurement. The weighted average assumption was weighted based on relative fair value.
SoFi Technologies, Inc.
SoFi Technologies, Inc.
Notes to Condensed Consolidated Financial Statements (Continued)
(Unaudited)
(In Thousands, Unless Otherwise Stated and Except for Share and Per Share Data)
•Annual default rate — The annualized rate of default within the total serviced loan balance. An increase in the annual default rate, in isolation, would result in a decrease in a fair value measurement. The weighted average assumption was weighted based on relative fair value.
•Discount rate — The weighted average rate at which the expected cash flows are discounted to arrive at the net present value of the servicing rights. An increase in the discount rate, in isolation, would result in a decrease in a fair value measurement. The weighted average assumption was weighted based on relative fair value.
SoFi Technologies, Inc.
SoFi Technologies, Inc.
Notes to Condensed Consolidated Financial Statements (Continued)
(Unaudited)
(In Thousands, Unless Otherwise Stated and Except for Share and Per Share Data)
The following table presents the estimated decrease to the fair value of our servicing rights if the key assumptions had each of the below adverse changes:
| | | September 30, 2023 | | December 31, 2022 | | March 31, 2024 | | December 31, 2023 |
| Market servicing costs | Market servicing costs | | | | Market servicing costs | | | |
| 2.5 basis points increase | 2.5 basis points increase | $ | (10,280) | | | $ | (10,395) | |
| 5.0 basis points increase | 5.0 basis points increase | (20,559) | | | (20,807) | |
| Conditional prepayment rate | Conditional prepayment rate | |
| 10% increase | 10% increase | $ | (3,370) | | | $ | (4,036) | |
| 10% increase | |
| 10% increase | |
| 20% increase | 20% increase | (6,770) | | | (7,833) | |
| Annual default rate | Annual default rate | |
| 10% increase | |
| 10% increase | |
| 10% increase | 10% increase | $ | (153) | | | $ | (166) | |
| 20% increase | 20% increase | (305) | | | (331) | |
| Discount rate | Discount rate | |
| 100 basis points increase | 100 basis points increase | $ | (4,021) | | | $ | (3,905) | |
| 100 basis points increase | |
| 100 basis points increase | |
| 200 basis points increase | 200 basis points increase | (7,787) | | | (7,562) | |
The sensitivity calculations above are hypothetical and should not be considered to be predictive of future performance. The effect on fair value of a variation in assumptions generally cannot be determined because the relationship of the change in assumptions to the fair value may not be linear. Additionally, the effect of an adverse variation in a particular assumption on the fair value of our servicing rights is calculated while holding the other assumptions constant. In reality, changes in one factor may lead to changes in other factors, which could impact the above hypothetical effects.
Residual Investments and Residual Interests Classified as Debt
Residual investments and residual interests classified as debt do not trade in active markets with readily observable prices, and there is limited observable market data for reference. The fair values of residual investments and residual interests classified as debt are determined using a discounted cash flow methodology. Management classifies residual investments and residual interests classified as debt as Level 3 due to the use of significant unobservable inputs in the fair value measurements.
The following key unobservable inputs were used in the fair value measurements of our residual investments and residual interests classified as debt:
| | | | | September 30, 2023 | | December 31, 2022 | |
| | Range | | Weighted Average | | Range | | Weighted Average | |
| Residual investments | Residual investments | | | | | | | | |
| Residual investments | |
| Residual investments | |
| Conditional prepayment rate | |
| Conditional prepayment rate | |
| Conditional prepayment rate | Conditional prepayment rate | 12.3% – 29.2% | | 14.3% | | 17.9% – 32.0% | | 19.9% | |
| Annual default rate | Annual default rate | 0.4% – 6.5% | | 1.1% | | 0.4% – 5.4% | | 1.1% | |
| Annual default rate | |
| Annual default rate | |
| Discount rate | |
| Discount rate | |
| Discount rate | Discount rate | 5.8% – 10.5% | | 7.6% | | 4.8% – 10.5% | | 6.7% | |
| Residual interests classified as debt | Residual interests classified as debt | | |
| Residual interests classified as debt | |
| Residual interests classified as debt | |
| Conditional prepayment rate | |
| Conditional prepayment rate | |
| Conditional prepayment rate | Conditional prepayment rate | 12.3% – 30.1% | | 28.1% | | 17.2% – 18.1% | | 17.8% | |
| Annual default rate | Annual default rate | 0.6% – 6.5% | | 4.4% | | 0.6% – 0.8% | | 0.7% | |
| Annual default rate | |
| Annual default rate | |
| Discount rate | Discount rate | 9.3% – 10.5% | | 9.5% | | 7.5% – 7.5% | | 7.5% | |
| Discount rate | |
| Discount rate | |
SoFi Technologies, Inc.
SoFi Technologies, Inc.
Notes to Condensed Consolidated Financial Statements (Continued)
(Unaudited)
(In Thousands, Unless Otherwise Stated and Except for Share and Per Share Data)
The key assumptions are defined as follows:
•Conditional prepayment rate — The monthly annualized proportion of the principal of a pool of loans that is assumed to be paid off prematurely in each period for the pool of loans in the securitization. An increase in the conditional prepayment rate, in isolation, would result in a decrease in a fair value measurement. The weighted average assumption was weighted based on relative fair value.
•Annual default rate — The annualized rate of borrowers who fail to remain current on their loans for the pool of loans in the securitization. An increase in the annual default rate, in isolation, would result in a decrease in a fair value measurement. The weighted average assumption was weighted based on relative fair value.
SoFi Technologies, Inc.
SoFi Technologies, Inc.
Notes to Condensed Consolidated Financial Statements (Continued)
(Unaudited)
(In Thousands, Unless Otherwise Stated and Except for Share and Per Share Data)
•Discount rate — The weighted average rate at which the expected cash flows are discounted to arrive at the net present value of the residual investments and residual interests classified as debt. An increase in the discount rate, in isolation, would result in a decrease in a fair value measurement. The weighted average assumption was weighted based on relative fair value.
Loan Commitments
We classify student loan commitments as Level 3 because the assets do not trade in an active market with readily observable prices and, as such, our valuations utilize significant unobservable inputs. Additionally, we classify IRLCs as Level 3, as our IRLCs are inherently uncertain and unobservable given that a home loan origination is contingent on a plethora of factors. The following key unobservable inputs were used in the fair value measurements of our IRLCs and student loan commitments:
| | | September 30, 2023 | | December 31, 2022 | |
| | Range | | Weighted Average | | Range | | Weighted Average | |
| | Range | |
| Range | |
| Range | |
| IRLCs | |
| IRLCs | |
| IRLCs | IRLCs | | | | | | | | |
Loan funding probability(1) | Loan funding probability(1) | 76.4% – 86.6% | | 84.3% | | 11.1% – 58.6% | | 46.3% | |
Loan funding probability(1) | |
Loan funding probability(1) | |
| Student loan commitments | |
| Student loan commitments | |
| Student loan commitments | Student loan commitments | | |
Loan funding probability(1) | Loan funding probability(1) | 95.0% – 95.0% | | 95.0% | | 95.0% – 95.0% | | 95.0% | |
Loan funding probability(1) | |
Loan funding probability(1) | |
___________________
(1)The aggregate amount of student loans we committed to fund was $85,551$6,459 as of September 30, 2023. The higher assumptions in the 2023 period reflect the home loan funding pipeline associated with our acquisition of Wyndham.March 31, 2024. See Note 11. Derivative Financial Instruments for the aggregate notional amount associated with IRLCs.
The key assumption is defined as follows:
•Loan funding probability — Our expectation of the percentage of IRLCs or student loan commitments which will become funded loans. A significant difference between the actual funded rate and the assumed funded rate at the measurement date could result in a significantly higher or lower fair value measurement of our IRLCs and student loan commitments. An increase in the loan funding probabilities, in isolation, would result in an increase in a fair value measurement. The weighted average assumptions were weighted based on relative fair values.
Safeguarding Assets and Liabilities
Through our SoFi Invest product (via our wholly-owned subsidiary, SoFi Digital Assets, LLC, a licensed money transmitter), our members can invest in digital assets. We engage third parties to provide custodial services for our digital assets offering, which includes holding the cryptographic key information and working to protect the digital assets from loss or theft. The third-party custodians hold digital assets as custodial assets in an account in SoFi’s name for the benefit of our members. We maintain the internal recordkeeping of our members’ digital assets, including the amount and type of digital assets owned by each of our members in the custodial accounts. We currently utilize two third-party custodians. Therefore, we have concentration risk in the event the custodians are not able to perform in accordance with our agreements. As of September 30, 2023, we did not identify any loss events.
SoFi Technologies, Inc.
SoFi Technologies, Inc.
Notes to Condensed Consolidated Financial Statements (Continued)
(Unaudited)
(In Thousands, Unless Otherwise Stated and Except for Share and Per Share Data)
The following table presents the significant digital assets held by our third-party custodians on behalf of our members:
| | | | | | | | | | | |
| September 30, 2023 | | December 31, 2022 |
| Bitcoin (BTC) | $ | 74,761 | | | $ | 44,346 | |
| Ethereum (ETH) | 47,276 | | | 37,826 | |
| Dogecoin (DOGE) | 4,478 | | | 4,784 | |
| Litecoin (LTC) | 2,544 | | | 2,492 | |
| Ethereum Classic (ETC) | 2,249 | | | 2,333 | |
Cardano (ADA)(1) | — | | | 5,217 | |
Solana (SOL)(1) | — | | | 1,588 | |
All other(1)(2) | 8,051 | | | 8,240 | |
| Digital assets safeguarding liability and corresponding safeguarding asset | $ | 139,359 | | | $ | 106,826 | |
___________________(1)Effective June 9, 2023, we ended support of these digital assets, as well as several others included in the “all other” category.
(2)Includes 17 and 23 digital assets as of September 30, 2023 and December 31, 2022, respectively, none of which were determined to be individually significant.
Financial Instruments Not Measured at Fair Value
The following table summarizes the carrying values and estimated fair values, by level within the fair value hierarchy, of our assets and liabilities that are not measured at fair value on a recurring basis in the condensed consolidated balance sheets:
| | Fair Value |
| Carrying Value | | Level 1 | | Level 2 | | Level 3 | | Total |
| September 30, 2023 | | | | | | | | | |
| | | Fair Value | | | | | Fair Value |
| Carrying Value | | | Carrying Value | | Level 1 | | Level 2 | | Level 3 | | Total |
| March 31, 2024 | |
| Assets | Assets | |
| Assets | |
| Assets | |
Cash and cash equivalents(1) | |
Cash and cash equivalents(1) | |
Cash and cash equivalents(1) | Cash and cash equivalents(1) | $ | 2,813,876 | | | $ | 2,813,876 | | | $ | — | | | $ | — | | | $ | 2,813,876 | |
Restricted cash and restricted cash equivalents(1) | Restricted cash and restricted cash equivalents(1) | 483,141 | | | 483,141 | | | — | | | — | | | 483,141 | |
Loans at amortized cost(2) | Loans at amortized cost(2) | 361,248 | | | — | | | — | | | 388,662 | | | 388,662 | |
Other investments(3) | Other investments(3) | 68,313 | | | — | | | 68,313 | | | — | | | 68,313 | |
| Total assets | Total assets | $ | 3,726,578 | | | $ | 3,297,017 | | | $ | 68,313 | | | $ | 388,662 | | | $ | 3,753,992 | |
| Liabilities | Liabilities | | | | | | | | | |
Deposits(4) | Deposits(4) | $ | 15,671,973 | | | $ | — | | | $ | 15,663,198 | | | $ | — | | | $ | 15,663,198 | |
Deposits(4) | |
Deposits(4) | |
Debt(5) | Debt(5) | 6,109,523 | | | 937,024 | | | 4,931,984 | | | — | | | 5,869,008 | |
| Total liabilities | Total liabilities | $ | 21,781,496 | | | $ | 937,024 | | | $ | 20,595,182 | | | $ | — | | | $ | 21,532,206 | |
| December 31, 2022 | | | | | | | | | |
| December 31, 2023 | |
| Assets | Assets | |
| Assets | |
| Assets | |
Cash and cash equivalents(1) | |
Cash and cash equivalents(1) | |
Cash and cash equivalents(1) | Cash and cash equivalents(1) | $ | 1,421,907 | | | $ | 1,421,907 | | | $ | — | | | $ | — | | | $ | 1,421,907 | |
Restricted cash and restricted cash equivalents(1) | Restricted cash and restricted cash equivalents(1) | 424,395 | | | 424,395 | | | — | | | — | | | 424,395 | |
Loans at amortized cost(2) | Loans at amortized cost(2) | 307,957 | | | — | | | — | | | 328,775 | | | 328,775 | |
Other investments(3) | Other investments(3) | 28,651 | | | — | | | 28,651 | | | — | | | 28,651 | |
| Total assets | Total assets | $ | 2,182,910 | | | $ | 1,846,302 | | | $ | 28,651 | | | $ | 328,775 | | | $ | 2,203,728 | |
| Liabilities | Liabilities | | | | | | | | | |
Deposits(4) | Deposits(4) | $ | 7,342,296 | | | $ | — | | | $ | 7,340,160 | | | $ | — | | | $ | 7,340,160 | |
Deposits(4) | |
Deposits(4) | |
Debt(5) | Debt(5) | 5,396,740 | | | 826,242 | | | 4,219,574 | | | — | | | 5,045,816 | |
| Total liabilities | Total liabilities | $ | 12,739,036 | | | $ | 826,242 | | | $ | 11,559,734 | | | $ | — | | | $ | 12,385,976 | |
(1)The carrying amounts of our cash and cash equivalents and restricted cash and restricted cash equivalents approximate their fair values due to the short-term maturities and highly liquid nature of these accounts.
(2)The fair value of our credit cards was determined using a discounted cash flow model with key inputs relating to weighted average lives, expected lifetime loss rates and discount rate. The fair value of our commercial and consumer banking and senior secured loans was determined using a discounted cash flow model with key inputs relating to the underlying contractual coupons, terms, discount rate and expectations for defaults.
(3)Other investments include Federal Reserve Bank (“FRB”)FRB stock and FHLB stock, which are presented within other assets in the condensed consolidated balance sheets.
SoFi Technologies, Inc.
SoFi Technologies, Inc.
Notes to Condensed Consolidated Financial Statements (Continued)
(Unaudited)
(In Thousands, Unless Otherwise Stated and Except for Share and Per Share Data)
(4)The fair values of our deposits without contractually defined maturities (such as demand and savings deposits) and our noninterest-bearing deposits approximate their carrying values. The fair value of our time-based deposits was determined using a discounted cash flow model based on rates currently offered for deposits of similar remaining maturities.
(5)The carrying value of our debt is net of unamortized discounts and debt issuance costs. The fair value of our convertible notes was classified as Level 1, as it was based on an observable market quote. The fair values of our warehouse facility debt and revolving credit facility debt were classified as Level 2 and based on market factors and credit factors specific to these financial instruments. The fair value of our securitization debt was classified as Level 2 and valued using a discounted cash flow model, with key inputs relating to the underlying contractual coupons, terms, discount rate and expectations for defaults and prepayments.
Nonrecurring Fair Value Measurements
Investments in equity securities of $22,861$23,085 and $22,825$22,920 as of September 30, 2023March 31, 2024 and December 31, 2022,2023, respectively, which are presented within other assets in the condensed consolidated balance sheets, include investments for which fair values are not readily determinable, which we elect to measure using the measurement alternative method of accounting. The fair value measurements are classified within Level 3 of the fair value hierarchy due to the use of unobservable inputs in the fair value measurements. The balances were primarily composed of a $19,739 investment valued under the measurement alternative method during 2022 that was a former equity method investment.
SoFi Technologies, Inc.
SoFi Technologies, Inc.
Notes to Condensed Consolidated Financial Statements (Continued)
(Unaudited)
(In Thousands, Unless Otherwise Stated and Except for Share and Per Share Data)
Note 13. Share-Based Compensation The 2021 Stock Option and Incentive Plan (the “2021 Plan”) allows for the issuance of stock options, stock appreciation rights, restricted stock, restricted stock units (“RSUs”)RSUs (including performance stock units, or “PSUs”)PSUs), dividend equivalents and other stock or cash based awards for issuance to its employees, non-employee directors and non-employee third parties. Shares associated with option exercises and RSU vesting are issued from the authorized pool.
Effective January 1, 2023, we approved a plan to allow our non-employee directors to elect, on an annual basis, to defer their cash retainers into equity awards, that are immediately vested, and/or to defer their RSU grants, which vest in accordance with the grant terms (collectively referred to as deferred stock units, or “DSUs”)DSUs). DSUs are equity awards that entitle the holder to shares of our common stock when the awards vest. Directors may choose to receive their deferred stock distributions in a lump sum or in installments over different time periods. DSUs are measured based on the fair value of our common stock on the date of grant. DSU activity is presented with RSUs in the disclosures below.
Share-based compensation expense related to stock options, RSUs and PSUs is presented within the following line items in the condensed consolidated statements of operations and comprehensive loss:income (loss):
| | | | | Three Months Ended September 30, | | Nine Months Ended September 30, | | | Three Months Ended March 31, |
| | 2023 | | 2022 | | 2023 | | 2022 | | | | | | 2024 | | 2023 |
| Technology and product development | Technology and product development | $ | 23,725 | | | $ | 20,856 | | | $ | 66,344 | | | $ | 56,690 | |
| Sales and marketing | Sales and marketing | 6,330 | | | 6,593 | | | 20,270 | | | 17,734 | |
| Cost of operations | Cost of operations | 2,987 | | | 5,075 | | | 7,382 | | | 14,034 | |
| General and administrative | General and administrative | 28,963 | | | 45,331 | | | 108,113 | | | 146,560 | |
| Total | Total | $ | 62,005 | | | $ | 77,855 | | | $ | 202,109 | | | $ | 235,018 | |
Total compensation and benefits, inclusive of share-based compensation expense, was $213,820 and $656,483$208,246 for the three and nine months ended September 30, 2023, respectively,March 31, 2024 and $221,423 and $619,441$216,415 for the three and nine months ended September 30, 2022, respectively.March 31, 2023. Compensation and benefits expenses are presented within eachthe following categories of the financial statement line itemsexpenses within noninterest expenseexpense: (i) technology and product development, (ii) sales and marketing, (iii) cost of operations, and (iv) general and administrative in the condensed consolidated statements of operations and comprehensive loss.
SoFi Technologies, Inc.
SoFi Technologies, Inc.
Notes to Condensed Consolidated Financial Statements (Continued)
(Unaudited)
(In Thousands, Unless Otherwise Stated and Except for Share and Per Share Data)
Stock Options
The following is a summary of stock option activity: | | | | | | | | | | | | | | | | | |
| Number of Stock Options | | Weighted Average Exercise Price | | Weighted Average Remaining Contractual Term (in years) |
| Outstanding as of January 1, 2023 | 18,749,679 | | | $ | 7.43 | | | 4.7 |
| | | | | |
| Exercised | (747,930) | | | 1.34 | | | |
| | | | | |
| Expired | (50,093) | | | 6.65 | | | |
| Outstanding as of September 30, 2023 | 17,951,656 | | | $ | 7.69 | | | 4.0 |
| Exercisable as of September 30, 2023 | 17,945,311 | | | $ | 7.69 | | | 4.0 |
| | | | | | | | | | | | | | | | | |
| Number of Stock Options | | Weighted Average Exercise Price | | Weighted Average Remaining Contractual Term (in years) |
| Outstanding as of January 1, 2024 | 17,896,732 | | | $ | 7.70 | | | 3.8 |
| | | | | |
| Exercised | (171,555) | | | 2.71 | | | |
| | | | | |
| Expired | (3,267) | | | 6.23 | | | |
| Outstanding as of March 31, 2024 | 17,721,910 | | | $ | 7.75 | | | 3.5 |
| Exercisable as of March 31, 2024 | 17,721,910 | | | $ | 7.75 | | | 3.5 |
Total compensation cost related to unvested stock options not yet recognized as of September 30, 2023March 31, 2024 was immaterial.
Restricted Stock Units
RSUs, inclusive of DSUs, are equity awards granted to employees that entitle the holder to shares of our common stock when the awards vest. RSUs are measured based on the fair value of our common stock on the date of grant.
SoFi Technologies, Inc.
SoFi Technologies, Inc.
Notes to Condensed Consolidated Financial Statements (Continued)
(Unaudited)
(In Thousands, Unless Otherwise Stated and Except for Share and Per Share Data)
The following table summarizes RSU activity: | | | Number of
RSUs | | Weighted Average Grant Date Fair Value | | Number of
RSUs | | Weighted Average Grant Date Fair Value |
| Outstanding as of January 1, 2023 | 69,538,139 | | | $ | 9.07 | |
| Outstanding as of January 1, 2024 | |
| Granted | Granted | 36,048,164 | | | 6.40 | |
Vested(1) | Vested(1) | (24,621,235) | | | 8.50 | |
| Forfeited | Forfeited | (8,320,278) | | | 9.01 | |
| Outstanding as of September 30, 2023 | 72,644,790 | | $ | 7.97 | |
| Outstanding as of March 31, 2024 | |
(1)The total fair value, based on grant date fair value, of RSUs that vested during the ninethree months ended September 30, 2023March 31, 2024 was $209.3$69.0 million.
As of September 30, 2023,March 31, 2024, there was $535.4$525.4 million of unrecognized compensation cost related to unvested RSUs, inclusive of DSUs, which will be recognized over a weighted average period of approximately 2.22.3 years.
Performance Stock Units
The following table summarizes PSU activity: | | | Number of
PSUs | | Weighted Average Grant Date Fair Value | | Number of
PSUs | | Weighted Average Grant Date Fair Value |
| Outstanding as of January 1, 2023 | 19,563,747 | | | $ | 9.84 | |
| Outstanding as of January 1, 2024 | |
| Granted | Granted | 97,752 | | | 3.36 | |
| | Forfeited | Forfeited | (3,372,442) | | | 7.52 | |
| Outstanding as of September 30, 2023 | 16,289,057 | | | $ | 10.28 | |
| Forfeited | |
| Forfeited | |
| Outstanding as of March 31, 2024 | |
Compensation cost associated with PSUs is recognized using the accelerated attribution method for each of the three vesting tranches over the respective derived service period. We determined the grant-date fair value of PSUs utilizing a Monte Carlo simulation model.
AsDuring 2024, we granted PSUs that will vest, if at all, in January 2027, subject to the achievement of September 30, 2023, there was $12.2 millionspecified performance goals, such as growth in total book value and maintaining a minimum total risk weighted capital ratio during a three-year measurement period commencing January 2024.
We determined the grant-date fair value of unrecognized compensation cost relatedPSUs utilizing a Monte Carlo simulation model. The following table summarizes the inputs used for estimating the fair value of PSUs granted:
| | | | | | | | |
| Input | | Three Months Ended
March 31, 2024 |
| Risk-free interest rate | | 4.5% |
| Expected volatility | | 73.0% |
| Fair value of common stock | | $8.02 |
| Dividend yield | | —% |
Our use of a Monte Carlo simulation model requires the use of subjective assumptions:
•Risk-free interest rate — Based on the U.S. Treasury rate at the time of grant commensurate with the remaining term of the PSUs.
•Expected volatility — Based on the implied volatility of our common stock from a set of comparable publicly-traded companies.
•Fair value of common stock — Based on the closing stock price on the date of grant.
•Dividend yield — We assumed no dividend yield because we have historically not paid out dividends to unvested PSUs, which will be recognized over a weighted average period of approximately 0.9 years.common stockholders.
SoFi Technologies, Inc.
SoFi Technologies, Inc.
Notes to Condensed Consolidated Financial Statements (Continued)
(Unaudited)
(In Thousands, Unless Otherwise Stated and Except for Share and Per Share Data)
As of March 31, 2024, there was $8.8 million of unrecognized compensation cost related to unvested PSUs, which will be recognized over a weighted average period of approximately 2.2 years.
For interim periods, we follow the general recognition approach whereby tax expense is recognized using an estimated annual effective tax rate, which is applied to the year-to-date operating results. Additionally, we recognize tax expense or benefit for any discrete items occurring within the interim period that were excluded from the estimated annual effective tax rate. Our effective tax rate may be subject to fluctuations during the year due to impacts from the following items: (i) changes in forecasted pre-tax and taxable income or loss, (ii) changes in statutory law or regulations in jurisdictions where we operate, (iii) audits or settlements with taxing authorities, (iv) the tax impact of expanded product offerings or business acquisitions, and (v) changes in valuation allowance assumptions.
For the three and nine months ended September 30,March 31, 2024 and 2023, we recorded income tax (expense) benefit of $244$(6,183) and $3,661,$1,637, respectively. For the three and nine months ended September 30, 2022, we recordedOur income tax benefit (expense) of $242positions in both the 2024 and $(629), respectively. Income taxes2023 periods were primarily attributable toimpacted by income tax expenseexpenses associated with the profitability of SoFi Bank in state jurisdictions where separate filings are required. Forrequired, as well as federal taxes where our tax credits and loss carryforwards may be limited. Our income tax benefit position in the three and nine month 2023 periods, this expenseperiod was more than offset byprimarily attributable to income tax benefits from foreign losses in jurisdictions with net deferred tax liabilities related to Technisys.
There were no material changes to our unrecognized tax benefits during the ninethree months ended September 30, 2023,March 31, 2024, and we do not expect any other significant increases or decreases to unrecognized tax benefits within the next twelve months.
Valuation allowances are established when necessary to reduce deferred tax assets to the amounts that are more likely than not expected to be realized. In making such a determination of whether a valuation allowance is necessary, the Company considers all available positive and negative evidence supporting the allowance (e.g., the results of recent operations and future forecasts). If the Company determines that it is able to realize its deferred tax assets in the future in excess of the net recorded amount, the Company decreases the deferred tax asset valuation allowance, which reduces the provision for income taxes. During the ninethree months ended September 30, 2023,March 31, 2024, we maintained a full valuation allowance against our net deferred tax assets in applicable jurisdictions. In certain foreign and state jurisdictions where sufficient deferred tax liabilities exist, no valuation allowance is recognized. We will continue to recognize a full valuation allowance until there is sufficient positive evidence to support its release.
Note 15. Commitments, Guarantees, Concentrations and ContingenciesLeases and Occupancy Our leases consist of operating and finance leases, the latter of which expire in 2040.
Operating Leases
We primarily lease our office premises under multi-year, non-cancelable operating leases. Our operating leases have terms expiring from 20232024 to 2040, exclusive of renewal option periods. Our office leases contain renewal option periods ranging from one to ten years from the expiration dates. These options were not recognized as part of our ROU assets and operating lease liabilities, as we did not conclude at the commencement date of the leases that we were reasonably certain to exercise these options. However, in our normal course of business, we expect our office leases to be renewed, amended or replaced by other leases. Associated with these leases, we obtained non-cash operating lease ROU assets in exchange for new operating lease liabilities of $7,881$1,666 during the ninethree months ended September 30, 2023, inclusive of $8,553 of operating lease ROU assets obtained through acquisitions. During the nine months ended September 30, 2023, we recognized impairment expense of $1,243 within noninterest expense—general and administrative in the condensed consolidated statements of operations and comprehensive loss related to a sublease arrangement of an office premise. Fair value was determined using a discounted cash flow methodology.March 31, 2024.
Occupancy
Occupancy-related costs, which primarily relate to the operations of our leased office spaces, were $8,878$7,758 and $23,858$7,207 during the three and nine months ended September 30,March 31, 2024 and 2023, respectively, and $8,453 and $24,950 during the three and nine months ended September 30, 2022, respectively. Occupancy-related expenses are presented within eachthe following categories of the financial statement line itemsexpenses within noninterest expense: (i) technology and product development, (ii) sales and marketing, (iii) cost of operations, and (iv) general and administrative in the condensed consolidated statements of operations and comprehensive loss.income (loss).
SoFi Technologies, Inc.
SoFi Technologies, Inc.
Notes to Condensed Consolidated Financial Statements (Continued)
(Unaudited)
(In Thousands, Unless Otherwise Stated and Except for Share and Per Share Data)
Concentrations
Financial instruments that potentially subject us to significant concentrations of credit risk consist principally of cash and cash equivalents, restricted cash and restricted cash equivalents, residual investments and loans. We hold cash and cash
SoFi Technologies, Inc.
SoFi Technologies, Inc.
Notes to Condensed Consolidated Financial Statements (Continued)
(Unaudited)
(In Thousands, Unless Otherwise Stated and Except for Share and Per Share Data)
equivalents and restricted cash and restricted cash equivalents in accounts at regulated domestic financial institutions in amounts that may exceed FDIC insured amounts. We believe these institutions are of high credit quality.
We are dependent on third-party funding sources and deposit balances to originate loans. Additionally, we sell loans to various third parties. We have historically sold loans to a limited pool of third-party buyers. No individual third-party buyer accounted for 10% or more of consolidated total net revenues for the periods presented.
Within our Technology Platform segment, we have a relatively smaller number of clients compared to our lending and financial services businesses. As such, the loss of one or a few of our top clients could be significant to that portion of our business. No individual client accounted for 10% or more of consolidated total net revenues for the periods presented.
The Company is exposed to default risk on borrower loans originated and financed by us. There is no single borrower or group of borrowers that comprise a significant concentration of the Company’s loan portfolio. Likewise, the Company is not overly concentrated within a group of channel partners or other customers, with the exception of our distribution of personal loan residual interests in our sponsored personal loan securitizations, which we market to third parties, and the aforementioned whole loan buyers. Given we have a limited number of prospective buyers for our personal loan securitization residual interests, this might result in us utilizingour utilization of a significant amount of deposits or our own capital to fund future residual interests in personal loan securitizations, or impact the execution of future securitizations if we are limited in our own ability to invest in the residual interest portion of future securitizations, or find willing buyers for securitization residual interests.
Contingencies
Legal Proceedings
In the ordinary course of business, the Company may be subject to a variety of pending legal proceedings. While we are unable to predict the ultimate outcome of these actions, we believe that any ultimate liability arising from any of these actions will not have a material adverse effect on our consolidated financial position, results of operations or cash flows. However, many of these matters are in various stages of proceedings and further developments could cause management to revise its assessment of these matters. Our assessments are based on our knowledge and historical experience, as well as the specific facts and circumstances asserted, but the ultimate outcome of any matter could require payment substantially in excess of the amount that we have accrued and/or disclosed. Regardless of the final outcome, defending lawsuits, claims, government and self-regulatory organization investigations, and proceedings in which we are involved is costly and can impose a significant burden on management and employees, and there can be no assurances that we will receive favorable final outcomes.
Guarantees
We have three types of repurchase obligations that we account for as financial guarantees, which are disclosed in our Annual Report on Form 10-K. In the event of a repurchase, we are typically required to pay the purchase price of the loans transferred.
As of September 30, 2023March 31, 2024 and December 31, 2022,2023, we accrued liabilities within accounts payable, accruals and other liabilities in the condensed consolidated balance sheets of $4.1$7.1 million and $1.4$5.9 million, respectively, related to our estimated repurchase obligation, the former of which includes liabilities assumed in our acquisition of Wyndham.obligation. The corresponding charges for changes in the estimated obligation are recorded within noninterest income—loan origination, sales, and salessecuritizations in the condensed consolidated statements of operations and comprehensive loss.income (loss). As of September 30, 2023March 31, 2024 and December 31, 2022,2023, the amounts associated with loans sold that were subject to the terms and conditions of our repurchase obligations totaled $5.4$8.3 billion and $5.1$6.7 billion, respectively.
As of September 30, 2023March 31, 2024 and December 31, 2022,2023, we had a total of $6.4 million and $9.1 million, respectively, in letters of credit outstanding with financial institutions, which were issued for the purpose of securing certain of our operating lease obligations. A portion of the letters of credit was collateralized by $1.3 million and $3.1 million of our cash as of September 30, 2023March 31, 2024 and December 31, 2022, respectively,2023, which is included within restricted cash and restricted cash equivalents in the condensed consolidated balance sheets.
As of September 30, 2023 and December 31, 2022, we had a total of $13.7 million and $11.7 million, respectively, in letters of credit outstanding with the FHLB, which serve as collateral for public deposits and were collateralized by loans.
SoFi Technologies, Inc.
SoFi Technologies, Inc.
Notes to Condensed Consolidated Financial Statements (Continued)
(Unaudited)
(In Thousands, Unless Otherwise Stated and Except for Share and Per Share Data)
As of March 31, 2024 and December 31, 2023, we had a total of $27.2 million in letters of credit outstanding with the FHLB, which serve as collateral for public deposits and were collateralized by loans.
Commitments
As part of our community reinvestment initiatives, we have a commitment to fund a line of credit up to $20.0 million as of September 30, 2023, to be used to finance housing and stimulate economic development in low- to moderate-income communities. As of March 31, 2024, we funded $2.8 million of loans, which are presented within loans held for investment, at amortized cost in the condensed consolidated balance sheets, and had $17.2 million of the total $20.0 million commitment outstanding.
Mortgage Banking Regulatory Mandates
We are subject to certain state-imposed minimum net worth requirements for the states in which we are engaged in the business of a residential mortgage lender. Noncompliance with these requirements on an annual basis could result in potential fines or penalties imposed by the applicable state. Future events or changes in mandates may affect our ability to meet mortgage banking regulatory requirements. As of September 30, 2023March 31, 2024 and December 31, 2022,2023, we were in compliance with all minimum net worth requirements and,requirements; therefore, we have not accrued any liabilities related to fines or penalties.
Note 16. LossEarnings (Loss) Per Share We compute lossearnings (loss) per share attributable to common stock using the two-class method required for participating interests. Series 1 Redeemable Preferred Stock has preferential cumulative dividend rights. For each period presented, we increased net lossincome (loss) by the contractual amount of dividends payable to holders of Series 1 Redeemable Preferred Stock.
Basic loss per share of common stock wasis computed by dividing net loss,income (loss), adjusted for the impact of Series 1 Redeemable Preferred Stock dividends, by the weighted average number of shares of common stock outstanding during the period.
Diluted earnings (loss) per share of common stock is computed by dividing net income, adjusted for the impact of Series 1 Redeemable Preferred Stock dividends, by the weighted average number of shares of common stock outstanding during the period plus amounts representing the dilutive effect of contingently issuable shares including PSU awards which require future service as a condition of delivery of the underlying common stock, RSUs, outstanding options, outstanding warrants and dilution resulting from the conversion of convertible notes, if applicable. The adjustment for convertible notes reflects the conversion price at the end of the reporting period. We excluded the effect of all potentially dilutive common stock elements from the denominator in the computation of diluted lossearnings (loss) per share asin the periods where their inclusion would have been anti-dilutive.
The calculations of basic and diluted loss per share were as follows:
| | | | | | | | | | | | | | | | | | | | | | | |
| Three Months Ended September 30, | | Nine Months Ended September 30, |
| 2023 | | 2022 | | 2023 | | 2022 |
| Numerator: | | | | | | | |
| Net loss | $ | (266,684) | | | $ | (74,209) | | | $ | (348,655) | | | $ | (280,401) | |
| Less: Redeemable preferred stock dividends | (10,189) | | | (10,189) | | | (30,236) | | | (30,236) | |
| Net loss attributable to common stockholders – basic and diluted | $ | (276,873) | | | $ | (84,398) | | | $ | (378,891) | | | $ | (310,637) | |
| Denominator: | | | | | | | |
| Weighted average common stock outstanding – basic | 951,183,107 | | | 916,762,973 | | | 939,070,185 | | | 893,455,206 | |
| Weighted average common stock outstanding – diluted | 951,183,107 | | | 916,762,973 | | | 939,070,185 | | | 893,455,206 | |
| Loss per share – basic | $ | (0.29) | | | $ | (0.09) | | | $ | (0.40) | | | $ | (0.35) | |
| Loss per share – diluted | $ | (0.29) | | | $ | (0.09) | | | $ | (0.40) | | | $ | (0.35) | |
We excluded the effect of the below elements from our calculation of diluted loss per share, as their inclusion would have been anti-dilutive, as there were no earnings attributable to common stockholders. These amounts represent the number of instruments outstanding at the end of the period.
SoFi Technologies, Inc.
SoFi Technologies, Inc.
Notes to Condensed Consolidated Financial Statements (Continued)
(Unaudited)
(In Thousands, Unless Otherwise Stated and Except for Share and Per Share Data)
| | | | | | | | | | | |
| September 30, |
| 2023 | | 2022 |
| Common stock options | 17,951,656 | | | 19,047,350 | |
| Common stock warrants | 12,170,990 | | | 12,170,990 | |
Unvested RSUs(1) | 72,644,790 | | | 63,948,079 | |
| Unvested PSUs | 16,289,057 | | | 20,345,761 | |
Convertible notes(2) | 53,538,000 | | | 53,538,000 | |
Contingent common stock(3) | 61,145 | | | 6,305,595 | |
| | | |
| | | | | | | | | | | | | | | | | |
| | | Three Months Ended March 31, |
| | | | | 2024 | | 2023 |
| Numerator: | | | | | | | |
| Net income (loss) | | | | | $ | 88,043 | | | $ | (34,422) | |
| Less: Redeemable preferred stock dividends | | | | | (10,079) | | | (9,968) | |
| Net income (loss) attributable to common stockholders – basic | | | | | $ | 77,964 | | | $ | (44,390) | |
Plus: Dilutive effect of convertible notes, net(1) | | | | | (55,441) | | | — | |
Net income (loss) attributable to common stockholders – diluted(1)(2) | | | | | $ | 22,523 | | | $ | (44,390) | |
| Denominator: | | | | | | | |
| Weighted average common stock outstanding – basic | | | | | 982,617,492 | | | 929,270,723 | |
Effect of dilutive securities(2): | | | | | | | |
| Convertible notes | | | | | 47,845,642 | | | — | |
| Unvested RSUs | | | | | 9,752,440 | | | — | |
| Common stock options | | | | | 2,260,927 | | | — | |
| Weighted average common stock outstanding – diluted | | | | | 1,042,476,501 | | | 929,270,723 | |
| Earnings (loss) per share – basic | | | | | $ | 0.08 | | | $ | (0.05) | |
| Earnings (loss) per share – diluted | | | | | $ | 0.02 | | | $ | (0.05) | |
________________________
(1)For the three months ended March 31, 2024, diluted earnings per share of $0.02 and diluted net income attributable to common stockholders of $22,523 exclude gain on extinguishment of debt, net of tax, associated with convertible note activity during the period, as well as interest expense incurred, net of tax, related to convertible notes due 2026.
(2)During the three months ended March 31, 2024 and March 31, 2023, 81.0 million and 194.8 million shares, respectively, were excluded from the computation of diluted earnings per share, as the effect would have been anti-dilutive.
The following table presents all potentially dilutive stock elements, and reflect the number of instruments outstanding at the end of the period.
| | | | | | | | | | | |
| March 31, |
| 2024 | | 2023 |
| Common stock options | 17,721,910 | | | 18,569,877 | |
| Common stock warrants | 12,170,990 | | | 12,170,990 | |
Unvested RSUs(1) | 73,141,764 | | | 86,139,377 | |
| Unvested PSUs | 14,913,609 | | | 18,073,029 | |
Convertible notes(2) | 22,841,631 | | | 53,538,000 | |
Contingent common stock(3) | 45,859 | | | 6,305,595 | |
| | | |
________________________
(1)As of September 30, 2023,March 31, 2024, includes DSUs granted to non-employee directors. See Note 13. Share-Based Compensation for additional information.
(2)Represents the shares of common stock issuable upon conversion of all convertible notes at the conversion rate in effect at the date indicated. As of March 31, 2024, the 2026 convertible notes are potentially convertible into 22,841,631 shares of common stock, and there are no shares of common stock expected to be issued relating to the 2029 convertible notes, as there was no amount in excess of the expected cash redemption price which would require share settlement. See Note 9. Debt for additional information.
(3)As of September 30, 2023, includesRepresents contingently returnable common stock in connection with the Technisys Merger, which consists of shares that continue to be held in escrow pending resolution of outstanding indemnification claims by SoFi. These shares were issued in 2022 and partially released in 2023. See Note 2. Business Combinations for additional information.
SoFi Technologies, Inc.
SoFi Technologies, Inc.
Notes to Condensed Consolidated Financial Statements (Continued)
(Unaudited)
(In Thousands, Unless Otherwise Stated and Except for Share and Per Share Data)
Note 17. Business Segment Information Segment Organization and Reporting Framework
We have three reportable segments: Lending, Technology Platform and Financial Services. Each of our reportable segments is a strategic business unit that serves specific needs of our members based on the products and services provided. The segments are based on the manner in which management views the financial performance of the business. The reportable segments also reflect our organizational structure. Each segment has a segment manager who reports directly to the Chief Operating Decision Maker (“CODM”).CODM. The CODM has ultimate authority and responsibility over resource allocation decisions and performance assessment.
The operations of acquired businesses have been integrated into, or managed as part of, our existing reportable segments. Activities that are not part of a reportable segment, such as management of our corporate investment portfolio and asset/liability management by our centralized treasury function (as further discussed below), are included in the Corporate/Other non-reportable segment.
Contribution profit (loss) is the primary measure of segment profit and loss reviewed by the CODM and is intended to measure the direct profitability of each segment in the manner in which management evaluates performance and makes decisions about funding our operations and allocating resources. Contribution profit (loss) is defined as total net revenue for each reportable segment less:
•fair value changes in servicing rights and residual interests classified as debt that are attributable to assumption changes, which impact the contribution profit within the Lending segment. These fair value changes are non-cash in nature and are not realized in the period; therefore, they do not impact the amounts available to fund our operations; and
•expenses directly attributable to the corresponding reportable segment. Directly attributable expenses primarily include compensation and benefits and sales and marketing, and vary based on the amount of activity within each segment. Directly attributable expenses also include loan origination and servicing expenses, professional services, product fulfillment, lead generation and occupancy-related costs. Expenses are attributed to the reportable segments using either direct costs of the segment or labor costs that can be attributed based upon the allocation of employee time for individual products.
We apply a funds transfer pricing (“FTP”)an FTP framework to attribute net interest income to our business segments based on their usage and/or provision of funding. The primary objective of the FTP framework is to transfer interest rate risk from the business segments by providing matched duration of funding of assets and liabilities to allocate interest income and interest expense to each segment. Therefore, the financial impact, management and reporting of interest rate risk is centralized in Corporate/Other, where it is monitored and managed. The application of the FTP framework impacts the measure of net interest
SoFi Technologies, Inc.
SoFi Technologies, Inc.
Notes to Condensed Consolidated Financial Statements (Continued)
(Unaudited)
(In Thousands, Unless Otherwise Stated and Except for Share and Per Share Data)
income and, thereby, total net revenue and contribution profit (loss) for our Lending and Financial Servicesreportable segments, as well as the total net revenue of Corporate/Other, but has no impact on our consolidated results of operations.
Assets are not allocated to reportable segments, as our CODM does not evaluate reportable segments using discrete asset information.
Segment Information
Lending. The Lending segment includes our personal loan, student loan and home loan products and the related servicing activities. Revenues in the Lending segment are driven by changes in the fair value of our whole loans and securitization interests (inclusive of our economic hedging activities), gains or losses recognized on transfers that meet the true sale requirements, and our servicing-related activities, which mainly consist of servicing fees and the changes in our servicing assets over time. In our Lending segment, we also earn the difference between interest income earned on our loans and interest expense, as determined using the FTP framework. Our CODM considers net interest income in addition to contribution profit in evaluating the performance of our Lending segment and making resource allocation decisions. Therefore, we present interest income net of interest expense.
Technology Platform. The Technology Platform segment includes: (i) technology products and solutions revenue, which is primarily related to our platform-as-a-serviceplatform as a service through Galileo, which provides the infrastructure to facilitate core client-facingclient-
SoFi Technologies, Inc.
SoFi Technologies, Inc.
Notes to Condensed Consolidated Financial Statements (Continued)
(Unaudited)
(In Thousands, Unless Otherwise Stated and Except for Share and Per Share Data)
facing and back-end capabilities, such as account setup, account funding, direct deposit, authorizations and processing, payments functionality and check account balance features, (ii) beginning in March 2022, revenue earned by Technisys, which expanded our segment to include a cloud-native digital and core banking platform offering and which results in the sale of software licenses and the provision of related technology solutions, and (iii) beginning in the third quarter of 2023, interest income earned on segment cash balances, for which prior period amounts were determined to be immaterial. See Note 2. Business Combinations for additional information on the Technisys Merger.
Financial Services. The Financial Services segment primarily includes our SoFi Money product (primarily inclusive of checking and savings accounts, as well as cash management accounts), SoFi Invest product, SoFi Credit Card product, SoFi Relay personal finance management product and other financial services, such as lead generation and content for other financial services institutions and our members. Checking and savings provides members a digital banking experience that offers no account fees, 2-day early paycheck and a competitive annual percentage yield. SoFi Money cash management provides members a digital cash management experience. SoFi Invest provides investment features and financial planning services that we offer to our members. Revenues in the Financial Services segment include interest income earned and interest expense incurred under the FTP framework, interchange fees on our member debit and credit transactions, and digital assets transaction fees, and fees related to pay for order flow and share lending arrangements in SoFi Invest. We also earn referral fees in connection with referral activity we facilitate through our platform.
Our CODM considers net interest income in addition to contribution profit (loss) in evaluating the performance of our Financial Services segment and making resource allocation decisions. Under the FTP framework, the Financial Services segment earns interest income that is reflective of an FTP credit for deposits provided to the overall business, as well as incurs interest expense that is reflective of an FTP charge related to the use of funding for SoFi Credit Card.
Corporate/Other. Non-segment operations are classified as Corporate/Other, which includes net revenues associated with corporate functions that are not directly related to a reportable segment. Net interest income (expense) within Corporate/Other reflects the residual impact from FTP charges and FTP credits allocated to our reportable segments under our FTP framework. These non-segment net revenue (loss) also include interest income earned on corporate cash balances, nonrecurring income on certain investments from available cash on hand, such as our investments in AFS debt securities (which investments are not interconnected with our core business lines and, thereby, reportable segments), noninterest income related to gains and losses on extinguishment of corporate borrowings including our convertible notes, and interest expense on other corporate borrowings, such as our revolving credit facility and the amortization of debt issuance costs and original issue discount on our convertible notes.
SoFi Technologies, Inc.
SoFi Technologies, Inc.
Notes to Condensed Consolidated Financial Statements (Continued)
(Unaudited)
(In Thousands, Unless Otherwise Stated and Except for Share and Per Share Data)
Segment Results
The following tables present financial information, including the measure of contribution profit (loss), for each reportable segment:
| | | | | | | | | | | | | | | | | | | | | | | | | | | | | | | | | | | | | | |
| Three Months Ended September 30, 2023 | | Lending | | Technology Platform(1) | | Financial Services(1) | | Reportable Segments Total | | Corporate/Other(1) | | Total |
| Net revenue | | | | | | | | | | | | |
| Net interest income (expense) | | $ | 265,215 | | | $ | 573 | | | $ | 93,101 | | | $ | 358,889 | | | $ | (13,926) | | | $ | 344,963 | |
Noninterest income (expense)(2) | | 83,758 | | | 89,350 | | | 25,146 | | | 198,254 | | | (6,008) | | | 192,246 | |
| Total net revenue (loss) | | $ | 348,973 | | | $ | 89,923 | | | $ | 118,247 | | | $ | 557,143 | | | $ | (19,934) | | | $ | 537,209 | |
Servicing rights – change in valuation inputs or assumptions(3) | | (7,420) | | | — | | | — | | | (7,420) | | | | | |
Residual interests classified as debt – change in valuation inputs or assumptions(4) | | 928 | | | — | | | — | | | 928 | | | | | |
| Directly attributable expenses | | (138,525) | | | (57,732) | | | (114,987) | | | (311,244) | | | | | |
| Contribution profit | | $ | 203,956 | | | $ | 32,191 | | | $ | 3,260 | | | $ | 239,407 | | | | | |
| | | | | | | | | | | | |
| Three Months Ended September 30, 2022 | | Lending | | Technology Platform(1) | | Financial Services(1) | | Reportable Segments Total | | Corporate/Other(1) | | Total |
| Net revenue | | | | | | | | | | | | |
| Net interest income (expense) | | $ | 139,516 | | | $ | — | | | $ | 28,158 | | | $ | 167,674 | | | $ | (9,824) | | | $ | 157,850 | |
Noninterest income (expense)(2) | | 162,178 | | | 84,777 | | | 20,795 | | | 267,750 | | | (1,615) | | | 266,135 | |
| Total net revenue (loss) | | $ | 301,694 | | | $ | 84,777 | | | $ | 48,953 | | | $ | 435,424 | | | $ | (11,439) | | | $ | 423,985 | |
Servicing rights – change in valuation inputs or assumptions(3) | | (6,182) | | | — | | | — | | | (6,182) | | | | | |
Residual interests classified as debt – change in valuation inputs or assumptions(4) | | 1,453 | | | — | | | — | | | 1,453 | | | | | |
| Directly attributable expenses | | (116,403) | | | (65,241) | | | (101,576) | | | (283,220) | | | | | |
| Contribution profit (loss) | | $ | 180,562 | | | $ | 19,536 | | | $ | (52,623) | | | $ | 147,475 | | | | | |
| | | | | | | | | | | | |
| Nine Months Ended September 30, 2023 | | Lending | | Technology Platform(1) | | Financial Services(1) | | Reportable Segments Total | | Corporate/Other(1) | | Total |
| Net revenue | | | | | | | | | | | | |
| Net interest income (expense) | | $ | 698,147 | | | $ | 573 | | | $ | 225,775 | | | $ | 924,495 | | | $ | (52,396) | | | $ | 872,099 | |
Noninterest income (expense)(2) | | 319,348 | | | 254,860 | | | 71,625 | | | 645,833 | | | (10,547) | | | 635,286 | |
| Total net revenue (loss) | | 1,017,495 | | | 255,433 | | | 297,400 | | | 1,570,328 | | | (62,943) | | | 1,507,385 | |
Servicing rights – change in valuation inputs or assumptions(3) | | (28,105) | | | — | | | — | | | (28,105) | | | | | |
Residual interests classified as debt – change in valuation inputs or assumptions(4) | | 415 | | | — | | | — | | | 415 | | | | | |
| Directly attributable expenses | | (392,642) | | | (191,231) | | | (322,722) | | | (906,595) | | | | | |
| Contribution profit (loss) | | $ | 597,163 | | | $ | 64,202 | | | $ | (25,322) | | | $ | 636,043 | | | | | |
| | | | | | | | | | | | |
SoFi Technologies, Inc.
SoFi Technologies, Inc.
Notes to Condensed Consolidated Financial Statements (Continued)
(Unaudited)
(In Thousands, Unless Otherwise Stated and Except for Share and Per Share Data)
| | Nine Months Ended September 30, 2022 | | Lending | | Technology Platform(1) | | Financial Services(1) | | Reportable Segments Total | | Corporate/Other(1) | | Total |
| | Three Months Ended March 31, 2024 | |
| | Three Months Ended March 31, 2024 | |
| | Three Months Ended March 31, 2024 | | | Lending | | Technology Platform | | Financial Services | | Reportable Segments Total(1) | | Corporate/Other(1) | | Total |
| Net revenue | Net revenue | | | | | | | | | | | | |
| Net interest income | |
| Net interest income | |
| Net interest income | |
Noninterest income(2) | |
| Total net revenue | |
Servicing rights – change in valuation inputs or assumptions(3) | |
Residual interests classified as debt – change in valuation inputs or assumptions(4) | |
Residual interests classified as debt – change in valuation inputs or assumptions(4) | |
Residual interests classified as debt – change in valuation inputs or assumptions(4) | |
| Directly attributable expenses | |
| Directly attributable expenses | |
| Directly attributable expenses | |
| Contribution profit | |
| Contribution profit | |
| Contribution profit | |
| | Three Months Ended March 31, 2023 | |
| | Three Months Ended March 31, 2023 | |
| | Three Months Ended March 31, 2023 | | | Lending | | Technology Platform | | Financial Services | | Reportable Segments Total(1) | | Corporate/Other(1) | | Total |
| Net revenue | |
| Net interest income (expense) | |
| Net interest income (expense) | |
| Net interest income (expense) | Net interest income (expense) | | $ | 347,873 | | | $ | — | | | $ | 46,965 | | | $ | 394,838 | | | $ | (19,326) | | | $ | 375,512 | |
Noninterest income (expense)(2) | Noninterest income (expense)(2) | | 463,927 | | | 229,481 | | | 55,894 | | | 749,302 | | | (7,958) | | | 741,344 | |
| Total net revenue (loss) | Total net revenue (loss) | | $ | 811,800 | | | $ | 229,481 | | | $ | 102,859 | | | $ | 1,144,140 | | | $ | (27,284) | | | $ | 1,116,856 | |
Servicing rights – change in valuation inputs or assumptions(3) | Servicing rights – change in valuation inputs or assumptions(3) | | (26,860) | | | — | | | — | | | (26,860) | | | | | |
Residual interests classified as debt – change in valuation inputs or assumptions(4) | Residual interests classified as debt – change in valuation inputs or assumptions(4) | | 7,078 | | | — | | | — | | | 7,078 | | |
Residual interests classified as debt – change in valuation inputs or assumptions(4) | |
Residual interests classified as debt – change in valuation inputs or assumptions(4) | |
| Directly attributable expenses | |
| Directly attributable expenses | |
| Directly attributable expenses | Directly attributable expenses | | (336,814) | | | (169,849) | | | (258,697) | | | (765,360) | | |
| Contribution profit (loss) | Contribution profit (loss) | | $ | 455,204 | | | $ | 59,632 | | | $ | (155,838) | | | $ | 358,998 | | |
| Contribution profit (loss) | |
| Contribution profit (loss) | |
____________________
(1)Within the Technology Platform segment, intercompany fees were $6,950 and $15,645$7,001 for the three and nine months ended September 30, 2023, respectively,March 31, 2024 and $1,757 and $4,198$3,741 for the three and nine months ended September 30, 2022.March 31, 2023. The equal and offsetting intercompany expenses are reflected within all three segments’ directly attributable expenses, as well as within expenses not allocated to segments. The intercompany revenues and expenses are eliminated in consolidation. The revenues are eliminated within Corporate/Other and the expenses are adjusted in our reconciliation of directly attributable expenses below.
(2)Refer to Note 3. Revenue for a reconciliation of revenue from contracts with customers to total noninterest income (expense).
(3)Reflects changes in fair value inputs and assumptions, including market servicing costs, conditional prepayment, default rates and discount rates. This non-cash change, which is recorded within noninterest income in the condensed consolidated statements of operations and comprehensive loss,income (loss), is unrealized during the period and, therefore, has no impact on our cash flows from operations. As such, the changes in fair value attributable to assumption changes are adjusted to provide management and financial users with better visibility into the cash flows available to finance our operations.
(4)Reflects changes in fair value inputs and assumptions, including conditional prepayment, default rates and discount rates. When third parties finance our consolidated VIEs through purchasing residual interests, we receive proceeds at the time of the securitization close and, thereafter, pass along contractual cash flows to the residual interest owner. These obligations are measured at fair value on a recurring basis, with fair value changes recorded within noninterest income in the condensed consolidated statements of operations and comprehensive loss.income (loss). The fair value change attributable to assumption changes has no impact on our initial financing proceeds, our future obligations to the residual interest owner (because future residual interest claims are limited to securitization collateral cash flows), or the general operations of our business. As such, this non-cash change in fair value during the period is adjusted to provide management and financial users with better visibility into the cash flows available to finance our operations.
SoFi Technologies, Inc.
SoFi Technologies, Inc.
Notes to Condensed Consolidated Financial Statements (Continued)
(Unaudited)
(In Thousands, Unless Otherwise Stated and Except for Share and Per Share Data)
The following table reconciles reportable segments total contribution profit to lossincome (loss) before income taxes. Expenses not allocated to reportable segments represent items that are not considered by our CODM in evaluating segment performance or allocating resources.
| | Three Months Ended September 30, | | Nine Months Ended September 30, |
| 2023 | | 2022 | | 2023 | | 2022 |
| | | Three Months Ended March 31, | |
| | | Three Months Ended March 31, | |
| | | Three Months Ended March 31, | |
| | | | | 2024 | | | | | | | 2024 | | 2023 |
| Reportable segments total contribution profit | Reportable segments total contribution profit | $ | 239,407 | | | $ | 147,475 | | | $ | 636,043 | | | $ | 358,998 | |
| Corporate/Other total net loss | (19,934) | | | (11,439) | | | (62,943) | | | (27,284) | |
| Corporate/Other total net income (loss) | |
| Intercompany expenses | Intercompany expenses | 6,950 | | | 1,757 | | | 15,645 | | | 4,198 | |
| Servicing rights – change in valuation inputs or assumptions | Servicing rights – change in valuation inputs or assumptions | 7,420 | | | 6,182 | | | 28,105 | | | 26,860 | |
| Residual interests classified as debt – change in valuation inputs or assumptions | Residual interests classified as debt – change in valuation inputs or assumptions | (928) | | | (1,453) | | | (415) | | | (7,078) | |
| Expenses not allocated to segments: | Expenses not allocated to segments: | |
| Share-based compensation expense | Share-based compensation expense | (62,005) | | | (77,855) | | | (202,109) | | | (235,018) | |
| Share-based compensation expense | |
| Share-based compensation expense | |
Employee-related costs(1) | Employee-related costs(1) | (63,728) | | | (49,248) | | | (181,147) | | | (137,254) | |
| Depreciation and amortization expense | Depreciation and amortization expense | (52,516) | | | (40,253) | | | (147,967) | | | (109,007) | |
| Goodwill impairment expense | (247,174) | | | — | | | (247,174) | | | — | |
| Other corporate and unallocated expenses(2) | Other corporate and unallocated expenses(2) | (74,420) | | | (49,617) | | | (190,354) | | | (154,187) | |
| Loss before income taxes | $ | (266,928) | | | $ | (74,451) | | | $ | (352,316) | | | $ | (279,772) | |
Other corporate and unallocated expenses(2) | |
Other corporate and unallocated expenses(2) | |
| Income (loss) before income taxes | |
(1)Includes compensation, benefits, restructuring charges, recruiting, certain occupancy-related costs and various travel costs of executive management, certain technology groups and general and administrative functions that are not directly attributable to the reportable segments.
(2)Represents corporate overhead costs that are not allocated to reportable segments, which primarily includes corporate marketing and advertising costs, tools and subscription costs, professional services costs, corporate and FDIC insurance costs, foreign currency translation adjustments and transaction-related expenses.
Note 18. Subsequent Events ManagementOn April 22, 2024, the Company notified holders of its Series 1 Redeemable Preferred Stock that it intends to redeem all of the Company performed3,234,000 shares of Series 1 Preferred Stock outstanding on May 29, 2024 at the “Series 1 Redemption Price”, determined in accordance with the Certificate of Incorporation, of (i) $100 per share of Series 1 Redeemable Preferred Stock plus (ii) an evaluationamount in cash equal to any accumulated and compounded (if applicable) and unpaid dividends on the Series 1 Redeemable Preferred Stock to, but excluding, the payment date, which is equal to approximately $105.1027 per share and an aggregate payment of subsequent events that occurred after the balance sheet date through the date of this Quarterly Report on Form 10-Q, and determined that there were no subsequent events to report.
Item 2. Management’s Discussion and Analysis of Financial Condition and Results of Operations
The following discussion and analysis provides information that management believes is relevant to an assessment and understanding of our consolidated results of operations and financial condition. You should read this discussion and analysis in conjunction with the condensed consolidated financial statements and notes thereto included elsewhere in this Quarterly Report on Form 10-Q, as well as SoFi Technologies’ audited consolidated financial statements and notes thereto included in our Annual Report on Form 10-K filed with the SEC on March 1, 2023February 27, 2024 and subsequent filings with the SEC. Certain amounts may not foot or tie to other disclosures due to rounding. Certain information in this discussion and analysis or set forth elsewhere in this Quarterly Report on Form 10-Q contains forward-looking statements that involve numerous risks and uncertainties, including, but not limited to, those described under the sections entitled “Cautionary Statement Regarding Forward-Looking Statements” and Part II, Item 1A. “Risk Factors” included in this Quarterly Report on Form 10-Q. We assume no obligation to update any of these forward-looking statements. Actual results may differ materially from those contained in any forward-looking statements.
We are a member-centric, one-stop shop for financial services that, through our Lending and Financial Services products, allows members to borrow, save, spend, invest and protect their money. We refer to our customers as “members” and “clients”.
Our mission is to help our members achieve financial independence in order to realize their ambitions. To us, financial independence does not mean being wealthy, but rather represents the ability of our members to have the financial means to achieve their personal objectives at each stage of life, such as owning a home, having a family, or having a career of their choice — more simply stated, to have enough money to do what they want. We were founded in 2011 and have developed a suite of financial products that offers the speed, selection, content and convenience that only an integrated digital platform can provide. In order for us to achieve our mission, we have to help people get their money right, which means providing them with the ability to borrow better, save better, spend better, invest better and protect better. Everything we do today is geared toward helping our members “Get Your Money Right” and we strive to innovate and build ways for our members to achieve this goal.
In order to help achieve our mission, we offer personal loans, student loans, and home loans and related servicing. We also offer a variety of financial services products, such as SoFi Money, SoFi Credit Card, SoFi Invest and SoFi Relay, that provide more daily interactions with our members, and weas well as lending as a service which helps a broader range of borrowers to find lending solutions. We offer products and capabilities, such as SoFi At Work, that are designed to appeal to enterprises. We have also made strategic acquisitions to further expand our platform capabilities for enterprises, which we believe will deepen our participation in the entire technology ecosystem powering digital financial services.
We have built a social area within our digital native application, which we refer to as the “member home feed”. The member home feed is personalized and delivers content to a member about what they must do that day in their financial life, what they should consider doing that day in their financial life, and what they can do that day in their financial life. Through the member home feed, there are significant opportunities to build frequent engagement and, to date, the member home feed has been an important driver of new product adoption. The member home feed is an important part of our strategy and our ability to use data as a competitive advantage.
To complement these products and services, we believe in establishing partnerships with other enterprises to leverage our existing capabilities to reach a broader market and in building vertically-integrated technology platforms designed to manage and deliver our suite of products and technology solutions to our members and clients in a low-cost and differentiated manner.
Our three reportable segments and their primary product offerings as of September 30, 2023March 31, 2024 were as follows:
_________________
(1)Lending as a service includes referred loans which are originated by a third-party partner to which we provide pre-qualified borrower referrals, certain loans which we originate and subsequently sell to a third-party partner, and certain loans associated with our Lantern Credit financial services marketplace platform.
Members
We have created an innovative financial services platform designed to offer best-in-class products to meet the broad objectives of our members and the lifecycle of their financial needs. Our platform offers our members (as defined under “Key
Business Metrics”) a suite of financial products and services, enabling them to borrow, save, spend, invest and protect their finances across one integrated platform, as well as personal financial management tools and benefits to complement our products. Our aim is to create a best-in-class, integrated financial services platform that will generate a virtuous cycle whereby positive member experiences will lead to new product adoption by existing members and enhanced profitability for each additional product by lowering overall member acquisition costs and increasing the lifetime value of our members. We refer to this virtuous cycle as our “Financial Services Productivity Loop”.
We believe that developing a relationship with our members and gaining their trust is central to our success as a financial services platform. Moreover, we believe that some of the current frictions faced by other financial institutions are caused by a disjointed and non-seamless product experience, a lack of digital customer acquisition, subpar mobile web products instead of digital native apps and incomplete product offerings to meet a customer’s holistic financial needs. Through our mobile technology and continuous effort to improve our financial services products, we are seeking to build a financial services platform that can support all of our members’ financial services needs throughout their lifetime.
Enterprises
In addition to benefiting our members, our products and capabilities are also designed to appeal to enterprises, such as financial services institutions that subscribe to our enterprise services, and have become interconnected with the SoFi platform. We have continued to expand our platform capabilities for enterprises through strategic acquisitions, including: (i) our acquisition of Galileo in 2020, which provides technology platform services to financial and non-financial institutions and which has allowed us to vertically integrate across more of our financial services, and (ii) the Technisys Merger in the first quarter of 2022, through which we added a cloud-native digital and core banking platform into our technology platform offerings and expanded our technology platform services to a broader international market. These expansions have deepened our participation in the entire technology ecosystem powering digital financial services, allowing us to not only reduce costs to operate our member-centric business, but also deliver increasing value to our enterprise customers. While our enterprises are not considered members, they are important contributors to the growth of the SoFi platform, and also have their own constituents who might benefit from our products in the future.
SoFi Bank
In February 2022, we closed the Bank Merger, pursuant to which we became a bank holding company and began operating as SoFi Bank. Golden Pacific’s community bank business continues to operate as a division of SoFi Bank.
As a bank holding company, we offer checking and savings accounts and credit cards through SoFi Bank. We are originating all new loan applications within SoFi Bank, and we intend to continue to explore other products for SoFi Bank over time. The key current and expected financial benefits to us of operating a national bank include: (i) lowering our cost to fund loans, as we can utilize deposits held at SoFi Bank to fund loans, which have a lower borrowing cost of funds than our warehouse and securitization financing model, (ii) increasing our flexibility to hold loans on our balance sheet for longer periods, thereby enabling us to earn interest on these loans for a longer period, (iii) supporting origination volume growth by providing an alternative financing option, while also maintaining our warehouse capacity, and (iv) through deposits, providing us with meaningful member data that can allow us to better serve our members’ financial needs. See Part II, Item 1A. “Risk Factors” for a discussion of certain potential risks related to being a bank holding company.
International Operations
While we primarily operate in the United States, we also operate internationally in Latin America and Canada largely through Galileo and Technisys,our Technology Platform segment, as well as in Hong Kong through our acquisition of 8SoFi Holdings (Hong Kong) Limited (an investment business) in 2020..
Our Reportable Segments
We conduct our business through three reportable segments: Lending, Technology Platform and Financial Services. Below is a discussion of our segments and their primary products and non-product offerings.
Lending Segment
We offer personal loans, student loans, and home loans and related servicing. We believe that our market opportunity within each of these lending channels is significant. Our lending process primarily leverages an in-application, digital borrowing experience, which we believe serves as a competitive advantage as digital lending becomes increasingly ubiquitous. Furthermore, our platform supports the full transaction lifecycle, including credit application, underwriting, approval, funding and servicing. Through data derived at loan origination and throughout the servicing process, we haveSoFi has life-of-loan performance data on each loan in our ecosystem that we originate and on which we retain servicing, which provides a meaningful data asset.
Net interest income, which we define as the difference between the earned interest income and interest expense to finance loans, is a key component of the profitability of our Lending segment. We implemented an FTP framework to attribute net interest income to our business segments based on their usage and/or provision of funding, under which Lending segment net interest income represents the difference between interest income earned on our loans and an FTP charge for the segment’s use of funds to originate loans, which can fluctuate based on changes in interest rates, funding curves, the composition of our balance sheet and the availability of capital. See Note 17. Business Segment Information to the Notes to Condensed Consolidated Financial Statements for additional information on the FTP framework.
Personal Loans. We originate personal loans to help our members with a variety of financial needs, such as debt consolidation, home improvement projects, family planning, travel and weddings, to name a few. We offer fixed rate loans with flexible repayment terms, including unemployment protection. We generally offer loan sizes of $5,000 to $100,000, subject to legal and/or licensing requirements, with terms generally ranging from 2 to 7 years. We regularly update the annual percentage rates offered on our personal loans.
Student Loans. We operate in the student loan refinance space, with a focus on prime and super-prime school loans, as well as the “in-school” lending space, which allows members to borrow funds while they attend school. We offer flexible loan sizes, repayment options and competitive rates. Within student loan refinancing, we generally offer loan sizes of $5,000 or higher, subject to legal and/or licensing requirements, with terms generally ranging from 5 to 20 years. Within in-school loans, we generally offer loan sizes of $1,000 or higher, subject to legal and/or licensing requirements, with terms generally ranging from 5 to 15 years. We regularly update the annual percentage rates offered on our fixed and variable-rate student loans.
Home Loans. We offer agency, non-agency and beginning in the second quarter of 2023, certain government loans (e.g., VA and Federal Housing Administration (“FHA”) loans) for members purchasing a home or refinancing an existing mortgage. In the first quarter of 2024, we began offering fixed rate, closed end second mortgages with a maximum loan amount of $350,000. For our home loan products, we offer competitive rates, flexible down payment options for as little as 3% (or 0% for VA loans), a close on time guarantee, and educational tools and calculators. WeFor one-unit properties, we generally offer loan sizes of $75,000 to $726,200 for one-unit properties$766,550 in conforming normal cost areas (with exceptions for smaller loan sizes considered on a case-by-case basis), up to $1,089,300 for one-unit properties$1,149,825 in conforming high cost areas (GSE-eligible loans above the normal conforming limit, which is determined by county), and. For multi-unit properties, we offer loan sizes up to $2,095,200 for multi-unit properties in conforming normal cost and conforming high cost areas, respectively.$2,211,600. In addition, we offer loan sizes up to $3,000,000 for jumbo loans (loans in the jumbo loan program), up to $1,500,000 for VA loans, and up to $472,030 for FHAFederal Housing Administration loans in most areas. Our fixed rate home loans generally have terms of 10, 15, 20, 25 or 30 years. We offer adjustable rate mortgage products for conforming and jumbo loans, with a fixed rate for 5, 7 or 10 years followed by rate adjustments every six months for the remainder of the 30-year term, and for VA and Federal Housing Administration loans, with a fixed rate for 5 years followed by rate adjustments every year for the remainder of the 30-year term. We regularly update the annual percentage rates offered on our home loans.
Lending Model
AlthoughWe originate loans through our lending business, remains primarilyand have the option of pursuing a gain-on-sale origination model, whereby we seek to originate loans, recognize a gain from these loans and sell them into either our whole loan or securitization channels, operating SoFi Bank has also provided us with more flexibility to holdor holding loans on our balance sheet for longer periods, thereby enablingwhen advantageous. This enables us to maximize our return and balance our risk by earning interest on these loans for a longer period and to be selective in our sales arrangements. We expect to benefit from the continued mix towards deposit funding through operating SoFi Bank.
We sell our whole loans primarily to large financial institutions, such as bank holding companies. In securitization transactions that do not qualify for sale accounting, the related assets remain on our balance sheet and cash proceeds received are reported as liabilities, with related interest expense recognized over the life of the related borrowing. In securitization transactions that qualify for sale accounting, we typically have insignificant continuing involvement as an investor. In the case of both whole loan sales and securitizations, and with the exception of certain of our home loans, we also continue to retain servicing rights to our originated loans following transfer. We directly service all of the personal loans that we originate. We act as master servicer for, and rely on sub-servicers to directly service, all of our student loans and GSE conforming home loans. We view servicing as an integral component of the Lending segment, as we believe our servicing function is an important asset because of the connection to the member it affords us throughout the life of the loan. We directly service all of the personal loans that we originate. We act as master servicer for, and rely on sub-servicers to directly service, all of our student loans and GSE conforming home loans. We believe this ongoing relationship with our members enhancesloan thereby enhancing the effectiveness of our Financial Services Productivity Loop by increasing member touchpoints and driving new product adoption by existing members.
We rely upon deposits, warehouse financing and our own capital to enable us to continue to expand our origination capabilities. Our ability to utilize deposits held at SoFi Bank to fund our loans has lowered our overall cost of asset-backed financing relative to alternative sources of funding.
Underwriting Process
We have developed an extensive underwriting process across each lending product that is focused on willingness to pay (measured by credit attributes and risk scores), ability to pay (measured through income and free cash flow), and stability (measured by credit experience). A key element of our underwriting process is the ability to facilitate risk-based interest rates that we believe are appropriate for each loan using proprietary risk models through which we project quarterly loan performance, including expected losses and prepayments. We believe the outcome of this process helps us determine a more data-driven, risk-adjusted interest rate that we can offer our members. Further, our data and monitoring tools enable us to implement risk mitigation strategies quickly and efficiently, including underwriting standard adjustments to adapt our operations to changing environments and expectations.
Our personal loan and student loan underwriting models are typically based on credit reports, industry credit and bankruptcy prediction models, custom credit assessment models, and debt capacity analysis, as indicated by borrower free cash flow. Our underwriting strategy utilizes an advanced risk model that provides refined risk separation. Home loans originated by SoFi that are agency-conforming loans are subject to credit, debt service, and collateral eligibility established by GSEs. Government loans, such as VA and FHAFederal Housing Administration loans, are subject to the underwriting requirements established by the appropriate government agency. In addition to these requirements, agency-conforming and government loans are subject to credit eligibility overlays imposed by SoFi as well as individual investor requirements. Other non-agency loans originated by us, such as Jumbo loans, are subject to investor credit criteria, which typically includes a minimum tri-bureau credit score, established credit history requirements, income verification, as well as maximum limits on debt-to-income service and caps on loan-to-value based on an accredited appraisal.
We also leverage our data to provide existing members a streamlined application process through automation. Across our loan products, existing members generally experience a higher approval rate than new members, subject to the existing member being in good standing on their existing products.
Technology Platform Segment
Our Technology Platform segment consists of Galileo and Technisys. Through Galileo, weWe provide technology platform services through a diversified suite of program,offerings which include an event and authorization platform accessed via application programming interfaces, for financial and non-financial institutions. Technisys is a cloud-native digital and core banking platform withand services related to both platforms. Our customers include financial services customers predominantlyand non-financial institutions in North America and Latin America. Through Technisys, weWe earn technology product and solutions revenue through salesthe use of software licensesthe platforms, either on a per use basis, or from overall license and the provision of maintenance and support servicesfee service arrangements related to those software licenses.respective platforms. We also provideoffer additional add-on technology solutions forto support our clients and drive engagement, such as their business needs evolve over time, which we referan AI-based virtual assistant for customers of banks and financial institutions, and a real-time payment risk platform to as “evolution labs.”
We earn technology products and solutions fees for providing an integrated platform as a serviceenhance payment fraud mitigation strategies for financial customers. We continue to leverage investments made to integrate Galileo and non-financial institutions. Many technology platformTechnisys and position the Technology Platform segment contracts are multi-year contracts. In certain of our contracts, we provide for a variety of integrated platform services, which vary by client and are either non-cancellable or cancellable with a substantive payment. Pricing structures under these contracts are typically volume-based, or a combination of activity and volume-based, and payment terms are predominantly monthly in arrears. Many of these contracts contain minimum monthly payments, which may result in credits if we do not meet the agreed upon monthly service levels. We also earn subscription and service fees for providing software licenses and associated services, including implementation, maintenance and subsequent development work. We charge a recurring subscription fee for the software license and related maintenance services. Other software-related services are billed on a periodic basis as the services are provided. Certain arrangements for software and related services contain a provision for a fixed upfront payment.diversified durable growth.
Financial Services Segment
Our suite of financial services products, by nature, provides more daily interactions with our members and is, therefore, differentiated from our lending products, which inherently have less consistent touchpoints with our members. We offer a suite of financial services solutions, the most significant of which are discussed below.
•SoFi MoneySoFi Money:: Checking and savings accounts provide a digital banking experience. Following the Bank Merger, we began to allowexperience which allows members to convert their cash management accounts into checkingspend, save and savingsearn interest and rewards in flexible ways. We believe SoFi Checking and Savings accounts held at SoFi Bank.Bank are attractive to our members and prospective members due to our differentiated offerings, including competitive interest rates, access to expanded FDIC insurance coverage of up to $2 million through our Insured Deposit Program and the convenience and benefits of being part of a cohesive, simplified financial ecosystem within our mobile platform.
•SoFi InvestSoFi Invest:: A mobile-first investment platform offering members access to trading and advisory solutions, such as active investing robo-advisory and digital assets accounts.robo-advisory. Our interactive investing experience fosters engagement by allowing members to view and monitor other investors’ activity on the platform.
•SoFi Credit Card: Designed Our active investing service enables members to helpbuy and sell stocks and ETFs, as well as alternative investment funds, mutual funds and money market funds beginning in January 2024, to engage in options trading, to participate in IPOs, to buy and sell fractional shares, to engage in margin investing and to access a retirement investment account. Our robo-advisory service offers managed portfolios of stocks, bonds and ETFs. Additionally, we provide introductory brokerage services to our members save, invest and pay down debt through a variable rewards program, with higher rewards offerings when redeeming into other SoFi products. Our credit card product features no annual fee and cash back rewards on purchases.have invested heavily to create an appealing mobile investing experience.
Additional financial services solutions offered within our platform include:
•Loan referrals: SoFi Credit Card: Designed to help eligible members spend better with cash back rewards on every purchase and without limits. Our unlimited cash back credit card features no annual fee, no foreign transaction fees and flexible redemption options through statement credit or other SoFi products, with a 10% boost on cash back rewards earned for credit card members with direct deposit through SoFi Checking.
•Lantern Credit:A financial services marketplace platform developed to help applicants that do not qualify for SoFi products, and small business owners, to seek alternative products from other providers, as well as to provide a product comparison experience.
•Other lending as a service through: Includes referred loans which are originated by a third-party partner to which we present loan referral leadsprovide pre-qualified borrower referrals, and certain loans which we originate and subsequently sell to our affiliate partners.a third-party partner.
•SoFi Relay: A personal finance management product that allows members to track all of their financial accounts in one place and gain meaningful insights into their financial health and habits, such as credit score monitoring and spending behaviors. SoFi Relay also provides us with unified intelligence about our members that offers information about what SoFi products and features may help our members best achieve their financial goals, allowing us to further personalize the SoFi experience for our members.
•Lantern Credit: A financial services marketplace platform developed to help applicants that do not qualify for SoFi products seek alternative products from other providers, as well as to provide a product comparison experience.
We believe that the content and features we provide within our mobile application can spur more financial education, which leads to more ways for our members to actively engage in getting their money right and can ultimately demonstrate the effectiveness of our Financial Services Productivity Loop.
We earn revenues in connection with our Financial Services segment primarily in the following ways:
•Net interest income: Net interest income is a key component of the profitability of our Financial Services segment as it relates primarily to our SoFi Money and credit card products. Net interest income on SoFi Money is based on interest income determined using our FTP framework, net of interest expense based on the interest rate offered to our members on their deposits. Net interest income on credit card is based on the contractual interest included in credit card agreements, net of interest expense as determined using the FTP framework. See Note 17. Business Segment Information to the Notes to Condensed Consolidated Financial Statements for additional information on the FTP framework.
•Referral fees: Through strategic partnerships, we earn a specified referral fee in connection with referral activity we facilitate through our platform. Referral fees are paid to us by third-party partners that offer services to end users who do not use one of our product offerings, but who were referred to the partners through our platform. We also earn referral fulfillment fees for providing pre-qualified borrower referrals to a third-party partner who separately contracts with a loan originator. Our referral fee is calculated as either a fixed price per successful referral or a percentage of the transaction volume between the enterprise partners and referred consumers.
•Interchange fees: We earn interchange fees from our SoFi-branded debit cards and credit cards, which are reduced by fees payable to card associations and other third parties.cards. These fees are remitted by merchants and represent a percentage of the underlying transaction value processed through a payment network. We arrange for performance byengage a card association and bank issuer to enable certain aspects of the SoFi-branded transaction card process. We enter into contracts that establish the shared economics of SoFi-branded transaction cards.
•Brokerage fees: We earn brokerage fees primarily from our share lending and payment for order flow arrangements related to our SoFi Invest product, and digital assets activity. In our share lending arrangements and payment for order flow arrangements,in which we benefit through a negotiated multi-year revenue sharing arrangement, since our members' brokerage activity drives the share lending and payment for order flow volume. In our digital assets arrangements, our fee is calculated as a negotiated percentage of the transaction volume.
We achieved strong results fora number of key financial achievements in the three and nine months ended September 30, 2023,March 31, 2024, including record total net revenue of $537.2$645.0 million, and $1.5 billion, respectively, representing increasesan increase of 27% and 35%37% over total net revenue in the same periodsperiod of 2022, respectively. We realized strong momentum2023, as well as our second consecutive quarter of net income, achieving $88.0 million in memberthe first quarter of 2024, which includes a $59.2 million gain from exchanging convertible debt during the three months ended March 31, 2024. This compares to a loss of $34.4 million in the same prior year period. Diluted earnings per share for the three months ended March 31, 2024 was $0.02, which did not include a benefit from the convertible debt exchange in the quarter, compared to a loss per share of $0.05 in the same period of 2023. Continued growth in both total members and product growth and cross-buy adds, reflectingproducts reflects the benefits of our broad product suite and Financial Services Productivity Loop strategy. We added approximately 2.2Total members reached over 8.1 million new membersas of March 31, 2024, a 44% increase from the end of the third quarter of 2022, with 7.0prior year period, while total products reached over 11.8 million total members as of September 30, 2023,March 31, 2024, a 47% year-over-year38% year over year increase. We also added 3.2 million new products over this time period, with 10.4 million total products as of September 30, 2023, a 45% year-over-year increase.
Lending segment contribution profit of $204.0 million and $597.2$207.7 million for the three and nine months ended September 30, 2023, respectively,March 31, 2024 at a margin of 58% and 59%63%, respectively, increased 13% and 31%decreased 1% over the respective 2022 periods,2023 period, which had a contribution margin of 60%62%. Growth in net interest income of $65.5 million, or 33%, was driven by higher loan balances and 56%, respectively. Additionally,an average net interest margin of 5.99% and 5.84%5.91% in the three and nine months ended September 30, 2023, respectively, increased 13 and 69March 31, 2024, an increase of 43 basis points respectively, compared to 5.86% and 5.15%5.48% in the respective 2022 periods. Growth in net2023 period. Net interest incomemargin expansion was driven by an increase in both average interest-earning assets and average yields, partially offset by an increase in the cost of interest-bearing liabilities. Year-over-year originationOrigination volume increased 48% and 31% for the three and nine months ended September 30, 2023, respectively,
22% year over year, primarily driven by continued strong demand for personal loans and stable growth in the student loan business, despite continued macroeconomic headwinds in the student and home loan businesses.headwinds. Student loans saw some increasing demand in the third quarter of 2023 ahead of the resumption of principal and interest payments on federally-held student loans, and we expect that we may continue to see an increasemodest growth in student loan refinancing. Our acquisition of Wyndham in the second quarter of 2023 provided increased capacity and capabilities for our home loans product, which contributed to a notable year-over-yearyear over year increase in the second and third quarters of 2023,home loans, and which we expect to continue to provide benefits, during the remainder of the year.while we expect overall home loans growth could be correlated with rate movements in 2024.
Technology Platform segment contribution profit of $30.7 million for the three months ended March 31, 2024 increased 107% over the respective 2023 period, and total net revenue increased 6% and 11%of $94.4 million for the three and nine months ended September 30, 2023 compared toMarch 31, 2024 increased 21% over the respective 2022 periods, while contribution profit2023 period. Growth was driven by continued strong organic growth of $32.2 millionexisting clients and $64.2 million increased 65% and 8%, respectively.new product adoption, as well as notable contributions from increasingly diversified clients which have launched since the second half of 2023. Margin improvements were driven primarily by Galileo account growth, and decreases in directly attributable expenses, as we begin to realize the benefits of earlier investments made to support Technology Platform product development and the integration of Galileo and Technisys. The year-to-date comparison was also impacted by a partial period of contribution from TechnisysWe continue to make significant strides in 2022 compared to a full period of contribution in 2023. We have shifted our strategy to target larger potential clients with larger existing businesses, business-to-business clients and a more durable client base, which is expected to have a longer sales cycle. In addition, we continueof leveraging our unique product suite to pursue a diversified durable growth strategy withand expansion via new products and geographies.geographies, in addition to larger, more durable revenue opportunities. We expect growth in segment revenue to continue to accelerate during the remainder of the year, with increased contributionin 2024, as we are well positioned to capture opportunities from new clients along with greater product adoption among existing clients.traditional financial institutions and nonfinancial categories.
Within Financial Services, contribution profit (loss) of $3.3 million and $(25.3)$37.2 million for the three and nine months ended September 30, 2023, respectively,March 31, 2024 significantly improved compared to $(52.6) million and $(155.8)a contribution loss of $24.2 million in the respective 2022 periods,2023 period, and total net revenue of $118.2 million and $297.4$150.6 million for the three and nine months ended September 30, 2023, respectively,March 31, 2024 increased 142% and 189%86% over the respective 2022 periods.2023 period. We achieved continued strong growth in deposits, ending the period with $15.7$21.6 billion of deposits as of March 31, 2024, allowing us to maintain diversified sources of funding and driving an increase in net interest income earned on our deposits. In addition,By continuously innovating with new and relevant offerings, features and rewards for members, we grew total Financial Services products by 50%42% year over year.year to 10.1 million at quarter-end. We continue to realize scale in our marketing spend and improvement in operating leverage in the segment. We expect to continue to scale our products through increased brand awareness and network effects, and continue to beimprove contribution profit positive in the segment at the end of 2023 and beyond.segment.
The strength of our results underscores our belief that our suite of differentiated products and services provides the foundation for a diversified business that can endure through market cycles as well as exogenous factors. For instance, our access to multiple channels of funding, including deposit and loan warehouse funding, provides an advantage via increased optionality in sourcing liquidity through different environments and periods of capital markets volatility, as well as increases our flexibility to capture additional net interest margin and optimize returns, which typically provides more stable earnings in any macroeconomic environment, but is particularly important during times of excess macroeconomic volatility.
During 2023,2024, we continued to have strong deposit contribution from direct deposit members with a high quality median FICO score. We expect that our funding mix will continue to move towards deposit funding, which has a lower borrowing cost of funds than our warehouse and securitization financing model. We also providedcontinue to provide our members with access to expanded FDIC insurance coverage through a network of participating banks in our Insured Deposit Program, further enhancing our benefits offering to our members. Our Tier 1total capital ratio, as calculated under applicable regulatory capital rules, was 14.3%17.3% as of September 30, 2023.March 31, 2024.
Non-GAAP Financial Measures Our management and Board of Directors use adjusted net revenue and adjusted EBITDA, which are non-GAAP financial measures, to evaluate our operating performance, formulate business plans, help better assess our overall liquidity position, and make strategic decisions, including those relating to operating expenses and the allocation of internal resources. Accordingly, we believe that these non-GAAP measures provide useful information to investors and others in understanding and evaluating our operating results in the same manner as our management and Board of Directors.
Adjusted Net Revenue
Adjusted net revenue is defined as total net revenue, adjusted to exclude the fair value changes in servicing rights and residual interests classified as debt due to valuation inputs and assumptions changes, which relate only to our Lending segment.segment, as well as gains and losses on extinguishment of debt. We adjust total net revenue to exclude these items, as they are non-cash charges that are not realized during the period or not indicative of our core operating performance, and therefore positive or negative changes do not impact the cash available to fund our operations. This measure helps provide our management with an understanding of the net revenue available to finance our operations and helps management better decide on the proper expenses to authorize for each of our operating segments, to ultimately help achieve target contribution profit margins. Therefore, the measure of adjusted net revenue serves as both the starting point for how we think about the liquidity generated from our operations and also the starting point for our annual financial planning, the latter of which focuses on the cash we expect to generate from our operating segments to help fund the current year’s strategic objectives. Adjusted net revenue has limitations as an analytical tool and should not be considered in isolation from, or as a substitute for, the analysis of other GAAP financial measures, such as total net revenue. The primary limitation of adjusted net revenue is its lack of
comparability to other companies that do not utilize this measure or that use a similar measure that is defined in a different manner.
| | |
| Total Net Revenue and Adjusted Net Revenue |
| In Thousands |
|
The following table reconciles adjusted net revenue to total net revenue, the most directly comparable GAAP measure:
| | | | | | Three Months Ended September 30, | | Nine Months Ended September 30, | | | | Three Months Ended March 31, |
| ($ in thousands) | ($ in thousands) | | 2023 | | 2022 | | 2023 | | 2022 | ($ in thousands) | | | | | | 2024 | | 2023 |
Total net revenue | Total net revenue | | $ | 537,209 | | | $ | 423,985 | | | $ | 1,507,385 | | | $ | 1,116,856 | |
Servicing rights – change in valuation inputs or assumptions(1) | Servicing rights – change in valuation inputs or assumptions(1) | | (7,420) | | | (6,182) | | | (28,105) | | | (26,860) | |
Residual interests classified as debt – change in valuation inputs or assumptions(2) | Residual interests classified as debt – change in valuation inputs or assumptions(2) | | 928 | | | 1,453 | | | 415 | | | 7,078 | |
Gain on extinguishment of debt(3) | |
Adjusted net revenue | Adjusted net revenue | | $ | 530,717 | | | $ | 419,256 | | | $ | 1,479,695 | | | $ | 1,097,074 | |
(1)Reflects changes in fair value inputs and assumptions on servicing rights, including conditional prepayment, default rates and discount rates. These assumptions are highly sensitive to market interest rate changes and are not indicative of our performance or results of operations. Moreover, these non-cash charges are unrealized during the period and, therefore, have no impact on our cash flows from operations. As such, these positive and negative changes are adjusted out of total net revenue to provide management and financial users with better visibility into the net revenue available to finance our operations and our overall performance.
(2)Reflects changes in fair value inputs and assumptions on residual interests classified as debt, including conditional prepayment, default rates and discount rates. When third parties finance our consolidated securitization VIEs by purchasing residual interests, we receive proceeds at the time of the closing of the securitization and, thereafter, pass along contractual cash flows to the residual interest owner. These residual debt obligations are measured at fair value on a recurring basis, but they have no impact on our initial financing proceeds, our future obligations to the residual interest owner (because future residual interest claims are limited to contractual securitization collateral cash flows), or the general operations of our business. As such, these positive and negative non-cash changes in fair value attributable to assumption changes are adjusted out of total net revenue to provide management and financial users with better visibility into the net revenue available to finance our operations.
(3)Reflects gain on extinguishment of debt. Gains and losses are recognized during the period of extinguishment for the difference between the net carrying amount of debt extinguished and the fair value of equity securities issued. These non-cash charges are not indicative of our core operating performance, and as such are adjusted out of total net revenue to provide management and financial users with better visibility into the net revenue available to finance our operations and our overall performance.
The following table reconciles adjusted net revenue to total net revenue, the most directly comparable GAAP measure, for the quarterly periods presented:
| | Quarter Ended | |
| | Quarter Ended | |
| | Quarter Ended | |
| | Quarter Ended | |
| ($ in thousands) | |
| ($ in thousands) | |
| ($ in thousands) | ($ in thousands) | | September 30,
2023 | | June 30,
2023 | | March 31,
2023 | | December 31,
2022 | | September 30,
2022 | |
| Total net revenue | Total net revenue | | $ | 537,209 | | | $ | 498,018 | | | $ | 472,158 | | | $ | 456,679 | | | $ | 423,985 | | |
| Total net revenue | |
| Total net revenue | |
Servicing rights – change in valuation inputs or assumptions(1) | |
Servicing rights – change in valuation inputs or assumptions(1) | |
Servicing rights – change in valuation inputs or assumptions(1) | Servicing rights – change in valuation inputs or assumptions(1) | | (7,420) | | | (8,601) | | | (12,084) | | | (12,791) | | | (6,182) | | |
Residual interests classified as debt – change in valuation inputs or assumptions(2) | Residual interests classified as debt – change in valuation inputs or assumptions(2) | | 928 | | | (602) | | | 89 | | | (470) | | | 1,453 | | |
Residual interests classified as debt – change in valuation inputs or assumptions(2) | |
Residual interests classified as debt – change in valuation inputs or assumptions(2) | |
Gain on extinguishment of debt(3) | |
Gain on extinguishment of debt(3) | |
Gain on extinguishment of debt(3) | |
| Adjusted net revenue | Adjusted net revenue | | $ | 530,717 | | | $ | 488,815 | | | $ | 460,163 | | | $ | 443,418 | | | $ | 419,256 | | |
| Adjusted net revenue | |
| Adjusted net revenue | |
___________________
(1)See footnote (1) to the table above.
(2)See footnote (2) to the table above.
The reconciling items to determine our non-GAAP measure of adjusted net revenue are applicable only to the Lending segment. Thefollowing table below presentsreconciles adjusted net revenue for the Lending segment to total net revenue, the most directly comparable GAAP measure for the Lending segment:
| | Three Months Ended September 30, | | Nine Months Ended September 30, |
| | | | Three Months Ended March 31, | |
| | | | Three Months Ended March 31, | |
| | | | Three Months Ended March 31, | |
| ($ in thousands) | ($ in thousands) | | 2023 | | 2022 | | 2023 | | 2022 | ($ in thousands) | | | | | | 2024 | | 2023 |
| Total net revenue – Lending | Total net revenue – Lending | | $ | 348,973 | | | $ | 301,694 | | | $ | 1,017,495 | | | $ | 811,800 | |
Servicing rights – change in valuation inputs or assumptions(1) | Servicing rights – change in valuation inputs or assumptions(1) | | (7,420) | | | (6,182) | | | (28,105) | | | (26,860) | |
Residual interests classified as debt – change in valuation inputs or assumptions(2) | Residual interests classified as debt – change in valuation inputs or assumptions(2) | | 928 | | | 1,453 | | | 415 | | | 7,078 | |
| Adjusted net revenue – Lending | Adjusted net revenue – Lending | | $ | 342,481 | | | $ | 296,965 | | | $ | 989,805 | | | $ | 792,018 | |
(1)See footnote (1) to the table above.
(2)See footnote (2) to the table above.
Adjusted EBITDA
Adjusted EBITDA is defined as net income (loss), adjusted to exclude, as applicable: (i) corporate borrowing-based interest expense (our adjusted EBITDA measure is not adjusted for warehouse or securitization-based interest expense, nor deposit interest expense and finance lease liability interest expense, as these are not direct operating expenses), (ii) income tax expense (benefit), (iii) depreciation and amortization, (iv) share-based expense (inclusive of equity-based payments to non-employees), (v) restructuring charges, (vi) impairment expense (inclusive of goodwill impairment and property, equipment and software abandonments), (vi)(vii) transaction-related expenses, (vii)(viii) foreign currency impacts related to operations in highly inflationary countries, (ix) fair value changes in warrant liabilities, (viii)(x) fair value changes in each of servicing rights and residual interests classified as debt due to valuation assumptions, (xi) gain on extinguishment of debt, and (ix)(xii) other charges, as appropriate, that are not expected to recur and are not indicative of our core operating performance.
We believe adjusted EBITDA provides a useful measure to investors for period-over-period comparisons of our business, as it removes the effects of certain non-cash items and certain charges that are not indicative of our core operating performance or results of operations. It is also a measure that management relies upon to evaluate cash flows generated from operations, and therefore the extent of additional capital, if any, required to invest in strategic initiatives. Adjusted EBITDA has limitations as an analytical tool and should not be considered in isolation from, or as a substitute for, the analysis of other GAAP financial measures, such as net income (loss). Some of the limitations of adjusted EBITDA include that it does not reflect the impact of working capital requirements or capital expenditures and it is not a universally consistent calculation among companies in our industry, which limits its usefulness as a comparative measure.
| | |
Net Loss and Adjusted EBITDA |
In Thousands |
|
| | |
| Net Income (Loss) and Adjusted EBITDA |
| In Thousands |
|
The following table reconciles adjusted EBITDA to net loss,income (loss), the most directly comparable GAAP measure:
| | | | | | Three Months Ended September 30, | | Nine Months Ended September 30, | | | | Three Months Ended March 31, |
| ($ in thousands) | ($ in thousands) | | 2023 | | 2022 | | 2023 | | 2022 | ($ in thousands) | | | | | | 2024 | | 2023 |
| Net loss | | $ | (266,684) | | | $ | (74,209) | | | $ | (348,655) | | | $ | (280,401) | |
| Net income (loss) | |
| Non-GAAP adjustments: | Non-GAAP adjustments: | |
Interest expense – corporate borrowings(1) | Interest expense – corporate borrowings(1) | | 9,784 | | | 5,270 | | | 26,951 | | | 11,369 | |
Income tax (benefit) expense(2) | | (244) | | | (242) | | | (3,661) | | | 629 | |
Interest expense – corporate borrowings(1) | |
Interest expense – corporate borrowings(1) | |
Income tax expense (benefit)(2) | |
Depreciation and amortization(3) | Depreciation and amortization(3) | | 52,516 | | | 40,253 | | | 147,967 | | | 109,007 | |
| Share-based expense | Share-based expense | | 62,005 | | | 77,855 | | | 202,109 | | | 235,018 | |
Restructuring charges(4) | Restructuring charges(4) | | — | | | — | | | 4,953 | | | — | |
Impairment expense(5) | Impairment expense(5) | | 247,174 | | | — | | | 248,417 | | | — | |
Transaction-related expense(6) | | (34) | | | 100 | | | 142 | | | 17,446 | |
Foreign currency impact of highly inflationary subsidiaries(6) | |
| Servicing rights – change in valuation inputs or assumptions(7) | |
Servicing rights – change in valuation inputs or assumptions(7) | |
Servicing rights – change in valuation inputs or assumptions(7) | Servicing rights – change in valuation inputs or assumptions(7) | | (7,420) | | | (6,182) | | | (28,105) | | | (26,860) | |
Residual interests classified as debt – change in valuation inputs or assumptions(8) | Residual interests classified as debt – change in valuation inputs or assumptions(8) | | 928 | | | 1,453 | | | 415 | | | 7,078 | |
Gain on extinguishment of debt(9) | |
| Total adjustments | Total adjustments | | 364,709 | | | 118,507 | | | 599,188 | | | 353,687 | |
| Adjusted EBITDA | Adjusted EBITDA | | $ | 98,025 | | | $ | 44,298 | | | $ | 250,533 | | | $ | 73,286 | |
(1)Our adjusted EBITDA measure adjusts for corporate borrowing-based interest expense, as these expenses are a function of our capital structure. Corporate borrowing-based interest expense includes interest on our revolving credit facility, as well as interest expense and the amortization of debt discount and debt issuance costs on our convertible notes. Revolving credit facility interest expense in the 2023 periods2024 period increased due to higher interest rates relative to the prior year periods on identical outstanding debt. Convertible note interest expense in the 2024 period increased related to the issuance of interest-bearing convertible senior notes during the period.
(2)Income taxesOur income tax positions in both the 2024 and 2023 periods were primarily attributable toimpacted by income tax expenseexpenses associated with the profitability of SoFi Bank in state jurisdictions where separate filings are required. Forrequired, as well as federal taxes where our tax credits and loss carryforwards may be limited. Our income tax benefit position in the three and nine month 2023 periods, this expenseperiod was more than offset byprimarily attributable to income tax benefits from foreign losses in jurisdictions with net deferred tax liabilities related to Technisys. See Note 14. Income Taxes to the Notes to Condensed Consolidated Financial Statements for additional information.
(3)Depreciation and amortization expense for the 2023 periods2024 period increased compared to the 2022 periods2023 period primarily in connection with acquisitions and growth in our internally-developed software balance.
(4)Restructuring charges in the nine-month 2023 period primarily included employee-related wages, benefits and severance associated with a small reduction in headcount in our Technology Platform segment, in the first quarter of 2023, which do not reflect expected future operating expenses and are not indicative of our core operating performance.
(5)Impairment expense includes $247,174 related to goodwill impairment in the three and nine month 2023 periods, and $1,243 relatedperiod relates to a sublease arrangement, in the nine month 2023 period, which areis not indicative of our core operating performance.
(6)Transaction-related expensesForeign currency charges reflect the impacts of highly inflationary accounting for our operations in Argentina, which are related to our Technology Platform segment and commenced in the first quarter of 2022 with the Technisys Merger. For the year ended December 31, 2023, and 2022 periods included financial advisory and professional services costs associated with our acquisitions of Wyndham and Technisys, respectively.all amounts were reflected in the fourth quarter, as inter-quarter amounts were determined to be immaterial.
(7)Reflects changes in fair value inputs and assumptions, including market servicing costs, conditional prepayment, default rates and discount rates. This non-cash change is unrealized during the period and, therefore, has no impact on our cash flows from operations. As such, these positive and negative changes in fair value attributable to assumption changes are adjusted out of net lossincome (loss) to provide management and financial users with better visibility into the earnings available to finance our operations.
(8)Reflects changes in fair value inputs and assumptions, including conditional prepayment, default rates and discount rates. When third parties finance our consolidated VIEs through purchasing residual interests, we receive proceeds at the time of the securitization close and, thereafter, pass along contractual cash flows to the residual interest owner. These obligations are measured at fair value on a recurring basis, which has no impact on our initial financing proceeds, our future obligations to the residual interest owner (because future residual interest claims are limited to contractual securitization collateral cash flows), or the general operations of our business. As such, these positive and negative non-cash changes in fair value attributable to assumption changes are adjusted out of net lossincome (loss) to provide management and financial users with better visibility into the earnings available to finance our operations.
SoFi Technologies, Inc.
TABLE OF CONTENTS(9)Reflects gain on extinguishment of debt. Gains and losses are recognized during the period of extinguishment for the difference between the net carrying amount of debt extinguished and the fair value of equity securities issued. These non-cash charges are not indicative of our core operating performance, and as such are adjusted out of total net revenue to provide management and financial users with better visibility into the net revenue available to finance our operations and our overall performance.The following table reconciles adjusted EBITDA to net loss,income (loss), the most directly comparable GAAP measure, for the quarterly periods presented:
| | Quarter Ended | |
| | Quarter Ended | |
| | Quarter Ended | |
| | Quarter Ended | |
| ($ in thousands) | ($ in thousands) | | September 30,
2023 | | June 30,
2023 | | March 31,
2023 | | December 31,
2022 | | September 30,
2022 | |
Net loss | | $ | (266,684) | | | $ | (47,549) | | | $ | (34,422) | | | $ | (40,006) | | | $ | (74,209) | | |
| ($ in thousands) | |
| ($ in thousands) | |
| Net income (loss) | |
| Net income (loss) | |
| Net income (loss) | |
| Non-GAAP adjustments: | |
| Non-GAAP adjustments: | |
| Non-GAAP adjustments: | Non-GAAP adjustments: | | |
| Interest expense – corporate borrowings | Interest expense – corporate borrowings | | 9,784 | | | 9,167 | | | 8,000 | | | 7,069 | | | 5,270 | | |
| Interest expense – corporate borrowings | |
| Interest expense – corporate borrowings | |
| Income tax (benefit) expense | |
| Income tax (benefit) expense | |
| Income tax (benefit) expense | Income tax (benefit) expense | | (244) | | | (1,780) | | | (1,637) | | | 1,057 | | | (242) | | |
| Depreciation and amortization | Depreciation and amortization | | 52,516 | | | 50,130 | | | 45,321 | | | 42,353 | | | 40,253 | | |
| Depreciation and amortization | |
| Depreciation and amortization | |
| Share-based expense | |
| Share-based expense | |
| Share-based expense | Share-based expense | | 62,005 | | | 75,878 | | | 64,226 | | | 70,976 | | | 77,855 | | |
| Restructuring charges | Restructuring charges | | — | | | — | | | 4,953 | | | — | | | — | | |
| Restructuring charges | |
| Restructuring charges | |
| Impairment expense | Impairment expense | | 247,174 | | | — | | | 1,243 | | | — | | | — | | |
| Impairment expense | |
| Impairment expense | |
| Foreign currency impact of highly inflationary subsidiaries | |
| Foreign currency impact of highly inflationary subsidiaries | |
| Foreign currency impact of highly inflationary subsidiaries | |
| Transaction-related expense | |
| Transaction-related expense | |
| Transaction-related expense | Transaction-related expense | | (34) | | | 176 | | | — | | | 1,872 | | | 100 | | |
| Servicing rights – change in valuation inputs or assumptions | Servicing rights – change in valuation inputs or assumptions | | (7,420) | | | (8,601) | | | (12,084) | | | (12,791) | | | (6,182) | | |
| Servicing rights – change in valuation inputs or assumptions | |
| Servicing rights – change in valuation inputs or assumptions | |
| Residual interests classified as debt – change in valuation inputs or assumptions | Residual interests classified as debt – change in valuation inputs or assumptions | | 928 | | | (602) | | | 89 | | | (470) | | | 1,453 | | |
| Residual interests classified as debt – change in valuation inputs or assumptions | |
| Residual interests classified as debt – change in valuation inputs or assumptions | |
| Gain on extinguishment of debt | |
| Gain on extinguishment of debt | |
| Gain on extinguishment of debt | |
| Total adjustments | |
| Total adjustments | |
| Total adjustments | Total adjustments | | 364,709 | | | 124,368 | | | 110,111 | | | 110,066 | | | 118,507 | | |
Adjusted EBITDA | Adjusted EBITDA | | $ | 98,025 | | | $ | 76,819 | | | $ | 75,689 | | | $ | 70,060 | | | $ | 44,298 | | |
Adjusted EBITDA | |
Adjusted EBITDA | |
The table below presents the key business metrics that management uses to evaluate our business, measure our performance, identify trends and make strategic decisions:
| | | September 30, 2023 | | September 30, 2022 | | % Change | | March 31, 2024 | | March 31, 2023 | | Variance | | % Change |
| Members | Members | 6,957,187 | | | 4,742,673 | | | 47 | % | Members | 8,131,720 | | | 5,655,711 | | 5,655,711 | | | 2,476,009 | | 2,476,009 | | | 44 | | 44 | % |
| Total Products | Total Products | 10,447,806 | | | 7,199,298 | | | 45 | % | Total Products | 11,830,128 | | | 8,554,363 | | 8,554,363 | | | 3,275,765 | | 3,275,765 | | | 38 | | 38 | % |
| Total Products — Lending segment | Total Products — Lending segment | 1,593,906 | | | 1,280,493 | | | 24 | % | Total Products — Lending segment | 1,705,155 | | | 1,416,122 | | 1,416,122 | | | 289,033 | | 289,033 | | | 20 | | 20 | % |
| Total Products — Financial Services segment | Total Products — Financial Services segment | 8,853,900 | | | 5,918,805 | | | 50 | % | Total Products — Financial Services segment | 10,124,973 | | | 7,138,241 | | 7,138,241 | | | 2,986,732 | | 2,986,732 | | | 42 | | 42 | % |
| Total Accounts — Technology Platform segment | Total Accounts — Technology Platform segment | 136,739,131 | | | 124,332,810 | | | 10 | % | Total Accounts — Technology Platform segment | 151,049,375 | | | 126,326,916 | | 126,326,916 | | | 24,722,459 | | 24,722,459 | | | 20 | | 20 | % |
See “Summary Results by Segment” for additional metrics we review at the segment level.
Members
We refer to our customers as “members”. We define a member as someone who has a lending relationship with us through origination and/or ongoing servicing, opened a financial services account, linked an external account to our platform, or signed up for our credit score monitoring service. Our members have continuous access to our certified financial planners (“CFPs”), our career advice services,CFPs, our member events, our
content, educational material, news, and our tools and calculators, which are provided at no cost to the member. Additionally, our mobile app and website have a member home feed that is personalized and delivers content to a member about what they must do that day in their financial life, what they should consider doing that day in their financial life, and what they can do that day in their financial life. Beginning in the first quarter of 2024, we aligned our methodology for calculating member and product metrics with our member and product definitions to include co-borrowers, co-signers, and joint- and co-account holders, as applicable. Quarterly amounts for prior periods were determined to be immaterial and were not recast.
Once someone becomes a member, they are always considered a member unless they violate our terms of service. We adjust our total number of members in the event a member isare removed in accordance with our terms of service.service, in which case, we adjust our total number of members. This could occur for a variety of reasons—including fraud or pursuant to certain legal processes—and, as our terms of service evolve together with our business practices, product offerings and applicable regulations, our grounds for removing members from our total member count could change. The determination that a member should be removed in accordance with our terms of service is subject to an evaluation process, following the completion, and based on the results, of which, relevant members and their associated products are removed from our total member count in the period in which such evaluation process concludes. However, depending on the length of the evaluation process, that removal may not take place in the same period in which the member was added to our member count or the same period in which the circumstances leading to their removal occurred. For this reason, our total member count may not yet reflect adjustments that may be made once ongoing evaluation processes, if any, conclude.
We view members as an indication not only of the size and a measurement of growth of our business, but also as a measure of the significant value of the data we have collected over time. The data we collect from our members helps us to, among other things: (i) assess loan life performance data on each loan in our ecosystem, which can inform risk-based interest rates that we can offer our members, (ii) understand our members’ spending behavior to identify and suggest other products we offer that may align with the members’ financial needs, and (iii) enhance our opportunities to sell additional products to our members, as our members represent a vital source of marketing opportunities. When we provide additional products to members, it helps improve our unit economics per member, as we save on marketing costs that we would otherwise incur to attract new members. It also increases the lifetime value of an individual member. This in turn enhances our Financial Services Productivity Loop. Member growth is generally an indicator of future revenue, but is not directly correlated with revenues, since not all members who sign up for one of our products fully utilize or continue to use our products, and not all of our products (such as our complimentary product, SoFi Relay) provide direct sources of revenue.
Since our inception through September 30, 2023,March 31, 2024, we have served approximately 7.08.1 million members who have used approximately 10.411.8 million products on the SoFi platform.
Total Products
Total products refers to the aggregate number of lending and financial services products that our members have selected on our platform since our inception through the reporting date, whether or not the members are still registered for such products. Total products is a primary indicator of the size and reach of our Lending and Financial Services segments. Management relies on total products metrics to understand the effectiveness of our member acquisition efforts and to gauge the propensity for members to use more than one product.
In our Lending segment, total products refers to the number of personal loans, student loans and home loans that have been originated through our platform through the reporting date, whether or not such loans have been paid off. If a member has multiple loan products of the same loan product type, such as two personal loans, that is counted as a single product. However, if a member has multiple loan products across loan product types, such as one personal loan and one home loan, that is counted as two products. The account of a co-borrower or co-signer is not considered a separate lending product.
In our Financial Services segment, total products refers to the number of SoFi Money accounts (inclusive of checking and savings accounts held at SoFi Bank and cash management accounts), SoFi Invest accounts, SoFi Credit Card accounts (including accounts with a zero dollar balance at the reporting date), referred loans (which are originated by the Company or a third-party partner to which we provide pre-qualified borrower referrals), SoFi At Work accounts and SoFi Relay accounts (with either credit score monitoring enabled or external linked accounts) that have been opened through our platform through the reporting date. Checking and savings accounts are considered one account within our total products metric. Our SoFi Invest service is composed of threetwo products: active investing accounts robo-advisory accounts and digital assetsrobo-advisory accounts. Our members can select any one or combination of the three types of SoFi Invest products. If a member has multiple SoFi Invest products of the same account type, such as two active investing accounts, that is counted as a single product. However, if a member has multiple SoFi Invest products across account types, such as one active investing account and one robo-advisory account, those separate account types are considered separate products. The account of a joint- or co-account holder is considered a separate financial services product. In the event a member is removed in accordance with our terms of service, as discussed under “Members” above, the member’s associated products are also removed.
Total lending products were composed of the following:
| | Lending Products | Lending Products | | September 30, 2023 | | September 30, 2022 | | Variance | | % Change | Lending Products | | March 31, 2024 | | March 31, 2023 | | Variance | | % Change |
| Personal loans | Personal loans | | 1,057,995 | | | 783,645 | | | 274,350 | | | 35 | % | Personal loans | | 1,152,688 | | | 904,912 | | 904,912 | | | 247,776 | | 247,776 | | | 27 | | 27 | % |
| Student loans | Student loans | | 507,567 | | | 471,141 | | | 36,426 | | | 8 | % | Student loans | | 521,835 | | | 484,961 | | 484,961 | | | 36,874 | | 36,874 | | | 8 | | 8 | % |
| Home loans | Home loans | | 28,344 | | | 25,707 | | | 2,637 | | | 10 | % | Home loans | | 30,632 | | | 26,249 | | 26,249 | | | 4,383 | | 4,383 | | | 17 | | 17 | % |
| Total lending products | Total lending products | | 1,593,906 | | | 1,280,493 | | | 313,413 | | | 24 | % | Total lending products | | 1,705,155 | | | 1,416,122 | | 1,416,122 | | | 289,033 | | 289,033 | | | 20 | | 20 | % |
Total financial services products were composed of the following:
| | Financial Services Products | Financial Services Products | | September 30, 2023 | | September 30, 2022 | | Variance | | % Change | Financial Services Products | | March 31, 2024 | | March 31, 2023 | | Variance | | % Change |
Money(1) | Money(1) | | 3,063,778 | | | 2,002,791 | | | 1,060,987 | | | 53 | % | Money(1) | | 3,880,021 | | | 2,413,013 | | 2,413,013 | | | 1,467,008 | | 1,467,008 | | | 61 | | 61 | % |
| Invest | | 2,465,072 | | | 2,067,621 | | | 397,451 | | | 19 | % |
Invest(2) | | Invest(2) | | 2,224,705 | | | 2,210,915 | | | 13,790 | | | 1 | % |
| Credit Card | Credit Card | | 235,791 | | | 153,978 | | | 81,813 | | | 53 | % | Credit Card | | 254,617 | | | 193,236 | | 193,236 | | | 61,381 | | 61,381 | | | 32 | | 32 | % |
Referred loans(2) | | 51,301 | | | 36,538 | | | 14,763 | | | 40 | % |
Referred loans(3) | | Referred loans(3) | | 59,555 | | | 44,586 | | | 14,969 | | | 34 | % |
| Relay | Relay | | 2,958,497 | | | 1,600,102 | | | 1,358,395 | | | 85 | % | Relay | | 3,613,686 | | | 2,205,931 | | 2,205,931 | | | 1,407,755 | | 1,407,755 | | | 64 | | 64 | % |
| At Work | At Work | | 79,461 | | | 57,775 | | | 21,686 | | | 38 | % | At Work | | 92,389 | | | 70,560 | | 70,560 | | | 21,829 | | 21,829 | | | 31 | | 31 | % |
| Total financial services products | Total financial services products | | 8,853,900 | | | 5,918,805 | | | 2,935,095 | | | 50 | % | Total financial services products | | 10,124,973 | | | 7,138,241 | | 7,138,241 | | | 2,986,732 | | 2,986,732 | | | 42 | | 42 | % |
___________________
(1)Includes checking and savings accounts held at SoFi Bank, and cash management accounts.
(2)In the fourth quarter of 2023, we transferred the crypto services provided by SoFi Digital Assets, LLC, and began closing existing digital assets accounts and removing the account from Invest products. This process was completed in the first quarter of 2024. As of March 31, 2023, Invest products included 415,298 digital assets accounts. Excluding these accounts (that were closed as part of the transfer of the crypto services), total Invest products increased by 429,032, or 24%, year over year.
(3)Limited to loans wherein we provide third party fulfillment services.
Technology Platform Total Accounts
In our Technology Platform segment, total accounts refers to the number of open accounts at Galileo as of the reporting date. We include intercompany accounts on the Galileo platform-as-a-serviceplatform as a service in our total accounts metric to better align with the Technology Platform segment revenue reported in Note 17. Business Segment Information to the Notes to Condensed Consolidated Financial Statements, which includes intercompany revenue. Intercompany revenue is eliminated in consolidation. Total accounts is a primary indicator of the accounts dependent upon our technology platform to use virtual card products, virtual wallets, make peer-to-peer and bank-to-bank transfers, receive early paychecks, separate savings from spending balances, make debit transactions and rely upon real-time authorizations, all of which result in revenues for the Technology Platform segment. We do not measure total accounts for the Technisys products and solutions, as the revenue model is not primarily dependent upon being a fully integrated, stand-ready service.
| | |
Technology Platform Accounts(1)(2) |
| In Millions |
___________________
(1)We include SoFi accounts on the Galileo platform-as-a-service in Technology Platform total accounts to better align with the presentation of Technology Platform segment total net revenue.
(2)In 2023, Technology Platform total accounts reflects the previously disclosed migration by one of our clients of the majority of its processing volumes to a pure processor. These accounts remained open for administrative purposes through the end of 2022, and were included in our total accounts in such period.
| | | | | | | | | | | | | | | | | | | | | | | |
| September 30, 2023 | | September 30, 2022 | | Variance | | % Change |
| Total accounts | 136,739,131 | | | 124,332,810 | | | 12,406,321 | | | 10 | % |
| | | | | | | | | | | | | | | | | | | | | | | |
| March 31, 2024 | | March 31, 2023 | | Variance | | % Change |
| Total accounts | 151,049,375 | | | 126,326,916 | | | 24,722,459 | | | 20 | % |
Key Factors Affecting Operating Results Our future operating results and cash flows are dependent upon a number of opportunities, challenges and other factors, including our loan origination volume, financial services products and member activity on our platform, growth in
technology platform clients, competition and industry trends, general economic conditions and our ability to optimize our national bank charter. The key factors affecting our operating results are discussed in our Annual Report on Form 10-K for the year ended December 31, 2022,2023, with notable updates provided herein.
Industry Trends and General Economic Conditions
The Federal Reserve increased the benchmark interest rate throughout 2022 and several times in 2023, largely in response to high inflation, low unemployment and strong consumer demand, while balancing macroeconomic risks, such as increased market volatility. We have continued to see strong demand for our deposits as a result of our competitive interest rate offering and expanded access to expanded FDIC insurance coverage.coverage through a network of participating banks in our Insured Deposit Program. Rate cuts are expected in 2024, but the timing of such cuts remains uncertain. However, over past quarters rising interest rates have unfavorably impacted, and could continue to unfavorably impact, demand for refinancing loan products. Economic and market volatility may continue to occur and could worsen, including if there is additional turmoil in the banking and financial services sectors, which could adversely impact our liquidity, results of operations and financial condition. These market developments have negatively impacted customer confidence in the safety and soundness of certain banks. As a result, although we have not observed a decline in our overall deposits to date, our members may choose to maintain deposits with other financial institutions or spread their deposit funds among multiple financial institutions. In addition, if the Federal Reserve does not effectively curb inflation or interest rates further rise unexpectedly or too quickly or macroeconomic conditions deteriorate or do not improve, it could have a negative impact on the overall economy and result in increased unemployment, which could adversely impact our results of operations. In 2023,the first quarter of 2024, we saw a continuation from 20222023 of elevated credit spreads across capital markets and changes in consumer credit. Our increased personal loan annualized charge-off rate year over year was reflective of our expectation of credit metrics to revert over time to more normalized levels, but remains healthy, while our higherlower credit card annualized charge-off rate was reflective of our maturing portfolio.improvement in credit card delinquency rates. Negative changes to macroeconomic conditions may result in decreased demand for our products, increased operating costs and negatively impact our results of operations.
Fair Value of Loans
We measure our personal loans, student loans and home loans at fair value, which are level 3 measurements due to the use of unobservable inputs. These unobservable assumptions reflect estimates of inputs that market participants would use in pricing our loans.
value. Our fair value adjustments on loans impact our consolidated results of operations and include adjustments related to loans originated during the period, loans held at the balance sheet date, as well as gains (losses) on loans sold or repurchased during the period. Fair value adjustments made in each reporting period are impacted by factors such as, among others, interest rates, weighted average coupon, credit spreads, actual and estimated losses, prepayment speeds, duration and previous loan sale execution on similar loans. In determining our fair value assumptions, we incorporate recent data impacting the capital markets, as well as factors specific to us. Changes in these factors, either positive or negative, can have a material impact on our results of operations.
The following table summarizes the significant inputs to the fair value model for personal and student loans:
| | Personal Loans | | Student Loans |
| September 30,
2023 | | June 30,
2023 | | September 30,
2023 | | June 30,
2023 |
| Personal Loans | | | Personal Loans | | Student Loans |
| March 31,
2024 | | | March 31,
2024 | | December 31,
2023 | | March 31,
2024 | | December 31,
2023 |
Weighted average coupon rate(1) | Weighted average coupon rate(1) | 13.8 | % | | 13.6 | % | | 5.3 | % | | 5.0 | % | Weighted average coupon rate(1) | 13.8 | % | | 13.8 | % | | 5.6 | % | | 5.6 | % |
| Weighted average annual default rate | Weighted average annual default rate | 4.6 | | | 4.6 | | | 0.5 | | | 0.5 | |
| Weighted average conditional prepayment rate | Weighted average conditional prepayment rate | 20.3 | | | 19.0 | | | 10.5 | | | 10.6 | |
| Weighted average discount rate | Weighted average discount rate | 6.6 | | | 6.1 | | | 4.8 | | | 4.4 | |
|
(1)Represents the average coupon rate on loans held on balance sheet, weighted by unpaid principal balance outstanding at the balance sheet date.
As of the thirdfirst quarter of 20232024 relative to the secondfourth quarter of 2023, we observed the following trends:
•The weighted average couponconditional prepayment rates on personal loans and student loans increased by 20154 bps and 308 bps, respectively, which reflects raterespectively. Increases reflect the impacts of observed increases passed on to borrowers as benchmark interest rates have increased, combined with higher personal and student loan originations.in prepayments during the first quarter.
•The twoweighted average discount rates on personal loans and five year swap ratesstudent loans increased by 1626 bps and 436 bps, respectively, as well as the applicable benchmark rate forward curve.respectively. For personal loans our discount rate assumptions increased in the third quarter primarily due to larger spreads indicated by asset-backed security and secondary bond markets, as well as the impacts of the increased benchmark rates. For student loans, our discount rate assumptions increased in the thirdfirst quarter primarily due to the impacts of the increased benchmark rates.rates increasing by 48 bps and 49 bps, respectively, partially offset by spreads tightening. Spread changes are indicated by asset-backed security and secondary bond markets.
•Annualized net charge-off rates on personal loans and student loans in the thirdfirst quarter of 20232024 were 3.44% and 0.38%3.5%, respectively, which remained lower than the assumed weighted average default rates in our fair value model of 4.6% and 0.5%, respectively.4.8%. Personal loan charge-offs during the first quarter of 2024 were impacted by delinquent loan sales of $62.5 million of aggregate unpaid principal balance, a
portion of which we expect to recover in future periods. Annualized net charge-off rates on student loans in the first quarter of 2024 of 0.6% were consistent with the assumed weighted average default rates in our fair value model. Our fair value assumption for annual default rate incorporates fair value markdowns on loans beginning when they are 10 days or more delinquent, with additional markdowns at 30 days, 60 days and 90 days past due. For instance, personal loans are marked down on average 70% when the loans are 30 days past due.
The combination of these and other factors including higher in period originations, resulted in fair value gainslosses recognized on our personal loans portfolio and fair value lossesgains recognized on our student loans portfolio during the thirdfirst quarter of 2023.2024.
Student Loan Relief
In June 2023, Congress passed the Fiscal Responsibility Act of 2023 which, among other things, ended the suspension of principal and interest payments on federally-held student loans pursuant to the CARES Act passed in 2020, which became effective 60 days after June 30, 2023, as well asand prohibits the Secretary of Education from implementing any extension of any executive action or rule pursuant thereto. Additionally, in August 2022, President Biden announced relief measures forto the CARES Act. Following the end of the federal student loan borrowers, including forgiveness of $10,000 of student loans (or up to $20,000 if student loans are Pell Grants) for anyone earning less than $125,000 annually and certain changes to income-driven repayment plans for student loans (the “Biden Forgiveness Program”). Although the U.S. Supreme Court subsequently struck down the Biden Forgiveness Program,payment moratorium on August 30, 2023, President Biden indicated that, between October 1, 2023 and September 30, 2024, he would allow federal loan borrowers to not be considered delinquent if they miss a payment and that the U.S. Department of Education will not refer borrowers who fail to pay their student loan bills to credit agencies. In addition,Additionally, President Biden has announced multiple relief measures for federal student loan borrowers, despite legal challenges at the Supreme Court to certain of President Biden’s student loan forgiveness proposals. For example, the Biden Administration announced on July 14, 2023 President Biden announced that $39 billion in federal student loan debt would be eliminated to remedy mistakes of loan servicers, and that other student loan holders will have
their loans adjusted. On October 4,In the fall and winter of 2023, the Biden Administration approved anestimated that it would cancel more than $132 billion of student debt for more than three million borrowers and continue to pursue debt forgiveness strategies including through the Saving on a Valuable Education (“SAVE”) Plan which offers forgiveness after as few as 10 years of payments for borrowers who originally took out $12,000 or less for college. In February 2024, the Biden Administration announced that it will automatically discharge $1.2 billion in loans for nearly 153,000 eligible borrowers under the SAVE Plan. In March 2024, the Biden Administration announced the approval of $5.8 billion in additional 125,000 borrowers for student loan debt relief totaling anfor 77,700 borrowers made possible by the U.S. Department of Education’s Public Service Loan Forgiveness Program (“PSLF”). Most recently, on April 17, 2024, the U.S. Department of Education issued a notice of proposed rulemaking to include targeted student loan debt forgiveness to certain borrowers, including provisions under the Higher Education Act of 1965, as amended, that would provide relief for eligible borrowers of runaway interest, forgiveness of outstanding debt related to loans which entered repayment at least 20 years ago, and additional $9 billion in student debt forgiveness.provisions to facilitate relief related to income-driven repayment plans.
While we expect we may continue to see an increase in student loan refinancing volume following the end of the federal student loan payment moratorium, afterwhich occurred on August 30, 2023, as borrowers may look to refinance at a lower rate or, given the high interest rate environment, may look to extend the loan term, the timing and impact to our student loan refinancing product will largely depend on expectations regarding the introduction or implementation of additional relief measures, the interest rate environment, how competitive our student loan refinancing products are compared to our competitors and macroeconomic factors.
Consolidated Results of Operations The following table sets forth selected consolidated statements of income data:
| | | | | | Three Months Ended
September 30, | | 2023 vs 2022 | | Nine Months Ended
September 30, | | 2023 vs 2022 | | | | | | Three Months Ended
March 31, | | 2024 vs 2023 |
| ($ in thousands) | ($ in thousands) | | 2023 | | 2022 | | $ Change | | % Change | | 2023 | | 2022 | | $ Change | | % Change | ($ in thousands) | | | | | | | | | | 2024 | | 2023 | | $ Change | | % Change |
| Net interest income | Net interest income | | $ | 344,963 | | | $ | 157,850 | | | $ | 187,113 | | | 119 | % | | $ | 872,099 | | | $ | 375,512 | | | $ | 496,587 | | | 132 | % | Net interest income | | | | | | | | | | $ | 402,718 | | | $ | | $ | 236,010 | | | $ | | $ | 166,708 | | | 71 | | 71 | % |
| Total noninterest income | Total noninterest income | | 192,246 | | | 266,135 | | | (73,889) | | | (28) | | | 635,286 | | | 741,344 | | | (106,058) | | | (14) | | Total noninterest income | | | | | | | | | | 242,277 | | | 236,148 | | 236,148 | | | 6,129 | | 6,129 | | | 3 | | 3 | % |
| Total net revenue | Total net revenue | | 537,209 | | | 423,985 | | | 113,224 | | | 27 | | | 1,507,385 | | | 1,116,856 | | | 390,529 | | | 35 | | Total net revenue | | | | | | | | | | 644,995 | | | 472,158 | | 472,158 | | | 172,837 | | 172,837 | | | 37 | | 37 | % |
| Total noninterest expense | Total noninterest expense | | 804,137 | | | 498,436 | | | 305,701 | | | 61 | | | 1,859,701 | | | 1,396,628 | | | 463,073 | | | 33 | | Total noninterest expense | | | | | | | | | | 550,769 | | | 508,217 | | 508,217 | | | 42,552 | | 42,552 | | | 8 | | 8 | % |
| Loss before income taxes | | (266,928) | | | (74,451) | | | (192,477) | | | 259 | | | (352,316) | | | (279,772) | | | (72,544) | | | 26 | |
| Income tax benefit (expense) | | 244 | | | 242 | | | 2 | | | 1 | | | 3,661 | | | (629) | | | 4,290 | | | n/m |
| Net loss | | $ | (266,684) | | | $ | (74,209) | | | $ | (192,475) | | | 259 | % | | $ | (348,655) | | | $ | (280,401) | | | $ | (68,254) | | | 24 | % |
| Income (loss) before income taxes | | Income (loss) before income taxes | | | | | | | | | | 94,226 | | | (36,059) | | | 130,285 | | | n/m |
| Income tax (expense) benefit | | Income tax (expense) benefit | | | | | | | | | | (6,183) | | | 1,637 | | | (7,820) | | | n/m |
| Net income (loss) | | Net income (loss) | | | | | | | | | | $ | 88,043 | | | $ | (34,422) | | | $ | 122,465 | | | n/m |
Net Interest Income
The tablestable below presentpresents average balance and interest information for each major category of interest-earning assets and interest-bearing liabilities, along with net interest income and net interest margin.
Average Balances and Net Interest Earnings Analysis
| | Three Months Ended September 30, 2023 | | Three Months Ended September 30, 2022 |
| | Three Months Ended March 31, 2024 | | | | Three Months Ended March 31, 2024 | | Three Months Ended March 31, 2023 |
| ($ in thousands) | ($ in thousands) | | Average Balances(1) | | Interest Income/Expense | | Average Yield/Rate | | Average Balances(1) | | Interest Income/Expense | | Average Yield/Rate | ($ in thousands) | | Average Balances(1) | | Interest Income/Expense | | Average Yield/Rate | | Average Balances(1) | | Interest Income/Expense | | Average Yield/Rate |
| Assets | Assets | | | | | | | | | | | | |
| Interest-earning assets: | Interest-earning assets: | |
| Interest-earning assets: | |
| Interest-earning assets: | |
| Interest-bearing deposits with banks | |
| Interest-bearing deposits with banks | |
| Interest-bearing deposits with banks | Interest-bearing deposits with banks | | $ | 2,342,361 | | | $ | 24,485 | | | 4.15 | % | | $ | 1,067,810 | | | $ | 2,529 | | | 0.95 | % | | $ | 3,120,567 | | | $ | | $ | 37,268 | | | 4.80 | | 4.80 | % | | $ | 1,786,522 | | | $ | | $ | 8,369 | | | 1.87 | | 1.87 | % |
| Investment securities | Investment securities | | 517,786 | | | 1,838 | | | 1.41 | | | 504,365 | | | 3,097 | | | 2.46 | |
Loans(2) | | 19,996,570 | | | 537,947 | | | 10.67 | | | 9,150,847 | | | 191,525 | | | 8.37 | |
| Loans | |
| | Total interest-earning assets | |
| Total interest-earning assets | |
| Total interest-earning assets | Total interest-earning assets | | 22,856,717 | | | 564,270 | | | 9.79 | | | 10,723,022 | | | 197,151 | | | 7.35 | |
| Total noninterest-earning assets | Total noninterest-earning assets | | 3,116,217 | | | | | 3,019,934 | | | | |
| Total assets | Total assets | | $ | 25,972,934 | | | $ | 13,742,956 | | |
| Total assets | |
| Total assets | |
| Liabilities, Temporary Equity and Permanent Equity | |
| Liabilities, Temporary Equity and Permanent Equity | |
| Liabilities, Temporary Equity and Permanent Equity | Liabilities, Temporary Equity and Permanent Equity | | | | | |
| Interest-bearing liabilities: | Interest-bearing liabilities: | |
| Interest-bearing liabilities: | |
| Interest-bearing liabilities: | |
| Demand deposits | |
| Demand deposits | |
| Demand deposits | Demand deposits | | $ | 2,355,243 | | | $ | 12,837 | | | 2.16 | % | | $ | 1,982,603 | | | $ | 7,769 | | | 1.57 | % | | $ | 2,528,655 | | | $ | | $ | 11,398 | | | 1.81 | | 1.81 | % | | $ | 1,927,612 | | | $ | | $ | 12,852 | | | 2.67 | | 2.67 | % |
| Savings deposits | Savings deposits | | 9,416,236 | | | 104,375 | | | 4.40 | | | 1,453,458 | | | 6,114 | | | 1.68 | |
| Time deposits | Time deposits | | 2,244,196 | | | 28,351 | | | 5.01 | | | 354,211 | | | 266 | | | 0.30 | |
| Total interest-bearing deposits | Total interest-bearing deposits | | 14,015,675 | | | 145,563 | | | 4.12 | | | 3,790,272 | | | 14,149 | | | 1.49 | |
| Warehouse facilities | Warehouse facilities | | 3,223,333 | | | 51,257 | | | 6.31 | | | 1,523,903 | | | 12,539 | | | 3.29 | |
| Securitization debt | Securitization debt | | 724,063 | | | 9,374 | | | 5.14 | | | 487,142 | | | 4,492 | | | 3.69 | |
Other debt(3) | | 1,644,295 | | | 13,113 | | | 3.16 | | | 1,647,221 | | | 7,988 | | | 1.94 | |
Other debt(2) | |
| Total debt | Total debt | | 5,591,691 | | | 73,744 | | | 5.23 | | | 3,658,266 | | | 25,019 | | | 2.74 | |
| Residual interests classified as debt | Residual interests classified as debt | | 10,744 | | | — | | | — | | | 48,894 | | | 904 | | | 7.40 | |
| Total interest-bearing liabilities | Total interest-bearing liabilities | | 19,618,110 | | | 219,307 | | | 4.44 | | | 7,497,432 | | | 40,072 | | | 2.14 | |
| Total noninterest-bearing liabilities | Total noninterest-bearing liabilities | | 783,925 | | | | | 735,086 | | | | |
| Total liabilities | Total liabilities | | 20,402,035 | | | 8,232,518 | | |
| Total liabilities | |
| Total liabilities | |
| Total temporary equity | |
| Total temporary equity | |
| Total temporary equity | Total temporary equity | | 320,374 | | | 320,374 | | |
| Total permanent equity | Total permanent equity | | 5,250,525 | | | 5,190,064 | | |
| Total permanent equity | |
| Total permanent equity | |
| Total liabilities, temporary equity and permanent equity | |
| Total liabilities, temporary equity and permanent equity | |
| Total liabilities, temporary equity and permanent equity | Total liabilities, temporary equity and permanent equity | | $ | 25,972,934 | | | $ | 13,742,956 | | |
| Net interest income(4) | | $ | 344,963 | | | $ | 157,079 | | |
Net interest margin(5) | | | | 5.99 | % | | | | 5.86 | % |
Net interest income(3) | |
| Net interest income(3) | |
| Net interest income(3) | |
Net interest margin(4) | |
Net interest margin(4) | |
Net interest margin(4) | | | | | | | 5.91 | % | | | | | | 5.48 | % |
(1)Average balances were calculated on daily carrying balances for the 20232024 period and on four-month ending carrying balances for the 20222023 period, as the daily analysis in the prior period would have involved undue burden. Both average calculations are representative of our operations.
(2)Interest income on loans measured at amortized cost for the 2022 period includes amortization of deferred loan fees, net of deferred loan costs, which were not material.
(3)Interest expense on other debt primarily includes debt issuance and discount expense, as well as interest expense on the revolving credit facility.
(4)(3)Net interest income is calculated as the excess of total interest income on interest-earning assets over total interest expense on interest-bearing liabilities.
(5)Net interest margin is calculated as net interest income divided by total average interest-earning assets.
| | | | | | | | | | | | | | | | | | | | | | | | | | | | | | | | | | | | | | |
| | Nine Months Ended September 30, 2023 | | Nine Months Ended September 30, 2022 |
| ($ in thousands) | | Average Balances(1) | | Interest Income/Expense | | Average Yield/Rate | | Average Balances(1) | | Interest Income/Expense | | Average Yield/Rate |
| Assets | | | | | | | | | | | | |
| Interest-earning assets: | | | | | | | | | | | | |
| Interest-bearing deposits with banks | | $ | 1,973,892 | | | $ | 57,094 | | | 3.87 | % | | $ | 1,168,934 | | | $ | 3,930 | | | 0.45 | % |
| Investment securities | | 486,931 | | | 11,259 | | | 3.09 | | | 521,027 | | | 9,107 | | | 2.33 | |
Loans(2) | | 17,520,517 | | | 1,337,476 | | | 10.21 | | | 8,007,445 | | | 451,247 | | | 7.51 | |
| | | | | | | | | | | | |
| Total interest-earning assets | | 19,981,340 | | | 1,405,829 | | | 9.41 | | | 9,697,406 | | | 464,284 | | | 6.38 | |
| Total noninterest-earning assets | | 3,140,883 | | | | | | | 2,614,678 | | | | | |
| Total assets | | $ | 23,122,223 | | | | | | | $ | 12,312,084 | | | | | |
| Liabilities, Temporary Equity and Permanent Equity | | | | | | | | | | | | |
| Interest-bearing liabilities: | | | | | | | | | | | | |
| Demand deposits | | $ | 2,100,866 | | | $ | 38,611 | | | 2.46 | % | | $ | 1,146,498 | | | $ | 10,696 | | | 1.24 | % |
| Savings deposits | | 7,409,745 | | | 225,649 | | | 4.07 | | | 761,377 | | | 8,130 | | | 1.42 | |
| Time deposits | | 1,701,417 | | | 60,948 | | | 4.79 | | | 148,299 | | | 297 | | | 0.27 | |
| Total interest-bearing deposits | | 11,212,028 | | | 325,208 | | | 3.88 | | | 2,056,174 | | | 19,123 | | | 1.24 | |
| Warehouse facilities | | 3,093,592 | | | 139,513 | | | 6.03 | | | 2,076,242 | | | 32,159 | | | 2.07 | |
| Securitization debt | | 823,457 | | | 30,570 | | | 4.96 | | | 553,790 | | | 15,229 | | | 3.67 | |
Other debt(3) | | 1,644,427 | | | 38,298 | | | 3.11 | | | 1,644,414 | | | 19,670 | | | 1.59 | |
| Total debt | | 5,561,476 | | | 208,381 | | | 5.01 | | | 4,274,446 | | | 67,058 | | | 2.09 | |
| Residual interests classified as debt | | 13,334 | | | 141 | | | 1.41 | | | 64,681 | | | 3,469 | | | 7.15 | |
| Total interest-bearing liabilities | | 16,786,838 | | | 533,730 | | | 4.25 | | | 6,395,301 | | | 89,650 | | | 1.87 | |
| Total noninterest-bearing liabilities | | 754,024 | | | | | | | 639,926 | | | | | |
| Total liabilities | | 17,540,862 | | | | | | | 7,035,227 | | | | | |
| Total temporary equity | | 320,374 | | | | | | | 320,374 | | | | | |
| Total permanent equity | | 5,260,987 | | | | | | | 4,956,483 | | | | | |
| Total liabilities, temporary equity and permanent equity | | $ | 23,122,223 | | | | | | | $ | 12,312,084 | | | | | |
| | | | | | | | | | | | |
Net interest income(4) | | | | $ | 872,099 | | | | | | | $ | 374,634 | | | |
Net interest margin(5) | | | | | | 5.84 | % | | | | | | 5.15 | % |
__________________(1)Average balances were calculated on daily carrying balances for the 2023 period and on ten-month ending carrying balances for the 2022 period, as the daily analysis in the prior period would have involved undue burden. Both average calculations are representative of our operations.
(2)Interest income on loans measured at amortized cost for the 2022 period includes amortization of deferred loan fees, net of deferred loan costs, which were not material.
(3)Interest expense on other debt primarily includes debt issuance and discount expense, as well as interest expense on the revolving credit facility.
(4)Net interest income is calculated as the excess of total interest income on interest-earning assets over total interest expense on interest-bearing liabilities.
(5)Net interest margin is calculated as net interest income divided by total average interest-earning assets.
For the three months ended September 30, 2023March 31, 2024 compared to the three months ended September 30, 2022,March 31, 2023, net interest income increased by $187.1$166.7 million, or 119%71%, and net interest margin increased by 1343 basis points. For the nine months ended September 30, 2023 compared to the nine months ended September 30, 2022, net interest incomeAverage interest-earning assets increased by $496.6 million, or 132%59%, and net interest marginaverage yields increased by 69114 basis points. The increases were primarily driven by (i) higher interest income from (i) personal loans, which was primarily a function of increases in the average balance and origination volume, as well as longer loan holding periods for both personal and student loans, and (ii) interest-bearing deposits with banks, which reflected our strong liquidity position in a rising interest rate environment. Average interest-earning assets increasedenvironment, and (iii) lower interest expense on warehouse facilities and securitizations primarily attributable to lower average balances, which is reflective of our continued funding mix towards deposit funding, and partially offset by 113% and 106% duringhigher interest rates incurred on our facilities which is reflective of the three and nine-month periods, respectively, and average yields increased by 244 and 303 basis points, respectively.
higher interest rate environment year over year. These increasesitems were partially offset by higher interest expense on deposits attributable to a higher average balance and higher interest rates offered to our members, and higher interest expense on warehouse facilities attributable to a higher average balance and higher interest rates incurred on our facilities, all of which are reflective of the higher interest rate environment year over year.members.
Analysis of Changes in Net Interest Income
The following table presents period-over-period changes in net interest income and the extent to which the variances are attributable to changes in the volume of our interest-earning assets and interest-bearing liabilities or changes in the interest rates related to these assets and liabilities:
| | Three Months Ended September 30, | | Nine Months Ended September 30, |
| 2023 vs. 2022 | | 2023 vs. 2022 |
| Increase (Decrease) Due to Change in(1): | | Increase (Decrease) Due to Change in(1): |
| | | | Three Months Ended March 31, | |
| | | | Three Months Ended March 31, | |
| | | | Three Months Ended March 31, | |
| | | | 2024 vs. 2023 | | | | | | 2024 vs. 2023 |
| | | | Increase (Decrease) Due to Change in(1): | | | | | | Increase (Decrease) Due to Change in(1): |
| ($ in thousands) | ($ in thousands) | | Volume | | Rate | | Total Variance | | Volume | | Rate | | Total Variance | ($ in thousands) | | | | | | | | Volume | | Rate | | Total Variance |
| Interest income: | Interest income: | | | | | | | | | | | | |
| Interest-bearing deposits with banks | |
| Interest-bearing deposits with banks | |
| Interest-bearing deposits with banks | Interest-bearing deposits with banks | | $ | 13,324 | | | $ | 8,632 | | | $ | 21,956 | | | $ | 23,283 | | | $ | 29,881 | | | $ | 53,164 | |
| Investment securities | Investment securities | | 47 | | | (1,306) | | | (1,259) | | | (789) | | | 2,941 | | | 2,152 | |
| Loans | Loans | | 291,771 | | | 54,651 | | | 346,422 | | | 726,206 | | | 160,023 | | | 886,229 | |
| Total interest income | Total interest income | | 305,142 | | | 61,977 | | | 367,119 | | | 748,700 | | | 192,845 | | | 941,545 | |
Total interest income | |
Total interest income | |
| Interest expense: | Interest expense: | | | | | | | | | | | | |
| Interest-bearing deposits | |
| Interest-bearing deposits | |
| Interest-bearing deposits | Interest-bearing deposits | | 106,198 | | | 25,216 | | | 131,414 | | | 265,568 | | | 40,517 | | | 306,085 | |
| Debt | Debt | | 25,498 | | | 23,227 | | | 48,725 | | | 48,223 | | | 93,100 | | | 141,323 | |
| Residual interests classified as debt | Residual interests classified as debt | | — | | | (904) | | | (904) | | | (544) | | | (2,784) | | | (3,328) | |
Total interest expense | Total interest expense | | 131,696 | | | 47,539 | | | 179,235 | | | 313,247 | | | 130,833 | | | 444,080 | |
Net interest income | Net interest income | | $ | 173,446 | | | $ | 14,438 | | | $ | 187,884 | | | $ | 435,453 | | | $ | 62,012 | | | $ | 497,465 | |
(1)We calculate the changes in interest income and interest expense separately for each item. Volume and rate changes have been allocated on a consistent basis using the respective percentage changes in average balances and average rates.
Noninterest Income and Net Revenue
The following table presents the components of our total noninterest income, as well as total net revenue:
| | | | | | Three Months Ended
September 30, | | 2023 vs 2022 | | Nine Months Ended
September 30, | | 2023 vs 2022 | | | | | | Three Months Ended
March 31, | | 2024 vs 2023 |
| ($ in thousands) | ($ in thousands) | | 2023 | | 2022 | | $ Change | | % Change | | 2023 | | 2022 | | $ Change | | % Change | ($ in thousands) | | | | | | | | | | 2024 | | 2023 | | $ Change | | % Change |
| Loan origination and sales | | $ | 81,683 | | | $ | 163,697 | | | $ | (82,014) | | | (50) | % | | $ | 311,258 | | | $ | 465,815 | | | $ | (154,557) | | | (33) | % |
| Securitizations | | (6,298) | | | (8,772) | | | 2,474 | | | (28) | | | (22,375) | | | (31,790) | | | 9,415 | | | (30) | |
| Loan origination, sales, and securitizations | | Loan origination, sales, and securitizations | | | | | | | | | | $ | 57,000 | | | $ | 123,334 | | | $ | (66,334) | | | (54) | % |
| Servicing | Servicing | | 8,009 | | | 7,296 | | | 713 | | | 10 | | | 29,803 | | | 30,003 | | | (200) | | | (1) | | Servicing | | | | | | | | | | 6,974 | | | 12,742 | | 12,742 | | | (5,768) | | (5,768) | | | (45) | | (45) | % |
| Technology products and solutions | Technology products and solutions | | 81,856 | | | 82,035 | | | (179) | | | — | | | 236,946 | | | 223,562 | | | 13,384 | | | 6 | | Technology products and solutions | | | | | | | | | | 85,672 | | | 72,801 | | 72,801 | | | 12,871 | | 12,871 | | | 18 | | 18 | % |
| Other | Other | | 26,996 | | | 21,879 | | | 5,117 | | | 23 | | | 79,654 | | | 53,754 | | | 25,900 | | | 48 | | Other | | | | | | | | | | 92,631 | | | 27,271 | | 27,271 | | | 65,360 | | 65,360 | | | 240 | | 240 | % |
Total noninterest income | Total noninterest income | | $ | 192,246 | | | $ | 266,135 | | | $ | (73,889) | | | (28) | | | $ | 635,286 | | | $ | 741,344 | | | $ | (106,058) | | | (14) | | Total noninterest income | | | | | | | | | | $ | 242,277 | | | $ | | $ | 236,148 | | | $ | | $ | 6,129 | | | 3 | | 3 | % |
Total net revenue | Total net revenue | | $ | 537,209 | | | $ | 423,985 | | | $ | 113,224 | | | 27 | % | | $ | 1,507,385 | | | $ | 1,116,856 | | | $ | 390,529 | | | 35 | % | Total net revenue | | | | | | | | | | $ | 644,995 | | | $ | | $ | 472,158 | | | $ | | $ | 172,837 | | | 37 | | 37 | % |
Three Months. Total noninterest income decreasedincreased by $73.9$6.1 million, or 28%3%, for the three months ended September 30, 2023March 31, 2024 compared to the three months ended September 30, 2022, whichMarch 31, 2023. The increase was primarily attributable to: (i) higher loan write-offs in the 2023 period, (ii) the net effectgain on extinguishment of lower income related to in-period originations, loan sale execution and fair value adjustments on loans, which were primarily impacted by higher benchmark rates, higher personal loan origination volume and longer loan holding periods, as well as lower gains on loan hedging activities due to smaller increases in interest ratesdebt of $59.2 million during the 20232024 period, (iii)(ii) higher origination fees primarily related to a new product feature offered on personal loans, whereby a borrower may optionally elect to pay origination fees to qualify for a lower annual percentage rate, and (iv)(iii) growth in technology services fees driven by account growth, as well as increased interchangeprocessing and brokerage revenue.service arrangement activity among our integrated technology solutions clients.
Nine Months. Total noninterest income decreased by $106.1 million, or 14%, for the nine months ended September 30, 2023 compared to the nine months ended September 30, 2022, which was primarily attributable to:These increases were partially offset by: (i) higher loan write-offs in the 20232024 period, primarily driven by longer loan holding periods and elevated charge off rates, and (ii) the net effect of lower gains in the 2024 period compared to losses in the 2023 period on student loan, hedging activities duepersonal loan and risk retention interest rate swap positions primarily driven by increases in interest rates during the 2024 period compared to smaller increasesdecreases in interest rates during the 2023 period, partially offset by higher income related to in period originations, loan sale execution and fair value adjustmentslosses on personal loans in the 2024 period compared to gains during the 2023 period, which were primarily impacted by higher personal loan origination volumeprepayment rate, discount rate and default rate assumptions, and lower fair value gains on student loan prepaymentloans in the 2024 period, which were primarily impacted by higher unpaid principal balance.
assumptions, (iii) higher origination fees primarily related to a new product feature offered on personal loans, whereby a borrower may optionally elect to pay origination fees to qualify for a lower annual percentage rate, (iv) improved securitizations income driven by a positive variance in our securitization bond fair values, and an increase in securitization loan fair market values primarily associated with a consolidated securitization transaction in the first quarter of 2023, partially offset by lower gains in the 2023 period on risk retention hedge activities, (v) growth in technology products and solutions fees largely driven by revenue contribution from Technisys for the full period in 2023, and (vi) increased interchange revenue.
Noninterest Expense
The following table presents the components of our total noninterest expense:
| | | | | | Three Months Ended
September 30, | | 2023 vs 2022 | | Nine Months Ended
September 30, | | 2023 vs 2022 | | | | | | Three Months Ended
March 31, | | 2024 vs 2023 |
| ($ in thousands) | ($ in thousands) | | 2023 | | 2022 | | $ Change | | % Change | | 2023 | | 2022 | | $ Change | | % Change | ($ in thousands) | | | | | | | | | | 2024 | | 2023 | | $ Change | | % Change |
| Technology and product development | Technology and product development | | $ | 125,698 | | | $ | 110,702 | | | $ | 14,996 | | | 14 | % | | $ | 369,602 | | | $ | 291,976 | | | $ | 77,626 | | | 27 | % | Technology and product development | | | | | | | | | | $ | 130,920 | | | $ | | $ | 117,059 | | | $ | | $ | 13,861 | | | 12 | | 12 | % |
| Sales and marketing | Sales and marketing | | 186,719 | | | 162,129 | | | 24,590 | | | 15 | | | 544,695 | | | 444,121 | | | 100,574 | | | 23 | | Sales and marketing | | | | | | | | | | 167,366 | | | 175,154 | | 175,154 | | | (7,788) | | (7,788) | | | (4) | | (4) | % |
| Cost of operations | Cost of operations | | 98,258 | | | 83,083 | | | 15,175 | | | 18 | | | 276,051 | | | 232,611 | | | 43,440 | | | 19 | | Cost of operations | | | | | | | | | | 100,061 | | | 83,908 | | 83,908 | | | 16,153 | | 16,153 | | | 19 | | 19 | % |
| General and administrative | General and administrative | | 124,457 | | | 126,199 | | | (1,742) | | | (1) | | | 379,326 | | | 388,533 | | | (9,207) | | | (2) | | General and administrative | | | | | | | | | | 145,240 | | | 123,689 | | 123,689 | | | 21,551 | | 21,551 | | | 17 | | 17 | % |
| Goodwill impairment | | 247,174 | | | — | | | 247,174 | | | n/m | | 247,174 | | | — | | | 247,174 | | | n/m |
| | Provision for credit losses | |
| Provision for credit losses | |
| Provision for credit losses | Provision for credit losses | | 21,831 | | | 16,323 | | | 5,508 | | | 34 | | | 42,853 | | | 39,387 | | | 3,466 | | | 9 | | | | | | | | | | | 7,182 | | | 8,407 | | 8,407 | | | (1,225) | | (1,225) | | | (15) | | (15) | % |
Total noninterest expense | Total noninterest expense | | $ | 804,137 | | | $ | 498,436 | | | $ | 305,701 | | | 61 | % | | $ | 1,859,701 | | | $ | 1,396,628 | | | $ | 463,073 | | | 33 | % | Total noninterest expense | | | | | | | | | | $ | 550,769 | | | $ | | $ | 508,217 | | | $ | | $ | 42,552 | | | 8 | | 8 | % |
Three Months. Total noninterest expense increased by $305.7$42.6 million, or 61%8%, for the three months ended September 30, 2023March 31, 2024 compared to the three months ended September 30, 2022,March 31, 2023, primarily driven by: (i) goodwill impairment expense related to the Galileo and Technisys reporting units, further discussed within “Critical Accounting Policies and Estimates—Goodwill”,(ii) increases in utilization of lead generation channels, advertising and marketing expenditures and direct member incentives, and (iii) increased amortization of purchased and internally-developed software, and in tools and subscriptions costs, reflective of continued investments in technology.
Nine Months. Total noninterest expense increased by $463.1 million, or 33%, for the nine months ended September 30, 2023 compared to the nine months ended September 30, 2022, primarily driven by: (i) goodwill impairment expense related to the Galileo and Technisys reporting units, further discussed within “Critical Accounting Policies and Estimates—Goodwill”,technology, (ii) increases in direct member incentives, advertising and marketing expenditures, utilization(iii) an increase in product fulfillment costs, which included debit card fulfillment services, primarily related to our SoFi Money product, as well as payment processing network association fees associated with increased activity on our technology platform, and (iv) amortization of lead generation channels and direct member incentives, (iii) higherpremiums on a credit default swap related to our student loans during the 2024 period. This increase was partially offset by decreased employee compensation and benefits, which was attributable to decreases in share-based compensation expense, partially offset by increases in headcount and salary and the inclusion of Technisys for the full 2023 period compared to a partial period in 2022, related to support of our growth and impacts of the inflationary environment, as well as restructuring charges during the first quarter of 2023 and partially offset by decreases in share-based compensation expense, (iv) increased amortization of purchased and internally-developed software, and in tools and subscriptions costs, reflective of continued investments in technology, and (v) increases in amortization of intangible assets primarily due to acquired intangible assets in the Technisys Merger and Wyndham acquisition. These increases were partially offset by the absence of transaction expenses that were incurred in the 2022 period related to our acquisition of Technisys.
SoFi Technologies, Inc.
2023.Provision for Credit Losses
Analysis of Allowance for Credit Losses
Allowance for Credit Losses Ratios
The following table presents the ratio of allowance for credit losses to total loans outstanding that are measured at amortized cost:
| | ($ in thousands) | ($ in thousands) | | September 30, 2023 | | September 30, 2022 | ($ in thousands) | | March 31, 2024 | | March 31, 2023 |
| Allowance for credit losses to total loans outstanding | Allowance for credit losses to total loans outstanding | | | | |
| Allowance for credit losses | Allowance for credit losses | | $ | 51,923 | | | $ | 34,370 | |
Total loans held for investment outstanding(1) | | $ | 407,693 | | | $ | 310,527 | |
| Allowance for credit losses | |
| Allowance for credit losses | |
Loans held for investment, at amortized cost(1) | |
Ratio(2) | Ratio(2) | | 12.74 | % | | 11.07 | % | Ratio(2) | | 3.96 | % | | 10.75 | % |
|
(1)Total loansLoans outstanding balance excludes accrued interest.
(2)The increasedecrease in the ratio was primarily attributable to senior secured loans, for which we did not recognize an allowance for credit losses, partially offset by credit cards, andwhich was primarily reflective of an increase in the average balance combined with elevatedtotal balances and associated loss rates.reserves.
We omitted the credit ratios associated with nonaccrual loans, as the balance of nonaccrual loans was immaterial.
Allocation of Allowance for Credit Losses
The following table presents the allocation of the allowance for credit losses and the percentage of loans outstanding by category to total loans outstanding that are measured at amortized cost:
| | September 30, 2023 | | September 30, 2022 |
| | March 31, 2024 | | | | March 31, 2024 | | March 31, 2023 |
| ($ in thousands) | ($ in thousands) | | Allowance for credit losses | | Percent of loans to total loans(1) | | Allowance for credit losses | | Percent of loans to total loans(1) | ($ in thousands) | | Allowance for credit losses | | Percent of loans to total loans(1) | | Allowance for credit losses | | Percent of loans to total loans(1) |
| Credit card | Credit card | | $ | 50,055 | | | 72 | % | | $ | 32,960 | | | 70 | % | Credit card | | $ | 49,092 | | | 24 | | 24 | % | | $ | 37,089 | | | 69 | | 69 | % |
| Commercial and consumer banking | Commercial and consumer banking | | 1,868 | | | 28 | | | 1,410 | | | 30 | |
Senior secured loans(2) | |
| Total | Total | | $ | 51,923 | | | 100 | % | | $ | 34,370 | | | 100 | % | Total | | $ | 51,313 | | | 100 | | 100 | % | | $ | 38,937 | | | 100 | | 100 | % |
(1)Loans outstanding balances used in the calculation exclude accrued interest.
(2)For the periods presented, we did not recognize an allowance for credit losses on senior secured loans, as we determined that our expected exposure to credit losses was immaterial.
Analysis of Charge-offs
The following tables presenttable presents information regarding average loans outstanding, net charge-offs and the annualized ratio of net charge-offs to average loans outstanding:
| | | Three Months Ended September 30, 2023 | | Three Months Ended September 30, 2022 |
| | | Three Months Ended March 31, 2024 | |
| | | Three Months Ended March 31, 2024 | |
| | | Three Months Ended March 31, 2024 | | | Three Months Ended March 31, 2023 |
| ($ in thousands) | ($ in thousands) | | Average Loans(1) | | Net Charge-offs(2) | | Ratio | | Average Loans(1) | | Net Charge-offs(2) | | Ratio | ($ in thousands) | | Average Loans(1) | | Net Charge-offs(2) | | Ratio | | Average Loans(1) | | Net Charge-offs(2) | | Ratio |
| Personal loans | Personal loans | | $ | 13,895,181 | | | $ | 120,372 | | | 3.44 | % | | $ | 4,914,715 | | | $ | 23,961 | | | 1.95 | % | Personal loans | | $ | 15,664,935 | | | $ | | $ | 134,387 | | | 3.45 | | 3.45 | % | | $ | 9,560,160 | | | $ | | $ | 71,069 | | | 2.97 | | 2.97 | % |
| Student loans | Student loans | | 5,662,842 | | | 5,432 | | | 0.38 | | | 3,837,742 | | | 3,169 | | | 0.33 | |
| Home loans | Home loans | | 80,614 | | | — | | | — | | | 131,067 | | | — | | | — | |
Credit card(3) | | 247,694 | | | 11,127 | | | 17.82 | | | 182,490 | | | 5,133 | | | 11.25 | |
| Senior secured loans | |
| Credit card | |
| Commercial and consumer banking | Commercial and consumer banking | | 110,239 | | | 8 | | | 0.03 | | | 84,833 | | | (5) | | | n/m |
| Total loans | Total loans | | $ | 19,996,570 | | | $ | 136,939 | | | 2.72 | % | | $ | 9,150,847 | | | $ | 32,258 | | | 1.41 | % | Total loans | | $ | 23,540,252 | | | $ | | $ | 155,368 | | | 2.65 | | 2.65 | % | | $ | 15,015,721 | | | $ | | $ | 85,623 | | | 2.28 | | 2.28 | % |
| | Nine Months Ended September 30, 2023 | | Nine Months Ended September 30, 2022 |
| ($ in thousands) | | Average Loans(1) | | Net Charge-offs(2) | | Ratio | | Average Loans(1) | | Net Charge-offs(2) | | Ratio |
| Personal loans | | $ | 11,731,420 | | | $ | 278,778 | | | 3.18 | % | | $ | 3,790,432 | | | $ | 42,412 | | | 1.49 | % |
| Student loans | | 5,375,562 | | | 15,432 | | | 0.38 | | | 3,844,797 | | | 8,470 | | | 0.29 | |
| Home loans | | 75,002 | | | — | | | — | | | 149,461 | | | — | | | — | |
Credit card(3) | | 230,849 | | | 31,713 | | | 18.37 | | | 156,295 | | | 12,438 | | | 10.61 | |
| Commercial and consumer banking | | 107,684 | | | 5 | | | 0.01 | | | 66,460 | | | (4) | | | n/m |
| Total loans | | $ | 17,520,517 | | | $ | 325,928 | | | 2.49 | % | | $ | 8,007,445 | | | $ | 63,316 | | | 1.05 | % |
(1)Average balances were calculated on daily carrying balances for the 2023 periods2024 period and on four-month or ten-month ending carrying balances for the 2022 periods,2023 period, as the daily analysis in the prior period would have involved undue burden. Both average calculations are representative of our operations.
(2)Net charge-offs include both credit- and certain non-credit-related charge-offs.
(3)The increase in the net charge-off rate associated with credit card was primarily related to our maturing portfolio.
The provision for credit losses for the three and nine months ended September 30, 2023 increasedMarch 31, 2024 decreased by $5.5$1.2 million, or 34%15%, and $3.5 million, or 9%, respectively, compared to the same periodsperiod in 2022.2023. The increasedecrease during the three-month period was primarily related to growthimprovement in total credit card balances.delinquency rates.
Income Taxes
For the three and nine months ended September 30,March 31, 2024 and 2023, we recorded income tax (expense) benefit of $0.2$(6.2) million and $3.7$1.6 million, respectively. For the three and nine months ended September 30, 2022, we recordedOur income tax benefit (expense) of $0.2 millionpositions in both the 2024 and $(0.6) million, respectively. Income taxes2023 periods were primarily attributable toimpacted by income tax expenseexpenses associated with the profitability of SoFi Bank in state jurisdictions where separate filings are required. Forrequired, as well as federal taxes where our tax credits and loss carryforwards may be limited. Our income tax benefit position in the three and nine month 2023 periods, this expenseperiod was more than offset byprimarily attributable to income tax benefits from foreign losses in jurisdictions with net deferred tax liabilities related to Technisys.
Valuation allowances are established when necessary to reduce deferred tax assets to the amounts that are more likely than not expected to be realized. In making such a determination of whether a valuation allowance is necessary, the Company considers all available positive and negative evidence supporting the allowance (e.g., the results of recent operations and future forecasts). If the Company determines that it is able to realize its deferred tax assets in the future in excess of the net recorded amount, the Company decreases the deferred tax asset valuation allowance, which reduces the provision for income taxes. Such a potential benefit has not been included in our guidance.
Summary Results by Segment Contribution profit (loss) is the primary measure of segment-level profit and loss that, along with our key business metrics, is used by management to evaluate our business, measure our performance, identify trends and make strategic decisions. Contribution profit (loss) is defined as total net revenue for each reportable segment less expenses directly attributable to the reportable segment and, in the case of our Lending segment, adjusted for fair value adjustments attributable to assumption changes associated with our servicing rights and residual interests classified as debt. See the sections entitled “Consolidated Results of Operations”, “Summary Results by Segment” and “Non-GAAP Financial Measures” for discussion and analysis of these key financial measures.
Lending Segment
In the table below, we present certain metrics related to our Lending segment:
| | Three Months Ended
September 30, | | 2023 vs 2022 | | Nine Months Ended
September 30, | | 2023 vs 2022 |
| | | | | | Three Months Ended
March 31, | |
| | | | | | Three Months Ended
March 31, | |
| | | | | | Three Months Ended
March 31, | | | 2024 vs 2023 |
| Metric | Metric | | 2023 | | 2022 | | $ Change | | % Change | | 2023 | | 2022 | | Change | | % Change | Metric | | | | | | | | | | 2024 | | 2023 | | Change | | % Change |
| Total products (number, as of period end) | Total products (number, as of period end) | | 1,593,906 | | | 1,280,493 | | | 313,413 | | | 24 | % | | 1,593,906 | | | 1,280,493 | | | 313,413 | | | 24 | % | Total products (number, as of period end) | | | | | | | | | | 1,705,155 | | | 1,416,122 | | 1,416,122 | | | 289,033 | | 289,033 | | | 20 | | 20 | % |
| Origination volume ($ in thousands, during period) | Origination volume ($ in thousands, during period) | |
| Personal loans | |
| Personal loans | |
| Personal loans | Personal loans | | $ | 3,885,967 | | | $ | 2,809,759 | | | $ | 1,076,208 | | | 38 | % | | $ | 10,578,306 | | | $ | 7,307,612 | | | $ | 3,270,694 | | | 45 | % | | | | | | | | | | $ | 3,278,882 | | | $ | | $ | 2,951,358 | | | $ | | $ | 327,524 | | | 11 | | 11 | % |
| Student loans | Student loans | | 919,330 | | | 457,184 | | | 462,146 | | | 101 | | | 1,840,070 | | | 1,839,710 | | | 360 | | | — | | Student loans | | | | | | | | | | 751,680 | | | 525,373 | | 525,373 | | | 226,307 | | 226,307 | | | 43 | | 43 | % |
| Home loans | Home loans | | 355,698 | | | 216,246 | | | 139,452 | | | 64 | | | 688,608 | | | 860,676 | | | (172,068) | | | (20) | | Home loans | | | | | | | | | | 336,148 | | | 89,787 | | 89,787 | | | 246,361 | | 246,361 | | | 274 | | 274 | % |
| Total | Total | | $ | 5,160,995 | | | $ | 3,483,189 | | | $ | 1,677,806 | | | 48 | % | | $ | 13,106,984 | | | $ | 10,007,998 | | | $ | 3,098,986 | | | 31 | % | Total |
| | | | | | | | | $ | 4,366,710 | |
|
| $ | 3,566,518 | |
|
| $ | 800,192 | |
|
| 22 | % |
Loans with a balance (number, as of period end)(1) | Loans with a balance (number, as of period end)(1) | | 967,851 | | | 717,148 | | | 250,703 | | | 35 | % | | 967,851 | | | 717,148 | | | 250,703 | | | 35 | % | Loans with a balance (number, as of period end)(1) | | | | | | | | | | 1,039,446 | | | 801,110 | | 801,110 | | | 238,336 | | 238,336 | | | 30 | | 30 | % |
Average loan balance ($, as of period end)(1) | Average loan balance ($, as of period end)(1) | |
| Personal loans | Personal loans | | $ | 24,221 | | | $ | 24,772 | | | $ | (551) | | | (2) | % | | $ | 24,221 | | | $ | 24,772 | | | $ | (551) | | | (2) | % |
| Personal loans | |
| Personal loans | | | | | | | | | | | $ | 24,259 | | | $ | 25,008 | | | $ | (749) | | | (3) | % |
Student loans(2) | Student loans(2) | | 44,828 | | | 47,152 | | | (2,324) | | | (5) | | | 44,828 | | | 47,152 | | | (2,324) | | | (5) | | Student loans(2) | | | | | | | | | | 44,448 | | | 46,106 | | 46,106 | | | (1,658) | | (1,658) | | | (4) | | (4) | % |
| Home loans | Home loans | | 285,773 | | | 286,855 | | | (1,082) | | | — | | | 285,773 | | | 286,855 | | | (1,082) | | | — | | Home loans | | | | | | | | | | 282,917 | | | 283,579 | | 283,579 | | | (662) | | (662) | | | — | | — | % |
__________________
(1)Loans with a balance and average loan balance include loans on our balance sheet, as well as transferred loans and referred loans with which we have a continuing involvement through our servicing agreements.
(2)In-school loans carry a lower average balance than student loan refinancing products.
Total Products
Total products in our Lending segment is a subset of our total products metric. See “Key Business Metrics” for further discussion of this measure as it relates to our Lending segment.
Origination Volume
We refer to the aggregate dollar amount of loans originated through our platform in a given period as origination volume. Origination volume is an indicator of the size and health of our Lending segment and an indicator (together with the relevant loan characteristics, such as interest rate and prepayment and default expectations) of revenues and profitability. Changes in origination volume are driven by the addition of new members and existing members, the latter of which at times will either refinance into a new SoFi loan or secure an additional, concurrent loan, as well as macroeconomic factors impacting consumer spending and borrowing behavior. Since the profitability of the Lending segment is largely correlated with origination volume, management relies on origination volume trends to assess the need for external financing to support the Financial Services segment and the expense budgets for unallocated expenses.
Personal Loans. During the three and nine months ended September 30, 2023,March 31, 2024, personal loan origination volume increased significantly relative to the corresponding 2022 periods,2023 period, primarily due to increased demand driven by expanded marketing efforts and increased demand for debt consolidation products in a rising interest rate environment.environment during 2023 that has persisted into 2024.
Student Loans. During the three months ended September 30, 2023,March 31, 2024, student loan origination volume increased significantly relative to the corresponding 20222023 period, as demand for student loan refinancing products increased ahead ofafter the resumption of principal and interest payments on federally-held student loans as borrowers looklooked to refinance at a lower rate or, given the high interest rate environment, to extend the loan term. During the nine months ended September 30, 2023,Demand for student loan origination volume remained flat relative torefinancing products during the corresponding 2022 period, primarily due toprior year was affected by the unfavorable impact of the suspension of principal and interest payments on federally-held student loans through August 30, 2023 and the expectation of debt cancellation for certain federal student loan borrowers which was struck down by the U.S. Supreme Court in June 2023, combined with a continued rising interest rate environment in 2023. See “Key Factors Affecting Operating Results—Student Loan Relief” for additional discussion of student loans.
Home Loans. During the three months ended September 30, 2023,March 31, 2024, home loan origination volume increased significantly relative to the corresponding 2022 period2023 period. Our home loan origination volume increased notably beginning in the second quarter of 2023, aided by the increased capacity and capabilities subsequent to our acquisition of Wyndham. During the nine months ended September 30, 2023, home loan origination volume decreased significantly relative to the corresponding 2022 period due to continuedThis was partially offset by rising interest rates through 2023, which tends to lower demand for home loans overall and shift demand from refinance originations to purchase originations, the latter of which is a more competitive landscape. Although purchase originations historically represented a smaller percentage of our home loan originations, our mix during the 2023 period has shiftedcontinued to shift toward more purchase originations, which we would expect to continue under similar macroeconomic conditions. Our home loan origination volume increased notably in the second and third quarters of 2023 compared to the first quarter of 2023, aided by the increased capacity and capabilities subsequent to our acquisition of Wyndham, which we expect to continue to provide benefits during the remainder of the year.
Loans with a Balance and Average Loan Balance
Loans with a balance refers to the number of loans that have a balance greater than zero dollars as of the reporting date. Loans with a balance allows management to better understand the unit economics of acquiring a loan in relation to the lifetime value of that loan. Average loan balance is defined as the total unpaid principal balance of the loans divided by loans with a balance within the respective loan product category as of the reporting date. Average loan balance tends to fluctuate based on the pace of loan originations relative to loan repayments and the initial loan origination size.
In the table below, we present additional information related to our lending products:
| | Three Months Ended September 30, | | Nine Months Ended September 30, |
| | | | Three Months Ended March 31, | |
| | | | Three Months Ended March 31, | |
| | | | Three Months Ended March 31, | |
| ($ in thousands) | ($ in thousands) | | 2023 | | 2022 | | 2023 | | 2022 | ($ in thousands) | | | | | | 2024 | | 2023 |
Overall weighted average origination FICO | Overall weighted average origination FICO | | 751 | | | 749 | | | 750 | | | 752 | |
| Personal Loans | Personal Loans | |
| Weighted average origination FICO | |
| Weighted average origination FICO | |
| Weighted average origination FICO | Weighted average origination FICO | | 744 | | | 746 | | | 745 | | | 747 | |
Weighted average interest rate earned(1) | Weighted average interest rate earned(1) | | 13.57 | % | | 12.22 | % | | 13.20 | % | | 11.65 | % | Weighted average interest rate earned(1) | | | | | | 13.65 | % | | 12.56 | % |
| Interest income recognized | Interest income recognized | | $ | 452,771 | | | $ | 143,757 | | | $ | 1,103,979 | | | $ | 317,342 | |
| Sales of loans | Sales of loans | | $ | 15,006 | | | $ | 749,648 | | | $ | 65,019 | | | $ | 2,851,466 | |
| Student Loans | Student Loans | |
| Weighted average origination FICO | Weighted average origination FICO | | 781 | | | 771 | | | 775 | | | 773 | |
| Weighted average origination FICO | |
| Weighted average origination FICO | |
Weighted average interest rate earned(1) | Weighted average interest rate earned(1) | | 5.17 | % | | 4.23 | % | | 5.01 | % | | 4.09 | % | Weighted average interest rate earned(1) | | | | | | 5.65 | % | | 4.73 | % |
| Interest income recognized | Interest income recognized | | $ | 72,081 | | | $ | 40,019 | | | $ | 196,510 | | | $ | 115,859 | |
| Sales of loans | Sales of loans | | $ | — | | | $ | 74,080 | | | $ | 96,678 | | | $ | 877,920 | |
| Home Loans | Home Loans | |
| Weighted average origination FICO | Weighted average origination FICO | | 755 | | | 747 | | | 756 | | | 747 | |
| Weighted average origination FICO | |
| Weighted average origination FICO | |
Weighted average interest rate earned(1) | Weighted average interest rate earned(1) | | 5.67 | % | | 4.37 | % | | 5.51 | % | | 3.24 | % | Weighted average interest rate earned(1) | | | | | | 8.17 | % | | 4.13 | % |
| Interest income recognized | Interest income recognized | | $ | 1,276 | | | $ | 1,499 | | | $ | 3,441 | | | $ | 3,731 | |
| Sales of loans | Sales of loans | | $ | 333,843 | | | $ | 251,821 | | | $ | 678,136 | | | $ | 959,971 | |
__________________
(1)Weighted average interest rate earned represents annualized interest income recognized divided by the average of the unpaid principal balances of loans outstanding during the period, which are impacted by loan holding periods as well as interest rates charged to borrowers. Weighted average interest rate earned was determined on a daily basis for the 2023 periods2024 period and on a four-month or ten-month basis for the 2022 periods,2023 period, as the daily analysis in the prior period would have involved undue burden. Both average calculations are representative of our operations.
Lending Segment Results of Operations
The following table presents the measure of contribution profit for the Lending segment:
| | | | | | Three Months Ended
September 30, | | 2023 vs 2022 | | Nine Months Ended
September 30, | | 2023 vs 2022 | | | | | | Three Months Ended
March 31, | | 2024 vs 2023 |
| ($ in thousands) | ($ in thousands) | | 2023 | | 2022 | | $ Change | | % Change | | 2023 | | 2022 | | $ Change | | % Change | ($ in thousands) | | | | | | | | | | 2024 | | 2023 | | $ Change | | % Change |
| Net interest income | Net interest income | | $ | 265,215 | | | $ | 139,516 | | | $ | 125,699 | | | 90 | % | | $ | 698,147 | | | $ | 347,873 | | | $ | 350,274 | | | 101 | % | Net interest income | | | | | | | | | | $ | 266,536 | | | $ | | $ | 201,047 | | | $ | | $ | 65,489 | | | 33 | | 33 | % |
| Noninterest income | Noninterest income | | 83,758 | | | 162,178 | | | (78,420) | | | (48) | | | 319,348 | | | 463,927 | | | (144,579) | | | (31) | | Noninterest income | | | | | | | | | | 63,940 | | | 136,034 | | 136,034 | | | (72,094) | | (72,094) | | | (53) | | (53) | % |
Total net revenue | Total net revenue | | 348,973 | | | 301,694 | | | 47,279 | | | 16 | | | 1,017,495 | | | 811,800 | | | 205,695 | | | 25 | | Total net revenue | | | | | | | | | | 330,476 | | | 337,081 | | 337,081 | | | (6,605) | | (6,605) | | | (2) | | (2) | % |
Servicing rights – change in valuation inputs or assumptions(1) | Servicing rights – change in valuation inputs or assumptions(1) | | (7,420) | | | (6,182) | | | (1,238) | | | 20 | | | (28,105) | | | (26,860) | | | (1,245) | | | 5 | | Servicing rights – change in valuation inputs or assumptions(1) | | | | | | | | | | (5,226) | | | (12,084) | | (12,084) | | | 6,858 | | 6,858 | | | (57) | | (57) | % |
Residual interests classified as debt – change in valuation inputs or assumptions(2) | Residual interests classified as debt – change in valuation inputs or assumptions(2) | | 928 | | | 1,453 | | | (525) | | | (36) | | | 415 | | | 7,078 | | | (6,663) | | | (94) | | Residual interests classified as debt – change in valuation inputs or assumptions(2) | | | | | | | | | | 73 | | | 89 | | 89 | | | (16) | | (16) | | | (18) | | (18) | % |
| Directly attributable expenses | Directly attributable expenses | | (138,525) | | | (116,403) | | | (22,122) | | | 19 | | | (392,642) | | | (336,814) | | | (55,828) | | | 17 | | Directly attributable expenses | | | | | | | | | | (117,604) | | | (115,188) | | (115,188) | | | (2,416) | | (2,416) | | | 2 | | 2 | % |
Contribution profit | Contribution profit | | $ | 203,956 | | | $ | 180,562 | | | $ | 23,394 | | | 13 | % | | $ | 597,163 | | | $ | 455,204 | | | $ | 141,959 | | | 31 | % | Contribution profit | | | | | | | | | | $ | 207,719 | | | $ | | $ | 209,898 | | | $ | | $ | (2,179) | | | (1) | | (1) | % |
Adjusted net revenue(3) | Adjusted net revenue(3) | | $ | 342,481 | | | $ | 296,965 | | | $ | 45,516 | | | 15 | % | | $ | 989,805 | | | $ | 792,018 | | | $ | 197,787 | | | 25 | % | Adjusted net revenue(3) | | | | | | | | | | $ | 325,323 | | | $ | | $ | 325,086 | | | $ | | $ | 237 | | | — | | — | % |
__________________
(1)Reflects changes in fair value inputs and assumptions, including market servicing costs, conditional prepayment, default rates and discount rates. This non-cash change, which is recorded within noninterest income in the condensed consolidated statements of operations and comprehensive loss, is unrealized during the period and, therefore, has no impact on our cash flows from operations. As such, the changes in fair value attributable to assumption changes are adjusted to provide management and financial users with better visibility into the cash flows available to finance our operations.
(2)Reflects changes in fair value inputs and assumptions, including conditional prepayment, default rates and discount rates. When third parties finance our consolidated VIEs through purchasing residual interests, we receive proceeds at the time of the securitization close and, thereafter, pass along contractual cash flows to the residual interest owner. These obligations are measured at fair value on a recurring basis, with fair value changes recorded within noninterest income in the condensed consolidated statements of operations and comprehensive loss. The fair value change attributable to assumption changes has no impact on our initial financing proceeds, our future obligations to the residual interest owner (because future residual interest claims are
limited to contractual securitization collateral cash flows), or the general operations of our business. As such, this non-cash change in fair value is adjusted to provide management and financial users with better visibility into the cash flows available to finance our operations.
(3)Adjusted net revenue is a non-GAAP financial measure. For information regarding our use and definition of this measure and for a reconciliation to the most directly comparable U.S. GAAP measure, total net revenue, see “Non-GAAP Financial Measures” herein.
Net interest income
Net interest income in our Lending segment increased by $125.7$65.5 million, or 90%, and by $350.3 million, or 101%33%, for the three and nine months ended September 30, 2023, respectively,March 31, 2024 compared to the same periodsperiod in 2022,2023, which was primarily attributable to increases in average personal loan unpaid principal balances of $7.9$6.1 billion (173%(73%) and $6.9 billion (200%), respectively, and in average student loan unpaid principal balances of $1.9$1.8 billion (57%) and $1.7 billion (51%(39%), respectively, combined with a higher weighted average interest rate. The personal and student loan average balance increase wasincreases were primarily attributable to higher origination volume and longer loan holding periods. The student loan average balance increase was primarily attributable to longer loan holding periods. Interest expense associated with funding our lending activities increased by $214.5$193.0 million, or 443%, and by $516.5 million, or 532%130%, for the three and nine-month year-over-year periods, respectively,three-month year over year period, primarily due to the sharp increases in benchmark rates which are reflective of the higher interest rate environment year over year,during 2023 as well as higher average loan balances.
Noninterest income
Noninterest income in our Lending segment decreased by $78.4$72.1 million, or 48%, and by $144.6 million, or 31%53%, for the three and nine months ended September 30, 2023, respectively,March 31, 2024 compared to the same periodsperiod in 2022,2023, which was primarily driven by lower loan origination, and sales, income of $82.0 million and $154.6 million, respectively. For the nine month period, this was partially offset by higher securitizations income of $9.4$66.3 million.
Loan Origination, Sales, and SalesSecuritizations
The following table presents the components of noninterest income—loan origination, sales, and salessecuritizations:
| | Three Months Ended
September 30, | | 2023 vs 2022 | | Nine Months Ended
September 30, | | 2023 vs 2022 |
| | | | | | Three Months Ended
March 31, | |
| | | | | | Three Months Ended
March 31, | |
| | | | | | Three Months Ended
March 31, | | | 2024 vs 2023 |
| ($ in thousands) | ($ in thousands) | | 2023 | | 2022 | | $ Change | | % Change | | 2023 | | 2022 | | $ Change | | % Change | ($ in thousands) | | | | | | | | | | 2024 | | 2023 | | $ Change | | % Change |
In period originations, loan sale execution and fair value adjustments(1) | In period originations, loan sale execution and fair value adjustments(1) | | $ | 57,450 | | | $ | 88,026 | | | $ | (30,576) | | | (35) | % | | $ | 337,425 | | | $ | 183,098 | | | $ | 154,327 | | | 84 | % | In period originations, loan sale execution and fair value adjustments(1) | | | | | | | | | | $ | (72,040) | | | $ | | $ | 222,351 | | | $ | | $ | (294,391) | | | n/m | | n/m |
| Economic derivative hedges of loan fair values | Economic derivative hedges of loan fair values | | 80,029 | | | 106,240 | | | (26,211) | | | (25) | | | 165,531 | | | 336,382 | | | (170,851) | | | (51) | | Economic derivative hedges of loan fair values | | | | | | | | | | 205,921 | | | (32,336) | | (32,336) | | | 238,257 | | 238,257 | | | n/m | | n/m |
Other derivative instruments(2) | Other derivative instruments(2) | | 2,180 | | | (6,087) | | | 8,267 | | | n/m | | 4,443 | | | (10,711) | | | 15,154 | | | n/m | Other derivative instruments(2) | | | | | | | | | | 2,571 | | | 2,198 | | 2,198 | | | 373 | | 373 | | | 17 | | 17 | % |
| Loan origination fees | Loan origination fees | | 56,394 | | | 2,238 | | | 54,156 | | | n/m | | 73,577 | | | 6,169 | | | 67,408 | | | n/m | Loan origination fees | | | | | | | | | | 73,742 | | | 1,062 | | 1,062 | | | 72,680 | | 72,680 | | | n/m | | n/m |
Loan write-off expense – whole loans(3) | | (115,410) | | | (26,021) | | | (89,389) | | | 344 | | | (271,437) | | | (47,698) | | | (223,739) | | | 469 | |
Loan write-off expense(3) | | Loan write-off expense(3) | | | | | | | | | | (144,744) | | | (72,807) | | | (71,937) | | | 99 | % |
Loan repurchase (expense) benefit(4) | Loan repurchase (expense) benefit(4) | | (515) | | | 479 | | | (994) | | | n/m | | (243) | | | 2,266 | | | (2,509) | | | n/m | Loan repurchase (expense) benefit(4) | | | | | | | | | | (1,265) | | | 425 | | 425 | | | (1,690) | | (1,690) | | | n/m | | n/m |
| Other | Other | | 1,562 | | | (1,174) | | | 2,736 | | | n/m | | 1,988 | | | (3,661) | | | 5,649 | | | n/m | Other | | | | | | | | | | (7,185) | | | 2,444 | | 2,444 | | | (9,629) | | (9,629) | | | n/m | | n/m |
Loan origination and sales noninterest income | | $ | 81,690 | | | $ | 163,701 | | | $ | (82,011) | | | (50) | % | | $ | 311,284 | | | $ | 465,845 | | | $ | (154,561) | | | (33) | % |
Loan origination, sales, and securitizations noninterest income | | Loan origination, sales, and securitizations noninterest income | | | | | | | | | | $ | 57,000 | | | $ | 123,337 | | | $ | (66,337) | | | (54) | % |
(1)Includes fair value adjustments on loans originated during the period, fair value adjustments onof loans and securitization bond and residual interest positions held at the balance sheet date, as well as gains (losses) on loans sold and consolidated securitization transactions during the period. Fair value adjustments are impacted by interest rates, weighted average coupon, credit spreads actual and estimated losses,loss estimates, prepayment speeds, duration and previous loan sale execution on similar loans.
(2)Includes IRLCs and interest rate caps, andas well as purchase price earn-out.earn-out during the 2023 period.
(3)For the three months ended September 30,March 31, 2024 and 2023, and 2022, includes gross write-offs of $134.1$175.5 million and $31.4$86.7 million, respectively. Total recoveries were $18.7$30.8 million and $5.4$13.9 million, respectively, of which $13.2$25.0 million and $2.7$6.9 million, respectively, were captured via loan sales to a third-party collection agency. For the nine months ended September 30, 2023 and 2022, includes gross write-offs of $320.5 million and $60.9 million, respectively. Total recoveries were $49.1 million and $13.2 million, respectively, of which $30.8 million and $4.4 million, respectively, were captured via loan sales to a third-party collection agency. The increases in loan write-off expense were related to increased origination volume and longer loan holding periods.
(4)Represents the (expense) benefit associated with our estimated loan repurchase obligation. See Note 15. Commitments, Guarantees, Concentrations and Contingencies to the Notes to Condensed Consolidated Financial Statements for additional information.
Three Months. The decrease in loan origination, sales, and salessecuritizations income was primarily driven by: (i) fair value losses on personal loans in the 2024 period compared to gains during the 2023 period, which were primarily impacted by higher prepayment rate, discount rate and default rate assumptions, and lower fair value gains on student loans in the 2024 period, which were primarily impacted by higher unpaid principal balance, and (ii) higher personal loan write-offs in the 20232024 period, primarily driven by longer loan holding periods and elevated charge off rates, and (ii) lower fair valuerates. These decreases were partially offset by: (i) gains on personal loans and higher fair valuein the 2024 period compared to losses on student loans, which were primarily impacted by higher benchmark rates, higher personal and student loan origination volume, and longer loan holding periods, and (iii) lower gains in the 2023 period on student loan, personal loan and student loanrisk retention interest rate swap positions primarily driven by smaller increases in interest rates during the 2024 period compared to decreases in interest rates during the 2023 period. This decrease was partially offset by: (i)period, and (ii) higher origination fees primarily related to a new product feature offered on personal loans, whereby a borrower may optionally elect to pay origination fees to qualify for a lower annual
percentage rate, and (ii) fair value gains on home loans (compared to losses in the 2022 period), which were primarily impacted by lower benchmark rates.
Nine Months. The decrease in loan origination and sales income was primarily driven by: (i) higher personal loan write-offs in the 2023 period, primarily driven by longer loan holding periods and elevated charge off rates, and (ii) lower gains in the 2023 period on student loan and personal loan interest rate swap positions and on home loan pipeline hedges primarily driven by smaller increases in interest rates and in the underlying hedge price index during the 2023 period, respectively. This decrease was partially offset by: (i) higher fair value gains on personal loans and fair value gains on student loans in the 2023 period (compared to losses in the 2022 period), which were primarily impacted by higher origination volume and lower prepayment assumptions, respectively, (ii) fair value gains on home loans (compared to losses in the 2022 period), which were primarily impacted by smaller decreases in benchmark rates, (iii) higher origination fees primarily related to a new product feature offered on personal loans, whereby a borrower may optionally elect to pay origination fees to qualify for a lower annual percentage rate, and (iv) losses on home loan and student loan sale execution in the 2022 period, which were due to both volume and price factors.rate.
SoFi Technologies, Inc.
Nine Months.TABLE OF CONTENTS The improvement in securitizations income was primarily driven by an increase in securitization loan and residual interests in securitization trusts fair market values primarily associated with consolidated securitization transactions in the first and third quarters of 2023, and a positive variance in our securitization bond and residual interest position fair values. This was partially offset by the impact of securitization write-offs and lower gains in the 2023 period on risk retention hedge activities.Servicing
We own the master servicing on all of the servicing rights that we retain and, in each case, recognize the gross servicing rate applicable to each serviced loan. Sub-servicers are utilized for all serviced student loans and home loans, which represents a cost to SoFi, but these arrangements do not impact our calculation of the weighted average basis points earned for each loan type serviced. Further, there is no impact on servicing income due to forbearance and moratoriums on certain debt collection activities, and there are no waivers of late fees. The table below presents information related to our loan servicing activities:
| | | | | | | | | | | | | | | | | | | | | | | | | | | | | | | | | | | | | | | | | | | | | | | | | | |
| | Three Months Ended
September 30, | | 2023 vs 2022 | | Nine Months Ended
September 30, | | 2023 vs 2022 |
| ($ in thousands) | | 2023 | | 2022 | | $ Change | | % Change | | 2023 | | 2022 | | $ Change | | % Change |
| Servicing income recognized | | | | | | | | | | | | | | | | |
| Personal loans | | $ | 5,048 | | | $ | 9,806 | | | $ | (4,758) | | | (49) | % | | $ | 17,234 | | | $ | 27,901 | | | $ | (10,667) | | | (38) | % |
| Student loans | | 6,219 | | | 9,293 | | | (3,074) | | | (33) | | | 19,235 | | | 29,119 | | | (9,884) | | | (34) | |
| Home loans | | 3,721 | | | 3,387 | | | 334 | | | 10 | | | 11,052 | | | 9,416 | | | 1,636 | | | 17 | |
| Servicing rights fair value change | | | | | | | | | | | | | | | | |
| Personal loans | | $ | (1,998) | | | $ | (3,013) | | | $ | 1,015 | | | (34) | % | | $ | (9,943) | | | $ | (857) | | | $ | (9,086) | | | n/m |
| Student loans | | (4,788) | | | (4,053) | | | (735) | | | 18 | % | | (2,238) | | | (9,137) | | | 6,899 | | | (76) | % |
| Home loans | | 3,777 | | | (1,460) | | | 5,237 | | | n/m | | 4,981 | | | 10,173 | | | (5,192) | | | (51) | % |
SoFi Technologies, Inc.
| | | | | | | | | | | | | | | | | | | | | | | | | | | | | | | | | | |
| | | | | | Three Months Ended
March 31, | | 2024 vs 2023 |
| ($ in thousands) | | | | | | | | | | 2024 | | 2023 | | $ Change | | % Change |
| Servicing income recognized | | | | | | | | | | | | | | | | |
| Personal loans | | | | | | | | | | $ | 11,819 | | | $ | 6,537 | | | $ | 5,282 | | | 81 | % |
| Student loans | | | | | | | | | | 5,525 | | | 6,715 | | | (1,190) | | | (18) | % |
| Home loans | | | | | | | | | | 4,080 | | | 3,604 | | | 476 | | | 13 | % |
| Servicing rights fair value change | | | | | | | | | | | | | | | | |
| Personal loans | | | | | | | | | | $ | 54,102 | | | $ | (6,579) | | | $ | 60,681 | | | n/m |
| Student loans | | | | | | | | | | 4,013 | | | 3,848 | | | 165 | | | 4 | % |
| Home loans | | | | | | | | | | 2,168 | | | (609) | | | 2,777 | | | n/m |
Directly attributable expenses
The directly attributable expenses allocated to the Lending segment that were used in the determination of the segment's contribution profit were as follows:
| | Three Months Ended
September 30, | | 2023 vs 2022 | | Nine Months Ended
September 30, | | 2023 vs 2022 |
| | | | | | Three Months Ended
March 31, | |
| | | | | | Three Months Ended
March 31, | |
| | | | | | Three Months Ended
March 31, | | | 2024 vs 2023 |
| ($ in thousands) | ($ in thousands) | | 2023 | | 2022 | | $ Change | | % Change | | 2023 | | 2022 | | $ Change | | % Change | ($ in thousands) | | | | | | | | | | 2024 | | 2023 | | $ Change | | % Change |
| Direct advertising | Direct advertising | | $ | 49,477 | | | $ | 44,813 | | | $ | 4,664 | | | 10 | % | | $ | 142,843 | | | $ | 127,704 | | | $ | 15,139 | | | 12 | % | Direct advertising | | | | | | | | | | $ | 44,769 | | | $ | | $ | 45,774 | | | $ | | $ | (1,005) | | | (2) | | (2) | % |
| Compensation and benefits | | Compensation and benefits | | | | | | | | | | 28,254 | | | 25,686 | | | 2,568 | | | 10 | % |
| Lead generation | Lead generation | | 35,229 | | | 25,999 | | | 9,230 | | | 36 | | | 90,303 | | | 69,381 | | | 20,922 | | | 30 | | Lead generation | | | | | | | | | | 24,815 | | | 21,621 | | 21,621 | | | 3,194 | | 3,194 | | | 15 | | 15 | % |
| Compensation and benefits | | 31,136 | | | 27,717 | | | 3,419 | | | 12 | | | 87,242 | | | 77,855 | | | 9,387 | | | 12 | |
| Loan origination and servicing costs | Loan origination and servicing costs | | 12,307 | | | 10,736 | | | 1,571 | | | 15 | | | 35,676 | | | 31,838 | | | 3,838 | | | 12 | | Loan origination and servicing costs | | | | | | | | | | 10,430 | | | 10,350 | | 10,350 | | | 80 | | 80 | | | 1 | | 1 | % |
| Professional services | Professional services | | 1,650 | | | 1,896 | | | (246) | | | (13) | | | 6,610 | | | 5,765 | | | 845 | | | 15 | | Professional services | | | | | | | | | | 2,378 | | | 2,193 | | 2,193 | | | 185 | | 185 | | | 8 | | 8 | % |
| Intercompany technology platform expenses | Intercompany technology platform expenses | | 300 | | | — | | | 300 | | | n/m | | 512 | | | — | | | 512 | | | n/m | Intercompany technology platform expenses | | | | | | | | | | 444 | | | — | | — | | | 444 | | 444 | | | n/m | | n/m |
Other(1) | Other(1) | | 8,426 | | | 5,242 | | | 3,184 | | | 61 | | | 29,456 | | | 24,271 | | | 5,185 | | | 21 | | Other(1) | | | | | | | | | | 6,514 | | | 9,564 | | 9,564 | | | (3,050) | | (3,050) | | | (32) | | (32) | % |
| Directly attributable expenses | Directly attributable expenses | | $ | 138,525 | | | $ | 116,403 | | | $ | 22,122 | | | 19 | % | | $ | 392,642 | | | $ | 336,814 | | | $ | 55,828 | | | 17 | % | Directly attributable expenses | | | | | | | | | | $ | 117,604 | | | $ | | $ | 115,188 | | | $ | | $ | 2,416 | | | 2 | | 2 | % |
___________________
(1)Other expenses primarily include loan marketing expenses, member promotional expenses, tools and subscriptions, travel and occupancy-related costs and third-party loan fraud.fraud (net of related insurance recoveries).
Lending segment directly attributable expenses for the three and nine months ended September 30, 2023March 31, 2024 increased by $22.1$2.4 million, or 19%2%, and $55.8 million, or 17%, respectively, compared to the same periodsperiod in 2022,2023, primarily due to: (i) an increase in student and personal loan lead generation channels during 2023;2024, and (ii) an increase in direct advertising primarily related to direct mail advertising; (iii) an increase in allocated compensation and related benefits, which reflected increases in average compensation and average headcount in 2023; and (iv) an2024. This increase was partially offset by: (i) a decline in other expenses, primarily related to loan marketing expenses and third-party loan fraud.fraud and tools and subscriptions, and (ii) a decrease in direct advertising primarily related to direct mail advertising.
Transfers of Financial Assets
We regularly transfer financial assets and account for such transfers as either sales or secured borrowings depending on the facts and circumstances of the transfer. The following table summarizes our current whole loan sales:
| | | | | | | | | | | | | | | |
| | | Three Months Ended March 31, |
| | | | | 2024 | | 2023 |
| Personal loans | | | | | | | |
| Fair value of consideration received: | | | | | | | |
| Cash | | | | | $ | 499,751 | | | $ | — | |
| Receivable | | | | | 3,036 | | | — | |
| Servicing assets recognized | | | | | 33,549 | | | — | |
| Repurchase liabilities recognized | | | | | (1,800) | | | — | |
| Total consideration | | | | | 534,536 | | | — | |
| Aggregate unpaid principal balance and accrued interest of loans sold | | | | | 503,037 | | | — | |
| Realized gain | | | | | $ | 31,499 | | | $ | — | |
Sale execution(1) | | | | | 106.6 | % | | — | % |
| Student loans | | | | | | | |
| Fair value of consideration received: | | | | | | | |
| Cash | | | | | $ | 310,331 | | | $ | — | |
| Servicing assets recognized | | | | | 8,249 | | | — | |
| Repurchase liabilities recognized | | | | | (46) | | | — | |
| Total consideration | | | | | 318,534 | | | — | |
| Aggregate unpaid principal balance and accrued interest of loans sold | | | | | 303,578 | | | — | |
| Realized gain | | | | | $ | 14,956 | | | $ | — | |
Sale execution(1) | | | | | 104.9 | % | | — | % |
| Home loans | | | | | | | |
| Fair value of consideration received: | | | | | | | |
| Cash | | | | | $ | 344,678 | | | $ | 77,819 | |
| Servicing assets recognized | | | | | 2,832 | | | 954 | |
| Repurchase liabilities recognized | | | | | (505) | | | (96) | |
| Total consideration | | | | | 347,005 | | | 78,677 | |
| Aggregate unpaid principal balance and accrued interest of loans sold | | | | | 344,258 | | | 77,976 | |
| Realized gain | | | | | $ | 2,747 | | | $ | 701 | |
Sale execution(1) | | | | | 100.9 | % | | 101.0 | % |
_____________________
(1)Sale execution represents the ratio of cash proceeds and servicing assets recognized to the aggregate unpaid principal balance and accrued interest of the loans sold. Amounts included in repurchase liabilities are excluded from the calculation, as they typically would not materially differ from the fair value markdown on the loans over the repurchase period had they been held on balance sheet and entered delinquency.
The following table summarizes our delinquent whole loan sales during the three months ended March 31, 2024. There were no delinquent whole loan sales during the three months ended March 31, 2023.
| | | | | | | | | | | | | |
| | | | | Three Months Ended March 31, | | |
| | | | | 2024 | | |
| Personal loans | | | | | | | |
| Fair value of consideration received: | | | | | | | |
| Cash | | | | | $ | 5,000 | | | |
| Servicing assets recognized | | | | | 3,400 | | | |
| Repurchase liabilities recognized | | | | | (25) | | | |
| Total consideration | | | | | 8,375 | | | |
Aggregate unpaid principal balance and accrued interest of loans sold(1) | | | | | 66,411 | | | |
| Realized loss | | | | | $ | (58,036) | | | |
Sale execution(2) | | | | | 12.6 | % | | |
_____________________(1) Includes $62.5 million of aggregate unpaid principal balance sold, related to late-stage delinquent loans for which we retained servicing and portions of recoveries. $43.2 million of the $62.5 million of unpaid principal balance was recorded in prior periods as a write down in noninterest income—loan origination, sales, and securitizations in the condensed consolidated statements of operations and comprehensive income (loss). These loans were sold prior to charge-off during the three months ended March 31, 2024, and otherwise would have been charged off as of March 31, 2024 consistent with our policy. In our other charged off whole loan sales, we typically do not retain servicing or recoveries.
(2) Sale execution represents the ratio of cash proceeds and servicing assets recognized to the aggregate unpaid principal balance and accrued interest of the loans sold. Amounts included in repurchase liabilities are excluded from the calculation, as they typically would not materially differ from the fair value markdown on the loans over the repurchase period had they been held on balance sheet and entered delinquency.
Technology Platform Segment
In the table below, we present the total accounts metric related to Galileo within our Technology Platform segment:
| | | | | | | | | | | | | | | | | | | | | | | |
| | | | | 2023 vs 2022 |
| September 30, 2023 | | September 30, 2022 | | Change | | % Change |
| Total accounts | 136,739,131 | | | 124,332,810 | | | 12,406,321 | | | 10 | % |
| | | | | | | | | | | | | | | | | | | | | | | |
| | | | | 2023 vs 2022 |
| March 31, 2024 | | March 31, 2023 | | Change | | % Change |
| Total accounts | 151,049,375 | | | 126,326,916 | | | 24,722,459 | | | 20 | % |
See “Key Business Metrics” for further discussion of this measure as it relates to our Technology Platform segment.
Technology Platform Segment Results of Operations
The following table presents the measure of contribution profit for the Technology Platform segment:
| | | | | | Three Months Ended
September 30, | | 2023 vs 2022 | | Nine Months Ended
September 30, | | 2023 vs 2022 | | | | | | Three Months Ended
March 31, | | 2024 vs 2023 |
| ($ in thousands) | ($ in thousands) | | 2023 | | 2022 | | $ Change | | % Change | | 2023 | | 2022 | | $ Change | | % Change | ($ in thousands) | | | | | | | | | | 2024 | | 2023 | | $ Change | | % Change |
| Net interest income | Net interest income | | $ | 573 | | | $ | — | | | $ | 573 | | | n/m | | $ | 573 | | | $ | — | | | $ | 573 | | | n/m | Net interest income | | | | | | | | | | $ | 501 | | | $ | | $ | — | | | $ | | $ | 501 | | | n/m | | n/m |
| Noninterest income | Noninterest income | | 89,350 | | | 84,777 | | | 4,573 | | | 5 | % | | 254,860 | | | 229,481 | | | 25,379 | | | 11 | % | Noninterest income | | | | | | | | | | 93,865 | | | 77,887 | | 77,887 | | | 15,978 | | 15,978 | | | 21 | | 21 | % |
Total net revenue | Total net revenue | | 89,923 | | | 84,777 | | | 5,146 | | | 6 | | | 255,433 | | | 229,481 | | | 25,952 | | | 11 | | Total net revenue | | | | | | | | | | 94,366 | | | 77,887 | | 77,887 | | | 16,479 | | 16,479 | | | 21 | | 21 | % |
| Directly attributable expenses | Directly attributable expenses | | (57,732) | | | (65,241) | | | 7,509 | | | (12) | | | (191,231) | | | (169,849) | | | (21,382) | | | 13 | | Directly attributable expenses | | | | | | | | | | (63,624) | | | (63,030) | | (63,030) | | | (594) | | (594) | | | 1 | | 1 | % |
Contribution profit | Contribution profit | | $ | 32,191 | | | $ | 19,536 | | | $ | 12,655 | | | 65 | % | | $ | 64,202 | | | $ | 59,632 | | | $ | 4,570 | | | 8 | % | Contribution profit | | | | | | | | | | $ | 30,742 | | | $ | | $ | 14,857 | | | $ | | $ | 15,885 | | | 107 | | 107 | % |
Net interest income
Net interest income in our Technology Platform segment of $0.6$0.5 million for both the three and nine months ended September 30, 2023March 31, 2024 relates to interest income earned on segment cash balances, which we began recording within the
Technology Platform segment in the third quarter of 2023. Prior period amounts were determined to be immaterial, and presented within Corporate/Other.
Noninterest income
Noninterest income in our Technology Platform segment increased by $4.6$16.0 million, or 5%, and $25.4 million, or 11%21%, for the three and nine months ended September 30, 2023, respectively,March 31, 2024 compared to the same periodsperiod in 2022.2023. The increase in the nine-month period was primarily attributable to growth in technology products and solutionsservices fees driven by revenue contribution from Technisys for the full 2023 period compared to seven months of 2022.account growth, as well as increased processing and service arrangement activity among our integrated technology solutions clients. Noninterest income also included $7.0 million and $15.6 million of intercompany revenue for the three and nine months
ended September 30, 2023, respectively,March 31, 2024 compared to $1.8 million and $4.2$3.7 million for the three and nine months ended September 30, 2022, respectively.March 31, 2023. The increase in intercompany revenue was primarily attributable to increased usage of technology platform services during the 2023 periods2024 period by our Financial Services segment, as well as within our Technology Platform segment as we continue to leverage synergies to enhance our product offerings.
Directly attributable expenses
The directly attributable expenses allocated to the Technology Platform segment that were used in the determination of the segment's contribution profit were as follows:
| | Three Months Ended
September 30, | | 2023 vs 2022 | | Nine Months Ended
September 30, | | 2023 vs 2022 |
| | | | | | Three Months Ended
March 31, | |
| | | | | | Three Months Ended
March 31, | |
| | | | | | Three Months Ended
March 31, | | | 2024 vs 2023 |
| ($ in thousands) | ($ in thousands) | | 2023 | | 2022 | | $ Change | | % Change | | 2023 | | 2022 | | $ Change | | % Change | ($ in thousands) | | | | | | | | | | 2024 | | 2023 | | $ Change | | % Change |
| Compensation and benefits | Compensation and benefits | | $ | 34,155 | | | $ | 39,862 | | | $ | (5,707) | | | (14) | % | | $ | 112,201 | | | $ | 101,544 | | | $ | 10,657 | | | 10 | % | Compensation and benefits | | | | | | | | | | $ | 36,298 | | | $ | | $ | 38,704 | | | $ | | $ | (2,406) | | | (6) | | (6) | % |
| Product fulfillment | Product fulfillment | | 11,784 | | | 10,531 | | | 1,253 | | | 12 | | | 34,332 | | | 29,489 | | | 4,843 | | | 16 | | Product fulfillment | | | | | | | | | | 13,647 | | | 10,223 | | 10,223 | | | 3,424 | | 3,424 | | | 33 | | 33 | % |
| Tools and subscriptions | Tools and subscriptions | | 6,085 | | | 5,425 | | | 660 | | | 12 | | | 19,931 | | | 13,552 | | | 6,379 | | | 47 | | Tools and subscriptions | | | | | | | | | | 6,735 | | | 6,513 | | 6,513 | | | 222 | | 222 | | | 3 | | 3 | % |
| Professional services | Professional services | | 3,664 | | | 3,609 | | | 55 | | | 2 | | | 10,841 | | | 10,492 | | | 349 | | | 3 | | Professional services | | | | | | | | | | 2,696 | | | 3,934 | | 3,934 | | | (1,238) | | (1,238) | | | (31) | | (31) | % |
Other(1) | Other(1) | | 2,044 | | | 5,814 | | | (3,770) | | | (65) | | | 13,926 | | | 14,772 | | | (846) | | | (6) | | Other(1) | | | | | | | | | | 4,248 | | | 3,656 | | 3,656 | | | 592 | | 592 | | | 16 | | 16 | % |
| Directly attributable expenses | Directly attributable expenses | | $ | 57,732 | | | $ | 65,241 | | | $ | (7,509) | | | (12) | % | | $ | 191,231 | | | $ | 169,849 | | | $ | 21,382 | | | 13 | % | Directly attributable expenses | | | | | | | | | | $ | 63,624 | | | $ | | $ | 63,030 | | | $ | | $ | 594 | | | 1 | | 1 | % |
(1)Other expenses are primarily related to travel and occupancy-related costs, advertising and marketing, and data center costs.costs and accounts receivable write offs.
Technology Platform segment directly attributable expenses decreasedincreased by $7.5$0.6 million, or 12%, and increased by $21.4 million, or 13%1%, for the three and nine months ended September 30, 2023, respectively,March 31, 2024 compared to the same periodsperiod in 2022,2023, primarily due to: (i) a decrease in compensation benefits expense for the three month period, which reflected a decrease in average headcount in 2023 corresponding with restructuring during the first quarter of 2023, and an increase in compensation and benefits expense for the nine-month period, primarily related to bonus adjustments in the second quarter of 2023 and the inclusion of Technisys in our results for the full nine-month 2023 period; (ii) an increase in tools and subscriptions costs related to internal technology initiatives to support the growth of the platform, along with the inclusion of Technisys in our results for the full nine-month 2023 period; and (iii) an increase in product fulfillment costs, primarily related to payment processing network association fees associated with increased activity on the platform. This was partially offset by a decrease in compensation and benefits expense, which reflected a decrease in average headcount year over year.
Financial Services Segment
In the table below, we present the total products metric related to our Financial Services segment:
| | | | | | | | | | | | | | | | | | | | | | | | | | |
| | | | | | 2023 vs. 2022 |
| | September 30, 2023 | | September 30, 2022 | | Change | | % Change |
| Total products | | 8,853,900 | | | 5,918,805 | | | 2,935,095 | | | 50 | % |
| | | | | | | | | | | | | | | | | | | | | | | | | | |
| | | | | | 2023 vs. 2022 |
| | March 31, 2024 | | March 31, 2023 | | Change | | % Change |
| Total products | | 10,124,973 | | | 7,138,241 | | | 2,986,732 | | | 42 | % |
Total products in our Financial Services segment is a subset of our total products metric. See “Key Business Metrics” for a further discussion of this measure as it relates to our Financial Services segment.
Financial Services Segment Results of Operations
The following table presents the measure of contribution lossprofit (loss) for the Financial Services segment:
| | | | | | Three Months Ended
September 30, | | 2023 vs 2022 | | Nine Months Ended
September 30, | | 2023 vs 2022 | | | | | | Three Months Ended
March 31, | | 2024 vs 2023 |
| ($ in thousands) | ($ in thousands) | | 2023 | | 2022 | | $ Change | | % Change | | 2023 | | 2022 | | $ Change | | % Change | ($ in thousands) | | | | | | | | | | 2024 | | 2023 | | $ Change | | % Change |
| Net interest income | Net interest income | | $ | 93,101 | | | $ | 28,158 | | | $ | 64,943 | | | 231 | % | | $ | 225,775 | | | $ | 46,965 | | | $ | 178,810 | | | 381 | % | Net interest income | | | | | | | | | | $ | 119,713 | | | $ | | $ | 58,037 | | | $ | | $ | 61,676 | | | 106 | | 106 | % |
| Noninterest income | Noninterest income | | 25,146 | | | 20,795 | | | 4,351 | | | 21 | | | 71,625 | | | 55,894 | | | 15,731 | | | 28 | | Noninterest income | | | | | | | | | | 30,838 | | | 23,064 | | 23,064 | | | 7,774 | | 7,774 | | | 34 | | 34 | % |
Total net revenue | Total net revenue | | 118,247 | | | 48,953 | | | 69,294 | | | 142 | | | 297,400 | | | 102,859 | | | 194,541 | | | 189 | | Total net revenue | | | | | | | | | | 150,551 | | | 81,101 | | 81,101 | | | 69,450 | | 69,450 | | | 86 | | 86 | % |
| Directly attributable expenses | Directly attributable expenses | | (114,987) | | | (101,576) | | | (13,411) | | | 13 | | | (322,722) | | | (258,697) | | | (64,025) | | | 25 | | Directly attributable expenses | | | | | | | | | | (113,377) | | | (105,336) | | (105,336) | | | (8,041) | | (8,041) | | | 8 | | 8 | % |
Contribution profit (loss) | Contribution profit (loss) | | $ | 3,260 | | | $ | (52,623) | | | $ | 55,883 | | | n/m | | $ | (25,322) | | | $ | (155,838) | | | $ | 130,516 | | | (84) | % | Contribution profit (loss) | | | | | | | | | | $ | 37,174 | | | $ | | $ | (24,235) | | | $ | | $ | 61,409 | | | n/m | | n/m |
Net interest income
Net interest income in our Financial Services segment increased by $64.9$61.7 million, or 231%, and $178.8 million, or 381%106%, for the three and nine months ended September 30, 2023, respectively,March 31, 2024 compared to the same periodsperiod in 2022,2023, which was primarily attributable to net interest income earned on our deposits, which includes interest income based on our FTP framework (which eliminates in consolidation) and interest expense to members. This net increase corresponds with the growth of deposits at SoFi Bank, as well as the impact of higher interest rates offered to members. In addition, net interest income earned on our credit cards increased, which includes interest income earned on outstanding balances as well as interest expense incurred under the FTP framework, and was primarily attributable to growth in total credit cards.
Noninterest income
Noninterest income in our Financial Services segment increased by $4.4$7.8 million, or 21%, and $15.7 million, or 28%34%, for the three and nine months ended September 30, 2023, respectively,March 31, 2024 compared to the same periodsperiod in 2022,2023, primarily due to an increase in interchange fees, which coincided with increased credit card and debit card transactions, as well as brokerage-related fees, which were primarily attributablegrowth in referral fulfillment activity, as we continue to increased tradingdrive volume onto our platform during 2023.
Directly attributable expensespartners.
The directly attributable expenses allocated to the Financial Services segment that were used in the determination of the segment's contribution profit (loss) were as follows:
| | Three Months Ended
September 30, | | 2023 vs 2022 | | Nine Months Ended
September 30, | | 2023 vs 2022 |
| | | | | | Three Months Ended
March 31, | |
| | | | | | Three Months Ended
March 31, | |
| | | | | | Three Months Ended
March 31, | | | 2024 vs 2023 |
| ($ in thousands) | ($ in thousands) | | 2023 | | 2022 | | $ Change | | % Change | | 2023 | | 2022 | | $ Change | | % Change | ($ in thousands) | | | | | | | | | | 2024 | | 2023 | | $ Change | | % Change |
| Compensation and benefits | Compensation and benefits | | $ | 29,530 | | | $ | 31,369 | | | $ | (1,839) | | | (6) | % | | $ | 90,697 | | | $ | 81,678 | | | $ | 9,019 | | | 11 | % | Compensation and benefits | | | | | | | | | | $ | 32,505 | | | $ | | $ | 30,475 | | | $ | | $ | 2,030 | | | 7 | | 7 | % |
| Member incentives | | Member incentives | | | | | | | | | | 19,384 | | | 11,455 | | | 7,929 | | | 69 | % |
| Product fulfillment | | Product fulfillment | | | | | | | | | | 16,576 | | | 10,609 | | | 5,967 | | | 56 | % |
| Direct advertising | | Direct advertising | | | | | | | | | | 8,997 | | | 13,075 | | | (4,078) | | | (31) | % |
| Provision for credit losses | Provision for credit losses | | 21,831 | | | 16,323 | | | 5,508 | | | 34 | | | 42,853 | | | 39,387 | | | 3,466 | | | 9 | | Provision for credit losses | | | | | | | | | | 7,165 | | | 8,407 | | 8,407 | | | (1,242) | | (1,242) | | | (15) | | (15) | % |
| Member incentives | | 15,767 | | | 11,712 | | | 4,055 | | | 35 | | | 39,084 | | | 27,517 | | | 11,567 | | | 42 | |
| Direct advertising | | 8,026 | | | 10,063 | | | (2,037) | | | (20) | | | 36,667 | | | 26,214 | | | 10,453 | | | 40 | |
| Product fulfillment | | 12,909 | | | 8,416 | | | 4,493 | | | 53 | | | 34,779 | | | 23,841 | | | 10,938 | | | 46 | |
| Lead generation | Lead generation | | 6,220 | | | 7,751 | | | (1,531) | | | (20) | | | 29,700 | | | 16,324 | | | 13,376 | | | 82 | | Lead generation | | | | | | | | | | 6,419 | | | 17,053 | | 17,053 | | | (10,634) | | (10,634) | | | (62) | | (62) | % |
| Intercompany technology platform expenses | Intercompany technology platform expenses | | 3,794 | | | 1,065 | | | 2,729 | | | 256 | | | 8,532 | | | 2,788 | | | 5,744 | | | 206 | | Intercompany technology platform expenses | | | | | | | | | | 4,951 | | | 2,097 | | 2,097 | | | 2,854 | | 2,854 | | | 136 | | 136 | % |
| Professional services | Professional services | | 3,401 | | | 1,020 | | | 2,381 | | | 233 | | | 7,541 | | | 3,354 | | | 4,187 | | | 125 | | Professional services | | | | | | | | | | 4,777 | | | 1,607 | | 1,607 | | | 3,170 | | 3,170 | | | 197 | | 197 | % |
Other(1) | Other(1) | | 13,509 | | | 13,857 | | | (348) | | | (3) | | | 32,869 | | | 37,594 | | | (4,725) | | | (13) | | Other(1) | | | | | | | | | | 12,603 | | | 10,558 | | 10,558 | | | 2,045 | | 2,045 | | | 19 | | 19 | % |
| Directly attributable expenses | Directly attributable expenses | | $ | 114,987 | | | $ | 101,576 | | | $ | 13,411 | | | 13 | % | | $ | 322,722 | | | $ | 258,697 | | | $ | 64,025 | | | 25 | % | Directly attributable expenses | | | | | | | | | | $ | 113,377 | | | $ | | $ | 105,336 | | | $ | | $ | 8,041 | | | 8 | | 8 | % |
___________________
(1)Other expenses primarily include operational product losses, third-party fraud expense, tools and subscriptions,network servicing fees, travel and occupancy-related costs, tools and subscriptions, and marketing expenses.
Financial Services directly attributable expenses increased by $13.4$8.0 million, or 13%8%, for the three months ended September 30, 2023,March 31, 2024 compared to the same period in 2022,2023, primarily due to: (i) an increase related to our provision for credit losses, which was primarily related to growth in total credit card balances; (ii) an increase in product fulfillment costs, which included debit card fulfillment services, primarily related to our SoFi Money product; and (iii) an increase in direct member incentives utilized to drive adoption and usage of our Financial Services products, the most significant of which was our SoFi Money product.
Financial Services directly attributable expenses increased by $64.0 million, or 25%, for the nine months ended September 30, 2023 compared to the same period in 2022, primarily due to: (i) an increase related to utilization of lead generation channels, primarily related to our credit card, Relay, and SoFi Money products;product, (ii) an increase in direct member incentives utilized to drive adoption and usage of our Financial Services products, the most significant of which was our SoFi Money product; (iii) an increase in product fulfillment costs, which included debit card fulfillment services, primarily related to our SoFi Money product; (iv)product, (iii) an increase in direct advertising costs primarily driven by an increase in online and digital advertising largely relatedintercompany expenses attributable to increased usage of technology platform services during the promotion of our SoFi Money product; and (v)2024 period, (iv) an increase in compensation and benefits expense, which reflected growth in the Financial Services segment that required additional staffing, as well as increased average compensationstaffing. This increase was partially offset by: (i) a decrease in 2023.lead generation expense, primarily related to our SoFi Money and credit card products, and (ii) a decrease in direct advertising costs primarily driven by a decrease in online and digital advertising largely related to our SoFi Money product.
Corporate/Other Non-Reportable Segment
Non-segment operations are classified as Corporate/Other, which includes net revenues associated with corporate functions, non-recurring gains and losses from non-securitization investment activities and interest income and realized gains and losses associated with investments in AFS debt securities, all of which are not directly related to a reportable segment. Net interest expense within Corporate/Other also reflects the financial impact of our capital management activities within the treasury function, which reflects the residual impact from FTP charges and FTP credits allocated to our reportable segments under our FTP framework. The following table presents the measure of total net lossincome (loss) for Corporate/Other:
| | | | | | | | | | | | | | | | | | | | | | | | | | | | | | | | | | | | | | | | | | | | | | | | | | |
| | Three Months Ended
September 30, | | 2023 vs 2022 | | Nine Months Ended
September 30, | | 2023 vs 2022 |
| ($ in thousands) | | 2023 | | 2022 | | $ Change | | % Change | | 2023 | | 2022 | | $ Change | | % Change |
| Net interest expense | | $ | (13,926) | | | $ | (9,824) | | | $ | (4,102) | | | 42 | % | | $ | (52,396) | | | $ | (19,326) | | | $ | (33,070) | | | 171 | % |
| Noninterest loss | | (6,008) | | | (1,615) | | | (4,393) | | | 272 | | | (10,547) | | | (7,958) | | | (2,589) | | | 33 | |
Total net loss | | $ | (19,934) | | | $ | (11,439) | | | $ | (8,495) | | | 74 | % | | $ | (62,943) | | | $ | (27,284) | | | $ | (35,659) | | | 131 | % |
| | | | | | | | | | | | | | | | | | | | | | | | | | | | | | | | | | |
| | | | | | Three Months Ended
March 31, | | 2024 vs 2023 |
| ($ in thousands) | | | | | | | | | | 2024 | | 2023 | | $ Change | | % Change |
| Net interest income (expense) | | | | | | | | | | $ | 15,968 | | | $ | (23,074) | | | $ | 39,042 | | | n/m |
| Noninterest income (loss) | | | | | | | | | | 53,634 | | | (837) | | | 54,471 | | | n/m |
Total net income (loss) | | | | | | | | | | $ | 69,602 | | | $ | (23,911) | | | $ | 93,513 | | | n/m |
Reconciliation of Directly Attributable Expenses
The following table reconciles directly attributable expenses allocated to our reportable segments to total noninterest expense in the condensed consolidated statements of operations and comprehensive loss:income (loss):
| | | Three Months Ended September 30, | | Nine Months Ended September 30, |
| | | | Three Months Ended March 31, | |
| | | | Three Months Ended March 31, | |
| | | | Three Months Ended March 31, | |
| ($ in thousands) | ($ in thousands) | | 2023 | | 2022 | | 2023 | | 2022 | ($ in thousands) | | | | | | 2024 | | 2023 |
| Reportable segments directly attributable expenses | Reportable segments directly attributable expenses | | $ | (311,244) | | | $ | (283,220) | | | $ | (906,595) | | | $ | (765,360) | |
| Intercompany expenses | Intercompany expenses | | 6,950 | | | 1,757 | | | 15,645 | | | 4,198 | |
| Expenses not allocated to segments: | Expenses not allocated to segments: | |
| Share-based compensation expense | Share-based compensation expense | | (62,005) | | | (77,855) | | | (202,109) | | | (235,018) | |
| Share-based compensation expense | |
| Share-based compensation expense | |
Employee-related costs(1) | Employee-related costs(1) | | (63,728) | | | (49,248) | | | (181,147) | | | (137,254) | |
| Depreciation and amortization expense | Depreciation and amortization expense | | (52,516) | | | (40,253) | | | (147,967) | | | (109,007) | |
| Goodwill impairment expense | | (247,174) | | | — | | | (247,174) | | | — | |
| Other corporate and unallocated expenses(2) | |
Other corporate and unallocated expenses(2) | |
Other corporate and unallocated expenses(2) | Other corporate and unallocated expenses(2) | | (74,420) | | | (49,617) | | | (190,354) | | | (154,187) | |
| Total noninterest expense | Total noninterest expense | | $ | (804,137) | | | $ | (498,436) | | | $ | (1,859,701) | | | $ | (1,396,628) | |
(1)Includes compensation, benefits, restructuring charges, recruiting, certain occupancy-related costs and various travel costs of executive management, certain technology groups and general and administrative functions that are not directly attributable to the reportable segments.
(2)Represents corporate overhead costs that are not allocated to reportable segments, which primarily includes corporate marketing and advertising costs, tools and subscription costs, professional services costs, corporate and FDIC insurance costs, foreign currency translation adjustments and transaction-related expenses.
Liquidity and Capital Resources Liquidity
We strive to maintain access to diverse funding sources and ample liquidity to fund our operating requirements, to pursue strategic growth initiatives and to meet our legal and regulatory requirements. Our principal sources of liquidity are our cash and cash equivalents, including cash from operations, and investments in other highly liquid assets.
We maintain a Capital and Asset Liability ManagementCALM policy (“CALM”) that outlines specific requirements relating to the oversight of SoFi Technologies, Inc. (and its subsidiaries) capital planning, financial planning and forecasting, liquidity risk management, contingency funding planning, interest rate risk management, cash management and financial operations, among other activities. Oversight of these activities is the responsibility of our Asset Liability Committee (the "ALCO").ALCO. The ALCO is comprised of a cross-functional leadership team that is responsible for managing our use of capital, liquidity, sources and uses of funding, and sensitivities to various market risks, by identifying key risks and exposures, monitoring them appropriately, establishing tolerances and limits, and mitigating risks where appropriate, and facilitating timely responses to changes in the macroeconomic environment and liquidity events to ensure the Company has the ability to meet its obligations.
The following table summarizes our total liquidity reserves:
| | September 30, 2023 |
| Amount Available | | Amount Borrowed / Utilized | | Remaining Available Capacity |
| March 31, 2024 | | | March 31, 2024 |
| Amount Available | | | Amount Available | | Amount Borrowed / Utilized | | Remaining Available Capacity |
| Cash and cash equivalents | Cash and cash equivalents | $ | 2,813,876 | | | n/a | | $ | 2,813,876 | |
Investments in available-for-sale debt securities(1) | 486,091 | | | n/a | | 486,091 | |
Investments in AFS debt securities(1) | |
Warehouse facilities(2) | Warehouse facilities(2) | 8,420,000 | | | 3,961,751 | | | 4,458,249 | |
Revolving credit facility(3) | Revolving credit facility(3) | 645,000 | | | 491,143 | | | 153,857 | |
FHLB advances(1) | 150,247 | | | 13,700 | | | 136,547 | |
Correspondent bank lines of credit(4) | 50,000 | | | — | | | 50,000 | |
FHLB advances(4) | |
Other lines of credit(5) | |
| Total liquidity | Total liquidity | $ | 12,565,214 | | | $ | 4,466,594 | | | $ | 8,098,620 | |
(1)As of September 30, 2023, we had $135.9 million of investmentExcludes investments in AFS debt securities and $23.0 million of loanswhich are pledged as collateral to the FHLB to secure undrawn borrowing capacity of $150.2 million, of which $13.7 million was utilized to secure letters of credit.FHLB.
(2)Includes personal loan, student loan credit card and risk retention warehouse facilities. For risk retention facilities, we only include capacity amounts wherein we can pledge additional asset-backed bonds and residual investments as of the date indicated. As of September 30, 2023,March 31, 2024, warehouse facility maturity dates ranged from JanuaryApril 2024 through January 2032.October 2027. See Note 9. Debt to the Notes to Condensed Consolidated Financial Statements for additional information.
(3)As of September 30, 2023,March 31, 2024, the amount utilized under the revolving credit facility includes $5.1$13.1 million utilized to secure a letterletters of credit. See Note 9. Debt to the Notes to Condensed Consolidated Financial Statements for additional information.
(4)As of March 31, 2024, we had $115.7 million of investments in AFS debt securities and $54.3 million of loans pledged as collateral to the FHLB to secure undrawn borrowing capacity of $151.0 million, of which $27.2 million was utilized to secure letters of credit.
(5)Borrowing capacity with correspondent banks is unsecured.
We believe our existing liquidity will be sufficient to cover net losses, meet our existing working capital and capital expenditure needs as well as our planned growth for at least the next 12 months.
Sources of Funding
Our primary funding sources include SoFi Bank deposits, warehouse funding, common and preferred equity capital, convertible debt, corporate revolving credit facility, securitizations, and other financings.
We offer deposit accounts (checking and savings accounts) to our members through SoFi Bank. We also source brokered and non-brokered wholesale deposits, which include certificates of deposit. As of September 30, 2023March 31, 2024 and December 31, 2022,2023, time deposit balances due in less than one year totaled $2.1$2.2 billion and $1.0$2.6 billion, respectively. As of September 30, 2023March 31, 2024 and December 31, 2022,2023, the amount of uninsured deposits totaled $361.4$413.2 million and $615.9$348.1 million, respectively. In 2023, we provided our members with access to expanded FDIC insurance coverage through a network of participating banks, which contributed to the decrease in uninsured deposits relative to year end. As of September 30, 2023,March 31, 2024, approximately 98% of our total deposits were insured.
Uses of Funding
Our primary uses of funds include loan originations, investments in our business, such as technology and product investments, andas well as sales and marketing initiatives, as well as the losses generated byinitiatives. In addition, our Financial Services segment on a year-to-date basis.has historically generated losses, and achieved contribution profit for the first time during the third quarter of 2023. Our capital expenditures have historically been less significant relative to our operating and financing cash flows, and we expect this trend to continue for the foreseeable future.
As of September 30, 2023,March 31, 2024, we had debt obligations, common stock and redeemable preferred stock outstanding.
Borrowings
Our borrowings primarily included our loan and risk retention warehouse facilities, asset-backed securitization debt, revolving credit facility and convertible notes. The amount of financing actually advanced on each individual loan under our loan warehouse facilities, as determined by agreed-upon advance rates, may be less than the stated advance rate depending, in part, on changes in underlying loan characteristics of the loans securing the financings. Each of our loan warehouse facilities allows the lender providing the funds to evaluate the market value of the loans that are serving as collateral for the borrowings or advances being made. The amount owed and outstanding on our loan warehouse facilities fluctuates significantly based on our origination volume, sales volume, the amount of time we strategically hold loans on our balance sheet, and the amount of loans being funded with our cash or member deposits.
Refer to Note 9. Debt to the Notes to Condensed Consolidated Financial Statements in this Form 10-Q and to Note 12. Debt to the Notes to Consolidated Financial Statements in our Annual Report on Form 10-K for additional information on our borrowing arrangements and the capped call transactions entered into in connection with the issuance of our convertible notes.
Covenants
We have various affirmative and negative financial covenants, as well as non-financial covenants, related to our warehouse debt and revolving credit facility, as well as our Series 1 Redeemable Preferred Stock. Additionally, we have compliance requirements associated with our convertible notes, and certain provisions of the arrangement could change in the event of a “Make-Whole Fundamental Change”, as defined in the indenture governing such convertible notes.
The availability of funds under our warehouse facilities and revolving credit facility is subject to, among other conditions, our continued compliance with the covenants. These financial covenants include, but are not limited to, maintaining: (i) a certain minimum tangible net worth, (ii) minimum unrestricted cash and cash equivalents, (iii) a maximum leverage ratio of total debt to tangible net worth, and (iv) minimum risk-based capital and leverage ratios. A breach of these covenants can result in an event of default under these facilities and allows the lenders to pursue certain remedies. See Note 9. Debt to the Notes to Condensed Consolidated Financial Statements for additional information. Our subsidiaries are restricted in the amount that can be distributed to SoFi only to the extent that such distributions would cause the financial covenants to not be met.
In addition, pursuant to our amended and restated agreement related to our Series 1 Redeemable Preferred Stock, we are subject to the following financial covenants:
•Tangible net worth to total debt ratio requirement, which excludes our warehouse, risk retention and securitization related debt;
•Tangible net worth to Series 1 Redeemable Preferred Stock ratio requirement; and
•Minimum excess equity requirements, where the measure of equity includes permanent equity and SoFi Technologies Redeemable Preferred Stock (exclusive of Series 1 Redeemable Preferred Stock), as applicable.
We were in compliance with all covenants as of September 30, 2023.March 31, 2024.
Capital Management
SoFi Technologies, a bank holding company, and SoFi Bank, a nationally chartered association, are required to comply with regulatory capital rules issued by the Federal Reserve and other U.S. banking regulators, including the OCC and FDIC. From time to time, we may contribute capital to SoFi Bank. We are required to manage our capital position to maintain sufficient capital to satisfy these regulatory rules and support our business activities, including the requirement to maintain minimum regulatory capital ratios in accordance with the Basel Committee on Banking Supervision standardized approach for U.S. banking organizations (U.S. Basel III). If the Federal Reserve finds that we are not “well-capitalized” or “well-managed”, we would be required to take remedial action, which may contain additional limitations or conditions relating to our activities.
The Federal Reserve and the OCC have authority to prohibit bank holding companies and banks, respectively, from paying dividends if, in their opinion, the payment of dividends would constitute an unsafe or unsound practice. Under the National Bank Act, SoFi Bank generally may, without prior approval of the OCC, declare a dividend so long as the total amount of all dividends (common and preferred), including the proposed dividend, in the current year do not exceed net income for the current year to date plus retained net income for the prior two years. However, taking into account a wide range of factors, the OCC may object and therefore prevent SoFi Bank from paying dividends to the Company. As such, as of September 30, 2023,March 31, 2024, the Bank would not have any funds free of restrictions that are available for dividend payments. Restrictions on the ability of SoFi Bank to pay dividends to the parent company could also impact the Company’s ability to pay dividends to common stockholders.
Additionally, under the Federal Reserve’s capital rules, our bank holding company’s ability to pay dividends is restricted if we do not maintain capital above the capital conservation buffer, as discussed below. Further, a policy statement of the Federal Reserve provides that, among other things, a bank holding company generally should not pay dividends on regulatory capital instruments if its net income for the past year is not sufficient to cover both the cash dividends and a rate of earnings retention that is consistent with the company’s capital needs, asset quality, and overall financial condition. Based on this Federal Reserve policy, as of September 30, 2023,March 31, 2024, the Company generally would not have any funds free of restrictions available for dividend payments on regulatory capital instruments.
These requirements establish required minimum ratios for Common Equity Tier 1 (“CET1”)CET1 risk-based capital, Tier 1 risk-based capital, total risk-based capital and a Tier 1 leverage ratio; set risk-weighting for assets and certain other items for purposes of the risk-based capital ratios; and define what qualifies as capital for purposes of meeting the capital requirements. Additionally, regulatory capital rules include a capital conservation buffer of 2.5% that is added on top of each of the minimum risk-based capital ratios in order to avoid restrictions on capital distributions and discretionary bonuses. In addition, the Federal Reserve and the OCC have authority to require banking organizations subject to their supervision to hold additional amounts of capital in excess of the minimum risk-based capital ratios.
The risk- and leverage-based capital ratios and amounts are presented below:
| | September 30, 2023 |
| | March 31, 2024 | |
| ($ in thousands) | |
| ($ in thousands) | |
| ($ in thousands) | ($ in thousands) | | Amount | | Ratio | | Required Minimum(1) | | Well-Capitalized Minimum(2) | | Amount | | Ratio | | Amount | | Ratio | | Required Minimum(1) | | Well-Capitalized Minimum(2) |
| SoFi Bank | SoFi Bank | | | | | | | | |
| CET1 risk-based capital | |
| CET1 risk-based capital | |
| CET1 risk-based capital | CET1 risk-based capital | | $ | 2,916,462 | | | 15.9 | % | | 7.0 | % | | 6.5 | % | | $ | 3,386,874 | | | 17.0 | | 17.0 | % | | $ | 3,331,616 | | | 17.3 | | 17.3 | % | | 7.0 | % | | 6.5 | % |
| Tier 1 risk-based capital | Tier 1 risk-based capital | | 2,916,462 | | | 15.9 | | | 8.5 | | | 8.0 | |
| Total risk-based capital | Total risk-based capital | | 2,968,169 | | | 16.2 | | | 10.5 | | | 10.0 | |
| Tier 1 leverage | Tier 1 leverage | | 2,916,462 | | | 15.8 | | | 4.0 | | | 5.0 | |
| Risk-weighted assets | Risk-weighted assets | | 18,378,777 | | |
| Quarterly adjusted average assets | Quarterly adjusted average assets | | 18,498,763 | | |
| Quarterly adjusted average assets | |
| Quarterly adjusted average assets | |
| SoFi Technologies | SoFi Technologies | |
| SoFi Technologies | |
| SoFi Technologies | |
| CET1 risk-based capital | |
| CET1 risk-based capital | |
| CET1 risk-based capital | CET1 risk-based capital | | $ | 3,292,842 | | | 14.3 | % | | 7.0 | % | | n/a | | $ | 3,991,968 | | | 17.1 | | 17.1 | % | | $ | 3,439,969 | | | 15.0 | | 15.0 | % | | 7.0 | % | | n/a |
| Tier 1 risk-based capital | Tier 1 risk-based capital | | 3,292,842 | | | 14.3 | | | 8.5 | | | n/a | Tier 1 risk-based capital | | 3,991,968 | | | 17.1 | | 17.1 | | | 3,439,969 | | 3,439,969 | | | 15.0 | | 15.0 | | | 8.5 | | 8.5 | | | n/a | | n/a |
| Total risk-based capital | Total risk-based capital | | 3,344,549 | | | 14.5 | | | 10.5 | | | n/a | Total risk-based capital | | 4,042,980 | | | 17.3 | | 17.3 | | | 3,494,458 | | 3,494,458 | | | 15.3 | | 15.3 | | | 10.5 | | 10.5 | | | n/a | | n/a |
| Tier 1 leverage | Tier 1 leverage | | 3,292,842 | | | 13.6 | | | 4.0 | | | n/a | Tier 1 leverage | | 3,991,968 | | | 14.0 | | 14.0 | | | 3,439,969 | | 3,439,969 | | | 12.8 | | 12.8 | | | 4.0 | | 4.0 | | | n/a | | n/a |
| Risk-weighted assets | Risk-weighted assets | | 23,067,995 | | |
| Quarterly adjusted average assets | Quarterly adjusted average assets | | 24,212,987 | | |
| Quarterly adjusted average assets | |
| Quarterly adjusted average assets | |
(1)Required minimums presented for risk-based capital ratios include the required capital conservation buffer.
(2)The well-capitalized minimum measure is applicable at the bank level only.
As of September 30,March 31, 2024 and December 31, 2023, our regulatory capital ratios exceeded the thresholds required to be regarded as a well-capitalized institution, and meet all capital adequacy requirements to which we are subject. There have been no events or conditions since September 30, 2023March 31, 2024 that management believes would change the categorization.
Commitments
In addition to our warehouse facility borrowings, revolving credit facility borrowings and convertible notes, our material commitments requiring, or potentially requiring, the use of cash in future periods primarily include commitments
associated with being the named sponsor of SoFi Stadium, including operating lease obligations and finance lease obligations, which expire in 2040, as well as sponsorship and advertising opportunities related to sponsorship, advertising, and cloud computing agreements under which we are required to make payments over the stadium itself andlife of the surrounding performance venue and planned retail district, and a three-year marketing arrangement entered into during 2022.agreements. Additional material commitments include operating lease obligations primarily associated with office premises and the remaining commitment related to a four-year cloud computing services arrangement that we executedfinance lease obligations which expire in the fourth quarter of 2021.2040.
Guarantees
We may require liquidity resources associated with our guarantee arrangements. As a component of our loan sale agreements, we make certain representations to third parties that purchased our previously held loans. We have a three-year obligation to GSEs on loans that we sell to GSEs, to repurchase any originated loans that do not meet certain GSE guidelines, and we are required to pay the full initial purchase price back to the GSEs. In addition, we make standard representations and warranties related to personal, student and home loan transfers, as well as limited credit-related repurchase guarantees on certain such transfers. If realized, any of the repurchases would require the use of cash. See Note 15. Commitments, Guarantees, Concentrations and Contingencies to the Notes to Condensed Consolidated Financial Statements for further information on these and other guarantee obligations. We believe we have adequate liquidity to meet these expected obligations.
Factors Affecting Liquidity
We are currently dependent on the success of our lending business. The primary drivers of operating cash flows related to our Lending segment are origination volume, the holding period of our loans, loan sale execution and the timing of loan repayments. Our ability to access whole loan buyers, to sell our loans on favorable terms, to maintain adequate warehouse capacity at favorable terms, to access new deposits and grow existing deposits and to strategically manage our continuing financial interest in securitization-related transfers is critical to our growth strategy and our ability to have adequate liquidity to fund our balance sheet. Our ability to attract and maintain deposits can be impacted by, among other things, general economic conditions, the condition of the banking sector (such as bank failures or exposure to credit, market, operational, legal and reputational risks), competition from other financial services firms, idiosyncratic events and the interest rates we offer, which can impact our liquidity from deposits. Through the third quarter ofIn 2023, we continuedbegan to have strong deposit contribution. During 2023, we also providedprovide our members with access to expanded FDIC insurance
coverage through a network of participating banks.banks in our Insured Deposit Program. We continued to have strong deposit contribution through the first quarter of 2024.
There is no guarantee that we will be able to execute on our strategy as it relates to the timing and pricing of securitization-related transfers. Therefore, we may hold securitization interests for longer than planned or be forced to liquidate at suboptimal prices. Securitization transfers are also negatively impacted during recessionary periods, wherein purchasers may be more risk averse.
Our cash flows from operations have also been impacted by material net losses. If our current net losses continue for the foreseeable future and we are not able to achieve GAAP net income profitability in 2023 as currently expected, we may raise additional capital in the form of equity or debt, which may not be at favorable terms when compared to previous financing transactions.
Further, future uncertainties around the demand for our personal loans, home loans and around the student loan refinance market in general, including as a result of worsening macroeconomic conditions or continued turmoil in the banking and financial services sectors, should be considered when assessing our future liquidity and solvency prospects. In the future, our loan origination volume and our resulting loan balances, and any positive cash flows thereof, could also be lower based on strategic decisions to tighten our credit standards.
In addition to our ability to pledge unencumbered loans against available warehouse capacity, we have relationships with whole loan buyers who have historically demonstrated strong demand for our loans. Securitization markets can also generate additional liquidity; however, financing through the securitization market could result in worse execution as compared to whole loans sales depending on market conditions and, in certain cases, we are required to maintain a minimum investment due to securitization risk retention rules.
Additionally, our securitization transactions require us to maintain a continuing financial interest in the form of securitization investments when we deconsolidate the SPE or in consolidation of the SPE when we have a significant financial interest. In either instance, the continuing financial interest requires us to maintain capital in the SPE that would otherwise be available to us if we had sold loans through a different channel. As it relates to our securitization debt, the maturity of the notes issued by the various trusts occurs upon either the maturity of the loan collateral or full payment of the loan collateral held in the trusts, the timing of which cannot be reasonably estimated. Our own liquidity resources are not required to make any contractual payments on our securitization borrowings.
SoFi Technologies, Inc.
Our cash flows from operations have also historically been impacted by material net losses. While we achieved net income profitability for the first time during the fourth quarter of 2023, changing business, macroeconomic or other conditions could potentially lead us, in the future, to raise additional capital in the form of equity or debt, which may not be at favorable terms when compared to previous financing transactions.Our long-term liquidity strategy includes continuing to grow our deposit base, maintaining adequate warehouse capacity, maintaining corporate debt and other sources of financing, as well as effectively managing the capital raised through debt and equity transactions. Although our goal is to increase our cash flow from operations, there can be no assurance that our future operating plans will lead to improved operating cash flows.
The Federal Deposit Insurance Act (“FDIA”)FDIA and FDIC regulations generally limit the ability of an insured depository institution to accept, renew or roll over any brokered deposit unless the institution’s capital category is “well capitalized” or, with the FDIC’s approval, “adequately capitalized.” As of September 30, 2023,March 31, 2024, our regulatory capital ratios exceeded the thresholds required to be regarded as a well-capitalized institution, and meet all capital adequacy requirements to which we are subject.
On August 16, 2022, the Inflation Reduction Act (the "IRA"), was signed into law. The IRA enacted a 15% corporate book minimum tax and a 1% excise tax on stock repurchases effective after December 31, 2022. The IRA is not expected to have a material impact on our operations or cash flows for the foreseeable future.
Cash Flow and Liquidity Analysis
The following table provides a summary of cash flow data:
| | | | Nine Months Ended September 30, | | | Three Months Ended March 31, |
| ($ in thousands) | ($ in thousands) | | 2023 | | 2022 | ($ in thousands) | | 2024 | | 2023 |
| Net cash used in operating activities | | $ | (6,979,198) | | | $ | (4,837,023) | |
| Net cash provided by (used in) operating activities | |
| Net cash used in investing activities | Net cash used in investing activities | | (476,335) | | | (54,926) | |
| Net cash provided by financing activities | Net cash provided by financing activities | | 8,906,046 | | | 5,384,714 | |
Cash Flows from Operating Activities
For the ninethree months ended September 30, 2023,March 31, 2024, net cash used inprovided by operating activities of $7.0 billion$738.2 million stemmed from net income of $88.0 million, a net loss of $348.7 million and an unfavorablefavorable change in our operating assets net of operating liabilities of $7.3 billion, partially offset by$632.0 million, and a positive adjustment for non-cash items of $647.7$18.2 million. The change in operating assets net of operating liabilities was primarily a result of our loan origination and sales activities. We originated loans of $13.1$3.6 billion during the period and also purchased
loans of $197.5$17.7 million. These cash uses were partially offset by principal payments on loans of $5.1$2.3 billion and proceeds from loan sales of $839.8 million.$1.8 billion.
For the ninethree months ended September 30, 2022,March 31, 2023, net cash used in operating activities of $4.8$2.2 billion stemmed from a net loss of $280.4$34.4 million and an unfavorable change in our operating assets net of operating liabilities of $5.0$2.3 billion, partially offset by a positive adjustment for non-cash items of $423.1$120.7 million. The change in operating assets net of operating liabilities was primarily a result of our loan origination and sales activities. We originated loans of $10.0$3.6 billion during the period and also purchased loans of $1.6 billion.$40.6 million. These cash uses were largelypartially offset by principal payments on loans of $2.0$1.4 billion and proceeds from loan sales of $4.7 billion.$77.9 million.
Cash Flows from Investing Activities
For the ninethree months ended September 30, 2023,March 31, 2024, net cash used in investing activities of $476.3 million$1.3 billion was primarily attributable to $990.6 million related to loan activities. Changes in loans held for investment was primarily a result of loan originations during the period of $1.2 billion, partially offset by proceeds from loan sales of $122.7 million and principal payments on loans of $105.3 million, as well as net outflows related to credit cards of $9.9 million. Other cash uses included net purchases of $280.9$237.3 million related to our investments in AFS debt securities, $72.3 million related to business combinations, net of cash acquired, which includes our acquisition of Wyndham and settlements of vested employee performance awards associated with the Technisys Merger, $97.1 million related to loan activities, primarily driven by credit cards, $77.1$32.0 million for purchases of property, equipment and software, which primarily included internally-developed software and purchased software, and $45.9$11.2 million related to purchases of non-securitization investments, primarily FRB stock and FHLB stock. These uses were partially offset by proceeds of $101.3$9.5 million from our securitization investments.
For the ninethree months ended September 30, 2022,March 31, 2023, net cash used in investing activities of $54.9$40.2 million was primarily attributable to proceeds of $99.8 million from our securitization investments, and the aggregate net cash acquired from the Technisys Merger and Bank Merger of $58.5 million. These sources were more than offset by net cash uses of $130.1$29.5 million related to loan activities, primarily driven by credit cards, $70.5$23.7 million for purchases of property, equipment and software, which primarily included internally-developed software and purchased software, $17.9 million for settlements of vested employee performance awards, which was a component of the purchase consideration related to the Technisys Merger, and $7.6 million related to purchases of non-securitization investments, primarily FRB stock and FHLB stock. These uses were partially offset by net cash usesproceeds of $7.2$25.4 million related to our investments in AFS debt securities.
SoFi Technologies, Inc.
securities, and $16.0 million from our securitization investments.Cash Flows from Financing Activities
For the ninethree months ended September 30, 2023,March 31, 2024, net cash provided by financing activities of $8.9$1.1 billion was primarily attributable to net cash sources from our SoFi Bank deposits of $8.3 billion. Additionally, our$2.9 billion and proceeds from the issuance of our 2029 convertible notes of $845.3 million. This was partially offset by our net change in debt financing activityfacilities of $1.2$2.4 billion exceededrelated to our warehouses and debt repayments of $595.2 million, which were primarily related to our warehouse facilities.$170.4 million. Our payments of debt issuance costs were in the normal course of business and reflective of our recurring debt warehouse facility activity, which involves securing new warehouse facilities and extending existing warehouse facilities.
For the ninethree months ended September 30, 2022,March 31, 2023, net cash provided by financing activities of $5.4$3.4 billion was primarily attributable to net cash sources from our SoFi Bank deposits of $4.9$2.8 billion. Additionally, our proceeds from debt financing activity of $821.1 million were partially offset by$0.8 billion exceeded our debt repayments of $266.1 million,$0.1 billion, which were primarily related to our warehouse facilities. Our payments of debt issuance costs were in the normal course of business and reflective of our recurring debt warehouse facility activity, which involves securing new warehouse facilities and extending existing warehouse facilities.
Other Arrangements
We enter into arrangements in which we originate loans, establish an SPE and transfer loans to the SPE, which has historically served as an important source of liquidity. We also retain the servicing rights of the underlying loans and hold additional interests in the SPE. When an SPE is determined not to be a VIE or when an SPE is determined to be a VIE but we are not the primary beneficiary, the SPE is not consolidated. In addition, a significant change to the pertinent rights of other parties or our pertinent rights, or a significant change to the ranges of possible financial performance outcomes used in our assessment of the variability of cash flows due to us, could impact the determination of whether or not a VIE is consolidated. VIE consolidation and deconsolidation may lead to increased volatility in our financial results and impact period-over-period comparability.
Historically, we have established personal loan trusts and student loan trusts that were created and designed to transfer credit and interest rate risk associated with the underlying loans through the issuance of collateralized notes and residual certificates. We hold a variable interest in the trusts through our ownership of collateralized notes in the form of asset-backed bonds and residual certificates. The residual certificates absorb variability and represent the equity ownership interest in the equity portion of the personal loan and student loan trusts.
We are also the servicer for all trusts in which we hold a financial interest. Although we have the power as servicer to perform the activities that most impact the economic performance of the VIE, we do not hold a significant financial interest in the trusts and, therefore, we are not the primary beneficiary. Further, we do not provide financial support beyond our initial equity investment, and our maximum exposure to loss as a result of our involvement with nonconsolidated VIEs is limited to our investment. For a more detailed discussion of nonconsolidated VIEs, including related activity during the period, see Note 7. Securitization and Variable Interest Entities to the Notes to Condensed Consolidated Financial Statements.
Financial Condition Summary
Changes in the composition and balance of our assets and liabilities as of September 30, 2023March 31, 2024 compared to December 31, 20222023 were principally attributed to the following:
•an increase of $1.5 billion$532.3 million in cash and cash equivalents and restricted cash and restricted cash equivalents. See “Cash Flow and Liquidity Analysis” for further discussion of our cash flow activity;
•a decrease in loans held for sale of $280.3 million, which was primarily related to personal loan sales in excess of originations;
•an increase in loans held for saleinvestment of $7.4 billion, which was$522.7 million, primarily related to increased personal loan originationssenior secured loans and longer loan holding periods;periods on student loans;
•an increase in investments in AFS debt securities of $243.3 million;
•an increase in deposits of $8.3$3.0 billion, which was primarily related to increased savings deposits from members and increased brokered deposits;members; and
•an increasea decrease of $902.8 million$2.4 billion in gross warehouse and risk retention facility debt to support our originations during the current period, which reflected the net impact of $9.7$1.0 billion of cash borrowings and $8.8$3.5 billion of cash repayments.
Critical Accounting Policies and Estimates Our consolidated financial statements have been prepared in accordance with GAAP. In preparing our consolidated financial statements, we make judgments, estimates and assumptions that affect reported amounts of assets and liabilities, as well as revenues and expenses. We base our assumptions, judgments and estimates on historical experience and various other factors that we believe to be reasonable under the circumstances. The results involve judgments about the carrying values of
assets and liabilities not readily apparent from other sources. Actual results could differ materially from these estimates under different assumptions or conditions. We regularly evaluate our estimates, assumptions and judgments, particularly those that include the most difficult, subjective or complex judgments and which are often about matters that are inherently uncertain. We evaluate our critical accounting policies and estimates on an ongoing basis and update them as necessary based on changes in market conditions or factors specific to us. There have been no material changes in our significant accounting policies or critical accounting estimates during 2023.2024. For a complete discussion of our significant accounting policies and critical accounting estimates, refer to our Annual Report on Form 10-K for the year ended December 31, 20222023 within Note 1. Organization, Summary of Significant Accounting Policies and New Accounting Standards to the Notes to Consolidated Financial Statements and “Management’s Discussion and Analysis of Financial Condition and Results of Operations—Critical Accounting Policies and Estimates”.
Goodwill
We assess goodwill for impairment at the reporting unit level on an annual basis with a testing date of October 1 or whenever indicators of impairment exist. Goodwill impairment assessments require a significant amount of management judgment, and meaningful change in one or more of the underlying forecasts, estimates, or assumptions used in testing goodwill for impairment could result in a material impact on the Company’s results of operations and financial position.
In interim periods, we perform a qualitative assessment for our reporting units to which goodwill is allocated to determine if, for any reporting unit, it is more likely than not that the fair value of the reporting unit is less than its carrying amount. In addition to the factors noted in our Annual Report on Form 10-K for the year ended December 31, 20222023 for performing such an assessment, management also considers actual results for the current period and updated internal forecasts as compared to prior internal forecasts and other assumptions used in the quantitative annual assessment.
An impairmentBased on this assessment, while management does not believe that the goodwill in any of a reporting unit’s goodwill is determined based on the amount by which the reporting unit’s carrying value exceeds its fair value, limited to the amountunits is impaired as of goodwill allocated to the reporting unit. An interim test is performed when events or circumstances occur that may indicateMarch 31, 2024, management has determined that it is more likely than not that the fair value of any reporting unit may be less than its carrying value. During the third quarter of 2023, the Technology Platform segment continued to experience slower growth rates than expected at the time of acquisition due to: (i) the uncertain macroeconomic environment, which has continued to impact customer spend volume, and (ii) continued longer sales cycles as a result of our shift in strategy to focus on diversified durable growth driven by potential new partners with scaled customer bases and interest in multiple Technology Platform products. These factors constituted a triggering event for goodwill testing purposes. As a result, we performed an interim quantitative test on the Galileo and Technisys reporting units to determine the existence and magnitude of potential goodwill impairment. We determined it was not necessary to perform an interim goodwill impairment test for our other reporting units.
Management calculated the fair value amountvalues of the Galileo and Technisys reporting units using a combinationwithin the Technology Platform segment, with goodwill of a discounted cash flow (“DCF”) calculation, which is a form$1.34 billion, are not substantially in excess of the income approach, and a market multiples calculation, which is a form of the market approach. The discount rates used for the Galileo and Technisys reporting units in our interim quantitative assessment were 14.0% and 23.5%, respectively. The higher discount rate at Technisys was primarily driven by macroeconomic factors in Latin America, specifically the highly inflationary economic environment in Argentina. Additionally, management applied a terminal year long-term growth rate of 3.5% to both reporting units, consistent with previous quantitative assessments. As a result of this assessment, the fair value of the Galileo and Technisys reporting units were determined to be below their carrying values by 9.9% and 14.8%, respectively, resulting in management recognizing non-cash goodwill impairment charges of $124.5 million and $122.7 million for the Galileo and Technisys reporting units, respectively.amounts.
As of September 30, 2023, if the discount rate applied to the estimated cash flows was increased or decreased by 50 basis points, the fair value of the Galileo and Technisys reporting units would decrease or increase by 6% and 4%, respectively. Similarly, if the long-term growth rate was increased or decreased by 50 basis points, the fair value of the Galileo and Technisys reporting units would increase or decrease by approximately 3% and 1%, respectively.
Management cannot predict the occurrence of certain events or changes in circumstances that might adversely affect the value of goodwill. We continue to monitor the aforementioned conditions, general macroeconomic deterioration, including the interest rate environment, inflationary pressures, and the potential for a prolonged economic downturn or recession, as well as other factors, including those listed in "Cautionary"Cautionary Statement Regarding Forward-Looking Statements"Statements" and "Risk Factors""Risk Factors" in Part II, Item 1A of this Quarterly Report. Further persistence of the aforementioned conditions and these other factors could result in additional impairment charges in future periods.
Recent Accounting Standards Issued, But Not Yet Adopted
See Note 1. Organization, Summary of Significant Accounting Policies and New Accounting Standards to the Notes to Condensed Consolidated Financial Statements herein and Note 1. Organization, Summary of Significant Accounting Policies and New Accounting Standards to the Notes to Consolidated Financial Statements in our Annual Report on Form 10-K for the year ended December 31, 2022.2023.
Item 3. Quantitative and Qualitative Disclosures About Market Risk
In the normal course of business, we are subject to a variety of market-related risks that can affect our operations and profitability. We broadly define these areas of risk as interest rate risk, credit risk, market risk, counterparty risk and operational risk. Historically, substantially all of our revenue and operating expenses were denominated in United States dollars. We may in the future be subject to increasing foreign currency exchange rate risk with our acquisition of a foreign company. Foreign currency exchange rate risk is the risk that our financial position or results of operations could be positively or negatively impacted by fluctuations in exchange rates. Exchange rate risk was not a material risk for the Company during the periods presented. For additional information on our market risks, see Part II, Item 7A “Quantitative and Qualitative Disclosures About Market Risk” in our Annual Report on Form 10-K for the year ended December 31, 2022.2023.
Interest Rate Risk
We are exposed to the risk of loss to future earnings, values or future cash flows that may result from changes in market discount rates or overall market conditions, such as instability in the banking and financial services sectors. We are subject to interest rate risk associated with our loans, securitization investments (including residual investments and asset-backed bonds), servicing rights variable-rate debt, deposit accounts and investments in AFS debt securities.securities, which are measured at fair value on a recurring basis using a discounted cash flow methodology in which the discount rate represents an estimate of the required rate of return by market participants. Our loans with variable interest rates are exposed to interest rate volatility, which impacts the amount of recognized interest income. Our securitization residual investments are carried at fair value, which is subject to changes in market value by virtue of the impact of interest rates on the market yield of the residual investments. The value and earnings of our asset-backed bonds, which are associated with our personal loans and student loans, have a converse relationship to the movement of interest rates. That is, as interest rates rise, bond values and earnings fall and vice versa. Additionally, we are subject to interest rate risk on our variable-rate warehouse facilities and our revolving credit facility. Market interest rates may also drive the interest we offer to members on their deposits. Future funding activities may increase our exposure to interest rate risk, as the interest rates payable on such funding may be tied to SOFR or another representative alternative reference rate. We are also exposed to market risk through our investments in equity securities, which are either measured at fair value using the net asset value practical expedient or which may have positive or negative adjustments that impact our results of operations resulting from observable price changes based on current market conditions.
Interest rate risk also occurs in periods where changes in short-term interest rates result in loans being originated with terms that provide a smaller interest rate spread above the financing terms of our warehouse facilities or above the interest rate we offer on deposits, which can negatively impact our realized net interest income. We utilize simulations to evaluate changes in net interest income under multiple interest rate scenarios relative to the baseline forecast. The sensitivity is defined as the changes in net interest income relative to the baseline forecast.
The following table summarizes the potential effect on net interest income and fair value of interest rate sensitive financial assets and liabilities recorded on our consolidated balance sheet as of March 31, 2024, based upon a sensitivity analysis performed by management assuming a hypothetical, immediate and parallel increase and decrease in market interest rates of 100 basis points. The net interest income sensitivities are applied to our 12 month forecast, which incorporates market expectations of interest rates, contractual cash flows, repricing characteristics, and our projected business activity, including deposit forecasts as a key assumption. Our consolidated balance sheet is liability sensitive, given liabilities reprice faster than assets, resulting in higher net interest income in decreasing interest rate scenarios. The fair value sensitivities are applied only to
interest rate sensitive financial assets that existed at the balance sheet date, which included loans, securitization investments, servicing rights and investments in AFS debt securities as of March 31, 2024.
| | | | | | | | | | | | | | |
| | Impact if Interest Rates: |
| ($ in thousands) | | Increase 100 Basis Points | | Decrease 100 Basis Points |
| | | | |
| Fair value | | $ | (409,445) | | | $ | 435,776 | |
| Net interest income (expense) | | (23,790) | | | 29,131 | |
Credit Risk
We are subject to credit risk, which is the risk of default that results from a borrower’s inability or unwillingness to make contractually required loan payments or declines in home loan collateral values. Generally, all loans sold into the secondary market are sold without recourse. For such loans, our credit risk is generally limited to repurchase obligations due to fraud or origination defects. For loans that were repurchased or not sold in the secondary market, we are subject to credit risk to the extent a borrower defaults and we are not able to fully recover the principal balance. We believe that this risk is mitigated through the implementation of stringent underwriting standards, strong fraud detection tools and technology designed to comply with applicable laws and our standards. In addition, we believe that this risk is mitigated through the quality of our loan portfolio.
Market Risk
WeThe following table summarizes the potential effect on earnings over the next 12 months and the potential effect on the fair values of our loans for which we elected the fair value option and residual investments recorded on our consolidated balance sheet as of March 31, 2024 based on upon a sensitivity analysis performed by management assuming an immediate hypothetical change in credit loss rates by a rate of 10%. The fair value and earnings sensitivities are exposedapplied only to financial assets that existed at the risk of loss to future earnings, values or future cash flows that may result from changes in market discount rates or overall market conditions, such as instability in the banking and financial services sectors. We are exposed to such market risk directly through ourbalance sheet date, which included loans, investments in AFS debt securities loans, servicing rights(which had an immaterial impact from credit risk) and securitizationresidual investments held on our balance sheets, allas of whichMarch 31, 2024. Asset-backed bonds are measured at fair value on a recurring basis. Investments in AFS debt securities are valued utilizing quoted prices in actively traded markets or rely upon observable inputs other than quoted prices, dealer quotes in markets thatexcluded because they are not active and implied pricing derived from new issuances of similar securities. The other assets mentioned are measured at fair value using a discounted cash flow methodology in whichexpected to absorb the discount rate represents an estimatelosses of the required rate of return by market participants. The discount rates for our loans and securitization investments may change due to expected loan performance or changes in the expected returns of similar financial instruments available in the market. For our servicing rights, the discount rate is commensurate with the risk of the servicing asset cash flow, which variesVIE based on the characteristicsextent of overcollateralization and expected credit losses of the serviced loan portfolio. WeVIE. Alternatively, residual investments are also exposedsubject to market risk through our investments in equity securities, which are either measured at fair value usingcredit exposure, and by design this is the net asset value practical expedient or which may haveportion of the SPE that is expected to absorb the losses of the VIE.
positive or negative adjustments that impact our results of operations resulting from observable price changes based on current market conditions. | | | | | | | | | | | | | | |
| | Impact if Credit Loss Rates: |
| ($ in thousands) | | Increase 10 Percent | | Decrease 10 Percent |
| | | | |
| | | | |
| | | | |
| Fair value | | $ | (110,780) | | | $ | 110,780 | |
| Carrying value | | (5,131) | | | 5,131 | |
| Income (loss) before income taxes | | (115,911) | | | 115,911 | |
Counterparty Risk
We are subject to risk that arises from our debt warehouse facilities, economic hedging activities, third-party custodians, and capped call options on our common stock. These activities generally involve an exchange of obligations with unaffiliated lenders or other individuals or entities, referred to in such transactions as “counterparties”. If a counterparty was to default, we could potentially be exposed to reputational damage and financial loss if such counterparty was unable to meet its obligations to us. We manage this risk by selecting only counterparties that we believe to be financially strong, spreading the risk among multiple such counterparties, placing contractual limits on the amount of dependence on any single counterparty, and entering into netting agreements with the counterparties, as appropriate.
In accordance with Treasury Market Practices Group’s recommendation, we execute Securities Industry and Financial Markets Association trading agreements with all material trading partners. Each such agreement provides for an exchange of margin money should either party’s exposure exceed a predetermined contractual limit. Such margin requirements limit our overall counterparty exposure. The master netting agreements contain a legal right to offset amounts due to and from the same counterparty. Derivative assets represent derivative contracts in a gain position net of loss positions with the same counterparty and, therefore, also represent our maximum counterparty credit risk. We incurred no losses due to nonperformance by any of our counterparties during the ninethree months ended September 30, 2023.March 31, 2024. As of September 30, 2023,March 31, 2024, gross derivative asset and liability positions subject to master netting arrangements were $3.5$1.5 million and $13.8$5.9 million, respectively.
In the case of our loan warehouse facilities, we are subject to risk if the counterparty chooses not to renew a borrowing agreement and we are unable to obtain financing to originate loans. With our loan warehouse facilities, we seek to mitigate this risk by ensuring that we have sufficient borrowing capacity with a variety of well-established counterparties to meet our
funding needs. As of September 30, 2023,March 31, 2024, we had total borrowing capacity under loan warehouse facilities of $8.4$8.7 billion, of which $4.0 billion$812 million was utilized. Refer to Note 9. Debt to the Notes to Condensed Consolidated Financial Statements for additional information regarding our loan warehouse facilities.
In the case of our call options on our common stock, (referred to herein as the “Capped Call Transactions”), if the Capped Call Counterparties,capped call counterparties, which are financial institutions and initial purchasers of our convertible notes, are unable to meet their obligations under the contract, we may not be able to mitigate the dilutive effect on our common stock upon conversions of our convertible notes or offset any potential cash payments we may be required to make in excess of the principal amount of converted convertible notes.
We are also subject to counterparty risk associated with our use of third-party custodians to safeguard digital assets on behalf of our members. Refer to Note 12. Fair Value Measurements10. Equity to the Notes to Condensed Consolidated Financial Statements and to Part II, Item 1A. Risk Factors under “Regulatory, Tax and Other Legal Risks” for additional information on our counterparty risk as it relates to our digital assets product offering.capped call transactions.
Operational Risk
Operational risk is the risk of loss arising from inadequate or failed internal processes, controls, people (e.g., human error or misconduct) or systems (e.g., technology problems), business continuity or external events (e.g., natural disasters), compliance, reputational, regulatory, or legal matters and includes those risks as they relate directly to us, fraud losses attributed to applications and any associated fines and monetary penalties as a result, transaction processing, or employees, as well as to third parties with whom we contract or otherwise do business. We rely on third-party computer systems and third-party providers to support and carry out certain functions on our platform, which are themselves susceptible to operational risk or which may rely on subcontractors to provide services to us that face similar risks. Any interruption in services or deterioration in the quality of the service or performance of such third-party systems or providers could be disruptive to our business and adversely affect our results of operations and the perception of the reliability of our networks and services and the quality of our brand. In addition, we may be subjected to member complaints, fines, subpoenas, civil investigative demands, litigation, disputes, regulatory investigations and other similar actions. We strive to manage operational risk, including operational risk associated with our reliance on third-party systems, through contractual provisions, our system design, and a robust third-party risk management process, which includes establishing policies and procedures to accomplish timely and efficient processing, obtaining periodic internal control attestations from management, conducting internal process Risk Control Self-Assessments and audit reviews to evaluate the effectiveness of internal controls. Our operational risk, and the amount we invest in risk management, may increase as we introduce new products and product features, and as new threat actors and evolving threat vectors, such as account takeover tactics, increase and become more sophisticated. In order to be effective, among other things,
our enterprise risk management capabilities must adapt and align to support any new product or loan features, capability, strategic development, or external change.
Item 4. Controls and Procedures
Evaluation of Disclosure Controls and Procedures
Our management, with the participation of our Chief Executive Officer and Chief Financial Officer, has evaluated the effectiveness of our disclosure controls and procedures (as defined in Rules 13a-15(e) and 15d-15(e) under the Securities Exchange Act of 1934, as amended (the “Exchange Act”) as of the end of the period covered by this Quarterly Report on Form 10-Q. Based on that evaluation, our Chief Executive Officer and Chief Financial Officer concluded that such disclosure controls and procedures were effective as of the end of the period covered by this Quarterly Report on Form 10-Q and designed to ensure that information required to be disclosed in our reports filed or submitted under the Exchange Act is recorded, processed, summarized and reported within the requisite time periods specified in the applicable rules and forms, and that it is accumulated and communicated to our management, including our Chief Executive Officer and Chief Financial Officer, as appropriate, to allow timely decisions regarding required disclosure. Management recognizes that any controls and procedures, no matter how well designed and operated, can provide only reasonable assurance of achieving their objectives and management necessarily applies its judgment in evaluating the cost-benefit relationship of possible controls and procedures.
Changes in Internal Control over Financial Reporting
There have not been any changes in our internal control over financial reporting (as defined in Rules 13a-15(f) and 15d-15(f) under the Exchange Act) during the quarter ended September 30, 2023March 31, 2024 that have materially affected, or are reasonably likely to materially affect, our internal control over financial reporting.
PART II – OTHER INFORMATION
Item 1. Legal Proceedings
The information required by Item 103 of Regulation S-K is included in Note 15. Commitments, Guarantees, Concentrations and Contingencies to the Notes to Condensed Consolidated Financial Statements in Part I, Item 1. of this Quarterly Report on Form 10-Q.
Item 1A. Risk Factors
In evaluating our company and our business, you should carefully consider the risks and uncertainties described below, together with the other information in this Quarterly Report on Form 10-Q, including our condensed consolidated financial statements and the related notes and the section titled “Management’s Discussion and Analysis of Financial Condition and Results of Operations”. The occurrence of one or more of the events or circumstances described in these risk factors, alone or in combination with other events or circumstances, may have a material adverse effect on our business, reputation, revenue, financial condition, results of operations or future prospects, in which case the market price of our common stock could decline, and you could lose part or all of your investment. Unless otherwise indicated, references in this section and elsewhere in this Quarterly Report on Form 10-Q to our business being adversely affected, negatively impacted or harmed will include an adverse effect on, or a negative impact or harm to, our business, reputation, financial condition, results of operations, revenue or our future prospects. The material and other risks and uncertainties summarized in this Quarterly Report on Form 10-Q and described below are not intended to be exhaustive and are not the only ones we face. Additional risks and uncertainties not presently known to us or that we currently deem immaterial may also impair our business. This Quarterly Report on Form 10-Q also contains forward-looking statements that involve risks and uncertainties. Our actual results could differ materially from those anticipated in the forward-looking statements as a result of a number of factors, including the risks described below. See the section titled “Cautionary Statement Regarding Forward-Looking Statements”.
Summary Risk Factors
Our business is subject to numerous risks and uncertainties, which illuminate challenges that we face in connection with the successful implementation of our strategy and the growth of our business. Our business, prospects, financial condition or operating results could be harmed by any of these risks, as well as other risks not currently known to us or that we currently consider immaterial. These risks are discussed more fully below and include, but are not limited to, risks related to:
Business, Financial and Operational Risks
•our ability to successfully identify and address the risks and uncertainties we face;
•demands on our resources, intense and increasing competition, and the success of our business model (including futurecontinuing profitability);
•legislative and regulatory policies and related actions that apply or may apply to us, particularly in connection with student loans, as a result of our operating a bank and as a bank holding company, orin connection with student loans, given our brokerage and investment advisory activity;activity, or related to services provided by our technology platform;
•the loss of one or more significant purchasers of our loans or one or more significant technology platform clients;
•adverse developments affecting the financial services industry, such as actual events or concerns involving liquidity, defaults, or non-performance by financial institutions or transactional counterparties;
•impact of macroeconomic factors, including regulatory responses, elevated and fluctuating inflation, increased delinquency rates on consumer debt, reduced consumer discretionary spending and economic uncertainty;
•failure of third-party service providers or systems on which we rely or, in the event we move certain services or systems in-house, our ability to successfully perform those services or implement and operate those systems;
Risks Related to Market and Interest Rates
•cost and availability of funding in the capital markets and fluctuations in interest rates;
•higher than expected payment speeds of loans or longer holding periods of loans could negatively impact our returns as the holder of the residual interests in securitization trusts;
•decreased demand for certain lending products in the face of high interest rates, such as student loans and home loans;
Risks Related to Strategic and New Products
•potential and past acquisitions that require significant attention and could disrupt our business and adversely affect our financials;
•our failure to innovate or respond to evolving technological or other changes;
•an increase in fraudulent activity, particularly in connection with our personal loans product, credit card and SoFi Money;
•increased business, economic and regulatory risks from continued expansion abroad, or given our brokerage and investment advisory activity;activity, or related to services provided by our technology platform;
Credit Market Related Risks
•worsening economic conditions, including general economic uncertainty, elevated and fluctuating inflation and interest rates, market volatility, the cyclical nature of our industry, and our ability to maintain expected levels of liquidity;
•our inability to make accurate credit and pricing decisions or effectively forecast our loss rates;
•the discharge of qualified student loans in bankruptcy in certain circumstances;
•the failure of our third-party service providers to perform various functions related to the origination and servicing of loans;
•financial issues or liquidity issues experienced by our technology platform clients that could result in termination of, or inability to pay for, their services;
Risks Related to Funding and Liquidity
•our ability to retain, increase or secure new or alternative financing, including through deposits, to finance our business and the receivables that we originate or other assets that we hold;
•termination of one or more of our warehouse facilities on which we are highly dependent;
•our ability to sell the loans we originate to third parties;
•increases in member loan default rates or the possibility of being required to retain or repurchase loans or indemnify the purchasers of our loans;
Regulatory, Tax and Other Legal Risks
•our exposure to evolving laws, rules, regulations and government enforcement policies, federal or state loan forgiveness programs, expansion of the federal student loan income-driven repayment plan, and potential enforcement actions, litigation, investigations, exams or inquiries or impairment of licenses;
•our ability to effectively mitigate risk exposure;
•changes in business, economic or political conditions;
•failure to comply with laws and regulations, including related to banks and bank holding companies, consumer financial protection, anti-money laundering, anti-corruption or privacy, information security and data protection;
•increased regulatory scrutiny of the services provided by our technology platform;
•application of regulations and supervision under banking and securities laws and regulations;
•our ability to efficiently protect our intellectual property rights;
•failure to comply with open source licenses for open source software included in our or any of our subsidiaries’ platforms;
•the risk that we are, or any of our subsidiaries is, determined to have been subject to registration as an investment company under the Investment Company Act;
Personnel and Business Continuity Risks
•the loss of key management members or key employees, or an inability to hire key personnel;
•increased business continuity and cyber risks due to our primarily remotehybrid workforce;
•natural disasters, power outages, telecommunications failures, man-made problems and similar events;
•employee misconduct;
Risk Management and Financial Reporting Risks
•our ability to establish and maintain proper and effective internal control over financial reporting and risk management processes and procedures;
•adjustments to our key business metrics, including adjustments to the total number of members or products in the event a member is removed in accordance with our terms of service which may not be reflected in the current period;
•changes in accounting principles generally accepted in the United States;
•regulatory obligations as a result of our business combination with a special purpose acquisition company that may impact us differently than other publicly traded companies;
•incorrect estimates or assumptions by management in connection with the preparation of our financial statements;
Information Technology and Data Risks
•breach or violation of law by a third party on which we depend;
•cyberattacks and other security breaches or disruptions of our systems or third-party systems on which we rely, including our cloud computing services arrangement, including disruptions that may impact our ability to collect loan payments and maintain accurate accounts, or our ability to provide services to our technology platform clients;
•liabilities related to the collection, processing, use, storage and transmission of personal data;
•liabilities related to the data, models, and use of artificial intelligence in products or business processes;
Risks Related to Ownership of Our Securities
•volatility in the price of our common stock, changes in analyst ratings or expectations, and future dilution of our stockholders;
•possibility of securities litigation, which is expensive and time consuming; and
•failure to comply with Nasdaq continued listing standards.
Business, Financial and Operational Risks We operate in rapidly evolving industries, and have limited experience in parts of our Financial Services and Technology Platform segments, which may make it difficult for us to successfully identify and address the risks and uncertainties we face.
We operate in rapidly evolving industries which may make it difficult to quickly identify risks to our business and evaluate our future prospects. In addition, in recent years, we have rapidly expanded our operations to include or expand, among other things, deposit accounts, credit cards, investment services, and technology solutions, home loan originations, small business financing solutions, lending as a service solutions, and international operations, and we have limited experience in these areas. In the first quarter of 2022, we acquired a bank charter and face risks as a result of our lack of experience operating a bank and as a bank holding company. We also acquired Technisys in the first quarter of 2022, which furthered our international expansion into Latin America and introduced new risks due to our limited history of operations in certain Latin American countries. In 2023, we acquired Wyndham, Capital Mortgage (“Wyndham”), a leading fintech mortgage lender, which expanded our home loan business.
In addition to the recent events above, we face numerous challenges to our success, including our ability to:
•increase or maintain the number, volume and types of, and add new features to, the loans we extend to our members as the market for loans evolves and as we face new and increasing competitive threats;
•successfully integrate our past and future acquisitions, including continuing to integratedevelop Wyndham’s technology, and employees, performing functions in home loans origination, such as home loans processing and underwriting, which we have not previously performed, and managing the origination of new home loan types;
•increase the number of members utilizing our non-lending products, including our direct deposit feature, and maintain and build on the loyalty of existing members by increasing their use of new or additional products;
•successfully maintain and enhance our diversified funding strategy, including through deposits, securitization financing from consolidated and nonconsolidated VIEs, whole loan sales, and debt warehouse facilities and deposits;facilities;
•further establish, diversify and refine our checking and savings, investment and brokerage offerings to meet evolving consumer needs and preferences;
•offer an attractive annual percentage yield on our deposits compared to our competitors and manage deposit costs;
•diversify our revenue streams across our products and services;
•favorably compete with other companies and banks, including traditional and alternative technology-enabled lenders, financial service providers, broker-dealers, and technology platform-as-a-serviceplatform as a service providers;
•continue to realize the benefits of operating a bank;
•introduce new products or other offerings, as well as new or improved technologies, to meet the needs of our existing and prospective members or to keep pace with competitive lending, checking and savings, investment, technology and other developments;
•maintain or increase the effectiveness of our direct marketing and other sales and marketing efforts, and maintain our brand;
•successfully design, develop, integrate, operate and maintain technology systems at scale and with a high degree of reliability that support our member growth and product adoption;
•successfully navigate economic conditions and fluctuations in the credit markets, including elevated and fluctuating inflation, interest rates that are higher than those in the recent past, recessionary pressures and economic uncertainty;
•continue to add new clients and new products to existing clients in our technology platform-as-a-serviceplatform as a service business;
•successfully identify financial issues or liquidity issues experienced by our technology platform clients that could result in termination of, or their inability to pay for, our technology platform services;
•successfully diversify our technology platform clients into new industry verticals and new geographies;
•successfully identify a slowdown or acceleration in the business growth of our technology platform clients to ensure aligned costs and capabilities;
•successfully navigate the evolving regulatory environment for technology platform as a service providers;
•establish fraud prevention strategies that proactively identify threat vectors and mitigate losses;
•defend our platform from information security vulnerabilities, cyberattacks or malicious attacks;
•effectively manage the growth of our business;
•effectively manage our expenses;
•obtain debt or equity capital on attractive terms or at all;
•successfully continue to expand internationally;
•adequately respond to macroeconomic and other exogenous challenges, including continued government efforts to curb inflation, which may impact the overall economy and affect demand for our products and services, market volatility, particularly in the financial services industry, changes in consumer confidence, and consumer discretionary spending and loan delinquency rates, pandemics or other health-related crises, the war between Israel and Hamas, escalating conflict in the Middle East, and the ongoing war in Ukraine;Ukraine, and the upcoming presidential election in the United States;
•maintain successful relationships with our governmental regulatory agencies and law enforcement authorities, as well as self-regulatory agencies; and
•anticipate and react to changes in an evolving regulatory and political environment.
We may not be able to successfully address the risks and uncertainties we face, which could negatively impact our business, financial condition, results of operations, cash flows and future prospects.
We have a history of losses, and may not achieve profitabilityexperience net losses in the future and there is no assurance that our revenue and business model will be successful.
We have a history of net losses.losses prior to the fourth quarter of 2023. We may continue to incur net losses in the future, and such losses may fluctuate significantly from quarter to quarter. We will need to generate and sustain significant revenues for our business generally, and achieve greater scale and generate greater operating cash flows from our Financial Services segment, in particular, in future periods, as well as successfully navigate the macroeconomic environment, in order to achieve, maintain or increase our level of profitability. We intend to continue to invest in sales and marketing, technology, and new products and services in order to enhance our brand recognition and our value proposition to our members, prospective members and clients in our technology platform business, and these additional costs will create further challenges to generatingmaintaining or increasing near-term profitability. Our general and administrative expenses have in the past and may in the future increase to meet the increased compliance and
other requirements associated with operating as a public company and a bank holding company, operating a bank, and evolving regulatory requirements. See “Regulatory, Tax and Other Legal Risks—Risks—As a bank holding company, we are subject to extensive supervision and regulation, and changes in laws and regulations applicable to bank holding companies could limit or restrict our activities and could have a material adverse effect on our operations”.
We are continuously refining our revenue and business model, which is premised on creating a virtuous cycle for our members to engage with more products across our platform, a strategy we refer to as the Financial Services Productivity Loop,
and, with respect to our Technology Platform segment, adoption by clients of additional platform-as-a-serviceplatform as a service offerings. There is no assurance that our revenue and business model or any changes to our revenue and business model to better position us with respect to our competitors will be successful. Our efforts to grow our business may be more costly than we expect, and we may not be able to maintain or increase our revenue sufficiently to offset our higher operating expenses. We may continue to incur losses and not achieve future profitability or, if achieved, we may be unable to maintain such profitability, due tofor a number of reasons, including the risks described in this Quarterly Report on Form 10-Q, unforeseen expenses, difficulties, complications and delays, differences between our assumptions and estimates and results, further deterioration inthe effects of macroeconomic conditions and other unknown events.
We have experienced rapid growth in recent years, including through the addition of new products and lines of business and into new geographies, which may place significant demands on our operational, risk management, sales and marketing, technology, compliance, and finance and accounting resources.
Our rapid growth in certain areas of our business in recent years, primarily within our Financial Services and Technology Platform segments, as well as operating a bank and as a bank holding company, has placed significant demands on our operational, risk management, sales and marketing, technology, compliance, and finance and accounting infrastructure, and has resulted in increased expenses, a trend that we expect to continue as our business grows. In addition, we are required to continuously develop and adapt our systems and infrastructure in response to the increasing sophistication of the consumer financial services market, changing technologies, evolving fraud, privacy and information security landscape, and regulatory developments, both domestically and internationally, relating to our existing and projected business activities. Our future growth will depend on, among other things, our ability to maintain an operating platform and management system able to address such growth, our ability to grow and optimize deposit balances, and our ongoing ability to demonstrate to our regulators that our risk management and compliance practices are growing in a commensurate fashion, all of which has required and we expect will continue to require us to incur significant additional expenses, expand our workforce and commit additional time from senior management and operational resources. We may not be able to manage supporting and expanding our operations effectively, and any failure to do so would adversely affect our ability to increase the scale of our business, generate projected revenue and control expenses.
Our results of operations and future prospects depend on our ability to retain existing members and attract new members. We face intense and increasing competition and, if we do not compete effectively, our competitive positioning and our operating results will be harmed.
We operate in a rapidly changing and highly competitive industry, and our results of operations and future prospects depend on, among others:
•the continued growth and engagement of our member base;
•our ability to monetize our member base, including through the use of additional products by our existing members;
•our ability to acquire members at a lower cost; and
•our ability to increase the overall value to us of each of our members while they remain on our platform (which we refer to as a member’s lifetime value).
We expect our competition to continue to increase, as there are no substantial barriers to entry to certain of the markets we serve. Some of our current and potential competitors have longer operating histories, particularly with respect to our financial services products, significantly greater financial, technical, marketing and other resources, and a larger customer base than we do. This allows them to potentially offer more competitive pricing or other terms or features, a broader range of financial products, or a more specialized set of specific products or services, as well as respond more quickly than we can to new or emerging technologies and changes in member preferences. In addition to established enterprises, we may also face competition from early-stage companies attempting to capitalize on the same, or similar, opportunities as we are. Our existing or future competitors may develop products or services that are similar to our products and services or that achieve greater market acceptance than our products and services. This could attract current or potential members away from our services and reduce our market share in the future. Additionally, when new competitors seek to enter our markets, or when existing market participants seek to increase their market share, these competitors sometimes undercut, or otherwise exert pressure on, the
pricing terms prevalent in that market, which could adversely affect our market share and/or our ability to capitalize on market opportunities.
We currently compete at multiple levels with a variety of competitors, including:
•other personal loan, student loan refinancing, in-school student loan and home loan lenders, including other banks and other financial institutions, as well as credit card issuers, that can offer more competitive interest rates or terms;
•banks and other financial institutions, with respect to our checking and savings accounts;
•rewards credit cards provided by other financial institutions, with respect to our SoFi Credit Card;
•other brokerage firms, including online or mobile platforms, and other companies for our SoFi Invest accounts;
•other mortgage lenders, including fintech-focused lenders, and other companies for our home loans;
•other technology platforms with respect to the enterprise services we provide, such as technology products and solutions via Galileo and Technisys;
•other content providers for subscribers to our financial services content, including content from alternative providers available to our subscribers through our Lantern Credit service, which is a financial services aggregator providing marketplace lending products, and various enterprise partnerships; and
•other financial services firms offering employers a comprehensive platform for employees to build financial well-being through student loan and 529 educational plan contributions, educational tools, and financial resources, all of which we provide through SoFi At Work.
We believe that our ability to compete depends upon many factors both within and beyond our control, including, among others, the following:
•the size, diversity and lifetime value of our member base and technology platform clients;
•our ability to introduce successful new products and services, as well as new or improved technologies, or to iterate and innovate on existing products or services to satisfy evolving member and technology platform client preferences or to keep pace with market trends;
•our ability to diversify our revenue streams across our products and services, and cost effectively acquire new members and technology platform clients;
•the timing and market acceptance of our products and services, including developments and enhancements to those products and services, offered by us and our competitors;
•member and technology platform client service and support efforts;
•selling, marketing and promotional efforts;
•our ability to compete on price, particularly with respect to the SoFi Invest productand the Technology Platform where demand for our products and services may be affected if we are unable to compete with other brokerages or technology-as-a-service providers on price;
•our ability to offer competitive interest rates on deposit accounts;
•the ease of use, performance, price and reliability of solutions developed either by us or our competitors;
•our ability to attract and retain talent;
•changes in economic conditions, and regulatory and policy developments;
•our ability to successfully operate a national bank, grow deposits and realize the potential benefits to our members;
•our ability to successfully scale our products and services and execute on our Financial Services Productivity Loop strategy and our other business plans, including successfully integrating our acquisitions and diversifying our technology platform clients into new industry verticals and new geographies;
•general market conditions and their impact on our liquidity and ability to access funding;
•the impact of macroeconomic conditions, including the impacts from current efforts to curb inflation, stock market volatility, changes in consumer confidence, and consumer discretionary spending, and any changes in loan default rates, and related developments on the lending and financial services markets we serve; and
•our brand strength relative to our competitors.
Our current and future business prospects demand that we act to meet these competitive challenges but, in doing so, our revenues and results of operations could be adversely affected if we, for example, increase marketing or other expenditures or make new expenditures in other areas. Competitive pressures could also result in us reducing the annual percentage rate on the loans we originate, increasing the annual percentage rate we pay on the checking and savings product, charging fees for services we currently provide for free, incurring higher member or technology platform client acquisition costs, or make it more difficult for us to grow our loan originations in both number of loans and volume for new as well as existing members or expand the adoption of additional products by our current, or acquire new, technology platform clients. All of the foregoing factors and events could adversely affect our business, financial condition, results of operations, cash flows and future prospects.
Adverse developments affecting the financial services industry, such as actual events or concerns involving liquidity, defaults, or non-performance by financial institutions or transactional counterparties, could adversely affect our financial condition and results of operations.
Actual events involving limited liquidity, defaults, non-performance or other adverse developments that affect financial institutions, transactional counterparties or other companies in the financial services industry or the financial services industry generally, or concerns or rumors about any events of these kinds or other similar risks, have in the past and may in the future lead to market-wide liquidity problems and adversely affect our financial condition and results of operations. For example, Silicon Valley Bank ("SVB") and Signature Bank were put into FDIC receivership in March 2023 and First Republic Bank was put into FDIC receivership in May 2023. These market developments have negatively impacted customer confidence in the safety and soundness of certain banks. As a result, although we have not observed a decline in our deposits to date, our members may choose to maintain deposits with other financial institutions or spread their deposit funds among multiple financial institutions. The closure of financial institutions, even if such financial institutions are unrelated to our business, may result in a deterioration of consumer confidence in banks and the banking system more broadly as well as declines in the price of our stock or reluctance of our members to use our products and services.
Inflation and rapid increases in interest rates have led to a decline in the trading value of previously issued government securities with interest rates below current market interest rates. AlthoughOn March 12, 2023, the Federal Reserve announced the creation of the Bank Term Funding Program, a new emergency lending program for FDIC-insured banks, as well as certain U.S. branches and agencies of foreign banks. Under the Bank Term Funding Program, the Treasury FDIC and Federal Reserve Board have announced a program to provide up toDepartment provided $25 billion of credit protection to the Federal Reserve Banks, in order to provide loans with terms up to financial institutionsone year secured by certain of such government securities held by eligible financial institutionsinstitution borrowers. The program was established to mitigatereduce the need for eligible borrowers to sell the securities in times of stress, thus, mitigating the risk of potential losses on the sale of such instruments, widespread demands for customer withdrawals or other liquidity needs of financial institutions for immediate liquidity may exceedsecurities. On January 24, 2024, the capacity of such program. Additionally, thereFederal Reserve announced that the program would cease making new loans, as scheduled, on March 11, 2024. There is no guarantee that the Federal Reserve would establish a similar facility in the future or that the Treasury, FDIC and Federal Reserve Board will provide access to uninsured funds in the event of the closure of other banks or financial institutions, or that they would do so in a timely fashion.
It is likely that, if the banking sector deteriorates, the U.S. and/or other global economies would be adversely affected, including facing the possibility of a recession, the duration and severity of which is difficult to predict. These developments may adversely affect our business, financial condition and results of operations.
Our future growth depends significantly on our branding and marketing efforts, and if our marketing efforts are not successful or we receive negative publicity, our business and results of operations will be harmed.
We have invested significantly in our brand and believe that maintaining and enhancing our brand identity is critical to our success. Our ability to attract members depends in large part on the success of these marketing efforts and the success of the marketing channels we use to promote our products. Our marketing channels include, but are not limited to, earned media through press, social media and search engine optimization, as well as paid advertising, such as online affiliations, search engine marketing, digital marketing, social media marketing, influencer marketing, offline partnerships, out-of-home, direct mail, lifecycle marketing and television and radio advertising. Our ability to compete for, attract and maintain members, lending counterparties, marketing partners and other partners relies to a large extent on their trust in our business, our reputation and the value of our brand. While our goal remains to increase the strength, recognition and trust in our brand by increasing our member base and expanding our products and services, if in the future any of our current marketing channels becomes less effective, if regulatory requirements, including the CFPB and FDIC’s advertising rules, restrict or diminish our ability to use these channels, if we are unable to continue to use any of these channels, if we receive negative publicity or fail to maintain our brand, if the cost of using these channels significantly increases or if we are not successful in generating new channels, we may not be able to attract new members or increase the activity of our existing members on our platform in a cost-effective manner. For example, in February 2024, the CFPB released a Consumer Financial Protection Circular, warning digital comparison-shopping tool operators and lead generators that marketing practices that take unreasonable advantage of a consumer’s reasonable
reliance on the operator or lead generator to act in the consumer’s interests may violate the CFPA prohibition on abusive acts or practices. Such unreasonable advantage can include distorting the shopping experience for a consumer financial product or service by giving preferential treatment to an operator or lead generator’s own or other products or services through steering or enhanced product placement, for financial or other benefits. If we are unable to recover our marketing costs through increases in the size, value or the overall number of loans we originate, or member selection and utilization of other SoFi products such as SoFi Money, SoFi Invest and SoFi Credit Card, it could have a material adverse effect on our business, financial condition, results of operations, cash flows and future prospects. In addition, negative publicity can adversely affect our reputation and damage our brand, and may arise from many sources, including actual or alleged misconduct, errors or improper business practices by employees, employee claims of discrimination or harassment, product failures, existing or future litigation or regulatory actions, inadequate protection of consumer information by us or our third-party service providers, data breaches, matters related to or affecting our financial reporting or compliance with SEC and Nasdaq listing requirements and media coverage, whether accurate or not. Negative publicity or allegations could reduce demand for our products, result in a decrease in the price of our stock, undermine the loyalty of our members and the confidence of our lending counterparties and technology platform clients, impact our partnerships, reduce our ability to recruit and retain employees or lead to greater regulatory scrutiny, all of which could lead to the attrition of our members, lending counterparties, and/or technology platform clients and harm our results of operations. In addition, we and our officers, directors and/or employees have been, and may in the future be, named or otherwise involved in litigation or claims, including employment-related claims such as workplace discrimination or harassment, which could result in negative publicity and/or adversely impact our business, even if we are ultimately successful in defending against or litigating such claims.
Reputational harm, including as a result of our actual or alleged conduct or public opinion of the financial services industry generally, could adversely affect our business, results of operations, and financial condition.
Reputation risk, or the risk to our business, earnings and capital from negative public opinion, is inherent in our business and has increased substantially because of our size and profile in the financial services industry. NegativeMoreover, negative public opinion abouthas in the past and could in the future result from actions by the financial services industry generally, including due to the failure of one or us specifically couldmore additional banks, or by certain members or individuals in the industry and can adversely affect our reputation andwith no actual or alleged actions on our ability to keep and attract customers.part. For example, public opinion of the financial services industry was negatively impacted following the closure2023 closures of SVBSilicon Valley Bank, Signature Bank, and First Republic Bank and generally resulted in decreases in the stock prices of financial services companies.
Negative public opinion could result from our actual or alleged conduct in any number of activities, including sales and marketing practices; home loan or other consumer lending practices; loan origination or servicing activities; mortgage foreclosure actions; management of client accounts or investments; lending, investing or other business relationships; identification and management of potential conflicts of interest from transactions; obligations and interests with and among our members or customers; environmental, social and governance practices; litigation or regulatory actions taken by us or to which we are a party; regulatory compliance; risk management; incentive compensation practices; and disclosure, sharing or inadequate protection or improper use of member or customer information, and from actions taken by government regulators and community or other organizations in response to that conduct. Although we have policies and procedures in place intended to detect and prevent conduct by employees and third-party service providers that could potentially harm members or customers or our reputation, there is no assurance that such policies and procedures will be fully effective in preventing such conduct.
Furthermore, our actual or perceived failure to address or prevent any such conduct or otherwise to effectively manage our business or operations could result in significant reputational harm. Moreover, negative public opinion has in the past and could in the future result from actions by the financial services industry generally, including due to the failure of one or more additional banks, or by certain members or individuals in the industry and can adversely affect our reputation with no actual or alleged actions on our part. For example, our marketing strategy includes an emphasis on social media. Social media provides a powerful medium for consumers, employees and others to communicate their approval of or displeasure with a business. This aspect of social media is especially challenging because it allows any individual to reach a broad audience with an ability to respond or react, in near real time, with comments that are often not filtered or checked for accuracy. We are beginning to monitor social media metrics for their impact on our business but if we are unable to quickly and effectively respond, any negative publicity could “go viral”, causing nearly immediate and potentially significant harm to our brand and reputation, and our business, whether or not factually accurate, including a significant withdrawal of deposits from SoFi Bank within a short period of time.
LegislativeOur reputation and/or business could be negatively impacted by ESG matters and/or our reporting of such matters.
There is an increasing focus from regulators, certain investors, and regulatory policiesother stakeholders concerning ESG matters, both in the United States and related actionsinternationally. We communicate certain ESG-related initiatives and/or commitments regarding our employees, diversity, equity and inclusion goals, and other matters in connection with student loans could have a material adverse effectour ESG Report, on our student loan portfolios.
In recent years, there has been increased focus by policymakers on outstanding federal student loans, including, among other things, onwebsite, in our filings with the total volume of outstanding loansSEC, and on the number of loans outstanding per borrower. In response, there has been discussion of potential legislativeelsewhere. These initiatives and regulatory actionscommitments could be difficult to achieve and other possible stepscostly to among other things:
•permit private education loans such as our refinanced student loan and in-school student loan products to be discharged in bankruptcy without the need to show undue hardship;
•amend the federal postsecondary education loan programs, including to reduce interest rates on certain loans, to revise repayment plans, to make income-driven repayment plans more attractive to borrowers, to implement broader loan forgiveness plans, to provide for refinancing of private education loans into federal student loans at low interest rates, to reduce or eliminate the Grad PLUS program (which authorizes loans that comprise a substantial portion of our student loan refinancing business) and to provide for refinancing of existing federally held student loans into new federal student loans at low interest rates;
•require private education lenders to reform loan agreements to provide for income-driven repayment plans and other payment plans; and
•make sweeping changes to the entire cost structure and financial aid system for higher education in the U.S., including proposals to provide free postsecondary education.
For example, in August 2022, President Biden announced relief measures for federal student loan borrowers, including forgiveness of $10,000 of student loans (or up to $20,000 if student loans are Pell Grants) for anyone earning less than $125,000 annually and certain changes to income-driven repayment plans for student loans (the “Biden Forgiveness Program”). Although the U.S. Supreme Court subsequently struck down the Biden Forgiveness Program, President Biden indicated between October 1, 2023 and September 30, 2024, he would allow federal loan borrowers to not be considered delinquent if they miss a payment and that the U.S. Department of Education will not refer borrowers whoimplement. We could fail to pay their student loan billsachieve, or be perceived to credit agencies.fail to achieve, our ESG-related initiatives or commitments. In addition, on July 14, 2023, President Biden announcedwe could be criticized for the timing, scope or nature of these initiatives, goals, or commitments, or for any revisions to them. To the extent that $39 billion in federal student loan debt wouldour
be eliminated to remedy mistakes of loan servicers,required and other student loan holders will have their loans adjusted. On October 4, 2023, the Biden Administration approved an additional 125,000 borrowers for student loan debt relief, totaling an additional $9 billion in student debt forgiveness. Whilevoluntary disclosures about ESG matters increase, we have seen and expect we may continue to see an increase in student loan refinancing volume following the end of federal student loan moratorium in August 2023, the timing and impact to our student loan refinancing product will largely depend on expectations regarding the introduction or implementation of additional relief measures, the interest rate environment, how competitive our student loan refinancing products are compared to our competitors and macroeconomic factors. If in the future, student loans were forgiven or canceled in any meaningful scale, or if federal loan borrowers were permitted to refinance at lower interest rates, our profitability, results of operations, financial condition, cash flows or future business prospects could be criticized for the accuracy, adequacy, or completeness of such disclosures. Our actual or perceived failure to achieve our ESG-related initiatives, goals, or commitments could negatively impact our reputation, result in ESG-focused investors not purchasing and holding our stock, or otherwise materially and adversely affected as a result. In particular,harm our student loan refinancing business within our Lending segment, which is our largest segment, would be materially and adversely affected. In addition, proposals to make student loans dischargeable in bankruptcy or similar proposals could make whole loan purchasers less likely to purchase our student loans, securitization investors less likely to purchase securities backed by our student loans or warehouse lenders less likely to lend against our student loans at attractive advance rates. As a result of any material adverse effect to our Lending segment, our overall profitability, results of operations, financial condition, cash flows or future business prospects may be adversely affected. See “Regulatory, Tax and Other Legal Risks—Legislative and regulatory actions and related economic uncertainty have had and could in the future have a material adverse effect on our current loan portfolios and our loan origination volume”.business.
We may experience fluctuations in our quarterly operating results.
We may experience fluctuations in our quarterly operating results due to a number of factors, including changes in the fair values of our instruments (including, but not limited to, our loans), the level of our expenses, the degree to which we encounter competition in our markets, general economic conditions, significant changes in default rates on loans, the rate and credit market environment and our ability to raise our coupon rates along with interest rates that are higher than those in the recent past, legal or regulatory developments, changing demographics, and legislative, regulatory or policy changes. In light of these factors, results for any period should not be relied upon as being indicative of performance in future periods.
We sell our loans to a concentrated number of whole loan purchasers and the loss of one or more significant purchasers could have a negative impact on our operating results.
Although we have begun to hold loans on-balance sheet for longer periods, when we sell our personal loans, student loans and home loans, we sell to a concentrated number of whole loan purchasers. There are inherent risks whenever a large percentage of a business is concentrated with a limited number of parties. It is not possible for us to predict the future level of demand for our loans by these or other purchasers. In addition, purchases of our loans by these purchasers have historically fluctuated and may continue to fluctuate based on a number of factors, some of which may be outside of our control, including economic conditions, the availability of alternative investments, changes in the terms of the loans, loans offered by competitors, prevailing interest rates and a change in business plan, liquidity or strategy by the purchaser. If any of these purchasers significantly reduces the dollar amount of the loans it purchases from us, we may be unable to sell those loans to another purchaser on favorable terms or at all, which may require us to reduce originations or hold additional loans on balance sheet and may reduce our flexibility in making financing decisions. In addition, the loss of one or more significant purchasers of our loans could increase the volatility of the mark-to-market methodology we use to determine the fair value of the loans we hold on balance sheet. This may have a material adverse effect on our revenues, results of operations, capital requirements, liquidity and cash flows.
Galileo and Technisys depend on a small number of clients, the loss or disruptions in operations of any of which could have a material adverse effect on their businesses and financial results, and negatively impact our financial results and results of operations.
Galileo and Technisys revenue from clients is highly concentrated. There are inherent risks whenever a large percentage of net revenue is concentrated with a limited number of clients, including fluctuations in revenue, the loss of any one or more of those clients as a result of bankruptcy or insolvency proceedings involving the client, the loss of the client to a competitor, harm to that client’s reputation or financial prospects or other reasons, including adverse general economic conditions affecting Galileo and Technisys clients many of which are fintechs and other financial services firms. Any reduction in the amount of revenues that we derive from these clients, without an offsetting increase in new sales to other clients, has had and could have a material adverse effect on our operating results in the future. A significant change in the liquidity or financial position of our clients could also have a material adverse effect on our liquidity and our future operating results. In addition, disruptions in the operations of certain of Galileo’s key clients have had an adverse impact on Galileo, and any future disruptions in the operations of any key Galileo or Technisys clients could be material and have an adverse impact on our results of operations.
We rely on third parties to perform certain key functions, and their failure to perform those functions could adversely affect our business, financial condition and results of operations.
We rely on certain third-party computer systems or third-party service providers, including cloud technology providers such as Amazon Web Services (“AWS”),AWS, internet service providers, payment services providers, market and third-party data providers, regulatory and compliance services providers, clearing systems, market makers, exchange systems, banking technology systems, co-location facilities, communications facilities and other facilities to run our platform, facilitate trades by our members and support or carry out certain functions. For example, to provide our checking and savings account, cash management account, credit card and other products and services, we rely on third parties that we do not control, such as payment card networks, our acquiring and issuing processors, payment card issuers, various financial institution partners, systems like the ACH, and other partners. We rely on these third parties for a variety of services, including the transmission of transaction data, processing of chargebacks and refunds, settlement of funds, and the provision of information and other elements of our services. In addition, external content providers provide us with financial information, market news, charts, option and stock quotes, digital assets quotes,
research reports and other fundamental data that we provide to our members. Any interruption in these third-party services, or deterioration in the quality of their service or performance, could be disruptive to our business. Furthermore, third parties may rely on artificial intelligence or machine learning for the services they provide us and, given that the regulatory framework relating to the use of machine learning and artificial services in the provision of financial services is still developing, the third parties’ use of such technologies may impact their ability to carry out certain functions or impact the quality of their service or performance.
Because we are a bank holding company subject to regulation, supervision and examination by the Federal Reserve, and because SoFi Bank is subject to regulation, supervision and examination by the OCC and the FDIC, and SoFi Bank and its affiliates are subject to regulations issued by the CFPB, our and SoFi Bank’s oversight of third-party service providers is also subject to regulatory oversight. If a regulatory authority found our or SoFi Bank’s service provider oversight to be lacking, the regulatory authority could require that we or SoFi Bank implement corrective action, including limiting or terminating certain relationships with service providers, which could be costly and disruptive to our business.
Further, we may, from time to time, decide to modify or terminate relationships with third-party service providers and to perform certain functions and/or services internally. For example, we historically used a third party bank to issue the SoFi Money debit cards and sponsor access to debit networks for payment transactions, funding transactions and associated settlement of funds, and sponsor and support ACH, check and wire transactions along with associated funds settlement. However, after gaining direct access to debit networks, we directly perform certain services previously sponsored by the third party bank andbank. Although we have performed these services satisfactorily to date, there is no guarantee we will be able to perform them satisfactorily.continue to do so. Additionally, the migration of any such functions and/or services may introduce additional risks and could cause disruption to our business.
Our third-party service providers are susceptible to operational, technological and security vulnerabilities, including security breaches, which may impact our business, and our ability to monitor our third-party service providers’ data security is limited. In addition, these third-party service providers may rely on subcontractors to provide services to us that face similar risks.
Failures or security breaches by or of our third-party service providers or their subcontractors that result in an interruption in service, unauthorized access, misuse, loss or destruction of data or other similar occurrences could interrupt our business, have in the past and could in the future cause us to incur losses, result in decreased member or client satisfaction and increase member or client attrition, subject us to member or client complaints, significant fines, litigation, disputes, claims, regulatory investigations or other inquiries and harm our reputation. Through contractual provisions and third-party risk management processes, we take steps to require that our providers, and their subcontractors, protect our data and information, including personal data. However, due to the size and complexity of our technology platform and services, the amount of data that we store and the number of members, technology platform clients, employees and third-party service providers with access to personal data, we, our third-party service providers and their subcontractors are potentially vulnerable to a variety of intentional and inadvertent cybersecurity breaches and other security-related incidents and threats, which could result in a material adverse effect on our business, financial condition and results of operations. Any contractual protections we may have from our third-party service providers may not be sufficient to adequately protect us against such consequences, and we may be unable to enforce any such contractual protections.
In addition, there is no assurance that our third-party service providers or their subcontractors will be able to continue to provide these services to meet our current needs in an efficient, cost-effective manner or that they will be able to adequately expand their services to meet our needs in the future. Certain of our vendor agreements are terminable on short or no notice, and if current vendors were to stop providing services to us on acceptable terms, we may be unable to procure alternatives from other vendors in a timely and efficient manner and on acceptable terms, or at all. An interruption in or the cessation of service by our third-party service providers or their subcontractors, coupled with our possible inability to make alternative arrangements in a smooth, cost-effective and timely manner, could have adverse effects on our business, financial condition and results of operations.
If a service provider fails to provide the services required or expected, or fails to meet applicable contractual or regulatory requirements such as service levels or compliance with applicable laws, the failure could negatively impact our business. Such a failure could also adversely affect the perception of the reliability of our networks and services and the quality of our brand, which could materially adversely affect our business and results of operations. Further, if there were deficiencies in the oversight and control of our third-party relationships, and if our regulators held us responsible for those deficiencies, it could have an adverse effect on our business, reputation and results of operations.
The conditional conversion feature of the notes, if triggered, may adversely affect our financial condition.
Holders of our convertible notes issued in October 2021 and due in 2026 (theand our convertible notes issued in March 2024 and due in 2029 (collectively, the “notes”) may be entitled to convert the notes during specified periods at their option. If one or more holders elect to convert their notes, we may settle any converted principal through the payment of cash, which could adversely affect our financial results and liquidity and could result in a decline in our stock price.
The Capped Call Transactions may affect the value of the notes and our common stock.
In connection with the issuance of the notes, we entered into privately negotiated capped call transactions (the “Capped Call Transactions”) with certain financial institutions (the “Capped Call Counterparties”). The Capped Call Transactions are expected generally to reduce the potential dilutive effect on our common stock upon any conversion of the notes and/or offset any potential cash payments we are required to make in excess of the principal amount of converted notes, as the case may be, with such reduction and/or offset subject to a cap. In connection with establishing their initial hedges of the Capped Call Transactions, the Capped Call Counterparties or their respective affiliates entered into various derivative transactions with respect to our common stock and/or purchased shares of our common stock concurrently with or shortly after the pricing of the notes.
In addition, the Capped Call Counterparties and/or their respective affiliates may modify their hedge positions by entering into or unwinding various derivatives with respect to our common stock and/or purchasing or selling our common stock or other securities of ours in secondary market transactions following the pricing of the notes and from time to time prior to the maturity of the notes (and are likely to do so following any conversion of the notes, any repurchase of the notes by us on any fundamental change repurchase date, any redemption date or any other date on which the notes are retired by us, in each case if we exercise the relevant election to terminate the corresponding portion of the Capped Call Transactions). This activity could also cause or avoid an increase or a decrease in the market price of our common stock or the notes. The potential effect, if any, of these transactions and activities on the market price of our common stock or the notes will depend, in part, on market conditions and cannot be ascertained at this time. Any of these activities could adversely affect the value of our common stock.
We are subject to counterparty risk with respect to the Capped Call Transactions, and the Capped Call Transactions may not operate as planned.
The Capped Call Counterparties are financial institutions or affiliates of financial institutions, and we will be subject to the risk that any or all of them might default under the Capped Call Transactions. Our exposure to the credit risk of the Capped Call Counterparties will not be secured by any collateral. Global economic conditions have, from time to time, resulted in the actual or perceived failure or financial difficulties of many financial institutions. If a Capped Call Counterparty becomes subject to insolvency proceedings, we will become an unsecured creditor in those proceedings with a claim equal to our exposure at that time under our transactions with that Capped Call Counterparty. Our exposure will depend on many factors, but, generally, an increase in our exposure will be correlated with increases in the market price or the volatility of our common stock. In addition, upon a default by a Capped Call Counterparty, we may suffer more dilution than we currently anticipate with respect to our common stock. We can provide no assurances as to the financial stability or viability of any Capped Call Counterparty.
In addition, the Capped Call Transactions are complex, and they may not operate as planned. For example, the terms of the Capped Call Transactions may be subject to adjustment, modification or, in some cases, renegotiation if certain corporate or other transactions occur. Accordingly, these transactions may not operate as we intend if we are required to adjust their terms as a result of transactions in the future or upon unanticipated developments that may adversely affect the functioning of the Capped Call Transactions.
Market and Interest Rate Risks
Our business and results of operations have in the past and may in the future be adversely affected by the financial markets, fiscal, monetary, and regulatory policies, and economic conditions generally.
Our business, results of operations and reputation are directly affected by elements beyond our control, including general economic, political, social and health conditions in the U.S. and in countries abroad. These elements can arise suddenly and the full impact can remain unknown or result in adverse effects, including, but not limited to, extreme volatility in credit, equity and foreign currency markets, changes to buying patterns of our members and prospective members or reductions in the credit quality of our members.members, and changes to the financial condition of our technology platform clients and prospective clients.
In particular, markets in the U.S. or abroad have been and may in the future be affected by the level and volatility of interest rates, availability and market conditions of financing, recessionary pressures, inflation and hyperinflation, supply chain disruptions,
disruptions, changes in consumer spending, employment levels, labor shortages, federal government shutdowns, developments related to the U.S. federal debt ceiling, changes in legislation, regulations or policy, energy prices, home prices, commercial property values, bankruptcies, a default by a significant market participant or class of counterparties, market volatility, liquidity of the global financial markets, the growth of global trade and commerce, exchange rates, trade policies, the availability and cost of capital and credit, disruption of communication, transportation or energy infrastructure and investor sentiment and confidence. Additionally, global markets have been and may in the future be adversely affected by the current or anticipated impact of climate change, extreme weather events or natural disasters, the emergence or continuation of widespread health emergencies or pandemics, (such as the COVID-19 pandemic), cyberattacks or campaigns, military conflict, including the war between Israel and Hamas, escalating conflict in the Middle East and the ongoing war in Ukraine, terrorism or other geopolitical events, including the upcoming presidential election in the United States, which may affect our results of operations. For example, although we do not have operations in the locations impacted by these conflicts, the ongoing war in these locations has led and could in the future lead to macroeconomic effects, including volatility in commodity prices and the supply of energy resources, instability in financial markets, supply chain interruptions, political and social instability, as well as an increase in cyberattacks and espionage. Also, any sudden or prolonged market downturn in the U.S. or abroad, as a result of the above factors or otherwise, could adversely affect our business, results of operations and financial condition, including capital and liquidity levels. We are not able to predict with any certainty the ultimate impact that any of these events, as well as any other future events, may have on our business.
Significant downturns in the securities markets or in general economic and political conditions may also cause individuals to be reluctant to make their own investment decisions and thus decrease the demand for our products and services and could also result in our members reducing their engagement with our platform. In addition, such significant downturns may cause default rates on our loans to increase and cause funding and liquidity concerns for our current and prospective technology platform clients reducing their adoption and use of our platform-as-a-service products.platform as a service products and services. Conversely, significant upturns in the securities markets or in general economic and political conditions may cause individuals to be less proactive in seeking ways to improve the returns on their trading or investment decisions and, thus, decrease the demand for our products and services. Any of these changes could cause our future performance to be uncertain or unpredictable, and could have an adverse effect on our business, financial condition and results of operations. In addition, a prolonged weakness in the U.S. equity markets or a general extended economic downturn could cause our members or technology platform clients to incur losses, which in turn could cause our brand and reputation to suffer. If our reputation is harmed, the willingness of our existing members or technology platform clients and potential new members or clients to do business with us could be negatively impacted, which would adversely affect our business, financial condition and results of operations.
Our business is sensitive to interest rates and interest rates are highly sensitive to many factors that are beyond our control, including global, domestic and local economic conditions and the policies of various governmental and regulatory agencies and, in particular, the Federal Reserve. The Federal Reserve increased interest rates throughout 2022 and multiple times in 2023, has signaled that interest ratesand we are unable to predict whether it will continue to be higher than recent past, and that it may continue to raise rates further.further or whether and when it may lower rates. Further changes to prevailing interest rates could influence not only the interest we receive on loans and investments and the amount of interest we pay on deposits and borrowings, but such changes could also affect (i) our ability to originate loans at competitive rates and obtain deposits; (ii) the fair value of our financial assets and liabilities; (iii) the average duration of our loan portfolios and other interest-earning assets; (iv) the mix of lending products we originate which is influenced by demand for refinancing products,products; and (v) the competition faced by our SoFi Money deposit product from other investment products which may become more attractive as interest rates rise. See ““Changing expectations for inflation and deflation and corresponding fluctuations in interest rates could decrease demand for our lending products and negatively affect loan performance, as well as increase certain operating costs, such as employee compensation” compensation” for additional information on the risks of interest rate fluctuations to our business.
Interest rate increaseschanges and other actions, including balance sheet management, lending facilities, and the Federal Reserve’s exit from quantitative easing, and similar actions taken by the Federal Reserve or other central banks, are beyond our control and difficult to predict. These actions affect interest rates and the value of financial instruments, increase the likelihood of a more volatile market, a further appreciating U.S. dollar and negative growth in gross domestic product, and affect other assets and liabilities and can impact our members.members and technology platform clients. Any such downturn, especially in the regions in which we operate, may adversely affect our asset quality, deposit levels, loan demand and results of operations.
Changes to existing laws, regulations and policies and evolving priorities, including those related to financial regulation, taxation, international trade, fiscal policy, cybersecurity and privacy, digital assets, climate change (including any required reduction of greenhouse gas emissions) and healthcare, may adversely impact U.S. or global economic activity and our members, our technology platform clients, our counterparties and our earnings and operations. For example, changes, or proposed changes, to certain U.S. trade and international investment policies, particularly with important trading partners (including China and the European Union (the “EU”)) have in recent years negatively impacted financial markets. Actions
taken by other countries, particularly China, to restrict the activities of businesses, could also negatively affect financial
markets. An escalation of tensions, such as a further escalation in conflict in the Middle East in connection with the Israel-Hamas war, could lead to further measures that adversely affect financial markets, disrupt world trade and commerce and lead to trade retaliation, including through the use of duties and tariffs, foreign exchange measures or the large-scale sale of U.S. Treasury Bonds.
Any of these developments could adversely affect our business, our members, our technology platform clients, the value of our loan portfolios, our level of charge-offs and provision for credit losses, our capital levels, our liquidity and our results of operations.
We primarily utilizehave the option of pursuing a gain-on-sale origination model and, consequently, our business is affected by the cost and availability of funding in the capital markets.
In addition to the issuance of equity, historically we have funded our operations and capital expenditures through sales of our loans, secured and unsecured borrowing facilities and securitizations. We primarily utilizehave the option of pursuing a gain-on-sale origination model and, consequently, our earnings and financial condition are largely dependent on the price we can obtain for our products in the capital markets, which has been and may be negatively impacted by interest rates that are higher than those in the recent past combined with longer periods during which we have held, and may continue to hold, loans on-balance sheet. These capital markets risks may be partially mitigated by the availability of bank deposits and other corporate cash (if any) to temporarily hold the loans on our balance sheet. However, bank deposits and corporate cash have not historically been our primary source of funding and can be impacted by a number of factors. Our ability to obtain financing in the capital markets depends, among other things, on our development efforts, business plans, operating performance, lending activities, public perceptions of the financial services industry, and condition of, and our access to, the capital markets at the time we seek financing. The capital markets have recently and from time to time experienced periods of significant volatility, including volatility driven by rising inflation, uncertainty in the financial services sector, the COVID-19 pandemic, the war between Israel and Hamas, escalating conflict in the Middle East and the ongoing war in Ukraine, among other things. This volatility can dramatically and adversely affect financing costs when compared to historical norms or make funding unavailable. Additional factors that could make financing more expensive or unavailable to us include, but are not limited to, financial losses, events that have an adverse impact on our reputation, lawsuits challenging our business practices, adverse regulatory changes, changes in the activities of our business partners, loan performance, events that have an adverse impact on the financial services industry generally, counterparty availability, negative credit rating actions with respect to our rated securities, corporate and regulatory actions, interest rate changes, general economic conditions, including changing expectations for inflation and deflation, and the legal, regulatory and tax environments governing funding transactions, including existing or future securitization transactions. If financing is difficult, expensive or unavailable, our business, financial condition, results of operations, cash flows and future prospects could be materially and adversely affected.
Changing expectations for inflation and deflation and corresponding fluctuations in interest rates could decrease demand for our lending products and negatively affect loan performance, as well as increase certain operating costs, such as employee compensation.
There is particular uncertainty about the prospects for continued growth in the U.S. economy. A number of factors influence the potential economic uncertainty, including, but not limited to, changing U.S. consumer spending patterns, elevated and fluctuating inflation and interest rates, reduced consumer discretionary spending, and weakening wage growth and employment levels. For example, the Federal Reserve increased interest rates throughout 2022 and multiple times in 2023, has signaled that interest ratesand we are unable to predict whether it will continue to be higher than recent past, and that it may continue to raise rates further. Increased interest rates may decrease borrower demand for certain of our lending products, even as inflation places pressure on consumer spending, borrowing and saving habits as consumers evaluate their prospects for future income growth and employment opportunities in the current economic environment, and as borrowers face uncertainty about the impact of risingelevated prices on their ability to repay a loan. A change in demand for our lending products and any steps we may take to mitigate such change could impact our credit quality and overall growth. For example, we have experienced lower demand for our home loans in a risingan elevated interest rate environment, as our historical demand has primarily resulted from refinancing, which is less attractive in a higher interest rate environment. We have similarly experienced lowerAlthough demand for refinanced student loans due in part tohas increased following the expiration of the moratorium on federal student loan payments which recently expired at the end of August 2023.2023, it has not yet returned to pre-COVID levels. We have also focused on personal loan originations to offset the lower demand in other lending products. Personal loans are a higher risk product than home loans or student loans and we have recently seen an increase in the amount of personal loans that we originate which may increase the inherent risk in our overall portfolio. In addition, fluctuating interest rates may increase our cost of capital and ability to offer a competitive interest rate on our loans. Although we closely monitor these increased risks, there is no guarantee we will make the correct adjustments to our originations or make adjustments quickly enough. Furthermore, inflationary and other economic pressure resulting in
the inability of a borrower to repay a loan could translate into increased loan defaults, foreclosures and charge-offs and negatively affect our business, financial condition, results of operations, cash flows and future prospects.
Additionally, an inflationary environment combined with a competitivehealthy labor market and decreases in the market value of our equity awards could make it more costly for us to attract or retain employees. In order to meet the compensation expectations of our prospective and current employees due to inflationary and other factors, we have in the past and may in the future be required to increase our operating costs or risk losing skilled workers to competitors. See “Personnel and Business Continuity Risks—The job market and the optimization of our workforce creates a challenge and potential risk as we strive to attract and retain a highly skilled workforce” for more information on the risks posed by a competitive labor market.
Fluctuations in interest rates could negatively affect the demand for our checking and savings product.
Falling, low or fluctuating interest rates, which we have experienced in the past and may experience again in the future, may have a negative impact on the demand for our checking and savings product. Checking and savings provides members a digital banking experience that offers a variable annual percentage yield, which is at our discretion. If we are not able to offer competitive interest rates on deposit accounts, demand for our checking and savings product may decrease, which may impact our ability to access deposits as a more cost-effective source of funding for our loans. Although we have recently experienced a risingbeen in an elevated interest rate environment in recent years, there is no guarantee that it will remain so or that the interest rate we offer on deposit accounts will remain competitive and in a falling or low interest rate environment, account holders and prospective account holders may be discouraged from using these products, which would adversely affect our business, financial condition, results of operations, cash flows and future prospects.
Higher than expected payment speeds of loans could negatively impact our returns as the holder of the residual interests in securitization trusts holding personal and student loans. These factors could materially alter our net revenue or the value of our residual interest holdings.
The rate at which borrowers prepay their loans can have a material impact on our net revenue and the value of our residual interests in securitization trusts. Prepayment rates are subject to a variety of economic, social, competitive and other factors, including fluctuations in interest rates, availability of alternative financings, legislative, regulatory or policy changes affecting the student loan market, the home loan market, consumer lending generally and the general economy, including changing expectations for inflation and deflation.
While we anticipate some variability in prepayment rates, extraordinary or extended increases or decreases in prepayment rates could materially affect our liquidity and net revenue. For example, when, as a result of unanticipated prepayment levels, loans within a securitization trust amortize faster than originally contracted due to prepayments, the trust’s pool balance may decline at a rate faster than the prepayment rate assumed when the trust’s bonds were originally issued. If the trust’s pool balance declines faster than originally anticipated, in most of our securitization structures, the bonds issued by that trust will also be repaid faster than originally anticipated. In such cases, our net revenue may decrease, inclusive of our servicing revenue and the diminished value of any retained residual interest by us in the trust.
Finally, rating agencies may place bonds on watch or change their ratings on (or their ratings methodology for) the bonds issued by a securitization trust, possibly raising or lowering their ratings, based upon these prepayment rates and their perception of the risk posed by those rates to the timing of the trust cash flows. Placing bonds on watch, changing ratings negatively, proposing or making changes to ratings methodology could: (i) affect our liquidity, (ii) impede our access to the securitization markets, (iii) require changes to our securitization structures, and (iv) raise or lower the value of the residual interests of our future securitization transactions.
The transition away from LIBOR as a benchmark reference for interest rates may affect our cost of capital, or our liquidity, or expose us to borrower litigation or damage to the SoFi brand.
LIBOR has served as a global benchmark for determining interest rates on commercial and consumer loans, bonds, derivatives and numerous other financial instruments. Prior to December 31, 2021, we typically used USD LIBOR as the reference rate for the securities issued under certain of our securitizations (such as student loan securitizations), certain secured and unsecured financing facilities (such as our loan warehouse facilities, risk retention facilities and revolving credit facility), certain hedging arrangements, and our Series 1 Redeemable Preferred Stock dividends. LIBOR was set based on interest rate information reported by certain banks, which stopped reporting such information after 2021.
In the fourth quarter of 2021, we began to use SOFR (the rate recommended by the Federal Reserve in conjunction with the Alternative Reference Rates Committee as the recommended risk-free reference rate for the U.S.) as the pricing index on all new variable-rate loan originations, and on applicable new warehouse facility agreements and other financial instruments.
Although we have transitioned a large portion of our agreements and financial instruments from USD LIBOR to SOFR or other representative alternative reference rates, we have in the past and may in the future incur significant expenses in implementing replacement reference rates for the calculation of interest rates under our loan agreements with borrowers,
developing systems and analytics to successfully transition our risk management processes, and we may be subject to disputes or litigation with our borrowers over the appropriateness or comparability to LIBOR of the replacement reference rates or the interpretation or enforcement of certain fallback language in LIBOR-based products. The replacement reference rates could also result in a reduction in our interest income, which could have an adverse impact on our value, liquidity and results of operations. We may also receive inquiries and other actions from regulators in respect to our replacement of LIBOR with alternative reference rates.
These uncertainties regarding the possible cessation of LIBOR or their resolution could have a material adverse impact on our funding costs, net interest margin, loan and other asset values, asset-liability management strategies, and other aspects of our business and financial results.
We are exposed to financial risks that may be partially mitigated but cannot be eliminated by our hedging activities, which carry their own risks.
We continue to use, and may in the future use, financial instruments for hedging and risk management purposes in order to protect against possible fluctuations in interest rates, or for other reasons that we deem appropriate. In particular, we expect our interest rate risk to increase with our home loans business which continues to grow, including as a result of our acquisition of Wyndham. However, any current and future hedges we enter into will not completely eliminate the risk associated with fluctuating interest rates and our hedging activities may prove to be ineffective.
The success of our hedging strategy will be subject to our ability to correctly assess counterparty risk and the degree of correlation between the performance of the instruments used in the hedging strategy and any changes in interest rates, along with our ability to continuously recalculate, readjust and execute hedges in an efficient and timely manner. Therefore, though we may enter into transactions to seek to reduce risks, unanticipated changes may create a more negative consequence than if we had not engaged in any such hedging transactions. Moreover, for a variety of reasons, we may not seek to establish a perfect
correlation between such hedging instruments and the instruments being hedged. Any such imperfect correlation may prevent us from achieving the effect of the intended hedge and expose us to risk of loss. Any failure to manage our hedging positions properly or inability to enter into hedging instruments under acceptable terms, or any other unintended or unanticipated economic consequences of our hedging activities, could affect our financial condition and results of operations.
Our financial condition and results of operations have been and may in the future be adversely impacted by an epidemic or pandemic, including the COVID-19 pandemic.
Occurrences of epidemics or pandemics, depending on their scale, may cause different degrees of disruption to the regional, state and local economies in which we offer our products and services. For example, the COVID-19 pandemic caused changes in consumer and student behavior, as well as economic disruptions. Although government mandates to restrict daily activities have been lifted in the U.S. andAny future pandemic or public health emergency declarations have expired and the direct and indirect effects of the COVID-19 pandemic and policies as acrisis may result of the pandemic are dissipating, there is no guarantee that there will not be a future resurgence of the COVID-19 pandemic or the outbreak of another public health crisis. For example,in, among other impacts, worker shortages, supply chain issues, inflationary pressures, vaccine and testing requirements, the emergence of new variants and the reinstatement and subsequent lifting of restrictions and health and safety related measures in response to the emergence of new variants have occurred in the past and may occur in the future. We are unable to predict the future path or impact of any global or regionalmeasures. Any COVID-19 resurgences or future epidemics or pandemics or other public health crises which could adversely affect our business, operations and financial condition, as well as the business, operations and financial conditions of our members, other customers and partners.
See “Our business and results of operations have in the past and may in the future be adversely affected by the financial markets, fiscal, monetary, and regulatory policies, and economic conditions generally” and “Management’s Discussion and Analysis of our Financial Condition and Results of Operations — Operations—Key Business Metrics” and ““—— Consolidated Results of Operations” for further discussion of the impact of macroeconomic conditions in recent periods on our business and operating results.
Strategic and New Product Risks We have in the past consummated, and from time to time we may evaluate and potentially consummate, acquisitions, which could require significant management attention, disrupt our business and adversely affect our financial results.
Our success depends, in part, on our ability to expand our business. In some circumstances, we may determine to do so through the acquisition of complementary assets, businesses and technologies rather than through internal development. For
example: (i) in April 2020, we acquired 8 Limited, an investment business in Hong Kong, (ii) in May 2020, we acquired Galileo, a company that provides technology platform services to financial and non-financial institutions, (iii) in February 2022, we acquired Golden Pacific, a bank holding company, (iv) in March 2022, we acquired Technisys, a cloud-native digital multi-product core banking platform, and (v) in April 2023, we acquired Wyndham, a mortgage lender. The identification of suitable acquisition candidates can be difficult, time-consuming and costly, and we may not be able to successfully complete identified acquisitions. The risks we face in connection with acquisitions include, among others:
•diversion of management time and focus from operating our business to addressing acquisition integration challenges;
•coordination of technology, product development, risk management and sales and marketing functions;
•retention of employees from the acquired company and retention of our employees due to cultural challenges associated with integrating employees from the acquired company into our organization;
•integration of the acquired company’s accounting, management information, human resources, third-party risk management and other administrative systems;
•the need to implement or improve controls, procedures and policies at a business that prior to the acquisition may have lacked effective controls, information security and cybersecurity safeguards, procedures and policies, including third-party risk management practices;
•write-offs or impairments of intangible assets, goodwill or other assets recognized in connection with the acquisition;
•liability for activities of the acquired company before the acquisition, including patent and trademark infringement claims, violations of laws, including employment laws, commercial disputes, tax liabilities and other known and unknown liabilities;
•litigation or other claims in connection with the acquired company, including claims from terminated or current employees, customers, former stockholders or other third parties; and
•known and unknown regulatory compliance risks resulting from geographic expansion, including elevated risk factors for tax compliance, money laundering controls, and supervisory controls oversight.
Our failure to address these risks or other problems encountered in connection with our acquisitions and investments could cause us to fail to realize the anticipated benefits of these acquisitions or investments, cause us to incur unanticipated
liabilities and harm our business, generally. Future acquisitions could also result in dilutive issuances of our equity securities, the incurrence of debt, contingent liabilities, regulatory obligations to further capitalize our business, and goodwill and intangible asset impairments, and increased regulatory scrutiny, any of which could harm our financial condition and negatively impact our stockholders. To the extent we pay the consideration for any future acquisitions or investments in cash, it would reduce the amount of cash available to us for other purposes.
Demand for our products may decline if we do not continue to innovate or respond to evolving technological or other changes.
We operate in a dynamic industry characterized by rapidly evolving technology, frequent product introductions, and competition based on pricing and other differentiators. We continue to explore new product offerings and may rely on our proprietary technology to make our platform available to members, to service member accounts, to provide our technology platform-as-a-serviceplatform as a service to clients and to introduce new products, which both fosters innovation and introduces new potential liabilities and risks. In addition, we may increasingly rely on technological innovation as we introduce new types of products, expand our current products into new markets, and continue to streamline our platform. For example, while we do not currently rely heavily on artificial intelligence, we expect to integrate more artificial intelligence into our technology in the future especially to improve the experience of our members. Even if we enhance our current products or release new products that incorporate artificial intelligence, there can be no assurance that our products will be successful or that we will innovate effectively to keep pace with the rapid evolution of artificial intelligence. Our ability to integrate artificial intelligence or other new technologies may also be limited by new laws or regulatory guidance. The process of developing new technologies and products is complex, and if we are unable to successfully innovate and continue to deliver a superior member and technology platform client experience, members’ and clients’ demand for our products may decrease and our growth and operations may be harmed.
An increase in fraudulent activity could lead to reputational damage to our brand and material legal, regulatory and financial exposure (including fines and other penalties), and could reduce the use and acceptance of SoFi Money and SoFi Credit Card.
Financial institutions like us, as well as our members, colleagues, regulators, vendors and other third parties, have experienced a significant increase in fraudulent activity in recent years and will likely continue to be the target of increasingly sophisticated fraudsters and fraud rings in the future. This is particularly true for our newer products where we have limited experience evaluating customer behavior and performing tailored risk assessments, such as checking and savings and credit card.
We develop and maintain systems and processes aimed at detecting and preventing fraudulent activity, which require significant investment, maintenance and ongoing monitoring and updating as technologies and regulatory requirements change
and as efforts to overcome security and anti-fraud measures become more sophisticated. Despite our efforts, we have in the past and may in the future be subject to fraudulent activity, which may affect our results of operations. For example, our general and administrative expenses in recent yearsthe past have included charges related to fraud events. The possibility of fraudulent or other malicious activities and human error or malfeasance cannot be eliminated entirely and will evolve as new and emerging technology is deployed, including the increasing use of personal mobile and computing devices that are outside of our network and control environments, particularly as a large part of our workforce works remotely. Risks associated with each of these include theft of funds and other monetary loss, the effects of which could be compounded if not detected quickly. Fraudulent activity may not be detected until well after it occurs and the severity and potential impact may not be fully known for a substantial period of time after it has been discovered.
Fraudulent activity and other actual or perceived failures to maintain a product’s integrity and/or security has led to increased regulatory scrutiny and may lead to regulatory investigations and intervention (such as mandatory card reissuance), increased litigation (including class action litigation), remediation, fines and response costs, negative assessments of us and our subsidiaries by regulators and rating agencies, reputational and financial damage to our brand, and reduced usage of our products and services, all of which could have a material adverse impact on our business. In addition, we offer certain fraud and compliance and risk management services to technology platform clients as part of our platform as a service offerings and regulatory scrutiny of these types of services has increased recently. Any failure in these services provided to technology platform clients could result in regulatory actions or fines, and potential loss of client accounts.
Successful fraudulent activity and other incidents related to the actual or perceived failures to maintain the integrity of our processes and controls could negatively affect us, including harming the market perception of the effectiveness of our security measures or harming the reputation of the financial system in general, which could result in reduced use of our products and services. Such events could also result in legislation and additional regulatory requirements. Although we
maintain insurance, there can be no assurance that liabilities or losses we may incur will be covered under such policies or that the amount of insurance will be adequate.
SoFiWe may be unable to successfully integrate Technisys’ operations and may not realize the anticipated benefits of acquiring Technisys.
We closed the Technisys acquisition in March 2022 and continue to integrate Technisys’its operations have been largely integrated into our business. The success of the Technisys acquisition, including anticipated benefits and cost savings and potential additional revenue opportunities, will depend, in part, on SoFi’sour ability to successfully integrate Technisys’ operations in a manner that results inrealize various benefits, including, among other things, the development of an end-to-end vertically integrated banking technology stack to support multiple products and enable the combined company to meet the expanding needs of existing customers and serve additional established banks, fintechs and non-financial brands looking to enter financial services. The ongoing process of integrating operations could result in a loss of key personnel or cause an interruption of, or loss of momentum in, the activities of one or more of SoFi’s businesses or inconsistencies in standards, controls, procedures and policies that adversely affect the ability of SoFiinability to maintain relationships with customers and employees. The diversion of management’s attention and any delays or difficulties encounteredrealize our expected cost savings in connection with the integration of Technisys’ operationsacquisition could have an adverse effect on theour business, financial condition, operating results and prospects of SoFi.
If SoFi experiences difficulties in the integration process, including those listed above, SoFi may fail to realize the anticipated benefits of the Technisys acquisition in a timely manner or at all.prospects. Failure to achieve these anticipated benefits could result in increased costs, decreases in the amount of expected revenues, lost cost savings and incremental revenue opportunities and diversion of management’s time and energy and could have an adverse effect on SoFi’sour business, financial condition, operating results and prospects.
We may continue to expand operations abroad where we have limited operating experience and may be subject to increased business, economic and regulatory risks that could adversely impact our financial results.
In April 2020, we undertook our first international expansion by acquiring 8 Limited, an investment business in Hong Kong. Additionally, with the acquisition of Galileo in May 2020, we gained clients in Canada, Mexico and Colombia and, with the acquisition of Technisys in March 2022, we further expanded our operations into Latin America. We may, in the future, continue to pursue further international expansion of our business operations, either organically or through acquisitions, in new international markets where we have limited or no experience in marketing, selling and deploying our products and services. If we fail to deploy or manage our operations in these countries successfully, our business and operations may suffer. In addition, we are subject to a variety of risks inherent in doing business internationally, including:
•political, social and/or economic instability or military conflict;
•risks related to governmental regulations in foreign jurisdictions, including regulations relating to privacy, and unexpected changes in regulatory requirements and enforcement;
•fluctuations in currency exchange rates and global market volatility;
•higher levels of credit risk and fraud;
•enhanced difficulties of integrating foreign acquisitions;
•burdens of enforcing and complying with a variety of foreign laws;
•reduced protection for intellectual property rights in some countries;
•difficulties in staffing and managing global operations and the increased travel, infrastructure and legal compliance costs associated with multiple international locations and subsidiaries;
•different regulations and practices with respect to employee/employer relationships, existence of workers’ councils and labor unions, and other challenges caused by distance, language, and cultural differences, making it harder to do business in certain international jurisdictions;
•compliance with statutory equity requirements; and
•management of tax consequences.
If we are unable to manage the complexity of global operations successfully, our financial performance and operating results could suffer.
Credit Market Related Risks We operate in a cyclical industry. In an economic downturn, member default rates may increase, there may be decreased demand for our products, and there may be adverse impacts to our business.
Recent macroeconomic factors, such as government actions to curb inflation,elevated interest rates, global events and market volatility, may cause the economy to enter into a period of slower economic growth or a recession, the length and severity of which cannot be predicted. Such uncertainty and negative trends in general economic conditions can have a significant negative impact on our ability to generate adequate revenue and to absorb expected and unexpected losses. Many factors, including factors that are beyond our
control, may result in higher default rates by our members and non-payment by our technology platform clients, a decline in the demand for our products, and potentially impact our ability to make accurate credit assessments, lending decisions or technology platform client selections. Any of these factors could have a detrimental impact on our financial performance and liquidity.
Our Lending and Financial Services segments may be particularly negatively impacted by worsening economic conditions that place financial stress on our members resulting in loan defaults or charge-offs. If a loan charges off while we are still the owner, the loan either enters a collections process or is sold to a third-party collection agency and, in either case, we will receive less than the full outstanding interest on, and principal balance of, the loan. Declining economic conditions may also lead to either decreased demand for our loans or demand for a higher yield on our loans, and consequently lower prices or a lower advance rate, from institutional whole loan purchasers, securitization investors and warehouse lenders on whom we rely for liquidity.
The longevity and severity of a downturn or recession will also place pressure on lenders under our debt warehouses, whole loan purchasers and investors in our securitizations, each of whom may have less available liquidity to invest in our loans, and long-term market disruptions could negatively impact the securitizationssecuritization market as a whole. Although certain of our debt warehouses contain committed terms, there can be no assurance that our financing arrangements will remain available to us through any particular business cycle or be renewed on the same terms. The timing and extent of a downturn may also require us to change, postpone or cancel our strategic initiatives or growth plans to pursue shorter-term sustainability. The longer and more severe an economic downturn, the greater the potential adverse impact on us.
Our Technology Platform segment is also susceptible to worsening economic conditions that place financial stress on our current clients using our platform-as-a-serviceplatform as a service products and services and potential new clients interested in such services. These clients and potential clients may experience liquidity and other financial issues or strategically slowdown growth, any of which could lead them to decrease or terminate their use of our technology platform services or delay or reject implementation of new or expanded products and services. Any such actions with respect to our technology platform products and services could have an adverse impact on our business.
There can be no assurance that economic conditions will be favorable for our business, that interest in purchasing our loans by financial institutions or investment by clients in our platform-as-a-serviceplatform as a service products and services will remain at current levels, or that default rates by our members or instances of non-payment by our technology platform clients will not increase. Reduced demand, or lower prices or a lower advance rate for our loan products from institutional whole loan purchasers, securitization investors and warehouse lenders, and technology platform clients and increased default rates by our members, and reduced demand, lower prices and increased non-payment by our technology platform clients, may limit our access to capital, including debt warehouse facilities, securitizations and
securitizations, secured and unsecured borrowing facilities, and negatively impact our profitability. These impacts, in addition to limiting our access to capital and negatively impacting our profitability, could also, in turn, increase the volatility of the mark-to-market methodology we use to determine the fair value of the loans and credit card receivables we hold on balance sheet and consequently have a material adverse effect on our revenues, results of operations, capital requirements, liquidity and cash flows.
If we do not make accurate credit and pricing decisions or effectively forecast our loss rates, our business and financial results will be harmed, and the harm could be material.
In making a decision whether to extend credit to prospective or existing members, we rely upon data to assess our ability to extend credit within our risk appetite, our debt servicing capacity, and overall risk level to determine lending exposure and loan pricing. If the decision components, rapidly deteriorating macroeconomic conditions or analytics are either unstable, biased, or missing key pieces of information, the wrong decisions will be made, which will negatively affect our financial results. If our credit decisioning strategy fails to adequately predict the creditworthiness of our members, including a failure to predict a member’s true credit risk profile and ability to repay their loan or credit card balance, higher than expected loss rates will impact the fair value of our loans and credit card receivables. Additionally, if any portion of the information pertaining to the prospective member is false, inaccurate or incomplete, and our systems did not detect such falsities, inaccuracies or incompleteness, or any or all of the other components of our credit decision process fails, we may experience higher than forecasted losses, including losses attributed to fraud. Furthermore, we rely on credit reporting agencies to obtain credit reports and other information we rely upon in making underwriting and pricing decisions. If one of these third parties experiences an outage, if we are unable to access the third-party data used in our decision strategy, if such data contains inaccuracies or our access to such data is limited, our ability to accurately evaluate potential members will be compromised, and we may be unable to effectively predict credit losses inherent in our loan portfolio, which would negatively impact our results of operations, which could be material.
Additionally, if we make errors in the development, validation, or implementation of any of the underwriting models or tools that we use for the loans securing our debt warehouses or included in securitization transactions or whole loan sales, such loans may experience higher delinquencies and losses, which would negatively impact our debt warehouse financing terms and future securitization and whole loan sale transactions.
If the information provided to us by applicants is incorrect or fraudulent, we may misjudge an applicant’s qualification to receive a loan or use one of our products, and our results of operations may be harmed.
Our lending and platform access decisions are based partly on information provided to us by applicants. To the extent that an applicant provides information to us in a manner that we are unable to verify, or the information provided by an applicant consists of data obtained under false pretenses by third parties, is a manufactured/synthetic identity, or is a stolen identity, our credit decisioning process may not accurately reflect the associated risk. In addition, data provided by third-party sources, including credit reporting agencies, is a significant component of our credit decisions and this data may contain inaccuracies. Inaccurate analysis of credit data that could result from false loan application information could harm our reputation, business and results of operations. Additionally, we rely on the accuracy of applicant information in approving applicants for our non-lending products, such as SoFi Money, SoFi Credit Card or SoFi Invest accounts. If the information provided to us by these applicants is incorrect or fraudulent and we are unable to detect the inaccuracies, it increases our regulatory and fraud risk and the risk of identity theft to our members, and could harm our reputation, business and results of operations.
We use identity and fraud prevention tools to analyze data provided by external databases or automated physical identity document proofing technologies to authenticate each applicant’s identity. These fraud prevention tools, scores, and data aggregators are reliant on sustained access to reliable data sources to facilitate robust verification which have reduced effectiveness with diminished data access. From time to time in the past, however, these checks have failed and there is a risk that these checks could fail in the future and fraud, which may be significant, may occur and go undetected. For example, in the past we have identified certain fraudulent activity related to our personal loans product. While the fraudulent activity was detected and the losses were recognized in our results of operations, there can be no assurance there will not be future instances of fraud, that we will be able to detect such fraudulent activity in a timely manner, or that such future fraudulent activity will not be material. We may not be able to recoup funds underlying loans made in connection with inaccurate statements, omissions of fact or fraud, in which case our revenue, results of operations and profitability will be harmed. Fraudulent activity or significant increases in fraudulent activity could also lead to regulatory intervention, which could negatively impact our results of operations, brand and reputation, and require us to take steps to reduce fraud risk, which could increase our costs.
Internet-based loan origination processes may give rise to greater risks than paper-based processes.
We use internet-based loan processes to obtain application information and distribute certain legally required notices to applicants for, and borrowers of, our loans and to obtain electronically signed loan documents in lieu of paper documents with ink signatures obtained in person. These processes may entail greater risks than paper-based loan origination processes, including regarding the sufficiency of notice for compliance with consumer protection laws, risks that borrowers may challenge the authenticity of loan documents, or the validity of the borrower’s electronic signature on loan documents, and risks that unauthorized changes are made to the electronic loan documents. If any of those factors were to cause our loans, or any of the terms of our loans, to be unenforceable against the relevant borrowers, or impair our ability to service our loans (as master servicer or servicer), the value of our loan assets would decrease significantly to us and to our whole loan purchasers, securitization investors and warehouse lenders. In addition to increased default rates and losses on our loans, this could lead to the loss of whole loan purchasers and securitization investors and trigger terminations and amortizations under our debt warehouse facilities, each of which would materially adversely impact our business.
Student loans are subject to discharge in certain circumstances.
Private education loans, including the refinanced student loans and other student loans made by us, are generally not dischargeable by a borrower in bankruptcy. However, a private education loan may be discharged if a debtor files an adversary claim and the bankruptcy court determines that not discharging the debt would impose an undue hardship on the debtor and the debtor’s dependents. New policies implemented by the Biden Administration in late 2022 gave judges more leeway to discharge student loans, resulting in more borrowers discharging their student loans in bankruptcy in 2023, compared to prior years. In addition, in November 2022, the Department of Justice introduced a new process for handling student loan discharge cases intended to reduce the burden on debtors pursuing discharge of their federal student loans in bankruptcy. Further, bills have been introduced in Congress that would make student loans dischargeable in bankruptcy to the same extent as other forms of unsecured credit without regard to a hardship analysis. For example, in October 2022, then House Judiciary Chair Jerrold Nadler and Representative David Cicilline introduced the Student Borrower Bankruptcy Relief Act of 2022, which would eliminate the section of the U.S. bankruptcy code that makes private and federal student loans non-dischargeable through bankruptcy. In addition, in November 2022, the Department of Justice introduced a new process for handling cases of individuals that was supposed to reduce the burden on debtors pursuing discharge of their federal student loans in
bankruptcy. It is possible that a higher percentage of borrowers will obtain relief under bankruptcy or other debtor relief laws in the future than is reflected in our historical experience. A private education loan that is not a refinanced parent-student loan is also generally dischargeable as a result of the death or disability of the borrower. The discharge of a significant amount of our loans could adversely affect our business and results of operations. See “Business, FinancialRegulatory, Tax and OperationalOther Legal Risks—Legislative and regulatory policies and related actions have had and could in connection with student loans couldthe future have a material adverse effect on our student loan portfolios” and our student loan origination volume.”
We offer personal loans, which have a limited performance history, and therefore we have only limited prepayment, loss and delinquency data with respect to such loans on which to base projections.
The performance of the personal loans we offer is significantly dependent on the ability of the credit decisioning, income validation, and scoring models we use to originate such loans, which include a variety of factors, to effectively evaluate an applicant’s credit profile and likelihood of default. Despite recession-readiness planning and stress forecasting, there is no assurance that our credit criteria can accurately predict loan performance under economic conditions such as a prolonged down-cycle or recessionary economic environment or the governmental response to periods of disruption, which may drive unexpected outcomes. If our criteria do not accurately reflect credit risk on the personal loans, greater than expected losses may result on these loans and our business, operating results, financial condition and prospects could be materially and adversely affected.
In addition, personal loans are dischargeable in a bankruptcy proceeding involving a borrower without the need for the borrower to file an adversary claim.proceeding. The discharge of a significant amount of our personal loans could adversely affect our financial condition. Furthermore, other characteristics of personal loans may increase the risk of default or fraud and there are few restrictions on the uses that may be made of personal loans by borrowers, which may result in increased levels of credit consumption. We also originate a material portion of our personal loans through ACH deposits directly to the borrowers, which may result in a higher risk of fraud. The effect of these factors may be to reduce the amounts collected on our personal loans and adversely affect our operating results and financial condition.
We service all of the personal loans we originate and credit cards we issue and have limited servicing experience, and we rely on third-party service providers to service the student loans and home loans we originate, and to perform various other functions in connection with the origination and servicing of certain of our loans. If we or a third-party service provider fails to properly perform these functions, our business and our ability to service our loans may be adversely affected.
We service all of the personal loans we originate and, in all material respects, all of the credit cards we issue, and we have limited experience with such servicing. We may begin servicing the student loans that we originate at some time in the future. We rely on sub-servicers to service all of our student loans and our home loans that we deliver to GSEs and do not sell
servicing-released, and to perform certain back-up servicing functions with respect to our personal loans. In addition, we rely on third-party service providers to perform various functions relating to our loan origination and servicing business, including fraud detection, marketing, operational functions, cloud infrastructure services, information technology, telecommunications and processing remotely created checks. While we oversee these service providers to ensure they service our loans in accordance with our agreements and regulatory requirements, we do not have control over the operations of any of the third-party service providers that we utilize. In the event that a third-party service provider for any reason fails to perform such functions, including through negligence, willful misconduct or fraud, our ability to process payments and perform other operational functions for which we currently rely on such third-party service providers will suffer and our business, cash flows and future prospects may be negatively impacted. Such third-party service provider failures could also result in, among other things, increased regulatory scrutiny of our third-party service provider oversight, costly investigations, required corrective action and remediation, regulatory enforcement actions, class action lawsuits, and harm to our reputation.
Any failure on our part or on the part of third parties on whom we rely to perform functions related to our servicing activities to properly service our loans could result in us being removed as the servicer on the loans we originate, including loans financed by our warehouse facilities or sold into our whole loan sales channel and securitization transactions. If we fail to monitor our student loan sub-servicer and ensure that such sub-servicer complies with its obligations under state laws that require student loan servicers to be licensed, we may face civil claims for damages under such state laws. Because we receive revenue from such servicing activities, any such removal as the servicer or, with respect to our student loans, master servicer, could adversely affect our business, operating results, financial condition or prospects, as would the cost of onboarding a new servicer. Furthermore, we have agreed in our servicing agreements to service loans in accordance with the standards set forth therein, and may be obligated to repurchase loans or indemnify the buyer of any such loans if we fail to meet those standards.
Additionally, if one or more key third-party service providers were to cease to exist, to become a debtor in a bankruptcy or an insolvency proceeding or to seek relief under any debtor relief laws or to terminate its relationship with us, there could be delays in our ability to process payments and perform other operational functions for which we are currently
relying on such third-party service provider, and we may not be able to promptly replace such third-party service provider with a different third-party service provider that has the ability to promptly provide the same services in the same manner and on the same economic terms. As a result of any such delay or inability to replace such key third-party service provider, our ability to process payments and perform other business functions could suffer and our business, cash flows and future prospects may be negatively impacted.
We perform and manage the loan origination process for all of the home loans that we originate. If we fail to properly perform these functions, our home loans business may be adversely affected.
In April 2023, we acquired Wyndham, a leading mortgage lender, expanding our home loans business. In connection with the acquisition of Wyndham, we adopted loan origination technology which facilitates performing many functions in connection with the origination of home loans, including processing, underwriting, pricing, vendor management, closing, and additional functions for loan origination that we previously outsourced to third-party providers, and we now directly manage loan underwriters and loan processors which are services previously managed by third-party providers. In the event that we fail for any reason to perform or manage such functions in accordance with all applicable requirements, including through human errors, technology errors, negligence, willful misconduct or fraud, our ability to originate home loans will suffer and our business, cash flows and future prospects may be negatively impacted, and we could incur penalties or liabilities including obligations to repurchase loans from investors to whom we sold the loans. Additionally, if we fail to perform such functions or properly manage our new resources, we may be unable to complete, or be delayed in the completion of, the origination of home loans in our pipeline and to originate new home loans, and we may not be able to promptly onboard a replacement service provider that has the ability to promptly provide the same services in the same manner and on the same economic terms.
Potential geographic concentration of our members may increase the risk of loss on the loans that we originate and negatively impact our business.
Any concentration of our members in specific geographic areas may increase the risk of loss on our loans. Certain regions of the U.S. from time to time will experience weaker economic conditions and higher unemployment and, consequently, will experience higher rates of delinquency and loss than on similar loans in other regions of the country. Moreover, a further deterioration in economic conditions or a recession, outbreaks of disease, (such as additional COVID-19 strains or variants), the continued increase in extreme weather conditions and other natural events (such as hurricanes, tornadoes, floods, drought, wildfires, mudslides, earthquakes and other extreme conditions) and other factors could adversely affect the ability and willingness of borrowers in affected regions to meet their payment obligations under their loans and may consequently affect the delinquency and loss experience of such loans. In addition, we, as master servicer for all student loans and home loans and as servicer of our personal loans, have offered in the past, and may in the future offer, hardship forbearance or other relief programs in certain circumstances to affected borrowers.
Conversely, an improvement in economic conditions in one or more of the geographic areas in which we have members could result in higher prepayments of their payment obligations under their loans by borrowers in such states. As a result, we and the whole loan purchasers who hold our loans or securitization investors or warehouse lenders who hold securities backed by our loans may receive principal payments earlier than anticipated, and fewer interest payments than anticipated, and face certain reinvestment risks, such as the inability to acquire loans on equally attractive terms as the prepaid loans. In addition, higher prepayments than anticipated may have a negative impact on our servicing revenue which could cause our operating results and financial condition to be materially and adversely affected.
Further, the concentration of our loans in one or more geographic locations may have a disproportionate effect on us or investors in our loans or securities backed by our loans if governmental authorities in any of those areas take action against us as originator, master servicer or servicer of those loans or take action affecting our ability as master servicer or servicer to service those loans.
Funding and Liquidity Risks If we are unable to retain and/or increase our current sources of funding, including deposits, and secure new or alternative methods of financing, our ability to finance additional loans and introduce new products will be negatively impacted.
Historically, in addition to the issuance of equity, we have funded our operations and capital expenditures primarily through access to the capital markets through sales of our loans, access to secured and unsecured borrowing facilities and utilization of securitization financing from consolidated and nonconsolidated VIEs. In each of these instances (other than for certain whole loan sales of home loans), we retain the servicing rights to our loans from which we earn a servicing fee. In securitization financing transactions, we transfer a pool of loans originated by SoFi Lending Corp. or SoFi Bank to a VIE which
is sponsored by SoFi Lending Corp. or SoFi Bank, and we retain risk in the VIE, typically in the form of asset-backed bonds and residual interest investments. Through SoFi Bank, we utilize deposits as well, which offer us a lower cost source of funds, and we have the ability to access other funding sources, such as the Federal Home Loan Bank (“FHLB”)FHLB and certain brokered deposit channels established by SoFi Bank. We rely on each of these outlets for liquidity and the loss or reduction of any one of these outlets, including deposits, could materially adversely impact our business. For example, certain banks have faced operational difficulties in accessing the FHLB discount window and there is no guarantee that we will not face the same or similar issues. In addition, there can be no assurance that we will be able to successfully access the securitization markets at any given time, or that deposits at SoFi Bank will remain at current levels or grow, and in the event of a sudden or unexpected shortage of funds in the banking and financial system, we cannot be sure that we will be able to maintain necessary levels of funding without incurring high funding costs, a reduction in the term of funding instruments, an increase in the amount of equity we are required to hold or the liquidation of certain assets. Furthermore, there is a risk that there will be no market at all for our loans either from whole loan buyers or through investments in securities backed by our loans.
We may require capital in excess of amounts we currently anticipate, and depending on market conditions and other factors, we may not be able to maintain our capital or obtain additional capital for our current operations or anticipated future growth on reasonable terms or at all. As the volume of loans that we originate, and the increased suite of products that we make available to members, increases, we may be required to expand the size of our debt warehousing facilities or seek additional sources of capital. The availability of these financing sources depends on many factors, some of which are outside of our control. We may also experience the occurrence of events of default or breaches of financial performance or other covenants under our debt agreements, which could reduce or terminate our access to institutional funding.
If we are unable to increase our current sources of funding, including deposits, and secure new or alternative methods of financing, our ability to finance additional loans and to develop and offer new products will be negatively impacted. The interest rates, advance rates and other costs of new, renewed or amended facilities may also be higher than those currently in effect. If we are unable to renew or otherwise replace these facilities or generally arrange new or alternative methods of financing on favorable terms, we may be forced to curtail our origination of loans or reduce lending or other operations, which would have a material adverse effect on our business, financial condition, operating results and cash flows.
If one or more of our warehouse facilities, on which we are highly dependent, is terminated or otherwise becomes unavailable, we may be unable to find replacement financing on favorable terms, or at all, which would have a material adverse effect on our business and financial condition.
We require a significant amount of short-term funding capacity for loans we originate. Consistent with industry practice, our existing warehouse facilities generally require periodic renewal. If any of our committed warehouse facilities are terminated or are not renewed or our uncommitted facilities are not honored, we may be unable to find replacement financing on favorable terms, or at all, and we might not be able to originate an acceptable or sustainable volume of loans, which would
have a material adverse effect on our business. Additionally, as our business continues to expand, including our home loan business, we may need additional warehouse funding capacity for the loans we originate. There can be no assurance that, in the future, we will be able to obtain additional warehouse funding capacity on favorable terms, on a timely basis, or at all.
If we fail to meet or satisfy any of the financial or other covenants included in our warehouse facilities, we would be in default under one or more of these facilities and our lenders could elect to declare all amounts outstanding under the facilities to be immediately due and payable, enforce their interests against loans pledged under such facilities and restrict our ability to make additional borrowings. Certain of these facilities also contain cross-default provisions. These restrictions may interfere with our ability to obtain financing or to engage in other business activities, which could materially and adversely affect us. There can be no assurance that we will maintain compliance with all financial and other covenants included in our warehouse facilities in the future.
In addition, our agreements with our warehouse lenders contain various concentration limits and triggers, including related to excess spread. As high interest rates place pressure on our net cost of funds for loans held at SoFi Lending Corp., which do not benefit from deposit funding through SoFi Bank, the likelihood of reaching an excess spread limit increases. A breach of such limits or other similar terms of such agreements could result in an inability to place loans in the relevant warehouse facilities and require us to pursue other forms of financing. If we are unable to find replacement financing on favorable terms, or at all, our operations could be impacted materially.
Increases in member default rates on loans could make us and our loans less attractive to whole loan buyers, lenders under debt warehouse facilities and investors in securitizations, which may adversely affect our access to financing and our business.
Increases in member default rates, due to deteriorating economic conditions or other factors, could make us and our loans less attractive to our existing or prospective funding sources, including whole loan buyers, securitization investors and lenders under debt warehousing facilities. If our existing funding sources do not achieve their desired financial returns or if they suffer losses, they or prospective funding sources may increase the cost of providing future financing or refuse to provide future financing or purchase loans on terms acceptable to us or at all.
Our securitizations are nonrecourse to the Company and are collateralized by the pool of our loans pledged to the relevant securitization issuer. If the loans securing our securitizations fail to perform as expected, rating agencies may place our bonds on watch or change their ratings on (or their ratings methodology for) the bonds issued by our securitization trusts. Our loans performance and any actions taken by the rating agencies could result in the lenders under our warehouse facilities, the whole loan purchasers who purchase our loans, the investors in our securitizations who purchase securities backed by our loans, or future lenders, whole loan purchasers or securitization investors in similar arrangements, increasing the cost of providing future financing or refusing to provide future financing or purchase loans on terms acceptable to us or at all.
While this risk may be partially mitigated by our ability to hold loans on our balance sheet, in sufficient volume this will negatively impact our financial condition. Consequently, if we were to be unable to arrange new or alternative methods of financing on favorable terms, we may have to curtail or cease our origination of loans, which could have a material adverse effect on our business, financial condition, operating results and cash flows.
We make representations and warranties in connection with the transfer of loans to whole loan purchasers, government-sponsored enterprises, and our debt warehouse lenders and securitization trusts. If such representations and warranties are not correct, we could be required to repurchase loans or indemnify the purchaser, which could have an adverse effect on our ability to operate and fund our business.
We sell and finance the loans we originate to and with third parties, including, with respect to home loans, counterparties like GSEs, and we make certain representations and warranties to those third parties in connection with the transfer of loans described below. In the ordinary course of business, we are exposed to liability under these representations and warranties made to purchasers of loans. Such representations and warranties typically include, among other things, that the loans were originated and serviced in compliance with the law and with our credit risk origination policy and servicing guidelines, and, in connection with transfers to GSEs, that the loans were originated in compliance with the guidelines of the relevant GSE, and that, to the best of our knowledge, each loan was originated by us without any fraud or misrepresentation on our part or on the part of the borrower or any other person. In addition, purchasers require loans to meet strict underwriting and loan term criteria in order to be eligible for purchase. If those representations and warranties are breached as to a given loan, or if a certain loan we sell does not meet the relevant eligibility criteria, we will be obligated to repurchase the loan, typically at a purchase price equal to the then-outstanding principal balance of such loan, plus accrued interest and any premium. We may also be required to indemnify the purchaser for losses resulting from the breach of representations and warranties. With regard to home loans insured by the Federal Housing Administration or the United States Department of Veterans Affairs (“VA”),VA, and
to the extent that any of our home loans do not comply with Federal Housing Administration or VA guidelines, we could also face claims under the False Claims Act. In connection with our whole loan sales, we also typically covenant to repurchase any loan that enters delinquent status within the first thirty to sixty days following origination of the loan. Any significant increase in our obligation to repurchase loans or indemnify purchasers of loans could have a significant adverse impact on our cash flows, even if they are reimbursable, and could also have a detrimental effect on our business and financial condition. If any such repurchase event occurs on a large scale, we may not have sufficient funds to meet our repurchase obligations, which would result in a default under the underlying agreements. Moreover, we may not be able to resell or refinance loans repurchased due to a breach of a representation or warranty or we may be forced to sell such loans below par. Any such event could have an adverse impact on our business, operating results, financial condition and prospects. In addition, in the acquisition of Wyndham, we also acquired Wyndham's liability to its loan investors and loan insurers for mortgage loans originated by Wyndham, including repurchase obligations that might not be contingent upon the investor proving an error by Wyndham.
In addition to loan level representations and warranties, our agreements with the lenders and investors on our securitizations, debt warehouse facilities and corporate revolving debt contain a number of corporate financial covenants and early payment triggers and performance covenants. These facilities, together with deposits, are the primary funding sources available to support the maintenance and growth of our business and our liquidity would be materially adversely affected by our inability to comply with the various covenants and other specified requirements set forth in our agreements with our lenders and investors, which could result in the early amortization, default and/or acceleration of our existing facilities. Such covenants and requirements include financial covenants, portfolio performance covenants and other events. For a description of these
covenants, requirements and events, see “Management’s Discussion and Analysis of Financial Condition and Results of Operations — Liquidity and Capital Resources”.
During an early amortization period or occurrence of a termination event or an event of default, principal collections from the loans in our asset-backedwarehouse facilities would be applied to repay principal under such facilities rather than being available to fund newly originated loans. During the occurrence of a termination event or an event of default under any of our facilities, the applicable lenders could accelerate the related debt and such lenders’ commitments to extend further credit under the related facility, if any, would terminate. If we were unable to repay the amounts due and payable under such facilities and securitizations, the applicable lenders and noteholders could seek remedies, including against the collateral pledged under such facilities and by the securitization trust. An acceleration of the debt under certain facilities could also lead to a default under other facilities and, in certain instances, our hedging arrangements, due to cross-default and cross-acceleration provisions.
An early amortization event or event of default would negatively impact our liquidity, including our ability to originate new loans, and require us to rely on alternative funding sources, which might increase our funding costs or which might not be available when needed. If we were unable to arrange new or alternative methods of financing on favorable terms, we might have to hold loans on balance sheet in an amount that may negatively impact our financial condition, or curtail or cease the origination of loans, which could impair our growth, and, in each case, have a material adverse effect on our business, financial condition, operating results and cash flows, which in turn could have a material adverse effect on our ability to meet our obligations under our facilities.
We require substantial capital and, in the future, may require additional capital to pursue our business objectives and achieve recurring profitability. If adequate capital is not available to us or is unavailable on favorable terms, including due to the cost and availability of funding in the capital markets, our business, operating results and financial condition may be harmed.
Since our founding, we have raised substantial equity and debt financing to support the growth of our business. We may require additional capital to pursue our business objectives and growth strategy and respond to business opportunities, challenges or unforeseen circumstances, including supporting our lending operations, increasing our marketing expenditures to attract new members and technology platform clients and improve our brand awareness, developing our products, introducing new services, further expanding internationally in existing or new countries or further improving existing offerings and services, enhancing our operating infrastructure and potentially acquiring complementary businesses and technologies, and complying with the increased regulatory requirements for bank holding companies and banks. Accordingly, on a regular basis we need, or we may need, to engage in additional debt or equity financings to secure additional funds. However, additional funds may not be available when we need them, in amounts we need, or permitted to be applied to specific use cases, on terms that are acceptable to us or at all. Volatility in the credit markets in general or in the market for personal, student and home loans and credit cards in particular may also have an adverse effect on our ability to obtain debt financing. Furthermore, the cost of our borrowing has increased and may continue to increase due to market volatility, interest rates that are higher than those in the recent past, changes in the risk premiums required by lenders or the unavailability of traditional sources of debt capital. Volatility or depressed valuations or trading prices in the equity markets may similarly adversely affect our ability to obtain
equity financing. Furthermore, if we raise additional funds through further issuances of equity or convertible debt securities, our existing stockholders could suffer significant dilution and any new equity securities we issue could have rights, preferences and privileges superior to those of holders of our common stock.
We are required to serve as a source of financial strength for SoFi Bank, which is subject to minimum capital requirements imposed by federal regulators, which means that we may be required to provide capital or liquidity support to SoFi Bank, even at times when we may not have the resources to provide such support. In addition, maintaining adequate liquidity is crucial to our securities brokerage, and our money services business (“MSB”) operations, including key functions such as transaction settlement, custody requirements and margin lending. Our broker-dealer subsidiary, SoFi Securities, is subject to Rule 15c3-1 under the Exchange Act, which specifies minimum capital requirements intended to ensure the general financial soundness and liquidity of broker-dealers, and SoFi Securities is subject to Rule 15c3-3 under the Exchange Act, which requires broker-dealers to maintain certain liquidity reserves. We meet our liquidity needs primarily from working capital, deposits and cash generated by member activity, as well as from external debt and equity financing. Increases in the number of members, fluctuations in member cash or deposit balances, as well as market conditions or changes in regulatory treatment of member deposits, may affect our ability to meet our liquidity needs.
A reduction in our liquidity position could reduce our members’ confidence in us, which could result in the withdrawal of member assets, including deposits held at SoFi Bank, and loss of members, or could cause us to fail to satisfy minimum capital requirements for SoFi Bank, or broker-dealer or other regulatory capital guidelines, which may result in immediate suspension of banking and other securities activities, regulatory prohibitions against certain business practices, increased regulatory inquiries and reporting requirements, increased costs, fines, penalties or other sanctions, including suspension or expulsion by the Federal Reserve, the
OCC, the SEC, the Financial Industry Regulatory Authority (“FINRA”)FINRA or other self-regulatory organizations (“SROs”)SROs or state regulators, and could ultimately lead to the liquidation of SoFi Bank or our broker-dealer or other regulated entities. Factors which may adversely affect our liquidity position include temporary liquidity demands due to timing differences between brokerage transaction settlements and the availability of segregated cash balances, timing differences between digital asset transaction settlements between us and our digital asset market makers and between us and our digital asset members, fluctuations in cash held in member accounts, a significant increase in our margin lending activities, increased regulatory capital requirements, changes in regulatory guidance or interpretations, or Federal Housing Administration or VA guidelines, other regulatory changes or a loss of market or member confidence resulting in unanticipated withdrawals of member assets. We expect that we will continue to use our available cash to fund our lending activities and help scale our Financial Services segment. To supplement our cash resources, we may seek to enter into additional securitizations and whole loan sale agreements or increase the size of existing debt warehousing facilities, increase the size of, or replace, our revolving credit facility, continue to grow deposits and pursue other potential options. In addition, a reduction in our liquidity position could impair our technology platform clients’ confidence in us and our platform-as-a-serviceplatform as a service products and services, many of which require capital investments and ongoing platform maintenance by us, which could result in decisions by our technology platform clients to terminate or not renew their existing contracts or to not add new products to their account.
If we are unable to adequately maintain our cash resources, we may delay non-essential capital expenditures, implement cost cutting procedures, delay or reduce future hiring, discontinue the pursuit of our strategic objectives and growth strategies or reduce our rate of future originations compared to the current level. There can be no assurance that we can obtain sufficient sources of external capital to support the growth of our business. Delays in doing so or failure to do so may require us to reduce loan originations or reduce our operations, which would harm our ability to pursue our business objectives as well as harm our business, operating results and financial condition.
We are unable to finance all of the receivables that we originate or other assets that we hold, and that illiquidity could result in a negative impact on our financial condition.
We primarily operatehave the option of pursuing a gain-on-sale origination model, the success of which is tied to our ability to finance the assets that we originate. Certain of our assets, however, are ineligible for sale to a whole loan buyer or securitization trust, or are ineligible for, or are subject to a lower advance rate under, warehouse funding, each of which has specific eligibility criteria for receivables it purchases or holds as collateral. Ineligible receivables include, among others, those in default or that are delinquent, receivables with defects in their origination or servicing, including fraud, or receivables generated under origination guidelines and credit policies that are no longer in effect. In addition, many of our warehouse funding sources contain excess concentration limits for loans in forbearance or with specific loan level characteristics such as time-to-maturity or loan type. Once these limits have been exceeded, the advance rate applied to those receivables becomes less advantageous to us. If we are unable to sell or reasonably fund these receivables, we are required to hold them on our consolidated balance sheet which, in sufficient volume, negatively impacts our financial condition.
In addition to the receivables described above, we also hold on our consolidated balance sheet certain risk retention assets with respect to which we have a reduced ability to receive financing. These risk retention assets include residuals from
our securitization trusts that are either ineligible for transfer or are subject to EU regulations. The illiquidity of these positions may negatively impact our financial condition.
Our checking and savings product is expected to continue to provide us with an important source of cost-efficient funding and any failure to scale the product due to our limited experience or a competitive marketplace could have a negative impact on our business, operating results and financial condition.
We expect that checking and savings, a deposit account product, will continue to provide us with an important source of deposits to use for cost-effective funding of loan originations and other activities. However, revenue growth for checking and savings is dependent on increasing the volume of members who open an account and on growing balances in those accounts. Although checking and savings accounts have grown since its introduction in the first quarter of 2022, there is no guarantee that account openings and the amount on deposit in those accounts will continue to grow. In addition, although we have invested in a number of initiatives to attract new checking and savings account holders and capture a greater share of our members’ savings, including offering a competitive annual percentage yield on deposits and offering SoFi Plus membership benefits to deposit holders, there can be no assurance that these investments to acquire and retain members, provide differentiated features and services and spur usage of our deposit account product will be effective or cost effective. There are also no assurances that we will be able to maintain a competitive annual percentage yield on deposits, and members can easily transfer checking and savings account balances to our competitors. Further, developing our service offerings and marketing the checking and savings product in additional customer acquisition channels could have higher costs than anticipated or be less effective than anticipated, and could adversely impact our results or dilute our brand. Finally, our checking and savings product faces competition from similar products offered by our competitors which may offer more attractive features, including a higher interest rate on deposits, which may impact the success of the product. In the event we are unable to sufficiently grow the checking and savings product, we may be required to find alternative, higher-cost funding for our lending and other activities,
or we might not be able to originate an acceptable or sustainable volume of loans, either of which could have a negative impact on our business, operating results and financial condition. See “Market and Interest Rate Risks — Fluctuations in interest rates could negatively affect the demand for our checking and savings product”.
Any failure to accurately capture credit risk or to execute our funding strategy for SoFi Credit Card could have a negative impact on our business, operating results and financial condition.
The performance of the SoFi Credit Card product is significantly dependent on the ability of the credit and fraud decisioning and scoring models we use to originate the product, which includes a variety of factors, to effectively prevent fraud, evaluate an applicant’s credit profile and likelihood of default. Despite establishing a defined risk appetite and leveraging third-party stress testing of product loss forecasts, there is no assurance that our credit criteria can accurately predict repayment and loss profiles. If our criteria do not accurately prevent fraud or reflect credit risk on the SoFi Credit Card product, greater than expected losses may result and our business, operating results, financial condition and prospects could be materially and adversely affected.
In addition, revenue growth for SoFi Credit Card is dependent on increasing the volume of members who open an account and on growing loan balances on those accounts. Over time we will continue to invest in a number of new product initiatives to attract new SoFi Credit Card members and capture a greater share of our members’ total spending and borrowings. Revenue growth for SoFi Credit Card may be adversely affected by new restrictions on credit card fees finalized by the CFPB in March 2024. Although scheduled to become effective in May 2024, the rule is subject to challenge in the 5th U.S. Circuit Court of Appeals and could be stayed. If it becomes effective as written, the rule would significantly reduce the penalty fees that could be charged to a SoFi Credit Card customer who fails to make a timely payment, which may adversely affect revenue and our ability to limit losses resulting from such delinquencies. While we have generally seen increases in revenue from SoFi Credit Card, there can be no assurance that our investments in SoFi Credit Card to acquire members, provide differentiated features and services and spur usage of our card will continue to be effective, and developing our service offerings and forming new partnerships could have higher costs than anticipated, and could adversely impact our results or dilute our brand.
Furthermore, the success of the SoFi Credit Card product depends on our ability to execute on our funding strategy for the resulting credit card receivables. We may establish a credit card receivable securitization program in the future. There is no guarantee, however, that we will be successful in establishing a securitization program for these assets. In the event we are unable to finance our credit card receivables, we may be required to hold those assets on our consolidated balance sheet or sell them for a loss, either of which could have a negative impact on our business, operating results and financial condition.
Regulatory, Tax and Other Legal Risks As a bank holding company, we are subject to extensive supervision and regulation, and changes in laws and regulations applicable to bank holding companies could limit or restrict our activities and could have a material adverse effect on our operations.
As a bank holding company, we are subject to regulation, supervision and examination by the Federal Reserve, and SoFi Bank is subject to regulation, supervision and examination by the OCC and the FDIC, as well as regulations issued by the CFPB. Federal laws and regulations govern numerous matters affecting us, including changes in the ownership or control of banks and bank holding companies, maintenance of adequate capital and the financial condition of a financial institution, permissible types, amounts and terms of extensions of credit and investments, permissible nonbanking activities, the level of reserves against deposits and restrictions on dividend payments. The OCC possesses the power to issue cease and desist orders to prevent or remedy unsafe or unsound practices or violations of law by banks subject to their regulation, and the Federal Reserve possesses similar powers with respect to bank holding companies. In general, the bank supervisory framework is intended to protect insured depositors and the safety, soundness and stability of the U.S. financial system and not shareholders in depository institutions or their holding companies.
In connection with applying for approval to become a bank holding company, we developed a financial and bank capitalization plan and enhanced our governance, compliance, controls and management infrastructure and capabilities in order to ensure compliance with all applicable regulations, which required, and will continue to require, substantial time, monetary and human resource commitments. If any new regulations or interpretations of existing regulations to which we are subject impose requirements on us that are impractical or that we cannot satisfy, our financial performance, and our stock price, may be adversely affected.
Federal regulations establish minimum capital requirements for insured depository institutions, including minimum risk-based capital and leverage ratios, and define “capital” for calculating these ratios. The minimum capital requirements are:
(i) a common equity Tier 1 capital ratio of 4.5%; (ii) a Tier 1 to risk-based assets capital ratio of 6%; (iii) a total capital ratio of 8%; and (iv) a Tier 1 leverage ratio of 4%. The regulations also establish a “capital conservation buffer” of 2.5%. of common equity Tier 1 capital. An institution will be subject to limitations on paying dividends, engaging in share repurchases and paying discretionary bonuses if its capital level falls below the capital conservation buffer amount. The federal banking regulators could also require the Company and/or SoFi Bank, as applicable, to hold capital that exceeds minimum capital requirements for insured depository institutions. The application of these capital requirements could, among other things, require us to maintain higher capital resulting in lower returns on equity, and we may be required to obtain additional capital, or face regulatory actions if we are unable, to comply with such requirements.
We are also subject to the requirements in Sections 23A and 23B of the Federal Reserve Act and the Federal Reserve Board’sReserve’s implementing Regulation W, which regulate loans, extensions of credit, purchases of assets, and certain other transactions between an insured depository institution (such as SoFi Bank) and its affiliates. The statute and regulation require us to impose certain quantitative limits, collateral requirements and other restrictions on “covered transactions” between SoFi Bank and its affiliates and require all transactions be on “market terms” and conditions consistent with safe and sound banking practices.
The laws, rules, regulations, and supervisory guidance and policies applicable to us are subject to regular modification and change, including increased regulation as a result of the turmoil in the banking industry. These changes could adversely and materially impact us. For example, the Dodd-Frank Act and other federal banking laws subject companies with $10 billion or more of consolidated assets to additional regulatory requirements. Section 1075 of the Dodd-Frank Act, which is commonly known as the “Durbin Amendment”, amended the Electronic Fund Transfer Act to restrict the amount of interchange fees that may be charged and prohibit network exclusivity for debit card transactions. SoFi Bank is required to comply with the restrictions on interchange fees that went into effect on July 1, 2023, which may negatively impact future interchange fees.fees we collect. In addition, in October 2023, the Federal Reserve proposed changes to the regulations implementing the Electronic Fund Transfer Act that would further restrict the amount of interchange fees that may be charged and require biennial reviews of those fees. Changes in laws, rules, regulations and supervisory guidance and policies could, among other things, subject us to additional costs, including costs of compliance; limit the types of financial services and products we may offer; and/or increase the ability of non-banks to offer competing financial services and products. Failure to comply with laws, regulations, policies, or supervisory guidance could result in enforcement and other legal actions by federal and state authorities, including criminal and civil penalties, the loss of FDIC insurance, revocation of a banking charter or registration as a broker-dealer and investment adviser, other sanctions by regulatory agencies, civil money penalties, and/or reputational damage, which could have a material adverse effect on our business, financial condition, and results of operations.
Finally, we intend to continue to explore other products for SoFi Bank over time. Some of those products may require, or be deemed to require, additional data, procedures, partnerships, regulatory approvals, or capabilities that we have not yet
obtained or developed. Should we fail to expand and evolve SoFi Bank products in a successful manner, or should these new products, or new regulations or interpretations of existing regulations, impose requirements on us that are cumbersome or that we cannot satisfy, our business may be materially and adversely affected.
Failure to comply with applicable laws, regulations or commitments, or to satisfy our regulators’ supervisory expectations, could subject us to, among other things, supervisory or enforcement action, which could adversely affect our business, financial condition and results of operations.
If we do not comply with applicable laws, regulations or commitments, including SoFi Bank’s operating agreement, if we are deemed to have engaged in unsafe or unsound conduct, or if we do not satisfy our regulators’ supervisory expectations, then we may be subject to increased scrutiny, supervisory criticism, governmental or private litigation and/or a wide range of potential monetary penalties or consequences, enforcement actions, criminal liability and/or reputational harm. Such actions could be public or of a confidential nature, and arise even if we are acting in good faith or operating under a reasonable interpretation of the law and could include, for example, monetary penalties, payment of damages or other monetary relief, restitution or disgorgement of profits, directives to take remedial action or to cease or modify practices, restrictions on growth or expansionary proposals, denial or refusal to accept applications, removal of officers or directors, prohibition on dividends or capital distributions, increases in capital or liquidity requirements and/or termination of SoFi Bank’s deposit insurance. Additionally, compliance with applicable laws, regulations and commitments requires significant investment of management attention and resources. Any failure to comply with applicable laws, regulations or commitments could have an adverse effect on our business, financial condition and results of operations.
An inability to accept or maintain deposits due to market demand or regulatory constraints could materially adversely affect our liquidity position and our ability to fund our business.
SoFi Bank accepts deposits and uses the proceeds as a source of funding, with our direct retail deposits becoming a larger proportion of our funding over time. Although earlier this year we launched the SoFi Insured Deposit Program in 2023, whereby funds (up
(up to $2 million) are deposited into deposit accounts at banks which are insured by the FDIC up to the applicable limits, we continue to face strong competition with regard to deposits, and pricing and product changes may adversely affect our ability to attract and retain cost-effective deposit balances. To the extent we offer higher interest rates to attract or maintain deposits, our funding costs will be adversely impacted.
Our ability to obtain deposit funding and offer competitive interest rates on deposits is also dependent on SoFi Bank’s capital levels. The FDIA’s brokered deposit provisions and related FDIC rules in certain circumstances prohibit banks from accepting or renewing brokered deposits and apply other restrictions, such as a cap on interest rates that can be paid. For example, while SoFi Bank met the definition of “well-capitalized” as of September 30, 2023March 31, 2024 and currently has no restrictions regarding acceptance of brokered deposits or setting of interest rates, there can be no assurance that we will continue to meet this definition. Additionally, our regulators can adjust applicable capital requirements at any time and have authority to place limitations on our deposit businesses. An inability to attract or maintain deposits in the future could materially adversely affect our ability to fund our business.
Legislative and regulatory actionspolicies and related economic uncertaintyactions have had and could in the future have a material adverse effect on our currentstudent loan portfolios and our student loan origination volume.
Legislative and regulatory actions have had and could continue to have a significant impact on our student loan refinancing business. On March 27, 2020, the Coronavirus Aid, Relief, and Economic SecurityCARES Act (“CARES Act”) was signed into law. In compliance with the CARES Act, payments and interest accrual on all loans owned by the U.S. Department of Education were initially suspended through September 30, 2020, a pause on student loan repayments that was subsequently extended through August 30, 2023 by a series of executive actions. Interest on federal student loans began accruing on September 1, 2023 and borrowers’ first loan payments were due in October 2023. Although federal student loans are largely back in repayment, the increased focus in recent years by policymakers on outstanding federal student loans, including, among other things, on the total volume of outstanding loans and on the number of loans outstanding per borrower, has led to discussion of additional potential legislative and regulatory actions and other possible steps to, among other things:
•permit private education loans such as our refinanced student loan and in-school student loan products to be discharged in bankruptcy without the need to show undue hardship;
•amend the federal postsecondary education loan programs, including to reduce interest rates on certain loans, to revise repayment plans, to make income-driven repayment plans more attractive to borrowers, to implement broader loan forgiveness plans, to provide for refinancing of private education loans into federal student loans at low interest rates, to reduce or eliminate the Grad PLUS program (which authorizes loans that comprise a substantial portion of our student loan refinancing business) and to provide for refinancing of existing federally held student loans into new federal student loans at low interest rates;
•require private education lenders to reform loan agreements to provide for income-driven repayment plans and other payment plans; and
•make sweeping changes to the entire cost structure and financial aid system for higher education in the U.S., including proposals to provide free postsecondary education.
In addition, there is pressure on policymakers to reduce or cancel student loans or accrued interest at a significant scale, which would further reduce demand for our student loan refinancing product and have a negative impact on our loan origination volume and revenue. For example, in August 2022, President Biden announceddespite legal challenges at the Supreme Court to some of the Biden Forgiveness Program. AlthoughAdministration’s prior student loan forgiveness measures, the Biden Administration continues to pursue options for providing relief to student borrowers, announcing additional relief throughout 2023 and 2024, including that it would cancel more than $132 billion of student debt for more than three million borrowers and continue to pursue debt forgiveness strategies including through the SAVE Plan which offers forgiveness after as few as 10 years of payments for borrowers who originally took out $12,000 or less for college, and approval of $5.8 billion in additional student loan debt relief for 77,700 borrowers made possible under the U.S. Supreme Court subsequently struck down the Biden Forgiveness Program, President Biden indicated between October 1, 2023 and September 30,Department of Education’s PSLF. In addition, in April 2024, he would allow federal loan borrowers to not be considered delinquent if they miss a payment and that the U.S. Department of Education will not refer borrowers who failissued a notice of proposed rulemaking to pay their student loan bills to credit agencies. In addition, on July 14, 2023, President Biden announced that $39 billion in federalinclude targeted student loan debt forgiveness to certain borrowers, including provisions under the Higher Education Act of 1965, as amended, that would be eliminatedprovide relief for eligible borrowers of runaway interest, forgiveness of outstanding debt related to remedy mistakes of loan servicers,loans which entered repayment at least 20 years ago, and other student loan holders will have their loans adjusted. On October 4, 2023, the Biden Administration approved an additional 125,000 borrowers for student loan debtprovisions to facilitate relief totaling an additional $9 billion in student debt forgiveness. These legislative and regulatory actions have served, and any similar measures in therelated to income-driven repayment plans.
The future are likely to continue to serve, as a disincentive for borrowers to refinance their federal student loans through our platform, thereby reducing our student loan refinancing
origination volume and negatively impacting our revenue. While we have seen and expect we may continue to see an increase in student loan refinancing volume following the end of federal student loan moratorium in August 2023, the timing and impact to our student loan refinancing product will largely depend on expectations regarding the introduction or implementation of these or any additional relief measures, the interest rate environment, how competitive our student loan refinancing products are compared to our competitors and macroeconomic factors. If in the future, student loans were forgiven or canceled in any meaningful scale, or if federal loan borrowers were permitted to refinance at lower interest rates, our student loan refinancing business within our Lending segment, which is our largest segment, would be materially and
adversely affected and our profitability, results of operations, financial condition, cash flows or future business prospects could be materially and adversely affected as a result. In addition, proposals to make student loans dischargeable in bankruptcy or similar proposals could make whole loan purchasers less likely to purchase our student loans, securitization investors less likely to purchase securities backed by our student loans or warehouse lenders less likely to lend against our student loans at attractive advance rates. As a result of any material adverse effect to our Lending segment, our overall profitability, results of operations, financial condition, cash flows or future business prospects may be adversely affected.
Although we continue to evaluate the ultimate impact of local, state and federal legislation, regulation and politics, guidance and actions, future legislative, regulatory and executive actions, and the ongoing impact of our own forbearance measures on our financial results, business operations and strategies, there is no guarantee that our estimates will be accurate or that any actions we take based on such estimates will be successful. Furthermore, we believe that the cost of responding to, and complying with, evolving laws and regulations, as well as any guidance from enforcement actions, will continue to increase, as will the risk of penalties and fines from any enforcement actions that may be imposed on our businesses. Our profitability, results of operations, financial condition, cash flows or future business prospects could be materially and adversely affected as a result.
If we fail to comply with federal and state consumer protection laws, rules, regulations and guidance, our business could be adversely affected.
The CFPB, an agency which oversees compliance with and enforces federal consumer financial protection laws, has supervisory authority over certainthe offer, sale or provision of the studentour consumer financial products and mortgage lending activity in which we engage. To the extent such lending activity is conducted by SoFi Bank,services. Prior to January 1, 2024, the OCC examinesexamined SoFi Bank for compliance with CFPB rules and enforcesenforced CFPB rules with respect to SoFi Bank. ToIn addition, to the extent suchcertain of our lending or loan servicing activity iswas conducted outside of SoFi Bank, the CFPB hashad the authority to pursue enforcement actions against companies that offer or provideus as a company offering those certain consumer financial products or services, including, among other things, lendersservices. Beginning January 1, 2024, SoFi Bank and loan servicers that engage in unfair, deceptive or abusive acts or practices (“UDAAP”). Once SoFi Bank’s assets exceed $10 billion in value for four consecutive quarters, which we expectits affiliates became subject to occur in the first quarter of 2024,supervision and regulation by the CFPB will have supervisory authority over SoFi Bank. Thewith respect to federal consumer protection laws, including laws relating to fair lending and the prohibition of UDAAP in connection with the offer, sale or provision of consumer financial products and services. As part of its regulatory oversight, the CFPB may also seek a range of other remedies, including rescission of contracts, refund of money, return of real property, restitution, disgorgement of profits or other compensation for unjust enrichment, damages, public notification of the violation and “conduct” restrictions (i.e., future limits on the target’s activities or functions). Under the current Administrationadministration and leadership of the agency, the CFPB has pursued a more aggressive enforcement policy with respect to a range of regulatory compliance matters. For example, on January 6, 2022, the CFPB announced a new initiative to scrutinize so-called consumer “junk fees.” Since then, the CFPB has taken action to constrain “pay-to-pay” fees and has announced a rulemaking proceeding on credit card late fees. On October 26, 2022, the CFPB issued guidance to banks on how to avoid charging unlawful overdraft and depositor fees. On February 1, 2023, the CFPB proposed a rule to curb credit card late fees, including proposing aan $8 immunity provision to any missed payment. On March 16, 2023, the CFPB issued a bulletin on unfair billing and collection practices after bankruptcy discharges of certain student loan debt, in violation of the Consumer Financial Protection Act, to notify regulated entities how the CFPB intends to exercise its enforcement and supervisory authorities on this issue. On July 13, 2023, the CFPB sued Prehired for illegal student lending practices, including misrepresenting the nature of its loans, tricking consumers in its debt collection practices, and suing students in faraway jurisdictions. On February 29, 2024, the CFPB released a Consumer Financial Protection Circular, warning digital comparison-shopping tool operators and lead generators that marketing practices that take unreasonable advantage of a consumer’s reasonable reliance on the operator or lead generator to act in the consumer’s interests may violate the CFPA’s prohibition on abusive acts or practices. In addition, where a company has violated Title X of the Dodd Frank Act, the Dodd-Frank Act empowers state attorneys general and state regulators to bring certain civil actions. Increased enforcement or rules from the CFPB could increase our legal and financial compliance costs, make some activities more difficult, time-consuming and costly, and increase demand on our systems and resources.
We hold lending licenses or similar authorizations in multiple states, each of which has the authority to supervise and examine our activities. As a licensed consumer lender, mortgage lender, loan broker, collection agency, MSB and loan servicer in certain states, we are subject to examinations by state agencies in those states. Similarly, we are subject to licensure requirements and regulations as an education loan servicer in multiple states. An administrative proceeding, litigation, investigation or regulatory proceeding relating to allegations or findings of the violation of such laws by us, any sub-servicer we engage, or our collection agents, could impair our ability to service and collect on our loans or could result in requirements that we pay damages, fines or penalties and/or cancel the balance or other amounts owing under one or more of our loans. There is no assurance that allegations of violations of the provisions of applicable federal or state consumer protection laws will not be asserted against us, any sub-servicers or collection agents we engage or other prior owners of our loans in the future. To the extent it is determined that any of our loans were not originated in accordance with all applicable laws, we may be obligated to repurchase such loan from a whole loan buyer, securitization trust or warehouse facility.
We must comply with federal, state and local consumer protection laws including, among others, the federal and state UDAAP laws, the Federal Trade Commission Act, the Truth in Lending Act, the Community Reinvestment Act (“CRA”),CRA, the Real Estate Settlement Procedures Act, the Equal Credit Opportunity Act (“ECOA”),ECOA, the Fair Housing Act (“FHA”),FHA, the Home Mortgage Disclosure Act,HMDA, the Secure and Fair Enforcement for Mortgage Licensing Act, the Fair Credit Reporting Act
(“FCRA”),FCRA, the Fair Debt Collection Practices Act, the Servicemembers Civil Relief Act, the Military Lending Act, the Electronic Fund Transfer Act, the Gramm-Leach-Bliley Act (“GLBA”),GLBA, the CARES Act and the Dodd-Frank Act. We must also comply with laws on advertising, as well as privacy laws, including the Telephone Consumer Protection Act (“TCPA”),TCPA, the Telemarketing Sales Rule, the CAN-SPAM Act, the Personal Information Protection and Electronic Documents Act, applicable laws and regulations of Hong Kong including the Personal Data (Privacy) Ordinance and the Personal Data (Privacy) (Amendment) Ordinance 2012 and the California Consumer Privacy Act (the “CCPA”).CCPA and other state privacy laws. Privacy and data security concerns, data collection and transfer restrictions, contractual obligations and U.S. laws and regulations related to data privacy, security and protection could materially and adversely affect our business, financial condition and results of operations. Compliance with applicable laws is costly, and our failure to comply with applicable federal, state and local laws could lead to:
•loss of our licenses and approvals to engage in our lending and servicing businesses;
•damage to our reputation in the industry;
•governmental investigations and enforcement actions;
•administrative fines and penalties and litigation;
•civil and criminal liability, including class action lawsuits;
•inability to enforce loan agreements;
•diminished ability to sell loans that we originate or purchase, requirements to sell such loans at a discount compared to other loans or repurchase or address indemnification claims from purchasers of such loans;
•loss or restriction of warehouse facilities to fund loans;
•inability to raise capital; and
•inability to execute on our business strategy, including our growth plans.
The CRA, to which SoFi Bank is subject, presents a useful example of how a failure to comply with applicable laws could hamper our growth. On January 1, 2023, SoFi Bank began operating under a five-year CRA strategic plan which includes measurable goals relating to: (i) Community Development (“CD”)CD Lending and CD Investments, (ii) CD Contributions, (iii) CD Services, (iv) Small Business Lending, and (v) Retail Services and Products. On October 23, 2023, the Federal Reserve, OCC and FDIC approved changes to their CRA regulations, maintaining the existing CRA ratings (Outstanding, Satisfactory, Needs to Improve, and Substantial Noncompliance) but modifying the evaluation framework to replace the existing tests generally applicable to banks with at least $2 billion in assets (the lending, investment, and services tests) with four new tests and associated performance metrics. The new CRA regulations, which become effective on January 1, 2026, increase the geographic areas in which banks will be evaluated for CRA performance and may be particularly burdensome on banks focused on mobile and digital banking such as SoFi Bank. The OCC’s assessment of our compliance with the CRA is taken into account when evaluating any application we submit for, among other things, a merger or the acquisition of another financial institution. Our failure to satisfy our CRA obligations could, at a minimum, result in the denial of such applications and limit our growth.
In the first quarter of 2019, we were subject to a consent order from the Federal Trade CommissionFTC (the “FTC Consent Order”), which resolved allegations that we misrepresented how much money student loan borrowers have saved or would save from financing their loans with us, in violation of the Federal Trade Commission Act. Under the consent order,FTC Consent Order, we are prohibited from misrepresenting to consumers how much money they would save by using our products, unless the claims are backed up by reliable evidence.
While we have developed and monitor policies and procedures designed to assist in compliance with laws and regulations, no assurance can be given that our compliance policies and procedures will be effective and that we will not be subject to fines and penalties, including with respect to any alleged noncompliance with the FTC Consent Order. Ambiguities in applicable statutes and regulations may leave uncertainty with respect to permitted or restricted conduct and may make compliance with laws, and risk assessment decisions with respect to compliance with laws, difficult and uncertain. In addition, ambiguities make it difficult, in certain circumstances, to determine if, and how compliance violations may be cured. We have in the past and may in the future fail to comply with applicable statutes and regulations even if acting in good faith, or because governmental bodies or courts interpret existing laws or regulations in a more restrictive manner, which have in the past and may in the future lead to regulatory investigations, governmental enforcement actions or private causes of action with respect to our compliance. To resolve issues raised in examinations or other governmental actions, we may be required to take various corrective actions, including changing certain business practices, making refunds or taking other actions that could be financially or competitively detrimental to us. In some cases, regardless of fault, it may be less time-consuming or costly to settle these matters, which may require us to implement certain changes to our business practices, provide remediation to
certain individuals or make a settlement payment to a given party or regulatory body. There is no assurance that any future settlements will not have a material adverse effect on our business.
We hold state licenses that result in substantial compliance costs, and our business would be adversely affected if our licenses are impaired as a result of noncompliance with those requirements.
We currently hold state licenses in connection with our lending activities, our student loan servicing activities, our securities business, as well as ourand prior MSB activities. Although we have transitioned our lending products to SoFi Bank, for as long as SoFi Lending Corp. originates, brokers, purchases or master services or services loans, we must comply with certain state licensing requirements and varying compliance requirements in all the states in whichrequirements. In addition. although we operate and the District of Columbia.have transferred our digital assets business, we still hold MSB licenses while we determine whether to maintain or relinquish those licenses. Changes in licensing laws may result in increased disclosure requirements, increased fees, or may impose other conditions to licensing that we or our personnel are unable to meet. In most states in which we operate, a regulatory agency or agencies regulate and enforce laws relating to loan servicers, brokers, and originators, collection agencies, and MSBs. We are subject to periodic examinations by state and other regulators in the jurisdictions in which we conduct business, which can result in increases in our administrative costs and refunds to borrowers of certain fees earned by us, and we may be required to pay substantial penalties imposed by those regulators due to compliance errors, or we may lose our license or our ability to do business in the jurisdiction otherwise may be impaired. Fines and penalties incurred in one jurisdiction may cause investigations or other actions by regulators in other jurisdictions.
We may not be able to maintain all currently required licenses and permits. If we change or expand our business activities, we may be required to obtain additional licenses before we can engage in those activities. If we apply for a new license, a regulator may determine that we were required to do so at an earlier point in time, and as a result, may impose penalties or refuse to issue the license, which could require us to modify or limit our activities in the relevant state. For example, we have been fined in the past by state regulators for engaging in financial services related activities prior to obtaining a license. Based on changes to our businesses, we may also forfeit certain of our licenses that are no longer required, such as our MSB licenses following the transfer of our digital assets business. Regulators may impose conditions, requirements or penalties in connection with the forfeiture of any of our licenses.
States may also expand or otherwise modify their current regulations and if such states so act, we may not be able to comply with such updated regulations or maintain all requisite licenses and permits in such states or our costs of compliance with and maintenance of such licenses or permits may materially increase. For example, California, Colorado and Maine have implemented additional regulations related to student loan servicers which impose additional registration, reporting and disclosure requirements and which, if applicable to us, may increase our costs of originating and servicing loans in those states.
In addition, the states that currently do not provide extensive regulation of our business may later choose to do so, and if such states so act, we may not be able to obtain or maintain all requisite licenses and permits, which could require us to modify or limit our activities in the relevant state or states. The failure to satisfy those and other regulatory requirements could result in a default under our warehouse facilities, other financial arrangements and/or servicing agreements and thereby have a material adverse effect on our business, financial condition and results of operations.
Our compliance and risk management policies and procedures as a bank, bank holding company and otherwise regulated financial services company may not be fully effective in identifying or mitigating compliance and risk exposure in all market environments or against all types of risk.
As a bank, a bank holding company and a financial services company operating in the banking and securities industry, among others, our business exposes us to a number of heightened risks. We have devoted significant resources to developing our compliance and risk management policies and procedures and will continue to do so, but there can be no assurance these are sufficient, especially as our business is rapidly growing and evolving. Nonetheless, our limited operating history in many of the products we offer, our evolving business and our rapid growth make it difficult to predict all of the risks and challenges we may encounter and may increase the risk that our policies and procedures that serve to identify, monitor and manage compliance risks may not be fully effective in mitigating our exposure in all market environments or against all types of risk. Further, some controls are manual and are subject to inherent limitations and errors in oversight. This could cause our compliance and other risk management strategies to be ineffective. Other compliance and risk management methods depend upon the evaluation of information regarding markets, customers, catastrophic occurrences or other matters that are publicly available or otherwise accessible to us, which may not always be accurate, complete, up-to-date or properly evaluated. Insurance and other traditional risk-shifting tools may be held by or available to us in order to manage certain exposures, but they are subject to terms such as deductibles, coinsurance, limits and policy exclusions, as well as risk of counterparty denial of coverage, default or insolvency. Any failure to maintain effective compliance and other risk management strategies could have an adverse effect on our business, financial condition and results of operations.
We are also exposed to heightened regulatory risk because our business is subject to extensive regulation and oversight in a variety of areas, and such regulations are subject to evolving interpretations and application and it can be difficult to predict how they may be applied to our business, particularly as we introduce new products and services and expand into new jurisdictions. Additionally, the regulatory landscape involving digital assets is constantly evolving andevolving. Although we have exited our digital assets business, the Company, including SoFi Digital Assets, LLC, may still be subject to loss of revenue, fines, penalties or loss of regulatory licenses if the Federal
Reserve, the SEC or any other regulators issue new regulations or interpretive guidancescrutiny related to digital assets that prohibit any of our currentprior business practices. The risk of transacting in digital assets is substantially heightened in the current environment due to increased federal and state regulatory and enforcement scrutiny after the collapse of various digital asset businesses.
Also, due to market volatility, it is difficult to predict how much capital we will need in the future to meet net capital requirements. Any perceived or actual breach of laws and regulations could negatively impact our business, financial condition or results of operations. It is possible that these laws and regulations could be interpreted or applied in a manner that would prohibit, alter or impair our existing or planned products and services.
Regulatory scrutiny of banking as a service, or BaaS, solutions has recently increased and may require us to devote significant resources to enhancing our Technology Platform policies, procedures, operations, controls and products, and the failure to satisfy such increased scrutiny may cause regulators to take action against us or our BaaS partners, or result in a loss of one or more of our BaaS partners.
Our Technology Platform facilitates the provision of BaaS products and services to third parties through various card, deposit, payment, transfer, credit and lending solutions that allow financial technology companies or other third parties to, among other things, connect to sponsor banks’ systems directly via application programming interfaces and cloud infrastructure so they can build banking offerings on top of the sponsor banks’ regulated infrastructure. In addition, our Technology Platform offers an end-to-end core banking platform solution with integrated payment processing. Furthermore, in connection with our Technology Platform's BaaS solutions, we sometimes offer certain program management, data, analytics, compliance and risk management functions. The third parties that use these BaaS solutions include a variety of financial entities, including banks, fintech companies and other financial intermediaries. SoFi Bank is one of the sponsor banks that utilizes our BaaS products and services and may continue to do so in the future.
Federal bank regulators have increasingly focused on the risks related to BaaS solutions, including risk management, oversight, internal controls, information security, change management and information technology operational resilience, as well as potential systemic risk posed by BaaS solutions to the larger banking industry. Recently, regulators have even brought enforcement actions against financial entities that have allegedly not adequately addressed these concerns while growing their BaaS offerings. Regulators have specifically required these financial entities to enhance oversight of third-party fintech partnerships, improve control frameworks related to anti-money laundering and Bank Secrecy Act compliance, and adopt, implement and adhere to revised and expanded risk-based policies, procedures and processes. If we or any of the fintech clients or sponsor bank partners supported by our Technology Platform were to face regulatory actions that limit the growth of our or their fintech business, or if we were forced to stop growing our Technology Platform, or if any of our fintech clients or sponsor banks were to limit or cease their participation in BaaS solutions, this could have a negative impact on our revenue and results of operation for the Technology Platform segment.
Furthermore, regulatory scrutiny of BaaS solutions extends directly to middleware providers, such as our Technology Platform, which, in certain circumstances, bear accountability for their partners’ compliance and risk management, including with respect to penalties, fines, and other measures that bank regulatory agencies take in the event of non-compliant activity or risks that are not well controlled. This is particularly true when the BaaS solution includes program management, and compliance and risk management controls, including managing anti-money laundering and fraud risks. In addition, as our fintech and sponsor bank partners face increased regulatory scrutiny, their scrutiny of our services will likely increase and our inability to satisfactorily respond to partner demands could result in those partners moving to different solutions. Assessing and managing risk for our Technology Platform clients in the face of regulatory and client scrutiny has in the past and will continue to require us to devote significant resources to enhancing relevant policies, procedures, operations and products. Finally, as a subsidiary of a bank holding company, any failure of our Technology Platform's BaaS solutions to withstand regulatory scrutiny could reflect badly on our relationship with our regulators and on our overall reputation.
While we believe we are a leader in managing, monitoring and overseeing BaaS relationships with third parties and corresponding technologies, if we are not successful in continuing to enhance our controls for assessing and managing the third-party, anti-money laundering, fraud and information technology risks stemming from certain of our fintech and sponsor bank partnerships, we could be subject to additional regulatory scrutiny with respect to that portion of our business which could subject us to regulatory fines or other penalties, or business or reputational harm, and could adversely affect our financial condition and results of operations.
We may become subject to enforcement actions or litigation as a result of our failure to comply with laws and regulations, even though noncompliance was inadvertent or unintentional.
We maintain systems and procedures designed to ensure that we comply with applicable laws and regulations; however, some legal/regulatory frameworks provide for the imposition of fines or penalties for noncompliance even though the noncompliance was inadvertent or unintentional and even though there were systems and procedures designed to ensure compliance in place at the time.
For example, we engage in outbound telephone and text communications with consumers, and accordingly must comply with a number of federal and state statutes and regulations that regulate certain such communications, including the TCPA and Telemarketing Sales Rules. The U.S. Federal Communications Commission (the “FCC”), and the FTC have responsibility for regulating various aspects of some of these federal laws. Among other requirements, the TCPA requires us to obtain prior express written consent for certain telemarketing calls and to adhere to “do-not-call” registry requirements which, in part, mandate we maintain and regularly update lists of consumers who have chosen not to be called and restrict calls to consumers who are on the national do-not-call list. Further, in late 2023 and early 2024, the FCC introduced various new TCPA restrictions relating to, among other things, lead generation, prior express written consent to marketing calls made with certain telephony technology and processing opt-outs and do not call requests that will come into effect later this year or in January 2025. In addition to federal laws, Florida and several other states also have mini-TCPA and other similar consumer protection laws regulating certain telemarketing directed to their residents. TheseCollectively, these federal and state laws limit our ability to communicate with consumers and reduce the effectiveness of our marketing programs. As currently construed, the TCPA does not distinguish between voice and data, and, as such, SMS/MMS messages are also “calls” for the purpose of TCPA obligations and restrictions.
For violations of the TCPA, the law provides for a private right of action under which a plaintiff may recover monetary statutory damages of $500 for each call or text made in violation of the statute. A court may treble the $500 amount upon a finding of a willful or knowing violation. There is no statutory cap on maximum aggregate exposure for TCPA violations (although some courts have applied in TCPA class actions constitutional limits on excessive penalties). Like the TCPA, several mini-TCPA and other similar state laws also provide for a private right of action under which a plaintiff may recover statutory damages of $500 or more for each violative call or text and enhanced statutory if the violation is knowing or willful. An action may be brought by the FCC, a state attorney general, an individual, or a class of individuals. Like other companies that rely on telephone and text communications, we may be subject to putative class action suits alleging violations of the TCPA, and state mini-TCPA and other similar state laws. If in the future we are found to have violated any federal or state law regulating telemarketing, the amount of damages and potential liability could be extensive and adversely impact our business.
In addition, we use credit reports in our credit decisioning processes and, accordingly, must comply with FCRA which requires a permissible purpose to obtain a consumer credit report and requires persons that furnish loan payment information to credit bureaus to report such information accurately. We are also required to perform a reasonable investigation in the event we receive indirect disputes from the credit bureaus about the accuracy of our credit reporting for a particular consumer and to update any inaccurate information we discover. Although we have policies and procedures in place to comply with FCRA, we are subject to lawsuits alleging that we failed under FCRA to adequately investigate indirect disputes over credit reporting which we receive from one or more credit bureaus. We have experienced an increase in such FCRA claims since our business has grown and even if we are ultimately successful in defending against such suits, they could involve substantial time and expense to analyze and respond to, could divert management’s attention and other resources from running our business, and could lead to settlements, judgments, fines, penalties or injunctive relief.
Changes in applicable laws and regulations, as well as changes in government enforcement policies and priorities, may negatively impact the management of our business, results of operations, ability to offer certain products or the terms and conditions upon which they are offered, and ability to compete.
Financial services regulation is constantly changing, and new laws or regulations, or new interpretations of existing laws or regulations, could have a materially adverse impact on our ability to operate as currently intended, and cause us to incur significant expense in order to ensure compliance. Federal and state financial services regulators are also enforcing existing laws, regulations, and rules aggressively and enhancing their supervisory expectations regarding the management of legal and regulatory compliance risks. These regulatory changes and uncertainties make our business planning more difficult and could
result in changes to our business model and potentially adversely impact our results of operations. Furthermore, to the extent applicable, these laws can impose specific statutory liabilities upon creditors who fail to comply with their provisions and may affect the enforceability of a loan.
Proposals to change the statutes affecting financial services companies are frequently introduced in Congress and state legislatures that, if enacted, may affect their operating environment in substantial and unpredictable ways. In addition,
numerous federal and state regulators and self-regulatory organizationsSROs have the authority to promulgate or change regulations that could have a similar effect on our operating environment. We cannot determine with any degree of certainty whether any such legislative or regulatory proposals will be enacted and, if enacted, the ultimate impact that any such potential legislation or implementing regulations, or any such potential regulatory actions by federal or state regulators, would have upon our business.
New laws, regulations, policy or changes in enforcement of existing laws or regulations applicable to our business, or reexamination of current practices, could adversely impact our profitability, limit our ability to continue existing or pursue new business activities, require us to change certain of our business practices, affect retention of key personnel, or expose us to additional costs (including increased compliance costs and/or customer remediation). These changes also may require us to invest significant resources, and devote significant management attention, to make any necessary changes and could adversely affect our business. For example, the SEC proposed Regulation Best Execution, along with other proposals related to equity market structure, in December 2022. If adopted as proposed, Regulation Best Execution and other recent proposals would substantially alter existing order routing, execution incentives and business practices. The SEC also finalized rules in February 2023 to shorten the standard settlement cycle for most broker-dealer transactions in securities from two business days after the trade (T+2) to one (T+1). While theThe SEC compliance date for T+1 is not untilin May 2024 and this change has and will continue to require technological, operational, and compliance adjustments across the industry that are and will likely continue to be time consuming and costly for all market participants. In March 2023, the SEC proposed multiple rules related to privacy and cybersecurity. Proposed amendments to Regulation S-P would, among other things: (i) require covered institutions (including broker-dealers and investment advisers) to adopt written policies and procedures for an incident response program to address unauthorized access to or use of customer information; and (ii) require covered institutions to have written policies and procedures to provide timely notification to affected individuals whose sensitive customer information was or is reasonably likely to have been accessed or used without authorization. The SEC also proposed amendments to existing Regulation SID andreopened the comment period for the Investment Management Cybersecurity Release which proposed new cybersecurity risk management rules parts of whichthat would require broker-dealers,registered investment advisers and other securities industry participantsinvestment companies to adopt specificand implement written cybersecurity policies and procedures reasonably designed to address certaincybersecurity risks, disclose information about cybersecurity risks and notifyincidents, report information confidentially to the SEC about certain customers when cybercybersecurity incidents, occur.and maintain related records. In July 2023, the SEC proposed new rules and amendments to address certain conflicts of interest associated with the use of predictive data analytics by broker-dealers and investment advisers (“firms”) in investor interactions. If adopted, thesethe proposed rules and amendments would require usbroker-dealers and investment advisers to neutralize the effect of conflicts of interest associated with theevaluate and determine whether their use of specificcertain technologies likein investor interactions such as analytical, technological or computational functions, algorithms, models, correlation matrices or similar methods or processes that direct or optimize for investment related behavior.behavior, involves a conflict of interest that results in the broker-dealer or investment adviser’s interests being placed ahead of investors’ interests. Depending on the outcome of any final rule, our ability to use these technologies to generate business activity and revenue may be limited. See also “Recent statements by lawmakers, regulators and other public officials have signaled an increased focus on new or additional laws or regulations that could impact our broker-dealer business and require us to make significant changes to our business model and practices, and could result in significant costs to our business or loss of current revenue streams”. Additionally, in April 2023, the SEC re-proposed amendments to Regulation ATS and Exchange Act Rule 3b-16, including to essentially amend what it means to be an “exchange,” and in doing so made clear that the proposal applied to all crypto assets that are securities. Pending final adoption of the proposed rule, it is possible that we would need to obtain additional regulatory permission to conduct our business. The time and cost of obtaining such permission could be significant, and is not guaranteed. Further, we may need to pause or alter certain aspects of our business until such permission is obtained. Compliance with each of these rules, when and if required, would impose additional costs on our business. To the extent such proposals affect the equity market structure more broadly, our ability to generate revenue may be impaired. There is also the risk that, despite our best efforts, the SEC does not view our compliance measures as sufficient. This risk is substantially elevated where regulators adopt a substantial number of new rules in a short time frame. On October 13, 2023, the SEC adopted rules relating to providing additional disclosures in the securities lending market. These rules require any covered person that loans a reportable security on behalf of itself or another person to report certain material terms of those loans and related information to FINRA by the end of the day on which the loan is effected. FINRA in turn will make certain information it receives publicly available by the next business day. These regulations could make securities lending more costly, leading to less overall lending activity and a decrease in revenue. On February 22, 2024, the SEC adopted amendments to Rule 605 under Exchange Act that requires disclosures for order executions in national market system (“NMS”) stocks. The amendments modify the type of information required to be disclosed under Rule 605 and expand the scope of reporting entities subject to Rule 605 to include broker-dealers who introduce or carry 100,000 or more customer accounts. Complying with Rule 605 is a new requirement for us. In addition, the Rule itself has been modified to include new definitions, new and modified categories of order types, and new statistical measures of execution quality and other metrics. See also “Lawmakers, regulators and other public officials have signaled an increased focus on new or additional laws or regulations that could impact our broker-dealer business and require us to make significant changes to our business model and practices, and could result in significant costs to our business or loss of current revenue streams”. Compliance with each of these rules, when and if required, would impose additional costs on our business. To the extent such proposals affect the equity market structure more broadly, our ability to generate revenue may be impaired. There is also the risk that, despite our best efforts, the SEC does not view our compliance measures as sufficient. This risk is substantially elevated where regulators adopt a substantial number of new rules in a short time frame. In addition, non-compliance with any adopted requirements would likely result in enforcement action by the SEC or FINRA.
Extensive regulation and supervision have a negative impact on our ability to compete in a cost-effective manner and may subject us to material compliance costs and penalties.
The Company, primarily through its subsidiary SoFi Bank and certain non-bank subsidiaries, is subject to extensive federal and state regulation and supervision. Banking regulations are primarily intended to protect depositors’ funds, federal
deposit insurance funds and the banking system as a whole. Many laws and regulations affect our lending practices, capital structure, investment practices, dividend policy and growth, among other things. They encourage us to ensure a satisfactory level of lending in defined areas and establish and maintain comprehensive programs relating to anti-money laundering and
customer identification. Congress, state legislatures, and federal and state regulatory agencies continually review banking laws, regulations and policies for possible changes. Changes to statutes, regulations or regulatory policies, including changes in interpretation or implementation of statutes, regulations or policies, could affect us in substantial and unpredictable ways. Such changes could subject us to additional costs, limit the types of financial services and products it may offer and/or increase the ability of non-banks to offer competing financial services and products, among other things. Failure to comply with laws, regulations or policies could result in sanctions by regulatory agencies, civil money penalties and/or reputation damage, which could have a material adverse effect on our business, financial condition and results of operations.
We are subject to the risk that regulatory or enforcement agencies and/or consumer advocacy groups may assert that our business practices may violate certain rules, laws and regulations, including anti-discrimination statutes.
Anti-discrimination statutes, such as the FHA and the ECOA and state law equivalents, prohibit creditors from discriminating against loan applicants and borrowers based on certain characteristics, such as race, religion and national origin. Various federal regulatory and enforcement departments and agencies, including the Department of Justice and CFPB, take the position that these laws apply not only to intentional discrimination, but also to facially neutral practices that have a disparate impact on a group that shares a characteristic that a creditor may not consider in making credit decisions. State and federal regulators, as well as consumer advocacy groups and plaintiffs’ attorneys, are focusing greater attention on “disparate impact” claims. Similarly, these regulatory agencies and litigants could take the position that the geographical footprint within which we conduct lending activity or the manner in which we advertise loans, disproportionately excludes potential borrowers belonging to a protected class, and constitutes unlawful “redlining”. Although we utilize an automated underwriting process to originate loans, we frequently adjust pricing strategies which increases our risk of inadvertently violating the FHA and the ECOA. These regulatory agencies could also take the position that the underwriting or credit models or algorithms we use produce disparate outcomes or do not produce sufficient information about a credit decision to satisfy applicant notification requirements under ECOA. In addition to reputational harm, violations of the FHA and the ECOA can result in actual damages, punitive damages, injunctive or equitable relief, attorneys’ fees and civil money penalties.
Our investment manageradviser and broker-dealer subsidiaries are subject to regulation by the SEC and FINRA.
We offer investment management services through SoFi Wealth, LLC (“SoFi Wealth”), an internet based investment adviser, and SoFi Capital Advisors, LLC (“SoFi Capital Advisors”), which sponsors private investment funds that invest in asset-backed securitizations. Both SoFi Wealth and SoFi Capital Advisors (collectively, the “Investment Advisers”) are registered as investment advisers under the Investment Advisers Act of 1940, as amended (the “Advisers Act”), which does not imply any level of skill or training, and are subject to regulation by the SEC. SoFi Securities LLC (“SoFi Securities”) is an affiliated SEC-registered broker-dealer and FINRA member. We offer cash management accounts, which are brokerage products, through SoFi Securities.
The Investment Advisers operate in a highly regulated environment and are subject to, among other things, the anti-fraud provisions of the Advisers Act and to fiduciary duties derived from these provisions, which apply to their relationships with our members who are their advisory clients, as well as the funds managed by the Investment Advisers. These provisions and duties also impose certain restrictions and obligations on us with respect to our dealings with our members, fund investors and our investments, including for example restrictions on transactions with our affiliates. Our Investment Advisers are also subject to other requirements under the Advisers Act and related regulations. These additional requirements relate to matters including, among others, maintaining effective and comprehensive compliance programs, record-keeping and reporting and disclosure requirements. Further, in 2022 and 2023,In recent years, the SEC proposed numerousand, in some cases, adopted amendments to the Advisers Act rules, which are likely to present a number of additional significant and burdensome compliance challenges for registered investment advisers. In addition, our Investment Advisers have been in the past, and will be in the future, subject to SEC examination. Moreover, the Advisers Act generally grants the SEC broad administrative powers, including the power to limit or restrict an investment adviser from conducting advisory activities in the event it fails to comply with federal securities laws. The investment advisers are also subject to applicable state securities laws. Additional sanctions that may be imposed for failure to comply with applicable requirements include the prohibition of individuals from associating with an investment adviser, the revocation of registrations and other censures and fines. Even if an investigation or proceeding did not result in a sanction or the sanction imposed against us or our personnel by a regulator was small in monetary amount, the adverse publicity relating to the investigation, proceeding or imposition of these sanctions could harm our reputation and cause us to lose existing members or fail to gain new members. See Part II, Item 1. “Legal Proceedings”.
Our subsidiary, SoFi Securities, is an affiliated SEC-registered broker-dealer and FINRA member. The securities industry is highly regulated, including under federal, state and other applicable laws, rules and regulations, and we may be adversely affected by regulatory changes related to suitability of financial products, supervision, sales practices, advertising, application of fiduciary standards, best execution and market structure, any of which could limit our business and damage our reputation. FINRA has adopted extensive regulatory requirements relating to sales practices, advertising, registration of
personnel, compliance and supervision, and compensation and disclosure, to which SoFi Securities and its personnel are
subject. FINRA and the SEC also have the authority to conduct periodic examinations of SoFi Securities, and may also conduct administrative proceedings. Additionally, material expansions of the business in which SoFi Securities engages are subject to approval by FINRA. This could delay, or even prevent, the firm’s ability to expand its securities and brokerage offerings in the future.
From time to time, SoFi Securities and the Investment Advisers may be threatened with or named as a defendant in lawsuits, arbitrations and administrative claims. As previously noted, these entities are also subject to regulatory examinations and inspections by regulators (including the SEC and FINRA, as applicable). Compliance and trading problems or other deficiencies or weaknesses that are reported to regulators, such as the SEC and FINRA, by dissatisfied members or others, or that are identified by regulators themselves are investigated by such regulators, and may, if pursued, result in formal claims being filed against SoFi Securities and the Investment Advisers by members or disciplinary action being taken by regulators against us or our personnel. Our failure to comply with applicable laws or regulations or our own policies and procedures could result in fines, litigation, suspensions of personnel or other sanctions, which could have a material effect on our overall financial results. For example, in August 2021, we settled charges with the SEC againstDecember 2023, FINRA found that SoFi Wealth for allegedly breachingSecurities failed to establish, maintain, and enforce a supervisory system reasonably designed to supervise its fiduciary duties to clients in connection with the investment of client assets in two ETFs sponsored by Social Finance by agreeing to: (i) a cease-and-desist order, a censure, a penalty of $300 thousand, and (ii) perform certain undertakings.fully paid securities lending offerings. Even if a sanction imposed against us or our personnel is small in monetary amount, the adverse publicity arising from the imposition of sanctions against us by regulators could harm our reputation and our brand and lead to material legal, regulatory and financial exposure (including fines and other penalties), cause us to lose existing members or fail to gain new members. In addition, in the normal course of business, SoFi Securities and the Investment Advisers discuss matters raised by its regulators during regulatory examinations or otherwise upon their inquiry. These matters could also result in censures, fines, penalties or other sanctions.
In addition to the broker-dealer proposals described above under “Changes in applicable laws and regulations, as well as changes in government enforcement policies and priorities, may negatively impact the management of our business, results of operations, ability to offer certain products or the terms and conditions upon which they are offered, and ability to compete”, a substantial number of proposed rules for investment advisers are pendingwere introduced in 2023 and 2024 and may be adopted this year. These proposals cover material regulatory topics, including: (i) environmental, social, and governance issues for investment advisers and registered investment companies; (ii) outsourcing by investment advisers; and (iii) safeguarding and custody of client assets.assets; and (iv) expansion of the scope of activities and relationships that make a person an investment advice fiduciary under Section 3(21) of the Employee Retirement Income Security Act of 1974 and Section 4975 of the Internal Revenue Code. If enacted, compliance with each of these proposed rules would impose additional costs on our business. There is also the risk that, despite our best efforts, the SEC does not view our compliance measures as sufficient. This risk is substantially elevated where regulators adopt a substantial number of new rules in a short time frame.
The regulatory regimeWe recently transferred our digital assets-related trading services to comply with regulations governing blockchain technologies and digital assets is uncertain, and new regulations or policies may alter our business practices with respect to digital assets orbank holding companies; this transfer could adversely impact our business.member relationships and our reputation.
We currently offerUntil recently, we offered virtual currency and digital asset-related trading services through SoFi Digital Assets, LLC, a subsidiary that is licensed and registered with various governmental authorities as a MSB, money transmitter, virtual currency business or the equivalent. With respect to our digital assets trading activities, we do not hold or store members’ digital assets, but instead rely on third-party custodians, and we hold an immaterial amount of digital assets in order to facilitate paying new member bonuses when members initiate their first digital assets trade. Although many regulators have provided some guidance, regulation of digital assets based on or incorporating blockchain, such as digital assets and digital asset exchanges, remains uncertain and will continue to evolve. For example, in February 2023, the SEC issued a new rule proposal related to the custody of client assets by SEC-registered investment advisers. If adopted as proposed, the proposal would expand the SEC’s existing custody rules for investment advisers to apply to a broad range of assets, including cryptocurrencies, and would require that all client assets be maintained by a “qualified custodian.” SEC Chairman Gensler also noted at the time of the proposal that “[b]ased upon how crypto platforms generally operate, investment advisers cannot rely on them as qualified custodians.” While we do not currently provide custodial services to any clients who invest in crypto assets, we are considering the potential impact of the SEC’s new custody proposal, if any, on our own custodial arrangements with third parties. Additionally, in April 2023, the SEC re-proposed amendments to Regulation ATS and Exchange Act Rule 3b-16, including to essentially amend what it means to be an “exchange,” and in doing so made clear that the proposal applied to all crypto assets that are securities. If adopted, our digital assets business could be subject to additional regulation, increased costs of compliance, and we could be forced to cease trading in certain types of assets or create new entities to support various lines of business. If adopted, this could also provide an additional avenue for the SEC to pursue enforcement action against us or others in this space.
Further, regulation varies significantly among international, federal, state and local jurisdictions. As digital assets have grown in popularity and in market size, federal and state agencies are increasingly taking an interest in, and in certain cases regulating, their use and operation. For example, SoFi Bank’s activities with respect to digital assets may be restricted. The conditional approval of the bank charter by the OCC was conditioned on SoFi Bank not engaging in any crypto-related
activities or services unless it has received a prior written determination of no supervisory objection from the OCC. In addition, in connection with our approval as a bank holding company in February 2022, the Federal Reserve determined that SoFi Digital Assets, LLC iswas engaged in certain crypto-relateddigital asset-related activities that the Federal Reserve has not found to be permissible for a bank holding company under the Bank Holding Company Act and Regulation Y. However, Section 4(a)(2) of the Bank Holding Company Act permitspermitted us to continue our current digital assets related offering for a two-year conformance period from the date we became a bank holding company,company. In compliance with the possibility for three one-year extensions, providedrequirement that we do not expand such activities, except as authorized by the Bank Holding Company Act and Regulation Y, or increase our established risk limits for total customer digital assets maintained in wallets that are accessible online, referred to as “hot wallets”, or held on our balance sheet. While we are engaging with the Federal Reserve to determine whether there is a path to conform our crypto-related activities to the requirements of the Bank Holding Company Act, there can be no assurance that such attempts will be successful or that we will receive any extensions from the Federal Reserve to continue our current crypto-related activities beyond the two-year conformance period from the date we becamethose permissible for a bank holding company, in December 2023, we ceased offering digital-asset related trading services in all states except New York. We provided a majority of our members with the option to either close their digital asset account or migrate their digital assets accounts to Blockchain.com. Members located in New York were not eligible for account migration, so those member accounts remained open for sell orders only until January 28, 2024, following which any open New York accounts were closed. All transaction fees from any sales from digital assets accounts were reimbursed. As part of our transfer of our digital asset-related activities we entered into a referral arrangement with Blockchain.com, and we have and may ultimately be forcedcontinue to wind-down such activities in a short period of time. A wind-down ofenter into additional referral arrangements with other companies that can provide digital-asset related trading services to our crypto-related activities could result inmembers. Although we do not expect the transfer of members’ positionsour digital asset-related activities or entry into the referral arrangements to alternative custodians who may have inferiora material adverse impact on our business, results of operation or more costly services.financial results, we cannot guarantee that our members will not experience a negative impact with respect to their digital asset positions. In addition, a wind-down could result in forced liquidationsthese are recent events and there is no guarantee we will not face member dissatisfaction or litigation, or harm to our reputation, or adverse regulatory consequences, from such developments.
Furthermore, if our prior digital asset-related trading services are the subject of our members’ positions during adverse market conditions, any of whichregulatory scrutiny or enforcement actions, it could have a material adverse effect on our business, results of operations and reputation.
The laws and regulations to which we are subject, including those pertaining to digital assets and crypto-related activities, are rapidly evolving and increasing in scope. There has been a significant amount of guidance, reports, and public statements issued by federal and state financial regulators regarding the legal
permissibility of, and supervisory considerations relating to, financial institutions engaging in crypto-relateddigital assets-related activities. We continue to monitor these developments closely and work with our federal regulators to ensure that our crypto-related activities conform with all applicable requirements.
Many U.S. regulators, including the SEC, FinCEN, the Financial Crimes Enforcement Network (“FinCEN”),CFTC, the Commodity Futures Trading Commission, (the “CFTC”), the Internal Revenue Service (the “IRS”),IRS, and state regulators including the New York State Department of Financial Services, (the “NYSDFS”), have made official pronouncements, pursued cases against businesses in the digital assets space or issued guidance or rules regarding the treatment of Bitcoin and other digital currencies. The IRS released guidance treating digital assets as property that is not currency for U.S. federal income tax purposes, although there is no indication yet whether other courts or federal or state regulators will follow this classification. Both federal and state agencies have instituted enforcement actions against those violating their interpretation of existing laws. Other U.S. and many state agencies have offered little or incomplete official guidance regarding the treatment of digital assets.
The For example, the CFTC has publicly taken the position that certain virtual currencies, which term includes digital assets, are commodities. For example, the CFTC took the position in a March 2023 action against Binance Holdings Limited and other defendants that Ether and other digital assets “are commodities”. The CFTC staff have also issued and are enforcing a new interpretation of “swap execution facility” that expands its definition to reach commodity trading advisors and introducing brokers. Senior SEC staff members have created additional ambiguity about certain digital assets, including Ether, by refusing to affirmatively state whether they are “commodities” subject to CFTC jurisdiction or “securities” subject to SEC jurisdiction. To the extent that Bitcoin or any other digital asset is deemed to fall within the definition of a “commodity interest” under the Commodity Exchange Act (the “CEA”) or if proposed legislation is passed which classifies Bitcoin and other digital assets as a commodity, we may be subject to additional regulation under the CEA and CFTC regulations.
The prices of digital assets have beenIn addition, in the past and may continue to be highly volatile, including as a result of various associated risks and uncertainties in future regulation of digital assets and blockchain technologies. Following recent unstable market conditions, certain digital asset lenders and platforms have frozen or limited withdrawals and other such lenders and platforms may, in the future, need to or be required to freeze or limit withdrawals or may become insolvent and cease operations entirely. Although changes in digital assets held by third-party custodians on behalf of our members have no impact on our earnings unless we were to experience a loss event, the effects of these actions or insolvencies may cause broader effects through the digital asset markets, such as potentially increasing price volatility or attracting further scrutiny. The prevalence of digital assets is a relatively recent trend, and we do not know, or may be unable to prepare for, other market-impacting events that could cause increased volatility or a prolonged periods of price depression.
Activities adjacent to the digital asset trading services that we provide can materially impact the value of digital assets and our business. In January 2023, the SEC took action against Nexo Capital, Inc. as well as Genesis Global Capital, LLC and Gemini Trust Company, LLC (collectively, “Gemini”) in connection with certain crypto lending products. The SEC also entered into a settlement agreement with cryptocurrency exchange Payward Ventures, Inc. and Payward Trading Ltd. (“Kraken”) in February 2023, for failing to register its “staking-as-a-service” program as a securities offering in violation of Section 5 of the Securities Act. Nexo and Kraken each agreed to substantial fines.
Recently, the SEC has brought high profile enforcement actions against companies that intermediate transactions in digital assets. In March 2023, the Staff of the SEC advised Coinbase Global, Inc. through a “Wells Notice” that it had made a “preliminary determination” to recommend that the SEC file an enforcement action against Coinbase Global, Inc. and Coinbase, Inc. (collectively, “Coinbase”) alleging violations of the federal securities laws, including the Exchange Act and the Securities Act, relating to aspects of Coinbase’s spot market, staking service Coinbase Earn, Coinbase Prime and Coinbase Wallet. InFor example, in June 2023, the SEC filed lawsuits against cryptocurrency exchanges Coinbase and Binance Holdings Limited and its affiliate BAM Trading Services Inc. (collectively, “Binance”). The SEC alleges, alleging, among other allegations, that Coinbase operated its crypto trading platform as an unregistered national securities exchange, broker and clearing agency and for its failure to register the offer and sale of its crypto asset staking-as-a-service program. The SEC alleges that Binance werewas operating unregistered national exchanges, broker-dealers and clearing agencies and the unregistered offer and sale of crypto assets. While we currently do not offer crypto lending or crypto staking services, any substantial action, settlement, or related investigation by regulators can lead to adverse impressions of the crypto industry generally or significantly affect the actual or perceived value of cryptocurrencies that we currently support on our platform.
Foreign, federal, state and local regulators revisit and update their laws and policies, and can be expected to continue to do so in the future. We expect additional laws, guidance and policies to be issued by regulators. While the financial and regulatory fallout from FTX’s collapse did not directly impact our business, financial condition or member assets, the FTX collapse and the collapse of other crypto asset market participants has caused increased focus on the cryptocurrency industry and U.S. and foreign regulators are highly likely to adopt new regulatory requirements in response to the collapse. Changes in this regulatory environment, including changing interpretations and the implementation of new or varying regulatory requirements by the government or any new legislation, may impose significant costs or restrictions on our ability to conduct business, significantly affect or change the manner in which we currently conduct some aspects of our business or impact our business in unforeseeable ways. Regulatory guidance around issues like the security status of digital assets has been unclear, and regulatory action in this area could further add to this uncertainty. On July 21, 2022,In November, 2023, the SEC announced insiderfiled a lawsuit against Kraken alleging that Kraken’s crypto trading chargesplatform operated as an unregistered securities exchange, broker, dealer, and clearing agency. In March 2024, the CFTC filed a lawsuit against individuals transacting inKuCoin, alleging that KuCoin operated an illegal digital assets and, as part of the complaint,asset derivative exchange. If the SEC, alleged certain digital assets were securities. If the SECCFTC or another federal or state regulator alleges that any assets we offer areoffered were securities we could face potential regulatory action. If we need to limit the types of digital assets we offer or ifderivatives, or that we are unable to successfully comply with new regulations, our business or revenue may suffer.
We may also face regulatory action or penalties. The SEC and FINRA have increased the focus and pace of investigations and enforcement actions related to what the SEC calls crypto asset securities. For example, as noted above, the SEC Chair Gary Gensler indicated in an October 2022 speech that he believed the vast majority of crypto tokens are securities and that many crypto intermediaries are transacting in securities and have to register with the SEC. In a June 8, 2023 speech, Chairman Gensler stated “[g]iven that most crypto tokens are subject to the securities laws, it follows that most crypto intermediaries have to comply with securities laws as well.” In November 2022, FINRA conducted a targeted exam of broker-dealer practices regarding retail communications concerning crypto asset products and services. In December 2022, the SEC issued a sample comment letter regarding developments in the crypto asset markets. The SEC and state regulators have alleged in actions against other companies that certain digital assets are “securities,” some of which are or were tradeable on our platform. U.S. Courts have not yet confirmed the status of each such digital asset, but in a July 13, 2023 federal district court decision, a district court judge held that sales of cryptocurrency XRP both were and were not sales of securities, depending on the underlying facts and circumstances of how the various sales were conducted. Despite our best efforts to operate our digital asset business in a compliant manner, if in the future we are found to have violated any other federal or state securities laws or regulations, the amount of damages and potential liability could be extensive and adversely impact our business. The time and cost involved in defending ourselves against such charges would similarly be significant and draw resources away from other areas of our business.
As noted above, if a digital asset we offer is a security,commodities law or regulation, we could face potential liability, including an enforcement action or private class action lawsuits, and face the costs of defending ourselves in the action, including potential fines, penalties, reputation harm, and potential loss of revenue. Our personnel could also become disqualified from associating with a broker-dealer or we could be required to delist the digital asset, all of which could cause disruption to our members and adversely affect our business. See “We may become subject to enforcement actions or litigation as a result of our failure to comply with laws and regulations, even though noncompliance was inadvertent or unintentional”.
Even if we do not face regulatory action or penalties, we have in the past and may in the future face heightened scrutiny due to our cryptocurrency offerings. Although our cryptocurrency assets are held by third-party custodians, we believe recent bankruptcies and financial distress among crypto asset market participants has led and may continue to lead to greater scrutiny of our cryptocurrency related services and could result in reputational harm. For example, on November 21, 2022, we received a letter from Senators on the Committee on Banking, Housing, and Urban Affairs regarding the activities of our digital asset exchange, SoFi Digital Assets, LLC. The letter inquired about certain crypto-related activities and concluded with various
questions and requests to which we subsequently responded. While we believe our practices are consistent with applicable law and our commitment to our federal regulators, if we are not considered to be in compliance or we receive increased attention regarding SoFi Digital Assets, LLC, our reputation or business may be perceived differently by our members and our business may be harmed. In addition, in the future we may be subject to the risk of additional inquiries, legal proceedings and government investigations due to the public’s and regulators’ focus on the cryptocurrency industry.
States may require licenses and apply other requirements related to blockchain technologies and digital assets.
In the case of virtual currencies, state regulators such as the NYSDFS have created regulatory frameworks. For example, in July 2014, the NYSDFS proposed the first U.S. regulatory framework for licensing participants in virtual currency business activity. The regulations, known as the “BitLicense”, are intended to focus on consumer protection. The NYSDFS issued its final BitLicense regulatory framework in June 2015, and in January 2023 issued guidance on custody and disclosure practices requiring BitLicense holders to, among other things, hold virtual currency in a manner that protects customer assets and disclose the material terms and conditions associated with their products and services, including custody services. The BitLicense regulates the conduct of businesses that are involved in virtual currencies in New York or with New York customers and prohibits any person or entity involved in such activity from conducting such activities without a license. SoFi Digital Assets, LLC currently holds a BitLicense.
Other states may adopt similar statutes and regulations which will require us to obtain a license to conduct digital asset activities. In July 2020, Louisiana adopted the Virtual Currency Business Act, which requires operators of virtual currency businesses to obtain a virtual currency license in order to conduct business in Louisiana, and in December 2021, the Louisiana Office of Financial Institutions issued guidance establishing how it will license and regulate virtual currency businesses under the act. In addition, a California federal court recently held that all governance token holders can be held responsible for any losses suffered in a security incident involving a Distribute Autonomous Organization or “DAO.” The SEC has also proposed amendments to its definition of “exchange” under SEC Rule 3b-16 that could hold “significant holders of governance or other tokens” responsible if a DeFi platform associated with such tokens fails to appropriately register with the SEC. While we are not a party to the California claim, and the SEC’s proposal has not yet been adopted, governance tokens currently are tradable on our platform. Other states, such as Florida and Texas, have published guidance on how their existing regulatory regimes governing money transmitters apply to virtual currencies. Some states, such as New Hampshire, North Carolina and Washington, have amended their state’s statutes to include virtual currencies into existing licensing regimes, while others have interpreted their existing statutes as requiring a money transmitter license to conduct certain virtual currency business activities. SoFi Digital Assets, LLC is licensed as a money transmitter or the equivalent in most states and the District of Columbia, but may be required to obtain additional licenses in light of evolving regulation of virtual currency businesses.
It is likely that, as blockchain technologies and the use of virtual currencies continue to grow, additional states will take steps to monitor the developing industry and perhaps require us to obtain additional licenses in connection with our virtual currency activity. For example, on May 5, 2023, the Attorney General for the State of New York proposed the Crypto Regulation, Protection, Transparency, and Oversight (CRPTO) Act. New York’s CRPTO Act would require, among other things, independent public audits of cryptocurrency exchanges and measures to prevent individuals from owning related companies, such as brokerages, tokens, and investment advisers, to mitigate potential conflicts of interest, and place further restrictions on the activities of crypto brokers. The CRPTO Act is one example of a regulation that, if adopted, could change the way brokers and the blockchain and virtual currency industries do business and could impose additional costs and other potentially adverse impacts on our business.
There are financial and third party risks associated with using a custodian to store cryptocurrency offerings.
Cryptocurrency is a new and emerging asset class and there are financial and third party risks related to our digital assets offerings, such as inappropriate access to or theft or destruction of digital assets held by our custodians, insufficient insurance coverage by the custodians to reimburse us for all such losses, the custodian’s failure to maintain effective controls over the custody and settlement services provided to us, the custodian’s inability to purchase or liquidate digital assets holdings, and defaults on financial or performance obligations by counterparty financial institutions. The realization of any one or combination of these risks could materially and adversely affect our financial performance and significantly harm our business.
The obligations associated with our custodial arrangements, including to take measures to safeguard digital assets, involve unique risks and uncertainties. While other types of assets held in a similar manner have been deemed not to be part of the asset custodian’s bankruptcy estate under various regulatory regimes, bankruptcy courts have not yet settled on the appropriate treatment of custodial holdings of digital assets. We hold our members’ digital assets through two third-party custodians. Although we intend to structure our arrangements with third-party custodians in a manner that would not deem the assets to be the property of the custodian, there is no guarantee that a court would not consider such assets as part of the custodian’s bankruptcy estate. As there is a lack of legal precedent in this area and as the outcome of any claim could be very
fact-dependent, such an event could delay or preclude the return of digital assets to our members. In addition, as some digital asset providers and service providers curtail their crypto-related activities, a loss of potential custodians and other service providers may result which would make it difficult for us to continue offering digital asset products and services. These and other risks could adversely impact our digital assets product offering, our reputation and harm our business.
Failure to comply with anti-money laundering, economic and trade sanctions regulations, and similar laws could subject us to penalties and other adverse consequences.
Various laws and regulations in the U.S. and abroad, such as the Bank Secrecy Act (“BSA”),BSA, the Dodd-Frank Act, the USA PATRIOT Act, and the Credit Card Accountability Responsibility and Disclosure Act, impose certain anti-money laundering requirements on companies that are financial institutions or that provide financial products and services. Under these laws and regulations, financial institutions are broadly defined to include banks and MSBs such as money transmitters. In 2013, FinCEN issued guidance regarding the applicability of the BSA to administrators and exchangers of convertible virtual currency, clarifying that they are MSBs, and more specifically, money transmitters. The BSA requires banks and MSBs to develop and implement risk-based anti-money laundering programs, report large cash transactions and suspicious activity, and maintain transaction records, among other requirements. State regulators may impose similar requirements on licensed money transmitters. In addition, our contracts with financial institution partners and other third parties may contractually require us to maintain an anti-money laundering program. SoFi Bank is subject to the regulatory and supervisory jurisdiction of the OCC with respect to the BSA and its implementing regulations applicable to banks. Our subsidiary, SoFi Digital Assets, LLC, is registered with FinCEN as an MSB. Registration as an MSB subjects us to the regulatory and supervisory jurisdiction of FinCEN and the IRS, the anti-money laundering provisions of the BSA and its implementing regulations applicable to MSBs. Although we have exited our digital assets business, the Company, including SoFi Digital Assets, LLC, may still be subject to regulatory scrutiny related to our prior business practices.
We are also subject to economic and trade sanctions programs administered by the Office of Foreign Assets Control of the U.S. Department of Treasury,OFAC, which prohibit or restrict transactions to or from or dealings with specified countries, their governments, and in certain circumstances, their nationals, and with individuals and entities that are specially-designated nationals of those countries, narcotics traffickers, terrorists or terrorist organizations, and other sanctioned persons and entities.
Our failure to comply with anti-money laundering, economic and trade sanctions regulations, and similar laws could subject us to substantial civil and criminal penalties, or result in the loss or restriction of our national bank charter, MSB or broker-dealer registrations and state licenses, or liability under our contracts with third parties, which may significantly affect our ability to conduct some aspects of our business. Changes in this regulatory environment, including changing interpretations and the implementation of new or varying regulatory requirements by the government, may significantly affect or change the manner in which we currently conduct some aspects of our business.
We are subject to anti-corruption, anti-bribery and similar laws, and noncompliance with such laws can subject us to significant adverse consequences, including criminal or civil liability, and harm our business.
We are subject to the Foreign Corrupt Practices Act, U.S. domestic bribery laws and other U.S. and foreign anti-corruption laws. Anti-corruption and anti-bribery laws have been enforced aggressively in recent years and are interpreted
broadly to generally prohibit companies, their employees and their third-party intermediaries from authorizing, offering or providing, directly or indirectly, improper payments or benefits to recipients in the public sector. These laws also require that we keep accurate books and records and maintain internal controls and compliance procedures designed to prevent any such actions. Although our operations are currently concentrated in the U.S., as we increase our international cross-border business and expand operations abroad, we have engaged and may further engage with business partners and third-party intermediaries to market our services and to obtain necessary permits, licenses and other regulatory approvals. In addition, we or our third-party intermediaries may have direct or indirect interactions with officials and employees of government agencies or state-owned or affiliated entities. We can be held liable for the corrupt or other illegal activities of these third-party intermediaries, our employees, representatives, contractors, partners, and agents, even if we do not explicitly authorize such activities. The failure to comply with any such laws could subject us to criminal or civil liability, cause us significant reputational harm and have an adverse effect on our business, financial condition and results of operations.
We conduct our business operations through subsidiaries and may in the future rely on dividends from our subsidiaries for a substantial amount of our cash flows.
We may in the future depend on dividends, distributions and other payments from our subsidiaries to fund payments on our obligations, including any debt obligations we may incur. Regulatory and other legal restrictions may limit our ability to transfer funds to or from certain subsidiaries, including SoFi Securities and SoFi Bank. In addition, certain of our subsidiaries are subject to laws and regulations that authorize regulatory bodies to block or reduce the flow of funds to us, or that prohibit such transfers altogether in certain circumstances. These laws and regulations may hinder our ability to access funds that we may need to make payments on our obligations, including any debt obligations we may incur and otherwise conduct our
business by, among other things, reducing our liquidity in the form of corporate cash. In addition to negatively affecting our business, a significant decrease in our liquidity could also reduce investor confidence in us. Certain rules and regulations of the SEC and FINRA may limit the extent to which our broker-dealer subsidiaries may distribute capital to us. For example, under FINRA rules applicable to SoFi Securities, a dividend in excess of 10% of a member firm’s excess net capital may not be paid without FINRA’s prior written approval. In addition, the OCC has the authority to use its enforcement powers to prohibit a bank from paying dividends if, in its opinion, the payment of dividends would constitute an unsafe or unsound practice. Federal law also prohibits the payment of dividends by a bank that will result in the bank failing to meet its applicable capital requirements on a pro forma basis. In addition, under the National Bank Act, SoFi Bank generally may, without prior approval of the OCC, declare a dividend but only so long as the total amount of all dividends (common and preferred), including the proposed dividend, in the current year do not exceed net income for the current year to date plus retained net income for the prior two years. Compliance with these rules may impede our ability to receive dividends, distributions and other payments from SoFi Securities and SoFi Bank.
We have in the past, continue to be, and may in the future be subject to inquiries, exams, pending investigations, or enforcement matters.
The financial services industry is subject to extensive regulation and oversight under federal, state, and applicable international laws. From time to time, in the normal course of business, we have received and may receive or be subject to inquiries or investigations by state and federal regulatory or enforcement agencies and bodies, such as the CFPB, SEC, the Federal Reserve, the OCC, the FDIC, the FHFA, the VA, the state attorneys general, state financial regulatory agencies, other state or federal agencies and SROs like FINRA. We also have in the past and may in the future receive inquiries from state regulatory agencies regarding requirements to obtain licenses from or register with those states, including in states where we have previously determined that we are not required to obtain such a license or be registered with the state. In addition, we have been threatened with or named as a defendant in lawsuits, arbitrations and administrative claims involving securities, consumer financial services and other matters. We are also subject to periodic regulatory examinations and inspections. Compliance and trading problems or other deficiencies or weaknesses that are reported to regulators, such as the OCC, SEC, FINRA, the CFPB or state regulators, by dissatisfied customers or others, or that are identified by regulators themselves, are investigated by such regulators, and may, if pursued, result in formal claims being filed against us by customers or disciplinary action being taken against us or our employees by regulators or enforcement agencies. To resolve issues raised in examinations or other governmental actions, we may be required to take various corrective actions, including changing certain business practices, making refunds or taking other actions that could be financially or competitively detrimental to us.
Any such inquiries, investigations, lawsuits, arbitrations, administrative claims or other inquiries have in the past and could in the future involve substantial time and expense to analyze and respond to, divert management’s attention and other resources from running our business, and lead to fines, penalties, injunctive relief, and the need to obtain additional licenses that we do not currently possess. Our involvement in any such matters, whether tangential or otherwise and even if the matters are ultimately determined in our favor, could also cause significant harm to our reputation, lead to additional investigations and enforcement actions from other agencies or litigants, and further divert management attention and resources from the operation
of our business. As a result, the outcome of legal and regulatory actions arising out of any state or federal inquiries we receive could have a material adverse effect on our business, financial condition or results of operations.
Recent statements by lawmakers,Lawmakers, regulators and other public officials have signaled an increased focus on new or additional laws or regulations that could impact our broker-dealer business and require us to make significant changes to our business model and practices, and could result in significant costs to our business or loss of current revenue streams.
Various lawmakers, regulators and other public officials have recently made statements about our business practices in which we and other broker-dealers engage, including SoFi Securities, and signaled an increased focus on new or additional laws or regulations that, if acted upon, could impact our business. On October 5, 2021, forFor example, SEC Chair Gensler, speaking before the U.S. House of Representatives Committeea focus by regulators and lawmakers on Financial Services, reiterated his view that payment for order flow (“PFOF”) andPFOF, exchange rebates, may present a number ofand related conflicts of interest. This follows the Spring 2021 House Committee on Financial Services hearings on the events surrounding the January 2021 market volatility and disruptions surrounding GameStop and other “meme” stocks at which various members of Congress expressed their concerns about various market practices, including PFOF and options trading. Chair Gensler previously instructed the staff ofinterest have resulted in new proposed rules. Additionally, the SEC to study, and in some cases make rulemaking recommendations to the SEC regarding, a variety of market issues and practices, including PFOF, so-called gamification, and whether broker-dealers are adequately disclosing their policies and procedures around potential trading restrictions; whether margin requirements and other payment requirements are sufficient; and whether broker-dealers have appropriate tools to manage their liquidity and risk, and on May 6, 2021, in testimony to the House Committee on Financial Services, Chair Gensler discussed the use of mobile app features such as rewards, bonuses, push notifications and other prompts. Chair Gensler suggested that such prompts could promote behavior that is not in the interest of the customer, such as
excessive trading and advised that he had directed the SEC staff to consider whether expanded enforcement mechanisms are necessary. On October 14, 2021, the SEC issued the “Staff Report on Equity and Options Market Structure Conditions in Early 2021.” In its report, the SEC concluded that “consideration should be given to whether game-like features and celebratory animations that are likely intended to create positive feedback from trading lead investors to trade more than they would otherwise,” and that “payment for order flow and the incentives it creates may cause broker-dealers to find novel ways to increase customer trading, including through the use of digital engagement practices.” In addition, on August 27, 2021, the SEC issued a request for information and comments on broker-dealer and investment adviser digital engagement practices (“DEPs”), related tools and methods, regulatory considerations, and potential approaches. In its request, the SEC noted that certain competition practices, such as PFOF, in combination with zero commissions, create incentives for firms to use DEPs to encourage frequent trading, and that these incentives may not be transparent to retail investors. The SEC noted that DEPs can potentially harm retail investors if they prompt them to engage in trading activities that may not be consistent with their investment goals or risk tolerance. Additionally, on December 14, 2022, the SEChas proposed new requirements regarding best execution (Regulation Best Execution), trade reporting, Regulation National Market System, PFOF (both on-exchange and off-exchange), minimuma rule to prohibit volume-based transaction pricing incrementsin connection with the execution of agency-related orders in national market system stock. The SEC also issued an order in September 2023 directing the equity exchanges and the National Best BidFINRA to file a new national marketing system plan. This order and Offer. These rules remainother proposals but have the potential to substantially reshape U.S. equities markets in intended and unintended ways, and to substantially alter existing order routing, execution incentives and business practices. The SEC also finalized rules in February 2023 to shorten the standard settlement cycle for most broker-dealer transactions in securities from two business days after the trade (T+2) to one (T+1). While theThe SEC compliance date for T+1 is not untilin May 2024 and this change has required and will continue to require technological, operational, and compliance adjustments across the industry that are likely to be time consuming and costly for all market participants.
In addition, Additionally, a focus by lawmakers and regulators on March 18, 2021, FINRA issued a regulatory notice reminding member firms of their obligations with respect to maintaining margin requirements, customer order handlingso-called gamification and effectively managing liquidity, with a particular focus on best executiondigital engagement practices and the need for member firms to make “meaningful disclosures” to inform customers of a firm’s order handling procedures during extreme market conditions. Also, on June 23, 2021, FINRA issued a regulatory notice reminding member firms of the requirement that customer order flow be directed to markets providing the “most beneficial terms for their customers” and indicated that member firms may not negotiate the terms of order routing arrangementshas resulted in a mannernew rule proposed by the SEC and, in July 2023, the SEC proposed new rules and amendments to address certain conflicts of interest associated with the use of predictive data analytics by broker-dealers and investment advisers in investor interactions. If adopted, the proposed rules would require broker-dealers and investment advisers to evaluate and determine whether their use of certain technologies in investor interactions such as analytical, technological or computational functions, algorithms, models, correlation matrices or similar methods or processes that reduces price improvement opportunitiesdirect or optimize for investment related behavior, involves a conflict of interest that would otherwise be available to those customersresults in the absencebroker-dealer or investment adviser’s interests being placed ahead of PFOF.investors’ interests. A Fall 2023 SEC rulemaking agenda indicates that adoptions of these proposed rules are likely.
To the extent that the SEC, FINRA or other regulatory authorities or legislative bodies adopt additional regulations or legislation in respect of any of these areas or relating to any other aspect of our business, we could face a heightened risk of potential regulatory violations and could be required to make significant changes to our business model and practices, which changes may not be successful. Any of these outcomes could have an adverse effect on our business, financial condition and results of operations. Additionally, any negative publicity surrounding PFOF practices generally, or our implementation of this practice, could harm our brand and reputation. For more information about the potential impact of legal and regulatory changes, see “We may become subject to enforcement actions or litigation as a result of our failure to comply with laws and regulations, even though noncompliance was inadvertent or unintentional”.
Regulations relating to privacy, information security and data protection could increase our costs, affect or limit how we collect and use personal information, and adversely affect our business opportunities.
We are subject to various privacy, information security and data protection laws, including requirements concerning security breach notification, and we could be negatively impacted by them. For example, we are subject to the GLBA and implementing regulations and guidance. Among other things, the GLBA (i) imposes certain limitations on the ability to share consumers’ nonpublic personal information with nonaffiliated third parties and (ii) requires certain disclosures to consumers about our practices for the collection, sharing and safeguarding of their information and their right to “opt out” of the institution’s disclosure of their personal financial information to nonaffiliated third parties (with certain exceptions). The GLBA and other state laws also require that we implement and maintain certain security measures, policies and procedures to protect personal information.
Furthermore, legislators and/or regulators are increasingly adopting new and/or amending existing privacy, information security and data protection laws that potentially could have a significant impact on our current and planned privacy, data protection and information security-related practices; our policies and practices related to the collection, use, sharing, retention and safeguarding of consumer and/or employee information; and some of our current or planned business activities. New requirements, originating from new or amended laws, could also increase our costs of compliance and business operations and could reduce income from certain business initiatives.
Compliance with current or future privacy, information security and data protection laws (including those regarding security breach notification) affecting customer and/or employee data to which we are subject could result in higher compliance and technology costs and could restrict our ability to provide certain products and services (such as products or services that
involve sharing information with third parties or storing sensitive credit card information), which could materially and adversely affect our profitability. A failure by us or a third-party contractor providing services to us to comply with applicable data privacy and security laws, regulations, self-regulatory requirements or industry guidelines, or our terms of use with our users, may result in sanctions, statutory or contractual damages or litigation (including class actions) and may subject us to reputational harm. Additionally, there is always a danger that regulators can attempt to assert authority over our business in the area of privacy, information security and data protection. In addition,Furthermore, if our vendors and/or service providers are or become subject to laws and regulations in the jurisdictions that have enacted more stringent and expansive legislation applicable to privacy, information and/or data protection, the costs that these vendors and service providers must incur in becoming compliant may be passed along to us, resulting in increasing costs on our business.
Concerns in our ability, perceived or otherwise, to protect the privacy and security of personal information may affect our ability to retain and engage new and existing members, clients, investors, and employees, and thereby affect our financial condition. Furthermore, failure to comply or perceived failure to comply with applicable privacy or data protection laws, rules, and regulations may subject us to examinations, investigations, and general heightened scrutiny that may cause us to modify or cease certain operations or practices, significant liabilities or regulatory fines, penalties or other sanctions. Any of these could damage our reputation and adversely affect our business, financial condition, and results of operations.
Privacy requirements, including notice and opt-out requirements, under the GLBA and the FCRA are enforced by the Federal Trade Commission,FTC, the OCC and by the CFPB through UDAAP and are a standard component of CFPBOCC and OCCCFPB compliance and examinations. State entities also may initiate actions for alleged violations of privacy or security requirements under state law. Our failure to comply with privacy, information security and data protection laws could result in potentially significant regulatory investigations and government actions, litigation, fines or sanctions, consumer or merchant actions and damage to our reputation and brand, all of which could have a material adverse effect on our business.
Should we undertake an international expansion of our business, particularly if we commence doing business in one or more countries of the EU or the United Kingdom (the “UK”), we will be required to comply with stringent privacy and data protection laws. Within the EU, legislators have adopted the General Data Protection Regulation (the “GDPR”), which became effective in May 2018. Should we commence doing business in Europe, the GDPR will impose additional obligations and risk upon our business, which may increase substantially the penalties to which we could be subject in the event of any noncompliance. We may incur substantial expense in complying with obligations imposed by the GDPR and we may be required to make significant changes in our business operations, all of which may adversely affect our revenues and our business overall.
In addition, further to the UK’s exit from the EU on January 31, 2020, the GDPR ceased to apply in the UK at the end of the transition period on December 31, 2020. However, as of January 1, 2021, the UK’s European Union (Withdrawal) Act 2018 incorporated the GDPR (as it existed on December 31, 2020 but subject to certain UK specific amendments) into UK law, referred to as the “UK GDPR”. The UK GDPR and the UK Data Protection Act 2018 set out the UK’s data protection regime, which is independent from but aligned to the EU’s data protection regime. Noncompliance with the UK GDPR may result in significant monetary penalties. Although the UK is regarded as a third country under the EU’s GDPR, the European Commission (“EC”)EC has issued a decision recognizing the UK as providing adequate protection under the EU GDPR and, therefore, transfers of personal data originating in the EU to the UK remain unrestricted. Like the EU GDPR, the UK GDPR restricts personal data transfers outside the UK to countries not regarded by the UK as providing adequate protection. The UK government has confirmed that personal data transfers from the UK to the EEA remain free flowing.
In addition, around the world many jurisdictions outside of Europe are also considering and/or have enacted comprehensive data protection legislation. For example, we are subject to stringent privacy and data protection requirements in Hong Kong. Also, many jurisdictions outside of Europe where we may seek to expand our business in the future are also considering and/or have enacted comprehensive data protection legislation. Additional jurisdictions with stringent data protection laws include Brazil and China. In the United States, the SEC proposed multiple rules related to privacy and cybersecurity in March 2023. Proposed amendments to Regulation S-P would, among other things: (i) require covered institutions (including broker-dealers and investment advisers) to adopt written policies and procedures for an incident response program to address unauthorized access to or use of customer information; and (ii) require covered institutions to have written policies and procedures to provide timely notification to affected individuals whose sensitive customer information was or is reasonably likely to have been accessed or used without authorization. The SEC also proposed amendments to existing Regulation SID andreopened the comment period for the Investment Management Cybersecurity Release which proposed new cybersecurity risk management rules parts of whichthat would require broker-dealers,registered investment advisers and other securities industry participantsinvestment companies to adopt specificand implement written cybersecurity policies and procedures reasonably designed to address certaincybersecurity risks, disclose information about cybersecurity risks and notifyincidents, report information confidentially to the SEC about certain customers when cybercybersecurity incidents, occur.and maintain related records. While we believe we have robust policies and procedures addressing incidents involving unauthorized access to or use of customer information, these regulations have and may in the future require us to amend our current incident
response program. In addition, these regulations may interfere with our intended business
activities, inhibit our ability to expand into those markets or prohibit us from continuing to offer services in those markets without significant additional costs.
The regulatory framework governing the collection, processing, storage, use and sharing of certain information, particularly financial and other personal information, is rapidly evolving and is likely to continue to be subject to uncertainty and varying interpretations. It is possible that these laws may be interpreted and applied in a manner that is inconsistent with laws in other jurisdictions or with our existing data management practices or the features of our services and platform capabilities. We therefore cannot yet fully determine the impact the existing and/or future laws, rules, regulations and industry standards may have on our business or operations. Any failure or perceived failure by us, or any third parties with which we do business, to comply with our posted privacy policies, changing consumer expectations, evolving laws, rules and regulations, industry standards, or contractual obligations to which we or such third parties are or may become subject, may result in actions or other claims against us by governmental entities or private actors, the expenditure of substantial costs, time and other resources or the imposition of significant fines, penalties or other liabilities. In addition, any such action, particularly to the extent we were found to be guilty of violations or otherwise liable for damages, would damage our reputation and adversely affect our business, financial condition and results of operations.
We cannot yet fully determine the impact the existing and/or future laws, rules, regulations and industry standards may have on our business or operations. Any such laws, rules, regulations and industry standards may be inconsistent among different jurisdictions, subject to differing interpretations or may conflict with our current or future practices. Additionally, our customers may be subject to differing privacy laws, rules and legislation, which may mean that they require us to be bound by varying contractual requirements applicable to certain other jurisdictions. Adherence to such contractual requirements may impact our collection, use, processing, storage, sharing and disclosure of various types of information including financial information and other personal information, and may mean we become bound by, or voluntarily comply with, self-regulatory or other industry standards relating to these matters that may further change as laws, rules and regulations evolve. Complying with these requirements and changing our policies and practices may be onerous and costly, and we may not be able to respond quickly or effectively to regulatory, legislative and other developments. These changes may in turn impair our ability to offer our existing or planned features, products and services and/or increase our cost of doing business. As we expand our customer base, these requirements may vary from customer to customer, further increasing the cost of compliance and doing business.
We publicly post documentation regarding our practices concerning the collection, processing, use and disclosure of data. Although we endeavor to comply with our published policies and documentation, we may at times fail to do so or be alleged to have failed to do so. Any failure or perceived failure by us to comply with our privacy policies or any applicable privacy, security or data protection, information security or consumer-protection related laws, regulations, orders or industry standards could expose us to costly litigation, significant awards, fines or judgments, civil and/or criminal penalties or negative publicity, and could materially and adversely affect our business, financial condition and results of operations. The publication of our privacy policy and other documentation that provide promises and assurances about privacy and security can subject us to potential state and federal action if they are found to be deceptive, unfair, or misrepresentative of our actual practices, which could, individually or in the aggregate, materially and adversely affect our business, financial condition and results of operations.
It may be difficult and costly to protect our intellectual property rights, and we may not be able to ensure their protection.
Our ability to provide our products and services to our members and technology platform clients depends, in part, upon our proprietary technology. We may be unable to protect our proprietary technology effectively, which would allow competitors to duplicate our business processes and know-how, and adversely affect our ability to compete with them. A third party may attempt to reverse engineer or otherwise obtain and use our proprietary technology without our consent. The pursuit of a claim against a third party for infringement of our intellectual property could be costly, and there can be no guarantee that any such efforts would be successful.
In addition, our platform or those of third-party service providers that we utilize may infringe upon claims of third-party intellectual property, and we may face intellectual property challenges from such other parties. We may not be successful in defending against any such challenges or in obtaining licenses to avoid or resolve any intellectual property disputes, or in receiving amounts due to us under indemnification obligations from third-party service providers. The costs of defending any such claims or litigation could be significant and, if we are unsuccessful, could result in a requirement that we pay significant damages or licensing fees, which would negatively impact our financial performance. If we cannot protect our proprietary technology from intellectual property challenges, our ability to maintain our platform could be adversely affected.
Some aspects of our platform include open source software, and any failure to comply with the terms of one or more of these open source licenses could negatively affect our business.
We incorporate open source software into our proprietary platform and into other processes supporting our business. Such open source software may include software covered by licenses like the GNU General Public License and the Apache License or other open source licenses. The terms of various open source licenses have not been interpreted by U.S. courts, and there is a risk that such licenses could be construed in a manner that limits our use of the software, inhibits certain aspects of our platform and negatively affects our business operations.
Some open source licenses contain requirements that we make available source code for modifications or derivative works we create based upon the type of open source software we use. If portions of our proprietary platform are determined to be subject to an open source license, or if the license terms for the open source software that we incorporate change, we could be required to publicly release the affected portions of our source code, re-engineer all or a portion of our platform or change our business activities. In addition to risks related to license requirements, the use of open source software can lead to greater risks than the use of third-party commercial software, as open source licensors generally do not provide warranties or controls on the origin of the software. Many of the risks associated with the use of open source software cannot be eliminated and could adversely affect our business.
Litigation, regulatory actions and compliance issues could subject us to significant fines, penalties, judgments, remediation costs, negative publicity, changes to our business model, and requirements resulting in increased expenses.
Our business is subject to increased risks of litigation and regulatory actions as a result of a number of factors and from various sources, including as a result of the highly regulated nature of the financial services industry and the focus of state and federal enforcement agencies on the financial services industry.
From time to time, we are also involved in, or the subject of, reviews, requests for information, investigations and proceedings (both formal and informal) by state and federal governmental agencies and SROs, regarding our business activities and our qualifications to conduct our business in certain jurisdictions, which has in the past and could in the future subject us to significant fines, penalties, obligations to change our business practices and other requirements resulting in increased expenses and diminished earnings. Our involvement in any such matter also has in the past and could in the future cause significant harm to our reputation and divert management attention from the operation of our business, even if the matters are ultimately determined in our favor. Moreover, any settlement, or any consent order or adverse judgment in connection with any formal or informal proceeding or investigation by a government agency, may prompt litigation or additional investigations or proceedings as other litigants or other government agencies begin independent reviews of the same activities. See “If we fail to comply with federal and state consumer protection laws, rules, regulations and guidance, our business could be adversely affected” for a discussion of the FTC Consent Order.
In addition, a number of participants in the financial services industry have been the subject of: putative class action lawsuits; state attorney general actions and other state regulatory actions; federal regulatory enforcement actions, including actions relating to alleged unfair, deceptive or abusive acts or practices; violations of state licensing and lending laws, including state usury laws; actions alleging discrimination on the basis of race, ethnicity, gender or other prohibited bases; and allegations of noncompliance with various state and federal laws and regulations relating to originating and servicing consumer finance loans. For example, we entered into a settlement agreement on April 18, 2022 related to a putative class action in which it was alleged that we engaged in unlawful lending discrimination through policies and practices by making applicants who are conditional permanent residents or DACA holders ineligible for loans or eligible only with a co-signer who is U.S. citizen or lawful permanent resident. We made an aggregate payment to the class and the class counsel in an immaterial amount. In addition, as a financial services company, errors in performing settlement functions, including clerical, technological and other errors related to the handling of funds and securities could lead to censures, fines or other sanctions imposed by applicable regulatory authorities as well as losses and liabilities in related lawsuits and proceedings brought by transaction counterparties and others.
The current regulatory environment, increased regulatory compliance efforts and enhanced regulatory enforcement have resulted in significant operational and compliance costs and may prevent us from providing certain products and services. There is no assurance that these regulatory matters or other factors will not, in the future, affect how we conduct our business and, in turn, have a material adverse effect on our business. In particular, legal proceedings brought under state consumer protection statutes or under several of the various federal consumer financial services statutes may result in a separate fine for each violation of the statute, which, particularly in the case of class action lawsuits, could result in damages substantially in excess of the amounts we earned from the underlying activities.
In addition, from time to time, through our operational and compliance controls, we identify compliance and other issues that require us to make operational changes and, depending on the nature of the issue, result in financial remediation to impacted members. These self-identified issues and voluntary remediation payments could be significant, depending on the issue and the number of members impacted, and also could generate litigation or regulatory investigations that subject us to additional risk. See Part II, Item 1. “Legal Proceedings”.
Changes in tax law and differences in interpretation of tax laws and regulations may adversely impact our financial statements.
We operate in multiple jurisdictions and are subject to tax laws and regulations of the U.S. federal, state and local and non-U.S. governments. U.S. federal, state and local and non-U.S. tax laws and regulations are complex and subject to varying interpretations. U.S. federal, state and local and non-U.S. tax authorities may interpret tax laws and regulations differently than we do and challenge tax positions that we have taken. This may result in differences in the treatment of revenues, deductions, credits and/or differences in the timing of these items. The differences in treatment may result in payment of additional taxes, interest or penalties that could have an adverse effect on our financial condition and results of operations. Further, future changes to U.S. federal, state and local and non-U.S. tax laws and regulations could increase our tax obligations in jurisdictions where we do business or require us to change the manner in which we conduct some aspects of our business. Proposals to reform U.S. and foreign tax laws could significantly impact how U.S. multinational corporations are taxed on foreign earnings and could increase the U.S. corporate tax rate. Several of the proposals currently being considered, if enacted, could have an adverse impact on our future effective tax rate, income tax expense, and cash flows. Further, the Organisation for Economic Co-operation and Development (the “OECD”), an international association of 38 countries, including the U.S., has issued guidelines that change long-standing tax principles. These guidelines create tax uncertainty as countries amend their tax laws to adopt certain parts of the guidelines.
We will be adversely affected if we, or any of our subsidiaries, are determined to have been subject to registration as an investment company under the Investment Company Act.
We are currently not deemed to be an “investment company” subject to regulation under the Investment Company Act of 1940, as amended (the “Investment Company Act”). No opinion or no-action position has been requested of the SEC on our status as an Investment Company. There is no guarantee we will continue to be exempt from registration under the Investment Company Act and were we to be deemed to be an investment company under the Investment Company Act, and thus subject to regulation under the Investment Company Act, the increased reporting and operating requirements could have an adverse impact on our business, operating results, financial condition and prospects.
In addition, if the SEC or a court of competent jurisdiction were to find that we are in violation of the Investment Company Act for having failed to register as an investment company thereunder, possible consequences include, but are not limited to, the following: (i) the SEC could apply to a district court to enjoin the violation; (ii) we could be sued by investors in us and in our securities for damages caused by the violation; and (iii) any contract to which we are a party that is made in, or whose performance involves a, violation of the Investment Company Act would be unenforceable by any party to the contract unless a court were to find that under the circumstances enforcement would produce a more equitable result than nonenforcement and would not be inconsistent with the purposes of the Investment Company Act. Should we be subjected to any or all of the foregoing, our business would be materially and adversely affected.
Personnel and Business Continuity Risks We rely on our management team and will require additional key personnel to grow our business, and the loss of key management members or key employees, or an inability to hire key personnel, could harm our business.
We believe our success has depended, and continues to depend, on the efforts and talents of our senior management, who have significant experience in the financial services and technology industries, are responsible for our core competencies and would be difficult to replace. Our future success depends on our continuing ability to attract, develop, motivate and retain highly qualified and skilled employees. Qualified individuals are usually in high demand even in an uncertain economy, and we may incur significant costs to attract and retain them. In addition, the loss of any of our senior management or key employees could materially adversely affect our ability to execute our business plan and strategy, and we may not be able to find adequate replacements on a timely basis, or at all, and our other employees may be required to take on additional responsibilities. Furthermore, many candidates evaluate year over year stock growth trends for a sense of the potential long-term value of their proposed stock awards, or have recently begun to discount the value of growth stocks on the whole. The volatility of the market price of our common stock could harm our ability to attract and retain talent. Our executive officers and other employees are at-will employees, which means they may terminate their employment relationship with us at any time, and their knowledge of our
business and industry would be extremely difficult to replace. We cannot ensure that we will be able to retain the services of any members of our senior management or other key employees. If we do not succeed in attracting well-qualified employees or retaining and motivating existing employees, our business could be materially and adversely affected.
The job market and the optimization of our workforce creates a challenge and potential risk as we strive to attract and retain a highly skilled workforce.
Competition for certain of our employees, including highly skilled technology and product professionals responsible for the design, engineering and operation of systems, is competitive, which can present a risk as we compete for experienced candidates, especially if the competition is able to offer more attractive financial terms of employment. This risk extends to our current employee population. We also invest significant time and expense in engaging and developing our employees, which also increases their value to other companies that may seek to recruit them. Turnover can result in significant replacement costs and lost productivity.
In addition, from time to time, we implement organizational changes to pursue greater efficiency and realign our business and strategic priorities. For example, in the recent past, we laid off a relatively small number of employees even though we intend to continue to hire in other areas. As our organization continues to evolve, and we are required to implement and optimize our business and organizational structures, we may find it difficult to maintain the benefits of our corporate culture, including our ability to quickly develop and launch new and innovative products. This could negatively affect our business performance. See also ““We transitioned to a flexible-first workforce model, which could subject us to increased business continuity and cyber risks, as well as other operational challenges and risks that could significantly harm our business and operations”operations” for more information on the impact of a flexible workforce model on corporate culture and employee retention.
In addition, U.S. immigration policy has made it more difficult for qualified foreign nationals to obtain or maintain work visas under the H-1B classification. These H-1B visa limitations make it more difficult and/or more expensive for us to hire the skilled professionals we need to execute our growth strategy, especially engineering, data analytics and risk management personnel, and may adversely impact our business.
We transitioned to a flexible-first workforce model, which could subject us to increased business continuity and cyber risks, as well as other operational challenges and risks that could significantly harm our business and operations.
We offer most of our employees the choice of working full time in the office, a hybrid approach, or full-time remote. We recentlyIn 2023 we announced an increase in in-office collaboration for non-remote employees who are returning to the office for a specified number of days per month, varying by business team. This return to the office for non-remote employees is limited, and we expect many employees to continue to work remotely for a number of days per week. As a result, we expect to continue to be subject to the challenges and risks of having a remote workforce, as well as new challenges and risks from operating with a hybrid workforce. For example, our employees are accessing our servers remotely through home or other networks to perform their job responsibilities. Such security systems may be less secure than those used in our offices, which may subject us to increased security risks, including cybersecurity-related events, and expose us to risks of data or financial loss and associated disruptions to our business operations. Additionally, employees who access company data and systems remotely may not have access to technology that is as robust as that in our offices, which could place additional pressure on our user infrastructure and third parties that are not easily mitigated. These risks include home internet availability affecting work continuity and efficiency, and additional dependencies on third-party communication tools, such as instant messaging and online meeting platforms. We may also be exposed to risks associated with the locations of remote employees, including compliance with local laws and regulations or exposure to compromised internet infrastructure. Allowing our employees to work remotely may create intellectual property risk if employees create intellectual property on our behalf while residing in a jurisdiction with unenforced or uncertain intellectual property laws. Further, if employees fail to inform us of changes in their work location, we may be exposed to additional risks without our knowledge. While most of our operations can be performed remotely and we believe have operated effectively, there is no guarantee that this will continue or that we will continue to be as effective while operating a flexible-first workforce model because our team is dispersed.
Additionally, operating our business with both remote and in-person workers, or workers who work in flexible locations and on flexible schedules, could have a negative impact on our corporate culture, decrease the ability of our workforce to collaborate and communicate effectively, decrease innovation and productivity, or negatively affect workforce morale. If we are unable to manage the cybersecurity and other risks of a flexible-first workforce model, and maintain our corporate culture and workforce morale, our business could be harmed or otherwise adversely impacted.
Our business is subject to the risks of natural disasters, power outages, telecommunications failures and similar events, including public health crises, and to interruptions by human-made problems such as terrorism, cyberattacks, and other actions, which may impact the demand for our products or our members’ ability to repay their loans.
Events beyond our control may damage our ability to maintain our platform and provide services to our members. Such events include, but are not limited to, hurricanes, earthquakes, fires, floods and other natural disasters, public health crises, such as the COVID-19 pandemicpower or other infectious diseases, power outages, telecommunications failures and similar events. Despite any precautions we may take, system interruptions and delays could occur if there is a natural disaster, if a third-party provider closes a facility we use without adequate notice for financial or other reasons, or if there are other unanticipated problems at our leased facilities. Because we rely heavily on our servers, computer and communications systems and the Internet to conduct our business and provide high-quality service to our members, disruptions could harm our ability to effectively run our business. Moreover, our members and customers face similar risks, which could directly or indirectly impact our business. We currently use AWS and would be unable to switch instantly to another system in the event of failure to access AWS. This means that an outage of AWS could result in our system being unavailable for a significant period of time.
Terrorism, cyberattacks and other criminal, tortious or unintentional actions could also give rise to significant disruptions to our operations. In addition, the long-term effects of climate change on the global economy and our industry in particular are unclear, however we recognize that there are inherent climate-related risks wherever business is conducted. For example, our offices may be vulnerable to the adverse effects of climate change. We have large offices located in the San Francisco Bay Area and Salt Lake City, Utah, regions that are prone to events such as seismic activity and severe weather, that have experienced and may continue to experience, climate-related events and at an increasing rate. Examples include drought and water scarcity, warmer temperatures, wildfires and air quality impacts and power shut-offs associated with wildfire prevention. The increasing intensity of drought throughout California and Utah and annual periods of wildfire danger increase the probability of planned power outages. Although we maintain a disaster response plan and insurance, such events could disrupt our business, the business of our partners or third-party suppliers, and may cause us to experience losses and additional costs to maintain and resume operations. Our business interruption insurance may not be sufficient to compensate us for losses that may result from interruptions in our service as a result of system failures or other disruptions. Comparable natural and other risks may reduce demand for our products or cause our members to suffer significant losses and/or incur significant disruption in their respective operations, which may affect their ability to satisfy their obligations towards us. All of the foregoing could materially and adversely affect our business, results of operations and financial condition.
Employee misconduct, which can be difficult to detect and deter, could harm our reputation and subject us to significant legal liability.
We operate in an industry in which integrity and the confidence of our members is of critical importance. We are subject to risks of errors and misconduct by our employees that could adversely affect our business, including:
•engaging in misrepresentation or fraudulent activities when marketing or performing online brokerage and other services to our members;
•improperly using or disclosing confidential information of our members, technology platform clients, or other parties;
•concealing unauthorized or unsuccessful activities; or
•otherwise not complying with applicable laws and regulations or our internal policies or procedures.
There have been numerous highly-publicized cases of fraud and other misconduct by financial services industry employees. The precautions that we take to detect and deter employee misconduct might not be effective. If any of our employees engage in illegal, improper, or suspicious activity or other misconduct, we could suffer serious harm to our reputation, financial condition, member relationships, and our ability to attract new members. We also could become subject to regulatory sanctions and significant legal liability, which could cause serious harm to our financial condition, reputation, member relationships and prospects of attracting additional members.
Risk Management and Financial Reporting Risks If we fail to establish and maintain proper and effective internal control over financial reporting, our ability to produce accurate and timely financial statements could be impaired, investors may lose confidence in our financial reporting and the trading price of our common stock may decline.
Pursuant to Section 404 of the Sarbanes-Oxley Act, a report by management on internal control over financial reporting and an attestation of our independent registered public accounting firm are required. The rules governing the standards that must be met for management to assess internal control over financial reporting are complex and require
significant documentation, testing and possible remediation. We are required, pursuant to Section 404 of the Sarbanes-Oxley Act, to furnish a report by management on, among other things, the effectiveness of our internal control over financial reporting for our annual reports on Form 10-K. This assessment must include disclosure of any material weaknesses identified by our management in our internal control over financial reporting. Our independent registered public accounting firm must also attest to the effectiveness of our internal control over financial reporting in our annual reports on Form 10-K. We are required to disclose changes made in our internal controls and procedures on a quarterly basis. Failure to comply with the Sarbanes-Oxley Act could potentially subject us to sanctions or investigations by the SEC, the applicable stock exchange or other regulatory authorities, which would require additional financial and management resources.
The annual internal control assessment required by Section 404 of Sarbanes-Oxley has diverted, and may in the future divert, internal resources and we have and may experience higher operating expenses, higher independent auditor and consulting fees in the future. To comply with the Sarbanes-Oxley Act, the requirements of being a reporting company under the Exchange Act and any new or revised accounting rules in the future, as necessary, we have, and may in the future further, work to upgrade SoFi’s legacy information technology systems; implement additional financial and management controls, reporting
systems and procedures; and hire additional accounting and finance staff. If we are unable to hire the additional accounting and finance staff necessary to comply with these requirements, we may need to retain additional outside consultants. In addition, our current controls and any new controls that we develop may become inadequate because of poor design and changes in our business. For example, our continuing growth and expansion in globally dispersed markets, such as our acquisition of Technisys, has placed and may in the future place significant additional pressure on our system of internal control over financial reporting, as acquisition targets may not be in compliance with the provisions of the Sarbanes-Oxley Act. We do not conduct a formal evaluation of companies’ internal control over financial reporting prior to an acquisition. We may be required to hire additional staff and incur substantial costs to implement the necessary new internal controls at companies we acquire. Any failure to implement and maintain effective internal controls over financial reporting could adversely affect the results of assessments by our independent registered public accounting firm and their attestation reports. If we or, if required, our independent registered public accounting firm, are unable to conclude that our internal control over financial reporting is effective, investors may lose confidence in itsour financial reporting, which could negatively impact the price of our securities.
On April 12, 2021, the Acting Director of the Division of Corporation Finance and Acting Chief Accountant of the SEC together issued a statement regarding the accounting and reporting considerations for warrants issued by special purpose acquisition companies entitled “Staff Statement on Accounting and Reporting Considerations for Warrants Issued by Special Purpose Acquisition Companies (“SPACs”)” (the “SEC Statement”). Specifically, the SEC Statement focused on certain settlement terms and provisions related to certain tender offers following a business combination, which terms are similar to those contained in the warrant agreement governing the public warrants and private placement warrants issued initially by SCH. Following the issuance of the SEC statement, on April 22, 2021, SCH concluded that it was appropriate to restate its previously issued audited financial statements as of and for the period ended December 31, 2020, and as part of such process, SCH identified a material weakness in its internal control over financial reporting. As the accounting acquirer in the Business Combination, we inherited this material weakness and the warrants.
As a result of any material weakness, restatement, change in accounting, for the SoFi Technologies warrants, or other matters raised or that may in the future be raised by the SEC, we may face potential litigation or other disputes, which may include, among others, claims invoking the federal and state securities laws, contractual claims or other claims arising from the restatement and material weaknesses in our internal control over financial reporting and the preparation of our financial statements. As of the date of this Quarterly Report on Form 10-Q, we have no knowledge of any such litigation or dispute. However, weWe can provide no assurance that such litigation or disputedisputes will not arise in the future. Any such litigation or dispute related to our financial statements or internal controls, whether successful or not, could have a material adverse effect on our business, results of operations and financial condition.
We cannot assure you that there will not be additional material weaknesses in our internal control over financial reporting now or in the future. For example, as the accounting acquirer in the Business Combination, we inherited a material weakness from SCH related to the treatment of warrants issued by special acquisition companies which required SCH to restate its previously issued audited financial statements as of December 31, 2020. Any failure to maintain internal control over financial reporting could cause us to fail to timely detect errors and severely inhibit our ability to accurately report our financial condition, results of operations or cash flows. If we are unable to conclude that our internal control over financial reporting is effective, or if our independent registered public accounting firm determines that we have a material weakness in our internal control over financial reporting, investors may lose confidence in the accuracy and completeness of our financial reports, the market price of our common stock could decline, and we could be subject to sanctions or investigations by Nasdaq, the SEC or other regulatory authorities. Failure to remedy any material weakness in our internal control over financial reporting, or to implement or maintain other effective control systems required of public companies, could also restrict our future access to the capital markets.
We adjust our total number of members in the event a member is removed in accordance with our terms of service, and our total member count in any one period may not yet reflect such adjustments.
We adjust our total number of members in the event a member is removed in accordance with our terms of service. This could occur for a variety of reasons—including fraud or pursuant to certain legal processes or if a member requests that we close their account in accordance with our terms of service—and, as our terms of service evolve together with our business practices, product offerings and applicable regulations, additional grounds for removing members from our total member count could occur. The determination that a member should be removed in accordance with our terms of service is subject to an evaluation process, following the completion, and based on the results, of which, relevant members and their associated products are removed from our total member count. However, depending on the length of the evaluation process, that removal may not take place in the same period in which the member was added to our member count or the same period in which the
circumstances leading to their removal occurred. For this reason, our total member count in any one period may not yet reflect such adjustments. In any given period, we estimate that up to 10% of our members may be under evaluation for removal in accordance with our terms of service; however, we cannot assure you that this percentage in any period will not be more significant and have an adverse impact on our stock price or results of operations.
Our reported financial results may be adversely affected by changes in accounting principles generally accepted in the United States.
Generally accepted accounting principles in the United States are subject to interpretation by the Financial Accounting Standards Board, the American Institute of Certified Public Accountants, the SEC and various bodies formed to promulgate and interpret appropriate accounting principles. A change in these principles or interpretations could have a significant effect on our reported financial results, and could affect the reporting of transactions completed before the announcement of a change.
Our management has limited experience in operating a public company.
We have incurred and will continue to incur increased costs as a result of operating as a public company, and our management intends to continue to devote substantial time to new compliance initiatives. As a public company, we are subject to the reporting requirements of the Exchange Act, the Sarbanes-Oxley Act, the Dodd-Frank Act, as well as rules adopted, and to be adopted, by the SEC and Nasdaq. Our management and other personnel devote and we expect will continue to devote a substantial amount of time to these compliance initiatives. Furthermore, new rules and regulations or changes to existing rules and regulations in the future may increase our legal and financial compliance costs and make some activities more time-consuming and costly, which would increase our net loss for the foreseeable future. The impact of these requirements could also make it more difficult for us to attract and retain qualified persons to serve on our Board of Directors, its board committees or as executive officers.
Our executive officers have limited experience in dealing with the increasingly complex laws pertaining to public companies, which may increase the amount of their time devoted to these activities and result in less time being devoted to the management and growth of the business. We continue to evaluate whether we have adequate personnel with the appropriate level of knowledge, experience and training in the accounting policies, practices or internal control over financial reporting required of public companies. We have in the past and may in the future expand our employee base and hire additional employees to support our operations as a public company, which has caused and may in the future cause our operating costs to increase. See “ “IfIf we fail to establish and maintain proper and effective internal control over financial reporting, our ability to produce accurate and timely financial statements could be impaired, investors may lose confidence in our financial reporting and the trading price of our common stock may decline”decline”.
As a result of our business combination with a special purpose acquisition company, regulatory obligations may impact us differently than other publicly traded companies.
We became a publicly traded company by completing a transaction with SCH, a SPAC. As a result of this transaction, regulatory obligations have, and may continue, to impact us differently than other publicly traded companies. For instance, the SEC and other regulatory agencies may issue additional guidance or apply further regulatory scrutiny to companies like us that have completed a business combination with a SPAC. Managing this regulatory environment, which has and may continue to evolve, could divert management’s attention from the operation of our business, negatively impact our ability to raise additional capital when needed or have an adverse effect on the price of our common stock.
Our risk management processes and procedures may not be effective.
Our risk management processes and procedures seek to appropriately balance risk and return and mitigate risks. We have established processes and procedures intended to identify, measure, monitor and control the types of risk to which we are subject, including interest rate risk, credit risk, deposit risk, market risk, foreign currency exchange rate risk, liquidity risk, strategic risk, operational risk, cybersecurity risk, and reputational risk. Credit risk is the risk of loss that arises when a loan obligor fails to meet the terms of a loan repayment obligation, the loan enters default, and if uncured results in financial loss of remaining principal and interest to the loan purchaser. Our exposure to credit risk mainly arises from our lending activities.activities, including SoFi Credit Card. Deposit risk refers to accelerated availability of depositor funds, prior to settlement, risk of ACH returns or merchant settlements, and transactional limits that may be applied to deposit accounts. Market risk is the risk of loss due to changes in external market factors, such as interest rates, asset prices, and foreign exchange rates. Foreign currency exchange rate risk is the risk that our financial position or results of operations could be positively or negatively impacted by fluctuations in exchange rates. We may in the future be subject to increasing foreign currency exchange rate risk with our acquisition of Technisys, a foreign company, and we continue to pursue a diversified durable growth strategy with expansion via new products and geographies. Liquidity risk is the risk that financial condition or overall safety and soundness are
adversely affected by an inability, or perceived inability, to meet obligations (e.g., current and future cash flow needs) and support business growth. We actively monitor our liquidity position at the broker-dealer and SoFi Bank. Strategic risk is the risk from changes in the business environment, ineffective business strategies, improper implementation of decisions or inadequate responsiveness to changes in the business and competitive environment.
Operational risk is the risk of loss arising from inadequate or failed internal processes, controls, people (e.g., human error or misconduct) or systems (e.g., technology problems), business continuity or external events (e.g., natural disasters), compliance, reputational, regulatory, or legal matters and includes those risks as they relate directly to us, fraud losses attributed to applications and any associated fines and monetary penalties as a result, transaction processing, or employees, as well as to third parties with whom we contract or otherwise do business. We believe operational risk is one of the most prevalent forms of risk in our risk profile. We strive to manage operational risk by establishing policies and procedures to accomplish timely and efficient processing, obtaining periodic internal control attestations from management, conducting internal process Risk Control Self-Assessments and audit reviews to evaluate the effectiveness of internal controls. Our operational risk, and the amount we invest in risk management, may increase as we introduce new products and product features, and as new threat actors and evolving threat vectors, such as account takeover tactics, increase and become more sophisticated. In order to be effective, among other things, our enterprise risk management capabilities must adapt and align to support any new product or loan features, capability, strategic development, or external change.
Cybersecurity risk is the risk of a malicious technological attack intended to impact the confidentiality, availability, or integrity of our systems and data, including, but not limited to, sensitive client data. Our technology and cybersecurity teams rely on a layered system of preventive and detective technologies, controls, and policies to detect, mitigate, and contain cybersecurity threats. In addition, our cybersecurity team, and the third-party consultants they engage, regularly assess our cybersecurity risks and mitigation efforts. Cyberattacks can also result in financial and reputational risk.
Reputational risk is the risk arising from possible negative perceptions of us, whether true or not, among our current and prospective members, clients, counterparties, employees, and regulators. The potential for either enhancing or damaging our reputation is inherent in almost all aspects of business activity. We attempt to manage this risk through our commitment to a set of core values that emphasize and reward high standards of ethical behavior, maintaining a culture of compliance, and by being responsive to member and regulatory requirements.
Risk, including, but not limited to, the risks outlined above, is inherent in our business, and therefore, despite our efforts to manage risk, there can be no assurance that we will not sustain unexpected losses. We could incur substantial losses and our business operations could be disrupted to the extent our business model, operational processes, control functions, technological capabilities, risk analyses, and business/product knowledge do not adequately identify and manage potential risks associated with our strategic initiatives. There also may be risks that exist, or that develop in the future, that we have not appropriately anticipated, identified or mitigated, including when processes are changed or new products and services are introduced. If our risk management framework does not effectively identify and control our risks, we could suffer unexpected losses or be otherwise adversely affected, which could have a material adverse effect on our business.
Incorrect estimates or assumptions by management in connection with the preparation of our consolidated financial statements or forecasts could adversely affect our reported or forecasted assets, liabilities, income, revenues or expenses.
The preparation of our consolidated financial statements requires management to make critical accounting estimates and assumptions that affect the reported amounts of assets, liabilities, income, revenues or expenses during the reporting periods. Incorrect estimates and assumptions by management could adversely affect our reported amounts of assets, liabilities, income, revenues and expenses during the reporting periods. If we make incorrect assumptions or estimates, our reported financial results may be over- or understated, which could materially and adversely affect our business, financial condition and results of operations.
In addition, operating results are difficult to forecast because they generally depend on a number of factors, including the competition we face, and our ability to attract and retain members and enterprise partnerships, and macroeconomic risks, while generating sustained revenues through the Financial Services Productivity Loop. Additionally, our business may be affected by reductions in consumer borrowing, spending and investing, consumer deposits or investment by technology platform clients from time to time as a result of a number of factors, including the state of the overall economy, which may be difficult to predict. This may result in decreased revenue levels, and we may be unable to adopt measures in a timely manner to compensate for any unexpected shortfall in income. This inability could cause our operating results in a given quarter to be higher or lower than expected. These factors make creating accurate forecasts and budgets challenging and, as a result, we may fall materially short of our forecasts and expectations, which could cause our stock price to decline and investors to lose confidence in us.
We may fail to meet our publicly announced guidance or other expectations about our business and future operating results, which could cause our stock price to decline.
From time to time, weWe typically release earnings guidance in our quarterly and annual earnings conference calls, quarterly and annual earnings releases, orand may, from time to time, announce guidance otherwise, regarding our future performance that represents our management’s estimates as of the
date of release. On October 30, 2023, we provided guidance for the full year 2023. This guidance includes forward-looking statements based on projections prepared by our management. Projections are based upon a number of assumptions and estimates that are based on information known when they are issued, and, while presented with numerical specificity, are inherently subject to significant business, economic and competitive uncertainties and contingencies relating to our business, many of which are beyond our control and are based upon specific assumptions with respect to future business decisions, some of which will change.
Guidance is necessarily speculative in nature, and some or all of the assumptions underlying the guidance furnished by us may not materialize or may vary significantly from actual outcomes. Accordingly, our guidance is only an estimate of what management believes is realizable as of the date of release. Actual results may vary from our guidance and the variations may be material. In light of the foregoing, investors are urged not to rely upon our guidance in making an investment decision regarding our common stock.
Information Technology and Data Risks Cyberattacks and other security breaches could have an adverse effect on our business, harm our reputation and expose us to liability and adversely affect our ability to collect payments and maintain accurate accounts. Efforts to prevent and respond to these attacks and breaches are costly.
In the normal course of business, we collect, process and retain non-public and confidential information regarding our members, prospective members, technology platform clients and the customers of our technology platform clients. We also have arrangements in place with certain third-party service providers that require us to share consumer information.
It is possible that we mayWe likely will not be able to anticipate or prevent all security breaches even if we have implemented the required preventive measures, in which case there would be an increased risk of fraud or identity theft, and we have in the past and may in the future experience losses on, or delays in the collection of amounts owed. Although we devote significant resources and management focus to work to ensure the integrity of our systems through information/cybersecurity and business continuity programs, our facilities and systems, and those of third-party service providers, mighthave been and will likely continue to be targeted by external or internal threats, security breaches, acts of vandalism, including other intentional acts by employees or third-party service providers that we are unable to predict and protect against or that compromise our security systems, computer viruses, misplaced or lost data, programming or human errors, and other similar events. In addition, the digital nature of our platform may make it lucrative for hacking and potentially vulnerable to computer viruses, physical or electronic break-ins and similar disruptions.
We and third-party service providers have experienced such attempts in the past and expect to continue to experience them in the future. Security breaches could occur from outside our company, and also from the actions of persons inside our company who may have authorized or unauthorized access to our technology systems, despite the required investment in security controls. We also face security threats from malicious threat actors that could obtain unauthorized access to our systems and networks, which threats we anticipate will continue to grow in scope and complexity over time. In addition, security threats may increase as a result of geopolitical events, such as in connection with the war between Israel and Hamas, escalating conflict in the Middle East and the ongoing war in Ukraine.Ukraine, and the upcoming presidential election in the United States. These events could interrupt our business or operations, result in significant legal and financial exposure, supervisory liability, damage to our reputation and a loss of confidence in the security of our systems, products and services. Although the impact to date from these events has not had a material adverse effect on us, no assurance is given that this will continue to be the case in the future.
Cybersecurity risks in the financial services industry have increased, in part because of new technologies, the use of the Internet and telecommunications technologies (including mobile devices) to conduct financial and other business transactions and the increased sophistication and activities of organized criminals, perpetrators of fraud, hackers, terrorists and others. In addition to cyberattacks and other security breaches involving the theft of non-public and confidential information, hackers have engaged in attacks that are designed to disrupt key business services, such as consumer-facing websites. We may not be able to anticipate or implement effective preventive measures against all security breaches, especially because the techniques used change frequently and because attacks can originate from a wide variety of sources. We employ detection and response mechanisms designed to contain and mitigate security incidents, but there are no assurances that these mechanisms will be effective and early detection efforts may be thwarted by sophisticated attacks and malware designed to avoid detection.
Despite our investments in detection strategy and a 24/7/365 security operations center, we also may fail to detect the existence of a security breach related to the information of our members.
Cybersecurity risks have also subjected us to additional regulation. InFor example, in July 2023, the SEC adopted a final rule that will require registrants to disclose cybersecurity incidents that are determined to be material. In addition, in March 2023, the SEC proposed new cybersecurity risk management rules partsand amendments to address certain conflicts of whichinterest associated with the use of predictive data analytics by broker-dealers and investment advisers in investor interactions. If adopted, the proposed rules would require broker-dealers and investment advisers to evaluate and other securities industry participantsdetermine whether their use of certain technologies in investor interactions such as analytical, technological or computational functions, algorithms, models, correlation matrices or similar methods or processes that direct or optimize for investment related behavior, involves a conflict of interest that results in the broker-dealer or investment adviser’s interests being placed ahead of investors’ interests. To the extent we determined there were conflicts of interest, we would be required to adopt specificeliminate, or neutralize the effect of, any such conflicts. The proposed rules would also require us to have written policies and procedures reasonably designed to address certain cybersecurity risks and
notify certain customers when cyber incidents occur. The adopted rule, and if adopted,achieve compliance with the proposed rule, are expectedrules and to increase our compliance costsmake and require the creation of new policieskeep books and procedures. Despite our best efforts, if the SEC determines that our cybersecurity policies are inadequate, it could leadrecords related to adverse regulatory or enforcement actions.these requirements.
The access by unauthorized persons to, or the improper disclosure by us of, confidential information regarding our members, prospective members, technology platform clients and the customers of our technology platform clients, or our proprietary information, software, methodologies and business secrets could interrupt our business or operations, result in significant legal and financial exposure, supervisory liability, damage to our reputation or a loss of confidence in the security of our systems, products and services, all of which could have a material adverse impact on our business. Because each loan that we originate involves, in part, our proprietary automated underwriting process, any failure of our computer systems involving our automated underwriting process and any technical or other errors contained in the software pertaining to our automated underwriting process could compromise our ability to accurately evaluate potential members, which could negatively impact our results of operations. Furthermore, any failure of our computer systems could cause an interruption in operations and result in disruptions in, or reductions in the amount of, collections from the loans we make to our members. Additionally, if hackers were able to access our secure files, they might be able to gain access to the personal information of our members.members, prospective members, technology platform clients and the customers of our technology platform clients. If we are unable to prevent such activity, we may be subject to significant liability, negative publicity and a material loss of members or technology platform clients, all of which may negatively affect our business. In addition, there have in the past been a number of well-publicized attacks or breaches affecting companies in the financial services industry that have heightened concern by consumers, which could also intensify regulatory focus, cause users to lose trust in the security of the industry in general and result in reduced use of our services and increased costs, all of which could also have a material adverse effect on our business.
The collection, processing, use, storage, sharing and transmission of personal data could give rise to liabilities as a result of federal, state and international laws and regulations, as well as our failure to adhere to the privacy and data security practices that we articulate to our members.
We collect, process, store, use, share and/or transmit a large volume of personal information and other non-public data from current, past and prospective members. There are federal, state, and foreign laws regarding privacy, data security and the collection, use, storage, protection, sharing and/or transmission of personal information and non-public data. Additionally, many states continue to enact legislation on matters of privacy, information security, cybersecurity, data breach and data breach notification requirements. For example, as of January 1, 2020, the CCPA granted additional consumer rights with respect to data privacy in California. The CCPA was amended by a California ballot initiative, the California Privacy Rights Act (“CPRA”),CPRA, in November 2020. The CCPA amendments, including expanded rights for consumers and obligations for businesses, went into effect on January 1, 2023. The CCPA, among other things, entitles California residents to know how their personal information is being collected and shared, to access or request the deletion of their personal information and to opt out of the sharing of their personal information. The amended CCPA also created a new state agency, the California Privacy Protection Agency (“CPPA”),CPPA, and vested it with full administrative power, authority and jurisdiction to implement and enforce the CCPA. Generally, personal information that we process is subject to GLBA and thereby exempt from CCPA coverage. However, the CCPA regulates other personal information that we collect and process in connection with the business. While we have made modifications to our data collection and processing practices and policies to comply with the CCPA, and CPRA, we cannot predict their impact on our business, operations or financial condition. The effectsSimilar laws have been passed in numerous other states and a number of other states have proposed new privacy laws, some of which are similar to the CCPAabove-discussed recently passed laws. Such proposed legislation, if enacted, may add additional complexity, variation in requirements, restrictions and potential legal risk, require additional investment of resources in compliance programs, impact strategies and the CPRA are potentially significantavailability of previously useful data and could result in increased compliance costs and/or changes in business practices and policies. The existence of comprehensive privacy laws in different states in the country would make our compliance obligations more complex and costly and may require us to further modify our data collection or processing practices and policies and to incur substantial costs and expenses in an effort to comply and increase our potential exposure to regulatory enforcement and/or litigation. Additionally, our broker-dealer and investment adviser arethe likelihood that we may be subject to SEC Regulation S-P, which requires that these businesses maintain policies and procedures addressing the protection of customer information and records. This includes protecting against any anticipated threatsenforcement actions or hazards to the security or integrity of customer records and information and against unauthorized access to or use of customer records or information. Regulation S-P also requires theseotherwise incur liability for noncompliance. In addition, laws in all 50 U.S. states require businesses to provide initial and annual privacy noticesnotice to customers describing information sharing policies and informing customersindividuals if certain of their rights. The SEC proposed multiple rules related topersonal information has been disclosed as a result of a qualifying data breach. These various privacy and cybersecurity in March 2023. Proposed amendmentssecurity laws may impact our business activities, including our identification of research subjects, relationships
with business partners and ultimately the marketing and distribution of our products. State laws are changing rapidly and the U.S. Congress recently proposed a new comprehensive federal data privacy law to Regulation S-P would, among other things: (i) require covered institutions (including broker-dealers and investment advisers) to adopt written policies and procedures for an incident response program to address unauthorized access to or use of customer information; and (ii) require covered institutions to have written policies and procedures to provide timely notification to affected individuals whose sensitive customer information was or is reasonablywhich we may likely to have been accessed or used without authorization. The SEC also proposed amendments to existing Regulation SID and proposed new cybersecurity risk management rules, parts of which would require broker-dealers, investment advisers, and other securities industry participants to adopt specific policies and procedures designed to address certain cybersecurity risks and notify certain customers when cyber incidents occur.become subject, if enacted.
Outside the United States, an increasing number of laws, regulations, and industry standards apply to data privacy and security. For example, the European Union’s General Data Protection Regulation (EU GDPR), the United Kingdom’s GDPR (UK GDPR), various Latin American (LATAM) privacy laws such as Brazil’s Lei Geral de Proteção de Dados Pessoais
(LGPD) and Argentina’s Ley de Protección de los Datos Personales (PDPA) impose strict requirements for the processing of personal data of individuals located, respectively, within the European Economic Area (EEA), the United Kingdom (UK) and LATAM region. For example, under the EU GDPR, government regulators may impose temporary or definitive bans on data processing, as well as fines of up to 20 million Euros or 4% of the annual global revenue of the company, whichever is greater; or private litigation related to processing of personal data brought by classes of data subjects or consumer protection organizations authorized at law to represent their interests. Certain jurisdictions, such as the EU, Switzerland, the UK and LATAM have enacted cross-border personal data transfers laws regulating personal data flows to third countries. For example, absent appropriate safeguards or other circumstances, the EU GDPR generally restricts the transfer of personal data to countries outside of the EEA, such as the United States, which the European Commission does not consider to provide an adequate level of personal data protection. The European Commission released a set of “Standard Contractual Clauses” that are designed to be a valid mechanism by which entities can transfer personal data out of the EEA to jurisdictions that the European Commission has not found to provide an adequate level of protection. Currently, these Standard Contractual clauses are a valid mechanism to transfer personal data outside of the EEA. The Standard Contractual Clauses, however, require parties that rely upon that legal mechanism to comply with additional obligations such as conducting transfer impact assessments to determine whether additional security measures are necessary to protect the at-issue personal data. In addition, laws in Switzerland, the UK and LATAM similarly restrict personal data transfers outside of those jurisdictions to countries such as the United States of America that do not provide an adequate level of personal data protection. In addition to European restrictions on cross-border personal data transfers, other jurisdictions have enacted or are considering similar cross-border personal data transfer laws and local personal data residency laws, any of which could increase the cost and complexity of doing business. If we cannot implement a valid compliance mechanism for cross-border personal data transfers, we may face increased exposure to regulatory actions, substantial fines, and injunctions against processing or transferring personal data from Europe or elsewhere. Inability to import personal data to the United States may significantly and negatively impact our business operations, including by limiting our ability to collaborate with parties subject to European and other data protection laws or requiring us to increase our personal data processing capabilities in Europe and/or elsewhere at significant expense.
Any violations of these laws and regulations may require us to change our business practices or operational structure, including limiting our activities in certain states and/or jurisdictions, address legal claims, and sustain monetary penalties, reputational damage and/or other harms to our business. Further, in certain cases we rely on the data processing, privacy, data protection and cybersecurity practices of our third-party service providers, including with regard to maintaining the confidentiality, security and integrity of data. If we fail to manage our third-party service providers or their relevant practices, or if they fail to meet any requirements with regard to data processing, privacy, data protection or cybersecurity required by applicable legal or contractual obligations that we face (including any applicable requirements of our clients), we may be liable in certain cases. Legal obligations relating to privacy, cybersecurity and data protection may require us to manage our third-party service providers and their practices and to enter into agreements with them in certain cases. We may face difficulties in binding our third-party service providers to these agreements and otherwise managing their relevant practices, which may subject us to claims, proceedings, and liabilities.
Furthermore, our online privacy policy and website make certain statements regarding our privacy, information security, and data security practices with regard to information collected from our members. Failure to adhere to such practices may result in regulatory scrutiny and investigation (including the potential for fines and monetary penalties), complaints by affected members, reputational damage and other harm to our business. If either we, or the third-party service providers with which we share member data, are unable to address privacy concerns, even if unfounded, or to comply with applicable laws and regulations, it could result in additional costs and liability, damage our reputation, and harm our business.
Disruptions in the operation of our computer systems and third-party data centers and service providers could have an adverse effect on our business.
Our ability to deliver products and services to our members and clients, and otherwise operate our business and comply with applicable laws, depends on the efficient and uninterrupted operation of our computer systems and third-party data centers, as well as third-party service providers. Our computer systems and third-party providers may encounter service interruptions at any time due to system or software failure or errors, employee misconfiguration of resources or misdirected communications, natural disasters, severe weather conditions, health pandemics, terrorist attacks, cyberattacks or other events.
For example, in September 2023, the SoFi Invest platform experienced a service interruption that resulted in some of our members being unable to view certain of their account information and unable to buy and sell securities and other financial products on our platform for a period of time. Any such events, including persistent interruptions or perceptions of such interruptions whether true or not, in our products and services could cause members to believe that our products and services are unreliable, leading them to switch to our competitors or to otherwise avoid our products and services, and otherwise have a negative effect on our business and technology infrastructure (including our computer network systems), which could lead to member dissatisfaction or long-term disruption of our operations. Additionally, our insurance policies might be insufficient to
cover a claim made against us by any such members affected by any disruptions, outages, or other performance or infrastructure problems.
Additionally, our reliance on third-party providers may mean that we will not be able to resolve operational problems internally or on a timely basis, as our operations will depend upon such third-party service providers communicating appropriately and responding swiftly to their own service disruptions through industry standard best practices in business continuity and/or disaster recovery. As a last resort, we may rely on our ability to replace a third-party service provider if it experiences difficulties that interrupt operations for a prolonged period of time or if an essential third-party service terminates. If these service arrangements are terminated for any reason without an immediately available substitute arrangement, our operations may be severely interrupted or delayed. If such interruption or delay were to continue for a substantial period of time, our business, prospects, financial condition and results of operations could be adversely affected.
The implementation of technology changes and upgrades to maintain current and integration ofintegrate new systems may cause service interruptions, transaction processing errors or system conversion delays and may cause us to fail to comply with applicable laws, all of which could have a material adverse effect on our business. We have made and expect to continue to make substantial and increasing investments in “observability”, or the monitoring of our systems, but limitations or failures in those systems may exacerbate other problems by preventing us from anticipating or quickly detecting issues. In addition, our ability to monitor third party services and service providers is limited, and so our ability to anticipate, detect, and remediate anomalies in those services is also more limited when compared to our internal systems monitoring. In addition,
Although our current use of artificial intelligence and machine learning is limited, our systems and those of our partners are increasingly reliant on artificial intelligence machine learning systems, which are complex and may have errors or inadequacies that are not easily detectable. These systems may inadvertently reduce the efficiency of our systems, or may cause unintentional or unexpected outputs that are incorrect, do not match our business goals, do not comply with our policies, or otherwise are inconsistent with our brands, guiding principles and mission. Errors or breakdowns in our machine learning systems could also result in damage to our reputation, loss of members, loss of revenue or liability for damages, any of which could adversely affect our growth prospects and our business.
We expect that new technologies and business processes applicable to the financial services industry will continue to emerge and that these new technologies and business processes may be better than those we currently use. There is no assurance that we will be able to successfully adopt new technology as critical systems and applications become obsolete and better ones become available. A failure to maintain and/or improve current technology and business processes could cause disruptions in our operations or cause our solution to be less competitive, all of which could have a material adverse effect on our business.
Risks Related to Ownership of Our Securities The price of our common stock has fluctuated and may be volatile in the future.
The price of our common stock has fluctuated and may continue to fluctuate due to a variety of factors, including:
•changes in the industry in which we operate, including public perception of such industry;
•developments involving our competitors;
•changes in laws and regulations affecting our business, or changes in policies with respect to student loan forgiveness;
•changes in interest rates and inflation;
•variations in our operating performance and the performance of our competitors in general;
•actual or anticipated fluctuations in our quarterly or annual operating results;
•publication of research reports by securities analysts about us or our competitors or our industry;
•the public’s reaction to our press releases, our other public announcements and our filings with the SEC or any changes in our reputation;
•actions by stockholders;
•additions and departures of key personnel;
•commencement of, or involvement in, litigation or regulatory enforcement investigations involving our company;
•changes in our capital structure, such as future issuances of securities or the incurrence of additional debt, including in connection with acquisitions;
•any reverse stock split of our outstanding shares of common stock, which may increase the price of our common stock;
•volatility in capital markets and changes in the volume of shares of our common stock available for public sale; and
•general economic and political conditions, such as the effects of recessions, interest rates, inflation, consumer confidence and spending, public perception of the financial services industry, availability of loans and liquidity in the capital markets, local and national elections, corruption, political instability and acts of war or terrorism, including the war between Israel and Hamas, escalating conflict in the Middle East and the ongoing war in Ukraine.Ukraine, and the upcoming presidential election in the United States.
These market and industry factors, as well as others, may materially reduce the market price of our common stock regardless of our operating performance.
We do not intend to pay cash dividends on our common stock for the foreseeable future.
We currently intend to retain our future earnings, if any, to finance the further development and expansion of our business and do not intend to pay cash dividends on our common stock in the foreseeable future. Any future determination to pay dividends on our common stock will be at the discretion of our Board of Directors and will depend on obtaining regulatory approvals, if required, our financial condition, results of operations, capital requirements, restrictions contained in future agreements and financing instruments, business prospects and such other factors as our Board of Directors deems relevant.
If analysts publish inaccurate or unfavorable research, our stock price and trading volume could decline.
The trading market for our common stock depends in part on the research and reports that analysts publish about our business. We do not have any control over these analysts. If one or more of the analysts who cover us downgrade our common stock or publish inaccurate or unfavorable research about our business, as they have done in the past, the price of our common stock would likely decline. If few analysts cover us, demand for our common stock could decrease and our common stock price and trading volume may decline. Similar results may occur if one or more of these analysts stop covering us in the future or fail to publish reports on us regularly. In addition, analysts may establish and publish their own periodic projections for us. These projections may vary widely and may not accurately predict the results we actually achieve. Our share price may decline if our actual results do not match the projections of these research analysts. In addition, if the market for technology stocks or financial services stocks or the broader stock market experiences a loss of investor confidence, the trading price of our common stock could decline for reasons unrelated to our business, financial condition or results of operations.
We may be subject to securities litigation, which is expensive and could divert management attention.
The market price of our common stock may be volatile and, in the past, companies that have experienced volatility in the market price of their stock have been subject to securities class action litigation. We may be the target of this type of litigation in the future. Securities litigation against us could result in substantial costs and divert management’s attention from other business concerns, which could seriously harm our business.
Future resales of our common stock may cause the market price of our securities to drop significantly, even if our business is doing well.
Sales of a substantial number of shares of our common stock in the public market or the perception that these sales might occur, have in the past and could in the future depress the market price of our common stock and could impair our ability to raise capital through the sale of additional equity securities. Sales of a substantial number of shares, or the perception that such sales may occur, could have a material and adverse effect on the trading price of our common stock. For example, lock-up restrictions entered into in connection with the Business Combination have expired. As such, salesSales of a substantial number of shares of common stock in the public market could occur at any time. We have filed with the SEC, and the SEC has declared effective, a registration statement covering shares of our common stock issued in connection with the Agreement, including shares issued to the Third Party PIPE Investors, among others, to facilitate such sales and we have filed a registration statement on Form S-3 which allows us to sell securities from time to time. These sales, or the perception in the market that the
holders of a large number of shares intend to sell shares, could cause the market price of our common stock to decline or increase the volatility in the market price of our common stock.
Our warrants are exercisable for shares of common stock, which could increase the number of shares eligible for future resale in the public market and result in dilution to our stockholders.
In December 2021, we completed the redemption of outstanding warrants to purchase shares of the Company’s common stock that were issued under the Warrant Agreement, dated October 8, 2020. There are 12,170,990 Series H warrants issued in connection with the Series 1 and Series H preferred stock issuances in December 2019 that remain outstanding and were previously converted into SoFi Technologies common stock warrants.warrants that expire May 29, 2024. To the extent such warrants are exercised, additional shares of common stock will be issued, which will result in dilution to the holders of our common stock and increase
the number of shares eligible for resale in the public market. Sales of substantial numbers of such shares in the public market or the fact that such warrants may be exercised could adversely affect the market price of our common stock.
Our issuance of additional capital stock in connection with financings, acquisitions, investments, our stock incentive plans or otherwise will dilute all other stockholders.
Our issuance of additional capital stock in connection with financings, acquisitions, investments, our stock incentive plans or otherwise will dilute our stockholders. We expect to issue additional capital stock in the future that will result in dilution to all other stockholders. We expect to continue granting equity awards to employees, directors, and consultants under our stock incentive plans. We may also raise capital through equity financings in the future. As part of our business strategy, we may acquire or make investments in complementary companies, products, or technologies and issue equity securities to pay for any such acquisition or investment. Any such issuances of additional capital stock may cause stockholders to experience significant dilution of their ownership interests and the per share value of our common stock to decline.
There can be no assurance that we will be able to comply with the continued listing standards of Nasdaq.
If Nasdaq delists our shares of common stock from trading on its exchange for failure to meet Nasdaq’s listing standards, we and our stockholders could face significant material adverse consequences, including:
•a limited availability of market quotations for our securities;
•reduced liquidity for our securities;
•a determination that our common stock is a “penny stock,” which will require brokers trading in our common stock to adhere to more stringent rules and possibly result in a reduced level of trading activity in the secondary trading market for our securities;
•a limited amount of news and analyst coverage; and
•a decreased ability to issue additional securities or obtain additional financing in the future.
Delaware law and our organizational documents contain certain provisions, including anti-takeover provisions that limit the ability of stockholders to take certain actions and could delay or discourage takeover attempts that stockholders may consider favorable.
The General Corporation Law of the State of Delaware (the “DGCL”) and our organizational documents contain provisions that could have the effect of rendering more difficult, delaying, or preventing an acquisition that stockholders may consider favorable, including transactions in which stockholders might otherwise receive a premium for their shares. These provisions could also limit the price that investors might be willing to pay in the future for shares of our common stock, and therefore depress the trading price of our common stock. Additionally, these provisions could also make it difficult for stockholders to take certain actions, including electing directors who are not nominated by the current members of our Board of Directors or taking other corporate actions, including effecting changes in our management. Among other things, our organizational documents include provisions regarding:
•the ability of our Board of Directors to issue shares of preferred stock, including “blank check” preferred stock and to determine the price and other terms of those shares, including preferences and voting rights, without stockholder approval, which could be used to significantly dilute the ownership of a hostile acquirer;
•the prohibition of cumulative voting in the election of directors, which limits the ability of minority stockholders to elect director candidates;
•limitations on the liability of our directors, and the indemnification of our directors and officers;
•the ability of our Board of Directors to amend our bylaws, which may allow our Board of Directors to take additional actions to prevent an unsolicited takeover and inhibit the ability of an acquirer to amend our bylaws to facilitate an unsolicited takeover attempt; and
•advance notice procedures with which stockholders must comply to nominate candidates to our Board of Directors or to propose matters to be acted upon at a stockholders’ meeting, which could preclude stockholders from bringing matters before annual or special meetings of stockholders and delay changes in our Board of Directors and also may discourage or deter a potential acquirer from conducting a solicitation of proxies to elect the acquirer’s own slate of directors or otherwise attempting to obtain control of our company.
These provisions, alone or together, could delay or prevent hostile takeovers and changes in control or changes in the Board of Directors or management of our company.
The provisions of our bylaws requiring exclusive forum in the Court of Chancery of the State of Delaware and the federal district courts of the United States for certain types of lawsuits may have the effect of discouraging certain lawsuits, including derivative lawsuits and lawsuits against our directors and officers, by limiting plaintiffs’ ability to bring a claim in a judicial forum that they find favorable.
Our bylaws provide that, to the fullest extent permitted by law, and unless we consent in writing to the selection of an alternative forum, the Court of Chancery of the State of Delaware (or, in the event that such court does not have jurisdiction, the federal district court for the District of Delaware or other state courts of the State of Delaware) will be the sole and exclusive forum for any state law claims for (i) any derivative action or proceeding brought on our behalf, (ii) any action asserting a claim for or based on a breach of a fiduciary duty owed by any of our current or former directors, officers or other employees to us or our stockholders, (iii) any action asserting a claim against us or any of our current or former directors, officers or other employees arising pursuant to any provision of the DGCL or our bylaws or Certificate of Incorporation (as either may be amended from time to time), (iv) any action asserting a claim related to or involving our company that is governed by the internal affairs doctrine, and (v) any action asserting an “internal corporate claim” as that term is defined in Section 115 of the DGCL (the “Delaware Forum Provision”). The Delaware Forum Provision, however, does not apply to actions or claims arising under the Exchange Act. Our bylaws also provide that, unless we consent in writing to the selection of an alternate forum, the sole and exclusive forum for the resolution of any complaint asserting a cause of action arising under the Securities Act of 1933, as amended, and the rules and regulations promulgated thereunder, will be the United States Federal District Courts.Courts (the “Federal Forum Provision”). Section 27 of the Exchange Act creates exclusive federal jurisdiction over all suits brought to enforce any duty or liability created by the Exchange Act or the rules and regulations thereunder; our stockholders cannot and will not be deemed to have waived compliance with the U.S. federal securities laws and the rules and regulations thereunder.
These provisionsThe Delaware Forum Provision and the Federal Forum Provision in our bylaws may have the effect of discouraging certain lawsuits, including derivative lawsuitsimpose additional litigation costs on stockholders in pursuing any such claims and lawsuits againstmay also impose additional litigation costs on stockholders who assert that either such provision is not enforceable or invalid. Additionally, these forum selection clauses may limit our directors and officers, by limiting plaintiffs’stockholders’ ability to bring a claim in a judicial forum that they find favorable. The enforceabilityfavorable for disputes with us or our directors, officers or employees, which may discourage the filing of similar choicelawsuits against us and our directors, officers and employees, even though an action, if successful, might benefit our stockholders. In addition, while the Delaware Supreme Court and other states courts have upheld the validity of federal forum selection provisions purporting to require claims under the Securities Act be brought in federal court, there is still some uncertainty as to whether other companies’ certificates of incorporation or bylaws has been challenged in legal proceedings, and itcourts will enforce our Federal Forum Provision. If the Federal Forum Provision is possible that, in connection with any applicable action brought against our company, a court could find the choice of forum provisions contained in the Bylawsfound to be inapplicableunenforceable, we may incur additional costs associated with resolving such matters. The Court of Chancery of the State of Delaware and the federal district courts of the United States may reach different judgments or unenforceable inresults than would other courts, including courts where a stockholder considering an action may be located or would otherwise choose to bring the action, and such action.judgments may be more or less favorable to us than our stockholders.
Item 2. Unregistered Sales of Equity Securities and Use of Proceeds
None.
Item 3. Defaults Upon Senior Securities
None.
Item 4. Mine Safety Disclosures
Not applicable.
Item 5. Other Information
On September 15, 2023, Jeremy Rishel, our Chief Technology Officer, adopted a trading arrangement during an open trading window for the sale of the Company’s common stock (a “Rule 10b5-1 Trading Plan”) that is intended to satisfy the affirmative defense conditions of Securities Exchange Act Rule 10b5-1(c). Mr. Rishel’s Rule 10b5-1 Trading Plan, which has a term ending on August 30, 2024, provides for the sale of up to 168,819 shares of common stock pursuant to one or more market or limit orders. During the three months ended September 30, 2023, no other Company directorMarch 31, 2024, none of the Company’s directors or officerofficers (as defined in Rule 16a-1(f) of the Securities and Exchange Act of 1934) adopted, terminated or modified a Rule 10b5-1 trading arrangement or non-Rule 10b5-1 trading arrangement (as such terms are defined in Item 408 of Regulation S-K).
On May 3, 2024, the Board of Directors adopted a form of Performance Stock Unit Award Agreement for the grant of PSU awards under the 2021 Plan (“PSU Awards”) to the Company’s executive officers. Recipients of the PSU Awards may earn between 0% and 150% of the target number of PSUs subject to the achievement of certain pre-established tangible book value performance targets measured over a three-year performance period (the “Measurement Period”), subject to a modifier based on our total stockholder return (“TSR”) compared to the Nasdaq Composite Index also measured over the Measurement Period, which will increase or decrease the number of PSUs that vest by 25% (capped at 187.5% of the target number of PSUs subject to the award). Further, if our TSR over the Measurement Period is negative, the TSR modifier is capped at target (even if our TSR exceeds the 50th percentile of the pre-selected index). In the event of actual performance between the threshold and target, and target and maximum, performance levels, the percentage of PSUs that vest will be calculated between each designated segment using linear interpolation. Further, if the Company’s total risk weighted capital ratio falls below 10.5% at any point during the Measurement Period, 100% of the PSUs will immediately be forfeited in their entirety. The PSU Awards are all otherwise subject to the terms and conditions of the 2021 Plan and the form of Performance Stock Unit Award Agreement, a copy of which is filed as Exhibit 10.3 to this Form 10-Q and incorporated herein by reference.
Item 6. Exhibits
| | | | | | | | | | | | |
Exhibit No. | | Description | | | | |
| | | | | | |
| | | | | | |
| | | | | | |
| | | | | | |
| | | | | | |
101.INS | | Inline XBRL Instance Document - the instance document does not appear in the interactive data file because its XBRL tags are embedded within the Inline XBRL document | | | | |
101.SCH+ | | Inline XBRL Taxonomy Extension Schema Document | | | | |
101.CAL+ | | Inline XBRL Taxonomy Extension Calculation Linkbase Document | | | | |
101.LAB+ | | Inline XBRL Taxonomy Extension Label Linkbase Document | | | | |
101.PRE+ | | Inline XBRL Taxonomy Extension Presentation Linkbase Document | | | | |
101.DEF+ | | Inline XBRL Taxonomy Extension Definition Linkbase Document | | | | |
104 | | Cover Page Interactive Data File (formatted as inline XBRL and contained in Exhibit 101) | | | | |
| | | | | | | | | | | | | | | | | | | | |
| Exhibit No. | | Description | Form | File Number | Date of Filing | Exhibit Number Reference |
| | | | | | |
| | | 8-K | 001-39606 | March 8, 2024 | 4.1 |
| | | 8-K | 001-39606 | March 8, 2024 | 4.2 |
| | | 8-K | 001-39606 | March 8, 2024 | 10.1 |
| | | 8-K | 001-39606 | March 8, 2024 | 10.2 |
| | | | | | |
| | | | | | |
| | | | | | |
| | | | | | |
| | | | | | |
| 101.INS | | Inline XBRL Instance Document - the instance document does not appear in the interactive data file because its XBRL tags are embedded within the Inline XBRL document | | | | |
| 101.SCH* | | Inline XBRL Taxonomy Extension Schema Document | | | | |
| 101.CAL* | | Inline XBRL Taxonomy Extension Calculation Linkbase Document | | | | |
| 101.LAB* | | Inline XBRL Taxonomy Extension Label Linkbase Document | | | | |
| 101.PRE* | | Inline XBRL Taxonomy Extension Presentation Linkbase Document | | | | |
| 101.DEF* | | Inline XBRL Taxonomy Extension Definition Linkbase Document | | | | |
| 104 | | Cover Page Interactive Data File (formatted as inline XBRL and contained in Exhibit 101) | | | | |
___________________
+* Filed herewith.
*+ Indicates a document being furnished with this Form 10-Q. Information furnished herewith shall not be deemed to be “filed” for the purposes of Section 18 of the Securities Exchange Act of 1934 or otherwise subject to the liabilities of that Section. Such exhibit shall not be deemed incorporated by reference into any filing under the Securities Act of 1933 or the Securities Exchange Act of 1934.
SIGNATURE
Pursuant to the requirements of the Securities Exchange Act of 1934, as amended, the registrant has duly caused this report to be signed on its behalf by the undersigned thereunto duly authorized.
| | | | | | | | | | | |
| | SoFi Technologies, Inc. |
| | (Registrant) |
| | | |
| Date: | November 8, 2023May 7, 2024 | By: | /s/ Christopher Lapointe |
| | | Christopher Lapointe |
| | | Chief Financial Officer |