UNITED STATES
SECURITIES AND EXCHANGE COMMISSION
Washington, D.C. 20549
FORM 10-Q
| | | | | |
| ☒ | QUARTERLY REPORT PURSUANT TO SECTION 13 OR 15(d) OF THE SECURITIES EXCHANGE ACT OF 1934 |
For the quarterly period ended March 31, 20212022
OR
| | | | | |
| ☐ | TRANSITION REPORT PURSUANT TO SECTION 13 OR 15(d) OF THE SECURITIES EXCHANGE ACT OF 1934 |
Commission file number 001-39725
Maravai LifeSciences Holdings, Inc.
(Exact name of registrant as specified in its charter)
| | | | | | | | | | | | | | |
| Delaware | | 8731 | | 85-2786970 |
| (State or other jurisdiction of incorporation or organization) | | (Primary Standard Industrial
Classification Code Number) | | (I.R.S. Employer Identification No.) |
| | | | |
10770 Wateridge Circle, Suite 200 San Diego, California | | | | 92121 |
| (Address of principal executive offices) | | | | (Zip code) |
10770 Wateridge Circle Suite 200
San Diego, California 92121
(Address of principal executive offices)
Registrant’s telephone number, including area code: (858) 546-0004
Securities registered pursuant to Section 12(b) of the Act:
| | | | | | | | | | | | | | |
| Title of each class | | Trading Symbol(s) | | Name of each exchange on which registered |
| Class A common stock, $0.01 par value | | MRVI | | The Nasdaq Stock Market LLC |
Securities registered pursuant to section 12(g) of the Act: None
Indicate by check mark whether the registrant: (1) has filed all reports required to be filed by Section 13 or 15(d) of the Securities Exchange Act of 1934 during the preceding 12 months (or for such shorter period that the registrant was required to file such reports); and (2) has been subject to such filing requirements for the past 90 days. Yes x No o
Indicate by check mark whether the registrant has submitted electronically every Interactive Data File required to be submitted pursuant to Rule 405 of Regulation S-T (§232.405 of this chapter) during the preceding 12 months (or for such shorter period that the registrant was required to submit such files). Yes ☒ No ☐
Indicate by check mark whether the registrant is a large accelerated filer, an accelerated filer, a non-accelerated filer, a smaller reporting company, or an emerging growth company. See the definitions of “large accelerated filer,” “accelerated filer” and “smaller reporting company” in Rule 12b-2 of the Exchange Act. (Check one):
| | | | | | | | | | | |
| Large accelerated filer | oý | Accelerated filer | o |
| Non-accelerated filer | ýo | Smaller reporting company | o |
| | Emerging growth company | ýo |
If an emerging growth company, indicate by check mark if the registrant has elected not to use the extended transition period for complying with any new or revised financial accounting standards provided pursuant to Section 13(a) of the Exchange Act. o
Indicate by check mark whether the registrant is a shell company (as defined in Rule 12b-2 of the Act). Yes ☐ No x
As of May 7, 2021, 114,351,371April 29, 2022, 131,538,212 shares of the registrant’s Class A common stock were outstanding and 143,308,170123,669,196 shares of the registrant’s Class B common stock were outstanding.
TABLE OF CONTENTS
SPECIAL NOTE REGARDING FORWARD LOOKING STATEMENTFORWARD-LOOKING STATEMENTS
This Quarterly Report on Form 10-Q contains “forward-looking statements” within the meaning of the U.S. Private Securities Litigation Reform Act of 1995 that are subject to risks and uncertainties.1995. All statements other than statements of historical fact included in this report, including, without limitation, statements under the section “Management’s Discussion and Analysis of Financial Condition and Results of Operations,” are forward-looking statements. Forward-looking statements give our current expectations and projections relating to our financial condition, results of operations, plans, objectives, future performance and business. You can identify forward-looking statements by the fact that they do not relate strictly to historical or current facts. These statements often may include words such as “anticipate,” “estimate,” “expect,” “project,” “plan,” “intend,” “believe,” “may,” “will,” “should,” “can have,” “likely” and other words and terms of similar meaning in connection with any discussionmeaning. These statements are based upon management’s current expectations, assumptions and estimates and are not guarantees of the timing or nature of our future operating or financial performance or other events. All forward-looking statements are subject to risks, uncertainties and uncertaintiesother factors that may cause our actual results to differ materially from those that we expected, including:
•our history of losses, the risk that we may continue to incur losses in the future and our ability to generate sufficient revenue to achieve or maintain profitability;
•the fluctuation of our operating results, which makes our future operating results difficult to predict and could cause our operating results to fall below expectations or any guidance we may provide;
•our dependence on a limited number of customers for a high percentage of our revenue;
•the use of certainCertain of our products are used by customers in the production of vaccines and therapies, thatsome of which represent relatively new and still-developing modes of treatment, which may experience unforeseentreatment. Unforeseen adverse events, negative clinical outcomes, development of alternative therapies, or increased regulatory scrutiny;scrutiny of these and their financial cost may damage public perception of the safety, utility, or efficacy of these vaccines and therapies or other modes of treatment and may harm our customers’ ability to conduct their business. Such events may negatively impact our revenue and have an adverse effect on our performance.
•the impact of COVID-19 and any pandemic, epidemic or outbreak of infectious disease;
•changes in economic conditions;
•We are dependent on our dependence on customers’ spending on and demand for outsourced nucleic acid production and biologics safety testing and protein detection research products and services;services. A reduction in spending or demand could have a material adverse effect on our business, financial condition, results of operations, cash flows and prospects.
•competitionWe compete with life science, pharmaceutical and biotechnology companies who are substantially larger than we are and potentially capable of developing new approaches that could make our products, services and technologies obsolete;technology obsolete.
•the ability ofIf our products and services todo not perform as expected andor the reliability of the technology on which our products and services are based;
•the complexitybased is questioned, we could experience lost revenue, delayed or reduced market acceptance of our products and the fact that theyservices, increased costs and damage to our reputation.
•Our products are highly complex and are subject to quality control requirements;requirements.
•Our success depends on the market acceptance of our reliancelife science reagents. Our reagents may not achieve or maintain significant commercial market acceptance.
•Until the 2020 fiscal year, we had incurred losses for each fiscal year since inception, we may incur losses in the future and we may not be able to generate sufficient revenue to maintain profitability.
•Our operating results may fluctuate significantly in the future, which makes our future operating results difficult to predict and could cause our operating results to fall below expectations or any guidance we may provide.
•Product liability lawsuits against us could cause us to incur substantial liabilities, limit sales of our existing products and limit commercialization of any products that we may develop.
•Our acquisitions expose us to risks that could adversely affect our business, and we may not achieve the anticipated benefits of acquisitions of businesses or technologies.
•We depend on a limited number of customers for a high percentage of our revenue. If we cannot maintain our current relationships with customers, fail to sustain recurring sources of revenue with our existing customers, or if we fail to enter into new relationships, our future operating results will be adversely affected.
•We rely on a limited number of suppliers or, in some cases, sole suppliers, for some of our raw materials and our inabilitymay not be able to find replacements or immediately transition to alternative suppliers;suppliers.
•Our products could become subject to more onerous regulation by the FDA or other regulatory agencies in the future, which could increase our dependence on a stablecosts and adequate supplydelay or prevent commercialization of quality raw materials from our suppliers,products, thereby materially and the riskadversely affecting our business, financial condition, results of adverse impacts from price increases or interruptions of such supply;operations, cash flows and prospects.
•disruptions atIf we are unable to obtain, maintain and enforce intellectual property protection for our sites;
•current or future products, or if the scope of our intellectual property protection is not sufficiently broad, our ability to manufacture in specific quantities;
•natural disasters, geopolitical unrest, war, terrorism, public health issues such as COVID-19 or other catastrophic events that could disrupt the supply, delivery or demand ofcommercialize our products successfully and services;
•our ability to secure additional financing for future strategic transactions;
•our reliance on third-party package delivery services and adverse impacts arising from significant disruptions of these services, damages or losses sustained during shipping or significant increases in prices;
•our ability to continue to hire and retain skilled personnel;
•our ability to successfully identify and implement distribution arrangements and marketing alliances;
•the market acceptance of our life science reagents;
•the market receptivity to our new products and services upon their introduction;
•our ability to implement our strategies for revenue growth;
•the accuracy of our estimates of market opportunity and forecasts of market growth;compete effectively may be materially adversely affected.
•product liability lawsuits;
•the application of privacy laws, security laws, regulations, policies and contractual obligations related to data privacy and security;
•our ability to efficiently manage our growth;
•the success of any opportunistic acquisitions;
•the integrity of our internal computer systems;
•the impact of export and import control laws and regulations;
•risks related to Brexit;
•changes in political, economic or governmental regulations;
•financial, operating, legal and compliance risks associated with global operations;
•risks associated with our acquisitions;
•impacts from foreign currency exchange rates;
•the risk that our products could become subject to more onerous regulation in the future;
•our ability to use net operating loss and tax credit carryforwards;
•the fact that our activities are and will continue to be subject to extensive government regulation;
•the risk thatIf we may be required to record a significant charge to earnings if our goodwill or other amortizable intangible assets become impaired;
•unfavorable accounting charges or effects driven by changes in accounting principles or guidance;
•impacts on our financial results from our revenue recognition and other factors;
•fluctuations in our effective tax rate;
•environmental risks;
•our ability to obtain, maintain and enforce intellectual property protection for our current and future products;
•our ability to protect the confidentiality of our proprietary information;
•risks associated with lawsuits to protect our patents or with respect to the infringement, misappropriations or other violations of intellectual property rights of third parties;
•risks associated with failuresfail to comply with our obligations under any license agreements;agreements, disagree over contract interpretation, or otherwise experience disruptions to our business relationships with our licensors, we could lose intellectual property rights that are necessary to our business.
•potential changes in patent law in the United StatesOur existing indebtedness could adversely affect our business and other jurisdictions;growth prospects.
•Our principal asset is our interest in Maravai Topco Holdings, LLC (“Topco LLC”), and, accordingly, we depend on distributions from Topco LLC to pay our taxes and expenses, including payments under a tax receivable agreement with the former owners of Topco LLC (the “Tax Receivable Agreement” or “TRA”). Topco LLC’s ability to obtainmake such distributions may be subject to various limitations and maintain our patent protection; restrictions.
•impactConflicts of claims by third partiesinterest could arise between our shareholders and Maravai Life Sciences Holdings, LLC (“MLSH 1”), the only other member of Topco LLC, which may impede business decisions that we orcould benefit our employees, consultants or independent contractors have infringed, misappropriated or otherwise violated their intellectual property;shareholders.
•The Tax Receivable Agreement requires us to make cash payments to MLSH 1 and Maravai Life Sciences Holdings 2, LLC (“MLSH 2”), an entity through which certain of our abilityformer owners hold their interests in the Company, in respect of certain tax benefits to protect our intellectual propertywhich we may become entitled, and proprietary rights throughoutwe expect that the world;payments we will be required to make will be substantial.
•our reliance on confidentiality agreements;Our organizational structure, including the Tax Receivable Agreement, confers certain benefits upon MLSH 1 and MLSH 2 that will not benefit the other common shareholders to the same extent as they will benefit MLSH 1 and MLSH 2.
•our ability to protect our trademarksGTCR, LLC (“GTCR”) controls us, and trade names;its interests may conflict with ours or yours in the future.
•threats not relatedProvisions of our corporate governance documents could make an acquisition of us more difficult and may prevent attempts by our shareholders to intellectual property; and
•other risks addressed inreplace or remove our Annual Report on Form 10-K for the year ended December 31, 2020.current management, even if beneficial to our shareholders.
We derive many of our forward-looking statements from our operating budgets and forecasts, which are based on many detailed assumptions. While we believe that our assumptions are reasonable, we caution that it is very difficult to predict the impact of known factors, and it is impossible for us to anticipate all factors that could affect our actual results. Important factors that could cause our actual results to differ materially from our expectations, or cautionary statements, are disclosed under the sectionsections entitled
“Management’s “Risk Factors” and “Management’s Discussion and Analysis of Financial Condition and Results of Operations” in our Annual Report on Form 10-K for the year ended December 31, 2021 and in this Quarterly Report on Form 10-Q.
The forward-looking statements included in this report are made only as of the date hereof. We undertake no obligation to update or revise any forward-looking statement as a result of new information, future events or otherwise, except as otherwise required by law.
Part I.
Item 1. Financial Statements and Supplementary Data
MARAVAI LIFESCIENCES HOLDINGS, INC.
CONDENSED CONSOLIDATED BALANCE SHEETS
(in thousands, except share amounts and par value)
(Unaudited)
| | | March 31, 2021 | | December 31, 2020 | | | March 31, 2022 | | December 31, 2021 |
| Assets | Assets | | | | | Assets | | | |
| Current assets: | Current assets: | | | Current assets: | |
| Cash | Cash | $ | 247,675 | | | $ | 236,184 | | | Cash | $ | 431,469 | | | $ | 551,272 | |
| Accounts receivable, net | Accounts receivable, net | 121,821 | | | 51,018 | | | Accounts receivable, net | 120,355 | | | 117,512 | |
| Inventory | Inventory | 47,129 | | | 33,301 | | | Inventory | 51,409 | | | 51,557 | |
| Prepaid expenses and other current assets | Prepaid expenses and other current assets | 8,918 | | | 11,095 | | | Prepaid expenses and other current assets | 15,902 | | | 19,698 | |
| | Total current assets | Total current assets | 425,543 | | | 331,598 | | | Total current assets | 619,135 | | | 740,039 | |
| Property and equipment, net | Property and equipment, net | 105,133 | | | 101,305 | | | Property and equipment, net | 47,702 | | | 46,332 | |
| Goodwill | Goodwill | 224,275 | | | 224,275 | | | Goodwill | 283,535 | | | 152,766 | |
| Intangible assets, net | Intangible assets, net | 172,616 | | | 177,656 | | | Intangible assets, net | 235,405 | | | 117,571 | |
| Deferred tax assets | Deferred tax assets | 419,901 | | | 431,699 | | | Deferred tax assets | 793,210 | | | 808,117 | |
| Other assets | Other assets | 4,300 | | | 4,158 | | | Other assets | 64,243 | | | 53,451 | |
| Total assets | Total assets | $ | 1,351,768 | | | $ | 1,270,691 | | | Total assets | $ | 2,043,230 | | | $ | 1,918,276 | |
| Liabilities and stockholders' equity | Liabilities and stockholders' equity | | | | | Liabilities and stockholders' equity | | | |
| Current liabilities: | Current liabilities: | | | Current liabilities: | |
| Accounts payable | Accounts payable | $ | 9,806 | | | $ | 8,171 | | | Accounts payable | $ | 10,384 | | | $ | 8,154 | |
| Accrued expenses and other current liabilities | Accrued expenses and other current liabilities | 28,973 | | | 38,546 | | | Accrued expenses and other current liabilities | 32,411 | | | 34,574 | |
| Deferred revenue | Deferred revenue | 119,175 | | | 78,061 | | | Deferred revenue | 3,693 | | | 10,211 | |
| Current portion of payable to related parties pursuant to Tax Receivable Agreement | 1,298 | | | 0 | | | |
| Current portion of payable to related parties pursuant to a Tax Receivable Agreement | | Current portion of payable to related parties pursuant to a Tax Receivable Agreement | 34,747 | | | 34,838 | |
| Current portion of long-term debt | Current portion of long-term debt | 6,000 | | | 6,000 | | | Current portion of long-term debt | 5,440 | | | 6,000 | |
| | Total current liabilities | Total current liabilities | 165,252 | | | 130,778 | | | Total current liabilities | 86,675 | | | 93,777 | |
| Long-term debt, less current portion | Long-term debt, less current portion | 527,593 | | | 528,614 | | | Long-term debt, less current portion | 524,499 | | | 524,591 | |
| Deferred tax liabilities | 8,571 | | | 8,609 | | | |
| Lease facility financing obligation, less current portion | 55,924 | | | 56,167 | | | |
| Payable to related parties pursuant to a Tax Receivable Agreement | 382,362 | | | 389,546 | | | |
| | Payable to related parties pursuant to a Tax Receivable Agreement, less current portion | | Payable to related parties pursuant to a Tax Receivable Agreement, less current portion | 711,232 | | | 713,481 | |
| Other long-term liabilities | Other long-term liabilities | 2,310 | | | 2,231 | | | Other long-term liabilities | 66,522 | | | 41,066 | |
| Total liabilities | Total liabilities | 1,142,012 | | | 1,115,945 | | | Total liabilities | 1,388,928 | | | 1,372,915 | |
| Lease commitments (Note 5) | 0 | | 0 | | |
| Stockholders' equity | | | |
| Class A common stock, $0.01 par value - 500,000,000 shares authorized; 96,646,515 shares issued and outstanding as of March 31, 2021 and December 31, 2020 | 966 | | | 966 | | | |
| Class B common stock, $0.01 par value - 300,000,000 shares authorized; 160,974,129 shares issued and outstanding as of March 31, 2021 and December 31, 2020 | 1,610 | | | 1,610 | | | |
| | Stockholders' equity: | | Stockholders' equity: | | | |
| Class A common stock, $0.01 par value - 500,000 shares authorized; 131,490 and 131,488 shares issued and outstanding as of March 31, 2022 and December 31, 2021, respectively | | Class A common stock, $0.01 par value - 500,000 shares authorized; 131,490 and 131,488 shares issued and outstanding as of March 31, 2022 and December 31, 2021, respectively | 1,315 | | | 1,315 | |
| Class B common stock, $0.01 par value - 300,000 shares authorized; 123,669 shares issued and outstanding as of March 31, 2022 and December 31, 2021 | | Class B common stock, $0.01 par value - 300,000 shares authorized; 123,669 shares issued and outstanding as of March 31, 2022 and December 31, 2021 | 1,237 | | | 1,237 | |
| Additional paid-in capital | Additional paid-in capital | 85,976 | | | 85,125 | | | Additional paid-in capital | 128,584 | | | 128,386 | |
| Accumulated other comprehensive loss | (42) | | | (44) | | | |
| | Retained earnings | Retained earnings | 24,101 | | | 854 | | | Retained earnings | 251,423 | | | 184,561 | |
| Total stockholders' equity attributable to Maravai LifeSciences Holdings, Inc. | Total stockholders' equity attributable to Maravai LifeSciences Holdings, Inc. | 112,611 | | | 88,511 | | | Total stockholders' equity attributable to Maravai LifeSciences Holdings, Inc. | 382,559 | | | 315,499 | |
| Non-controlling interests | 97,145 | | | 66,235 | | | |
| Non-controlling interest | | Non-controlling interest | 271,743 | | | 229,862 | |
| Total stockholders' equity | Total stockholders' equity | 209,756 | | | 154,746 | | | Total stockholders' equity | 654,302 | | | 545,361 | |
| Total liabilities and stockholders' equity | Total liabilities and stockholders' equity | $ | 1,351,768 | | | $ | 1,270,691 | | | Total liabilities and stockholders' equity | $ | 2,043,230 | | | $ | 1,918,276 | |
The accompanying notes are an integral part of these condensed consolidated financial statements.
MARAVAI LIFESCIENCES HOLDINGS, INC.
CONDENSED CONSOLIDATED STATEMENTS OF INCOME
(in thousands, except per share amounts)
(Unaudited)
| | | | | | | | | | | | | | | |
| Three Months Ended
March 31, | | |
| 2022 | | 2021
(as adjusted)* | | | | |
| Revenue | $ | 244,293 | | | $ | 148,211 | | | | | |
| Operating expenses: | | | | | | | |
| Cost of revenue | 40,032 | | | 31,391 | | | | | |
| Selling, general and administrative | 33,200 | | | 23,471 | | | | | |
| Research and development | 3,695 | | | 2,160 | | | | | |
| | | | | | | |
| | | | | | | |
| | | | | | | |
| Total operating expenses | 76,927 | | | 57,022 | | | | | |
| Income from operations | 167,366 | | | 91,189 | | | | | |
| Other income (expense): | | | | | | | |
| Interest expense | (2,664) | | | (7,904) | | | | | |
| Loss on extinguishment of debt | (208) | | | — | | | | | |
| Change in payable to related parties pursuant to a Tax Receivable Agreement | 2,340 | | | 5,886 | | | | | |
| Other income | 7 | | | 3 | | | | | |
| Income before income taxes | 166,841 | | | 89,174 | | | | | |
| Income tax expense | 19,981 | | | 13,709 | | | | | |
| Net income | 146,860 | | | 75,465 | | | | | |
| Net income attributable to non-controlling interests | 79,998 | | | 52,363 | | | | | |
| Net income attributable to Maravai LifeSciences Holdings, Inc. | $ | 66,862 | | | $ | 23,102 | | | | | |
| | | | | | | |
| Net income per Class A common share attributable to Maravai LifeSciences Holdings, Inc.: | | | | | | | |
| Basic | $ | 0.51 | | | $ | 0.24 | | | | | |
| Diluted | $ | 0.50 | | | $ | 0.24 | | | | | |
| | | | | | | |
| Weighted average number of Class A common shares outstanding: | | | | | | | |
| Basic | 131,489 | | | 96,647 | | | | | |
| Diluted | 255,287 | | | 96,673 | | | | | |
____________________
*As adjusted to reflect the impact of the adoption of Accounting Standards Codification 842 (“ASC 842”). See Note 1 to the condensed consolidated financial statements for a summary of the adjustments.
The accompanying notes are an integral part of these condensed consolidated financial statements.
MARAVAI LIFESCIENCES HOLDINGS, INC.
CONDENSED CONSOLIDATED STATEMENTS OF COMPREHENSIVE INCOME
(in thousands, except share and unit amounts and per share and per unit amounts)thousands)
(Unaudited)
| | | | | | | | | | | |
| Three Months Ended March 31, |
| 2021 | | 2020 |
| | | |
| Revenue | $ | 148,211 | | | $ | 50,981 | |
| Operating expenses: | | | |
| Cost of revenue | 30,368 | | | 15,297 | |
| Research and development | 2,164 | | | 3,744 | |
| Selling, general and administrative | 23,237 | | | 16,126 | |
| | | |
| Gain on sale and leaseback transaction | 0 | | | (19,002) | |
| Total operating expenses | 55,769 | | | 16,165 | |
| Income from operations | 92,442 | | | 34,816 | |
| Other income (expense): | | | |
| Interest expense | (8,770) | | | (7,382) | |
| Change in payable to related parties pursuant to a Tax Receivable Agreement | 5,886 | | | 0 | |
| Other income | 3 | | | 80 | |
| Income before income taxes | 89,561 | | | 27,514 | |
| Income tax expense | 13,709 | | | 3,635 | |
| Net income | 75,852 | | | 23,879 | |
| Net income attributable to non-controlling interests | 52,605 | | | 490 | |
| Net income attributable to Maravai LifeSciences Holdings, Inc. | $ | 23,247 | | | $ | 23,389 | |
| | | |
| Net income per Class A common share/unit attributable to Maravai LifeSciences Holdings, Inc.: | | | |
| Basic | $ | 0.24 | | | $ | 0.09 | |
| Diluted | $ | 0.24 | | | $ | 0.09 | |
| | | |
| Weighted average number of Class A common shares/units outstanding: | | | |
| Basic | 96,646,515 | | | 253,916,941 | |
| Diluted | 96,672,968 | | | 253,916,941 | |
| | | | | | | | | | | | | | | |
| Three Months Ended
March 31, | | |
| 2022 | | 2021
(as adjusted)* | | | | |
| Net income | $ | 146,860 | | | $ | 75,465 | | | | | |
| Other comprehensive income: | | | | | | | |
| Foreign currency translation adjustments | — | | | 8 | | | | | |
| Total other comprehensive income | 146,860 | | | 75,473 | | | | | |
| Comprehensive income attributable to non-controlling interests | 79,998 | | | 52,369 | | | | | |
| Total comprehensive income attributable to Maravai LifeSciences Holdings, Inc. | $ | 66,862 | | | $ | 23,104 | | | | | |
____________________
The accompanying notes are an integral part of thesethe condensed consolidated financial statements.
MARAVAI LIFESCIENCES HOLDINGS, INC.
CONDENSED CONSOLIDATED STATEMENTS OF COMPREHENSIVE INCOMECHANGES IN STOCKHOLDERS’ EQUITY
(in thousands)
(Unaudited)
| | | | | | | | | | | |
| Three Months Ended March 31, |
| March 31, 2021 | | March 31, 2020 |
| Net income | $ | 75,852 | | | $ | 23,879 | |
| Other comprehensive income: | | | |
| Foreign currency translation adjustments | 8 | | | (71) | |
| Total other comprehensive income | 75,860 | | | 23,808 | |
| Comprehensive income attributable to non-controlling interests | 52,605 | | | 490 | |
| Total comprehensive income attributable to Maravai LifeSciences Holdings, Inc. | $ | 23,255 | | | $ | 23,318 | |
| | | | | | | | | | | | | | | | | | | | | | | | | | | | | | | | | | | | | | | | | | | | | | | | | |
| Three Months Ended March 31, 2022 |
| Class A Common Stock | | Class B Common Stock | | | | | | | | | | |
| Shares | | Amount | | Shares | | Amount | | Additional Paid-In Capital | | | | Retained Earnings | | Non-Controlling Interest | | Total Stockholders' Equity |
| December 31, 2021 | 131,488 | | $ | 1,315 | | | 123,669 | | $ | 1,237 | | | $ | 128,386 | | | | | $ | 184,561 | | | $ | 229,862 | | | $ | 545,361 | |
| | | | | | | | | | | | | | | | | |
| | | | | | | | | | | | | | | | | |
| Issuance of Class A common stock under employee equity plans, net of shares withheld for employee taxes | 2 | | | — | | | — | | | — | | | 34 | | | | | — | | | — | | | 34 | |
| Non-controlling interest adjustment for changes in proportionate ownership in Topco LLC | — | | | — | | | — | | | — | | | (14) | | | | | — | | | 14 | | | — | |
| Stock-based compensation | — | | | — | | | — | | | — | | | 1,869 | | | | | — | | | 1,758 | | | 3,627 | |
| Distribution for tax liabilities to non-controlling interest holder | — | | | — | | | — | | | — | | | — | | | | | — | | | (39,889) | | | (39,889) | |
| Impact of change to deferred tax asset associated with cash contribution to Topco | — | | | — | | | — | | | — | | | (1,691) | | | | | — | | | — | | | (1,691) | |
| Net income | — | | | — | | | — | | | — | | | — | | | | | 66,862 | | | 79,998 | | | 146,860 | |
| | | | | | | | | | | | | | | | | |
| March 31, 2022 | 131,490 | | $ | 1,315 | | | 123,669 | | $ | 1,237 | | | $ | 128,584 | | | | | $ | 251,423 | | | $ | 271,743 | | | $ | 654,302 | |
| | | | | | | | | | | | | | | | | | | | | | | | | | | | | | | | | | | | | | | | | | | | | | | | | | | | | |
| Three Months Ended March 31, 2021 |
| Class A Common Stock | | Class B Common Stock | | | | | | | | | | |
| Shares | | Amount | | Shares | | Amount | | Additional Paid-In Capital | | Accumulated Other Comprehensive Loss | | Retained Earnings | | Non-Controlling Interest | | Total Stockholders' Equity |
| December 31, 2020 | 96,647 | | $ | 966 | | | 160,974 | | $ | 1,610 | | | $ | 85,125 | | | $ | (44) | | | $ | 854 | | | $ | 66,235 | | | $ | 154,746 | |
| Cumulative effect of adoption of ASC 842, net of tax | — | | | — | | | — | | | — | | | — | | | — | | | 1,670 | | | 2,784 | | | 4,454 | |
| | | | | | | | | | | | | | | | | |
| | | | | | | | | | | | | | | | | |
| | | | | | | | | | | | | | | | | |
| | | | | | | | | | | | | | | | | |
| Stock-based compensation | — | | | — | | | — | | | — | | | 854 | | | — | | | — | | | 1,424 | | | 2,278 | |
| Distribution for tax liabilities to non-controlling interest holder | — | | | — | | | — | | | — | | | (3) | | | — | | | — | | | (23,125) | | | (23,128) | |
| Net income | — | | | — | | | — | | | — | | | — | | | — | | | 23,102 | | | 52,363 | | | 75,465 | |
| Foreign currency translation adjustment | — | | | — | | | — | | | — | | | — | | | 2 | | | — | | | 6 | | | 8 | |
March 31, 2021
(as adjusted)* | 96,647 | | $ | 966 | | | 160,974 | | $ | 1,610 | | | $ | 85,976 | | | $ | (42) | | | $ | 25,626 | | | $ | 99,687 | | | $ | 213,823 | |
____________________
*As adjusted to reflect the impact of the adoption of ASC 842. See Note 1 to the condensed consolidated financial statements for a summary of the adjustments.
The accompanying notes are an integral part of the condensed consolidated financial statementsstatements.
MARAVAI LIFESCIENCES HOLDINGS, INC.
CONDENSED CONSOLIDATED STATEMENTS OF CHANGES IN STOCKHOLDERS’/MEMBER’S EQUITY
(in thousands)
(Unaudited)
| | | | | | | | | | | | | | | | | | | | | | | | | | | | | | | | | | | | | | | | | | | | | | | | | | | | | |
| Class A Common Stock | | Class B Common Stock | | | | | | | | | | |
| Shares | | Amount | | Shares | | Amount | | Additional Paid In Capital | | Accumulated Other Comprehensive Loss | | Retained Earnings | | Non-Controlling Interest | | Total Stockholders'/Member's Equity |
| December 31, 2020 | 96,647 | | $ | 966 | | | 160,974 | | $ | 1,610 | | | $ | 85,125 | | | $ | (44) | | | $ | 854 | | | $ | 66,235 | | | $ | 154,746 | |
| Equity-based compensation | — | | | — | | | — | | | — | | | 854 | | | — | | | — | | | 1,424 | | | 2,278 | |
| Distribution for tax liabilities to non-controlling interest holder | — | | | — | | | — | | | — | | | (3) | | | — | | | — | | | (23,125) | | | (23,128) | |
| Net income | — | | — | | | — | | — | | | — | | — | | | 23,247 | | | 52,605 | | | 75,852 | |
| Foreign currency translation adjustment | — | | | — | | | — | | | — | | | — | | | 2 | | | — | | | 6 | | | 8 | |
| March 31, 2021 | 96,647 | | $ | 966 | | | 160,974 | | $ | 1,610 | | | $ | 85,976 | | | $ | (42) | | | $ | 24,101 | | | $ | 97,145 | | | $ | 209,756 | |
| | | | | | | | | | | | | | | | | | | | | | | | | | | | | | | | | | | | | | | | | |
| Units | | Amount | | Contributed Capital | | Accumulated Other Comprehensive Loss | | Accumulated Deficit | | Non-Controlling Interest | | Total Member's Equity |
| December 31, 2019 | 253,917 | | $0 | | $183,910 | | $ | (133) | | | $ | (42,381) | | | $ | 3,231 | | | $ | 144,627 | |
| Unit-based compensation | — | | — | | 420 | | — | | | — | | | 88 | | | 508 | |
| Net income | — | | — | | — | | — | | | 23,389 | | | 490 | | | 23,879 | |
| Foreign currency translation adjustment | — | | — | | — | | (71) | | | — | | | — | | | (71) | |
| March 31, 2020 | 253,917 | | $ | 0 | | | $ | 184,330 | | | $ | (204) | | | $ | (18,992) | | | $ | 3,809 | | | $ | 168,943 | |
The accompanying notes are an integral part of the condensed consolidated financial statements
MARAVAI LIFESCIENCES HOLDINGS, INC.
CONDENSED CONSOLIDATED STATEMENTS OF CASH FLOWS
(in thousands)
(Unaudited)
| | | Three Months Ended March 31, | | Three Months Ended
March 31, |
| | 2021 | | 2020 | | 2022 | | 2021
(as adjusted)* |
| Operating activities | | | | |
| Operating activities: | | Operating activities: | | | |
| Net income | Net income | $ | 75,852 | | | $ | 23,879 | | Net income | $ | 146,860 | | | $ | 75,465 | |
| Adjustments to reconcile net income to net cash provided by operating activities: | Adjustments to reconcile net income to net cash provided by operating activities: | | Adjustments to reconcile net income to net cash provided by operating activities: | |
| Depreciation | Depreciation | 1,854 | | | 1,691 | | Depreciation | 1,855 | | | 1,256 | |
| Amortization of intangible assets | Amortization of intangible assets | 5,040 | | | 5,075 | | Amortization of intangible assets | 5,527 | | | 5,041 | |
| Non-cash operating lease expense | | Non-cash operating lease expense | 1,874 | | | 2,378 | |
| Amortization of deferred financing costs | Amortization of deferred financing costs | 654 | | | 431 | | Amortization of deferred financing costs | 699 | | | 654 | |
| Equity-based compensation expense | Equity-based compensation expense | 2,278 | | | 508 | | Equity-based compensation expense | 3,627 | | | 2,278 | |
| Loss on extinguishment of debt | | Loss on extinguishment of debt | 208 | | | — | |
| Deferred income taxes | Deferred income taxes | 11,760 | | | (1,274) | | Deferred income taxes | 13,217 | | | 11,760 | |
| Gain on sale and leaseback transaction | 0 | | | (19,002) | | |
| Acquired and in-process research and development costs | 0 | | | 2,881 | | |
| Non-cash interest expense recognized on lease facility financing obligation | 162 | | | 215 | | |
| Revaluation of liabilities under Tax Receivable Agreement | (5,886) | | | 0 | | |
| | Revaluation of liabilities under the Tax Receivable Agreement | | Revaluation of liabilities under the Tax Receivable Agreement | (2,340) | | | (5,886) | |
| Other | Other | (144) | | | 38 | | Other | (985) | | | (300) | |
| Changes in operating assets and liabilities: | Changes in operating assets and liabilities: | | Changes in operating assets and liabilities: | |
| Accounts receivable | Accounts receivable | (70,812) | | | (10,086) | | Accounts receivable | (2,217) | | | (70,812) | |
| Inventory | Inventory | (13,828) | | | (5,365) | | Inventory | 1,201 | | | (13,808) | |
| Prepaid expenses and other assets | Prepaid expenses and other assets | 98 | | | 209 | | Prepaid expenses and other assets | 2,517 | | | (581) | |
| Accounts payable | Accounts payable | 1,897 | | | 3,402 | | Accounts payable | 1,950 | | | 1,896 | |
| Accrued expenses and other current liabilities | Accrued expenses and other current liabilities | (11,044) | | | 9,044 | | Accrued expenses and other current liabilities | (4,062) | | | (10,746) | |
| Deferred revenue | | Deferred revenue | (6,518) | | | 41,114 | |
| Other long-term liabilities | Other long-term liabilities | (280) | | | (1,925) | | Other long-term liabilities | (1,109) | | | (1,383) | |
| Deferred revenue | 41,114 | | | (8) | | |
| Net cash provided by operating activities | Net cash provided by operating activities | 38,715 | | | 9,713 | | Net cash provided by operating activities | 162,304 | | | 38,326 | |
| Investing activities | | | | |
| Cash paid for asset acquisition, net of cash acquired | 0 | | | (3,024) | | |
| Investing activities: | | Investing activities: | | | |
| Cash paid for acquisition of a business, net of cash acquired | | Cash paid for acquisition of a business, net of cash acquired | (238,836) | | | — | |
| | Purchases of property and equipment | Purchases of property and equipment | (3,580) | | | (3,409) | | Purchases of property and equipment | (2,748) | | | (3,332) | |
| Proceeds from sale of building | Proceeds from sale of building | 548 | | | 34,500 | | Proceeds from sale of building | — | | | 548 | |
| Net cash (used in) provided by investing activities | (3,032) | | | 28,067 | | |
| Financing activities | | | | |
| | Net cash used in investing activities | | Net cash used in investing activities | (241,584) | | | (2,784) | |
| Financing activities: | | Financing activities: | | | |
| Distributions for tax liabilities to non-controlling interests holders | Distributions for tax liabilities to non-controlling interests holders | (23,128) | | | 0 | | Distributions for tax liabilities to non-controlling interests holders | (39,889) | | | (23,128) | |
| Proceeds from borrowings of long-term debt, net of discount | 0 | | | 15,000 | | |
| Proceeds from borrowings of long-term debt | | Proceeds from borrowings of long-term debt | 8,455 | | | — | |
| Principal repayments of long-term debt | Principal repayments of long-term debt | (1,500) | | | (625) | | Principal repayments of long-term debt | (9,815) | | | (1,500) | |
| Payments made on facility financing lease obligation and capital lease | (141) | | | (36) | | |
| Proceeds from employee stock purchase plan | 570 | | | 0 | | |
| Net cash (used in) provided by financing activities | (24,199) | | | 14,339 | | |
| | Proceeds from employee stock purchase plan and exercise of stock options, net of shares withheld for employee taxes | | Proceeds from employee stock purchase plan and exercise of stock options, net of shares withheld for employee taxes | 726 | | | 570 | |
| Net cash used in financing activities | | Net cash used in financing activities | (40,523) | | | (24,058) | |
| Effects of exchange rate changes on cash | Effects of exchange rate changes on cash | 7 | | | (72) | | Effects of exchange rate changes on cash | — | | | 7 | |
| Net increase in cash, and restricted cash | 11,491 | | | 52,047 | | |
| | Net (decrease) increase in cash | | Net (decrease) increase in cash | (119,803) | | | 11,491 | |
| Cash, beginning of period | Cash, beginning of period | 236,184 | | | 24,700 | | Cash, beginning of period | 551,272 | | | 236,184 | |
| Cash, end of period | Cash, end of period | $ | 247,675 | | | $ | 76,747 | | Cash, end of period | $ | 431,469 | | | $ | 247,675 | |
| Supplemental cash flow information | | | | |
| | Supplemental cash flow information: | | Supplemental cash flow information: | |
| Cash paid for interest | Cash paid for interest | $ | 7,947 | | | $ | 6,236 | | Cash paid for interest | $ | 1,373 | | | $ | 7,219 | |
| Cash paid for income taxes | Cash paid for income taxes | $ | 2,725 | | | $ | 0 | | Cash paid for income taxes | $ | 914 | | | $ | 2,725 | |
| Supplemental disclosures of non-cash investing and financing activities | | | | |
| | Supplemental disclosures of non-cash investing and financing activities: | | Supplemental disclosures of non-cash investing and financing activities: | | | |
| Property and equipment included in accounts payable and accrued expenses | Property and equipment included in accounts payable and accrued expenses | $ | 1,415 | | | $ | 581 | | Property and equipment included in accounts payable and accrued expenses | $ | 1,742 | | | $ | 1,202 | |
| | Right-of-use assets obtained in exchange for new operating lease liabilities | | Right-of-use assets obtained in exchange for new operating lease liabilities | $ | 773 | | | $ | — | |
|
MARAVAI LIFESCIENCES HOLDINGS, INC.
| | | | | | | | | | | |
| Three Months Ended
March 31, |
| 2022 | | 2021
(as adjusted)* |
| Fair value of contingent consideration liability recorded in connection with acquisition of business in other long-term liabilities | $ | 7,800 | | | $ | — | |
| Accrued consideration payable | $ | 10,000 | | | $ | — | |
| | | |
| | | |
| | | |
| | | |
| | | |
| | | |
____________________
*As adjusted to reflect the impact of the adoption of ASC 842. See Note 1 to the condensed consolidated financial statements for a summary of the adjustments.
The accompanying notes are an integral part of the condensed consolidated financial statementsstatements.
MARAVAI LIFESCIENCES HOLDINGS, INC.
NOTES TO THE CONDENSED CONSOLIDATED FINANCIAL STATEMENTS
1.Organization and Significant Accounting Policies
Description of Business
Maravai LifeSciences Holdings, Inc. (the “Company”, and together with its consolidated subsidiaries, “Maravai”, “we”, “us”, and “our”) was formed as a Delaware corporation in August 2020 for the purpose of facilitating an initial public offering (“IPO”) of its Class A common stock, facilitating certain organizational transactions and to operate the business of Maravai Topco Holdings, LLC (“Topco LLC”) and its consolidated subsidiaries.
We are a leading life sciences company providingprovides critical products to enable the development of drug therapies,drugs, therapeutics, diagnostics noveland vaccines and to support research on human diseases. Our products address the key phases of biopharmaceutical development and include complex nucleic acids for diagnostic and therapeutic applications and antibody-based products to detect impurities during the production of biopharmaceutical products, and products to detect the expression of proteins in tissues of various species.products.
The Company is headquartered in San Diego, California and has threehistorically operated in 3 principal businesses: Nucleic Acid Production, Biologics Safety Testing and Protein Detection. In September 2021, the Company completed the divestiture of its Protein Detection business. Our Nucleic Acid Production business manufactures and sells products used in the fields of gene therapy, vaccines, nucleoside chemistry, oligonucleotide therapy and molecular diagnostics, including reagents used in the chemical synthesis, modification, labelling and purification of deoxyribonucleic acid (“DNA”) and ribonucleic acid (“RNA”). Our core Nucleic Acid Production offerings include messenger ribonucleic acid (“mRNA”), long and short oligonucleotides, our proprietary CleanCap® capping technology and oligonucleotide building blocks. Our Biologics Safety Testing business sells highly specialized analytical products for use in biologic manufacturing process development, including custom product-specific development antibody and assay development services. Our Protein Detection business sells innovative labeling and detection reagents
Organization
We were incorporated as a Delaware corporation in August 2020 for researchers in immunohistochemistry.
Organizational Transactions and Initial Public Offering
In November 2020, the Company completed itspurpose of facilitating an initial public offering (“IPO”) and sold 69,000,000 shares of Class A common stock at a public offering price of $27.00 per share and received proceeds of $1.8 billion, net of underwriting discounts and commissions, which the Company used to purchase previously-issued and newly-issued LLC units in Topco LLC, to pay Maravai Life Sciences Holdings 2, LLC (“MLSH 2”) as consideration for certain organizational transactions that occurred before the IPO, and to purchase outstanding shares of Class A common stock from MLSH 2.
. Immediately prior to and in connection with, the completion of our IPO, the Company completedwe effected a series of organizational transactions (“Organizational(the “Organizational Transactions”), including:
•The amendmentwhich, together with the IPO, were completed in November 2020, that resulted in the Company operating, controlling all of the business affairs and restatementbecoming the ultimate parent company of Maravai Topco LLC’s operating agreement (the “NewHoldings, LLC Operating Agreement”) to, among other things, (i) modify (“Topco LLC’s capital structure by replacing the membership interests held by Topco LLC’s existing owners with a new class of Topco LLC units (the “LLC Units”LLC”) and (ii) appoint the Company as the sole managing member of Topco LLC;
•Amend and restate the Company’s certificate of incorporation to among other things, authorize the Company to issue two classes of common stock: Class A common stock and Class B common stock;
•The issuance of shares of the Company’s Class B common stock toits consolidated subsidiaries. Maravai Life Sciences Holdings, LLC (“MLSH 1”), which was Topco LLC’s pre-IPO owner on a one-to-one basisis controlled by investment entities affiliated with GTCR, is the number of LLC Units owned; and
•The acquisition, by merger, of two membersonly other member of Topco LLC (“the Blocker Entities”), for which we issued shares of Class A common stock and paid cash as consideration (“the Blocker Mergers”).LLC.
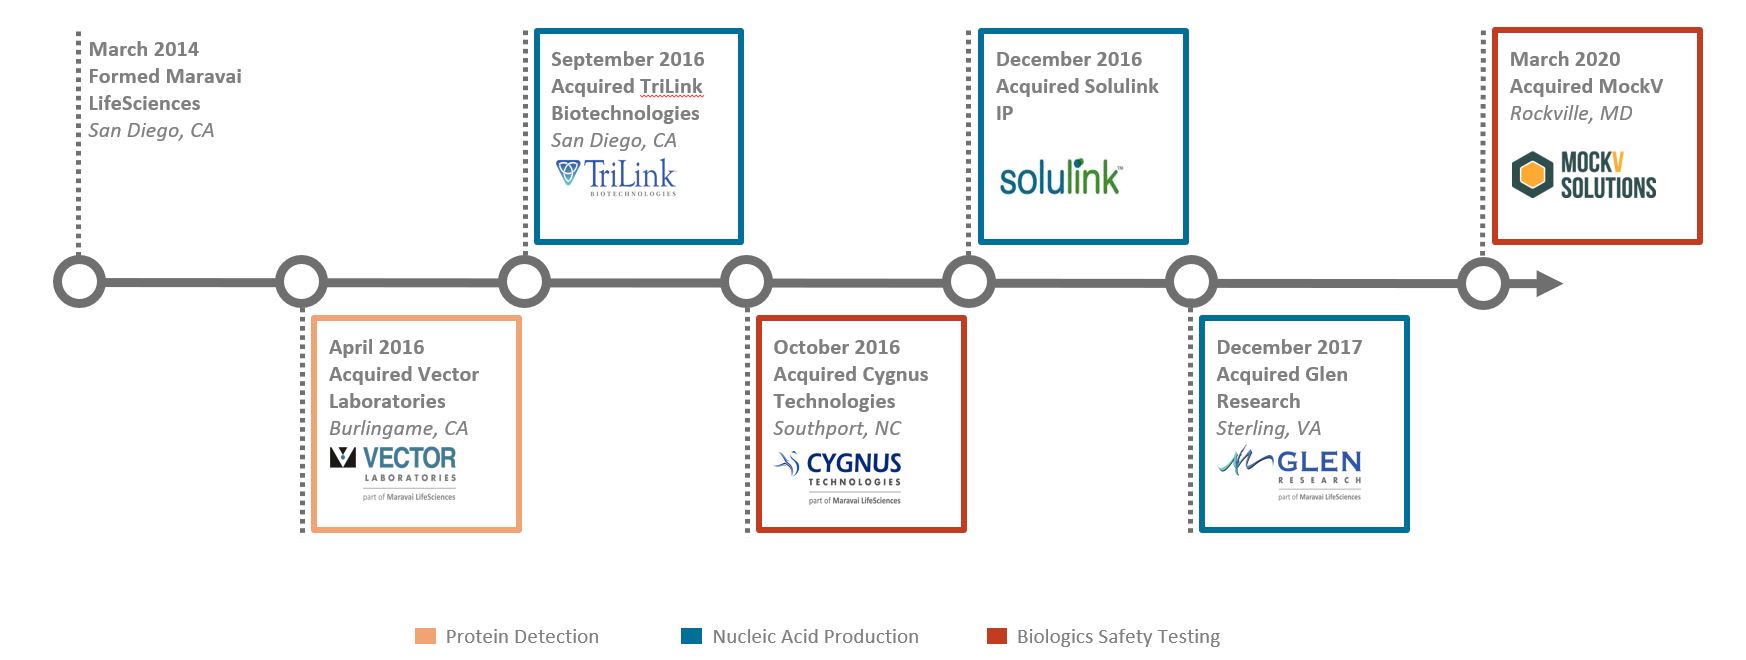
The Company is the sole managing member of Topco LLC, which operates and controls TriLink Biotechnologies, LLC (“TriLink”), Glen Research, LLC, Vector Laboratories, Inc., MockV Solutions, LLC and Cygnus Technologies, LLC (“Cygnus”) and their respective subsidiaries. MLSH 1 is the only other member of Topco LLC.
The Organizational Transactions were considered transactions between entities under common control. As a result, the consolidated financial statements for periods priorPrior to the IPOCompany’s divestiture of its Protein Detection business in September 2021, Topco LLC also operated and the Organizational Transactions have been adjusted to combine the previously separate entities for presentation purposes.
controlled Vector Laboratories, Inc. and its subsidiaries (“Vector”). Basis of Presentation
The Company operates and controls all of the business and affairs of Topco LLC, and through Topco LLC and its subsidiaries, conducts its business. Because we manage and operate the business and control the strategic decisions and day-to-day operations of Topco LLC and also have a substantial financial interest in Topco LLC, we consolidate the financial results of Topco LLC, and a portion of our net income is allocated to the non-controlling interests in Topco LLC held by MLSH 1.
The accompanying unaudited interim condensed consolidated financial statements include the accounts of the Company and its subsidiaries. All intercompany transactions and accounts between the businesses comprising the Company have been eliminated in the accompanying consolidated financial statements.
Unaudited Interim Condensed Consolidated Financial Statements
The accompanying unaudited condensed consolidated financial statements have been prepared in accordance with accounting principles generally accepted in the United States of America (“GAAP”) for interim financial information and pursuant to Form 10-Q of Regulation S-X of the Securities and Exchange Commission (“SEC”). Accordingly, they do not include all of the information and footnotes required by GAAP for complete financial statements. These unaudited condensed consolidated financial statements include all adjustments necessary to fairly state the financial position and the results of our operations and cash flows for interim periods in accordance with GAAP. All such adjustments are of a normal, recurring nature. Operating results for the three months ended March 31, 20212022 are not necessarily indicative of the results that may be expected for the year ending December 31, 20212022 or for any future period.
The condensed consolidated balance sheet presented as of December 31, 2020,2021, has been derived from the audited consolidated financial statements as of that date. The condensed consolidated financial statements and notes are presented as permitted by Form 10-Q and do not contain all information that is included in the annual financial statements and notes thereto of the Company. The condensed consolidated financial statements and notes included in this report should be read in conjunction with
the 2020consolidated financial statements and notes included in the Company’s Annual Report on Form 10-K for the year ended December 31, 2021 (“2021 Form 10-K”) filed with the SEC.
Use of Estimates
The preparation of consolidated financial statements in accordance with GAAP requires the Company to make judgments, estimates and assumptions that affect the reported amounts of assets, liabilities, equity, revenue and expenses, and related disclosures. These estimates form the basis for judgments the Company makes about the carrying values of assets and liabilities that are not readily apparent from other sources. The Company bases its estimates and judgments on historical experience and on various other assumptions that the Company believes are reasonable under the circumstances. These estimates are based on management’s knowledge about current events and expectations about actions the Company may undertake in the future. Significant estimates include, but are not limited to, revenue recognition, the net realizable valuemeasurement of inventory, expected future cash flows including growth rates, discount rates, terminal values and other assumptions and estimates used to evaluate the recoverability of long-lived assets, estimated fair values of intangibleright-of-use assets and goodwill,lease liabilities and related incremental borrowing rate, the payable to related parties pursuant to the Tax Receivable Agreement (“TRA”)(as defined in Note 9), amortization methods and periods, the fair value of leased buildings and other assumptions associated with lease financing transactions, the estimated fair valuerealizability of our long-term debt, equity-based compensation, thenet deferred tax assets, and valuation of incentive units, allowance for doubtful accounts,goodwill and accounting for income taxes and assessment of valuation allowances.intangible assets acquired in business combinations. Actual results could differ materially from those estimates.
Significant Accounting Policies
A description of the Company’s significant accounting policies is included in Note 1 of the audited financial statements withinNotes to the Consolidated Financial Statements included in its Annual Report on2021 Form 10-K for the year ended December 31, 2020. There10-K. Except as noted below, there have been no material changes in the Company’s significant accounting policies during the three months ended March 31, 2021.2022.
Revenue Recognition
The Company generates revenue primarily from the sale of products, and services and the performance ofto a much lesser extent, services in the fields of nucleic acid production, biologics safety testing and protein detection. Revenue is recognized when control of promised goods or services is transferred to a customer in an amount that reflects the consideration to which the entity expects to be entitled in exchange for those goods or services. To determine revenue recognition for its arrangements with customers, the Company performs the following five steps: (i) identify the contract(s) with a customer; (ii) identify the performance obligations in the contract; (iii) determine the transaction price; (iv) allocate the transaction price to the performance obligations in the contract; and (v) recognize revenue when (or as) the entity satisfies a performance obligation. The majority of the Company’s contracts include only one performance obligation. A performance obligation is a promise in a contract to transfer a distinct good or
service to the customer and is defined as the unit of account for revenue recognition. The Company also recognizes revenue from other contracts that may include a combination of products and services, the provision of solely services, or from license fee arrangements which may be associated with the delivery of product. Where there is a combination of products and services, the Company accounts for the promises as individual performance obligations if they are concluded to be distinct. Performance obligations are considered distinct if they are both capable of being distinct and distinct within the context of the contract. In determining whether performance obligations meet the criteria for being distinct, the Company considers a number of factors, such as the degree of interrelation and interdependence between obligations, and whether or not the good or service significantly modifies or transforms another good or service in the contract. As a practical expedient, we do not adjust the transaction price for the effects of a significant financing component if, at contract inception, the period between customer payment and the transfer of goods or services is expected to be one year or less. Contracts with customers are evaluated on a contract-by-contract basis as contracts may include multiple types of goods and services as described below.
Revenue for an individual contract is recognized at the related transaction price, which is the amount the Company expects to be entitled to in exchange for transferring the products and/or services. The transaction price for product sales is calculated at the contracted product selling price. The transaction price for a contract with multiple performance obligations is allocated to the separate performance obligations on a relative standalone selling price basis. Standalone selling prices for products are determined based on the prices charged to customers, which are directly observable. Standalone selling price of services are mostly based on time and materials. Generally, payments from customers are due when goods and services are transferred. As most contracts contain a single performance obligation, the transaction price is representative of the standalone selling price charged to customers. Revenue is recognized only to the extent that it is probable that a significant reversal of the cumulative amount recognized will not occur in future periods. Variable consideration has not been material to our consolidated financial statements.
The Company accepts returns only if the products do not meet customer specifications and historically, the Company’s volume of product returns has not been significant. Further, no warranties are provided for promised goods and services other than assurance type warranties.
The Company has elected the practical exemption to not disclose the unfulfilled performance obligations for contracts with an original length of one year or less. The Company had no material unfulfilled performance obligations for contracts with an original length greater than one year for any period presented.
Nucleic Acid Production
Nucleic Acid Production revenue is generated from the manufacture and sale of highly modified, complex nucleic acids products to support the needs of our of customers’ research, therapeutic and vaccine programs. The primary offering of products include; CleanCap®includes CleanCap®, mRNA and specialized oligonucleotides. Contracts typically consist of a single performance obligation. We also sell nucleic acid products for labeling and detecting proteins in cells and tissue samples research. The Company recognizes revenue from these products in the period in which the performance obligation is satisfied by transferring control to the customer. Revenue for nucleic acid catalog products is recognized at a single point in time, generally upon shipment to the customer. Revenue for contracts for certain custom nucleic acid products, with an enforceable right to payment and a reasonable margin for work performed to date, is recognized over time, based on a cost-to-cost input method over the manufacturing period. Payments received from customers in advance of manufacturing their products is recorded as deferred revenue until the products were delivered.
Biologics Safety Testing
The Company’s Biologics Safety Testing revenue is associated with the sale of bioprocess impurity detection kit products. We also enter into contracts that include custom antibody development, assay development and antibody
affinity extraction services. These products and services enable the detection of impurities that occur in the manufacturing of biologic drugs and other therapeutics. The Company recognizes revenue from the sale of bioprocess impurity detection kits in the period in which the performance obligation is satisfied by transferring control to the customer. Custom antibody development contracts consist of a single performance obligation, typically with an enforceable right to payment and a reasonable margin for work performed to date. Revenue is recognized over time based on a cost-to-cost input method over the contract term. Where an enforceable right to payment does not exist, revenue is recognized at a point in time when control is transferred to the customer. Assay development service contracts consist of a single performance obligation, revenue is recognized at a point in time when a successful antigen test and report is provided to the customer. Affinity extraction services, which generally occur over a short period of time, consist of a single performance obligation to perform the extraction service and provide a summary report to the customer. Revenue is recognized either over time or at a point in time depending on contractual payment terms with the customer.
Protein Detection
ThePrior to the divestiture of its Protein Detection business in September 2021, the Company also manufacturesmanufactured and sellssold protein labeling and detection reagents to customers that arewere used for basic research and development. The contracts to sell these catalog products consistconsisted of a single performance obligation to deliver the reagent products. Revenue from these contracts iswas recognized at a point in time, generally upon shipment of the final product to the customer.
The Company elected the practical expedient to not disclose the unfulfilled performance obligations for contracts with an original length of one year or less. The Company had no material unfulfilled performance obligations for contracts with an original length greater than one year for any period presented.
The Company accepts returns only if the products do not meet customer specifications and historically, the Company’s volume of product returns has not been significant. Further, no warranties are provided for promised goods and services other than assurance type warranties.
Revenue for an individual contract is recognized at the related transaction price, which is the amount the Company expects to be entitled to in exchange for transferring the products and/or services. The transaction price for product sales is calculated at the contracted product selling price. The transaction price for a contract with multiple performance obligations is allocated to the separate performance obligations on a relative standalone selling price basis. Standalone selling prices for products are determined based on the prices charged to customers, which are directly observable. Standalone selling price of services are mostly based on time and materials. Generally, payments from customers are due when goods and services are transferred. As most contracts contain a single performance obligation, the transaction price is representative of the standalone selling price charged to customers. Revenue is recognized only to the extent that it is probable that a significant reversal of the cumulative amount recognized will not occur in future periods. Variable consideration has not been material to our consolidated financial statements.
Sales taxes
Sales taxes collected by the Company are not included in the transaction price as revenue as they are ultimately remitted to a governmental authority.
Shipping and handling costs
ShippingThe Company has elected to account for shipping and handling activities related to contracts with customers as costs which are charged to customers, are included infulfill the promise to transfer the associated products. Accordingly, revenue for shipping and handling is recognized at the same time that the related product revenue is recognized.
Contract costs
The Company recognizes the incremental costs of obtaining contracts as an expense when incurred when the amortization period of the assets that otherwise would have been recognized is one year or less. These costs are included in sales and marketing and general and administrative expenses. The costs to fulfill the contracts are determined to be immaterial and are recognized as an expense when incurred.
Contract balances
Contract assets are generated when contractual billing schedules differ from revenue recognition timing and the Company records a contract receivable when it has an unconditional right to consideration. Contract assetsThere were no contract asset balances which are included in prepaid and other current assets, totaled $1.0 million and $0.2 million as of March 31, 20212022 and December 31, 2020, respectively.2021.
Contract liabilities include billings in excess of revenue recognized, such as customer deposits and deferred revenue. Customer deposits, which are included in accrued expenses, are recorded when cash payments are received or due in advance of performance. Deferred revenue is recorded when the Company has unsatisfied performance obligations. Total contract liabilities were $120.7$5.3 million and $79.2$12.6 million as of March 31, 20212022 and December 31, 2020,2021, respectively. Contract liabilities are expected to be recognized into revenue within the next twelve months.
Disaggregation of Revenue
The following tables summarize the revenue by segment and region for the periods presented (in thousands):
| | For the three months ended March 31, 2021 | | Nucleic Acid
Production | | Biologics
Safety
Testing | | Protein
Detection | | Total | |
| | | Three Months Ended March 31, 2022 |
| | | Nucleic Acid Production | | Biologics Safety Testing | | | Total |
| North America | North America | | $ | 68,132 | | $ | 6,412 | | $ | 3,752 | | $ | 78,296 | North America | $ | 79,418 | | $ | 7,519 | | | $ | 86,937 |
| Europe, the Middle East and Africa | Europe, the Middle East and Africa | | 47,898 | | 4,349 | | 1,468 | | 53,715 | Europe, the Middle East and Africa | 131,350 | | 4,697 | | | 136,047 |
| Asia Pacific | Asia Pacific | | 7,885 | | 6,735 | | 1,360 | | 15,980 | Asia Pacific | 12,867 | | 8,328 | | | 21,195 |
| Latin and Central America | Latin and Central America | | 17 | | 153 | | 50 | | 220 | Latin and Central America | 15 | | 99 | | | 114 |
| Total revenue | Total revenue | | $ | 123,932 | | $ | 17,649 | | $ | 6,630 | | $ | 148,211 | Total revenue | $ | 223,650 | | $ | 20,643 | | | $ | 244,293 |
| | | | | | | | | | | | | | | | | | | | | | | |
| Three Months Ended March 31, 2021 |
| Nucleic Acid Production | | Biologics Safety Testing | | Protein Detection | | Total |
| North America | $ | 68,132 | | $ | 6,412 | | $ | 3,752 | | $ | 78,296 |
| Europe, the Middle East and Africa | 47,898 | | 4,349 | | 1,468 | | 53,715 |
| Asia Pacific | 7,885 | | 6,735 | | 1,360 | | 15,980 |
| Latin and Central America | 17 | | 153 | | 50 | | 220 |
| Total revenue | $ | 123,932 | | $ | 17,649 | | $ | 6,630 | | $ | 148,211 |
| | | | | | | | | | | | | | | | | | | | | | | | | | |
| For the three months ended March 31, 2020 | | Nucleic Acid
Production | | Biologics
Safety
Testing | | Protein
Detection | | Total |
| North America | | $ | 24,869 | | $ | 5,125 | | $ | 3,429 | | $ | 33,423 |
| Europe, the Middle East and Africa | | 2,049 | | 3,541 | | 1,622 | | 7,212 |
| Asia Pacific | | 3,558 | | 5,562 | | 1,107 | | 10,227 |
| Latin and Central America | | 13 | | 66 | | 40 | | 119 |
| Total revenue | | $ | 30,489 | | $ | 14,294 | | $ | 6,198 | | $ | 50,981 |
The following table provides a disaggregation ofTotal revenue is attributed to geographic regions based on the patternbill-to location of the transaction. For all periods presented, the majority of our revenue recognition (in thousands):
| | | | | | | | | | | | | | |
| | For the three months ended March 31, |
| | 2021 | | 2020 |
| Revenue recognized at a point in time | | $ | 136,231 | | | $ | 49,775 | |
| Revenue recognized over time | | 11,980 | | | 1,206 | |
| Total revenue | | $ | 148,211 | | | $ | 50,981 | |
Non-Controlling Interests
Non-controlling interests represent the portion of profit or loss, net assets and comprehensive income of our consolidated subsidiaries that is not allocable to the Company based on our percentage of ownership of such entities. Non-controlling interests consist of the following:
•Until November, 2020 Topco LLC held a 70% ownership interest in MLSC Holdings, LLC (“MLSC”) through its consolidated subsidiaries with the remaining 30% being recorded as non-controlling interests in our consolidated financial statements. MLSC net income or loss was attributed to the non-controlling interests using an attribution method, similar to the hypothetical liquidation at book value method, based on the distribution provisions of the MLSC Amended and Restated Limited Liability Company Agreement (“MLSC LLC Agreement”). In November 2020, and beforefollowing the closingcompletion of the IPO, Topco LLC repurchased all of the outstanding non-controlling interests in MLSC for $166.4 million.
•In November 2020, based on the Organizational Transactions, described above, we became the sole managing member of Topco LLC. As of March 31, 2021,2022, we holdheld approximately 38%51.5% of the outstanding LLC Units of Topco LLC, and MLSH 1 held approximately 62%48.5% of the outstanding LLC Units of Topco LLC are held by MLSH 1.LLC. Therefore, we report non-controlling interests based on the percentage of LLC Units of Topco LLC held by MLSH 1 on ourthe condensed consolidated balance sheet as of March 31, 2021.2022. Income or loss attributed to the non-controlling interest in Topco LLC is based on the LLC Units outstanding during the period for which the income or loss is generated and is presented on the condensed consolidated statements of income and condensed consolidated statements of comprehensive income.
MLSH 1 is entitled to exchange its LLC Units of Topco LLC, together with an equal number of shares of our Class B common stock (together referred to as “Paired Interests”), for shares of Class A common stock on a one-for-one basis or, at our election, for cash, from a substantially concurrent public offering or private sale (based on the price of our Class A common stock in such public offering or private sale). As such, future exchanges of Paired Interests by MLSH 1 will result in a change in ownership and reduce or increase the amount recorded as non-controlling interests and increase or decrease additional paid-in-capital when Topco LLC has positive or negative net assets, respectively. For the three months ended March 31, 2022 and 2021, MLSH 1 did not exchange any Paired Interests. In April 2021, MLSH 1 executed an exchange
Distributions of Paired Interest immediately prior to the closing of the Company’s secondary offering (see Note 11)
A distribution of$39.9 million and $23.1 million for tax liabilities waswere made to MLSH 1 during the three months ended March 31, 2021. NaN distributions were made during the three months ended March 31, 2020.2022 and 2021, respectively.
Segment Information
The Company operateshas historically operated in 3 reportable segments. Operating segments are defined as components of an enterprise aboutfor which separate financial information is evaluated regularly by the chief operating decision maker in deciding how
to allocate resources and assessing performance. The Company’s chief operating decision maker (“CODM”), its Chief Executive Officer,
allocates resources and assesses performance based upon discrete financial information at the segment level. Substantially allAll of our long-lived assets are located in the United States. After the divestiture of Vector in September 2021, the Company no longer has the Protein Detection segment. The Company has reported the historical results of the Protein Detection business as such discrete financial information evaluated by the CODM for the periods presented included the information for this legacy segment. As of March 31, 2022, the Company operated in 2 reportable segments: Nucleic Acid Production and Biologics Safety Testing.
Net Income per Class A Common Share/UnitShare Attributable to Maravai LifeSciences Holdings, Inc.
Basic net income per Class A Common share/unitshare attributable to Maravai LifeSciences Holdings, Inc. is computed by dividing net income attributable to us by the weighted average number of Class A Common shares/unitsshares outstanding during the period. The non-controlling interest, for historical periods prior to the IPO, is calculated pursuant to the terms of the MLSC LLC Agreement on a fully-distributed basis, taking into account the various classes of equity of MLSC, including the cumulative yields on MLSC’s preferred units. Diluted net income per Class A Common share/unitshare is calculated by giving effect to all potential weighted average dilutive LLC incentive units for historical periods prior to the IPO and stock options, restricted stock units, and Topco LLC Units, that together with an equal number of shares of our Class B common stock (together referred to as “Paired Interests”), are convertible into shares of our Class A Common stock, for the periods after the IPO. For historical periods prior to the IPO, the weighted average number of common units outstanding during the period and the potential dilutive common unit equivalents is determined under the two-class method.stock. The dilutive effect of outstanding awards, if any, is reflected in diluted earnings per share/unitshare by application of the treasury stock method or if-converted method, as applicable. The Company reported net income attributable to Maravai LifeSciences Holdings, Inc. for the three months ended March 31, 20212022 and 2020.2021.
Contingent Consideration
Contingent consideration represents additional consideration that may be transferred to former owners of an acquired entity in the future if certain future events occur or conditions are met. Contingent consideration resulting from the acquisition of a business is recorded at fair value on the acquisition date. Such contingent consideration is re-measured to its estimated fair value at each reporting date with the change in fair value recognized within operating expenses in the Company’s condensed consolidated statements of income. Subsequent changes in the fair value of the contingent consideration are classified as an adjustment to cash flows from operating activities in the condensed consolidated statements of cash flows because the change in fair value is an input in determining net income. Cash paid in settlement of contingent consideration liabilities are classified as cash flows from financing activities up to the acquisition date fair value with any excess classified as cash flows from operating activities.
Changes in the fair value of contingent consideration liabilities associated with the acquisition of a business can result from updates to assumptions such as the expected timing or probability of achieving customer related performance targets, specified sales milestones, changes in projected revenue or changes in discount rates. Judgment is used in determining those assumptions as of the acquisition date and for each subsequent reporting period. Therefore, any changes in the fair value will impact the Company’s results of operations in such reporting period thereby resulting in potential variability in the Company’s operating results until such contingencies are resolved.
Fair Value of Financial Instruments
The Company defines fair value as the amount that would be received to sell an asset, or paid to transfer a liability, in an orderly transaction between market participants at the measurement date. The Company follows accounting guidance that has a three-level hierarchy for fair value measurements based upon the transparency of inputs to the valuation of the asset or liability as of the measurement date. Instruments with readily available actively quoted prices, or for which fair value can be measured from actively quoted prices in an orderly market, will generally have a higher degree of market price transparency and a lesser degree of judgment used in measuring fair value. The three levels of the hierarchy are defined as follows:
Level 1—Observable inputs that reflect quoted prices (unadjusted) for identical assets or liabilities in active markets;
Level 2—Include other inputs that are directly or indirectly observable in the marketplace; and
Level 3—Unobservable inputs which are supported by little or no market activity.
As of March 31, 20212022 and December 31, 2020,2021, the carrying value of the Company’s current assets and liabilities approximatesapproximated fair value due to the short maturities of these instruments. The fair values of the Company’s long-term debt approximateapproximated carrying value, excluding the effect of unamortized debt discount, as it is based on borrowing rates currently available to the Company for debt with similar terms and maturities (Level 2 inputs).
Acquisitions
The Company evaluates mergers, acquisitions and other similar transactions to assess whether or not the transaction should be accounted for as a business combination or an acquisition of assets. The Company first identifies who is the acquiring entity by determining if the target is a legal entity or a group of assets or liabilities. If control over a legal entity is being evaluated, the
Company also evaluates if the target is a variable interest or voting interest entity. For acquisitions of voting interest entities, the Company applies a screen test to determine if substantially all of the fair value of the gross assets acquired is concentrated in a single identifiable asset or group of similar identifiable assets. If the screen test is met, the transaction is accounted for as an acquisition of assets. If the screen is not met, further determination is required as to whether or not the Company has acquired inputs and processes that have the ability to create outputs which would meet the definition of a business.
The Company accounts for its business combinations using the acquisition method of accounting which requires that the assets acquired and liabilities assumed of acquired businesses be recorded at their respective fair values at the date of acquisition. The purchase price, which includes the fair value of consideration transferred, is attributed to the fair value of the assets acquired and liabilities assumed. The purchase price may also include contingent consideration. The Company assesses whether such contingent consideration is subject to liability classification and fair value measurement or meets the definition of a derivative. Contingent consideration liabilities are recognized at their estimated fair value on the acquisition date. Contingent consideration arrangements that are determined to be compensatory in nature are recognized as post combination expense in our condensed consolidated statements of income ratably over the implied service period beginning in the period it becomes probable such amounts will become payable. The excess of the purchase price of the acquisition over the fair value of the identifiable net assets of the acquiree is recorded as goodwill. The fair value of assets acquired and liabilities assumed in certain cases may be subject to revision based on the final determination of fair value during a period of time not to exceed twelve months from the acquisition date. The results of acquired businesses are included in the Company’s consolidated financial statements from the date of acquisition. Transaction costs directly attributable to acquired businesses are expensed as incurred.
Determining the fair value of assets acquired and liabilities assumed requires management to use significant judgment and estimates, including the selection of valuation methodologies and assumptions about future net cash flows, discount rates and market participants. Each of these factors can significantly affect the value attributed to the identifiable intangible asset acquired in a business combination.
Concentration of Credit Risk
Financial instruments that potentially subject the Company to significant concentrations of credit risk consist principally of cash and accounts receivable. The Company maintains the majoritysubstantially all of its cash balances at multiplea financial institutionsinstitution that management believes areis of high credit-quality and is financially stable. Cash is deposited with major financial institutions in excess of Federal Deposit Insurance Corporation (“FDIC”) insurance limits. The Company believes it is not exposed to significant credit risk due to the financial strength of the depository institutions in which the cash is held. The Company provides credit, in the normal course of business, to international and domestic distributors and customers, which are geographically dispersed. The Company attempts to limit its credit risk by performing ongoing credit evaluations of its customers and maintaining adequate allowances for potential credit losses.
The following table summarizes revenue from each of our customers who individually accounted for 10% or more of our total revenue or accounts receivable for the periods presented:
| | | | | | | | | | | | | | | | | | | | | | | | | | | |
| Revenue | | Accounts Receivable, net |
| Three Months Ended March 31, | | | | March 31, 2022 | | December 31, 2021 |
| 2022 | | 2021 | | | | | | |
| BioNTech SE | 40.4 | % | | 22.2 | % | | | | | | * | | * |
| Pfizer Inc. | 29.5 | % | | 29.2 | % | | | | | | 64.3 | % | | 23.6 | % |
| CureVac N.V. | * | | * | | | | | | * | | 46.5 | % |
| Nacalai USA, Inc. | * | | * | | | | | | * | | 11.6 | % |
| | | | | | | | | | | | | | | | | | | | | | | | | | |
| | Revenue | | Accounts Receivable, net |
| | For the three months ended March 31, | | March 31, 2021 | | December 31, 2020 |
| | 2021 | | 2020 | | |
| BioNTech SE | | 22.2 | % | | * | | 32.9 | % | | * |
| Pfizer, Inc. | | 29.2 | % | | * | | 34.3 | % | | 45.1 | % |
| Sanofi | | * | | 26.0 | % | | * | | * |
| CureVac | | * | | * | | * | | 12.8 | % |
| *Less than 10% | | | | | | | | |
*Less than 10%
For the three months ended March 31, 2022 and 2021, substantially all of the revenue recorded for BioNTech SE and Pfizer Inc. was generated by ourthe Nucleic Acid Production segment.
Retrospective Application of a Change in Accounting Principle
The Company continues to experience strong revenue growth in the Nucleic Acid Production segment, driven by sales of CleanCap® related products which represent a significant portion of the Company’s total revenue in the first fiscal quarter of 2021. For the three months ended March 31, 2020, substantially all of the revenue recorded for Sanofi was generated by our Nucleic Acid Production segment.
Emerging Growth Company Status
The Company is an emerging growth company, as defined in the Jumpstart Our Business Startups Act of 2012 (“JOBS Act”). Under the JOBS Act, emerging growth companies can delay adopting new or revised accounting standards issued subsequent to the enactment of the JOBS Act, until such time as those standards apply to private companies. The Company has elected to use this extended transition period for complying with new or revised accounting standards that have different effective dates for public and private companies until the earlier of the date that it (i) is no longer an emerging growth company or (ii) affirmatively and irrevocably opts out of the extended transition period provided in the JOBS Act. As a result, these condensed consolidated financial statements may not be comparable to companies that comply with the new or revised accounting pronouncements as of public company effective dates.
Recently Issued Accounting Pronouncements Not Yet Adopted
In February 2016, the Financial Accounting Standards Board (“FASB”) issuedadopted Accounting Standards Update (“ASU”) 2016-02, Leases (“TopicASC 842”), which supersedes the guidance in ASCAccounting Standards Codification (“ASC”) 840, Leases. The new standard, as amended by subsequent ASUs on Topic 842 and recent extensions issued by the FASB in response to COVID-19, requires lessees to apply a dual approach, classifying leases as either finance or operating leases based on the principle of whether or not the lease is effectively a financed purchase by the lessee. This classification will determine whether lease expense is recognized based on an(“ASC 840”), effective interest method or on a straight-line basis over the term of the lease. A lessee is also required to record a right-of-use asset and a lease liability for all leases with a term of greater than 12 months regardless of their classification. Leases with a term of 12 months or less will be accounted for similar to existing guidance for operating leases today. The Company plans to adopt this standard using the modified retrospective approach with a cumulative effect adjustment to retained earnings at the beginning of the period of adoption. The Company will also adopt certain practical expedients provided by Topic 842.January 1. 2021. As a result of the Company having elected the extended transition period for complying with new or revised accounting standards pursuant to Section 107(b) of the JOBSJumpstart Our Business Startups Act and assumingof 2012, ASC 842 was not adopted until the Company continuesfourth quarter of 2021. The comparative information for
the three months ended March 31, 2021 has been adjusted to be considered an Emerging Growth Company, Topic 842 will be effective forreflect the Company on January 1, 2022. The Company is currently assessing its inventoryimpact of leases but has not yet determined the full effects of Topic 842 on its consolidated financial statements but does expect the adoption of TopicASC 842 will have a materialas of January 1, 2021.
Select line items from the condensed consolidated statements of income reflecting the adoption of ASC 842 are as follows (in thousands):
| | | | | | | | | | | | | | | | | |
| Three Months Ended March 31, 2021 |
| As Previously Reported | | Adjustments | | As Adjusted |
| Operating expenses: | | | | | |
| Cost of revenue | $ | 30,368 | | | $ | 1,023 | | | $ | 31,391 | |
| Selling, general and administrative | 23,237 | | | 234 | | | 23,471 | |
| Research and development | 2,164 | | | (4) | | | 2,160 | |
| Total operating expenses | 55,769 | | | 1,253 | | | 57,022 | |
| Income from operations | 92,442 | | | (1,253) | | | 91,189 | |
| Other income (expense): | | | | | |
| Interest expense | (8,770) | | | 866 | | | (7,904) | |
| Income before income taxes | 89,561 | | | (387) | | | 89,174 | |
| Net income | 75,852 | | | (387) | | | 75,465 | |
| Net income attributable to non-controlling interests | 52,605 | | | (242) | | | 52,363 | |
| Net income attributable to Maravai LifeSciences Holdings, Inc. | 23,247 | | | (145) | | | 23,102 | |
The adoption of ASC 842 had no impact on the Company’s basic and diluted earnings per share for the three months ended March 31, 2021.
Select line items from the condensed consolidated financial statements and related notes toof comprehensive income reflecting the recognition of right of use (“ROU”) assets and lease liabilities on the Company’s consolidated balance sheets, but it will not have a material impact on the Company’s consolidated statement of income. The adoption of TopicASC 842 will also resultare as follows (in thousands):
| | | | | | | | | | | | | | | | | |
| Three Months Ended March 31, 2021 |
| As Previously Reported | | Adjustments | | As Adjusted |
| Net income | $ | 75,852 | | | $ | (387) | | | $ | 75,465 | |
| Total other comprehensive income | 75,860 | | | (387) | | | 75,473 | |
| Comprehensive income attributable to non-controlling interests | 52,605 | | | (236) | | | 52,369 | |
| Total comprehensive income attributable to Maravai LifeSciences Holdings, Inc. | 23,255 | | | (151) | | | 23,104 | |
Select line items from the condensed consolidated statements of changes in enhanced disclosures.stockholders’ equity reflecting the adoption of ASC 842 are as follows (in thousands):
In June 2016, the FASB issued ASU 2016-13, Financial Instruments-Credit Losses (Topic 326): Measurement of Credit Losses on Financial Instruments which has been subsequently amended (“ASU 2016-13”). ASU 2016-13 revises the measurement of credit losses for most financial instruments measured at amortized cost, including trade receivables, from an incurred loss methodology to an expected loss methodology which results in earlier recognition of credit losses. Under the incurred loss model, a loss is not recognized until it is probable that the loss-causing event has already occurred. The new standard introduces a forward-looking expected credit loss model that requires an estimate of the expected credit losses over the life of the instrument by considering all relevant information including historical experience, current conditions, and reasonable and supportable forecasts that affect collectability. In addition, this standard also modifies the impairment model for available-for-sale debt securities, which are measured at fair value, by eliminating the consideration for the length of time fair value has been less than amortized cost when assessing credit loss for a debt security and provides for reversals of credit losses through income upon credit improvement. As a result of the Company having elected the extended transition period for complying with new or | | | | | | | | | | | | | | | | | |
| Three Months Ended March 31, 2021 |
| As Previously Reported | | Adjustments | | As Adjusted |
| Retained earnings | $ | 24,101 | | | $ | 1,525 | | | $ | 25,626 | |
| Non-controlling interest | 97,145 | | | 2,542 | | | 99,687 | |
| Total stockholders' equity | 209,756 | | | 4,067 | | | 213,823 | |
revisedSelect line items from the condensed consolidated statements of cash flows reflecting the adoption of ASC 842 are as follows (in thousands):
| | | | | | | | | | | | | | | | | |
| Three Months Ended March 31, 2021 |
| As Previously Reported | | Adjustments | | As Adjusted |
| Operating activities | | | | | |
| Net income | $ | 75,852 | | | $ | (387) | | | $ | 75,465 | |
| Adjustments to reconcile net income to net cash provided by operating activities: | | | | | |
| Depreciation | 1,854 | | | (598) | | | 1,256 | |
| Amortization of intangible assets | 5,040 | | | 1 | | | 5,041 | |
| Non-cash operating lease expense | — | | | 2,378 | | | 2,378 | |
| Non-cash interest expense recognized on lease facility financing obligation | 162 | | | (162) | | | — | |
| Other | (144) | | | (156) | | | (300) | |
| Changes in operating assets and liabilities: | | | | | |
| Inventory | (13,828) | | | 20 | | | (13,808) | |
| Prepaid expenses and other assets | 98 | | | (679) | | | (581) | |
| Accrued expenses and other current liabilities | (11,044) | | | 298 | | | (10,746) | |
| Other long-term liabilities | (280) | | | (1,103) | | | (1,383) | |
| Net cash provided by operating activities | 38,715 | | | (389) | | | 38,326 | |
| Investing activities | | | | | |
| Purchases of property and equipment | (3,580) | | | 248 | | | (3,332) | |
| Net cash used in investing activities | (3,032) | | | 248 | | | (2,784) | |
| Financing activities | | | | | |
| Payments made on facility financing lease obligation and capital lease | (141) | | | 141 | | | — | |
| Net cash used in financing activities | (24,199) | | | 141 | | | (24,058) | |
Recently Adopted Accounting Pronouncements
In November 2021, the Financial Accounting Standards Board (“FASB”) issued Accounting Standards Update (“ASU”) 2021-10, Government Assistance (Topic 832) - Disclosures by Business Entities about Government Assistance (“ASU 2021-10”). ASU 2021-10 provides guidance to increase the transparency of government assistance including the disclosure of: (i) the types of assistance, (ii) an entity’s accounting standards pursuant to Section 107(b)for the assistance, and (iii) the effect of the JOBS Act,assistance on an entity’s financial statements. Under the new guidance, an entity is required to provide the following annual disclosures about transactions with a government that are accounted for by applying a grant or contribution accounting model by analogy: (i) information about the nature of the transactions and assuming the Company continuesrelated accounting policy used to account for the transactions, (ii) the line items on the balance sheet and income statement that are affected by the transactions, and the amounts applicable to each financial statement line item, and (iii) significant terms and conditions of the transactions, including commitments and contingencies. The new guidance is required to be considered an Emerging Growth Company,adopted either: (i) prospectively to all transactions within the scope of the amendments that are reflected in financial statements at the date of initial application and new transactions that are entered into after the date of initial application, or (ii) retrospectively to those transactions. We adopted ASU 2016-13, will be effective for the Company2021-10 on January 1, 2023, with early adoption permitted. The Company is currently assessing2022 using the prospective method. There was no impact of adopting this standard on itsto the Company’s condensed consolidated financial statements and disclosures.as a result of the adoption of this ASU.
In August 2018,October 2021, the FASB issued ASU 2018-15,2021-08, Intangibles—Goodwill and Other—Internal-Use Software (Subtopic 350-40): Customer’sBusiness Combinations (Topic 805) - Accounting for Implementation Costs Incurred in a Cloud Computing Arrangement That Is a Service Contract Assets and Contract Liabilities from Contracts with Customers (“ASU 2018-15”2021-08”). The ASU aligns the requirements for capitalizing implementation costs incurred, which requires an acquirer in a hosting arrangement that isbusiness combination to recognize and measure contract assets and contract liabilities in accordance with ASC 606, Revenue from Contracts with Customers, as if it had originated the contracts. This approach differs from the current requirement to measure contract assets and contract liabilities acquired in a service contract with the requirements for capitalizing implementation costs incurred to develop or obtain internal-use software. This new standard also requires customers to expense the capitalized implementation costs of a hosting arrangement that is a service contract over the term of the hosting arrangement. Thisbusiness combination at fair value. ASU 2021-08 is effective for years beginning after December 15, 2020, and31, 2022, including interim periodperiods within annual periods beginning after December 15, 2021,those fiscal years, with early adoption permitted. The ASU is to be applied prospectively to business combinations occurring on or after the effective date of its adoption. The Company has not yet determinedearly adopted ASU 2021-08 and there was no impact to the potential effects of this ASU on itsCompany’s condensed consolidated financial statements.
In October 2018, the FASB issued ASU 2018-17, Consolidation (Topic 810): Targeted Improvements to the Related Party Guidance for Variable Interest Entities. ASU 2018-17 changes how entities evaluate decision-making fees under the variable interest entity guidance. To determine whether decision-making fees represent a variable interest, an entity considers indirect interests held through related parties under common control on a proportional basis, rather than in their entirety. This guidance is effective for fiscal years, beginning after December 15, 2020 and interim periods within fiscal years beginning after December 15, 2021, with early adoption permitted. All entities are required to apply the amendments in this ASU retrospectively with a cumulative-effect adjustment to retained earnings at the beginning of the earliest period presented. The Company is currently evaluating the impact this standard will have on its consolidated financial statements and disclosures.
In August 2020, the FASB issued ASU 2020-06, Debt - Debt with Conversion and Other Options (Subtopic 470-20) and Derivatives and Hedging-Contracts in Entity’s Own Equity (Subtopic 815-40) - Accounting for Convertible Instruments and Contracts in an Entity’s Own Equity (“ASU 2020-06”), which simplifies the accounting for convertible instruments, amends the guidance on derivative scope exceptions for contracts in an entity’s own equity, and modifies the guidance on diluted earnings per share calculation as a result of these changes. The standard is effective for the Company for annual reporting periods beginning after December 15, 2023. The Company is currently evaluating the impact the adoption of this standard may haveASU.
2.Acquisition
MyChem, LLC
On January 27, 2022, the Company completed the acquisition of MyChem, LLC (“MyChem”), a privately-held San Diego, California-based provider of ultra-pure nucleotides to customers in the diagnostics, pharma, genomics and research markets. The acquisition will vertically integrate the Company’s supply chain and expand its product offerings for inputs used in the development of therapeutics and vaccines.
The Company acquired MyChem for a total purchase consideration of $257.8 million, subject to customary post-closing adjustments, including a working capital settlement. The total cash consideration paid at closing was $240.0 million using existing cash on itshand. The transaction was accounted for as an acquisition of a business as MyChem consisted of inputs and processes applied to those inputs that had the ability to contribute to the creation of outputs.
For the three months ended March 31, 2022, the Company incurred $3.0 million in transaction costs associated with the acquisition of MyChem, which were recorded within selling, general and administrative in the condensed consolidated financial statements.statements of income.
In March 2020, the FASB issued ASU 2020-04, Reference Rate Reform (Topic 848) (“Update 2020-04”), for facilitationThe acquisition date fair value of consideration transferred to acquire MyChem consisted of the effectsfollowing (in thousands):
| | | | | |
| Cash paid | $ | 240,012 | |
| Consideration payable | 10,000 | |
| Fair value of contingent consideration | 7,800 | |
| Total consideration transferred | $ | 257,812 | |
Pursuant to the Securities Purchase Agreement (the “MyChem SPA”) between the Company and sellers of reference rate reform on financial reporting. This updateMyChem, additional payments to the sellers of MyChem are dependent upon meeting or exceeding defined revenue targets during fiscal 2022 (the “Performance Payment”). The MyChem SPA provides optional guidance for a limitedtotal maximum Performance Payment of $40.0 million. The MyChem SPA also provides that the Company will pay to the sellers of MyChem an additional $20.0 million (the “Retention Payment”) as of the second anniversary of the closing of the acquisition date as long as two senior employees who are also the sellers of MyChem continue to be employed by TriLink. The Company considers the payment of the Retention Payment as probable and is recognizing compensation expense related to this payment in the post-acquisition period ratably over the expected service period of timetwo years. The MyChem SPA further provides that the Company will pay to help ease the potential burden in accounting for, or recognizingsellers of MyChem an additional amount of up to $10.0 million subject to the effectscompletion of reference rate reformcertain calculations associated with acquired inventory, which has been recorded within other long-term liabilities on financial reporting.the condensed consolidated balance sheet as of March 31, 2022. The amendmentsPerformance Payment was recorded as contingent consideration and was included as part of the purchase consideration. For the three months ended March 31, 2022, the Company recorded $1.7 million of compensation expense related to the Retention Payment within research and development in the guidance provide optional expedientscondensed consolidated statements of income.
The Company estimated the fair value of the Performance Payment contingent consideration based on a Monte-Carlo simulation model which utilized an income approach. The estimated fair value was based on MyChem revenue projections, expected payout term, volatility and exceptions for applying GAAP to contracts, hedging relationships, and other transactions affected by reference rate form if certain criteriarisk adjusted discount rates which are met. The amendments apply to contracts, hedging relationships, and other transactions that reference London inter-bank Offered Rate (“LIBOR”) or another reference rate expected to be discontinued becauseLevel 3 inputs (see Note 4). As of reference rate reform. When elected, the optional expedients for contract modifications are applied consistently for all eligible contracts or eligible transactions within the relevant areas of GAAP. This guidance was effective upon issuance and may generally be applied through DecemberMarch 31, 2022. In January 2021, the FASB issued ASU 2021-01, Reference Rate Reform (Topic 848) to clarify that certain optional expedients and exceptions apply to modification of derivative contracts and certain hedging relationships affected by2022, there were no significant changes in the interest rates usedestimated fair value of the Performance Payment compared to its acquisition date fair value.
As the Company is in the process of finalizing the evaluation of certain liabilities and assets, the allocation of purchase consideration is preliminary and provisional measurements of certain liabilities and goodwill are subject to change. The
following table summarizes the estimated fair values of the assets acquired and liabilities assumed at the acquisition date (in thousands):
| | | | | |
| Cash | $ | 1,176 | |
| Current assets | 2,741 | |
| Intangible assets, net | 123,360 | |
| Other assets | 9,288 | |
| Total identifiable assets acquired | 136,565 | |
| Current liabilities | (1,123) | |
| Other long-term liabilities | (8,399) | |
| Total liabilities assumed | (9,522) | |
| Net identifiable assets acquired | 127,043 | |
| Goodwill | 130,769 | |
| Net assets acquired | $ | 257,812 | |
The acquisition was accounted for under the acquisition method of accounting, and therefore, the total purchase price was allocated to the identifiable tangible and intangible assets acquired and the liabilities assumed based on their respective fair values as of the acquisition date. Purchase consideration in excess of the amounts recognized for the net assets acquired was recognized as goodwill. Goodwill is primarily attributable to expanded synergies expected from the acquisition associated with a vertical supply integration. There were no tax impacts associated with the acquisition due to the pass-through income tax treatment of MyChem. All of the goodwill acquired in connection with the acquisition of MyChem was allocated to the Company’s Nucleic Acid Production segment and is deductible to Topco LLC for income tax purposes.
Upon closing of the acquisition, approximately $1.0 million was placed into escrow to cover potential working capital adjustments and approximately $12.5 million was placed into escrow to secure certain representations and warranties pursuant to the terms of the purchase agreement. These amounts are included in the total purchase consideration of $257.8 million. Because these amounts held in escrow are not controlled by the Company, they are not included in the accompanying condensed consolidated balance sheet as of March 31, 2022.
The following table summarizes the estimated fair values of MyChem’s identifiable intangible assets as of the date of acquisition and their estimated useful lives:
| | | | | | | | | | | |
| Estimated Fair Value
(in thousands) | | Estimated Useful Life
(in years) |
| Trade Names | $ | 460 | | | 3 |
| Developed Technology | 121,000 | | | 12 |
| Customer Relationships | 1,900 | | | 12 |
| Total | $ | 123,360 | | | |
The trade name and customer relationship intangible assets are related to the MyChem’s name, customer loyalty and customer relationships. The developed technology intangible asset is related to processes and techniques for synthesizing and developing ultra-pure nucleotides. The fair value of these intangible assets was based on MyChem’s projected revenues and were estimated using an income approach, specifically the multi-period excess earnings method. Under the income approach, an intangible asset’s fair value is equal to the present value of future economic benefits to be derived from ownership of the asset. The estimated fair value was developed by discounting future net cash flows computing variation margin settlements,to their present value at market-based rates of return utilizing Level 3 inputs. The useful lives for these intangible assets was determined based upon the remaining period for which the assets that are expected to contribute directly or indirectly to future cash flows. Key quantitative assumptions used in the determination of fair value of the developed technology intangible included revenue growth rates ranging from 3.0% to 30.6%, a discount rate of 16.5% and for calculating price alignment interest. ASU 2021-01 is effective beginningan assumed technical obsolescent curve range of 5.0% to 7.5%.
Pursuant to the terms of the MyChem SPA, the Company recognized an indemnification asset of $8.0 million within other assets, which represented the seller’s obligation to reimburse pre-acquisition income tax liabilities assumed in the acquisition, and was recorded within other long-term liabilities.
The carrying value of the remaining assets acquired or liabilities assumed was estimated to equal their fair values based on January 7, 2021 and may be applied retrospectively or prospectively to such transactions through December 31, 2022. We are currently evaluating our contracts and we do not expecttheir short-term nature. These estimates were based on the assumption that the adoptionCompany believes to be reasonable; however, actual results may differ from these estimates.
Revenue and earnings from MyChem included in the Company’s condensed consolidated statements of this guidance willincome since the date of acquisition were immaterial.
No proforma revenue or earnings information for the three months ended March 31, 2022 and 2021 have abeen presented as the impact was not determined to be material impact on ourto the Company’s condensed consolidated financial statementsrevenues and disclosures.net income for the respective periods.
2.3.Goodwill and Intangible Assets
The Company’s goodwill of $224.3$283.5 million and $152.8 million as of March 31, 20212022 and December 31, 2020,2021, respectively, represents the excess of purchase consideration over the fair value of assets acquired and liabilities assumed. As of March 31, 20212022 and December 31, 2020,2021, the Company had 43 reporting units, 2 of which are contained in the Nucleic Acid Production segment. During the three months ended March 31, 2022, the Company recorded goodwill of $130.8 million in connection with the acquisition of MyChem that was completed in January 2022 (see Note 2). The Company has not recognized any goodwill impairment in any of the periods presented.
The following istable summarizes the activity in the Company’s goodwill by segment for the period presented (in thousands):
| | | | | | | | | | | | | | | | | | | | | | | |
| Nucleic Acid
Production | | Biologics
Safety
Testing | | Protein
Detection | | Total |
| March 31, 2021 | $ | 32,838 | | | $ | 119,928 | | | $ | 71,509 | | | $ | 224,275 | |
| December 31, 2020 | $ | 32,838 | | | $ | 119,928 | | | $ | 71,509 | | | $ | 224,275 | |
| | | | | | | | | | | | | | | | | |
| Nucleic Acid Production | | Biologics Safety Testing | | Total |
| Balance as of December 31, 2021 | $ | 32,838 | | | $ | 119,928 | | | $ | 152,766 | |
| Acquisition | 130,769 | | | — | | | 130,769 | |
| Balance as of March 31, 2022 | $ | 163,607 | | | $ | 119,928 | | | $ | 283,535 | |
Intangible assets are being amortized on a straight-line basis, which reflects the expected pattern in which the economic benefits of the intangible assets are being obtained, over an estimated useful life ranging from 5 to 1514 years.
The following are components of finite-lived intangible assets and accumulated amortization are as follows:of the periods presented:
| | | As of March 31, 2021 | | March 31, 2022 |
| | Gross
Carrying
Amount | | Accumulated
Amortization | | Net
Carrying
Amount | | Estimated
Useful
Life (Min) | | Weighted
Average
Remaining
Amortization
Period | | Gross Carrying Amount | | Accumulated Amortization | | Net Carrying Amount | | Estimated Useful Life | | Weighted Average Remaining Amortization Period |
| | | | (in thousands) | | | | (in years) | | (in years) | | | | (in thousands) | | | | (in years) | | (in years) |
| Trade Names | Trade Names | $ | 11,490 | | | $ | 5,700 | | | $ | 5,790 | | | 5 - 15 | | 6.1 | Trade Names | $ | 7,580 | | | $ | 5,192 | | | $ | 2,388 | | | 5 - 10 | | 4.1 |
| Patents and Developed Technology | Patents and Developed Technology | 169,404 | | | 55,952 | | | 113,452 | | | 5 - 14 | | 9.2 | Patents and Developed Technology | 288,649 | | | 68,335 | | | 220,314 | | | 5 - 14 | | 10.2 |
| Customer Relationships | Customer Relationships | 83,323 | | | 29,949 | | | 53,374 | | | 10-14 | | 8.6 | Customer Relationships | 21,853 | | | 9,150 | | | 12,703 | | | 10 - 12 | | 7.2 |
| Total | Total | $ | 264,217 | | | $ | 91,601 | | | $ | 172,616 | | | 8.9 | Total | $ | 318,082 | | | $ | 82,677 | | | $ | 235,405 | | | 10.0 |
| | | As of December 31, 2020 | | December 31, 2021 |
| | Gross Carrying Amount | | Accumulated Amortization | | Net Carrying Amount | | Estimated Useful Life | | Weighted Average Remaining Amortization Period | | Gross Carrying Amount | | Accumulated Amortization | | Net Carrying Amount | | Estimated Useful Life | | Weighted Average Remaining Amortization Period |
| | | | (in thousands) | | | | (in years) | | (in years) | | | | (in thousands) | | | | (in years) | | (in years) |
| Trade Names | Trade Names | $ | 11,490 | | | $ | 5,384 | | | $ | 6,106 | | | 5 - 15 | | 6.3 | Trade Names | $ | 7,120 | | | $ | 5,012 | | | $ | 2,108 | | | 5 - 10 | | 2.9 |
| Patents and Developed Technology | Patents and Developed Technology | 169,404 | | | 52,809 | | | 116,595 | | | 5 - 14 | | 9.5 | Patents and Developed Technology | 167,648 | | | 63,465 | | | 104,183 | | | 5 - 14 | | 8.5 |
| Customer Relationships | Customer Relationships | 83,323 | | | 28,368 | | | 54,955 | | | 10 - 14 | | 8.8 | Customer Relationships | 19,953 | | | 8,673 | | | 11,280 | | | 10 - 12 | | 6.4 |
| Total | Total | $ | 264,217 | | | $ | 86,561 | | | $ | 177,656 | | | 9.1 | Total | $ | 194,721 | | | $ | 77,150 | | | $ | 117,571 | | | 8.1 |
During the three months ended March 31, 2022, the Company recorded intangible assets of $123.4 million in connection with the acquisition of MyChem that was completed in January 2022 (see Note 2).
The Company recognized $4.7 million and $3.1 million of amortization expense from intangible assets directly linked with revenue generating activities within cost of revenue in the condensed consolidated statementstatements of income for the three months
ended March 31, 2022 and 2021, and 2020.respectively. Amortization expense for intangible assets that are not directly related to sales generating activities of $0.8 million and $1.9 million was recorded as selling, general and administrative expenses for the three months ended March 31, 2022 and 2021, and 2020.respectively.
As of March 31, 2021,2022, the estimated future amortization expense for finite-lived intangible assets iswere as follows (in thousands):
| | 2021 (remaining nine months) | $ | 15,039 | | |
| 2022 | 19,428 | | |
| 2022 (remaining nine months) | | 2022 (remaining nine months) | $ | 18,742 | |
| 2023 | 2023 | 19,230 | | 2023 | 24,812 | |
| 2024 | 2024 | 19,230 | | 2024 | 24,812 | |
| 2025 | 2025 | 19,230 | | 2025 | 24,669 | |
| 2026 | | 2026 | 24,432 | |
| Thereafter | Thereafter | 80,459 | | Thereafter | 117,938 | |
| Total estimated amortization expense | Total estimated amortization expense | $ | 172,616 | | Total estimated amortization expense | $ | 235,405 | |
The following table summarizes the Company’s financial assets and liabilities that are measured at fair value on a recurring basis by level within the fair value hierarchy (in thousands):
| | | | | | | | | | | | | | | | | | | | | | | |
| Fair Value Measurements as of March 31, 2022 |
| Level 1 | | Level 2 | | Level 3 | | Total |
| Assets | | | | | | | |
| Interest rate cap | $ | — | | | $ | 3,715 | | | $ | — | | | $ | 3,715 | |
| Liabilities | | | | | | | |
| Contingent consideration | $ | — | | | $ | — | | | $ | 7,800 | | | $ | 7,800 | |
Assets and liabilities measured at fair value on a recurring basis as of December 31, 2021 were insignificant.
Contingent Consideration
In connection with the acquisition of MyChem (see Note 2), the Company is required to make contingent payments to the sellers of up to $40.0 million subject to achieving certain revenue thresholds. The preliminary fair value of the liability for the contingent payments recognized upon the acquisition as part of the purchase accounting opening balance sheet totaled $7.8 million. The preliminary fair value of the contingent consideration was determined using a Monte Carlo simulation-based model discounted to present value. Assumptions used in this calculation are expected revenue, a discount rate of 16.9% and various probability factors. The ultimate settlement of the contingent consideration could deviate from current estimates based on the actual results of these financial measures. The contingent consideration projected year of payment is 2023. This liability is considered to be a Level 3 financial liability that is remeasured each reporting period. Changes in fair value of contingent consideration are recognized as a gain or loss and recorded within change in estimated fair value of contingent consideration in the condensed consolidated statements of income.
The following table provides a reconciliation of liabilities measured at fair value on a recurring basis using significant unobservable inputs (Level 3) for the period presented (in thousands):
| | | | | |
| Contingent Consideration |
| Balance as of December 31, 2021 | $ | — | |
| Contingent consideration related to the acquisition of MyChem | 7,800 | |
| |
| Balance as of March 31, 2022 | $ | 7,800 | |
3.5.Balance Sheet Components
Inventory
Inventory consistsconsisted of the following as of the periods presented (in thousands):
| | | March 31, 2021 | | December 31, 2020 | | March 31, 2022 | | December 31, 2021 |
| Raw materials | Raw materials | | $ | 20,190 | | | $ | 11,112 | | Raw materials | $ | 20,054 | | | $ | 19,726 | |
| Work in process | Work in process | | 19,897 | | | 18,333 | | Work in process | 20,548 | | | 21,382 | |
| Finished goods | Finished goods | | 7,042 | | | 3,856 | | Finished goods | 10,807 | | | 10,449 | |
| Total inventory | Total inventory | | $ | 47,129 | | | $ | 33,301 | | Total inventory | $ | 51,409 | | | $ | 51,557 | |
4.Lease Commitments
The Company leases 4 facilities, including office, laboratory and manufacturing space under long-term non-cancelable operating leases. The leased facilities have initial terms of two to twelve, and two leases have multiple five-year renewal terms and the other leases having three-year and five-year renewal terms.
Rent expense for the three months ended March 31, 2021 and 2020, was approximately $1.0 million and $0.8 million, respectively. For the three months ended March 31, 2021 and 2020, reported rent expense is net of approximately $0.3 million and $0.4 million, respectively, of deferred gain being recognized over the life of the lease associated with the Company’s sale leaseback arrangement for its Burlingame, California facility.
In January 2020, the Company completed the sale of land, building and related building improvements specific to its facility in Burlingame, California for approximately $34.5 million in cash. Simultaneously, with the close of the transaction, the Company leased the property for a two-and-a-half-year period, resulting in a total of $3.3 million in new lease obligations through December 31, 2021. The Company’s sale of the building and immediate leaseback of the facility qualified for sale-leaseback accounting. The lease was evaluated and classified as an operating lease. Given the Company was considered to retain more than a minor part but less than substantially all of the use of the property, the present value of the minimum lease payment over the lease term of $3.1 million was required to be deferred and recognized as a reduction of rent expense over the life of the lease. Net of the $3.1 million in deferred gain, the Company recognized a net gain on the sale of the asset of $19.0 million during the three months ended March 31, 2020. In August 2020, the Company executed a six-month extension for the leased property, including escalating rent payments, with total incremental lease payments associated with the extension of $1.8 million. The unamortized deferred gain at the time of the modification, approximating $2.0 million, is being amortized on a prospective basis over the extended lease term. Upon execution of the amendment inclusive of escalating rent payments, expense is being recognized on a straight-line basis and the difference between the recognized rent expense and the amounts paid under the lease are being recorded as deferred rent included in other short-term and long-term liabilities on the consolidated balance sheet as of March 31, 2021 and December 31, 2020.
In July 2018, the Company entered into a lease for a new manufacturing facility (the “San Diego Facility Lease”). The lease included tenant improvement provisions for construction prior to occupancy. Construction on this new manufacturing facility began in 2018 and Company evaluated the extent of its financial and operational involvement in the tenant improvements to the San Diego Facility Lease to determine whether it was considered the owner of the construction project. The Company concluded that it was deemed to be the owner of the facility for accounting purposes (even though it did not meet the definition for legal purposes) during the construction period which began in 2018 and was completed in 2019. In 2019, upon completion of the construction, the Company evaluated the lease and concluded that the completed construction project failed to qualify for sale and leaseback accounting and has accounted for the lease as a financing lease transaction. The leased building and related improvements remain on the Company’s balance sheet as of March 31, 2021 and December 31, 2020 and rental payments associated with the San Diego Facility Lease have been allocated to operating lease expense for the ground underlying the leased building and principal and interest payments on the lease facility financing obligation. The Company recorded the fair value of the building asset and improvements, which was estimated to be $59.0 million and the related lease facility financing obligation of $51.2 million. The difference between the gross asset value and the lease facility financing obligation represents the approximate $8.0 million of building improvement costs reimbursed by the Company.
In September 2020, the Company amended its San Diego Facility lease agreement to provide for additional manufacturing and office space. The amended lease agreement provides for tenant improvements for construction prior to occupancy of $2.7 million, rent concessions, and escalating rent payments over the life of the lease which now expires in May 2030. The total future minimum lease payments under the amended lease agreement are $57.1 million, with an option to renew subject to certain conditions. As of December 31, 2020, the anticipated tenant improvement allowance was recorded as a component of the lease facility financing obligation, a $2.0 million receivable for lessor-funded financing within prepaid and other current
assets, and $0.7 million in construction in progress for costs incurred to date as the Company has earned the right to this portion of the tenant allowance as of December 31, 2020. As of December 31, 2020, the Company had recognized $20.4 million and $1.7 million in construction in progress and accrued expenses. During the three months ended March 31, 2021, the Company earned the right to the remaining $2.0 million of the tenant allowance and recognized the amount as a component of the expanded space. Construction associated with the expansion was completed and placed into service during the three months ended March 31, 2021. As a result, approximately $21.0 million of cost was reclassified from construction in progress into building, leasehold improvements, and equipment.
The Company recognizes payments under the lease agreement as a reduction of the lease facility financing obligation using the effective interest method and the ground rent as operating lease expense as reflected in the schedule below. Payments on the San Diego Facility Lease obligation for the three months ended March 31, 2021 and 2020 were approximately $1.0 million and $0.6 million, respectively. For the three months ended March 31, 2021 and 2020 the Company recognized rent expense associated with the ground lease for the San Diego Facility Lease of approximately $0.2 million in the consolidated statements of income.
The Company is also considered to be the accounting owner of its Southport, North Carolina leased facility (the “Southport Facility”).
In 2017, the Company amended its initial lease with the former related party landlord to include the lease of additional space as well as an adjustment of the base rent for the existing space. The Company continues to recognize payments under the amended lease agreement as a reduction of the facility financing obligation using the effective interest method and the ground rent as operating lease expense as noted in the schedule below. As a result of the amendment, the Company anticipates the repayment of the financing obligation by September 2024. The fair value of the leased property established at acquisition continues to be depreciated over the building’s estimated useful life of thirty-five years. For the three months ended March 31, 2021 and 2020, payments on these lease obligations and the rent associated with the ground lease for the Southport Facility were not significant.
As of March 31, 2021, minimum annual payments under the Company’s non-cancelable lease agreements and lease financing obligations were follows (in thousands):
| | | | | | | | | | | | | | |
| | Lease Facility Financing Obligations | | Operating Leases |
| 2021 (remaining nine months) | | $ | 3,223 | | | $ | 2,112 | |
| 2022 | | 4,648 | | | 3,062 | |
| 2023 | | 5,014 | | | 1,336 | |
| 2024 | | 5,109 | | | 1,371 | |
| 2025 | | 5,071 | | | 1,104 | |
| 2026 and beyond | | 24,272 | | | 5,286 | |
| Total minimum payments | | 47,337 | | | 14,271 | |
| Less: amount representing interest | | (26,970) | | | |
| Present value of future minimum lease payments | | 20,367 | | | |
| Residual value of lease facility financing obligation | | 36,563 | | | |
| Less: short-term lease facility financing obligations | | (1,006) | | | |
| Long-term lease facility financing obligations | | $ | 55,924 | | | |
Operating leases in the table above includes future minimum lease payments for the ground lease for the Southport and San Diego Facilities and Vector sale-leaseback. Future minimum lease payments for the Vector sale-leaseback for the remaining nine months of fiscal year 2021 and full fiscal year 2022 are $1.2 million and $1.8 million, respectively.
5.6.Long-Term Debt
2020 Credit AgreementsAgreement
In October 2020, Maravai Intermediate Holdings, LLC (“Intermediate”), a wholly-owned subsidiary of Topco LLC, along with its subsidiaries (the “New Borrowers”Vector, TriLink and Cygnus (together with Intermediate, the “Borrowers”), entered into a credit agreement (the “New Credit(as amended, the “Credit Agreement”) to refinance existing $400.0 million long-term debt with a new $780.0 million facility. The New Credit Agreement, which provides for a First$600.0 million term loan facility, maturing October 2027 (the “Term Loan”), and a $180.0 million revolving credit facility (the “Revolving Credit Facility”).
In August 2021, in conjunction with the Company’s divestiture of the Protein Detection segment, the Company transferred, per the existing terms of the Credit Agreement, the portion of the Term Loan held by Vector of $118.4 million to Intermediate in its entirety. This amount was not assumed by Voyager Group Holdings, Inc., the entity that acquired Vector, as part of the divestiture. Total outstanding debt and loan covenant requirements remained unchanged as a result of the divestiture.
In January 2022, the Company entered into an amendment (the “Amendment”) to the Credit Agreement, among Intermediate, Cygnus, and TriLink, as the borrowers, Topco LLC, as holdings, the lenders from time-to-time party thereto and Morgan Stanley Senior Funding, Inc., as administrative and collateral agent (as amended, supplemented or otherwise modified, the “Credit Agreement”). The Company entered into the Amendment to: (i) refinance $544.0 million in aggregate principal amount of first lien term loans initially issued thereunder (the “First Lien Term Loan”) and replace it with a Tranche B Term Loan (the “New First Lien“Tranche B Term Loan”) of $600.0 million, maturing October 2027,; (ii) replace the LIBOR-based interest rate with a Term Secured Overnight Financing Rate (“SOFR”) based rate; and a(iii) reduce the interest rate margins applicable to the Term Loan and Revolving Credit Facility (the New Revolvingunder the Credit Facility”)Agreement. The previous interest rate margin on the facilities was, with respect to each LIBOR-based loan, 3.75% to 4.25% and, with respect to each base rate-based loan, 2.75% to 3.25% (depending, in each case, on consolidated first lien leverage). Following the Amendment, the interest rate margin on the facilities is 3.00%, with respect to each Term SOFR-based loan, and 2.00%, with respect to each base rate-based loan. Further, the Amendment reduces the base rate floor for upthe term loans from 2.00% to $180.0 million in funding. The New1.50%, sets the floor for Term SOFR-based term loans at 0.50% and sets the floor for Term SOFR-based revolving loans at 0.00%. No other significant terms under the Credit Agreement amended and restatedwere changed in connection with the Amendment.
Company’s prior credit agreement as of August 2018 (the “First and Second Lien Credit Agreements”). In November 2020, the Company repaid $50.0 million of principal balance of the New First Lien Term Loan using proceeds from the IPO. The New First Lien Term Loan bears interest at an annual rate equal to the Eurocurrency rate (i.e. the LIBOR rate) plus an applicable rate. The interest rate was 5.25% per annum asAs of March 31, 2021.2022, the interest rate on the Tranche B Term Loan was 3.50% per annum.
The New Credit Agreement also provides for a $20.0 million limit for letters of credit, which remained unused as of March 31, 2021 and December 31, 2020.2022.
Borrowings under the New Credit Agreement are unconditionally guaranteed by Topco LLC, together with the existing and future material domestic subsidiaries of Topco LLC (subject to certain exceptions), as specified in the respective guaranty agreements. Borrowings under the New Credit Agreement are also secured by a first-priority lien and security interest in substantially all of the assets (subject to certain exceptions) of existing and future material domestic subsidiaries of Topco LLC that are loan parties.
The Newaccounting related to entering into the Amendment was evaluated on a creditor-by-creditor basis to determine whether each transaction should be accounted for as a modification or extinguishment. Certain creditors under the First Lien Term Loan did not participate in this refinancing transaction, were repaid their principal and interest of $8.5 million and ceased being creditors of the Company and the repayment of their related outstanding debt balances has been accounted for as an extinguishment of debt. Proceeds of borrowings from new lenders of $8.5 million were accounted for as a new debt financing. The Company recorded a loss on extinguishment of debt of $0.2 million in the accompanying condensed consolidated statements of income for the three months ended March 31, 2022. For the remainder of the creditors, this transaction was accounted for as a modification because the change in present value of cash flows between the 2 term loans before and after the transaction was less than 10% on a creditor-by-creditor basis. As part of the refinancing, the Company incurred $0.9 million of various costs, of which an insignificant amount was related to an original issuance discount, and were all capitalized in the accompanying balance sheet within long-term debt, and are subject to amortization over the term of the refinanced debt as an adjustment to interest expense using the effective interest method.
We also incurred $0.3 million of financing-related fees related to the Revolving Credit Facility. As of March 31, 2022, unamortized debt issuance costs totaled $2.8 million and are recorded as assets within other assets on the accompanying condensed consolidated balance sheet as there is no balance outstanding related to the Revolving Credit Facility.
Commencing with the fiscal year ended December 31, 2021, and each fiscal year thereafter, the Credit Agreement requires that we make mandatory prepayments on the Term Loan principal upon certain excess cash flow, subject to certain step-downs based on the Company’s first lien net leverage ratio. The mandatory prepayment shall be reduced to 25% or 0% of the calculated excess cash flow if the first lien net leverage ratio was equal to or less than 4.75:1.00 or 4.25:1.00, respectively, however, no prepayment shall be required to the extent excess cash flow calculated for the respective period is equal to or less than $10.0 million. As of March 31, 2022, the Company’s first lien net leverage ratio was less than 4.25:1.00, thus a prepayment was not required.
The Tranche B Term Loan became repayable in quarterly payments of $1.4 million beginning in March 2022, with all remaining outstanding principal due in October 2027. The Tranche B Term Loan includes prepayment provisions that allow the Company, at our option, to repay all or a portion of the principal amount at any time. The Revolving Credit Facility allows the Company to repay and borrow from time to time until October 2025, at which time all amounts borrowed must be repaid. Subject to certain exceptions and limitations, we are required to repay borrowings under the Tranche B Term Loan and Revolving Credit Facility with the proceeds of certain occurrences, such as the incurrence of debt, certain equity contributions and certain asset sales or dispositions.
Accrued interest under the Credit Agreement is payable by us (a) quarterly in arrears with respect to Base Rate loans, (b) at the end of each interest rate period (or at each three-month interval in the case of loans with interest periods greater than three months) with respect to Term SOFR Rate loans, (c) on the date of any repayment or prepayment and (d) at maturity (whether by acceleration or otherwise). An annual commitment fee is applied to the daily unutilized amount under the Revolving Credit Facility at 0.375% per annum, with one stepdown to 0.25% per annum based on Intermediate’s first lien net leverage ratio.
The Credit Agreement contains certain covenants, including, among other things, covenants limiting our ability to incur or prepay certain indebtedness, pay dividends or distributions, dispose of assets, engage in mergers and consolidations, make acquisitions or other investments and make changes in the nature of the business. Additionally, the New Credit Agreement also requires us to maintain a certain net leverage ratio. The Company was in compliance with these covenants as of March 31, 2021.2022.
Interest Rate Cap
In the first fiscal quarter of 2021, the Company entered into a new interest rate cap agreement to manage a portion of its variable interest rate risk on its outstanding long-term debt. The contract, effective March 31, 2021, entitles the Company to receive from the counterparty at each calendar quarter end the amount, if any, by which a specified defined floating market rate exceeds the cap strike interest rate, applied to the contractscontract’s notional amount of $415.0 million The floating rate of interest is reset at the end of each three month period. The contract expires on March 31, 2023. The interest rate cap agreement has not been designated as a hedging relationship and has been recognized on the condensed consolidated balance sheet at fair value of $0.3$3.7 million within non-current assets with changes in fair value recognized within interest expense in the condensed consolidated statements of income.
The Company’s long-term debt consisted of the following as of the periods presented (in thousands):
| | | March 31, 2021 | | December 31, 2020 | | March 31, 2022 | | December 31, 2021 |
| New First Lien Term Loan | | $ | 548,500 | | | $ | 550,000 | | |
| Tranche B Term Loan | | Tranche B Term Loan | $ | 542,640 | | | $ | — | |
| First Lien Term Loan | | First Lien Term Loan | — | | | 544,000 | |
| Unamortized debt issuance costs | Unamortized debt issuance costs | | (14,907) | | | (15,386) | Unamortized debt issuance costs | (12,701) | | | (13,409) | |
| Total long-term debt | Total long-term debt | | 533,593 | | | 534,614 | Total long-term debt | 529,939 | | | 530,591 | |
| Less: current portion | Less: current portion | | (6,000) | | | (6,000) | Less: current portion | (5,440) | | | (6,000) | |
| Total long-term debt, less current portion | Total long-term debt, less current portion | | $ | 527,593 | | | $ | 528,614 | Total long-term debt, less current portion | $ | 524,499 | | | $ | 524,591 | |
There were 0no balances outstanding on the Company’s New Revolving Credit Facility as of March 31, 20212022 and December 31, 2020.2021.
As of March 31, 2021,2022, the aggregate future principal maturities of the Company’s debt obligations for each of the next five years, based on contractual due dates, were as follows (in thousands):
| | | | | |
| 2021 (remaining nine months) | $ | 4,500 | |
| 2022 | 6,000 | |
| 2023 | 6,000 | |
| 2024 | 6,000 | |
| 2025 | 6,000 | |
| Thereafter | 520,000 | |
| Total long-term debt | $ | 548,500 | |
6.Equity-Based Compensation
In November 2020, in connection with the IPO, the Company’s board of directors adopted the 2020 Omnibus Incentive Plan (the “2020 Plan”). All awards granted under the 2020 Plan are intended to be treated as (i) stock options, including incentive stock options (“ISOs”), (ii) stock appreciation rights (“SARs”), (iii) restricted share awards (“RSAs”), (iv) restricted stock units (“RSUs”), (v) dividend equivalents, or (vi) other stock or cash awards as may be determined by the plan’s administrator from time to time. The Company uses the Black-Scholes option pricing model to estimate the fair value of each option grant on the date of grant or any other measurement date.
Prior to the IPO, the Company’s parent, MLSH 1, granted unit-based awards to certain executives of the Company in the form of non-vested units. Our controlled subsidiary, MLSC, also granted unit-based awards to certain employees (collectively the “Incentive Units”). All awards of Incentive Units were measured based on the fair value of the award on the date of grant. Compensation expense for the Incentive Units is recognized over their requisite service period. The incentive units were subject to a combination of market, service or performance vesting conditions. For Incentive Units subject to performance conditions, the Company evaluated the probability of achieving each performance condition at each reporting date and recognized expense over the requisite service period when it was deemed probable that a performance condition will be met using the accelerated attribution method over the requisite service period. Upon completion of the IPO all of the Incentive Units subject to a performance and market condition became vested.
The following table sets forth the total equity-based compensation expense included in the Company’s consolidated statements of income (in thousands):
| | | | | | | | | | | |
| For the three months ended March 31 |
| 2021 | | 2020 |
| Cost of sales | $ | 510 | | | $ | 4 | |
| Research and development | 87 | | | 80 | |
| Selling, general and administrative | 1,681 | | | 424 | |
| Total equity-based compensation | $ | 2,278 | | | $ | 508 | |
NaN stock options were exercised or exercisable during the three months ended March 31, 2021.
As of March 31, 2021, the total unrecognized equity-based compensation related to stock options, Incentive Units and RSUs were $21.6 million, $2.9 million and $1.7 million, respectively, which is expected be recognized over a weighted-average period of approximately 3.7, 2.3 and 2.6 years, respectively. | | | | | |
| 2022 (remaining nine months) | $ | 4,080 | |
| 2023 | 5,440 | |
| 2024 | 5,440 | |
| 2025 | 5,440 | |
| 2026 | 5,440 | |
| Thereafter | 516,800 | |
| Total long-term debt | $ | 542,640 | |
7.Net Income Per Class A Common Share/UnitShare Attributable to Maravai LifeSciences Holdings, Inc.
Net income per unit for periods prior to our IPO have not been retrospectively adjusted to give effect to the Organizational Transactions described in Note 1 and the 69,000,000 shares of Class A common stock sold in our IPO. Additionally, basicBasic net income per Class A common stock for the three months ended March 31, 2021, has been calculated by dividing net income for the period, adjusted for net income attributable to non-controlling interests, by the weighted average Class A common stock outstanding during the period. Diluted net income per Class A common share gives effect to potentially dilutive securities by application of the treasury stock method or if-converted method, as applicable. Diluted net income per share of Class A common stock attributable to the Company is computed by adjusting the net income and the weighted-average number of shares of Class A common stock outstanding to give effect to potentially diluted securities.
Prior toThe following table presents the Organizational Transactions, the members’ equitycomputation of MLSC was comprised of Class Abasic and Class B preferred units, unit-based awards granted only to certain employees of its subsidiaries (“MLSC Incentive Units”) and MLSC common units, each with participation rights. The MLSC preferred units were entitled to cumulative dividends of 8.0% compounded annually, up to an additional 4.0%, also compounded annually, to the extent of remaining unallocated earnings. The preferred unitholders of MLSC were required, however, to share a portion of the additional 4.0% in dividends with the holders of MLSC Incentive Units based on a formula defined in the MLSC LLC Agreement. The Company determined that vested MLSC Incentive Units and MLSC Class A and B preferred units were participating securities under the two-class method at the MLSC subsidiary level, however, they do not have a contractual obligation to share in losses, and therefore no undistributed losses have been allocated to them. MLSH 1 Incentive Units are granted by the parent of the Company, and as a result, do not represent potential common units of the Company.
In September 2020, the Company entered into a Sale and Rollover Agreement and repurchased a majority of the outstanding MLSC Class B preferred units as well as entered into an agreement that resulted in an exchange of the remaining MLSC Class B preferred units and MLSC common units for MLSH 1 common units in November 2020 upon the IPO.
Prior to the Organizational Transactions and IPO, basicdiluted net income per common unitshare attributable to our memberthe Company for the three months ended March 31, 2020 was based on the weighted average number of common units outstanding during the period. Diluted net incomeperiods presented (in thousands, except per common unit is computed by adjusting the net income and the weighted-average number of common units outstanding to give effect to potentially dilutive securities.share amounts):
| | | For the three months ended March 31, | | | | | | | | | | | |
| | 2021 | | 2020 | | Three Months Ended
March 31, | |
| | (in thousands, except share and unit amounts and per share and per unit amounts) | | 2022 | | 2021
(as adjusted)* | |
| Net income per Class A common share/unit: | Net income per Class A common share/unit: | | Net income per Class A common share/unit: | | | | |
| Numerator—basic: | Numerator—basic: | | Numerator—basic: | | |
| Net income | Net income | $75,852 | | $ | 23,879 | | Net income | $ | 146,860 | | | $ | 75,465 | | |
| Less: preferred unit dividends attributable to the MLSC non-controlling interests | 0 | | (1,530) | | |
| Less: income attributable to common non-controlling interests | Less: income attributable to common non-controlling interests | (52,605) | | (21) | | Less: income attributable to common non-controlling interests | (79,998) | | | (52,363) | | |
| Net income attributable to Maravai LifeSciences Holdings, Inc.—basic | Net income attributable to Maravai LifeSciences Holdings, Inc.—basic | $23,247 | | $ | 22,328 | | Net income attributable to Maravai LifeSciences Holdings, Inc.—basic | $ | 66,862 | | | $ | 23,102 | | |
| Numerator—diluted: | Numerator—diluted: | | | | Numerator—diluted: | | | | |
| Net income attributable to Maravai LifeSciences Holdings, Inc.—basic | Net income attributable to Maravai LifeSciences Holdings, Inc.—basic | 23,247 | | 22,328 | Net income attributable to Maravai LifeSciences Holdings, Inc.—basic | $ | 66,862 | | | $ | 23,102 | | |
| Net income effect of dilutive securities: | Net income effect of dilutive securities: | | Net income effect of dilutive securities: | | |
| Effect of dilutive employee stock purchase plan ("ESPP") and restricted stock units | 4 | | 0 | |
| | Effect of dilutive employee stock purchase plan ("ESPP"), restricted stock units (“RSUs”) and stock options | | Effect of dilutive employee stock purchase plan ("ESPP"), restricted stock units (“RSUs”) and stock options | $ | 31 | | | $ | 4 | | |
| Effect of the assumed conversion of Class B common stock | | Effect of the assumed conversion of Class B common stock | 61,070 | | | — | | |
| Net income attributable to Maravai LifeSciences Holdings, Inc.—diluted | Net income attributable to Maravai LifeSciences Holdings, Inc.—diluted | $23,251 | | $22,328 | Net income attributable to Maravai LifeSciences Holdings, Inc.—diluted | $ | 127,963 | | | $ | 23,106 | | |
| Denominator—basic: | Denominator—basic: | | | | Denominator—basic: | | | | |
Weighted average Class A common shares/units outstanding—basic (1) | 96,646,515 | | 253,916,941 | |
| Net income per Class A common share/unit—basic | $0.24 | | $0.09 | |
| Weighted average Class A common shares outstanding—basic | | Weighted average Class A common shares outstanding—basic | 131,489 | | | 96,647 | | |
| Net income per Class A common share—basic | | Net income per Class A common share—basic | $ | 0.51 | | | $ | 0.24 | | |
| Denominator—diluted: | Denominator—diluted: | | | | Denominator—diluted: | | | | |
Weighted average Class A common shares/units outstanding—basic (1) | 96,646,515 | | 253,916,941 | |
| Weighted average Class A common shares outstanding—basic | | Weighted average Class A common shares outstanding—basic | 131,489 | | | 96,647 | | |
| Weighted average effect of dilutive securities: | Weighted average effect of dilutive securities: | | Weighted average effect of dilutive securities: | | |
| Effect of dilutive restricted stock units | 17,481 | | 0 | |
| Effect of dilutive ESPP | 8,972 | | 0 | |
| Weighted average Class A common shares/units outstanding—diluted (1) | 96,672,968 | | 253,916,941 | |
| Net income per Class A common share/unit—diluted | $0.24 | | $0.09 | |
| Effect of dilutive ESPP, RSUs and stock options | | Effect of dilutive ESPP, RSUs and stock options | 129 | | | 26 | | |
| Effect of the assumed conversion of Class B common stock | | Effect of the assumed conversion of Class B common stock | 123,669 | | | — | | |
| Weighted average Class A common shares outstanding—diluted | | Weighted average Class A common shares outstanding—diluted | 255,287 | | | 96,673 | | |
| Net income per Class A common share—diluted | | Net income per Class A common share—diluted | $ | 0.50 | | | $ | 0.24 | | |
____________________
(1)*AmountsAs adjusted to reflect the impact of the adoption of ASC 842. See Note 1 for a summary of the three months ended March 31, 2021 represent sharesadjustments.
Shares of Class B common stock do not share in the earnings or losses of the Company and are therefore not participating securities. As such, a separate presentation of basic and diluted net income per share for Class B common stock under the two-class method has not been presented.
The following table presents potentially dilutive securities excluded from the computation of diluted net income per share/unitshare for the periods presented because their effect would have been anti-dilutive:anti-dilutive for the periods presented (in thousands):
| | | For the three months ended March 31 | | Three Months Ended
March 31, | |
| | 2021 | | 2020 | | 2022 | | 2021 | |
| Time-based incentive units | 0 | | 1,140 | |
| Performance-based incentive units | 0 | | 2,849 | |
| | Stock options | Stock options | 1,587 | | 0 | Stock options | 2,049 | | 1,587 | |
| Shares estimated to be purchased under the ESPP | | Shares estimated to be purchased under the ESPP | 53 | | — | |
| Shares of Class B common stock | Shares of Class B common stock | 160,974 | | 0 | Shares of Class B common stock | — | | 160,974 | |
| | 162,562 | | 3,989 | | 2,102 | | 162,561 | |
8.Income Taxes
We are subject to U.S. federal and state income taxes with respect to our allocable share of any taxable income or loss of Topco LLC, generated after the IPO, as well as any stand-alone income or loss we generate. Topco LLC is organized as a limited liability company and treated as a partnership for federal tax purposes with the exception of Maravai Inc. and its subsidiaries who are taxpaying entities in the U.S., Canada, and the U.K. Topco LLC generally does not pay income taxes on its taxable income in most jurisdictions. Instead, Topco LLC’s taxable income or loss is passed through to its members, including us. Maravai, Inc. files and pays corporate income taxes for U.S. federal and state income tax purposes and internationally, primarily within
The following table summarizes the U.K. and Canada. We anticipate this structure to remain in existence for the foreseeable future.
On March 11, 2021, the President signed the American Rescue Plan Act of 2021 (ARPA) into law. ARPA includes several provisions, such as measures that extend and expand the employee retention credit, previously enacted under the Coronavirus Aid, Relief and Economic Security Act (CARES Act), through December 31, 2021. ARPA also contains other provisions that do not have a material impact on ourCompany’s income tax expense and effective tax rate.rate for the periods presented (in thousands, except percentages):
| | | | | | | | | | | | | | | |
| Three Months Ended
March 31, | | |
| 2022 | | 2021
(as adjusted)* | | | | |
| Income before income taxes | $ | 166,841 | | | $ | 89,174 | | | | | |
| Income tax expense | $ | 19,981 | | | $ | 13,709 | | | | | |
| Effective tax rate | 12.0 | % | | 15.4 | % | | | | |
____________________
*As adjusted to reflect the impact of the adoption of ASC 842. See Note 1 for a summary of the adjustments.
The Company’s effective income tax rate was 15.3% and 13.2%of 12.0% for the three months ended March 31, 2021 and 2020, respectively.2022 differed from the U.S. federal statutory rate of 21.0%, primarily due to income associated with the non-controlling interest.
The following table summarizes our income tax expense (in thousands, except percentages):
| | | | | | | | | | | |
| Three months ended March 31, |
| 2021 | | 2020 |
| Income before provision for income taxes | $ | 89,561 | | | $ | 27,514 | |
| Provision for income taxes | $ | 13,709 | | | $ | 3,635 | |
| Effective tax rate | 15.3 | % | | 13.2 | % |
OurCompany’s effective tax rate of 15.3%15.4% for the three months ended March 31, 2021 differed from the U.S. federal statutory rate of 21.0%, primarily due to income associated with the non-controlling interest and an increase in tax expense due to adjustments to the deferred tax assets for our investment in Topco LLC, which is expected to be recovered at lower effective state tax rates.
The provision for income taxes for the period ended March 31, 2020 relates to the corporate operating companies under Maravai LifeSciences Holdings, Inc. as we did not own units in Topco LLC. Our effective tax rate of 13.2% for the three months ended March 31, 2020 differed from the U.S. federal statutory rate of 21%, primarily due to income associated with the non-controlling interest and a discrete tax charge associated with a building sale offset with a release of valuation allowance on our excess interest expense carryforward due to the enactment of the Coronavirus Aid, Relief, and Economic Security (“CARES”) Act, which modified the calculation of interest deductions for 2019 and 2020.
Tax Distributions to Topco LLC’s Owners
Topco LLC is subject to an operating agreement put in place at the date of the Organizational Transactions.Transactions (“LLC Operating Agreement”). The agreementLLC Operating Agreement has numerous provisions related to allocations of income and loss, as well as timing and amounts of distributions to its owners. This agreement also includes a provision requiring cash distributions enabling its owners to pay their taxes on income passing through from Topco LLC. These tax distributions are computed based on an assumed income tax rate equal to the sum of (i) the maximum combined marginal federal and state income tax rate applicable to an individual and (ii) the net investment income tax. The assumed income tax rate currently totals 46.7%, which may increase to 54.1% in certain cases where the qualified business income deduction is unavailable.
In addition, under the tax rules, Topco LLC is required to allocate taxable income disproportionately to its unit holders. Because tax distributions are determined based on the holder of LLC Units who is allocated the largest amount of taxable income on a per unit basis, but are made pro rata based on ownership, Topco LLC is required to make tax distributions that, in the aggregate, will likely exceed the amount of taxes Topco LLC would have otherwise paid if it were taxed on its taxable income at the assumed income tax rate. Topco LLC is subject to entity level taxation in certain states and certain of its subsidiaries are subject to entity level U.S. and foreign income taxes. As a result, the accompanying condensed consolidated statements of income
include income tax expense related to those states and to U.S. and foreign jurisdictions where Topco LLC or any of our subsidiaries are subject to income tax.
During the three months ended March 31, 2022, Topco LLC paid tax distributions of $82.3 million to its owners, including $42.4 million to us. During the three months ended March 31, 2021, Topco LLC paid tax distributions of $37.0 million to its owners, including $13.9 million to us. As of March 31, 2021, 02022, no amounts for tax distributions havehad been accrued as such payments were made during the quarter.
9.Related Party Transactions
GTCR, LLC and MLSH 1
Prior to the IPO,1’s majority owner is GTCR, LLC (“GTCR”),. The Company’s Chief Executive Officer (“CEO”) and Chief Financial Officer (“CFO”) are executives or MLSH 1’s majority owner, provided subsidiaries of the Company with financial1. The Company’s CEO, CFO and management consulting services through an advisory services agreement. The advisory services agreement provided that the Company pay a $0.1 million quarterly management fee to GTCR. The advisory services agreement was terminated in connection with the IPO. The Company incurred approximately $0.1 million in management fees to GTCR for the three months ended March 31, 2020.
The Company also reimburses GTCR for out-of-pocket expenses incurred while providing the above professional services. During the three months ended March 31, 2021 and 2020, out-of-pocket expenses incurred to GTCR were insignificant.
In March 2021, the Company made a $23.1 million distribution for tax liabilities to MLSH 1.
Legacy Owners of Cygnus
The non-controlling interests in MLSC represent equity interest that was retained by the shareholders of the MLSC entity prior to its acquisition by the Company. The President of Cygnus and his affiliated entity were the owners of the non-controlling interests. In September 2020, Topco LLC and MLSH 1 entered into a Sale and Rollover Agreement with the President of Cygnus and his affiliated entity to purchase certain MLSC Class B preferred units and common units as well as exchange the remaining MLSC Class B preferred units and common units for a variable numberGeneral Counsel are executives of MLSH 1 common units. As a result of this transaction, the President of Cygnus and his affiliated entity no longer held a non-controlling interest in MLSC upon the exchange of MLSH 1 common units for the remaining MLSC Class B preferred and common units which occurred in November 2020.
The Company leases the Southport Facility, which through the date of the Organizational Transactions was owned by an entity controlled by a close relative of the President of one of its subsidiaries. The President of this subsidiary also personally financed a loan to this entity, which was used to acquire the property leased by the Company. For the three months ended March 31, 2020, the Company paid less than $0.1 million in lease payments for the lease facility.2.
Payable to Related Parties Pursuant to athe Tax Receivable Agreement
We are a party to a tax receivable agreement (“TRA”)the TRA with MLSH 1 and MLSH 2. The TRA provides for the payment by us to MLSH 1 and MLSH 2, collectively, of 85% of the amount of certain tax benefits, if any, that we actually realize, or in some circumstances are deemed to realize, as a result of the Organizational Transactions, IPO and IPO.any subsequent purchases or exchanges of LLC Units of Topco LLC. Based on our current projections of taxable income, and before deduction of any specially allocated depreciation and amortization, we anticipate having enough taxable income to utilize most of these tax benefits.
As of March 31, 2021,2022, our liability under the TRA is $383.7$746.0 million payable to MLSH 1 and MLSH 2, under the TRA, representing approximately 85% of the calculated tax savings we anticipate being able to utilize in future years. ForDuring the three months ended March 31, 2021,2022, the Company recognized a $5.9gain of $2.3 million gain on TRA liability adjustment reflecting a change in the tax benefit obligation attributable to a change in the expected tax benefit. The remeasurement was primarily due to changes in our estimated state apportionment and the corresponding reduction of our estimated state tax rate.
ForDuring the fiscal quarterthree months ended March 31, 2021, 02022, no payments were made to MLSH1MLSH 1 or MLSH 2 pursuant to the TRA and $1.3 millionTRA.
Topco LLC Operating Agreement
MLSH 1 is party to the LLC Operating Agreement put in place at the date of the liabilityOrganizational Transactions. This agreement includes a provision requiring cash distributions enabling its owners to pay their taxes on income passing through from Topco LLC. During the three months ended March 31, 2022 and 2021, the Company made distributions of $39.9 million and $23.1 million, respectively, for tax liabilities to MLSH 1 under this agreement.
Contract Development and Manufacturing Agreement with Curia Global
GTCR has been reclassified as short-term liability.significant influence over Curia Global. During the three months ended March 31, 2022 and 2021, the Company paid insignificant amounts to Curia Global (“Curia”), an entity for which GTCR exercises significant influence, for contract manufacturing and development services. Such amounts were included in research and development expense on the condensed consolidated statements of income.
10.Segments
The Company’s financial performance is reported in 3 segments. A description of each segment follows:
•Nucleic Acid Production: focuses on the manufacturing and sale of highly modified nucleic acids products to support the needs of customers’ research, therapeutic and vaccine programs. This segment also provides research products for labeling and detecting proteins in cells and tissue samples.
•Biologics Safety Testing: focuses on manufacturing and selling biologics safety and impurity tests and assay development services that are utilized by our customers in their biologic drug manufacturing spectrum.
•Protein Detection: focusesfocused on manufacturing and selling labeling and visual detection reagents to scientific research customers for their tissue-based protein detection and characterization needs. The Company completed the divestiture of its Protein Detection business in September 2021.
The Company has determined that adjusted earnings before interest, tax, depreciation and amortization (“Adjusted EBITDA”) is the profit or loss measure that the CODM uses to make resource allocation decisions and evaluate segment performance. Adjusted EBITDA assists management in comparing the segment performance on a consistent basis for purposes of business decision-making by removing the impact of certain items that management believes do not directly reflect the core operations and, therefore, are not included in measuring segment performance. The Company defines Adjusted EBITDA as net income
before interest, taxes, depreciation and amortization, certain non-cash items and other adjustments that we do not consider in our evaluation of ongoing operating performance from period to period. Corporate costs are managed on a standalone basis and not allocated to segments.
Following isThe following tables include financial information relating to the operating segments for the periods presented (in thousands):
| | For the three months ended March 31, 2021 | Nucleic Acid
Production | | Biologics
Safety
Testing | | Protein
Detection | | Corporate | | Eliminations | | Total | |
| | | Three Months Ended March 31, 2022 |
| | | Nucleic Acid Production | | Biologics Safety Testing | | | Corporate | | Eliminations | | Total |
| Revenue | Revenue | $ | 124,169 | | | $ | 17,649 | | | $ | 6,630 | | | $ | 0 | | | $ | (237) | | | $ | 148,211 | | Revenue | $ | 223,650 | | | $ | 20,643 | | | | $ | — | | | $ | — | | | $ | 244,293 | |
| Adjusted EBITDA | Adjusted EBITDA | $ | 95,613 | | | $ | 14,330 | | | $ | 2,267 | | | $ | (10,336) | | | $ | 58 | | | $ | 101,932 | | Adjusted EBITDA | $ | 182,799 | | | $ | 16,532 | | | | $ | (12,339) | | | $ | — | | | $ | 186,992 | |
| | | | | | | | | | | | | | | | | | | | | | | | | | | | | | | | | | | |
| For the three months ended March 31, 2020 | Nucleic Acid
Production | | Biologics
Safety
Testing | | Protein
Detection | | Corporate | | Eliminations | | Total |
| Revenue | $ | 30,892 | | | $ | 14,293 | | | $ | 6,198 | | | $ | 0 | | | $ | (402) | | | $ | 50,981 | |
| Adjusted EBITDA | $ | 18,830 | | | $ | 11,940 | | | $ | 3,293 | | | $ | (4,288) | | | $ | (224) | | | $ | 29,551 | |
| | | | | | | | | | | | | | | | | | | | | | | | | | | | | | | | | | | |
| Three Months Ended March 31, 2021 |
| Nucleic Acid Production | | Biologics Safety Testing | | Protein Detection | | Corporate | | Eliminations | | Total |
| Revenue | $ | 124,169 | | | $ | 17,649 | | | $ | 6,630 | | | $ | — | | | $ | (237) | | | $ | 148,211 | |
| Adjusted EBITDA (as adjusted)* | $ | 95,032 | | | $ | 14,287 | | | $ | 1,959 | | | $ | (10,336) | | | $ | (46) | | | $ | 100,896 | |
____________________
*As adjusted to reflect the impact of the adoption of ASC 842. See Note 1 for a summary of the adjustments.
During the three months ended March 31, 2021, and 2020, intersegment revenue was $0.2 million and $0.4 million, respectively.million. The intersegment sales and the related gross margin on inventory recorded at the end of the period are eliminated for consolidation purposes in the Eliminations column. Internal selling prices for intersegment sales are consistent with the segment’s normal retail price offered to external parties. There was 0no commission expense recognized for intersegment sales for the three months ended March 31, 2021 and 2020.2021. Intersegment revenue represents intersegment revenue between the Nucleic Acid Production and Protein Detection segments. There was no inter-segment activity for the three months ended March 31, 2022.
The Company does not allocate assets to its reportable segments as they are not included in the review performed by the CODM for purposes of assessing segment performance and allocating resources.
A reconciliation of Adjusted EBITDA to net income, the most directly comparable GAAP measure, is set forth below for the periods presented (in thousands):
| | | For the three months ended March 31, | | Three Months Ended
March 31, | |
| | 2021 | | 2020 | | 2022 | | 2021
(as adjusted)* | |
| Net income | Net income | $ | 75,852 | | | $ | 23,879 | | Net income | $ | 146,860 | | | $ | 75,465 | | |
| Add: | Add: | | Add: | | |
| Amortization | Amortization | 5,041 | | | 5,075 | | Amortization | 5,527 | | | 5,041 | | |
| Depreciation | Depreciation | 1,854 | | | 1,691 | | Depreciation | 1,855 | | | 1,256 | | |
| Interest expense | Interest expense | 8,770 | | | 7,382 | | Interest expense | 2,664 | | | 7,904 | | |
| Income tax expense | Income tax expense | 13,709 | | | 3,635 | | Income tax expense | 19,981 | | | 13,709 | | |
| EBITDA | EBITDA | 105,226 | | | 41,662 | | EBITDA | 176,887 | | | 103,375 | | |
| Acquisition integration costs | Acquisition integration costs | (811) | | | 689 | | Acquisition integration costs | 4,779 | | | 4 | | |
| Acquired in-process research and development costs | 0 | | | 2,881 | | |
| | Equity-based compensation | Equity-based compensation | 2,278 | | | 508 | | Equity-based compensation | 3,627 | | | 2,278 | | |
| GTCR management fees | 0 | | | 211 | | |
| Gain on sale and leaseback transaction | 0 | | | (19,002) | | |
| | Merger and acquisition related expenses | Merger and acquisition related expenses | 919 | | | 902 | | Merger and acquisition related expenses | 1,188 | | | 919 | | |
| Financing costs | Financing costs | 206 | | | 1,700 | | Financing costs | 1,037 | | | 206 | | |
| Tax receivable agreement liability adjustment | Tax receivable agreement liability adjustment | (5,886) | | | 0 | | Tax receivable agreement liability adjustment | (2,340) | | | (5,886) | | |
| Other | | Other | 1,814 | | | — | | |
| Adjusted EBITDA | Adjusted EBITDA | $ | 101,932 | | | $ | 29,551 | | Adjusted EBITDA | $ | 186,992 | | | $ | 100,896 | | |
____________________
11.*Subsequent Events
On April 12, 2021,As adjusted to reflect the Company completed a secondary offering of 20,700,000 shares of its Class A common stock by certain selling stockholders, which included the full exerciseimpact of the underwriters’ option to purchase up to 2,700,000 additional shares
adoption of Class A common stock, atASC 842. See Note 1 for a price of $31.25 per share for total gross proceeds of $646.9 million. The selling stockholders were responsible for the underwriting discounts and commissions, and received allsummary of the net proceeds from the sale of shares of Class A common stock. The Company did 0t receive any proceeds from the sale of the shares of Class A common stock and bore the costs associated with the sale of the shares in the secondary offering. Immediately prior to closing of the secondary offering, MLSH 1 executed an exchange of 17,665,959 LLC units (paired with the corresponding shares of Class B common stock) for an equal number of Class A common stock to be sold in the secondary offering.adjustments.
Item 2. Management’s Discussion and Analysis of Financial Condition and Results of Operations
You should read the following discussion and analysis of financial condition and results of operations together with our condensed consolidated financial statements and related notes included elsewhere in this Quarterly Report on Form 10-Q and the audited consolidated financial statements and notes thereto included in our Annual Report on Form 10-K for the year ended December 31, 2020,2021, as filed with the Securities and Exchange Commission. This discussion and analysis reflects our historical results of operations and financial position, and contain forward-looking statements that involve risks and uncertainties. Our actual results could differ materially from those discussed in or implied by these forward-looking statements. Factors that could cause or contribute to such differences include, but are not limited to, those discussed in the section titled “Risk Factors” in our Annual Report on Form 10-K for the year ended December 31, 2020.2021. Please also see the section titled “Forward Looking“Special Note Regarding Forward-Looking Statements.” We were incorporated in August 2020 and, pursuant to the organizational transactionsOrganizational Transactions described in Note 1 to our condensed consolidated financial statements, became a holding company whose principal asset is a controlling equity interest in Topco LLC. As the sole managing member of Topco LLC, we operate and control the business and affairs of Topco LLC and its subsidiaries. Accordingly, we consolidate Topco LLC in our consolidated financial statements and report a non-controlling interest related to the portion of Topco LLC not owned by us. Because the organizational transactionsOrganizational Transactions were considered transactions between entities under common control, the consolidated financial statements for periods prior to the organizational transactionsOrganizational Transactions and the initial public offering have been adjusted to combine the previously separate entities for presentation purposes. Unless otherwise noted or the context otherwise requires, references in this Quarterly Report on Form 10-Q to “we,” “us” or “our” refer to Maravai LifeSciences Holdings, Inc. and its subsidiaries.
Overview
We are a leading life sciences company providing critical products to enable the development of drug therapies, diagnostics, novel vaccines and support research on human diseases. Our customers include the top global biopharmaceutical companies ranked by research and development expenditures according to industry consultants, and many other emerging biopharmaceutical and life sciences research companies, as well as leading academic research institutions and in vitro diagnostics companies. Our products address the key phases of biopharmaceutical development and include complex nucleic acids for diagnostic and therapeutic applications, antibody-based products to detect impurities during the production of biopharmaceutical products, and products to detect the expression of proteins in tissues of various species.
We have and will continue to build a transformative life sciences products company by acquiring businesses and accelerating their growth through capital infusions and industry expertise. Biomedical innovation is dependent on a reliable supply of reagents in the fields of nucleic acid production, biologics safety testing and protein labeling. From inventive startups to the world’s leading biopharmaceutical, vaccine, diagnostics and gene and cell therapy companies, these customers turn to us to solve their complex discovery challenges and help them streamline and scale their supply chain needs beginning from research and development through clinical trials to commercialization.
Our primary customers are biopharmaceutical companies who are pursuing novel research and product development programs. Our customers also include a range of government, academic and biotechnology institutions.
As of March 31, 2021,2022, we employed a team of over 460520 employees, approximately 23%18% of whom have advanced degrees. We primarily utilize a direct sales model for our sales to our customers in North America. Our international sales, primarily in Europe and Asia Pacific, are sold through a combination of third-party distributors as well as via a direct sales model. The
percentage of our total revenue derived from customers in North America was 52.8%35.6% and 65.6%52.8% for the three months ended March 31, 20212022 and 2020,2021, respectively.
We generated revenue of $148.2$244.3 million and $51.0$148.2 million for the three months ended March 31, 2021and 2020,2022 and 2021, respectively.
Total revenue by segment was $223.7 million in Nucleic Acid Production and $20.6 million in Biologics Safety Testing for the three months ended March 31, 2022. Total revenue by segment was $123.9 million in Nucleic Acid Production, $17.6 million in Biologics Safety Testing and $6.6 million in Protein Detection for the three months ended March 31, 2021. We divested our Protein Detection segment in September 2021, compared to $30.5 million, $14.3 million and $6.2 million, respectively, for the three months ended March 31, 2020.since then operate two business segments only, Nucleic Acid Production and Biologics Safety Testing.
Our research and development efforts are geared towards supporting our customers’ needs. We incurred research and development expenses of $2.2$3.7 million and $3.7$2.2 million for the three months ended March 31, 20212022 and 2020,2021, respectively. We intend to continue to invest in research and development and new products and technologies to support our customers’ needs for the foreseeable future.
We focus a substantial portion of our resources supporting our core business segments. We are actively pursuing opportunities to expand our customer base both domestically and internationally by fostering strong relationships with both existing and new
customers and distributors. Our management team has experience working with biopharmaceutical, vaccine, diagnostics and gene and cell therapy companies as well as academic and research scientists. We also intend to continue making investments in our overall infrastructure and business segments to support our growth. We incurred aggregate selling, general and administrative expenses of $23.2$33.2 million and $16.1$23.5 million for the three months ended March 31, 20212022 and 2020,2021, respectively.
We expect our expenses will increase in connection with our ongoing activities, as we:Recent Developments
•attract, hire and retain qualified personnel;Acquisition
•invest in processes and infrastructureIn January 2022, we completed the acquisition of MyChem, LLC (“MyChem”), a privately-held San Diego, California-based provider of ultra-pure nucleotides to enable manufacturing automation;
•support research and development to introduce new products and services;
•market and sell new and existing products and services;
•protect and defend our intellectual property;
•acquire businesses or technologies to support the growth of our business; and
•function as a public company.
Key Factors Affecting Our Results of Operations and Future Performance
We believe that our financial performance has been, andcustomers in the foreseeable future will continue to be, primarily driven bydiagnostics, pharma, genomics and research markets, for a numbertotal purchase consideration of factors as described below, each$257.8 million. As a result of which presents growth opportunities for our business. These factors also pose important challenges thatthe acquisition, we must successfully addressown all the outstanding interest in order to sustain our growth and improve ourMyChem. Our consolidated results of operations. Our abilityoperations for the three months ended March 31, 2022 include the operating results of MyChem from the acquisition date. See Note 2 to successfully address these challenges is subject to various risks and uncertainties, including those described under the heading “Risk Factors”condensed consolidated financial statements contained in our AnnualPart I, Item 1 of this Quarterly Report on Form 10-K for the year ended December 31, 2020.10-Q.
Drug Development Pipelines
Our financial performance has largely been driven by our customers accelerating their drug development pipelines for cell, geneTrends and RNA therapies. A key factor to our future success will be our ability to provide good manufacturing practices (“GMP”) grade nucleic acids and associated pre-clinical and non-GMP compounds to these customers. Our GMP-grade nucleic acids are manufactured following certain voluntary GMP quality standards and customer specific requirements. We believe these products, including “GMP-grade” materials, are exempt from compliance with the current GMP regulations of the U.S. Food and Drug Administration (“FDA”). The mRNA and gene editing therapeutics that many of our customers are developing are early in their lifecycle. We expect an increase in demand for our GMP-grade nucleic acids to the extent that our customers have success in their early-phase clinical trials of these therapeutics. New FDA policies, and plans for maximizing the use of expedited programs, may advance the development of cell and gene therapies. Additionally, the COVID-19 pandemic has both fostered increased interest in mRNA as a therapeutic modality for this virus and directed significant resources to developing a base of knowledge for mRNA.
Demand for Outsourced GMP-grade RNA
We believe that growing numbers of RNA therapeutics companies expect to outsource production of pre-clinical and GMP-grade RNA to trusted business partners. Companies are often driven to outsource due to the complex nature of the manufacturing process, faster speeds to market, recent availability of high-quality contract development and manufacturing organizations (“CDMO”) partners, an influx of inexperienced and virtual biopharmaceutical companies, the need for
redundancy of clinical and commercial supply and recent moves to onshore critical supply chains. We offer a number of products and services to meet this demand for outsourced pre-clinical and GMP-grade RNA.
Demand for Outsourced Biologics Safety Testing Products and Assay Development Services
We believe that many biopharmaceutical companies rely on outsourced providers for their biologics safety testing products and assay development needs. Once process development has been completed, biopharmaceutical companies avoid changing biologics safety testing products or providers for fear of affecting the regulatory approval pathway of their therapeutic products. This supports revenue growth for the biologics safety testing products that have been adopted by these companies. We also have long-standing relationships with many of our customers, which are bolstered by the regulatory demands on our customers and the “designed-in” nature of our products and services. A successful partnership with a customer related to the development of their drug leads to repeat business as customers become comfortable with our products. The drug approval process risk is reduced when regulatory bodies are familiar with an impurity detection product vendor and most biopharmaceutical customers are not willing to risk a regulatory issue related to biologics safety testing for their drug program on an unproven vendor. It is therefore critical to our success that our products and services be “designed-in” at the outset, especially to the most promising product candidates.Uncertainties
COVID-19 Considerations and Business Update
The global COVID-19 pandemic has created significant uncertainty, volatility and economic disruption in the markets we operate. We have responded to the pandemic by leveraging our deep product portfolio and general scientific expertise to develop robust COVID-19-related product and service offerings providing critical support for the development of therapeutics, vaccines and diagnostics.
While ourOur results of operations and cash flows have been positively impacted by the continued strong demand for COVID-19 related products and services, including our proprietary CleanCap® CleanCap® analogs and ongoing demand for highly modified RNA products, particularly mRNA,mRNA. Continued COVID-19-related demand for these products and services, which comprised the majority of our revenue for the recent periods, may contract considerably if the COVID-19 pandemic subsides and consumer demand for COVID-19 vaccines declines. Such a contraction in demand could have a material impact on our operating results, cash flows and financial condition in the future. Other effects of the COVID-19 pandemic could still have an adverse impact on our operating results, cash flows and financial condition in the future. The factors that could cause such adverse impact include: the severityemergence, duration and duration of the pandemic; the emergenceintensity of new virus variants; continued demand for COVID-19 vaccines; competition faced by our customers from other COVID-19 vaccine manufacturers;manufacturers or developers of alternative treatments; the availability and administration of pediatric and booster vaccinations, vaccine supply constraints, vaccine hesitancy and the effectiveness of vaccines against new virus strains; and the U.S. economy and global economy;economy, including impacts resulting from supply chain constraints, labor market shortages and inflationary pressures.
Other Trends and Uncertainties
Biopharmaceutical customers are increasingly relying on outside parties to provide important inputs and services for their clinical research and manufacturing, a development driving growth for suppliers with unique capabilities and the timing, scopeability to manufacture at an appropriate scale to support customer programs. We believe that suppliers like ourselves, with this rare combination of capabilities, proprietary products and effectivenessthe required investment in manufacturing and quality systems, are benefiting from rapid growth as biopharmaceutical customers seek to partner with a small number of U.S. and international governmental, regulatory, fiscal, monetary and public health responsestrusted suppliers. In addition to the COVID-19 pandemiccontinued trend toward outsourcing, several market developments are driving increased growth, in our addressable market segments, including: (i) pivot toward mRNA vaccines driven in part by COVID-19; (ii) rapid growth in development of cell and associated economic disruptions.
In response to the spreadgene therapies; (iii) large and growing pipeline of COVID-19,protein-based therapeutics; and (iv) rise in accordance with direction from state and local government authorities, we have been and continue to restrict access to our facilities mostly to personnel and third parties who must perform critical activities that are required to be completed on-site, limit the number of such personnel that can be present at our facilities at any one time, and request that some of our personnel work remotely. In the event that government authorities were to further modify current restrictions, our employees conducting research and development, or manufacturing activities may not be able to access our laboratory or manufacturing space, and our core activities may be significantly limited or curtailed, possibly for an extended period of time.
We remain fully operational as we abidemolecular diagnostics driven by local COVID-19 safety regulations across the world. To achieve this, we have had and continue to have many employees working remotely and have adopted significant protective measures for our employees on site, including conducting weekly COVID-19 testing, staggered shifts, social distancing and hygiene best practices recommended by the Centers for Disease Control and Prevention (the “CDC”) and local public health officials. In addition, we have taken steps to monitor and strengthen our supply chain to maintain an uninterrupted supply of our critical products and services.COVID-19.
How We Assess Our Business
We consider a variety of financial and operating measures in assessing the performance of our business. The key measures we use to determine how our business is performing are revenue and Adjusted EBITDA.
Adjusted EBITDA is a non-GAAP financial measure that we define as net income (loss) adjusted for interest expense, provision for income taxes, depreciation, amortization and equity-based compensation expenses. Adjusted EBITDA reflects further adjustments to eliminate the impact of certain items, including certain non-cash and other items, that we do not consider representative of our ongoing operating performance. We also present Adjusted Free Cash Flow, which is a non-GAAP measure that we define as Adjusted EBITDA less capital expenditures.
Management uses Adjusted EBITDA to evaluate the financial performance of our business and the effectiveness of our business strategies. We present Adjusted EBITDA and Adjusted Free Cash Flow because we believe they are frequently used by analysts, investors and other interested parties to evaluate companies in our industry and they facilitate comparisons on a
consistent basis across reporting periods. Further, we believe they are helpful in highlighting trends in our operating results because they exclude items that are not indicative of our core operating performance. Adjusted EBITDA is also a component of the financial covenant under our new credit agreement (the “New Credit Agreement”) that governs our ability to access more than $63.0 million in aggregate letters of credit obligations and outstandingavailable borrowings under our new revolving credit facility (the “New Revolving Credit Facility”).facility. In addition, if we borrow more than $63.0 million, we are required to maintain a specified net leverage ratio. See “—Liquidity and Capital Resources—Sources of Liquidity—Debt Covenants” below for a discussion of this financial covenant.
Adjusted EBITDA and Adjusted Free Cash Flow have limitations as analytical tools and you should not consider them in isolation, or as substitutes for analysis of our results as reported under GAAP. We may in the future incur expenses similar to the adjustments in the presentation of Adjusted EBITDA. In particular, we expect to incur meaningful share-based compensation expense in the future. Other limitations include that Adjusted EBITDA and Adjusted Free Cash Flow do not reflect:
•all expenditures or future requirements for capital expenditures or contractual commitments;
•changes in our working capital needs;
•provision for income taxes, which may be a necessary element of our costs and ability to operate;
•the costs of replacing the assets being depreciated, which will often have to be replaced in the future;
•the non-cash component of employee compensation expense; and
•the impact of earnings or charges resulting from matters we consider not to be reflective, on a recurring basis, of our ongoing operations.
In addition, Adjusted EBITDA and Adjusted Free Cash Flow may not be comparable to similarly titled measures used by other companies in our industry or across different industries.
Components of Results of Operations
Revenue
Our revenue consists primarily of product revenue and, to a much lesser extent, service revenue from royalties attributable to the out-licensing of our proprietary biological assets intellectual property that we may develop.revenue. We generated total consolidated revenue of $148.2$244.3 million and $51.0$148.2 million for the three months ended March 31, 20212022 and 2020,2021, respectively, through the following segments: (i) Nucleic Acid Production, (ii) Biologics Safety Testing and (iii) Protein Detection. We divested our Protein Detection segment in September 2021, and since then operate two business segments only, Nucleic Acid Production and Biologics Safety Testing.
Nucleic Acid Production Segment
Our Nucleic Acid Production segment focuses on the manufacturing and sale of highly modified nucleic acids products to support the needs of customers’ research, therapeutic and vaccine programs. This segment also provides research products for labeling and detecting proteins in cells and tissue samples.
Biologics Safety Testing Segment
Our Biologics Safety Testing segment focuses on manufacturing and selling biologics safety and impurity tests and assay development services that are utilized by our customers in their biologic drug manufacturing activities.
Protein Detection Segment
Our Protein Detection segment products, which includeincluded a portfolio of labeling and visual detection reagents, arewere purchased by our scientific research customers for their tissue-based protein detection and characterization needs. In September 2021, we completed the divestiture of Vector Laboratories, Inc. and subsidiaries (“Vector”), which made up our Protein Detection segment.
Cost of Revenue
Cost of revenue associated with our products primarily consists of manufacturing related costs incurred in the production process, including personnel and related costs, equity-based compensation from awards issued by both MLSH 1 and one of our subsidiaries, and stock options and restricted stock units (“RSUs”) we have issued,expense, inventory write-downs, costs of materials, labor and overhead, packaging and delivery costs and allocated costs, including facilities, information technology, depreciation and amortization of intangibles. Cost of revenue associated with our services primarily consists of personnel and related costs,
equity-based compensation awards,expense, cost of materials and allocated costs, including facilities and information technology costs. Costs of services were not material tofor the three months ended March 31, 20212022 and 2020.2021.
We expect cost of revenue to increase in future periods as our revenue grows.
Operating Expenses
Selling, general and administrative. Our selling, general and administrative expenses primarily consist of salaries, benefits and equity-based compensation expense for our employees in our commercial sales functions, marketing, executive, accounting and finance, legal and human resource functions as well as travel expenses, professional services fees, such as consulting, audit, tax and legal fees, general corporate costs and allocated costs, including facilities, information technology and amortization of intangibles.
We expect that our selling, general and administrative expenses will continue to increase, primarily due to increased headcount and expanding facilities footprint to support anticipated growth in the business, costs incurred in increasing our presence globally and increases in marketing activities to drive awareness and adoption of our products and services, and due to incremental costs associated with operating as a public company.
Research and development. Research and development costs primarily consist of salaries, benefits, incentive compensation, equity-based compensation from awards issued by both MLSH 1 and one of our subsidiaries as well as equity-based compensation from stock options and RSUs issued by us,expense, outside contracted services, cost of supplies, in-process research and development costs from asset acquisitions and allocated facilities costs for employees engaged in research and development of products and services. We expense all research and development costs in the period in which they are incurred. Payment made prior to the receipt of goods or services to be used in research and development are recognized as prepaid assets until the goods are received or services are rendered.
We planexpect that our research and development costs will continue to continueincrease to support our research and development efforts, including supportingmeeting our customers’ needs.
Selling, general and administrative. Our selling, general and administrative expenses primarily consist of salaries, benefits and equity-based compensation from awards issued by both MLSH 1 and one of our subsidiaries as well as stock-based compensation from stock options and RSUs issued by us to employees in our commercial sales functions, marketing, executive, accounting and finance, legal and human resource functions as well as travel expenses, professional services fees, such as consulting, audit, tax and legal fees, general corporate costs and allocated costs, including facilities, information technology and amortization of intangibles.
We expect that our selling, general and administrative expenses will continue to increase, primarily due to increased headcount to support anticipated growth in the business, costs incurred in increasing our presence globally and increases in marketing activities to drive awareness and adoption of our products and services, and due to incremental costs associated with operating as a public company.Other Income (Expense)
Interest Expense
Interest expense consist of interest costs and the related amortization of the debt discount and deferred issuance costs on our outstanding debt.
Loss on Extinguishment of Debt
Loss on extinguishment of debt represent the write-off of remaining unamortized debt discount and deferred issuance costs on previously outstanding debt when we engage in refinancing activities.
Change in payable to related parties pursuant to a Tax Receivable Agreement
The tax receivable agreement liability adjustment reflects changes in the tax receivable agreement liability recorded in our condensed consolidated statements of financial conditionbalance sheets as a result of change in the tax benefit obligation attributable to a change in the expected tax benefit.
Income Tax Expense
As a result of our ownership of LLC Units in Topco LLC, we are subject to U.S. federal, state and local income taxes with respect to our allocable share of any taxable income of Topco LLC and will be taxed at the prevailing corporate tax rates.
Non-Controlling Interests
Until November, 2020, Topco LLC held a majority ownership interest in MLSC through its consolidated subsidiaries withNon-controlling interests represent the remaining ownership being recorded as non-controlling interest in our consolidated financial statements. MLSCportion of profit or loss, net assets and comprehensive income or loss was attributedof our consolidated subsidiaries that is not allocable to the non-controlling interests using an attribution method, similar to the hypothetical liquidation at book value method,Company based on the distribution provisionsour percentage of the MLSC Amended and Restated Limited Liability Company Agreement (“MLSC LLC Agreement”).
As the sole managerownership of Topco LLC, we operate the business and control the strategic decisions and day-to-day operations of Topco LLC and also have a substantial financial interest in Topco LLC. Accordingly, we consolidate the financial results of Topco LLC, and report a non-controlling interest based on LLC Units of Topco LLC held by MLSH 1 on our consolidated balance sheets as of March 31, 2021. such entities. Income or loss attributed to the non-controlling interests is based on the LLC Units outstanding during the period and is presented on the
condensed consolidated statements of incomeincome. As of March 31, 2022, we held 51.5% of the outstanding LLC Units of Topco LLC and consolidated statements48.5% of comprehensive income.the outstanding LLC Units of Topco LLC were held by MLSH 1.
Results of Operations
The results of operations presented below should be reviewed in conjunction with the condensed consolidated financial statements and notes included elsewhere in this Quarterly Report on Form 10-Q. For information with respect to recent accounting pronouncementpronouncements that are of significance or potential significance to us, see “NoteNote 1 Organization and Significant Accounting Policies” into the “Notes to Condensed Consolidated Financial Statements”condensed consolidated financial statements contained in Part I, Item 1 of this Quarterly Report on Form 10-Q.
| | | Three Months Ended March 31, | | Three Months Ended March 31, |
| | 2021 | | 2020 | | Change | | 2022 | | 2021
(as adjusted)* | | Change |
| in thousands, except per share and per unit data | | | | | | |
| | | (in thousands, except per share amounts) | | |
| Revenue | Revenue | $ | 148,211 | | | $ | 50,981 | | | 190.7 | % | Revenue | $ | 244,293 | | | $ | 148,211 | | | 64.8 | % |
| Operating expenses: | Operating expenses: | | Operating expenses: | |
Cost of revenue (1) | Cost of revenue (1) | 30,368 | | | 15,297 | | | 98.5 | % | Cost of revenue (1) | 40,032 | | | 31,391 | | | 27.5 | % |
Selling, general and administrative (1) | | Selling, general and administrative (1) | 33,200 | | | 23,471 | | | 41.5 | % |
Research and development (1) | Research and development (1) | 2,164 | | | 3,744 | | | (42.2) | % | Research and development (1) | 3,695 | | | 2,160 | | | 71.1 | % |
Selling, general and administrative (1) | 23,237 | | | 16,126 | | | 44.1 | % | |
| Gain on sale and leaseback transaction | — | | | (19,002) | | | |
| | Total operating expenses | Total operating expenses | 55,769 | | | 16,165 | | | 245.0 | % | Total operating expenses | 76,927 | | | 57,022 | | | 34.9 | % |
| Income from operations | Income from operations | 92,442 | | | 34,816 | | | 165.5 | % | Income from operations | 167,366 | | | 91,189 | | | 83.5 | % |
| Other expense | (2,881) | | | (7,302) | | | (60.5) | % | |
| Other income (expense), net | | Other income (expense), net | (525) | | | (2,015) | | | (73.9) | % |
| Income before income taxes | Income before income taxes | 89,561 | | | 27,514 | | | 225.5 | % | Income before income taxes | 166,841 | | | 89,174 | | | 87.1 | % |
| Income tax expense | Income tax expense | 13,709 | | | 3,635 | | | 277.1 | % | Income tax expense | 19,981 | | | 13,709 | | | 45.8 | % |
| Net income | Net income | $ | 75,852 | | | $ | 23,879 | | | 217.7 | % | Net income | $ | 146,860 | | | $ | 75,465 | | | 94.6 | % |
| Net income attributable to non-controlling interests | Net income attributable to non-controlling interests | 52,605 | | | 490 | | | * | Net income attributable to non-controlling interests | 79,998 | | | 52,363 | | | 52.8 | % |
| Net income attributable to Maravai LifeSciences Holdings, Inc. | Net income attributable to Maravai LifeSciences Holdings, Inc. | $ | 23,247 | | | $ | 23,389 | | | (0.6) | % | Net income attributable to Maravai LifeSciences Holdings, Inc. | $ | 66,862 | | | $ | 23,102 | | | 189.4 | % |
| Net income per Class A common share/unit attributable to Maravai LifeSciences Holdings, Inc. (2): | | |
| Net income per Class A common share attributable to Maravai LifeSciences Holdings, Inc.: | | Net income per Class A common share attributable to Maravai LifeSciences Holdings, Inc.: | |
| Basic | Basic | $ | 0.24 | | | $ | 0.09 | | | Basic | $ | 0.51 | | | $ | 0.24 | | |
| Diluted | Diluted | $ | 0.24 | | | $ | 0.09 | | | Diluted | $ | 0.50 | | | $ | 0.24 | | |
Weighted average number of Class A common shares/units outstanding (2): | | |
| Weighted average number of Class A common shares outstanding: | | Weighted average number of Class A common shares outstanding: | |
| Basic | Basic | 96,647 | | | 253,917 | | | Basic | 131,489 | | | 96,647 | | |
| Diluted | Diluted | 96,673 | | | 253,917 | | | Diluted | 255,287 | | | 96,673 | | |
| Non-GAAP measures: | Non-GAAP measures: | | Non-GAAP measures: | |
| Adjusted EBITDA | Adjusted EBITDA | $ | 101,932 | | | $ | 29,551 | | | Adjusted EBITDA | $ | 186,992 | | | $ | 100,896 | | |
| Adjusted Free Cash Flow | Adjusted Free Cash Flow | $ | 96,937 | | | $ | 25,561 | | | Adjusted Free Cash Flow | $ | 182,502 | | | $ | 96,362 | | |
____________________
*Not meaningfulAs adjusted to reflect the impact of the adoption of ASC 842. See Note 1 to the condensed consolidated financial statements contained in Part I, Item 1 of this Quarterly Report on Form 10-Q for a summary of the adjustments.
(1)Includes equity-based compensation expense as follows:follows (in thousands, except percentages):
| | | | | | | | | | | | | | | | | |
| Three Months Ended March 31, |
| in thousands | 2021 | | 2020 | | Change |
| Cost of revenue | $ | 510 | | | $ | 4 | | | 12650.0 | % |
| Research and development | 87 | | | 80 | | | 8.7 | % |
| Selling, general and administrative | 1,681 | | | 424 | | | 296.5 | % |
| Total equity-based compensation expense | $ | 2,278 | | | $ | 508 | | | 348.4 | % |
(2) These periods have not been retrospectively adjusted to give effect to the Organizational Transactions described in Note 1 to our condensed consolidated financial statements and the shares of Class A common stock sold in our IPO. Additionally, basic net income per Class A common stock for the three months ended March 31, 2021, has been calculated by dividing net income for the period, and adjusted for net income attributable to non-controlling interests, by the weighted average Class A common | | | | | | | | | | | | | | | | | |
| Three Months Ended March 31, |
| 2022 | | 2021 | | Change |
| Cost of revenue | $ | 823 | | | $ | 510 | | | 61.4 | % |
| Selling, general and administrative | 2,633 | | | 1,681 | | | 56.6 | % |
| Research and development | 171 | | | 87 | | | 96.6 | % |
| Total equity-based compensation expense | $ | 3,627 | | | $ | 2,278 | | | 59.2 | % |
stock outstanding during the period. Diluted net income per Class A common share/LLC unit gives effect to the potentially dilutive securities by application of the treasury stock method or if-converted method, as applicable.
Revenue
Consolidated revenue by segment was as follows:follows for the periods presented (in thousands, except percentages):
| | | Three Months Ended March 31, | | Percentage of Revenue | | Three Months Ended March 31, | | Percentage of Revenue |
| in thousands | 2021 | | 2020 | | Change | | 2021 | | 2020 | |
| Revenue | | | | | | | | | | |
| | | 2022 | | 2021 | | Change | | 2022 | | 2021 |
| Nucleic Acid Production | Nucleic Acid Production | $ | 123,932 | | | $ | 30,490 | | | 306.5 | % | | 83.6 | % | | 59.91% | Nucleic Acid Production | $ | 223,650 | | | $ | 123,932 | | | 80.5 | % | | 91.5 | % | | 83.6 | % |
| Biologics Safety Testing | Biologics Safety Testing | 17,649 | | | 14,293 | | | 23.5 | % | | 11.9 | % | | 28.04% | Biologics Safety Testing | 20,643 | | | 17,649 | | | 17.0 | % | | 8.5 | % | | 11.9 | % |
| Protein Detection | Protein Detection | 6,630 | | | 6,198 | | | 7.0 | % | | 4.5 | % | | 12.16% | Protein Detection | — | | | 6,630 | | | # | | — | % | | 4.5 | % |
| Total revenue | Total revenue | $ | 148,211 | | | $ | 50,981 | | | 190.7 | % | | 100.0 | % | | 100.0 | % | Total revenue | $ | 244,293 | | | $ | 148,211 | | | 64.8 | % | | 100.0 | % | | 100.0 | % |
Comparison of Three Months Ended March 31, 2021 and 2020____________________
# Not meaningful
Total revenue was $148.2$244.3 million for the three months ended March 31, 20212022 compared to $51.0 million for the three months ended March 31, 2020, representing an increase of $97.2 million, or 190.7%.
Nucleic Acid Production revenue increased from $30.5 million for the three months ended March 31, 2020 to $123.9$148.2 million for the three months ended March 31, 2021, representing an increase of $93.4$96.1 million, or 306.5%64.8%.
Nucleic Acid Production revenue increased from $123.9 million for the three months ended March 31, 2021 to $223.7 million for the three months ended March 31, 2022, representing an increase of $99.7 million, or 80.5%. The increase in Nucleic Acid Production revenue was driven bythe result of continued strong demand during the quarter for our proprietary CleanCap® analogs as COVID-19 vaccine manufacturers scalescaled production ongoingand increased demand for highly modified RNAmRNA products particularly mRNA, due to resumptionas this technology becomes incorporated into more therapeutic and vaccine development programs for a variety of mRNA therapeutic programs and lifting of shelter-in-place COVID-19 restrictions.indications.
Biologics Safety Testing revenue increased from $14.3 million for the three months ended March 31, 2020 to $17.6 million for the three months ended March 31, 2021 to $20.6 million for the three months ended March 31, 2022, representing an increase of $3.4$3.0 million, or 23.5%17.0%. The increase was driven by higher demand and consumption of our products as athe result of increased COVID-19 related diagnostic needs, coupled with higher revenue generated from contract services.growth in the underlying markets supporting cell and gene therapies, biosimilar and other biologic programs.
There was no Protein Detection revenue increased from $6.2 million for the three months ended March 31, 2020 to $6.6 million for the three months ended March 31, 2021, representing a change of $0.4 million, or 7.0%. The increase was primarily2022 due to resumptionthe sale of research laboratory work from prior shutdowns as a result of the COVID-19 pandemic, coupled with increased demand for our products.Protein Detection business segment, which was completed in early September 2021.
Adjusted EBITDA and Segment Information
Management has determined that adjusted earnings before interest, tax, depreciation and amortization is the profit or loss measure used to make resource allocation decisions and evaluate segment performance. Adjusted EBITDA assists management in comparing the segment performance on a consistent basis for purposes of business decision-making by removing the impact of certain items that management believes do not directly reflect the core operations and, therefore, are not included in measuring segment performance. Corporate costs are managed on a standalone basis and not allocated to segments.
We do not allocate assets to our reportable segments as they are not included in the review performed by our Chief Operating Decision Maker for purposes of assessing segment performance and allocating resources.
Excluding approximately $0.3 million associated with a building in the United Kingdom,As of March 31, 2022, all of our long-lived assets arewere located within the United States. In February 2021, the Company entered into an agreement to sell the facility in the United Kingdom.
Following isThe following tables include financial information relating to the operating segments for the periods presented (in thousands):
| | | | | | | | | | | | | | | | | | | | | | | | | | | | | | | | | |
| Three Months Ended March 31, 2022 |
| Nucleic Acid Production | | Biologics Safety Testing | | | | Corporate | | Eliminations | | Total |
| Revenue | $ | 223,650 | | | $ | 20,643 | | | | | $ | — | | | $ | — | | | $ | 244,293 | |
| Adjusted EBITDA | $ | 182,799 | | | $ | 16,532 | | | | | $ | (12,339) | | | $ | — | | | $ | 186,992 | |
| | | | | | | | | | | | | | | | | | | | | | | | | | | | | | | | | | | |
| For the three months ended March 31, 2021 | Nucleic Acid Production | | Biologic Safety Testing | | Protein Detection | | Corporate | | Eliminations | | Total |
| Revenue | $ | 124,169 | | | $ | 17,649 | | | $ | 6,630 | | | $ | — | | | $ | (237) | | | $ | 148,211 | |
| Adjusted EBITDA | $ | 95,613 | | | $ | 14,330 | | | $ | 2,267 | | | $ | (10,336) | | | $ | 58 | | | $ | 101,932 | |
| | | | | | | | | | | | | | | | | | | | | | | | | | | | | | | | | | | |
| Three Months Ended March 31, 2021 |
| Nucleic Acid Production | | Biologics Safety Testing | | Protein Detection | | Corporate | | Eliminations | | Total |
| Revenue | $ | 124,169 | | | $ | 17,649 | | | $ | 6,630 | | | $ | — | | | $ | (237) | | | $ | 148,211 | |
| Adjusted EBITDA (as adjusted)* | $ | 95,032 | | | $ | 14,287 | | | $ | 1,959 | | | $ | (10,336) | | | $ | (46) | | | $ | 100,896 | |
____________________
| | | | | | | | | | | | | | | | | | | | | | | | | | | | | | | | | | | |
| For the three months ended March 31, 2020 | Nucleic Acid Production | | Biologics Safety Testing | | Protein Detection | | Corporate | | Eliminations | | Total |
| Revenue | $ | 30,892 | | | $ | 14,293 | | | $ | 6,198 | | | $ | — | | | $ | (402) | | | $ | 50,981 | |
| Adjusted EBITDA | $ | 18,830 | | | $ | 11,940 | | | $ | 3,293 | | | $ | (4,288) | | | $ | (224) | | | $ | 29,551 | |
Comparison of Three Months Ended March 31, 2021 and 2020
Inter-segment revenue was $0.2 million and $0.4 million for the three months ended March 31, 2021 and 2020, respectively, and represents intersegment revenue between Nucleic Acid Production and Protein Detection segments. The inter-segment sales and related gross margin on inventory recorded at the end of the period are eliminated for consolidation purposes in the Eliminations column. Internal selling prices for intersegment sales are consistent with the segment’s normal retail price offered to external parties. There werewas no commission expense recognized for intersegment sales for the three months ended March 31, 2021 and 2020.2021. There was no inter-segment activity for the three months ended March 31, 2022.
A reconciliation of Adjusted EBITDA to net income, the most directly comparable GAAP measure, is set forth below:below for the periods presented (in thousands):
| | | Three Months Ended March 31, | | Three Months Ended
March 31, | |
| in thousands | 2021 | | 2020 | |
| | | 2022 | | 2021
(as adjusted)* | |
| Net income | Net income | $ | 75,852 | | | $ | 23,879 | | Net income | $ | 146,860 | | | $ | 75,465 | | |
| Add: | Add: | | Add: | | |
| Amortization | Amortization | 5,041 | | | 5,075 | | Amortization | 5,527 | | | 5,041 | | |
| Depreciation | Depreciation | 1,854 | | | 1,691 | | Depreciation | 1,855 | | | 1,256 | | |
| Interest expense | Interest expense | 8,770 | | | 7,382 | | Interest expense | 2,664 | | | 7,904 | | |
| Income tax expense | Income tax expense | 13,709 | | | 3,635 | | Income tax expense | 19,981 | | | 13,709 | | |
| EBITDA | EBITDA | 105,226 | | | 41,662 | | EBITDA | 176,887 | | | 103,375 | | |
| Acquisition integration costs (a)(1) | Acquisition integration costs (a)(1) | (811) | | | 689 | | Acquisition integration costs (a)(1) | 4,779 | | | 4 | | |
| | Acquired in-process research and development costs (b) | — | | | 2,881 | | |
| Equity-based compensation (c) | 2,278 | | | 508 | | |
| GTCR management fees (d) | — | | | 211 | | |
| Gain on sale and leaseback transaction (e) | — | | | (19,002) | | |
| Merger and acquisition related expenses (f) | 919 | | | 902 | | |
| Financing costs (g) | 206 | | | 1,700 | | |
Equity-based compensation (2) | | Equity-based compensation (2) | 3,627 | | | 2,278 | | |
| | Tax receivable agreement liability adjustment (h) | (5,886) | | | — | | |
| Merger and acquisition related expenses (3) | | Merger and acquisition related expenses (3) | 1,188 | | | 919 | | |
Financing costs (4) | | Financing costs (4) | 1,037 | | | 206 | | |
Tax receivable agreement liability adjustment (5) | | Tax receivable agreement liability adjustment (5) | (2,340) | | | (5,886) | | |
Other (6) | | Other (6) | 1,814 | | | — | | |
| Adjusted EBITDA | Adjusted EBITDA | $ | 101,932 | | | $ | 29,551 | | Adjusted EBITDA | $ | 186,992 | | | $ | 100,896 | | |
____________________
(a)*As adjusted to reflect the impact of the adoption of ASC 842. See Note 1 to the condensed consolidated financial statements contained in Part I, Item 1 of this Quarterly Report on Form 10-Q for a summary of the adjustments.
(1)Refers to incremental costs incurred to execute and integrate completed acquisitions, and retention payments in connection with these acquisitions.
(b)Refers to in-process research and development charge associated with the acquisition of MockV Solutions, Inc.
(c)(2)Refers to non-cash expense associated with equity-based compensation.
(d)Refers to cash fees paid to GTCR, LLC (“GTCR”), pursuant to the advisory services agreement that was terminated in connection with our IPO.
(e)Refers to the gain on the sale of our Burlingame, California facility, which was leased back to the Company in 2020.
(f)(3)Refers to diligence, legal, accounting, tax and consulting fees incurred associated with acquisitions that were not consummated.
(g)(4)Refers to transaction costs related to our IPO and the refinancing of our long-term debt and costs from our secondary offering that are not capitalizable or cannot be offset against proceeds from such transactions.
(h)(5)Refers to the gain related to the adjustment toof our tax receivable agreement related party liability primarily due to changes in our estimated effectivestate apportionment and the corresponding reduction of our estimated state tax rate.
(6)Refers to the loss recognized during the period associated with certain working capital and other adjustments for the sale of Vector, which was completed in September 2021, and the non-cash expense incurred on extinguishment of debt.
Adjusted Free Cash Flow
Adjusted Free Cash Flow, which is a non-GAAP measure that we define as Adjusted EBITDA less capital expenditures, is set forth below for the periods presented (in thousands):
| | | Three Months Ended March 31, | | Three Months Ended
March 31, | |
| | 2021 | | 2020 | | 2022 | | 2021
(as adjusted)* | |
| Adjusted EBITDA | Adjusted EBITDA | $ | 101,932 | | | $ | 29,551 | | Adjusted EBITDA | $ | 186,992 | | | $ | 100,896 | | |
Capital expenditures (a)(1) | Capital expenditures (a)(1) | (4,995) | | | (3,990) | | Capital expenditures (a)(1) | (4,490) | | | (4,534) | | |
| Adjusted Free Cash Flow | Adjusted Free Cash Flow | $ | 96,937 | | | $ | 25,561 | | Adjusted Free Cash Flow | $ | 182,502 | | | $ | 96,362 | | |
____________________
(a)*As adjusted to reflect the impact of the adoption of ASC 842. See Note 1 to the condensed consolidated financial statements contained in Part I, Item 1 of this Quarterly Report on Form 10-Q for a summary of the adjustments.
(1)We define capital expenditures as purchases of property and equipment, which are included in cash flows from investing activities, and accounts payable and accrued expenses and other current liabilities.
Costs
Operating Expenses
Operating expenses included the following for the periods presented (in thousands, except percentages):
| | | | | | | | | | | | | | | | | | | | | | | | | | | | | |
| Three Months Ended March 31, | | Percentage of Revenue |
| 2022 | | 2021
(as adjusted)* | | Change | | 2022 | | 2021
(as adjusted)* |
| Cost of revenue | $ | 40,032 | | | $ | 31,391 | | | 27.5 | % | | 16.4 | % | | 21.2 | % |
| Selling, general and administrative | 33,200 | | | 23,471 | | | 41.5 | % | | 13.6 | % | | 15.8 | % |
| Research and development | 3,695 | | | 2,160 | | | 71.1 | % | | 1.5 | % | | 1.5 | % |
| | | | | | | | | |
| | | | | | | | | |
| Total operating expenses | $ | 76,927 | | | $ | 57,022 | | | 34.9 | % | | 31.5 | % | | 38.5 | % |
____________________
*As adjusted to reflect the impact of Revenuethe adoption of ASC 842. See Note 1 to the condensed consolidated financial statements contained in Part I, Item 1 of this Quarterly Report on Form 10-Q for a summary of the adjustments.
| | | | | | | | | | | | | | | | | | | | | | | | | | | | | |
| Three Months Ended March 31, | | Percentage of Revenue |
| in thousands | 2021 | | 2020 | | Change | | 2021 | | 2020 |
| Cost of revenue | $ | 30,368 | | | $ | 15,297 | | | 98.5 | % | | 20.5 | % | | 30.0 | % |
ComparisonCost of Three Months Ended March 31, 2021 and 2020Revenue
Cost of revenue increased by $15.1$8.6 million from $15.3 million for the three months ended March 31, 2020 to $30.4$31.4 million for the three months ended March 31, 2021 to $40.0 million for the three months ended March 31, 2022, or 98.5%27.5%. The increase in cost of revenue was primarily attributable to an increase in direct product costs and supplies and materials resulting from higher revenue, increases in personnel costs associated with overall growth and expansion of the Company, and higher overall supplies and materials costs.sales volume. Gross profit increased by $82.2$87.4 million from $35.7$116.8 million for the three months ended March 31, 20202021 to $117.8$204.3 million for the three months ended March 31, 2021.2022. The increase in the gross profit margin as a percentage of sales was primarily attributable to favorable product mix shift.
ResearchSelling, General and DevelopmentAdministrative
| | | | | | | | | | | | | | | | | | | | | | | | | | | | | |
| Three Months Ended March 31, | | Percentage of Revenue |
| in thousands | 2021 | | 2020 | | Change | | 2021 | | 2020 |
| Research and development | $ | 2,164 | | | $ | 3,744 | | | (42.2) | % | | 1.5 | % | | 7.3 | % |
Comparison of Three Months Ended March 31, 2021Selling, general and 2020
Research and developmentadministrative expenses decreasedincreased by $1.6$9.7 million from $3.7$23.5 million for the three months ended March 31, 20202021 to $33.2 million for the three months ended March 31, 2022, or 41.5%. The increase was primarily driven by $4.7 million of expenses relating to the acquisition of MyChem, $1.6 million from working capital adjustments related to the sale of Vector in September 2021, $1.2 million of diligence fees associated with merger and acquisition activities, and $0.9 million of fees relating to the debt refinancing transaction. There was a also a general increase in selling, general and administrative expense driven by overall Company growth.
Research and Development
Research and development expenses increased by $1.5 million from $2.2 million for the three months ended March 31, 2021 or 42.2%. The decrease in expenses from the prior period is primarily attributable to the $2.9 million of in-process research development costs related to an asset acquisition incurred during the three months ended March, 2020, offset by an increase of $0.6 million in supplies and materials and an increase of $0.4 million in personnel expenses.
Selling, General and Administrative
| | | | | | | | | | | | | | | | | | | | | | | | | | | | | |
| Three Months Ended March 31, | | Percentage of Revenue |
| in thousands | 2021 | | 2020 | | Change | | 2021 | | 2020 |
| Selling, general and administrative | $ | 23,237 | | | $ | 16,126 | | | 44.1 | % | | 15.7 | % | | 31.6 | % |
Comparison of Three Months Ended March 31, 2021 and 2020
Selling, general and administrative expenses increased by $7.1 million from $16.1$3.7 million for the three months ended March 31, 20202022, or 71.1%. The increase was primarily driven by $1.7 million in personnel costs.
Other Income (Expense)
Other income (expense) included the following for the periods presented (in thousands, except percentages):
| | | | | | | | | | | | | | | | | | | | | | | | | | | | | |
| Three Months Ended March 31, | | Percentage of Revenue |
| 2022 | | 2021
(as adjusted)* | | Change | | 2022 | | 2021
(as adjusted)* |
| Interest expense | $ | (2,664) | | | $ | (7,904) | | | (66.3) | % | | (1.1) | % | | (5.4) | % |
| Loss on extinguishment of debt | (208) | | | — | | | # | | (0.1) | % | | — | % |
| Change in payable to related parties pursuant to a Tax Receivable Agreement | 2,340 | | | 5,886 | | | (60.2) | % | | 1.0 | % | | 4.0 | % |
| Other income | 7 | | | 3 | | | 133.3 | % | | 0.0 | % | | 0.0 | % |
| Total other expense | $ | (525) | | | $ | (2,015) | | | (73.9) | % | | (0.2) | % | | (1.4) | % |
____________________
*As adjusted to $23.2reflect the impact of the adoption of ASC 842. See Note 1 to the condensed consolidated financial statements contained in Part I, Item 1 of this Quarterly Report on Form 10-Q for a summary of the adjustments.
# Not meaningful
Other expense was $2.0 million for the three months ended March 31, 2021 or 44.1%. The increase was primarily duecompared to a
$3.5 million increase in personnel expenses predominantly due to an increase in headcount, related stock-based compensation, and bonuses, a $3.0 million increase in professional service costs predominantly due to consulting and accounting/audit fees, tax services, and corporate insurance, and a $0.9 million increase in facilities costs.
Other Income (Expense)
| | | | | | | | | | | | | | | | | | | | | | | | | | | | | |
| Three Months Ended March 31, | | Percentage of Revenue |
| in thousands | 2021 | | 2020 | | Change | | 2021 | | 2020 |
| Other income (expense): | | | | | | | | | |
| Interest expense | $ | (8,770) | | | $ | (7,382) | | | 18.8 | % | | (5.9) | % | | (14.5) | % |
| Change in payable to related parties pursuant to a Tax Receivable Agreement | 5,886 | | | — | | | * | | 4.0 | % | | — | % |
| Other income | 3 | | | 80 | | | (96.3) | % | | — | % | | 0.2 | % |
| Total other income (expense) | $ | (2,881) | | | $ | (7,302) | | | (60.5) | % | | (1.9) | % | | (14.3) | % |
Comparison of Three Months Ended March 31, 2021 and 2020
Other expense was $7.3$0.5 million for the three months ended March 31, 2020 compared to $2.9 million for the three months ended March 31, 2021,2022, representing an increasea decrease of $4.4$1.5 million, or 60.5%73.9%. The increasedecrease in expense was primarily attributable to highera $5.2 million decrease in interest expense asdue to a result$3.2 million change in fair value of the interest rate cap and $2.2 million decrease in interest expense driven by the lower interest rates from the debt modification. This was partially offset by a larger outstanding debt balance for the period. A $5.9$3.5 million decrease in gain related to the payable to related parties pursuant to a Tax Receivable Agreement was recorded for the three months ended March 31, 2021 as a result of changes in our estimated state income tax apportionment and the corresponding reduction of our estimated state income tax rate.
Relationship with GTCR, LLC (“GTCR”)
Prior to our initial public offering (“IPO”), we utilized GTCR for certain services pursuant to an advisory services agreement. Under this agreement, GTCR provided us with financial and management consulting services in the areas of corporate strategy, budgeting for future corporate investments, acquisition and divestiture strategies, and debt and equity financings. The advisory services agreement provided that we pay a $0.1 million quarterly management fee to GTCR for these services. We also reimbursed GTCR for out-of-pocket expenses incurred while providing these services. The advisory services agreement also provided that certain of our subsidiaries pay placement fees to GTCR of 1.0% of the gross amount of debt or equity financings. In connection with our IPO, this advisory services agreement was terminated.
As GTCR continues to have representation on our Board of Directors, we will continue to pay GTCR for any direct reimbursable expenses related to the activities oftheir Board members affiliated with GTCR.
activities. We paid GTCR insignificant amounts induring each of the three months ended March 31, 20212022 and 2020, respectively, for services in connection with the advisory services agreement.2021. We may continue to engage GTCR from time to time, subject to compliance with our related party transactions policy.
InDuring the three months ended March 31, 2022 and 2021, we paid amade distributions of $39.9 million and $23.1 million, distributionrespectively, for tax liabilities to MLSH 1.1, which is primarily owned by GTCR.
Concurrent with our IPO, we entered intoWe are also a tax receivable agreementparty to a Tax Receivable Agreement (“TRA”) with MLSH 1, who is primarily owned by GTCR, and MLSH 2.2 (see Note 9 to the condensed consolidated financial statements contained in Part I, Item 1 of this Quarterly Report on Form 10-Q). The Tax Receivable Agreement (“TRA”)TRA provides for the payment by us to MLSH 1 and MLSH 2, collectively, of 85.0% of the amount of tax benefits, if any, that we actually realize, or in some circumstances are deemed to realize, as a result of the Organizational Transactions and IPO. Payment obligations under the TRA are not conditioned upon any Topco LLC unitholders maintaining a continued ownership interest in us or Topco LLC and the rights of MLSH 1 and MLSH 2 under the TRA are assignable. There is no maximum term for the TRA and the TRA will continue until all tax benefits have been utilized or expired unless we exercise our right to terminate the TRA for an agreed-upon amount.
No payments were made to MLSH 1 or MLSH 2 pursuant to the TRA during 2021. As of March 31, 2021, our liability under the TRA was $383.7 million.
Liquidity and Capital Resources
Overview
As of March 31, 2021, we had cash of $247.7 million and; retained earnings of $24.1 million, and net income of $75.9 million for the three months ended March 31, 2021. We also had positive cash flow from operations of $38.7 million.
We have relied on revenue derived from product and services sales and equity and debt financings to fund our operations to date. Our principal uses of cash have been to fund operations, acquisitions and capital expenditures, interest payments and mandatory principal payments on our long-term debt, as well as make distributions to MLSH 1.
We plan to utilize our existing cash on hand, together with cash generated from operations, primarily to fund our commercial and marketing activities associated with our products and services, continued research and development initiatives, and ongoing investments into our manufacturing facilities to create efficiencies and build capacity.
In addition, with the completion of the IPO, we are obligated to make payments under the TRA we entered into with MLSH 1 and MLSH 2. Although the actual amount and timing of any payments that we make under the TRA will vary, we expect that those payments will be significant. Any payments we make under the TRA will generally reduce the amount of overall cash flow that might have otherwise been available to us and, to the extent that we are unable to make payments under the TRA for any reason, the unpaid amount generally will be deferred and will accrue interest until paid by us.
In addition to payments to be made under the TRA, we are also required to make distributions for tax liabilities to the non-controlling interest holders of Topco LLC for the portion of income passing through to them from Topco LLC.
Sources of Liquidity
Since our inception, we have financed our operations primarily from the issuance of equity, borrowings under long-term debt agreements and, to a lesser extent, cash flow from operations.
Our total debt outstanding of $548.5 million at March 31, 2021, was comprised of our First Lien Term Loan. We had no outstanding borrowings under our New Revolving Credit Facility as of March 31, 2021.
New Credit Agreement
On October 19, 2020, Maravai Intermediate Holdings, LLC (“Intermediate”), a wholly-owned subsidiary of ours, along with its subsidiaries Vector Laboratories, TriLink BioTechnologies and Cygnus Technologies (together with Intermediate, the “Borrowers”) entered into the New Credit Agreement with lending institutions, for term-loan borrowings (the “New First Lien Term Loan”) totaling $600.0 million to refinance our outstanding senior secured credit facilities and to allow for a distribution to our members. The New Credit Agreement also provided for a revolving credit facility (the “New Revolving Credit Facility”) of $180.0 million for letters of credit and loans to be used for working capital and other general corporate financing purposes. Borrowings under the New Credit Agreement are unconditionally guaranteed by Topco LLC, along with the existing and future material domestic subsidiaries of Topco LLC (subject to certain exceptions) as specified in the respective guaranty agreements, and are secured by a lien and security interest in substantially all of the assets of existing and future material domestic subsidiaries of Topco LLC that are loan parties. The New First Lien Term Loan bears interest at an annual rate equal to the Eurocurrency rate (i.e. the LIBOR rate) plus an applicable rate. The interest rate was 5.25% per annum as of March 31, 2021
The New Term Loan becomes repayable in quarterly payments of $1.5 million beginning on March 31, 2021, with all remaining outstanding principal due on October 19, 2027. The New Term Loan includes prepayment provisions that allow the us, at their option, to repay all or a portion of the principal amount at any time. The New Revolving Credit Facility allows the us to repay and borrow from time to time until October 19, 2025, at which time all amounts borrowed must be repaid. Subject to certain exceptions and limitations, we are required to repay borrowings under the New Term Loan and New Revolving Credit Facility with the proceeds of certain occurrences, such as the incurrence of debt, certain equity contributions, and certain asset sales or dispositions.
Accrued interest under the New Credit Agreement is payable by us (a) quarterly in arrears with respect to Base Rate loans, (b) at the end of each interest rate period (or at each three-month interval in the case of loans with interest periods greater than three months) with respect to Eurocurrency Rate loans, (c) on the date of any repayment or prepayment and (d) at maturity (whether by acceleration or otherwise). An annual commitment fee is applied to the daily unutilized amount under the New Revolving Credit Facility at 0.375% per annum, with one stepdown to 0.25% per annum based on Intermediate’s first lien net leverage ratio.
Debt Covenants
The New Credit Agreement includes a financial covenant that requires that, if as of the end of any fiscal quarter the aggregate amount of letters of credit obligations and borrowings under the New Revolving Credit Facility outstanding as of the end of such fiscal quarter (excluding cash collateralized letters of credit obligations and letter of credit obligations in an aggregate amount not in excess of $5.0 million at any time outstanding and for the first four fiscal quarters ending after October 19, 2020, borrowings of revolving credit loans made on October 19, 2020) exceed 35% of the aggregate amount of all Revolving Credit
Commitments in effect as of such date, or $63.0 million, then the consolidated first lien net leverage ratio of Intermediate shall not be greater than 8.00 to 1.00. For purposes of this covenant, the net leverage ratio is calculated by dividing outstanding first lien indebtedness (net of cash) by Adjusted EBITDA over the preceding four fiscal quarters.
The New Credit Agreement also contains negative and affirmative covenants in addition to the financial covenant, including covenants that restrict our ability to, among other things, incur or prepay certain indebtedness, pay dividends or distributions, dispose of assets, engage in mergers and consolidations, make acquisitions or other investments, and make changes in the nature of the business. The New Credit Agreement contains certain events of default, including, without limitation, nonpayment of principal, interest or other obligations, violation of the covenants, insolvency, court ordered judgments, and certain changes of control. The New Credit Agreement also requires the Company to provide audited consolidated financial statements to the lenders no later than 120 days after year-end.
As of March 31, 2021, we were in compliance with the covenants under the New Credit Agreement.
The New Credit Agreement also requires mandatory prepayments upon certain excess cash flow, subject to certain step-downs and threshold levels as defined and set forth in the terms of the New Credit Agreement to commence with the fiscal year ending December 31, 2021.
Tax Receivable Agreement
In connection with the completion of our IPO we also entered into a Tax Receivable Agreement with MLSH 1 and MLSH 2. The Tax Receivable Agreement provides for the payment by us to MLSH 1 and MLSH 2, collectively, of 85% of the amount of tax benefits, if any, that we actually realize, or in some circumstances are deemed to realize, from exchanges of LLC Units (together with the corresponding shares of Class B common stock) for Class A common stock, as a result of (i) certain increases in the tax basis of assets of Topco LLC and its subsidiaries resulting from purchases or exchanges of LLC Units, (ii) certain tax attributes of the entities acquired from MLSH 1 and MLSH 2 in connection with the Organizational Transactions, (“the Blocker Entities”), Topco LLC and subsidiaries of Topco LLC that existed prior to this offeringthe IPO, and (iii) certain other tax benefits related to our entering into the Tax Receivable Agreement,TRA, including tax benefits attributable to payments that we make under the Tax Receivable AgreementTRA (collectively, the “Tax Attributes”). Payment obligations under the TRA are not conditioned upon any Topco LLC unitholders maintaining a continued ownership interest in us or Topco LLC, and the rights of MLSH 1 and MLSH 2 under the TRA are assignable. There is no stated term for the TRA, and the TRA will continue until all tax benefits have been utilized or expired unless we exercise our right to terminate the TRA for an agreed-upon amount.
No payments were made to MLSH 1 or MLSH 2 pursuant to the TRA during the three months ended March 31, 2022. As of March 31, 2021,2022, our liability under the TRA was $383.7$746.0 million.
Liquidity and Capital Resources
Overview
We have financed our operations primarily from cash flow from operations, borrowings under long-term debt agreements and, to a lesser extent, the sale of our Class A common stock.
As of March 31, 2022, we had cash of $431.5 million and retained earnings of $251.4 million. We also had net income of $146.9 million and positive cash flows from operations of $162.3 million for the three months ended March 31, 2022.
We have relied on revenue derived from product and services sales, and equity and debt financings to fund our operations to date.
Our principal uses of cash have been to fund operations, acquisitions and capital expenditures, as well as make tax distributions to MLSH 1, make TRA payments to MLSH 1 and MLSH 2 as well as make interest payments and mandatory principal payments on our long-term debt.
We plan to utilize our existing cash on hand, together with cash generated from operations, primarily to fund our commercial and marketing activities associated with our products and services, continued research and development initiatives, and ongoing investments into our manufacturing facilities to create efficiencies and build capacity. We believe our cash on hand, cash generated from operations and continued access to our credit facilities, will be sufficient to satisfy our cash requirements over the next 12 months and beyond.
To the extent revenue from sales in our two remaining business segments continues to grow, we expect our accounts receivable and inventory balances to increase. Any increase in accounts receivable and inventory may not be completely offset by increases in accounts payable and accrued expenses, which could result in greater working capital requirements. Moreover, we have and will continue to incur additional costs associated with operating as a public company, including expenses related to legal, accounting, regulatory, exchange listing and regulatory compliance matters.
As a result of our ownership of LLC Units in Topco LLC, the Company is subject to U.S. federal, state and local income taxes with respect to its allocable share of any taxable income of Topco LLC and is taxed at the prevailing corporate tax rates. In addition to tax expenses, we also will incur expenses related to our operations and we will be required to make payments under the TRA with MLSH 1 and MLSH 2. Due to the uncertainty of various factors, we cannot precisely quantify the likely tax benefits we will realize as a result of LLC Unit exchanges and the resulting amounts we are likely to pay out to LLC Unitholders of Topco LLC pursuant to the TRA; however, we estimate that such payments may be substantial. Assuming no changes in the relevant tax law, and that we earn sufficient taxable income to realize all tax benefits that are subject to the TRA, we expect that future payments under the TRA relating to the purchase by the Company of LLC Units from MLSH 1 and the tax attributes to be approximately $746.0 million and to range over the next 15 years from approximately $34.7 million to $63.0 million per year and decline thereafter. Future payments in respect of subsequent exchanges or financings would be in addition to these amounts and are expected to be substantial. The foregoing numbers are estimates and the actual payments could differ materially. We expect to fund these payments using cash on hand and cash generated from operations.
As a result of a change of control, material breach, or our election to terminate the TRA early, (1) we could be required to make cash payments to MLSH 1 and MLSH 2 that are greater than the specified percentage of the actual benefits we ultimately realize in respect of the tax benefits that are subject to the TRA and (2) we will be required to make an immediate cash payment equal to the present value of the anticipated future tax benefits that are the subject of the TRA, which payment may be made significantly in advance of the actual realization, if any, of such future tax benefits. In these situations, our obligations under the TRA could have a material adverse effect on our liquidity and could have the effect of delaying, deferring or preventing certain mergers, asset sales, other forms of business combination, or other changes of control. There can be no assurance that we will be able to adequately finance our payment obligations under the TRA.
In addition to payments to be made under the TRA, we are also required to make tax distributions to MLSH 1 pursuant to the LLC Operating Agreement for the portion of income passing through to them from Topco LLC.
Credit Agreement
The Credit Agreement provides us with a term-loan facility (the “Term Loan”) totaling $600.0 million and a revolving credit facility (the “Revolving Credit Facility”) of $180.0 million for letters of credit and loans to be used for working capital and other general corporate financing purposes. Borrowings under the Credit Agreement are unconditionally guaranteed by Topco LLC, along with the existing and future material domestic subsidiaries of Topco LLC (subject to certain exceptions) as specified in the respective guaranty agreements, and are secured by a lien and security interest in substantially all of the assets of existing and future material domestic subsidiaries of Topco LLC that are loan parties.
In January 2022, the Company entered into an amendment (the “Amendment”) to the Credit Agreement, among Intermediate, Cygnus and TriLink, as the borrowers, Topco LLC, as holdings, the lenders from time-to-time party thereto and Morgan Stanley Senior Funding, Inc., as administrative and collateral agent (as amended, supplemented or otherwise modified, the “Credit Agreement”). The Company entered into the Amendment to: (i) refinance the existing $544.0 million aggregate principal balance on the First Lien Term Loan and replace it with a new Tranche B Term Loan (“Tranche B Term Loan”), (ii) replace the LIBOR-based interest rate with a Term Secured Overnight Financing Rate (“SOFR”) based rate, and (iii) reduce the interest rate margins applicable to the Term Loan and Revolving Credit Facilities under the Credit Agreement. The previous interest rate margin on the facilities was, with respect to each LIBOR-based loan, 3.75% to 4.25% and, with respect to each base rate-based loan, 2.75% to 3.25% (depending, in each case, on consolidated first lien leverage). Following the Amendment, the interest rate margin on the facilities is 3.00%, with respect to each Term SOFR-based loan, and 2.00%, with respect to each base rate-based loan. Further, the Amendment reduced the base rate floor for the term loans from 2.00% to 1.50%, sets the floor for Term SOFR-based term loans at 0.50% and sets the floor for Term SOFR-based revolving loans at 0.00%. No other significant terms under the Credit Agreement were changed in connection with the Amendment.
The Base Rate is defined in the Credit Agreement as the greatest of (i) the rate last quoted by The Wall Street Journal as the “Prime Rate” in the United States, (ii) the NYFRB Rate plus 0.50% per annum, (iii) the Term SOFR Rate for a one month interest period plus 1.00% per annum, (iv) solely with respect to the Tranche B term loans, 1.50% per annum and (v) for any loans that are not Tranche B term loans, 1.00% per annum. The “Term SOFR Rate,” as defined in the Credit Agreement, means with respect to any Term SOFR Rate Borrowing and for any other tenor comparable to the applicable interest period, the Term SOFR Reference Rate at approximately 5:00 a.m., Chicago time, two U.S. Government Securities Business Days prior to the commencement of such tenor comparable to the applicable interest period, as such rate is published by the CME Term SOFR Administrator; provided that in no event shall the Term SOFR Rate for any interest period (i) for Term B Loans be less than 0.50% or (ii) for any other Loans, be less than 0.00%.
The Tranche B Term Loan became repayable in quarterly payments of $1.4 million beginning in March 2022, with all remaining outstanding principal due in October 2027. The Tranche B Term Loan includes prepayment provisions that allow us, at our option, to repay all or a portion of the principal amount at any time. The Revolving Credit Facility allows us to repay and borrow from time to time until October 2025, at which time all amounts borrowed must be repaid. Subject to certain exceptions and limitations, we are required to repay borrowings under the Tranche B Term Loan and Revolving Credit Facility with the proceeds of certain occurrences, such as the incurrence of debt, certain equity contributions and certain asset sales or dispositions.
Commencing with the fiscal year ended December 31, 2021, and each fiscal year thereafter, the Credit Agreement requires that we make mandatory prepayments on the Term Loan principal upon certain excess cash flow, subject to certain step-downs based on the Company’s first lien net leverage ratio. The mandatory prepayment shall be reduced to 25% or 0% of the calculated excess cash flow if the first lien net leverage ratio was equal to or less than 4.75:1.00 or 4.25:1.00, respectively, however, no prepayment is required to the extent excess cash flow calculated for the respective period is equal to or less than $10.0 million. As of March 31, 2022, our first lien net leverage ratio was less than 4.25:1.00, thus a prepayment was not required.
Accrued interest under the Credit Agreement is payable by us (a) quarterly in arrears with respect to Base Rate loans, (b) at the end of each interest rate period (or at each three-month interval in the case of loans with interest periods greater than three months) with respect to Term SOFR Rate loans, (c) on the date of any repayment or prepayment and (d) at maturity (whether by acceleration or otherwise). An annual commitment fee is applied to the daily unutilized amount under the Revolving Credit Facility at 0.375% per annum, with one stepdown to 0.25% per annum based on Intermediate’s first lien net leverage ratio.
Debt Covenants
The Credit Agreement includes a financial covenant that requires that, if as of the end of any fiscal quarter the aggregate amount of letters of credit obligations and borrowings under the Revolving Credit Facility outstanding as of the end of such fiscal quarter (excluding cash collateralized letters of credit obligations and letter of credit obligations in an aggregate amount not in excess of $5.0 million at any time outstanding and for the first four fiscal quarters ending after October 2020, borrowings of revolving credit loans made before October 2020) exceeds 35% of the aggregate amount of all Revolving Credit Commitments in effect as of such date, then the net leverage ratio of Intermediate may not be greater than 8.00 to 1.00. For purposes of this covenant, the net leverage ratio is calculated by dividing outstanding first lien indebtedness (net of cash) by Adjusted EBITDA over the preceding four fiscal quarters.
The Credit Agreement also contains negative and affirmative covenants in addition to the financial covenant, including covenants that restrict our ability to, among other things, incur or prepay certain indebtedness, pay dividends or distributions, dispose of assets, engage in mergers and consolidations, make acquisitions or other investments, and make changes in the nature of the business. The Credit Agreement contains certain events of default, including, without limitation, nonpayment of
principal, interest or other obligations, violation of the covenants, insolvency, court ordered judgments and certain changes of control. The Credit Agreement also requires the Company to provide audited consolidated financial statements to the lenders no later than 120 days after year-end.
The Credit Agreement contains a financial covenant (consolidated first lien leverage ratio) measured as of the last day of each fiscal quarter. As of March 31, 2022, we were in compliance with these covenants.
As of March 31, 2022, interest rate on the Tranche B Term Loan was 3.50%.
Tax Receivable Agreement
We are a party to the TRA with MLSH 1 and MLSH 2. The TRA provides for the payment by us to MLSH 1 and MLSH 2, collectively, of 85% of the amount of certain tax benefits, if any, that we actually realize, or in some circumstances are deemed to realize, as a result of the Organizational Transactions, IPO and any subsequent purchases or exchanges of LLC Units of Topco LLC. Based on our current projections of taxable income, and before deduction of any specially allocated depreciation and amortization, we anticipate having enough taxable income to utilize most of these tax benefits.
As of March 31, 2022, our liability under the TRA was $746.0 million, representing 85% of the calculated tax savings we anticipated being able to utilize in future years. We may record additional liabilities under the TRA when LLC Units are exchanged in the future and as our estimates of the future utilization of the tax attributes,Tax Attributes, NOLs and other tax benefits change. We expect to make payments under the TRA, to the extent they are required, within 125 days after the extended due date of our U.S. federal income tax return for such taxable year. Interest on such payment will begin to accrue from the due date (without extensions) of such tax return at a rate of LIBOR plus 100 basis points. Any late payments will continue to accrue interest at LIBOR plus 500 basis points until such payments are made.
In April 2021, we completed a secondary offering in which certain stockholders sold an aggregate of 20,700,000 shares of our Class A common stock at a public offering price of $31.25 per share. We did not receive any proceeds from the sale of these shares. The offering also included exchange of 17,665,959 LLC units (paired with the corresponding shares of Class B common stock) for Class A common stock by certain selling stockholders.
The payment obligations under the TRA are obligations of Maravai LifeSciences Holdings, Inc. and not of Topco LLC. Although the actual timing and amount of any payments that may be made under the TRA will vary, we expect that the aggregate payments that we will be required to make to MLSH 1 and MLSH 2 will be substantial. Any payments made by us under the TRA will generally reduce the amount of overall cash flow that might have otherwise been available to us or to Topco LLC and, to the extent that we are unable to make payments under the TRA for any reason, the unpaid amounts will be deferred and will accrue interest until paid by us. We anticipate funding ordinary course payments under the Tax Receivable AgreementTRA from cash flow from operations of Topco LLC and its subsidiaries, available cash and/or available borrowings under the New Credit Agreement.
Cash Flows
The following table summarizes our cash flows for the periods presented:presented (in thousands):
| | | | | | | | | | | |
| Three Months Ended March 31, |
| 2022 | | 2021
(as adjusted)* |
| Net cash provided by (used in): | | | |
| Operating activities | $ | 162,304 | | | $ | 38,326 | |
| Investing activities | (241,584) | | | (2,784) | |
| Financing activities | (40,523) | | | (24,058) | |
| Effects of exchange rate changes on cash | — | | | 7 | |
| | | |
| Net (decrease) increase in cash | $ | (119,803) | | | $ | 11,491 | |
| | | | | | | | | | | |
| Three Months Ended March 31, |
| (in thousands) | 2021 | | 2020 |
| Net cash (used in) provided by: | | | |
| Operating activities | $ | 38,715 | | | $ | 9,713 | |
| Investing activities | (3,032) | | | 28,067 | |
| Financing activities | (24,199) | | | 14,339 | |
| Effects of exchange rate changes on cash | 7 | | | (72) | |
| Net increase in cash | $ | 11,491 | | | $ | 52,047 | |
Operating Activities
Net cash provided by operating activities for the three months ended March 31, 20212022 was $38.7$162.3 million, which was primarily attributable to a net income of $75.9$146.9 million, offset by non-cash depreciation and amortization of $6.9$7.4 million, non-cash operating lease expense of $1.9 million, non-cash amortization of deferred financing costs of $0.7 million, non-cash equity-based compensation of $3.6 million, and non-cash decrease in deferred income taxes of $13.2 million. These were partially offset by a non-cash gain on the revaluation of liabilities under the TRA of $2.3 million and a net cash outflow from the change in our operating assets and liabilities of $8.2 million.
Net cash provided by operating activities for the three months ended March 31, 2021 was $38.3 million, which was primarily attributable to a net income of $75.5 million, non-cash depreciation and amortization of $6.3 million, non-cash operating lease
expense of $2.4 million, non-cash amortization of deferred financing costs of $0.7 million, non-cash equity-based compensation of $2.3 million, aand non-cash decrease in deferred income taxes of $11.8 million,million. These were partially offset by a non-cash gain on the revaluation of liabilities under the Tax Receivable Agreement of $5.9 million and a net cash outflow from the change in our operating assets and liabilities of $52.9 million.
Net cash provided by operating activities for the three months ended March 31, 2020 was $9.7 million, which was primarily attributable to a net income of $23.9 million, offset by non-cash depreciation and amortization of $6.8 million, non-cash amortization of deferred financing costs of $0.4 million, non-cash equity-based compensation of $0.5 million, and the acquired in-process research and development costs of $2.9 million, partially offset by a net cash outflow from the change in our operating assets and liabilities of $4.7 million, an increase in non-cash deferred income taxes of $1.3 million, and a gain on sale of leaseback transaction of $19.0$54.3 million.
Investing Activities
Net cash used in investing activities for the three months ended March 31, 20212022 was $3.0$241.6 million, which was primarily comprised of $238.8 million for the net cash consideration paid for the acquisition of MyChem and net cash outflows of $3.6$2.7 million for property and equipment purchases.
Net cash used in investing activities for the three months ended March 31, 2021 was $2.8 million, which was primarily attributable to net cash outflows of $3.3 million for property and equipment purchases, partially offset by cash receipts of $0.5 million from the sale of our United Kingdom facility.
Financing Activities
Net cash provided by investingused in financing activities for the three months ended March 31, 20202022 was $28.1$40.5 million, which was primarily attributable to $39.9 million of distributions for tax liabilities to non-controlling interest holders, required pursuant to the sale and leasebackterms of our Burlingame, California facility for $34.5 million, net of cash outflows of $3.4 million for property and equipment purchases and $3.0 million for an asset acquisition, net of cash acquired.
Financing Activities
Net cash used in financing activities for the three months ended March 31, 2021 was $24.2$24.1 million, which was primarily attributable to $23.1 million of distributions for tax liabilities to non-controlling interest holders, required pursuant to the terms of the LLC Operating Agreement, and $1.5 million of principal payment onrepayments of long-term debt.
Net cash provided by financing activitiesCapital Expenditures
Capital expenditures for the three months ended March 31, 2020 was $14.32022 totaled $4.5 million. Capital expenditures for the year ending December 31, 2022 are projected to be in the range of $65.0 million to $75.0 million and will primarily be related to new facility construction for our Flanders San Diego, California and Leland, North Carolina locations.
Contractual Obligations and Commitments
The following table summarizes our contractual obligations and commitments as of March 31, 2022 (in thousands):
| | | | | | | | | | | | | | | | | | | | | | | | | | | | | |
| Payments due by period |
| Total | | 1 year | | 2 - 3 years | | 4 - 5 years | | 5+ years |
Operating leases (1) | $ | 141,707 | | | $ | 7,070 | | | $ | 22,421 | | | $ | 22,770 | | | $ | 89,446 | |
| | | | | | | | | |
Debt obligations (2) | 542,640 | | | 5,440 | | | 10,880 | | | 10,880 | | | 515,440 | |
TRA payments (3) | 745,979 | | | 34,747 | | | 84,377 | | | 86,745 | | | 540,110 | |
Unconditional purchase obligations (4) | 7,200 | | | 4,200 | | | 3,000 | | | — | | | — | |
Consideration payable (5) | 10,000 | | | — | | | 10,000 | | | — | | | — | |
| Total | $ | 1,447,526 | | | $ | 51,457 | | | $ | 130,678 | | | $ | 120,395 | | | $ | 1,144,996 | |
____________________
(1)Represents operating leases including our Flanders San Diego Facility and Leland Facility, which was primarily attributableare expected to $15.0 millioncommence in the third and fourth quarter of proceeds from borrowings of2022, respectively.
(2)Represents long-term debt partially offset by $0.6 million principal repaymentsmaturities, excluding interest. See Note 6 to the condensed consolidated financial statements contained in Part I, Item 1 of long-term debt.this Quarterly Report on Form 10-Q for additional information.
Off-Balance Sheet Arrangements(4)Represents firm purchase commitments to our suppliers.
(5)Represents an additional amount we may be required to pay to the sellers of MyChem subject to the completion of certain calculations associated with acquired inventory. See Note 2 to the condensed consolidated financial statements contained in Part I, Item 1 of this Quarterly Report on Form 10-Q for additional information.
Tax distributions are required under the terms of the Topco LLC Agreement. See Note 8 to the condensed consolidated financial statements contained in Part I, Item 1 of this Quarterly Report on Form 10-Q for additional information regarding tax distributions.
Commencing with the fiscal year ended December 31, 2021, and each fiscal year thereafter, the Credit Agreement requires that we make mandatory prepayments of the Term Loan principal upon certain excess cash flow, subject to certain step-downs based on our first lien net leverage ratio. The mandatory prepayment shall be reduced to 25% or 0% of the calculated excess cash flow if the first lien net leverage ratio was equal to or less than 4.75:1.00 or 4.25:1.00, respectively, however, no prepayment shall be required to the extent excess cash flow calculated for the respective period is equal to or less than $10.0 million. As of March 31, 2021,2022, our first lien net leverage ratio is less than 4.25:1.00.
In connection with our acquisition of MyChem, we didmay be required to make certain payments to its sellers. We may be required to make additional payments of up to $40.0 million to the sellers of MyChem dependent upon meeting or exceeding defined revenue targets during fiscal 2022. We may also be required to make certain payments of $20.0 million to them as of the second anniversary of the closing of the acquisition date as long as the sellers of MyChem continue to be employed by TriLink. We cannot, at this time, determine when or if the related targets will be achieved or whether the events triggering the commencement of payment obligations will occur. Therefore, such payments were not have any relationships with unconsolidated entities orincluded in the table above. See Notes 2 and 4 to the condensed consolidated financial partnerships, such as entities often referred to as structured finance or special purpose entities establishedstatements contained in Part I, Item 1 of this Quarterly Report on Form 10-Q for the purpose of facilitating off-balance sheet arrangements or other contractually narrow or limited purposes.additional details.
Critical Accounting Policies and Estimates
The discussion and analysis of our financial condition and results of operations are based upon our interim condensed consolidated financial statements, which have been prepared in accordance with U.S. generally accepted accounting principles. The preparation of these condensed consolidated financial statements requires us to make estimates and judgments that affect
the reported amounts of assets, liabilities, revenue, expenses and related disclosures in the consolidated financial statements. Our estimates are based on historical experience and on various other assumptions that we believe are reasonable under the circumstances, the results of which form the basis for making judgments about the carrying value of assets and liabilities that are not readily apparent from other sources. Actual results could differ from these estimates under different assumptions or conditions and any such difference may be material. For a discussion of how these and other factors may affect our business, financial condition or results of operations, see “Risk“Item 1A. Risk Factors” described in our Annual Report on Form 10-K for the fiscal year ended December 31, 2020.2021.
The critical accounting estimates that we believe affect our more significant judgments and estimates used in the preparation of our condensed consolidated financial statements presented in this report are described in Management’s Discussion and Analysis of Financial Condition and Results of Operations and in the Notes to the Consolidated Financial Statements included in our Annual Report on Form 10-K for fiscal year ended December 31, 2020. There2021. Except as noted below, there have been no material changes to our critical accounting policies or estimates from those set forth in our Annual Report on Form 10-K for the fiscal year ended December 31, 2020.2021.
Recognition of Intangible Assets as Part of a Business Combination
The Company accounts for its business combinations using the acquisition method of accounting which requires that the assets acquired and liabilities assumed of acquired businesses be recorded at their respective fair values at the date of acquisition. The purchase price, which includes the fair value of consideration transferred, is attributed to the fair value of the assets acquired and liabilities assumed. The excess of the purchase price of the acquisition over the fair value of the identifiable net assets of the acquiree is recorded as goodwill.
Determining the fair value of intangible assets acquired requires management to use significant judgment and estimates, including the selection of valuation methodologies, assumptions about future net cashflows, discount rates and market participants. Each of these factors can significantly affect the value attributed to the identifiable intangible asset acquired in a business combination.
We generally utilize a discounted cash flow method under the income approach to estimate the fair value of identifiable intangible assets acquired in a business combination. For the acquisition of MyChem, LLC, the estimated fair value of the developed technology intangible asset was based on the multi-period excess earnings method. The estimated fair value was developed by discounting future net cash flows to their present value at market-based rates of return. We selected the assumptions used in the financial forecasts using historical data, supplemented by current and anticipated market conditions, estimated revenue growth rates, management’s plans, and guideline companies. Some of the more significant assumptions inherent in estimating the fair value of this intangible asset included revenue growth rates ranging from 3.0% to 30.6%, technical obsolescent curves ranging from 5.0% to 7.5%, and a discount rate of 16.5%.
The use of alternative estimates and assumptions could increase or decrease the estimated fair value and amounts allocated to identifiable intangible assets acquired and future amortization expense as well as goodwill.
Recent Accounting Pronouncements
For a description of the expected impact of recent accounting pronouncements, see “Note 1. Organization and Significant Accounting Policies” inNote 1 to the “Notes to Condensed Consolidated Financial Statements”condensed consolidated financial statements contained in Part I, Item 1 of this Quarterly Report on Form 10-Q.
JOBS Act Accounting Election
We are an “emerging growth company” within the meaning of the JOBS Act. The JOBS Act permits an emerging growth company like us to take advantage of an extended transition period to comply with new or revised accounting standards applicable to public companies. We are electing to use this extended transition period and we will therefore comply with new or revised accounting standards on the earlier of (i) when they apply to private companies; or (ii) when we lose our emerging growth company status. As a result, our financial statements may not be comparable with companies that comply with public company effective dates for accounting standards. We also rely on other exemptions provided by the JOBS Act, including not being required to comply with the auditor attestation requirements of Section 404(b) of the Sarbanes-Oxley Act unless we cease to be an emerging growth company.
We will remain an emerging growth company until the earliest of (1) December 31, 2025, (2) the last day of the fiscal year in which we have total annual gross revenue of at least $1.07 billion, (3) the last day of the fiscal year in which we are deemed to be a “large accelerated filer” as defined in Rule 12b-2 under the Exchange Act, which would occur if the market value of our Class A common stock held by non-affiliates exceeded $700.0 million as of the last business day of the second fiscal quarter of such year or (4) the date on which we have issued more than $1.0 billion in non-convertible debt securities during the prior three-year period.
Item 3. Quantitative and Qualitative Disclosures About Market Risk
Interest Rate Risk
As of March 31, 2021,2022, our primary exposure to interest rate risk was associated with our variable rate long-term debt. The NewBorrowings under our Credit Agreement bear interest subjectat a rate equal to the Base Rate plus a margin of 2.00%, with respect to each Base Rate-based loan, or the Adjusted Eurocurrency Rate.Term SOFR (Secured Overnight Financing Rate) plus a margin of 3.00% with respect to each Term SOFR-based loan, subject in each case to an applicable Base Rate or Term SOFR floor (see Note 6 to the condensed consolidated financial statements contained in Part I, Item 1 of this Quarterly Report on Form 10-Q). Interest rates can fluctuate for a number of reasons, including changes in the fiscal and monetary policies or geopolitical events or changes in general economic conditions. This could adversely affect our cash flows.
As of March 31, 2021,2022, we have an interest rate cap agreement in place to hedge a portion of our variable interest rate risk on our outstanding long-term debt. The agreement has a contract notional amount of $415.0 million and entitles us to receive from the counterparty at each calendar quarter end the amount, if any, by which a specified floating market rate exceeds the cap strike interest rate. The floating interest rate is reset at the end of each calendar quarter end. The contract expires on March 31, 2023.
We had $548.5$542.6 million of outstanding borrowings under our New First LienTranche B Term Loan and no outstanding borrowings under our Revolving Credit Facility as of March 31, 2021.2022. For the three months ended March 31, 2021,2022, the effect of a hypothetical 100 basis point increase or decrease in overall interest rates would have changed our interest expense by approximately $1.4 million.
We had cash of $247.7$431.5 million as of March 31, 2021.2022. Our cash is held in demand deposits and is not subject to market risk.
Foreign Currency Risk
The majorityAll of our revenue is denominated in U.S. dollars; however,dollars. Although approximately 47.2%64.4% of our revenue was derived from international sales for the three months ended March 31, 2021,2022 was derived from international sales, primarily in Europe and Asia Pacific. However, only ourPacific, none of these sales in the United Kingdom are denominated in local currency. Our remaining international sales are denominated in the U.S. dollar. OurThe majority of our expenses are generally denominated in the currencies in which they are incurred, which is primarily in the United States and, to a lesser extent, the United Kingdom.States. As we expand our presence in international markets, to the extent we are required to enter into agreements denominated in a currency other than the U.S. dollar, results of operations and cash flows may increasingly be subject to fluctuations due to changes in foreign currency exchange rates and may be adversely affected in the future due to changes in foreign exchange rates. To date, we have not entered into any hedging arrangements with respect to foreign currency risk. As our international operations grow, we will continue to reassess our approach to manage our risk relating to fluctuations in currency rates.
Item 4. Controls and Procedures
Evaluation of Disclosure Controls and Procedures
Under the supervision and with the participation of our management, including our Chief Executive Officer and Chief Financial Officer, we evaluated the effectiveness of our disclosure controls and procedures pursuant to Rule 13a-15(e) and 15(d)-15(e) under the Securities Exchange Act of 1934, as amended (the “Exchange Act”) as of the end of the period covered by this Quarterly Report on Form 10-Q. Our disclosure controls and procedures are designed to ensure that information required to be disclosed in the reports we file or submit under the Exchange Act is recorded, processed, summarized and reported within the time periods specified in the SEC’s rules and forms, and that such information is accumulated and communicated to our management, including the Chief Executive Officer and the Chief Financial Officer, to allow timely decisions regarding required disclosures. Any controls and procedures, no matter how well designed and operated, can provide only reasonable assurance of achieving the desired control objective and management necessarily applies its judgment in evaluating the cost-benefit relationship of possible controls and procedures. Based on that evaluation, our Chief Executive Officer and Chief
Financial Officer have concluded that our disclosure controls and procedures were effective at a reasonable assurance level as of March 31, 2021.2022.
Changes in Internal Control over Financial Reporting
As permitted by applicable SEC guidance, the scope of our evaluation regarding changes in our internal control over financial reporting during the three months ended March 31, 2022 excluded internal control over financial reporting for MyChem, LLC, which we acquired on January 27, 2022, as we are still in the process of integrating its internal control over financial reporting into our existing operations as part of our planned integration activities. There have beenwere no other changes in our internal control over financial reporting, as such term is defined in Rules 13a-15(f) and 15d-15(f) under the Exchange Act, during the three months ended March 31, 20212022 that have materially affected, or are reasonably likely to materially affect, our internal control over financial reporting.
Part II.
Item 1. Legal Proceedings
From time to time, we may be involved in various legal proceedings and subject to claims that arise in the ordinary course of business. Although the results of litigation and claims are inherently unpredictable and uncertain, we are not currently a party to any legal proceedings the outcome of which, if determined adversely to us, are believed to, either individually or taken together, have a material adverse effect on our business, operating results, cash flows or financial condition. Regardless of the outcome, litigation has the potential to have an adverse impact on us because of defense and settlement costs, diversion of management resources, and other factors.
Item 1A. Risk Factors
Other than the addition of the risk factor set forth below to “Risk Factors—Risks Related to our Intellectual PropertyBusiness and Technology”Strategy”, there have been no material changes to the risk factors disclosed under the heading “Risk Factors” in our most recent Annual Report on Form 10-K.
Risks Related to Our Intellectual PropertyBusiness and TechnologyStrategy
The extent and duration of our revenue associated with COVID-19 related products and services are uncertain and are dependent, in important respects, on factors outside our control.
If weCertain of our products, including our proprietary CleanCap® analogs, are prevented from enforcingused by our intellectual property rights because of governmental regulatory policies or political pressure or action, our sales and profitability may be materially adversely affected.
Our ability to maintain and grow our product sales and profitability depends,customers in part, on our ability to maintain and enforce our patents and other intellectual property rights. Recent political statements and proposed actions against the enforcement of intellectual property related to COVID-19 vaccines, such as the announcement by the United States Trade Representative on May 5, 2021, that the United States will support negotiations at the World Trade Organization related to waiver of certain unspecified intellectual property protections for COVID-19 vaccines, may impact our ability to fully assert our intellectual property rights related to our CleanCap product in connection with the production of COVID-19 vaccines. Further, these policy actionsThe evolving nature of the COVID-19 pandemic and the resulting global public health response may complicateaffect continued demand for our analysisCOVID-19 related products and decision-making with respectservices, which have comprised the majority of our revenue in recent periods. More specifically, the ongoing manufacture and supply of COVID-19 vaccines (including potential booster doses) by our customers is uncertain and subject to both researchvarious political, social, economic, and regulatory factors that are outside of our control, including the duration of the pandemic; emerging information concerning the severity and incidence of the virus and its variants; the emergence of additional virus variants; regional resurgences of the virus globally; the rate at which the population globally becomes vaccinated against COVID-19; the development and capital investment, givenavailability of antiviral therapeutic alternatives; and political and social debate relating to the potentialneed for, lower returnsefficacy of, or side effects related to one or more specific COVID-19 vaccines. To the extent that the supply and manufacture of COVID-19 vaccines by our customers slows or becomes no longer necessary, demand for our products and services could significantly decrease, which would have a material adverse effect on those investments that could result from our inability to fully protect our intellectual property. If we are unable to successfully navigate these considerations, the future revenuesrevenue, results of operations and profitability of our business could be negatively impacted. We are unable to estimate the impact of these potential policies given that they remain undefined and their adoption is uncertain.
Item 2. Unregistered Sales of Equity Securities
None.
Item 3. Defaults Upon Senior Securities
None.
Item 5. Other Information
None.
Item 6. Exhibits
| | | | | | | | |
| Exhibit Number | | Description |
| | |
| 3.1 | | |
| | |
| 3.2 | | |
| | |
| 10.1+§ | | |
| | |
| 10.2+§ | | |
| | |
| 10.3+§ | | |
| | |
| 10.4 | | Amendment No. 2, dated as of January 19, 2022, to the Credit Agreement, dated as of October 19, 2020, among Maravai Intermediate Holdings, LLC, Cygnus Technologies, LLC, Trilink Biotechnologies, LLC, Maravai Topco Holdings, LLC and Morgan Stanley Senior Funding, Inc. (incorporated by reference to Exhibit 10.1 to the Company’s Current Report on Form 8-K filed on January 20, 2022). |
| | |
| 31.1 | | |
| | |
| 31.2 | | |
| | |
| 32.1* | | |
| | |
| 32.2* | | |
| | |
| 101.INS | | XBRL Instance Document - the instance document does not appear in the Interactive Data File because its XBRL tags are embedded within the Inline XBRL document. |
| | |
| 101.SCH | | XBRL Taxonomy Extension Schema Document. |
| | |
| 101.CAL | | XBRL Taxonomy Extension Calculation Linkbase Document. |
| | |
| 101.DEF | | XBRL Extension Definition Linkbase Document. |
| | |
| 101.LAB | | XBRL Taxonomy Label Linkbase Document. |
| | |
| 101.PRE | | XBRL Taxonomy Extension Presentation Linkbase Document. |
| | |
| 104 | | Cover Page Interactive Data File (formatted as Inline XBRL and contained in exhibit 101) |
_______________
| | | | | |
| * | The certifications furnished in Exhibits 32.1 and 32.2 hereto are deemed to accompany this Quarterly Report on Form 10-Q and will not be deemed “filed” for purposes of Section 18 of the Securities Exchange Act of 1934, as amended, except to the extent that the registrant specifically incorporates it by reference. |
| |
| + | Indicates a management contract or compensatory plan or agreement. |
| |
| § | Exhibits and schedules have been omitted pursuant to Item 601(a)(5) of Regulation S-K and will be provided on a supplemental basis to the Securities and Exchange Commission upon request. |
SIGNATURES
Pursuant to the requirements of the Securities Act of 1934, the registrant has duly caused this Quarterly Report on Form 10-Q to be signed on its behalf by the undersigned, thereunto duly authorized.
| | | | | | | | | | | |
| Maravai LifeSciences Holdings, Inc. |
| | |
| By: | | /s/ Kevin Herde |
| Name: | | Kevin Herde |
| Title: | | Chief Financial Officer |