UNITED STATES
SECURITIES AND EXCHANGE COMMISSION
Washington, D.C. 20549
___________________________
FORM 10-Q
___________________________
(Mark One)
| | | | | |
| ☒ | QUARTERLY REPORT PURSUANT TO SECTION 13 OR 15(d) OF THE SECURITIES EXCHANGE ACT OF 1934 |
For the quarterly period ended March 31, 20232024
or
| | | | | |
| ☐ | TRANSITION REPORT PURSUANT TO SECTION 13 OR 15(d) OF THE SECURITIES EXCHANGE ACT OF 1934 |
For the transition period from to
Commission File Number: 001-39653
___________________________
BLUE OWL CAPITAL INC.
(Exact name of registrant as specified in its charter)
___________________________
| | | | | | | | | | | | | | |
| Delaware | | 86-3906032 |
(State or other jurisdiction of
incorporation or organization) | | (I.R.S. Employer
Identification No.) |
| | | | | | | | | | | |
| 399 Park Avenue, | New York, | NY | 10022 |
| (address of principal executive offices) |
(212) 419-3000
(Registrant’s telephone number, including area code)
___________________________
Securities registered pursuant to Section 12(b) of the Act:
| | | | | | | | | | | | | | |
| Title of each class | | Trading symbol(s) | | Name of each exchange on which registered |
| Class A common stock | | OWL | | New York Stock Exchange |
| | | | |
Indicate by check mark whether the registrant: (1) has filed all reports required to be filed by Section 13 or 15(d) of the Securities Exchange Act of 1934 during the preceding 12 months (or for such shorter period that the registrant was required to file such reports), and (2) has been subject to such filing requirements for the past 90 days. Yes ☒ No o
Indicate by check mark whether the registrant has submitted electronically every Interactive Data File required to be submitted pursuant to Rule 405 of Regulation S-T (§232.405 of this chapter) during the preceding 12 months (or for such shorter period that the registrant was required to submit and post such files). Yes ☒ No o
Indicate by check mark whether the registrant is a large accelerated filer, an accelerated filer, a non-accelerated filer, a smaller reporting company, or an emerging growth company. See the definitions of “large accelerated filer,” “accelerated filer,” “smaller reporting company,” and “emerging growth company” in Rule 12b-2 of the Exchange Act.
| | | | | | | | | | | | | | |
| Large accelerated filer | ☒ | | Accelerated filer | o |
| Non-accelerated filer | o | | Smaller reporting company | o |
| | | Emerging growth company | o |
If an emerging growth company, indicate by check mark if the registrant has elected not to use the extended transition period for complying with any new or revised financial accounting standards provided pursuant to Section 13(a) of the Exchange Act. ☐
Indicate by check mark whether the registrant is a shell company (as defined in Rule 12b-2 of the Act). Yes ☐ No ☒
Indicate the number of shares outstanding of each of the issuer’s classes of common stock, as of the latest practicable date.
| | | | | | | | |
| Class | | Outstanding at May 1, 2023April 26, 2024 |
| Class A common stock, par value $0.0001 | | 445,872,226500,879,131 | |
| Class B common stock, par value $0.0001 | | — | |
| Class C common stock, par value $0.0001 | | 642,123,728611,908,856 | |
| Class D common stock, par value $0.0001 | | 319,132,127316,016,619 | |
TABLE OF CONTENTS
DEFINED TERMS
| | | | | | | | |
| Assets Under Management or AUM | | Refers to the assets that we manage, and areis generally equal to the sum of (i) net asset value (“NAV”); (ii) drawn and undrawn debt; (iii) uncalled capital commitments; (iv) total managed assets for certain Real Estate products; and (v) par value of collateral for collateralized loan obligations (“CLOs”). |
| | |
| Annual Report | | Refers to our annual report for the year ended December 31, 2022,2023, filed with the SEC on Form 10-K on February 27, 2023.23, 2024. |
| | |
| our BDCs | | Refers to ourthe business development companies (“BDCs”) we manage, as regulated under the Investment Company Act of 1940, as amended: Blue Owl Rock Capital Corporation (NYSE: ORCC)OBDC) (“ORCC”OBDC”), Blue Owl Rock Capital Corporation II (“ORCCOBDC II”), Blue Owl Rock Capital Corporation III (NYSE: OBDE) (“ORCCOBDC III”), Blue Owl Rock Technology Finance Corp. (“ORTF”OTF”), Blue Owl Rock Technology Finance Corp. II (“ORTFOTF II”), Blue Owl Rock CoreCredit Income Corp. (“ORCIC”OCIC”) and Blue Owl Rock Technology Income Corp. (“ORTIC”OTIC”). |
| | |
| Blue Owl, the Company, the firm, we, us, and our | | Refers to the Registrant and its consolidated subsidiaries. |
| | |
| Blue Owl Carry | | Refers to Blue Owl Capital Carry LP. |
| | |
| Blue Owl GP | | Refers collectively to Blue Owl Capital GP Holdings LLC and Blue Owl Capital GP LLC, which are directly or indirectly wholly owned subsidiaries of the Registrant that hold the Registrants interests in the Blue Owl Operating Partnerships. |
| | |
| Blue Owl Holdings | | Refers to Blue Owl Capital Holdings LP. |
| | |
| Blue Owl Operating Group | | Refers collectively to the Blue Owl Operating Partnerships and their consolidated subsidiaries. |
| | |
| Blue Owl Operating Group Units | | Refers collectively to a unit in each of the Blue Owl Operating Partnerships. |
| | |
| Blue Owl Operating Partnerships | | Refers to Blue Owl Carry and Blue Owl Holdings, collectively. |
| | |
| Blue Owl Securities | | Refers to Blue Owl Securities LLC, a Delaware limited liability company. Blue Owl Securities is a broker-dealer registered with the SEC, a member of FINRAFinancial Industry Regulatory Authority, Inc. (“FINRA”) and the Securities Investor Protection Corporation (“SIPC.SIPC”). Blue Owl Securities is wholly owned by Blue Owl and provides distribution services to all Blue Owl Divisions.platforms. |
| | |
| Business Combination | | Refers to the transactions contemplated by the business combination agreement dated as of
|
| | |
| Business Combination Date | | Refers to May 19, 2021, the date on which the Business Combination was completed. |
| | |
| | |
| | |
| Class A Shares | | Refers to the Class A common stock, par value $0.0001 per share, of the Registrant. |
| | |
| Class B Shares | | Refers to the Class B common stock, par value $0.0001 per share, of the Registrant. |
| | |
| Class C Shares | | Refers to the Class C common stock, par value $0.0001 per share, of the Registrant. |
| | |
| Class D Shares | | Refers to the Class D common stock, par value $0.0001 per share, of the Registrant. |
| | |
| | |
| | |
Class E SharesCredit | | Refers to the Class E common stock, par value $0.0001 per share, of the Registrant. |
| | |
CLOs | | Refers to collateralized loan obligations. |
| | |
Direct Lending | | Refers to our Direct Lending products, which offerCredit platform that offers private credit solutions to middle-market companies through fourour investment strategies: diversified lending, technology lending, first lien lending, opportunistic lending, andlending. Our Credit platform also includes our CLOs.adjacent investment strategy, liquid credit, which focuses on the management of CLOs, and other investment strategies (e.g. strategic equity and healthcare opportunities). |
| | |
| Dyal Capital | | Refers to the Dyal Capital Partners business that was acquired from Neuberger Berman Group LLC in connection with the Business Combination.
| | |
| | |
| | |
| | |
| | |
| | | | | | | | |
| Fee-Paying AUM or FPAUM | | Refers to the AUM on which management fees or FRE performance revenues are earned. For our BDCs, FPAUM is generally equal to total assets (including assets acquired with debt but excluding cash). For our other Direct LendingCredit products, excluding CLOs, FPAUM is generally equal to NAV or investment cost. FPAUM also includes uncalled committed capital for products where we earn management fees on such uncalled committed capital. For CLOs, FPAUM is generally equal to the par value of collateral. For our GP Strategic Capital Solutions products, FPAUM for the GP minority equity investmentsstakes strategy is generally equal to capital commitments during the investment period and the cost of unrealized investments after the investment period. For GP Capital Solutions’Strategic Capitals’ other strategies, FPAUM is generally equal to investment cost. For Real Estate, FPAUM is generally equal to a combination of capital commitments and cost of unrealized investments during the investment period and the cost of unrealized investments after the investment period; however, for certain Real Estate products FPAUM is based on NAV. |
| | |
| | |
| | |
| Financial Statements | | Refers to our consolidated and combined financial statements included in this report. |
| | |
| GAAP | | Refers to U.S. generally accepted accounting principles. |
| | |
| GP Strategic Capital | | Refers to our GP Strategic Capital platform that primarily focuses on acquiring equity stakes in, and providing debt financing to, large, multi-product private equity and private credit firms through two existing investment strategies: GP minority stakes and GP debt financing, and also includes our professional sports minority stakes strategy. |
| | |
| NYSE | | Refers to the New York Stock Exchange. |
| | |
| | |
| | |
| | |
| | |
our funds or our products | | Refers to the products that we manage, including our BDCs, private funds, CLOs, managed accounts and managed accounts.real estate investment trusts. |
| | |
| GAAP | | Refers to U.S. generally accepted accounting principles.
| | |
| GP Capital Solutions | | Refers to our GP Capital Solutions products, which primarily focus on acquiring equity stakes in, or providing debt financing to, large, multi-product private equity and private credit platforms through two existing investment strategies: GP minority equity investments and GP debt financing, and also include our professional sports minority investments strategy.
| | |
| NYSE | | Refers to the New York Stock Exchange.
| | |
Oak Street | | Refers to the investment advisory business of Oak Street Real Estate Capital, LLC that was acquired on December 29, 2021. |
| | |
Oak Street Acquisition | | Refers to the acquisition of Oak Street completed on December 29, 2021. |
| | |
Owl Rock | | Refers collectively to the combined businesses of Owl Rock Capital Group LLC (“Owl Rock Capital Group”) and Blue Owl Securities LLC (formerly, Owl Rock Capital Securities LLC), which was the predecessor of Blue Owl for accounting and financial reporting purposes. |
| | |
| Part I Fees | | Refers to quarterly performance income on the net investment income of our BDCs and similarly structured products, subject to a fixed hurdle rate. These fees are classified as management fees throughout this report, as they are predictable and recurring in nature, not subject to repayment, and cash-settled each quarter. |
| | |
| Part II Fees | | Generally refers to fees from our BDCs and similarly structured products that are paid in arrears as of the end of each measurement period when the cumulative aggregate realized capital gains exceed the cumulative aggregate realized capital losses and aggregate unrealized capital depreciation, less the aggregate amount of Part II Fees paid in all prior years since inception. Part II Fees are classified as realized performance incomerevenues throughout this report. |
| | |
| Partner Manager | | Refers to alternative asset management firms in which the GP Strategic Capital Solution products invest. |
| | |
| Permanent Capital | | Refers to AUM in products that do not have ordinary redemption provisions or a requirement to exit investments and return the proceeds to investors after a prescribed period of time. Some of these products, however, may be required or can elect to return all or a portion of capital gains and investment income, and some may have periodic tender offers or redemptions that are subject to approval.redemptions. Permanent capitalCapital includes certain products that are subject to management fee step downs or roll-offs or both over time. |
| | |
| Principals | | Refers to our founders and senior members of management who hold, or in the future may hold, Class B Shares and Class D Shares. Class B Shares and Class D Shares collectively represent 80% of the total voting power of all shares. |
| | |
| Real Estate | | Refers, unless context indicates otherwise, to our Real Estate products, whichplatform that primarily focusfocuses on providing investors with predictable current income, and potential for appreciation, while focusing on limiting downside risk through a uniqueacquiring triple net lease strategy.real estate occupied by investment grade or creditworthy tenants. |
| | |
| Registrant | | Refers to Blue Owl Capital Inc. |
| | |
| SEC | | Refers to the U.S. Securities and Exchange Commission. |
| | |
| Tax Receivable Agreement or TRA | | Refers to the Amended and Restated Tax Receivable Agreement, dated as of October 22, 2021, as may be amended from time to time by and among the Registrant, Blue Owl Capital GP LLC, the Blue Owl Operating Partnerships and each of the Partners (as defined therein) party thereto. |
| | |
| | |
| | |
| | |
| | | | | | | | |
Wellfleet | | Refers to the Wellfleet Credit Partners LLC business that was acquired in the Wellfleet Acquisition. |
Wellfleet Acquisition | | Refers to the acquisition of Wellfleet completed on April 1, 2022. |
AVAILABLE INFORMATION
We file annual, quarterly and current reports, proxy statements and other information required by the Securities Exchange Act of 1934, as amended (the “Exchange Act”) with the SEC. We make available free of charge on our website (www.blueowl.com) our annual reports on Form 10-K, quarterly reports on Form 10-Q, current reports on Form 8-K, proxy statements and other filing as soon as reasonably practicable after such material is electronically filed with or furnished to the SEC. We also use our website to distribute company information, including assets under management and performance information, and such information may be deemed material. Accordingly, investors should monitor our website, in addition to our press releases, SEC filings and public conference calls and webcasts.
Also posted on our website in the “Investor Resources—“Shareholders—Governance” section is the charter for our Audit Committee, as well as our Corporate Governance Guidelines and Code of Business Conduct governing our directors, officers and employees. Information on or accessible through our website is not a part of or incorporated into this report or any other SEC filing. Copies of our SEC filings or corporate governance materials are available without charge upon written request to Blue Owl Capital Inc., 399 Park Avenue, 37th Floor, New York, New York 10022, Attention: Office of the Secretary. Any materials we file with the SEC are also publicly available through the SEC’s website (www.sec.gov).
No statements herein, available on our website or in any of the materials we file with the SEC constitute, or should be viewed as constituting, an offer of any fund.
CAUTIONARY STATEMENT REGARDING FORWARD-LOOKING STATEMENTS
This report contains forward-looking statements within the meaning of Section 27A of the Securities Act of 1933, as amended (the “Securities Act”), and Section 21E of the Exchange Act, which reflect our current views with respect to, among other things, future events, operations and financial performance. You can identify these forward-looking statements by the use of forward-looking words such as “outlook,” “believes,” “expects,” “potential,” “continues,” “may,” “will,” “should,” “seeks,” “approximately,” “predicts,” “projects,” “intends,” “plans,” “estimates,” “anticipates” or the negative version of those words, other comparable words or other statements that do not relate to historical or factual matters. The forward-looking statements are based on our beliefs, assumptions and expectations of our future performance, taking into account all information currently available to us. Such forward-looking statements are subject to various risks, uncertainties (some of which are beyond our control) or other assumptions relating to our operations, financial results, financial condition, business prospects, growth strategy and liquidity that may cause actual results or performance to be materially different from those expressed or implied by these forward-looking statements. Some of these factors are described under the headings “Item 1A. Risk Factors” and “Item 2. Management’s Discussion and Analysis of Financial Condition and Results of Operations.” These factors should not be construed as exhaustive and should be read in conjunction with the risk factors and other cautionary statements that are included in this report and in our other periodic filings. If one or more of these or other risks or uncertainties materialize, or if our underlying assumptions prove to be incorrect, our actual results may vary materially from those indicated in these forward-looking statements. New risks and uncertainties arise over time, and it is not possible for us to predict those events or how they may affect us. Therefore, you should not place undue reliance on these forward-looking statements. Any forward-looking statement speaks only as of the date on which it is made. We do not undertake any obligation to publicly update or review any forward-looking statement, whether as a result of new information, future developments or otherwise, except as required by law.
PART I - FINANCIAL INFORMATION
Item 1. Financial Statements.
The information required by this item is included in the Financial Statements set forth in the F-pages of this report. Item 2. Management’s Discussion and Analysis of Financial Condition and Results of Operations.
The following Management’s Discussion and Analysis of Financial Condition and Results of Operations (“MD&A”), should be read in conjunction with the unaudited consolidated and combined financial statements and the related notes included in this report.Financial Statements. For a description of our business, please see “Business of Blue Owl”“Item 1. Business” in the Annual Report.
20232024 First Quarter Overview | | | | | | | | | | | | | | | |
| | | Three Months Ended March 31, |
| (dollars in thousands) | | | | | 2023 | | 2022 |
| Net Income (Loss) Attributable to Blue Owl Capital Inc. | | | | | $ | 8,317 | | | $ | (11,815) | |
| | | | | | | |
| | | | | | | |
| | | | | | | |
Fee-Related Earnings(1) | | | | | $ | 225,899 | | | $ | 171,383 | |
| | | | | | | |
Distributable Earnings(1) | | | | | $ | 209,014 | | | $ | 155,726 | |
| | | | | | | | | | | | | | | |
| | | Three Months Ended March 31, |
| (dollars in thousands) | | | | | 2024 | | 2023 |
| Net Income Attributable to Blue Owl Capital Inc. | | | | | $ | 25,091 | | | $ | 8,317 | |
| | | | | | | |
| | | | | | | |
| | | | | | | |
Fee-Related Earnings(1) | | | | | $ | 289,698 | | | $ | 225,899 | |
| | | | | | | |
Distributable Earnings(1) | | | | | $ | 240,099 | | | $ | 209,014 | |
(1) For the specific components and calculations of these Non-GAAP measures, as well as a reconciliation of these measures to the most comparable measure in accordance with GAAP, see “—Non-GAAP Analysis” and “—Non-GAAP Reconciliations.”
Please see “—GAAP Results of Operations Analysis” and “—Non-GAAP Analysis” for a detailed discussion of the underlying drivers of our results.
Acquisitions
In April 2024, we announced our entry into an agreement to acquire Kuvare Insurance Services LP (dba Kuvare Asset Management) (“KAM”), a boutique investment management firm focused on providing asset management services to the insurance industry, including Kuvare UK Holdings (“Kuvare”), for $750 million (the “KAM Acquisition”). We will fund the KAM Acquisition through a combination of $325 million in cash and $425 million in Blue Owl Class A common stock. The KAM Acquisition is expected to close in the second or third quarter of 2024 and remains subject to customary regulatory approvals and other closing conditions and specified termination rights. Separately, we made a long-term investment in Kuvare, purchasing $250 million of preferred equity.
In April 2024, we announced our entry into an agreement to acquire Prima Capital Advisors (“Prima”) for $170 million (the “Prima Acquisition”). The Prima Acquisition will be funded through a combination of approximately $157 million of Class A Shares, Class C Shares and Blue Owl Operating Group Units and approximately $13 million in cash, subject to certain closing consideration adjustments. The Prima Acquisition is expected to close in the second or third quarter of 2024, subject to customary closing conditions.
Assets Under Management
| | | | | | | | | | | | | | |
Blue Owl AUM: $144.4$174.3 billion FPAUM: $91.6$105.4 billion |
| | | | |
Direct Lending ProductsCredit
AUM: $71.6$91.3 billion FPAUM: $51.2$58.8 billion | | GP Strategic Capital Solutions Products AUM: $49.2$55.8 billion FPAUM: $28.6$31.8 billion | | Real Estate Products AUM: $23.6$27.2 billion FPAUM: $11.9$14.9 billion |
| | | | |
Diversified Lending Commenced 2016 AUM: $41.5$53.6 billion FPAUM: $26.2$31.2 billion | | GP Minority EquityStakes Commenced 2010 AUM: $47.0$53.5 billion FPAUM: $27.7$30.4 billion | | Net Lease Commenced 2009 AUM: $23.6$27.2 billion FPAUM: $11.9$14.9 billion |
Technology Lending Commenced 2018 AUM: $17.2$21.5 billion FPAUM: $13.3$14.9 billion | | GP Debt Financing Commenced 2019 AUM: $1.6 billion FPAUM: $0.8$1.1 billion | | |
First Lien Lending Commenced 2018 AUM: $3.3$4.5 billion FPAUM: $2.9$2.1 billion | | Professional Sports Minority InvestmentsStakes Commenced 2021 AUM: $0.6$0.8 billion FPAUM: $0.1$0.3 billion | | |
Opportunistic Lending Commenced 2020 AUM: $2.4$2.5 billion FPAUM: $1.6$1.5 billion | | | | |
CLOsLiquid Credit
Commenced 2022 AUM: $7.2$7.9 billion FPAUM: $7.2$7.8 billion | | | | |
Other AUM: $1.5 billion FPAUM: $1.3 billion | | | | |
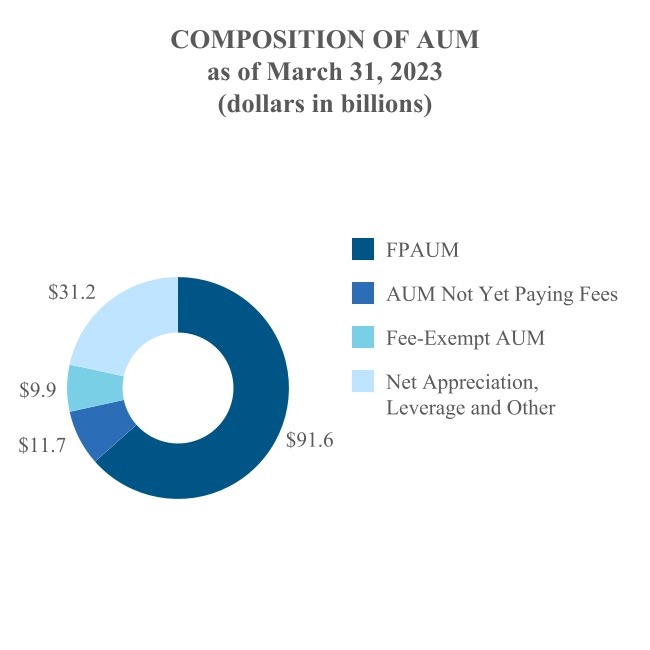
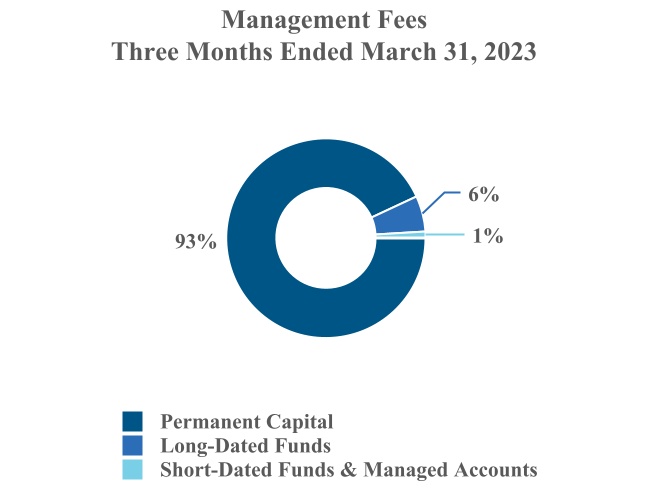
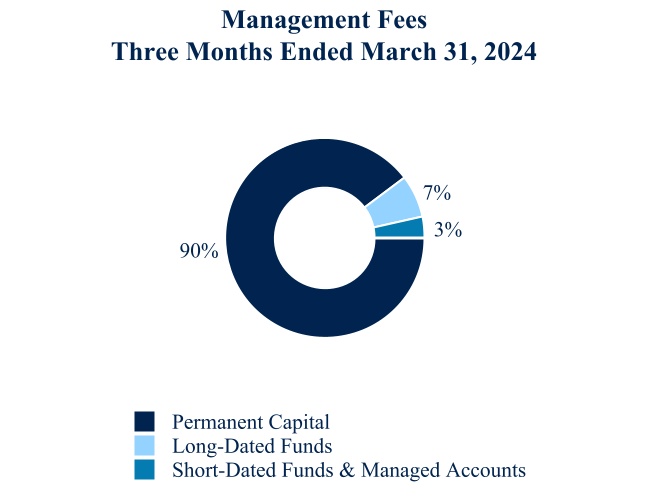
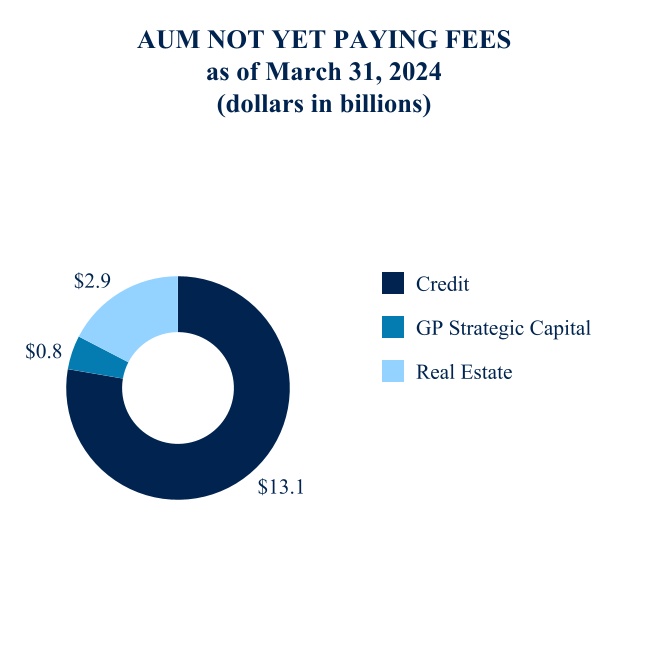
March 31, 2024, totals may not sum due to rounding. As of March 31, 2023,2024, our AUM was $144.4$174.3 billion, which included $91.6$105.4 billion of FPAUM. For the three months ended March 31, 2023,2024, approximately 93%90% of our management fees were earned on AUM from Permanent Capital. As of March 31, 2023,2024, we have $11.7$16.8 billion in AUM not yet paying fees, providing approximately $155over $240 million of annualized management fees once deployed or upon the expiration of certain fee holidays.deployed. See “—Assets Under Management” for additional information, including important information on how we define these metrics.
Business Environment
Our business is impacted by conditions in the financial markets and economic conditions in the U.S., and to a lesser extent, globally.
We believe that our management-fee centric business model and base of Permanent Capital contribute to the resiliency of our earnings and the strength of our business growth.growth, including during periods of market uncertainty and volatility. During the first quarter of 2023, investor concerns over macroeconomic factors, including inflation, interest rates, global gross domestic product growth and geopolitical instability, persisted.
In addition, shocks to deposit bases at regional banks and subsequent Federal Reserve action introduced another element of uncertainty and volatility to the public equity and credit markets centered around the duration of capital2024, industry M&A and capital availability. Duringmarkets activity remained moderately constructive, a continuation of the first quarter of 2023, 93%improvement relative to late 2022 and early 2023.
Over the past twelve months, 92% of our management fees were generated by permanent capitalPermanent Capital and the remainder predominantly from long-dated capital, with no meaningful pressure to our asset base from redemptions. Fundraising and capital deployment contributed to management fee growth of 22% over the last twelve months. We also ended the first quarter of 20232024 with substantial available capital to deploy, reporting $11.7$16.8 billion of AUM not yet paying fees.
AsActivity in the loan market improved during the quarter, with direct lenders continuing to play a numbersignificant role in new financings alongside syndicated market activity, which recovered meaningfully from low levels in 2023. Industry-wide, refinancings accelerated with greater capital availability, offsetting some of legacy participants have remainedthe new origination volume. For Blue Owl, positive net deployment, ongoing capital raising, and the listing of OBDE on the sidelines in the broadly syndicated loan market, direct lenders continueNYSE continued to take market share, providing financing solutions to sponsors and companies at wider spreads and lower loan to value ratios on average. Rising interest rates continue to have a beneficial impact on ourdrive management fees as higher base rates continue to drive increased Part I Fees.higher.
We continue to see attractive deployment opportunities for our GP Strategic Capital Solutions products, as capital needs across the private alternative asset management universesector remain elevated. The deployment landscape remains attractive with significant capital needs acrosselevated, particularly in the privatecurrent challenging fundraising and realization environment. In addition to our leading franchise in larger-cap GP stakes, we recently launched a strategy intended to finance mid-cap alternative asset management universe.
In Real Estate, a combination of rising interest rates, elevated inflation, and uncertainty around future capital availabilityindustry transaction volumes increased slightly, in the wake of regional bank shocks continue to affect valuations and transaction volumes.conjunction with higher commercial mortgage-backed securities issuances. Our Real Estate products,business, focused on single tenant triple net lease to primarily investment grade tenants, continued to deploy capital across four major themes: digital infrastructure, onshoring, healthcare real estate, and essential retail. Investors in our Real Estate products continue to benefit from the inflation-mitigating characteristics of the net lease structure, highly predictable net rent growth, and long-duration contractual income across the portfolio, and we continue to deploy capital into attractive opportunities as we raise neware raising capital through various new products launched in 2022.across institutional and wealth channels.
We are continuing to closely monitor developments related to the macroeconomic factors that have contributed to market volatility, and to assess the impact of these factors on financial markets and on our business. Our future results may be adversely affected by slowdowns in fundraising activity and the pace of capital deployment, which could result in delayed management fees. It is currently not possible to predict the ultimate effects of these events on the financial markets, overall economy and our consolidated financial statements.Financial Statements. See “Item“Item 1A. Risk Factors —Risks Related to Macroeconomic Factors”Factors.” in our Annual ReportReport.
Additionally, we intend to pursue strategic acquisitions and “Item 1A. Risk Factors — Difficult marketinvestments to accelerate our growth and political conditions may reduce the valuebroaden our product offerings. Our acquisition strategy is centered around driving additional scale or hamper the performance of the investments made byexpanding capabilities that complement or augment our products or impair the ability of our products to raise or deploy capital” in this report.existing products.
Assets Under Management
We present information regarding our AUM, FPAUM and various other related metrics throughout this MD&A to provide context around our fee generating revenues results, as well as indicators of the potential for future earnings from existing and new products. Our calculations of AUM and FPAUM may differ from the calculation methodologies of other asset managers, and as a result these measures may not be comparable to similar measures presented by other asset managers. In addition, our calculation of AUM includes amounts that are fee exempt (i.e., not subject to fees).
As of March 31, 2023,2024, assets under management related to us, our executives and other employees totaled approximately $3.4$3.6 billion (including $1.1$1.8 billion related to accrued carried interest). A portion of these assets under management are not charged fees.
Composition of Assets Under Management
Our AUM consists of FPAUM, AUM not yet paying fees, fee-exempt AUM and net appreciation and leverage in products on which fees are based on commitments or investment cost. AUM not yet paying fees generally relates to unfunded capital commitments (to the extent such commitments are not already subject to fees), undeployed debt (to the extent we earn fees based on total asset values or investment cost, inclusive of assets purchased using debt) and AUM that is subject to a temporary fee holiday. Fee-exempt AUM represents certain investments by us, our employees, other related parties and third parties, as well as certain co-investment vehicles on which we never earn fees.
Management uses AUM not yet paying fees as an indicator of management fees that will be coming online as we deploy existing assets in products that charge fees based on deployed and not uncalled capital, as well as AUM that is currently subject to a fee holiday that will expire in the future. AUM not yet paying fees could provide approximately $155provide over $240 million of additional annualized management fees once deployed or upon the expiration of the relevant fee holidays.
Permanency and Duration of Assets Under Management
Our capital base is heavily weighted toward Permanent Capital. We view the permanency and duration of the products that we manage as a differentiator in our industry and as a means of measuring the stability of our future revenues stream. The chart below presents the composition of our management fees by remaining product duration. Changes in these relative percentages will occur over time as the mix of products we offer changes. For example, our Real Estate products have a higher concentration in what we refer to as “long-dated” funds, or funds in which the contractual remaining life is five years or more, which in isolation may cause our percentage of management fees from Permanent Capital to decline.
Changes in AUM
| | | Three Months Ended March 31, 2023 | | Three Months Ended March 31, 2022 |
| | Three Months Ended March 31, 2024 | |
| | Three Months Ended March 31, 2024 | |
| | Three Months Ended March 31, 2024 | | | Three Months Ended March 31, 2023 |
| (dollars in millions) | (dollars in millions) | Direct Lending | | GP Capital Solutions | | Real
Estate | | Total | | Direct Lending | | GP Capital Solutions | | Real
Estate | | Total | (dollars in millions) | Credit | | GP Strategic Capital | | Real Estate | | Total | | Credit | | GP Strategic Capital | | Real Estate | | Total |
| Beginning Balance | Beginning Balance | $ | 68,607 | | | $ | 48,510 | | | $ | 21,085 | | | $ | 138,202 | | | $ | 39,227 | | | $ | 39,906 | | | $ | 15,362 | | | $ | 94,495 | |
| | New capital raised | |
| New capital raised | |
| New capital raised | New capital raised | 1,940 | | | 320 | | | 1,539 | | | 3,799 | | | 1,938 | | | 1,566 | | | 360 | | | 3,864 | |
| Change in debt | Change in debt | 939 | | | — | | | 495 | | | 1,434 | | | 3,618 | | | — | | | — | | | 3,618 | |
| Distributions | Distributions | (763) | | | (702) | | | (207) | | | (1,672) | | | (284) | | | (758) | | | (165) | | | (1,207) | |
| Change in value / other | Change in value / other | 894 | | | 1,039 | | | 678 | | | 2,611 | | | 276 | | | 439 | | | 533 | | | 1,248 | |
| Ending Balance | Ending Balance | $ | 71,617 | | | $ | 49,167 | | | $ | 23,590 | | | $ | 144,374 | | | $ | 44,775 | | | $ | 41,153 | | | $ | 16,090 | | | $ | 102,018 | |
Direct Lending.Credit. IncreaseThe increase in AUM for the three months ended March 31, 20232024 was driven by the following:
•$1.21.3 billion new capital raised in diversified lending, primarily driven by continued private wealth fundraising in ORCIC and a separately managed account.OCIC.
•$0.71.3 billion new capital raised in first lien lending, primarily driven by recently launched products.
•$0.3 billion new capital raised in technology lending, primarily driven by continued private wealth fundraising in ORTF II and ORTIC.OTIC.
•$0.93.9 billion of additional net debt commitments across all of Direct Lending,primarily in diversified lending and technology lending strategies, as we continue to opportunistically manage leverage in our BDCs.
•$0.91.2 billion of overall appreciation across the platform.
•$0.8 billionoffsetting decrease in distributions, which primarily relate to dividends paid from our BDCs. Redemptions and repurchases from these products were not material duringmaterial.
•$1.0 billion of overall appreciation across the first quarter of 2023.platform.
GP Capital Solutions.Strategic Capital. IncreaseThe increase in AUM for the three months ended March 31, 20232024 was driven by overall appreciation primarily in our GP minority stakes strategy of $1.0 billion and new capital raised of $0.7 billion, primarily from our new mid-cap minority equity stakes product.
Real Estate. The increase in AUM for the three months ended March 31, 2024 was driven by new capital raised of $1.0 billion across various products, primarily Blue Owl Real Estate Net Lease Trust (“ORENT”), our real estate investment trust, and Blue Owl Real Estate Fund VI (“OREF VI”), our triple net-lease drawdown fund, partially offset by dispositions of certain assets of $0.6 billion.
Changes in FPAUM
| | | | | | | | | | | | | | | | | | | | | | | | | | | | | | | | | | | | | | | | | | | | | | | |
| | | |
| | | | | | | | | | | | | | | |
| | | | | | | | | | | | | | | |
| | | | | | | | | | | | | | | |
| | | | | | | | | | | | | | | |
| | | | | | | | | | | | | | | |
| | | | | | | | | | | | | | | |
| | | | | | | | | | | | | | | |
| | | | | | | | | | | | | | | |
| | | | | | | | | | | | | | | |
| Three Months Ended March 31, 2024 | | Three Months Ended March 31, 2023 |
| (dollars in millions) | Credit | | GP Strategic Capital | | Real Estate | | Total | | Credit | | GP Strategic Capital | | Real Estate | | Total |
| Beginning Balance | $ | 57,074 | | | $ | 31,075 | | | $ | 14,547 | | | $ | 102,696 | | | $ | 49,041 | | | $ | 28,772 | | | $ | 10,997 | | | $ | 88,810 | |
| | | | | | | | | | | | | | | |
| New capital raised / deployed | 2,090 | | | 688 | | | 939 | | | 3,717 | | | 2,021 | | | (8) | | | 1,078 | | | 3,091 | |
| | | | | | | | | | | | | | | |
| Distributions | (1,157) | | | — | | | (198) | | | (1,355) | | | (732) | | | (203) | | | (151) | | | (1,086) | |
| Change in value / other | 772 | | | — | | | (393) | | | 379 | | | 820 | | | — | | | (2) | | | 818 | |
| Ending Balance | $ | 58,779 | | | $ | 31,763 | | | $ | 14,895 | | | $ | 105,437 | | | $ | 51,150 | | | $ | 28,561 | | | $ | 11,922 | | | $ | 91,633 | |
Credit. The increase in FPAUM for the three months ended March 31, 2024 was driven by the overall appreciation across all of our major products andfollowing:
•$1.3 billion new capital raised in diversified lending, primarily driven by continued private wealth fundraising in OCIC.
•$0.4 billion new capital raised in our professional sports minority investments strategy, partially offsetstrategic equity investment strategy.
•$0.3 billion new capital raised in technology lending, driven by continued private wealth fundraising in OTIC.
•$1.2 billion offsetting decrease in distributions, in Dyal Fund IVwhich primarily relate to dividends paid from our BDCs. Redemptions and our professional sports minority investments strategy.repurchases from these products were not material.
Real Estate.• Increase in AUM for the three months ended March 31, 2023 was driven by new capital raised$0.8 billion of $1.5 billion across various products, primarily Real Estate Fund VI, our recently launched triple net-lease drawdown fund, Net Lease Trust, our recently launched REIT, and Net Lease Property Fund; overall appreciation across the platform of $0.7 billion and additional debt commitments of $0.5 billion, primarily related to Net Lease Property Fund, partially offset by distributions across various products.
Changes in FPAUM
| | | | | | | | | | | | | | | | | | | | | | | | | | | | | | | | | | | | | | | | | | | | | | | |
| Three Months Ended March 31, 2023 | | Three Months Ended March 31, 2022 |
| (dollars in millions) | Direct Lending | | GP Capital Solutions | | Real
Estate | | Total | | Direct Lending | | GP Capital Solutions | | Real
Estate | | Total |
| Beginning Balance | $ | 49,041 | | | $ | 28,772 | | | $ | 10,997 | | | $ | 88,810 | | | $ | 32,029 | | | $ | 21,212 | | | $ | 8,203 | | | $ | 61,444 | |
| | | | | | | | | | | | | | | |
New capital raised / deployed (1) | 2,021 | | | (8) | | | 1,078 | | | 3,091 | | | 2,200 | | | 3,337 | | | 1,077 | | | 6,614 | |
Fee basis step down (1) | — | | | — | | | — | | | — | | | — | | | (898) | | | — | | | (898) | |
| Distributions | (732) | | | (203) | | | (151) | | | (1,086) | | | (278) | | | — | | | (161) | | | (439) | |
| Change in value / other | 820 | | | — | | | (2) | | | 818 | | | (1,293) | | | — | | | 156 | | | (1,137) | |
| Ending Balance | $ | 51,150 | | | $ | 28,561 | | | $ | 11,922 | | | $ | 91,633 | | | $ | 32,658 | | | $ | 23,651 | | | $ | 9,275 | | | $ | 65,584 | |
(1)The three months ended March 31, 2022, reflects a change in classification from fee basis step down to new capital raised / deployed for the fee holiday expiration in GP Capital Solutions Dyal Fund V of $2.1 billion on January 1, 2022.platform.
Direct Lending.GP Strategic Capital. IncreaseThe increase in FPAUM for the three months ended March 31, 20232024 was driven by a combinationnew capital raised of continued fundraising and debt deployment and the overall appreciation across the platform, partially offset by distributions, which$0.7 billion, primarily related to dividends paid from our BDCs.
GP Capital Solutions. FPAUM for the three months ended March 31, 2023 remained relatively unchanged.new mid-cap minority equity stakes product.
Real Estate. IncreaseThe increase in FPAUM for the three months ended March 31, 20232024 was driven primarily by capital raised and deployment in Real Estate FundORENT and OREF VI, and Net Lease Trust.partially offset by dispositions of certain assets.
Product Performance
Product performance for certain of our products is included throughout this discussion with analysis to facilitate an understanding of our results of operations for the periods presented. The performance information of our products reflected is not indicative of Blue Owl’s performance. An investment in Blue Owl is not an investment in any of our products. Past performance is not indicative of future results. As with any investment, there is always the potential for gains as well as the possibility of losses. There can be no assurance that any of these products or our other existing and future products will achieve similar returns. MoICMultiple of invested capital (“MoIC”) and IRRinternal rate of return (“IRR”) data has not been presented for products that have launched within the last two years as such information is generally not meaningful (“NM”).
Direct LendingCredit
| | | | | | | | | | | | | | | | | | | | | | | | | | | | | | | | | | | | | | | | | | | | | | | | | | | | | | | | | | | | | | | | | |
| | | | | | | | | | | | | | | MoIC | | IRR |
| (dollars in millions) | Year of
Inception | | AUM | | Capital
Raised
(4) | | Invested
Capital
(5) | | Realized
Proceeds
(6) | | Unrealized
Value
(7) | | Total
Value | | Gross (8) | | Net (9) | | Gross (10) | | Net (11) |
| Diversified Lending (1) | | | | | | | | | | | | | | | | | | | | | |
| ORCC | 2016 | | $ | 14,878 | | | $ | 6,019 | | | $ | 6,019 | | | $ | 2,409 | | | $ | 5,884 | | | $ | 8,293 | | | 1.57 | x | | 1.42 | x | | 12.7 | % | | 9.3 | % |
| ORCC II (2) | 2017 | | $ | 2,595 | | | $ | 1,345 | | | $ | 1,345 | | | $ | 340 | | | $ | 1,297 | | | $ | 1,637 | | | NM | | 1.27 | x | | NM | | 7.0 | % |
| ORCC III | 2020 | | $ | 4,018 | | | $ | 1,800 | | | $ | 1,800 | | | $ | 229 | | | $ | 1,814 | | | $ | 2,043 | | | 1.19 | x | | 1.17 | x | | 12.1 | % | | 11.1 | % |
| ORCIC (2) | 2020 | | $ | 13,066 | | | $ | 5,532 | | | $ | 5,532 | | | $ | 332 | | | $ | 5,250 | | | $ | 5,582 | | | NM | | 1.08 | x | | NM | | 8.4 | % |
| | | | | | | | | | | | | | | | | | | | | |
| Technology Lending (1) | | | | | | | | | | | | | | | | | | | | | |
| ORTF | 2018 | | $ | 6,986 | | | $ | 3,234 | | | $ | 3,234 | | | $ | 441 | | | $ | 3,386 | | | $ | 3,827 | | | 1.29 | x | | 1.21 | x | | 12.1 | % | | 8.6 | % |
| ORTF II | 2021 | | $ | 5,739 | | | $ | 3,495 | | | $ | 1,220 | | | $ | 17 | | | $ | 1,225 | | | $ | 1,242 | | | 1.09 | x | | 1.06 | x | | 13.3 | % | | 8.5 | % |
| | | | | | | | | | | | | | | | | | | | | |
| First Lien Lending (3) | | | | | | | | | | | | | | | | | | | | | |
| Owl Rock First Lien Fund Levered | 2018 | | $ | 2,820 | | | $ | 1,161 | | | $ | 863 | | | $ | 193 | | | $ | 880 | | | $ | 1,073 | | | 1.31x | | 1.25x | | 10.3 | % | | 8.3 | % |
| Owl Rock First Lien Fund Unlevered | 2019 | | $ | 169 | | | $ | 163 | | | $ | 156 | | | $ | 31 | | | $ | 142 | | | $ | 173 | | | 1.15x | | 1.11x | | 5.4 | % | | 3.9 | % |
| | | | | | | | | | | | | | | | | | | | | | | | | | | | | | | | | | | | | | | | | | | | | | | | | | | | | | | | | | | | | | | | | |
| | | | | | | | | | | | | | | MoIC | | IRR |
| (dollars in millions) | Year of
Inception | | AUM | | Capital
Raised
(4) | | Invested
Capital
(5) | | Realized
Proceeds
(6) | | Unrealized
Value
(7) | | Total
Value | | Gross (8) | | Net (9) | | Gross (10) | | Net (11) |
| Diversified Lending (1) | | | | | | | | | | | | | | | | | | | | | |
| Blue Owl Capital Corporation | 2016 | | $ | 14,845 | | | $ | 5,970 | | | $ | 5,970 | | | $ | 3,029 | | | $ | 6,021 | | | $ | 9,050 | | | 1.76x | | 1.54x | | 13.6 | % | | 9.8 | % |
| Blue Owl Capital Corporation II (2) | 2017 | | $ | 2,570 | | | $ | 1,293 | | | $ | 1,262 | | | $ | 447 | | | $ | 1,263 | | | $ | 1,710 | | | NM | | 1.39x | | NM | | 7.6 | % |
| Blue Owl Capital Corporation III | 2020 | | $ | 4,493 | | | $ | 1,832 | | | $ | 1,832 | | | $ | 461 | | | $ | 1,911 | | | $ | 2,372 | | | 1.35x | | 1.32x | | 13.4 | % | | 12.6 | % |
| Blue Owl Credit Income Corp. (2) | 2020 | | $ | 19,694 | | | $ | 9,252 | | | $ | 8,661 | | | $ | 1,028 | | | $ | 8,893 | | | $ | 9,921 | | | NM | | 1.16x | | NM | | 11.5 | % |
| | | | | | | | | | | | | | | | | | | | | |
| Technology Lending (1) | | | | | | | | | | | | | | | | | | | | | |
| Blue Owl Technology Finance Corp. | 2018 | | $ | 7,310 | | | $ | 3,309 | | | $ | 3,309 | | | $ | 741 | | | $ | 3,529 | | | $ | 4,270 | | | 1.42x | | 1.31x | | 12.4 | % | | 9.1 | % |
| Blue Owl Technology Finance Corp. II | 2021 | | $ | 7,176 | | | $ | 4,159 | | | $ | 1,732 | | | $ | 135 | | | $ | 1,818 | | | $ | 1,953 | | | 1.20x | | 1.14x | | 16.4 | % | | 11.4 | % |
| | | | | | | | | | | | | | | | | | | | | |
| First Lien Lending (3) | | | | | | | | | | | | | | | | | | | | | |
| Blue Owl First Lien Fund Levered | 2018 | | $ | 2,185 | | | $ | 1,161 | | | $ | 912 | | | $ | 306 | | | $ | 916 | | | $ | 1,222 | | | 1.42x | | 1.35x | | 10.9 | % | | 9.0 | % |
| Blue Owl First Lien Fund Unlevered | 2019 | | $ | 613 | | | $ | 363 | | | $ | 156 | | | $ | 69 | | | $ | 117 | | | $ | 186 | | | 1.24x | | 1.20x | | 6.5 | % | | 5.2 | % |
(1)Information presented in the AUM through Total Value columns for these vehicles is presented on a quarter lag due to these vehicles being public filers with the SEC and have not yet filedfiling their quarterly information as of our filing date. Additional information related to these vehicles can be found in their filings with the SEC, which are not part of this report.
(2)For the purposes of calculating Gross IRR, the expense support provided to the fund would be impacted when assuming a performance excluding management fees (including Part I Fees) and Part II Fees, and therefore is not meaningful for ORCCOBDC II and ORCIC.OCIC.
(3)Blue Owl Rock First Lien Fund is comprised of three feeder funds: Onshore Levered, Offshore Levered and Insurance Unlevered. The gross and net MoIC and IRR presented in the chart are for Onshore Levered and Insurance Unlevered as those are the largest of the levered and unlevered feeder funds. The gross and net MoIC for the Offshore Levered feeder fund is 1.29x1.39x and 1.21x,1.29x, respectively. The gross and net IRR for the Offshore Levered feeder is 9.7%10.2% and 6.7%7.4%, respectively. All other values for Blue Owl Rock First Lien Fund Levered are for Onshore Levered and Offshore Levered combined. AUM is presented as the aggregate of the three Blue Owl Rock First Lien Fund feeders. Blue Owl Rock First Lien Fund Unlevered Investor equity and note commitments are both treated as capital for all values.
(4)Includes reinvested dividends and share repurchases, if applicable.
(5)Invested capital includes capital calls, reinvested dividends and periodic investor closes, as applicable.
(6)Realized proceeds represent the sum of all cash distributions to investors.
(7)Unrealized value represents the product’s NAV. There can be no assurance that unrealized values will be realized at the valuations indicated.
(8)Gross multiple of invested capital (“MoIC”)MoIC is calculated by adding total realized proceeds and unrealized values of a product’s investments and dividing by the total amount of invested capital. Gross MoIC is calculated before giving effect to management fees (including Part I Fees) and Part II Fees, as applicable.
(9)Net MoIC measures the aggregate value generated by a product’s investments in absolute terms. Net MoIC is calculated by adding total realized proceeds and unrealized values of a product’s investments and dividing by the total amount of invested capital. Net MoIC is calculated after giving effect to management fees (including Part I Fees) and Part II Fees, as applicable, and all other expenses.
(10)Gross IRR is an annualized since inception gross internal rate of return of cash flows to and from the product and the product’s residual value at the end of the measurement period. Gross IRRs are calculated before giving effect to management fees (including Part I Fees) and Part II Fees, as applicable.
(11)Net IRRs are calculated consistent with gross IRRs, but after giving effect to management fees (including Part I Fees) and Part II Fees, as applicable, and all other expenses. An individual investor’s IRR may differ from the reported IRR based on the timing of capital transactions.
GP Strategic Capital Solutions | | | | | | | | | | | | | | | | | | | | | | | | | | | | | | | | | | | | | | | | | | | | | | | | | | | | | | | | | | | | | | | | | |
| | | | | | | | | | | | | | | MoIC | | IRR |
| (dollars in millions) | Year of
Inception | | AUM | | Capital
Raised | | Invested
Capital
(2) | | Realized
Proceeds
(3) | | Unrealized
Value
(4) | | Total
Value | | Gross (5) | | Net (6) | | Gross (7) | | Net (8) |
| GP Minority Equity (1) | | | | | | | | | | | | | | | | | | | | | |
| Dyal Fund I | 2011 | | $ | 812 | | | $ | 1,284 | | | $ | 1,266 | | | $ | 672 | | | $ | 601 | | | $ | 1,273 | | | 1.15x | | 1.01x | | 2.9 | % | | 0.1 | % |
| Dyal Fund II | 2014 | | $ | 2,885 | | | $ | 2,153 | | | $ | 1,857 | | | $ | 672 | | | $ | 2,054 | | | $ | 2,726 | | | 1.73x | | 1.47x | | 13.7 | % | | 8.8 | % |
| Dyal Fund III | 2015 | | $ | 8,708 | | | $ | 5,318 | | | $ | 3,268 | | | $ | 3,159 | | | $ | 4,405 | | | $ | 7,564 | | | 2.84x | | 2.31x | | 30.7 | % | | 23.1 | % |
| Dyal Fund IV | 2018 | | $ | 14,056 | | | $ | 9,041 | | | $ | 5,864 | | | $ | 3,012 | | | $ | 7,329 | | | $ | 10,341 | | | 2.09x | | 1.76x | | 79.8 | % | | 50.2 | % |
| Dyal Fund V | 2020 | | $ | 13,513 | | | $ | 12,852 | | | $ | 2,579 | | | $ | 410 | | | $ | 2,757 | | | $ | 3,167 | | | 1.49x | | 1.23x | | 59.7 | % | | 31.9 | % |
| | | | | | | | | | | | | | | | | | | | | | | | | | | | | | | | | | | | | | | | | | | | | | | | | | | | | | | | | | | | | | | | | |
| | | | | | | | | | | | | | | MoIC | | IRR |
| (dollars in millions) | Year of
Inception | | AUM | | Capital
Raised | | Invested
Capital
(2) | | Realized
Proceeds
(3) | | Unrealized
Value
(4) | | Total
Value | | Gross (5) | | Net (6) | | Gross (7) | | Net (8) |
| GP Minority Stakes (1) | | | | | | | | | | | | | | | | | | | | | |
| Blue Owl GP Stakes I | 2011 | | $ | 706 | | | $ | 1,284 | | | $ | 1,266 | | | $ | 723 | | | $ | 493 | | | $ | 1,216 | | | 1.11x | | 0.96x | | 2.0 | % | | -0.7 | % |
| Blue Owl GP Stakes II | 2014 | | $ | 2,908 | | | $ | 2,153 | | | $ | 1,961 | | | $ | 908 | | | $ | 2,149 | | | $ | 3,057 | | | 1.85x | | 1.56x | | 13.7 | % | | 9.1 | % |
| Blue Owl GP Stakes III | 2015 | | $ | 9,827 | | | $ | 5,318 | | | $ | 3,275 | | | $ | 3,447 | | | $ | 5,255 | | | $ | 8,702 | | | 3.24x | | 2.66x | | 30.2 | % | | 23.4 | % |
| Blue Owl GP Stakes IV | 2018 | | $ | 15,715 | | | $ | 9,041 | | | $ | 6,533 | | | $ | 4,370 | | | $ | 8,049 | | | $ | 12,419 | | | 2.27x | | 1.90x | | 64.9 | % | | 42.0 | % |
| Blue Owl GP Stakes V | 2020 | | $ | 13,627 | | | $ | 12,852 | | | $ | 4,581 | | | $ | 2,009 | | | $ | 3,239 | | | $ | 5,248 | | | 1.31x | | 1.15x | | 34.1 | % | | 15.1 | % |
(1)Information presented in the Invested Capital through IRR columns for these vehicles is presented on a quarter lag and areis exclusive of investments made by us and the related carried interest vehicles of the respective products.
(2)Invested capital includes capital calls.
(3)Realized proceeds represent the sum of all cash distributions to investors.
(4)Unrealized value represents the product'sproduct’s NAV. There can be no assurance that unrealized values will be realized at the valuations indicated.
(5)Gross MoIC is calculated by adding total realized proceeds and unrealized values of a product’s investments and dividing by the total amount of invested capital. Gross MoIC is calculated before giving effect to management fees and carried interest, as applicable.
(6)Net MoIC measures the aggregate value generated by a product'sproduct’s investments in absolute terms. Net MoIC is calculated by adding total realized proceeds and unrealized values of a product'sproduct’s investments and dividing by the total amount of invested capital. Net MoIC is calculated after giving effect to management fees and carried interest, as applicable, and all other expenses.
(7)Gross IRR is an annualized since inception gross internal rate of return of cash flows to and from the product and the product’s residual value at the end of the measurement period. Gross IRRs are calculated before giving effect to management fees and carried interest, as applicable.
(8)Net IRR is an annualized since inception net internal rate of return of cash flows to and from the product and the product'sproduct’s residual value at the end of the measurement period. Net IRRs reflect returns to all investors. Net IRRs are calculated after giving effect to management fees and carried interest, as applicable, and all other expenses. An individual investor'sinvestor’s IRR may differ from the reported IRR based on the timing of capital transactions.
Real Estate
| | | | | | | | | | | | | | | | | | | | | | | | | | | | | | | | | | | | | | | | | | | | | | | | | | | | | | | | | | | | | | | | | |
| | | | | | | | | | | | | | | MoIC | | IRR |
| (dollars in millions) | Year of Inception | | AUM | | Capital Raised | | Invested Capital
(3) | | Realized
Proceeds
(4) | | Unrealized
Value
(5) | | Total
Value | | Gross (6) | | Net (7) | | Gross (8) | | Net (9) |
| Net Lease | | | | | | | | | | | | | | | | | | | | | |
| | | | | | | | | | | | | | | | | | | | | |
| | | | | | | | | | | | | | | | | | | | | |
| | | | | | | | | | | | | | | | | | | | | |
| Oak Street Real Estate Capital Fund IV (1) | 2017 | | $ | 1,180 | | | $ | 1,250 | | | $ | 1,250 | | | $ | 1,410 | | | $ | 562 | | | $ | 1,972 | | | 1.74x | | 1.56x | | 26.6 | % | | 21.5 | % |
| Oak Street Real Estate Capital Net Lease Property Fund | 2019 | | $ | 6,839 | | | $ | 3,298 | | | $ | 3,298 | | | $ | 634 | | | $ | 3,695 | | | $ | 4,329 | | | 1.24x | | 1.22x | | 15.7 | % | | 14.4 | % |
| Oak Street Real Estate Capital Fund V (1) | 2020 | | $ | 3,810 | | | $ | 2,500 | | | $ | 1,912 | | | $ | 521 | | | $ | 1,910 | | | $ | 2,431 | | | 1.35x | | 1.27x | | 35.9 | % | | 27.9 | % |
| | | | | | | | | | | | | | | | | | | | | |
| Oak Street Net Lease Trust (2) | 2022 | | $ | 3,259 | | | $ | 1,123 | | | $ | 1,123 | | | $ | 15 | | | $ | 1,090 | | | $ | 1,105 | | | NM | | NM | | NM | | NM |
| Oak Street Real Estate Capital Fund VI (1) | 2022 | | $ | 3,307 | | | $ | 3,015 | | | $ | — | | | $ | — | | | $ | — | | | $ | — | | | NM | | NM | | NM | | NM |
| | | | | | | | | | | | | | | | | | | | | |
| | | | | | | | | | | | | | | | | | | | | | | | | | | | | | | | | | | | | | | | | | | | | | | | | | | | | | | | | | | | | | | | | |
| | | | | | | | | | | | | | | MoIC | | IRR |
| (dollars in millions) | Year of Inception | | AUM | | Capital Raised | | Invested Capital
(3) | | Realized
Proceeds
(4) | | Unrealized
Value
(5) | | Total
Value | | Gross (6) | | Net (7) | | Gross (8) | | Net (9) |
| Net Lease | | | | | | | | | | | | | | | | | | | | | |
| | | | | | | | | | | | | | | | | | | | | |
| | | | | | | | | | | | | | | | | | | | | |
| | | | | | | | | | | | | | | | | | | | | |
| Blue Owl Real Estate Fund IV (1) | 2017 | | $ | 1,076 | | | $ | 1,250 | | | $ | 1,260 | | | $ | 1,487 | | | $ | 475 | | | $ | 1,962 | | | 1.73x | | 1.56x | | 24.2 | % | | 19.4 | % |
| Blue Owl Real Estate Net Lease Property Fund | 2019 | | $ | 6,718 | | | $ | 3,523 | | | $ | 3,796 | | | $ | 1,143 | | | $ | 3,616 | | | $ | 4,759 | | | 1.28x | | 1.25x | | 12.1 | % | | 10.9 | % |
| Blue Owl Real Estate Fund V (1) | 2020 | | $ | 4,044 | | | $ | 2,500 | | | $ | 2,500 | | | $ | 814 | | | $ | 2,485 | | | $ | 3,299 | | | 1.44x | | 1.32x | | 26.6 | % | | 21.3 | % |
| | | | | | | | | | | | | | | | | | | | | |
| Blue Owl Real Estate Net Lease Trust (2) | 2022 | | $ | 4,731 | | | $ | 2,473 | | | $ | 2,473 | | | $ | 92 | | | $ | 2,337 | | | $ | 2,429 | | | NM | | NM | | NM | | NM |
| Blue Owl Real Estate Fund VI (1) | 2023 | | $ | 5,821 | | | $ | 5,163 | | | $ | 438 | | | $ | 13 | | | $ | 393 | | | $ | 406 | | | NM | | NM | | NM | | NM |
| | | | | | | | | | | | | | | | | | | | | |
(1)Information presented in the Invested Capital through IRR columns for these vehicles is presented on a quarter lag.
(2)Information presented in the AUM through Total Value columns for this vehicle is presented on a quarter lag due to the vehicle being a public filer with the SEC and has not yet filedfiling its quarterly information as of our filing date. Additional information related to this vehicle can be found in its filings with the SEC, which are not part of this report.
(3)Invested capital includes investments by the general partner, capital calls, dividends reinvested, recallable capital which has been reinvested and periodic investorsinvestor closes, as applicable.
(4)Realized proceeds represent the sum of all cash distributions to all investors.
(5)Unrealized value represents the fund’s NAV. There can be no assurance that unrealized values will be realized at the valuations indicated.
(6)Gross MoIC is calculated by adding total realized proceeds and unrealized values of a product’s investments and dividing by the total amount of invested capital. Gross MoIC is calculated before giving effect to management fees and carried interest, as applicable.
(7)Net MoIC measures the aggregate value generated by a product'sproduct’s investments in absolute terms. Net MoIC is calculated by adding total realized proceeds and unrealized values of a product'sproduct’s investments and dividing by the total amount of invested capital. Net MoIC is calculated after giving effect to management fees and carried interest, as applicable, and all other expenses.
(8)Gross IRR is an annualized since inception gross internal rate of return of cash flows to and from the product and the product’s residual value at the end of the measurement period. Gross IRRs are calculated before giving effect to management fees and carried interest, as applicable.
(9)Net IRR is an annualized since inception net internal rate of return of cash flows to and from the product and the product'sproduct’s residual value at the end of the measurement period. Net IRRs reflect returns to all investors. Net IRRs are calculated after giving effect to management fees and carried interest, as applicable, and all other expenses. An individual investor'sinvestor’s IRR may differ from the reported IRR based on the timing of capital transactions.
GAAP Results of Operations Analysis
As a result of the Wellfleet Acquisition, prior period amounts may not be comparable to current period amounts or expected future trends. Wellfleet’s results of operations are included from April 1, 2022.
Three Months Ended March 31, 2023,2024, Compared to the Three Months Ended March 31, 20222023
| | Three Months Ended March 31, | |
| Three Months Ended March 31, | |
| Three Months Ended March 31, | |
| Three Months Ended March 31, | |
| (dollars in thousands) | |
| (dollars in thousands) | |
| (dollars in thousands) | (dollars in thousands) | 2023 | | 2022 | | $ Change |
| Revenues | Revenues | | | | | |
| Management fees, net (includes Part I Fees of $85,864 and $46,739) | $ | 358,825 | | | $ | 247,632 | | | $ | 111,193 | |
| Revenues | |
| Revenues | |
| Management fees, net (includes Part I Fees of $120,161 and $85,864) | |
| Management fees, net (includes Part I Fees of $120,161 and $85,864) | |
| Management fees, net (includes Part I Fees of $120,161 and $85,864) | |
| Administrative, transaction and other fees | Administrative, transaction and other fees | 31,655 | | | 28,345 | | | 3,310 | |
| Realized performance income | 506 | | | — | | | 506 | |
| Administrative, transaction and other fees | |
| Administrative, transaction and other fees | |
| Performance revenues | |
| Performance revenues | |
| Performance revenues | |
| Total Revenues, Net | |
| Total Revenues, Net | |
| Total Revenues, Net | Total Revenues, Net | 390,986 | | | 275,977 | | | 115,009 | |
| Expenses | Expenses | | | | | |
| Expenses | |
| Expenses | |
| Compensation and benefits | |
| Compensation and benefits | |
| Compensation and benefits | Compensation and benefits | 197,618 | | | 193,892 | | | 3,726 | |
| Amortization of intangible assets | Amortization of intangible assets | 70,891 | | | 61,526 | | | 9,365 | |
| Amortization of intangible assets | |
| Amortization of intangible assets | |
| General, administrative and other expenses | |
| General, administrative and other expenses | |
| General, administrative and other expenses | General, administrative and other expenses | 56,134 | | | 43,294 | | | 12,840 | |
| Total Expenses | Total Expenses | 324,643 | | | 298,712 | | | 25,931 | |
| Total Expenses | |
| Total Expenses | |
| Other Loss | |
| Other Loss | |
| Other Loss | Other Loss | | | | | |
| Net gains on investments | Net gains on investments | 612 | | | 5 | | | 607 | |
| Net gains on investments | |
| Net gains on investments | |
| | Interest and dividend income | |
| | Interest expense, net | (13,573) | | | (12,834) | | | (739) | |
| Interest and dividend income | |
| | Interest and dividend income | |
| Interest expense | |
| Interest expense | |
| Interest expense | |
| Change in TRA liability | |
| Change in TRA liability | |
| Change in TRA liability | Change in TRA liability | (1,964) | | | (9,652) | | | 7,688 | |
| Change in warrant liability | Change in warrant liability | (1,950) | | | 17,758 | | | (19,708) | |
| Change in warrant liability | |
| Change in warrant liability | |
| Change in earnout liability | |
| Change in earnout liability | |
| Change in earnout liability | Change in earnout liability | (994) | | | (496) | | | (498) | |
| Total Other Loss | Total Other Loss | (17,869) | | | (5,219) | | | (12,650) | |
| Income (Loss) Before Income Taxes | 48,474 | | | (27,954) | | | 76,428 | |
| Income tax expense (benefit) | 6,440 | | | (5,038) | | | 11,478 | |
| Consolidated and Combined Net Income (Loss) | 42,034 | | | (22,916) | | | 64,950 | |
| Net (income) loss attributable to noncontrolling interests | (33,717) | | | 11,101 | | | (44,818) | |
| Net Income (Loss) Attributable to Blue Owl Capital Inc. | $ | 8,317 | | | $ | (11,815) | | | $ | 20,132 | |
| Total Other Loss | |
| Total Other Loss | |
| Income Before Income Taxes | |
| Income Before Income Taxes | |
| Income Before Income Taxes | |
| Income tax expense | |
| Income tax expense | |
| Income tax expense | |
| Consolidated Net Income | |
| Consolidated Net Income | |
| Consolidated Net Income | |
| Net income attributable to noncontrolling interests | |
| Net income attributable to noncontrolling interests | |
| Net income attributable to noncontrolling interests | |
| Net Income Attributable to Blue Owl Capital Inc. | |
| Net Income Attributable to Blue Owl Capital Inc. | |
| Net Income Attributable to Blue Owl Capital Inc. | |
Revenues, Net
Management Fees. Theincrease in management fees was primarily driven bydue to the drivers below. See Note 69 to our Financial Statements for additional details on our GAAP management fees by product and strategy.
•Direct LendingCredit increased $74.5$62.6 million, including an increase in Part I Fees of $33.2 million, due to continued fundraising and deployment of capital within new and existing Direct Lending products, as well as the $7.5 million accretive impact of the Wellfleet Acquisition.Credit products.
•GP Strategic Capital Solutions increased $27.9$11.1 million, primarily driven by continued fundraising in Dyal Fund V.our sixth flagship minority equity stakes product.
•Real Estate increased $8.8$15.4 million, dueattributable to continued fundraising and deployment of capital within new and existing Real Estate products, primarily Net Lease TrustOREF VI and Net Lease Property Fund.ORENT.
Administrative, Transaction and Other Fees. The increase in administrative, transaction and other fees was driven primarily by the following: (i)
•$16.3 million increase in fee income earned for services provided to portfolio companies, reflecting an increase in volume of $7.5transactions on which we earn such fees.
•$8.0 million increase in dealer manager revenues, due primarily to growth in the distribution of our retail BDCs.
•$7.4 million increase in administrative fees, driven by a higher level of reimbursable compensation expenses due to growth of our products and business overall; (ii) an increase of $2.8 million in dealer manager revenues due to growth in the distribution of our retail BDCs; and (iii) an offsetting decrease of $7.0 million due to fee income earned for services provided to portfolio companies, reflecting a lower volume of transactions on which we earn such fees.overall.
Expenses
Compensation and Benefits. Compensation and benefits expenses increased, primarily due to the following:
• $36.2$40.8 million increase, driven by higher compensation to existing employees, as well as increased headcount due to our continued growth, inclusive of the Wellfleet Acquisition.growth.
•$22.97.6 million offsetting decrease in equity-based compensation, primarily reflecting a $40.0an $18.6 million decrease in acquisition-related equity-based compensation primarily due to the settlement of the FirstSecond Oak Street Earnout (as described in Note 3 to the financial statements in our Annual Report) in January 2023,2024, partially offset by an $18.5a $10.5 million increase in our other recurring annual equity grants driven by the additional grants made during the fourth quarter of 20222023 in connection with year-end bonus compensation.
• $10.0$6.1 million offsetting decrease in acquisition-related cash compensation, primarily due to the settlement of the FirstSecond Oak Street Earnout in January 2023.2024.
Amortization of Intangible Assets. Amortization of intangible assets increased primarilydecreased $14.7 million due to increased trademarks amortization as a result of corporate actions taken duringin the first quarter of 2023 resultingprior year period that resulted in a change of the estimatedshorter useful lives of acquired trademarks. The remaining unamortized balances of the trademarks are being expensed through June 30, 2023. See Note 3 to our Financial Statements for additional information.life.
General, Administrative and Other Expenses.General, administrative and other expenses increased, primarily driven by the following: (i) an
•$8.1 million increase of $12.8in Transaction Expenses, primarily due to the KAM Acquisition and Prima Acquisition.
•$7.9 million increase in reimbursed expenses, primarily related to dealer manager expenses, due to growth in our products and business overall.
•$4.0 million increase in distribution costs, dueprimarily related to increased fundraising; and (ii) an increase of $5.8 million in occupancy costs driven by additional leased space to accommodate our continued growth. These increases were offset by a favorable change of $8.9 million in expense support resulting from recoveries with certain products we manage. Credit products.
•The remaining net change was across various categories, driven by our continued growth.
Other Loss
ChangeInterest Expense. The increase in TRA Liability. The change in the TRA liabilityinterest expense was driven by accretion and a decrease in the risk free rate used to value the contingent consideration portion of the TRA liability.higher average debt outstanding.
Change in Warrant Liability. The change in the warrant liability for the current and prior period was driven by the increase in the price of our Class A Shares. The change in the warrant liability in the prior year period was driven by the increase in the price of our Public Warrants. In August 2022, the Public Warrants were redeemed. See Note 1 to our Financial Statements for additional information.
Income Tax Expense (Benefit)
The changeincrease in income tax expense (benefit) was due to higher pre-tax income in the current period as a result of the drivers discussed above. Please see Note 1011 to our Financial Statements and financial statements in our Annual Report for a discussion of the significant tax differences that impacted our effective tax rate.
Net (Income) LossIncome Attributable toTo Noncontrolling InterestInterests
Net (income) lossincome attributable to noncontrolling interests in the current period and prior period primarily represents the allocation to Common Units (as defined in Note 1 to our Financial Statements) of their pro rata share of the Blue Owl Operating Group’s net income or loss due to the drivers discussed above. The Common Units represented an approximately 68% and 71%66% weighted average economic interest in the Blue Owl Operating Group for the three months ended March 31, 2023 and March 31, 2022, respectively.2024.
Non-GAAP Analysis
In addition to presenting our results in accordance with GAAP, we present certain other financial measures that are not presented in accordance with GAAP. Management uses these measures in budgeting and to assess the operating results of our business, and we believe that this information enhances the ability of stockholders to analyze our performance from period to period. These non-GAAP financial measures supplement and should be considered in addition to and not in lieu of our GAAP results, and such measures should not be considered as indicative of our liquidity. Our non-GAAP measures may not be comparable to other similarly titled measures used by other companies. Please see “—Non-GAAP Reconciliations” for reconciliations of these measures to the most comparable measures prepared in accordance with GAAP.
Fee-Related Earnings and Related Components
Fee-Related Earnings is a supplemental non-GAAP measure of our core operating performance used to make operating decisions and assess our core operating results, focusing on whether our core revenue streams, primarily consisting of management fees, are sufficient to cover our core operating expenses. FRE performance revenues refers to the GAAP performance revenues that are measured and eligible to be received on a recurring basis and not dependent on realization events from the underlying investments. Management also reviews the components that comprise Fee-Related Earnings (i.e., FRE revenues and FRE expenses) on the same basis used to calculate Fee-Related Earnings, and such components are also non-GAAP measures and have been identified with the prefix “FRE” in the tables and discussion below.
Fee-Related Earnings exclude various items that are required for the presentation of our results under GAAP, including the following: noncontrolling interests in the Blue Owl Operating Partnerships; equity-based compensation expense; compensation expenses related to capital contributions in certain subsidiary holding companies that are in-turn paid as compensation to certain employees, as such contributions are not included in Fee-Related Earnings or Distributable Earnings; amortization of acquisition-related earnouts; amortization of intangible assets; “Transaction Expenses” as defined below; expense support payments and subsequent reimbursements; net gains (losses) on investments,investments; net losses on retirement of debt; interest;interest and dividend income; interest expense; changes in TRA, warrant and earnout liabilities; and taxes. Transaction Expenses are expenses incurred in connection with the Business Combination and other acquisitions and strategic transactions, including subsequent adjustments related to such transactions, that were not eligible to be netted against consideration or recognized as acquired assets and assumed liabilities in the relevant transactions. FRE revenues and FRE expenses also exclude realizedDE performance incomerevenues and related compensation expense, as well as revenues and expenses related to amounts reimbursed by our products, including administrative fees and dealer manager reallowed commissions, that have no impact to our bottom line operating results, and therefore FRE revenues and FRE expenses do not represent our total revenues or total expenses in any given period. DE performance revenues refers to GAAP performance revenues that are not FRE performance revenues.
Distributable Earnings
Distributable Earnings is a supplemental non-GAAP measure of operating performance that equals Fee-Related Earnings plus or minus, as relevant, realizedDE performance incomerevenues and related compensation, interest and dividend income, interest expense, net, as well as amounts payable for taxes and payments made pursuant to the TRA. Amounts payable for taxes presents the current income taxes payable, excluding the impact of tax contingency-related accrued expenses or benefits, as such amounts are included when paid or received, related to the respective period’s earnings, assuming that all Distributable Earnings were allocated to the Registrant, which would occur following the exchange of all Blue Owl Operating Group Units for Class A Shares. Current income taxes payable and payments made pursuant to the TRA reflect the benefit of tax deductions that are excluded when calculating Distributable Earnings (e.g., equity-based compensation expenses, Transaction Expenses, tax goodwill, etc.). If these tax deductions were to be excluded from amounts payable for taxes, Distributable Earnings would be lower and our effective tax rate would appear to be higher, even though a lower amount of income taxes would have been paid or payable for a period’s earnings. We make these adjustments when calculating Distributable Earnings to more accurately reflect the net realized earnings that are expected to be or become available for distribution or reinvestment into our business. Management believes that Distributable Earnings can be useful as a supplemental performance measure to our GAAP results assessing the amount of earnings available for distribution.
Fee-Related Earnings and Distributable Earnings Summary
| | | Three Months Ended March 31, |
| | | Three Months Ended March 31, | |
| | | Three Months Ended March 31, | |
| | | Three Months Ended March 31, | |
| (dollars in thousands) | (dollars in thousands) | | 2023 | | 2022 | | $ Change | |
| FRE revenues | FRE revenues | | $ | 377,403 | | | $ | 272,598 | | | $ | 104,805 | | |
| FRE revenues | |
| FRE revenues | |
| FRE expenses | FRE expenses | | 151,630 | | | 101,735 | | | 49,895 | | |
| Net income allocated to noncontrolling interests included in Fee-Related Earnings | | 126 | | | 520 | | | (394) | | |
| FRE expenses | |
| FRE expenses | |
| Net (income) loss allocated to noncontrolling interests included in Fee-Related Earnings | |
| Net (income) loss allocated to noncontrolling interests included in Fee-Related Earnings | |
| Net (income) loss allocated to noncontrolling interests included in Fee-Related Earnings | |
| Fee-Related Earnings | |
| Fee-Related Earnings | |
| Fee-Related Earnings | Fee-Related Earnings | | $ | 225,899 | | | $ | 171,383 | | | $ | 54,516 | | |
| Distributable Earnings | Distributable Earnings | | $ | 209,014 | | | $ | 155,726 | | | $ | 53,288 | | |
| Distributable Earnings | |
| Distributable Earnings | |
Fee-Related Earnings and Distributable Earnings increased as a result of higher FRE revenues in Direct Lending,Credit, GP Strategic Capital Solutions and Real Estate, as well as the accretive impact of the Wellfleet Acquisition, partially offset by higher FRE expenses, as further discussed below.
FRE Revenues
| | | Three Months Ended March 31, |
| | | Three Months Ended March 31, | |
| | | Three Months Ended March 31, | |
| | | Three Months Ended March 31, | |
| (dollars in thousands) | (dollars in thousands) | | 2023 | | 2022 | | $ Change | |
| Direct Lending Products | | | | | | | |
| Credit Platform | |
| Credit Platform | |
| Credit Platform | |
| Diversified lending | |
| Diversified lending | |
| Diversified lending | Diversified lending | | $ | 146,095 | | | $ | 105,452 | | | $ | 40,643 | | |
| Technology lending | Technology lending | | 47,690 | | | 23,030 | | | 24,660 | | |
| Technology lending | |
| Technology lending | |
| First lien lending | |
| First lien lending | |
| First lien lending | First lien lending | | 4,485 | | | 3,681 | | | 804 | | |
| Opportunistic lending | Opportunistic lending | | 2,400 | | | 1,541 | | | 859 | | |
| CLOs | | 7,518 | | | — | | | 7,518 | | |
| Opportunistic lending | |
| Opportunistic lending | |
| Liquid credit | |
| Liquid credit | |
| Liquid credit | |
| Other | |
| Other | |
| Other | |
| Management Fees, Net | |
| Management Fees, Net | |
| Management Fees, Net | Management Fees, Net | | 208,188 | | | 133,704 | | | 74,484 | | |
| Administrative, transaction and other fees | Administrative, transaction and other fees | | 7,524 | | | 14,473 | | | (6,949) | | |
| FRE Revenues - Direct Lending Products | | 215,712 | | | 148,177 | | | 67,535 | | |
| Administrative, transaction and other fees | |
| Administrative, transaction and other fees | |
| FRE performance revenues | |
| FRE performance revenues | |
| FRE performance revenues | |
| FRE Revenues - Credit Platform | |
| FRE Revenues - Credit Platform | |
| FRE Revenues - Credit Platform | |
| | GP Capital Solutions Products | | | |
| GP minority equity investments | | 130,296 | | | 102,100 | | | 28,196 | | |
| GP Strategic Capital Platform | |
| | GP Strategic Capital Platform | |
| | GP Strategic Capital Platform | |
| GP minority stakes | |
| GP minority stakes | |
| GP minority stakes | |
| GP debt financing | GP debt financing | | 3,751 | | | 3,092 | | | 659 | | |
| Professional sports minority investments | | 402 | | | 500 | | | (98) | | |
| GP debt financing | |
| GP debt financing | |
| Professional sports minority stakes | |
| Professional sports minority stakes | |
| Professional sports minority stakes | |
| Management Fees, Net | |
| Management Fees, Net | |
| Management Fees, Net | Management Fees, Net | | 134,449 | | | 105,692 | | | 28,757 | | |
| Administrative, transaction and other fees | Administrative, transaction and other fees | | 1,203 | | | 1,571 | | | (368) | | |
| FRE Revenues - GP Capital Solutions Products | | 135,652 | | | 107,263 | | | 28,389 | | |
| Administrative, transaction and other fees | |
| Administrative, transaction and other fees | |
| FRE Revenues - GP Strategic Capital Platform | |
| FRE Revenues - GP Strategic Capital Platform | |
| FRE Revenues - GP Strategic Capital Platform | |
| | Real Estate Products | | | |
| Real Estate Platform | |
| | Real Estate Platform | |
| | Real Estate Platform | |
| Net lease | |
| Net lease | |
| Net lease | Net lease | | 25,957 | | | 17,158 | | | 8,799 | | |
| Management Fees, Net | Management Fees, Net | | 25,957 | | | 17,158 | | | 8,799 | | |
| Management Fees, Net | |
| Management Fees, Net | |
| FRE performance revenues | |
| FRE performance revenues | |
| FRE performance revenues | |
| Administrative, transaction and other fees | Administrative, transaction and other fees | | 82 | | | — | | | 82 | | |
| FRE Revenues - Real Estate Products | | 26,039 | | | 17,158 | | | 8,881 | | |
| Administrative, transaction and other fees | |
| Administrative, transaction and other fees | |
| FRE Revenues - Real Estate Platform | |
| FRE Revenues - Real Estate Platform | |
| FRE Revenues - Real Estate Platform | |
| Total FRE Revenues | Total FRE Revenues | | $ | 377,403 | | | $ | 272,598 | | | $ | 104,805 | | |
| Total FRE Revenues | |
| Total FRE Revenues | |
FRE Management Fees. The increase in FRE management fees was primarily driven bydue to the drivers below:below.
•Direct LendingCredit FRE management fees increased $62.6 million, including an increase in Part I Fees of $33.2 million, due to continued fundraising and deployment of capital within new and existing Direct Lending products, as well as the accretive impact of the Wellfleet Acquisition.Credit products.
•GP Strategic Capital SolutionsFRE management fees increased $12.0 million, primarily driven by continued fundraising in Dyal Fund V.our sixth flagship minority equity stakes product.
•Real Estate FRE management fees increased due$15.4 million, attributable to continued fundraising and deployment of capital within new and existing Real Estate products, primarily Net Lease TrustOREF VI and Net Lease Property Fund.ORENT.
FRE Administrative, Transaction and Other Fees. The decreaseincrease in FRE administrative, transaction and other fees was driven primarily by a decrease$16.3 million increase in fee income earned for services provided to portfolio companies, reflecting a loweran increase in volume of transactions on which we eearn such feesarn such fees..
FRE Expenses | | | | | | | | | | | | | | | | | | | |
| | | Three Months Ended March 31, |
| (dollars in thousands) | | | | | 2024 | | 2023 | | | | |
| FRE compensation and benefits | | | | | $ | 138,666 | | | $ | 103,600 | | | | | |
| FRE general, administrative and other expenses | | | | | 52,371 | | | 48,030 | | | | | |
| Total FRE Expenses | | | | | $ | 191,037 | | | $ | 151,630 | | | | | |
| | | | | | | | | | | | | | | | | | | | | | | |
| | | Three Months Ended March 31, |
| (dollars in thousands) | | | | | 2023 | | 2022 | | $ Change | | |
| FRE compensation and benefits | | | | | $ | 103,600 | | | $ | 74,969 | | | $ | 28,631 | | | |
| FRE general, administrative and other expenses | | | | | 48,030 | | | 26,766 | | | 21,264 | | | |
| Total FRE Expenses | | | | | $ | 151,630 | | | $ | 101,735 | | | $ | 49,895 | | | |
FRE Compensation and Benefits. FRE compensation and benefits expenses increased, driven by higher compensation to existing employees, as well as increased headcount due to our continued growth, inclusive of the Wellfleet Acquisition.growth.
FRE General, Administrative and Other Expenses. FRE general, administrative and other expenses increased, driven by the following:
•$4.7 million increase primarily driven by: (i) an increase of $10.0 million in distribution costsoffice-related expenses and professional fees due to increased fundraising;headcount and (ii) anour continued growth.
•$3.3 million increase of $5.8 million in occupancy costs, driven by additional leased space to accommodate our continued growth, with thegrowth.
•$4.1 million offsetting decrease in distribution costs, primarily related to our Credit products.
•The remaining net increasechange was across various categories, driven by our continued growth.
Non-GAAP Reconciliations
The table below presents the reconciliation of the non-GAAP measures presented throughout this MD&A. Please see “—Non-GAAP Analysis” for important information regarding these measures.
| | | |
| | | | | Three Months Ended March 31, | | | Three Months Ended March 31, |
| (dollars in thousands) | (dollars in thousands) | | 2023 | | 2022 | |
| GAAP Net Income (Loss) Attributable to Class A Shares | | $ | 8,317 | | | $ | (11,815) | | |
| Net income (loss) attributable to noncontrolling interests | | 33,717 | | | (11,101) | | |
| Income tax expense (benefit) | | 6,440 | | | (5,038) | | |
| GAAP Income (Loss) Before Income Taxes | | 48,474 | | | (27,954) | | |
| Net income allocated to noncontrolling interests included in Fee-Related Earnings | | 126 | | | 520 | | |
| GAAP Net Income Attributable to Class A Shares | |
| GAAP Net Income Attributable to Class A Shares | |
| GAAP Net Income Attributable to Class A Shares | |
| Net income attributable to noncontrolling interests | |
| Net income attributable to noncontrolling interests | |
| Net income attributable to noncontrolling interests | |
| Income tax expense | |
| Income tax expense | |
| Income tax expense | |
| GAAP Income Before Income Taxes | |
| GAAP Income Before Income Taxes | |
| GAAP Income Before Income Taxes | |
| Net (income) loss allocated to noncontrolling interests included in Fee-Related Earnings | |
| Net (income) loss allocated to noncontrolling interests included in Fee-Related Earnings | |
| Net (income) loss allocated to noncontrolling interests included in Fee-Related Earnings | |
| Strategic Revenue-Share Purchase consideration amortization | Strategic Revenue-Share Purchase consideration amortization | | 9,769 | | | 8,922 | | |
| Realized performance income | | (506) | | | — | | |
| Realized performance compensation | | 177 | | | — | | |
| Strategic Revenue-Share Purchase consideration amortization | |
| Strategic Revenue-Share Purchase consideration amortization | |
| DE performance revenues | |
| DE performance revenues | |
| DE performance revenues | |
| DE performance revenues compensation | |
| DE performance revenues compensation | |
| DE performance revenues compensation | |
| Equity-based compensation - other | |
| Equity-based compensation - other | |
| Equity-based compensation - other | Equity-based compensation - other | | 35,628 | | | 17,526 | | |
| Equity-based compensation - acquisition related | Equity-based compensation - acquisition related | | 20,679 | | | 60,654 | | |
| Equity-based compensation - acquisition related | |
| Equity-based compensation - acquisition related | |
| Equity-based compensation - Business Combination grants | |
| Equity-based compensation - Business Combination grants | |
| Equity-based compensation - Business Combination grants | Equity-based compensation - Business Combination grants | | 16,968 | | | 18,421 | | |
| Acquisition-related cash earnout amortization | Acquisition-related cash earnout amortization | | 6,098 | | | 16,082 | | |
| Acquisition-related cash earnout amortization | |
| Acquisition-related cash earnout amortization | |
| Capital-related compensation | |
| Capital-related compensation | |
| Capital-related compensation | Capital-related compensation | | 1,698 | | | 830 | | |
| Amortization of intangible assets | Amortization of intangible assets | | 70,891 | | | 61,526 | | |
| Amortization of intangible assets | |
| Amortization of intangible assets | |
| Transaction Expenses | |
| Transaction Expenses | |
| Transaction Expenses | Transaction Expenses | | 116 | | | 2,425 | | |
| Expense support | Expense support | | (2,088) | | | 7,212 | | |
| Net gains on investments | | (612) | | | (5) | | |
| Expense support | |
| Expense support | |
| Net losses on investments | |
| Net losses on investments | |
| Net losses on investments | |
| | Change in TRA liability | |
| | Change in TRA liability | |
| | Change in TRA liability | Change in TRA liability | | 1,964 | | | 9,652 | | |
| Change in warrant liability | Change in warrant liability | | 1,950 | | | (17,758) | | |
| Change in warrant liability | |
| Change in warrant liability | |
| Change in earnout liability | Change in earnout liability | | 994 | | | 496 | | |
| Interest expense, net | | 13,573 | | | 12,834 | | |
| Change in earnout liability | |
| Change in earnout liability | |
| Interest and dividend income | |
| Interest and dividend income | |
| Interest and dividend income | |
| Interest expense | |
| Interest expense | |
| Interest expense | |
| Fee-Related Earnings | Fee-Related Earnings | | 225,899 | | | 171,383 | | |
| Realized performance income | | 506 | | | — | | |
| Realized performance compensation | | (177) | | | — | | |
| Interest expense, net | | (13,573) | | | (12,834) | | |
| Fee-Related Earnings | |
| Fee-Related Earnings | |
| DE performance revenues | |
| DE performance revenues | |
| DE performance revenues | |
| DE performance revenues compensation | |
| DE performance revenues compensation | |
| DE performance revenues compensation | |
| Interest and dividend income | |
| Interest and dividend income | |
| Interest and dividend income | |
| Interest expense | |
| Interest expense | |
| Interest expense | |
| Taxes and TRA payments | |
| Taxes and TRA payments | |
| Taxes and TRA payments | Taxes and TRA payments | | (3,641) | | | (2,823) | | |
| Distributable Earnings | Distributable Earnings | | 209,014 | | | 155,726 | | |
| Interest expense, net | | 13,573 | | | 12,834 | | |
| Taxes and TRA payments | | 3,641 | | | 2,823 | | |
| Fixed assets depreciation and amortization | | 1,922 | | | 218 | | |
| Adjusted EBITDA | | $ | 228,150 | | | $ | 171,601 | | |
| Distributable Earnings | |
| Distributable Earnings | |
| | | Three Months Ended March 31, |
| | | Three Months Ended March 31, | |
| | | Three Months Ended March 31, | |
| | | Three Months Ended March 31, | |
| (dollars in thousands) | (dollars in thousands) | | 2023 | | 2022 | |
| GAAP Revenues | GAAP Revenues | | $ | 390,986 | | | $ | 275,977 | | |
| GAAP Revenues | |
| GAAP Revenues | |
| Strategic Revenue-Share Purchase consideration amortization | Strategic Revenue-Share Purchase consideration amortization | | 9,769 | | | 8,922 | | |
| Realized performance income | | (506) | | | — | | |
| Strategic Revenue-Share Purchase consideration amortization | |
| Strategic Revenue-Share Purchase consideration amortization | |
| DE performance revenues | |
| DE performance revenues | |
| DE performance revenues | |
| Reimbursed expenses | |
| Reimbursed expenses | |
| Reimbursed expenses | Reimbursed expenses | | (22,846) | | | (12,301) | | |
| FRE Revenues | FRE Revenues | | $ | 377,403 | | | $ | 272,598 | | |
| FRE Revenues | |
| FRE Revenues | |
| | | Three Months Ended March 31, |
| | | Three Months Ended March 31, | |
| | | Three Months Ended March 31, | |
| | | Three Months Ended March 31, | |
| (dollars in thousands) | (dollars in thousands) | | 2023 | | 2022 | |
| GAAP Compensation and Benefits | GAAP Compensation and Benefits | | $ | 197,618 | | | $ | 193,892 | | |
| Realized performance compensation | | (177) | | | — | | |
| GAAP Compensation and Benefits | |
| GAAP Compensation and Benefits | |
| DE performance revenues compensation | |
| DE performance revenues compensation | |
| DE performance revenues compensation | |
| Equity-based compensation - other | |
| Equity-based compensation - other | |
| Equity-based compensation - other | Equity-based compensation - other | | (35,628) | | | (17,113) | | |
| Equity-based compensation - acquisition related | Equity-based compensation - acquisition related | | (20,679) | | | (60,654) | | |
| Equity-based compensation - acquisition related | |
| Equity-based compensation - acquisition related | |
| Equity-based compensation - Business Combination grants | |
| Equity-based compensation - Business Combination grants | |
| Equity-based compensation - Business Combination grants | Equity-based compensation - Business Combination grants | | (16,968) | | | (18,421) | | |
| Acquisition-related cash earnout amortization | Acquisition-related cash earnout amortization | | (6,098) | | | (16,082) | | |
| Acquisition-related cash earnout amortization | |
| Acquisition-related cash earnout amortization | |
| Capital-related compensation | |
| Capital-related compensation | |
| Capital-related compensation | Capital-related compensation | | (1,698) | | | (830) | | |
| Reimbursed expenses | Reimbursed expenses | | (12,770) | | | (5,823) | | |
| Reimbursed expenses | |
| Reimbursed expenses | |
| FRE Compensation and Benefits | FRE Compensation and Benefits | | $ | 103,600 | | | $ | 74,969 | | |
| FRE Compensation and Benefits | |
| FRE Compensation and Benefits | |
| | | | | | | | | | | | | | | | | | | |
| | | Three Months Ended March 31, |
| (dollars in thousands) | | | | | 2023 | | 2022 | | | | |
| GAAP General, Administrative and Other Expenses | | | | | $ | 56,134 | | | $ | 43,294 | | | | | |
| Equity-based compensation - other | | | | | — | | | (413) | | | | | |
| Transaction Expenses | | | | | (116) | | | (2,425) | | | | | |
| Expense support | | | | | 2,088 | | | (7,212) | | | | | |
| Reimbursed expenses | | | | | (10,076) | | | (6,478) | | | | | |
| FRE General, Administrative and Other Expenses | | | | | $ | 48,030 | | | $ | 26,766 | | | | | |
Critical Accounting Estimates
We prepare our Financial Statements in accordance with U.S. GAAP. In applying many of these accounting principles, we make estimates that affect the reported amounts of assets, liabilities, revenues and expenses in the Financial Statements. We base our estimates on historical experience and other factors that we believe are reasonable under the circumstances. These estimates, however, are subjective and subject to change, and actual results may differ materially from our current estimates due to the inherent nature of these estimates, including geopolitical, macro-environmental and other uncertainty. For a summary of our significant accounting policies, see Note 2 to our Financial Statements and financial statements in our Annual Report.
Estimation of Fair Values
Investments Held by our Products
The fair value of the investments held by our Direct Lending products and certain Real Estate products is the primary input to the calculation for the majority of our management fees. Management fees from our GP Capital Solutions and other Real Estate products are generally based on commitments or investment cost, so our management fees are generally not impacted by changes in the estimated fair values of investments held by these products. However, to the extent that management fees are calculated based on investment cost of the product’s investments, the amount of fees that we may charge will increase or decrease from the effect of changes in the cost basis of the product’s investments, including potential impairment losses. In the absence of observable market prices, we use valuation methodologies applied on a consistent basis and assumptions that we believe market participants would use to determine the fair value of the investments. For investments where little market activity exists, the determination of fair value is based on the best information available, we incorporate our own assumptions and involves a significant degree of judgment, and the consideration of a combination of internal and external factors.
Our products generally value their investments at fair value, as determined in good faith by each product’s respective board of directors or valuation committee, as applicable, based on, among other things, the input of third party valuation firms and taking into account the nature and realizable value of any collateral, an investee’s ability to make payments and its earnings, the markets in which the investee operates, comparison to publicly traded companies, discounted cash flows, current market interest rates and other relevant factors. Because such valuations are inherently uncertain, the valuations may fluctuate significantly over time due to changes in market conditions. These valuations would, in turn, have corresponding proportionate impacts on the amount of management fees that we may earn from certain products on which revenues are based on the fair value of investments.
TRA Liability
We carry a portion of our TRA liability at fair value, as it is contingent consideration related to the Dyal Acquisition. The valuation of this portion of the TRA liability is mostly sensitive to our expectation of future cash savings that we may ultimately realize related to our tax goodwill and other intangible assets deductions. We then apply a discount rate that we believe is appropriate given the nature of and expected timing of payments of the liability. A decrease in the discount rate assumption would result in an increase in the fair value estimate of the liability, which would have a correspondingly negative impact on our GAAP results of operations. However, payments under the TRA are ultimately only made to the extent we realize the offsetting cash savings on our income taxes due to the tax goodwill and other intangibles deduction. See Note 9 to our Financial Statements for additional details.
Earnout Liability and Private Placement Warrants Liability
The fair values of our Earnout Securities liability and Private Placement Warrants liability were determined using various significant unobservable inputs, including a discount rate and our best estimate of expected volatility and expected holding periods. Changes in the estimated fair values of these liabilities may have material impacts on our results of operations in any given period, as any increases in these liabilities have a corresponding negative impact on our GAAP results of operations. See Note 9 to our Financial Statements for additional details.
Equity-based Compensation
The grant-date fair values of our RSU and Incentive Unit grants, as well as the Wellfleet Earnouts are generally determined using our Class A Share price on the grant date, adjusted for the lack of dividend participation during the vesting period, and the application of a discount for lack of marketability on RSUs and Incentive Units that are subject to post-vesting transfer restrictions. The higher these discounts, the lower the compensation expense taken over time for these grants.
For the Oak Street Earnout Units that were classified as equity-based compensation for GAAP, we determines the grant date fair value using Monte Carlo simulations that had various significant unobservable inputs. The assumptions used have a material impact on the valuation of these grants, and include our best estimate of expected volatility, expected holding periods and appropriate discounts for lack of marketability. The higher the expected volatility, the higher the compensation expense taken for these grants. The higher the expected holding periods and discount for lack of marketability, the lower the compensation expense taken for these grants. See Note 8 to our Financial Statements and financial statements in our Annual Report for additional details.
Deferred Tax Assets
Substantially all of our deferred tax assets relate to goodwill and other intangible assets deductible for tax purposes, as well as payments expected to be made under the TRA. In accordance with relevant tax rules, we expect to take substantially all of these goodwill and other intangible deductions over a 15-year period following the applicable transaction. To the extent we generate insufficient taxable income to take the full deduction in any given year, we will generate a net operating loss (“NOL”) that is available for us to use over an indefinite carryforward period in order to fully realize the deferred tax assets.
When evaluating the realizability of deferred tax assets, all evidence—both positive and negative—is considered. This evidence includes, but is not limited to, expectations regarding future earnings, future reversals of existing temporary tax differences and tax planning strategies. We did not take into account any tax planning strategies when arriving at this conclusion; however, the other assumptions underlying the taxable income estimates, are based on our near-term operating model. If we experience a significant decline in AUM for any extended time during the period for which these estimates relate and we do not otherwise experience offsetting growth rates in other periods, we may not generate taxable income sufficient to realize the deferred tax assets and may need to record a valuation allowance. However, given the indefinite carryforward period available for NOLs and the conservative estimates used to prepare the taxable income projections, the sensitivity of our estimates and assumptions are not likely to have a material impact on our conclusion that a valuation allowance is not needed.
Goodwill and Other Intangible Assets
Our ongoing accounting for goodwill and other intangible assets requires us to make significant estimates and assumptions when evaluating these assets for impairment. We generally undertake a qualitative review of factors that may indicate whether an impairment exists. We take into account factors such as the adverse impacts to FPAUM and management fees, general economic conditions, and various other factors that require judgement in deciding whether a quantitative analysis should be undertaken. Our evaluation for indicators of impairment may not capture a potential impairment, which could result in an overstatement of the carrying values of goodwill and other intangible assets. We also estimate the useful lives of our finite-lived intangible assets for purposes of amortization. The useful lives are based on our judgment of the expected future economic benefits of the assets. Changes in estimated useful lives could result in significant changes to the amount of amortization expense recognized in future periods.
Variable Interest Entities
The determination of whether to consolidate a variable interest entity (“VIE”) under GAAP requires a significant amount of judgment concerning the degree of control over an entity by its holders of variable interests. To make these judgments, we conduct an analysis, on a case-by-case basis, of whether we are the primary beneficiary and are therefore required to consolidate an entity. We continually reconsider whether we should consolidate a VIE. Upon the occurrence of certain events, such as modifications to organizational documents and investment management agreements of our products, we will reconsider our conclusion regarding the status of an entity as a VIE. Our judgement when analyzing the status of an entity and whether we consolidate an entity could have a material impact on individual line items within our Financial Statements, as a change in our conclusion would have the effect of grossing up the assets, liabilities, revenues and expenses of the entity being evaluated. In light of the relevantly insignificant direct and indirect investments into our products, the likelihood of a reasonable change in our estimation and judgement would likely not result in a change in our conclusions to consolidate or not consolidate any VIEs to which we have exposure.
Impact of Changes in Accounting on Recent and Future Trends
We believe that none of the changes to GAAP that went into effect during the three months ended March 31, 2023, or that have been issued but that we have not yet adopted, are expected to materially impact our future trends. | | | | | | | | | | | | | | | | | | | |
| | | Three Months Ended March 31, |
| (dollars in thousands) | | | | | 2024 | | 2023 | | | | |
| GAAP General, Administrative and Other Expenses | | | | | $ | 76,748 | | | $ | 56,134 | | | | | |
| | | | | | | | | | | |
| Transaction Expenses | | | | | (8,222) | | | (116) | | | | | |
| Expense support | | | | | 1,798 | | | 2,088 | | | | | |
| Reimbursed expenses | | | | | (17,953) | | | (10,076) | | | | | |
| FRE General, Administrative and Other Expenses | | | | | $ | 52,371 | | | $ | 48,030 | | | | | |
Liquidity and Capital Resources
Overview
We rely on management fees as the primary source of our operating liquidity. From time to time we may rely on the use of our Revolving Credit Facility between management fee collection dates, which generally occur on a quarterly basis. We may also rely on our Revolving Credit Facility for liquidity needed to fund acquisitions, which we may replace with longer-term financing, subject to market conditions.
We ended the first quarter of 20232024 with $37.9$155.8 million of cash and cash equivalents and approximately $758.6 million$0.9 billion available under our Revolving Credit Facility. In April 2024, we issued $750.0 million of 6.250% Senior Notes due 2034 (the “2034 Notes”), repaying outstanding borrowings under our Revolving Credit Facility and providing additional liquidity for general corporate purposes, including to fund strategic acquisitions and related transactions and growth initiatives. Based on management’s experience and our current level of liquidity and assets under management, we believe that our current liquidity position and cash generated from management fees will continue to be sufficient to meet our anticipated working capital needs for at least the next 12 months.
Over the short and long term, we may use cash and cash equivalents, issue additional debt or equity securities, or may seek other sources of liquidity to:
•Grow our existing investment management business.
•Expand into, or acquire, into businesses that are complementary to our existing investment management business or other strategic growth initiatives.
•Pay operating expenses, including cash compensation to our employees.
•Repay debt obligations and interest thereon.
•Opportunistically repurchase Class A Shares on the open market, as well as pay withholding taxes on net settled, vested RSUs.
•Pay income taxes and amounts due under the TRA.
•Pay dividends to holders of our Class A Shares, as well as make corresponding distributions to holders of Common Units at the Blue Owl Operating Group level.
•Fund debt and equity investment commitments to existing or future products.
Debt Obligations
As of March 31, 2023,2024, our long-term debt obligations consisted of $59.8 million aggregate principal amount of 7.397% Senior Notes due 2028 (the “2028 Notes”), $700.0 million aggregate principal amount of 3.125% Senior Notes due 2031 (the “2031 Notes”), $400.0 million aggregate principal amount of 4.375% Senior Notes due 2032 (the “2032 Notes”) and $350.0 million aggregate principal amount of 4.125% Senior Notes due 2051 (the “2051 Notes”and collectively with the 2028 Notes, 2031 Notes and the 2032 Notes, the “Notes”). We also had $350.0$595.0 million outstanding under our Revolving Credit Facility as of March 31, 2023,2024, and asall outstanding amounts under our Revolving Credit Facility were repaid in connection with the issuance of the date of this filing, the balance was $140.0 million.2034 Notes. We expect to use cash on hand to pay interest and principal due on our financing arrangements over time, which would reduce amounts available for dividends and distributions to our stockholders. We may choose to refinance all or a portion of any amounts outstanding on or prior to their respective maturity dates by issuing new debt, which could result in higher borrowing costs. We may also choose to repay borrowing by using proceeds from the issuance of equity or other securities, which would dilute stockholders. See Note 47 to our Financial Statements and Note 4 to the financial statements in our Annual Report for additional information regarding our debt obligations.
Management regularly reviews Adjusted EBITDA to assess our ability to service our debt obligations, and as such believes that such measure is meaningful to our investors. Adjusted EBITDA is equal to Distributable Earnings plus interest expense, net, taxes payable and TRA payments, and fixed assets depreciation and amortization. Adjusted EBITDA is a non-GAAP financial measure that supplements and should be considered in addition to and not in lieu of our GAAP results, and such measure should not be considered as indicative of our liquidity. Adjusted EBITDA may not be comparable to other similarly titled measured used by other companies. Adjusted EBITDA was $228.2 million for the three months ended March 31, 2023. Please see “—Non-GAAP Reconciliations” for reconciliations of Adjusted EBITDA to the most comparable measures prepared in accordance with GAAP.
Tax Receivable Agreement
As discussed in Note 118 to our Financial Statements, in this report, we made a payment under the TRA and may in the future be required to make payments under the TRA.additional payments. As of March 31, 2023,2024, assuming no material changes in the relevant tax law and that we generate sufficient taxable income to realize the full tax benefit of the increased amortization resulting from the increase in tax basis of certain Blue Owl Operating Group assets, we expect to pay approximately $936.8 million$1.1 billion under the TRA (such amount excludes the adjustment to fair value for the portion classified as contingent consideration). Future cash savings and related payments under the TRA in respect of subsequent exchanges of Blue Owl Operating Group Units for Class A or B Shares would be in addition to these amounts.
Payments under the TRA are anticipated to increase the tax basis adjustment and, consequently, result in increasing annual amortization deductions in the taxable years of and after such increases to the original basis adjustments, and potentially will give rise to increasing tax savings with respect to such years and correspondingly increasing payments under the TRA.
The obligation to make payments under the TRA is an obligation of Blue Owl GP, and any other corporate taxpaying entities that in the future may hold GP Units (as defined in Note 1 to our Financial Statements) and not of the Blue Owl Operating Group. We may need to incur debt to finance payments under the TRA to the extent the Blue Owl Operating Group does not distribute cash to the Registrant or Blue Owl GP in an amount sufficient to meet our obligations under the TRA.
The actual increase in tax basis of the Blue Owl Operating Group assets resulting from an exchange or from payments under the TRA, as well as the amortization thereof and the timing and amount of payments under the TRA, will vary based upon a number of factors, including the following:
•The amount and timing of our taxable income will impact the payments to be made under the TRA. To the extent that we do not have sufficient taxable income to utilize the amortization deductions available as a result of the increased tax basis in the Blue Owl Operating Partnerships’ assets, payments required under the TRA would be reduced.
•The price of our Class A Shares at the time of any exchange will determine the actual increase in tax basis of the Blue Owl Operating Partnerships’ assets resulting from such exchange; payments under the TRA resulting from future exchanges, if any, will be dependent in part upon such actual increase in tax basis.
•The composition of the Blue Owl Operating Group assets at the time of any exchange will determine the extent to which we may benefit from amortizing the increased tax basis in such assets and thus will impact the amount of future payments under the TRA resulting from any future exchanges.
•The extent to which future exchanges are taxable will impact the extent to which we will receive an increase in tax basis of the Blue Owl Operating Group assets as a result of such exchanges, and thus will impact the benefit derived by us and the resulting payments, if any, to be made under the TRA.
•The tax rates in effect at the time any potential tax savings are realized, which would affect the amount of any future payments under the TRA.
Depending upon the outcome of these and other factors, payments that we may be obligated to make under the TRA in respect of exchanges could be substantial. In light of the numerous factors affecting our obligation to make payments under the TRA, the timing and amounts of any such actual payments are not reasonably ascertainable.
Share Repurchases and RSUs Withheld for Tax Withholding
On May 4, 2022, our Board authorized the repurchase of up to $150.0 million of Class A Shares (the “Program”). Under the Program, repurchases may be made from time to time in open market transactions, in privately negotiated transactions or otherwise. The timing and the actual numbers repurchased will depend on a variety of factors, including legal requirements, price and economic and market conditions. The Program may be changed, suspended or discontinued at any time and will terminate upon the earlier of (i) the purchase of all shares available under the Program or (ii) December 31, 2024. TheThere were no repurchases made under the Program replaced the previously authorized program under which we repurchased 2,000,000 shares during the first quarter of 2022.three months ended March 31, 2024 and 2023.
Additionally, pursuant to the terms of our RSU agreements, upon the vesting of RSUs to employees, we may net settle awards to satisfy employee tax withholding obligations. In such instances, we cancel a number of RSUs equivalent in value to the amount of tax withholding payments that we make on behalf of employees out of available cash. During the three months ended March 31, 2024 and 2023, 969,149 RSUs with a fair value of $17.4 million and 2022, 319,306 RSUs with a fair value of $4.4 million and 56,981 RSUs with a fair value of $0.7 million, respectively, were withheld to satisfy tax withholding obligations.
Oak Street Cash Earnout and Wellfleet Earnout
A portion of the Oak Street Cash Earnout and the Wellfleet Earnout (each as defined in Note 3 to the financial statements in our Annual Report) is classified as a liability and represents the fair value of the obligation to make future cash payments that would need to be made if all the respective Oak Street Triggering Events and Wellfleet Triggering Events occur. In April 2023, we modified our purchase agreement with the Wellfleet sellers, such that Wellfleet Earnout Shares will be delivered in cash in lieu of Wellfleet Earnout Shares. As we approach each Triggering Event, we generally would expect the respective liabilities to increase due to the passage of time, which would result in mark-to-market losses being recognized in our consolidated statement of operations. Further, the cash portion classified as compensation expense will be expensed and a corresponding accrued compensation liability will be recorded over the service period. To the extent we have insufficient cash on hand or that we opt to, we may rely on debt or equity financing to facilitate these transactions in the future. In January 2023, the Oak Street Triggering Event occurred with respect to the First Oak Street Earnout. In April 2023, the Wellfleet Triggering Event occurred with respect to the First Wellfleet Earnout. In January 2024, the Oak Street Triggering Event occurred with respect to the Second Oak Street Earnout. In April 2024, the Wellfleet Triggering Event occurred with respect to the Second Wellfleet Earnout. For details on the Oak Street Cash Earnout and Wellfleet Earnout,Earnouts, see Note 1 to the Financial Statements and Note 3 to the financial statements in our Annual Report.
Report for additional information. Dividends and Distributions
For the first quarter of 2023, we declared a dividend of $0.14 to holders of record as of the close of business on May 19, 2023, which will be paid on May 31, 2023. Starting in 2023, we moved to a fixed quarterly dividend based on our expected annual Distributable Earnings for the current fiscal year, which will be reassessed on an annual basis. For the first quarter of 2024, we declared a dividend of $0.18 to holders of record as of the close of business on May 21, 2024, which will be paid on May 30, 2024. We set the target annual dividend for fiscal year 20232024 at $0.56$0.72 per Class A Share (representing a fixed quarterly dividend of $0.14$0.18 per Class A Share), subject to the approval of the Board each quarter on or prior to each quarterly distribution date and in compliance with Delaware law, and such dividends are paid following the end of each quarter.
We intend to increase our fixed dividend each year, in line with our expected growth in Distributable Earnings. When setting our dividend, our Board considers Blue Owl’s share of Distributable Earnings, and makes adjustments as necessary or appropriate to provide for the conduct of our business, to make appropriate investments in our business and products, including funding of GP commitments and potential strategic transactions; to provide for future cash requirements such as tax-related payments, operating reserves, fixed asset purchases, purchases under the Company'sCompany’s share repurchase program and dividends to stockholders for any ensuing quarter; or to comply with applicable law and the Company'sCompany’s contractual obligations. All of the foregoing is subject to the qualification that the declaration and payment of any dividends are at the sole discretion of our Board, and our Board may change our dividend policy at any time, including, without limitation, to reduce or eliminate dividends entirely.
The Blue Owl Operating Partnerships will make cash distributions (“Tax Distributions”) to the partners of such partnerships, including to Blue Owl GP, if we determine that the taxable income of the relevant partnership will give rise to taxable income for its partners. Generally, Tax Distributions will be computed based on our estimate of the taxable income of the relevant partnership allocable to a partner multiplied by an assumed tax rate equal to the highest effective marginal combined U.S. federal, New York State and New York City income tax rates prescribed for an individual or corporate resident in New York City (taking into account certain assumptions set forth in the relevant partnership agreements). Tax Distributions will be made only to the extent distributions from the Blue Owl Operating Partnerships for the relevant year were otherwise insufficient to cover the estimated assumed tax liabilities.
Holders of our Class A and B Shares may not always receive distributions or may receive lower distributions on a per share basis at a time when we, indirectly through Blue Owl GP, and holders of our Common Units are receiving distributions on their interests, as distributions to the Registrant and Blue Owl GP may be used to settle tax and TRA liabilities, if any, and other obligations.
Dividends are expected to be treated as qualified dividends under current law to the extent of the Company’s current and accumulated earnings and profits, with any excess dividends treated as a return of capital to the extent of a stockholder’s basis, and any remaining excess generally treated as gain realized on the sale or other disposition of stock.
Risks to our Liquidity
Our ability to obtain financing provides us with additional sources of liquidity. Any new financing arrangement that we may enter into may have covenants that impose additional limitations on us, including with respect to making distributions, entering into business transactions or other matters, and may result in increased interest expense. If we are unable to secure financing on terms that are favorable to us, our business may be adversely impacted. No assurance can be given that we will be able to issue new debt, enter into new credit facilities or issue equity or other securities in the future on attractive terms or at all.
Adverse market conditions, including from unexpectedly high and persistent inflation, an increasing interest rate environment, geopolitical events, and the current instability experienced by some financial institutions, may negatively impact our liquidity. Cash flows from management fees may be impacted by a slowdown or a decline in fundraising and deployment, as well as declines in the value of investments held in certain of our products. We hold the majority of our cash balances with a single highly rated financial institution and such balances are in excess of Federal Deposit Insurance Corporation insured limits. See “Item 1A. Risk Factors — Risks Related to Macroeconomic Factors” in our Annual Report and “Item 1A. Risk Factors — Difficult market and political conditions may reduce the value or hamper the performance of the investments made by our products or impair the ability of our products to raise or deploy capital” in this report.
LIBOR Transition
On March 5, 2021, the U.K. Financial Conduct Authority announced that it would phase out the London Interbank Offered Rate (“LIBOR”) as a benchmark immediately after December 31, 2021, for sterling, euro, Japanese yen, Swiss franc and 1-week and 2-month U.S. Dollar settings and immediately after June 30, 2023, the remaining U.S. Dollar settings. Our Notes are fixed rate borrowings, and therefore the LIBOR phase out will not have an impact on this borrowing. The Revolving Credit Facility is subject to the secured overnight financing rate (“SOFR”) at our option, or alternative rates that are not tied to LIBOR. Certain of our products hold investments and have borrowings that are tied to LIBOR, and we continue to focus on managing any risk related to those exposures. Our senior management has oversight of these transition efforts. See “Item 1A. Risk Factors—Risks Related to Our Legal and Regulatory Environment—Changes to the method of determining LIBOR or the selection of a replacement for LIBOR may affect the value of investments held by our products” in our Annual Report.
Cash Flows Analysis
| | Three Months Ended March 31, | |
| Three Months Ended March 31, | |
| (dollars in thousands) | |
| (dollars in thousands) | |
| (dollars in thousands) | (dollars in thousands) | 2023 | | 2022 | | $ Change | 2024 | | 2023 | | $ Change |
| Net cash provided by (used in): | Net cash provided by (used in): | | | | | |
| Operating activities | |
| Operating activities | |
| Operating activities | Operating activities | $ | 121,009 | | | $ | 93,204 | | | $ | 27,805 | |
| Investing activities | Investing activities | (34,360) | | | (22,607) | | | (11,753) | |
| Financing activities | Financing activities | (116,815) | | | 72,788 | | | (189,603) | |
| Net Change in Cash and Cash Equivalents | Net Change in Cash and Cash Equivalents | $ | (30,166) | | | $ | 143,385 | | | $ | (173,551) | |
Operating Activities. Our net cash flows from operating activities are generally comprised of management fees, less cash used for operating expenses, including interest paid on our debt obligations. One of our largest operating cash outflows generally relates to bonus expense, which are generally paid out during the first quarter of the year following the expense.
Net cash flows from operating activities increaseddecreased from the prior year period due to higher management fees, partially offset by operating expenses, in particular higher bonus payments made during the first quarter related to the prior year.year, partially offset by higher management fees.
Included in the three months ended March 31, 2024, were the cash outflows of the portion of the Second Oak Street Earnout classified as contingent consideration in excess of the acquisition-date fair value that settled in January 2024; the amount paid up to the acquisition-date fair value was included in financing activities and the remainder (i.e., accretion since the acquisition date) was included in operating activities.
Included in the three months ended March 31, 2023, were the cash outflows of the portion of the First Oak Street Earnout classified as contingent consideration in excess of the acquisition-date fair value that settled in January 2023; the amount paid up to the acquisition-date fair value was included in financing activities and the remainder (i.e., accretion since the acquisition date) was included in operating activities.
Investing Activities. Cash flows from investing activities for the three months ended March 31, 2024, were primarily related to purchases of investments in our products and cash outflows for office space-related leasehold improvements. In addition, investment activities included inflows from repayments on our interest-bearing revolving promissory note receivable from a product we manage.
Cash flows from investing activities for the three months ended March 31, 2023, were primarily related to purchases of investments in our products.
Financing Activities. Cash flows from investingfinancing activities for the three months ended March 31, 2022,2024, were primarily related to leasehold improvements associated with certain office spaces.borrowing and repayment activity under our Revolving Credit Facility,which borrowings were used to finance working capital needs and general capital purposes. In addition, we had distributions on our Common Units (noncontrolling interests) and dividends on our Class A Shares. Included in the three months ended March 31, 2024, was a portion of the cash outflows related to the Second Oak Street Earnout classified as contingent consideration that settled in January 2024, as discussed above, as well as amounts paid under the TRA.
Financing Activities.Cash flows from financing activities for the three months ended March 31, 2023, were primarily driven by dividends on our Class A Shares and related distributions on our Common Units (noncontrolling interests). In addition, we had borrowings and repayments under our Revolving Credit Facility, which borrowings were used to finance working capital needs and general capital purposes. Included in the three months ended March 31, 2023, were a portion of the cash outflows related to the First Oak Street Earnout classified as contingent consideration that settled in January 2023, as discussed above.2023.
Cash flows
Critical Accounting Estimates
We prepare our Financial Statements in accordance with U.S. GAAP. In applying many of these accounting principles, we make estimates that affect the reported amounts of assets, liabilities, revenues and expenses in the Financial Statements. We base our estimates on historical experience and other factors that we believe are reasonable under the circumstances. These estimates, however, are subjective and subject to change, and actual results may differ materially from financing activitiesour current estimates due to the inherent nature of these estimates, including geopolitical, macro-environmental and other uncertainty. For a summary of our significant accounting policies, see Note 2 to our Financial Statements and the financial statements in our Annual Report.
Estimation of Fair Values
Investments Held by our Products
The fair value of the investments held by our products in our Credit and Real Estate platforms is the primary input to the calculation for the three months ended March 31, 2022, were primarily drivenmajority of our management fees. Management fees from our GP Strategic Capital and other Real Estate products are generally based on commitments or investment cost, so our management fees are generally not impacted by dividendschanges in the estimated fair values of investments held by these products. However, to the extent that management fees are calculated based on our Class A Shares and related distributions on our Common Units (noncontrolling interests). Our cash flows from financing activities also benefited from a net increase to our debt as a resultinvestment cost of the proceedsproduct’s investments, the amount of fees that we may charge will increase or decrease from the effect of changes in the cost basis of the product’s investments, including potential impairment losses. In the absence of observable market prices, we use valuation methodologies applied on a consistent basis and assumptions that we believe market participants would use to determine the fair value of the investments. For investments where little market activity exists, the determination of fair value is based on the best information available, our 2032 Notes, which were used to finance working capital needsown assumptions, a significant degree of judgment, and general capital purposes, partially offset by repayments under our Revolving Credit Facility.the consideration of a combination of internal and external factors.
Our products generally value their investments at fair value, as determined in good faith by each product’s respective board of directors or valuation committee, as applicable, based on, among other things, the input of third party valuation firms and taking into account the nature and realizable value of any collateral, an investee’s ability to make payments and its earnings, the markets in which the investee operates, comparison to publicly traded companies, discounted cash flows, current market interest rates and other relevant factors. Because such valuations are inherently uncertain, the valuations may fluctuate significantly over time due to changes in market conditions. These valuations would, in turn, have corresponding proportionate impacts on the amount of management fees that we may earn from certain products on which revenues are based on the fair value of investments.
TRA Liability
We carry a portion of our TRA liability at fair value, as it is contingent consideration related to the Dyal Acquisition. The valuation of this portion of the TRA liability is mostly sensitive to our expectation of future cash savings that we may ultimately realize related to our tax goodwill and other intangible assets deductions. We then apply a discount rate that we believe is appropriate given the nature of and expected timing of payments of the liability. A decrease in the discount rate assumption would result in an increase in the fair value estimate of the liability, which would have a correspondingly negative impact on our GAAP results of operations. However, payments under the TRA are ultimately only made to the extent we realize the offsetting cash savings on our income taxes due to the tax goodwill and other intangibles deduction. See Note 4 to our Financial Statements for additional details.
Earnout Liability and Warrant Liability
The fair values of our earnout liability and warrant liability were determined using various significant unobservable inputs, including a discount rate and our best estimate of expected volatility and expected holding periods. Changes in the estimated fair values of these liabilities may have material impacts on our results of operations in any given period, as any increases in these liabilities have a corresponding negative impact on our GAAP results of operations. See Note 4 to our Financial Statements for additional details.
Equity-based Compensation
The grant-date fair values of our RSU and Incentive Unit (both defined in Note 1 to our Financial Statements) grants, as well as the Wellfleet Earnouts are generally determined using our Class A Share price on the grant date, adjusted for the lack of dividend participation during the vesting period, and the application of a discount for lack of marketability on RSUs and Incentive Units that are subject to post-vesting transfer restrictions. The higher these discounts, the lower the compensation expense taken over time for these grants.
For the Oak Street Earnout Units that were classified as equity-based compensation for GAAP, we determined the grant date fair value using Monte Carlo simulations that had various significant unobservable inputs. The assumptions used have a material impact on the valuation of these grants, and include our best estimate of expected volatility, expected holding periods and appropriate discounts for lack of marketability. The higher the expected volatility, the higher the compensation expense taken for these grants. The higher the expected holding periods and discount for lack of marketability, the lower the compensation expense taken for these grants. See Note 10 to our Financial Statements and Note 8 to the financial statements in our Annual Report for additional details.
Deferred Tax Assets
Substantially all of our deferred tax assets relate to goodwill and other intangible assets deductible for tax purposes, as well as payments expected to be made under the TRA. In accordance with relevant tax rules, we expect to take substantially all of these goodwill and other intangible deductions over a 15-year period following the applicable transaction. To the extent we generate insufficient taxable income to take the full deduction in any given year, we will generate a net operating loss (“NOL”) that is available for us to use over an indefinite carryforward period in order to fully realize the deferred tax assets.
When evaluating the realizability of deferred tax assets, all evidence—both positive and negative—is considered. This evidence includes, but is not limited to, expectations regarding future earnings, future reversals of existing temporary tax differences and tax planning strategies. We did not take into account any tax planning strategies when arriving at this conclusion; however, the other assumptions underlying the taxable income estimates are based on our near-term operating model. If we experience a significant decline in AUM for any extended time during the period for which these estimates relate and we do not otherwise experience offsetting growth rates in other periods, we may not generate taxable income sufficient to realize the deferred tax assets and may need to record a valuation allowance. However, given the indefinite carryforward period available for NOLs and the conservative estimates used to prepare the taxable income projections, the sensitivity of our estimates and assumptions are not likely to have a material impact on our conclusion that a valuation allowance is not needed.
Goodwill and Other Intangible Assets
Our ongoing accounting for goodwill and other intangible assets requires us to make significant estimates and assumptions when evaluating these assets for impairment. We generally undertake a qualitative review of factors that may indicate whether an impairment exists. We take into account factors such as the adverse impacts to FPAUM and management fees and general economic conditions that require judgement in deciding whether a quantitative analysis should be undertaken. Our evaluation for indicators of impairment may not capture a potential impairment, which could result in an overstatement of the carrying values of goodwill and other intangible assets. We also estimate the useful lives of our finite-lived intangible assets for purposes of amortization. The useful lives are based on our judgment of the expected future economic benefits of the assets. Changes in estimated useful lives could result in significant changes to the amount of amortization expense recognized in future periods.
Variable Interest Entities
The determination of whether to consolidate a variable interest entity (“VIE”) under GAAP requires a significant amount of judgment concerning the degree of control over an entity by its holders of variable interests. To make these judgments, we conduct an analysis, on a case-by-case basis, of whether we are the primary beneficiary and are therefore required to consolidate an entity. We continually reconsider whether we should consolidate a VIE. Upon the occurrence of certain events, such as modifications to organizational documents and investment management agreements of our products, we will reconsider our conclusion regarding the status of an entity as a VIE. Our judgement when analyzing the status of an entity and whether we consolidate an entity could have a material impact on individual line items within our Financial Statements, as a change in our conclusion would have the effect of grossing up the assets, liabilities, revenues and expenses of the entity being evaluated. In light of the relevantly insignificant direct and indirect investments into our products, the likelihood of a reasonable change in our estimation and judgement would likely not result in a change in our conclusions to consolidate or not consolidate any VIEs to which we have exposure.
Impact of Changes in Accounting on Recent and Future Trends
We believe that none of the changes to GAAP that went into effect during the three months ended March 31, 2024, or that have been issued but that we have not yet adopted, are expected to materially impact our future trends.
Item 3. Quantitative and Qualitative Disclosures About Market Risk.
Our primary exposure to market risk is the indirect impact that movements in the fair value of investments in products has on our management fees. In our Direct LendingCredit products, our management fees are generally based on the fair value of the gross assets held by such products, and therefore changes in the fair value of those assets impactsimpact the management fees we earn in any given period. These management fees will be increased (or reduced) in direct proportion to the effect of changes in the market value of our investments in the related funds. The proportion of our management fees that are based on fair value is dependent on the number and types of investment funds in existence and the current stage of each fund’s life cycle. Management fees from our GP Strategic Capital Solutions and Real Estate products, however, are generally based on capital commitments or investment cost, and therefore management fees are not materially impacted by changes in fair values of the underlying investments held by those products. To the extent that management fees are calculated based on investment cost of the product’s investments, the amount of fees that we may charge will increase or decrease from the effect of changes in the cost basis of the product’s investments, including potential impairment losses.
Interest Rate Risk
Our Notes bear interest at fixed rates. Borrowings under our Revolving Credit Facility bear interest at a variable rate based on SOFR (or an alternative base rate at our option). An increase or decrease in interest rates by 100 basis points is not expected to have a material impact on our interest expense.
We are also subject to interest rate risk through the investments we hold in our products. An increase in interest rates would be expected to negatively affect the fair value of investments that accrue interest income at fixed rates and therefore negatively impact net change in unrealized gains on investments of the relevant product. The actual impact is dependent on the average duration and the amount of such holdings. Conversely, investments that accrue interest at variable rates would be expected to benefit from an increase in interest rates because these investments would generate higher levels of current income. This would positively impact interest and dividend income but have an offsetting decrease in the fair value of the investments and negatively impact the net change in unrealized gains of the products. An increase in interest rates would also be expected to result in an increase in borrowing costs in any of our products that borrow funds based on floating rates. In the cases where our products pay management fees based on NAV or total assets (including assets purchased with leverage), we would expect our management fees (including Part I Fees) to experience a change in direction and magnitude corresponding to that experienced by the underlying product.
Credit Risk
We generally endeavor to minimize our risk of exposure by limiting to reputable financial institutions the counterparties with which we enter into financial transactions. As of March 31, 20232024 and December 31, 2022,2023, we held the majority of our cash balances with a single highly rated financial institution and such balances are in excess of Federal Deposit Insurance Corporation insured limits. We seek to mitigate this exposure by monitoring the credit standing of these financial institutions. See “Item 1A. Risk Factors — Risks Related to Macroeconomic Factors” in our Annual Report and “Item 1A. Risk Factors — Difficult market and political conditions may reduce the value or hamper the performance of the investments made by our products or impair the ability of our products to raise or deploy capital” in this report.Report.
Item 4. Controls and Procedures.
Evaluation of Disclosure Controls and Procedures
We maintain disclosure controls and procedures, as such term is defined in Rules 13a-15(e) and 15d-15(e) under the Exchange Act, that are designed to ensure that information required to be disclosed by us in reports that we file or submit under the Exchange Act is recorded, processed, summarized and reported within the time periods specified in SEC rules and forms, and that such information is accumulated and communicated to our management, including our principal executive officer and principal financial officer, as appropriate, to allow timely decisions regarding required disclosure. Any controls and procedures, no matter how well designed and operated, can provide only reasonable assurance of achieving the desired objectives.
Our management, with the participation of our principal executive officer and principal financial officer, has evaluated the effectiveness of the design and operation of our disclosure controls and procedures as of March 31, 2023.2024. Based upon that evaluation and subject to the foregoing, our principal executive officer and principal financial officer concluded that, as of March 31, 2023,2024, the design and operation of our disclosure controls and procedures were effective to accomplish their objectives at the reasonable assurance level.
Changes in Internal Control over Financial Reporting
There has been no change in our internal control over financial reporting (as such term is defined in Rules 13a-15(f) and 15d-15(f) under the Exchange Act) during the quarter ended March 31, 2023,2024, that has materially affected, or is reasonably likely to materially affect, our internal control over financial reporting.
PART II - OTHER INFORMATION
Item 1. Legal Proceedings.
We may from time to time be involved in litigation and claims incidental to the conduct of our business. Our business is also subject to extensive regulation, which may result in regulatory proceedings against us. See “Item“Item 1A. Risk Factors.”Factors” in our Annual Report. We are not currently subject to any pending legal (including judicial, regulatory, administrative or arbitration) proceedings that we expect to have a material impact on our Financial Statements. However, given the inherent unpredictability of these types of proceedings and the potentially large and/or indeterminate amounts that could be sought, an adverse outcome in certain matters could have a material effect on our financial results in any particular period. See Note 118 to our Financial Statements for additional information.
Item 1A. Risk Factors.
Some factors that could cause our actual results to differ materially from those results in this report are described as risks in our Annual Report. Any of these factors could materially and adversely affect our business, financial condition, results of operations and cash flows. As of the date of this report, there have been no material changes to the risk factors previously disclosed in theour Annual Report, other than as described below.Report. We may, however, disclose changes to such factors or disclose additional factors from time to time in our future filings with the SEC.
Difficult market and political conditions may reduce the value or hamper the performance of the investments made by our products or impair the ability of our products to raise or deploy capital.
Our business is affected by conditions and trends in the global financial markets and the global economic and political climate relating to, among other things, current high and rising interest rates, the availability and cost of credit, rising inflation rates, economic uncertainty, changes in laws (including laws relating to our taxation, taxation of our clients and the possibility of changes to regulations applicable to alternative asset managers), trade policies, commodity prices, tariffs, currency exchange rates and controls, political elections and administration transitions, and national and international political events (including hostilities between Russia and Ukraine, other forms of conflict, terrorist acts, and security operations) and catastrophic events such as fires, floods, earthquakes, tornadoes, hurricanes and global health pandemics. We may also be subject to risks arising from a default by one of several large financial institutions that are dependent on one another to meet their liquidity or operational needs, so that a default by one financial institution may cause a series of defaults by the other financial institutions. This is sometimes referred to as “systemic risk” and may adversely affect financial intermediaries with which we interact in the conduct of our business. These factors are outside of our control and may affect the level and volatility of credit and securities prices and the liquidity and value of fund investments, and we and our products may not be able to or may choose not to manage our exposure to these conditions. The extent and impact of sanctions imposed in connection with the war between Russia and Ukraine has caused and may continue to cause additional financial market volatility and impact the global economy as the situation continues to evolve.
During periods of difficult market conditions or slowdowns, which may be across one or more industries, sectors or geographies, our products’ portfolio companies may experience decreased revenues, financial losses, credit rating downgrades, difficulty in obtaining access to financing and increased funding costs. During such periods, those companies may also have difficulty in pursuing growth strategies, expanding their businesses and operations (including to the extent that they are Partner Managers, raising additional capital) and be unable to meet their debt service obligations or other expenses as they become due, including obligations and expenses payable to our funds. Negative financial results in our products’ portfolio companies may reduce the net asset value of our products, result in the impairment of assets and reduce the investment returns for our products, which could have a material adverse effect on our operating results and cash flow or ability to raise additional capital through new or successor products. In addition, such conditions would increase the risk of default with respect to credit-oriented or debt investments by our products. Our products may be adversely affected by reduced opportunities to exit and realize value from their investments, by lower than expected returns on investments made prior to the deterioration of the credit markets and by our inability to find suitable investments for our products to effectively deploy capital, which could adversely affect our ability to raise new funds and thus adversely impact our prospects for future growth.
Our cash and cash equivalents could be adversely affected if the financial institutions in which we hold our cash and cash equivalents fail.
We regularly maintain cash balances at third-party financial institutions in excess of the Federal Deposit Insurance Corporation insurance limit. If a depository institution fails to return these deposits or is otherwise subject to adverse conditions in the financial or credit markets, our access to invested cash or cash equivalents could be limited which adversely impact our results of operations or financial condition.
Item 2. Unregistered Sales of Equity Securities and Use of Proceeds.
None.
Item 3. Defaults Upon Senior Securities.
None.
Item 4. Mine Safety Disclosures.
None.
Item 5. Other Information.
None.Rule 10b5-1 Trading Plans
During the fiscal quarter ended March 31, 2024, none of our directors or executive officers adopted or terminated any contract, instruction or written plan for the purchase or sale of our securities to satisfy the affirmative defense conditions of Rule 10b5-1(c) or any “non-Rule 10b5-1 trading arrangement.”
Item 6. Exhibits
See Exhibit Index on the following page.
Exhibit Index
| | | | | | | | |
| Exhibit Number | | Description |
| | |
| | |
| | |
| | |
| | |
| | |
| | |
| | |
| | |
| | |
| | |
| | |
| | |
| | |
| | |
| | |
| | |
| | |
| | |
| | |
| | |
| | |
| | |
| | |
| | |
| | |
| | |
| | |
| | |
| | |
| | |
| | |
| | |
| | |
| | |
| | |
| | |
| | |
| | |
| | |
| | |
| | |
| | |
| | |
| | |
| | |
| | |
| | |
| | |
| | |
| | |
| | |
| | |
| | |
| | |
| | |
| | |
| | |
| | |
| | |
| | |
| | |
| | |
| | |
| | |
| | |
| | |
| | |
| | |
| | |
| | |
| | |
| | |
| | |
| | |
| | |
| | |
| | |
| | |
| | |
| | |
| | |
| | |
| | |
| | |
| | |
| | |
| | |
| | |
| | |
| | |
| | |
| | |
| | |
| | |
| | |
| | |
| | |
| | |
| | |
| | |
| | |
| | |
| | |
| | |
| | |
| | |
| | |
| | |
| | |
| | |
| | |
| | |
| | |
| | |
| | |
| | |
| | |
| | |
| | |
| 101* | | Interactive data files pursuant to Rule 405 of Regulation S-T, formatted in Inline XBRL (eXtensible Business Reporting Language): (i) the Consolidated and Combined Statements of Financial Condition as of March 31, 20232024 and December 31, 2022,2023, (ii) the Consolidated and Combined Statements of Operations for the three months ended March 31, 20232024 and 2022,2023 (iii) the Consolidated and Combined Statements of Changes in Stockholders’ Equity (Deficit) for the three months ended March 31, 20232024 and 2022,2023 (iv) the Consolidated and Combined Statements of Cash Flows for the three months ended March 31, 20232024 and 2022,2023, and (v) the Notes to the Consolidated and Combined Financial Statements |
| 104* | | Cover Page Interactive Data File (formatted as Inline XBRL and contained in Exhibit 101) |
| | |
| | |
| | |
| | |
| * | | Filed herewith |
| ** | | Furnished herewith. This certification is not deemed filed by the SEC and is not to be incorporated by reference in any filing we make under the Securities Act of 1933 or the Securities Exchange Act of 1934, irrespective of any general incorporation language in any filings |
| | |
| | |
SIGNATURES
Pursuant to the requirements of the Securities Exchange Act of 1934, the Registrant has duly caused this report to be signed on its behalf by the undersigned thereunto duly authorized.
| | | | | | | | | | | |
Date: May 4, 20233, 2024 | | Blue Owl Capital Inc. |
| | | |
| | By: | /s/ Alan Kirshenbaum |
| | | Alan Kirshenbaum |
| | | Chief Financial Officer |
| | | |
INDEX TO FINANCIAL STATEMENTS
| | | | | |
| Page |
| |
Consolidated and Combined Statements of Financial Condition as of March 31, 20232024 and December 31, 20222023 | |
Consolidated and Combined Statements of Operations for the three months ended March 31, 20232024 and 20222023 | |
Consolidated and Combined Statements of Changes in Stockholders’ Equity (Deficit) for the three months ended March 31, 20232024 and 20222023 | |
Consolidated and Combined Statements of Cash Flows for the three months ended March 31, 20232024 and 20222023 | |
Notes to Consolidated and Combined Financial Statements | |
Blue Owl Capital Inc.
Consolidated and Combined Statements of Financial Condition (Unaudited)
(Dollars in Thousands, Except Per Share Data)
| | | | | | | | | | | |
| | March 31,
2023 | | December 31,
2022 |
| Assets | | | |
| Cash and cash equivalents | $ | 37,913 | | | $ | 68,079 | |
| Due from related parties | 299,620 | | | 357,921 | |
| Investments (includes $47,826 and $16,922 at fair value and $344,896 and $315,304 of investments in the Company’s products, respectively) | 346,532 | | | 317,231 | |
| Operating lease assets | 240,184 | | | 224,411 | |
| Strategic Revenue-Share Purchase consideration, net | 448,170 | | | 457,939 | |
| Deferred tax assets | 745,755 | | | 757,234 | |
| Intangible assets, net | 2,334,531 | | | 2,405,422 | |
| Goodwill | 4,205,159 | | | 4,205,159 | |
| Other assets, net | 105,064 | | | 99,679 | |
| Total Assets | $ | 8,762,928 | | | $ | 8,893,075 | |
| Liabilities | | | |
| Debt obligations, net | $ | 1,765,530 | | | $ | 1,624,771 | |
| Accrued compensation | 144,802 | | | 309,644 | |
| Operating lease liabilities | 260,697 | | | 239,844 | |
| TRA liability (includes $122,951 and $120,587 at fair value, respectively) | 823,914 | | | 820,960 | |
| Warrant liability, at fair value | 10,500 | | | 8,550 | |
| Earnout liability, at fair value | 91,814 | | | 172,070 | |
| Deferred tax liabilities | 39,978 | | | 41,791 | |
| Accounts payable, accrued expenses and other liabilities | 156,355 | | | 126,559 | |
| Total Liabilities | 3,293,590 | | | 3,344,189 | |
| Commitments and Contingencies (Note 11) | | | |
| Stockholders’ Equity | | | |
| | | |
| | | |
| Class A Shares, par value $0.0001 per share, 2,500,000,000 authorized, 445,872,226 and 445,131,351 issued and outstanding, respectively | 45 | | | 45 | |
| | | |
| Class C Shares, par value $0.0001 per share, 1,500,000,000 authorized, 642,123,728 and 629,402,505 issued and outstanding, respectively | 64 | | | 63 | |
| Class D Shares, par value $0.0001 per share, 350,000,000 authorized, 319,132,127 and 319,132,127 issued and outstanding, respectively | 32 | | | 32 | |
| | | |
| Additional paid-in capital | 2,328,516 | | | 2,293,903 | |
| Accumulated deficit | (738,949) | | | (689,345) | |
| Total Stockholders’ Equity Attributable to Blue Owl Capital Inc. | 1,589,708 | | | 1,604,698 | |
| Stockholders’ equity attributable to noncontrolling interests | 3,879,630 | | | 3,944,188 | |
| Total Stockholders’ Equity | 5,469,338 | | | 5,548,886 | |
| Total Liabilities and Stockholders’ Equity | $ | 8,762,928 | | | $ | 8,893,075 | |
| | | | | | | | | | | |
| | March 31,
2024 | | December 31,
2023 |
| Assets | | | |
| Cash and cash equivalents | $ | 155,759 | | | $ | 104,160 | |
| Due from related parties | 383,951 | | | 367,136 | |
| Investments (includes $88,059 and $78,779 at fair value and $351,236 and $337,595 of investments in the Company’s products, respectively) | 357,774 | | | 344,265 | |
| Operating lease assets | 276,862 | | | 281,669 | |
| Strategic Revenue-Share Purchase consideration, net | 406,421 | | | 417,081 | |
| Deferred tax assets | 930,108 | | | 781,694 | |
| Intangible assets, net | 2,053,813 | | | 2,110,008 | |
| Goodwill | 4,224,153 | | | 4,224,153 | |
| Other assets, net | 196,636 | | | 187,455 | |
| Total Assets | $ | 8,985,477 | | | $ | 8,817,621 | |
| Liabilities | | | |
| Debt obligations, net | $ | 2,072,119 | | | $ | 1,681,241 | |
| Accrued compensation | 157,198 | | | 370,726 | |
| Operating lease liabilities | 334,586 | | | 319,532 | |
| TRA liability (includes $107,311 and $116,398 at fair value, respectively) | 1,017,379 | | | 879,509 | |
| Warrant liability, at fair value | 37,300 | | | 22,600 | |
| Earnout liability, at fair value | 10,619 | | | 92,909 | |
| Deferred tax liabilities | 33,174 | | | 34,419 | |
| Accounts payable, accrued expenses and other liabilities | 151,536 | | | 138,754 | |
| Total Liabilities | 3,813,911 | | | 3,539,690 | |
| Commitments and Contingencies (Note 8) | | | |
| Stockholders’ Equity | | | |
| | | |
| | | |
| Class A Shares, par value $0.0001 per share, 2,500,000,000 authorized, 500,879,131 and 464,425,386 issued and outstanding, respectively | 50 | | | 46 | |
| | | |
| Class C Shares, par value $0.0001 per share, 1,500,000,000 authorized, 611,908,856 and 632,486,822 issued and outstanding, respectively | 61 | | | 63 | |
| Class D Shares, par value $0.0001 per share, 350,000,000 authorized, 316,016,619 and 317,089,623 issued and outstanding, respectively | 32 | | | 32 | |
| | | |
| Additional paid-in capital | 2,568,949 | | | 2,410,982 | |
| Accumulated deficit | (922,988) | | | (882,884) | |
| Total Stockholders’ Equity Attributable to Blue Owl Capital Inc. | 1,646,104 | | | 1,528,239 | |
| Stockholders’ equity attributable to noncontrolling interests | 3,525,462 | | | 3,749,692 | |
| Total Stockholders’ Equity | 5,171,566 | | | 5,277,931 | |
| Total Liabilities and Stockholders’ Equity | $ | 8,985,477 | | | $ | 8,817,621 | |
The accompanying notes are an integral part of these consolidated and combined financial statements.
Blue Owl Capital Inc.
Consolidated and Combined Statements of Operations (Unaudited)
(Dollars in Thousands, Except Per Share Data)
| | | |
| | | | | Three Months Ended March 31, | | | Three Months Ended March 31, |
| | | | 2023 | | 2022 | |
| Revenues | Revenues | | | | | |
Management fees, net (includes Part I Fees of $85,864 and $46,739 respectively) | | $ | 358,825 | | | $ | 247,632 | | |
| Revenues | |
| Revenues | |
Management fees, net (includes Part I Fees of $120,161 and $85,864 respectively) | |
Management fees, net (includes Part I Fees of $120,161 and $85,864 respectively) | |
Management fees, net (includes Part I Fees of $120,161 and $85,864 respectively) | |
| Administrative, transaction and other fees | Administrative, transaction and other fees | | 31,655 | | | 28,345 | | |
| Realized performance income | | 506 | | | — | | |
| Administrative, transaction and other fees | |
| Administrative, transaction and other fees | |
| Performance revenues | |
| Performance revenues | |
| Performance revenues | |
| Total Revenues, Net | |
| Total Revenues, Net | |
| Total Revenues, Net | Total Revenues, Net | | 390,986 | | | 275,977 | | |
| Expenses | Expenses | | | | | |
| Expenses | |
| Expenses | |
| Compensation and benefits | |
| Compensation and benefits | |
| Compensation and benefits | Compensation and benefits | | 197,618 | | | 193,892 | | |
| Amortization of intangible assets | Amortization of intangible assets | | 70,891 | | | 61,526 | | |
| Amortization of intangible assets | |
| Amortization of intangible assets | |
| General, administrative and other expenses | |
| General, administrative and other expenses | |
| General, administrative and other expenses | General, administrative and other expenses | | 56,134 | | | 43,294 | | |
| Total Expenses | Total Expenses | | 324,643 | | | 298,712 | | |
| Total Expenses | |
| Total Expenses | |
| Other Loss | |
| Other Loss | |
| Other Loss | Other Loss | | | | | |
| Net gains on investments | Net gains on investments | | 612 | | | 5 | | |
| Net gains on investments | |
| Net gains on investments | |
| | Interest and dividend income | |
| | Interest and dividend income | |
| | Interest and dividend income | |
| Interest expense | |
| Interest expense | |
| Interest expense | |
| Change in TRA liability | |
| Change in TRA liability | |
| Change in TRA liability | |
| Change in warrant liability | |
| Change in warrant liability | |
| Change in warrant liability | |
| Change in earnout liability | |
| Change in earnout liability | |
| Change in earnout liability | |
| Total Other Loss | |
| Total Other Loss | |
| Total Other Loss | |
| Income Before Income Taxes | |
| Income Before Income Taxes | |
| Income Before Income Taxes | |
| Income tax expense | |
| Income tax expense | |
| Income tax expense | |
| Consolidated Net Income | |
| Consolidated Net Income | |
| Consolidated Net Income | |
| Net income attributable to noncontrolling interests | |
| Net income attributable to noncontrolling interests | |
| Net income attributable to noncontrolling interests | |
| Net Income Attributable to Blue Owl Capital Inc. | |
| Net Income Attributable to Blue Owl Capital Inc. | |
| Net Income Attributable to Blue Owl Capital Inc. | |
| | Interest expense, net | | (13,573) | | | (12,834) | | |
| Change in TRA liability | | (1,964) | | | (9,652) | | |
| Change in warrant liability | | (1,950) | | | 17,758 | | |
| Change in earnout liability | | (994) | | | (496) | | |
| Total Other Loss | | (17,869) | | | (5,219) | | |
| Income (Loss) Before Income Taxes | | 48,474 | | | (27,954) | | |
| Income tax expense (benefit) | | 6,440 | | | (5,038) | | |
| Consolidated and Combined Net Income (Loss) | | 42,034 | | | (22,916) | | |
| Net (income) loss attributable to noncontrolling interests | | (33,717) | | | 11,101 | | |
| Net Income (Loss) Attributable to Blue Owl Capital Inc. | | $ | 8,317 | | | $ | (11,815) | | |
| | | Earnings (Loss) per Class A Share | | | |
| Earnings per Class A Share | |
| | Earnings per Class A Share | |
| | Earnings per Class A Share | |
| Basic | |
| Basic | |
| Basic | Basic | | $ | 0.02 | | | $ | (0.03) | | |
| Diluted | Diluted | | $ | 0.02 | | | $ | (0.03) | | |
| Diluted | |
| Diluted | |
| Weighted-Average Class A Shares | |
| Weighted-Average Class A Shares | |
| Weighted-Average Class A Shares | Weighted-Average Class A Shares | | | | | |
Basic(1) | Basic(1) | | 456,189,118 | | 417,108,929 | |
Basic(1) | |
Basic(1) | |
| Diluted | Diluted | | 461,911,117 | | 417,108,929 | |
| Diluted | |
| Diluted | |
(1)Included in the weighted-average Class A Shares outstanding wereare RSUs that have vested but have not been settled in Class A Shares. These RSUs do not participate in dividends until settled in Class A Shares. See Note 13.12.
The accompanying notes are an integral part of these consolidated and combined financial statements.
| Blue Owl Capital Inc. | Consolidated and Combined Statements of Changes in Stockholders’ Equity (Deficit) | | Blue Owl Capital Inc. | |
| Blue Owl Capital Inc. | |
| Consolidated Statements of Changes in Stockholders’ Equity (Unaudited) | | Consolidated Statements of Changes in Stockholders’ Equity (Unaudited) |
| (Dollars in Thousands, Except Per Share Data) | (Dollars in Thousands, Except Per Share Data) | (Dollars in Thousands, Except Per Share Data) |
| | | | | Three Months Ended March 31, |
| | | 2023 | | 2022 | |
| | | | | Three Months Ended March 31, |
| | | | | 2024 | |
| | Class A Shares Par Value | |
| | Class A Shares Par Value | |
| | Class A Shares Par Value | Class A Shares Par Value | | | | | |
| Beginning balance | Beginning balance | | $ | 45 | | | $ | 40 | | |
| Beginning balance | |
| Beginning balance | |
| | Shares delivered on vested RSUs | |
| | | Shares delivered on vested RSUs | |
| | Shares delivered on vested RSUs | |
| | Class C Shares and Common Units exchanged for Class A Shares | Class C Shares and Common Units exchanged for Class A Shares | | — | | | 1 | | |
| | Class C Shares and Common Units exchanged for Class A Shares | |
| | Class C Shares and Common Units exchanged for Class A Shares | |
| | Ending Balance | |
| | Ending Balance | |
| | Ending Balance | Ending Balance | | $ | 45 | | | $ | 41 | | |
| | | Class C Shares Par Value | Class C Shares Par Value | | | |
| | Class C Shares Par Value | |
| | Class C Shares Par Value | |
| Beginning balance | |
| Beginning balance | |
| Beginning balance | Beginning balance | | $ | 63 | | | $ | 67 | | |
| | Settlement of Oak Street Earnout Units | | 1 | | | — | | |
| Settlement of Earnout Securities | |
| | Settlement of Earnout Securities | |
| | Settlement of Earnout Securities | |
| | Class C Shares and Common Units exchanged for Class A Shares | |
| | Class C Shares and Common Units exchanged for Class A Shares | |
| | Class C Shares and Common Units exchanged for Class A Shares | |
| | Ending Balance | |
| | Ending Balance | |
| | Ending Balance | Ending Balance | | $ | 64 | | | $ | 67 | | |
| | Class D Shares Par Value | Class D Shares Par Value | | | |
| | Class D Shares Par Value | |
| | Class D Shares Par Value | |
| Beginning balance | Beginning balance | | $ | 32 | | | $ | 32 | | |
| Beginning balance | |
| Beginning balance | |
| | Ending Balance | |
| | Ending Balance | |
| | Ending Balance | Ending Balance | | $ | 32 | | | $ | 32 | | |
| | | Additional Paid-in Capital | Additional Paid-in Capital | | | |
| | Additional Paid-in Capital | |
| | Additional Paid-in Capital | |
| Beginning balance | |
| Beginning balance | |
| Beginning balance | Beginning balance | | $ | 2,293,903 | | | $ | 2,160,934 | | |
| | Deferred taxes on capital transactions | Deferred taxes on capital transactions | | (8,053) | | | 9,639 | | |
| | Deferred taxes on capital transactions | |
| | Deferred taxes on capital transactions | |
| TRA liability on capital transactions | TRA liability on capital transactions | | (988) | | | (14,868) | | |
| Exercise of warrants | | — | | | 2 | | |
| TRA liability on capital transactions | |
| TRA liability on capital transactions | |
| | Equity-based compensation | |
| | Equity-based compensation | |
| | Equity-based compensation | Equity-based compensation | | 4,508 | | | 2,781 | | |
| | Withholding taxes on vested RSUs | Withholding taxes on vested RSUs | | (1,395) | | | (214) | | |
| Class A Share repurchases | | — | | | (24,238) | | |
| | Withholding taxes on vested RSUs | |
| | Withholding taxes on vested RSUs | |
| | Reallocation between additional paid-in capital and noncontrolling interests due to changes in Blue Owl Operating Group ownership | Reallocation between additional paid-in capital and noncontrolling interests due to changes in Blue Owl Operating Group ownership | | 40,541 | | | 32,196 | | |
| | Reallocation between additional paid-in capital and noncontrolling interests due to changes in Blue Owl Operating Group ownership | |
| | Reallocation between additional paid-in capital and noncontrolling interests due to changes in Blue Owl Operating Group ownership | |
| Ending Balance | |
| Ending Balance | |
| Ending Balance | Ending Balance | | $ | 2,328,516 | | | $ | 2,166,232 | | |
| | Accumulated Deficit | Accumulated Deficit | | | |
| | Accumulated Deficit | |
| | Accumulated Deficit | |
| Beginning balance | |
| Beginning balance | |
| Beginning balance | Beginning balance | | $ | (689,345) | | | $ | (497,506) | | |
| Cash dividends declared on Class A Shares | Cash dividends declared on Class A Shares | | (57,921) | | | (40,505) | | |
| Comprehensive income (loss) | | 8,317 | | | (11,815) | | |
| Cash dividends declared on Class A Shares | |
| Cash dividends declared on Class A Shares | |
| Comprehensive income | |
| Comprehensive income | |
| Comprehensive income | |
| Ending Balance | Ending Balance | | $ | (738,949) | | | $ | (549,826) | | |
| Total Stockholders' Equity Attributable to Blue Owl Capital Inc. | | $ | 1,589,708 | | | $ | 1,616,546 | | |
| Ending Balance | |
| Ending Balance | |
| Total Stockholders’ Equity Attributable to Blue Owl Capital Inc. | |
| Total Stockholders’ Equity Attributable to Blue Owl Capital Inc. | |
| Total Stockholders’ Equity Attributable to Blue Owl Capital Inc. | |
| | Stockholders’ Equity Attributable to Noncontrolling Interests | Stockholders’ Equity Attributable to Noncontrolling Interests | | | |
| | Stockholders’ Equity Attributable to Noncontrolling Interests | |
| | Stockholders’ Equity Attributable to Noncontrolling Interests | |
| Beginning balance | |
| Beginning balance | |
| Beginning balance | Beginning balance | | $ | 3,944,188 | | | $ | 4,184,003 | | |
| | Equity-based compensation | Equity-based compensation | | 64,805 | | | 84,018 | | |
| | | Equity-based compensation | |
| | Equity-based compensation | |
| | Contributions | |
| | Contributions | |
| | Contributions | Contributions | | 9,825 | | | 5,131 | | |
| Distributions | Distributions | | (129,358) | | | (101,038) | | |
| Distributions | |
| Distributions | |
| Withholding taxes on vested RSUs | |
| Withholding taxes on vested RSUs | |
| Withholding taxes on vested RSUs | Withholding taxes on vested RSUs | | (3,006) | | | (519) | | |
| Reallocation between additional paid-in capital and noncontrolling interests due to changes in Blue Owl Operating Group ownership | Reallocation between additional paid-in capital and noncontrolling interests due to changes in Blue Owl Operating Group ownership | | (40,541) | | | (32,196) | | |
| Comprehensive income (loss) | | 33,717 | | | (11,101) | | |
| Reallocation between additional paid-in capital and noncontrolling interests due to changes in Blue Owl Operating Group ownership | |
| Reallocation between additional paid-in capital and noncontrolling interests due to changes in Blue Owl Operating Group ownership | |
| Comprehensive income | |
| Comprehensive income | |
| Comprehensive income | |
| Ending Balance | Ending Balance | | $ | 3,879,630 | | | $ | 4,128,298 | | |
| Total Stockholders' Equity | | $ | 5,469,338 | | | $ | 5,744,844 | | |
| Ending Balance | |
| Ending Balance | |
| Total Stockholders’ Equity | |
| Total Stockholders’ Equity | |
| Total Stockholders’ Equity | |
| | Cash Dividends Paid per Class A Share | Cash Dividends Paid per Class A Share | | $ | 0.13 | | | $ | 0.10 | | |
| | Cash Dividends Paid per Class A Share | |
| | Cash Dividends Paid per Class A Share | |
| Blue Owl Capital Inc. | Consolidated and Combined Statements of Changes in Stockholders’ Equity (Deficit) | | Blue Owl Capital Inc. | |
| Blue Owl Capital Inc. | |
| Consolidated Statements of Changes in Stockholders’ Equity (Unaudited) | | Consolidated Statements of Changes in Stockholders’ Equity (Unaudited) |
| (Dollars in Thousands, Except Per Share Data) | (Dollars in Thousands, Except Per Share Data) | (Dollars in Thousands, Except Per Share Data) |
| | | | | Three Months Ended March 31, |
| | | 2023 | | 2022 | |
| | | | Three Months Ended March 31, |
| | | | | 2024 | |
| Number of Class A Shares | Number of Class A Shares | | | |
| Number of Class A Shares | |
| Number of Class A Shares | |
| Beginning balance | |
| Beginning balance | |
| Beginning balance | Beginning balance | | 445,131,351 | | | 404,919,411 | | |
| | Class A Share repurchases | | — | | | (2,000,000) | | |
| | Shares delivered on vested RSUs | |
| | Shares delivered on vested RSUs | |
| | Shares delivered on vested RSUs | Shares delivered on vested RSUs | | 424,933 | | | 101,122 | | |
| | Class C Shares and Common Units exchanged for Class A Shares | Class C Shares and Common Units exchanged for Class A Shares | | 315,942 | | | 4,619,175 | | |
| Exercise of warrants | | — | | | 200 | | |
| | Class C Shares and Common Units exchanged for Class A Shares | |
| | Class C Shares and Common Units exchanged for Class A Shares | |
| Class D Shares exchanged for Class A Shares | |
| Class D Shares exchanged for Class A Shares | |
| Class D Shares exchanged for Class A Shares | |
| | Ending Balance | |
| | Ending Balance | |
| | Ending Balance | Ending Balance | | 445,872,226 | | | 407,639,908 | | |
| | | Number of Class C Shares | Number of Class C Shares | | | |
| | Number of Class C Shares | |
| | Number of Class C Shares | |
| Beginning balance | |
| Beginning balance | |
| Beginning balance | Beginning balance | | 629,402,505 | | | 674,766,200 | | |
| | Class C Shares and Common Units exchanged for Class A Shares | Class C Shares and Common Units exchanged for Class A Shares | | (315,942) | | | (4,619,175) | | |
| | | Class C Shares and Common Units exchanged for Class A Shares | |
| | Class C Shares and Common Units exchanged for Class A Shares | |
| | Shares delivered on vested Common Units | |
| | Shares delivered on vested Common Units | |
| | Shares delivered on vested Common Units | |
| | Settlement of Oak Street Earnout Units | Settlement of Oak Street Earnout Units | | 13,037,165 | | | — | | |
| | Settlement of Oak Street Earnout Units | |
| | Settlement of Oak Street Earnout Units | |
| Ending Balance | |
| Ending Balance | |
| Ending Balance | Ending Balance | | 642,123,728 | | | 670,147,025 | | |
| | Number of Class D Shares | Number of Class D Shares | | | |
| | Number of Class D Shares | |
| | Number of Class D Shares | |
| Beginning balance | Beginning balance | | 319,132,127 | | | 319,132,127 | | |
| Beginning balance | |
| Beginning balance | |
| Class D Shares exchanged for Class A Shares | |
| Class D Shares exchanged for Class A Shares | |
| Class D Shares exchanged for Class A Shares | |
| | Ending Balance | |
| | Ending Balance | |
| | Ending Balance | Ending Balance | | 319,132,127 | | | 319,132,127 | | |
| |
The accompanying notes are an integral part of these consolidated and combined financial statements.
Blue Owl Capital Inc.
Consolidated and Combined Statements of Cash Flows (Unaudited)
(Dollars in Thousands)
| | | | | | | | | | | | | |
| | Three Months Ended March 31, |
| | 2023 | | 2022 | | |
| Cash Flows from Operating Activities | | | | | |
| Consolidated and combined net income (loss) | $ | 42,034 | | | $ | (22,916) | | | |
| Adjustments to reconcile consolidated and combined net income (loss) to net cash from operating activities: | | | | | |
| Amortization of intangible assets | 70,891 | | | 61,526 | | | |
| Equity-based compensation | 73,275 | | | 96,601 | | | |
| Depreciation and amortization of fixed assets | 1,922 | | | 218 | | | |
| Amortization of debt discounts and deferred financing costs | 1,117 | | | 1,022 | | | |
| Amortization of investment discounts and premiums | — | | | 6 | | | |
| Non-cash lease expense | 5,081 | | | 1,444 | | | |
| Payment of earnout liability in excess of acquisition-date fair value | (7,188) | | | — | | | |
| | | | | |
| Net gains on investments, net of dividends | (612) | | | (5) | | | |
| Change in TRA liability | 1,964 | | | 9,652 | | | |
| Change in warrant liability | 1,950 | | | (17,758) | | | |
| Change in earnout liability | 994 | | | 496 | | | |
| Deferred income taxes | 1,619 | | | (7,860) | | | |
| Changes in operating assets and liabilities: | | | | | |
| Due from related parties | 58,301 | | | 12,994 | | | |
| Strategic Revenue-Share Purchase consideration | 9,769 | | | 8,922 | | | |
| Other assets, net | (1,102) | | | 4,099 | | | |
| Accrued compensation | (168,804) | | | (72,843) | | | |
| Accounts payable, accrued expenses and other liabilities | 29,798 | | | 17,606 | | | |
| Net Cash Provided by Operating Activities | 121,009 | | | 93,204 | | | |
| | | | | |
| Cash Flows from Investing Activities | | | | | |
| Purchases of fixed assets | (5,672) | | | (18,379) | | | |
| Purchases of investments | (37,686) | | | (5,750) | | | |
| Proceeds from investment sales and maturities | 8,998 | | | 1,522 | | | |
| | | | | |
| Net Cash Used in Investing Activities | (34,360) | | | (22,607) | | | |
| | | | | |
| Cash Flows from Financing Activities | | | | | |
| | | | | |
| | | | | |
| | | | | |
| | | | | |
| Proceeds from debt obligations | 355,000 | | | 395,060 | | | |
| Debt issuance costs | — | | | (4,854) | | | |
| Repayments of debt obligations, including retirement costs | (215,000) | | | (153,000) | | | |
| | | | | |
| Payment of earnout liability up to acquisition-date fair value | (74,062) | | | — | | | |
| Withholding taxes on vested RSUs | (4,401) | | | (733) | | | |
| Dividends paid on Class A Shares | (57,921) | | | (40,505) | | | |
| Proceeds from exercise of warrants | — | | | 2 | | | |
| Class A Share repurchases | — | | | (24,238) | | | |
| | | | | |
| Contributions from noncontrolling interests | 8,927 | | | 2,094 | | | |
| Distributions to noncontrolling interests | (129,358) | | | (101,038) | | | |
| Net Cash (Used in) Provided by Financing Activities | (116,815) | | | 72,788 | | | |
| Net Increase (Decrease) in Cash and Cash Equivalents | (30,166) | | | 143,385 | | | |
| Cash and cash equivalents, beginning of period | 68,079 | | | 42,567 | | | |
| Cash and Cash Equivalents, End of Period | $ | 37,913 | | | $ | 185,952 | | | |
| Supplemental Information | | | | | |
| Cash paid for interest | $ | 11,254 | | | $ | 215 | | | |
| Cash paid for income taxes | $ | 1,828 | | | $ | 113 | | | |
| | | | | | | | | | | | | |
| | Three Months Ended March 31, |
| | 2024 | | 2023 | | |
| Cash Flows from Operating Activities | | | | | |
| Consolidated net income | $ | 112,013 | | | $ | 42,034 | | | |
| Adjustments to reconcile consolidated net income to net cash from operating activities: | | | | | |
| Amortization of intangible assets | 56,195 | | | 70,891 | | | |
| Equity-based compensation | 65,713 | | | 73,275 | | | |
| Depreciation and amortization of fixed assets | 2,809 | | | 1,922 | | | |
| Amortization of debt discounts and deferred financing costs | 1,326 | | | 1,117 | | | |
| | | | | |
| Non-cash lease expense | 19,861 | | | 5,081 | | | |
| Payment of earnout liability in excess of acquisition-date fair value | (13,137) | | | (7,188) | | | |
| | | | | |
| Net gains on investments, net of dividends on equity-method investments | (818) | | | (612) | | | |
| Change in TRA liability | (1,019) | | | 1,964 | | | |
| Change in warrant liability | 14,700 | | | 1,950 | | | |
| Change in earnout liability | 585 | | | 994 | | | |
| Deferred income taxes | 9,130 | | | 1,619 | | | |
| Changes in operating assets and liabilities: | | | | | |
| Due from related parties | (16,815) | | | 58,301 | | | |
| Strategic Revenue-Share Purchase consideration | 10,660 | | | 9,769 | | | |
| Other assets, net | (634) | | | (1,102) | | | |
| Accrued compensation | (210,786) | | | (168,804) | | | |
| | | | | |
| Accounts payable, accrued expenses and other liabilities | (2,536) | | | 29,798 | | | |
| Net Cash Provided by Operating Activities | 47,247 | | | 121,009 | | | |
| | | | | |
| Cash Flows from Investing Activities | | | | | |
| Purchases of fixed assets | (6,141) | | | (5,672) | | | |
| Purchases of investments | (12,940) | | | (37,686) | | | |
| Proceeds from investment sales and maturities | 3,750 | | | 8,998 | | | |
| | | | | |
| Net Cash Used in Investing Activities | (15,331) | | | (34,360) | | | |
| | | | | |
|
|
|
| | | | | |
| |
| | | | | |
| Cash Flows from Financing Activities | | | | | |
| | | | | |
| | | | | |
| | | | | |
| | | | | |
| Proceeds from debt obligations | 720,000 | | | 355,000 | | | |
| Debt issuance costs | 66 | | | — | | | |
| Repayments of debt obligations, including retirement costs | (330,000) | | | (215,000) | | | |
| | | | | |
| Payment of earnout liability, up to acquisition-date fair value | (69,738) | | | (74,062) | | | |
| Payments under the TRA | (28,166) | | | — | | | |
| Withholding taxes on vested RSUs | (17,435) | | | (4,401) | | | |
| Dividends paid on Class A Shares | (65,195) | | | (57,921) | | | |
| | | | | |
| | | | | |
| | | | | |
| Contributions from noncontrolling interests | 14,535 | | | 8,927 | | | |
| Distributions to noncontrolling interests | (204,384) | | | (129,358) | | | |
| Net Cash Provided by (Used in) Financing Activities | 19,683 | | | (116,815) | | | |
| Net Increase (Decrease) in Cash and Cash Equivalents | 51,599 | | | (30,166) | | | |
| Cash and cash equivalents, beginning of period | 104,160 | | | 68,079 | | | |
| Cash and Cash Equivalents, End of Period | $ | 155,759 | | | $ | 37,913 | | | |
| Supplemental Information | | | | | |
| Cash paid for interest | $ | 11,018 | | | $ | 11,254 | | | |
| Cash paid for income taxes | $ | 5,077 | | | $ | 1,828 | | | |
The accompanying notes are an integral part of these consolidated and combined financial statements.
Blue Owl Capital Inc.
Notes to Consolidated and Combined Financial Statements (Unaudited)
(Unaudited)March 31, 2024
1. ORGANIZATION
Blue Owl Capital Inc. (the “Registrant”), a Delaware corporation, together with its consolidated subsidiaries (collectively, the “Company” or “Blue Owl”), is a global alternative asset manager. Anchored by a strong permanent capitalPermanent Capital base, the Company deploys private capital across Direct Lending,Credit, GP Strategic Capital Solutions and Real Estate strategiesplatforms on behalf of institutional and private wealth clients.
The Company’s primary sources of revenues are management fees, which are generally based on the amount of the Company’s fee-paying assets under management. The Company generates substantially all of its revenues in the United States. The Company operates through one operating and reportable segment. This single reportable segment reflects how the chief operating decision makers allocate resources and assess performance under the Company’s “one-firm approach,” which includes operating collaboratively across product lines, with predominantly a single expense pool.
The Company conducts its operations through Blue Owl Capital Holdings LP (“Blue Owl Holdings”) and Blue Owl Capital Carry LP (“Blue Owl Carry”). Blue Owl Holdings and Blue Owl Carry are referred to, collectively, as the “Blue Owl Operating Partnerships,” and collectively with their consolidated subsidiaries, as the “Blue Owl Operating Group.” The Registrant holds its controlling financial interests in the Blue Owl Operating Group indirectly through Blue Owl Capital GP Holdings LLC and Blue Owl Capital GP LLC (collectively, “Blue Owl GP”), which are directly or indirectly wholly owned subsidiaries of the Registrant.
Business Combination, Including Dyal Acquisition
The Registrant was initially incorporated in the Cayman Islands as Altimar Acquisition Corporation (“Altimar”), a special purpose acquisition company. Pursuant to the Business Combination Agreement dated December 23, 2020, as amended, modified, supplemented or waived from time to time (the “Business Combination Agreement”), on May 19, 2021 (“Business Combination Date”), (i) Altimar was redomiciled as a Delaware corporation and changed its name to Blue Owl Capital Inc., (ii) Altimar merged with the combined businesses of Blue Owl Capital Group LLC (formerly, Owl Rock (as defined below)Capital Group LLC) and Blue Owl Securities LLC (formerly, Owl Rock Securities LLC) (“Owl Rock”) (the “Altimar Merger”) and (iii) the Company acquired Dyal Capital Partners (“Dyal Capital”), a former division of Neuberger Berman Group LLC (the “Dyal Acquisition”) (collectively with the Altimar Merger, the “Business Combination”). As further discussed in Note 2, for both the Altimar Merger and the Dyal Acquisition, Owl Rock was deemed to be the acquirer for accounting purposes. Therefore, the predecessor to Blue Owl is “Owl Rock,” a combined carve-out of Owl Rock Capital Group LLC and Blue Owl Securities LLC (formerly, Owl Rock Capital Securities LLC) (“Securities”).
Oak Street Acquisition
On December 29, 2021, the Company completed its acquisition of Blue Owl Real Estate Capital, LLC (f/k/a Oak Street Real Estate Capital, LLC, (“Oak“Oak Street”) and its advisory business (the “Oak Street Acquisition”).
Wellfleet Acquisition
On April 1, 2022, the Company completed its acquisition of Blue Owl Liquid Credit Partners (f/k/a Wellfleet Credit Partners, LLC, (“Wellfleet”“Wellfleet”), a manager of collateralized loan obligations (“CLOs”) (the “Wellfleet Acquisition”).
Par Four Acquisition”
On August 15, 2023, the Company acquired the rights to certain CLO management agreements, related assets and collectively with the Oak Street Acquisition and the Dyal Acquisition, the “Acquisitions”personnel from Par Four CLO Management LLC (“Par Four”) (the “Par Four Acquisition”).
Blue Owl Capital Inc.
Notes to Consolidated and Combined Financial Statements (Unaudited)
(Unaudited)March 31, 2024
CHI Acquisition
On December 1, 2023, the Company acquired the rights to investment management agreements, investor relationships, related assets and personnel from Cowen Healthcare Investments (“CHI”) (the “CHI Acquisition,” and collectively with the Dyal Acquisition, Oak Street Acquisition, Wellfleet Acquisition, and Par Four Acquisition, the “Acquisitions”).
Registrant’s Capital Structure
The following table presents the number of shares of the Registrant, RSUs and warrants that were outstanding as of March 31, 2023:2024:
| | | | | | | | |
| | March 31, 20232024 |
| Class A Shares | | 445,872,226500,879,131 | |
| | |
| Class C Shares | | 642,123,728611,908,856 | |
| Class D Shares | | 319,132,127316,016,619 | |
| RSUs | | 25,497,22829,107,582 | |
| Private Placement Warrants | | 5,000,000 | |
Class A Shares—Shares of Class A common stock that are publicly traded. Class A Stockholders are entitled to dividends declared on the Class A Shares by the Registrant’s board of directors (the “Board”). As of March 31, 2023,2024, the Class A Shares and Class C Shares (collectively, the “Low-Vote Shares”) represent a combined 20% of the total voting power of all shares. Prior to April 2022, the Low-Vote Shares represented 10% of the total voting power of all shares.
Class B Shares—Shares of Class B common stock that are not publicly traded. Class B Stockholders are entitled to dividends in the same amount per share as declared on Class A Shares. As of March 31, 2023,2024, the Class B Shares and Class D Shares (collectively, the “High-Vote Shares”) represent a combined 80% of the total voting power of all shares. Prior to April 2022, the High-Vote Shares represented 90% of the total voting power of all shares. No Class B Shares have been issued from inception through March 31, 2023. Common Units (as defined below) held by certain senior members of management (“Principals”) are exchangeable on a one-for-one basis for Class B Shares.
Class C Shares—Shares of Class C common stock that are not publicly traded. Class C Stockholders do not participate in the earnings of the Registrant, as the holders of such shares participate in the economics of the Blue Owl Operating Group through their direct and indirect holdings of Common Units and Incentive Units (as defined below and subject to limitations on unvested units). For every Common Unit held directly or indirectly by non-Principals, one Class C Share is issued to grant a corresponding voting interest in the Registrant. The Class C Shares are Low-Vote Shares as described above.
Class D Shares—Shares of Class D common stock that are not publicly traded. Class D Stockholders do not participate in the earnings of the Registrant, as the holders of such shares participate in the economics of the Blue Owl Operating Group through their direct or indirect holdings of Common Units and Incentive Units (subject to limitations on unvested units). For every Common Unit held directly and indirectly by Principals, one Class D Share is issued to grant a corresponding voting interest in the Registrant. The Class D Shares are High-Vote Shares as described above.
RSUs—The Company grants Class A restricted share units (“RSUs”) to its employees and independent Board members. An RSU entitles the holder to receive a Class A Share, or cash equal to the fair value of a Class A Share at the election of the Board, upon completion of a requisite service period. RSUs granted to-dateto date do not accrue dividend equivalents. No RSUs were issued prior to the Business Combination. RSU grants are accounted for as equity-based compensation. See Note 810 and the Company’s Annual Report for additional information.
Warrants—In connection with the Business Combination, the Company issued warrants to purchase Class A Shares at aan original price of $11.50 per share.share (currently, $11.29 due to certain dividend adjustments). A portion of the outstanding warrants are held by the sponsor of Altimar (“Private Placement Warrants”) and the remaining warrants were held by other third-party investors (“Public Warrants”). The Private Placement Warrants will expire five years from the Business Combination Date. In August 2022, the Company redeemed all outstanding Public Warrants, as further discussed below.
Blue Owl Capital Inc.
Notes to Consolidated and Combined Financial Statements (Unaudited)
(Unaudited)March 31, 2024
Blue Owl Operating Partnerships’ Capital Structure
The following table presents the interests outstanding of the Blue Owl Operating Group that were outstanding as of March 31, 2023,2024, which interests are collectively referred to as “Blue Owl Operating Group Units”:
| | | | | | | | |
| Units | | March 31, 20232024 |
| GP Units | | 445,872,226500,879,131 | |
| Common Units | | 961,255,855927,925,475 | |
| Incentive Units | | 32,167,36634,665,699 | |
GP Units—The Registrant indirectly holds a general partner interest and all of the GP Units in each of the Blue Owl Operating Partnerships. The GP Units are general partner interests in the Blue Owl Operating Partnerships that represent the Registrant’s economic ownership in the Blue Owl Operating Group. For each Class A Share and Class B Share outstanding, the Registrant indirectly holds an equal number of GP Units. References to GP Units refer collectively to a GP Unit in each of the Blue Owl Operating Partnerships. References to GP Units also include Common Units (as defined below) acquired and held directly or indirectly by the Registrant as a result of Common Units exchanged for Class A Shares.
Common Units—Common Units are limited partner interests held by certain members of management, employees and other third parties in the Blue Owl Operating Partnerships. Subject to certain restrictions, Common Units are exchangeable on a one-for-one basis for either Class A Shares (if held by a non-Principal) or Class B Shares (if held by a Principal). Common Unit exchanges may be settled in cash at the election of the Company’s Exchange Committee (currently composed of independent members of the Board), and only if funded from proceeds of a new permanent equity offering. Common Units held by Principals are exchangeable after the two-year anniversary of the Business Combination Date. References to Common Units refer collectively to a Common Unit in each of the Blue Owl Operating Partnerships, but excludes any Common Units held directly or indirectly by the Registrant. Upon an exchange of Common Units for an equal number of Class A Shares or Class B Shares, a corresponding number of Class C Shares or Class D Shares, respectively, will be cancelled. Common Unitholders are entitled to distributions in the same amount per unit as declared on GP Units.
Incentive Units—Incentive Units are Class P limited partner interests in the Blue Owl Operating Partnerships granted to certain members of management, employees and consultants (collectively, “Incentive Unit Grantees”) and are generally subject to vesting conditions, as further discussed in Note 8.10 to the Financial Statements and Note 8 to the financial statements in our Annual Report. Incentive Units are held indirectly through Blue Owl Management Vehicle LP on behalf of Incentive Unit Grantees. A vested Incentive Unit may convert into a Common Unit upon becoming economically equivalent on a tax basis to a Common Unit. Once vested, Incentive Unitholders are entitled to distributions in the same amount per unit as declared on GP Units and Common Units. Unvested Incentive Unitholders generally are not entitled to distributions; however, consistent with other Blue Owl Operating Group Units (other than Oak Street Earnout Units), unvested Incentive Units receive taxable income allocations that may subject holders to tax liabilities. As a result, Incentive Unitholders (consistent with other Blue Owl Operating Group Units other than Oak Street Earnout Units) may receive tax distributions on unvested units to cover a portion or all of such tax liabilities.
Share Repurchases and RSUs Withheld for Tax Withholding and Warrants Redeemed
The following table presents share repurchase activity and RSUs withheld to satisfy tax withholding obligations during each of the indicated periods:
| | | | | | | | | | | | | | | | | |
| | | Three Months Ended March 31, |
| | | | | 2023 | | 2022 | | |
| | | | | | | | | |
| Number of shares purchased pursuant to the Programs | | | | | — | | | 2,000,000 | | | |
| | | | | | | | | |
| Number of RSUs withheld to satisfy tax withholding obligations | | | | | 319,306 | | | 56,981 | | | |
| | | | | | | | | |
Blue Owl Capital Inc.
Notes to Consolidated and Combined Financial Statements
(Unaudited)
On May 4, 2022, the Company’s Board authorized the repurchase of up to $150.0 million of Class A Shares. Under the repurchase program (the “Program”), repurchases may be made from time to time in open market transactions, in privately negotiated transactions or otherwise. The timing and the actual numbers repurchased will depend on a variety of factors, including legal requirements, price and economic and market conditions. The Program may be changed, suspended or discontinued at any time and will terminate upon the earlier of (i) the purchase of all shares available under the Program or (ii) December 31, 2024. TheThere were no repurchases made under the Program replaced the previously authorized program (collectively, the “Programs”) under which the Company repurchased 2,000,000 shares during the first quarter of 2022.three months ended March 31, 2024 and 2023.
Pursuant to the terms of the Company’s RSU awards, upon the vesting of RSUs to employees, the Company net settles awards to satisfy employee tax withholding obligations. In such instances, the Company cancels a number of RSUs equivalent in value to the amount of tax withholding payments that the Company is making on behalf of employees out of available cash.
Blue Owl Capital Inc.
Notes to Consolidated Financial Statements (Unaudited)
March 31, 2024
The following table presents RSUs withheld to satisfy tax withholding obligations during each of the 9,159,048 Public Warrants that were outstanding on July 18, 2022, 14,553 were exercised for cash at an exercise price of $11.50 per Class A Share in exchange for an aggregate of 14,553 Class A Shares and 8,961,029 Public Warrants were exercised on a cashless basis in exchange for an aggregate of 2,141,601 Class A Shares. The remaining 183,466 Public Warrants were redeemed for $0.10 per warrant. Total cash proceeds generated from exercises of the Public Warrants during the three months ended September 30, 2022 were $0.2 million.indicated periods:
| | | | | | | | | | | | | | | | | |
| Three Months Ended
March 31, | | |
| 2024 | | 2023 | | | | | | |
| | | | | | | | | |
| | | | | | | | | |
| | | | | | | | | |
| Number of RSUs withheld to satisfy tax withholding obligations | 969,149 | | | 319,306 | | | | | | | |
| | | | | | | | | |
Acquisitions-Related Earnouts
| | | | | | | | |
Units | | March 31, 2023 |
Oak Street Earnout Units | | 13,037,165 | |
Wellfleet Earnout Shares | | 940,668 | |
In connection with the Oak Street Acquisition, the Company agreed to make additional payments of cash (“Oak Street Cash Earnout”) and Common Units (“Oak Street Earnout Units” and collectively with the Oak Street Cash Earnout, the “Oak Street Earnouts”) in two tranches upon the occurrence of certain “Oak Street Triggering Events.” The Oak Street Triggering Events are based on achieving a certain level of quarterly management fee revenues from existing and future Oak Streetthe Company’s Real Estate products. In January 2023, the Oak Street Triggering Event occurred with respect to the First Oak Street Earnout. In January 2024, the Oak Street Triggering Event occurred with respect to the Second Oak Street Earnout. See Note 3 to the financial statements in the Company’s Annual Report for additional information.
In connection with the Wellfleet Acquisition, the Company agreed to make additional payments of cash (“Wellfleet Earnout Cash”) and Class A Shares (“Wellfleet Earnout Shares” and collectively with the Wellfleet Earnout Cash, the “Wellfleet Earnouts”) to the sellers in three tranches at each anniversary following the closing of the transaction for three years, contingent upon the continued employment of certain Wellfleet employees (“Wellfleet Triggering Events”). In April 2023, the Company modified the Wellfleet Earnout Shares arrangement, such that the settlement of the Wellfleet Earnout Shares would be in cash at each payment date, including the settlement of the First Wellfleet Earnouts during the second quarter of 2023. In April 2024, the Wellfleet Triggering Event occurred with respect to the FirstSecond Wellfleet Earnout. See Note 3 to the financial statements in the Company’s Annual Report for additional information.
Common Unit Exchanges
From time to time, the Company exchanges Common Units and Class C Shares for an equal number of Class A Shares. As a result of these exchanges, the Company reallocates equity from noncontrolling interests to the Company’s additional paid-in capital and records additional deferred tax assets and TRA liability in connection with the exchanges. See the consolidated and combined statement of stockholders’ equity for these amounts.
Blue Owl Capital Inc.
Notes to Consolidated and Combined Financial Statements
(Unaudited)
2. SUMMARY OF SIGNIFICANT ACCOUNTING POLICIES
Basis of Presentation
These unaudited, interim, consolidated and combined financial statements (“Financial Statements”) are prepared in accordance with U.S. generally accepted accounting principles (“GAAP”) as set forth in the Financial Accounting Standards Board’s (“FASB”) Accounting Standards Codification (“ASC”). All intercompany transactions and balances have been eliminated in consolidation and combination. The notes are an integral part of the Company’s Financial Statements. In the opinion of management, all adjustments necessary for a fair presentation of the Company’s Financial Statements have been included and are of a normal and recurring nature. The Company’s comprehensive income (loss) is comprised solely of consolidated and combined net income (loss) (i.e., the Company has no other comprehensive income). These interim Financial Statements should be read in conjunction with the annual report for the year ended December 31, 2022,2023, filed with the SEC on Form 10-K (“Annual Report”).
Prior to the Business Combination, Blue Owl’s financial statements were prepared on a consolidated and combined basis. As part of the Business Combination, Securities was contributed to the Blue Owl Operating Group. Following the Business Combination, the financial statements are prepared on a consolidated basis.
Blue Owl Capital Inc.
Notes to Consolidated Financial Statements (Unaudited)
March 31, 2024
The merger between Owl Rock and Altimar was accounted for as a reverse asset acquisition, with no step-up to fair value on any assets or liabilities, and therefore no goodwill or other intangible assets were recorded. The Acquisitions were accounted for using the acquisition method of accounting. As a result, the Company recorded the fair value of the net assets acquired as of the closing date of each respective acquisition, and operating results for each acquired business are included starting as of such each respective date.
For details about Blue Owl’s significant accounting policies and accounting updates adopted in the prior year, see Note 2 to the financial statements in the Company’s Annual Report. During the three months ended March 31, 2023,2024, there were no material updates to Blue Owl’s significant accounting policies.
Use of Estimates
The preparation of financial statements in conformity with GAAP requires management to make assumptions and estimates that affect the amounts reported in the Financial Statements. The most critical of these estimates are related to (i) the fair value of the investments held by the products the Company manages, as for many products, this impacts the amount of revenues the Company recognizes each period; (ii) the fair value of equity-based compensation grants; (iii) the fair values of liabilities with respect to the TRA (the portion considered contingent consideration), warrants and earnout liabilities; (iv) the estimate of future taxable income, which impacts the realizability and carrying amount of the Company’s deferred income tax assets; and (v) the qualitative and quantitative assessments of whether impairments of acquired intangible assets and goodwill exist. Inherent in such estimates and judgements relating to future cash flows, which include the Company’s interpretation of current economic indicators and market valuations, andare assumptions about the Company’s strategic plans with regard to its operations. While management believes that the estimates utilized in preparing the Financial Statements are reasonable and prudent, actual results could differ materially from those estimates.
Blue Owl Capital Inc.
Notes to Consolidated Financial Statements (Unaudited)
March 31, 2024
New Accounting Pronouncements
The Company considers the applicability and impact of all ASUs issued by the FASB. None of the ASUs that have been issued but not yet adopted arelisted below were not applicable, not expected to have a material impact on the Company’s Financial Statements.
Blue Owl Capital Inc.
Notes to Consolidated and Combined Financial Statements
(Unaudited)
3. INTANGIBLE ASSETS, NET
The following table summarizes when adopted or did not have a significant impact on the Company’s intangible assets, net:Financial Statements upon adoption.
| | | | | | | | | | | | | | | | | | | | | | | | | | | | | |
| (dollars in thousands) | March 31,
2023 | | December 31,
2022 | | Useful Life
(in years) | | Remaining Weighted-Average Amortization Period as of March 31, 2023 |
| Intangible assets, gross: | | | | | | | | | |
| Investment management agreements | $ | 2,222,320 | | | $ | 2,222,320 | | | 0.1 | - | 20.0 | | 12.4 years |
| Investor relationships | 459,500 | | | 459,500 | | | 5.8 | - | 13.0 | | 9.4 years |
Trademarks(1) | 94,400 | | | 94,400 | | | 0.3 | - | 0.3 | | 0.3 years |
| Total intangible assets, gross | 2,776,220 | | | 2,776,220 | | | | | | | |
| | | | | | | | | |
| Accumulated amortization: | | | | | | | | | |
| Investment management agreements | (335,866) | | | (290,816) | | | | | | | |
| Investor relationships | (71,224) | | | (60,630) | | | | | | | |
| Trademarks | (34,599) | | | (19,352) | | | | | | | |
| Total accumulated amortization | (441,689) | | | (370,798) | | | | | | | |
| Total Intangible Assets, Net | $ | 2,334,531 | | | $ | 2,405,422 | | | | | | | |
| | | | | | | | | | | |
| Standard | Description | Effective Date and
Method of Adoption | Impact on Financial Statements |
| ASU 2023-07 - Segment Reporting (Topic 280): Improvements to Reportable Segment Disclosures | The guidance requires incremental disclosures related to a public entity’s reportable segment disclosure requirements. The amendments are as follows: •Introduce a new requirement to disclose significant segment expenses regularly provided to the chief operating decision maker (“CODM”). •Extend certain annual disclosures to interim periods. •Clarify single reportable segment entities must apply ASC 280 in its entirety. •Require disclosure of the title and position of the CODM and an explanation of how the CODM uses the reported measure(s) of segment profit or loss in assessing segment performance and deciding how to allocate resources. •Permit more than one measure of segment profit or loss to be reported under certain conditions. The guidance does not change the definition of a segment, the method for determining segments, or the criteria for aggregating operating segments into reportable segments. | Effective for fiscal years beginning after December 15, 2023, and interim periods within fiscal years beginning after December 15, 2024.
A public entity should apply the amendments in this update retrospectively to all prior periods presented in the financial statements.
The Company plans to adopt the ASU beginning with the 2024 Form 10-K. | The Company is currently evaluating the impact of the required disclosures for entities with a single reportable segment, as well as the nature of other new quantitative and qualitative disclosures in the ASU. |
| ASU 2023-09—Income Taxes (Topic 740): Improvements to Income Tax Disclosures | The ASU enhances income tax disclosures for public business entities by requiring entities to disclose: •A tabular rate reconciliation using both percentages and amounts, broken out into specific categories with certain reconciling items at or above 5% of the statutory (i.e. expected) tax further broken out by nature and/or jurisdiction. •Income taxes paid (net of refunds received), broken out between federal (national), state/local and foreign, and amounts paid to individual jurisdictions when 5% or more of the total income taxes are paid. The ASU also includes other amendments, such as replacing the term ‘public entity’ with ‘public business entity’ and the removal of certain disclosures. | For public business entities, the amendments in this update are effective for annual periods beginning after December 15, 2024. Early adoption is permitted for annual financial statements that have not yet been issued or made available for issuance. The amendments in this update should be applied on a prospective basis. Retrospective application is permitted.
The Company plans to adopt the ASU beginning with the 2025 Form 10-K. | The guidance will result in enhanced disclosures that will improve the transparency of income tax disclosures by requiring consistent categories and greater disaggregation of information in the rate reconciliation, as well as income taxes paid disaggregated by jurisdiction. |
(1) As a result of certain corporate actions taken during the first quarter of 2023, the estimated useful lives of acquired trademarks has been updated. The remaining unamortized balances are being expensed through June 30, 2023.
The following table presents expected future amortization of finite-lived intangible assets as of March 31, 2023:
| | | | | | | | |
| (dollars in thousands) | | |
| Period | | Amortization |
| April 1, 2023 to December 31, 2023 | | $ | 228,830 | |
| 2024 | | 223,942 | |
| 2025 | | 219,739 | |
| 2026 | | 205,907 | |
| 2027 | | 191,731 | |
| Thereafter | | 1,264,382 | |
| Total | | $ | 2,334,531 | |
Pro Forma Financial Information
Unaudited pro forma revenues and unaudited pro forma net income (loss) allocated to Class A Stockholders were $251.6 million and $(12.0) million, respectively, for the three months ended March 31, 2022. This proforma financial information was computed by combining the historical financial information of the Company, including as if the Wellfleet Acquisition was consummated on January 1, 2021. These pro forma amounts assume a consistent ownership structure, annual effective tax rates and amortization of the fair value of acquired assets as of each respective acquisition date. The proforma information does not reflect the potential benefits of cost and funding synergies, opportunities to earn additional revenues, or other factors, and therefore does not represent what the actual revenues and net income (loss) would have been had the businesses actually been combined as of the dates above.
Blue Owl Capital Inc.
Notes to Consolidated and Combined Financial Statements (Unaudited)
(Unaudited)March 31, 2024
4. DEBT OBLIGATIONS,3. INTANGIBLE ASSETS, NET
Intangible Assets, Net
The following tables summarize outstanding debt obligations of the Company:
| | | | | | | | | | | | | | | | | | | | | | | | | | | | | | | |
| | March 31, 2023 |
| (dollars in thousands) | Maturity Date | | Aggregate Facility Size | | Outstanding Debt | | Amount Available | | Net Carrying Value | | |
| 2031 Notes | 6/10/2031 | | $ | 700,000 | | | $ | 700,000 | | | $ | — | | | $ | 685,896 | | | |
| 2032 Notes | 2/15/2032 | | 400,000 | | | 400,000 | | | — | | | 392,049 | | | |
| 2051 Notes | 10/7/2051 | | 350,000 | | | 350,000 | | | — | | | 337,585 | | | |
| Revolving Credit Facility | 6/15/2027 | | 1,115,000 | | | 350,000 | | | 758,638 | | | 350,000 | | | |
| Total | | | $ | 2,565,000 | | | $ | 1,800,000 | | | $ | 758,638 | | | $ | 1,765,530 | | | |
| | | | | | | | | | | | | | | | | | | | | | | | | | | | | | | |
| | December 31, 2022 |
| (dollars in thousands) | Maturity Date | | Aggregate Facility Size | | Outstanding Debt | | Amount Available | | Net Carrying Value | | |
| 2031 Notes | 6/10/2031 | | $ | 700,000 | | | $ | 700,000 | | | $ | — | | | $ | 685,474 | | | |
| 2032 Notes | 2/15/2032 | | $ | 400,000 | | | $ | 400,000 | | | $ | — | | | $ | 391,819 | | | |
| 2051 Notes | 10/7/2051 | | 350,000 | | | 350,000 | | | — | | | 337,478 | | | |
| Revolving Credit Facility | 6/15/2027 | | 1,115,000 | | | 210,000 | | | 899,876 | | | 210,000 | | | |
| Total | | | $ | 2,565,000 | | | $ | 1,660,000 | | | $ | 899,876 | | | $ | 1,624,771 | | | |
Amounts available fortable summarizes the Company’s Revolving Credit Facility presented in the tables above are reduced by outstanding lettersintangible assets, net:
| | | | | | | | | | | | | | | | | |
| (dollars in thousands) | March 31,
2024 | | December 31,
2023 | | Remaining Weighted-Average Amortization Period as of March 31, 2024 |
| Intangible assets, gross: | | | | | |
| Investment management agreements | $ | 2,224,420 | | | $ | 2,224,420 | | | 11.5 years |
| Investor relationships | 460,300 | | | 460,300 | | | 8.4 years |
| Total intangible assets, gross | 2,684,720 | | | 2,684,720 | | | |
| | | | | |
| Accumulated amortization: | | | | | |
| Investment management agreements | (516,548) | | | (471,104) | | | |
| Investor relationships | (114,359) | | | (103,608) | | | |
| Total accumulated amortization | (630,907) | | | (574,712) | | | |
| Total Intangible Assets, Net | $ | 2,053,813 | | | $ | 2,110,008 | | | |
The following table presents expected future amortization of credit related to certain leases.finite-lived intangible assets as of March 31, 2024:
For a description of terms for the instruments above as well as related financial covenants, see Note 4 to the financial statements in the Company’s Annual Report. | | | | | | | | |
| (dollars in thousands) | | |
| Period | | Amortization |
| April 1, 2024 to December 31, 2024 | | $ | 169,819 | |
| 2025 | | 221,252 | |
| 2026 | | 207,408 | |
| 2027 | | 193,109 | |
| 2028 | | 189,458 | |
| Thereafter | | 1,072,767 | |
| Total | | $ | 2,053,813 | |
5. LEASES4. INVESTMENTS AND FAIR VALUE DISCLOSURES
The Company primarily has non-cancelable operating leases for its headquarters in New York and various other offices. The operating lease forfollowing table presents the Company’s headquarters does not include any renewal options; however, certaincomponents of the Company’s other leases contain renewal and early termination options that the Company has determined are not reasonably certain of being exercised.investments:
| | | | | | | | | | | | | | | | | | |
| (dollars in thousands) | | | | Three Months Ended March 31, |
| Lease Cost | | | | | | 2023 | | 2022 |
| | | | | | | | |
| Operating lease cost | | | | | | $ | 8,171 | | | $ | 3,451 | |
| Short term lease cost | | | | | | 62 | | | 315 | |
| | | | | | | | |
| | | | | | | | |
| Net Lease Cost | | | | | | $ | 8,233 | | | $ | 3,766 | |
| | | | | | | | | | | | | | | | | | |
| (dollars in thousands) | | | | Three Months Ended March 31, |
| Supplemental Lease Cash Flow Information | | | | | | 2023 | | 2022 |
| | | | | | | | |
| Cash paid for amounts included in the measurement of lease liabilities: | | | | | | | | |
| Operating cash flows for operating leases | | | | | | $ | 3,152 | | | $ | 2,007 | |
| | | | | | | | |
| | | | | | | | |
| | | | | | | | |
| Right-of-use assets obtained in exchange for lease obligations: | | | | | | | | |
| Operating leases | | | | | | $ | 35,933 | | | $ | 2,983 | |
| | | | | | | | |
| | | | | | | | | | | |
| (dollars in thousands) | March 31,
2024 | | December 31,
2023 |
| Loans, at amortized cost (includes $207,500 and $207,500 of investments in the Company’s products, respectively) | $ | 214,038 | | | $ | 214,170 | |
| Equity investments in the Company’s products, equity method | 55,677 | | | 51,316 | |
Equity investments in the Company’s products, at fair value | 85,682 | | | 76,258 | |
| Investments in the Company’s CLOs, at fair value | 2,377 | | | 2,521 | |
| | | |
| Total | $ | 357,774 | | | $ | 344,265 | |
Blue Owl Capital Inc.
Notes to Consolidated and Combined Financial Statements (Unaudited)
(Unaudited)
| | | | | | | | | | | | | | | | |
| Lease Term and Discount Rate | | March 31, 2023 | | December 31, 2022 | | |
| Weighted-average remaining lease term: | | | | | | |
| Operating leases | | 13.0 years | | 13.0 years | | |
| | | | | | |
| | | | | | |
| Weighted-average discount rate: | | | | | | |
| Operating leases | | 4.8 | % | | 4.0 | % | | |
| | | | | | |
| | | | | | | | | | |
| (dollars in thousands) | | | | |
| Future Maturity of Operating Lease Payments | | Operating Leases | | |
| April 1, 2023 to December 31, 2023 | | $ | 9,846 | | | |
| 2024 | | 2,730 | | | |
| 2025 | | 28,153 | | | |
| 2026 | | 30,551 | | | |
| 2027 | | 30,741 | | | |
| Thereafter | | 273,695 | | | |
| Total Lease Payments | | 375,716 | | | |
| Imputed interest | | (115,019) | | | |
| Total Lease Liabilities | | $ | 260,697 | | | |
Amounts presented in the table above are presented net of tenant improvement allowances and reflect the impacts of rent holiday periods.
The Company has future operating lease payments of approximately $85.4 million related to leases that have not commenced that were entered into as of March 31, 2023. Such lease payments are not included in the table above or the Company’s consolidated and combined statements of financial condition as operating lease assets and operating lease liabilities. These operating lease payments are anticipated to commence in 2024 and continue for approximately 14 years.
Blue Owl Capital Inc.
Notes to Consolidated and Combined Financial Statements
(Unaudited)
6. REVENUES
The following table presents a disaggregated view of the Company’s revenues:
| | | | | | | | | | | | | | | | | |
| | | Three Months Ended March 31, |
| (dollars in thousands) | | | | | 2023 | | 2022 | | |
| Direct Lending Products | | | | | | | | | |
| Diversified lending | | | | | $ | 146,095 | | | $ | 105,452 | | | |
| Technology lending | | | | | 47,690 | | | 23,030 | | | |
| First lien lending | | | | | 4,485 | | | 3,681 | | | |
| Opportunistic lending | | | | | 2,400 | | | 1,541 | | | |
| CLOs | | | | | 7,518 | | | — | | | |
| Management Fees, Net | | | | | 208,188 | | | 133,704 | | | |
| Administrative, transaction and other fees | | | | | 20,091 | | | 25,222 | | | |
| | | | | | | | | |
| Total GAAP Revenues - Direct Lending Products | | | | | 228,279 | | | 158,926 | | | |
| | | | | | | | | |
| GP Capital Solutions Products | | | | | | | | | |
| GP minority equity investments | | | | | 130,296 | | | 102,100 | | | |
| GP debt financing | | | | | 3,751 | | | 3,092 | | | |
| Professional sports minority investments | | | | | 402 | | | 500 | | | |
| Strategic Revenue-Share Purchase consideration amortization | | | | | (9,769) | | | (8,922) | | | |
| Management Fees, Net | | | | | 124,680 | | | 96,770 | | | |
| Administrative, transaction and other fees | | | | | 8,405 | | | 3,123 | | | |
| Total GAAP Revenues - GP Capital Solutions Products | | | | | 133,085 | | | 99,893 | | | |
| | | | | | | | | |
| Real Estate Products | | | | | | | | | |
| Net lease | | | | | 25,957 | | | 17,158 | | | |
| Management Fees, Net | | | | | 25,957 | | | 17,158 | | | |
| Administrative, transaction and other fees | | | | | 3,159 | | | — | | | |
| Realized performance income | | | | | 506 | | | — | | | |
| Total GAAP Revenues - Real Estate Products | | | | | 29,622 | | | 17,158 | | | |
| Total GAAP Revenues | | | | | $ | 390,986 | | | $ | 275,977 | | | |
Blue Owl Capital Inc.
Notes to Consolidated and Combined Financial Statements
(Unaudited)
The table below presents the beginning and ending balances of the Company’s management fees, realized performance income and administrative, transaction and other fees receivable and unearned management fees. Substantially all of the amounts receivable are collected during the following quarter. A liability for unearned management fees is generally recognized when management fees are paid to the Company in advance. The entire change in unearned management fees shown below relates to amounts recognized as revenues in the current year period. Management fees, realized performance income and administrative, transaction and other fees receivable are included within due from related parties and unearned management fees are included within accounts payable, accrued expenses and other liabilities in the Company’s consolidated and combined statements of financial condition.
| | | | | | | | | | | |
| Three Months Ended March 31, |
| (dollars in thousands) | 2023 | | 2022 |
| Management Fees Receivable | | | |
| Beginning balance | $ | 262,059 | | | $ | 168,057 | |
| Ending balance | $ | 213,969 | | | $ | 174,397 | |
| | | |
| Administrative, Transaction and Other Fees Receivable | | | |
| Beginning balance | $ | 44,060 | | | $ | 19,535 | |
| Ending balance | $ | 32,331 | | | $ | 13,183 | |
| | | |
| Realized Performance Income Receivable | | | |
| Beginning balance | $ | 1,132 | | | $ | 10,496 | |
| Ending balance | $ | 320 | | | $ | — | |
| | | |
| Unearned Management Fees | | | |
| Beginning balance | $ | 9,389 | | | $ | 10,299 | |
| Ending balance | $ | 12,764 | | | $ | 9,804 | |
The table below presents the changes in the Company’s Strategic Revenue-Share Purchase consideration. The consideration paid in 2021, which includes $455.0 million paid in Class A Shares and $50.2 million in cash, is being amortized as a reduction of management fees, net in the Company’s consolidated and combined statements of operations over a weighted-average period of 12 years, which represents the average period over which the related customer revenues are expected to be recognized.
| | | | | | | | | | | |
| Three Months Ended March 31, |
| (dollars in thousands) | 2023 | | 2022 |
| Beginning Balance | $ | 457,939 | | | $ | 495,322 | |
| | | |
| Amortization | (9,769) | | | (8,922) | |
| Ending Balance | $ | 448,170 | | | $ | 486,400 | |
Blue Owl Capital Inc.
Notes to Consolidated and Combined Financial Statements
(Unaudited)
7. OTHER ASSETS, NET
| | | | | | | | | | | |
| (dollars in thousands) | March 31,
2023 | | December 31, 2022 |
| Fixed assets, net: | | | |
| Leasehold improvements | $ | 66,433 | | | $ | 61,741 | |
| Furniture and fixtures | 11,163 | | | 10,922 | |
| Computer hardware and software | 3,909 | | | 3,171 | |
| Accumulated depreciation and amortization | (6,568) | | | (4,644) | |
| Fixed assets, net | 74,937 | | | 71,190 | |
| Receivables | 13,754 | | | 11,935 | |
| Prepaid expenses | 7,514 | | | 6,099 | |
| Unamortized debt issuance costs on revolving credit facilities | 5,970 | | | 6,328 | |
| Other assets | 2,889 | | | 4,127 | |
| Total | $ | 105,064 | | | $ | 99,679 | |
8. EQUITY-BASED COMPENSATION
The Company grants equity-based compensation awards in the form of RSUs and Incentive Units to its management, employees, consultants and independent members of the Board under the 2021 Omnibus Equity Incentive Plan, as amended (“2021 Equity Incentive Plan”). The total number of Class A Shares and Blue Owl Operating Group Units, collectively, that may be issued under the 2021 Equity Incentive Plan is 101,230,522, of which 34,769,386 remain available as of March 31, 2023. To the extent that an award expires or is canceled, forfeited, terminated, surrendered, exchanged or withheld to cover tax withholding obligations, the unissued awards will again be available for grant under the 2021 Equity Incentive Plan.
The table below presents information regarding equity-based compensation expense.
| | | | | | | | | | | | | | | | | |
| | | Three Months Ended March 31, |
| (dollars in thousands) | | | | | 2023 | | 2022 | | |
| Acquisition related | | | | | | | | | |
| | | | | | | | | |
| | | | | | | | | |
| Oak Street Earnout Units | | | | | 19,868 | | | 60,654 | | | |
| Wellfleet Earnout Shares | | | | | 811 | | | — | | | |
| Total acquisition related | | | | | 20,679 | | | 60,654 | | | |
| Incentive Units | | | | | 39,474 | | | 27,162 | | | |
| RSUs | | | | | 13,122 | | | 8,785 | | | |
| Equity-Based Compensation Expense | | | | | $ | 73,275 | | | $ | 96,601 | | | |
| Corresponding tax benefit | | | | | $ | 242 | | | $ | 152 | | | |
| | | | | | | | | |
| Fair value of RSUs settled in Class A Shares | | | | | $ | 5,856 | | | $ | 1,300 | | | |
| Fair value of RSUs withheld to satisfy tax withholding obligations | | | | | $ | 4,400 | | | $ | 733 | | | |
Blue Owl Capital Inc.
Notes to Consolidated and Combined Financial Statements
(Unaudited)
9. INVESTMENTS AND FAIR VALUE DISCLOSURES
The following table presents the components of the Company’s investments:
| | | | | | | | | | | |
| (dollars in thousands) | March 31,
2023 | | December 31, 2022 |
| Loans, at amortized cost (includes $254,500 and $252,225 of investments in the Company’s products, respectively) | $ | 256,135 | | | $ | 254,152 | |
| Equity investments in the Company's products, equity method | 42,571 | | | 46,157 | |
Equity investments in the Company's products, at fair value | 45,148 | | | 14,079 | |
| Investments in the Company's CLOs, at fair value | 2,678 | | | 2,843 | |
| | | |
| Total | $ | 346,532 | | | $ | 317,231 | |
Fair Value Measurements Categorized within the Fair Value Hierarchy
Fair value represents the price that would be received upon the sale of an asset or paid to transfer a liability in an orderly transaction between market participants as of the measurement date (i.e., an exit price). The Company and the products it manages hold a variety of assets and liabilities, certain of which are not publicly traded or that are otherwise illiquid. Significant judgement and estimation go into the assumptions that drive the fair value of these assets and liabilities. The fair value of these assets and liabilities may be estimated using a combination of observed transaction prices, prices from third parties (including independent pricing services and relevant broker quotes), models or other valuation methodologies based on pricing inputs that are neither directly nor indirectly market observable. Due to the inherent uncertainty of valuations of assets and liabilities that are determined to be illiquid or do not have readily ascertainable fair values, the estimates of fair value may differ from the values ultimately realized, and those differences can be material.
GAAP prioritizes the level of market price observability used in measuring assets and liabilities at fair value. Market price observability is impacted by a number of factors, including the type of assets and liabilities and the specific characteristics of the financial assets and liabilities. Financial assets and liabilities with readily available, actively quoted prices or for which fair value can be measured from actively quoted prices generally will have a higher degree of market price observability and lesser degree of judgment used in measuring fair value.
Financial assets and liabilities measured at fair value are classified and disclosed into one of the following categories based on the observability of inputs used in the determination of fair values:
•Level I – Quoted prices that are available in active markets for identical financial assets or liabilities as of the reporting date.
•Level II – Valuations obtained from independent third-party pricing services, the use of models or other valuation methodologies based on pricing inputs that are either directly or indirectly market observable as of the measurement date. These financial assets and liabilities exhibit higher levels of liquid market observability as compared to Level III financial assets and liabilities.
•Level III – Pricing inputs that are unobservable in the market and includes situations where there is little, if any, market activity for the financial asset or liability. The inputs into the determination of fair value of financial assets and liabilities in this category may require significant management judgment or estimation. The fair value of these financial assets and liabilities may be estimated using a combination of observed transaction prices, independent pricing services, models or other valuation methodologies based on pricing inputs that are neither directly nor indirectly market observable (e.g., cash flows, implied yields).
In certain cases, the inputs used to measure fair value may fall into different levels of the fair value hierarchy. In such cases, a financial asset or liability’s level within the fair value hierarchy is based on the lowest level of input that is significant to the fair value measurement. The assessment of the significance of a particular input to the fair value measurement in its entirety requires judgment and considers factors specific to the financial asset or liability when the fair value is based on unobservable inputs.
Blue Owl Capital Inc.
Notes to Consolidated and Combined Financial Statements (Unaudited)
(Unaudited)March 31, 2024
The tables below summarizes the Company’s assets and liabilities measured at fair value on a recurring basis as of March 31, 20232024 and December 31, 2022:2023:
| | March 31, 2023 |
| | March 31, 2024 | | | | March 31, 2024 |
| (dollars in thousands) | (dollars in thousands) | | Level I | | Level II | | Level III | | Total | (dollars in thousands) | | Level I | | Level II | | Level III | | Total |
| Investments, at Fair Value | Investments, at Fair Value | | | | | | | | |
| | Equity investments in the Company's products | | $ | — | | | $ | 45,148 | | | $ | — | | | $ | 45,148 | |
| Equity investments in the Company’s products | |
| | Equity investments in the Company’s products | |
| | Equity investments in the Company’s products | |
| CLOs | CLOs | | — | | | — | | | 2,678 | | | 2,678 | |
| Total Assets, at Fair Value | Total Assets, at Fair Value | | $ | — | | | $ | 45,148 | | | $ | 2,678 | | | $ | 47,826 | |
| | Liabilities, at Fair Value | Liabilities, at Fair Value | |
| Liabilities, at Fair Value | |
| Liabilities, at Fair Value | |
| TRA liability | |
| TRA liability | |
| TRA liability | TRA liability | | $ | — | | | $ | — | | | $ | 122,951 | | | $ | 122,951 | |
| Warrant liability | Warrant liability | | — | | | — | | | 10,500 | | | 10,500 | |
| Earnout liability | Earnout liability | | — | | | — | | | 91,814 | | | 91,814 | |
| Total Liabilities, at Fair Value | Total Liabilities, at Fair Value | | $ | — | | | $ | — | | | $ | 225,265 | | | $ | 225,265 | |
| | December 31, 2022 |
| | December 31, 2023 | | | | December 31, 2023 |
| (dollars in thousands) | (dollars in thousands) | | Level I | | Level II | | Level III | | Total | (dollars in thousands) | | Level I | | Level II | | Level III | | Total |
| Investments, at Fair Value | Investments, at Fair Value | | | | | | | | |
| Equity investments in the Company's products | | $ | — | | | $ | 14,079 | | | $ | — | | | $ | 14,079 | |
| Equity investments in the Company’s products | |
| Equity investments in the Company’s products | |
| Equity investments in the Company’s products | |
| CLOs | CLOs | | — | | | — | | | 2,843 | | | 2,843 | |
| $ | — | | | $ | 14,079 | | | $ | 2,843 | | | $ | 16,922 | |
| Total Assets, at Fair Value | |
| | Liabilities, at Fair Value | Liabilities, at Fair Value | |
| Liabilities, at Fair Value | |
| Liabilities, at Fair Value | |
| TRA liability | |
| TRA liability | |
| TRA liability | TRA liability | | $ | — | | | $ | — | | | $ | 120,587 | | | $ | 120,587 | |
| Warrant liability | Warrant liability | | — | | | — | | | 8,550 | | | 8,550 | |
| Earnout liability | Earnout liability | | — | | | — | | | 172,070 | | | 172,070 | |
| Total Liabilities, at Fair Value | Total Liabilities, at Fair Value | | $ | — | | | $ | — | | | $ | 301,207 | | | $ | 301,207 | |
Blue Owl Capital Inc.
Notes to Consolidated and Combined Financial Statements (Unaudited)
(Unaudited)March 31, 2024
Reconciliation of Fair Value Measurements Categorized within Level III
Unrealized gains and losses on the Company’s assets and liabilities carried at fair value on a recurring basis are included within other loss in the consolidated and combined statements of operations. There were no transfers in or out of Level III. The following table sets forth a summary of changes in the fair value of the Level III measurements for the three months ended March 31, 20232024 and 2022:2023:
| | | | | | | |
Three Months Ended March 31, 2023 | Level III Assets |
(dollars in thousands) | Investment in CLOs | | |
Beginning balance | $ | 2,843 | | | |
| | | |
| | | |
Net losses | (165) | | | |
Ending Balance | $ | 2,678 | | | |
Change in net unrealized losses on assets still recognized at the reporting date | $ | (165) | | | |
| | | | | | | | | | | | | | | | | |
| (dollars in thousands) | | | | | Level III Assets |
| | | | | Investment in CLOs | | |
| | | Three Months Ended March 31, |
| | | | | 2024 | | 2023 | | |
| Beginning balance | | | | | $ | 2,521 | | | $ | 2,843 | | | |
| | | | | | | | | |
| | | | | | | | | |
| | | | | | | | | |
| Net losses | | | | | (144) | | | (165) | | | |
| Ending Balance | | | | | $ | 2,377 | | | $ | 2,678 | | | |
| Change in net unrealized losses on assets still recognized at the reporting date | | | | | $ | (144) | | | $ | (165) | | | |
| | | | | | | | | | | | | | | | | | | | | | | |
| |
| | | | | | | |
| | | | | | | |
| | | | | | | |
| | | | | | | |
| | | | | | | |
| | | | | | | |
| | | | | | | |
| | | | | | | |
| Three Months Ended March 31, 2024 | Level III Liabilities |
| (dollars in thousands) | TRA Liability | | Warrant Liability | | Earnout Liability | | Total |
| Beginning balance | $ | 116,398 | | | $ | 22,600 | | | $ | 92,119 | | | $ | 231,117 | |
| | | | | | | |
| Settlements | (8,551) | | | — | | | (82,875) | | | (91,426) | |
| Net (gains) losses | (536) | | | 14,700 | | | 402 | | | 14,566 | |
| Ending Balance | $ | 107,311 | | | $ | 37,300 | | | $ | 9,646 | | | $ | 154,257 | |
| Change in net unrealized (gains) losses on liabilities still recognized at the reporting date | $ | (536) | | | $ | 14,700 | | | $ | 402 | | | $ | 14,566 | |
| | | | | | | | | | | | | | | | | | | | | | | |
| |
| | | | | | | |
| | | | | | | |
| | | | | | | |
| | | | | | | |
| | | | | | | |
| | | | | | | |
| | | | | | | |
| Three Months Ended March 31, 2023 | Level III Liabilities |
| (dollars in thousands) | TRA Liability | | Warrant Liability | | Earnout Liability | | Total |
| Beginning balance | $ | 120,587 | | | $ | 8,550 | | | $ | 172,070 | | | $ | 301,207 | |
| | | | | | | |
| Settlements | — | | | — | | | (81,250) | | | (81,250) | |
| Net losses | 2,364 | | | 1,950 | | | 994 | | | 5,308 | |
| Ending Balance | $ | 122,951 | | | $ | 10,500 | | | $ | 91,814 | | | $ | 225,265 | |
| Change in net unrealized losses on liabilities still recognized at the reporting date | $ | 2,364 | | | $ | 1,950 | | | $ | 994 | | | $ | 5,308 | |
| | | | | | | | | | | | | | | | | | | | | | | |
| Three Months Ended March 31, 2022 | Level III Liabilities |
| (dollars in thousands) | TRA Liability | | Warrant Liability | | Earnout Liability | | Total |
| Beginning balance | $ | 111,325 | | | $ | 25,750 | | | $ | 143,800 | | | $ | 280,875 | |
| | | | | | | |
| | | | | | | |
| Net losses (gains) | 9,653 | | | (6,950) | | | 496 | | | 3,199 | |
| Ending Balance | $ | 120,978 | | | $ | 18,800 | | | $ | 144,296 | | | $ | 284,074 | |
| Change in net unrealized losses (gains) on liabilities still recognized at the reporting date | $ | 9,653 | | | $ | (6,950) | | | $ | 496 | | | $ | 3,199 | |
Valuation Methodologies for Fair Value Measurements Categorized within Levels II and III
Equity Investments in the Company’s Products
The fair value of equity investments in the Company’s products is determined based on the published net asset value of these investments, as such values are the price at which contributions and redemptions are effectuated on a monthly basis. These investments are generally classified as Level II. The majority of this balance is subject to a one-year minimum holding period, which will expire in the fourth quarter of 2023. The remaining balance is generally redeemable on a monthly basis at the Company’s option.
Blue Owl Capital Inc.
Notes to Consolidated and Combined Financial Statements
(Unaudited)
CLOs
The fair value of CLOs are determined based on inputs from independent pricing services. These investments are classified as Level III. The Company obtains prices from independent pricing services that utilizes autilize discounted cash flows, which take into account unobservable significant inputs, such as yield, prepayments and credit quality.
The fair value of corporate bonds are estimated based on quoted prices in markets that are not active, dealer quotations or alternative pricing sources supported by observable inputs. These investments are generally classified as Level II. The Company obtains prices from independent pricing services that generally utilize broker quotes and may use various other pricing techniques, which take into account appropriate factors such as yield, quality, coupon rate, maturity, type of issue, trading characteristics and other data.Blue Owl Capital Inc.
Notes to Consolidated Financial Statements (Unaudited)
March 31, 2024
TRA Liability
The TRA related to the Dyal Acquisition is considered contingent consideration and is measured at fair value based on discounted future cash flows. The remaining TRA liability on the Company’s consolidated and combined statements of financial condition is not measured at fair value.
Warrant Liability
The Company uses a Monte Carlo simulation model to value the Private Placement Warrants. The Company estimates the volatility of its Class A Shares based on the volatility implied by our peer group. The risk-free interest rate is based on U.S. Treasuries for a maturity similar to the expected remaining life of the warrants. The expected term of the warrants is assumed to be equivalent to their remaining contractual term. Prior to their redemption, the Public Warrants were traded on the NYSE and were stated at the last reported sales price without any valuation adjustments, and therefore were classified as Level I.
Earnout Liability
As of March 31, 2023 and2024, the earnout liability was comprised of the Wellfleet Earnouts. As of December 31, 2022,2023, the earnout liability was comprised of the Oak Street Cash Earnout and the Wellfleet Earnouts, each of which were deemed to be contingent consideration on the Oak Street Acquisition and Wellfleet Acquisition, respectively.
The fair value of the Oak Street Cash Earnout was determined using a Monte Carlo simulation model. Thediscounted cash flow model incorporates management revenue forecast and makes the following adjustments: historical revenue volatility, risk free rate based on U.S. Treasuries for a maturity similar to the expected remaining life and a discount rate to adjust management’s revenue forecast from a risk-based forecast to a risk-neutral forecast.as of December 31, 2023.
The fair value of the Wellfleet Earnouts, which are primarily comprised of future contingent cash payments, was determined using a discounted cash flow model, which incorporates a discount rate based on the Company’s credit rating.
Blue Owl Capital Inc.
Notes to Consolidated and Combined Financial Statements
(Unaudited)
model.Quantitative Inputs and Assumptions for Fair Value Measurements Categorized within Level III
The following table summarizes the quantitative inputs and assumptions used for the Company’s Level III measurements as of March 31, 2023:2024:
| | (dollars in thousands) | (dollars in thousands) | | Fair Value | | Valuation Technique | | Significant Unobservable Inputs | | Range | | Weighted Average | | Impact to Valuation from an Increase in Input | (dollars in thousands) | | Fair Value | | Valuation Technique | | Significant Unobservable Inputs | | Range | | Weighted Average | | Impact to Valuation from an Increase in Input |
| | Assets | Assets | |
| CLOs | |
| CLOs | |
| CLOs | CLOs | | $ | 2,678 | | | Discounted cash flow | | Yield | | 18 | % | - | 22% | | 20 | % | | Decrease | | $ | 2,377 | | | Discounted cash flow | | Discounted cash flow | | Yield | | 13 | % | - | 17% | | 15 | % | | Decrease |
| | | Liabilities | Liabilities | |
| | Liabilities | |
| | Liabilities | |
| TRA liability | |
| TRA liability | |
| TRA liability | TRA liability | | $ | 122,951 | | | Discounted cash flow | | Discount Rate | | 10 | % | - | 10% | | 10 | % | | Decrease | | $ | 107,311 | | | Discounted cash flow | | Discounted cash flow | | Discount Rate | | 12 | % | - | 12% | | 12 | % | | Decrease |
| Warrant liability | Warrant liability | | 10,500 | | | Monte Carlo Simulation | | Volatility | | 34 | % | - | 34% | | 34 | % | | Increase | Warrant liability | | 37,300 | | | Monte Carlo Simulation | | Monte Carlo Simulation | | Volatility | | 27 | % | - | 27% | | 27 | % | | Increase |
| Earnout liability: | Earnout liability: | |
| Oak Street Earnouts | | 77,990 | | | Monte Carlo Simulation | | Revenue Volatility | | 45 | % | - | 45% | | 45 | % | | Increase |
| | Wellfleet Earnouts | |
| | Wellfleet Earnouts | |
| | | Discount Rate | | 16 | % | | 16% | | 16 | % | | Decrease |
| Wellfleet Earnouts | Wellfleet Earnouts | | 13,824 | | | Discounted cash flow | | Credit Valuation Adjustment | | 6 | % | - | 6% | | 6 | % | | Decrease | | 9,646 | | | Discounted cash flow | | Discounted cash flow | | Discount Rate | | 6 | % | - | 6% | | 6 | % | | Decrease |
| | 91,814 | | |
| | Total Liabilities, at Fair Value | Total Liabilities, at Fair Value | | $ | 225,265 | | |
| | Total Liabilities, at Fair Value | |
| | Total Liabilities, at Fair Value | |
Blue Owl Capital Inc.
Notes to Consolidated and Combined Financial Statements (Unaudited)
(Unaudited)March 31, 2024
The following table summarizes the quantitative inputs and assumptions used for the Company’s Level III measurements as of December 31, 2022:2023:
| | (dollars in thousands) | (dollars in thousands) | | Fair Value | | Valuation Technique | | Significant Unobservable Inputs | | Range | | Weighted Average | | Impact to Valuation from an Increase in Input | (dollars in thousands) | | Fair Value | | Valuation Technique | | Significant Unobservable Inputs | | Range | | Weighted Average | | Impact to Valuation from an Increase in Input |
| | Assets | Assets | |
| CLOs | |
| CLOs | |
| CLOs | CLOs | | $ | 2,843 | | | Discounted cash flow | | Yield | | 16 | % | | 19% | | 17 | % | | Decrease | | $ | 2,521 | | | Discounted cash flow | | Discounted cash flow | | Yield | | 15 | % | - | 19% | | 17 | % | | Decrease |
| | | Liabilities | Liabilities | |
| | Liabilities | |
| | Liabilities | |
| TRA liability | |
| TRA liability | |
| TRA liability | TRA liability | | $ | 120,587 | | | Discounted cash flow | | Discount Rate | | 11 | % | - | 11% | | 11 | % | | Decrease | | $ | 116,398 | | | Discounted cash flow | | Discounted cash flow | | Discount Rate | | 11 | % | - | 11% | | 11 | % | | Decrease |
| Warrant liability | Warrant liability | | 8,550 | | | Monte Carlo simulation | | Volatility | | 34 | % | | 34% | | 34 | % | | Increase | Warrant liability | | 22,600 | | | Monte Carlo Simulation | | Monte Carlo Simulation | | Volatility | | 31 | % | - | 31% | | 31 | % | | Increase |
| Earnout liability: | Earnout liability: | |
| Oak Street Earnouts | Oak Street Earnouts | | 158,497 | | | Monte Carlo simulation | | Revenue Volatility | | 50 | % | | 50% | | 50 | % | | Increase |
| Discount rate | | 17 | % | - | 17% | | 17 | % | | Decrease |
| Oak Street Earnouts | |
| Oak Street Earnouts | | | 82,875 | | | Discounted cash flow | | Discount Rate | | 16 | % | - | 16% | | 16 | % | | Decrease |
| | | | | | | | | - | |
| Wellfleet Earnouts | Wellfleet Earnouts | | 13,573 | | | Discounted cash flow | | Discount rate | | 6 | % | | 6% | | 6 | % | | Decrease |
| 172,070 | | |
| Wellfleet Earnouts | |
| Wellfleet Earnouts | | | 9,244 | | | Discounted cash flow | | Discount Rate | | 6 | % | - | 6% | | 6 | % | | Decrease |
| | 92,119 | |
| | Total Liabilities, at Fair Value | Total Liabilities, at Fair Value | | $ | 301,207 | | |
| | Total Liabilities, at Fair Value | |
| | Total Liabilities, at Fair Value | |
Fair Value of Other Financial Instruments
As of March 31, 2024, the fair value of the Company’s debt obligations was approximately $1.8 billion compared to a carrying value of $2.1 billion, of which $1.2 billion of the fair value would have been categorized as Level II within the fair value hierarchy and the remainder as Level III. As of December 31, 2023, the fair value of the Company’s debt obligations was approximately $1.4 billion compared to a carrying value of $1.8$1.7 billion, of which $1.1$1.2 billion of the fair value would have been categorized as Level II within the fair value hierarchy and the remainder as Level III. Management estimates that the carrying value of the Company’s other financial instruments, which are not carried at fair value, approximated their fair values as of March 31, 2024 and December 31, 2023, respectively, and such fair value measurements are categorized as Level III within the fair value hierarchy. As of December 31, 2022, management estimates that
5. LEASES
The Company primarily has non-cancelable operating leases for its headquarters in New York and various other offices. The operating lease for the carrying valueCompany’s headquarters does not include any renewal options; however, certain of the Company’s other investmentsleases contain renewal and early termination options that the Company has determined are not reasonably certain of being exercised.
| | | | | | | | | | | | | | | | | | |
| (dollars in thousands) | | | | Three Months Ended March 31, |
| Lease Cost | | | | | | 2024 | | 2023 |
| | | | | | | | |
| Operating lease cost | | | | | | $ | 10,759 | | | $ | 8,171 | |
| Short term lease cost | | | | | | 37 | | | 62 | |
| | | | | | | | |
| | | | | | | | |
| Net Lease Cost | | | | | | $ | 10,796 | | | $ | 8,233 | |
Blue Owl Capital Inc.
Notes to Consolidated Financial Statements (Unaudited)
March 31, 2024
| | | | | | | | | | | | | | | | | | |
| (dollars in thousands) | | | | Three Months Ended March 31, |
| Supplemental Lease Cash Flow Information | | | | | | 2024 | | 2023 |
| | | | | | | | |
| Cash paid (received) for amounts included in the measurement of lease liabilities: | | | | | | | | |
Operating cash flows for operating leases(1) | | | | | | $ | (9,065) | | | $ | 3,152 | |
| | | | | | | | |
| | | | | | | | |
| | | | | | | | |
| Right-of-use assets obtained in exchange for lease obligations: | | | | | | | | |
| Operating leases | | | | | | $ | 5,495 | | | $ | 35,933 | |
| | | | | | | | |
(1)The amount presented above for the three months ended March 31, 2024, includes $14.7 million of tenant improvement allowances received from the lessor.
| | | | | | | | | | | | | | | | |
| Lease Term and Discount Rate | | March 31, 2024 | | December 31, 2023 | | |
| Weighted-average remaining lease term: | | | | | | |
| Operating leases | | 12.4 years | | 12.5 years | | |
| | | | | | |
| | | | | | |
| Weighted-average discount rate: | | | | | | |
| Operating leases | | 5.5 | % | | 5.4 | % | | |
| | | | | | |
| | | | | | | | | | |
| (dollars in thousands) | | | | |
| Future Maturity of Operating Lease Payments | | Operating Leases | | |
| April 1, 2024 to December 31, 2024 | | $ | 19,081 | | | |
| 2025 | | 36,427 | | | |
| 2026 | | 39,642 | | | |
| 2027 | | 38,435 | | | |
| 2028 | | 39,366 | | | |
| Thereafter | | 303,774 | | | |
| Total Lease Payments | | 476,725 | | | |
| Imputed interest | | (142,139) | | | |
| Total Lease Liabilities | | $ | 334,586 | | | |
Amounts presented in the table above are presented net of tenant improvement allowances and reflect the impacts of rent holiday periods.
The Company has future operating lease payments of approximately $30.9 million related to leases that have not commenced that were entered into as of March 31, 2024. Such lease payments are not included in the table above or the Company’s consolidated statements of financial condition as operating lease assets and operating lease liabilities. These operating lease payments are anticipated to commence in the second quarter of 2024 and continue for approximately 14 years.
Blue Owl Capital Inc.
Notes to Consolidated Financial Statements (Unaudited)
March 31, 2024
6. OTHER ASSETS, NET
| | | | | | | | | | | |
| (dollars in thousands) | March 31,
2024 | | December 31,
2023 |
| Fixed assets, net: | | | |
| Leasehold improvements | $ | 147,904 | | | $ | 127,612 | |
| Furniture and fixtures | 13,936 | | | 13,823 | |
| Computer hardware and software | 9,361 | | | 8,328 | |
| Accumulated depreciation and amortization | (17,683) | | | (14,870) | |
| Fixed assets, net | 153,518 | | | 134,893 | |
| Receivables | 11,386 | | | 15,853 | |
| Prepaid expenses | 9,079 | | | 7,212 | |
| Unamortized debt issuance costs on revolving credit facilities | 8,750 | | | 9,265 | |
| Other assets | 13,903 | | | 20,232 | |
| Total | $ | 196,636 | | | $ | 187,455 | |
7. DEBT OBLIGATIONS, NET
The following tables summarize outstanding debt obligations of the Company:
| | | | | | | | | | | | | | | | | | | | | | | | | | | | | | | |
| | March 31, 2024 |
| (dollars in thousands) | Maturity Date | | Aggregate Facility Size | | Outstanding Debt | | Amount Available | | Net Carrying Value | | |
| 2028 Notes | 5/26/2028 | | $ | 59,800 | | | $ | 59,800 | | | $ | — | | | $ | 58,504 | | | |
| 2031 Notes | 6/10/2031 | | 700,000 | | | 700,000 | | | — | | | 687,585 | | | |
| 2032 Notes | 2/15/2032 | | 400,000 | | | 400,000 | | | — | | | 393,000 | | | |
| 2051 Notes | 10/7/2051 | | 350,000 | | | 350,000 | | | — | | | 338,030 | | | |
| Revolving Credit Facility | 6/29/2028 | | 1,550,000 | | | 595,000 | | | 948,300 | | | 595,000 | | | |
| Total | | | $ | 3,059,800 | | | $ | 2,104,800 | | | $ | 948,300 | | | $ | 2,072,119 | | | |
| | | | | | | | | | | | | | | | | | | | | | | | | | | | | | | |
| | December 31, 2023 |
| (dollars in thousands) | Maturity Date | | Aggregate Facility Size | | Outstanding Debt | | Amount Available | | Net Carrying Value | | |
| 2028 Notes | 5/26/2028 | | $ | 59,800 | | | $ | 59,800 | | | $ | — | | | $ | 58,390 | | | |
| 2031 Notes | 6/10/2031 | | 700,000 | | | 700,000 | | | — | | | 687,163 | | | |
| 2032 Notes | 2/15/2032 | | 400,000 | | | 400,000 | | | — | | | 392,766 | | | |
| 2051 Notes | 10/7/2051 | | 350,000 | | | 350,000 | | | — | | | 337,922 | | | |
| Revolving Credit Facility | 6/29/2028 | | 1,550,000 | | | 205,000 | | | 1,338,300 | | | 205,000 | | | |
| Total | | | $ | 3,059,800 | | | $ | 1,714,800 | | | $ | 1,338,300 | | | $ | 1,681,241 | | | |
Blue Owl Capital Inc.
Notes to Consolidated Financial Statements (Unaudited)
March 31, 2024
Revolving Credit Facility
On December 7, 2021, the Company entered into a revolving credit facility (the “Revolving Credit Facility”), which are not carried at fair value, approximated their fair values,was amended in June 2023 to increase total borrowing capacity to $1.6 billion and such fair value measurementsextend the maturity date to June 29, 2028. Amounts available for the other investmentsRevolving Credit Facility presented in the tables above are categorizedreduced by outstanding letters of credit related to certain leases. Borrowings under the Revolving Credit Facility bear interest at the Company’s discretion at a rate (a) per annum of adjusted-term secured overnight financing rate (“SOFR”) plus a margin of 1.25% to 1.875%, plus 0.1% term SOFR adjustment, or (b) the greater of the (i) prime rate, (ii) New York Fed Bank Rate plus 0.50% or (iii) adjusted-term SOFR plus 1%, plus a margin of 0.25% to 0.875%. The Company is subject to an undrawn commitment fee rate of 0.125% to 0.375% of the daily amount of available revolving commitment. The borrowing rates for balances outstanding under the Revolving Credit Facility as Level IIIof March 31, 2024 and itsDecember 31, 2023, were 6.92% and 6.96%, respectively. As of the date of this report, the amount borrowed under the Revolving Credit Facility was fully repaid.
For a description of terms of the other debt obligations presented in the tables above as well as related financial covenants, see Note 4 to the financial statements in the Company’s Annual Report.
8. COMMITMENTS AND CONTINGENCIES
Tax Receivable Agreement
Pursuant to the TRA, the Company will pay 85% of certain tax benefits, if any, that it realizes (or in certain cases is deemed to realize) as a result of any increases in tax basis of the assets of the Blue Owl Operating Group related to the Business Combination and any subsequent exchanges of Blue Owl Operating Group Units for shares of the Registrant or cash.
Payments under the TRA will continue until all such tax benefits have been utilized or expired unless (i) the Company exercises its right to terminate the TRA and pays recipients an amount representing the present value of the remaining payments, (ii) there is a change of control or (iii) the Company breaches any of the material obligations of the TRA, in which case all obligations will generally be accelerated and due as if the Company had exercised its right to terminate the TRA. In each case, if payments are categorizedaccelerated, such payments will be based on certain assumptions, including that the Company will have sufficient taxable income to fully utilize the deductions arising from the increased tax deductions.
The estimate of the timing and the amount of future payments under the TRA involves several assumptions that do not account for the significant uncertainties associated with these potential payments, including an assumption that the Company will have sufficient taxable income in the relevant tax years to utilize the tax benefits that would give rise to an obligation to make payments.
During the three months ended March 31, 2024, the Company made a TRA payment of $28.2 million (including$2.8 million to related parties). The table below presents management’s estimate as Level Iof March 31, 2024, of the maximum amounts that would be payable under the TRA assuming that the Company will have sufficient taxable income each year to fully realize the expected tax savings. In light of the numerous factors affecting the Company’s obligation to make such payments, the timing and amounts of any such actual payments may differ materially from those presented in the table.
| | | | | | | | |
| (dollars in thousands) | | Potential Payments Under the Tax Receivable Agreement |
| April 1, 2024 to December 31, 2024 | | $ | — | |
| 2025 | | 53,732 | |
| 2026 | | 62,268 | |
| 2027 | | 82,022 | |
| 2028 | | 82,180 | |
| Thereafter | | 858,518 | |
| Total Payments | | 1,138,720 | |
| Less adjustment to fair value for contingent consideration | | (121,341) | |
| Total TRA Liability | | $ | 1,017,379 | |
Blue Owl Capital Inc.
Notes to Consolidated Financial Statements (Unaudited)
March 31, 2024
Unfunded Product Commitments
As of March 31, 2024, the Company had unfunded investment commitments to its products of $33.2 million, which is exclusive of commitments that employees and other related parties have directly to the Company’s products, and which the Company expects to fund over the next several years. In addition, the Company has unfunded commitments under a promissory note with one of its products, as further discussed in Note 13.
Indemnification and Guarantee Arrangements
In the normal course of business, the Company enters into contracts that contain indemnities or guarantees for related parties of the Company, including the Company’s products, as well as persons acting on behalf of the Company or such related parties and third parties. The terms of the indemnities and guarantees vary from contract to contract and the Company’s maximum exposure under these arrangements cannot be determined or the risk of material loss is remote, and therefore no amounts have been recorded in the consolidated statements of financial condition. As of March 31, 2024, the Company has not had prior claims or losses pursuant to these arrangements.
Litigation
From time to time, the Company is involved in legal actions in the ordinary course of business. Although there can be no assurance of the outcome of such legal actions, in the opinion of management, the Company does not have a potential liability related to any current legal proceeding or claim that would individually or in the aggregate materially affect its results of operations, financial condition or cash flows.
Blue Owl Capital Inc.
Notes to Consolidated Financial Statements (Unaudited)
March 31, 2024
9. REVENUES
The following table presents a disaggregated view of the Company’s revenues:
| | | | | | | | | | | | | | | | | |
| | | Three Months Ended March 31, |
| (dollars in thousands) | | | | | 2024 | | 2023 | | |
| Credit Platform | | | | | | | | | |
| Diversified lending | | | | | $ | 192,378 | | | $ | 146,095 | | | |
| Technology lending | | | | | 59,210 | | | 47,690 | | | |
| First lien lending | | | | | 4,103 | | | 4,485 | | | |
| Opportunistic lending | | | | | 2,385 | | | 2,400 | | | |
| Liquid credit | | | | | 6,799 | | | 7,518 | | | |
| Other | | | | | 5,926 | | | — | | | |
| Management Fees, Net | | | | | 270,801 | | | 208,188 | | | |
| Administrative, transaction and other fees | | | | | 47,421 | | | 20,091 | | | |
| Performance revenues | | | | | 175 | | | — | | | |
| Total GAAP Revenues - Credit Platform | | | | | 318,397 | | | 228,279 | | | |
| | | | | | | | | |
| GP Strategic Capital Platform | | | | | | | | | |
| GP minority stakes | | | | | 139,786 | | | 130,296 | | | |
| GP debt financing | | | | | 5,405 | | | 3,751 | | | |
| Professional sports minority stakes | | | | | 1,232 | | | 402 | | | |
| Strategic Revenue-Share Purchase consideration amortization | | | | | (10,660) | | | (9,769) | | | |
| Management Fees, Net | | | | | 135,763 | | | 124,680 | | | |
| Administrative, transaction and other fees | | | | | 10,800 | | | 8,405 | | | |
| Total GAAP Revenues - GP Strategic Capital Platform | | | | | 146,563 | | | 133,085 | | | |
| | | | | | | | | |
| Real Estate Platform | | | | | | | | | |
| Net lease | | | | | 41,334 | | | 25,957 | | | |
| Management Fees, Net | | | | | 41,334 | | | 25,957 | | | |
| Administrative, transaction and other fees | | | | | 5,176 | | | 3,159 | | | |
| Performance revenues | | | | | 1,870 | | | 506 | | | |
| Total GAAP Revenues - Real Estate Platform | | | | | 48,380 | | | 29,622 | | | |
| Total GAAP Revenues | | | | | $ | 513,340 | | | $ | 390,986 | | | |
Blue Owl Capital Inc.
Notes to Consolidated Financial Statements (Unaudited)
March 31, 2024
The table below presents the beginning and ending balances of the Company’s management fees, performance revenues and administrative, transaction and other fees receivable and unearned management fees. Substantially all of the amounts receivable are collected during the following quarter. A liability for unearned management fees is generally recognized when management fees are paid to the Company in advance. The entire change in unearned management fees shown below relates to amounts recognized as revenues in the current year period. Management fees, performance revenues and administrative, transaction and other fees receivable are included within due from related parties and unearned management fees are included within accounts payable, accrued expenses and other liabilities in the fair value hierarchy.Company’s consolidated statements of financial condition.
| | | | | | | | | | | |
| Three Months Ended March 31, |
| (dollars in thousands) | 2024 | | 2023 |
| Management Fees Receivable | | | |
| Beginning balance | $ | 243,203 | | | $ | 262,059 | |
| Ending balance | $ | 270,139 | | | $ | 213,969 | |
| | | |
| Administrative, Transaction and Other Fees Receivable | | | |
| Beginning balance | $ | 42,059 | | | $ | 44,060 | |
| Ending balance | $ | 41,805 | | | $ | 32,331 | |
| | | |
| Performance Revenues Receivable | | | |
| Beginning balance | $ | 2,975 | | | $ | 1,132 | |
| Ending balance | $ | 1,184 | | | $ | 320 | |
| | | |
| Unearned Management Fees | | | |
| Beginning balance | $ | 9,398 | | | $ | 9,389 | |
| Ending balance | $ | 7,610 | | | $ | 12,764 | |
The table below presents the changes in the Company’s Strategic Revenue-Share Purchase consideration. The consideration paid in 2021, which includes $455.0 million paid in Class A Shares and $50.2 million in cash, is being amortized as a reduction of management fees, net in the Company’s consolidated statements of operations over a weighted-average period of 12 years, which represents the average period over which the related customer revenues are expected to be recognized.
| | | | | | | | | | | |
| Three Months Ended March 31, |
| (dollars in thousands) | 2024 | | 2023 |
| Beginning Balance | $ | 417,081 | | | $ | 457,939 | |
| | | |
| Amortization | (10,660) | | | (9,769) | |
| Ending Balance | $ | 406,421 | | | $ | 448,170 | |
10. EQUITY-BASED COMPENSATION
The Company grants equity-based compensation awards in the form of RSUs and Incentive Units to its management, employees, consultants and independent members of the Board under the 2021 Omnibus Equity Incentive Plan, as amended (“2021 Equity Incentive Plan”). Equity-based compensation awards are generally subject to a three to five-year requisite service period, although certain grants are immediately vested at grant. The total number of Class A Shares and Blue Owl Operating Group Units, collectively, that may be issued under the 2021 Equity Incentive Plan is 101,230,522, of which 17,770,216 remain available as of March 31, 2024. To the extent that an award expires or is canceled, forfeited, terminated, surrendered, exchanged or withheld to cover tax withholding obligations, the unissued awards will again be available for grant under the 2021 Equity Incentive Plan.
Blue Owl Capital Inc.
Notes to Consolidated Financial Statements (Unaudited)
March 31, 2024
The table below presents information regarding equity-based compensation expense.
| | | | | | | | | | | | | | | | | |
| | | Three Months Ended March 31, |
| (dollars in thousands) | | | | | 2024 | | 2023 | | |
| Acquisition related | | | | | | | | | |
| | | | | | | | | |
| | | | | | | | | |
| Oak Street Earnout Units | | | | | $ | — | | | $ | 19,868 | | | |
| Wellfleet Earnout Shares | | | | | 2,103 | | | 811 | | | |
| Total acquisition related | | | | | 2,103 | | | 20,679 | | | |
| Incentive Units | | | | | 46,503 | | | 39,474 | | | |
| RSUs | | | | | 17,107 | | | 13,122 | | | |
| Equity-Based Compensation Expense | | | | | $ | 65,713 | | | $ | 73,275 | | | |
| Corresponding tax benefit | | | | | $ | 825 | | | $ | 242 | | | |
| | | | | | | | | |
| Fair value of RSUs settled in Class A Shares | | | | | $ | 22,580 | | | $ | 5,856 | | | |
| Fair value of RSUs withheld to satisfy tax withholding obligations | | | | | $ | 17,435 | | | $ | 4,400 | | | |
11. INCOME TAXES
The computation of the effective tax rate and provision at each interim period requires the use of certain estimates and significant judgment including, but not limited to, the expected operating income for the year, projections of the proportion of income that is subject to tax, permanent differences between the Company’s GAAP earnings and taxable income, and the likelihood of recovering deferred tax assets existing as of the balance sheet date. The estimates used to compute the provision for income taxes may change throughout the year as new events occur, additional information is obtained or as tax laws and regulations change. Accordingly, the effective tax rate for future interim periods may vary materially.
Blue Owl Capital Inc.
Notes to Consolidated and Combined Financial Statements
(Unaudited)
The Registrant is a domestic corporation for U.S. federal income tax purposes and is subject to U.S. federal and state and local corporate-level income taxes on its share of taxable income from the Blue Owl Operating Group. Further, the Registrant’s income tax provision and related income tax assets and liabilities are based on, among other things, an estimate of the impact of exchanges of Common Units for Class A Shares, inclusive of an analysis of tax basis and state tax implications of the Blue Owl Operating Group and their underlying assets and liabilities. The Company’s estimate is based on the most recent information available. The tax basis and state impact of the Blue Owl Operating Group and their underlying assets and liabilities are based on estimates subject to finalization of the Company’s tax returns. The Blue Owl Operating Partnerships, are partnerships for U.S. federal income tax purposes and taxable entities for certain state and local taxes, such as New York City and Connecticut UBT.
The Company had an effective tax rate of 11.7% for the three months ended March 31, 2024 and 13.3% for the three months ended March 31, 2023, and 18.0% for the three months ended March 31, 2022.2023. The effective tax rates differed from the statutory rate primarily due to the portion of income allocated to noncontrolling interests, nondeductible compensation and state and local taxes.
The Company regularly evaluates the realizability of its deferred tax asset and may recognize or adjust any valuation allowance when it is more-likely-than-not that all or a portion of the deferred tax asset may not be realized. As of March 31, 2023,2024, the Company has not recorded any valuation allowances.
The Company files its tax returns as prescribed by the tax laws of the jurisdictions in which it operates. In the normal course of business, the tax years that remain open under the statute of limitations may be subject to examinations by the appropriate tax authorities. The Company is generally no longer subject to state or local examinations by tax authorities for tax years prior to 2018.2019.
Blue Owl Capital Inc.
Notes to Consolidated Financial Statements (Unaudited)
March 31, 2024
In connection with and subsequent to the Business Combination, the Company recorded to additional paid-in capital various adjustments to deferred tax assets and liabilities, as well as related impacts to the TRA liability, related to capital transactions. These adjustments primarily resulted from differences between the Company’s GAAP and tax basis in its investment in the Blue Owl Operating Partnerships, as well as portions related to the TRA liability that may eventually lead to additional tax basis in the Blue Owl Operating Partnerships upon future TRA payments. The deferred tax assets will be recovered as the basis is amortized. See the Company’s consolidated and combined statements of stockholders’ equity for these amounts.
11. COMMITMENTS AND CONTINGENCIES12. EARNINGS PER SHARE
Tax Receivable Agreement
Pursuant toThe table below presents the TRA, the Company will pay 85% of certain tax benefits, if any, that it realizes (or in certain cases is deemed to realize) as a result of any increases in tax basisCompany’s treatment for basic and diluted earnings per share for instruments outstanding of the assets ofRegistrant and the Blue Owl Operating Group relatedGroup. Potentially dilutive instruments are only considered in the calculation to the Business Combinationextent they would be dilutive.
| | | | | | | | | | | |
| Basic | | Diluted |
Class A Shares(1) | Included | | Included |
| Class B Shares | None outstanding | | None outstanding |
| Class C Shares and Class D Shares | Non-economic voting shares of the Registrant | | Non-economic voting shares of the Registrant |
Vested RSUs(1) | Contingently issuable shares | | Contingently issuable shares |
| Unvested RSUs | Excluded | | Treasury stock method |
Warrants(2) | Excluded | | Treasury stock method |
Compensation-classified Wellfleet Earnout Shares(3) | Excluded | | Excluded |
Contingent consideration-classified Wellfleet Earnout Shares(3) | Excluded | | Excluded |
| Potentially Dilutive Instruments of the Blue Owl Operating Group: | | | |
Vested Common Units and Incentive Units(4) | Excluded | | If-converted method |
Unvested Incentive Units(4) | Excluded | | The Company first applies the treasury stock method to determine the number of units that would have been issued, then applies the if-converted method to the resulting number of units |
Oak Street Earnout Units(5) | Excluded | | Contingently issuable shares
If-converted method |
| | | |
(1)Included in the weighted-average Class A Shares outstanding are RSUs that have vested but have not been settled in Class A Shares. These RSUs do not participate in dividends until settled in Class A Shares. These vested RSUs totaled 12,098,617 for the three months ended March 31, 2024, and any subsequent exchanges10,736,476 for the three months ended March 31, 2023.
(2)The treasury stock method for warrants, which are carried at fair value, includes adjusting the numerator for changes in fair value impacting net income for the period.
(3)During the second quarter of Blue Owl Operating Group Units for shares2023, the Company modified the Wellfleet Earnout Shares arrangement such that settlement of the Registrant or cash.
Payments underWellfleet Earnout Shares would be in cash at each payment date. As a result of the TRA will continue until allmodification, Wellfleet Earnout Shares are excluded from basic and diluted earnings per share for three months ended March 31, 2024. As of March 31, 2023, the Wellfleet Triggering Events with respect to the Wellfleet Earnout Shares had not occurred, and therefore such tax benefitsshares have not been included in the calculation of basic earnings per share for the three months ended March 31, 2023. However, had March 31, 2023, also been the end of the contingency period for the Wellfleet Earnout Shares, the Wellfleet Triggering Events would have occurred, and therefore the Wellfleet Earnout Shares have been utilized or expired unless (i)included in the Company exercises its right to terminatecalculation of diluted earnings per share for the TRA and paying recipients an amount representingthree months ended March 31, 2023, as if such shares were outstanding from the present valuedate of the remaining payments, (ii) there is a change of controlWellfleet Acquisition.
(4)The if-converted method for these instruments includes adding back to the numerator any related income or (iii)loss allocations to noncontrolling interest, as well as any incremental tax expense had the Company breaches anyinstruments converted into Class A Shares as of the material obligationsbeginning of the TRA, in which case all obligations will generally be accelerated and due as if the Company had exercised its right to terminate the TRA. In each case, if payments are accelerated, such payments will be based on certain assumptions, including that the Company will have sufficient taxable income to fully utilize the deductions arising from the increased tax deductions.
The estimate of the timing and the amount of future payments under the TRA involves several assumptions that do not account for the significant uncertainties associated with these potential payments, including an assumption that the Company will have sufficient taxable income in the relevant tax years to utilize the tax benefits that would give rise to an obligation to make payments.period.
Blue Owl Capital Inc.
Notes to Consolidated and Combined Financial Statements (Unaudited)
(Unaudited)
The table below presents management’s estimate as of March 31, 2024
(5)The Second Oak Street Earnouts and the First Oak Street Earnouts were settled as common units during the three months ended March 31, 2024 and 2023, of the maximum amounts that would be payable under the TRA assuming that the Company will have sufficient taxable income each year to fully realize the expected tax savings. In light of the numerous factors affecting the Company’s obligation to make such payments, the timing and amounts of any such actual payments may differ materially from those presented in the table.
| | | | | | | | |
| (dollars in thousands) | | Potential Payments Under the Tax Receivable Agreement |
| April 1, 2023 to December 31, 2023 | | $ | — | |
| 2024 | | 37,708 | |
| 2025 | | 52,236 | |
| 2026 | | 62,931 | |
| 2027 | | 69,695 | |
| Thereafter | | 714,255 | |
| Total Payments | | 936,825 | |
| Less adjustment to fair value for contingent consideration | | (112,911) | |
| Total TRA Liability | | $ | 823,914 | |
Unfunded Product Commitments
respectively. As of March 31, 2023, the Company had unfunded investment commitments to its products of $11.8 million, which is exclusive of commitments that employees and other related parties have directlyOak Street Triggering Events with respect to the Company’s products, and whichSecond Oak Street Earnout Units had not occurred nor are these units issuable by the Company expects to fund over the next several years. In addition, the Company has unfunded commitments under a promissory note with one of its products,Registrant (they would be issued as further discussed in Note 12.
Indemnification and Guarantee Arrangements
In the normal course of business, the Company enters into contracts that contain indemnities or guarantees for related partiesCommon Units of the Company, including the Company’s products, as well as persons acting on behalf of the Company or such related parties and third parties. The terms of the indemnities and guarantees vary from contract to contract and the Company’s maximum exposure under these arrangements cannot be determined or the risk of material loss is remote,Blue Owl Operating Group), and therefore no amountssuch units have not been recordedincluded in the consolidated statementscalculation of financial condition. As ofbasic earnings per share for the three months ended March 31, 2023. Had March 31, 2023, also been the Company hasend of the contingency period for the Second Oak Street Earnout Units, the Oak Street Triggering Event would have not had prior claims or losses pursuant to these arrangements.
Litigation
From time to time,occurred, and therefore the Company is involved in legal actionsSecond Oak Street Earnout Units have not been included in the ordinary coursecalculation of business. Although there can be no assurance ofdiluted earnings per share for the outcome of such legal actions, in the opinion of management, the Company does not have a potential liability related to any current legal proceeding or claim that would individually or in the aggregate materially affect its results of operations, financial condition or cash flows.three months ended March 31, 2023.
| | | | | | | | | | | | | | | | | | | | | | | | | | | |
| | | | | | | | | | | |
| | | | | | | |
| | | | | | | | | | | |
| | | | | | | | | | | |
| | | | | | | | | | | |
| | | | | | | | | | | |
| | | | | | | | | | | |
| | | | | | | | | | | |
| | | | | | | | | | | |
| | | | | | | | | | | |
| | | | | | | | | | | |
| Three Months Ended March 31, 2024 | Net Income
Attributable to
Class A Shares | | Weighted-Average Class A Shares Outstanding | | Earnings Per Class A Share | | Weighted-Average Number of Antidilutive Instruments | | | | |
| (dollars in thousands, except per share amounts) | | | | | | |
| Basic | $ | 25,091 | | | 488,435,221 | | | $ | 0.05 | | | | | | | |
| Effect of dilutive securities: | | | | | | | | | | | |
| Unvested RSUs | — | | | 8,685,416 | | | | | — | | | | | |
| Warrants | (5,153) | | | 1,617,910 | | | | | — | | | | | |
| Vested Common Units | — | | | — | | | | | 951,592,871 | | | | | |
| Vested Incentive Units | — | | | — | | | | | 8,636,283 | | | | | |
| Unvested Incentive Units | — | | | — | | | | | 25,282,958 | | | | | |
| Diluted | $ | 19,938 | | | 498,738,547 | | | $ | 0.04 | | | | | | | |
| | | | | | | | | | | | | | | | | | | | | | | |
| | | | | | | |
| | | |
| | | | | | | |
| | | | | | | |
| | | | | | | |
| | | | | | | |
| | | | | | | |
| | | | | | | |
| | | | | | | |
| | | | | | | |
| | | | | | | |
| | | | | | | |
| | | | | | | |
| | | | | | | |
| Three Months Ended March 31, 2023 | Net Income Attributable To
Class A Shares | | Weighted-Average Class A Shares Outstanding | | Earnings Per Class A Share | | Weighted-Average Number of Antidilutive Instruments |
| (dollars in thousands, except per share amounts) | | |
| Basic | $ | 8,317 | | | 456,189,118 | | | $ | 0.02 | | | |
| Effect of dilutive securities: | | | | | | | |
| Unvested RSUs | — | | | 5,164,511 | | | | | — | |
| Warrants | (618) | | | 200,334 | | | | | — | |
| Compensation-classified Wellfleet Earnout Shares | — | | | 278,761 | | | | | — | |
| Contingent consideration-classified Wellfleet Earnout Shares | — | | | 78,393 | | | | | — | |
| Vested Common Units | — | | | — | | | | | 961,462,973 | |
| Vested Incentive Units | — | | | — | | | | | 6,406,975 | |
| Unvested Incentive Units | — | | | — | | | | | 25,016,462 | |
| Diluted | $ | 7,699 | | | 461,911,117 | | | $ | 0.02 | | | |
12.13. RELATED PARTY TRANSACTIONS
The majority of the Company’s revenues, including all management fees and certain administrative, transaction and other fees, are earned from the products it manages, which are related parties of the Company.
The Company also has arrangements in place with products that it manages, whereby certain costs are initially paid by the Company and subsequently are reimbursed by the products. These amounts are included within due from related parties in the Company’s consolidated and combined statements of financial condition.
Blue Owl Capital Inc.
Notes to Consolidated and Combined Financial Statements (Unaudited)
(Unaudited)March 31, 2024
| | (dollars in thousands) | (dollars in thousands) | March 31, 2023 | | December 31, 2022 | (dollars in thousands) | March 31,
2024 | | December 31,
2023 |
| Management fees | Management fees | $ | 213,969 | | | $ | 262,059 | |
| Realized performance income | 320 | | | 1,132 | |
| Performance revenues | |
| Administrative fees | Administrative fees | 32,331 | | | 44,060 | |
| Other expenses paid on behalf of the Company’s products and other related parties | Other expenses paid on behalf of the Company’s products and other related parties | 53,000 | | | 50,670 | |
| Due from Related Parties | Due from Related Parties | $ | 299,620 | | | $ | 357,921 | |
Administrative Fees
Administrative fees represent allocable compensation and other expenses incurred by the Company, pursuant to administrative and other agreements, that are reimbursed by the products it manages.manages and other related parties. These administrative fees are included within administrative, transaction and other fees on the consolidated and combined statements of operations and totaled $24.0 million and $13.8 million and $9.1 million duringfor the three months ended March 31, 20232024 and 2022,2023, respectively.
Dealer Manager Revenues
Dealer manager revenues represent commissions earned from certain of the Company’s products for distribution services provided. These dealer manager revenues are included within administrative, transaction and other fees on the consolidated and combined statements of operations and totaled $16.7 million and $8.8 million and $5.9 million duringfor the three months ended March 31, 20232024 and 2022,2023, respectively. Substantially all of these dealer manager revenues are subsequently paid out to third party broker-dealers, and such payments are recorded within general, administrative and other expenses on the consolidated and combined statements of operations.
Expense Support and Caps Arrangements
The Company is party to expense support and cap arrangements with certain of the products it manages. Pursuant to these arrangements, the Company may absorb certain expenses of these products when in excess of stated expense caps or until such products reach certain profitability, cash flow or fundraising thresholds. In certain cases, the Company is able to recover these expenses once certain profitability, cash flow or fundraising thresholds are met. The Company recorded net expenses (recoveries) related to these arrangements of $(1.9)$(1.8) million and $7.0$(1.9) million for the three months ended March 31, 20232024 and 2022,2023, respectively. These net expenses (recoveries) are included in general, administrative and other expenses within the consolidated and combined statements of operations.
Aircraft Reimbursements
In the normal course of business, the Company reimburses certain related parties for business use of their aircraft based on current market rates. Personal use of the aircraft is not charged to the Company. The Company recorded expenses for these aircraft reimbursements of $0.9 million and $0.3 million for the three months ended March 31, 2023,2024 and 2022,2023, respectively.
Promissory Notes
On August 8, 2022, the Company entered into an interest-bearing revolving promissory note with a product it manages, allowing the product to borrow from the Company up to an aggregate of $250.0 million. On November 9, 2023, the promissory note was amended to maintain the total borrowing capacity of $250.0 million upon repayment of borrowings and established a maturity date of June 30, 2024 unless extended. The promissory note bears interest at a rate of SOFR plus 2.0%1.7%, subject to change based on credit rating and leverage ratio. As of March 31, 2024, $200.0 million was outstanding under this promissory note, and the Company recorded $3.6 million of interest income for the three months ended March 31, 2024. As of March 31, 2023, $250.0 million was outstanding under thethis promissory note and the Company recorded $4.1 million of interest income for the three months ended March 31, 2023. Interest is payable monthly in arrears and may be settled in cash or equity in the related product. Any unpaid principal balance and unpaid accrued interest is payable on demand upon 120 days written notice by the Company.at maturity.
Blue Owl Capital Inc.
Notes to Consolidated and Combined Financial Statements (Unaudited)
(Unaudited)March 31, 2024
On November 15, 2022, the Company entered into a one-year,an interest-bearing revolving promissory note with a product it manages, allowing the product to borrow from the Company up to an aggregate of $15.0 million. The promissory note bears interest at a rate of SOFR plus 4.75%, with any such interest amounts capitalized monthly. Any unpaid principal balance and unpaid accrued interest may be prepaid in full or in part any time prior to maturity in January 2026. As of March 31, 2024, $7.5 million was outstanding under this promissory note and the maturity date.Company recorded $0.2 million of interest income for the three months ended March 31, 2024. As of March 31, 2023, $4.5 million was outstanding under thethis promissory note and the Company recorded $0.1 million of interest income for the three months ended March 31, 2023.
13. EARNINGS (LOSS) PER SHARE
The table below presents the Company’s treatment for basic and diluted earnings (loss) per share for instruments outstanding of the Registrant and the Blue Owl Operating Group. Potentially dilutive instruments are only considered in the calculation to the extent they would be dilutive.
| | | | | | | | | | | |
| Basic | | Diluted |
Class A Shares(1)
| Included | | Included |
Class B Shares | None outstanding | | None outstanding |
Class C Shares and Class D Shares | Non-economic voting shares of the Registrant | | Non-economic voting shares of the Registrant |
Vested RSUs(1)
| Contingently issuable shares | | Contingently issuable shares |
Unvested RSUs | Excluded | | Treasury stock method |
Warrants(2)
| Excluded | | Treasury stock method |
Compensation-classified Wellfleet Earnout Shares | Excluded | | Treasury stock method |
Contingent consideration-classified Wellfleet Earnout Shares(3)
| Contingently issuable shares | | Contingently issuable shares |
Potentially Dilutive Instruments of the Blue Owl Operating Group: | | | |
Vested Common Units and Incentive Units(4)
| Excluded | | If-converted method |
Unvested Incentive Units(4)
| Excluded | | The Company first applies the treasury stock method to determine the number of units that would have been issued, then applies the if-converted method to the resulting number of units |
Oak Street Earnout Units(5)
| Excluded | | Contingently issuable shares
If-converted method |
| | | |
(1)Included in the weighted-average Class A Shares outstanding are RSUs that have vested but have not been settled in Class A Shares. These RSUs do not participate in dividends until settled in Class A Shares. These vested RSUs totaled 10,736,476 for the three months ended March 31, 2023, and 10,928,095 for the three months ended March 31, 2022.
(2)The treasury stock method for warrants, which are carried at fair value, includes adjusting the numerator for changes in fair value impacting net income (loss) for the period.
(3)As of March 31, 2023, the Wellfleet Triggering Events with respect to the Wellfleet Earnout Shares had not occurred, and therefore such shares have not been included in the calculation of basic earnings (loss) per share for the three months ended March 31, 2023. However, had March 31, 2023, also been the end of the contingency period for the Wellfleet Earnout Shares, the Wellfleet Triggering Events would have occurred, and therefore the Wellfleet Earnout Shares have been included in the calculation of diluted earnings (loss) per share for the three months ended March 31, 2023, as if such shares were outstanding from the date of the Wellfleet Acquisition.
(4)The if-converted method for these instruments includes adding back to the numerator any related income or loss allocations to noncontrolling interest, as well as any incremental tax expense had the instruments converted into Class A Shares as of the beginning of the period.
(5)As of March 31, 2023 and 2022, the Oak Street Triggering Events with respect to the Second Oak Street Earnout Units, and First and Second Oak Street Earnout Units, respectively, had not occurred nor are these units issuable by the Registrant (they would be issued as Common Units of the Blue Owl Operating Group), and therefore such units have not been included in the calculation of basic earnings (loss) per share for the three months ended March 31, 2023 and 2022, respectively. Additionally, had the end of each reporting period also been the end of the contingency period for the Second Oak Street Earnout Units, and First and Second Oak Street Earnout Units, respectively, the Oak Street Triggering Events would not yet have occurred, and therefore the Second Oak Street Earnout Units, and the First and Second Oak Street Earnout Units, respectively, have not been included in the calculation of diluted earnings (loss) per share for the three months ended March 31, 2023 and 2022, respectively.
Blue Owl Capital Inc.
Notes to Consolidated and Combined Financial Statements
(Unaudited)
| | | | | | | | | | | | | | | | | | | | | | | | | | | |
| Three Months Ended March 31, 2023 | Net Income Attributable to Class A Shares | | Weighted-Average Class A Shares Outstanding | | Earnings Per Class A Share | | Weighted-Average Number of Antidilutive Instruments | | | | |
| (dollars in thousands, except per share amounts) | | | | | | |
| Basic | $ | 8,317 | | | 456,189,118 | | | $ | 0.02 | | | | | | | |
| Effect of dilutive securities: | | | | | | | | | | | |
| Unvested RSUs | — | | | 5,164,511 | | | | | — | | | | | |
| Warrants | (618) | | | 200,334 | | | | | — | | | | | |
| Compensation-classified Wellfleet Earnout Shares | — | | | 278,761 | | | | | — | | | | | |
| Contingent consideration-classified Wellfleet Earnout Shares | — | | | 78,393 | | | | | — | | | | | |
| Vested Common Units | — | | | — | | | | | 961,462,973 | | | | | |
| Vested Incentive Units | — | | | — | | | | | 6,406,975 | | | | | |
| Unvested Incentive Units | — | | | — | | | | | 25,016,462 | | | | | |
| | | | | | | | | | | |
| Diluted | $ | 7,699 | | | 461,911,117 | | | $ | 0.02 | | | | | | | |
| | | | | | | | | | | |
| | | | | | | | | | | | | | | | | | | | | | | |
| Three Months Ended March 31, 2022 | Net Loss Attributable to Class A Shares | | Weighted-Average Class A Shares Outstanding | | Loss Per Class A Share | | Weighted-Average Number of Antidilutive Instruments |
| (dollars in thousands, except per share amounts) | | |
| Basic | $ | (11,815) | | | 417,108,929 | | | $ | (0.03) | | | |
| Effect of dilutive securities: | | | | | | | |
| Unvested RSUs | — | | | — | | | | | 10,777,018 | |
| Warrants | — | | | — | | | | | 14,159,170 | |
| Vested Common Units | — | | | — | | | | | 992,307,278 | |
| Vested Incentive Units | — | | | — | | | | | 251,183 | |
| | | | | | | |
| Unvested Incentive Units | — | | | — | | | | | 24,517,020 | |
| Oak Street Earnout Units | — | | | — | | | | | 26,074,330 | |
| Diluted | $ | (11,815) | | | 417,108,929 | | | $ | (0.03) | | | |
14. SUBSEQUENT EVENTS
Dividend
On May 4, 2023,2, 2024, the Company announced a cash dividend of $0.14$0.18 per Class A Share. The dividend is payable on May 31, 2023,30, 2024, to holders of record as of the close of business on May 19, 2023.21, 2024.
Acquisitions
In April 2024, the Company announced its entry into an agreement to acquire Kuvare Insurance Services LP (dba Kuvare Asset Management) (“KAM”), a boutique investment management firm focused on providing asset management services to the insurance industry, including Kuvare UK Holdings (“Kuvare”), for $750 million (the “KAM Acquisition”). The Company will fund the KAM Acquisition through a combination of $325 million in cash and $425 million in Blue Owl Class A common stock. The KAM Acquisition is expected to close in the second or third quarter of 2024 and remains subject to customary regulatory approvals and other closing conditions and specified termination rights. Separately, the Company made a long-term investment in Kuvare, purchasing $250 million of preferred equity.
In April 2024, the Company announced its entry into an agreement to acquire Prima Capital Advisors (“Prima”) for $170 million (the “Prima Acquisition”). The Prima Acquisition will be funded through a combination of approximately $157 million of Class A Shares, Class C Shares and Blue Owl Operating Group Units and approximately $13 million in cash, subject to certain closing consideration adjustments. The Prima Acquisition is expected to close in the second or third quarter of 2024, subject to customary closing conditions.
2034 Notes
In April 2024, the Company, through its indirect subsidiary, Blue Owl Finance LLC, issued $750.0 million aggregate principal amount of 6.250% Senior Notes due 2034 (the “2034 Notes”). The 2034 Notes bear interest at a rate of 6.250% per annum and mature on April 18, 2034. Interest on the 2034 Notes will be payable semi-annually in arrears on April 18 and October 18 of each year, commencing October 18, 2024. Proceeds from the 2034 Notes were used to repay the outstanding borrowings under the Revolving Credit Facility. The remaining proceeds will be used for general corporate purposes, including to fund any future strategic acquisitions or related transactions and growth initiatives.
The 2034 Notes are fully and unconditionally guaranteed, jointly and severally, by the Registrant, Blue Owl Operating Partnerships and certain of their subsidiaries. The guarantees are unsecured and unsubordinated obligations of the guarantors. All or a portion of the 2034 Notes may be redeemed at the Company’s option in whole, at any time, or in part, from time to time, prior to their stated maturity, subject to a make-whole redemption price; provided, however, that if the Company redeems any amounts on or after January 18, 2034, the redemption price for the 2034 Notes will be equal to 100% of the principal amount of the amounts redeemed, in each case, plus any accrued and unpaid interest. If a change of control repurchase event occurs, the 2034 Notes are subject to repurchase by the Company at a repurchase price in cash equal to 101% of the aggregate principal amount repurchased plus any accrued and unpaid interest. The 2034 Notes also provide for customary events of default and acceleration.