UNITED STATES
SECURITIES AND EXCHANGE COMMISSION
Washington, D.C. 20549
FORM 10-Q/A
Amendment No.1FORM 10-Q
☒ QUARTERLY REPORT PURSUANT TO SECTION 13 OR 15(D) OF THE SECURITIES EXCHANGE ACT OF 1934
For the quarterly period ended: May 31, 20222023
☐ TRANSITION REPORT UNDER SECTION 13 OR 15(D) OF THE EXCHANGE ACT
For the transition period from to
Commission file number: 333-85072000-52838
DBMM GROUP
DIGITAL BRAND MEDIA & MARKETING GROUP, INC.
WWW.DBMMGROUP.COM
(Exact name of small business issuer as specified in its charter)
845 Third Avenue, 6th Floor, New York, NY 10022
(Address of principal executive offices)
Florida
State of incorporation
59-3666743
IRS Employer Identification No.
(646) 722-2706
(Issuer's telephone number, including area code)
Indicate by check mark whether the registrant (1) has filed all reports required to be filed by Section 13 or 15(d) of the Securities Exchange Act of 1934 during the preceding 12 months (or for such shorter period that the registrant was required to file such reports), and (2) has been subject to such filing requirements for the past 90 days. Yes ☒ No ☐
Indicate by check mark whether the registrant has submitted electronically every Interactive Data File required to be submitted pursuant to Rule 405 of Regulation S-T (§232.405 of this chapter) during the preceding 12 months (or for such shorter period that the registrant was required to submit such Files). Yes ☒ No ☐
Indicate by check mark whether the registrant is a large accelerated filer, an accelerated filer, a non-accelerated filer, smaller reporting company, or an emerging growth company. See the definitions of “large accelerated filer,” “accelerated filer”, “smaller reporting company”, and “emerging growth company” in Rule 12b-2 of the Exchange Act.
Large Accelerated Filer ☐ Accelerated Filer ☐
Non-Accelerated Filer ☐ Smaller Reporting Company ☒
Emerging growth company ☐
If an emerging growth company, indicate by check mark if the registrant has elected not to use the extended transition period for complying with any new or revised financial accounting standards provided pursuant to Section 13(a) of the Exchange Act. ☐
Indicate by check mark whether the registrant is a shell company (as defined in Rule 12b-2 of the Exchange Act) Yes ☐ No ☒
Securities registered pursuant to Section 12(b) of the Act:
Title of each class | Trading Symbol(s) | Name of each exchange on which registered |
Common Stock, $0.001 par value | DBMM | OTC Markets |
Indicate the number of shares outstanding of each of the Issuer’s classes of common stock, as of the latest practicable date:
Date | Shares Outstanding |
July |
|
Explanatory Note:
The purpose of this Amendment No.1 to our Quarterly Report on Form 10-Q for the quarter ended May 31, 2022 originally filed with the US Securities and Exchange Commission on July 14, 2022 is to correct the number of our shares of common stock outstanding on our balance sheet at May 31, 2022 and to change the header of our results of operations to reflect that the period presented was for the nine month period ended May 31, 2022 and 2021, respectively.
INDEX
| Page No |
PART I. CONDENSED CONSOLIDATED FINANCIAL INFORMATION - UNAUDITED |
|
|
|
3 | |
3 | |
4 | |
5 | |
6 | |
Notes to Unaudited Condensed Consolidated Financial Statements | 7 |
Item 2. Management's Discussion and Analysis of Financial Condition and Results of Operations | 15 |
Item 3. Quantitative and Qualitative Disclosures About Market Risk |
|
| |
|
|
PART II. OTHER INFORMATION |
|
|
|
| |
| |
Item 2. Unregistered Sale of Equity Securities and Use of Proceeds |
|
| |
| |
| |
| |
|
|
|
PART I. FINANCIAL INFORMATION
ITEM I. FINANCIAL STATEMENTS
DIGITAL BRAND MEDIA & MARKETING GROUP, INC. AND SUBSIDIARIES | DIGITAL BRAND MEDIA & MARKETING GROUP, INC. AND SUBSIDIARIES | DIGITAL BRAND MEDIA & MARKETING GROUP, INC. AND SUBSIDIARIES | ||||||||||||||
CONDENSED CONSOLIDATED BALANCE SHEETS | CONDENSED CONSOLIDATED BALANCE SHEETS | CONDENSED CONSOLIDATED BALANCE SHEETS | ||||||||||||||
(Unaudited) | (Audited) | (Unaudited) | (Audited) | |||||||||||||
May 31, | August 31, | May 31, | August 31, | |||||||||||||
2022 | 2021 | 2023 | 2022 | |||||||||||||
ASSETS | ||||||||||||||||
CURRENT ASSETS | ||||||||||||||||
Cash | $ | 14,409 | $ | 9,787 | $ | 21,645 | $ | 9,364 | ||||||||
Accounts receivable, net | 17,895 | 16,251 | 21,605 | 20,383 | ||||||||||||
Prepaid expenses and other current assets | 470 | 470 | 470 | 470 | ||||||||||||
Total current assets | 32,774 | 26,508 | 43,720 | 30,217 | ||||||||||||
Property and equipment - net | 1,420 | 1,420 | 1,420 | 1,420 | ||||||||||||
TOTAL ASSETS | $ | 34,194 | $ | 27,928 | $ | 45,140 | $ | 31,637 | ||||||||
LIABILITIES AND STOCKHOLDERS' DEFICIT | ||||||||||||||||
CURRENT LIABILITIES | ||||||||||||||||
Accounts payable and accrued expenses | $ | 754,699 | $ | 657,275 | $ | 835,102 | $ | 799,720 | ||||||||
Accrued interest | 823,180 | 643,331 | 1,101,671 | 890,708 | ||||||||||||
Accrued compensation | 1,439,386 | 1,439,886 | 1,326,086 | 1,377,136 | ||||||||||||
Derivative liability | 217,447 | 506,360 | 377,243 | 281,932 | ||||||||||||
Loans payable, net | 1,861,318 | 1,648,248 | 2,344,917 | 1,945,071 | ||||||||||||
Officers loans payable | 91,978 | 89,709 | 56,615 | 79,169 | ||||||||||||
Convertible debentures, net | 546,571 | 590,991 | 517,242 | 546,571 | ||||||||||||
| 5,734,579 | 5,575,800 | 6,558,876 | 5,920,307 | |||||||||||||
Loan payable, net of short-term portion | 43,032 | 46,192 | 27,297 | 34,360 | ||||||||||||
TOTAL LIABILITIES | 5,777,611 | 5,621,992 | 6,586,173 | 5,954,667 | ||||||||||||
STOCKHOLDERS' DEFICIT | ||||||||||||||||
Preferred stock, Series 1, par value .001; authorized 2,000,000 shares; 1,995,185, and 1,995,185 shares issued and outstanding | 1,995 | 1,995 | 1,995 | 1,995 | ||||||||||||
Preferred stock, Series 2, par value .001; authorized 2,000,000 shares; 0 and 0 shares issued and outstanding | - | - | - | - | ||||||||||||
Common stock, par value .001; authorized 2,000,000,000 shares: 787,718,631, and 757,718,631, shares issued and outstanding | 787,718 | 757,718 | ||||||||||||||
Common stock, par value .001; authorized 2,000,000,000 shares: 795,218,631, and 787,718,631, shares issued and outstanding | 795,218 | 787,718 | ||||||||||||||
Additional paid in capital | 9,666,590 | 9,528,590 | 9,824,090 | 9,666,590 | ||||||||||||
Other comprehensive loss | 51,781 | (35,984 | ) | 26,189 | 93,478 | |||||||||||
Accumulated deficit | (16,251,501 | ) | (15,846,383 | ) | (17,188,525 | ) | (16,472,811 | ) | ||||||||
TOTAL STOCKHOLDERS' DEFICIT | $ | (5,743,417 | ) | $ | (5,594,064 | ) | $ | (6,541,033 | ) | $ | (5,923,030 | ) | ||||
TOTAL LIABILITIES AND STOCKHOLDERS' DEFICIT | $ | 34,194 | $ | 27,928 | $ | 45,140 | $ | 31,637 | ||||||||
See Notes to Unaudited Condensed Consolidated Financial Statements.
DIGITAL BRAND MEDIA & MARKETING GROUP, INC. AND SUBSIDIARIES | DIGITAL BRAND MEDIA & MARKETING GROUP, INC. AND SUBSIDIARIES | DIGITAL BRAND MEDIA & MARKETING GROUP, INC. AND SUBSIDIARIES | ||||||||||||||||||||||||||||||
CONDENSED CONSOLIDATED STATEMENTS OF OPERATIONS AND COMPREHENSIVE INCOME (LOSS) | ||||||||||||||||||||||||||||||||
CONDENSED CONSOLIDATED STATEMENTS OF OPERATIONS AND COMPREHENSIVE LOSS | CONDENSED CONSOLIDATED STATEMENTS OF OPERATIONS AND COMPREHENSIVE LOSS | |||||||||||||||||||||||||||||||
Unaudited | Unaudited | For the Three Months Ended May 31, | For the Nine Months Ended May 31, | |||||||||||||||||||||||||||||
For the Three Months Ended | For the Nine Months Ended | 2023 | 2022 | 2023 | 2022 | |||||||||||||||||||||||||||
May 31, 2022 | May 31, 2021 | May 31, 2022 | May 31, 2021 | (Unaudited) | (Unaudited) | (Unaudited) | (Unaudited) | |||||||||||||||||||||||||
REVENUES | $ | 68,130 | $ | 45,456 | $ | 164,976 | $ | 120,538 | ||||||||||||||||||||||||
SALES | $ | 98,496 | $ | 68,130 | $ | 221,356 | $ | 164,976 | ||||||||||||||||||||||||
COST OF REVENUES | 30,217 | 50,417 | 102,090 | 150,156 | ||||||||||||||||||||||||||||
GROSS PROFIT (LOSS) | 37,913 | (4,961 | ) | 62,886 | (29,618 | ) | ||||||||||||||||||||||||||
COST OF SALES | 81,789 | 30,217 | 185,690 | 102,090 | ||||||||||||||||||||||||||||
GROSS PROFIT | 16,707 |
| 37,913 | 35,666 | 62,886 | |||||||||||||||||||||||||||
COSTS AND EXPENSES | ||||||||||||||||||||||||||||||||
Sales, general and administrative | 124,451 | 138,079 | 441,908 | 377,173 | 107,022 | 124,451 | 371,272 | 441,908 | ||||||||||||||||||||||||
TOTAL OPERATING EXPENSES | 124,451 | 138,079 | 441,908 | 377,173 | 107,022 | 124,451 | 371,272 | 441,908 | ||||||||||||||||||||||||
OPERATING LOSS | (86,538 | ) | (143,040 | ) | (379,022 | ) | (406,791 | ) | (90,315 | ) | (86,538 | ) | (335,606 | ) | (379,022 | ) | ||||||||||||||||
OTHER (INCOME) EXPENSE | ||||||||||||||||||||||||||||||||
Interest expense | 95,599 | 54,315 | 307,240 | 192,274 | 68,391 | 95,599 | 224,317 | 307,240 | ||||||||||||||||||||||||
Other income | - | - | (98,265 | ) | - | - | - | (46,255 | ) | (98,265 | ) | |||||||||||||||||||||
Loss on extinguishment of debt | 82,485 | - | 82,845 | - | ||||||||||||||||||||||||||||
Loss (gain) on settlement of debt | (15,375 | ) | 82,485 | 73,349 | 82,845 | |||||||||||||||||||||||||||
Change in fair value of derivative liability | 18,273 | (3,309 | ) | (265,724 | ) | (68,864 | ) | (166,865 | ) | 18,273 | 128,697 | (265,724 | ) | |||||||||||||||||||
TOTAL OTHER (INCOME) EXPENSE | 196,357 | 51,006 | 26,096 | 123,410 | ||||||||||||||||||||||||||||
TOTAL OTHER (INCOME) EXPENSES, NET | (113,849 | ) | 196,357 | 380,108 | 26,096 | |||||||||||||||||||||||||||
NET LOSS | $ | (282,895 | ) | $ | (194,046 | ) | $ | (405,118 | ) | $ | (530,201 | ) | ||||||||||||||||||||
NET INCOME (LOSS) | $ | 23,534 | $ | (282,895 | ) | $ | (715,714 | ) | $ | (405,118 | ) | |||||||||||||||||||||
OTHER COMPREHENSIVE INCOME (LOSS) | ||||||||||||||||||||||||||||||||
OTHER COMPREHENSIVE LOSS | ||||||||||||||||||||||||||||||||
Foreign exchange translation | 69,630 | (75,080 | ) | 87,765 | (58,009 | ) | (93,110 | ) | 69,630 | (67,289 | ) | 87,765 | ||||||||||||||||||||
COMPREHENSIVE LOSS | (213,265 | ) | (269,126 | ) | (317,353 | ) | (588,210 | ) | ||||||||||||||||||||||||
COMPREHENSIVE INCOME (LOSS) | (69,576 | ) | (213,265 | ) | (783,003 | ) | (317,353 | ) | ||||||||||||||||||||||||
NET LOSS PER SHARE | ||||||||||||||||||||||||||||||||
Basic and diluted | $ | (0.00 | ) | $ | (0.00 | ) | $ | (0.00 | ) | $ | (0.00 | ) | ||||||||||||||||||||
Basic | $ | (0.00 | ) | $ | 0.00 | $ | (0.00 | ) | $ | (0.00 | ) | |||||||||||||||||||||
Diluted | $ | (0.00 | ) | $ | 0.00 | $ | (0.00 | ) | $ | (0.00 | ) | |||||||||||||||||||||
WEIGHTED AVERAGE NUMBER OF SHARES | ||||||||||||||||||||||||||||||||
Basic and diluted | 782,718,631 | 757,718,631 | 765,990,690 | 757,718,631 | ||||||||||||||||||||||||||||
Basic | 795,218,631 | 782,718,631 | 788,490,690 | 765,990,960 | ||||||||||||||||||||||||||||
Diluted | 879,742,281 | 782,718,631 | 788,490,690 | 765,990,960 | ||||||||||||||||||||||||||||
See Notes to Unaudited Condensed Consolidated Financial Statements.
DIGITAL BRAND MEDIA & MARKETING GROUP, INC. AND SUBSIDIARIES | ||||||||||||||||
CONDENSED CONSOLIDATED STATEMENTS OF CHANGES IN STOCKHOLDERS' DEFICIT | ||||||||||||||||
DIGITAL BRAND MEDIA & MARKETING GROUP, INC., AND SUBSIDIARIES | DIGITAL BRAND MEDIA & MARKETING GROUP, INC., AND SUBSIDIARIES | |||||||||||||||
CONSOLIDATED STATEMENTS OF CHANGES IN STOCKHOLDERS' DEFICIT | CONSOLIDATED STATEMENTS OF CHANGES IN STOCKHOLDERS' DEFICIT | |||||||||||||||
For the Nine Months Ended May 31, | ||||||||||||||||
For the Nine Months Ended May 31, | 2023 | 2022 | ||||||||||||||
(Unaudited) | (Unaudited) | (Unaudited) | ||||||||||||||
2022 | 2021 | |||||||||||||||
Series 1 | ||||||||||||||||
Preferred Stock | ||||||||||||||||
Shares, beginning and end of period | 1,995,185 | 1,995,185 | 1,995,185 | 1,995,185 | ||||||||||||
Preferred Stock | ||||||||||||||||
Balance, beginning and end of period | $ | 1,995 | $ | 1,995 | $ | 1,995 | $ | 1,995 | ||||||||
Series 2 | ||||||||||||||||
Preferred Stock | ||||||||||||||||
Shares, beginning and end of period | - | - | - | - | ||||||||||||
Preferred Stock | ||||||||||||||||
Balance, beginning and end of period | $ | - | $ | - | $ | - | $ | - | ||||||||
Common Stock | ||||||||||||||||
Shares, beginning of period | 757,718,631 | 757,718,631 | 787,718,631 | 757,718,631 | ||||||||||||
Issuance of shares pursuant to satisfaction of convertible debt obligations | 30,000,000 | - | ||||||||||||||
Issuance of shares under convertible debt settlement | 7,500,000 | 30,000,000 | ||||||||||||||
Shares, end of period | 787,718,631 | 757,718,631 | 795,218,631 | 787,718,631 | ||||||||||||
Balance, beginning of period | $ | 757,718 | $ | 757,718 | $ | 787,718 | $ | 757,718 | ||||||||
Issuance of shares pursuant to satisfaction of convertible debt obligations | 30,000 | - | ||||||||||||||
Issuance of shares under convertible debt settlement | 7,500 | 30,000 | ||||||||||||||
Balance, end of period | $ | 787,718 | $ | 757,718 | $ | 795,218 | $ | 787,718 | ||||||||
Additional paid-in capital | ||||||||||||||||
Balance, beginning of period | $ | 9,528,590 | $ | 9,270,444 | $ | 9,666,590 | $ | 9,528,590 | ||||||||
Issuance of shares pursuant to satisfaction of convertible debt obligations | 138,000 | - | ||||||||||||||
Issuance of shares under convertible debt settlement | 157,500 | 138,000 | ||||||||||||||
Balance, end of period | $ | 9,666,590 | $ | 9,270,444 | $ | 9,824,090 | $ | 9,666,590 | ||||||||
Other Comprehensive Income (Loss) | ||||||||||||||||
Balance, beginning of period | $ | (35,984 | ) | $ | (16,787 | ) | $ | 93,478 | $ | (35.984 | ) | |||||
Other comprehensive income (loss) | 87,765 | (58,009 | ) | (67,289 | ) | 87,765 | ||||||||||
Balance, end of period | $ | 51,781 | $ | (74,796 | ) | $ | 26,189 | $ | 51,781 | |||||||
Accumulated Deficit | ||||||||||||||||
Balance, beginning of year | $ | (15,846,383 | ) | $ | (15,144,733 | ) | ||||||||||
Balance, beginning of period | $ | (16,472,811 | ) | $ | (15,846,383 | ) | ||||||||||
Net loss | (405,118 | ) | (530,201 | ) | (715,714 | ) | (405,118 | ) | ||||||||
Balance, end of period | $ | (16,251,501 | ) | $ | (15,674,934 | ) | $ | (17,188,525 | ) | $ | (16,251,501 | ) | ||||
Total Stockholders' Deficit | $ | (5,743,417 | ) | $ | (5,719,573 | ) | $ | (6,541,033 | ) | $ | (5,743,417 | ) | ||||
See Notes to Unaudited Condensed Consolidated Financial Statements.
DIGITAL BRAND MEDIA & MARKETING GROUP, INC. AND SUBSIDIARIES | DIGITAL BRAND MEDIA & MARKETING GROUP, INC. AND SUBSIDIARIES | DIGITAL BRAND MEDIA & MARKETING GROUP, INC. AND SUBSIDIARIES | ||||||||||||||
CONDENSED CONSOLIDATED STATEMENTS OF CASH FLOWS | CONDENSED CONSOLIDATED STATEMENTS OF CASH FLOWS | CONDENSED CONSOLIDATED STATEMENTS OF CASH FLOWS | ||||||||||||||
For the Nine Months Ended | For the nine months ended | |||||||||||||||
(Unaudited) | May 31, | |||||||||||||||
May 31, | May 31, | 2023 | 2022 | |||||||||||||
2022 | 2021 | (Unaudited) | (Unaudited) | |||||||||||||
CASH FLOWS FROM OPERATING ACTIVITIES | ||||||||||||||||
Net loss | $ | (405,118 | ) | $ | (530,201 | ) | $ | (715,714 | ) | $ | (405,118 | ) | ||||
Adjustments to reconcile net loss to net cash used in operating activities: | ||||||||||||||||
Depreciation | - | 558 | - | - | ||||||||||||
Change in fair value of derivative liability | (265,724 | ) | (68,864 | ) | 128,697 | (265,724 | ) | |||||||||
Loss on extinguishment of debt | 82,845 | - | 73,349 | 82,845 | ||||||||||||
Changes in operating assets and liabilities: | ||||||||||||||||
Accounts receivable | (3,203 | ) | (6,740 | ) | 334 | (3,203 | ) | |||||||||
Accounts payable and accrued expenses | 137,062 | 129,326 | 31,051 | 137,062 | ||||||||||||
Accrued interest | 197,395 | 157,771 | 237,204 | 197,395 | ||||||||||||
Accrued compensation | (500 | ) | (3,300 | ) | (51,050 | ) | (500 | ) | ||||||||
NET CASH USED IN OPERATING ACTIVITIES | (257,243 | ) | (321,450 | ) | (296,129 | ) | (257,243 | ) | ||||||||
CASH FLOWS FROM INVESTING ACTIVITIES | ||||||||||||||||
Purchase of equipment | - | - | - | - | ||||||||||||
NET CASH USED IN INVESTING ACTIVITIES | - | - | - | - | ||||||||||||
CASH FLOWS FROM FINANCING ACTIVITIES | ||||||||||||||||
Proceeds from loan payable | 260,222 | 307,342 | ||||||||||||||
Officer loans payable | 4,417 | (1,096 | ) | |||||||||||||
Principal repayments loans payable | (2,400 | ) | - | |||||||||||||
Proceeds from loans payable | 337,519 | 260,222 | ||||||||||||||
Principal repayments loan payable | (5,895 | ) | (2,400 | ) | ||||||||||||
Officers loans payable | (22,554 | ) | 4,417 | |||||||||||||
NET CASH PROVIDED BY FINANCING ACTIVITIES | 262,239 | 306,246 | 309,070 | 262,239 | ||||||||||||
EFFECT OF VARIATION OF EXCHANGE RATE OF CASH | ||||||||||||||||
HELD IN FOREIGN CURRENCY | (374 | ) | 1,194 | (660 | ) | (374 | ) | |||||||||
NET INCREASE/(DECREASE) IN CASH | 4,622 | (14,010 | ) | 12,281 | 4,622 | |||||||||||
CASH - BEGINNING OF PERIOD | 9,787 | 34,461 | 9,364 | 9,787 | ||||||||||||
CASH - END OF PERIOD | 14,409 | 20,451 | 21,645 | 14,409 | ||||||||||||
Supplemental disclosures of cash flow information: | ||||||||||||||||
Cash paid for interest | $ | - | $ | - | $ | - | $ | - | ||||||||
Cash paid for taxes | $ | - | $ | - | $ | - | $ | - | ||||||||
Non-cash investing and financing activities: | ||||||||||||||||
Issuance of shares pursuant to satisfaction of convertible debt obligations | $ | 64,137 | $ | - | ||||||||||||
Noncash investing and financing activities | ||||||||||||||||
Issuance of shares of common stock under convertible debt settlement | $ | 92,151 | $ | 64,137 | ||||||||||||
See Notes to Unaudited Condensed Consolidated Financial Statements.
DIGITAL BRAND MEDIA & MARKETING GROUP, INC.
NOTES TO UNAUDITED CONDENSED CONSOLIDATED FINANCIAL STATEMENTS
NOTE 1 – ORGANIZATION, BASIS OF PRESENTATION AND GOING CONCERN
Nature of Business and History of the Company
Digital Brand Media & Marketing Group, Inc. (“The Company” or “DBMM”) is an OTC:PK listed company. The Company was organized under the laws of the State of Florida on September 29, 1998.
The Company strategically focuses on developing the business of its wholly owned and revenue generating online marketing services company, Digital Clarity. With deep DNA in its operating market, blending the services of an experienced professional workforce leveraging a technology offering positions the Company in a strong, forward-lookingforward looking structure. Digital Clarity operates in the growing area of digital marketing that helps companies make the most of the digital economy focusing on areas such as Search Engine Marketing (Google, Yahoo! & Bing), Social Media (Twitter, Facebook & LinkedIn) and Internet Strategy Planning including Design, Analytics and Mobile Marketing.
Following the acquisition of Digital Clarity in 2011 the Company has been honing its business model to be the differentiating service provider in digital marketing space to its clients and prospective business as DBMM grows into one of the leaders in the industry going forward.
Today, DBMM Group crafts, designs and executes digital marketing strategies across multiple ad platforms and social media networks for a broad array of clients to help each of them establish a uniform brand identity across the digital universe. The product offering is a unique value proposition of intelligent analytics provided by an experienced digital marketing and technology team. Therefore, DBMM Group is a blend of data, strategy and creative execution.
The accompanying unaudited condensed consolidated financial statements have been prepared in accordance with accounting principles generally accepted in the United States of America for interim financial information and with the instructions to Form 10-Q and Rule 10-01 of Regulation S-X. Accordingly, they do not include all of the information and footnotes required by generally accepted accounting principles for complete financial statements. In the opinion of management, all normal recurring adjustments considered necessary for a fair presentation have been included. Operating results for the nine months ended May 31, 20222023 are not necessarily indicative of the results that may be expected for the year ending August 31, 2022.2023. For further information refer to the financial statements and footnotes thereto included in the Company’s Form 10-K for the year ended August 31, 2021.2022.
Going Concern
The accompanying condensed consolidated financial statements have been prepared on a going concern basis. The financial statements do not reflect any adjustments that might result if the Company is unable to continue as a going concern.
The Company has outstanding loans and convertible notes payable aggregating $2.5$2.9 million at May 31, 20222023 and doesn’t have sufficient cash on hand to satisfy such obligations. The preceding raiseraises substantial doubt about the ability of the Company to continue as a going concern. However, the Company generated proceeds of $262,239$309,070 from financing activities during the nine months ending May 31, 2022.2023. The Company also has a non-binding Commitment Letter from an investor of $250,000 which also includes a right of first refusal on additional capital raise up to $3 million which will contribute to satisfying such obligations and fund any potential cash flow deficiencies from operations for the foreseeable future.
Accordingly, the accompanying consolidated financial statements have been prepared in conformity with U.S. GAAP, which contemplates continuation of the Company as a going concern and the realization of assets and satisfaction of liabilities in the normal course of business. The carrying amounts of assets and liabilities presented in the financial statements do not necessarily purport to represent realizable or settlement values. The financial statements do not include any adjustment that might result from the outcome of this uncertainty.
NOTE 2 – SIGNIFICANT ACCOUNTING POLICIES
Basis of Consolidation
The unaudited condensed consolidated financial statements include the accounts of the Company and its wholly owned subsidiary Stylar (DBA Digital Clarity). All significant inter-company transactions are eliminated. The Company has dissolved RTG Ventures (Europe) Limited, a dormant subsidiary during November 2022 and the subsidiary was removed from the United Kingdom Companies House in February 2023.
Cash and Cash Equivalents
Cash and cash equivalents consist primarily of cash in banks. The Company considers cash equivalents to include all highly liquid investments with original maturities of three months or less to be cash equivalents. The Company had no cash equivalents as of May 31, 2022.2023.
Accounts Receivable and Allowance for Doubtful Accounts
Accounts receivable are recorded at the invoiced amount and do not bear interest. Accounts receivable are presented net of allowance for doubtful accounts.
The Company has a policy of reserving for uncollectible accounts based on its best estimate of the amount of probable credit losses in its existing accounts receivable. The Company periodically reviews its accounts receivable to determine whether an allowance is necessary based on an analysis of past due accounts and other factors that may indicate that the realization of an account may be in doubt. Account balances deemed to be uncollectible are charged to the bad debt expense after all means of collection have been exhausted and the potential for recovery is considered remote. At May 31, 2022, theThe Company had no allowance for doubtful accounts.accounts as of May 31, 2023.
Property and Equipment
Property and equipment are stated at cost, less accumulated depreciation. Depreciation is provided using the straight-line method over the estimated useful lives of the related assets (primarily three to five years).
Revenue Recognition
Revenue is recognized upon transfer of control of promised or services to customers in an amount that reflects the consideration we expect to receive in exchange for those services. We enter into contracts that can include various combinations of services, which are generally capable of being distinct and accounted for as separate performance obligations. Revenue is recognized net of any taxes collected from customers, which are subsequently remitted to governmental authorities.
Nature of Services
The Company generally provides its services to companies primarily located in Europe but with international exposure. The Company generally provides its services ratably over the terms of the contract and bills such services at a monthly fixed rate. Some of the services are billed quarterly. The Company’s services are sold without guarantees.
Significant Judgments
Our contracts with customers sometimes often include promises to transfer multiple services to a customer. Determining whether services are considered distinct performance obligations that should be accounted for separately versus together may require significant judgment.
Judgment is required to determine Standalone Selling Price (SSP) for each distinct performance obligation. The Company uses a single amount to estimate SSP for items that are not sold separately, including set-up services, monthly search advertising services, and monthly optimization and management.
Contract Balances
Timing of revenue recognition may differ from the timing of invoicing to customers. The Company records a receivable when revenue is recognized prior to invoicing, or unearned revenue when revenue is recognized subsequent to invoicing.
The allowance for doubtful accounts reflects our best estimate of probable losses inherent in the accounts receivable balance. We determine the allowance based on known troubled accounts, historical experience, and other currently available evidence.
Use of Estimates
The preparation of financial statements in conformity with accounting principles generally accepted in the United States of America requires management to make estimates and assumptions that affect the reported amounts of assets and liabilities, and disclosure of contingent assets and liabilities, at the date of the financial statements and the reported amounts of revenues and expenses during the reporting period. Included in these estimates are assumptions about the collection of its accounts receivable, converted amount of cash denominated in a foreign currency, and estimated amounts of cash, the derivative liability could settle, if not in common shares. Actual results could differ from those estimates.
Income Taxes
The Company follows the provisions of the ASC 740 -10 related to, Accounting for Uncertain Income Tax Positions. When tax returns are filed, it is highly certain that some positions taken would be sustained upon examination by the taxing authorities, while others are subject to uncertainty about the merits of the position taken or the amount of the position that would be ultimately sustained. In accordance with the guidance of ASC 740-10, the benefit of a tax position is recognized in the financial statements in the period during which, based on all available evidence, management believes it is more likely than not that the position will be sustained upon examination, including the resolution of appeals or litigation processes, if any. Tax positions taken are not offset or aggregated with other positions. Tax positions that meet the more-likely-than-not recognition threshold are measured as the largest amount of tax benefit that is more than 50 percent likely of being realized upon settlement with the applicable taxing authority. The portion of the benefits associated with tax positions taken that exceeds the amount measured as described above should be reflected as a liability for uncertain tax benefits in the accompanying balance sheet along with any associated interest and penalties that would be payable to the taxing authorities upon examination. The Company believes its tax positions are all highly certain of being upheld upon examination. As such, the Company has not recorded a liability for uncertain tax benefits.
The Company has adopted ASC 740-10-25 Definition of Settlement, which provides guidance on how an entity should determine whether a tax position is effectively settled for the purpose of recognizing previously unrecognized tax benefits and provides that a tax position can be effectively settled upon the completion of an examination by a taxing authority without being legally extinguished. For tax positions considered effectively settled, an entity would recognize the full amount of tax benefit, even if the tax position is not considered more likely than not to be sustained based solely on the basis of its technical merits and the statute of limitations remains open.
Earnings (loss) per common share
The Company utilizes the guidance per FASB Codification “ASC 260 "Earnings Per Share". Basic earnings per share is calculated on the weighted effect of all common shares issued and outstanding and is calculated by dividing net income available to common stockholders by the weighted average shares outstanding during the period. Diluted earnings per share, which is calculated by dividing net income available to common stockholders by the weighted average number of common shares used in the basic earnings per share calculation, plus the number of common shares that would be issued assuming conversion of all potentially dilutive securities outstanding, is not presented separately as it is anti- dilutive. Such securities have been excluded from the per share computations.computations for the nine months period ended May 31, 2023 and the three and nine-month periods ended May 31, 2022. During the three-month period ended May 31, 2023, the dilutive securities amounted to 84,523,650 shares of common stock and related to convertible notes. The Company intends to settle with the holders of convertible notes to the Company’s benefit as has been historically resolved.
Derivative Liabilities
The Company assessed the classification of its derivative financial instruments as of May 31, 2022,2023, which consist of convertible instruments and rights to shares of the Company’s common stock and determined that such derivatives meet the criteria for liability classification under ASC 815.
ASC 815 generally provides three criteria that, if met, require companies to bifurcate conversion options from their host instruments and account for them as free-standingfree standing derivative financial instruments. These three criteria include circumstances in which (a) the economic characteristics and risks of the embedded derivative instrument are not clearly and closely related to the economic characteristics and risks of the host contract, (b) the hybrid instrument that embodies both the embedded derivative instrument and the host contract is not re-measured at fair value under otherwise applicable generally accepted accounting principles with changes in fair value reported in earnings as they occur and (c) a separate instrument with the same terms as the embedded derivative instrument would be considered a derivative instrument subject to the requirements of ASC 815. ASC 815 also provides an exception to this rule when the host instrument is deemed to be conventional, as described.
During the nine-monthsix-month period ended May 31, 20222023 and May 31, 2021,2022, the Company had notes payable outstanding in which the conversion rate was variable and undeterminable. Accordingly, the Company has recognized a derivative liability in connection with such instruments. The Company uses judgment in determining the fair value of derivative liabilities at the date of issuance at every balance sheet thereafter and in determining which valuation is most appropriate for the instrument (e.g., Binomial method), the expected volatility, the implied risk-free interest rate, as well as the expected dividend rate.
Fair Value of Financial Instruments
Effective January 1, 2008, the Company adopted FASB ASC 820-Fair Value Measurements and Disclosures, or ASC 820, for assets and liabilities measured at fair value on a recurring basis. ASC 820 establishes a common definition for fair value to be applied to existing generally accepted accounting principles that require the use of fair value measurements establishes a framework for measuring fair value and expands disclosure about such fair value measurements. The adoption of ASC 820 did not have an impact on the Company’s financial position or operating results but did expand certain disclosures.
ASC 820 defines fair value as the price that would be received to sell an asset or paid to transfer a liability in an orderly transaction between market participants at the measurement date. Additionally, ASC 820 requires the use of valuation techniques that maximize the use of observable inputs and minimize the use of unobservable inputs. These inputs are prioritized below.
Level 1 | Observable inputs such as quoted market prices in active markets for identical assets or liabilities. |
Level 2 | Observable market-based inputs or unobservable inputs that are corroborated by market data. |
Level 3 | Unobservable inputs for which there is little or no market data, which require the use of the reporting entity’s own assumptions. |
The Company did not have any Level 2 or Level 3 assets or liabilities as of May 31, 2022,2023, with the exception of its derivative liability which are valued based on Level 3 inputs.
Cash is considered to be highly liquid and easily tradable as of May 31, 20222023 and therefore classified as Level 1 within our fair value hierarchy.
In addition, FASB ASC 825-10-25 Fair Value Option, or ASC 825-10-25, was effective January 1, 2008. ASC 825-10-25 expands opportunities to use fair value measurements in financial reporting and permits entities to choose to measure many financial instruments and certain other items at fair value. The Company did not elect the fair value options for any of its qualifying financial instruments.
Convertible Instruments
The Company evaluates and accounts for conversion options embedded in its convertible instruments in accordance with professional standards for “Accounting for Derivative Instruments and Hedging Activities”.
Professional standards generally provide three criteria that, if met, require companies to bifurcate conversion options from their host instruments and account for them as free-standingfree standing derivative financial instruments. These three criteria include circumstances in which (a) the economic characteristics and risks of the embedded derivative instrument are not clearly and closely related to the economic characteristics and risks of the host contract, (b) the hybrid instrument that embodies both the embedded derivative instrument and the host contract is not re-measured at fair value under otherwise applicable generally accepted accounting principles with changes in fair value reported in earnings as they occur and (c) a separate instrument with the same terms as the embedded derivative instrument would be considered a derivative instrument. Professional standards also provide an exception to this rule when the host instrument is deemed to be conventional as defined under professional standards as “The Meaning of “Conventional Convertible Debt Instrument”.
The Company accounts for convertible instruments (when it has determined that the embedded conversion options should not be bifurcated from their host instruments) in accordance with professional standards when “Accounting for Convertible Securities with Beneficial Conversion Features,” as those professional standards pertain to “Certain Convertible Instruments.” Accordingly, the Company records, when necessary, discounts to convertible notes for the intrinsic value of conversion options embedded in debt instruments based upon the differences between the fair value of the underlying common stock at the commitment date of the note transaction and the effective conversion price embedded in the note. Debt discounts under these arrangements are amortized over the term of the related debt to their earliest date of redemption. The Company also records when necessary deemed dividends for the intrinsic value of conversion options embedded in preferred shares based upon the differences between the fair value of the underlying common stock at the commitment date of the note transaction and the effective conversion price embedded in the note.
ASC 815-40 provides that, among other things, generally, if an event is not within the entity’s control could or require net cash settlement, then the contract shall be classified as an asset or a liability.
Stock Based Compensation
We account for the grant of stock options and restricted stock awards in accordance with ASC 718, “Compensation-Stock Compensation.” ASC 718 requires companies to recognize in the statement of operations the grant-date fair value of stock options and other equity-based compensation.
Foreign Currency Translation
Assets and liabilities of subsidiaries operating in foreign countries are translated into U.S. dollars using either the exchange rate in effect at the balance sheet date or historical rate, as applicable. Results of operations are translated using the average exchange rates prevailing throughout the year. The effects of exchange rate fluctuations on translating foreign currency assets and liabilities into U.S. dollars are included in a separate component of stockholders’ equity (accumulated other comprehensive loss), while gains and losses resulting from foreign currency transactions are included in operations.
Concentration of Risks
The Company’s accounts and receivable as of May 31, 20222023 and August 31, 20212022 and revenues for the nine-month period ended May 31, 20222023 and 20212022 are primarily from four customers.
Recently Issued Accounting Pronouncements
Management does not believe that any other recently issued, but not yet effective, accounting standards if currently adopted would have a material effect on the accompanying condensed consolidated financial statements.
NOTE 3 – PROPERTY AND EQUIPMENT
Property and equipment consisted of the following:
Estimated Life | May 31, 2022 | August 31, 2021 | |||||||
Computer and office equipment | 3 to 5 years | $ | 23,920 | $ | 23,920 | ||||
Less: Accumulated depreciation | (22,500 | ) | (22,500 | ) | |||||
| $ | 1,420 | $ | 1,420 | ||||||
Depreciation expense amounted to $558 during the nine-month periods ended May 31, 2021.
| Estimated Life |
| May 31, 2023 |
|
| August 31, 2022 |
| ||
Computer and office equipment | 3 to 5 years |
| $ | 23,920 |
|
| $ | 23,920 |
|
Less: Accumulated depreciation |
|
| (22,500 | ) |
|
| (22,500 | ) | |
|
|
| $ | 1,420 |
|
| $ | 1,420 |
|
NOTE 4 – LOANS PAYABLE
The Company’s loans payable at each measurement date are as follows:
May 31, 2023 | August 31, 2022 | |||||||
Loans payable | $ | 2,372,214 | $ | 1,979,431 | ||||
May 31, 2022 | August 31, 2021 | May 31, 2023 | August 31, 2022 | |||||||||||||
Loans payable short-term | $ | 1,861,318 | $ | 1,648,248 | $ | 2,344,917 | $ | 1,945,071 | ||||||||
Loans payable long-term | 43,032 | 46,192 | 27,297 | 34,360 | ||||||||||||
| $ | 1,904,350 | $ | 1,694,440 | $ | 2,372,214 | $ | 1,979,431 | |||||||||
The loans payables are generally due on demand and have not been called, are unsecured, and are bearing interest at a range of 0-12%., with the exception of one loan payable to a financial institution. Such loan, which amounted to $50,414$38,531 at May 31, 20222023 bears interest at an annual rate ofat 2.5%, is unsecured, matures in November 2027 with principal and interest payable monthly starting in November 2021.monthly. This loan is part of a Bounce Back Loan Scheme from the UK Government.
The company may have to provide alternative consideration (which may be in cash, fixed number of shares or other financial instruments) up to amounts accrued to satisfy its fixed obligations under certain unsecured loans payable. The consideration hasn’t been issued yet and is included in accrued expenses and interest expense and was valued based on the fair value of the consideration at issuance.
The aggregate schedule maturities of the Company’s loans payable outstanding as of May 31, 20222023 are as follows:
2023 | $ | 1,861,322 | ||||||
2024 | 11,062 |
| $ | 2,344,917 |
| |||
2025 | 11,765 |
|
| 11,948 |
| |||
2026 | 12,513 |
|
| 12,708 |
| |||
2027 | 7,688 |
|
| 2,641 |
| |||
| $ | 1,904,350 |
|
|
|
| |||
|
| $ | 2,372,214 |
| ||||
NOTE 5 – CONVERTIBLE DEBENTURES
The Company’s convertible debentures consisted of the following:
May 31, 2022 | August 31, 2021 | May 31, 2023 | August 31, 2022 | |||||||||||||
Convertible notes payable | $ | 546,571 | $ | 590,991 | $ | 517,242 | $ | 546,571 | ||||||||
Unamortized debt discount | - | - | - | - | ||||||||||||
Total | $ | 546,571 | $ | 590,991 | $ | 517,242 | $ | 546,571 | ||||||||
The convertible debentures matured in 2015, and bear interest at ranges between 6% and 15%. The convertible debentures are convertible at ratios varying between 45% and 50% of the closing price at the date of conversion through, at its most favorable terms for the holders, the average of the three lowest closing bids for a period of 5-30 days prior to conversion.
No convertible debentures have been issued since 2015 and none executed since 2016. Certain settlements with holders of convertible debentures have been agreed since 2018 to the benefit to the Company.
NOTE 6 – OFFICERS LOANS PAYABLE
May 31, 2022 | August 31, 2021 | |||||||
Officers loans payable | $ | 91,978 | $ | 89,709 | ||||
May 31, 2023 | August 31, 2022 | |||||||
Officers loans payable | $ | 56,615 | $ | 79,169 | ||||
The loans payables are due on demand, are unsecured, and are non-interest bearing.
NOTE 7 – DERIVATIVE LIABILITIES
The Company accounts for the embedded conversion features included in its convertible instruments as derivative liabilities. At each measurement date, the fair value of the embedded conversion features was based on the lattice binomial method using the following assumptions:
May 31, 2022 | August 31, 2021 |
| May 31, 2023 |
| August 31, 2022 |
| ||||||||||
Effective Exercise price | 0.0016 - 0.0024 | 0.0015 - 0.004 |
| 0.0045 - 0.01 |
| 0.003 - 0.0048 |
| |||||||||
Effective Market price | .0031 | 0.004 |
| .009-.013 |
| 0.006 |
| |||||||||
Volatility | 25-64 | % | 90 | % |
| 40.55-77 | % |
| 96 | % | ||||||
Risk-free interest | 2.08 | % | 0.17 | % |
| 4.74-5.18 | % |
| 0.24 | % | ||||||
Terms | 365 days | 365 days |
| 365 days |
| 365 days |
| |||||||||
Expected dividend rate | 0 | % | 0 | % |
| 0 | % |
| 0 | % | ||||||
Changes in the derivative liabilities during the nine-month period ended May 31, 20222023 is as follows:
Balance at August 31, 2021 | $ | 506,360 | ||||||
Balance at August 31, 2022 | $ | 281,932 | ||||||
Reclassification of liability contracts | (23,189 | ) | (33,386 | ) | ||||
Changes in fair value of derivative liabilities | (265,724 | ) | 128,697 | |||||
Balance, May 31, 2022 | $ | 217,447 | ||||||
Balance, May 31, 2023 | $ | 377,243 | ||||||
NOTE 8 – ACCRUED COMPENSATION
As of May 31, 2022,2023, and August 31, 2021,2022, the Company owes $1,439,386$1,326,086 and $1,439,886,$1,377,136, respectively, in accrued compensation and expenses to certain directors and consultants. The amounts are non-interest bearing.
NOTE 9 – COMMON STOCK AND PREFERRED STOCK
Preferred Stock- Series 1 and 2
The designation of the Preferred Stock- Series 1 is as follows: Authorized 2,000,000 shares, par value of $0.001. One share of the Company’s Preferred Stock- Series is convertible into 53.04 shares of the Company’s common stock, at the holder’s option and with the Company’s acquiescence, and has three votes per share.
The designation of the Preferred Stock- Series 2 is as follows: Authorized 2,000,000 shares, par value of $0.001. One share of the Company’s Preferred Stock- Series is convertible into one share of the Company’s common stock, at the holder’s option and with the Company’s acquiescence, and has no voting rights.
Common Stock
The Authorized Shares were increased to 2,000,000,000 in April 4, 2016.
The Company successfully reached an agreement in March 2022 with a lender resultingholder of convertible debentures aggregating $76,216 in principal and interest and derivative liabilities in consideration of 7,500,000 shares of the Company’s common stock, which generated a loss on extinguishment of debt of issued 30,000,000 shares amounting to $82,845. $88,784 during February 2023.
The gain is the difference between theCompany successfully reached an agreement with a holder of convertible debentures aggregating $85,515 in principal and interest and derivative liabilities in consideration given by the Company, which consisted of 30,000,000 shares of itsthe Company’s common stock, valued at $168,000 and the carrying valuewhich generated a loss on extinguishment of its obligations related to its convertible notes, including related derivative liabilities, which amounted to $85,155 at the settlement date.debt of $82,545 during March 2022.
NOTE 10 – OTHER INCOME
The Company receives governmental assistance from the United Kingdom government in the form of research and development tax credits. Such research and development tax credits amounted to $98,265 during the nine-month period May 31, 2022 and are recognized as other income in the accompanying statement of condensed consolidated operations and comprehensive loss.
NOTE 1110 – COMMITMENTS AND CONTINGENCIES
Leases
The Company leases its facilities under non-cancellable operating leases which are renewable monthly. The leases have monthly base rents. The latest monthly base rent for the Company’s facilities ranges between $269$279 and $1,025.$415.
Rental expense amounted to $6,256$21,822 and $12,805 during the nine-month period ended May 31, 20222023 and 2021,2022, respectively.
The Company successfully reached an agreement with one its lessors to reduce its liability by $15,435 in April 2023 which was recorded net of its loss on extinguishment of debt during the nine month ending May 31, 2023.
Consulting Agreement
The annual compensation of Linda Perry amounts to $150,000 for her role as a consultant and as Executive Director for US interface to provide oversight regarding external regulatory reporting requirements. In addition, Ms. Perry is the lead executive for capital funding requirements and business development. The agreement has a rolling three-year term through September 2022.2025.
Legal Proceedings
From time to time, the Company has become or may become involved in certain lawsuits and legal proceedings which arise in the ordinary course of business. The Company intends to vigorously defend its positions. However, litigation is subject to inherent uncertainties and an adverse result in those or other matters may arise from time to time that may harm its financial position, or our business and the outcome of these matters cannot be ultimately predicted.
NOTE 1211 – FOREIGN OPERATIONS
As of May 31, 2023, a majority of our revenues and assets are associated with subsidiaries located in the United Kingdom. Assets at May 31, 2023 and revenues for the nine-month period ended May 31, 2023 were as follows (unaudited)
|
| United States |
|
| Great Britain |
|
| Total |
| |||
Revenues |
| $ | - |
|
| $ | 221,356 |
|
| $ | 221,356 |
|
Total revenues |
| $ | - |
|
| $ | 221,356 |
|
| $ | 221,356 |
|
Identifiable assets at May 31, 2023 |
| $ | 3,955 |
|
| $ | 41,185 |
|
| $ | 45,140 |
|
As of May 31, 2022, a majority of our revenues and assets are associated with subsidiaries located in the United Kingdom. Assets at May 31, 2022 and revenues for the nine-month period ended May 31, 2022 were as follows (unaudited)
|
| United States |
|
| Great Britain |
|
| Total |
| |||
Revenues |
| $ | - |
|
| $ | 164,976 |
|
| $ | 164,976 |
|
Total revenues |
| $ | - |
|
| $ | 164,976 |
|
| $ | 164,976 |
|
Identifiable assets at May 31, 2022 |
| $ | 7,423 |
|
| $ | 26,771 |
|
| $ | 34,194 |
|
As of May 31, 2021, a majority of our revenues and assets are associated with subsidiaries located in the United Kingdom. Assets at May 31, 2021 and revenues for the nine-month period ended May 31, 2021 were as follows (unaudited)
United States | Great Britain | Total | ||||||||||
Revenues | $ | - | $ | 120,538 | $ | 120,538 | ||||||
Total revenues | $ | - | $ | 120,538 | $ | 120,538 | ||||||
Identifiable assets at May 31, 2021 | $ | 17,947 | $ | 27,790 | $ | 45,737 | ||||||
NOTE 1312 – SUBSEQUENT EVENTS
The Company has analyzed its operations subsequent to May 31, 20222023 through the date these financial statements were issued and has determined that it does not have any material subsequent events to disclose.disclose with the exception of the following:
During June 2023, the Company issued 30,000,000 restricted shares of its common stock to a lender in accordance with the terms of two aged loans payable.
ITEM 2. MANAGEMENT’S DISCUSSION AND ANALYSIS OF FINANCIAL CONDITION AND RESULTS OF OPERATIONS
Readers are cautioned that certain statements contained herein are forward-looking statements and should be read in conjunction with our disclosures under the heading "Forward-Looking Statements"“Forward-Looking Statements” above. These statements are based on current expectations and assumptions that are subject to risks and uncertainties. This discussion also should be read in conjunction with the notes to our consolidated financial statements contained in Item 8. "Financial Statements and Supplementary Data" of this Report.
OPERATIONS OVERVIEW/OUTLOOK
The Company developed a document called the Creds Deck which provides a description to prospective clients of Digital Clarity’s value proposition http://www.dbmmgroup.com/wp-content/uploads/2020/11/Digital-Clarity-Creds-Deck_DB64F.pdf.
Coronavirus lockdown initially halted, and even now has slowed down, many business processes starting from manufacturing, supply chain to logistics, and marketing. Digital Clarity is no exception, and the negative impact for over two years, is measurable.
During the two-year period, some businesses have permanently closed or paused their digital marketing activities temporarily, because of this uncertainty. That mindset results in drastically decreased online traffic, sales, engagement, conversation, and pushed down search ranking. There are opportunities emerging, and Digital Clarity is actively pursuing new clients in a new environment.
This inserted a gap in the operating business plan. As digital marketing is not a quick-fix solution to gain momentum. Therefore, it does not give companies visibility overnight. Many companies using digital marketing techniques such as search engine optimization (SEO) or social media marketing, are already aware that implementations take three to four months’ time to achieve positive results. Our company mantra remains, “ROI is our DNA.”
This means that although there was a slowdown in existing business and new business development, there is a need for reinforcement of the digital values proposition to bring or maintain a company’s brand front and center. As a consultancy, we are delivering the message.
Operationally, fiscal year 2022 has been important in continuing the direction of the Company post-pandemic and steering it toward a scaled growth plan which has been in neutral while the Company addressed certain external challenges beyond its control. Nevertheless, the Company continued to focus on the positive, proven operating model and used that model to maintain certain existing clients and through its digital infrastructure, is perfectly placed to expand geographic reach to new clients in 2022.
Through a turbulent 2021 to date, DBMM continues to build on its strengths. Like the rest of the world, the effect of Covid-19 and the remains in turn-around. Despite the remaining challenges, the Company has strong relationships within the market and will continue to extend its business focus to a wide variety of industry verticals.
No one expected that pandemic and the SEC matter. The pandemic caused damage, as did the SEC matter.2023/07/DBMM_Creds_Deck_2023.pdf
The heart offiscal year 2023 has focused on a slow return to normalcy though businesses have faced enormous challenges over the business is its marketing consultancy. DBMM Group’s mainpast few years, and DBMM's operating business Digital Clarity, works in the area of Digital Marketingis no exception. However, for context, it is worth reminding investors and company transformation. Understanding each client and developing the model to individualize the outlook has been essential, is differentiating and is its competitive advantage. This kind of close relationship with its clients resulted inshareholders, that Digital Clarity being consideredwas acquired by DBMM as a close professionalcash-flow positive business with a great reputation and trusted advisor.industry network, winning industry awards.
As stated in the MD&As for many years, the operating business is cash flow positive, but the costs of maintaining a public company far exceed the profit in those early days. That was expected. That is the digital business model, though many digital companies do not have any operating revenues while they build the business.
Though the post-pandemic era still leaves scars, there is also an opportunity for lean organizations to take advantage of the new and challenging landscape that will no doubt still impact the overall economy.
Most analysts are clear the challenges globally, though different from the pandemic, will continue to have an impact in 2023.
Businesses will have to deal with the after-effects of not only the global pandemic but new challenges. The Company endeavorsbackdrop as we enter 2023, it is clear that B2B leaders are bracing for economic upheaval. Concerns about inflation, higher interest rates, supply chain shortages, and the prospect of a looming recession are already forcing go-to-market leaders to bringrethink their growth strategies.
Though the SEC casegeneral business sentiment is pessimistic, Digital Clarity has adapted its model to continually seek to focus on areas that will allow the business not only to survive during the turmoil but thrive as we come out of delayed filingsthe challenging economic backdrop.
Digital Clarity has been pivoting during these challenging headwinds and working to build upon its experience in the B2B space and engaging with prospects in the SaaS and Tech market. The company is also looking to develop business in Web3 and Ai sectors as companies look to adapt to a close as it has been dismissed on November 12, 2019, yet compliant with all of its filings since that time.changing business customer base.
WHY DIGITAL EXPERTS CONTINUE TO BE IN DEMAND
The world has changed. Digital is changing,now within the fabric of everyday life. As consumer markets plateau and technology is takingcome under pressure, the lead. Today, everything is going digital -- entertainment, health, real estate, banking and even currencies. This is, however, understandable. In North America alone, 95%move by Digital Clarity to meet the needs of the population are online (statista).business-to-business sector, is both timely and has commercial growth potential.
With everything turning to digital, it means companies are also jumping online to market their businesses. And to survive the challenges of digital marketing, brands
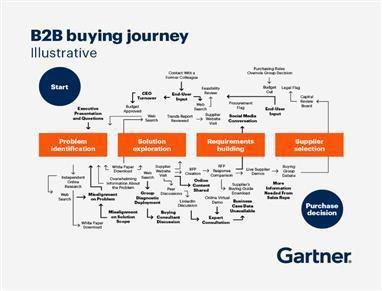
The B2B buyer journey is complex. This is why experts like Digital Clarity need to keepbe involved from the start.
Savvy communication experts like Digital Clarity produce ideas that shape perceptions and grow markets. There has never been a better time to navigate into the B2B Marketplace as demand for an experienced, safe pair of hands is required. This sector is growing rapidly and the demand for expertise and skill to help businesses in marketing their services and products is sought after. B2B digital ad spending is projected to reach $18.47 billion by 2024, it will account for nearly 50% of total B2B ad spending that year according to Insider Intelligence.
A hybrid approach to marketing in line with hybrid sales departments is expected to be the most dominant sales strategy by 2024 due to shifts in customer preferences and remote-first engagement according to McKinsey, The future of B2B sales Report 2022. Hybrid will drive up with the latest trends. Successfully reaching one’s target audience is no longer just putting out TVto 50 percent more revenue by enabling broader, deeper customer engagement and print ads. These days, social media is the new arena of digital marketers, with Statista claiming 3.7 billion peopleunlocking a more diverse talent pool than more traditional models.
Winning B2B organizations are active social media users as of October 2021.shifting to a more hybrid sales force by implementing actions that support success.
To keep up with the ever-changing scene, digital marketing experts need to stay in step with the evolving tech trends. Social media marketing companies like ours work tirelessly to research consumers and what makes them engage with brands. We try to find the best online solutions that will cater to our clients’ end-users’client’s end-users queries in the easiest and most cost-efficient way possible -- be it by developing new technology or adapting to trends.
RELENTLESS DIGITAL GROWTH POSITIONS DIGITAL CLARITY AS A LEADER
The need for seasoned expertise and insight is in huge demand. Digital Clarity’s strength, heritage, and reach in the digital marketing puts the DBMM brand in an excellent position for investment and growth. Digital Clarity’s strength in Search Engine Marketing, Analytics, Social Media, Strategic Company Transformation means thatAs the Company is readyconsumer-facing market becomes even more commoditized, the company’s move to feed on that demand and leapfrog into a powerful revenue focused vehicle.serving the business sector (B2B) will see it leveraging experience for growth.
SHOPPERS STILL USE A MIX OF DIGITAL TOUCHPOINTS DURING COVID-19 ALONG THE BUYING JOURNEY
|
|
|
|
CUSTOMERS STILL FACE SILOS ACROSS CHANNELS – THE DIGITAL LANDCAPE THROUGH THE PANDEMIC
|
|
|
|
|
|
|
|
AREAS THAT DIGITAL CLARITY EXCEL ARE AREAS THAT NEED TO BE CONSIDERED TODAY
|
|
|
|
|
|
|
|
Among, its range of services, Digital Clarity help companies ‘get found’ on search engines like Google. The Market Share chart from Statista, we can see that Google has the lion’s share of the search market worldwide. As a Google Premier Partner, Digital Clarity are well placed to advise, consult and grow companies, in 2021 and beyond.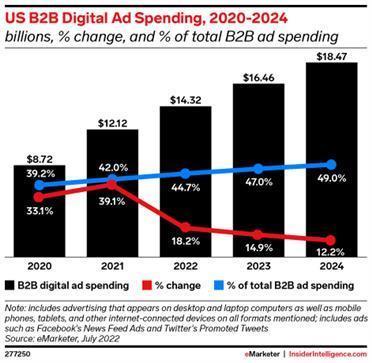
From Google’s parent Alphabet’s latest results,
Though the pandemic is certainly not over, the business world entered into a period of recovery in 2022. In the third quarterprocess, it’s become apparent that even if the ongoing shift toward digital and mobile advertising in B2B might slow down to a degree, it’s not going to stop.
THE SHIFT TO DIGITAL IS PERMANENT
Despite slower growth, digital will continue to command a greater overall share as more B2B marketers make the permanent shift from traditional advertising to online activities.
One of 2020, Google's revenue amountedthe most pronounced effects the pandemic had on B2B marketing was exponentially accelerating its transition into digital. As the business world begins recovering from the pandemic and returning to 46.02 billion U.S. dollars, up from 37.99 billion U.S. dollars in the preceding quarter. Google's main revenue source is advertising through Google sites and its network.more traditional models, this transition has slowed down. The past year has affirmed, however, that it will not stop.
HOW MACHINE LEARNING IS ENHANCING DIGITAL MARKETING STRATEGY
Digital Clarity applies strategy to algorithmic based machine learning tools. The launch of Google’s new machine learning tool, RankBrain which contributes to search engine results, left many people wondering what impact machine learning would have in the realm of Search Engine Optimization (SEO).
With the tech industry going crazy for all things Artificial Intelligence (AI), Natural Language Processing (NLP), machine learning, and chatbots – companies like Digital Clarity help brands make sense of this ever-changing landscape.
MACHINE LEARNING AND DIGITAL MARKETING
Because machine learning is being used to solve a huge set of diverse problems with the help of data, channels, content, and context, as marketers, Digital Clarity stands to benefit from this information and phenomenon as a whole. But, as the information we gather grows, digital marketing as we know it is set to change. Digital Clarity will be at the forefront of this change.
PAY PER CLICK (PPC) CAMPAIGNS
With Google launching new “smart” features such as Google Smart Bidding, Smart Display Campaigns, and In-Market Audience to help businesses maximize conversions, it is clear that the future of PPC lies in machine learning.
To become more strategic and take PPC campaigns to the next level for its clients, Digital Clarity:
● | Get to grips with the metrics that are most valuable to your business |
● | Understand obstacles that could get in the way of meeting your goals |
● | Know the underlying performance drivers to make more strategic decisions |
SEARCH - OVERALL
Search makes up half (52%) of advertising spend, increasing on par at 15% to £3.3bn,$4.3bn, next is non-video display at £1.33bn$1.73bn (+9%), then video display £967m$1.2bn (40%). Classifieds remains at £726m$949m and other remained at £41m.$53.3m.
DIGITAL CLARITY EMBRACE GOOGLE’S MACHINE LEARNING MARKETING SUITE
Machine learning and AI have grown at a rapid pace and are an integral part of day-to-dayday to day search advertising management and planning. Though machine learning has been an integral part of the ad world, what has been more significant has been the addition of Artificial Intelligence or AI. According to a recent report in The Harvard Business Review by Deloitte, AI in Digital Marketing is not just getting bigger, it’s getting far more persuasive
MIT researchers recently unveiled a chip that can perform inference using neural network computations three to seven times faster than previous chips, and with up to 95 percent less power consumption. Dozens of companies working on new generations of AI chips—for use both in and outside of data centers—are attracting significant investment. These companies raised more than $1.5 billion in funding last year, nearly twice the amount they raised the year before.
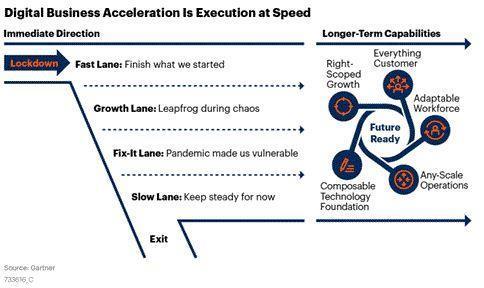
DIGITAL CLARITY PERFECTLY POSITIONED FOR THE FUTURE
According to Gartner's Digital Business Acceleration report: Where to Focus Now, Enterprises have the intention of becoming more digital due to COVID-19.
CONTENT MARKETINGSALES ARE GOING DIGITAL
Although still extremely important,Disruptive buyer dynamics are rewriting the internetrulebook for B2B sales, demanding digital-first engagement with customers. The rise in digital sales will be driven by marketing that creates demand and trust in brands.
This doesn’t portend the eventual “death of the sales rep,” but it does signal drastic changes needed in the seller role. Sales leaders must deliver significant value through digital and omnichannel sales models, aided by sales professionals who can steer self-learning customers toward more confident decisions. Digital delivers this.
THE GROWTH OF THE DIGITAL OMNICHANNEL
Gartner research shows a steady shift of customer preferences from in-person sales interactions to digital channels. B2B buyers spend only 17% of the total purchase journey with sales reps.
Because the average deal involves multiple suppliers, a sales rep gets roughly 5% of a customer’s total purchase time. And 44% of millennials prefer no sales rep interaction at all in a B2B setting.
Sales leaders must deliver significant value through digital and omnichannel sales models, aided by sales professionals who can steer self-learning customers toward more confident decisions.
OMNICHANNEL IS THE STANDARD, NOT THE EXCEPTION
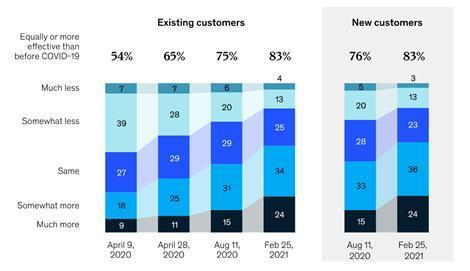
Digital Clarity can help organizations adopt the B2B Omnichannel. Eight in ten B2B leaders say that omnichannel is as or more effective than traditional methods, a sentiment that has become inundated with too much content. There is consensus among companies thatgrown sharply in order to succeed, brandsthe last 2 years. Even as in-person engagement re-emerged as an option, buyers made clear they prefer a cross-channel mix, choosing in-person, remote, and digital self-serve interactions in equal measure.
Increasing demands from customers, the proliferation of sales channels, the increase in data availability, and the need to be creatingpersonalize content have driven the need for sales and marketing teams to work as one. In fact, 89 percent of respondents now say that is valuable to readers. To do this, youmarketing and sales need to understand consumer trends, datawork closely together, more so than ever before.
To help enable and engagement. Machine learning tools alongside drive increased sales, marketing teams have been busy. Fifty-two percent of respondents say their companies have conducted extensive primary research to improve customer experience. Another 51 percent have invested in new capabilities to enable personalized marketing, while 45 percent say their companies have recently re-evaluated the role of marketing in their organization overall.
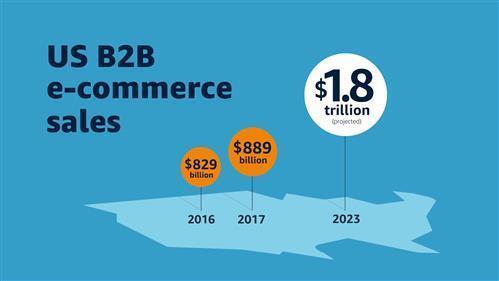
McKinsey says that the equilibrium is no accident. As B2B buyers flexed to remote and digital ways of engaging, they found much to like. The use and preference for e-commerce—self-serve, for example—has continually grown year on year.
Omnichannel is more effective than traditional sales models alone. As more companies enable face-to-face, remote, and e-commerce interactions, satisfaction with the sales model has grown exponentially. More than 90 percent of B2B companies say their go-to-market model is just as or more effective than before the pandemic began.
DIGITAL CLARITY PERFECTLY POSITIONED FOR GROWTH
Organizations will have to fight hard to retain loyalty if customer needs are not met: for example, eight in ten B2B decision makers say they will actively look for a new supplier if performance guarantees.
Buyers are more willing than ever before to spend big through remote or online sales channels, with 35 percent willing to spend $500,000 or more in a single transaction. Seventy-seven percent of B2B customers are also willing to spend $50,000 or more.
B2B customers now regularly use ten or more channels to interact with suppliers.
Digital Clarity’s strategic approach allows its clients to reduce the amountClarity is a specialist in many of time spent tracking data,these channels and has been for a number of years. This expertise, experience, and trust will put Digital Clarity front of mind for organizations as well as better decipher that data to create actionable tasks that will lead to success.they seek professional advice.
Some of the channels of focus are:
B2B DIGITAL MARKETING SERVICES
There is no denying that 2020/21the last year has proved challenging for Digital Marketing Services. When the pandemic hit in March 2020, many companies’ long-term plans and strategies were thrown out the window, as everyone from the frontlines to the C-suite shifted into fire-fighting mode. Many worked around the clock by leveraging remote technology.
Most businesses, exceptThat said, the need for those engagedspecialist marketing advisors is in essentials, have been at a standstilldemand. Google still dominates as part of the buying journey for both top and enterprisesbottom of the buying funnel. SEO and Google’s algorithm has become more complex. Digital Clarity are cutting back on costs. The axe falls on marketing. The virus has brought most scheduled digital marketing plansperfectly positioned to a grinding halt or slowed them down. The impact is felt in digital marketing, with predicted patterns now appearing skewed.help companies navigate the complexities.
During the main part of the lock-down., Google announced $800 million in funding and grants for businesses advertisers. It has on offer $ 340 million in credits for active advertisers. The clear opportunity is at the foundation of the Company, namely the need to expedite and continue to encourage development in the digital marketing services sector. The marketing services product is labor intensive and thus the Company must jumpstart the growth by significant capital to grow simultaneously in multiple geographies.
The Company’s outlook remains robust for 2022 and the foreseeable future, particularly as businesses adjust and redirect their retail business to online digital marketing in the COVID / Post COVID world.
CONTENT MARKETING
KEY MILESTONESContent has become a critical tool in the marketing mix for almost every B2B brand. Nine out of ten B2B marketers are using content marketing strategies to pull in new customers. This year, the most successful marketers were already spending 40% or more of their budget on their content strategy.
DuringAt its simplest, B2B content marketing is when a brand uses stories, ideas, and insights to engage and influence a business audience.
There is a realization amongst B2B brands that rather than being faceless organizations, they need to tell their brand’s story and show a more human side to their business, endear and promote demand from other businesses and customers. The best content marketing campaigns back up these stories and ideas with robust insights: interesting data points, original research, and real-world examples that help their customers understand a new trend or challenge and equip them with the fiscal 2021, revenues decreased duetools and best practices to external circumstances out of the company’s control which placed enormous pressure on the operating business.respond and thrive.
Despite these circumstances, the client baseThese data points and research is expandingutilized by Digital Clarity to support companies in base number and the size of client serviced. At any point in time, ourshaping their content strategy. Typically, areas that Digital Clarity help clients represent a variety of industries. Many of these clients choose to operate under an NDA as our clients see DBMM as a competitive advantage. Under that disclaimer, we cannot share all clients’ names, but here are a few key clients representing diverse verticals, as follows:are:
|
|
|
|
| |
|
| |
|
|
| ● |
|
|
| |
|
|
|
|
|
● | Case studies – these provide buyers with reassurance further down the buying funnel and can be made sector-specific. Nearly half of all business leaders appreciate them. |
● | Infographics – these have become one of the most popular content marketing tools in recent years. |
● | Podcasts – increasingly popular lead generation tools with marketers looking to deliver thought leadership content to buyers on the move. |
● | Videos – companies using video, experience clickthrough rates that are 27% higher and web conversion rates 34% greater than those that don’t. |
● | Email – nearly eight out of 10 marketers report see g an increase in email engagement over the past 12 months of 2022. |
● | LinkedIn – generates more than 50% of all social traffic to B2B websites & blogs. |
CONTENT IS INFORMATION, AND DISCOVERABLE INFORMATION DRIVES REVENUE
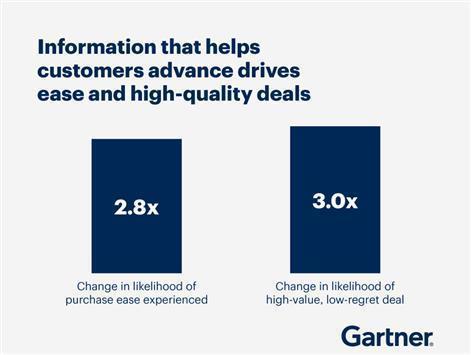
Information drives purchase ease and high-quality sales
All of this looping around and bouncing from one job to another means that buyers value suppliers that make it easier for them to navigate the purchase process.
In fact, Gartner research found that customers who perceived the information they received from suppliers to be helpful in advancing across their buying jobs were 2.8 times more likely to experience a high degree of purchase ease, and three times more likely to buy a bigger deal with less regret.
Digital Clarity has a process that helps shape their client’s content to become more discoverable information, and this increases revenues.
Buyer enablement, or the provisioning of information to customers in a way that enables them to complete information online, like gathering information or making a purchase, is an area that Digital Clarity are helping organizations.
KEY MILESTONES
As the market conditions in the consumer market cool slightly, the team at Digital Clarity has been busy pivoting their business model to address the need in the 2b2 business sector. This is a more strategic offering for prospective customers.
Digital Clarity has started offering a wider array of services to it fast-growing S company in the US. Services include, LinkedIn strategy, content positioning and SEO.
Digital Clarity has attended a major convergence summit with its client in the Unified Communication and Digital Transformation arena. This allowed the team to meet with the likes of SaaS CX providers, 8x8, Five9, and Mitel, amongst others. This will be an area of focus for the company into 2023.
In October, Digital Clarity was part of a select group that part of a panel that discussed the impact of NFTs, Blockchain and the growth of Web 3 and the Metaverse. The event was arranged by leading law firm Memery Crystal, part of Rosenblatt.
Digital Clarity has been on a large business development push and attended various networking events in London. The events include Enterprise Cyber Security hosted at the London Stock Exchange as well as diverse events in DeFi and InsureTech.
Other examples are representative of the diversity of client base. DBMM's approach using a client's analytics and executing an individualized model to increase ROI as the prime objective, spans a wide range of industries.
Digital Clarity’s services are in demand and the company is pursuing opportunities in Formula 1, Aviation and high-end marketing for Luxury Brands.
Core industry verticals for Digital Clarity include: B2B, SaaS, Digital Transformation, FinTech, Unified Communication Companies and discretionary advice for professional service providers.
SEARCH ENGINE OPTIMIZATION EVOLUTION
From an SEO point of view, keywords could become less important. Search engines receive more revenue for ads when they provide users with higher quality content. As a result, the algorithm they use needs to be more focused on providing each user with content that will serve a specific purpose, rather than be packed with the right keyword density. Therefore, the need to start thinking about the quality of your content as a ranking factor on search engines. This is where Digital Clarity comes in to help shape content ‘in the right way’ to direct potential buyers to the client’s website.
THE NEXT-GENERATION SEARCH ENGINE MARKET SET TO GROW 25.5% DURING 2021-2026
Over the last few years, the number of voice searches witnessed an exponential growth rate. Also, it is becoming less of a noveltyproviders and more like a new standard. Therefore, the next-generation search engines are more oriented toward voice-based search engines.
Next-generation search engines are also increasing because of deep neural networks, machine learning, and other advancements in AI technologies. Virtual assistants, such as smart speakers, are used for various applications across several end-user industries, such as retail, BFSI, and healthcare. One major consumer-facing application is as a personal assistant. It helps consumers accomplish various tasks. For instance, Apple's Siri offers an intuitive interface for connected homes or cars.
These assistants' capabilities can be personalized based on the end-user, thereby improving customer experience in various industries. Thus, although the personal segment holds a significant position, the commercial segment holds a massive opportunity to expand over the forecast period, owing to the growing industrial applications. For instance, virtual assistants can help customers find a doctor's office in the healthcare sector, fill and refill a prescription, and receive payment reminders.
Moreover, the voice search mobility trend is growing at a high pace with the advancements in speech recognition technology or voice search technology. Google has a 95% accuracy rate when spoken correctly in English. Moreover, Google voice search on smartphones is available in over 60 languages.
Personalized responses are one of the famous use cases of voice search, which Google has attained to a large extent, as Google can know and guess the next question the users will be most likely to ask. On the other hand, Alexa cannot understand the context to the same extent as Google. Alexa relies on custom-built skills and protocols, whereas the Google Assistant can understand specific user requests and further personalize the response.consultants.
THE GROWTH OF DIGITAL MARKETING & CONSULTANCY SERVICES
The skill set historically owned by agencies offering disciplines such as UX, design, creativity, customer-centric data analytics and customer engagement is now being immersed with large consultancy businesses whose traditional bread and butter was Digital Transformation.
Accenture, Deloitte, IBM, KPMG, McKinsey and PricewaterhouseCoopers rank among the most aggressive players in acquiring and partnering with agencies such as Digital Clarity. They present not only an opportunity for Digital Clarity but also a prospective exit and investment opportunity.
Digital Clarity have continued to develop their Digital Consulting and Strategy Planning offering. The forward-lookingforward looking program is to be a recognized leader in this field and fulfill companies seeking Digital Transformation for their originations.
THE NEED FOR PROFESSIONAL CONSULTANCY AND THE OPPORTUNITY FOR MASSIVE GROWTH
Four consultancies lead Ad Age's ranking of the 10 largest agency companies in the world. With combined revenue of $13.2 billion, the marketing services units of Accenture, PwC, IBM and Deloitte sit just below WPP, Omnicom, Publicis Groupe, Interpublic and Dentsu. Last year, only two consultancies—Accenture Interactive and IBM iX—made the top 10. IBM iX was the first to break into the top 10.
Given the experience of the team, Digital Clarity’s advisory and consultancy is in demand. With the recent growth in these business areas, and the rise of consultancies, it is confirmation that Digital Clarity is headed in the right direction for growth.growth
THE GROWTH OF DIGITAL TRANSFORMATION WORLDWIDE
The Global Digital Transformation Market size is expected to reach $1,302.9$1.3 billion by 2027, rising at a market growth of 20.8% CAGR during the forecast period. Digital transformation is considered as the utilization of digital technology. Digitally transformed enterprises can be flexible to the changing technological landscape and can address abrupt shifts in the industry, particularly the one presently created by the COVID-19 pandemic; studies show that the efficiency and rate of adaptation of digitally transformed companies to a post-pandemic era are relatively larger than conventional businesses. Source
Digital Clarity can help various businesses that have been considerably affected by the global outbreak of the COVID-19 pandemic. One of the significant challenges for the global economy in 2020 was to facilitate business continuity in the midst of social distancing guidelines, lockdowns norms, work-from-home culture, and other operational challenges. The lack of availability of digital strategies, infrastructure, or tools worsens the challenges for various companies that were needed to abruptly shift operations online or allow workers to work from their homes.
The situation, on the other hand, resulted in a considerable surge in awareness regarding the urgent requirement for digital transformation across a majority of the industries and created some lucrative opportunities for the global market. Companies are getting more aware of the advantages of digital transformation, particularly in the work-from-home culture that needs a business to allow the employees to easily learn, collaborate and perform organizational functions across remote locations.
DIGITAL CONTINUES TO DRIVE GROWTH IN CONSULTINGTHE IMPORTANCE OF STRATEGIC MARKETING CONSULTANCY
Such isThe fundamentals of marketing may not have changed, but everything else has: goals, roles, expectations, talent needs, and more. B2B marketing leaders need to navigate this new terrain and build the dominance of US consulting, that its status as the world’s largest consulting market barely bears mentioning anymore. The global consulting market grew by about 8%capabilities needed to $160 billion in 2020, but accounting for 44% of that, the US saw another year of meteoric growth last year according to Source Global Research. While it is still undeniably America first when it comes to consulting, however, the battle to be the second largest consulting market is much more tightly contested.
Despite slowed growth in the UK, the management consulting market in the UK has remained the globe’s second largest. Nearest rival Germany accounts for 0.3% less of the global consulting market than Britain.
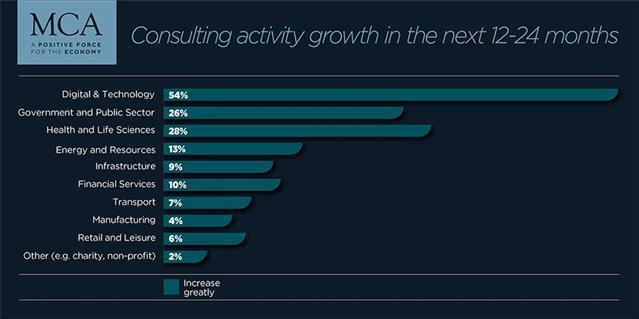
THE IMPORTANCE OF STRATEGIC CONSULTANCY IN 2022 AND BEYONDwin. Digital Clarity helps these organizations win.
Across industries, organizations are accelerating digital transformation processes for long-term growth and profitability. Yet: “53% of the organizations surveyed remain untested in the face of digital challenge and their digital transformation readiness therefore uncertain.” This report from Gartner highlights the need embrace change.
Businesses had no choice but to respond quickly to challenging conditions. Although not formally classed as ‘agile’, the twists and turns of the pandemic have required executives to innovate on the fly and collaborate to get things done. This has been compounded by working from home, which has cut out distractions and created more time for ‘deep thinking’. Regardless of headcount, a return to more stable trading conditions shouldn’t mean running back to the standard practices and silos that previously slowed marketers down.
Adobe says that Business-to-business (B2B) commerce will continue to undergo a major transformation in 2021 as companies adopt the latest technologies to find new customers, improve their supply-chain efficiencies, and provide a more personalized user experience to their clientele.
Digital Clarity has created a unique Diagnosis Workshop that helps brands identify needs as well as assess the opportunity available. The core focus is to help reduce wastage and increase results.
Areas of focus include:
| ● | Cost analysis |
| ● | Audit current channels |
| ● | Digital strategy planning |
| ● | ROI projection planning |
| ● | Digital consulting and training |
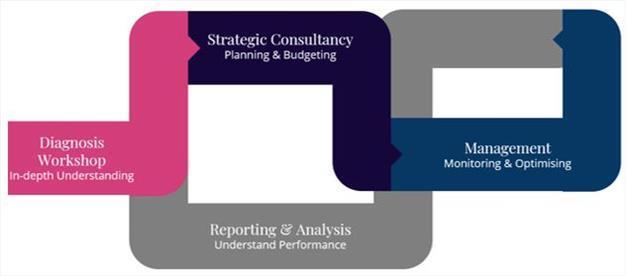
GLOBAL AD SPEND CONTINUES
|
|
|
|
|
|
|
|
Advertising investment is forecast to grow by 10.4% globally in 2021, according to the latest dentsu Ad Spend Report.
COMPETITIVE LANDSCAPE
Digital advertising is the fastest-growing segment of the global market for advertising spending. The increasing use of smartphones and the availability of cheap internet services are the two major factors propelling the growth prospects for this market. More than 30% of the companies are planning to spend around 75% of their advertising expenditures on digital marketing within the next five years.
“U. S. Marketers are expected to spend $110.1 billion on digital ads this year, or 51% of the $214.6 billion total U.S. advertising spending forecast, excluding political ads. Newspapers, radio, magazines, and local television now account for just 21% of the U.S. ad market.” From The Wall Street Journal
DIGITAL CLARITY HAS A COMPETITIVE ADVANTAGE
Digital Clarity operate in a highly commoditized market but have over the years build a stellar reputation that makes it different from its competitors. Some of these areas include:
| 1. | Our DNA is Strategically Driven |
We believe the path to successful customer acquisition lies in understanding a client’s business – not just running a campaign. We seek to help clients understand that success has to be objective and measurable.
| 2. | We are Business Led |
Digital marketing is not a cost but an asset. Not a line in a spreadsheet but an emotive force that if done right, will bring real business change and growth.
| 3. | We are Digital Thinkers |
Marketing has to be at the heart of the business. Delivering real innovation in digital marketing requires not just knowledge but authority and bravery. We think digital. We drive results.
| 4. | Our goal is to deliver Digital Performance |
We help our clients to understand their goals and objectives, using digital marketing to drive new business opportunities and retain their current customers.
In April 2020,
HIS Markit, a research firm, reported: “Each dollar that companies spent on advertising in the United States last year, led to $9 in sales.
THE GROWTH OF B2B SOCIAL MEDIA
2020 will go down as the year that marketing was pulled into the boardroom. 80% of senior executives said the role of marketing in setting strategy has expanded since the pandemic. Traditional consumers have moved online, making the digital environment even more important right now.
This priority has raised the profile of marketing as companies scramble to understand the digital-first consumer. The battleground for 20212023 will be about speed and agility. Now that many companies have treasure troves of data, the difference is how fast they can personalize the experience and respond to consumer behavior.behaviors. Expect to see more investment and innovation in technology infrastructure alongside marketing.
|
|
| ● | 76% of B2B organizations use social media analytics to measure content performance. |
| ● | By 2025, 80% of B2B sales interactions will occur on digital channels. |
| ● | U.S. B2B business will spend an estimated |
GROWTH IN LINKEDIN ADVERTISING SET TO SOAR BEYOND 2023
Almost all B2B content marketers (96%) use LinkedIn. They also rated it as the top-performing organic platform.
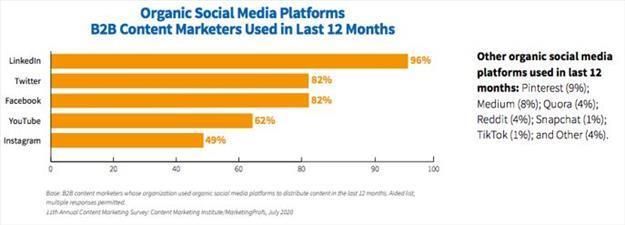
GROWTH IN LINKEDIN ADVERTISING SET TO SOAR TILL 2023
For paid social posts, the picture is similar but not identical.
LinkedIn again comes out on top (80%).Digital Clarity help business organization make the most of LinkedIn. We help customers understand and build campaigns around the 95-5 rule. The 95-5 rule advises you market mostly to buyers who are not likely to buy from you today.
But Facebook outranks Twitter and Instagram outranks YouTube.
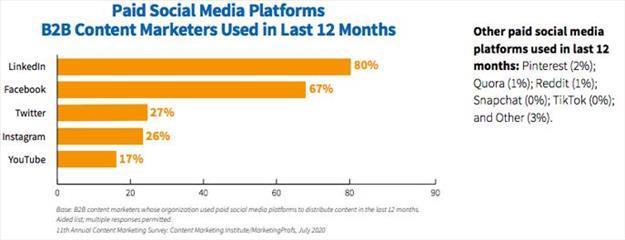
GLOBAL B2B ECOMMERCE SALES IN 2021
In the US alone, B2B eCommerce sales will hit $1.184 trillion by the end of 2021.
The predominance of B2B ecommerce means that B2B businesses must improve and simplify their shopping journey, channeling the B2C ordering experience. The B2B shopping experience is a lot more complicated than that of a B2C buyer.
Because of the nature of the transaction, B2B buyers usually need to go through various steps, including sales representative interaction, negotiations, and approvals before they can make a successful purchase. In short, B2B eCommerce businesses must adapt to a more seamless transaction building advanced functionality quote management, price negotiation, easy ordering, order and inventory management for the B2B market.
According to Forbes Magazine in 2021 the largest ecommerce markets are:
|
|
|
|
|
|
|
|
|
|
|
|
|
|
|
|
|
|
|
|
|
|
|
|
|
|
|
|
|
|
US B2B DIGITAL AD MARKET SET FOR POST PANDEMIC GROWTH
According to eMarketer's July 2021 forecast, 2023 will be a pivotal year for the US B2B digital ad market as spending approaches $15 billion. By then, the seismic transformation spurred by the pandemic will be permanent.
Last year, US B2B pivoted from in-person channels to digital ads to reach audiences. In 2021, the growth in digital ad spending will be even greater than was originally estimated by eMarketer, indicating the shift to digital isn’t slowing down.
Digital ads will also remain a more prevalent part of the B2B media mix in the coming years.
US B2BS SPEND ON LINKEDIN DISPLAY
LinkedIn makes up the largest share of US B2B display in 2021 with 32.2% of the $5.09 billion that will be spent on B2B display this year. We estimate US B2B LinkedIn display ad revenues will be $1.64 billion in the US, growing 27.1% from 2020 when $1.29 billion was spent on LinkedIn B2B display.
US B2BS SPEND ON SEARCH TO INCREASE
In 2021, US B2Bs will spend $5.36 billion on search ads, more than what will be allocated to display.
But search’s growth rate isn’t as strong: It will increase by 19.5% from 2020.
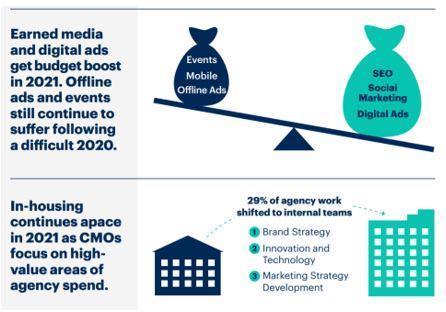
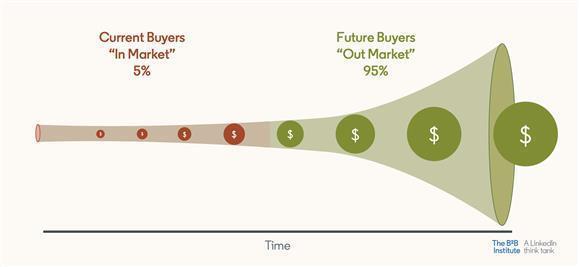
THE NEW NORMAL WILL BEIS DIGITAL
In just one-year, since the pandemic. digital adoption has happened at five to ten times the projected rate.
Lockdown periods, economic uncertainty and loss of predictability have forced customers and businesses online in previously unseen numbers. This migration has upset the power balance, with customers now more in control of the relationship and less loyal to brands and products. On top of that, 60% of companies have seen new buying behaviors such as changes to average basket size and product interests.
Pandemic disruption is also causing many businesses to demand a similar level of convenience to consumers. When we return to normal, there’s no question that the new normal will be digital.
GROWTH IN INVESTOR AWARENESS AND OUTREACH.
During 2022, Digital Brand Media & Marketing Group, Inc. will initiate a significant effort to raise positive awareness of DBMM's growth potential on a global basis. The Company had to continue to defer its 2020/21 plans until certain SEC Matters regarding the delinquent filings brought currentWe expect that, in July 2018, remain open into 2022. The global pandemic made it impossible to initiate any Investor Awareness Program and the SEC matter remains open, so the planning remains in neutral.
Hopefully in 20222023, the strategic outreach will be directed at investors around the world who understand the digital marketplace and its expanding influence on consumer decisions. DBMM will target new investors through a global digital and traditional integrated investor outreach campaign which will be run by Digital Clarity, with third parties, as required, for distribution. In all areas, the Company will act in the interests of all stakeholders.
In the full industry context of dramatic expansion of digital footprints, there has been no direct correlation between DBMM's revenues and its share price. Economic and industry analysts have opined that the industry multiple continues to grow to, in some cases, 25-30 times revenues. DBMM will expand its client and geographic scale, thus increasing revenues. There were matters outside of DBMM's control which caused growth to be in neutral, and in 2020/21 the pandemic threw all planning into disarray. With capital infusion following the closure of the SEC review with a final order of the earlier dismissal, 20222023 will follow the model of a growing client base and geographic reach until it achieves a TBD level of profitability. We anticipate the benchmark will replicate successful industry models in digital technology, marketing and company transformation.
On October 26, 2022, FINRA processed a Form 211 relating to the initiation of priced quotations of our shares of common stock, which means that the submitting broker-dealer has demonstrated to FINRA compliance with FINRA Rule 6432 and therefore has met the requirements under that rule to initiate a quotation for our shares of common stock within four days of October 26, 2022. FINRA’s processing of a Form 211 in no way constitutes FINRA’s approval of the security, the issuer, or the issuer’s business and relates solely to the submitting broker-dealer’s obligation to comply with FINRA Rule 6432 and SEA Rule 15c2-11 when quoting a security. (FINRA TO Glendale Securities)
After OTC Markets’ review of our activities following their process, our shares of common stock returned to normal market trading without restriction or caveat emptor. The caveat emptor was removed on December 20, 2022. Accordingly, plans to grow investor awareness and outreach are underway.
Glendale Securities, Inc. is the designated Market Maker.
The SEC matter has remained open since the November 12, 2019 dismissal regarding the cured late filings. This has been damaging to our investors and us and impedes our progress. Nevertheless, our compliance continued with required timely filings . In June 2023, the SEC issued an Order Dismissing Proceedings as Release 4413 advising us that their administrative proceedings against us has been dismissed
FINANCIAL OVERVIEW/OUTLOOK
DBMM has been honing its commercial model since the acquisition of Digital Clarity (“DC”) in 2011, whichand has been cash-flow positivecash flow-positive as an operating company since its acquisition. Externalthen. Unfortunately, external events outside of DBMM'sDBMM’s control hashave precluded the growth expected to this point,point; however, its margins will continue to be strong on an annual basis, and onceof 35-50% are accurate. Aspirationally, when the businessCompany reaches appropriate scale with assumedand profitability and cross-over point, DBMM trajectory suggests a resultant very successfulTBD, the business forwill meet all of its stakeholders.stakeholder expectations.
The growth trajectory anticipated is expected during 2022, following capital infusion and return2023 remained deferred until the Company returns to normal business and normal trading. Once that occurs,Normal trading has resumed and the clients will benefit immediately due to a wider range of resources;resources, and the shareholders will benefit as the market cap grows. The media market multiple far exceeds the “old” manufacturing multiples, as digital technology and marketing has become one of the fastest growing industries in the world today. The trading in our shares of common stock returned to normal on December 20, 2022 with no restrictions. The US retail marketplace of our shares of common stock was open finally to all investors.
DBMM'sThe return to normal business is a step-by-step process now that the SEC matter is closed in our favor and all mitigating factors circumstances concluded to our benefit. DBMM’s place in the sectorindustry reputationally is strong.strong, particularly for its size. The industry environment continues to grow exponentially, and the future of digital marketing asand company transformation is an essential strategy for any consumer-facing businesscommercial activity, and thus has been proven over-and-over as certain retail businesses are forced to close their doors for lack of or an ineffective digital presence. DBMM's brand, Digital Clarity, increases its valuation with client case studies and industry awards resultingbecome embedded in its being considered a leader in the sector for its size. DBMM's increasing client base, coupled with decreasing certain kind of debt and expenses, positions the Company to attract mezzanine financing, something sought after by many and achieved by few.planning.
Coincidently, 2020/21 resultsSince 2020, revenues have slowed down temporarily due to Brexit unease in the UK and clients concern about trade issues with or without the European Union. So, in the midsta number of thefactors: 1) client uncertainty caused by the Brexit trade issues, 2) COVID-19 global slowdown the COVID -19 global outbreak caused further slowdownwith some clients pausing as lockdowns stopped and started, 3) clients paused and business development much different during an initial lockdown, then lifted only to be reinstated on November 5, 2020. That only made the uncertainty further exacerbated, while clients needneeding to extend or double down on their digital footprintlacked the resources. To address the changing environment, the business development model has evolved and, as the industry has become essential during the pandemic. Nevertheless,such, Digital Clarity is revising its model to adjust to changing circumstances, whenhas earned a “seat at the table,” client by client. With precision, the revenues are paused or delayed and new clients developed.turning around.
TheSeveral years ago, the Company received a commitment for future working capital in order to grow the Company in key markets, with the intent to move to DBMM profitability following a return to normal trading. At that point, DBMM would not require future financing until it was ready to acquire 1-2 additional companies to complement and further develop the digital marketing business.markets. Growth capital will increase as thebe directed to support a client base re-balancedrebalancing and expands in size and scope.
leveraging of a very dynamic, transformational, digital landscape. DC’s mantra remains the same: “ROI is our DNA.” Going forward, there will be an emphasis on investor awareness as soon as the SEC dismissal has been affirmed by the full commission. DBMM has been current in its filings since July 2018 and is encouraged by the outlook afternow that normal trading hasbusiness recommenced. DBMM intends to make significant strides in aggressively wideningbroadening its brand exposure using a variety of digital and social channels.exposure. There are investors around the globe who understand the digital marketplace and its increasing influence on consumercommercial decisions. DBMM will be targeting these new investorsshareholders in the public market through a global digital and traditional, integrated campaign which will be run by Digital Clarity,DC, with third parties, as required for distribution.
The expectations for fiscal year 2022 remain2023 were to return to normal trading following affirmance of the dismissal by the full commission. The Company intends tofirst, which now has occurred, and then move ahead thereafter to thea scaled growth plan in multiple geographies toonce normal business recommenced and the SEC matter is finally closed. The result will benefit all stakeholders, being mindfulstakeholders.
The Company resolved in 2015 to eliminate any consideration of using convertible debentures as a financing vehicle. Accordingly, the impactCompany has not issued convertible debentures since 2015 nor have any convertible debentures been executed since 2016.
Additionally, we have demonstrated our adherence to such a philosophy by renegotiating its aged debt with lenders, one at a time, at fixed settlement amounts with no conversion terms. Furthermore, such renegotiations lead to the derecognition of the global pandemic.derivative liabilities overhanging our balance sheet. The Company intends to continue its debt negotiation and modification program.
This has been a successful strategy thus far:
During fiscal year 2021 and so far in 2022,2023, and to a lesser extent in fiscal 2020, we successfully reached agreements with certain lenders resulting in a gain on extinguishment for loans payable which amounted to the difference between the carrying value and the revised amount of the obligations.
The gain on extinguishment of principal and accrued interest amounted to $169,837 and $57,802 and during fiscal 2021 and 2020, respectively.
We also successfully reached an agreement with a holder of convertible debentures aggregating $249,800 to modify its terms. Such debentures are no longer convertible, are now non-interest bearing, and have been reclassified to loans payable. It also resulted in a decrease in derivative liabilities and an increase in additional paid-in capital of approximately $260,000 during fiscal 2021.
Finally,Furthermore, in March 2022, we reached an agreement with a holder of convertible debentures to satisfy obligations aggregating $85,000 in consideration of 30,000,00030 million shares of the Company’s common stock.
We have not issuedIn February 2023, we reached an agreement with a holder of convertible debentures since 2015.to satisfy obligations aggregating $76,000 in consideration of 7.5 million shares of the Company’s common stock.
NINE-MONTHIn May 2023, we reduced our liability to a lessor by $15,000.
NINE MONTH PERIOD ENDED MAY 31, 2023
We had $22,000 in cash and our working capital deficiency amounted to approximately $6.5 million at May 31, 2023.
During the nine-month period ended May 31, 2023, we used cash in our operating activities amounting to $296,000. Our cash used in operating activities was comprised of our net loss of approximately $716,000 adjusted primarily for the following:
Change in fair value of derivative liability of approximately $129,000;
Additionally, the following variations in operating assets and liabilities during the nine-month period ended May 31, 2023 impacted our cash used in operating activity:
Increase of accounts payable, accrued expenses, accrued interest, and accrued compensation, of approximately $216,000, resulting from a short fall in liquidity and capital resources.
We generated cash from financing activities of $309,000 which primarily consists of the proceeds from notes payable.
NINE MONTH PERIOD ENDED MAY 31, 2022
We had $14,000 in cash and our working capital deficiency amounted to approximately $5.75 million at May 31, 2022.
During the nine-month period ended May 31, 2022, we used cash in our operating activities amounting to approximately $257,000. Our cash used in operating activities was comprised of our net loss of approximately $405,000 adjusted primarily for the following:
Change in fair value of derivative liability of $265,000 and loss on extinguishment of debt of $83,000;
Additionally, the following variations in operating assets and liabilities during the nine-month period ended May 31, 2022 impacted our cash used in operating activity:
Increase in accountsAccounts payable, accrued expenses, accrued interest, and accrued compensation, of $334,000,approximately $303,000, resulting from a short fall in liquidity and capital resources.
We generated cash from financing activities of $262,000 which primarily consists of the proceeds from the issuance of loansnotes payable.
NINE-MONTH PERIOD ENDED MAY 31, 2021
We had approximately $20,000 in cash and our working capital deficiency amounted to $5.7 million at May 31, 2021.
During the nine-month period ended May 31, 2021, we used cash in our operating activities amounting to $321,000. Our cash used in operating activities was comprised of our net loss from continuing operations of $530,000 adjusted for the following:
Change in fair value of derivative liability of $69,000
Additionally, the following variations in operating assets and liabilities during the nine-month period ended May 31, 2022 impacted our cash used in operating activity:
Increase in accounts payable, accrued expenses, accrued interest, and accrued compensation, of approximately $284,000, resulting from a short fall in liquidity and capital resources.
During the nine-month period ended May 31, 2021, we generated cash from financing activities of $306,000, which consist of the proceeds from the issuance of loan payables.
| Unaudited Consolidated Operating Results | ||||||||||||||||||||||||||||||||
| For the Three Months Ended | For the Nine Months Ended | |||||||||||||||||||||||||||||||
| Increase/ | Increase/ | Increase/ | Increase/ | |||||||||||||||||||||||||||||
| May 31, | May 31, | (Decrease) | (Decrease) | May 31, | May 31, | (Decrease) | (Decrease) | |||||||||||||||||||||||||
| 2022 | 2021 | $ | % | 2022 | 2021 | $ | % | |||||||||||||||||||||||||
SALES | $ | 68,130 | $ | 45,456 | $ | 22,674 | 50 | % | $ | 164,976 | $ | 120,538 | $ | 44,438 | 37 | % | ||||||||||||||||
COST OF SALES | 30,217 | 50,417 | (20,200 | ) | -40 | % | 102,090 | 150,156 | (48,066 | ) | -32 | % | ||||||||||||||||||||
GROSS PROFIT | 37,913 | (4,961 | ) | 42,874 | 90 | % | 62,886 | (29,618 | ) | 92,504 | 69 | % | ||||||||||||||||||||
COSTS AND EXPENSES | ||||||||||||||||||||||||||||||||
Sales, general and administrative | 124,451 | 138,079 | (13,628 | ) | -10 | % | 441,908 | 377,173 | 64,735 | 17 | % | |||||||||||||||||||||
TOTAL OPERATING (GAIN) EXPENSES | 121,451 | 138,079 | (13,628 | ) | -10 | % | 441,908 | 377,173 | 64,735 | 17 | % | |||||||||||||||||||||
OPERATING GAIN (LOSS) | (86,538 | ) | (143,040 | ) | 56,502 | -40 | % | (379,022 | ) | (406,791 | ) | 27,769 | -7 | % | ||||||||||||||||||
OTHER (INCOME) EXPENSE | ||||||||||||||||||||||||||||||||
Interest expense | 95,599 | 54,315 | 41,284 | 76 | % | 307,240 | 192,274 | 114,966 | 60 | % | ||||||||||||||||||||||
Other income | - | - | - | NM | (98,265 | ) | - | 98,265 | NM | |||||||||||||||||||||||
Loss on extinguishment of debt | 82,485 | - | 82,485 | NM | 82,845 | - | 82,845 | NM | ||||||||||||||||||||||||
Change in fair value of derivative liability | 18,273 | (3,309 | ) | 21,582 | NM | (265,724 | ) | (68,864 | ) | 196,860 | 286 | % | ||||||||||||||||||||
TOTAL OTHER EXPENSE | 196,357 | 51,006 | 145,351 | NM | 26,096 | 123,410 | (97,314 | ) | 79 | % | ||||||||||||||||||||||
NET LOSS | $ | (282,895 | ) | $ | (194,046 | ) | $ | (88,849 | ) | 46 | % | $ | (405,118 | ) | $ | (530,201 | ) | $ | 125,083 | -24 | % | |||||||||||
(NM): not meaningful | ||||||||||||||||||||||||||||||||
RESULTS OF OPERATIONS
| Consolidated Operating Results | ||||||||||||||||||||||||||||||||
| For the Three-Month Period Ended | For the Nine-Month Period Ended | |||||||||||||||||||||||||||||||
| Increase/ | Increase/ | Increase/ | Increase/ | |||||||||||||||||||||||||||||
| May 31, | May 31, | (Decrease) | Decrease | May 31, | May 31, | (Decrease) | Decrease | |||||||||||||||||||||||||
| 2023 | 2022 | $ | % | 2023 | 2022 | $ | % | |||||||||||||||||||||||||
SALES | $ | 98,496 | $ | 68,130 | $ | 30,366 | 45 | % | $ | 221,356 | $ | 164,976 | $ | 56,380 | 34 | % | ||||||||||||||||
COST OF SALES | 81,789 | 30,217 | 51,572 | 1719 | % | 185,690 | 102,090 | 83,600 | 82 | % | ||||||||||||||||||||||
GROSS PROFIT | (16,707 | ) | 37,913 | (21,206 | ) | -56 | % | 35,666 | 62,886 | (27,220 | ) | -43 | % | |||||||||||||||||||
COSTS AND EXPENSES | ||||||||||||||||||||||||||||||||
Sales, general and administrative | 107,022 | 124,451 | (17,249 | ) | -14 | % | 371,272 | 441,908 | (70,636 | ) | -16 | % | ||||||||||||||||||||
TOTAL OPERATING EXPENSES | 107,022 | 124,451 | (17,249 | ) | -14 | % | 371,272 | 441,908 | (70,636 | ) | -16 | % | ||||||||||||||||||||
OPERATING LOSS | (90,315 | ) | (86,538 | ) | (3,777 | ) | 4 | % | (335,606 | ) | (379,072 | ) | (43,416 | ) | -11 | % | ||||||||||||||||
OTHER (INCOME) EXPENSE | ||||||||||||||||||||||||||||||||
Interest expense | 68,391 | 95,599 | (27,208 | ) | -28 | % | 224,317 | 307,240 | (82,923 | ) | -27 | % | ||||||||||||||||||||
Other income | - | NM | (46,255 | ) | (98,265 | ) | 52,010 | NM | ||||||||||||||||||||||||
Loss on settlement of debt | (15,375 | ) | 82,485 | (97,860 | ) | NM | 73,349 | 82,845 | (9,496 | ) | NM | |||||||||||||||||||||
Change in fair value of derivative liability | (166,865 | ) | 18,273 | (185,138 | ) | NM | 128,697 | (265,724 | ) | 394,421 | NM | |||||||||||||||||||||
TOTAL OTHER EXPENSES (INCOME), NET | (113,849 | ) | 196,357 | (310,206 | ) | NM | 380,108 | 26,096 | 354,012 | NM | ||||||||||||||||||||||
NET LOSS | $ | 23,534 | $ | (282,895 | ) | $ | (306,429 | ) | -108 | % | $ | (715,714 | ) | $ | (405,118 | ) | $ | 310,596 | 77 | % | ||||||||||||
NM: not meaningful | ||||||||||||||||
We currently generate revenue through our Pay-Per-Click Advertising, Search Engine Marketing, Search Engine Optimization Services, Web Design, Social Media, Digital analytics and Advisory Services.
For the three-month and nine-month periodsperiod ended May 31, 20222023 our primary sources of revenue are the Web design and advisory services, Per-Click Advertising, and Social Media. These primary sources amounted to 65%48%, 34%38%, and 1%14% of our revenues, respectively during the nine-month period ended May 31, 2022.2023.
Revenue is recognized upon transfer of control of promised or services to customers in an amount that reflects the consideration the Company expect to receive in exchange for those services. The Company enter into contracts that can include various combinations of services, which are generally capable of being distinct and accounted for as separate performance obligations. Revenue is recognized net of any taxes collected from customers, which are subsequently remitted to governmental authorities.
The increase in our revenues during the three-monththree and nine-month periodsperiod ended May 31, 2022,2023, when compared to the prior year, is due to increase activity following the easeincreased volume of restrictions in the UK associated with COVID-19services provided and its impact on Digital Clarity’s clients.new clients during fiscal 2023.
During the three-monththree and nine-month periodsperiod ended May 31, 2022,2023, our cost of sales decreasedincreased due to reduction in compensation streamlining our deliverya greater amount of services.resources allocated to servicing customer needs and identifying new clients.
The sales, general and administrative expenses decreased during the three-monththree and nine-months periodsnine-month period ended May 31, 2022 were at comparable levels2023 when compared to the prior year periods.periods primarily as a result of decreased overhead expenses and streamlined operations in fiscal 2023.
Interest expenseexpenses during the three-monththree and nine-monthsix-month decreased when compared to the prior year periods ended May 31, 2022 increased by additional considerationprimarily from the decrease of considerations provided to a lender upon issuance of loans payable.certain lenders in fiscal 2023 when compared to fiscal 2022.
The decreasechange in other expenseincome during the nine-month periodnine months ended May 31, 2022 is primarily attributable to the recognition of certain tax credits related to expenses incurred in the United Kingdom and the increase in other expenses during the three-month period ended May 31, 20222023 is primarily due to a loss on settlement of debt.lower research and development credits claimed during that period than in fiscal 2022.
The decreasechange in the fair value of in derivative liabilities during the three-month and nine-monthbetween comparable periods ended May 31, 2022 is primarily attributable to a decreasean increase in the Company’s estimatedstock price and fluctuation in expected volatility used in the assumptions to compute its fair value at May 31, 20222023 when compared to May 31, 2021.2022.
ITEM 3. QUANTITATIVE AND QUALITATIVE DISCLOSURE ABOUT MARKET RISK
As a “smaller reporting company”, as defined by Rule 10(f)(1) of Regulation S-K, the Company is not required to provide this information.
ITEM 4. CONTROLS AND PROCEDURES
Evaluation of Disclosure Controls and Procedures
Our management is responsible for establishing and maintaining a system of disclosure controls and procedures (as defined in Rule 13a-15(e) and 15d-15(e) under the Exchange Act) that is designed to ensure that information required to be disclosed by us in the reports that we file or submit under the Exchange Act is recorded, processed, summarized and reported, within the time periods specified in the Commission’s rules and forms. Disclosure controls and procedures include, without limitation, controls and procedures designed to ensure that information required to be disclosed by an issuer in the reports that it files or submits under the Exchange Act is accumulated and communicated to the issuer’s management, including its principal executive officer or officers and principal financial officer or officers, or persons performing similar functions, as appropriate to allow timely decisions regarding required disclosure.
As of the end of the period covered by this report, management, including our Principal Executive Officer and Principal Financial Officer, evaluated the effectiveness of our disclosure controls and procedures pursuant to Rules 13a-15(e) and 15d-15(e) under the Act.
Based upon the evaluation, our Principal Executive Officer and Principal Financial Officer concluded that our disclosure controls and procedures were effective as of May 31, 2022.2023. Our management concluded that the consolidated financial statements included in this report fairly present, in all material respects, our financial position, results of operations and cash flows for the period presented in accordance with GAAP.
Changes in Internal Controls Over Financial Reporting:
There were no changes in our internal control over financial reporting during the quarter ended May 31, 20222023 identified in connection with the evaluation thereof by our management, including our Principal Executive Officer and Principal Financial Officer, that have materially affected, or are reasonably likely to materially affect, our internal control over financial reporting.
PART II - OTHER INFORMATION
Item 1. Legal Proceedings
The U.S. Securities & Exchange Commission instituted an Administrative Proceeding, File No. 3-17990, on May 16, 2017 to revoke the Company's registration statement because of delinquent filings. A hearing was held on August 9, 2017 and the Initial Decision to revoke the registration was dated November 16, 2017. The order was subsequently remanded by order of the U.S. Supreme Court in December 2017. The Company responded to the Remand with evidence of mitigating circumstances under a Protective Order and filed all its delinquent filings: a Super 10-K for 2015-2016-2017 on May 31, 2018 and 10-Q's for 2018 1Q, 2Q on June 22, 2018 and 3Q on July 15, 2018, its due date.
The Hearing for January 15, 2019 was re-scheduled because of government shutdown. Digital Brand entered a Motion to Dismiss the Proceedings on March 19, 2019 based on being current as of July 2018, and all filings to date have been filed on time for the 2019 fiscal year. The facts were presented at the hearing. The Division did not support the dismissal in a response to which Digital Brand filed two Amendments to the Consolidated 10-K for 2015- 2016-2017 and the 10-K for 2018 on April 23 and 24, 2019 respectively, and Amendments No. 2 on October 1, 2019 to supersede language in Part II, Item 9A. On November 12, 2019, Carol Fox Foelak, Administrative Law Judge, Securities & Exchange Commission ordered an Initial Decision/Dismissal of the Proceeding. The Dismissal would have become effective under Rule 360 of the Commission's Rules of Practice, 17 C.F.R., Section 201.360, following the Commission’s Order of Finality. Unfortunately, on December 3, 2019 The Division of Enforcement Submitted a Petition for Review of Judge Carol Fox Foelak’s Initial Decision dismissing the Administrative Proceedings rendered on November 12, 2019. The Company filed a Motion for summary affirmance of the Initial Decision on December 20, 2019. The Motion for Summary Affirmance was not opposed by Enforcement, nevertheless the Petition for Review (“PFR”) was filed earlier.
On January 25, 2021, the Commission denied the Company’s Motion for Summary Affirmance of Judge Carol Fox-Foelak’s Dismissal of November 12, 2019 and granted the Division’s Petition for Review and set a briefing schedule beginning February 24, 2021. The Commission concluded that “briefing in the ordinary course would...assist the Commission. This appeal raises issues as to which we have an interest in articulating our views and important matters of public interest, including the proper application of the standard that governs determination of sanctions in a Section 12(j) proceeding.” Both parties have briefed and concluded April, 2021. The Company is disappointed that so much time has been lost and continues to vociferously support the original Dismissal two and a halfthree years ago.
The Commission notified the Company on December 9, 2021 that an extension of 90 days to issue a decision has been ordered. The CommissionA sixth extension was ordered a third 90-day extension to issue a decisionfor an additional 90 days to conclude September 6, 2022. The Company hasby June 5, 2023.
On June 2, 2023, the SEC issued an Order Dismissing Proceedings under Release 4413 advising us that that their pending administrative proceedings against us had been sponsored by a broker to resume trading via a Form 211 application todismissed. A final Order of Dismissal closes the Financial Industry Regulatory Authority. The Company continues to review options to support bringing this matter to conclusion as soon as possible.after previous unnecessary protracted delays.
Shareholders have been significantly damaged by the protracted SEC matter. The delays were further exacerbated by the unnecessary PFR requested by the Division of Enforcement while the Company continued its meetsto meet its reporting compliance in good faith as committed to the court and contained in its cured SEC filings and thereafter.
From time to time, the Company has become or may become involved in certain lawsuits and legal proceedings which arise in the ordinary course of business. The Company intends to vigorously defend its positions. However, litigation is subject to inherent uncertainties and an adverse result in those or other matters may arise from time to time that may harm its financial position, or our business and the outcome of these matters cannot be ultimately predicted.
Item 1A. Risk Factors
As a “smaller reporting company” as defined by Item 10 of Regulation S-K, the Company is not required to provide information required by this item.
Item 2. Unregistered Sale of Equity Securities and Use of Proceeds
None
Item 3. Defaults Upon Senior Securities
None.
Item 4. Submission of Matters to a Vote of Security Holders
None.
Item 5. Other Information
None.
Item 6. Exhibits
31.1 |
| Principal Executive Officer Rule 13a-14(a) Certification Principal Financial Officer Executive Director |
32.1 |
| Principal Executive Officer Sarbanes-Oxley Act Section 906 Certification Principal Financial Officer Executive Director |
|
|
|
101.INS |
| Inline XBRL Instance Document |
101.SCH |
| Inline XBRL Taxonomy Extension Schema Document |
101.CAL |
| Inline XBRL Taxonomy Extension Calculation Linkbase Document |
101.DEF |
| Inline XBRL Taxonomy Extension Definition Linkbase Document |
101.LAB |
| Inline XBRL Taxonomy Extension Labels Linkbase Document |
101.PRE |
| Inline XBRL Taxonomy Extension Presentation Linkbase Document |
104 |
| Cover Page Interactive Data File (formatted as Inline XBRL and contained in Exhibit 101) |
SIGNATURES
Pursuant to the requirements of the Securities and Exchange Act of 1934, the Registrant has duly caused this report to be signed on its behalf by the undersigned, thereunto duly authorized.
DIGITAL BRAND MEDIA & MARKETING GROUP, INC.
Date: September 23, 2022
July 17, 2023
By: /s/ Linda Perry
Linda Perry
Principal Executive Officer
Principal Financial Officer
Executive Director