UNITED STATES
SECURITIES AND EXCHANGE COMMISSION
WASHINGTON, D.C. 20549
FORM 10-Q/A
(Amendment No.1)10-Q
(Mark One)
☒ QUARTERLY REPORT PURSUANT TO SECTION 13 or 15(d) OF THE SECURITIES EXCHANGE ACT OF 1934.
For the quarterly period endedDecemberMarch 31, 20172018
☐ TRANSITION REPORT PURSUANT TO SECTION 13 OR 15(d) OF THE SECURITIES EXCHANGE ACT OF 1934.
For the transition period from ____________ to ____________
Commission File Number 001-34260
CHINA GREEN AGRICULTURE, INC.
(Exact name of registrant as specified in its charter)
| Nevada | 36-3526027 | |
| (State or other jurisdiction of | (IRS Employer | |
| incorporation or organization) | Identification No.) |
3rd floor, Borough A, Block A. No. 181, South Taibai
Road, Xi’an, Shaanxi province, PRC 710065 | ||
| (Address of principal executive offices) (Zip Code) |
+86-29-88266368
(Issuer’s telephone number, including area code)
| +86-29-88266368 | ||
| (Issuer's telephone number, including area code) |
Indicate by check mark whether the issuer (1) filed all reports required to be filed by Section 13 or 15(d) of the Securities Exchange Act of 1934 during the preceding 12 months (or for such shorter period that the registrant was required to file such reports), and (2) has been subject to such filing requirements for the past 90 days. Yes ☒ No ☐
Indicate by check mark whether the registrant has submitted electronically and posted on its corporate Web site, if any, every Interactive Data File required to be submitted and posted pursuant to Rule 405 of Regulation S-T (§232.405 of this chapter) during the preceding 12 months (or for such shorter period that the registrant was required to submit and post such files). Yes ☒ No ☐
Indicate by check mark whether the registrant is a large accelerated filer, an accelerated filer, a non-accelerated filer, smaller reporting company, or an emerging growth company. See the definitions of “large accelerated filer,” “accelerated filer,” “smaller reporting company,” and “emerging growth company” in Rule 12b-2 of the Exchange Act.
| Large accelerated filer | ☐ | Accelerated filer | ☐ | |
| Non-accelerated filer | ☐ (Do not check if a smaller reporting company) | Smaller reporting company | ☒ | |
| Emerging growth company | ☐ | |||
If an emerging growth company, indicate by check mark if the registrant has elected not to use the extended transition period for complying with any new or revised financial accounting standards provided pursuant to Section 13(a) of the Exchange Act. ☐
Indicate by check mark whether the registrant is a shell company (as defined in Rule 12b-2 of the Exchange Act). Yes ☐ No ☒
APPLICABLE ONLY TO CORPORATE ISSUERS:
Indicate the number of shares outstanding of each of the issuer’sissuer's classes of common stock, as of the latest practicable date: 38,551,26538,896,945 shares of common stock, $0.001$.001 par value, as of February 9,May 8, 2018.
Explanatory Note
This Amendment No. 1 to the Quarterly Report on Form 10-Q/A is filed as an amendment to the Quarterly Report on Form 10-Q for the quarter ended December 31, 2017 filed by China Green Agriculture, Inc. (the "Company") on February 13, 2018. The purpose of this Amendment No. 1 is to revise certain disclosures pursuant to the comment letter received from the SEC in connection with our filing of the Form 10-Q on February 16, 2018.
In this Amendment, the following changes were included:
● The disclosure of recent accounting pronouncements in Note 2 of Notes to Consolidated Condensed Financial Statements under Item 1 that ASU 2016-10, 2016-11, 2016-12 will be effective for us beginning July 1, 2018; and
● The disclosure of changes in inventories at the discussion of Liquidity and Capital Resources under Item 2, Management’s Discussion and Analysis of Financial Condition and Results of Operations.
This Form 10-Q/A has not been updated or modified in any other way and speaks only as of the date of the original filing, February 13, 2018, unless otherwise noticed. Accordingly, this Form 10-Q/A should be read in conjunction with the original filing and all filings made with the SEC subsequent to the date of the original filing.
TABLE OF CONTENTS
| Page | ||
| PART I | FINANCIAL INFORMATION | 1 |
| Item 1. | Financial Statements | 1 |
| Consolidated Condensed Balance Sheets As of March 31, 2018 and June 30, 2017 (Unaudited) | 1 | |
| Consolidated Condensed Statements of Income and Comprehensive Income For the Three and Nine months Ended March 31, 2018 and 2017 (Unaudited) | 2 | |
| Consolidated Condensed Statements of Cash Flows For the Nine months Ended March 31, 2018 and 2017 (Unaudited) | 3 | |
| Notes to Consolidated Condensed Financial Statements As of March 31, 2018 (Unaudited) | 4 | |
| Item 2. | Management’s Discussion and Analysis of Financial Condition and Results of Operations | |
| Item 3. | Quantitative and Qualitative Disclosures About Market Risk | 39 |
| Item 4. | Controls and Procedures | 40 |
| PART II | OTHER INFORMATION | 41 |
| Item 6. | Exhibits | 41 |
| Signatures | ||
| Exhibits/Certifications | 43 | |
PART I – FINANCIAL INFORMATION
Item 1. Financial Statements
CHINA GREEN AGRICULTURE, INC. AND SUBSIDIARIES
CONSOLIDATED BALANCE SHEETS
(UNAUDITED)
| March 31, 2018 | June 30, 2017 | |||||||
| ASSETS | ||||||||
| Current Assets | ||||||||
| Cash and cash equivalents | $ | 153,639,728 | $ | 123,050,548 | ||||
| Accounts receivable, net | 159,291,526 | 140,252,335 | ||||||
| Inventories | 80,715,004 | 78,013,891 | ||||||
| Prepaid expenses and other current assets | 3,730,085 | 4,201,782 | ||||||
| Amount due from related parties | 556,286 | 1,412,844 | ||||||
| Advances to suppliers, net | 19,059,434 | 24,023,062 | ||||||
| Total Current Assets | 416,992,063 | 370,954,462 | ||||||
| Plant, Property and Equipment, Net | 33,637,684 | 34,191,332 | ||||||
| Deferred Asset, Net | - | 864,070 | ||||||
| Other Assets | 310,350 | 279,031 | ||||||
| Other Non-current Assets | 17,291,085 | 17,829,621 | ||||||
| Intangible Assets, Net | 21,874,916 | 22,911,876 | ||||||
| Goodwill | 8,604,536 | 8,651,238 | ||||||
| Total Assets | $ | 498,710,633 | $ | 455,681,630 | ||||
| LIABILITIES AND STOCKHOLDERS' EQUITY | ||||||||
| Current Liabilities | ||||||||
| Accounts payable | $ | 22,099,127 | $ | 19,643,897 | ||||
| Customer deposits | 4,781,397 | 7,046,570 | ||||||
| Accrued expenses and other payables | 11,552,171 | 9,135,312 | ||||||
| Amount due to related parties | 3,329,975 | 3,071,102 | ||||||
| Taxes payable | 4,229,175 | 2,690,407 | ||||||
| Short term loans | 1,750,100 | 7,678,111 | ||||||
| Interest payable | 411,671 | 256,904 | ||||||
| Derivative liability | 115,017 | 195,812 | ||||||
| Total Current Liabilities | 48,268,633 | 49,718,116 | ||||||
| Long-term Liabilities | ||||||||
| Long-term loan | - | �� | 3,549 | |||||
| Convertible notes payable | 7,655,604 | 8,431,912 | ||||||
| Total Liabilities | $ | 55,924,237 | $ | 58,153,577 | ||||
| Stockholders' Equity | ||||||||
| Preferred Stock, $.001 par value, 20,000,000 shares authorized, zero shares issued and outstanding | - | - | ||||||
| Common stock, $.001 par value, 115,197,165 shares authorized, 38,551,265 shares issued and outstanding as of March 31, 2018 and June 30, 2017, respectively | 38,551 | 38,551 | ||||||
| Additional paid-in capital | 128,915,651 | 128,915,651 | ||||||
| Statutory reserve | 30,517,020 | 28,962,302 | ||||||
| Retained earnings | 263,732,243 | 244,738,993 | ||||||
| Accumulated other comprehensive income | 19,582,931 | (5,127,444 | ) | |||||
| Total Stockholders' Equity | 442,786,396 | 397,528,052 | ||||||
| Total Liabilities and Stockholders' Equity | $ | 498,710,633 | $ | 455,681,629 | ||||
The accompanying notes are an integral part of these consolidated financial statements.
| 1 |
CHINA GREEN AGRICULTURE, INC. AND SUBSIDIARIES
CONSOLIDATED STATEMENTS OF INCOME AND COMPREHENSIVE INCOME (LOSS)
(UNAUDITED)
Three Months Ended March 31, | Nine Months Ended March 31, | |||||||||||||||
| 2018 | 2017 | 2018 | 2017 | |||||||||||||
| Sales | ||||||||||||||||
| Jinong | $ | 27,490,333 | $ | 26,316,821 | $ | 80,475,373 | $ | 84,570,215 | ||||||||
| Gufeng | 38,932,597 | 30,858,499 | 81,602,384 | 67,734,572 | ||||||||||||
| Yuxing | 3,041,891 | 2,781,003 | 6,788,282 | 6,590,728 | ||||||||||||
| VIEs - others | 13,086,062 | 21,349,305 | 40,416,989 | 43,039,748 | ||||||||||||
| Net sales | 82,550,883 | 81,305,628 | 209,283,028 | 201,935,263 | ||||||||||||
| Cost of goods sold | ||||||||||||||||
| Jinong | 13,526,095 | 12,143,167 | 39,904,678 | 37,744,757 | ||||||||||||
| Gufeng | 34,114,896 | 26,319,435 | 71,261,349 | 57,843,171 | ||||||||||||
| Yuxing | 2,517,989 | 2,230,319 | 5,446,780 | 5,209,973 | ||||||||||||
| VIEs - others | 11,231,992 | 19,260,074 | 33,893,743 | 37,173,460 | ||||||||||||
| Cost of goods sold | 61,390,972 | 59,952,995 | 150,506,550 | 137,971,361 | ||||||||||||
| Gross profit | 21,159,911 | 21,352,633 | 58,776,478 | 63,963,902 | ||||||||||||
| Operating expenses | ||||||||||||||||
| Selling expenses | 3,553,306 | 6,130,825 | 16,414,318 | 15,108,275 | ||||||||||||
| Selling expenses - amortization of deferred asset | - | 1,556,031 | 11,140,251 | |||||||||||||
| General and administrative expenses | 7,980,606 | 3,971,890 | 15,890,586 | 11,837,282 | ||||||||||||
| Total operating expenses | 11,533,912 | 11,658,746 | 32,304,904 | 38,085,808 | ||||||||||||
| Income from operations | 9,625,999 | 9,693,887 | 26,471,574 | 25,878,094 | ||||||||||||
| Other income (expense) | ||||||||||||||||
| Other income (expense) | (145,311 | ) | 330,538 | (438,114 | ) | 175,366 | ||||||||||
| Discontinued VIE operation - Zhenbai | - | - | (322,214 | ) | - | |||||||||||
| Interest income | 138,009 | 79,280 | 356,172 | 232,396 | ||||||||||||
| Interest expense | (178,478 | ) | (232,639 | ) | (452,640 | ) | (464,430 | ) | ||||||||
| Total other income (expense) | (185,780 | ) | 177,179 | (856,826 | ) | (56,668 | ) | |||||||||
| Income before income taxes | 9,440,220 | 9,871,066 | 25,614,747 | 25,821,426 | ||||||||||||
| Provision for income taxes | 1,813,187 | 1,679,391 | 5,066,780 | 4,772,160 | ||||||||||||
| Net income | 7,627,033 | 8,191,675 | 20,547,967 | 21,049,266 | ||||||||||||
| Other comprehensive income (loss) | ||||||||||||||||
| Foreign currency translation gain (loss) | 16,213,419 | (2,801,325 | ) | 24,710,375 | (19,248,388 | ) | ||||||||||
| Comprehensive income (loss) | $ | 23,840,452 | $ | 5,390,350 | $ | 45,258,342 | $ | 1,800,878 | ||||||||
| Basic weighted average shares outstanding | 38,551,265 | 38,532,033 | 38,551,265 | 37,941,957 | ||||||||||||
| Basic net earnings per share | $ | 0.20 | $ | 0.21 | $ | 0.53 | $ | 0.55 | ||||||||
| Diluted weighted average shares outstanding | 38,896,945 | 38,532,033 | 38,896,945 | 37,941,957 | ||||||||||||
| Diluted net earnings per share | 0.19 | 0.21 | 0.53 | 0.55 | ||||||||||||
The accompanying notes are an integral part of these consolidated financial statements.
| 2 |
CHINA GREEN AGRICULTURE, INC. AND SUBSIDIARIES
CONSOLIDATED STATEMENTS OF CASH FLOWS
(UNAUDITED)
Nine Months Ended March 31, | ||||||||
| 2018 | 2017 | |||||||
| Cash flows from operating activities | ||||||||
| Net income | $ | 20,547,967 | $ | 21,049,266 | ||||
| Adjustments to reconcile net income to net cash provided by operating activities | ||||||||
| Issuance of common stock and stock options for compensation | - | 1,303,645 | ||||||
| Depreciation and amortization | 4,758,838 | 14,921,548 | ||||||
| Gain (Loss) on disposal of property, plant and equipment | 24,756 | 115,933 | ||||||
| Gain (Loss) on disengagement of sales VIE | 322,214 | |||||||
| Amortization of debt discount | 490,280 | 231,998 | ||||||
| Change in fair value of derivative liability | (67,798 | ) | (88,106 | ) | ||||
Allowance for bad debt | 7,630,782 | 5,624,394 | ||||||
| Changes in operating assets | ||||||||
| Accounts receivable | (19,035,727 | ) | (47,292,468 | ) | ||||
| Amount due from related parties | 902,528 | - | ||||||
| Other current assets | 1,149,289 | (509,573 | ) | |||||
| Inventories | 1,690,482 | 39,403,840 | ||||||
| Advances to suppliers | 6,127,171 | (2,675,330 | ) | |||||
| Other assets | 1,527,225 | (9,753,250 | ) | |||||
| Changes in operating liabilities | ||||||||
| Accounts payable | 1,256,821 | 6,094,687 | ||||||
| Customer deposits | (2,549,836 | ) | (2,181,648 | ) | ||||
| Tax payables | 1,325,136 | (8,461,337 | ) | |||||
| Accrued expenses and other payables | 2,118,084 | 4,860,128 | ||||||
| Interest payable | 216,553 | 301,355 | ||||||
| Net cash provided by operating activities | 28,434,766 | 22,945,082 | ||||||
| Cash flows from investing activities | ||||||||
| Purchase of plant, property, and equipment | (33,207 | ) | (30,756 | ) | ||||
| Cash paid for acquisition, net | (8,219 | ) | (5,569,348 | ) | ||||
| Change in construction in process | (14,265 | ) | (204,660 | ) | ||||
| Net cash used in investing activities | (55,691 | ) | (5,804,764 | ) | ||||
| Cash flows from financing activities | ||||||||
| Proceeds from loans | - | 5,890,757 | ||||||
| Repayment of loans | (6,130,802 | ) | (4,562,642 | ) | ||||
| Advance from related party | 195,013 | 600,000 | ||||||
| Net cash provided by financing activities | (5,935,789 | ) | 1,928,115 | |||||
| Effect of exchange rate change on cash and cash equivalents | 8,145,894 | (3,704,924 | ) | |||||
| Net increase in cash and cash equivalents | 30,589,179 | 15,363,509 | ||||||
| Cash and cash equivalents, beginning balance | 123,050,548 | 102,896,486 | ||||||
| Cash and cash equivalents, ending balance | $ | 153,639,728 | $ | 118,259,995 | ||||
| Supplement disclosure of cash flow information | ||||||||
| Interest expense paid | $ | 311,667 | $ | 464,430 | ||||
| Income taxes paid | $ | 3,741,644 | $ | 6,071,366 | ||||
The accompanying notes are an integral part of these consolidated financial statements.
| 3 |
NOTE 1 – ORGANIZATION AND DESCRIPTION OF BUSINESS
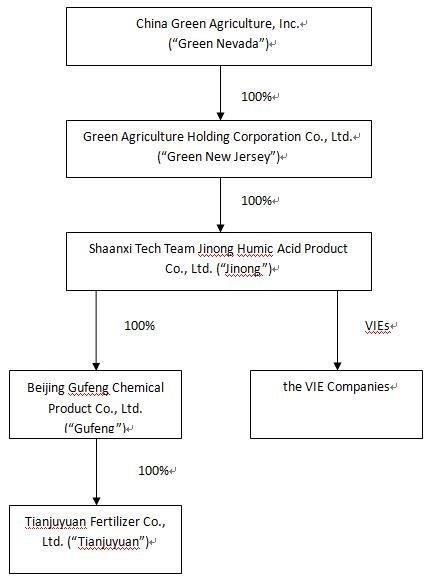
China Green Agriculture, Inc. (the “Company”, “Parent Company” or “Green Nevada”), through its subsidiaries, is engaged in the research, development, production, distribution and sale of humic acid-based compound fertilizer, compound fertilizer, blended fertilizer, organic compound fertilizer, slow-release fertilizers, highly-concentrated water-soluble fertilizers and mixed organic-inorganic compound fertilizer and the development, production and distribution of agricultural products.
Unless the context indicates otherwise, as used in this Report, the following are the references herein of all the subsidiaries of the Company (i) Green Agriculture Holding Corporation (“Green New Jersey”), a wholly-owned subsidiary of Green Nevada, incorporated in the State of New Jersey; (ii) Shaanxi TechTeam Jinong Humic Acid Product Co., Ltd. (“Jinong”), a wholly-owned subsidiary of Green New Jersey organized under the laws of the PRC; (iii) Xi’an Hu County Yuxing Agriculture Technology Development Co., Ltd. (“Yuxing”), a Variable Interest Entity (“VIE”) in the in the People’s Republic of China (the “PRC”) controlled by Jinong through a series of contractual agreements; (iv) Beijing Gufeng Chemical Products Co., Ltd., a wholly-owned subsidiary of Jinong in the PRC (“Gufeng”), and (v) Beijing Tianjuyuan Fertilizer Co., Ltd., Gufeng’s wholly-owned subsidiary in the PRC (“Tianjuyuan”).
On June 30, 2016 the Company, through its wholly-owned subsidiary Jinong, entered into strategic acquisition agreements and a series of contractual agreements with the shareholders of the following six companies that are organized under the laws of the PRC and would be deemed VIEs: Shaanxi Lishijie Agrochemical Co., Ltd. (“Lishijie”), Songyuan Jinyangguang Sannong Service Co., Ltd. (“Jinyangguang”), Shenqiu County Zhenbai Agriculture Co., Ltd. (“Zhenbai”), Weinan City Linwei District Wangtian Agricultural Materials Co., Ltd. (“Wangtian”), Aksu Xindeguo Agricultural Materials Co., Ltd. (“Xindeguo”), and Xinjiang Xinyulei Eco-agriculture Science and Technology co., Ltd. (“Xinyulei”). On January 1, 2017, the Company, through its wholly-owned subsidiary Jinong, entered into strategic acquisition agreements and a series of contractual agreements with the shareholders of the following two companies that are organized under the laws of the PRC and would be deemed VIEs, Sunwu County Xiangrong Agricultural Materials Co., Ltd. (“Xiangrong”), and Anhui Fengnong Seed Co., Ltd. (“Fengnong”).
On November 30, 2017, the Company, through its wholly-owned subsidiary Jinong, discontinued the strategic acquisition agreements and the series of contractual agreements with the shareholders of Zhenbai.
Yuxing, Lishijie, Jinyangguang, Wangtian, Xindeguo, Xinyulei, Xiangrong and Fengnong may also collectively be referred to as the “the VIE Companies”; Lishijie, Jinyangguang, Zhenbai, Wangtian, Xindeguo, Xinyulei, Xiangrong and Fengnong may also collectively be referred to as “the sales VIEs” or “the sales VIE companies”.
| 4 |
The Company’s corporate structure as of March 31, 2018 is set forth in the diagram below:
| 5 |
NOTE 2 -– BASIS OF PRESENTATION AND SUMMARY OF SIGNIFICANT ACCOUNTING POLICIES
Principle of consolidation
The accompanying consolidated financial statements include the accounts of the Company and its wholly-owned subsidiaries, Green New Jersey, Jinong, Gufeng, Tianjuyuan, and the VIE Companies. All significant inter-company accounts and transactions have been eliminated in consolidation.
Effective June 16, 2013, Yuxing was converted from being a wholly-owned foreign enterprise 100% owned by Jinong to a domestic enterprise 100% owned by one natural person, who is not affiliated with the Company (“Yuxing’s Owner”). Effective the same day, Yuxing’s Owner entered into a series of contractual agreements with Jinong pursuant to which Yuxing became the VIE of Jinong.
VIE assessment
A VIE is an entity (1) that has total equity at risk that is not sufficient to finance its activities without additional subordinated financial support from other entities, (2) where the group of equity holders does not have the power to direct the activities of the entity that most significantly impact the entity’s economic performance, or the obligation to absorb the entity’s expected losses or the right to receive the entity’s expected residual returns, or both, or (3) where the voting rights of some investors are not proportional to their obligations to absorb the expected losses of the entity, their rights to receive the expected residual returns of the entity, or both, and substantially all of the entity’s activities either involve or are conducted on behalf of an investor that has disproportionately few voting rights. In order to determine if an entity is considered a VIE, the Company first performs a qualitative analysis, which requires certain subjective decisions regarding its assessments, including, but not limited to, the design of the entity, the variability that the entity was designed to create and pass along to its interest holders, the rights of the parties, and the purpose of the arrangement. If the Company cannot conclude after a qualitative analysis whether an entity is a VIE, it performs a quantitative analysis. The qualitative analysis considered the design of the entity, the risks that cause variability, the purpose for which the entity was created, and the variability that the entity was designed to pass along to its variable interest holders. When the primary beneficiary could not be identified through a qualitative analysis, we used internal cash flow models to compute and allocate expected losses or expected residual returns to each variable interest holder based upon the relative contractual rights and preferences of each interest holder in the VIE’s capital structure.
Use of estimates
The preparation of consolidated financial statements in conformity with accounting principles generally accepted in the United States of America requires management to make estimates and assumptions that affect the reported amounts of assets and liabilities and disclosure of contingent assets and liabilities at the date of the consolidated financial statements and the amount of revenues and expenses during the reporting periods. Management makes these estimates using the best information available at the time the estimates are made. However, actual results could differ materially from those results.
Cash and cash equivalents and concentration of cash
For statement of cash flows purposes, the Company considers all cash on hand and in banks, certificates of deposit with state owned banks in the People’s Republic of China (“PRC”) and banks in the United States, and other highly-liquid investments with maturities of three months or less, when purchased, to be cash and cash equivalents. The Company maintains large sums of cash in three major banks in China. The aggregate cash in such accounts and on hand as of DecemberMarch 31, 20172018 and June 30, 2017 were $145,417,158$153,639,728 and $123,050,548, respectively. The Company had $145,409,838$153,634,080 and $122,907,629 in cash in banks in China, and also had $7,320$5,648 and $142,919 in cash in two banks in the United States as of DecemberMarch 31, 20172018 and June 30, 2017, respectively. Cash overdrafts as of a balance sheet date will be reflected as liabilities in the balance sheet. The Company has not experienced any losses in such accounts and believes it is not exposed to any significant risks on its cash in bank accounts.
Accounts receivable
The Company’s policy is to maintain reserves for potential credit losses on accounts receivable. Management regularly reviews the composition of accounts receivable and analyzes customer credit worthiness, current economic trends and changes in customer payment patterns to evaluate the adequacy of these reserves at each year-end. Accounts considered uncollectible are written off through a charge to the valuation allowance. As of DecemberMarch 31, 2017,2018, and June 30, 2017, the Company had accounts receivable of $122,117,190$178,750,045 and $141,665,179,$149,709,758, net of allowance for doubtful accounts of $13,949,452$19,458,519 and $9,457,423, respectively.
Inventories
Inventory is valued at the lower of cost (determined on a weighted average basis) or market. Inventories consist of raw materials;materials, work in process, finished goods and packaging materials. The Company reviews its inventories regularly for possible obsolete goods and establishes reserves when determined necessary.
Deferred assets
Deferred assets represent amounts that the distributors owed to the Company in their marketing efforts and developing standard stores to expand the Company’s products’ competitiveness and market shares. The amount owed to the Company to assist its distributors will be expensed over three years, which is the term as stated in the cooperation agreement, as long as the distributors are actively selling the Company’s products. For the sixnine months ended DecemberMarch 31, 20172018 and 2016,2017, the Company amortized $864,070$0 and $9,894,637$13,735,614, respectively, of the deferred assets. If a distributor breaches, defaults, or terminates the agreement with the Company within the three-year period, the outstanding unamortized portion of the amount owed will become payable to the Company immediately.
The deferred assets consist of items inside the distributors’ stores such as furniture, racks, cabinets, and display units, and items outside or attached to the distributors’ stores such as signage and billboards. These types of assets would be capitalized as fixed assets if the Company actually owned the stores or utilized the assets for its own operations. These assets would also be capitalized as leasehold improvements if the Company leased these stores from the distributors. Therefore, the Company believes that under U.S. generally accepted accounting principles, these types of asset purchases are properly capitalized. In addition, the Company believes that these assets are properly classified as deferred assets because if a distributor breaches, defaults, or terminates the agreement with the Company within a three-year period, a proportionate amount expended by the Company is to be repaid by the distributor.
The assets inside the distributors’ stores are custom made to fit the layout of each individual store and the signage and billboards are also custom designed to fit the specific location. The assets were purchased by the Company directly from the manufacturers and installed in the distributors’ stores. The Company wants to maintain control over the quality of the items being purchased as well as making them uniform among all the distributor locations.
Intangible Assets
The Company records intangible assets acquired individually or as part of a group at fair value. Intangible assets with definitivedefinite lives are amortized over the useful life of the intangible asset, which is the period over which the asset is expected to contribute directly or indirectly to the entity’s future cash flows. The Company evaluates intangible assets for impairment at least annually and more often whenever events or changes in circumstances indicate that the carrying value may not be recoverable. Whenever any such impairment exists, an impairment loss will be recognized for the amount by which the carrying value exceeds the fair value.
Customer deposits
Payments received before all of the relevant criteria for revenue recognition are satisfied are recorded as customer deposits. When all revenue recognition criteria are met, the customer deposits are recognized as revenue. As of DecemberMarch 31, 2017,2018, and June 30, 2017, the Company had customer deposits of $6,935,326$4,781,397 and $7,046,570, respectively.
| 7 |
Earnings per share
Basic earnings per share areis computed based on the weighted average number of shares of common stock outstanding during the period. Diluted earnings per share is computed based on the weighted average number of shares of common stock plus the effect of dilutive potential common shares outstanding during the period using the treasury stock method. Dilutive potential common shares include outstanding stock options and stock awards.
The components of basic and diluted earnings per share consist of the following:
| Three Months Ended | ||||||||
| December 31, | ||||||||
| 2017 | 2016 | |||||||
| Net Income for Basic Earnings Per Share | $ | 7,826,107 | $ | 5,506,011 | ||||
| Basic Weighted Average Number of Shares | 38,551,264 | 37,658,062 | ||||||
| Net Income Per Share – Basic | $ | 0.20 | $ | 0.15 | ||||
| Net Income for Diluted Earnings Per Share | $ | 7,826,107 | $ | 5,506,011 | ||||
| Diluted Weighted Average Number of Shares | 38,551,264 | 37,658,062 | ||||||
| Net Income Per Share – Diluted | $ | 0.20 | $ | 0.15 | ||||
| Three Months Ended March 31, | ||||||||
| 2018 | 2017 | |||||||
| Net Income for Basic Earnings Per Share | $ | 7,627,033 | $ | 8,191,675 | ||||
| Basic Weighted Average Number of Shares | 38,551,265 | 38,532,033 | ||||||
| Net Income Per Share – Basic | $ | 0.20 | $ | 0.21 | ||||
| Net Income for Diluted Earnings Per Share | $ | 7,627,033 | $ | 8,191,675 | ||||
| Diluted Weighted Average Number of Shares | 38,896,945 | 38,532,033 | ||||||
| Net Income Per Share – Diluted | $ | 0.19 | $ | 0.21 | ||||
| Nine Months Ended March 31, | ||||||||
| 2018 | 2017 | |||||||
| Net Income for Basic Earnings Per Share | $ | 20,547,967 | $ | 21,049,266 | ||||
| Basic Weighted Average Number of Shares | 38,551,265 | 37,941,957 | ||||||
| Net Income Per Share – Basic | $ | 0.53 | $ | 0.55 | ||||
| Net Income for Diluted Earnings Per Share | $ | 20,547,967 | $ | 21,049,266 | ||||
| Diluted Weighted Average Number of Shares | 38,896,945 | 37,941,957 | ||||||
| Net Income Per Share – Diluted | $ | 0.53 | $ | 0.55 | ||||
Recent accounting pronouncements
In May 2014, the FASB issued ASU 2014-09, Revenue from Contracts with Customers, which supersedes nearly all existing revenue recognition guidance under U.S. GAAP. The core principle of ASU 2014-09 is to recognize revenues when promised goods or services are transferred to customers in an amount that reflects the consideration to which an entity expects to be entitled for those goods or services. ASU 2014-09 defines a five-step process to achieve this core principle and, in doing so, more judgment and estimates may be required within the revenue recognition process than are required under existing U.S. GAAP. This pronouncement is effective for annual reporting periods beginning after December 15, 2016 and is to be applied using one of two retrospective application methods, with early application not permitted. The Company is currently assessing the materiality of the impact to our consolidated financial statements and has not yet selected a transition approach.
In January 2015, the FASB issued Accounting Standards Update (ASU) No. 2015-01 (Subtopic 225-20) -Income Statement - Extraordinary and Unusual Items. ASU 2015-01 eliminates the concept of an extraordinary item from GAAP. As a result, an entity will no longer be required to segregate extraordinary items from the results of ordinary operations, to separately present an extraordinary item on its income statement, net of tax, after income from continuing operations or to disclose income taxes and earnings-per-share data applicable to an extraordinary item. However, ASU 2015-01 will still retain the presentation and disclosure guidance for items that are unusual in nature and occur infrequently. ASU 2015-01 is effective for periods beginning after December 15, 2015. The adoption of ASU 2015-01 is not expected to have a material effect on the Company’s consolidated financial statements. Early adoption is permitted.
In February, 2015, the FASB issued Accounting Standards Update (ASU) No. 2015-02,Consolidation (Topic 810): Amendments to the Consolidation Analysis. ASU 2015-02 provides guidance on the consolidation evaluation for reporting organizations that are required to evaluate whether they should consolidate certain legal entities such as limited partnerships, limited liability corporations, and securitization structures (collateralized debt obligations, collateralized loan obligations, and mortgage-backed security transactions). ASU 2015-02 is effective for periods beginning after December 15, 2015. The adoption of ASU 2015-02 is not expected to have a material effect on the Company’s consolidated financial statements. Early adoption is permitted.
| Six Months Ended | ||||||||
| December 31, | ||||||||
| 2017 | 2016 | |||||||
| Net Income for Basic Earnings Per Share | $ | 12,920,935 | $ | 12,857,591 | ||||
| Basic Weighted Average Number of Shares | 38,551,264 | 37,653,333 | ||||||
| Net Income Per Share – Basic | $ | 0.34 | $ | 0.34 | ||||
| Net Income for Diluted Earnings Per Share | $ | 12,920,935 | $ | 12,857,591 | ||||
| Diluted Weighted Average Number of Shares | 38,551,264 | 37,653,333 | ||||||
| Net Income Per Share – Diluted | $ | 0.34 | $ | 0.34 | ||||
RecentIn September, 2015, the FASB issued ASU No. 2015-16,Business Combinations (Topic 805). Topic 805 requires that an acquirer retrospectively adjust provisional amounts recognized in a business combination, during the measurement period. To simplify the accounting pronouncementsfor adjustments made to provisional amounts, the amendments in the Update require that the acquirer recognize adjustments to provisional amounts that are identified during the measurement period in the reporting period in which the adjustment amount is determined. The acquirer is required to also record, in the same period’s financial statements, the effect on earnings of changes in depreciation, amortization, or other income effects, if any, as a result of the change to the provisional amounts, calculated as if the accounting had been completed at the acquisition date. In addition, an entity is required to present separately on the face of the income statement or disclose in the notes to the financial statements the portion of the amount recorded in current-period earnings by line item that would have been recorded in previous reporting periods if the adjustment to the provisional amounts had been recognized as of the acquisition date. ASU 2015-16 is effective for fiscal years beginning December 15, 2015. The adoption of ASU 2015-016 is not expected to have a material effect on the Company’s consolidated financial statements.
In November 2015, the FASB issued ASU No. 2015-17,Balance Sheet Classification of Deferred Taxes. The new guidance requires that all deferred tax assets and liabilities, along with any related valuation allowance, be classified as noncurrent on the balance sheet. This update is effective for annual periods beginning after December 15, 2016 and interim periods within those annual periods. The Company does not anticipate the adoption of this ASU will have a significant impact on its consolidated financial position, results of operations, or cash flows.
In February 2016, the FASB issued ASU No. 2016-02,Leases (Topic 842). The guidance in ASU No. 2016-02 supersedes the lease recognition requirements in ASC Topic 840,Leases (FAS 13). ASU 2016-02 requires an entity to recognize assets and liabilities arising from a lease for both financing and operating leases, along with additional qualitative and quantitative disclosures. ASU 2016-02 is effective for fiscal years beginning after December 15, 2018, with early adoption permitted. The Company is currently evaluating the effect this standard will have on its consolidated financial statements.
In March 2016, the FASB issued ASU 2016-09,Improvements to Employee Share Based Payment Accounting, to simplify several aspects of the accounting for share-based payment transactions, including the income tax consequences, classification of awards as either equity or liabilities, and classification on the statement of cash flows. The guidance will be effective for annual periods beginning after December 15, 2016 and interim periods within those annual periods. Early adoption is permitted, including adoption in an interim period. The Company is currently evaluating the impact of the adoption of this newly issued guidance to its consolidated financial statements.
In April 2016, the FASB issued ASU 2016-10, “Revenue from Contracts with Customers (Topic 606): Identifying Performance Obligations and Licensing” (“ASU 2016-10”), which clarifies the following two aspects of Topic 606: (a) identifying performance obligations; and (b) the licensing implementation guidance. The amendments do not change the core principle of the guidance in Topic 606. The new guidance is effective for annual periods beginning after December 15, 2017, including interim periods within those annual periods, which will be our interim period beginning July 1, 2018. Early adoption is permitted only as of annual reporting periods beginning after December 15, 2016, including interim reporting periods within that reporting period. The Company is currently evaluating the impact of adopting this standard on its consolidated financial statements.
In May 2016, the FASB issued ASU 2016-11, “Revenue Recognition (Topic 605) and Derivatives and Hedging (Topic 815): Rescission of SEC Guidance Because of Accounting Standards Updates 2014-09 and 2014-06 Pursuant to Staff Announcements at the March 3, 2016 EITF Meeting” (“ASU 2016-11”), which clarifies revenue and expense recognition for freight costs, accounting for shipping and handling fees and costs, and accounting for consideration given by a vendor to a customer. The new guidance is effective for annual periods beginning after December 15, 2017, including interim periods within those annual periods, which will be our interim period beginning July 1, 2018. Early adoption is permitted only as of annual reporting periods beginning after December 15, 2016, including interim reporting periods within that reporting period. The Company is currently evaluating the impact of adopting this standard on its consolidated financial statements.
In May 2016, the FASB issued ASU 2016-12, “Revenue from Contracts with Customers (Topic 606): Narrow-Scope Improvements and Practical Expedients” (“ASU 2016-12”), which amends the guidance in the new revenue standard on collectability, noncash consideration, presentation of sales tax, and transition. The amendments are intended to address implementation issues and provide additional practical expedients to reduce the cost and complexity of applying the new revenue standard. The new guidance is effective for annual periods beginning after December 15, 2017, including interim periods within those annual periods, which will be our interim period beginning July 1, 2018. Early adoption is permitted only as of annual reporting periods beginning after December 15, 2016, including interim reporting periods within that reporting period. The Company is currently evaluating the impact of adopting this standard on its consolidated financial statements.
In August 2016, the FASB issued ASU 2016-15, regarding ASC Topic 230 “Statement of Cash Flows.” This update addresses eight specific cash flow issues with the objective of reducing the existing diversity in practice. The new guidance is effective for annual reporting periods beginning after December 15, 2017, including interim periods within that reporting period. Early adoption is permitted. The Company does not expect the adoption of this standard to have a significant effect on our consolidated financial statements.
In November 2016, the FASB issued ASU No. 2016-18, Statement of Cash Flows (Topic 230): “Restricted Cash”(“ASU 2016-18”). ASU 2016-18 requires that a statement of cash flows explain the change during the period in the total of cash, cash equivalents, and amounts generally described as restricted cash or restricted cash equivalents. This update is effective in fiscal years, including interim periods, beginning after December 15, 2017 and early adoption is permitted. The adoption of this guidance will result in the inclusion of the restricted cash balances within the overall cash balance and removal of the changes in restricted cash activity, which is currently recognized in Otherother financing activities, on the Statements of Consolidated Cash Flows. Furthermore, an additional reconciliation will be required to reconcile Cash and cash equivalents and restricted cash reported within the Consolidated Balance Sheets to sum to the total shown in the Statements of Consolidated Cash Flows. The Company anticipates adopting this new guidance effective JanuaryJuly 1, 2018. The Company is currently evaluating this guidance and the impact it will have on the Consolidated Financial Statements and disclosures.
In January 2017, the FASB issued Accounting Standards Update No. 2017-01, Business Combinations (Topic 805): Clarifying the Definition of a Business (ASU 2017-01), which revises the definition of a business and provides new guidance in evaluating when a set of transferred assets and activities is a business. This guidance will be effective for us in the first quarter of 2018 on a prospective basis, and early adoption is permitted. We do not expect the standard to have a material impact on our consolidated financial statements.
In May 2017, the FASB issued ASU No. 2017-09, “Compensation—Stock compensation (Topic 718): Scope of modification accounting” (“ASU 2017-09”). The purpose of the amendment is to clarify which changes to the terms or condition of a share-based payment award require an entity to apply modification accounting. For all entities that offer share basedshare-based payment awards, ASU 2017-09 is effective for interim and annual reporting periods beginning after December 15, 2017. The Company is currently assessing the impact of ASU 2017-09 on its condensed consolidated financial statements.
Other recent accounting pronouncements issued by the FASB, including its Emerging Issues Task Force, the American Institute of Certified Public Accountants, and the Securities and Exchange Commission diddo not or wasare not believed by management to have a material impact on the Company’s present or future financial statements.
NOTE 3 – INVENTORIES
Inventories consisted of the following:
| March 31, | June 30, | |||||||
| 2018 | 2017 | |||||||
| Raw materials | $ | 21,496,578 | $ | 39,397,711 | ||||
| Supplies and packing materials | $ | 647,038 | $ | 540,151 | ||||
| Work in progress | $ | 434,576 | $ | 421,496 | ||||
| Finished goods | $ | 58,136,811 | $ | 37,655,533 | ||||
| Total | $ | 80,715,004 | $ | 78,013,891 | ||||
��
NOTE 4 – PROPERTY, PLANT AND EQUIPMENT
Property, plant and equipment consisted of the following:
| March 31, | June 30, | |||||||
| 2018 | 2017 | |||||||
| Building and improvements | $ | 42,482,222 | $ | 40,113,868 | ||||
| Auto | 3,732,403 | 3,473,352 | ||||||
| Machinery and equipment | 19,766,512 | 18,760,880 | ||||||
| Agriculture assets | 809,754 | 764,660 | ||||||
| Total property, plant and equipment | 66,790,890 | 63,111,079 | ||||||
| Less: accumulated depreciation | (33,153,206 | ) | (28,919,747 | ) | ||||
| Total | $ | 33,637,684 | $ | 34,191,332 | ||||
NOTE 5 – INTANGIBLE ASSETS
Intangible assets consisted of the following:
| March 31, | June 30, | |||||||
| 2018 | 2017 | |||||||
| Land use rights, net | $ | 10,522,033 | $ | 10,121,591 | ||||
| Customer relationships, net | 4,125,906 | 5,578,641 | ||||||
| Non-compete agreement | 746,890 | 1,092,584 | ||||||
| Trademarks | 6,480,087 | 6,119,059 | ||||||
| Total | $ | 21,874,916 | $ | 22,911,876 | ||||
LAND USE RIGHT
On September 25, 2009, Yuxing was granted a land use right for approximately 88 acres (353,000 square meters or 3.8 million square feet) by the People’s Government and Land & Resources Bureau of Hu County, Xi’an, Shaanxi Province. The fair value of the related intangible asset was determined to be the respective cost of RMB73,184,895 (or $11,643,717). The intangible asset is being amortized over the grant period of 50 years using the straight line method.
On August 13, 2003, Tianjuyuan was granted a certificate of Land Use Right for a parcel of land of approximately 11 acres (42,726 square meters or 459,898 square feet) at Ping Gu District, Beijing. The purchase cost was recorded at RMB 1,045,950 (or $166,411). The intangible asset is being amortized over the grant period of 50 years.
On August 16, 2001, Jinong received a land use right as a contribution from a shareholder, which was granted by the People’s Government and Land & Resources Bureau of Yangling District, Shaanxi Province. The fair value of the related intangible asset at the time of the contribution was determined to be RMB7, 285,099 (or $1,159,059). The intangible asset is being amortized over the grant period of 50 years.
| 11 |
The Land Use Rights consisted of the following:
| March 31, | June 30, | |||||||
| 2018 | 2017 | |||||||
| Land use rights | $ | 12,969,187 | $ | 12,246,630 | ||||
| Less: accumulated amortization | (2,447,154 | ) | (2,125,039 | ) | ||||
| Total land use rights, net | $ | 10,522,033 | $ | 10,121,591 | ||||
TECHNOLOGY PATENT
On August 16, 2001, Jinong was issued a technology patent related to a proprietary formula used in the production of humic acid. The fair value of the related intangible asset was determined to be the respective cost of RMB5, 875,068 (or $934,723) and is being amortized over the patent period of 10 years using the straight line method. This technology patent has been fully amortized.
On July 2, 2010, the Company acquired Gufeng and its wholly-owned subsidiary Tianjuyuan. The fair value on the acquired technology patent was estimated to be RMB9, 200,000 (or $1,463,720) and is amortized over the remaining useful life of six years using the straight line method.
The technology know-how consisted of the following:
| March 31, | June 30, | |||||||
| 2018 | 2017 | |||||||
| Technology know-how | $ | 2,398,443 | $ | 2,264,818 | ||||
| Less: accumulated amortization | (2,398,443 | ) | (2,264,818 | ) | ||||
| Total technology know-how, net | $ | - | $ | - | ||||
CUSTOMER RELATIONSHIPS
On July 2, 2010, the Company acquired Gufeng and its wholly-owned subsidiary Tianjuyuan. The fair value of the acquired customer relationships was estimated to be RMB65,000,000 (or $10,341,500) and is amortized over the remaining useful life of ten years. On June 30, 2016, and January 1, 2017 the Company acquired the VIE Companies. The fair value of the acquired customer relationships was estimated to be RMB14,729,602 (or $2,343,480) and is amortized over the remaining useful life of seven to ten years.
| March 31, | June 30, | |||||||
| 2018 | 2017 | |||||||
| Customer relationships | $ | 12,684,980 | $ | 12,757,628 | ||||
| Less: accumulated amortization | (8,559,073 | ) | (7,178,987 | ) | ||||
| Total customer relationships, net | $ | 4,125,907 | $ | 5,578,641 | ||||
NON-COMPETE AGREEMENT
On July 2, 2010, the Company acquired Gufeng and its wholly-owned subsidiary Tianjuyuan. The fair value of the acquired non-compete agreement was estimated to be RMB1,320,000 (or $210,012) and is amortized over the remaining useful life of five years using the straight line method. On June 30, 2016, and January 1, 2017 the Company acquired the VIE Companies. The fair value of the acquired non-compete agreements was estimated to be RMB6,843,439 (or $1,088,792) and is amortized over the remaining useful life of five years using the straight line method.
| March 31, | June 30, | |||||||
| 2018 | 2017 | |||||||
| Non-compete agreement | $ | 1,298,804 | $ | 1,515,218 | ||||
| Less: accumulated amortization | (551,914 | ) | (422,634 | ) | ||||
| Total non-compete agreement, net | $ | 746,890 | $ | 1,092,584 | ||||
| 12 |
TRADEMARKS
On July 2, 2010, the Company acquired Gufeng and its wholly-owned subsidiary Tianjuyuan. The preliminary fair value of the acquired trademarks was estimated to be RMB40,700,000 (or $6,475,370) and is subject to an annual impairment test. On June 30, 2016, and January 1, 2017 the Company acquired the VIE Companies. The fair value of the acquired trademarks was estimated to be RMB29,648 (or $4,717) and is subject to an annual impairment test.
AMORTIZATION EXPENSE
Estimated amortization expenses of intangible assets for the next five twelve months periods ending March 31, are as follows:
| Twelve Months Ending March 31, | Expense ($) | |||
| 2018 | 2,006,039 | |||
| 2019 | 1,985,475 | |||
| 2020 | 1,164,812 | |||
| 2021 | 722,045 | |||
| 2022 | 610,712 | |||
NOTE 6 - OTHER NON-CURRENT ASSETS
Other non-current assets mainly include advance payments related to leasing land for use by the Company. As of March 31, 2018, the balance of other non-current assets was $17,291,085, consisting of the lease fee advances for agriculture lands that the Company engaged in Shiquan County from 2018 to 2027.
In March 2017, Jinong entered into a lease agreement for approximately 3,400 mu, and 2600 hectare agriculture lands in Shiquan County, Shaanxi Province. The lease was from April 2017 and was renewable for every ten-year period up to 2066. The aggregate leasing fee was approximately RMB 13 million per annum, The Company had made 10-year advances of leasing fee per lease terms. The Company has amortized $1.6 million as expenses for the nine months ended March 31, 2018.
Estimated amortization expenses of the lease advance payments for the next four twelve-month periods ended March 31 and thereafter are as follows:
| Twelve months ending March 31, | ||||
| 2019 | $ | 2,135,918 | ||
| 2020 | $ | 2,135,918 | ||
| 2021 | $ | 2,135,918 | ||
| 2022 | $ | 2,135,918 | ||
| 2023 and thereafter | $ | 10,883,332 | ||
NOTE 7 – ACCRUED EXPENSES AND OTHER PAYABLES
Accrued expenses and other payables consisted of the following:
| March 31, | June 30, | |||||||
| 2018 | 2017 | |||||||
| Payroll payable | $ | 42,895 | $ | 103,412 | ||||
| Welfare payable | 163,339 | 154,239 | ||||||
| Accrued expenses | 5,506,284 | 4,863,988 | ||||||
| Other payables | 5,706,222 | 3,887,676 | ||||||
| Other levy payable | 133,431 | 125,998 | ||||||
| Total | $ | 11,552,171 | $ | 9,135,313 | ||||
| 13 |
NOTE 8 – AMOUNT DUE TO RELATED PARTIES
As of March 31, 2018, and June 30, 2017, the amount due to related parties was $3,329,975 and $3,071,102, respectively. As of March 31, 2018, and June 30, 2017, $1,113,700 and $1,051,652, respectively were amounts that Gufeng borrowed from a related party, Xi’an Techteam Science & Technology Industry (Group) Co. Ltd., a company controlled by Mr. Zhuoyu Li, Chairman and CEO of the Company, representing unsecured, non-interest bearing loans that are due on demand. These loans are not subject to written agreements.
On June 29, 2016, Jinong signed an office lease with Kingtone Information Technology Co., Ltd. (“Kingtone Information”), of which Mr. Tao Li, Chairman and CEO of the Company, serves as Chairman. Pursuant to the lease, Jinong rented 612 square meters (approximately 6,588 square feet) of office space from Kingtone Information. The lease provides for a two-year term effective as of July 1, 2016 with monthly rent of RMB24,480 (approximately $3,740).
NOTE 9 – LOAN PAYABLES
As of March 31, 2018, the short-term loan payables consisted of two loans which mature on dates ranging from June 9, 2018 through July 30, 2018 with interest rates ranging from 5.22% to 5.50%. Loans No. 1 and 2 below are collateralized by Tianjuyuan’s land use right and building ownership right.Loan No. 2 is guaranteed with parent company’s credit for Jinong.
| No. | Payee | Loan period per agreement | Interest Rate | March 31, 2018 | ||||||||||
| 1 | Bank of Beijing-Pinggu Branch | June 9, 2017-June 8, 2018 | 5.22 | % | 1,591,000 | |||||||||
| 2 | Beijing Agriculture Investment -small loan | August 1, 2017-July 30, 2018 | 5.50 | % | 159,100 | |||||||||
| Total | $ | 1,750,100 | ||||||||||||
The interest expense from short-term loans was $452,640 and $464,430 for the nine months ended March 31, 2018 and 2017, respectively.
| 14 |
NOTE 10 – CONVERTIBLE NOTES PAYABLE
Relating to the acquisition of the sales VIE Companies, the Company subsidiary, Jinong, issued convertible notes payable to the shareholders of sales VIE Companies twice, in the aggregate notional amount of RMB 63,000,000 ($10,023,300) with a term of three years and an annual interest rate of 3%.
| No. | Related Acquisitions of Sales VIEs | Issuance Date | Maturity Date | Notional Interest Rate | Conversion Price | Notional Amount (in RMB) | |||||||||||
| 1 | Wangtian, Lishijie, Shenqiu, Xindeguo, Xinyulei, Jinyangguang | June 30, 2016 | June 30, 2019 | 3 | % | $ | 5.00 | 51,000,000 | |||||||||
| 2 | Fengnong, Xiangrong | January 1, 2017 | December 31, 2019 | 3 | % | $ | 5.00 | 12,000,000 | |||||||||
The convertible notes take priority over the preferred stock and common stock of Jinong, and any other class or series of capital stock Jinong issues in the future in terms of interest and payments in the event of any liquidation, dissolution or winding up of Jinong. On or after the third anniversary of the issuance date of the note, noteholders may request Jinong to process the note conversion to convert the note into shares of the Company’s common stock. The notes cannot be converted prior to the maturity date. The per share conversion price of the notes is the higher of the following: (i) $5.00 per share or (ii) 75% of the closing price of the Company’s common stock on the date the noteholder delivers the conversion notice. Due to the discontinuation of VIE agreements with Zhenbai’s shareholders, certain convertible notes issued on June 30, 2016 with a face amount of RMB 12,000,000 ($1,909,200) were tendered back to the Company. All outstanding balance of unpaid principal and accrued interest in the tendered convertible notes were forfeited.
The Company determined that the fair value of the convertible notes payable outstanding was RMB 48,118,192 (or $7,655,604) and RMB 56,124,446 ($8,431,912) as of March 31, 2018 and June 30, 2017, respectively. Aside from the forfeiture of the convertible notes previously issued to Zhenbai’s shareholders, the difference between the fair value of the notes and the face amount of the notes is being amortized to accretion implied interest expense over the three-year life of the notes. As of March 31, 2018, the accumulated amortization of this discount into accretion expenses was $859,681.
NOTE 11 – TAXES PAYABLE
Enterprise Income Tax
Effective January 1, 2008, the Enterprise Income Tax (“EIT”) law of the PRC replaced the tax laws for Domestic Enterprises (“DEs”) and Foreign Invested Enterprises (“FIEs”). The EIT rate of 25% replaced the 33% rate that was applicable to both DEs and FIEs. The two year tax exemption and three year 50% tax reduction tax holiday for production-oriented FIEs was eliminated. Since January 1, 2008, Jinong became subject to income tax in China at a rate of 15% as a high-tech company, as a result of the expiration of its tax exemption on December 31, 2007. Accordingly, it made provision for income taxes for the nine months ended March 31, 2018 and 2017 of $2,689,188 and $2,814,503, respectively, which is mainly due to the operating income from Jinong. Gufeng is subject to 25% EIT rate and thus it made provision for income taxes of $1,899,873 and $1,428,284 for the nine months ended March 31, 2018 and 2017, respectively.
Value-Added Tax
All of the Company’s fertilizer products that are produced and sold in the PRC were subject to a Chinese Value-Added Tax (VAT) of 13% of the gross sales price. On April 29, 2008, the PRC State of Administration of Taxation (SAT) released Notice #56, “Exemption of VAT for Organic Fertilizer Products”, which allows certain fertilizer products to be exempt from VAT beginning June 1, 2008. The Company submitted the application for exemption in May 2009, which was granted effective September 1, 2009, continuing through December 31, 2015. On August 10, 2015 and August 28, 2015, the SAT released Notice #90. “Reinstatement of VAT for Fertilizer Products”, and Notice #97, “Supplementary Reinstatement of VAT for Fertilizer Products”, which restore the VAT of 13% of the gross sales price on certain fertilizer products includes non-organic fertilizer products starting from September 1, 2015, but granted taxpayers a reduced rate of 3% from September 1, 2015 through June 30, 2016.
Income Taxes and Related Payables
Taxes payable consisted of the following:
| March 31, | June 30, | |||||||
| 2018 | 2017 | |||||||
| VAT provision | $ | (539,917 | ) | $ | (575,872 | ) | ||
| Income tax payable | 3,962,830 | 2,229,735 | ||||||
| Other levies | 806,262 | 1,036,544 | ||||||
| Total | $ | 4,229,175 | $ | 2,690,407 | ||||
| 15 |
The provision for income taxes consists of the following:
| March 31, 2017 | June 30, 2016 | |||||||
| Current tax - foreign | $ | 5,066,780 | $ | 7,371,967 | ||||
| Deferred tax | - | - | ||||||
| $ | 5,066,780 | $ | 7,371,967 | |||||
Tax Rate Reconciliation
Our effective tax rates were approximately 19.8% and 20.1% for the nine months ended March 31, 2018 and 2017, respectively. Substantially all of the Company’s income before income taxes and related tax expense are from PRC sources. Actual income tax benefit reported in the consolidated statements of income and comprehensive income differ from the amounts computed by applying the US statutory income tax rate of 34% to income before income taxes for the nine months ended March 31, 2018 and 2017 for the following reasons:
| March 31, 2018 | ||||||||||||||||||||||||||||
| China | United States | |||||||||||||||||||||||||||
| 15% - 25% | 34% | Total | ||||||||||||||||||||||||||
| Pretax income (loss) | $ | 26,650,476 | - | (1,035,728 | ) | - | $ | 25,614,748 | ||||||||||||||||||||
| Expected income tax expense (benefit) | 6,662,619 | 25.0 | % | (352,147 | ) | 34.0 | % | 6,310,472 | ||||||||||||||||||||
| High-tech income benefits on Jinong | (2,689,188 | ) | (10 | )% | - | (2,689,188 | ) | |||||||||||||||||||||
| Losses from subsidiaries in which no benefit is recognized | (1,093,349 | ) | 4 | % | - | (1,093,349 | ) | |||||||||||||||||||||
| Change in valuation allowance on deferred tax asset from US tax benefit | 0 | - | 352,147 | 352,147 | (34.0 | )% | 352,147 | |||||||||||||||||||||
| Actual tax expense | $ | 5,066,780 | 19 | % | $ | - | - | % | $ | 5,066,780 | 19.8 | % | ||||||||||||||||
March 31, 2017
| China | United States | |||||||||||||||||||||||||||
| 15% - 25% | 34% | Total | ||||||||||||||||||||||||||
| Pretax income (loss) | $ | 25,831,101 | - | (2,067,988 | ) | - | $ | 23,763,113 | ||||||||||||||||||||
| Expected income tax expense (benefit) | 6,457,775 | 25.0 | % | (703,116 | ) | 34.0 | % | 5,754,659 | ||||||||||||||||||||
| High-tech income benefits on Jinong | (1,653,707 | ) | (6 | )% | - | (1,653,707 | ) | |||||||||||||||||||||
| Losses from subsidiaries in which no benefit is recognized | (31,908 | ) | (0.1 | )% | - | (31,908 | ) | |||||||||||||||||||||
| Change in valuation allowance on deferred tax asset from US tax benefit | 0 | - | 703,116 | 703,116 | (34.0 | )% | 703,116 | |||||||||||||||||||||
| Actual tax expense | $ | 4,772,160 | 18 | % | $ | - | - | % | $ | 4,772,160 | 20.1 | % | ||||||||||||||||
| 16 |
NOTE 12 – STOCKHOLDERS’ EQUITY
Common Stock
On December 30, 2016, the Company granted an aggregate of 870,000 shares of restricted stock under the 2009 Plan to certain key employees. The stock grants vest immediately. The value of the restricted stock awards was $1,044,000 and is based on the fair value of the Company’s common stock on the grant date.
There were no issuances of common stock during the three and nine months ended March 31, 2018.
On April 6, 2018, the Company issued an aggregate of 345,680 shares of common stock to satisfy its compensation liability of $421,730 due to a former employee. The shares were valued at the market price on the approval of the issuance.
Preferred Stock
Under the Company’s Articles of Incorporation, the Board has the authority, without further action by stockholders, to designate up to 20,000,000 shares of preferred stock in one or more series and to fix the rights, preferences, privileges, qualifications and restrictions granted to or imposed upon the preferred stock, including dividend rights, conversion rights, voting rights, rights and terms of redemption, liquidation preference and sinking fund terms, any or all of which may be greater than the rights of the common stock. If the Company sells preferred stock under its registration statement on Form S-3, it will fix the rights, preferences, privileges, qualifications and restrictions of the preferred stock of each series in the certificate of designation relating to that series and will file the certificate of designation that describes the terms of the series of preferred stock the Company offers before the issuance of the related series of preferred stock.
As of March 31, 2018, the Company has 20,000,000 shares of preferred stock authorized, with a par value of $.001 per share, of which no shares are issued or outstanding.
NOTE 13 – CONCENTRATIONS
Market Concentration
All of the Company's revenue-generating operations are conducted in the PRC. Accordingly, the Company's business, financial condition and results of operations may be influenced by the political, economic and legal environments in the PRC, and by the general state of the PRC's economy.
The Company's operations in the PRC are subject to specific considerations and significant risks not typically associated with companies in North America and Western Europe. These include risks associated with, among other things, the political, economic and legal environment and foreign currency exchange. The Company’s results may be adversely affected by, among other things, changes in governmental policies with respect to laws and regulations, anti-inflationary measures, currency conversion and remittance abroad, and rates and methods of taxation.
Vendor and Customer Concentration
None of our vendors accounted for more than 10% of the Company’s purchases of raw materials and supplies for the nine months ended March 31, 2018 and 2017.
None of our customers accounted for more than 10% of the Company’s sales for the nine months ended March 31, 2018 and 2017.
| 17 |
NOTE 14 – SEGMENT REPORTING
As of March 31, 2018, the Company was organized into four main business segments based on location and product: Jinong (fertilizer production), Gufeng (fertilizer production), Yuxing (agricultural products production) and the sales VIEs. Each of the four operating segments referenced above has separate and distinct general ledgers. The chief operating decision maker (“CODM”) receives financial information, including revenue, gross margin, operating income and net income produced from the various general ledger systems to make decisions about allocating resources and assessing performance; however, the principal measure of segment profitability or loss used by the CODM is net income by segment.
| Three Months Ended March 31, | Nine Months Ended March 31, | |||||||||||||||
| 2018 | 2017 | 2018 | 2017 | |||||||||||||
| Revenues from unaffiliated customers: | ||||||||||||||||
| Jinong | $ | 27,490,333 | $ | 26,316,821 | $ | 80,475,373 | $ | 84,570,215 | ||||||||
| Gufeng | 38,932,597 | 30,858,499 | 81,602,384 | 67,734,572 | ||||||||||||
| Yuxing | 3,041,891 | 2,781,003 | 6,788,282 | 6,590,728 | ||||||||||||
| VIES | 13,086,062 | 21,349,305 | 40,416,989 | 43,039,748 | ||||||||||||
| Consolidated | $ | 82,550,883 | $ | 81,305,628 | $ | 209,283,028 | $ | 201,935,263 | ||||||||
| Operating income: | ||||||||||||||||
| Jinong | $ | 5,704,281 | $ | 5,960,846 | $ | 18,047,510 | $ | 18,080,850 | ||||||||
| Gufeng | 3,210,959 | 2,457,008 | 7,866,697 | 5,448,907 | ||||||||||||
| Yuxing | (951,474 | ) | 244,978 | (553,726 | ) | 732,788 | ||||||||||
| VIES | 2,067,194 | 1,242,773 | 2,146,824 | 3,683,537 | ||||||||||||
| Reconciling item (1) | 0 | 0 | 0 | 0 | ||||||||||||
| Reconciling item (2) | (404,960 | ) | (209,917 | ) | (1,035,731 | ) | (209,917 | ) | ||||||||
| Reconciling item (3)--stock compensation | (1,801 | ) | 0 | (1,858,071 | ) | |||||||||||
| Consolidated | $ | 9,625,999 | $ | 9,693,887 | $ | 26,471,574 | $ | 25,878,094 | ||||||||
| Net income: | ||||||||||||||||
| Jinong | $ | 4,778,486 | $ | 4,852,889 | $ | 15,238,735 | $ | 15,048,662 | ||||||||
| Gufeng | 2,310,042 | 2,160,630 | 5,526,873 | 4,145,555 | ||||||||||||
| Yuxing | (951,805 | ) | 245,239 | (553,314 | ) | 732,828 | ||||||||||
| VIES | 1,892,425 | 1,144,635 | 1,693,616 | 3,190,209 | ||||||||||||
| Reconciling item (1) | 0 | - | 4 | - | ||||||||||||
| Reconciling item (2) | (404,960 | ) | (211,718 | ) | (1,035,731 | ) | (2,067,988 | ) | ||||||||
| Reconciling item (3) | 2,844 | (322,214 | ) | |||||||||||||
| Consolidated | $ | 7,627,033 | $ | 8,191,675 | $ | 20,547,969 | $ | 21,049,266 | ||||||||
| Depreciation and Amortization: | ||||||||||||||||
| Jinong | $ | 226,678 | $ | 1,764,443 | $ | 1,502,805 | $ | 11,752,674 | ||||||||
| Gufeng | 574,120 | 578,525 | 1,674,176 | 1,836,875 | ||||||||||||
| Yuxing | 327,729 | 302,729 | 955,530 | 922,855 | ||||||||||||
| VIES | 195,922 | 159,942 | 626,327 | 409,144 | ||||||||||||
| Consolidated | $ | 1,324,449 | $ | 2,805,639 | $ | 4,758,838 | $ | 14,921,548 | ||||||||
| Interest expense: | ||||||||||||||||
| Jinong | 74,270 | 188,003 | 216,553 | 301,355 | ||||||||||||
| Gufeng | 105,299 | 44,636 | 311,667 | 163,075 | ||||||||||||
| Yuxing | 0 | 0 | 0 | 0 | ||||||||||||
| Sales VIEs | (97,559 | ) | 0 | (172,048 | ) | 0 | ||||||||||
| Consolidated | $ | 82,010 | $ | 232,639 | $ | 356,172 | $ | 464,430 | ||||||||
| Capital Expenditure: | ||||||||||||||||
| Jinong | $ | 537 | $ | 1,186 | $ | 4,686 | $ | 2,979 | ||||||||
| Gufeng | (11,286 | ) | 2,300 | 2,878 | 7,299 | |||||||||||
| Yuxing | 350 | - | 5,122 | 6,226 | ||||||||||||
| VIES | 20,520 | 14,252 | 20,520 | 14,252 | ||||||||||||
| Consolidated | $ | 10,120 | $ | 17,738 | $ | 33,207 | $ | 30,756 | ||||||||
| 18 |
| As of | ||||||||
| March 31, | June 30, | |||||||
| 2018 | 2017 | |||||||
| Identifiable assets: | ||||||||
| Jinong | $ | 239,634,153 | $ | 213,355,900 | ||||
| Gufeng | 170,849,066 | 156,648,924 | ||||||
| Yuxing | 42,118,634 | 40,965,345 | ||||||
| Sales VIES | 45,628,711 | 44,571,422 | ||||||
| Reconciling item (1) | 482,949 | 142,918 | ||||||
| Reconciling item (2) | (2,879 | ) | (2,879 | ) | ||||
| Consolidated | $ | 498,710,634 | $ | 455,681,630 | ||||
| (1) | Reconciling amounts refer to the unallocated assets or expenses of Green New Jersey. |
| (2) | Reconciling amounts refer to the unallocated assets or expenses of the Parent Company. |
NOTE 15 - COMMITMENTS AND CONTINGENCIES
On June 29, 2016, Jinong signed an office lease with Kingtone Information. Pursuant to the lease, Jinong rented 612 square meters (approximately 6,588 square feet) of office space from Kingtone Information. The lease provides for a two-year term effective as of July 1, 2016 with monthly rent of $3,895 (RMB24,480).
In January 2008, Jintai signed a ten-year land lease with Xi’an Jinong Hi-tech Agriculture Demonstration Zone for a monthly rent of $827 (RMB5,200).
In February 2004, Tianjuyuan signed a fifty-year lease with the village committee of Dong Gao Village and Zhen Nan Zhang Dai Village in the Beijing Ping Gu District, at a monthly rent of $471 (RMB2,958).
Accordingly, the Company recorded an aggregate of $14,751 and $42,626 as rent expenses for the nine months ended March 31, 2018 and 2017, respectively.
Lease expenses for the next five twelve month periods ending March 31, are as follows:
| Twelve Months ending March 31, | ||||
| 2019 | $ | 5,647 | ||
| 2020 | 5,647 | |||
| 2021 | 5,647 | |||
| 2022 | 5,647 | |||
| 2023 | 5,647 | |||
NOTE 16 - VARIABLE INTEREST ENTITIES
In accordance with accounting standards regarding consolidation of variable interest entities, VIEs are generally entities that lack sufficient equity to finance their activities without additional financial support from other parties or whose equity holders lack adequate decision making ability. All VIEs with which a company is involved must be evaluated to determine the primary beneficiary of the risks and rewards of the VIE. The primary beneficiary is required to consolidate the VIE for financial reporting purposes.
Green Nevada through one of its subsidiaries, Jinong, entered into a series of agreements (the “VIE Agreements”) with Yuxing for it to qualify as a VIE, effective June 16, 2013.
The Company has concluded, based on the contractual arrangements, that Yuxing is a VIE and that the Company’s wholly-owned subsidiary, Jinong, absorbs a majority of the risk of loss from the activities of Yuxing, thereby enabling the Company, through Jinong, to receive a majority of Yuxing expected residual returns.
| 19 |
On June 30, 2016 and January 1, 2017, the Company, through its wholly-owned subsidiary Jinong, entered into strategic acquisition agreements and also into a series of contractual agreements to qualify as VIEs with the shareholders of the sales VIE Companies.
Jinong, the sales VIE Companies, and the shareholders of the sales VIE Companies also entered into a series of contractual agreements for the sales VIE Companies to qualify as VIEs (the “VIE Agreements”).
On November 30, 2017, the Company, through its wholly-owned subsidiary Jinong, exited the VIE agreements with the shareholders of Zhenbai.
As a result of these contractual arrangements, with Yuxing and the sales VIE Companies the Company is entitled to substantially all of the economic benefits of Yuxing and the VIE Companies. The following financial statement amounts and balances of the VIEs were included in the accompanying consolidated financial statements as of March 31, 2018 and June 30, 2017:
| March 31, | June 30, | |||||||
| 2018 | 2017 | |||||||
| ASSETS | ||||||||
| Current Assets | ||||||||
| Cash and cash equivalents | $ | 1,174,732 | $ | 374,587 | ||||
| Accounts receivable, net | 31,971,388 | 30,687,859 | ||||||
| Inventories | 23,387,611 | 21,314,940 | ||||||
| Other current assets | 1,166,727 | 2,195,156 | ||||||
| Related party receivable | 556,286 | - | ||||||
| Advances to suppliers | 1,728,629 | 2,380,812 | ||||||
| Total Current Assets | 59,985,373 | 56,953,354 | ||||||
| Plant, Property and Equipment, Net | 12,322,679 | 12,418,906 | ||||||
| Other assets | 238,813 | 225,508 | ||||||
| Intangible Assets, Net | 12,173,920 | 13,002,818 | ||||||
| Goodwill | 3,506,296 | 3,837,038 | ||||||
| Total Assets | $ | 88,227,081 | $ | 86,437,624 | ||||
| LIABILITIES AND STOCKHOLDERS’ EQUITY | ||||||||
| Current Liabilities | ||||||||
| Short-term loan | $ | - | $ | 166,311 | ||||
| Accounts payable | 19,197,636 | 18,355,921 | ||||||
| Customer deposits | 471,786 | 1,375,785 | ||||||
| Accrued expenses and other payables | 3,873,176 | 3,833,868 | ||||||
| Amount due to related parties | 45,063,604 | 42,741,043 | ||||||
| Total Current Liabilities | $ | 68,606,202 | $ | 66,472,928 | ||||
| Long-term Loan | - | 3,549 | ||||||
| Total Liabilities | $ | 68,606,202 | $ | 66,476,477 | ||||
| Stockholders’ equity | 19,620,879 | 19,961,147 | ||||||
| Total Liabilities and Stockholders’ Equity | 88,227,081 | $ | 86,437,624 | |||||
| Three months ended March 31, | Nine months ended March 31, | |||||||||||||||
| 2018 | 2017 | 2018 | 2017 | |||||||||||||
| Revenue | $ | 16,127,953 | $ | 24,130,308 | $ | 47,205,271 | $ | 49,630,476 | ||||||||
| Expenses | 13,749,981 | 22,740,434 | 39,340,523 | 45,707,439 | ||||||||||||
| Net income (loss) | $ | 940,622 | $ | 1,389,874 | $ | 1,140,302 | $ | 3,923,037 | ||||||||
| 20 |
NOTE 17 – BUSINESS COMBINATIONS
On June 30, 2016, the Company, through its wholly-owned subsidiary Jinong, entered into strategic acquisition agreements and also into a series of contractual agreements to qualify as VIEs with the shareholders of Shaanxi Lishijie Agrochemical Co., Ltd., Songyuan Jinyangguang Sannong Service Co., Ltd., Shenqiu County Zhenbai Agriculture Co., Ltd., Weinan City Linwei District Wangtian Agricultural Materials Co., Ltd., Aksu Xindeguo Agricultural Materials Co., Ltd., and Xinjiang Xinyulei Eco-agriculture Science and Technology Co., Ltd.
Subsequently, on January 1, 2017, Jinong entered into similar strategic acquisition agreements and a series of contractual agreements to qualify as VIEs with the shareholders of Sunwu County Xiangrong Agricultural Materials Co., Ltd., and Anhui Fengnong Seed Co., Ltd.
On November 30, 2017, the Company, through its wholly-owned subsidiary Jinong, discontinued the strategic acquisition agreements and the series of contractual agreements with the shareholders of Zhenbai.
The VIE Agreements are as follows:
Entrusted Management Agreements
Pursuant to the terms of certain Entrusted Management Agreements dated June 30, 2016 and January 1, 2017, between Jinong and the shareholders of the sales VIE Companies (the “Entrusted Management Agreements”), the sales VIE Companies and their shareholders agreed to entrust the operations and management of its business to Jinong. According to the Entrusted Management Agreement, Jinong possesses the full and exclusive right to manage the sales VIE Companies’ operations, assets and personnel, has the right to control all the sales VIE Companies’ cash flows through an entrusted bank account, is entitled to the sales VIE Companies’ net profits as a management fee, is obligated to pay all the sales VIE Companies’ payables and loan payments, and bears all losses of the sales VIE Companies. The Entrusted Management Agreements will remain in effect until (i) the parties mutually agree to terminate the agreement; (ii) the dissolution of the sales VIE Companies; or (iii) Jinong acquires all the assets or equity of the sales VIE Companies (as more fully described below under “Exclusive Option Agreements”).
Exclusive Technology Supply Agreements
Pursuant to the terms of certain Exclusive Technology Supply Agreements dated June 30, 2016 and January 1, 2017, between Jinong and the sales VIE companies (the “Exclusive Technology Supply Agreements”), Jinong is the exclusive technology provider to the sales VIE companies. The sales VIE companies agreed to pay Jinong all fees payable for technology supply prior to making any payments under the Entrusted Management Agreement. The Exclusive Technology Supply Agreements shall remain in effect until (i) the parties mutually agree to terminate the agreement; (ii) the dissolution of the sales VIE companies; or (iii) Jinong acquires the sales VIE companies (as more fully described below under “Exclusive Option Agreements”).
Shareholder’s Voting Proxy Agreements
Pursuant to the terms of certain Shareholder’s Voting Proxy Agreements dated June 30, 2016 and January 1, 2017, among Jinong and the shareholders of the sales VIE companies (the “Shareholder’s Voting Proxy Agreements”), the shareholders of the sales VIE companies irrevocably appointed Jinong as their proxy to exercise on such shareholders’ behalf all of their voting rights as shareholders pursuant to PRC law and the Articles of Association of the sales VIE companies, including the appointment and election of directors of the sales VIE companies. Jinong agreed that it shall maintain a board of directors, the composition and appointment of which shall be approved by the Board of the Company. The Shareholder’s Voting Proxy Agreements will remain in effect until Jinong acquires all the assets or equity of the sales VIE companies.
Exclusive Option Agreements
Pursuant to the terms of certain Exclusive Option Agreements dated June 30, 2016 and January 1, 2017, among Jinong, the sales VIE companies, and the shareholders of the sales VIE companies (the “Exclusive Option Agreements”), the shareholders of the sales VIE companies granted Jinong an irrevocable and exclusive purchase option (the “Option”) to acquire the sales VIE companies’ equity interests and/or remaining assets, but only to the extent that the acquisition does not violate limitations imposed by PRC law on such transactions. The Option is exercisable at any time at Jinong’s discretion so long as such exercise and subsequent acquisition of the sales VIE companies does not violate PRC law. The consideration for the exercise of the Option is to be determined by the parties and memorialized in the future by definitive agreements setting forth the kind and value of such consideration. Jinong may transfer all rights and obligations under the Exclusive Option Agreements to any third parties without the approval of the shareholders of the sales VIE companies so long as a written notice is provided. The Exclusive Option Agreements may be terminated by mutual agreements or by 30 days written notice by Jinong.
Equity Pledge Agreements
Pursuant to the terms of certain Equity Pledge Agreements dated June 30, 2016 and January 1, 2017, among Jinong and the shareholders of the sales VIE companies (the “Pledge Agreements”), the shareholders of the sales VIE companies pledged all of their equity interests in the sales VIE companies to Jinong, including the proceeds thereof, to guarantee all of Jinong’s rights and benefits under the Entrusted Management Agreements, the Exclusive Technology Supply Agreements, the Shareholder’ Voting Proxy Agreements and the Exclusive Option Agreements. Prior to termination of the Pledge Agreements, the pledged equity interests cannot be transferred without Jinong’s prior written consent. The Pledge Agreements may be terminated only upon the written agreement of the parties.
| 21 |
Non-Compete Agreements
Pursuant to the terms of certain Non-Compete Agreements dated June 30, 2016 and January 1, 2017, among Jinong and the shareholders of the sales VIE companies (the “Non-Compete Agreements”), the shareholders of the sales VIE companies agreed that during the period beginning on the initial date of their services with Jinong, and ending five (5) years after termination of their services with Jinong, without Jinong’s prior written consent, they will not provide services or accept positions including but not limited to partners, directors, shareholders, managers, proxies or consultants, provided by any profit making organizations with businesses that may compete with Jinong. They will not solicit or interfere with any of the Jinong’s customers, or solicit, induce, recruit or encourage any person engaged or employed by Jinong to terminate his or her service or engagement. If the shareholders of the sales VIE companies breach the non-compete obligations contained therein, Jinong is entitled to all loss and damages; if the damages are difficult to determine, remedies bore the shareholders of the sales VIE companies shall be no less than 50% of the salaries and other expenses Jinong provided in the past.
The Company entered into these VIE Agreements as a way for the Company to have more control over the distribution of its products. The transactions are accounted for as business combinations in accordance with ASC 805. A summary of the purchase price allocations at fair value is below:
For acquisitions made on June 30, 2016:
| Cash | $ | 708,737 | ||
| Accounts receivable | 6,422,850 | |||
| Advances to suppliers | 1,803,180 | |||
| Prepaid expenses and other current assets | 807,645 | |||
| Inventories | 7,787,043 | |||
| Machinery and equipment | 140,868 | |||
| Intangible assets | 270,900 | |||
| Other assets | 3,404,741 | |||
| Goodwill | 3,158,179 | |||
| Accounts payable | (3,962,670 | ) | ||
| Customer deposits | (3,486,150 | ) | ||
| Accrued expenses and other payables | (4,653,324 | ) | ||
| Taxes payable | (16,912 | ) | ||
| Purchase price | $ | 12,385,087 |
A summary of the purchase consideration paid is below:
| Cash | $ | 5,568,500 | ||
| Convertible notes | 6,671,769 | |||
| Derivative liability | 144,818 | |||
| $ | 12,385,087 |
The cash component of the purchase price for these acquisitions made on June 30, 2016 was paid in July and August 2016.
For acquisitions made on January 1, 2017:
| Working Capital | $ | 941,192 | ||
| Machinery and equipment | 222,875 | |||
| Intangible assets | 1440 | |||
| Goodwill | 684,400 | |||
| Customer Relationship | 522,028 | |||
| Non-compete Agreement | 392,852 | |||
| Purchase price | $ | 2,764,787 |
| 22 |
A summary of the purchase consideration paid is below:
| Cash | $ | 1,201,888 | ||
| Convertible notes | 1,559,350 | |||
| Derivative liability | 3,549 | |||
| $ | 2,764,787 |
The cash component of the purchase price for these acquisitions made on January 1, 2017 was paid during March 2017.
On November 30, 2017, the Company, through its wholly-owned subsidiary Jinong, discontinued the strategic acquisition agreements and the series of contractual agreements with the shareholders of Zhenbai. In return, the shareholders of Zhenbai agreed to tender the whole payment consideration in the SAA back to the Company with early termination penalties. The convertible notes paid to Zhenbai’s shareholders and the accrued interest has been forfeited.
For the discontinuation of Zhenbai made on November 30, 2017, the Company gave up the control of the following assets in Zhenbai:
| Working Capital | $ | 1,175,696 | ||
| Intangible assets | 893,780 | |||
| Customer Relationship | 682,604 | |||
| Non-compete Agreement | 211,176 | |||
| Goodwill | 536,819 | |||
| Total Asset | $ | 2,606,296 |
In return, the purchase consideration returned to the Company from Zhenbai’s shareholders is summarized below:
| Cash | $ | 459,900 | ||
| Interest Payable | 82,782 | |||
| Convertible notes | 1,719,336 | |||
| Derivative liability | 13,312 | |||
| Total Payback | $ | 2,275,330 | ||
| Net Loss | (330,966 | ) |
| 23 |
Item 2. Management’s Discussion and Analysis of Financial Condition and Results of Operations
The following discussion and analysis of our financial condition and results of operations should be read in conjunction with our consolidated financial statements and the notes to those financial statements appearing elsewhere in this report. This discussion and analysis contains forward-looking statements that involve significant risks and uncertainties. As a result of many factors, such as the slow-down of the global financial marketsmacro-economic environment in China and its impact on economic growth in general, the competition in the fertilizer industry and the impact of such competition on pricing, revenues and margins, the weather conditions in the areas where our customers are based, the cost of attracting and retaining highly skilled personnel, the prospects for future acquisitions, and the factors set forth elsewhere in this report, our actual results may differ materially from those anticipated in these forward-looking statements. In light of these risks and uncertainties, there can be no assurance that the forward-looking statements contained in this report will in fact occur. You should not place undue reliance on the forward-looking statements contained in this report.
The forward-looking statements speak only as of the date on which they are made, and, except to the extent required by U.S. federal securities laws, we undertake no obligation to update any forward-looking statement to reflect events or circumstances after the date on which the statement is made or to reflect the occurrence of unanticipated events. Further, the information about our intentions contained in this report is a statement of our intention as of the date of this report and is based upon, among other things, the existing regulatory environment, industry conditions, market conditions and prices, and our assumptions as of such date. We may change our intentions, at any time and without notice, based upon any changes in such factors, in our assumptions or otherwise.
Unless the context indicates otherwise, as used in the notes to the financial statements of the Company, the following are the references herein of all the subsidiaries of the Company (i) Green Agriculture Holding Corporation (“Green New Jersey”), a wholly-owned subsidiary of Green Nevada incorporated in the State of New Jersey; (ii) Shaanxi TechTeam Jinong Humic Acid Product Co., Ltd. (“Jinong”), a wholly-owned subsidiary of Green New Jersey organized under the laws of the PRC; (iii) Xi’an Hu County Yuxing Agriculture Technology Development Co., Ltd. (“Yuxing”), a Variable Interest Entity in the PRC (“VIE”) controlled by Jinong through contractual agreements; (iv) Shaanxi Lishijie Agrochemical Co., Ltd. (“Lishijie”), a VIE controlled by Jinong through contractual agreements; (v) Songyuan Jinyangguang Sannong Service Co., Ltd. (“Jinyangguang”), a VIE in the PRC controlled by Jinong through contractual agreements; (vi) Weinan City Linwei District Wangtian Agricultural Materials Co., Ltd. (“Wangtian”), a VIE controlled by Jinong through contractual agreements; (vii) Aksu Xindeguo Agricultural Materials Co., Ltd. (“Xindeguo”), a VIE controlled by Jinong through contractual agreements; (vii) Xinjiang Xinyulei Eco-agriculture Science and Technology Co., Ltd (“Xinyulei”), a VIE controlled by Jinong through contractual agreements; (ix) Sunwu County Xiangrong Agricultural Materials Co., Ltd. (“Xiangrong”), a VIE controlled by Jinong through contractual agreements; (x) Anhui Fengnong Seed Co., Ltd. (“Fengnong”), a VIE controlled by Jinong through contractual agreements; (xi) Beijing Gufeng Chemical Products Co., Ltd., a wholly-owned subsidiary of Jinong in the PRC (“Gufeng”); and (xii) Beijing Tianjuyuan Fertilizer Co., Ltd., Gufeng’s wholly-owned subsidiary in the PRC (“Tianjuyuan”). Yuxing, Lishijie, Jinyangguang, Wangtian, Xindeguo, Xinyulei, Xiangrong and Fengnong may also collectively be referred to as the “the VIE Companies”; Lishijie, Jinyangguang, Wangtian, Xindeguo, Xinyulei, Xiangrong and Fengnong may also collectively be referred to as “the sales VIEs” or “the sales VIE companies”.
Unless the context otherwise requires, all references to (i) “PRC” and “China” are to the People’s Republic of China; (ii) “U.S. dollar,” “$” and “US$” are to United States dollars; and (iii) “RMB”, “Yuan” and Renminbi are to the currency of the PRC or China.
Overview
We are engaged in the research, development, production and sale of various types of fertilizers and agricultural products in the PRC through our wholly-owned Chinese subsidiaries, Jinong and Gufeng (including Gufeng’s subsidiary Tianjuyuan), Yuxing and our VIE.VIE, Yuxing. Our primary business is fertilizer products, specifically humic-acid based compound fertilizer produced by Jinong and compound fertilizer, blended fertilizer, organic compound fertilizer, slow-release fertilizer, highly-concentrated water-soluble fertilizer and mixed organic-inorganic compound fertilizer produced by Gufeng. In addition, through Yuxing, we develop and produce various agricultural products, such as top-grade fruits, vegetables, flowers and colored seedlings. For financial reporting purposes, our operations are organized into three business segments: fertilizer products (Jinong), fertilizer products (Gufeng) and agricultural products production (Yuxing).
| 24 |
The fertilizer business conducted by Jinong and Gufeng generated approximately 75.5%90.3% and 78.9% of our total revenues for the sixnine months ended DecemberMarch 31, 20172018 and 2016, respectively. The sales VIEs generated 21.6% and 18.0% of our revenues for the six months ended December 31, 2017, and 2016, respectively. Yuxing serves as a research and development base for our fertilizer products.
Fertilizer Products
As of DecemberMarch 31, 2017,2018, we had developed and produced a total of 720722 different fertilizer products in use, of which 136138 were developed and produced by Jinong and 333 by Gufeng, and 251 by the VIE Companies.companies.
Below is a table that shows the metric tons of fertilizer sold by Jinong and Gufeng and the revenue per ton for the periods indicated:
| Three Months Ended | Change | |||||||||||||||||||||||||||||||
| December 31, | 2016 to 2017 | Three Months Ended March 31, | Change from 2017 to 2018 | |||||||||||||||||||||||||||||
| 2017 | 2016 | Amount | % | 2018 | 2017 | Amount | % | |||||||||||||||||||||||||
| (metric tons) | (metric tons) | |||||||||||||||||||||||||||||||
| Jinong | 13,165 | 8,955 | 4,210 | 47.0 | % | 12,606 | 14.455 | (1,849 | ) | -12.8 | % | |||||||||||||||||||||
| Gufeng | 66,237 | 63,167 | 3,070 | 4.9 | % | 104,207 | 90,235 | 13,972 | 15.5 | % | ||||||||||||||||||||||
| 79,402 | 72,122 | 13,922 | 116,813 | 104,690 | 12,123 | 11.6 | % | |||||||||||||||||||||||||
| Three Months Ended December 31, | Three Months Ended March 31, | |||||||||||||||
| 2017 | 2016 | 2018 | 2017 | |||||||||||||
| (revenue per tons) | (revenue per ton) | |||||||||||||||
| Jinong | $ | 2,107 | $ | 2,996 | $ | 2,302 | $ | 1,821 | ||||||||
| Gufeng | 364 | 334 | 382 | 342 | ||||||||||||
| Six Months Ended | Change | |||||||||||||||||||||||||||||||
| December 31, | 2016 to 2017 | Nine months Ended March 31, | Change from 2017 to 2018 | |||||||||||||||||||||||||||||
| 2017 | 2016 | Amount | % | 2017 | 2016 | Amount | % | |||||||||||||||||||||||||
| (metric tons) | (metric tons) | |||||||||||||||||||||||||||||||
| Jinong | 27,690 | 18,635 | 9,055 | 48.6 | % | 40,297 | 39,740 | 557 | 1.4 | % | ||||||||||||||||||||||
| Gufeng | 129,404 | 108,698 | 20,706 | 19.0 | % | 225,053 | 198,933 | 26,120 | 13.1 | % | ||||||||||||||||||||||
| 157,094 | 127,333 | 29,761 | 265,350 | 238,673 | 26,677 | 11.2 | % | |||||||||||||||||||||||||
| Six Months Ended December 31, | Nine months Ended March 31, | |||||||||||||||
| 2017 | 2016 | 2018 | 2017 | |||||||||||||
| (revenue per tons) | (revenue per ton) | |||||||||||||||
| Jinong | $ | 2,045 | $ | 3,126 | $ | 2,205 | $ | 2,128 | ||||||||
| Gufeng | 352 | 339 | 375 | 340 | ||||||||||||
For the three months ended DecemberMarch 31, 2017,2018, we sold approximately 79,042116,813 metric tons of fertilizer products, as compared to 72,122104,690 metric tons for the three months ended DecemberMarch 31, 2016.2017. For the three months ended DecemberMarch 31, 2017,2018, Jinong sold approximately 13,16512,606 metric tons of fertilizer products, a decrease of 1,849 metric tons, or 12.8%, as compared to 14,455 metric tons for the three months ended March 31, 2017. For the three months ended March 31, 2018, Gufeng sold approximately 104,207 metric tons of fertilizer products, as compared to 8,95590,235 metric tons for the three months ended DecemberMarch 31, 2016. 2017, an increase of 13,972 metric tons, or 15.5%.
| 25 |
For the threenine months ended DecemberMarch 31, 2017, Gufeng2018, we sold approximately 66,237265,350 metric tons of fertilizer products, as compared to 63,167238,673 metric tons for the threenine months ended DecemberMarch 31, 2016.
2017. For the sixnine months ended DecemberMarch 31, 2017, we sold approximately 157,094 metric tons of fertilizer products, as compared to 127,333 metric tons for the six months ended December 31, 2016. For the six months ended December 31, 2017,2018, Jinong sold approximately 27,69040,297 metric tons of fertilizer products, an increase of 9,055557 metric tons, or 48.6%1.4%, as compared to 18,63539,740 metric tons for the sixnine months ended DecemberMarch 31, 2016.2017. For the sixnine months ended DecemberMarch 31, 2017,2018, Gufeng sold approximately 129,404225,053 metric tons of fertilizer products, an increase of 20,70626,120 metric tons, or 19.0%13.1%, as compared to 108,698198,933 metric tons for the sixnine months ended DecemberMarch 31, 2016.
Our sales of fertilizer products to customers in five provinces within China accounted for approximately 55.5%65.9% of our fertilizer revenue for the three months ended DecemberMarch 31, 2017.2018. Specifically, the provinces and their respective percentage contributingcontributed to our fertilizer revenues were: Hebei (23.4%(27.7%), Heilongjiang (9.0%(11.7%), Liaoning (10.9%), Inner Mongolia (7.8%), Liaoning (7.7%(9.2%), and Shaanxi (7.5%(6.4%).
As of DecemberMarch 31, 2017,2018, we had a total of 1,9391,952 distributors covering 22 provinces, 4 autonomous regions and 4 central government-controlled municipalities in China. Jinong had 1,1271139 distributors in China. Jinong’s sales are not dependent on any single distributor or any group of distributors. Jinong’s top five distributors accounted for 2.03%2.7% of its fertilizer revenues for the three months ended DecemberMarch 31, 2017.2018. Gufeng had 314315 distributors, including some large state-owned enterprises. Gufeng’s top five distributors accounted for 74.6%78.07% of its revenues for the three months ended DecemberMarch 31, 2017.2018.
Agricultural Products
Through Yuxing, we develop, produce and sell high-quality flowers, green vegetables and fruits to local marketplaces and various horticulture and planting companies. We also use certain of Yuxing’s greenhouse facilities to conduct research and development activities for our fertilizer products. The three PRC provinces and municipalities that accounted for 80.9%80.7% of our agricultural products revenue for the three months ended DecemberMarch 31, 20172018 were Shaanxi (60.1%(67.6%), Sichuan (10.4%(7.4%), and Zhejiang (7.5%Gansu (5.7%).
Recent Developments
New Productsproducts and distributors
During the three months ended DecemberMarch 31, 2017,2018, Jinong did not launch anylaunched two new fertilizer product. However,products. In addition, Jinong added 612 new distributors during this period. Gufeng did not launch any new fertilizer products but added twoone new distributors during the three months ended December 31, 2017distributor.
Strategic Acquisitions
On June 30, 2016 and January 1, 2017, through Jinong, we entered into (i) Strategic Acquisition Agreements (the “SAA”), and (ii) Agreements for Convertible Notes (the “ACN”), with the shareholders of the companies as identified below (the “Targets”).
June 30, 2016:
| Cash | Principal of | |||||||||
| Payment for | Notes for | |||||||||
| Acquisition | Acquisition | |||||||||
| Company Name | Business Scope | (RMB[1]) | (RMB) | |||||||
| Shaanxi Lishijie Agrochemical Co., Ltd. | Sales of pesticides, agricultural chemicals, chemical fertilizers, agricultural materials; Manufacture and sales of mulches. | 10,000,000 | 3,000,000 | |||||||
| Songyuan Jinyangguang Sannong Service Co., Ltd. | Promotion and consulting services regarding agricultural technologies; Retail sales of chemical fertilizers (including compound fertilizers and organic fertilizers); Wholesale and retail sales of pesticides, agricultural machinery and accessories; Collection of agricultural information; Development of saline-alkali soil; Promotion and development of high-efficiency agriculture and related information technology solutions for agriculture, agricultural and biological engineering high technologies; E-commerce; Cultivation of freshwater fish, poultry, fruits, flowers, vegetables, and seeds; Recycling and complex utilization of straw and stalk; Technology transfer and training; Recycling of agricultural materials ; Ecological industry planning. | 8,000,000 | 12,000,000 | |||||||
| Shenqiu County Zhenbai Agriculture Co., Ltd.[2] | Cultivation of crops; Storage, sales, preliminary processing and logistics distribution of agricultural by-products; Promotion and application of agricultural technologies; Purchase and sales of agricultural materials; Electronic commerce. | 3,000,000 | 12,000,000 | |||||||
| Weinan City Linwei District Wangtian Agricultural Materials Co., Ltd. | Promotion and application of new agricultural technologies; Professional prevention of plant diseases and insect pests; Sales of plant protection products, plastic mulches, material, chemical fertilizers, pesticides, agricultural medicines, micronutrient fertilizers, hormones, agricultural machinery and medicines, and gardening tools. | 6,000,000 | 12,000,000 | |||||||
| Aksu Xindeguo Agricultural Materials Co., Ltd. | Wholesale and retail sales of pesticides; Sales of chemical fertilizers, packaged seeds, agricultural mulches, micronutrient fertilizers, compound fertilizers, plant growth regulators, agricultural machineries, and water economizers; Consulting services for agricultural technologies; Purchase and sales of agricultural by- products. | 10,000,000 | 12,000,000 | |||||||
| Xinjiang Xinyulei Eco-agriculture Science and Technology Co., Ltd | Sales of chemical fertilizers, packaged seeds, agricultural mulches, micronutrient fertilizers, organic fertilizers, plant growth regulators, agricultural machineries, and water economizers; Purchase and sales of agricultural by-products; Cultivation of fruits and vegetables; Consulting services and training for agricultural technologies; Storage services; Sales of articles of daily use, food and oil; On-line sales of the above-mentioned products. | |||||||||
| Total | 37,000,000 | 51,000,000 | ||||||||
| (1) | The exchange rate between RMB and U.S. dollars on June 30, 2016 | |
| (2) | On November 30, 2017, the Company, through its wholly-owned subsidiary Jinong, discontinued the strategic acquisition agreements and the series of contractual agreements with the shareholders of Zhenbai. In return, the shareholders of Zhenbai agreed to tender the whole payment consideration in the SAA back to the Company with early termination penalties. The convertible notes paid to Zhenbai’s shareholders and the accrued interest has been forfeited. |
January 1, 2017:
| Cash | Principal of | |||||||||
| Payment for | Notes for | |||||||||
| Acquisition | Acquisition | |||||||||
| Company Name | Business Scope | (RMB[1]) | (RMB) | |||||||
| Sunwu County Xiangrong Agricultural Materials Co., Ltd. | Sales of pesticides, agricultural chemicals, chemical fertilizers, agricultural materials; Manufacture and sales of mulches. | 4,000,000 | 6,000,000 | |||||||
| Anhui Fengnong Seed Co., Ltd. | Wholesale and retail sales of pesticides; Sales of chemical fertilizers, packaged seeds, agricultural mulches, micronutrient fertilizers, compound fertilizers and plant growth regulators | 4,000,000 | 6,000,000 | |||||||
| Total | 8,000,000 | 12,000,000 | ||||||||
(2) The exchange rate between RMB and U.S. dollars on January 1, 2017 is
| (2) | The exchange rate between RMB and U.S. dollars on January 1, 2017 was RMB1=US$0.144, according to the exchange rate published by Bank of China. |
Pursuant to the SAA and the ACN, the shareholders of the Targets, while retaining possession of the equity interests and continuing to be the legal owners of such interests, agreed to pledge and entrust all of their equity interests, including the proceeds thereof but excluding any claims or encumbrances, and the operations and management of its business to Jinong, in exchange of an aggregate amount of RMB45,000,000 (approximately $6,731,600) to be paid by Jinong within three days following the execution of the SAA, ACN and the VIE Agreements, and convertible notes with an aggregate face value of RMB 63,000,000 (approximately $9,418,800) with an annual fixed compound interest rate of 3% and term of three years.
Jinong acquired the Targets using the VIE arrangement based on our need to further develop our business and comply with the regulatory requirements under the PRC laws.
As our business focuses on the production of fertilizer, all our business activities intertwine with those in the agriculture industry in China. Specifically, we deal with compliance, regulation, safety, inspection, and licenses in fertilizer production, farm land use and transfer, growing and distribution of agriculture goods, agriculture basic supplies, seeds, pesticides, and trades of grains. It is an industry in which heavy regulations get implemented and strictly enforced. In addition, E-commerce, which is also under strict government regulation in the PRC, has lately become a sales and distribution channel for agricultural products. Currently, we are developing an online platform to connect the physical distribution network we either own or lease.
Compared with the regulatory environment in other jurisdictions, the regulatory environment in the PRC is unique. For example, the “M&A Rules” purports to require that an offshore special purpose vehicle controlled directly or indirectly by PRC companies or individuals and formed for purposes of overseas listing through acquisition of PRC domestic interests held by such PRC companies or individuals obtain the approval of the China Securities Regulatory Commission (the “CSRC”) prior to the listing and trading of such special purpose vehicle’s securities on an overseas stock exchange. On September 21, 2006, the CSRC published procedures regarding its approval of overseas listings by special purpose vehicles.
For both e-commerce and agriculture industries, PRC regulators limit the investment from foreign entities and set particularly rules for foreign-owned entities to conduct business. We expect these limitations on foreign-owned entities will continue to exist in e-commerce and agriculture industries. The VIE arrangement, however, provides feasibility for obtaining administrative approval process and avoiding industry restrictions that can be imposed on an entity that is a wholly-owned subsidiary of a foreign entity. The VIE agreements reduce uncertainty and the current limitation risk. It is our understanding that the VIE agreements, as well as the control we obtained through VIE arrangement, are valid and enforceable. Such legal structure does not violate the known, published, and current PRC laws. While there are substantial uncertainties regarding the interpretation and application of PRC Laws and future PRC laws and regulations, and there can be no assurance that the PRC authorities will take a view that is not contrary to or otherwise different from our belief and understanding stated above, we believe the substantial difficulty that we experienced previously to conduct business in agriculture as a foreign ownership ca be greatly reduced by the VIE arrangement. Further, as an integral part of the VIE arrangement, the underlying equity pledge agreements provide legal protection for the control we obtained. Pursuant to the equity pledge agreements, we have completed the equity pledge processes with the Targets to ensure the complete control of the interests in the Targets. The shareholders of the Targets are not entitled to transfer any shares to a third party under the exclusive option agreements. If necessary, they may transfer shares to our company without consideration.
While the VIE arrangement provides us with the feasibility to conduct our business in the E-Commerce and agriculture industries, validity and enforceability of VIE arrangement is subject to (i) any applicable bankruptcy, insolvency, fraudulent transfer, reorganization, moratorium or similar laws affecting creditors’ rights generally, (ii) possible judicial or administrative actions or any PRC Laws affecting creditors’ rights, (iii) certain equitable, legal or statutory principles affecting the validity and enforceability of contractual rights generally under concepts of public interest, interests of the State, national security, reasonableness, good faith and fair dealing, and applicable statutes of limitation; (iv) any circumstance in connection with formulation, execution or implementation of any legal documents that would be deemed materially mistaken, clearly unconscionable, fraudulent, coercive at the conclusions thereof; and (v) judicial discretion with respect to the availability of indemnifications, remedies or defenses, the calculation of damages, the entitlement to attorney’s fees and other costs, and the waiver of immunity from jurisdiction of any court or from legal process. Validity and enforceability of VIE arrangement is also subject to risk derived from the discretion of any competent PRC legislative, administrative or judicial bodies in exercising their authority in the PRC. As a result, there can no assurance that any of such PRC Laws will not be changed, amended or replaced in the immediate future or in the longer term with or without retrospective effect.
Results of Operations
Three Months ended DecemberMarch 31, 20172018 Compared to the Three Months ended DecemberMarch 31, 2016.2017.
| Three Months Ended March 31, | ||||||||||||||||||||||||||||||||
| 2017 | 2016 | Change $ | Change % | 2018 | 2017 | Change ($) | Change (%) | |||||||||||||||||||||||||
| Sales | ||||||||||||||||||||||||||||||||
| Jinong | 26,211,280 | 26,825,674 | (614,394 | ) | -2.3 | % | 27,490,333 | 26,316,821 | 1,173,512 | 4.5 | % | |||||||||||||||||||||
| Gufeng | 24,447,721 | 21,066,559 | 3,381,162 | 16.0 | % | 38,932,597 | 30,858,499 | 8,074,098 | 26.2 | % | ||||||||||||||||||||||
| Yuxing | 1,953,748 | 2,454,314 | (500,566 | ) | -20.4 | % | 3,041,891 | 2,781,003 | 260,888 | 9.4 | % | |||||||||||||||||||||
| Sales VIEs | 11,350,893 | 8,398,466 | 2,952,427 | 35.2 | % | |||||||||||||||||||||||||||
| VIEs-others | 13,086,062 | 21,349,305 | (8,263,243 | ) | -38.7 | % | ||||||||||||||||||||||||||
| Net sales | 63,963,642 | 58,745,013 | 5,218,629 | 8.9 | % | 82,550,883 | 81,305,628 | 1,245,255 | 1.5 | % | ||||||||||||||||||||||
| Cost of goods sold | ||||||||||||||||||||||||||||||||
| Jinong | 13,265,827 | 12,332,360 | 933,467 | 7.6 | % | 13,526,095 | 12,143,167 | 1,382,928 | 11.4 | % | ||||||||||||||||||||||
| Gufeng | 21,160,024 | 18,138,659 | 3,021,365 | 16.7 | % | 34,114,896 | 26,319,435 | 7,795,461 | 29.6 | % | ||||||||||||||||||||||
| Yuxing | 1,536,238 | 1,934,046 | (397,808 | ) | -20.6 | % | 2,517,989 | 2,230,319 | 287,670 | 12.9 | % | |||||||||||||||||||||
| Sales VIEs | 9,452,987 | 7,159,707 | 2,293,280 | 32.0 | % | |||||||||||||||||||||||||||
| VIEs | 11,231,992 | 19,260,074 | (8,028,082 | ) | -41.7 | % | ||||||||||||||||||||||||||
| Cost of goods sold | 45,415,076 | 39,564,772 | 5,850,304 | 14.8 | % | 61,390,972 | 59,952,995 | 1,437,977 | 2.4 | % | ||||||||||||||||||||||
| Gross profit | 18,548,566 | 19,180,241 | (631,675 | ) | -3.3 | % | 13,526,095 | 21,352,633 | (192,722 | ) | -0.9 | % | ||||||||||||||||||||
| Operating expenses | ||||||||||||||||||||||||||||||||
| Selling expenses | 7,682,008 | 3,965,382 | 3,716,626 | 93.7 | % | 3,553,306 | 6,130,825 | (2,577,519 | ) | -42.0 | % | |||||||||||||||||||||
| Selling expenses - amortization of deferred asset | 0 | 3,475,438 | (3,475,438 | ) | -100.0 | % | 0 | 1,556,031 | (1,556,031 | ) | -100.0 | % | ||||||||||||||||||||
| General and administrative expenses | 937,359 | 4,633,905 | (3,696,546 | ) | -79.8 | % | 7,980,606 | 3,971,890 | 4,008,716 | 100.9 | % | |||||||||||||||||||||
| Total operating expenses | 8,619,367 | 12,074,725 | (3,455,358 | ) | -28.6 | % | 11,533,912 | 11,658,746 | (124,834 | ) | -1.1 | % | ||||||||||||||||||||
| Income from operations | 9,929,199 | 7,105,516 | 2,823,683 | 39.7 | % | 9,625,999 | 9,693,887 | (67,888 | ) | -0.7 | % | |||||||||||||||||||||
| Other income (expense) | ||||||||||||||||||||||||||||||||
| Other income (expense) | (669,760 | ) | (114,115 | ) | (555,645 | ) | 486.9 | % | (145,311 | ) | (330,538 | ) | (475,849 | ) | -144.0 | % | ||||||||||||||||
| Interest income | 130,248 | 76,494 | 53,754 | 70.3 | % | 138,009 | 79,280 | 58,729 | 74.1 | % | ||||||||||||||||||||||
| Interest expense | (94,587 | ) | (93,246 | ) | (1,341 | ) | 1.4 | % | (178,478 | ) | (232,639 | ) | 54,161 | -23.3 | % | |||||||||||||||||
| Total other income (expense) | (634,099 | ) | (130,867 | ) | (503,232 | ) | 384.5 | % | (185,780 | ) | 177,179 | (362,959 | ) | -204.9 | % | |||||||||||||||||
| Income before income taxes | 9,295,101 | 6,974,649 | 2,320,452 | 33.3 | % | 9,440,220 | 9,871,066 | (430,846 | ) | -4.4 | % | |||||||||||||||||||||
| Provision for income taxes | 1,521,646 | 1,468,638 | 53,008 | 3.6 | % | 1,813,187 | 1,679,391 | 133,796 | 8.0 | % | ||||||||||||||||||||||
| Net income | 7,773,455 | 5,506,011 | 2,267,444 | 41.2 | % | 7,627,033 | 8,191,675 | (564,642 | ) | -6.9 | % | |||||||||||||||||||||
| Other comprehensive income (loss) | ||||||||||||||||||||||||||||||||
| Foreign currency translation gain (loss) | 8,255,781 | (1,205,884 | ) | 9,461,665 | -784.6 | % | 16,213,419 | ) | (2,801,325 | 19,014,744 | -678.8 | % | ||||||||||||||||||||
| Comprehensive income (loss) | 16,029,236 | 4,300,127 | 11,729,109 | 272.8 | % | 23,840,452 | 5,390,350 | 18,450,102 | 342.3 | % | ||||||||||||||||||||||
| Basic weighted average shares outstanding | 365,987 | 37,658,062 | (37,292,075 | ) | -99.0 | % | 38,551,265 | 38,532,033 | 19,231 | 0.0 | % | |||||||||||||||||||||
| Basic net earnings per share | 0.20 | 0.15 | (0.07 | ) | 37.0 | % | 0.20 | 0.21 | -0.01 | -6.9 | % | |||||||||||||||||||||
| Diluted weighted average shares outstanding | 365,987 | 37,658,062 | (37,292,075 | ) | -99.0 | % | 38,896,945 | 38,532,033 | 364,912 | 0.9 | % | |||||||||||||||||||||
| Diluted net earnings per share | 0.20 | 0.15 | (0.07 | ) | 37.0 | % | 0.19 | 0.21 | -0.02 | -9.2 | % | |||||||||||||||||||||
Net Sales
Total net sales for the three months ended DecemberMarch 31, 20172018 were $63,963,642,$82,550,883, an increase of $5,218,629$1,245,255, or 8.9%1.5%, from $58,745,013$81,305,628 for the three months ended DecemberMarch 31, 2016.2017.This increase was largely due to the increase in Gufeng’s sales volume.
| 29 |
For the three months ended March 31, 2018, Jinong’s net sales increased by $1,173,512, or 4.5%, to $27,490,333 from $26,316,821 for the three months ended March 31, 2017. This increase was primarily duemainly attributable to an increase in sales VIE’s and Gufeng’s net sales.Jinong’s higher selling prices.
For the three months ended DecemberMarch 31, 2017, Jinong’s2018, Gufeng’s net sales decreased $614,394,were $38,932,597, an increase of $8,074,098 or 2.3%, to $26,211,28026.2% from $26,825,674$30,858,499 for the three months ended DecemberMarch 31, 2016.2017. This decreaseincrease was mainly attributable to the decreaseGufeng’s increase in Jinong’sboth selling prices and sales volume induring the last three months.months ended March 31, 2018.
For the three months ended DecemberMarch 31, 2017, Gufeng’s2018, Yuxing’s net sales were $24,447,721,$3,041,891, an increase of $3,381,162,$260,888 or 16.0%9.4%, from $21,066,559 for$2,781,003 during the three months ended DecemberMarch 31, 2016. This increase was mainly attributable to the increase in market demand during the last three months.
For the three months ended December 31, 2017, Yuxing’s net sales were $1,953,748, a decrease of $500,566 or 20.4%, from $2,454,314 for the three months ended December 31, 2016. The decrease was mainly due to the decrease in market demand during the last three months.
For the three months ended December 31, 2017, VIEs’ net sales were $11,350,893, an increase of $2,952,427 or 35.2%, from $8,398,466 for the three months ended December 31, 2016.2017. The increase was mainly attributable to the increase in market demand duringand the last three months.higher prices for Yuxing’s top-grade flowers.
For the three months ended March 31, 2018, VIEs’ net sales were $13,086,062, a decrease of $8,263,243 or 38.7%, from $21,349,305 for the three months ended March 31, 2017. The decrease was mainly attributable to the decrease in market demand during the three months ended March 31, 2018.
Cost of Goods Sold
Total cost of goods sold for the three months ended DecemberMarch 31, 20172018 was $45,415,076,$61,390,972, an increase of $5,850,304,$1,437,977, or 14.8%2.4%, from $39,564,772$59,952,995 for the three months ended DecemberMarch 31, 2016.2017. The increase was mainly due to the increase in sales VIE’svolumes for Gufeng and Gufeng’s cost of goods sold which increased 32.0% and 16.7% respectively.Yuxing.
Cost of goods sold by Jinong for the three months ended DecemberMarch 31, 20172018 was $13,265,827, a decrease$13,526,095, an increase of $933,467,$1,382,928, or 7.6%11.4%, from $12,332,360$12,143,167 for the three months ended DecemberMarch 31, 2016.2017. The decrease inincrease cost of goods sold was primarily attributable to the 2.3% decreaseincrease in net salesales during the last three months.months ended March 31, 2018.
Cost of goods sold by Gufeng for the three months ended DecemberMarch 31, 20172018 was $21,160,024,$34,114,896, an increase of $3,021,365,$7,795,461, or 16.7%29.6%, from $18,138,659$26,319,435 for the three months ended DecemberMarch 31, 2016.2017. This increase was primarily attributable to the more products soldincrease in net sales during the last three months.months ended March 31, 2018.
For the three months ended DecemberMarch 31, 2017,2018, cost of goods sold by Yuxing was $1,536,238, a decrease$2,517,989, an increase of $397,808$287,670, or 20.6%12.9%, from $1,934,046$2,230,319 for the three months ended DecemberMarch 31, 2016. The decrease in cost of goods2017. This increase was primarily attributablemainly due to the 20.4% decreaseincrease in Yuxing’s net salesales during the last three months.months ended March 31, 2018.
Cost of goods sold by VIEs for the three months ended DecemberMarch 31, 20172018 was $9,452,987, an increase$11,231,992, a decrease of $2,293,280,$8,028,082, or 32.0%41.7%, from $7,159,707$19,260,074 for the three months ended DecemberMarch 31, 2016.2017. This increasedecrease was primarily attributable to the more products solddecreased sales volume during the last three months.months ended March 31, 2018.
Gross Profit
Total gross profit for the three months ended DecemberMarch 31, 20172018 decreased by $631,675, or 3.3%,$192,722 to $18,548,566,$21,159,911, as compared to $19,180,241$21,352,633 for the three months ended DecemberMarch 31, 2016.2017. Gross profit margin was 29.0%25.6% and 32.6%26.3% for the three months ended DecemberMarch 31, 20172018 and 2016, respectively.
Gross profit generated by Jinong decreased by $1,547,861, or 10.7%, to $12,945,453 for the three months ended December 31, 2017, from $14,493,314 for the three months ended December 31, 2016. Gross profit margin from Jinong’s sales was approximately 49.4% and 54.0% for the three months ended December 31, 2017 and 2016, respectively. The decrease in gross profit margin was mainly due to higherthe increasing in cost of raw material cost and packaging compared to the same period last year.
Gross profit generated by Jinong decreased by $209,416, or 1.5%, to $13,964,238 for the three months ended March 31, 2018 from $14,173,654 for the three months ended March 31, 2017. Gross profit margin from Jinong’s sales was approximately 50.8% and 53.9% for the three months ended March 31, 2018 and 2017, respectively. The decrease in gross profit margin was mainly due to the higher packaging cost.
For the three months ended DecemberMarch 31, 2017,2018, gross profit generated by Gufeng was $3,287,697,$4,817,701, an increase of $359,797,$278,637, or 12.3%6.1%, from $2,927,900$4,539,064, for the three months ended DecemberMarch 31, 2016.2017. Gross profit margin from Gufeng’s sales was approximately 13.4%12.4% and 13.9%14.7% for the three months ended DecemberMarch 31, 20172018 and 2016,2017, respectively. The decrease in gross profit percentage was mainly due to the increaseincreased weight for lower-margin products sales in product costs and the decrease inGufeng’s total sales, prices.answering market demand.
For the three months ended DecemberMarch 31, 2017,2018, gross profit generated by Yuxing was $417,510,$523,902, a decrease of $102,758,$26,782 or 19.8%4.9% from $520,268$550,684 for the three months ended DecemberMarch 31, 2016.2017. The gross profit margin was approximately 21.4%17.2% and 21.2%19.8% for the three months ended DecemberMarch 31, 2018 and 2017, and 2016, respectively, which is slightly increased.respectively. The decrease in gross profit margin was mainly due to the higher raw material costs during the three months ended March 31, 2018.
Gross profit generated by VIEs increaseddecreased by $659,147,$235,161, or 53.2%11.3%, to $1,897,906$1,854,070 for the three months ended DecemberMarch 31, 20172018 from $ 1,234,7592,089,231 for the three months ended DecemberMarch 31, 2016.2017. Gross profit margin from VIE’s sales was approximately 16.7%14.2% and 14.7%9.8% for the three months ended December 31, 20172018 and 2016,2017, respectively.
Selling Expenses
Our selling expenses consisted primarily of salaries of sales personnel, advertising and promotion expenses, freight-out costs and related compensation. Selling expenses were $7,682,008,$3,553,306, or 12.0%4.3%, of net sales for the three months ended DecemberMarch 31, 2017,2018, as compared to $3,965,382,$6,130,825, or 6.8%7.5%, of net sales for the three months ended DecemberMarch 31, 2016, an increase2017, a decrease of $3,716,626,$2,577,519, or 93.7%42.0%.
The selling expenses of Jinong for the three months ended DecemberMarch 31, 20172018 were $7,172,773$3,162,789, or 27.4%11.5%, of Jinong’s net sales, as compared to selling expenses of $3,637,790$16,894,249, or 13.6%64.2%, of Jinong’s net sales for the three months ended DecemberMarch 31, 2016. The increase in Jinong’s selling expenses was due to Jinong’s expanded marketing efforts.2017. The selling expenses of Yuxing were $10,498$12,691, or 0.5%0.4%, of Yuxing’s net sales for the three months ended DecemberMarch 31, 2017,2018, as compared to $11,264$10,690, or 0.5%0.4%, of Yuxing’s net sales for the three months ended DecemberMarch 31, 2016.2017. The selling expenses of Gufeng were $ 189,945$94,665, or 0.1%0.2%, of Gufeng’s net sales for the three months ended DecemberMarch 31, 2017,2018, as compared to $68,080$80,781, or 0.3%, of Gufeng’s net sales for the three months ended DecemberMarch 31, 2016.2017. The selling expenses of VIEs were $319,290$283,161, or 2.4%2.2%, of VIEs’ net sales for the three months ended DecemberMarch 31, 2017,2018, as compared to $248,248,$912,957, or 3.0%1.8%, of VIEs’ net sales for the three months ended DecemberMarch 31, 2016.2017.
Selling Expenses – amortization of deferred assets
Our selling expenses - amortization of our deferred assets were 0 for the three months ended DecemberMarch 31, 2017,2018, as compared to $3,475,438,$1,556,031 or 5.9%1.9%, of net sales for the three months ended DecemberMarch 31, 2016.2017, a decrease of $1,556,031, or 100%. This decrease was due to the fact that all of the deferred assets were fully amortized and therefore no amortization was recorded on the fully amortized assets during the three months ended DecemberMarch 31, 2017.2018.
General and Administrative Expenses
General and administrative expenses consisted primarily of related salaries, rental expenses, business development, depreciation and travel expenses incurred by our general and administrative departments and legal and professional expenses including expenses incurred and accrued for certain litigation. General and administrative expenses were $937,359,$7,980,606, or 1.5% of net sales for the three months ended December 31, 2017, as compared to $ 4,633,905, or 12.1%9.7%, of net sales for the three months ended DecemberMarch 31, 2016, a decrease2018, as compared to $3,971,890, or 4.9%, of $ 3,696,546,net sales for the three months ended March 31, 2017, an increase of $4,008,716, or 79.8%100.9%. The increase in general and administrative expenses was mainly due to Jinong, which had $5,097,168 of general and administrative expenses during the three months ended March 31, 2018.
Total Other ExpensesIncome
Total other expensesincome consisted of income from subsidies received from the PRC government, interest income, interest expenses and bank charges. TotalThe total other expense for the three months ended DecemberMarch 31, 20172018 was $572,155,$185,780 as compared to $130,867total other income of $177,179 for the three months ended DecemberMarch 31, 2016, an increase in expense2017, a decrease of $441,288,$362,959, or 337.2%.204.9 %. The increase in total other expense was largelymainly resulted from the increase for bank charges and accretion expenses offset by the decrease in interest expenses.
Income Taxes
Jinong is subject to a preferred tax rate of 15% as a result of its business being classified as a High-Tech project under the PRC Enterprise Income Tax Law (“EIT”) that became effective on January 1, 2008. Jinong incurred income tax expenses of $1,836,635$860,801 for the three months ended DecemberMarch 31, 2017,2018, as compared to $891,953$935,038 for the three months ended DecemberMarch 31, 2016, an increase2017, a decrease of $ 944,682,$74,237, or 105.9%7.9%.
Gufeng, is subject to a tax rate of 25%, incurred income tax expenses of $ 1,159,097$764,051 for the three months ended DecemberMarch 31, 2017,2018, as compared to $484,768$615,713 for the three months ended DecemberMarch 31, 2016,2017, an increase of $ 674,329,148,338, or 139.1%, which was primarily due to Gufeng’s increased net income.24.1%.
Yuxing hashad no income tax for the three months ended DecemberMarch 31, 2017 and 20162018 as a result of being exempted from paying income tax due to the fact its products fallingfall into the tax exemption list set out in the EIT.
| 31 |
Net Income
Net income for the three months ended DecemberMarch 31, 20172018 was $7,773,455, an increase$7,627,033, a decrease of $2,267,444,$564,642, or 41.2%6.9%, compared to $5,506,011$8,191,675 for the three months ended DecemberMarch 31, 2016.2017. Net income as a percentage of total net sales was approximately 12.2%9.2% and 9.4%10.1% for the three months ended DecemberMarch 31, 20172018 and 2016,2017, respectively.
Six MonthsNine months ended DecemberMarch 31, 20172018 Compared to the Six MonthsNine months ended DecemberMarch 31, 2016.2017.
| Nine Months Ended March 31, | ||||||||||||||||||||||||||||||||
| 2017 | 2016 | Change $ | Change % | 2018 | 2017 | Change$ | Change% | |||||||||||||||||||||||||
| Sales | ||||||||||||||||||||||||||||||||
| Jinong | 52,985,040 | 58,253,394 | (5,268,354 | ) | -9.0 | % | $ | 80,475,373 | 84,570,215 | (4,094,842 | ) | -4.8 | % | |||||||||||||||||||
| Gufeng | 42,669,787 | 36,876,073 | 5,793,714 | 15.7 | % | 81,602,384 | 67,734,572 | 13,867,812 | 20.5 | % | ||||||||||||||||||||||
| Yuxing | 3,746,391 | 3,809,725 | (63,334 | ) | -1.7 | % | 6,788,282 | 6,590,728 | 197,554 | 3.0 | % | |||||||||||||||||||||
| Sales VIEs | 27,330,927 | 21,690,443 | 5,640,484 | 26.0 | % | |||||||||||||||||||||||||||
| VIEs | 40,416,989 | 43,039,748 | (2,622,759 | ) | -6.1 | % | ||||||||||||||||||||||||||
| Net sales | 126,732,145 | 120,629,635 | 6,102,510 | 5.1 | % | 209,283,028 | 201,935,263 | 7,347,765 | 3.6 | % | ||||||||||||||||||||||
| Cost of goods sold | ||||||||||||||||||||||||||||||||
| Jinong | 26,378,583 | 25,601,590 | 776,993 | 3.0 | % | 39,904,678 | 37,744,757 | 2,159,921 | 5.7 | % | ||||||||||||||||||||||
| Gufeng | 37,146,453 | 31,523,736 | 5,622,717 | 17.8 | % | 71,261,349 | 57,843,171 | 13,418,178 | 23.2 | % | ||||||||||||||||||||||
| Yuxing | 2,928,791 | 2,979,654 | (50,863 | ) | -1.7 | % | 5,446,780 | 5,209,973 | 236,807 | 4.5 | % | |||||||||||||||||||||
| Sales VIEs | 22,661,751 | 17,913,386 | 4,748,365 | 26.5 | % | |||||||||||||||||||||||||||
| VIEs | 33,893,743 | 37,173,460 | (3,279,717 | ) | -8.8 | % | ||||||||||||||||||||||||||
| Cost of goods sold | 89,115,578 | 78,018,366 | 11,097,212 | 14.2 | % | 150,506,550 | 137,971,361 | 12,535,189 | 9.1 | % | ||||||||||||||||||||||
| Gross profit | 37,616,567 | 42,611,269 | (4,994,702 | ) | -11.7 | % | 58,776,478 | 63,963,902 | (5,187,424 | ) | -8.1 | % | ||||||||||||||||||||
| Operating expenses | ||||||||||||||||||||||||||||||||
| Selling expenses | 12,861,012 | 8,977,450 | 3,883,562 | 43.3 | % | 16,414,318 | 15,108,275 | 1,306,043 | 8.6 | % | ||||||||||||||||||||||
| Selling expenses - amortization of deferred asset | 9,584,220 | (9,584,220 | ) | -100.0 | % | 11,140,251 | (11,140,251 | ) | -100.0 | % | ||||||||||||||||||||||
| General and administrative expenses | 7,909,981 | 7,865,392 | 44,589 | 0.6 | % | 15,890,586 | 11,837,282 | 4,053,304 | 34.2 | % | ||||||||||||||||||||||
| Total operating expenses | 20,770,993 | 26,427,062 | (5,656,069 | ) | -21.4 | % | 32,304,904 | 38,085,808 | (5,780,904 | ) | -15.2 | % | ||||||||||||||||||||
| Income from operations | 16,845,574 | 16,184,207 | 661,367 | 4.1 | % | 26,471,574 | 25,878,094 | 593,480 | 2.3 | % | ||||||||||||||||||||||
| Other income (expense) | ||||||||||||||||||||||||||||||||
| Other income (expense) | (676,991 | ) | (155,172 | ) | (521,819 | ) | 336.3 | % | (438,144 | ) | 175,366 | (613,510 | ) | -349.8 | % | |||||||||||||||||
| Discontinued VIE operation - Zhenbai | (322,214 | ) | 0 | (322,214 | ) | |||||||||||||||||||||||||||
| Interest income | 218,162 | 153,116 | 65,046 | 42.5 | % | 356,172 | 232,396 | 123,776 | 53.3 | % | ||||||||||||||||||||||
| Interest expense | (274,162 | ) | (231,791 | ) | (42,371 | ) | 18.3 | % | (452,640 | ) | (464,430 | ) | 11,790 | -2.5 | % | |||||||||||||||||
| Total other income (expense) | (732,991 | ) | (233,847 | ) | (499,144 | ) | 213.4 | % | (856,826 | ) | (56,668 | ) | (800,158 | ) | 1412.0 | % | ||||||||||||||||
| Income before income taxes | 16,112,584 | 15,950,360 | 162,224 | 1.0 | % | 25,614,747 | 25,821,426 | (206,679 | ) | -0.8 | % | |||||||||||||||||||||
| Provision for income taxes | 3,244,301 | 3,092,769 | 151,532 | 4.9 | % | 5,066,780 | 4,772,160 | 294,620 | 6.2 | % | ||||||||||||||||||||||
| Net income | 12,868,283 | 12,857,591 | 10,692 | 0.1 | % | 20,547,967 | 21,049,266 | (501,299 | ) | -2.4 | % | |||||||||||||||||||||
| Other comprehensive income (loss) | ||||||||||||||||||||||||||||||||
| Foreign currency translation gain (loss) | 8,495,999 | (16,447,063 | ) | 24,943,062 | -151.7 | % | 24,710,375 | (19,248,388 | ) | 43,958,763 | -228.4 | % | ||||||||||||||||||||
| Comprehensive income (loss) | 21,364,282 | (3,589,472 | ) | 24,953,754 | -695.2 | % | $ | 45,258,342 | 1,800,878 | 43,457,464 | 2413.1 | % | ||||||||||||||||||||
| Basic weighted average shares outstanding | 38,551,264 | 37,653,333 | 897,931 | 2.4 | % | 38,551,265 | 37,941,957 | 609,308 | 1.6 | % | ||||||||||||||||||||||
| Basic net earnings per share | 0.33 | 0.34 | (0.01 | ) | -2.2 | % | $ | 0.53 | 0.55 | (0.02 | ) | -3.9 | % | |||||||||||||||||||
| Diluted weighted average shares outstanding | 38,551,264 | 37,653,333 | 897,931 | 2.4 | % | 38,896,945 | 37,941,957 | 954,988 | 2.5 | % | ||||||||||||||||||||||
| Diluted net earnings per share | 0.33 | 0.34 | (0.01 | ) | -2.2 | % | 0.53 | 0.55 | (0.02 | ) | -4.8 | % | ||||||||||||||||||||
Net Sales
Total net sales for the sixnine months ended DecemberMarch 31, 20172018 were $126,732,145,$209,283,028, an increase of $6,102,510,$7,347,765, or 5.1%3.6%, from $120,629,635$201,935,263 for the sixnine months ended DecemberMarch 31, 2016.
This2017.This increase was largely due to the increase of VIEs’ net sales during the six months ended December 31, 2017. The VIEs’Gufeng’s net sales for the sixnine months ended DecemberMarch 31, 2017 were $27,330,927, an increase of $5,640,484, or 26.0% from the same period a year ago.2018.
For the sixnine months ended DecemberMarch 31, 2017,2018, Jinong’s net sales decreased by $5,268,354,$4,094,842, or 9.0%4.8%, to $52,985,040$80,475,373 from $58,253,394$84,570,215 for the sixnine months ended DecemberMarch 31, 2016.2017. This decrease was mainly attributable to the decrease in Jinong’s sales volume, which was a result of Jinong’s implementation of its new sales strategy that further focuses on producing high-margin liquidrebalanced the production of fertilizer types during the last six months.nine months ended March 31, 2018.
For the sixnine months ended DecemberMarch 31, 2017,2018, Gufeng’s net sales were $42,669,787,$81,602,384, an increase of $5,793,714$13,867,812, or 15.7%20.5%, from $36,876,073$67,734,572 for the sixnine months ended DecemberMarch 31, 2016.2017. This increase was mainly attributable to the increase in Gufeng’s sales volume, which was result of the increase inhigher selling prices and volumes to answer market demand during the sixnine months ended DecemberMarch 31, 2018.
For the nine months ended March 31, 2018, Yuxing’s net sales were $6,788,282, a slight increase of $197,554, or 3.0%, from $6,590,728 during the nine months ended March 31, 2017.
For the sixnine months ended DecemberMarch 31, 2017, Yuxing’s2018, VIEs’ net sales were $3,746,391, a slight decrease$ 40,416,989, an increase of $63,334$ 2,622,759 or 1.7%,6.1% from $3,809,725 during$ 43,039,748 for the sixnine months ended DecemberMarch 31, 2016. The2017. This decrease was mainly attributable to the decrease in market demand.
For the six months ended December 31, 2017, VIEs’ net sales were $ 27,330,927, an increase of $ 5,640,484 or 26.0% from $ 21,690,443 for the six months ended December 31, 2016. This increase was mainly attributable to the increase in VIEs’ sales volume, which was result of the increasedecrease in market demand during the sixnine months ended DecemberMarch 31, 2017.2018.
Cost of Goods Sold
Total cost of goods sold for the sixnine months ended DecemberMarch 31, 20172018 was $89,115,578,$150,506,550, an increase of $11,097,212,$12,535,189, or 14.2%9.1%, from $78,018,366$137,971,361 for the sixnine months ended DecemberMarch 31, 2016.2017. This increase was mainly due to the increase for Jinong and VIE’s cost of goods sold.in Gufeng’s next sales.
Cost of goods sold by Jinong for the sixnine months ended DecemberMarch 31, 20172018 was $26,378,583,$39,904,678, an increase of $776,993,$2,159,921, or 3.0%5.7%, from $25,601,590$37,744,757 for the sixnine months ended DecemberMarch 31, 2016.2017. The increase was primarily dueattributable to its higher raw material and packing cost during the higher labor cost.nine months ended March 31, 2018.
Cost of goods sold by Gufeng for the sixnine months ended DecemberMarch 31, 20172018 was $37,146,453$71,261,349, an increase of $5,622,717,$13,418,178, or 17.8%23.2%, from $31,523,736$57,843,171 for the sixnine months ended DecemberMarch 31, 2016.2017. This increase was primarily attributable to the increase in net salesmore products sold during the last six months.nine months ended March 31, 2018.
For the sixnine months ended DecemberMarch 31, 2017,2018, cost of goods sold by Yuxing was $2,928,791, a slight decrease$5,446,780, an increase of $50,863,$236,807, or 1.7%4.5%, from $2,979,654$5,209,973 for the sixnine months ended DecemberMarch 31, 2016.2017. This decreaseincrease was mainly due to the decreaseincrease in Yuxing’s net sales.sales and the higher labor costs.
Cost of goods sold by VIEs for the sixnine months ended DecemberMarch 31, 20172018 was $22,661,751 an increase$33,893,743 a decrease of $4,748,365,$3,279,717, or 26.5%8.8%, from $ 17,913,38637,173,460 for the sixnine months ended DecemberMarch 31, 2016.2017. This increasedecrease was primarily attributable to the increasedecrease in net sales during the last six months.nine months ended March 31, 2018.
Gross Profit
Total gross profit for the sixnine months ended DecemberMarch 31, 20172018 decreased by $4,994,702$5,187,424 to $37,616,567,$58,776,478, as compared to $42,611,269$63,963,902 for the sixnine months ended DecemberMarch 31, 2016.2017. Gross profit margin was 29.7%28.1% and 35.3%31.7% for the sixnine months ended DecemberMarch 31, 20172018 and 2016,2017, respectively.
Gross profit generated by Jinong decreased by $ 6,045,347,$6,254,763, or 18.5%13.4%, to $26,606,457$40,570,695 for the sixnine months ended DecemberMarch 31, 20172018 from $32,651,804$46,825,458 for the sixnine months ended DecemberMarch 31, 2016.2017. Gross profit margin from Jinong’s sales was approximately 50.2%50.4% and 56.1%55.4% for the sixnine months ended DecemberMarch 31, 20172018 and 2016,2017, respectively. The decrease in gross profit margin was mainly due to higher raw material cost and higher packaging cost.
For the sixnine months ended DecemberMarch 31, 2017,2018, gross profit generated by Gufeng was $5,523,334,$10,341,035, an increase of $170,997,$ 449,634, or 3.2%4.5%, from $5,352,337$9,891,401 for the sixnine months ended DecemberMarch 31, 2016.2017. Gross profit margin from Gufeng’s sales was approximately 12.9%12.7% and 14.5%14.6% for the sixnine months ended DecemberMarch 31, 20172018 and 2016,2017, respectively. The decrease in gross profit percentage was mainly due to the increased weight for lower-margin products sales in Gufeng’s total sales, answering to market demand.
For the sixnine months ended DecemberMarch 31, 2017,2018, gross profit generated by Yuxing was $817,600,$1,341,502, a slight decrease of $12,471,$39,253, or 1.5%2.8% from $830,071$1,380,755 for the sixnine months ended DecemberMarch 31, 2016.2017. The gross profit margin was approximately 21.8%19.8% and 21.8%20.9% for the sixnine months ended DecemberMarch 31, 2018 and 2017, and 2016, respectively. The decrease in gross profit margin was mainly due to the higher labor cost during the nine months ended March 31, 2018.
For the sixnine months ended DecemberMarch 31, 2017,2018, gross profits generated by VIEs were $4,669,176,$6,523,246, an increase of $892,119,$ 656,958, or 23.6%11.2%, from $3,777,057$5,866,288 for the sixnine months ended DecemberMarch 31, 2016.2017. Gross profit margin from VIEs’ sales was approximately 17.1%16.1% and 17.4%13.6% for the sixnine months ended DecemberMarch 31, 20172018 and 2016,2017, respectively. The slight decreaseincrease in gross profit percentage was mainly due to higher raw material cost.selling prices.
| 33 |
Selling Expenses
Our selling expenses consisted primarily of salaries of sales personnel, advertising and promotion expenses, freight-out costs and related compensation. Selling expenses were $12,861,012,$16,414,318, or 10.1%7.8%, of net sales for the sixnine months ended DecemberMarch 31, 2017,2018, as compared to $8,977,450or 7.4%$15,108,275, or 7.5% of net sales for the sixnine months ended DecemberMarch 31, 2016,2017, an increase of $3,883,562,$1,306,043, or 43.3%8.6%. This increase was primarily due to Jinong. The selling expenses of Jinong for the sixnine months ended DecemberMarch 31, 20172018 were $12,015,951$15,178,740 or 22.7%18.9% of Jinong’s net sales, as compared to selling expenses of $8,142,911$13,871,464 or 14.0%16.4% of Jinong’s net sales for the sixnine months ended DecemberMarch 31, 2016. The increase in Jinong’s selling expenses was due to Jinong’s expanded marketing efforts and the increase in shipping costs.2017. The selling expenses of Yuxing were $20,144$32,835 or 1.1% of Yuxing’s net sales for the nine months ended March 31, 2018, as compared to $29,665 or 0.5% of Yuxing’s net sales for the sixnine months ended DecemberMarch 31, 2017, as compared to $18,975, or 0.5% of Yuxing’s net sales for the six months ended December 31, 2016. The2017.The selling expenses of Gufeng were $285,721$380,386 or 0.7%1.0% of Gufeng’s net sales for the sixnine months ended DecemberMarch 31, 2017,2018, as compared to $213,408$294,189 or 0.6%0.4% of Gufeng’s net sales for the sixnine months ended DecemberMarch 31, 2016.2017. The selling expenses of VIEs were $559,341,$822,357, or 1.8%2.0%, of VIEs’ net sales or the six months ended December 31, 2017, as compared to $602,156, or 2.8% of VIEs’ net sales for the sixnine months ended DecemberMarch 31, 2016.2018, as compared to $912,957, or 1.8% of VIEs’ net sales for the nine months ended March 31, 2017.
Selling Expenses – amortization of deferred assets
Our selling expenses - amortization of our deferred assets were 0 for the sixnine months ended DecemberMarch 31, 2017,2018, as compared to $9,584,220,$11,140,251, or 7.9%5.5%, of net sales for the sixnine months ended DecemberMarch 31, 2016.2017, a decrease of $11,140,251, or 100%. This decrease was due to the fact that all of the deferred assets were fully amortized and therefore no amortization was recorded on the fully amortized assets during the sixnine months ended DecemberMarch 31, 2017.2018.
General and Administrative Expenses
General and administrative expenses consisted primarily of related salaries, rental expenses, business development, depreciation and travel expenses incurred by our general and administrative departments and legal and professional expenses including expenses incurred and accrued for certain litigation. General and administrative expenses were $7,909,981,$15,890,586, or 6.2%7.6% of net sales for the sixnine months ended DecemberMarch 31, 2017,2018, as compared to $7,865,392,$11,837,282, or 6.5%5.9%, of net sales for the sixnine months ended DecemberMarch 31, 2016,2017, an increase of $44,589,$4,053,304, or 0.6%34.2%. The increase in general and administrative expenses was mainly due to VIEs, which had $4,589,796 general and administrative expenses during the nine months ended March 31, 2018.
Total Other Income and Expenses
Total other income and expenses consisted of income from subsidies received from the PRC government, interest income, interest expenses and bank charges. The total other expense for the sixnine months ended DecemberMarch 31, 20172018 was $732,991,$856,826, as compared to $ 233,847$56,668 for the sixnine months ended DecemberMarch 31, 2016,2017, an increase of $499,144,$800,158, or 213.4%1412.0%. The increase in total other expensewas mainly resulted fromdue to the increasediscontinued VIE operation-Zhanbai, which accounted for bank charges and accretion expenses. The bank charges increased by $128,854 or 1207.4%, to $139,626 during the six months ended December 31, 2017 as compared to $10,672 during the six months ended December 31, 2016. Accretion expenses increased by $174,274 or 112.2%, to $329,609 during the six months ended December 31, 2017 as compared to $155,335 during the six months ended December 31, 2016.$335,562.
Income Taxes
Jinong is subject to a preferred tax rate of 15% as a result of its business being classified as a High-Tech project under the PRC Enterprise Income Tax Law (“EIT”) that became effective on January 1, 2008. Jinong incurred income tax expenses of $ 1,845,9262,689,188 for the sixnine months ended DecemberMarch 31, 2017,2018, as compared to $1,879,465$2,814,503 for the sixnine months ended DecemberMarch 31, 2016,2017, a decrease of $33,539,$125,315, or 1.8%4.5%.
Gufeng, subject to a tax rate of 25%, incurred income tax expenses of $ 1,159,0971,899,873 for the sixnine months ended DecemberMarch 31, 2017, as compared to $792,503$1,408,216 for the sixnine months ended DecemberMarch 31, 2016,201, an increase of $366,594,$491,657, or 46.3%34.9%. The increase is mainly due to the increase in net sales for Gufeng for the six months ended December 31, 2017 comparing to the same period of last year.
Yuxing hadhas no income tax for the sixnine months ended DecemberMarch 31, 20172018 as a result of being exempted from paying income tax, due toas its products fallingfall into the tax exemption list set out in the EIT.
Net Income
Net income for the sixnine months ended DecemberMarch 31, 20172018 was $12,868,283,$20,547,967, a slight increaseslightly decrease of $10,692,$501,299, or 0.1%2.4%, compared to $12,857,591$21,049,266 for the sixnine months ended DecemberMarch 31, 2016.2017. Net income as a percentage of total net sales was approximately 10.2%9.8% and 10.710.4 % for the sixnine months ended DecemberMarch 31, 20172018 and 2016,2017, respectively.
Discussion of Segment Profitability Measures
As of DecemberMarch 31, 2017,2018, we were engaged in the following businesses: the production and sale of fertilizers through Jinong and Gufeng, the production and sale of high-quality agricultural products by Yuxing, and the sales of agriculture materials by the sales VIEs. For financial reporting purpose, our operations were organized into four main business segments based on locations and products: Jinong (fertilizer production), Gufeng (fertilizer production) and Yuxing (agricultural products production) and the sales VIEs. Each of the segments has its own annual budget about development, production and sales.
Each of the four operating segments referenced above has separate and distinct general ledgers. The chief operating decision maker (“CODM”) makes decisions with respect to resources allocation and performance assessment upon receiving financial information, including revenue, gross margin, operating income and net income produced from the various general ledger systems; however, net income by segment is the principal benchmark to measure profit or loss adopted by the CODM.
For Jinong, the net income decreasedincreased by $ 264,477,190,073 or 2.6%1.3% to $ 10,460,24915,238,735 for sixthe nine months ended DecemberMarch 31, 2017,2018 from $10,195,772$15,048,662 for the sixnine months ended DecemberMarch 31, 2016. The decrease was principally due to higher selling expenses.2017.
For Gufeng, the net income increased by $ 1,492,3671,381,318 or 75.2%33.3% to $ 3,477,292.485,526,873 for sixthe nine months ended DecemberMarch 31, 20172018 from $ 1,984,925$4,145,555 for sixthe nine months ended DecemberMarch 31, 2017. The increase was principally due to the increase in net sales.
For Yuxing, the net income decreased $89,368by $1,286,142 or 18.3%175.5% to $ 398,491net loss of $553,314 for sixthe nine months ended DecemberMarch 31, 20172018 from $ 487,859$732,828 for sixthe nine months ended DecemberMarch 31, 2017. The decrease was mainly due to the decrease in net sales.
For the VIEs, the net income was $ 199,680$335,673 for year ended DecemberMarch 31, 2017,2018, decreased by $ 1,845,894786,548 or 90.2%70.1%, from $2,045,574$1,122,221 for sixnine months ended DecemberMarch 31, 2016.2017. The decrease was mainly due to the increase in general and administrative expenses for the sales VIEs.
Liquidity and Capital Resources
Our principal sources of liquidity include cash from operations, borrowings from local commercial banks and net proceeds of offerings of our securities consummated in July 2009 and November/December 2009 (collectively the “Public Offerings”).
As of DecemberMarch 31, 2017,2018, cash and cash equivalents were $145,417,158,$153,639,728, an increase of $22,366,610,$30,589,180, or 18.2%24.9%, from $123,050,548 as of June 30, 2017.
| 35 |
We intend to use some of the remaining net proceeds from the Public Offerings, as well as other working capital if required, to acquire new businesses, upgrade production lines and complete Yuxing’s new greenhouse facilities for agriculture products located on 88 acres of land in Hu County, 18 kilometers southeast of Xi’an city. Yuxing purchased a set of agricultural products testing equipment for the year of 2016. We believe that we have sufficient cash on hand and positive projected cash flow from operations to support our business growth for the next twelve months to the extent we do not have further significant acquisitions or expansions. However, if events or circumstances occur and we do not meet our operating plan as expected, we may be required to seek additional capital and/or to reduce certain discretionary spending, which could have a material adverse effect on our ability to achieve our business objectives. Notwithstanding the foregoing, we may seek additional financing as necessary for expansion purposes and when we believe market conditions are most advantageous, which may include additional debt and/or equity financings. There can be no assurance that any additional financing will be available on acceptable terms, if at all. Any equity financing may result in dilution to existing stockholders and any debt financing may include restrictive covenants.
The following table sets forth a summary of our cash flows for the periods indicated:
| Six Months Ended | ||||||||||||||||
| December 31, | Nine Months Ended March 31, | |||||||||||||||
| 2017 | 2016 | 2018 | 2017 | |||||||||||||
| Net cash provided by operating activities | $ | 20,535,360 | $ | 18,178,990 | $ | 28,434,766 | $ | 22,945,082 | ||||||||
| Net cash used in investing activities | (23,086 | ) | (74,353 | ) | (55,691 | ) | (5,804,764 | ) | ||||||||
| Net cash provided by (used in) financing activities | (1,330,290 | ) | 300,000 | (5,935,789 | ) | 1,928,115 | ||||||||||
| Effect of exchange rate change on cash and cash equivalents | 3,184,627 | (4,726,271 | ) | 8,145,894 | (3,704,924 | ) | ||||||||||
| Net increase in cash and cash equivalents | 22,366,611 | 13,678,366 | ||||||||||||||
| Net increase (decrease) in cash and cash equivalents | 30,589,179 | 15,363,509 | ||||||||||||||
| Cash and cash equivalents, beginning balance | 123,050,548 | 102,896,486 | 123,050,548 | 102,896,486 | ||||||||||||
| Cash and cash equivalents, ending balance | $ | 145,417,159 | $ | 116,574,852 | $ | 153,639,728 | $ | 118,259,995 | ||||||||
Operating Activities
Net cash provided by operating activities was $20,535,360$ 28,434,766 for the sixnine months ended DecemberMarch 31, 2017,2018, an increase of $2,356,370,$ 5,489,684, or 13.0%23.9%, from cash provided by operating activities of $18,178,990compared to $ 22,945,082 for the sixnine months ended DecemberMarch 31, 2016.2017. The increase was mainly attributable to anthe increase in accountsamortization of debt discount, other assets and tax payable, andoffset by a decrease in advances to suppliersinventories and accrued expense and other payable during the sixnine months ended DecemberMarch 31, 20172018 as compared to the same period in 2016.2017.
Investing Activities
Net cash used in investing activities for the sixnine months ended DecemberMarch 31, 20172018 was $23,086, an increase$55,691, a decrease of $51,267,$ 5,749,073, or 69.0%99.0%, compared to cash used in investing activities of $74,353from $5,804,764 for the sixnine months ended DecemberMarch 31, 2016.2017. The differencedecrease was duemainly attributable to the fact that the Company purchased less plant, property and equipment during the last six months compared to the same period last year.decrease in cash paid for acquisition.
Financing Activities
Net cash used by financing activities for the six months ended December 31, 2017 was $1,330,290 compared to $300,000 net cash provided in financing activities for the sixnine months ended DecemberMarch 31, 2016,2018 was $5,935,789, a decrease of $7,863,904 or 407.9%, compared to cash provided by financing activities of $1,928,115 for the nine months ended March 31, 2017, which was largely due to $1,678,603 in repayment of loans forduring the sixnine months ended DecemberMarch 31, 2017, compared to zero repayment of loans in the same period last year.2018.
As of DecemberMarch 31, 20172018, and June 30, 2017, our loans payable were as follows:
| December 31, | June 30, | |||||||||||||||
| 2017 | 2017 | March 31, 2018 | June 30, 2017 | |||||||||||||
| Short term loans payable: | $ | 6,285,300 | $ | 7,678,111 | $ | 1,750,100 | $ | 7,678,111 | ||||||||
| Total | $ | 6,285,300 | $ | 7,678,111 | $ | 1,750,100 | $ | 7,678,111 | ||||||||
Accounts Receivable
We had accounts receivable of $136,066,642$178,750,045 as of DecemberMarch 31, 2017,2018, as compared to $141,665,179 as of June 30, 2017, a decreasean increase of $5,598,537$37,084,866 or 4.0 %. The decrease was primarily26.2%, which is mainly attributable to Gufeng’s accounts receivable.Gufeng. As of DecemberMarch 31, 2017, Gufeng’s2018, Gufeng had accounts receivable was $46,610,891, a decrease of $18,552,537 or 28.5%$83,216,576, an increase of $18,053,148, compared to $65,163,428 as of June 30, 2017.
Allowance for doubtful accounts in accounts receivable for the sixnine months ended DecemberMarch 31, 20172018 was $13,949,452,$19,458,519, an increase of $10,001,096 from $9,457,423 as of June 30, 2017,and the allowance for doubtful accounts as a percentage of accounts receivable was 10.3%10.9% as of DecemberMarch 31, 20172018 and 6.3%6.7% as of June 30, 2017.
| 36 |
Deferred assets
We had no deferred assets as of DecemberMarch 31, 2017,2018, as compared to $864,070 as of June 30, 2017. During the sixnine months, we assisted the distributors in certain marketing efforts and developing standard stores to expand our competitive advantage and market shares. Based on the distributor agreements, the amount owed by the distributors in certain marketing efforts and store development will be expensed over three years if the distributors are actively selling our products. If a distributor defaults, breaches, or terminates the agreement with us earlier than the contractual terms, the unamortized portion of the amount owed by the distributor is payable to us immediately. The deferred assets had been fully amortized as of DecemberMarch 31, 2017.2018.
Inventories
We had inventoriesinventory of $105,613,585$ 80,715,004 as of DecemberMarch 31, 2017,2018, as compared to $78,013,891 as of June 30, 2017, an increase of $27,599,694,$2,701,113, or 35.4%3.5%. The increase was primarily attributable to changes in Gufeng’sYuxing’s inventory. As of December 31, 2017, Gufeng’sYuxing’s inventory was $ 82,031,649, representing$18,838,259 as of March 31, 2018, an increase of $26,312,857, as$1,458,348, or 8.4%, compared to $55,718,792$ 17,379,911 as of June 30, 2017.
Advances to Suppliers
We had advances to suppliers of $20,821,812$19,059,434 as of DecemberMarch 31, 20172018 as compared to $24,023,062 as of June 30, 2017, representing a decrease of $3,201,250$4,963,628 or 13.3%20.7%. Our inventory level may fluctuate from time to time, depending how quickly the raw material is consumed and replenished during the production process, and how soon the finished goods are sold. The replenishment of raw material relies on management’s estimate of numerous factors, including but not limited to, the raw materials future price, and spot price along with its volatility, as well as the seasonal demand and future price of finished fertilizer products. Such estimate may not be accurate, and the purchase decision of raw materials based on the estimate can cause excessive inventories in times of slow sales and insufficient inventories in peak times.
Accounts Payable
We had accounts payable of $22,783,659$22,099,127 as of DecemberMarch 31, 20172018 as compared to $19,643,897 as of June 30, 2017, representing an increase of $3,139,762,$2,455,230, or 16.0%12.5%. The increase was primarily due to the increase of accounts payable for VIEs. They haveGufeng. Gufeng’s accounts payable of $20,454,287were $1,782,064 as of DecemberMarch 31, 20172018, as compared to $18,355,921$675,283 as of June 30, 2017, representing an increase of $2,098,366,$1,106,781, or 11.4%163.9%.
Unearned Revenue (Customer Deposits)
We had customer depositsunearned revenue of $6,935,326$4,781,397 as of DecemberMarch 31, 20172018 as compared to $7,046,570 as of June 30, 2017, representing a decrease of $111,244,$2,265,173, or 1.6%32.1%. The decrease was mainly attributable to VIE’s $ 718,647the decrease of unearned revenue for Jinong and VIEs. Jinong’s unearned revenue was $1,131,453 as of March 31, 2018, compared to $2,110,650 unearned revenue as of DecemberJune 30, 2017, representing a decrease of $979,197, or 46.4%. VIE’s unearned revenue was $497,242 as of March 31, 2017,2018, compared to $ $1,375,785 unearned revenue as of June 30, 2017, caused by the advance deposits made by clients.representing a decrease of $878,543, or 63.9%. This decrease was due toa seasonal fluctuation and we expect to deliver products to our customers during the next three months at which time we will recognize the revenue.
Off-Balance Sheet Arrangements
We do not have any off-balance sheet arrangements.
| 37 |
Critical Accounting Policies and Estimates
Management’s discussion and analysis of its financial condition and results of operations are based upon our consolidated financial statements, which have been prepared in accordance with United States generally accepted accounting principles. Our financial statements reflect the selection and application of accounting policies which require management to make significant estimates and judgments. See Note 2 to our consolidated financial statements, “Basis of Presentation and Summary of Significant Accounting Policies.” We believe that the following paragraphs reflect the most critical accounting policies that currently affect our financial condition and results of operations:
Use of estimates
The preparation of consolidated financial statements in conformity with accounting principles generally accepted in the United States of America requires management to make estimates and assumptions that affect the reported amounts of assets and liabilities and disclosure of contingent assets and liabilities at the date of the consolidated financial statements and the amount of revenues and expenses during the reporting periods. Management makes these estimates using the best information available at the time the estimates are made. However, actual results could differ materially from those estimates.
Revenue recognition
Sales revenue is recognized at the date of shipment to customers when a formal arrangement exists, the price is fixed or determinable, the delivery is completed, we have no other significant obligations and collectability is reasonably assured. Payments received before all of the relevant criteria for revenue recognition are satisfied are recorded as unearned revenue.
Our revenue consists of invoiced value of goods, net of a value-added tax (VAT). No product return or sales discount allowance is made as products delivered and accepted by customers are normally not returnable and sales discounts are normally not granted after products are delivered.
Cash and cash equivalents
For statement of cash flows purposes, we consider all cash on hand and in banks, certificates of deposit and other highly-liquid investments with maturities of three months or less, when purchased, to be cash and cash equivalents.
Accounts receivable
Our policy is to maintain reserves for potential credit losses on accounts receivable. Management reviews the composition of accounts receivable and analyzes historical bad debts, customer concentrations, customer credit worthiness, current economic trends and changes in customer payment patterns to evaluate the adequacy of these reserves. Any accounts receivable of Jinong and Gufeng that are outstanding for more than 180 days will be accounted as allowance for bad debts, and any accounts receivable of Yuxing that are outstanding for more than 90 days will be accounted as allowance for bad debts.
Deferred assets
Deferred assets represent amounts the Company advanced to the distributors in their marketing and stores development to expand our competitive advantage and market shares. Based on the distributor agreements, the amount owed by the distributors in certain marketing efforts and store development will be expensed over three years if the distributors are actively selling our products. If a distributor defaults, breaches, or terminates the agreement with us earlier than the realization of the contractual terms, the unamortized portion of the amount owed by the distributor is to be refunded to us immediately. The deferred assets had been fully amortized as of DecemberMarch 31, 2017.2018.
Segment reporting
FASB ASC 280 requires use of the “management approach” model for segment reporting. The management approach model is based on the way a company’s management organizes segments within the company for making operating decisions and assessing performance. Reportable segments are based on products and services, geography, legal structure, management structure, or any other way management disaggregates a company.
As of DecemberMarch 31, 2017,2018, we were organized into eleven main business units: Jinong (fertilizer production), Gufeng (fertilizer production), Yuxing (agricultural products production), Lishijie (agriculture sales), Jinyangguang (agriculture sales), Wangtian (agriculture sales), Xindeguo (agriculture sales), Xinyulei (agriculture sales), Fengnong (agriculture sales) and Xiangrong (agriculture sales). For financial reporting purpose, our operations were organized into four main business segments based on locations and products: Jinong (fertilizer production), Gufeng (fertilizer production) and Yuxing (agricultural products production) and the sales VIEs. Each of the segments has its own annual budget regarding development, production and sales.
Item 3. Quantitative and Qualitative Disclosures about Market Risk
Disclosures about Market Risk
We may be exposed to changes in financial market conditions in the normal course of business. Market risk generally represents the risk that losses may occur as a result of movements in interest rates and equity prices. We currently do not, in the normal course of business, use financial instruments that are subject to changes in financial market conditions.
Currency Fluctuations and Foreign Currency Risk
Substantially all of our revenues and expenses are denominated in RMB. However, we use the U.S. dollar for financial reporting purposes. Conversion of RMB into foreign currencies is regulated by the People’s Bank of China through a unified floating exchange rate system. Although the PRC government has stated its intention to support the value of RMB, there can be no assurance that such exchange rate will not again become volatile or that RMB will not devalue significantly against U.S. dollar. Exchange rate fluctuations may adversely affect the value, in U.S. dollar terms, of our net assets and income derived from our operations in the PRC.
Our reporting currency is the U.S. dollar. Except for U.S. holding companies, all of our consolidated revenues, consolidated costs and expenses, and our assets are denominated in RMB. As a result, we are exposed to foreign exchange risk as our revenues and results of operations may be affected by fluctuations in the exchange rate between U.S. dollars and RMB. If RMB depreciates against the U.S. dollar, the value of our RMB revenues, earnings and assets as expressed in our U.S. dollar financial statements will decline. Assets and liabilities are translated at the exchange rates as of the balance sheet dates, revenues and expenses are translated at the average exchange rates, and shareholders’ equity is translated at historical exchange rates. Any resulting translation adjustments are not included in determining net income but are included in determining other comprehensive income, a component of shareholders’ equity. As of March 31, 2018, our accumulated other comprehensive income was $19.6 million. We have not entered into any hedging transactions in an effort to reduce our exposure to foreign exchange risk. The value of RMB against the U.S. dollar and other currencies is affected by, among other things, changes in the PRC’s political and economic conditions. In 2016, China’s currency dropped by a cumulative 6.8% against the U.S. dollar. The effect on trade can be substantial. Moreover, it is possible that, in the future, PRC authorities may lift restrictions on fluctuations in RMB exchange rate and lessen intervention in the foreign exchange market.
Interest Rate Risk
We deposit surplus funds with Chinese banks earning daily interest. We do not invest in any instruments for trading purposes. All of our outstanding debt instruments carry fixed rates of interests. The amount of short-term debt outstanding as of March 31, 2018 and June 30, 2017 was $1.9 million and $7.7 million, respectively. We are exposed to interest rate risk primarily with respect to our short-term bank loans. Although the interest rates, which are based on the banks’ prime rates with respect to our short-term loans, are fixed for the terms of the loans, the terms are typically three to twelve months for short-term bank loans and interest rates are subject to change upon renewal. There were no material changes in interest rates for short-term bank loans renewed during the three months ended March 31, 2018. The original loan term on average is one year, and the remaining average life of the short term-loans is approximately three months.
Management monitors the banks’ prime rates in conjunction with our cash requirements to determine the appropriate level of debt balances relative to other sources of funds. We have not entered into any hedging transactions in an effort to reduce our exposure to interest rate risk.
Credit Risk
We have not experienced significant credit risk, as most of our customers are long-term customers with superior payment records. Our receivables are monitored regularly by our credit managers.
Inflation Risk
Inflationary factors such as increases in the cost of our products and overhead costs may adversely affect our operating results. Although we do not believe that inflation has had a material impact on our financial position or results of operations to date, a high rate of inflation in the future may have an adverse effect on our ability to maintain current levels of gross margin and selling, general and administrative expenses as a percentage of net revenues if the selling prices of our products do not increase with these increased costs.
| 39 |
Item 4. Controls and Procedures
(a)Evaluation of disclosure controls and procedures
At the conclusion of the period ended March 31, 2018 we carried out an evaluation, under the supervision and with the participation of our management, including our Chief Executive Officer (“CEO”) and Chief Financial Officer (“CFO”), of the effectiveness of the design and operation of our disclosure controls and procedures (as such term is defined in Rules 13a-15(e) and 15d-15(e) under the Securities Exchange Act of 1934 (the “Exchange Act”)). In March 2018, we reevaluated the effectiveness of the design and operation of our disclosure controls and procedures as of June 30, 2017. Based upon these evaluations, our CEO and CFO concluded that as of the end of the period covered by this Quarterly Report, our disclosure controls and procedures were not effective and adequately designed to ensure that the information required to be disclosed by us in the reports we file or submit under the Exchange Act is recorded, processed, summarized and reported within the time periods specified in the applicable rules and forms, and that such information was accumulated and communicated to our management, including our CEO and CFO, in a manner that allowed for timely decisions regarding required disclosure, due to our ability to record and appropriately classify payments we made in acquisitions. Having not properly classified such acquisition payments may result in inadequate or deficient financial reporting.
Despite the material weakness reported above, our management believes that our unaudited condensed consolidated financial statements included in this report fairly present in all material respects our financial condition, results of operations and cash flows for the periods presented because we have retained a consultant who has U.S. GAAP experience to assist us in the preparation of our unaudited condensed consolidated financial statements.
(b)Changes in internal controls
There were no changes in our internal control over financial reporting identified in connection with the evaluation required by paragraph (d) of Exchange Act Rules 13a-15 or 15d-15 that occurred during the quarter ended March 31, 2018 that have materially affected, or are reasonably likely to materially affect, our internal control over financial reporting.
| 40 |
PART II – OTHER INFORMATION
Item 1. Legal Proceedings
There are no other actions, suits, proceedings, inquiries or investigation before or by any court, public board, government agency, self-regulatory organization or body pending or, to the knowledge of the executive officers of our company or any of our subsidiaries, threatened against or affecting our company, our common stock, any of our subsidiaries or of our companies or our subsidiaries’ officers or directors in their capacities as such, in which an adverse decision could have a material adverse effect.
Item 2. Unregistered Sales of Equity Securities and Use of Proceeds
There were no unregistered sales of the Company’s equity securities during the three months ended March 31, 2018, that were not otherwise disclosed in a Current Report on Form 8-K.
Item 3. Defaults Upon Senior Securities
There has been no default in the payment of principal, interest, sinking or purchase fund installment, or any other material default, with respect to any indebtedness of the Company.
Item 4. Mine Safety Disclosures
Not applicable.
Item 5. Other Information
There is no other information required to be disclosed under this item which was not previously disclosed.
Item 6. Exhibits
The exhibits required by this item are set forth in the Exhibit Index attached hereto.
| 41 |
SIGNATURES
Pursuant to the requirements of the Securities Exchange Act of 1934, the Registrant has duly caused this report to be signed on its behalf by the undersigned thereunto duly authorized.
| CHINA GREEN AGRICULTURE, INC. | ||
| Date: | By: | /s/ Zhuoyu “Richard” Li |
| Name: | Zhuoyu “Richard” Li | |
| Title: | Chief Executive Officer | |
| (principal executive officer) | ||
| Date: | By: | /s/ Yongcheng Yang |
| Name: | Yongcheng Yang | |
| Title: | Chief Financial Officer | |
| (principal financial officer and | ||
principal accounting officer) | ||
EXHIBIT INDEX
| No. | ||
| Description | ||
| 31.1 | Certification of | |
| 31.2 | Certification of | |
| 32.1 | ||
| Certification of | ||
| 101.INS | XBRL Instance Document | |
| 101.SCH | XBRL Taxonomy Extension Schema Document | |
| 101.CAL | XBRL Taxonomy Extension Calculation Linkbase Document | |
| 101.DEF | XBRL Taxonomy Extension Definition Linkbase Document | |
| 101.LAB | XBRL Taxonomy Extension Label Linkbase Document | |
| 101.PRE | XBRL Taxonomy Extension Presentation Linkbase Document |
43