
UNITED STATES
SECURITIES AND EXCHANGE COMMISSION
Washington, D.C. 20549
FORM 10-Q/A10-Q
(Amendment No. 1)
☒ | QUARTERLY REPORT PURSUANT TO SECTION 13 OR 15(d) OF THE SECURITIES EXCHANGE ACT OF 1934 |
|
|
| For the quarterly period ended: |
|
|
|
|
☐ |
|
|
|
|
| |
|
|
|

|
( |
Wyoming | ||
(State or other jurisdiction of incorporation or organization) | (I.R.S. Tax. I.D. No.) | |
|
No 1 Gaobei South Coast, Yi An Men 111 Block 37, Chao Yang District,
Beijing City, People Republic of China
(Address of Principal Executive Offices)
(86) 18350283270
(Registrant’s Telephone Number, Including Area Code)
Indicate by check mark whether the registrant (1) has filed all reports required to be filed by Section 13 or 15(d) of the Securities Exchange Act of 1934 during the preceding 12 months (or for such shorter period that the registrant was required to file such reports), and (2) has been subject to such filing requirements for the past 90 days. Yes ☒ No ☐
Indicate by check mark whether the registrant has submitted electronically and posted on its corporate Web site, if any, every Interactive Data File required to be submitted and posted pursuant to Rule 405 of Regulation S-T (§232.405 of this chapter) during the preceding 12 months (or for such shorter period that the registrant was required to submit and post such files). Yes ☒ No ☐
Indicate by check mark whether the registrant is a large accelerated filer, an accelerated filer, a non-accelerated filer, smaller reporting company, or an emerging growth company. See definition of “large accelerated filer,” accelerated filer” “smaller reporting company,” and “emerging growth company” in Rule 12b-2 of the Exchange Act:
Large accelerated filer | ☐ | Accelerated filer | ☐ |
Non-accelerated filer | ☐ | Smaller Reporting Company | ☒ |
Emerging growth company |
|
|
|
If an emerging growth company, indicate by check mark if the registrant has elected not to use the extended transition period for complying with any new or revised financial accounting standards provided pursuant to Section 13(a) of the Exchange Act. ☐
Indicate by check mark whether the registrant is a shell company (as defined in Rule 12b-2 of the Exchange Act). Yes ☐ No ☒
As of December 14, 2020,August 16, 2021, there were 305,451,498 shares of common stock outstanding.
Explanatory Note
The purpose of this Amendment No. 1 to our Quarterly Report on Form 10-Q for the period ended September 30, 2020, as filed with the Securities and Exchange Commission on December 2, 2020, is to reclassify certain account receivables to accounts receivable – related party as contained in the financial statements and footnote no. 7 to our financial statements.
Other than the foregoing, and the new certifications required by Rule 13a-14(a) under the Securities and Exchange Act of 1934 (“Exchange Act”), our Quarterly Report on Form 10-Q is not being amended or updated in any respect. This Amendment No. 1 continues to describe the conditions as of the date of the Quarterly Report on Form 10-Q, and, except as contained herein, we have not modified or updated the disclosures contained in the Quarterly Report on Form 10-Q. This Amendment No. 1 should be read in conjunction with our filings made with the SEC subsequent to the filing of the Quarterly Report on Form 10-Q, including any amendment to those filings.
|
|
| ||
|
|
|
|
|
|
|
| ||
|
|
|
|
|
|
|
| ||
Management’s Discussion and Analysis of Financial Condition and Results of Operations |
|
|
| |
|
|
| ||
|
|
| ||
|
|
|
|
|
|
|
| ||
|
|
|
|
|
|
|
| ||
|
|
| ||
|
|
| ||
|
|
| ||
|
|
| ||
|
|
| ||
|
|
| ||
|
|
|
|
|
|
| |||
| Table of Contents |
CAUTIONARY NOTE REGARDING FORWARD-LOOKING STATEMENTS
This report contains forward-looking statements within the meaning of Section 27A of the Securities Act of 1933, as amended, (the “Securities Act”) and Section 21E of the Securities Exchange Act of 1934, as amended, (the “Exchange Act”). These forward-looking statements are generally located in the material set forth under the heading “Management’s Discussion and Analysis of Financial Condition and Results of Operations” but may be found in other locations as well. These forward-looking statements are subject to risks and uncertainties and other factors that may cause our actual results, performance or achievements to be materially different from the results, performance or achievements expressed or implied by the forward-looking statements. You should not unduly rely on these statements.
We identify forward-looking statements by use of terms such as “may,” “will,” “expect,” “anticipate,” “estimate,” “hope,” “plan,” “believe,” “predict,” “envision,” “intend,” “will,” “continue,” “potential,” “should,” “confident,” “could” and similar words and expressions, although some forward-looking statements may be expressed differently. You should be aware that our actual results could differ materially from those contained in the forward-looking statements.
Forward-looking statements are based on information available at the time the statements are made and involve known and unknown risks, uncertainties and other factors that may cause our results, levels of activity, performance or achievements to be materially different from the information expressed or implied by the forward-looking statements in this report. These factors include, among others:
| ● | our ability to execute on our growth strategies; |
|
|
|
| ● | our ability to find manufacturing partners on favorable terms; |
|
|
|
| ● | declines in general economic conditions in the markets where we may compete; |
|
|
|
| ● | our anticipated needs for working capital; and |
Where we express an expectation or belief as to future events or results, such expectation or belief is expressed in good faith and believed to have a reasonable basis.
Forward-looking statements speak only as of the date of this report or the date of any document incorporated by reference in this report. Except to the extent required by applicable law or regulation, we do not undertake any obligation to update forward-looking statements to reflect events or circumstances after the date of this report or to reflect the occurrence of unanticipated events.
| Table of Contents |
PART I – FINANCIAL INFORMATION
WETRADE GROUP INC
BALANCE SHEETS
(All amounts shown in U.S. Dollars) |
| September 30, |
|
| December 31, |
|
| June 30, |
|
| December 31, |
| ||||
|
| (unaudited) |
| (audited) |
|
| (unaudited) |
|
| |||||||
ASSETS |
|
|
|
|
|
|
|
|
|
| ||||||
Current Assets: |
|
|
|
|
|
|
|
|
|
| ||||||
Cash and Cash Equivalents |
| $ | 6,787,535 |
| $ | 6,591,128 |
|
| $ | 3,210,464 |
| $ | 4,640,603 |
| ||
Accounts Receivables |
| 550,902 |
| - |
|
| 4,151,236 |
| 2,609,520 |
| ||||||
Accounts Receivables - Related Party |
| 480,018 |
| - |
| |||||||||||
Note receivable |
| 3,665,808 |
| 3,097,981 |
| |||||||||||
Other receivables |
| 276,400 |
| - |
|
| 12,898 |
| 5,771 |
| ||||||
Prepayments |
| 197,097 |
| - |
|
|
| 1,863,217 |
|
|
| 61,707 |
| |||
|
|
|
|
|
| |||||||||||
Total current assets |
| 12,903,623 |
| 10,415,582 |
| |||||||||||
Non current Assets: |
|
|
|
|
|
|
|
|
|
| ||||||
Property and equipment, net |
| 170,428 |
| 0 |
| |||||||||||
Right of use assets |
| 2,832,007 |
| - |
|
| 2,574,212 |
| 2,813,186 |
| ||||||
Intangible asset, net |
| 77,196 |
| - |
|
| 43,411 |
| 49,029 |
| ||||||
Prepaid expense |
|
| 10,327 |
|
|
| - |
| ||||||||
Rental deposit |
|
| 34,058 |
|
|
| 264,910 |
| ||||||||
Total non-current assets |
| 2,822,109 |
| 3,127,125 |
| |||||||||||
|
|
|
|
|
|
|
|
| ||||||||
Total Assets: |
| $ | 11,211,481 |
|
| $ | 6,591,128 |
|
| $ | 15,725,732 |
|
| $ | 13,542,707 |
|
|
|
|
|
|
|
|
|
|
|
| ||||||
LIABILITIES AND STOCKHOLDERS’ EQUITY |
|
|
|
|
|
|
|
|
|
| ||||||
Current Liabilities: |
|
|
|
|
|
|
|
|
|
| ||||||
Account payables |
| 184,891 |
| 8,176 |
| |||||||||||
Accrued expenses |
| $ | 220,412 |
| $ | 32,000 |
|
| 223,815 |
| 263,355 |
| ||||
Tax payables |
| 556,802 |
| - |
|
| 272,210 |
| 828,695 |
| ||||||
Amount due to related parties |
| 416,500 |
| 1,754,515 |
|
| 560,500 |
| 416,500 |
| ||||||
Lease liabilities, current |
|
| 304,973 |
|
|
| - |
|
| 612,537 |
| 569,865 |
| |||
Other payables |
|
| 176,254 |
|
|
| 90,633 |
| ||||||||
|
|
|
|
|
| |||||||||||
Total Current Liabilities |
| 1,498,687 |
| 1,786,515 |
|
|
| 2,030,207 |
|
|
| 2,177,224 |
| |||
|
|
|
|
|
|
|
|
|
|
| ||||||
Lease liabilities, non- current |
|
| 2,581,882 |
|
|
| - |
| ||||||||
Lease liabilities, non current |
| 2,187,361 |
| 2,471,598 |
| |||||||||||
Total Liabilities |
| 4,080,569 |
| 1,786,515 |
|
| $ | 4,217,568 |
| $ | 4,648,822 |
| ||||
|
|
|
|
|
|
|
|
|
|
| ||||||
Stockholders’ Equity: |
|
|
|
|
|
|
|
|
|
| ||||||
Common Stock; $0.00 per share par value; 305,451,498 issued and outstanding at September 30, 2020 and 300,222,000 issued and outstanding at December 31, 2019* |
| - |
| - |
| |||||||||||
Common Stock; $0.00 per share par value; 305,451,498 issued and outstanding at June 30, 2021 and December 31, 2020 |
| 0 |
| 0 |
| |||||||||||
Additional Paid in Capital |
| 6,057,520 |
| 222,020 |
|
| 6,057,520 |
| 6,057,520 |
| ||||||
Share to be issued |
| - |
| 5,000,000 |
| |||||||||||
Accumulated other comprehensive income (loss) |
| 183,673 |
| - |
| |||||||||||
Retained Earning/ (Accumulated Deficit) |
|
| 889,719 |
|
|
| (417,407 | ) | ||||||||
Accumulated other comprehensive income |
| 698,900 |
| 578,735 |
| |||||||||||
Retained Earning |
|
| 4,751,744 |
|
|
| 2,257,630 |
| ||||||||
Total Stockholders’ Equity |
|
| 7,130,912 |
|
|
| 4,804,613 |
|
| $ | 11,508,164 |
|
| $ | 8,893,885 |
|
|
|
|
|
|
|
|
|
|
|
| ||||||
Total Liabilities and Stockholders’ Equity |
| $ | 11,211,481 |
|
| $ | 6,591,128 |
|
| $ | 15,725,732 |
|
| $ | 13,542,707 |
|
*Share and per share amounts have been retroactively adjusted to reflect the increased number of shares resulting from a 1:3 stock split.
The accompanying notes are an integral part of these unaudited financial statements.
| Table of Contents |
WETRADE GROUP INC
STATEMENTS OF OPERATIONS
Unaudited
|
| Three Months ended September 30 2020 |
|
| Three Months ended September 30 2019 |
|
| Nine Months ended September 30, 2020 | From inception to September 30, 2019 |
| ||||||
Revenue: |
|
|
|
|
|
|
|
|
|
| ||||||
Service revenue, non-related party |
| $ | 518,269 |
|
|
| - |
|
| $ | 518,269 |
|
|
| - |
|
Service revenue, related party |
|
| 1,493,829 |
|
|
|
|
|
|
| 2,370,192 |
|
|
|
|
|
Total Revenue: |
|
| 2,012,098 |
|
|
|
|
|
|
| 2,888,461 |
|
|
|
|
|
Cost of revenue |
|
| (427,647 | ) |
|
|
|
|
|
| (515,195 | ) |
|
|
|
|
Gross Profit |
|
| 1,584,451 |
|
|
| - |
|
|
| 2,373,266 |
|
|
| - |
|
|
|
|
|
|
|
|
|
|
|
|
|
|
|
|
|
|
Operating Costs and expenses: |
|
|
|
|
|
|
|
|
|
|
|
|
|
|
|
|
|
|
|
|
|
|
|
|
|
|
|
|
|
|
|
|
|
General and Administrative |
|
| 407,067 |
|
|
| 110,921 |
|
|
| 617,216 |
|
|
| 255,010 |
|
Operations Profit/ (Loss) |
|
| 1,177,384 |
|
|
| (110,921 | ) |
|
| 1,756,050 |
|
|
| (255,010 | ) |
Other income/ (loss) |
|
| 38,939 |
|
|
| - |
|
|
| 39,060 |
|
|
|
|
|
Net Income/ (Loss) before Income Tax |
|
| 1,216,323 |
|
|
| (110,921 | ) |
|
| 1,795,110 |
|
|
| (255,010 | ) |
Income tax expense |
|
| 475,431 |
|
|
| - |
|
|
| 487,984 |
|
|
| - |
|
Net income (loss) |
|
| 740,893 |
|
|
| (110,921 | ) |
|
| 1,307,126 |
|
|
| (255,010 | ) |
Other Comprehensive Income (Loss) |
|
|
|
|
|
|
|
|
|
|
|
|
|
|
|
|
Foreign currency translation adjustment |
|
| 244,292 |
|
|
| - |
|
|
| 183,673 |
|
|
| - |
|
Total comprehensive Income (Loss) |
| $ | 985,185 |
|
| $ | (110,921 | ) |
| $ | 1,490,799 |
|
| $ | (255,010 | ) |
|
|
|
|
|
|
|
|
|
|
|
|
|
|
|
|
|
Basic and Diluted Net Income (Loss) per share*: |
| $ | 0.00 |
|
| $ | (0.00 | ) |
| $ | 0.00 |
|
| $ | (0.00 | ) |
|
|
|
|
|
|
|
|
|
|
|
|
|
|
|
|
|
Weighted average number of shares outstanding*; Basic and Diluted |
| $ | 308,704,888 |
|
| $ | 300,073,998 |
|
| $ | 304,166,073 |
|
| $ | 300,024,666 |
|
|
| For the Three Months Ended June 30, 2021 |
|
| For the Three Months Ended June 30, 2020 |
|
| For the Six Months Ended June 30, 2021 |
|
| For the Six Months Ended June 30, 2020 |
| ||||
|
| (unaudited) |
|
| (unaudited) |
|
| (unaudited) |
|
| (unaudited) |
| ||||
Revenue: |
|
|
|
|
|
|
|
|
|
|
|
| ||||
Service revenue, related party |
| $ | 0 |
|
| $ | 855,293 |
|
| $ | 0 |
|
| $ | 876,363 |
|
Service revenue |
|
| 3,882,893 |
|
|
| 0 |
|
|
| 6,663,816 |
|
|
| 0 |
|
Total service revenue |
|
| 3,882,893 |
|
|
| 855,293 |
|
|
| 6,663,816 |
|
|
| 876,363 |
|
Cost of revenue |
|
| (190,459 | ) |
|
| 0 |
|
|
| (336,767 | ) |
|
| 0 |
|
Gross Profit |
|
| 3,692,434 |
|
|
| 855,293 |
|
|
| 6,327,049 |
|
|
| 876,363 |
|
|
|
|
|
|
|
|
|
|
|
|
|
|
|
|
|
|
Operating expenses |
|
|
|
|
|
|
|
|
|
|
|
|
|
|
|
|
General and administrative expense |
| $ | 1,767,457 |
|
| $ | 272,608 |
|
| $ | 3,656,646 |
|
| $ | 297,698 |
|
Total operating expenses |
|
| (1,767,457 | ) |
|
| (272,608 | ) |
|
| (3,656,646 | ) |
|
| (297,698 | ) |
|
|
|
|
|
|
|
|
|
|
|
|
|
|
|
|
|
Profit from operations |
|
| 1,924,977 |
|
|
| 582,685 |
|
|
| 2,670,403 |
|
|
| 578,665 |
|
Other revenue |
|
| 115,084 |
|
|
| 121 |
|
|
| 198,599 |
|
|
| 121 |
|
|
|
|
|
|
|
|
|
|
|
|
|
|
|
|
|
|
Profit before provision for income taxes |
|
| 2,040,061 |
|
|
| 582,806 |
|
|
| 2,869,002 |
|
|
| 578,786 |
|
Income tax provision |
|
| (198,031 | ) |
|
| (12,553 | ) |
|
| (374,888 | ) |
|
| (12,553 | ) |
|
|
|
|
|
|
|
|
|
|
|
|
|
|
|
|
|
Net income |
| $ | 1,842,030 |
|
| $ | 570,253 |
|
| $ | 2,494,114 |
|
| $ | 566,233 |
|
|
|
|
|
|
|
|
|
|
|
|
|
|
|
|
|
|
Comprehensive income |
|
|
|
|
|
|
|
|
|
|
|
|
|
|
|
|
Net income |
| $ | 1,842,030 |
|
| $ | 570,253 |
|
| $ | 2,494,114 |
|
| $ | 566,233 |
|
Other comprehensive income |
|
|
|
|
|
|
|
|
|
|
|
|
|
|
|
|
Foreign currency translation adjustment |
|
| 172,098 |
|
|
| (3,559 | ) |
|
| 120,165 |
|
|
| (57,060 | ) |
|
|
|
|
|
|
|
|
|
|
|
|
|
|
|
|
|
Total comprehensive income |
| $ | 2,014,128 |
|
| $ | 566,694 |
|
| $ | 2,614,279 |
|
| $ | 509,173 |
|
|
|
|
|
|
|
|
|
|
|
|
|
|
|
|
|
|
Earning per share, basic and diluted |
| $ | 0.01 |
|
| $ | 0.00 |
|
| $ | 0.01 |
|
| $ | 0.00 |
|
|
|
|
|
|
|
|
|
|
|
|
|
|
|
|
|
|
Weighted-average shares outstanding, basic and diluted* |
|
| 305,451,498 |
|
|
| 302,721,999 |
|
|
| 305,451,498 |
|
|
| 301,888,665 |
|
____________
*Share and per share amounts have been retroactively adjusted to reflect the increased number of shares resulting from a 1:3 stock split.
The accompanying notes are an integral part of these unaudited financial statements.
| Table of Contents |
WETRADE GROUP INC
STATEMENTS OF CASH FLOWS
|
|
|
| From the period March 28, 2019 |
| |||||||||||
|
| For the Period September 30, 2020 |
| (Inception) to September 30,2019 |
|
| For the Period |
| From the period |
| ||||||
|
| (unaudited) |
| (unaudited) |
|
| June 30, 2021 |
|
| June 30, 2020 |
| |||||
|
|
|
|
|
|
| (unaudited) |
| (unaudited) |
| ||||||
Cash Flows from Operating Activities: |
|
|
|
|
|
|
|
|
|
| ||||||
|
|
|
|
|
| |||||||||||
Net Income/ (Loss) |
| $ | 1,307,126 |
| $ | (255,010 | ) | |||||||||
Net Income |
| $ | 2,494,114 |
| $ | 566,233 |
| |||||||||
Adjustment to reconcile net income to cash flows from operating activities: |
|
|
|
|
| |||||||||||
Amortization of intangible asset |
| 6,206 |
| 0 |
| |||||||||||
|
|
|
|
|
|
|
|
|
|
| ||||||
Changes in Operating Assets and Liabilities: |
|
|
|
|
|
|
|
|
|
| ||||||
Trade Receivables, related party |
| (478,679 | ) |
| - |
| ||||||||||
Trade Receivables, third party |
| (549,365 | ) |
|
|
| ||||||||||
Accounts receivables |
| (1,509,231 | ) |
| (444,473 | ) | ||||||||||
Note receivable |
| (564,562 | ) |
| 0 |
| ||||||||||
Other receivables |
| (275,629 | ) |
| - |
|
| 227,063 |
| (20,688 | ) | |||||
Prepaid expenses |
| (206,845 | ) |
| - |
| ||||||||||
Prepayments |
| (1,407,521 | ) |
| (56,422 | ) | ||||||||||
Amount due to related parties |
| (1,560,020 | ) |
| 144,501 |
|
| 144,000 |
| (1,338,014 | ) | |||||
Intangible assets |
| (76,980 | ) |
| - |
|
| 0 |
| (54,679 | ) | |||||
Accounts payables |
| 176,447 |
| 0 |
| |||||||||||
Accrued expenses |
| 187,839 |
| 110,000 |
|
| 229,682 |
| 142,628 |
| ||||||
Tax payables |
| 555,248 |
| - |
| |||||||||||
Right of use assets |
| (2,824,106 | ) |
| - |
|
| 272,426 |
| 0 |
| |||||
Lease liabilities |
|
| 2,878,801 |
|
|
| - |
|
| (277,733 | ) |
| 0 |
| ||
Net Cash Flows Used in Operating Activities: |
|
| (1,042,610 | ) |
|
| (509 | ) | ||||||||
Other payables |
|
| (753,280 | ) |
|
| 5,731 |
| ||||||||
Net Cash Used in Operating Activities: |
| $ | (962,389 | ) |
| $ | (1,199,684 | ) | ||||||||
|
|
|
|
|
|
|
|
|
|
| ||||||
Cash flow from investing activity: |
|
|
|
|
| |||||||||||
Office equipment |
|
| (170,265 | ) |
|
| 0 |
| ||||||||
Net cash provided by investing activity: |
| (170,265 | ) |
| 0 |
| ||||||||||
Cash flow from financing activities: |
|
|
|
|
|
|
|
|
|
| ||||||
Proceeds from issuance of common stock |
|
| 835,500 |
|
|
| 222,020 |
| ||||||||
Share issued for cash |
|
| 0 |
|
|
| 219,202 |
| ||||||||
Net cash provided by financing activities: |
| 835,500 |
| 222,020 |
|
| 0 |
| 219,202 |
| ||||||
|
|
|
|
|
| |||||||||||
Effect of exchange rate changes on cash |
| 403,517 |
| - |
|
| (297,485 | ) |
| (60,620 | ) | |||||
|
|
|
|
|
| |||||||||||
Change in Cash and Cash Equivalents: |
| 196,407 |
| 221,511 |
|
| (1,430,139 | ) |
| (1,041,102 | ) | |||||
|
|
|
|
|
|
|
|
|
|
| ||||||
Cash and Cash Equivalents, Beginning of Period |
|
| 6,591,128 |
|
|
| - |
|
| $ | 4,640,603 |
|
| $ | 6,591,128 |
|
|
|
|
|
|
|
|
|
|
|
| ||||||
Cash and Cash Equivalents, End of Period |
| $ | 6,787,535 |
|
| $ | 221,511 |
|
| $ | 3,210,464 |
|
|
| 5,550,026 |
|
|
|
|
|
|
|
|
|
|
|
| ||||||
Supplemental Cash Flow Information: |
|
|
|
|
|
|
|
|
|
| ||||||
Cash paid for interest |
| $ | - |
| $ | - |
|
| 0 |
| 0 |
| ||||
Cash paid for taxes |
| $ | - |
| $ | - |
|
| $ | 1,078,125 |
| $ | 0 |
| ||
The accompanying notes are an integral part of these unaudited financial statements.
| Table of Contents |
WETRADE GROUP INC AND SUBSIDIARY
Statement of Changes in Stockholders’ Equity (Deficit)
Period Ended SeptemberJune 30, 20202021 and 20192020
Three months ended SeptemberJune 30, 2021 (Unaudited)
|
| Common Stock |
|
| Additional Paid in |
|
| Retained Earnings (Accumulated |
|
| Accumulated Other comprehensive |
|
| Total Shareholder Equity |
| |||||||||
|
| Shares |
|
| Amount |
|
| Capital |
|
| Deficit) |
|
| income (loss) |
|
| (Deficit) |
| ||||||
Balance as of March 31, 2021 |
|
| 305,451,498 |
|
| $ | 0 |
|
| $ | 6,057,520 |
|
| $ | 2,909,714 |
|
| $ | 526,802 |
|
| $ | 9,494,036 |
|
Foreign currency translation adjustment |
|
|
|
|
|
|
|
|
|
| 0 |
|
|
|
|
|
|
| 172,098 |
|
|
| 172,098 |
|
Net income for the period |
|
|
|
|
|
|
|
|
|
|
|
|
|
| 1,842,030 |
|
|
| 0 |
|
|
| 1,842,030 |
|
Balance as of June 30, 2021 |
|
| 305,451,498 |
|
| $ | 0 |
|
| $ | 6,057,520 |
|
| $ | 4,751,744 |
|
| $ | 698,900 |
|
| $ | 11,508,164 |
|
Six months ended June 30, 2021 (Unaudited)
|
| Common Stock |
|
| Additional Paid in |
|
| Retained Earnings (Accumulated |
|
| Accumulated Other comprehensive |
|
| Total Shareholder Equity |
| |||||||||
|
| Shares |
|
| Amount |
|
| Capital |
|
| Deficit) |
|
| income (loss) |
|
| (Deficit) |
| ||||||
Balance as of December 31, 2020 |
|
| 305,451,498 |
|
| $ | 0 |
|
| $ | 6,057,520 |
|
| $ | 2,257,630 |
|
| $ | 578,735 |
|
| $ | 8,893,885 |
|
Foreign currency translation adjustment |
|
| - |
|
|
| 0 |
|
|
| 0 |
|
|
| 0 |
|
|
| 120,165 |
|
|
| 120,165 |
|
Net income for the period |
|
| - |
|
|
| 0 |
|
|
| 0 |
|
| $ | 2,494,114 |
|
|
| 0 |
|
| $ | 2,494,114 |
|
Balance as of June 30, 2021 |
|
| 305,451,498 |
|
| $ | 0 |
|
| $ | 6,057,520 |
|
| $ | 4,751,744 |
|
| $ | 698,900 |
|
| $ | 11,508,164 |
|
Three months ended June 30, 2020 (Unaudited)
|
| Common Stock |
|
| Additional Paid in |
|
| Retained Earnings (Accumulated |
|
| Accumulated Other comprehensive |
|
| Total Shareholder Equity |
| |||||||||
|
| Shares* |
|
| Amount |
|
| Capital |
|
| Deficit) |
|
| income (loss) |
|
| (Deficit) |
| ||||||
Balance as of March 31, 2020 |
|
| 305,221,998 |
|
| $ | 0 |
|
| $ | 5,300,020 |
|
| $ | (417,868 | ) |
| $ | (57,060 | ) |
| $ | 4,825,092 |
|
Foreign currency translation adjustment |
|
|
|
|
|
|
|
|
|
| 0 |
|
|
|
|
|
|
| (3,559 | ) |
|
| (3,559 | ) |
Net income for the period |
|
|
|
|
|
|
|
|
|
|
|
|
|
| 566,694 |
|
|
| 0 |
|
|
| 566,694 |
|
Balance as of June 30, 2020 |
|
| 305,221,998 |
|
| $ | 0 |
|
| $ | 5,300,020 |
|
| $ | 148,826 |
|
| $ | (60,619 | ) |
| $ | 5,388,227 |
|
Six months ended June 30, 2020 (Unaudited)
|
| Common Stock* |
| Additional |
|
| Retained Earnings |
| Accumulated Other comprehensive |
| Total Shareholder |
|
| Common Stock |
| Additional Paid in |
| Retained Earnings (Accumulated |
| Accumulated Other comprehensive |
| Total Shareholder Equity |
| |||||||||||||||||||||||||||||
|
| Shares |
|
| Amount |
|
| Paid in Capital |
|
| Share to be issued |
|
| (Accumulated Deficit) |
|
| income (loss) |
|
| Equity (Deficit) |
|
| Shares* |
|
| Amount |
|
| Capital |
|
| Deficit) |
|
| income (loss) |
|
| (Deficit) |
| |||||||||||||
Balance as of June 30, 2020 |
| 305,221,998 |
| $ | - |
| $ | 5,222,020 |
| $ | 78,000 |
| $ | 148,826 |
| $ | (60,619 | ) |
| $ | 5,388,227 |
| ||||||||||||||||||||||||||||||
Balance as of December 31, 2019 |
| 300,222,000 |
| $ | 0 |
| $ | 5,222,020 |
| $ | (417,407 | ) |
| $ | 0 |
| $ | 4,804,613 |
| |||||||||||||||||||||||||||||||||
Stock issued during the period |
| 229,500 |
| 8 |
| 835,500 |
| (78,000 | ) |
| - |
| - |
| 757,500 |
|
| 4,999,998 |
|
|
| 78,000 |
| 0 |
| 0 |
| 78,000 |
| |||||||||||||||||||||||
Foreign currency translation adjustment |
|
|
|
|
| - |
| - |
|
|
| 244,292 |
| 244,292 |
|
| - |
| 0 |
| 0 |
| 0 |
| (60,619 | ) |
| (60,619 | ) | |||||||||||||||||||||||
Net income for the period |
|
|
|
|
|
|
| - |
| 740,893 |
| - |
| 740,893 |
|
|
| - |
|
|
| 0 |
|
|
| 0 |
|
| $ | 566,233 |
|
|
| 0 |
|
| $ | 566,233 |
| |||||||||||||
Balance as of September 30, 2020 |
|
| 305,451,498 |
|
| $ | - |
|
| $ | 6,057,520 |
|
| $ | - |
|
| $ | 889,719 |
|
| $ | 183,673 |
| $ | 7,130,912 |
| |||||||||||||||||||||||||
Balance as of June 30, 2020 |
|
| 305,221,998 |
|
| $ | 0 |
|
| $ | 5,300,020 |
|
| $ | 148,826 |
|
| $ | (60,619 | ) |
| $ | 5,388,227 |
| ||||||||||||||||||||||||||||
Nine months ended September 30, 2020 (Unaudited)
|
| Common Stock* |
|
| Additional |
|
|
|
|
| Retained Earnings |
|
| Accumulated Other comprehensive |
|
| Total Shareholder |
| ||||||||||
|
| Shares |
|
| Amount |
|
| Paid in Capital |
|
| Share to be issued |
|
| (Accumulated Deficit) |
|
| income (loss) |
|
| Equity (Deficit) |
| |||||||
Balance as of December 31, 2019 |
|
| 300,222,000 |
|
| $ | - |
|
| $ | 222,020 |
|
| $ | 5,000,000 |
|
| $ | (417,407 | ) |
| $ | - |
|
| $ | 4,804,613 |
|
Stock issued during the period |
|
| 5,229,498 |
|
|
| - |
|
|
| 5,835,500 |
|
|
| (5,000,000 | ) |
|
| - |
|
|
| - |
|
|
| 835,500 |
|
Foreign currency translation adjustment |
|
| - |
|
|
| - |
|
|
| - |
|
|
| - |
|
|
| - |
|
|
| 183,673 |
|
|
| 183,673 |
|
Net income for the period |
|
| - |
|
|
| - |
|
|
| - |
|
|
| - |
|
| $ | 1,307,126 |
|
|
| - |
|
| $ | 1,307,126 |
|
Balance as of September 30, 2020 |
|
| 305,451,498 |
|
| $ | - |
|
| $ | 6,057,520 |
|
| $ | - |
|
| $ | 889,719 |
|
| $ | 183,673 |
|
| $ | 7,130,912 |
|
Three months ended September 30, 2019 (Unaudited)
|
| Common Stock* |
|
| Additional Paid in |
|
| Share to be |
|
| Retained Earnings (Accumulated |
|
| Accumulated other comprehensive |
|
| Total Shareholder Equity |
| ||||||||||
|
| Shares |
|
| Amount |
|
| Capital |
|
| issued |
|
| Deficit) |
|
| loss |
|
| (Deficit) |
| |||||||
Balance as of June 30, 2019 (inception) |
|
| 300,000,000 |
|
| $ | - |
|
| $ | - |
|
| $ | - |
|
| $ | (144,089 | ) |
| $ | - |
| $ | (144,089 | ) | |
Stock issued during the period |
|
| 222,000 |
|
|
| - |
|
|
| 222,020 |
|
|
| - |
|
|
| - |
|
|
|
|
|
|
| 222,020 |
|
Share to be issued |
|
| - |
|
|
| - |
|
|
| - |
|
|
| - |
|
|
| - |
|
|
| - |
|
|
| - |
|
Foreign currency adjustment |
|
| - |
|
|
| - |
|
|
| - |
|
|
| - |
|
|
| - |
|
|
| - |
|
|
| - |
|
Net loss for the period |
|
| - |
|
|
| - |
|
|
| - |
|
|
| - |
|
| $ | (110,921 | ) |
|
| - |
| $ | (110,921 | ) | |
Balance as of September 30, 2019 |
|
| 300,222,000 |
|
| $ | - |
|
| $ | 222,020 |
|
| $ | - |
|
| $ | (255,010 | ) |
| $ | - |
| $ | (32,990 | ) | |
Nine months ended September 30, 2019 (Unaudited)
|
| Common Stock* |
|
| Additional Paid in |
|
| Share to be |
|
| Retained Earnings (Accumulated |
|
| Accumulated other comprehensive |
|
| Total Shareholder Equity |
| ||||||||||
|
| Shares |
|
| Amount |
|
| Capital |
|
| issued |
|
| Deficit) |
|
| loss |
|
| (Deficit) |
| |||||||
Balance as of March 28, 2019 (inception) |
|
| 300,000,000 |
|
| $ | - |
|
| $ | - |
|
| $ | - |
|
| $ | - |
|
| $ | - |
|
| $ | - |
|
Stock issued during the period |
|
| 222,000 |
|
|
| - |
|
|
| 222,020 |
|
|
| - |
|
|
| - |
|
|
|
|
|
|
| 222,020 |
|
Share to be issued |
|
| - |
|
|
| - |
|
|
| - |
|
|
| - |
|
|
| - |
|
|
| - |
|
|
| - |
|
Foreign currency adjustment |
|
| - |
|
|
| - |
|
|
| - |
|
|
| - |
|
|
| - |
|
|
| - |
|
|
| - |
|
Net loss for the period |
|
| - |
|
|
| - |
|
|
| - |
|
|
|
|
|
| $ | (255,010 | ) |
|
| - |
|
| $ | (255,010 | ) |
Balance as of September 30, 2019 |
|
| 300,222,000 |
|
| $ | - |
|
| $ | 222,020 |
|
| $ | - |
|
| $ | (255,010 | ) |
| $ |
|
|
| $ | (32,990 | ) |
_______________
*Share and per share amounts have been retroactively adjusted to reflect the increased number of shares resulting from a 1:3 stock split.
The accompanying notes are an integral part of these unaudited financial statements.
| Table of Contents |
Wetrade Group Inc
Notes to Financial Statements
For the NineSix Months Ended SeptemberJune 30, 20202021
(Unaudited)
NOTE 1 –. NATURE OF BUSINESS
Organization
WeTrade Group, Inc. was incorporated in the State of Wyoming on March 28, 2019.
WeTrade Group Inc.2019 and is in the business of providing technical services and solutions via its membership-based social e-commerce platformplatform. We are committed to providing an international cloud-based intelligence system and independently developed a micro-business cloud intelligence system called the Group“YCloud.” Our goal is target to providedprovide technical and auto-billing management services for 100to micro-business online stores in China through big data analytics, machine learning mechanisms, social network recommendations, and multi-channel data analysis.
We provide technology services to both individual and corporate users. Through Yueshang Beijing, we provide “YCloud” service to our customer, Zhuozhou Weijiafu Information Technology Limited, or Weijiafu, a PRC technology company, which provide “YCloud” services to individual and corporate micro-business owners. The market individual micro-business owners represents a potential of 330 million micro-businessusers by the year of 2023. YCloud serves corporate users in China.multiple industries, including Yuetao Group, Zhiding, Lvyue, Yuebei, Yuedian, Coke GO, and Zhongyanshangyue. We conduct business operations in mainland China and have established trial operations in Hong Kong, the Philippines, and Singapore. We expect to utilize the YCloud system to establish a global strategic cooperation with various social media platforms. Plan to negotiate with Kakao Talk, Line, Whatsapp, Ohho, and Bluechat. Additionally, we have formed long-term technical collaborations with Yuetao App, Daren App, Yuebei App, Zhiding App, Yuedian App, and Lvyue App through Weijiafu.
In January 2020, WeTrade havewe appointed 3rda third party software company to develop an auto-billing management system (“WepayWeTrade System”), the early stage of the YCloud system, at the cost of RMB 400,000 in order(or approximately USD $62,000) to provide online payment services for its online store customersmicro-business owners in the PRC.
The main functions of Wepay System are userthe YCloud system is to manage users’ marketing relationship implementation,relationships, CPS commission profit management, multi-channel app data statistics, AI fission and etc. Business applications cover the retail industry, tourism industry, hospitalitymanagement, and beauty industry.improved supply chain systems.

WeTrade Group INC has conducted its business operations in mainland China and trial operation in Hong Kong, Philippines and Singapore. WeTrade has also formed the long-term technical cooperation with Yuetao App, Daren App, Yuebei App, Jingdong App, Yuedian App and Lvyue App.Our Business
In 2020,We believe that YCloud the first global micro-business cloud intelligent internationalization system. It conducts multi-channel data analysis through the learning of big data and social recommendation relationships. It also provides users with independent research and development of community AI fission and management systems and supply chain systems. It focuses on solving the problem of new maintenance, supply chain CPS integration output, and enrich the functional needs of users. YCloud has four main functions and competitive advantages as follows
Multiple integrated payment methods and payment analytics: the YCloud system provides micro-business owners with multiple payment methods such as Alipay, WeChat, and UnionPay. The total order amount is directly entered into the platform to collect funds in orderseparate accounts. Using YCloud’s technology support, the micro-business owners offer multiple channels of payments to better servetheir customers, in mainland China, WeTrade reached an in-depth strategic partnership with Global Travelling Technology (Beijing) Co., Ltd., entrusting itincluding Alipay, WeChat, and UnionPay. Meanwhile, YCloud assigns a bar code to expand its business in China. As of the third quarter of 2020, WeTrade System has covered the e-commerce industry, tourism industry, hospitality industry, livestreaming/short video industry, etc.merchandises that purchasers can then scan to pay, allowing purchasers to make payments both online and offline. This proprietary payment technology allows our customers to reduce labor costs and error rates, thus significantly improving data analysis.
| Table of Contents |
As at September 30, 2020,Team management: the auto-billingYCloud system utilizes user marketing relationship tracking and CPS commission revenue management tools.
AI fission and management: using intelligent robots to analyze user behavior, data sharing, purchase history, and other data, the YCloud system provides tailored recommendations and displays. For example, the YCloud system connects users’ behavior across multiple apps and platforms and makes automatic recommendations based on the analysis.
Supply chain system integration: the YCloud system applies cross-platform resource integration technology. The integration allows the multi-channel output of WeTrade group has more than 12 million micro-business users, 60,000 blog usershigh-quality products creates a seamless connection between suppliers and more than 2000 hotels direct booking suppliers in China. It is expected will be more than 12% of 100 million micro-business users in China by end of 2020.customers. The YCloud provides a complete supply chain system integrating supply, sales, finance, and service.
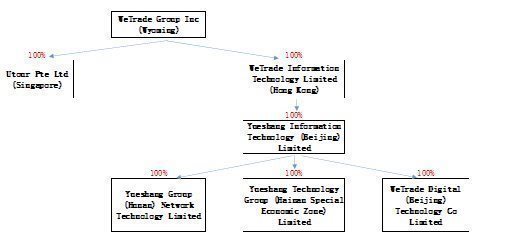
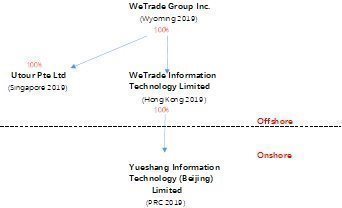
The following diagram sets forth the structure of the Company as of the date of this Current Report:
Our business and corporate address in the United States is 1621 Central Ave, Cheyenne, WY 82001 Our telephone number is +852-67966335 and our registered agent for service of process is Wyoming Registered Agent, 1621 Central Ave, Cheyenne, WY 82001. Our fiscal year end is December 31. Our Chinese business and corporate address is No 1 Gaobei South Coast, Yi An Men 111 Block 37, Chao Yang District, Beijing City, People Republic of China, Tel. +8610-85788631. The Chinese address is where our management is located.
NOTE 2. – SUMMARY OF SIGNIFICANT ACCOUNTING POLICIES
Basis of preparation of financial statements
The consolidated financial statements have been prepared in accordance with generally accepted accounting principles in the United States of America (“GAAP”). The consolidated financial statements include the financial statements of the Company and its subsidiaries. All significant inter-company transactions and balances have been eliminated in consolidation.
The condensed consolidated financial statements of the Company as of and for the ninesix months ended SeptemberJune 30, 20202021 and 20192020 are unaudited. In the opinion of management, all adjustments (including normal recurring adjustments) that have been made are necessary to fairly present the financial position of the Company as of SeptemberJune 30, 2020,2021, the results of its operations for the nine monthsperiod ended SeptemberJune 30, 20202021 and 2019,2020, and its cash flows for the nine monthsperiod ended SeptemberJune 30, 20202021 and 2019.2020. Operating results for the interimquarterly periods presented are not necessarily indicative of the results to be expected for a full fiscal year. Certain prior period amounts in the consolidated financial statements and accompanying notes have been reclassified to conform to the current period’s presentation. The balance sheet as of December 31, 20192020 has been derived from the Company’s audited financial statements included in the Form 10-K for the year ended December 31, 2019.2020.
| 6 |
| Table of Contents |
The statements and related notes have been prepared pursuant to the rules and regulations of the Securities and Exchange Commission (the “SEC”). Accordingly, certain information and footnote disclosures normally included in financial statements prepared in accordance with U.S. GAAP have been omitted pursuant to such rules and regulations. These financial statements should be read in conjunction with the financial statements and other information included in the Company’s Annual Report on Form 10-K as filed with the SEC for the fiscal year ended December 31, 2019.2020.
As of SeptemberJune 30, 2020,2021, the details of the consolidating subsidiaries are as follows:
|
| Place of |
| Attributable |
| |
Name of Company |
| incorporation |
| equity interest % |
| |
Utour Pte Ltd |
| Singapore |
|
| 100 | % |
|
|
|
|
|
|
|
WeTrade Information Technology Limited (“WITL”) |
| Hong Kong |
|
| 100 | % |
|
|
|
|
|
|
|
Yueshang Information Technology (Beijing) Co., Ltd. (“YITB”) |
| P.R.C. |
|
| 100 | % |
Yueshang Group Network (Hunan) Co., Limited (“Yueshang Hunan”) | P.R.C | 100 | % | |||
Yueshang Technology Group (Hainan Special Economic Zone) Co. Limited (“Yueshang Hainan”) | P.R.C | 100 | % | |||
WeTrade Digital (Beijing) Technology Co Limited (FKA: XiaoShang Technology Beijing Co Limited) | P.R.C | 100 | % | |||
Nature of Operations
WeTrade Group Inc. (the “Company” or or “We’ or “Us”) is a Wyoming corporation incorporated on March 28, 2019. The Company is an investment holding company that formed as a Wyoming corporation to use as a vehicle for raising equity outside the US.
As of September 30, 2020, the nature operation of its subsidiaries are as follows:
| Place of | Nature of | ||||
Name of Company |
| incorporation | operation | |||
Utour Pte Ltd | Singapore | Investment holding company |
| |||
|
| |||||
WeTrade Information Technology Limited (“WITL”) |
| Hong Kong | Investment holding company |
| ||
|
| |||||
Yueshang Information Technology (Beijing) Co., Ltd. (“YITB”) |
| P.R.C. | Providing of social e-commerce services, technical system support and services |
| ||
Yueshang Group Network (Hunan) Co., Limited (“Yueshang Hunan”) | P.R.C | Providing of social e-commerce services, technical system support and services | ||||
Yueshang Technology Group (Hainan Special Economic Zone) Co. Limited (“Yueshang Hainan”) | P.R.C | Providing of social e-commerce services, technical system support and services | ||||
WeTrade Digital (Beijing) Technology Co Limited (FKA: XiaoShang Technology Beijing Co Limited) | P.R.C | Providing of social e-commerce services, technical system support and services | ||||
| 7 |
| Table of Contents |
COVID-19 outbreak
In March 2020 the World Health Organization declared coronavirus COVID-19 a global pandemic. The COVID-19 pandemic has negatively impacted the global economy, workforces, customers, and created significant volatility and disruption of financial markets.markets. It has also disrupted the normal operations of many businesses, including ours. This outbreak could decrease spending, adversely affect demand for our services and harm our business and results of operations. It is not possible for us to predict the duration or magnitude of the adverse results of the outbreak and its effects on our business or results of operations at this time.
Revenue recognition
The Company follows the guidance of Accounting Standards Codification (ASC) 606, Revenue from Contracts. ASC 606 creates a five-step model that requires entities to exercise judgment when considering the terms of contracts, which includes (1) identifying the contracts or agreements with a customer, (2) identifying our performance obligations in the contract or agreement, (3) determining the transaction price, (4) allocating the transaction price to the separate performance obligations, and (5) recognizing revenue as each performance obligation is satisfied. The Company only applies the five-step model to contracts when it is probable that the Company will collect the consideration it is entitled to in exchange for the services it transfers to its clients.
Cash and Cash Equivalents
The Company considers all highly liquid debt instruments purchased with a maturity period of three months or less to be cash or cash equivalents. The carrying amounts reported in the accompanying unaudited condensed consolidated balance sheets for cash and cash equivalents approximate their fair value. All of the Company’s cash that is held in bank accounts in Singapore and PRC is not protected by Federal Deposit Insurance Corporation (“FDIC”) insurance or any other similar insurance in the PRC, or Singapore.
Use of EstimateForeign Currency
The preparation of financial statements in conformity with GAAP requires management to make estimates and assumptions that affect the reported amounts of assets and liabilities and disclosure of contingent assets and liabilities at the date of the financial statements, and the reported amounts of expenses during the reporting periods. Actual results could differ from those estimates.
Concentration of Risk
Financial instruments that potentially subject the Company to concentrations of credit risk consist principally of cash. Cash on hand amounted to $6,787,535as of September 30, 2020.
Foreign currency translation and transactions
For the period ended September 30, 2020, the Company’s principal country of operations is the PRC. The accompanying consolidated financial statements are presented in US$. The functional currency of the Company is US$, and the functional currency of the Company’s subsidiaries is RMB. The consolidated financial statements are translated into US$ from RMB at year-end exchange rates as to assets and liabilities and average exchange rates as to revenues and expenses. Capital accounts are translated at their historical exchange rates when the capital transactions occurred. The resulting translation adjustments are recorded as a component of shareholders’ equity included in other comprehensive income. Gains and losses from foreign currency transactions are included in profit or loss. There were no gains and losses from foreign currency transactions from the inception to June 30, 2021.
|
| As of |
| |||||
|
| For the period September 30, 2020 |
|
| December 31, 2019 |
| ||
|
|
|
|
|
|
| ||
RMB: US$ exchange rate |
|
| 6.79 |
|
|
| 7.00 |
|
|
| Nine months ended September 30, |
| |||||
|
| 2020 |
|
| 2019 |
| ||
|
|
|
|
|
|
| ||
RMB: US$ exchange rate |
|
| 6.81 |
|
|
| 7.05 |
|
The RMB is not freely convertible into foreign currency and all foreign exchange transactions must take place through authorized institutions. No representation is made that the RMB amounts could have been, or could be, converted into US$ at the rates used in translation.
|
| June 30, 2021 |
|
| December 31, 2020 |
| ||
RMB: US$ exchange rate |
|
| 6.46 |
|
|
| 6.53 |
|
The balance sheet amounts, with the exception of equity, SeptemberJune 30, 20202021 and December 31, 20192020 were translated at 6.796.45 RMB and 7.006.53 RMB to $1.00, respectively. The equity accounts were stated at their historical rates. The average translation rates applied to statements of operations and comprehensive income (loss) accounts for the period ended SeptemberJune 30, 20202021 and year ended December 31, 20192020 were 6.816.46 RMB and 7.056.84 RMB to $1.00, respectively. Cash flows were also translated at average translation rates for the periodsyear and, therefore, amounts reported on the statement of cash flows would not necessarily agree with changes in the corresponding balances on the consolidated balance sheet. The transactions dominated in SGD are immaterial.
| 8 |
| Table of Contents |
Use of Estimate
The preparation of financial statements in conformity with GAAP requires management to make estimates and assumptions that affect the reported amounts of assets and liabilities and disclosure of contingent assets and liabilities at the date of the financial statements, and the reported amounts of expenses during the reporting periods. Actual results could differ from those estimates.
Concentration of Risk
Financial instruments that potentially subject the Company to concentrations of credit risk consist principally of cash. Cash on hand amounted to $3,210,464as of June 30, 2021.
Accounts receivable
Accounts receivable are presented net of allowance for doubtful accounts. The Group uses specific identification in providing for bad debts when facts and circumstances indicate that collection is doubtful and based on factors listed in the following paragraph. If the financial conditions of its customers were to deteriorate, resulting in an impairment of their ability to make payments, additional allowance may be required.
The Company maintains an allowance for doubtful accounts which reflects its best estimate of amounts that potentially will not be collected. The Company determines the allowance for doubtful accounts on general basis taking into consideration various factors including but not limited to historical collection experience and credit-worthiness of the customers as well as the age of the individual receivables balance. Additionally, the Company makes specific bad debt provisions based on any specific knowledge the Company has acquired that might indicate that an account is uncollectible. The facts and circumstances of each account may require the Company to use substantial judgment in assessing its collectability.
Intangible Asset
Intangible asset is software development cost incurred by the Company,company, it will be amortized on a straight line basis over the estimated useful life of 5 years.
Property and Equipment, net
Property and equipment are stated at cost less accumulated depreciation and any recorded impairment. The estimated useful lives of computer and office equipment is 3 years.
Depreciation on property and equipment is calculated on the straight-line method over the estimated useful lives of the assets.
Leases
On February 2016, the FASB established Topic 842, Leases, by issuingThe Company adopted Accounting Standards Update (“ASU”) No. 2016-02, Leases (Topic 842) (ASU 2016-02), as amended, which supersedes the lease accounting guidance under Topic 840, and generally requires lessees to recognize the rightsoperating and obligations created by leasesfinancing lease liabilities and corresponding right-of-use (ROU) assets on the balance sheet and disclose key information aboutto provide enhanced disclosures surrounding the amount, timing and uncertainty of cash flows arising from leasing arrangements. Topic 842 was subsequently amended by ASU No. 2018-11, Targeted Improvements, ASU No. 2018-10, Codification Improvements to Topic 842, and ASU No. 2018-01, Land Easement Practical Expedient for Transition to Topic 842. The new standard establishes a
Operating leases are included in operating lease right-of-use model (“ROU”) that requires a lesseeassets and short-term and long-term lease liabilities in our consolidated balance sheets. Finance leases are included in property and equipment, other current liabilities, and other long-term liabilities in our consolidated balance sheets.
ROU assets represent the Company’s right to recognize ause an underlying asset for the lease term and lease liabilities represent the Company’s obligation to make lease payments arising from the lease. Operating lease ROU assets and liabilities are recognized at commencement date based on the present value of lease payments over the lease term. As most of the leases do not provide an implicit rate, we use the industry incremental borrowing rate based on the information available at commencement date in determining the present value of lease payments. We use the implicit rate when readily determinable. The operating lease ROU asset also includes any lease payments made and excludes lease liabilityincentives. The lease terms may include options to extend or terminate the lease when it is reasonably certain that we will exercise that option. Lease expense for lease payments is recognized on a straight-line basis over the balance sheet for all leases with a term longer than 12 months. Leases will be classified as finance or operating, with classification affecting the pattern and classification of expense recognition in the statement of operations.
The new standard became effective April 1, 2019. A modified retrospective transition approach is required, applying the new standard to all leases existing at the date of initial application. An entity may choose to use either (1) its effective date or (2) the beginning of the earliest comparative period presented in the financial statements as its date of initial application. If an entity chooses the second option, the transition requirements for existing leases also apply to leases entered into between the date of initial application and the effective date. The entity must also recast its comparative period financial statements and provide the disclosures required by the new standard for the comparative periods. The Company adopted the new standard on July 1, 2019 using the modified retrospective transition approach as of the effective date of the initial application. The new standard provides a number of optional practical expedients in transition. The Company elected the “package of practical expedients”, which permits entities not to reassess under the new lease standard prior conclusions about lease identification, lease classification and initial direct costs. The Company does not expect to elect the use-of-hindsight or the practical expedient pertaining to land easements.term.
| Table of Contents |
The most significant effects of the adoption of the new standard relate to the recognition of new ROU assets and lease labilities on our balance sheet for office operating leases and providing significant new disclosures about our leasing activities.
The new standard also provides practical expedients for an entity’s ongoing accounting. The Company has also elected the short-term leases recognition exemption for all leases that qualify. This means that the Company will not recognize ROU assets or lease liabilities, and this includes not recognizing ROU assets and lease liabilities, for existing short-term leases of those assets in transition. The Company also currently expects to elect the practical expedient to not separate lease and non-lease components for its leases. All existing leases are reported under this rule.
Under ASC 840, leases were classified as either capital or operating, and the classification significantly impacted the effect the contract had on the company’s financial statements. Capital lease classification resulted in a liability that was recorded on a company’s balance sheet, whereas operating leases did not impact the balance sheet. After the new adoption, $2,832,007$2,574,212 of operating lease right-of-use asset and $2,886,855$2,799,898 of operating lease liabilities were reflected on the Company’s SeptemberJune 30, 20202021 financial statements.
ASU 2016-02 requires that public companies use a secured incremental browning rate for the present value of lease payments when the rate implicit in the contract is not readily determinable. We determine a secured rate on a quarterly basis and update the weighted average discount rate accordingly. Lease terms and discount rate follow:
Lease cost |
| In USD |
|
| In USD |
| ||
Operating lease cost (included in general and admin in company’s statement of operations) |
| $ | 53,265 |
|
| $ | 230,770 |
|
|
|
|
|
|
|
| ||
Other information |
|
|
|
|
|
| ||
Cash paid for amounts included in the measurement of lease liabilities for the quarter ended 9/30/2020 |
| - |
| |||||
Cash paid for amounts included in the measurement of lease liabilities for the six months ended 6/30/2021 |
| 351,456 |
| |||||
Weighted average remaining lease term-operating leases (in years) |
| 4.92 |
|
| 4.17 |
| ||
Average discount rate - operating leases |
| 5 | % |
| 5 | % | ||
|
|
|
|
|
|
| ||
The supplemental balance sheet information related to leases for the period is as follows: |
|
|
|
|
|
| ||
Operating leases |
|
|
|
|
|
| ||
Long -term right-of-use assets |
|
| 2,832,007 |
|
|
| 2,574,212 |
|
Total right-of-use assets |
| $ | 2,832,007 |
|
| $ | 2,574,212 |
|
|
|
|
|
|
|
| ||
Short-term operating lease liabilities |
| 365,274 |
|
| 612,537 |
| ||
Long-term operating lease liabilities |
|
| 2,521,582 |
|
|
| 2,187,361 |
|
Total operating lease liabilities |
| $ | 2,886,855 |
|
| $ | 2,799,898 |
|
|
|
|
|
|
|
| ||
Maturities of the Company’s lease liabilities are as follows: |
|
|
|
|
|
| ||
|
|
|
|
|
|
| ||
Year ending September 30, |
|
|
| |||||
Year ending June 30, |
|
|
| |||||
2021 |
| 504,640 |
|
| 365,866 |
| ||
2022 |
| 653,079 |
|
| 698,898 |
| ||
2023 |
| 693,183 |
|
| 741,993 |
| ||
2024 |
| 736,072 |
|
| 787,140 |
| ||
2025 |
| 704,602 |
|
| 519,190 |
| ||
Total lease payments |
| 3,291,576 |
|
| 3,113,087 |
| ||
Less: Imputed interest/present value discount |
|
| (404,125 | ) |
|
| (313,189 | ) |
Present value of lease liabilities |
| $ | 6,179,027 |
|
| $ | 5,912,985 |
|
| Table of Contents |
Income Tax
Income taxes are determined in accordance with the provisions of ASC Topic 740, “Income Taxes” (“ASC Topic 740”). Under this method, deferred tax assets and liabilities are recognized for the future tax consequences attributable to differences between the financial statement carrying amounts of existing assets and liabilities and their respective tax basis. Deferred tax assets and liabilities are measured using enacted income tax rates expected to apply to taxable income in the periods in which those temporary differences are expected to be recovered or settled. Any effect on deferred tax assets and liabilities of a change in tax rates is recognized in income in the period that includes the enactment date.
ASC 740 prescribes a comprehensive model for how companies should recognize, measure, present, and disclose in their financial statements uncertain tax positions taken or expected to be taken on a tax return. Under ASC 740, tax positions must initially be recognized in the financial statements when it is more likely than not the position will be sustained upon examination by the tax authorities. Such tax positions must initially and subsequently be measured as the largest amount of tax benefit that has a greater than 50% likelihood of being realized upon ultimate settlement with the tax authority assuming full knowledge of the position and relevant facts.
The Company has a subsidiary in Singapore and PRC. The Company is subject to tax in Singapore and PRC jurisdictions. As a result of its future business activities, the Company will be required to file tax returns that are subject to examination by the Inland Revenue Authority of Singapore and Tax Department of PRC.
Earning (Loss)Profit Per Share
Basic net income (loss) per share of common stock attributable to common stockholders is calculated by dividing net income (loss) attributable to common stockholders by the weighted-average shares of common stock outstanding for the period. Potentially dilutive shares, which are based on the weighted-average shares of common stock underlying outstanding stock-based awards, warrants, options, or convertible debt using the treasury stock method or the if-converted method, as applicable, are included when calculating diluted net income (loss) per share of common stock attributable to common stockholders when their effect is dilutive.
Potential dilutive securities are excluded from the calculation of diluted EPS in profit periods as their effect would be anti-dilutive.
As of SeptemberJune 30, 2020,2021, there were no potentially dilutive shares.
|
| For the period September 30, 2020 |
|
| For the period September 30, 2019 |
|
| For the period June 30, 2021 |
|
| For the period June 30, 2020 |
| ||||
Statement of Operations Summary Information: |
|
|
|
|
|
|
|
|
|
| ||||||
Net Income/ (Loss) |
| $ | 1,307,126 |
|
|
| (255,010 | ) | ||||||||
Net Profit |
| $ | 2,494,114 |
|
| $ | 566,233 |
| ||||||||
Weighted-average common shares outstanding - basic and diluted |
|
| 304,166,073 |
|
|
| 300,024,666 |
|
|
| 305,451,498 |
|
|
| 301,888,665 |
|
Net loss per share, basic and diluted |
| $ | 0.00 |
|
|
| (0.00 | ) |
| $ | 0.01 |
|
| $ | 0.00 |
|
Comprehensive income (loss)
Comprehensive income (loss) is defined to include all changes in shareholders’ equity except those resulting from investments by owners and distributions to owners. The Company presents items of net income (loss) and other comprehensive income (loss) in one continuous statement, the Consolidated Statements of Operations and Comprehensive income (loss). The components of other comprehensive income or loss consist solely of foreign currency translation adjustments.
Fair Value
The Company follows guidance for accounting for fair value measurements of financial assets and financial liabilities and for fair value measurements of nonfinancial items that are recognized or disclosed at fair value in the financial statements on a recurring basis. Additionally, the Company adopted guidance for fair value measurement related to nonfinancial items that are recognized and disclosed at fair value in the financial statements on a nonrecurring basis. The guidance establishes a fair value hierarchy that prioritizes the inputs to valuation techniques used to measure fair value.
| 11 |
| Table of Contents |
The hierarchy gives the highest priority to unadjusted quoted prices in active markets for identical assets or liabilities (Level 1 measurements) and the lowest priority to measurements involving significant unobservable inputs (Level 3 measurements). The three levels of the fair value hierarchy are as follows:
Level 1 inputs are quoted prices (unadjusted) in active markets for identical assets or liabilities that the Company has the ability to access at the measurement date.
Level 2 inputs are inputs other than quoted prices included within Level 1 that are observable for the asset or liability, either directly or indirectly.
Level 3 inputs are unobservable inputs for the asset or liability. The carrying amounts of financial assets such as cash approximate their fair values because of the short maturity of these instruments.
NOTE 3. – RECENT ACCOUNTING PRONOUNCEMENTS
Recent accounting pronouncements issued by the FASB (including its Emerging Issues Task Force) and the United States Securities and Exchange Commission did not or are not believed by management to have a material impact on the Company’s present or future financial statements.
NOTE 4.4 – REVENUE
The main functionsIn the business of Wepay System isproviding technical services and solutions via a social e-commerce platform, we are committed to providing an online payment services, CPS profitinternational cloud-based intelligence system and independently developed the “YCloud” system. We aim to provide technical and auto-billing management services multi-channels Appto micro-business online stores in China through big data analytics, machine learning mechanisms, social network recommendations, and multi-channel data analysis, which is developed to provide payment and auto-billing services for online store customers from retail, tourism industry, hospitality and beauty industry.analysis.
We earnderive our revenue primarily by completing paymentfrom service fees charged for transactions for customersconducted through our “Wepay System” and from other value added services. Our revenues are classified into two categories: transaction revenues based on Gross Merchandise volume (“GMV”) of online stores and revenues from other value added services or online technical services from store customers. As per the services agreement , which will be 0.5%YCloud. We receive 3.5% of the actualtotal Gross Merchandise Volume (“GMV”) during trial periodgenerated in the platform as a service fee through our agreement with our customers (such as Weijiafu and subsequently 2% - 3.5%Hainan Changtongfu), depending on the type of service and industry. Gross Merchandise Volume, or GMV, payis a term used in online retailing to indicate a total sales monetary-value for merchandise sold through a particular marketplace over a certain time frame. We generally settle the Company asservice fee with customers within the system service fee. first ten days of each calendar month.
As of nineand for the six months period ended SeptemberJune 30, 2020,2021, we generated revenues from a related partytwo customers amounting $2,370,192. As of three months ended September 30, 2019, we generated revenues from a related party amounting $1,493,829. $6,663,816.
NOTE 5. – CASH AT BANK
As of SeptemberJune 30, 2020,2021, the Company held cash in bank in the amount of $6,787,535$3,210,464 which consist of the following:
|
| September 30, 2020 |
| December 31, 2019 |
|
| June 30, 2021 |
|
| December 31, 2020 |
| |||||
Bank Deposits-China |
| $ | 6,623,550 |
| 5,000,014 |
|
| $ | 2,534,231 |
| $ | 4,593,943 |
| |||
Bank Deposits-Singapore |
|
| 163,985 |
|
|
| 1,591,114 |
|
|
| 676,233 |
|
|
| 46,660 |
|
|
|
| 6,787,535 |
|
|
| 6,591,128 |
|
| $ | 3,210,464 |
|
| $ | 4,640,603 |
|
| 12 |
| Table of Contents |
NOTE 6. – INTANGIBLE ASSET
Intangible asset is software development cost incurred by company, it will be amortized on a straight line basis over the estimated useful life of 105 years as follow:
September 30, 2020 |
| |||||||||||||||||||||||||||||||
June 30, 2021 | June 30, 2021 |
|
| |||||||||||||||||||||||||||||
|
| Gross Carrying Amount |
|
| Accumulated Amortization |
|
| Net Carrying Amount |
|
| Weighted Average Useful Life (Years) |
|
| Gross Carrying Amount |
|
| Accumulated Amortization |
|
| Net Carrying Amount |
|
| Weighted Average Useful Life (Years) |
| ||||||||
|
|
|
|
|
|
|
|
|
| |||||||||||||||||||||||
Intangible assets: |
|
|
|
|
|
|
|
|
|
|
|
|
|
|
|
|
|
| ||||||||||||||
Software development |
| $ | 57,143 |
| $ | (3,266 | ) |
| $ | 53,877 |
| 10 |
|
| $ | 57,143 |
| $ | (6,206 | ) |
| $ | 50,937 |
| 5 |
| ||||||
Software development in progress |
| $ | 21,014 |
| - |
| 21,014 |
|
|
| ||||||||||||||||||||||
Foreign currency translation adjustment |
|
| - |
|
|
| - |
|
|
| 2,305 |
|
|
|
|
|
| - |
|
|
| - |
|
|
| (7,526 | ) |
|
|
| ||
Intangible assets, net |
| $ | 78,157 |
|
| $ | (3,266 | ) |
| $ | 77,196 |
|
|
|
|
| $ | 57,143 |
|
| $ | (6,206 | ) |
| $ | 43,411 |
|
|
|
| ||
Amortization expense for intangible assets was $3,266$6,206 for the ninesix months period ended SeptemberJune 30, 2020.2021.
Expected future intangible asset amortization as of SeptemberJune 30, 20202021 was as follows:
Fiscal years: |
|
|
|
|
|
| ||
Remaining 2020 |
| $ | 52,434 |
| ||||
2021 |
| 46,662 |
| |||||
Remaining 2021 |
| $ | 6,206 |
| ||||
2022 |
| 40,890 |
|
| 12,412 |
| ||
2023 |
| 35,118 |
|
| 12,412 |
| ||
Thereafter |
| 29,346 |
|
| 12,381 |
| ||
NOTE 7.7 – PROPERTY AND EQUIPMENT
As of June 30, 2021, property and equipment consist of the following:
|
| June 30, 2021 |
|
| December 31, 2020 |
| ||
Computer and office equipment |
| $ | 170,428 |
|
| $ | 0 |
|
Depreciation expenses were nil for the period ended June 30, 2021 and December 31, 2020 respectively as the computer and office equipment were acquired on June 29, 2021.
NOTE 8 – ACCOUNT RECEIVABLES
As of SeptemberJune 30, 2020,2021, account receivables consist of the following:
|
| September 30, 2020 |
|
| December 31, 2019 |
| ||
Account Receivables |
| $ | 550,902 |
|
|
| - |
|
Account Receivables- Related party |
|
| 480,018 |
|
|
| - |
|
|
|
| 1,030,920 |
|
|
| - |
|
|
| June 30, 2021 |
|
| December 31, 2020 |
| ||
Services fee receivable |
| $ | 4,151,236 |
|
| $ | 2,609,520 |
|
|
| $ | 4,151,236 |
|
| $ | 2,609,520 |
|
Account receivables-Third partiesreceivables is related to the services fee receivable from a third party customer.
Amount receivables- Related party is the amount receivable from a PRC related company, which was owned by a shareholder of the company.customers.
| Table of Contents |
NOTE 8. OTHER RECEIVABLE9 – PREPAYMENTS
Other receivable consistsAs of June 30, 2021, prepayments consist of the following:
|
| September 30, 2020 |
|
| December 31, 2019 |
| ||
Rental deposit |
| $ | 254,600 |
|
|
| - |
|
Others |
|
| 21,800 |
|
|
| - |
|
|
|
| 276,400 |
|
|
| - |
|
|
| June 30, 2021 |
|
| December 31, 2020 |
| ||
Office furniture |
| $ | 1,226,007 |
|
| $ | 0 |
|
Block chain software and annual fee |
|
| 621,016 |
|
|
| 0 |
|
Software licenses fee and others |
|
| 16,194 |
|
|
| 61,707 |
|
|
| $ | 1,863,217 |
|
| $ | 61,707 |
|
Management periodically reviews account balance. If any indication occurs,NOTE 10 – NOTE RECEIVABLES
As of June 30, 2021, Note receivables consist of the allowancefollowing:
|
| June 30, 2021 |
|
| December 31, 2020 |
| ||
Note receivables |
| $ | 3,665,808 |
|
| $ | 3,097,981 |
|
|
| $ | 3,665,808 |
|
| $ | 3,097,981 |
|
Note receivable is related to the short-term loan of RMB 30 million (approximately of US$4.65 million) to a third party with annual interest of 5%, which will be matured on November 4, 2021.
The accrued interest and principal amount of the loan for doubtful debts would be recognized. No such allowance has been recognized during the nine monthsperiod ended SeptemberJune 30, 2020.2021 and December 31, 2020 are as follow:
|
| June 30, 2021 |
|
| December 31, 2020 |
| ||
Principal |
| $ | 3,589,156 |
|
| $ | 3,064,336 |
|
Accrued interest |
|
| 76,652 |
|
|
| 33,645 |
|
|
| $ | 3,665,808 |
|
| $ | 3,097,981 |
|
NOTE 11 – OTHER RECEIVABLES
As of June 30, 2021, other receivables consist of rental deposit, property management fee deposit, prepaid trademark system set up fees and staff reserve fund as follow:
|
| June 30, 2021 |
|
| December 31, 2020 |
| ||
Prepaid trademark and system set up fee |
| $ | 0 |
|
| $ | 3,318 |
|
Staff reserve fund |
|
| 12,898 |
|
|
| 2,453 |
|
|
| $ | 12,898 |
|
| $ | 5,771 |
|
| 14 |
| Table of Contents |
NOTE 12 – RENTAL DEPOSIT
As of June 30, 2021, rental deposit of $34,058 is the office lease deposit with the tenancy period of 5 years, which consist of rental deposit and property management fee deposit.
NOTE 9 .13 – AMOUNT DUE TO DIRECTOR
As of SeptemberJune 30, 2020,2021, amount due to related parties consist of the following:
|
| As of September 30, 2020 |
| As of December 31, 2019 |
|
| As of June 30, 2021 |
|
| As of December 31, 2020 |
| |||||
|
|
|
|
|
|
|
|
|
|
| ||||||
Related parties payable |
| 276,500 |
| 254,515 |
|
| $ | 276,500 |
| $ | 276,500 |
| ||||
Related party loan |
|
| 140,000 |
|
|
| 1,500,000 |
|
| 140,000 |
| 140,000 |
| |||
Director fee payable |
|
| 144,000 |
|
|
| 0 |
| ||||||||
|
| $ | 416,500 |
|
|
| 1,754,515 |
|
| $ | 560,500 |
|
| $ | 416,500 |
|
The related party balance of $416,500$560,500 represented an outstanding loan of $140,000 from the related company owned by Company’s directordirector-Dai Zheng for daily business operation in Singapore, and professional expenses paid on behalf by Director of $276,500 and which consist of $224,500 advance from Dai Zheng, $42,000 advance from Li Zhuo and $10,000 from Che Kean Tat. It is unsecured, interest-free with no fixed payment term and imputed interest is consider to be immaterial.
The Company have settled related party loan of $650,000 and $710,000 in January 21, 2020 and March 2, 2020 respectively due to cost cutting in business operation in Singapore as a result of change in business plan. As of SeptemberJune 30, 2020,2021, there were $140,000 of related party loan that are due to the company owned by Mr. Dai, the Chairman of the Board.
NOTE 10. TAX PAYABLE14 – ACCRUED EXPENSES
Tax payablesAccrued expenses of $223,815 consists of the following:accrued payroll, CPF and social welfare as follow:
|
| September 30, 2020 |
|
| December 31, 2019 |
| ||
Valued Added Tax (“VAT”) Payables |
| $ | 63,666 |
|
|
| - |
|
Income Tax |
|
| 489,421 |
|
|
| - |
|
Others |
|
| 3,715 |
|
|
| - |
|
|
|
| 556,802 |
|
|
| - |
|
|
| June 30, 2021 |
|
| December 31, 2020 |
| ||
Accrued payroll |
| $ | 223,815 |
|
| $ | 263,355 |
|
|
| $ | 223,815 |
|
| $ | 263,355 |
|
The Group’sNOTE 15 – TAX PAYABLES
As of June 30, 2021, tax payable of $272,210 (December 31, 2020: $828,695) is consist of PRC subsidiary is subject to the VAT rate of 6% of total revenue and statutorycorporate income tax at the rate of 25%., Value-added Tax of 6% and PRC Urban construction tax and levies.
NOTE 11 16 – OTHER PAYABLES
Other payables of $176,254 is consist of the payables of securities account set up fee.
| 15 |
| Table of Contents |
.NOTE 17 – SHAREHOLDERS’ EQUITY (DEFICIT)
The company has an unlimited number of ordinary shares authorized, and has issued 305,451,498 shares with no par value as of SeptemberJune 30, 2020.2021.
ThereOn March 29, 2019, the company has issued 100,000,000 shares with no par value to thirty-three founders. On September 3, 2019, the company has issued a total 74,000 shares at $3 each to 5 non-US shareholders. The total outstanding shares has increased to 100,074,000 shares as at December 31, 2019.
In February 2020, there are 26,0001,666,666 shares issued at $3 per share to 2 new shareholders inshareholders. On July 10, 2020.2020, the company has issued another 26,000 shares at $3 per share to 2 new shareholders and the total outstanding shares has increased to 101,766,666 shares.
On September 15, 2020, the Wyoming Secretary of State approved the Company’s certificate of amendment to amend its Articles of Incorporation to effectuate a 3 for 1 forward stock split. The total issued and outstanding shares of the Company’s common stock has been increased from 10,322,660101,766,666 to 305,451,498305,299,998 shares, with the par value unchanged at zero.
On September 21, 2020, there are 151,500 shares issued at $5 per share to 303 new shareholders, the Company’s common stock issued has been increased to 305,451,498 shares as of September 30,December 31, 2020.
| Table of Contents |
ITEM 2. MANAGEMENT’S DISCUSSION AND ANALYSIS OF FINANCIAL CONDITION AND RESULTS OF OPERATIONS
The following discussion and analysis of financial condition and results of operations should be read in conjunction with our financial statements and related notes included elsewhere in this report. This discussion contains forward-looking statements that involve risks, uncertainties and assumptions. See “Cautionary Note Regarding Forward-Looking Statements.” Our actual results could differ materially from those anticipated in the forward-looking statements as a result of certain factors discussed elsewhere in this report.
Overview
WeTrade Group, Inc. was incorporated in the State of Wyoming on March 28, 2019 and is in the business of providing technical services and solutions via its membership-based social e-commerce platformplatform. We are committed to providing an international cloud-based intelligence system and independently developed a micro-business cloud intelligence system called the Group“YCloud.” Our goal is target to providedprovide technical and auto-billing management services for 100 millionto micro-business online stores in China.China through big data analytics, machine learning mechanisms, social network recommendations, and multi-channel data analysis.
We provide technology services to both individual and corporate users. Through Yueshang Beijing, we provide “YCloud” service to our customer, Zhuozhou Weijiafu Information Technology Limited, or Weijiafu, a PRC technology company, which provide “YCloud” services to individual and corporate micro-business owners. The market individual micro-business owners represents a potential of 330 million users by the year of 2023. YCloud serves corporate users in multiple industries, including Yuetao Group, Zhiding, Lvyue, Yuebei, Yuedian, Coke GO, and Zhongyanshangyue. We conduct business operations in mainland China and have established trial operations in Hong Kong, the Philippines, and Singapore. We expect to utilize the YCloud system to establish a global strategic cooperation with various social media platforms. Plan to negotiate with Kakao Talk, Line, Whatsapp, Ohho, and Bluechat. Additionally, we have formed long-term technical collaborations with Yuetao App, Daren App, Yuebei App, Zhiding App, Yuedian App, and Lvyue App through Weijiafu.
In January 2020, WeTrade havewe appointed 3rd partya third-party software company to develop an auto-billing management system (“WepayWeTrade System”), the early stage of the YCloud system, at the cost of RMB 400,000 in order(or approximately USD $62,000) to provide online payment services for its online store customersmicro-business owners in the PRC.
The main functions of Wepay Systemthe YCloud system is an online payment services,to manage users’ marketing relationships, CPS commission profit management, services, multi-channels Appmulti-channel data statistics, AI fission and data analysis, which is developed to provide paymentmanagement, and auto-billing services for online store customers from retail, tourism industry, hospitality and beauty industry.improved supply chain systems.
As at September 30, 2020,Currently, YCloud serves the auto-billing management systemmicro business industry. We expect to expand the application of WeTrade group has more than 12 million micro-business users, 60,000 blog usersYCloud to tourism, hospitality, livestreaming and more than 2000 hotels direct booking suppliers in China. It is expected will be more than 12% of 100 million micro-business users in China by end of 2020.short video, medical beauty and traditional retail industries.
| 17 |
| Table of Contents |
Results of Operations
The following tables provide a comparison of a summary of our results of operations for the ninethree and six months period ended SeptemberJune 30, 20202021 and 2019.2020.
Results of Operations for the Ninesix months period Ended SeptemberJune 30, 20202021 and 20192020
|
| For the Period September 30, 2020 |
|
| From the period March 28, 2019 (Inception) to September 30, 2019 |
|
| For the period June 30, 2021 |
|
| From the period June 30, 2020 |
| ||||
Revenue: |
|
|
|
|
|
|
|
|
|
| ||||||
Service revenue, non-related party |
| $ | 518,269 |
| $ | - |
| |||||||||
Service revenue, related party |
|
| 2,370,192 |
|
|
| - |
| ||||||||
Service revenue- related party |
| $ | - |
| $ | 876,363 |
| |||||||||
Service revenue- non related party |
| 6,663,816 |
|
|
| - |
| |||||||||
|
| 2,888,461 |
| - |
|
|
|
|
|
| ||||||
Cost of Revenue |
|
| (515,195 | ) |
|
| - |
| ||||||||
Cost of Sales |
|
| (336,767 | ) |
|
| - |
| ||||||||
Gross Profit |
| 2,373,266 |
|
|
|
| $ | 6,327,049 |
| $ | 876,363 |
| ||||
Operating Expenses: |
|
|
|
|
|
|
|
|
|
| ||||||
General and Administrative |
|
| (617,216 | ) |
|
| (255,010 | ) |
|
| (3,656,646 | ) |
|
| (297,698 | ) |
Operations Profit/ (Loss) |
| (1,756,050 | ) |
| (255,010 | ) | ||||||||||
Operations Profit |
| $ | 2,670,403 |
| $ | 578,786 |
| |||||||||
Other revenue |
|
| 39,060 |
|
|
| - |
|
|
| 198,599 |
|
|
| - |
|
Net Income/ (Loss) before income tax |
| 1,795,110 |
| (255,010 | ) | |||||||||||
Net Profit before income tax |
| $ | 2,869,002 |
| $ | 578,786 |
| |||||||||
Income tax expense |
|
| (487,984 | ) |
|
| - |
|
|
| (374,888 | ) |
|
| (12,553 | ) |
Net Income/ (loss) |
| $ | 1,307,126 |
| $ | (255,010 | ) | |||||||||
Net income |
| $ | 2,494,114 |
| $ | 566,233 |
| |||||||||
Revenue from Operations
For the nine-monthsix-month period ended SeptemberJune 30, 20202021 and 2019,2020, total revenue was $2,888,461were $6,663,816 and $0, respectively. The$876,363 from service revenue from customers and related party respectively, the increase was mainly fromdue to the service revenue generated from auto-billing management system from customers.new customers during the period.
Cost of revenue
For the six-month period ended June 30, 2021 and 2020, cost of revenue were $336,767 and nil respectively, the increase is in line with the increase in revenue during the period. Cost of revenue is mainly consists of staff payroll, PRC central provident fund (“CPF”) and other staff benefits, the increase is mainly due to more staffs were recruited during the period. The increase is in line with the increase in revenue during the period.
General and Administrative Expenses
For the ninesix months period ended SeptemberJune 30, 20202021 and 2019,2020, general and administrative expenses were $617,216$3,656,646 and 255,010, respectively. The$578,786 respectively, the increase is mainly due to increase in the payroll expenses as a result of 77 new staffs were recruited for software development during the period as compared to no such software development in prior period.
Other revenue
For the six months period ended June 30, 2021 and 2020, other revenue were $198,599 and nil respectively, the increase is mainly due to tax refund of RMB 540,000 (approximately of US$83,000) and accrued interest of note receivables of $115,212 during the period.
Net Income (Loss)
As a result of the factors described above, there was a net profit of $1,307,126$2,494,114 and net loss of $255,010$566,233 for the ninesix months period ended SeptemberJune 30, 20202021 and 2019, respectively,2020, the increase mainly due to revenue generated from auto-billing management system from related party.new customers.
| 18 |
| Table of Contents |
Results of Operations for the Threethree months period ended SeptemberEnded June 30, 20202021 and 2019.2020
|
| 2020 |
|
| 2019 |
| ||
Revenue |
|
|
|
|
|
| ||
Service revenue, non-related party |
| $ | 518,269 |
|
| $ | - |
|
Service revenue, related party |
|
| 1,493,829 |
|
|
| - |
|
|
|
| 2,012,098 |
|
|
| - |
|
Cost of Revenue |
|
| (427,647 | ) |
|
| - |
|
Gross Profit |
|
| 1,584,451 |
|
|
| - |
|
General and Administrative Expense |
|
| (407,067 | ) |
|
| (110,921 | ) |
Profit/ (Loss) from Operations |
|
| 1,177,384 |
|
|
| (110,921 | ) |
Other revenue |
|
| 38,939 |
|
|
| - |
|
Net Income/ (Loss) before income tax |
| 1,216,323 |
|
|
| (110,921 | ) | |
Income tax expenses |
|
| (475,431 | ) |
|
| - |
|
Net Income/ (loss) |
| $ | 740,893 |
|
| $ | (110,921 | ) |
|
| For the period June 30, 2021 |
|
| From the period June 30, 2020 |
| ||
Revenue: |
|
|
|
|
|
| ||
Service revenue- related party |
| $ | - |
|
| $ | 855,293 |
|
Service revenue- non related party |
| 3,882,893 |
|
|
| - |
| |
|
|
|
|
|
|
|
|
|
Cost of Sales |
|
| (190,459 | ) |
|
| - |
|
Gross Profit |
| $ | 3,692,434 |
|
| $ | 855,293 |
|
Operating Expenses: |
|
|
|
|
|
|
|
|
General and Administrative |
|
| (1,767,457 | ) |
|
| (272,608 | ) |
Operations Profit |
| $ | 1,924,977 |
|
| $ | 582,685 |
|
Other revenue |
|
| 115,084 |
|
|
| 121 |
|
Net Profit before income tax |
| $ | 2,040,061 |
|
| $ | 582,806 |
|
Income tax expense |
|
| (198,031 | ) |
|
| (12,553 | ) |
Net income |
| $ | 1,842,030 |
|
| $ | 570,253 |
|
Revenue from Operations
For the three-month period ended SeptemberJune 30, 20202021 and 2019,2020, total revenue was $2,012,098were $3,882,893 and $0, respectively. The$855,293 from service revenue from customers and related party respectively, the increase was mainly due to increase inthe service revenue generated from auto-billing management system from micro-business users.new customers during the period.
Cost of revenue
For the three-month period ended June 30, 2021 and 2020, cost of revenue were $190,459 and nil respectively, the increase is in line with the increase in revenue during the period. Cost of revenue is mainly consists of staff payroll, PRC central provident fund (“CPF”) and other staff benefits, the increase is mainly due to more staffs were recruited during the period. The increase is in line with the increase in revenue during the period.
General and Administrative Expenses
For the three monthsthree-months period ended SeptemberJune 30, 20202021 and 2019,2020, general and administrative expenses were $407,067$1,767,457 and $110,921, respectively. The$272,608 respectively, the increase is mainly due to increase in the payroll expenses as a result of 77 new staffs were recruited for software development during the period as compared to no such software development in prior period.
Other revenue
For the three-months period ended June 30, 2021 and 2020, other revenue were $115,084 and $121 respectively, the increase is mainly due to tax refund from PRC entities and accrued interest of note receivables during the period.
Net Income (Loss)
As a result of the factors described above, there was a net profit of $740,893$1,842,030 and net loss of $110,921$570,253 for the three months period ended SeptemberJune 30, 2021 and 2020, and 2019, respectively. Thethe increase mainly due to increase in revenue generated from auto-billing management system from new customers.
| Table of Contents |
Liquidity and Capital Resources
As of SeptemberJune 30, 2020,2021, we had cash on hand of $6,787,535.$3,210,464. The increasedecrease is mainly due to the increase in revenue from auto-billing management services from customers. The increase is mitigated by the repayment of related partyadditional short term loan of $650,000approximate $1.37 million (RMB 9 million) to third party and $710,000 in January 21, 2020 and March 2, 2020 respectively as compare toprepayment of office furniture during the bank balance of $6,591,128 in December 31, 2019.period.
Operating activities
Our continuing operating activities used cash of $1,042,610($962,389) and $509($1,199,684) for the periodsperiod ended SeptemberJune 30, 2021 and 2020, and 2019, respectively. The increase was mainlythis is due to additional short term loan repayment of approximately $1.6$1.37 million (RMB 9 million) and prepayment of office furniture to related parties.third party during the period.
Investing activities
Cash provided in our investing activities was $170,265 and nil for the period ended June 30, 2021 and 2020, this is due to additional of new computer and equipment during the period.
Financing activities
Cash provided in our financing activities was increased to $835,500nil and $220,020$219,202 for the periodsperiod ended SeptemberJune 30, 2021 and 2020, and 2019, respectively. The increase wasthis is due to additional 1,896,166 sharesno share issued to new 307 shareholders for cash in total amount of $757,500 during the period as compare to share issue of $219,202 in prior period.
Inflation
Inflation does not materially affect our business or the results of our operations.
Off-Balance Sheet Arrangements
We do not have any off-balance sheet arrangements.
Critical Accounting Policies
We prepare our financial statements in accordance with generally accepted accounting principles of the United States (“GAAP”). GAAP represents a comprehensive set of accounting and disclosure rules and requirements. The preparation of our financial statements requires management to make estimates and assumptions that affect the reported amounts of assets and liabilities, the disclosure of contingent assets and liabilities at the date of the financial statements, and the reported amounts of revenues and expenses during the reporting period. Our actual results could differ from those estimates. We use historical data to assist in the forecast of our future results. Deviations from our projections are addressed when our financials are reviewed on a monthly basis. This allows us to be proactive in our approach to managing our business. It also allows us to rely on proven data rather than having to make assumptions regarding our estimates.
Recent Accounting Pronouncements
We have reviewed all the recently issued, but not yet effective, accounting pronouncements and we do not believe any of these pronouncements will have a material impact on the Company financial statements.
| Table of Contents |
ITEM 3. QUANTITATIVE AND QUALITATIVE DISCLOSURES ABOUT MARKET RISK
We are a “smaller reporting company” as defined by Item 10(f)(1) of Regulation S-K, and as such are not required to provide the information contained in this item pursuant to Item 305 of Regulation S-K.
ITEM 4. CONTROLS AND PROCEDURES
Disclosure Controls and Procedures.
The management of the Company is responsible for establishing and maintaining adequate internal control over financial reporting. The Company’s internal control over financial reporting is a process designed under the supervision of the Company’s Chief Executive Officer and Chief Financial Officer to provide reasonable assurance regarding the reliability of financial reporting and the preparation of the Company’s financial statements for external purposes in accordance with U.S. generally accepted accounting principles.
With respect to the period ending SeptemberJune 30, 2020,2021, under the supervision and with the participation of our management, we conducted an evaluation of the effectiveness of the design and operations of our disclosure controls and procedures, as defined in Rules 13a-15(e) and 15d-15(e) promulgated under the Securities Exchange Act of 1934.
Based upon our evaluation regarding the period ending SeptemberJune 30, 2020,2021, the Company’s management, including its Principal Executive Officer, has concluded that its disclosure controls and procedures were not effective due to the Company’s limited internal resources and lack of ability to have multiple levels of transaction review. Material weaknesses noted are lack of an audit committee, lack of a majority of outside directors on the board of directors, resulting in ineffective oversight in the establishment and monitoring of required internal controls and procedures; and management is dominated by two individuals, without adequate compensating controls. However, management believes the financial statements and other information presented herewith are materially correct.
The Company’s disclosureOur management assessed the effectiveness of our internal control over financial reporting as of June 30, 2021. In making this assessment, our management used the criteria set forth by the Committee of Sponsoring Organizations of the Treadway Commission (“COSO”) in Internal Control - Integrated Framework - Guidance for Smaller Public Companies (the COSO criteria). Based on our assessment, management identified material weaknesses related to: (i) our internal audit functions; (ii) a lack of segregation of duties within accounting functions; and the lack of multiple levels of review of our accounting data. Based on this evaluation, our management concluded that as of June 30, 2021, we did not maintain effective internal control over financial reporting.
Because of its inherent limitations, internal control over financial reporting may not prevent or detect misstatements. Projections of any evaluation of effectiveness to future periods are subject to the risk that controls may become inadequate because of changes in conditions, or that the degree of compliance with any policies and procedures are designedmay deteriorate. Due to provide reasonable assuranceour size and nature, segregation of achieving their objectives. However,all conflicting duties may not always be possible and may not be economically feasible. To the Company’s management, including its Principal Executive Officer, does not expect that its disclosure controls andextent possible, we will implement procedures will prevent all error and all fraud. A control system, no matter how well conceived and operated, can provide only reasonable, not absolute, assuranceto assure that the objectivesinitiation of transactions, the custody of assets and the recording of transactions will be performed by separate individuals. With proper funding we plan on remediating the significant deficiencies identified above, and we will continue to monitor the effectiveness of these steps and make any changes that our management deems appropriate.
A material weakness is a control deficiency (within the meaning of Public Company Accounting Oversight Board Auditing Standard No. 5) or combination of control deficiencies, that results in a reasonable possibility that a material misstatement of the control system are met. Further, the design ofannual or interim financial statements will not be prevented or detected on a control system must reflect the fact that there are resource constraints, and the benefit of controls must be considered relative to their costs. Because of the inherent limitations in all control systems, no evaluation of controls can provide absolute assurance that all control issues and instances of fraud, if any, within the Company have been detected.timely basis.
Changes in Internal Control over Financial Reporting
There were no changes in our internal control over financial reporting that occurred during our most recently completed fiscal quarter that has materially affected, or are reasonably likely to materially affect, our internal control over financial reporting.
| Table of Contents |
We were not subject to any legal proceedings during the ninethree months ended SeptemberJune 30, 2020,2021, nor to the best of our knowledge and belief are any threatened or pending.
We are a “smaller reporting company” as defined by Item 10(f)(1) of Regulation S-K, and as such are not required to provide the information contained in this item.
ITEM 2. UNREGISTERED SALES OF EQUITY SECURITIES AND USE OF PROCEEDS
TheAs of June 30, 2021, there are no recent sales of unregistered securities and the Company has issued additional 1,896,666total outstanding shares to 307 shareholders during the nine months ended September 30, 2020.is 305,451,498 shares.
ITEM 3. DEFAULTS UPON SENIOR SECURITIES
No senior securities were issued and outstanding during the ninethree months ended SeptemberJune 30, 2020.2021.
ITEM 4. MINE SAFETY DISCLOSURES
Not applicable to our Company.
None.
| Table of Contents |
Exhibit No. |
| Description |
|
|
|
101.SCH | Inline XBRL Taxonomy Extension Schema Document. | |
101.CAL | Inline XBRL Taxonomy Extension Calculation Linkbase Document. | |
101.DEF | Inline XBRL Taxonomy Extension Definition Linkbase Document. | |
101.LAB | Inline XBRL Taxonomy Extension Labels Linkbase Document. | |
101.PRE | Inline XBRL Taxonomy Extension Presentation Linkbase Document. | |
104 | Cover Page Interactive Data File (formatted as inline XBRL and contained in |
| Table of Contents |
Pursuant to the requirements of the Securities Exchange Act of 1934, the registrant has duly caused this report to be signed on its behalf by the undersigned, thereunto duly authorized.
| WETRADE GROUP INC |
| |
|
|
|
|
| By: | /s/ Pijun, Liu |
|
| Pijun, Liu |
| |
|
| Chief Executive Officer |
|
(Principal Executive Officer)
|
| /s/ Kean Tat, Che |
|
|
| Kean Tat, Che |
|
|
| Chief Financial Officer |
|
|
24 |