| Income tax expense | The Company estimates the income tax amount payable for transactions where the Treasury’s Claim cannot be clearly determined. Additionally, the Company evaluates the recoverability of assets due to deferred taxes considering whether some or all of the assets will not be recoverable.| Upon the improper determination of the provision for income tax, the Company will be bound to pay additional taxes, including fines and compensatory and punitive interest. | · | Allowance for doubtful accounts; | · A periodic review is conducted of receivables risks in the Company’s clients’ portfolios. Bad debts based on the expiration of account receivables and account receivables’ specific conditions. | Trading properties; |
· | Impairment testingImproper recognition of goodwill and other non-current assets; |
· | Venture capital organization; |
· | Aquisitioncharges / reimbursements of assets carried out between entities under common control; |
· | Biological assets and agricultural produce at the point of harvest; |
Business combinations – purchase price allocation
We account for the acquisition of subsidiaries using the acquisition method. Accounting for business combinations requires us the determination of the fair value of the various assets and liabilities of the acquired business. We use all available information to make these fair value determinations, and for major acquisitions, may hire an independent appraisal firm to assist us in making these fair value estimates. In some instances, assumptions with respect to the timing and amount of future revenues and expenses associated with an asset might have to be used in determining its fair value.
Actual timing and amount of net cash flows from revenues and expenses related to that asset over time may differ materially from those initial estimates, and if the timing is delayed significantly or if the net cash flows decline significantly, the asset could become impaired.
During the fiscal year ended June 30, 2015, we did not acquire new businesses.
Fair Value of Financial Instruments
Fair values of derivative financial instruments are computed with reference to quoted market prices on trade exchanges, when available. The fair values of financial instruments that are not traded in an active market are determined by using valuation techniques. We use our judgment to select a variety of methods and make assumptions that are based on market conditions existing at statement of financial position. When no quoted prices in an active market are available, fair values (particularly with derivatives) are based on recognized valuation methods.
The Company developed an internal valuation model to determine the fair value of the IDBD shares under these circumstances. This model is principally based and is sensitive to the number of shares eligible to be tendered. In one end of the spectrum, all of the shares outstanding may be tendered, and on the opposite end, only the Creditors’ shares are eligible for tendering as per the judge’s ruling. The objective of the methodology is to arrive at a fair value of the IDBD’s share by subtracting from the quoted market price the value of the right to participate in the tender offer embedded in such quoted price. The relative weight of the “right to participate in the tender offer” embedded in IDBD’s quoted market price is sensitive and varies depending on the number of shares deemed eligible for tendering. Each scenario reflects a different number of shares eligible for tendering. A probability of occurrence has been assigned to each scenario based on available evidence. This methodology results in a weighted-probability value representing the fair value of IDBD’s shares recognized in the financial statements. The Company considers this value as a reasonable proxy for the fair value of the IDBD share.
We use a range of valuation models for the measurement of Level 2 and Level 3 instruments, details of which may be obtained from the following table:
Description | Pricing model | | Pricing method | | Parameters | | Range | allowance for bad debt. | Foreign currency-contractsHybrid financial instrument related to the non-recourse loan from Koor (Adama) | Present·The value methodof Adama’s shares. ·Unobserved data underlying the binomial model applied to the determination of the embedded derivative instruments’ value. | | Theoretical price | | Money market curve, interest-rate curve; Foreign exchange curve. | | | - | Changes in losses or profits resulting from the variation in the fair value of the embedded derivative, and variations in the book amount of the primary contract recognized as revenues or expenses from financing. | Commitment to tender offer IDBDLevel 2 and 3 financial instruments | Black-Scholes | | Theoretical price | | Main assumptions used by the Company are: ·Projected discounted income as per discount rate ·Values determined in accordance with the company’s shares in equity funds on the basis of its financial statements, based on fair value or investment assessments. ·Comparable market multiple (EV/GMV ratio). ·Underlying asset price;price (market price) and share price volatility (historical) and interest-rate curve (NIS rate curve). | | Underlying asset price
3.5 to 4.7
Share price volatility
30% to 40%
Money market interest rate 0.7%(Libor curve).
| Wrong recognition of a charge to 1% | income. | Other BorrowingsProbability estimate of contingent liabilities | Weighted probabilityWhether more economic resources may be spent in relation to litigation against the Company; such estimate is based on legal advisors’ opinions. | Charge / reversal of the difference between market price and the Commitmentprovision in relation to tender offer of shares in IDBD | | Theoretical price | | Underlying asset price; share price volatility (historical) and interest-rate curve (NIS rate curve). IRSA 2017 interest-rate and scenario weights. | | Underlying asset price
1.55 to 2.35
Share price volatility
60% to 80%
Money market interest rate 0.02% to 0.9%
| a claim. | IDBD SharesBiological assets | Weighted probabilityMain assumptions used in valuation are: yields, operating costs, selling expenses, future of the difference between market price and the Commitment to tender offer of shares in IDBD | | Theoretical price | | Underlying asset price; share price volatility (historical) and interest-rate curve (NIS rate curve). IRSA 2017 interest-rate and scenario weights. | | Underlying asset price
1.55 to 2.35
Share price volatility
60% to 80%
Money market interest rate 0.02% to 0.9%
| | Call option of Arcos
| Discounted cash flow | | | - | | Projected income and discounted interestsales prices, discount rate. | | | - | | Interest rate swaps
| Cash flow | | Theoretical price | | Interest rate and cash flow forward contract. | | | - | | Preferred sharesWrong recognition/valuation of Condor | Binomial tree | | Theoretical price | | Underlying asset price (market price), share price volatility (historical) and money market interest-rate curve (Libor rate). | | Underlying asset price 1.96 to 2.65
Share price volatility 56% to 76%
Money market interest rate 0.67% to
0.83%
| | Warrants of Condor | Black-Scholes | | Theoretical price | | Underlying asset price (market price), share price volatility (historical) and money market interest-rate curve (Libor rate). | | Underlying asset price 1.96 to 2.65
Share price volatility 56% to 76%
Money market interest rate 0.67% to
0.83%
| biological assets. See sensitivities modeled on these parameters in Note 14. |
Allowance for Doubtful Accounts
We maintain an allowance for trade receivables to account for estimated losses resulting from the inability of customers to make required payments. When evaluating the adequacy of an allowance for trade receivables, we base our estimates on the aging of accounts receivable balances and historical write-off experience, customer credit worthiness and changes in customer payment terms.
If the financial condition of customers were to deteriorate, actual write-offs might be higher than expected.
Taxation
We are subject to income taxes in numerous jurisdictions. Our tax charge on ordinary activities is the sum of the total current and deferred tax charges. The calculation of the Company’s total tax charge necessarily involves a degree of estimation and judgment in respect of certain items whose tax treatment may not be always determined with certainty due to interpretation. The final resolution of some of these items may give rise to material profits, losses and/or cash flows. The complexity of our structure makes the estimation and judgment more challenging. The resolution of issues may not always be within our control and may depend on the efficiency of legal action, if necessary. Issues can, and often do, take many years to resolve. Payments in respect of tax liabilities for an accounting period result from payments on account and on the final resolution of open items. As a result there can be substantial differences between the tax charge in the consolidated income statement and tax payments.
We recognize deferred tax assets only to the extent it is probable that future taxable profit will be available against which the temporary differences can be utilized. We assess the realizability of deferred tax assets by considering whether it is probable that some portion or all of the deferred tax assets will not be realized. We consider the scheduled reversal of deferred tax liabilities, projected future taxable income and tax planning strategies in making this assessment.
The amounts recognized in our Audited Consolidated Financial Statements in respect of each matter are derived from our best estimate and judgment as described in Note 5 to our Audited Consolidated Financial Statements.
Trading Properties
Trading properties include land and work in progress in respect of development sites with a view to sale. Trading properties are carried at the lower of cost or net realizable value. On each development, judgment is required to assess whether the cost of land and any associated construction work in progress is in excess of its net realizable value. Net realizable value is the estimated selling price in the ordinary course of business less estimated costs to completion and estimated selling costs.
The estimation of the net realizable value of our trading properties under development is inherently subjective due to a number of factors, including their complexity, unusually large size, the substantial expenditure required and long timescales to completion. In addition, as a result of these timescales to completion, the plans associated with these developments could be subject to significant variation. As a result, the net realizable values of our trading properties are subject to a degree of uncertainty and are made on the basis of assumptions, which may not prove to be accurate.
If actual results differ from the assumptions upon which the external valuer has based its valuation, this may have an impact on the net realizable value of our trading properties, which would in turn have an effect on our financial condition.
Impairment Testing of Goodwill and Other Non-current Assets
IFRS requires us to undertake an annual test for impairment of its property, plant and equipment, investment property and finite-lived intangible assets, to test for impairment if events or changes in circumstances indicate that the carrying amount of an asset may not be recoverable.
Impairment testing is an area involving management judgment, requiring assessment as to whether the carrying value of assets can be supported by the net present value of future cash flows derived from such assets using cash flow projections which have been discounted at an appropriate rate. In calculating the net present value of the future cash flows, we are required to make certain assumptions in respect of highly uncertain matters including management’s expectations of estimates of future cash flows, market rents for similar properties in the same location and condition, and discount rates.
For purposes of the impairment testing, we group assets at the lowest levels for which there are separately identifiable cash flows, known as cash generating units or CGUs. Given the nature of our assets and activities, most of our individual assets do not generate independent cash flows that are independent of those from CGUs. Therefore, we estimate the recoverable amount of the CGU to which the asset belongs, except where the fair value less costs to sell of the individual asset is higher than its book value; or the value in use of the asset can be estimated as being close to its fair value less costs to sell, where fair value can be reliably determined.
Generally, we consider each shopping center, office building and undeveloped property as a separate CGU. Details of the methods, estimates and assumptions we make in our annual impairment testing of goodwill are included in Note 6 in the Consolidated Financial Statements. No impairment of goodwill was identified.
Venture Capital Organization
We generally account for our investments in associates under the equity method. However, IAS 28 “Investments in Associates” provides an exemption from applying the equity method where investments in associates are held through “Venture Capital Organizations” (VCO) or venture capital entities, as defined in Spanish, even when we are not a VCO. This type of investment may be accounted for at fair value with changes in net income for the years because such measure proves to be more useful to users of financial statements than the equity method.
Acquisition of Assets Carried Out Between Entities Under Common Control
The Company has elected to recognize acquisition of assets or groups of assets carried out between entities under common control who also qualify as “Business Combination” according to IFRS 3, using the acquisition method.
Biological Assets and Agricultural Produce at the Point of Harvest
We measure biological assets, which include unharvested crops, beef and dairy cattle, sheep, and sugarcane plantations (at initial recognition, when the biological asset has attained significant biological growth, and at each subsequent measurement reporting date) and agricultural produce, which include harvested crop, raw meat, raw milk, wool and others, at fair value less costs to sell. We measure biological assets that have not attained significant biological growth or when the impact of biological transformation on price is not expected to be material, at cost less any impairment losses, which approximates fair value.
When an active market exists for biological assets, we use the quoted market price in the most relevant market as a basis to determine the fair value of our biological assets, as in the case of cattle. For other biological assets where there is neither an active market or market-determined prices during the growth cycle, we determine their fair value through the use of discounted cash flow (“DCF”) valuation.
The DCF method requires us to populate the models with highly subjective assumptions, including observable and unobservable inputs. The models we use to estimate the fair value of our biological assets are generally based on data not observable in the market, and the use of unobservable inputs is significant to the overall valuation of the assets.
The key assumptions used in our models include future market prices, estimated yields at the point of harvest, and estimated costs of harvesting and other costs.
The market prices used in our DCF models are determined by reference to observable data in the relevant market for the agricultural produce. We estimate our harvesting costs and other costs based on historical and statistical data. We estimate yields based on several factors, including the location of the farmland, soil type, environmental conditions, infrastructure and other restrictions and growth at the time of measurement. Yields are subject to a high degree of uncertainty and may be affected by several factors out of our control, including but not limited to extreme or unusual weather conditions, plagues and other diseases.
All of these assumptions are highly sensitive. Reasonable shifts in assumptions including but not limited to increases or decreases in prices, costs and discount factors used may result in a significant increase or decrease to the fair value of biological assets recognized at any given time. Cash flows are projected based on estimated production. Estimates of production in themselves are dependent on various assumptions, in addition to those described above, including but not limited to several factors such as location, environmental conditions and other restrictions. Changes in these estimates could materially impact on estimated production, and could therefore affect estimates of future cash flows used in the assessment of fair value (the valuation models and their assumptions are reviewed annually, and, if necessary, adjusted).
Further details on valuation methods, sensitivity analysis and other factors is included in Note 5 to our Audited Consolidated Financial Statements.
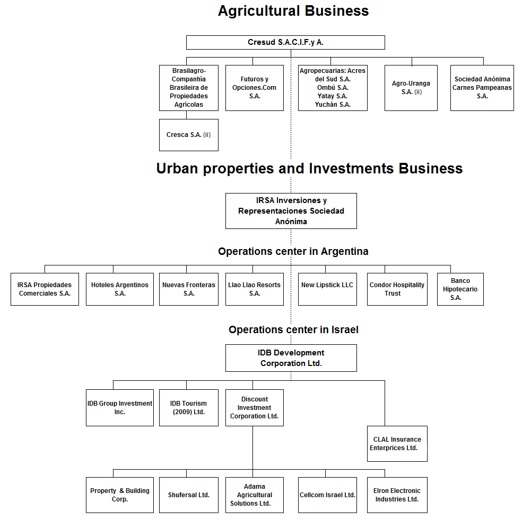
Business Segment Information IFRS 8 requires an entity to report financial and descriptive information about its reportable segments, which are operating segments or aggregations of operating segments that meet specified criteria. Operating segments are componentscomponent of an entity about which separate financial information is available that is evaluated regularly by the chief operating decision maker (“CODM”). SuchCODM. According to IFRS 8, the CODM represents a function whereby strategic decisions are made and resources are assigned. The CODM function is carried out by the Company’s Executive Committee in deciding how to allocate resources and in assessing performance, without prejudicePresident of the powersCompany, Mr. Eduardo S. Elsztain. In addition, and responsibilitiesdue to the acquisition of IDBD, two responsibility levels have been established for resource allocation and assessment of results of the management body, that is to say,two operations centers, through executive committees in Argentina and Israel. As a result of the Boardcontrol of Directors. CODM evaluatesIDBD, the businessCompany reports its financial and equity performance based on the differencesnew segment structure. Comparative information has been modified to reflect the new organization insofar as possible. Segment information is reported from the perspective of products and services: (i) agricultural business and (ii) urban properties and investment business. In addition, this last segment is reported divided from the geographic point of view in two Operations Centers to manage its global interests: Argentina and Israel. Within each operations center, the Company considers separately the various activities being developed, which represent reporting operating segments given the nature of its products, services, operations and risks. The amount reported forManagement believes the operating segment clustering in each segment item isoperations center reflects similar economic characteristics in each region, as well as similar products and services offered, types of clients and regulatory environments. Agricultural business: In the measure reported tothird quarter, we have changed the presentation of the agricultural business segments which are reviewed by the CODM for these purposes. In turn,a better alignment with the Boardcurrent business vision and the metrics used to such end. Four operating segments (crops, cattle, dairy and sugarcane) have been aggregated into a single operating segment named “Agricultural production”. Management consider for the aggregation the nature of Directors’ management is assessed by the Shareholders’ Meeting, which isproduction processes (growing of biological assets), the governance body.methods used to distribute their products and the nature of the regulatory environment (agricultural business). Therefore this quarter three segments are considered: Operating segments identified are disclosedThe "Agricultural production" segment consists of planting, harvesting and sale of crops as reportable segments if they meet anywheat, corn, soybeans, cotton and sunflowers; breeding, purchasing and/or fattening of free-range cattle for sale to slaughterhouses and local livestock auction markets; breeding and/or purchasing dairy cows for the following quantitative thresholds:production of raw milk for sale to local milk and milk-related products producers; and planting, harvesting and sale of sugarcane.
· | The operating segment’s reported revenue, including both sales to external customers and inter-segment sales or transfers, is 10% or more of the combined revenue, internal and external, of all operating segments; |
The “Land transformation and sales” segment comprises gains from the disposal and development of farmlands activities · | The absolute amount of its reported profit or loss is 10% or more of the greater, in absolute amount, of: |
· | the combined reported profit of all operating segments that do not report a loss; and |
· | the combined reported loss of all operating segments that report a loss. |
· | Its assets are 10% or more of the combined assets of all operating segments. |
As well as this, the operating segments that do not meet anyThe "Other segments" column includes, principally, agricultural services (for example, irrigation); leasing of the quantitative thresholds can be considered as reportable segments if the management estimates that this information could be useful for the users of the financial statements.
If, after determining reportable segments in accordance with the preceding quantitative thresholds, the total external revenue attributableour farms to those segments amounts to less than 75% of the total Company’s consolidated external revenue, additional segments are identified as reportable segments, even if they do not meet the thresholds described above, until at least 75% of the Company’s consolidated external revenue is included in reportable segments. Once the 75% of the Company’s consolidated external revenue is included in reportable segments, the remaining operating segments may be aggregatedthird parties; feedlot farming, slaughtering and processing in the "All other segments" column.
Segment information has been preparedmeat refrigeration plant; and classified according to different types of businesses in which the Company conducts its activities. The Company operates in two businesses areas, namely, Agricultural business and Investment and Development Properties business.brokerage activities, among others.
The Company’s Agricultural business is further comprised of eight reportable segments: (the reporting segments of crops, cattle, dairy, sugarcane, agricultural rentals and services and other segments are included within “Agriculture” activities): · | The “Crops” Segment consists of planting, harvesting and sale of crops as wheat, corn, soybeans, cotton, and sunflowers. The Company is focused on the long-term performance of the land and seeksamounts corresponding to maximize the use of the land through crop rotation; the use of technology and techniques. In this way, the type and quantity of harvested crops change in each agricultural campaign.
|
· | The “Cattle” Segment consists of breeding, purchasing and/ or fattening of free-range beef cattle for sale to meat processors and local livestock auction markets.
|
· | The “Dairy” Segment consists of breeding and/ or purchasing dairy cows for the production of raw milk for sale to local milk and milk-related products producers.
|
· | The “Sugarcane” Segment consists of planting, harvesting and sale of sugarcane.
|
· | The “Agriculture Rentals and Services” Segment consists of services (for example: irrigation) and leasing of the Company’s farms to third parties.
|
· | The “Land Transformation and Sales” Segment comprises gains from the disposal and development of farmlands activities.
|
· | The “Agro-industrial” Segment consists of feedlot farming and the slaughtering and processing in the meat refrigerating plant. Feedlot farming is distinctive and requires specific care and diets which differ from those provided to free-range cattle. This activity represents a separate operating segment due to the distinctive characteristics of the cattle feedlot system and the industrialized meat processing in the packing plant.
|
· | The "Other Segments" column consists of the aggregation of the remaining operating segments, which do not meet the quantitative thresholds for disclosure includes the brokerage and sale of inputs activities.
|
The Company’s Urban Properties and Investments business is further comprised of six operative segments:
· | The “Shopping Center Properties” Segment includes results from the commercial exploitation and development of shopping centers. Such results originate mainly from the lease and the delivery of services related to the lease of commercial facilities and other spaces in the Company’s shopping centers.
|
· | The “Offices” Segment includes the operating results of our lease of office space and other rental properties and service revenues related to this activity.
|
· | The “Development and Sale of Properties” Segment includes the operating results of the sales of undeveloped parcels of land and/or trading properties, as the results related with its development and maintenance. Also included in this segment are the results of the sales of real property intended for rent, sales of hotels and other properties included in the International segment.
|
· | The “Hotels” Segment includes the operating results of the Company’s hotels principally comprised of room, catering and restaurant revenues.
|
· | The “International” Segment includes the return on investments in subsidiaries and/or associates that mainly operate in the United States in relation to the lease of office buildings and hotels in that country and the return on investment in IDBD at fair value.
|
· | The "Financial Operations and Others" Segment primarily includes the financial activities carried out by the Company's associates, Banco Hipotecario S.A. and Tarshop S.A. and consumer finance residual financial operations of APSAMedia S.A. (currently merged with IRSA Commercial Properties). The e-commerce activities conducted through the associate Avenida Inc. are also included until the first quarter of the current fiscal year. This investment began to be considered a financial asset from the second quarter of this fiscal year.
|
For ease of presentation, the following table present summarized information for the two lines of business of the Company, i.e. agriculture and Urban Properties and Investments activities. The following tables represent the reportable segments of each of the Company’s lines of business.
Below is a summarized analysis of the lines of business of the Company for the yearsfiscal year ended June 30, 2015 and 2014, and 2013.have been retroactively adjusted to reflect changes in segment information.
| | | Year ended June 30, 2015 | | | | | Agricultural business (I) | | | Urban properties and investments (II) | | | Total | | | Revenues | | | 2,361,010 | | | | 2,547,062 | | | | 4,908,072 | | | Costs | | | (3,385,675 | ) | | | (633,467 | ) | | | (4,019,142 | ) | | Initial recognition and changes in the fair value of biological assets and agricultural produce at the point of harvest | | | 1,347,447 | | | | - | | | | 1,347,447 | | | Changes in the net realizable value of agricultural produce after harvest | | | (34,471 | ) | | | - | | | | (34,471 | ) | | Gross Profit | | | 288,311 | | | | 1,913,595 | | | | 2,201,906 | | | Gain from disposal of investment properties | | | - | | | | 1,150,230 | | | | 1,150,230 | | | Gain from disposal of farmlands | | | 569,521 | | | | - | | | | 569,521 | | | General and administrative expenses | | | (246,470 | ) | | | (378,125 | ) | | | (624,595 | ) | | Selling expenses | | | (284,830 | ) | | | (195,866 | ) | | | (480,696 | ) | | Other operating results, net | | | (18,123 | ) | | | 28,679 | | | | 10,556 | | | Profit from operations | | | 308,409 | | | | 2,518,513 | | | | 2,826,922 | | | Share of profit / (loss) of associates and joint ventures | | | 846 | | | | (1,036,256 | ) | | | (1,035,410 | ) | | Segment Profit | | | 309,255 | | | | 1,482,257 | | | | 1,791,512 | | | Investment properties | | | 77,202 | | | | 3,493,645 | | | | 3,570,847 | | | Property, plant and equipment | | | 2,078,497 | | | | 256,891 | | | | 2,335,388 | | | Trading properties | | | - | | | | 136,084 | | | | 136,084 | | | Goodwill | | | 8,395 | | | | 24,440 | | | | 32,835 | | | Units to be received under barters | | | - | | | | 90,486 | | | | 90,486 | | | Biological assets | | | 586,847 | | | | - | | | | 586,847 | | | Inventories | | | 495,919 | | | | 23,134 | | | | 519,053 | | | Interests in associates and joint ventures | | | 33,343 | | | | 2,381,670 | | | | 2,415,013 | | | Total segment assets | | | 3,280,203 | | | | 6,406,350 | | | | 9,686,553 | |
| | | Year ended June 30, 2014 | | | | | Agricultural business (I) | | | Urban properties and investments (II) | | | Total | | | Revenues | | | 1,812,108 | | | | 2,155,760 | | | | 3,967,868 | | | Costs | | | (2,617,972 | ) | | | (648,279 | ) | | | (3,266,251 | ) | | Initial recognition and changes in the fair value of biological assets and agricultural produce at the point of harvest | | | 1,172,739 | | | | - | | | | 1,172,739 | | | Changes in the net realizable value of agricultural produce after harvest | | | (17,447 | ) | | | - | | | | (17,447 | ) | | Gross Profit | | | 349,428 | | | | 1,507,481 | | | | 1,856,909 | | | Gain from disposal of investment properties | | | - | | | | 230,918 | | | | 230,918 | | | Gain from disposal of farmlands | | | 91,356 | | | | - | | | | 91,356 | | | General and administrative expenses | | | (239,630 | ) | | | (300,066 | ) | | | (539,696 | ) | | Selling expenses | | | (208,932 | ) | | | (150,109 | ) | | | (359,041 | ) | | Other operating results, net | | | (29,540 | ) | | | (47,922 | ) | | | (77,462 | ) | | (Loss) / Profit from operations | | | (37,318 | ) | | | 1,240,302 | | | | 1,202,984 | | | Share of profit / (loss) of associates and joint ventures | | | 11,479 | | | | (436,766 | ) | | | (425,287 | ) | | Segment (Loss) / Profit | | | (25,839 | ) | | | 803,536 | | | | 777,697 | | | Investment properties | | | 51,432 | | | | 3,540,437 | | | | 3,591,869 | | | Property, plant and equipment | | | 2,417,078 | | | | 237,860 | | | | 2,654,938 | | | Trading properties | | | - | | | | 143,059 | | | | 143,059 | | | Goodwill | | | 10,428 | | | | 24,784 | | | | 35,212 | | | Units to be received under barters | | | - | | | | 85,077 | | | | 85,077 | | | Assets held for sale | | | - | | | | 1,357,866 | | | | 1,357,866 | | | Biological assets | | | 651,582 | | | | - | | | | 651,582 | | | Inventories | | | 432,634 | | | | 17,220 | | | | 449,854 | | | Interests in associates and joint ventures | | | 37,226 | | | | 1,966,019 | | | | 2,003,245 | | | Total segment assets | | | 3,600,380 | | | | 7,372,322 | | | | 10,972,702 | |
Operations Center in Argentina
| | | Year ended June 30, 2013 | | | | | Agricultural business (I) | | | Urban properties and investments (II) | | | Total | | | Revenues | | | 1,355,430 | | | | 1,728,248 | | | | 3,083,678 | | | Costs | | | (2,045,779 | ) | | | (601,236 | ) | | | (2,647,015 | ) | | Initial recognition and changes in the fair value of biological assets and agricultural produce at the point of harvest | | | 888,493 | | | | - | | | | 888,493 | | | Changes in the net realizable value of agricultural produce after harvest | | | 11,756 | | | | - | | | | 11,756 | | | Gross Profit | | | 209,900 | | | | 1,127,012 | | | | 1,336,912 | | | Gain from disposal of investment properties | | | - | | | | 177,999 | | | | 177,999 | | | Gain from disposal of farmlands | | | 149,584 | | | | - | | | | 149,584 | | | General and administrative expenses | | | (153,675 | ) | | | (198,773 | ) | | | (352,448 | ) | | Selling expenses | | | (173,976 | ) | | | (117,230 | ) | | | (291,206 | ) | | Other operating results, net | | | 3,345 | | | | 92,425 | | | | 95,770 | | | Profit from operations | | | 35,178 | | | | 1,081,433 | | | | 1,116,611 | | | Share of profit / (loss) of associates and joint ventures | | | 9,191 | | | | (20,864 | ) | | | (11,673 | ) | | Segment Profit | | | 44,369 | | | | 1,060,569 | | | | 1,104,938 | | | | | | | | | | | | | | | | | Investment properties | | | 25,317 | | | | 4,306,984 | | | | 4,332,301 | | | Property, plant and equipment | | | 1,675,420 | | | | 231,734 | | | | 1,907,154 | | | Trading properties | | | - | | | | 129,677 | | | | 129,677 | | | Goodwill | | | 6,438 | | | | 75,852 | | | | 82,290 | | | Units to be received under barters | | | - | | | | 93,225 | | | | 93,225 | | | Biological assets | | | 402,594 | | | | - | | | | 402,594 | | | Inventories | | | 239,010 | | | | 16,428 | | | | 255,438 | | | Interests in associates and joint ventures | | | 31,223 | | | | 1,154,830 | | | | 1,186,053 | | | Total segment assets | | | 2,380,002 | | | | 6,008,730 | | | | 8,388,732 | |
Within this center, IRSA operates in the following segments:
The “Shopping centers” segment includes assets and results of the activity of shopping centers portfolio, principally comprised of lease and service revenues related to rental of commercial space and other spaces in the shopping centers of the Company. (I) | Agriculture line of business: |
The “Office and others” segment includes the assets and the operating results of the activity of lease of office space and other rental properties and service revenues related to this activity.The “Sales and developments” segment includes assets and the operating results of the sales of undeveloped parcels of land and/or trading properties, as the results related with its development and maintenance. Also included in this segment are the results of the sales of real property intended for rent, sales of hotels and other properties included in the International segment. The “Hotels” segment includes the operating results of the hotels principally comprised of room, catering and restaurant revenues. The “International” segment primarily includes assets and operating profit or loss from business related to associates Condor and Lipstick. Through these associates, the Company derives revenue from hotels and an office building in United States, respectively. Until September 30, 2014, this segment included revenue from a subsidiary that owned the building located at 183 Madison Ave in New York, United States, which was sold on September 29, 2014. Additionally, until October 11, 2015, this international segment only included results from the investment in IDBD carried at fair value. The “Financial operations and others” segment primarily includes the financial activities carried out by BHSA and Tarshop and other residual financial operations. The following tables presentCODM periodically reviews the reportable segmentsresults and certain asset categories and assesses performance of the agriculture line of business of the Company for the years ended June 30, 2015, 2014 and 2013: | | | June 30, 2015 | | | | | Agriculture | | | | | | | | | | | | | | | | | Crops | | | Cattle | | | Dairy | | | Sugarcane | | | Agricultural Rental and services | | | Agricultural Subtotal | | | Land Transformation and Sales | | | Agro-industrial | | | Other segments | | | Total Agricultural business | | | Revenues (i) | | | 986,717 | | | | 143,562 | | | | 71,940 | | | | 197,828 | | | | 37,175 | | | | 1,437,222 | | | | - | | | | 806,018 | | | | 117,770 | | | | 2,361,010 | | | Costs | | | (1,795,443 | ) | | | (224,556 | ) | | | (133,259 | ) | | | (368,172 | ) | | | (19,201 | ) | | | (2,540,631 | ) | | | (9,002 | ) | | | (739,201 | ) | | | (96,841 | ) | | | (3,385,675 | ) | | Initial recognition and changes in the fair value of biological assets and agricultural produce at the point of harvest | | | 918,319 | | | | 166,734 | | | | 74,919 | | | | 187,475 | | | | - | | | | 1,347,447 | | | | - | | | | - | | | | - | | | | 1,347,447 | | | Changes in the net realizable value of agricultural produce after harvest | | | (34,474 | ) | | | 3 | | | | - | | | | - | | | | - | | | | (34,471 | ) | | | - | | | | - | | | | - | | | | (34,471 | ) | | Gross Profit / (Loss) | | | 75,119 | | | | 85,743 | | | | 13,600 | | | | 17,131 | | | | 17,974 | | | | 209,567 | | | | (9,002 | ) | | | 66,817 | | | | 20,929 | | | | 288,311 | | | Gain from disposal of farmlands | | | - | | | | - | | | | - | | | | - | | | | - | | | | - | | | | 569,521 | | | | - | | | | - | | | | 569,521 | | | General and administrative expenses | | | (159,036 | ) | | | (25,753 | ) | | | (4,920 | ) | | | (19,821 | ) | | | (2,140 | ) | | | (211,670 | ) | | | (2,106 | ) | | | (25,334 | ) | | | (7,360 | ) | | | (246,470 | ) | | Selling expenses | | | (160,378 | ) | | | (20,109 | ) | | | (3,667 | ) | | | (7,770 | ) | | | (717 | ) | | | (192,641 | ) | | | (2,383 | ) | | | (77,146 | ) | | | (12,660 | ) | | | (284,830 | ) | | Other operating results, net | | | (8,636 | ) | | | (3,158 | ) | | | (773 | ) | | | (1,669 | ) | | | (336 | ) | | | (14,572 | ) | | | (4,601 | ) | | | (288 | ) | | | 1,338 | | | | (18,123 | ) | | Profit / (Loss) from Operations | | | (252,931 | ) | | | 36,723 | | | | 4,240 | | | | (12,129 | ) | | | 14,781 | | | | (209,316 | ) | | | 551,429 | | | | (35,951 | ) | | | 2,247 | | | | 308,409 | | | Share of profit of associates | | | 845 | | | | 1 | | | | - | | | | - | | | | - | | | | 846 | | | | - | | | | - | | | | - | | | | 846 | | | Segment Profit / (Loss) | | | (252,086 | ) | | | 36,724 | | | | 4,240 | | | | (12,129 | ) | | | 14,781 | | | | (208,470 | ) | | | 551,429 | | | | (35,951 | ) | | | 2,247 | | | | 309,255 | | | | | | | | | | | | | | | | | | | | | | | | | | | | | | | | | | | | | | | | | | | | | Investment properties | | | - | | | | - | | | | - | | | | - | | | | 77,202 | | | | 77,202 | | | | - | | | | - | | | | - | | | | 77,202 | | | Property, plant and equipment | | | 1,420,781 | | | | 187,100 | | | | 21,951 | | | | 293,386 | | | | 28,681 | | | | 1,951,899 | | | | 53,522 | | | | 18,102 | | | | 54,974 | | | | 2,078,497 | | | Goodwill | | | 5,352 | | | | - | | | | - | | | | 2,400 | | | | - | | | | 7,752 | | | | - | | | | - | | | | 643 | | | | 8,395 | | | Biological assets | | | 57,813 | | | | 375,357 | | | | 40,555 | | | | 113,122 | | | | - | | | | 586,847 | | | | - | | | | - | | | | - | | | | 586,847 | | | Inventories | | | 307,853 | | | | 58,529 | | | | 1,010 | | | | 2,418 | | | | - | | | | 369,810 | | | | - | | | | 23,415 | | | | 102,694 | | | | 495,919 | | | Interests in associates | | | 30,530 | | | | 20 | | | | - | | | | - | | | | - | | | | 30,550 | | | | - | | | | - | | | | 2,793 | | | | 33,343 | | | Total segment assets (ii) | | | 1,822,329 | | | | 621,006 | | | | 63,516 | | | | 411,326 | | | | 105,883 | | | | 3,024,060 | | | | 53,522 | | | | 41,517 | | | | 161,104 | | | | 3,280,203 | |
(i) | Of all of the Company’s revenues corresponding to the agricultural business, Ps. 1,668.86 million is originated in Argentina and Ps. 692.15 million in other countries, principally Brazil which acconts for Ps. 553.97 million. |
(ii) Of all of the Company’s assets included in the segmentoperating segments corresponding to the agricultural business Ps. 1,378.99 million is located in Argentina and Ps. 1,902.36 million in other countries, principally Brazil for Ps. 1,187.37 million.
| | | June 30, 2014 | | | | | Agriculture | | | | | | | | | | | | | | | | | Crops | | | Cattle | | | Dairy | | | Sugarcane | | | Agricultural Rental and services | | | Agricultural Subtotal | | | Land Transformation and Sales | | | Agro-industrial | | | Other segments | | | Total Agricultural business | | | Revenues (i) | | | 836,822 | | | | 90,315 | | | | 53,935 | | | | 123,851 | | | | 29,142 | | | | 1,134,065 | | | | - | | | | 554,084 | | | | 123,959 | | | | 1,812,108 | | | Costs | | | (1,540,681 | ) | | | (160,660 | ) | | | (104,334 | ) | | | (206,751 | ) | | | (17,374 | ) | | | (2,029,800 | ) | | | (8,228 | ) | | | (479,689 | ) | | | (100,255 | ) | | | (2,617,972 | ) | | Initial recognition and changes in the fair value of biological assets and agricultural produce at the point of harvest | | | 868,351 | | | | 145,321 | | | | 62,840 | | | | 96,227 | | | | - | | | | 1,172,739 | | | | - | | | | - | | | | - | | | | 1,172,739 | | | Changes in the net realizable value of agricultural produce after harvest | | | (17,624 | ) | | | 177 | | | | - | | | | - | | | | - | | | | (17,447 | ) | | | - | | | | - | | | | | | | | (17,447 | ) | | Gross Profit / (Loss) | | | 146,868 | | | | 75,153 | | | | 12,441 | | | | 13,327 | | | | 11,768 | | | | 259,557 | | | | (8,228 | ) | | | 74,395 | | | | 23,704 | | | | 349,428 | | | Gain from disposal of farmlands | | | - | | | | - | | | | - | | | | - | | | | - | | | | - | | | | 91,356 | | | | - | | | | - | | | | 91,356 | | | General and administrative expenses | | | (147,193 | ) | | | (27,183 | ) | | | (5,746 | ) | | | (28,261 | ) | | | (2,669 | ) | | | (211,052 | ) | | | (1,130 | ) | | | (16,880 | ) | | | (10,568 | ) | | | (239,630 | ) | | Selling expenses | | | (117,829 | ) | | | (13,854 | ) | | | (2,249 | ) | | | (4,871 | ) | | | (779 | ) | | | (139,582 | ) | | | (3,873 | ) | | | (54,751 | ) | | | (10,726 | ) | | | (208,932 | ) | | Other operating results, net | | | (29,355 | ) | | | (1,999 | ) | | | (417 | ) | | | 104 | | | | (222 | ) | | | (31,889 | ) | | | (82 | ) | | | (868 | ) | | | 3,299 | | | | (29,540 | ) | | Profit / (Loss) from Operations | | | (147,509 | ) | | | 32,117 | | | | 4,029 | | | | (19,701 | ) | | | 8,098 | | | | (122,966 | ) | | | 78,043 | | | | 1,896 | | | | 5,709 | | | | (37,318 | ) | | Share of profit of associates | | | 11,029 | | | | 7 | | | | - | | | | - | | | | - | | | | 11,036 | | | | - | | | | - | | | | 443 | | | | 11,479 | | | Segment Profit / (Loss) | | | (136,480 | ) | | | 32,124 | | | | 4,029 | | | | (19,701 | ) | | | 8,098 | | | | (111,930 | ) | | | 78,043 | | | | 1,896 | | | | 6,152 | | | | (25,839 | ) | | | | | | | | | | | | | | | | | | | | | | | | | | | | | | | | | | | | | | | | | | | | Investment properties | | | - | | | | - | | | | - | | | | - | | | | 51,432 | | | | 51,432 | | | | - | | | | - | | | | - | | | | 51,432 | | | Property, plant and equipment | | | 1,701,388 | | | | 158,507 | | | | 19,451 | | | | 423,902 | | | | 9,794 | | | | 2,313,042 | | | | 51,534 | | | | 18,930 | | | | 33,572 | | | | 2,417,078 | | | Goodwill | | | 6,745 | | | | - | | | | - | | | | 3,025 | | | | - | | | | 9,770 | | | | - | | | | - | | | | 658 | | | | 10,428 | | | Biological assets | | | 154,630 | | | | 312,068 | | | | 37,263 | | | | 142,873 | | | | - | | | | 646,834 | | | | - | | | | 65 | | | | 4,683 | | | | 651,582 | | | Inventories | | | 302,052 | | | | 28,881 | | | | 651 | | | | 1,702 | | | | - | | | | 333,286 | | | | - | | | | 25,878 | | | | 73,470 | | | | 432,634 | | | Interests in associates | | | 34,395 | | | | 23 | | | | - | | | | - | | | | - | | | | 34,418 | | | | - | | | | - | | | | 2,808 | | | | 37,226 | | | Total segment assets (ii) | | | 2,199,210 | | | | 499,479 | | | | 57,365 | | | | 571,502 | | | | 61,226 | | | | 3,388,782 | | | | 51,534 | | | | 44,873 | | | | 115,191 | | | | 3,600,380 | |
(i) Of allurban properties and investment business of the Company’s revenues corresponding to the agricultural business, Ps. 1,277.62 million is originated inoperations center Argentina and Ps. 534.49 million in other countries, principally Brazil which accounts for Ps. 415.02 million.
(ii) Of allbased on a measure of profit or loss of the Company’s assets includedsegment composed by the operating income plus the equity in earnings of joint ventures and associates. The valuation criteria used in preparing this information are consistent with IFRS standards used for the segment corresponding topreparation of the agricultural business, Ps. 1,252.06 million is located in Argentina and Ps. 2,348.32 million in other countries, principally Brazil which accountsAudited Consolidated Financial Statements, except for Ps. 1,727.36 million.the following:
| | | June 30, 2013 | | | | | Agriculture | | | | | | | | | | | | | | | | | Crops | | | Cattle | | | Dairy | | | Sugarcane | | | Agricultural Rental and services | | | Agricultural Subtotal | | | Land Transformation and Sales | | | Agro-industrial | | | Other segments | | | Total Agricultural business | | | Revenues (i) | | | 750,376 | | | | 82,939 | | | | 38,818 | | | | 160,259 | | | | 30,834 | | | | 1,063,226 | | | | - | | | | 208,921 | | | | 83,283 | | | | 1,355,430 | | | Costs | | | (1,227,832 | ) | | | (147,290 | ) | | | (74,826 | ) | | | (302,206 | ) | | | (12,052 | ) | | | (1,764,206 | ) | | | (5,675 | ) | | | (204,681 | ) | | | (71,217 | ) | | | (2,045,779 | ) | | Initial recognition and changes in the fair value of biological assets and agricultural produce at the point of harvest | | | 572,081 | | | | 79,336 | | | | 40,741 | | | | 197,317 | | | | - | | | | 889,475 | | | | - | | | | - | | | | (982 | ) | | | 888,493 | | | Changes in the net realizable value of agricultural produce after harvest | | | 11,801 | | | | (45 | ) | | | - | | | | - | | | | - | | | | 11,756 | | | | - | | | | - | | | | - | | | | 11,756 | | | Gross Profit / (Loss) | | | 106,426 | | | | 14,940 | | | | 4,733 | | | | 55,370 | | | | 18,782 | | | | 200,251 | | | | (5,675 | ) | | | 4,240 | | | | 11,084 | | | | 209,900 | | | Gain from disposal of farmlands | | | - | | | | - | | | | - | | | | - | | | | - | | | | - | | | | 149,584 | | | | - | | | | - | | | | 149,584 | | | General and administrative expenses | | | (89,585 | ) | | | (13,719 | ) | | | (3,125 | ) | | | (24,163 | ) | | | (4,416 | ) | | | (135,008 | ) | | | (572 | ) | | | (10,986 | ) | | | (7,109 | ) | | | (153,675 | ) | | Selling expenses | | | (115,923 | ) | | | (11,482 | ) | | | (1,842 | ) | | | (4,006 | ) | | | (1,711 | ) | | | (134,964 | ) | | | (10,628 | ) | | | (21,507 | ) | | | (6,877 | ) | | | (173,976 | ) | | Other operating results, net | | | (11,014 | ) | | | (3,545 | ) | | | (803 | ) | | | (27 | ) | | | (1,135 | ) | | | (16,524 | ) | | | (147 | ) | | | (1,305 | ) | | | 21,321 | | | | 3,345 | | | Profit / (Loss) from Operations | | | (110,096 | ) | | | (13,806 | ) | | | (1,037 | ) | | | 27,174 | | | | 11,520 | | | | (86,245 | ) | | | 132,562 | | | | (29,558 | ) | | | 18,419 | | | | 35,178 | | | Share of profit of associates | | | 8,117 | | | | - | | | | - | | | | - | | | | - | | | | 8,117 | | | | - | | | | 16 | | | | 1,058 | | | | 9,191 | | | Segment Profit / (Loss) | | | (101,979 | ) | | | (13,806 | ) | | | (1,037 | ) | | | 27,174 | | | | 11,520 | | | | (78,128 | ) | | | 132,562 | | | | (29,542 | ) | | | 19,477 | | | | 44,369 | | | | | | | | | | | | | | | | | | | | | | | | | | | | | | | | | | | | | | | | | | | | | Investment properties | | | - | | | | - | | | | - | | | | - | | | | 25,317 | | | | 25,317 | | | | - | | | | - | | | | - | | | | 25,317 | | | Property, plant and equipment | | | 1,115,211 | | | | 136,824 | | | | 21,440 | | | | 303,283 | | | | 456 | | | | 1,577,214 | | | | 58,026 | | | | 20,287 | | | | 19,893 | | | | 1,675,420 | | | Goodwill | | | 4,443 | | | | - | | | | - | | | | 1,995 | | | | - | | | | 6,438 | | | | - | | | | - | | | | - | | | | 6,438 | | | Biological assets | | | 56,395 | | | | 197,136 | | | | 28,134 | | | | 111,063 | | | | - | | | | 392,728 | | | | - | | | | 66 | | | | 9,800 | | | | 402,594 | | | Inventories | | | 154,730 | | | | 23,184 | | | | 433 | | | | 939 | | | | - | | | | 179,286 | | | | - | | | | 10,419 | | | | 49,305 | | | | 239,010 | | | Interests in associates | | | 28,858 | | | | - | | | | - | | | | - | | | | - | | | | 28,858 | | | | - | | | | - | | | | 2,365 | | | | 31,223 | | | Total segment assets (ii) | | | 1,359,637 | | | | 357,144 | | | | 50,007 | | | | 417,280 | | | | 25,773 | | | | 2,209,841 | | | | 58,026 | | | | 30,772 | | | | 81,363 | | | | 2,380,002 | |
(i) | Of all of the Company’s revenues corresponding to the agricultural business, Ps. 803.9 million is originatedOperating results of joint ventures: Cresca, Cyrsa, NPSF, Puerto Retiro, Baicom and Quality are evaluated by the CODM applying proportional consolidation method. Under this method the income/loss generated and assets, are reported in Argentina and Ps. 551.6 million in other countries, principally Brazil which accounts for Ps. 453.2 million. |
(ii) Of all of the Company’s assets included in the segment corresponding to the agricultural business, Ps. 883.1 million is located in Argentina and Ps. 1,496.9 million in other countries, principally Brazil which accounts for Ps. 1,190.1 million.
(II) Urban properties and investments
The following tables present the reportable segments of the Urban Properties and Investments line of business of the Company for the years ended June 30, 2015, 2014 and 2013:
| | | June 30, 2015 | | | | | Shopping Center Properties | | | Offices | | | Sales and developments | | | Hotels | | | International | | | Financial operations and others | | | Total Urban Properties and Investments | | | Revenues (i) | | | 1,778,310 | | | | 332,728 | | | | 13,707 | | | | 396,297 | | | | 25,873 | | | | 147 | | | | 2,547,062 | | | Costs | | | (291,183 | ) | | | (36,368 | ) | | | (19,457 | ) | | | (278,672 | ) | | | (7,121 | ) | | | (666 | ) | | | (633,467 | ) | | Gross Profit / (Loss) | | | 1,487,127 | | | | 296,360 | | | | (5,750 | ) | | | 117,625 | | | | 18,752 | | | | (519 | ) | | | 1,913,595 | | | Gain from disposal of investment properties | | | - | | | | - | | | | 1,150,230 | | | | - | | | | - | | | | - | | | | 1,150,230 | | | General and administrative expenses | | | (136,151 | ) | | | (58,971 | ) | | | (49,690 | ) | | | (77,567 | ) | | | (55,746 | ) | | | - | | | | (378,125 | ) | | Selling expenses | | | (112,825 | ) | | | (21,130 | ) | | | (9,146 | ) | | | (52,386 | ) | | | - | | | | (379 | ) | | | (195,866 | ) | | Other operating results, net | | | (48,810 | ) | | | (117,610 | ) | | | 13,093 | | | | (461 | ) | | | 184,886 | | | | (2,419 | ) | | | 28,679 | | | Profit / (Loss) from Operations | | | 1,189,341 | | | | 98,649 | | | | 1,098,737 | | | | (12,789 | ) | | | 147,892 | | | | (3,317 | ) | | | 2,518,513 | | | Share of profit / (loss) of associates and joint ventures | | | - | | | | (2,570 | ) | | | (1,712 | ) | | | 1,254 | | | | (1,191,116 | ) | | | 157,888 | | | | (1,036,256 | ) | | Segment Profit / (Loss) | | | 1,189,341 | | | | 96,079 | | | | 1,097,025 | | | | (11,535 | ) | | | (1,043,224 | ) | | | 154,571 | | | | 1,482,257 | | | | | | | | | | | | | | | | | | | | | | | | | | | | | | | | | Investment properties | | | 2,320,845 | | | | 978,125 | | | | 187,824 | | | | - | | | | - | | | | 6,851 | | | | 3,493,645 | | | Property, plant and equipment | | | 48,345 | | | | 30,599 | | | | 1,242 | | | | 175,386 | | | | 1,319 | | | | - | | | | 256,891 | | | Trading properties | | | 1,484 | | | | - | | | | 134,600 | | | | - | | | | - | | | | - | | | | 136,084 | | | Goodwill | | | 13,719 | | | | 6,180 | | | | 4,541 | | | | - | | | | - | | | | - | | | | 24,440 | | | Units to be received under barters | | | - | | | | - | | | | 90,486 | | | | - | | | | - | | | | - | | | | 90,486 | | | Inventories | | | 15,711 | | | | - | | | | 497 | | | | 6,926 | | | | - | | | | - | | | | 23,134 | | | Investments in associates and joint ventures | | | - | | | | 20,746 | | | | 46,555 | | | | - | | | | 909,911 | | | | 1,404,458 | | | | 2,381,670 | | | Total segment assets (ii) | | | 2,400,104 | | | | 1,035,650 | | | | 465,745 | | | | 182,312 | | | | 911,230 | | | | 1,411,309 | | | | 6,406,350 | |
(i) Of all of the Company’s revenues corresponding to urban properties and investment business, Ps. 2,522 million is originated in Argentina and Ps. 26 million in United States.
(ii) Of all of the Company’s assets included in urban properties and investment business, Ps. 5,389 million is located in Argentina and Ps. 1,639 million in other countries, principally in Israel for Ps. 907.0 million and Uruguay for Ps. 106.0 million, respectively.
| | | June 30, 2014 | | | | | Shopping Center Properties | | | Offices | | | Sales and developments | | | Hotels | | | International | | | Financial operations and others | | | Total Urban Properties and Investments | | | Revenues (i) | | | 1,383,008 | | | | 271,159 | | | | 85,531 | | | | 331,562 | | | | 83,926 | | | | 574 | | | | 2,155,760 | | | Costs | | | (296,688 | ) | | | (45,367 | ) | | | (34,963 | ) | | | (216,768 | ) | | | (53,510 | ) | | | (983 | ) | | | (648,279 | ) | | Gross Profit / (Loss) | | | 1,086,320 | | | | 225,792 | | | | 50,568 | | | | 114,794 | | | | 30,416 | | | | (409 | ) | | | 1,507,481 | | | Gain from disposal of investment properties | | | (82 | ) | | | - | | | | 231,000 | | | | - | | | | - | | | | - | | | | 230,918 | | | General and administrative expenses | | | (101,538 | ) | | | (41,945 | ) | | | (37,466 | ) | | | (59,585 | ) | | | (59,476 | ) | | | (56 | ) | | | (300,066 | ) | | Selling expenses | | | (73,427 | ) | | | (20,751 | ) | | | (13,706 | ) | | | (42,335 | ) | | | - | | | | 110 | | | | (150,109 | ) | | Other operating results, net | | | (46,568 | ) | | | (3,060 | ) | | | 8,137 | | | | (2,680 | ) | | | (895 | ) | | | (2,856 | ) | | | (47,922 | ) | | Profit / (Loss) from Operations | | | 864,705 | | | | 160,036 | | | | 238,533 | | | | 10,194 | | | | (29,955 | ) | | | (3,211 | ) | | | 1,240,302 | | | Share of profit / (loss) of associates and joint ventures | | | - | | | | (895 | ) | | | 6,368 | | | | 789 | | | | (616,313 | ) | | | 173,285 | | | | (436,766 | ) | | Segment Profit / (Loss) | | | 864,705 | | | | 159,141 | | | | 244,901 | | | | 10,983 | | | | (646,268 | ) | | | 170,074 | | | | 803,536 | | | | | | | | | | | | | | | | | | | | | | | | | | | | | | | | | Investment properties | | | 2,275,053 | | | | 834,480 | | | | 423,442 | | | | - | | | | - | | | | 7,462 | | | | 3,540,437 | | | Property, plant and equipment | | | 20,455 | | | | 36,415 | | | | 3,744 | | | | 175,745 | | | | 1,501 | | | | - | | | | 237,860 | | | Trading properties | | | 1,484 | | | | - | | | | 141,575 | | | | - | | | | - | | | | - | | | | 143,059 | | | Goodwill | | | 8,582 | | | | 11,661 | | | | 4,541 | | | | - | | | | - | | | | - | | | | 24,784 | | | Units to be received under barters | | | - | | | | - | | | | 85,077 | | | | - | | | | - | | | | - | | | | 85,077 | | | Assets held for sale (iii) | | | - | | | | - | | | | - | | | | - | | | | 1,357,866 | | | | - | | | | 1,357,866 | | | Inventories | | | 10,625 | | | | - | | | | 584 | | | | 6,011 | | | | - | | | | - | | | | 17,220 | | | Investments in associates and joint ventures | | | - | | | | 23,208 | | | | 38,289 | | | | 22,129 | | | | 628,658 | | | | 1,253,735 | | | | 1,966,019 | | | Total segment assets (ii) | | | 2,316,199 | | | | 905,764 | | | | 697,252 | | | | 203,885 | | | | 1,988,025 | | | | 1,261,197 | | | | 7,372,322 | |
(i) Of all of the Company’s revenues corresponding to urban properties and investment business, Ps. 2,072 million is originated in Argentina and Ps. 84 million in United States.
(ii) Of all of the Company’s assets included in urban properties and investment business, Ps. 5,273 million is located in Argentina and Ps. 2,099 million in other countries, principally in United States for Ps. 1,988 million.
(iii) See Note 44 to the Audited Consolidated Financial Statements for details.
| | | June 30, 2013 | | | | | Shopping Center Properties | | | Offices | | | Sales and developments | | | Hotels | | | International | | | Financial operation and others | | | Total Urban Properties and Investments | | | Revenues (i) | | | 1,103,044 | | | | 217,171 | | | | 141,996 | | | | 225,836 | | | | 38,998 | | | | 1,203 | | | | 1,728,248 | | | Costs | | | (245,528 | ) | | | (46,975 | ) | | | (106,558 | ) | | | (169,071 | ) | | | (31,587 | ) | | | (1,517 | ) | | | (601,236 | ) | | Gross Profit / (Loss) | | | 857,516 | | | | 170,196 | | | | 35,438 | | | | 56,765 | | | | 7,411 | | | | (314 | ) | | | 1,127,012 | | | Gain from disposal of investment properties | | | - | | | | - | | | | 177,999 | | | | - | | | | - | | | | - | | | | 177,999 | | | General and administrative expenses | | | (67,597 | ) | | | (34,984 | ) | | | (32,901 | ) | | | (49,883 | ) | | | (13,158 | ) | | | (250 | ) | | | (198,773 | ) | | Selling expenses | | | (58,907 | ) | | | (11,360 | ) | | | (16,456 | ) | | | (28,919 | ) | | | - | | | | (1,588 | ) | | | (117,230 | ) | | Other operating results, net | | | (45,020 | ) | | | (247 | ) | | | 6,342 | | | | (369 | ) | | | 135,082 | | | | (3,363 | ) | | | 92,425 | | | Profit / (Loss) from Operations | | | 685,992 | | | | 123,605 | | | | 170,422 | | | | (22,406 | ) | | | 129,335 | | | | (5,515 | ) | | | 1,081,433 | | | Share of profit / (loss) of associates and joint ventures | | | - | | | | (2,514 | ) | | | 1,569 | | | | 83 | | | | (82,552 | ) | | | 62,550 | | | | (20,864 | ) | | Segment Profit / (Loss) | | | 685,992 | | | | 121,091 | | | | 171,991 | | | | (22,323 | ) | | | 46,783 | | | | 57,035 | | | | 1,060,569 | | | | | | | | | | | | | | | | | | | | | | | | | | | | | | | | | Investment properties | | | 2,249,180 | | | | 857,782 | | | | 447,363 | | | | - | | | | 744,587 | | | | 8,072 | | | | 4,306,984 | | | Property, plant and equipment | | | 17,385 | | | | 29,830 | | | | 3,972 | | | | 180,348 | | | | 199 | | | | - | | | | 231,734 | | | Trading properties | | | 1,484 | | | | 106 | | | | 128,087 | | | | - | | | | - | | | | - | | | | 129,677 | | | Goodwill | | | 8,582 | | | | 11,661 | | | | 4,540 | | | | - | | | | 51,069 | | | | - | | | | 75,852 | | | Units to be received under barters | | | - | | | | - | | | | 93,225 | | | | - | | | | - | | | | - | | | | 93,225 | | | Inventories | | | 10,003 | | | | - | | | | 463 | | | | 5,962 | | | | - | | | | - | | | | 16,428 | | | Investments in associates and joint ventures | | | - | | | | 23,385 | | | | 32,759 | | | | 21,339 | | | | 802 | | | | 1,076,545 | | | | 1,154,830 | | | Total segment assets (ii) | | | 2,286,634 | | | | 922,764 | | | | 710,409 | | | | 207,649 | | | | 796,657 | | | | 1,084,617 | | | | 6,008,730 | |
(i) | Of all of the Company’s revenues corresponding to urban properties and investment business, Ps. 1,689 million is originated in Argentina and Ps. 39 million in United States, respectively. |
(ii) | Of all of the Company’s assets included in the urban properties and investment business, Ps. 5,131 million is located in Argentina and Ps. 877 million in other countries, principally in United States for Ps. 797 million. |
The agricultural business, which includes cattle, dairy cattle and agroindustrial activities are mainly concentrated in Argentina. The crop activities of the Company are primarily concentrated in Argentina, Brazil, Bolivia and Paraguay, while sugar cane production is developed in Brazil and Bolivia.
The shopping center properties of the Company are all located in Argentina, the country of domicile of the Company. Substantially, offices and other rental properties of the Company are located in Argentina. Properties of the Company located in the United States, are disclosed in column "International". Hotels of the Company are located in Argentina and the United States. The trading properties of the Company are also located in Argentina and Uruguay.
During the fiscal years ended as of June 30, 2015, 2014 and 2013, the “Office” segment revenues include Ps.52,693 million, Ps.44,067 million and Ps.34,229 million, which represent 16% of the segment’s total revenues in the three fiscal years and are derived from activities of a single tenant.
Starting in the fourth quarter of the 2015 fiscal year, the Company modified the presentation of the income statement with respectline-by-line based on the percentage held in joint ventures rather than in a single item as required by IFRS. Management believes that the proportional consolidation method provides more useful information to understand the financial information by segments,business return. Moreover, operating results of EHSA joint venture is accounted for better alignment and consistency withunder the current business model and metrics used by the CODM and how they consider and analyse segmentequity method. Management believes that, in this case, this method provides more adequate information for purposesthis type of assessing operating performance by segment. This change in segment information presentation affectedinvestment, given its low materiality and considering it is a company without direct trade operations, where the presentationmain asset consists of information relating toan indirect interest of 25% of LRSA.
Operating results from the shopping centers and offices segments. This revised form of presentation excludes fromdo not include the income statement by segment the common maintenanceamounts attributable to building arrangement expenses and expenses relating to the collective promotion fundfunds ("FPC", as per its Spanish acronym) as well as any revenues relating tototal recovered costs, whether by way of building administration expenses or other concepts included under financial results (for example default interest and other concepts). The CODM examines the recovery of such expenses. Only thenet amount from both concepts (total surplus or deficit represented by the net amount between suchbuilding administration expenses and related revenues is included in the income statement by segment.
The Company has used this revised segment presentation in the comparative discussion of the results of operations for the fiscal years included below.
In addition, in the fourth quarter of the 2015 fiscal year, the Company has modified how it presents the gain/loss on the sale of investment property in segment information, which is revised by CODM. The information revised by CODM includes the gain/loss on the sale of investment properties within salesFPC and development segment, regardless of the segment where the property would have been originally located. These modifications affected the segments of sales and development and international. Considering that in the comparative periods presented there were not sales of investment properties in the international segment, it was not necessary to retroactively adjust the amounts pertaining to prior fiscal years.
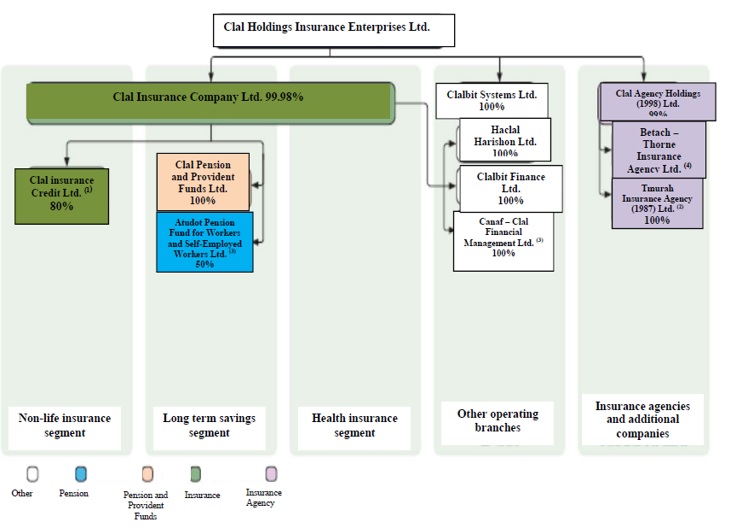
recoverable expenses). The asset categories examined by the CODM regularly reviews the following categories of assets:are: investment properties;properties, property, plant and equipment;equipment, trading properties; goodwill; rightsproperties, inventories, right to receive future units under barter agreements; inventories; biological assets; investments in associates; and theagreements, investment in the Entertainment Holding S.A. joint venture.associates and goodwill. The aggregatesum of these assets, classified by business segment, is reported under “assets by segment”. Assets are disclosed in these financial statements as “operatingallocated to each segment assets”. The measurement principles for the operating segment assets are based on the IFRS principles adoptedoperations and/or their physical location. Within the operations center in Argentina, most revenue from its operating segments is derived from, and their assets are located in, Argentina, except for earnings of associates included in the preparation“International” segment located in United States. Revenues for each reporting segments derive from a large and diverse client base and, therefore, there is no revenue concentration in any particular segment. Operations Center in Israel Within this center, IRSA operates in the following segments: · The “Real Estate” segment includes assets and operating income derived from business related to the subsidiary PBC. Through PBC, we operate rental properties and residential properties in Israel, United States and other parts of the consolidated financial statements, exceptworld and carries out commercial projects in Las Vegas. · The “Supermarkets” segment includes assets and operating income derived from the business of Shufersal which operates a supermarket chain in Israel. · The “Agrochemicals” segment includes income derived from the activities of Adama which is accounted for as an associate using the equity method of accounting Adama is specialized in agrochemicals, particularly for the Company’s shareproduction of crops for consumption. · The “Telecommunications” segment includes assets and operating income from the business of Cellcom which is telecommunication service provider that offers mobile phone services, fixed line phone services, data and Internet, among others. · The “Insurance” segment includes the operations of Clal which is one of the joint ventures Cresca S.A., CYRSA S.A., Nuevo Puerto Santa Fe S.A., Puerto Retiro S.A., Baicom Networks S.A.,most important insurance groups in Israel, and Quality Invest S.A., which are all reportedis mainly engaged in pension and social security insurance, among others. As indicated in Note 16 to the CODM under the proportionate consolidation method. Under this method, eachour Audited Consolidated Financial Statements, 51% of the operatingcontrolling shares of Clal are held in trust as specified in a judicial order of the Israel Securities Commission in order to comply with the requirement that the controlling shares of Clal be offered for sale to a third party; as a result, the Company is not fully consolidated on a line-by-line basis but rather in a single line as a financial instrument at fair value, as required by IFRS. · The “Others” segment assets reported to the CODM includes the proportionate share of the Company in the same operating assets of these joint ventures. As an example, the investment properties amount reported to the CODM includes (i) the investment property balanceand income derived from other diverse business activities, such as per the statement of financial position plus (ii) the Company’s share of the investment properties of these joint ventures. Under IFRS 11, the investment properties of these joint ventures are included together with all other of the joint ventures’ nettechnological developments, tourism, oil and gas assets, in the single line item titled “Investments in associateselectronics, and joint ventures” in the statement of financial position.others. The CODM evaluatesperiodically reviews the results and certain asset categories and assesses performance of business segmentsthis operating segment based on segment profit, defined as profit or loss from operations before financing and taxes. The measurement principles for the Company’s segment reporting structure are based on the IFRS principles adopted in the Consolidated Financial Statements, except for the Company’s sharea measure of profit or loss of the segment composed by the operating income plus the equity in earnings of joint ventures.ventures and associates. The valuation criteria used in preparing this information are consistent with IFRS standards used for the preparation of the Audited Consolidated Financial Statements. At the timeAs indicated under Note 2 of assessing the performance of business segments and deciding upon the allocation of resources, the Executive Committee uses information on operating income assets and liabilities of each such segment In theour Audited Consolidated Financial Statements, the transactionsCompany decided to consolidate income derived from its operations center in Israel with a three month lag, as adjusted for the effects of significant transactions; hence, operating results of IDBD for the period extending from October 11, 2015 (the date of acquisition of control) through March 31, 2016 are included in the Company’s comprehensive income for the fiscal year ended June 30, 2016.
Furthermore, comparative information has not been modified for as of that date the Company did not exercise control over IDBD. The assessment of this investment was part of the international segment of the urban properties and balances between related parties which may affect more than one segment are eliminated.investment business in the operations center in Argentina. Goods and services exchanged between segments are calculated on the basis of market prices. Intercompany transactions between segments, if any, are eliminated. Business segments involving the urban properties and investments business from the operations center in Argentina where the CODM evaluated assets under the proportional consolidation method, each reported asset includes the proportional share of the Company in the same class of assets of the associates and/or joint ventures. Only as an example, the investment properties amount reported to the CODM includes (i) the balance investment properties as per the statement of financial position plus (ii) the Company’s share of the investment properties of these joint ventures. Within the agricultural business, most revenue from its operating segments are generated from and their assets are located in Argentina and Brazil, mainly. Within the operations center in Israel, most revenue from its operating segments are derived from, and their assets are located in, Israel, except for part of earnings from the Real Estate segment, which are generated from activities outside Israel, mainly in United States. Within the agricultural business and the urban properties and investments business from the operations center in Argentina, the assets categories reviewed by the CODM are: investment properties, property, plant and equipment, trading properties, inventories, biological assets, right to receive future units under barter agreements, investment in joint ventures and associates and goodwill. The aggregate of these assets, classified by business segment, are disclosed as “segment assets”. Assets are allocated to each segment based on the operations and/or their physical location. Below is a summarized analysis of the lines of business of the Company for the year ended June 30, 2016: | | Agricultural business | | Urban properties and investments business | | Total | | | | | Operations Center in Argentina | | Operations Center in Israel | | Subtotal | | | | | | | | | (in million of Ps.) | | | | | | Revenues | 2,912 | | 3,284 | | 28,229 | | 31,513 | | 34,425 | | Costs | (3,821) | | (839) | | (20,481) | | (21,320) | | (25,141) | | Initial recognition and changes in the fair value of biological assets and agricultural produce at the point of harvest | 1,717 | | - | | - | | - | | 1,717 | | Changes in the net realizable value of agricultural produce after harvest | 208 | | - | | - | | - | | 208 | | Gross profit | 1,016 | | 2,445 | | 7,748 | | 10,193 | | 11,209 | | Gain from disposal of investment properties | - | | 1,056 | | 45 | | 1,101 | | 1,101 | | Loss from disposal of farmlands | (2) | | - | | - | | - | | (2) | | General and administrative expenses | (314) | | (554) | | (1,387) | | (1,941) | | (2,255) | | Selling expenses | (338) | | (264) | | (5,686) | | (5,950) | | (6,288) | | Other operating results, net | (70) | | 32 | | - | | 32 | | (38) | | Profit from operations | 292 | | 2,715 | | 720 | | 3,435 | | 3,727 | Share of profit / (loss) of joint ventures and associates | 23 | | 96 | | 338 | | 434 | | 457 | | Segment profit | 315 | | 2,811 | | 1,058 | | 3,869 | | 4,184 | | | | | | | | | | | | Investment properties | 11 | | 3,340 | | - | | 3,340 | | 3,351 | Property, plant and equipment | 2,736 | | 244 | | - | | 244 | | 2,980 | Trading properties | - | | 253 | | - | | 253 | | 253 | Goodwill | 10 | | 25 | | - | | 25 | | 35 | Rights to receive future units under barter agreements | - | | 90 | | - | | 90 | | 90 | Biological assets | 1,144 | | - | | - | | - | | 1,144 | Inventories | 660 | | 28 | | - | | 28 | | 688 | Interests in joint ventures and associates | 54 | | 964 | | - | | 964 | | 1,018 | Operating assets from Operations Center in Israel | - | | - | | 146,989 | | 146,989 | | 146,989 | Total segment assets | 4,615 | | 4,944 | | 146,989 | | 151,933 | | 156,548 | | | | | | | | | | | | Operating liabilities from Operations Center in Israel | - | | - | | 132,865 | | 132,865 | | 132,865 |
Below is a summarized analysis of the lines of business of the Company for the year ended June 30, 2015: | | Agricultural business | | Urban properties and investments business | | Total | | | | | Operations Center in Argentina | | | | | | | (in million of Ps.) | | | | Revenues | 2,395 | | 2,547 | | 4,942 | | Costs | (3,419) | | (633) | | (4,052) | | Initial recognition and changes in the fair value of biological assets and agricultural produce at the point of harvest | 1,347 | | - | | 1,347 | | Changes in the net realizable value of agricultural produce after harvest | (34) | | - | | (34) | | Gross profit | 289 | | 1,914 | | 2,203 | | Gain from disposal of investment properties | - | | 1,150 | | 1,150 | | Gain from disposal of farmlands | 570 | | - | | 570 | | General and administrative expenses | (247) | | (378) | | (625) | | Selling expenses | (286) | | (195) | | (481) | | Other operating results, net | (19) | | 29 | | 10 | | Profit from operations | 307 | | 2,520 | | 2,827 | | Share of profit / (loss) of joint ventures and associates | 1 | | (1,037) | | (1,036) | | Segment profit | 308 | | 1,483 | | 1,791 | | | | | | | | | Investment properties | 77 | | 3,494 | | 3,571 | | Property, plant and equipment | 2,079 | | 256 | | 2,335 | | Trading properties | - | | 136 | | 136 | | Goodwill | 8 | | 25 | | 33 | | Rights to receive future units under barter agreements | - | | 90 | | 90 | | Biological assets | 588 | | - | | 588 | | Inventories | 496 | | 23 | | 519 | | Interests in joint ventures and associates | 33 | | 2,382 | | 2,415 | | Total segment assets | 3,281 | | 6,406 | | 9,687 |
Below is a summarized analysis of the lines of business of the Company for the year ended June 30, 2014: | | Agricultural business | | Urban properties and investments business | | Total | | | | | Operations Center in Argentina | | | | | | | (in million of Ps.) | | | | Revenues | 1,813 | | 2,157 | | 3,970 | | Costs | (2,617) | | (649) | | (3,266) | | Initial recognition and changes in the fair value of biological assets and agricultural produce at the point of harvest | 1,172 | | - | | 1,172 | | Changes in the net realizable value of agricultural produce after harvest | (17) | | - | | (17) | | Gross profit | 351 | | 1,508 | | 1,859 | | Gain from disposal of investment properties | - | | 231 | | 231 | | Gain from disposal of farmlands | 91 | | - | | 91 | | General and administrative expenses | (241) | | (300) | | (541) | | Selling expenses | (210) | | (150) | | (360) | | Other operating results, net | (29) | | (49) | | (78) | | (Loss) / Profit from operations | (38) | | 1,240 | | 1,202 | | Share of profit / (loss) of joint ventures and associates | 11 | | (437) | | (426) | | Segment (loss) / profit | (27) | | 803 | | 776 | | | | | | | | | Investment properties | 51 | | 3,539 | | 3,590 | | Property, plant and equipment | 2,417 | | 238 | | 2,655 | | Trading properties | - | | 143 | | 143 | | Goodwill | 11 | | 26 | | 37 | | Rights to receive future units under barter agreements | - | | 85 | | 85 | | Assets held for sale | - | | 1,358 | | 1,358 | | Biological assets | 652 | | - | | 652 | | Inventories | 433 | | 18 | | 451 | | Interests in joint ventures and associates | 37 | | 1,966 | | 2,003 | | Total segment assets | 3,601 | | 7,373 | | 10,974 |
Agriculture line of business: The following tables present the reportable segments of the agriculture line of business: | | June 30, 2016 | | | Agricultural production | | Land transformation and sales | | Others | | Total Agricultural business (i) | | | (in million of Ps.) | | Revenues | 1,689 | | - | | 1,223 | | 2,912 | | Costs | (2,727) | | (9) | | (1,085) | | (3,821) | | Initial recognition and changes in the fair value of biological assets and agricultural produce at the point of harvest | 1,717 | | - | - | - | | 1,717 | Changes in the net realizable value of agricultural produce after harvest | 208 | | - | - | - | | 208 | | Gross profit / (loss) | 887 | | (9) | | 138 | | 1,016 | | Loss from disposal of farmlands | - | | (2) | | - | | (2) | | General and administrative expenses | (256) | | (1) | | (57) | | (314) | | Selling expenses | (247) | | - | | (91) | | (338) | | Other operating results, net | (72) | | - | | 2 | | (70) | | Profit / (Loss) from operations | 312 | | (12) | | (8) | | 292 | | Share of profit / (loss) of associates | 26 | | - | | (3) | | 23 | | Segment profit / (loss) | 338 | | (12) | | (11) | | 315 | | | | | | | | | | | Investment properties | - | - | - | | 11 | | 11 | | Property, plant and equipment | 2,673 | | 13 | | 50 | | 2,736 | | Goodwill | 10 | | - | | - | | 10 | | Biological assets | 1,144 | | - | | - | | 1,144 | | Inventories | 499 | | - | | 161 | | 660 | | Investments in associates | 54 | | - | | - | | 54 | | Total segment assets (ii) | 4,380 | | 13 | | 222 | | 4,615 |
(i) From all of the Company’s revenues corresponding to Agricultural Business, Ps. 2,212 million are originated in Argentina and Ps. 700 million in other countries, principally in Brazil for Ps. 503 million. (ii) From all of the Company’s assets included in the segment corresponding to Agricultural Business, Ps. 2,062 million are located in Argentina and Ps. 2,556 million in other countries, principally in Brazil for Ps. 1,470 million. | | June 30, 2015 | | | Agricultural production | | Land transformation and sales | | Others | | Total Agricultural business (i) | | | (in million of Ps.) | | Revenues | 1,400 | | - | | 995 | | 2,395 | | Costs | (2,545) | | (9) | | (865) | | (3,419) | | Initial recognition and changes in the fair value of biological assets and agricultural produce at the point of harvest | 1,347 | | - | | - | | 1,347 | Changes in the net realizable value of agricultural produce after harvest | (34) | | - | | - | | (34) | | Gross profit / (loss) | 168 | | (9) | | 130 | | 289 | | Gain from disposal of farmlands | - | | 570 | | - | | 570 | | General and administrative expenses | (210) | | (2) | | (35) | | (247) | | Selling expenses | (193) | | (2) | | (91) | | (286) | | Other operating results, net | (15) | | (5) | | 1 | | (19) | | (Loss) / Profit from operations | (250) | | 552 | | 5 | | 307 | | Share of profit of associates | 1 | | - | | - | | 1 | | Segment (loss) / profit | (249) | | 552 | | 5 | | 308 | | | | | | | | | | | Investment properties | - | | - | | 77 | | 77 | | Property, plant and equipment | 1,997 | | 13 | | 69 | | 2,079 | | Goodwill | 7 | | - | | 1 | | 8 | | Biological assets | 587 | | - | | 1 | | 588 | | Inventories | 370 | | - | | 126 | | 496 | | Investments in associates | 33 | | - | | - | | 33 | | Total segment assets (ii) | 2,994 | | 13 | | 274 | | 3,281 |
(i) From all of the Company’s revenues corresponding to Agricultural Business, Ps. 1,679 million are originated in Argentina and Ps. 716 million in other countries, principally in Brazil for Ps. 578 million. (ii) From all of the Company’s assets included in the segment corresponding to Agricultural Business, Ps. 1,379 million are located in Argentina and Ps. 1,902 million in other countries, principally in Brazil for Ps. 1,186 million. | | June 30, 2014 | | | Agricultural production | | Land transformation and sales | | Others | | Total Agricultural business (i) | | | (in million of Ps.) | | Revenues | 1,105 | | - | | 708 | | 1,813 | | Costs �� | (2,011) | | (8) | | (598) | | (2,617) | | Initial recognition and changes in the fair value of biological assets and agricultural produce at the point of harvest | 1,172 | | - | | - | | 1,172 | Changes in the net realizable value of agricultural produce after harvest | (17) | | - | | - | | (17) | | Gross profit / (loss) | 249 | | (8) | | 110 | | 351 | | Gain from disposal of farmlands | - | | 91 | | - | | 91 | General and administrative expenses | (208) | | (1) | | (32) | | (241) | | Selling expenses | (139) | | (4) | | (67) | | (210) | | Other operating results, net | (29) | | - | | - | | (29) | | (Loss) / Profit from operations | (127) | | 78 | | 11 | | (38) | | Share of profit of associates | 11 | | - | | - | | 11 | | Segment (loss) / profit | (116) | | 78 | | 11 | | (27) | | | | | | | | | | | Investment properties | - | | - | | 51 | | 51 | | Property, plant and equipment | 2,365 | | 7 | | 45 | | 2,417 | | Goodwill | 10 | | - | | 1 | | 11 | | Biological assets | 647 | | - | | 5 | | 652 | | Inventories | 334 | | - | | 99 | | 433 | | Investments in associates | 34 | | - | | 3 | | 37 | | Total segment assets (ii) | 3,390 | | 7 | | 204 | | 3,601 |
(i) From all of the Company’s revenues corresponding to Agricultural Business, Ps. 1,279 million are originated in Argentina and Ps. 534 million in other countries, principally in Brazil for Ps. 415 million. (ii) From all of the Company’s assets included in the segment corresponding to Agricultural Business, Ps. 1,252 million are located in Argentina and Ps. 2,348 million in other countries, principally in Brazil for Ps. 1,727 million. Urban properties line of business and investments The following tables present the reportable segments from the Operations Center in Argentina: | | June 30, 2016 | | | Shopping Center | | Offices and others | | Sales and developments | | Hotels | | International | | Financial operations and others | | Total | | | | | Revenues (i) | | | | | | | | | | | | | | | Costs | | | | | | | | | | | | | | | Gross profit / (loss) | | | | | | | | | | | | | | | Gain from disposal of investment properties | | | | | | | | | | | | | | | General and administrative expenses | | | | | | | | | | | | | | | Selling expenses | | | | | | | | | | | | | | | Other operating results, net | | | | | | | | | | | | | | | Profit / (Loss) from operations | | | | | | | | | | | | | | | Share of profit / (loss) of joint ventures and associates | | | | | | | | | | | | | | | Segment profit / (loss) | | | | | | | | | | | | | | | | | | | | | | | | | | | | | | Investment properties | | | | | | | | | | | | | | | Property, plant and equipment | | | | | | | | | | | | | | | Trading properties | | | | | | | | | | | | | | | Goodwill | | | | | | | | | | | | | | | Rights to receive future units under barter agreements | | | | | | | | | | | | | | | Inventories | | | | | | | | | | | | | | | Investment in joint ventures and associates | | | | | | | | | | | | | | | Total segment assets (ii) | | | | | | | | | | | | | |
(i) From all our revenues corresponding to the urban properties and investment business of the Operations Center in Argentina, Ps. 3,284 million are originated in Argentina. No external client represents 10% or more of revenue of any of the reportable segments. (ii) From all our assets included in the segment corresponding to the urban properties and investment business of the operations Center in Argentina, Ps. 5,618 million are located in Argentina and Ps. (674) million in other countries, principally in United States for Ps. (832) million and Uruguay for Ps. 158 million, respectively. | | June 30, 2015 | | | Shopping Center | | Offices and others | | Sales and developments | | Hotels | | International | | Financial operations and others | | Total | | | (in million of Ps.) | | Revenues (i) | 1,778 | | 333 | | 14 | | 396 | | 26 | | - | | 2,547 | | Costs | (291) | | (36) | | (19) | | (279) | | (7) | | (1) | | (633) | | Gross profit / (loss) | 1,487 | | 297 | | (5) | | 117 | | 19 | | (1) | | 1,914 | | Gain from disposal of investment properties | - | | - | | 1,150 | | - | | - | | - | | 1,150 | | General and administrative expenses | (135) | | (59) | | (50) | | (78) | | (56) | | - | | (378) | | Selling expenses | (113) | | (21) | | (9) | | (52) | | - | | - | | (195) | | Other operating results, net | (49) | | (118) | | 13 | | - | | 185 | | (2) | | 29 | | Profit / (Loss) from operations | 1,190 | | 99 | | 1,099 | | (13) | | 148 | | (3) | | 2,520 | | Share of (loss) / profit of joint ventures and associates | - | | (3) | | (2) | | 1 | | (1,191) | | 158 | | (1,037) | | Segment profit / (loss) | 1,190 | | 96 | | 1,097 | | (12) | | (1,043) | | 155 | | 1,483 | | | | | | | | | | | | | | | | | Investment properties | 2,321 | | 978 | | 188 | | - | | - | | 7 | | 3,494 | | Property, plant and equipment | 48 | | 31 | | 1 | | 175 | | 1 | | - | | 256 | | Trading properties | 1 | | - | | 135 | | - | | - | | - | | 136 | | Goodwill | 14 | | 6 | | 5 | | - | | - | | - | | 25 | | Rights to receive future units under barter agreements | - | | - | | 90 | | - | | - | | - | | 90 | | Inventories | 16 | | - | | - | | 7 | | - | | - | | 23 | | Interests in joint ventures and associates | - | | 21 | | 47 | | - | | 910 | | 1,404 | | 2,382 | | Total segment assets (ii) | 2,400 | | 1,036 | | 466 | | 182 | | 911 | | 1,411 | | 6,406 |
(i) From all our revenues corresponding to the urban properties and investment business of the Operations Center in Argentina, Ps. 2,521 million are originated in Argentina and Ps. 26 million in United States. No external client represents 10% or more of revenue of any of the reportable segments. (ii) From all our assets included in the segment corresponding to the urban properties and investment business of the Operations Center in Argentina, Ps. 4,767 million are located in Argentina and Ps. 1,639 million in other countries, principally in United States for Ps. 1,533 million and Uruguay for Ps. 106 million, respectively. | | June 30, 2014 | | | Shopping Center | | Offices and others | | Sales and developments | | Hotels | | International | | Financial operations and others | | Total | | | (in million of Ps.) | | Revenues (i) | 1,383 | | 271 | | 86 | | 332 | | 84 | | 1 | | 2,157 | | Costs | (297) | | (45) | | (35) | | (217) | | (54) | | (1) | | (649) | | Gross profit | 1,086 | | 226 | | 51 | | 115 | | 30 | | - | | 1,508 | | Gain from disposal of investment properties | - | | - | | 231 | | - | | - | | - | | 231 | | General and administrative expenses | (102) | | (42) | | (37) | | (60) | | (59) | | - | | (300) | | Selling expenses | (73) | | (21) | | (14) | | (42) | | - | | - | | (150) | | Other operating results, net | (47) | | (3) | | 8 | | (3) | | (1) | | (3) | | (49) | | Profit / (Loss) from operations | 864 | | 160 | | 239 | | 10 | | (30) | | (3) | | 1,240 | | Share of (loss) / profit of joint ventures and associates | - | | (1) | | 6 | | 1 | | (616) | | 173 | | (437) | | Segment profit / (loss) | 864 | | 159 | | 245 | | 11 | | (646) | | 170 | | 803 | | | | | | | | | | | | | | | | | Investment properties | 2,275 | | 834 | | 423 | | - | | - | | 7 | | 3,539 | | Property, plant and equipment | 20 | | 36 | | 4 | | 176 | | 2 | | - | | 238 | | Trading properties | 1 | | - | | 142 | | - | | - | | - | | 143 | | Goodwill | 9 | | 12 | | 5 | | - | | - | | - | | 26 | | Rights to receive future units under barter agreements | - | | - | | 85 | | - | | - | | - | | 85 | | Assets held for sale | - | | - | | - | | - | | 1,358 | | - | | 1,358 | | Inventories | 11 | | - | | 1 | | 6 | | - | | - | | 18 | | Interests in joint ventures and associates | - | | 23 | | 38 | | 22 | | 629 | | 1,254 | | 1,966 | | Total segment assets (ii) | 2,316 | | 905 | | 698 | | 204 | | 1,989 | | 1,261 | | 7,373 |
(i) From all our revenues corresponding to the urban properties and investment business of the Operations Center in Argentina, Ps. 2,073 million are originated mainly in Argentina and Ps. 84 million in United States. No external client represents 10% or more of revenue of any of the reportable segments. (ii) From all our assets included in the segment corresponding to the urban properties and investment business of the Operations Center in Argentina, Ps. 5,274 million are located in Argentina and Ps. 2,099 million in other countries, principally in United States for Ps. 1,988 million. The following table presents the reportable segments of the Operations Center in Israel: | | June 30, 2016 | | | Real Estate | | Supermarkets | | Agrochemicals | | Telecommunications | | Insurance | | Others | | Total | | | | | Revenues (i) | | | | | | | | | | | | | | | Costs | | | | | | | | | | | | | | | Gross profit | | | | | | | | | | | | | | | Gain from disposal of investment properties | | | | | | | | | | | | | | | General and administrative expenses | | | | | | | | | | | | | | | Selling expenses | | | | | | | | | | | | | | Profit / (Loss) from operations | | | | | | | | | | | | | | | Share of profit / (loss) of joint ventures and associates | | | | | | | | | | | | | | | Segment profit / (loss) | | | | | | | | | | | | | | | | | | | | | | | | | | | | | | Operating assets (ii) | | | | | | | | | | | | | | | Operating liabilities | | | | | | | | | | | | | | | | | | | | | | | | | | | | |
(i) From all our revenues corresponding to the urban properties and investment business of the Operations Center in Israel, Ps. 512 million are originated in United States and Ps. 27,717 million in Israel. No external client represents 10% or more of revenue of any of the reportable segments. (ii) From all our assets included in the segment corresponding to the urban properties and investment business of the Operations Center in Israel, Ps. 14,070 million are located in United States, Ps. 786 million in India and the remaining in Israel. The following tables present a reconciliation between the total results of segment operations and the results of operations as per the income statements.segment information and the profit from operation as per the statement of income. The adjustments relate to the presentation of the results of operations of joint ventures accounted for under the equity method under IFRS.IFRS and the non-elimination of the inter-segment transactions.
| | | June 30, 2016 | | | | June 30, 2015 | | Total segment information | | Adjustment for share of profit / (loss) of joint ventures | | Expenses and collective promotion funds | | Adjustment to income for elimination of inter-segment transactions | | Total statement of income | | | | Total segment information | | | Adjustment for share of profit / (loss) of joint ventures | | | Adjustment to income for elimination of inter-segment transactions | | | Common maintenance expenses and collective promotion fund | | | Total Income Statements | | (in million of Ps.) | | Revenues | | | 4,908,072 | | | | (53,473 | ) | | | (90,002 | ) | | | 887,208 | | | | 5,651,805 | | 34,425 | | (89) | | 1,194 | | (146) | | 35,384 | | Costs | | | (4,019,142 | ) | | | 62,335 | | | | 88,375 | | | | (901,283 | ) | | | (4,769,715 | ) | (25,141) | | 111 | | (1,207) | | 147 | | (26,090) | | Initial recognition and changes in the fair value of biological assets and agricultural produce at the point of harvest | | | 1,347,447 | | | | (23,295 | ) | | | - | | | | - | | | | 1,324,152 | | 1,717 | | (57) | | - | | - | | 1,660 | | Changes in the net realizable value of agricultural produce after harvest | | | (34,471 | ) | | | - | | | | - | | | | - | | | | (34,471 | ) | 208 | | - | | - | | - | | 208 | | Gross Profit / (Loss) | | | 2,201,906 | | | | (14,433 | ) | | | (1,627 | ) | | | (14,075 | ) | | | 2,171,771 | | | Gross profit / (loss) | | 11,209 | | (35) | | (13) | | 1 | | 11,162 | | Gain from disposal of investment properties | | | 1,150,230 | | | | - | | | | - | | | | - | | | | 1,150,230 | | 1,101 | | - | | - | | - | | 1,101 | | Gain from disposal of farmlands | | | 569,521 | | | | (19,059 | ) | | | - | | | | - | | | | 550,462 | | | | Loss from disposal of farmlands | | (2) | | - | | - | | - | | (2) | | General and administrative expenses | | | (624,595 | ) | | | 4,173 | | | | 2,602 | | | | - | | | | (617,820 | ) | (2,255) | | 5 | | - | | 6 | | (2,244) | | Selling expenses | | | (480,696 | ) | | | 6,217 | | | | 321 | | | | - | | | | (474,158 | ) | (6,288) | | 8 | | - | | 1 | | (6,279) | | Other operating results, net | | | 10,556 | | | | 2,949 | | | | (1,296 | ) | | | - | | | | 12,209 | | (38) | | (2) | | - | | (3) | | (43) | | Profit/(Loss) from Operations before share of Profit / (Loss) of Associates and Joint Ventures | | | 2,826,922 | | | | (20,153 | ) | | | - | | | | (14,075 | ) | | | 2,792,694 | | | | Share of profit / (loss) of associates and joint ventures | | | (1,035,410 | ) | | | 10,438 | | | | - | | | | - | | | | (1,024,972 | ) | | | Profit/(Loss) from operations before Financing and Taxes | | | 1,791,512 | | | | (9,715 | ) | | | - | | | | (14,075 | ) | | | 1,767,722 | | | Profit / (Loss) from operations before share of Profit / (Loss) of joint ventures and associates | | 3,727 | | (24) | | (13) | | 5 | | 3,695 | | Share of (loss) / profit of joint ventures and associates | | 457 | | 14 | | - | | - | | 471 | Profit / (Loss) from operations before financing and taxation | | 4,184 | | (10) | | (13) | | 5 | | 4,166 |
| | | June 30, 2014 | | | | | Total segment information | | | Adjustment for share of profit / (loss) of joint ventures | | | Adjustment to income for elimination of inter-segment transactions | | | Common maintenance expenses and collective promotion fund | | | Total Income Statements | | | Revenues | | | 3,967,868 | | | | (62,085 | ) | | | (38,074 | ) | | | 736,302 | | | | 4,604,011 | | | Costs | | | (3,266,251 | ) | | | 58,857 | | | | 36,505 | | | | (743,703 | ) | | | (3,914,592 | ) | | Initial recognition and changes in the fair value of biological assets and agricultural produce at the point of harvest | | | 1,172,739 | | | | (20,086 | ) | | | - | | | | - | | | | 1,152,653 | | | Changes in the net realizable value of agricultural produce after harvest | | | (17,447 | ) | | | - | | | | - | | | | - | | | | (17,447 | ) | | Gross Profit / (Loss) | | | 1,856,909 | | | | (23,314 | ) | | | (1,569 | ) | | | (7,401 | ) | | | 1,824,625 | | | Gain from disposal of investment properties | | | 230,918 | | | | - | | | | - | | | | - | | | | 230,918 | | | Gain from disposal of farmlands | | | 91,356 | | | | - | | | | - | | | | - | | | | 91,356 | | | General and administrative expenses | | | (539,696 | ) | | | 3,423 | | | | 2,334 | | | | - | | | | (533,939 | ) | | Selling expenses | | | (359,041 | ) | | | 5,949 | | | | 366 | | | | - | | | | (352,726 | ) | | Other operating results, net | | | (77,462 | ) | | | 3,585 | | | | (1,131 | ) | | | - | | | | (75,008 | ) | | Profit/(Loss) from Operations before share of Profit / (Loss) of Associates and Joint Ventures | | | 1,202,984 | | | | (10,438 | ) | | | - | | | | (7,401 | ) | | | 1,185,226 | | | Share of profit / (loss) of associates and joint ventures | | | (425,287 | ) | | | 16,636 | | | | - | | | | - | | | | (408,651 | ) | | Profit/(Loss) from operations before Financing and Taxes | | | 777,697 | | | | 6,279 | | | | - | | | | (7,401 | ) | | | 776,575 | |
| | | June 30, 2013 | | | | | Total segment information | | | Adjustment for share of profit / (loss) of joint ventures | | | Adjustment to income for elimination of inter-segment transactions | | | Common maintenance expenses and collective promotion fund | | | Total Income Statements | | | Revenues | | | 3,083,678 | | | | (137,889 | ) | | | (11,528 | ) | | | 594,290 | | | | 3,528,551 | | | Costs | | | (2,647,015 | ) | | | 116,004 | | | | 10,296 | | | | (599,780 | ) | | | (3,120,495 | ) | | Initial recognition and changes in the fair value of biological assets and agricultural produce at the point of harvest | | | 888,493 | | | | (1,749 | ) | | | - | | | | - | | | | 886,744 | | | Changes in the net realizable value of agricultural produce after harvest | | | 11,756 | | | | - | | | | - | | | | - | | | | 11,756 | | | Gross Profit / (Loss) | | | 1,336,912 | | | | (23,634 | ) | | | (1,232 | ) | | | (5,490 | ) | | | 1,306,556 | | | Gain from disposal of investment properties | | | 177,999 | | | | - | | | | - | | | | - | | | | 177,999 | | | Gain from disposal of farmlands | | | 149,584 | | | | - | | | | - | | | | - | | | | 149,584 | | | General and administrative expenses | | | (352,448 | ) | | | 4,291 | | | | 1,774 | | | | - | | | | (346,383 | ) | | Selling expenses | | | (291,206 | ) | | | 11,631 | | | | 112 | | | | - | | | | (279,463 | ) | | Other operating results, net | | | 95,770 | | | | 2,952 | | | | (654 | ) | | | - | | | | 98,068 | | | Profit/(Loss) from Operations before share of Profit / (Loss) of Associates and Joint Ventures | | | 1,116,611 | | | | (4,760 | ) | | | - | | | | (5,490 | ) | | | 1,106,361 | | | Share of profit / (loss) of associates and joint ventures | | | (11,673 | ) | | | 1,855 | | | | - | | | | - | | | | (9,818 | ) | | Profit/(Loss) from operations before Financing and Taxes | | | 1,104,938 | | | | (2,905 | ) | | | - | | | | (5,490 | ) | | | 1,096,543 | |
Total segment assets are allocated based on the operations of the segment and the physical location of the asset. According to the analysis above, segment assets include the proportionate share of the assets of joint ventures. The statement of financial position under IFRS shows the net investment in these joint ventures as a single item.| | June 30, 2015 | | | Total segment information | | Adjustment for share of Profit / (Loss) of joint ventures | | Expenses and collective promotion funds | | Adjustment to income for elimination of inter-segment transactions | | Total statement of income | | | (in million of Ps.) | Revenues | 4,942 | | (53) | | 887 | | (124) | | 5,652 | Costs | (4,052) | | 61 | | (901) | | 122 | | (4,770) | | Initial recognition and changes in the fair value of biological assets and agricultural produce at the point of harvest | 1,347 | | (23) | | - | | - | | 1,324 | | Changes in the net realizable value of agricultural produce after harvest | (34) | | - | | - | | - | | (34) | Gross profit / (loss) | 2,203 | | (15) | | (14) | | (2) | | 2,172 | | Gain from disposal of investment properties | 1,150 | | - | | - | | - | | 1,150 | | Gain / (Loss) from disposal of farmlands | 570 | | (20) | | - | | - | | 550 | | General and administrative expenses | (625) | | 4 | | - | | 3 | | (618) | Selling expenses | (481) | | 6 | | - | | 1 | | (474) | Other operating results, net | 10 | | 3 | | - | | (1) | | 12 | | Profit / (Loss) from operations before share of Profit / (Loss) of joint ventures and associates | 2,827 | | (22) | | (14) | | 1 | | 2,792 | | Share of (loss) / profit of joint ventures and associates | (1,036) | | 11 | | - | | - | | (1,025) | Profit / (Loss) from operations before financing and taxation | 1,791 | | (11) | | (14) | | 1 | | 1,767 |
| | June 30, 2014 | | | Total segment information | | Adjustment for share of Profit / (Loss) of joint ventures | | Expenses and collective promotion funds | | Adjustment to income for elimination of inter-segment transactions | | Total statement of income | | | (in million of Ps.) | Revenues | 3,970 | | (63) | | 736 | | (39) | | 4,604 | Costs | (3,266) | | 60 | | (744) | | 37 | | (3,913) | | Initial recognition and changes in the fair value of biological assets and agricultural produce at the point of harvest | 1,172 | | (20) | | - | | - | | 1,152 | | Changes in the net realizable value of agricultural produce after harvest | (17) | | - | | - | | - | | (17) | Gross profit / (loss) | 1,859 | | (23) | | (8) | | (2) | | 1,826 | | Gain from disposal of investment properties | 231 | | - | | - | | - | | 231 | | Gain from disposal of farmlands | 91 | | - | | - | | - | | 91 | | General and administrative expenses | (541) | | 5 | | - | | 3 | | (533) | Selling expenses | (360) | | 6 | | - | | - | | (354) | Other operating results, net | (78) | | 4 | | - | | (1) | | (75) | | Profit / (Loss) from operations before share of Profit / (Loss) of joint ventures and associates | 1,202 | | (8) | | (8) | | - | | 1,186 | | Share of (loss) / profit of joint ventures and associates | (426) | | 16 | | - | | - | | (410) | Profit / (Loss) from operations before financing and taxation | 776 | | 8 | | (8) | | - | | 776 |
The following tables present a reconciliation between total segment assets as per segment informationand liabilities and total assets as per the statement of financial position. Adjustments are mainly related to the filing of certain classes of assets in segment information and to the proportional consolidation of joint ventures mentioned previously. | | | June 30, 2015 | | | June 30, 2014 | | | June 30, 2013 | | | Total Operating Assets as per Segment Information | | | 9,686,553 | | | | 10,972,702 | | | | 8,388,732 | | | Less: | | | | | | | | | | | | | | Proportionate share in reportable assets per segment of certain joint ventures (*) | | | (478,107 | ) | | | (442,360 | ) | | | (256,962 | ) | | Plus: | | | | | | | | | | | | | | Investments in joint ventures (**) | | | 357,673 | | | | 372,034 | | | | 300,809 | | | Other non-reportable assets | | | 5,709,324 | | | | 4,881,312 | | | | 3,978,146 | | | Total Consolidated Assets as per Statement of financial position | | | 15,275,443 | | | | 15,783,688 | | | | 12,410,725 | |
| | June 30, 2016 | | June 30, 2015 | | June 30, 2014 | | | Agricultural business | | Urban properties and investments business | | Total | | Agricultural business | | Urban properties and investments business | | Total | | Agricultural business | | Urban properties and investments business | | Total | | | | | Operations Center in Argentina | Operations Center in Israel | Subtotal | | | | | | Operations Center in Argentina | | | | | | Operations Center in Argentina | | | | | (in million of Ps.) | | Total Assets per segment | 4,615 | | 4,944 | 146,989 | 151,933 | | 156,548 | | 3,281 | | 6,406 | | 9,687 | | 3,601 | | 7,373 | | 10,974 | | Less: | | | | | | | | | | | | | | | | | | | | | Proportionate share in reportable assets per segment of joint ventures (*) | (529) | | (117) | - | (117) | | (646) | | (382) | | (95) | | (477) | | (294) | | (149) | | (443) | | Measurement adjustments at fair value | | | | | | | | | | | | | | | | | | | | | Plus: | | | | | | | | | | | | | | | | | | | | | Investments in joint ventures (**) | 233 | | 203 | - | 203 | | 436 | | 177 | | 181 | | 358 | | 64 | | 308 | | 372 | | Other non-reportable assets (***) | 3,102 | | 6,561 | - | 6,561 | | 9,663 | | 2,794 | | 2,914 | | 5,708 | | 2,606 | | 2,275 | | 4,881 | | Total Consolidated assets as per Statement of financial position | 7,421 | | 11,591 | 146,989 | 158,580 | | 166,001 | | 5,870 | | 9,406 | | 15,276 | | 5,977 | | 9,807 | | 15,784 |
| (*) The following amounts related to the proportionate share of operating segment assets of certain of The Company´s joint ventures are reported as part of the total operating segment assets by segment. |
(***) Includes deferred income tax assets, income tax credit, restricted assets, trade and other receivables, financial assets held for sale, investment in financial assets, derivative financial instruments, employee benefits, cash and cash equivalents and intangible assets except for goodwill and right to receive units.
| | | June 30, 2015 | | | June 30, 2014 | | | June 30, 2013 | | | Investment properties | | | 95,888 | | | | 137,253 | | | | 160,900 | | | Property, plant and equipment | | | 358,193 | | | | 272,982 | | | | 65,700 | | | Trading properties | | | 3,130 | | | | 5,908 | | | | 20,160 | | | Goodwill | | | 5,223 | | | | 5,235 | | | | 5,238 | | | Biological assets | | | 7,970 | | | | 10,899 | | | | 1,902 | | | Inventories | | | 7,703 | | | | 10,083 | | | | 3,062 | | | Total proportionate share in assets per segment of joint ventures | | | 478,107 | | | | 442,360 | | | | 256,962 | |
| (**) Represents the equity-accounted amount of those joint ventures, which were proportionate-consolidated for segment information purposes. |
Comparability of information126
During
(*) Below is a detail of the proportionate share in assets by segment of joint ventures included in the information reported by segment. | | June 30, 2016 | | June 30, 2015 | | June 30, 2014 | | | Agricultural business | | Urban properties and investments business | | Total | | Agricultural business | | Urban properties and investments business | | Total | | Agricultural business | | Urban properties and investments business | | Total | | | | | Operations Center in Argentina | Operations Center in Israel | Subtotal | | | | | | Operations Center in Argentina | | | | | | Operations Center in Argentina | | | | | (in million of Ps.) | Investment properties | 2 | | 115 | - | 115 | | 117 | | - | | 96 | | 96 | | - | | 135 | | 135 | | Property, plant and equipment | 509 | | (5) | - | (5) | | 504 | | 366 | | (9) | | 357 | | 273 | | - | | 273 | Trading properties | - | | 1 | - | 1 | | 1 | | - | | 3 | | 3 | | - | | 6 | | 6 | Goodwill | - | | 5 | - | 5 | | 5 | | - | | 5 | | 5 | | - | | 7 | | 7 | Biological assets | 12 | | - | - | - | | 12 | | 9 | | - | | 9 | | 11 | | - | | 11 | Inventories | 6 | | 1 | - | 1 | | 7 | | 7 | | - | | 7 | | 10 | | 1 | | 11 | | Total proportionate share in assets per segment of joint ventures | 529 | | 117 | - | 117 | | 646 | | 382 | | 95 | | 477 | | 294 | | 149 | | 443 |
(**) Represents the equity-accounted amount of those joint ventures, which were proportionate-consolidated for segment information purposes. | | June 30, 2016 | | June 30, 2015 | | June 30, 2014 | | | | Agricultural business | | Urban properties and investments business | | Total | | Agricultural business | | Urban properties and investments business | | Total | | Agricultural business | | Urban properties and investments business | | Total | | | | | Operations Center in Argentina | Operations Center in Israel | Subtotal | | | | | | Operations Center in Argentina | | | | | | Operations Center in Argentina | | | | | (in million of Ps.) | | Total Liabilities per segment | - | | - | 132,865 | 132,865 | | 132,865 | | - | | - | | - | | - | | - | | - | | Plus: | | | | | | | | | | | | | | | | | | | | | Liabilities corresponding to agricultural business and urban properties and investment business of the operations center in Argentina | 5,323 | | 12,581 | - | 12,581 | | 17,904 | | 4,209 | | 7,165 | | 11,374 | | 4,213 | | 7,136 | | 11,349 | | Total Consolidated liabilities as per Statement of financial position | 5,323 | | 12,581 | 132,865 | 145,446 | | 150,769 | | 4,209 | | 7,165 | | 11,374 | | 4,213 | | 7,136 | | 11,349 |
Fiscal year ended on June 30, 2016 compared to the fiscal year ended on June 30, 2015 On October 11, 2015, we obtained control of IDBD (See Note 3 to the Consolidated Financial Statements as of June 30, 2016 and 2015). Given that we have consolidated significant figures from various industries provided by IDBD and its subsidiaries, consolidated results (Agricultural Business, Israeli Operating Center’s Real Brasileño (Rs.) has depreciated againstEstate Business and Argentine Operating Center’s Real Estate Business) exhibit significant variations in Revenues, Costs, Administrative and Selling expenses, Share of Profit / (Loss) of Associates, and Financial Results. Operating results REVENUES Our total revenues rose by 596.6%, from Ps. 4,942 million in fiscal year 2015 to Ps. 34,425 million in fiscal year 2016. This was mainly due to the Argentine Peso and other currencies by around 20.0%, which affects the comparability of the figures reported21.6% increase in the current financial statements given its negative impact on the financial positionAgricultural Business, from Ps. 2,395 million in fiscal year 2015 to Ps. 2,912 million in fiscal year 2016 and results of operations of the Company, due mainly to the foreign exchange rate exposure1,137.3% increase in the Urban Properties and Investments Business, attributable to net assetsthe Ps. 28,229 in revenues from the Operation Center in Israel for fiscal year 2016, and liabilities denominatedto the increase of 28.9% in foreign currencythe Operation Center in Argentina, from Ps. 2,547 million in fiscal year 2015 to Ps. 3,284 million in fiscal year 2016. Agricultural Business | | | Fiscal year ended June 30, 2016 | | Revenues | | Statement of Income | Interests in joint ventures | Inter-segment eliminations | Segment reporting | | | | (in million of Ps.) | | Crops | | 1,101 | 51 | - | 1,152 | | Cattle | | 80 | 9 | 89 | 178 | | Dairy | | 65 | - | - | 65 | | Sugarcane | | 294 | - | - | 294 | | Agricultural Production Subtotal | | 1,540 | 60 | 89 | 1,689 | | Land Transformation and Sales | | - | - | - | - | | Agro-industrial | | 966 | - | - | 966 | | Others segments | | 167 | - | 12 | 179 | | Agricultural Rental and Services | | 40 | - | 38 | 78 | | Subtotal Others | | 1,173 | - | 50 | 1,223 | | Total Agricultural Business | | 2,713 | 60 | 139 | 2,912 |
| | | Fiscal Year ended June 30, 2015 | | Revenues | | Statement of Income | Interests in joint ventures | Inter-segment eliminations | Segment reporting | | | | (in million of Ps.) | | Crops | | 964 | 23 | - | 987 | | Cattle | | 56 | 3 | 84 | 143 | | Dairy | | 72 | - | - | 72 | | Sugarcane | | 198 | - | - | 198 | | Agricultural Production Subtotal | | 1,290 | 26 | 84 | 1,400 | | Land Transformation and Sales | | - | - | - | - | | Agro-industrial | | 806 | - | - | 806 | | Others segments | | 118 | - | 10 | 128 | | Agricultural rental and Services | | 37 | - | 24 | 61 | | Subtotal Others | | 961 | - | 34 | 995 | | Total Agricultural Business | | 2,251 | 26 | 118 | 2,395 |
Total revenues rose by 20.5%, up from Ps. 2,251 million in fiscal year 2015 to Ps. 2,713 in fiscal year 2016. This was due to the following increases: · Ps. 137 million in the Crops segment, · Ps. 24 million in the Cattle segment, · Ps. 96 million in the Sugarcane segment, · Ps. 160 million in the Agro-industrial segment, · Ps. 49 million in Others segments, and investments · Ps. 3 million in the Agricultural Rental and Services segment; offset by a Ps. 7 million decrease in the Dairy segment. In turn, revenues from our interests in joint ventures with a functional currency differentincreased by 130.8% from the Real. During thisPs. 26 million in fiscal year ended June 30, 2014 Argentina’s Peso devalued against the U.S. Dollars and other currencies by approximately 51%, which causes an impact on the comparability2015 to Ps. 60 million in fiscal year 2016, primarily as a consequence of the figures discloseda 121.7% increase in the financial statements stemmingCrops sold to Cresca, up from exposurePs. 23 million in fiscal year 2015 to the exchange rate, above allPs. 51 million in our revenues from office rentals and our net assets and liabilities, denominated in foreign currency; as well as the Income/(loss) from our International segment.fiscal year 2016.
Shopping Center Properties
DuringSimilarly, inter-segment revenues rose by 17.8%, from Ps. 118 million in fiscal year 2015 we inaugurated two new shopping centers: “Distrito Arcos,” locatedup to Ps. 139 million in fiscal year 2016, mainly as a result of livestock sales during the year to our subsidiary Sociedad Anónima Carnes Pampeanas which was reclassified from the Cattle segment to the Agro-industrial segment and to the leases of croplands between our subsidiary Brasilagro and its subsidiaries, which were reclassified from the Crops and Sugarcane segment to the Agricultural Rental and Services segment.
Hence, according to business segment reporting and considering all our joint ventures and inter-segment eliminations, revenues increased by 21.6%, up from Ps. 2,395 million in fiscal year 2015 to Ps. 2,912 million in fiscal year 2016. Crops Total revenues from the Crops segment increased by 16.7%, up from Ps. 987 million in fiscal year 2015 to Ps. 1,152 million in fiscal year 2016, mainly as a consequence of: · a 20.9% increase in the areaaverage price of Palermo, Citythe Crops sold, up from Ps. 1,842 per ton in fiscal year 2015 to Ps. 2,226 per ton in fiscal year 2016, partially due to the reduction of Buenos Aires,5% in December 2014export duties of soybean and “Alto Comahue,” locatedthe elimination of export duties of corn and wheat (20% and 23%, respectively); · partially offset by a reduction of 18,175 tons in the Cityvolume of Neuquén, Argentine Patagonian region,Crops sold during fiscal year 2016 compared to the previous fiscal year; a 38.8% decrease in March 2015.Production volumes, from 405,882 tons in fiscal year 2015 down to 248,435 tons in fiscal year 2016. The following table provides a breakdown of the sales of Crops:
| | Sales of Crops (in tons) | | | | Fiscal year ended June 30 | | | | 2016 | 2015 | Variation | | | Corn | 255,162 | 269,701 | (14,539) | | Soybean | 198,296 | 250,125 | (51,829) | | Wheat | 46,607 | 7,083 | 39,524 | | Sorghum | 1,007 | 1,569 | (562) | | Sunflower | 10,421 | 5,181 | 5,240 | | Other | 5,863 | 1,872 | 3,991 | | Total Sales | 517,356 | 535,531 | (18,175) |
Cattle Total revenues from the Cattle segment increased 24.5%, from Ps. 143 million in fiscal year 2015 to Ps. 178 million in fiscal year 2016, mainly as a consequence of: · a 31.8% increase in the average price per kilogram sold, from Ps. 16.0 million in fiscal year 2015 to Ps. 21.2 million in fiscal year 2016; · offset by a 6.3% decrease in the volume of Cattle sold, down from 8,871 tons in fiscal year 2015 to 8,315 tons in fiscal year 2016. Dairy Total revenues from the Dairy segment dropped by 9.7%, down from Ps. 72 million in fiscal year 2015 to Ps. 65 million in fiscal year 2016, mainly as a consequence of: · an 8.2% reduction in the average price of milk, down from Ps. 3.55 per liter in fiscal year 2015 to Ps. 3.26 per liter in fiscal year 2016; · a 48.0% increase in the average price per kilogram sold of milking cows from Ps. 13.1 in fiscal year 2015 to Ps. 19.3 in fiscal year 2016; · a 17.7% reduction in the volume of milking cows from 903 tons in fiscal year 2015 to 743 tons in fiscal year 2016; · slightly offset by an 8.2% decrease in the volume of sales of milk, from 17 million liters in fiscal year 2015 to 16 million liters in fiscal year 2016. Sugarcane Total revenues from the Sugarcane segment increased 48.5%, from Ps. 198 million in fiscal year 2015 to Ps. 294 million in fiscal year 2016, mainly as a consequence of: · an increase of 295,226 tons (31.9%) in sales of sugarcane in fiscal year 2016 compared to the previous fiscal year, primarily attributable to Brasilagro; and · a 12.7% increase in the average price of sugarcane sold, from, from Ps. 214.0 per ton in fiscal year 2015 up to Ps. 241.2 per ton in fiscal year 2016. Agricultural Rental and Services Total revenues from the Agricultural Rental and Services segment increased by 27.9%, up from Ps. 61 million in fiscal year 2015 to Ps. 78 million in fiscal year 2016, mainly as a consequence of:
· a 60.2% increase in leases, due to an increase in leases in Brazil for Ps. 10 million originating primarily in the increase in the price of soybean and an increase in Income from theseleases in Argentina for Ps. 4.9 million, primarily attributable to a new developments,agreement for 1,106 hectares in La Esmeralda (Don Avelino), and an improvement in the agreement between Agro-Riego and Monsanto; · a 36.5% increase in revenues from the production of seeds mainly due to an increase in the prices of Crops that took place this fiscal year; · offset by a 16.5% decrease in revenues from irrigation services and agricultural management (Ps. 1 million) in the course of the current fiscal year compared to fiscal year 2015. Agro-industrial Total revenues from the Agro-industrial segment increased 19.9%, from Ps. 806 million in fiscal year 2015 to Ps. 966 million in fiscal year 2016, mainly as a consequence of: · a 20.0% increase in exports and a 32.1% increase in sales to the domestic market. Domestic consumption prices exhibited an upward trend and were 42.3% higher than in fiscal year 2015. The price of exports rose by 0.7% in US$ in fiscal year 2016 compared to 2015, · a 24.4% decrease in sales of by-products, · a small 3.3% reduction in slaughtering volumes, from 6,632 head per month in fiscal year 2015 to 6,415 during fiscal year 2016. Others segments Total revenues from Others segments rose by 39.8%, up from Ps. 22.9128 million in fiscal year 2015 to Ps. 179 million in fiscal year 2016, mainly as a consequence of: · an increase of Ps. 13 million in sales on consignment, and · an increase of Ps. 26 million in commodity brokerage services. Urban Properties and Investments Business | | | Fiscal year ended June 30, 2016 | | Revenues | | Statement of Income | Interests in joint ventures | Inter-segment eliminations | Maintenance Fee and Common Advertising Funds | Segment reporting | | | | (in million of Ps.) | | Operations Center in Argentina | | | | | | | | Shopping Center | | 3,487 | 20 | - | (1,101) | 2,406 | | Offices and Others | | 421 | 4 | 8 | (93) | 340 | | Sales and Developments | | (1) | 4 | - | - | 3 | | Hotels | | 534 | - | - | - | 534 | | International | | - | - | - | - | - | | Financial Operations and Others | | 1 | - | - | - | 1 | | Total Operations Center in Argentina | | 4,442 | 28 | 8 | (1,194) | 3,284 | | | | | | | | | | Operations Center in Israel | | | | | | | | Real Estate | | 1,538 | - | - | - | 1,538 | | Supermarkets | | 18,610 | - | - | - | 18,610 | | Agrochemicals | | - | - | - | - | - | | Telecommunications | | 6,655 | - | - | - | 6,655 | | Insurance | | - | - | - | - | - | | Other | | 1,426 | - | - | - | 1,426 | | Total Operations Center in Israel | | 28,229 | - | - | - | 28,229 | | Total Urban Properties and Investments Business | | 32,671 | 28 | 8 | (1,194) | 31,513 |
| | | Fiscal year ended June 30 2015 | | Revenues | | Statement of Income | Interests in joint ventures | Inter-segment eliminations | Maintenance Fee and Common Advertising Funds | Segment reporting | | | | (in million of Ps.) | | Operations Center in Argentina | | | | | | | | Shopping Centers | | 2,571 | 13 | - | (806) | 1,778 | | Offices and Others | | 397 | 10 | 5 | (79) | 333 | | Sales and Developments | | 9 | 5 | - | - | 14 | | Hotels | | 396 | - | - | - | 396 | | International | | 28 | - | - | (2) | 26 | | Financial Operations and Others | | - | - | - | - | - | | Total Urban Properties and Investments Business | | 3,401 | 28 | 5 | (887) | 2,547 | | | | | | | | | |
Total revenues from the Urban Properties and Investments business increased 860.6%, from Ps. 3,401 million in fiscal year 2015 to Ps. 32,671 million in fiscal year 2016, of which Ps. 28,229 million are derived from the Israeli Operating Center, and Ps. 11.74,442 million respectively. are derived from the Operation Center in Argentina. Considering Operation Center in Argentina variation was due to the a Ps. 916 million increase in the Shopping Center segment, a Ps. 24 million increase in the Offices and Others segment, a Ps. 138 million increase in the Hotels segment, a Ps. 1 million increase in the Financial Operations and Others segments, offset by a Ps. 28 million decrease in the International segment and a Ps. 10 million drop in the Sales and Developments segment. In December 2014, there was a transfer within the Company of 83,789 sqm of rental buildingsturn, revenues from IRSA Inversiones y Representaciones S.A. to IRSA Commercial Properties This transaction, though at the consolidated level itour interests in joint ventures did not have effects becauseexhibit significant variations when considering fiscal years 2016 and 2015. Our joint venture Nuevo Puerto de Santa Fe S.A. posted an increase in revenues but it was offset by a related party transaction, was considered a business Combination for the Company, and therefore, costs related to this transaction fordecrease in revenues posted by our joint venture Quality S.A. Inter-segment revenues rose by 60.0%, up from Ps. 110.55 million were recognized as income during fiscal year 2015 in “Other operating results, net”to Ps. 8 million during fiscal year 2016, both attributed to the Offices and Others segment. In addition, revenues from Maintenance Fee and Common Advertising Funds rose by 34.6%, from Ps. 887 million during fiscal year 2015 (of this amount, there are Ps. 806 million attributed to the Shopping Centers segment) to Ps. 1,194 million during fiscal year 2016 (of this amount, there are Ps. 1,101 million attributed to the Shopping Centers segment). DuringHence, according to business segment reporting and considering all our joint ventures, inter-segment eliminations, and maintenance fee and common advertising funds, revenues increased 1,137.3%, from Ps. 2,547 million in fiscal year 2015 to Ps. 31,513 million in fiscal year 2016 (of which Ps. 28,229 million are derived from the Operation Center in Israel and Ps. 3,284 million are derived from the Operation Center in Argentina). Without considering the revenues from the Operation Center in Israel, revenues, pursuant to business segment reporting, grew by 28.9%.
Operation Center in Argentina Shopping Center Revenues from the Shopping Centers segment increased 35.3%, from Ps. 1,778 million during fiscal year 2015 to Ps. 2,406 million during fiscal year 2016. Such variation was mostly attributable to: · an increase of Ps. 465 million in revenues from fixed and costsvariable rentals as a result of a 34% increase in our tenants’ sales, from Ps. 21,509 million during fiscal year 2015 to Ps. 28,905 million during fiscal year 2016; · a Ps. 52 million increase in revenues from admission fees; · a Ps. 41 million increase in parking revenues, and · a Ps. 34 million increase in revenues from commissions and other. Offices and Others Revenues from the Offices and Others segment increased 2.1%, up from Ps. 333 million in fiscal year 2015 to Ps. 340 million in fiscal year 2016. Such revenues were impacted by the partial sale of investment properties during fiscal year 2016, which resulted in a reduction of the segment total leasable area. Considering comparable properties in both fiscal years, rental revenues from properties which did not experience a decrease in their leasable area increased by 34.0%, up from Ps. 200 million during the fiscal year ended on June 30, 2015 to Ps. 268 million during the fiscal year ended on June 30, 2016, mainly due to the depreciation of the peso while revenues from properties which leasable area was reduced went down by 49.5%, from Ps. 111 million during fiscal year 2015 to Ps. 56 million during fiscal year 2016. As of year-end, the 2016 average occupancy rate of premium offices stood at 97.7% and the average rent was around US$ 27 per sqm. Sales and Developments There are significant variations in the revenues earned in this segment from one fiscal year to the other. Without considering our joint ventures, revenues from the Sales and Developments segment decreased by 111.1% from Ps. 9 million during fiscal year 2015 to a loss of Ps. 1 million during fiscal year 2016. Such reduction was mainly attributable to reduced revenues from the sale of the Condominios I and II (Ps. 7 million). Hence, total revenues derived from this segment fell by 78.6%, down from Ps. 14 million during fiscal year 2015 to Ps. 3 million during fiscal year 2016. Hotels Revenues from our OfficesHotels segment saw their comparability affectedincreased by partial sales of properties intended for lease allocated to that segment. In this respect,34.8% from Ps. 396 million during fiscal yearsyear 2015 and 2014, there were sales for 10,792 sqmto Ps. 534 million during fiscal year 2016, primarily attributable to a 34.4% increase in the average room rate of leasable surface area (approximately 8.8% of total leasable area at the beginning of the fiscal year), and 8,744 sqm of leasable surface area (approximately 6.2% of total leasable area at the beginning of the fiscal year), respectively (See Note 3)our hotels (measured in Argentine Pesos). International The revenues and costsRevenues from the internationalInternational segment were mainly affecteddecreased by 100% vis-à-vis the only 3-month consolidation in thePs. 26 million posted during fiscal year 2015 compared to the 12-month consolidation in the year 2014, of the results of Rigby 183 LLC (“Rigby 183”), owner ofbecause we sold the Madison 183 building located in the City of New York, which was sold in September 2015, and to a lesser extent, by the effect of devaluation described above.during fiscal year 2015.
Financial Operations and Others The operating result ofRevenues from the Financial Operations and Others segment primarily reflectssegments did not exhibit significant variations for the residual consumer financing activities of the Company, which have been decreasing progressively during fiscal years under discussion.periods presented.
Operations Center in Israel Real Estate. During fiscal year 2016, revenues from the Real Estate segment totaled Ps. 1,538 million. Supermarkets. During fiscal year 2016, revenues from the Supermarkets segment totaled Ps. 18,610 million. Telecommunications. During fiscal year 2016, revenues from the Telecommunications segment totaled Ps. 6,655 million. Others. During fiscal year 2016, revenues from the Others segment totaled Ps. 1,426 million. COSTS Our total costs rose by 520.5%, from Ps. 4,052 million in fiscal year 2015 the results of this segment were affected by different transactions performed by the Companyto Ps. 25,141 million in relation to the investment in Avenida, including the exercise of warrants, the dilution of part of our interest in this company in view of the entry of a new investor and the sale of 5% of our shareholding. Asfiscal year 2016. This was mainly as a result of all these transactions,an 11.8% increase in the Agriculture business, from the second quarter ofPs. 3,419 million in fiscal year 2015 we ceased to have significant influence on AvenidaPs. 3,821 million in fiscal year 2016, and therefore, we ceased to recognize it as an investment in an associate, accounted for under the equity method, and we started to recognize it as a financial asset valued at fair value through profit or loss, which are recognized in financial and holding results, net and are excluded3,268.1% increase in the segment reporting.
Cresud’s Results of OperationsUrban Properties and Investments Business, due to costs for Ps. 20,481 from the Operation Center in Israel for the fiscal years ended on June 30,year 2016; and a 32.5% increase in the Operation Center in Argentina, from Ps. 633 million in fiscal year 2015 2014 and 2013to Ps. 839 million in fiscal year 2016.
The following terms used herein have the meanings specified below:
Agricultural Business Revenues| | | Fiscal year ended June 30, 2016 | | Costs | | Statement of Income | Interests in joint ventures | Inter-segment eliminations | Segment reporting | | | | (in million of Ps.) | | Crops | | (1,698) | (80) | (35) | (1,813) | | Cattle | | (255) | (13) | - | (268) | | Dairy | | (135) | - | - | (135) | | Sugarcane | | (494) | - | (17) | (511) | | Agricultural Production subtotal | | (2,582) | (93) | (52) | (2,727) | | Land Transformation and Sales | | (9) | - | - | (9) | | Agro-industrial | | (836) | - | (89) | (925) | | Others segments | | (140) | - | - | (140) | | Agricultural rental and Services | | (20) | - | - | (20) | | Subtotal Others | | (996) | - | (89) | (1,085) | | Total Agricultural Business | | (3,587) | (93) | (141) | (3,821) |
Sales: Our sales consist of revenue on the sales of crops, milk and cattle. Sales are recognized when persuasive evidence of an arrangement exists, delivery has occurred, the price is fixed or determinable and collectibility is reasonably assured. Revenue from cattle feeding operations, primarily comprised of feeding, animal health and yardage, and revenue from operating leases and brokerage activities are recognized as services are performed.| | | Fiscal Year ended June 30, 2015 | | Costs | | Statement of Income | Interests in joint ventures | Inter-segment eliminations | Segment reporting | | | | (in million of Ps.) | | Crops | | (1,744) | (42) | (33) | (1,819) | | Cattle | | (220) | (5) | - | (225) | | Dairy | | (133) | - | - | (133) | | Sugarcane | | (368) | - | - | (368) | | Agricultural Production subtotal | | (2,465) | (47) | (33) | (2,545) | | Land Transformation and Sales | | (9) | - | - | (9) | | Agro-industrial | | (654) | - | (85) | (739) | | Others segments | | (105) | - | - | (105) | | Agricultural rental and Services | | (21) | - | - | (21) | | Subtotal Others | | (780) | - | (85) | (865) | | Total Agricultural Business | | (3,254) | (47) | (118) | (3,419) |
Costs.Total costs increased by 10.2%, from Ps. 3,254 million in fiscal year 2015 to Ps. 3,587 million in fiscal year 2016.This was primarily attributable to the following increases:
Cost· Ps. 35 million in the Cattle segment, · Ps. 2 million in the Dairy segment,
· Ps. 126 million in the Sugarcane segment, · Ps. 182 million in the Agro-industrial segment, · Ps. 35 million in the segment Other; offset by a Ps. 46 million reduction in the Crops segment, and Ps. 1 million in the Agricultural Rental and Services segment. In turn, the cost of Production: Ourour joint ventures experienced a net increase of Ps. 46 million, from 47 million in fiscal year 2015 up to Ps. 93 million in fiscal year 2016, mainly as a result of a Ps. 38 million increase in the costs of Cresca’s Crops, from Ps. 42 million in fiscal year 2015 to Ps. 80 million in fiscal year 2016. Similarly, inter-segment costs rose by Ps. 23 million, up from Ps. 118 million in fiscal year 2015 to Ps. 141 million in fiscal year 2016, primarily attributable to the cost of Cattle sales during the year to our subsidiary Sociedad Anónima Carnes Pampeanas which was reclassified from the Cattle segment to the Agro-industrial segment and to the leases of cropland between our subsidiary Brasilagro and its subsidiaries, which are reclassified from the Crops and Sugarcane segments to the Agricultural Rental and Services segment. Hence, according to business segment reporting and considering all our joint ventures, and the Inter-segment eliminations, costs grew by 11.8%, from Ps. 3,419 million in fiscal year 2015 to Ps. 3,821 million in fiscal year 2016. Crops Total costs from the Crops segment decreased by 0.4%, from Ps. 1,819 million in fiscal year 2015 to Ps. 1,813 million in fiscal year 2016. The costs from the Crops segment have been broken down in the following table: | | | | | Fiscal year 2016 | Fiscal year 2015 | | | In million Pesos | | Cost of sales | 952 | 873 | | Cost of production | 861 | 946 | | Total Costs | 1,813 | 1,819 |
Costs of sales in the Crops segment increased by 9.0%, from Ps. 873 million in fiscal year 2015 to Ps. 952 million in fiscal year 2016, mainly as a consequence of: · a 3.4% decrease in the volume of tons sold as compared to the previous fiscal year; and · slightly offset by a 12.8% increase in the average cost per ton of grain sold in fiscal year 2016, up from Ps. 1,631 in fiscal year 2015 to Ps. 1,840 in fiscal year 2016, due to a higher market price in Crops. The cost of sales as a percentage of sales was 88.5% in fiscal year 2015 and 82.6% in fiscal year 2016. The cost of production consistsin the Crops segment fell by 9.0% from Ps. 946 million in fiscal year 2015 to Ps. 861 million in fiscal year 2016, mainly as a consequence of: · an 11.0% reduction in direct production costs during this fiscal year compared to the previous fiscal year, primarily attributable to the smaller quantity of hectares sown in the 2015-2016 season (a 47.1% decrease compared to the previous season); · a smaller volume of production in fiscal year 2016 compared to the fiscal year 2015; · a larger number of hectares in operation in own farms in fiscal year 2016 compared to the fiscal year 2015. Total direct production costs per ton increased by 45.4%, from Ps. 1,899 per ton in fiscal year 2015 to Ps. 2,760 per ton in fiscal year 2016, mainly as a result of decreased yields and higher production costs in fiscal year 2016 compared to the fiscal year 2015. Cattle Total costs in the Cattle segment rose by 19.1%, from Ps. 225 million in fiscal year 2015 to Ps. 268 million in fiscal year 2016. The following table shows the costs in the Cattle segment: | | Fiscal year 2016 | Fiscal year 2015 | | | In million Pesos | | Cost of sales | 136 | 122 | | Cost of production | 132 | 103 | | Total Costs | 268 | 225 |
Cost of sales increased 11.5%, from Ps. 122 million in fiscal year 2015 to Ps. 136 million in fiscal year 2016, mainly as a consequence of: · an increase in the cost per kilogram sold in fiscal year 2016 (19.5%); and · a 6.2% decrease in beef sales volumes in fiscal year 2016. Costs of production in the Cattle segment rose by 28.2%, from Ps. 103 million in fiscal year 2015 to Ps. 132 million in fiscal year 2016. The higher cost of production from the Cattle segment in fiscal year 2016 was mainly attributable to: · smaller payroll expenses; · higher feeding costs (34.6% compared to fiscal year 2015) resulting from a higher quantity of head in the feedlot, and an 8% increase in the average cost of feedstuff.
Dairy Total Costs in the Dairy segment rose by 1.5%, from Ps. 133 million in fiscal year 2015 to Ps. 135 million in fiscal year 2016. The following table contains a breakdown of costs directly related toin the transformation of biological assets and agricultural produce.Dairy segment: | | Fiscal year 2016 | Fiscal year 2015 | | | In million Pesos | | Cost of sales | 61 | 68 | | Cost of production | 74 | 65 | | Total Costs | 135 | 133 |
Cost of Sales: Oursales in the Dairy segment fell by 10.3%, from Ps. 68 million in fiscal year 2015 to Ps. 61 million in fiscal year 2016, mainly as a consequence of: · a 42.3% increase in the cost of sales consistsof milking cows, from Ps. 10.9 per kg in fiscal year 2015 to Ps. 15.5 per kg in fiscal year 2016, · offset by an 8.6% decrease in the cost of Milk, from Ps. 3.5 per liter in fiscal year 2015 to Ps. 3.2 per liter in fiscal year 2016, · a 17.7% reduction in the sales volume of milking cows; · an 8.2% decrease in milk sales volume. Costs of production in the Dairy segment increased by 14.7%, from Ps. 65 million in fiscal year 2015 to Ps. 74 million in fiscal year 2016. This increase was primarily attributable to the impact of increased feeding, health and prairie costs. Sugarcane Total Costs in the Sugarcane segment rose by 38.9%, from Ps. 368 million in fiscal year 2015 to Ps. 511 million in fiscal year 2016. The following table contains a breakdown of costs in the Sugarcane segment: | | Fiscal year 2016 | Fiscal year 2015 | | | In million Pesos | | Cost of sales | 263 | 188 | | Cost of production | 248 | 180 | | Total Costs | 511 | 368 |
Costs of sales in the Sugarcane segment rose by 39.9%, de Ps. 188 million in fiscal year 2015 to Ps. 263 million in fiscal year 2016, mainly as a consequence of: (i)· an increase of 295,226 tons of sugarcane sold in fiscal year 2016 compared to the book valueprevious fiscal year, primarily attributable to our subsidiary Brasilagro; and · an increase in the average cost per ton of sugarcane sold in fiscal year 2016, from Ps. 204 per ton in fiscal year 2015 to Ps. 216 per ton in fiscal year 2016. Costs of sales as a percentage of sales was 94.9% in fiscal year 2015 and 89.5% in fiscal year 2016. The cost of production of the product sold atSugarcane segment increased 37.8%, from Ps. 180 million in fiscal year 2015 to Ps. 248 million in fiscal year 2016, mainly as a result of a higher production volume in fiscal year 2016 compared to the time of sale; andfiscal year 2015. (ii) certain directTotal production costs per ton increased by 4.1%, from Ps. 194 per ton in fiscal year 2015 to Ps. 202 per ton in fiscal year 2016.
Agricultural Rental and Services Total Costs in the Agricultural Rental and Services segment shrank by 4.8%, from Ps. 21 million in fiscal year 2015 to Ps. 20 million in fiscal year 2016, mainly as a consequence of: · a Ps. 2 million (42.3%) reduction in irrigation service costs, compared to Fiscal year 2015. · Partially offset by an increase of Ps. 1 million in feedlot lease and services costs, in Brasilagro and Cresud, respectively.
Land Transformation and Sales Total Costs in the Land Transformation and Sales segment remained stable at Ps. 9 million in both fiscal years. Agro-industrial Total Costs in the Agro-industrial segment rose by 25.2%, from Ps. 739 million in fiscal year 2015 to Ps. 925 million in fiscal year 2016, due to an inflationary context that hindered the increase in gross marginal contribution. The reason for this increase is to be found in the increase of costs to acquire Cattle and to a lesser extent in the increase in labor. Others segments Total Costs in the Others segments rose by 33.3%, from Ps. 105 million in fiscal year 2015 to Ps. 140 million in fiscal year 2016, primarily as a result of increased costs in the brokerage business related to commodity trading transactions through FyO, and increased costs for consignment, by 71.4% and 97.2%, respectively. Urban Properties and Investments Business | | | Fiscal year ended June 30 2016 | | Costs | | Statement of Income | Interests in joint ventures | Inter-segment eliminations | Maintenance Fee and Common Advertising Funds | Segment reporting | | | | (in million of Ps.) | | Operations Center in Argentina | | | | | | | | Shopping Centers | | (1,505) | (5) | (6) | 1,113 | (403) | | Offices and Others | | (139) | (8) | - | 94 | (53) | | Sales and Developments | | (15) | (5) | - | - | (20) | | Hotels | | (362) | - | - | - | (362) | | International | | - | - | - | - | - | | Financial Operations and Others | | (1) | - | - | - | (1) | | Total Operations Center in Argentina | | (2,022) | (18) | (6) | 1,207 | (839) | | | | | | | | | | Operations Center in Israel | | | | | | | | Real Estate | | (837) | - | - | - | (837) | | Supermarkets | | (13,925) | - | - | - | (13,925) | | Agrochemicals | | - | - | - | - | - | | Telecommunications | | (4,525) | - | - | - | (4,525) | | Insurance | | - | - | - | - | - | | Other | | (1,194) | - | - | - | (1,194) | | Total Operations Center in Israel | | (20,481) | - | - | - | (20,481) | | Total Urban Properties and Investments Business | | (22,503) | (18) | (6) | 1,207 | (21,320) | | | | Fiscal year ended June 30 2015 | | Costs | | Statement of Income | Interests in joint ventures | Inter-segment eliminations | Maintenance Fee and Common Advertising Funds | Segment reporting | | | | (in million of Ps.) | | Operations Center in Argentina | | | | | | | | Shopping Centers | | (1,103) | (4) | (4) | 820 | (291) | | Offices and Others | | (110) | (5) | - | 79 | (36) | | Sales and Developments | | (14) | (5) | - | - | (19) | | Hotels | | (279) | - | - | - | (279) | | International | | (9) | - | - | 2 | (7) | | Financial Operations and Others | | (1) | - | - | - | (1) | | Total Urban Properties and Investments Business | | (1,516) | (14) | (4) | 901 | (633) |
Costs of sales in our Urban Properties and Investments Business rose by 1,384.4%, from Ps. 1,516 million in fiscal year 2015 to Ps. 22,503 million in fiscal year 2016, of which Ps. 20,481 million are derived from the Operation Center in Israel, and Ps. 2,022 million are derived from the Operation Center in Argentina. Considering Operation Center in Argentina variation was due to an increase of Ps. 402 million in the Shopping Center segment, an increase of Ps. 29 million in the Offices and Others segment, a Ps. 1 million increase in the Sales and Developments segment, an increase of Ps. 83 million in the Hotels segment, offset by a Ps. 9 million decrease in the International segment; whilst the Financial Operations and Others segments did not experience significant variations.
In turn, the costs corresponding to maintenance fees and Common Advertising Funds costs increased 34.0%, from Ps. 901 million in fiscal year 2015 to Ps. 1,207 million in fiscal year 2016 mainly due to the maintenance fees and Common Advertising Funds expenses afforded by the Shopping Center, which rose by 35.7%, from Ps. 827 million during fiscal year 2015 to Ps. 1,113 million during fiscal year 2016, as a consequence of: (i) an increase in advertising expenses of Ps. 112 million, (ii) an increased charge for salaries and wages, social security contributions and other payroll expenses amounting to Ps. 103 million; (iii) an increase in maintenance, security, cleaning, repair and similar expenses amounting to Ps. 101 million (mainly stemming from increases in security and cleaning services and in the rates for public utilities), (iv) an increase in taxes, rates and contributions and other expenses amounting to Ps. 25 million and (v) an increase in other expenses for Ps. 42 million (primarily due to the absorption of the deficit in Common Advertising Funds and common maintenance fees). In addition, the variation was due to: II) an increase in the Common maintenance fees expenses incurred by the Offices and Others segment, which rose by Ps. 54 million, up from Ps. 28 million during fiscal year 2015 to Ps. 82 million during fiscal year 2016, primarily attributable to the acquisition of new buildings (maintenance, cleaning and lease expenses and common maintenance fees and other for Ps. 36 million, expenses associated to salaries and wages and social security contributions for Ps. 11 million and taxes, rates and contributions and utilities for Ps. 9 million). In addition, costs from our joint ventures experienced a net decrease of 28.6%, down from Ps. 14 million during fiscal year 2015 to Ps. 18 million during fiscal year 2016. Finally, costs from inter-segment operations rose by 50.0%, up from Ps. 4 million during fiscal year 2015 to Ps. 6 million during fiscal year 2016. Hence, according to the business segment information relayed in the framework of segment reporting and considering all our joint ventures, and the Inter-segment eliminations, costs rose by 3268.1%, up from Ps. 633 million in fiscal year 2015 to Ps. 21,320 million in fiscal year 2016 (of which Ps. 20,481 million are attributable to the Operation Center in Israel and Ps. 839 million to the Operation Center in Argentina). Without considering the costs from the Operation Center in Israel, costs rose by 32.5%. Operation Center in Argentina Shopping Centers Costs in the Shopping Centers segment rose by 38.5%, from Ps. 291 million during fiscal year 2015 to Ps. 403 million during fiscal year 2016. The reasons for this increase are to be found mainly in: (i) an increased charge for depreciations and amortizations in the amount of Ps. 56 million; (ii) an increased cost corresponding to rentals and common maintenance fees in the amount of Ps. 30 million; (iii) an increase in maintenance, security, cleaning, repair and similar expenses for Ps. 10 million (mainly stemming from increases in security and cleaning services and in the rates for public utilities); and (iv) an increase of salaries and wages, social security contributions and other payroll expenses in the amount of Ps.10 million, amongst other items. Costs in the Shopping Centers segment, measured as a percentage of the revenues derived from this segment rose from 16.4% during fiscal year 2015 to 16.7% in the fiscal year ended on June 30, 2016. Offices and Others Total Costs in the Offices and Others segment rose by 47.2%, from Ps. 36 million during fiscal year 2015 to Ps. 53 million during fiscal year 2016. (i) an increase in maintenance, security, cleaning, repair and similar expenses in the amount of Ps. 7 million; (ii) an increased cost corresponding to rentals and common maintenance fees for Ps. 6 million and; (iii) an increased charge for depreciations and amortizations in the amount of Ps. 5 million. This variation is affected by the partial sales of investment properties for rental that took place during fiscal year 2016. Costs attributable to non-comparable properties rose by 4.0%, from Ps. 9 million to Ps. 10 million. In turn, the costs that consider comparable properties in both fiscal years for failure to submit partial sales rose by 76.8%, from Ps. 24 million to Ps. 42 million, primarily attributable to increased maintenance costs. Total Costs in the Offices and Others segment, measured as a percentage of the revenues derived from this segment, rose from 10.8% during fiscal year 2015 to 15.6% during fiscal year 2016. Sales and Developments Costs attributable to this segment often vary significantly period over period, given that some of the sales consummated by us are non-recurrent. Without considering our joint ventures, costs associated to our Sales and Developments segment rose by 7.1%, from Ps. 14 million during fiscal year 2015 to Ps. 15 million during fiscal year 2016. Costs in the Sales and Developments segment, measured as a percentage of agricultural producethe revenues derived from this segment, rose from 135.7% during fiscal year 2015 to 666.7% during fiscal year 2016. Hotels Costs in the Hotels segment increased by 29.7%, from Ps. 279 million during fiscal year 2015 to Ps. 362 million during fiscal year 2016, mainly as a consequence of: · an increase of Ps. 52 million in salaries and wages, social security contributions and other selling expenses.payroll expenses; · an increase of Ps. 19 million in maintenance and repair expenses and; · increased charges for Ps. 7 million and Ps. 5 million as fees for services and as food, beverages and other hotel expenses, respectively. Costs in the Hotels segment, measured as a percentage of the revenues derived from this segment decreased from 70.5% during fiscal year 2015 to 67.8% during fiscal year 2016. International Costs in the International segment shrank by 100%, compared to the Ps. 7 million posted during fiscal year 2015 on account of the sale consummated in the year 2015 of the Madison 183 building which was previously held as a rental property. Costs in the Financial Transaction and Others segments, measured as a percentage of the revenues derived from this segment do not exhibit significant percentage figures.
Financial Operations and Others Costs in the Financial Operations and Others segments remained stable at Ps. 1 million in both fiscal years. Costs in the Financial Operations and Others, measured as a percentage of the revenues derived from this segment do not exhibit significant percentage figures. Operations Center in Israel Real Estate. During fiscal year 2016, costs from the Real Estate segment totaled Ps. 837 million. Costs, as a percentage of the revenues, amounted to 54.4%. Supermarkets. During fiscal year 2016, costs from the Supermarkets segment totaled Ps. 13,925 million. Costs, as a percentage of the revenues, amounted to 74.8%. Telecommunications. During fiscal year 2016, costs from the Telecommunications segment totaled Ps. 4,525 million. Costs, as a percentage of the revenues derived from this segment, amounted to 68.0%. Others. During fiscal year 2016, costs from the Others segment totaled Ps. 1,194 million. Costs, as a percentage of the revenues derived from this segment, amounted to 83.7%. Initial recognition and changes in the fair value of biological assets and agricultural produceproducts at the point of harvest | | | Fiscal year ended June 30, 2016 | | Initial recognition and changes in the fair value of biological assets and agricultural products at the point of harvest | | Statement of Income | Interests in joint ventures | Inter-segment eliminations | Segment reporting | | | | (in million of Ps.) | | Crops | | 1,017 | 54 | - | 1,071 | | Cattle | | 251 | 3 | - | 254 | | Dairy | | 74 | - | - | 74 | | Sugarcane | | 318 | - | - | 318 | | Agricultural Production Subtotal | | 1,660 | 57 | - | 1,717 | | Land Transformation and Sales | | - | - | - | - | | Agro-industrial | | - | - | - | - | | Others segments | | - | - | - | - | | Agricultural rental and Services | | - | - | - | - | | Subtotal Others | | - | - | - | - | | Total Agricultural Business | | 1,660 | 57 | - | 1,717 |
| | | Fiscal Year ended June 30, 2015 | | Initial recognition and changes in the fair value of biological assets and agricultural products at the point of harvest | | Statement of Income | Interests in joint ventures | Inter-segment eliminations | Segment reporting | | | | (in million of Ps.) | | Crops | | 897 | 21 | - | 918 | | Cattle | | 165 | 2 | - | 167 | | Dairy | | 75 | - | - | 75 | | Sugarcane | | 187 | - | - | 187 | | Agricultural Production Subtotal | | 1,324 | 23 | - | 1,347 | | Land Transformation and Sales | | - | - | - | - | | Agro-industrial | | - | - | - | - | | Others segments | | - | - | - | - | | Agricultural rental and Services | | - | - | - | - | | Subtotal Others | | - | - | - | - | | Total Agricultural Business | | 1,324 | 23 | - | 1,347 |
Our revenues from Initial recognition and changes in the fair value of biological assets and agricultural products at the point of harvest increased 25.4%, from Ps. 1,324 million in fiscal year 2015 to Ps. 1,660 million in fiscal year 2016. In turn, our revenues from Initial recognition and changes in the fair value of biological assets and agricultural products at the point of harvest derived from our interests in joint ventures increased 147.8% from Ps. 23 million in fiscal year 2015 to Ps. 57 million in fiscal year 2016. In addition, there were no inter-segment eliminations in connection with revenues from Initial recognition and changes in the fair value of biological assets and agricultural products at the point of harvest. BiologicalHence, according to business segment reporting and considering all our joint ventures, revenues from Initial recognition and changes in the fair value of biological assets and agricultural produceproducts at the point of harvest are accountedgrew by 27.5%, from Ps. 1,347 million in fiscal year 2015 to Ps. 1,717 million in fiscal year 2016.
Crops Income from production in the Crops segment rose by 16.7%, from Ps. 918 million in fiscal year 2015 to Ps. 1,071 million in fiscal year 2016, mainly as a consequence of: · a 38.8% decrease in total production, from 405,882 tons in fiscal year 2015 down to 248,435 tons in fiscal year 2016; · partially offset by a 33.8% increase in the average Price for the production of Crops; and · a 654.1% increase in the expected revenues. As of June 30, 2016, the harvested area was 97.1% of our total sown area, compared to 100% as of June 30, 2015. The following table shows the number of tons produced and total production income as of June 30, 2016 and 2015: Revenues from the production of Crops (in tons and million Pesos) | | Fiscal year ended June 30, | | | 2016 | 2015 | | | Tons | Pesos | Tons | Pesos | | Corn | 55,475 | 82 | 92,093 | 84 | | Soybean | 169,592 | 520 | 279,356 | 625 | | Wheat | 16,181 | 11 | 16,211 | 13 | | Sorghum | 829 | 1 | 1,202 | 1 | | Sunflower | 3,056 | 9 | 11,720 | 27 | | Other | 3,302 | 8 | 5,300 | 20 | | Total | 248,435 | 631 | 405,882 | 770 |
Estimated results from the valuation of our crops in progress at fair value lessrose by 654.1%, from Ps. 49 million in fiscal year 2015 to Ps. 369 million in fiscal year 2016, due to the cost722.4% increase in corn crops. Cattle Income from production in the Cattle segment rose by 52.1%, from Ps. 167 million in fiscal year 2015 to Ps. 254 million in fiscal year 2016, mainly as a consequence of: · a 19.3% increase in the average price per kilogram produced, from Ps. 14.8 per kilogram in fiscal year 2015 to Ps. 17.6 per kilogram in fiscal year 2016; · a slight 1.6% decrease in beef production, from 7,905 tons in fiscal year 2015 to 7,781 tons in fiscal year 2016; · offset by a 137.2% increase in holding results. The calving rate decreased by 12.1%, whereas the death rate decreased by 4.4% during fiscal year 2016 compared to fiscal year 2015. The number of sales, upon their initial recognitionhectares devoted to Cattle production decreased from 88,643 hectares in fiscal year 2015 to 85,392 hectares in fiscal year 2016, due to a smaller number of leased land devoted to Cattle production. Dairy Income from production in the Dairy segment decreased by 1.3%, from Ps. 75 million in fiscal year 2015 to Ps. 74 million in fiscal year 2016. This decrease was mainly due to: · the result from holding of milking cows, which increased by 46.9%, up from a gain of Ps. 8.9 million in fiscal year 2015 to a gain of Ps. 13.1 million in fiscal year 2016, as the inflationary context led to a significant rise in prices;
· a 7.8% decrease in the average price of milk, from Ps. 3.42 per liter in fiscal year 2015 to Ps. 3.15 per liter in fiscal year 2016; · a 6.2% decrease in the production of milking cows offset by a 78.6% increase in average price, · a 7.1% decrease in the milk production volume, from 17.5 million of liters in fiscal year 2015 to 16.3 million of liters during this fiscal year. This reduction in production volume was mainly due to a lower average number of milking cows per day, from 2,189 milking cows per day in fiscal year 2015 to 1,788 milking cows per day in fiscal year 2016, partially offset by a 10.8% increase in the efficiency level of average daily milk production per cow, from 21.5 liters per cow in fiscal year 2015 to 23.8 liters per cow in fiscal year 2016. Sugarcane Income from production in the Sugarcane segment rose by 70.1%, from Ps. 187 million in fiscal year 2015 to Ps. 318 million in fiscal year 2016, mainly as a consequence of: · a 32.4% increase in total production volume from 928,273 tons in fiscal year 2015 to 1,228,830 tons in fiscal year 2016; and · a 19.0% increase in the average production price of sugarcane. The 32.4% increase in the production volume from the Sugarcane segment was attributable to a 19.0% increase in the average price of production, which went from Ps. 199.5 per ton up to Ps. 237.4 per ton in fiscal year 2016. The following table shows the actual tons produced and income as of each balance sheet date, except where theirJune 30, 2016 and 2015: Revenues from the production of Sugarcane (In tons and million Pesos) | | Fiscal year ended June 30, | | | 2016 | 2015 | | | Tons | Pesos | Tons | Pesos | | Sugarcane | 1,228,830 | 292 | 928,273 | 185 |
Estimated results from the valuation of our sugarcane crops in progress at fair value cannot be reliably measured. Biological assets and agricultural produce Estimated results from the valuation of our sugarcane crops in progress at the point of harvest are measured at their approximate cost where few or no transformations have taken place since costs were originally incurred or where the impact on the biological transformation price is not expected to be material. Changes in fair value lessincreased significantly from a gain of Ps. 2 million in fiscal year 2015 to Ps. 27 million in fiscal year 2016 mainly generated by Brasilagro. This variation originated mainly in Brazil, and was caused by the costfollowing factors: · the number of sales are chargedestimated hectares went up from a year-on-year increase of 33.4% in fiscal year 2015 to income as incurred.a year-on-year increase of 0.4% in fiscal year 2016; · the estimated yields went up from a year-on-year increase of 2.4% in the fiscal year 2015 to a year-on-year increase of 3.2% for the fiscal year 2016; and · the estimated unit costs went down from a year-on-year increase of 10.0% in fiscal year 2015 to a year-on-year increase of 6.4% in fiscal year 2016. Changes in the net realizable value of agricultural produceproducts after harvest Our gain (loss)| | | Fiscal year ended June 30, 2016 | | Changes in the net realizable value of agricultural products after harvest | | Statement of Income | Interests in joint ventures | Inter-segment eliminations | Segment reporting | | | | (in million of Ps.) | | Crops | | 208 | - | - | 208 | | Cattle | | - | - | - | - | | Dairy | | - | - | - | - | | Sugarcane | | - | - | - | - | | Agricultural Production Subtotal | | 208 | - | - | 208 | | Land Transformation and Sales | | - | - | - | - | | Agro-industrial | | - | - | - | - | | Others segments | | - | - | - | - | | Agricultural rental and Services | | - | - | - | - | | Subtotal Others | | - | - | - | - | | Total Agricultural Business | | 208 | - | - | 208 |
| | | Fiscal Year ended June 30 2015 | | Changes in the net realizable value of agricultural products after harvest | | Statement of Income | Interests in joint ventures | Inter-segment eliminations | Segment reporting | | | | (in million of Ps.) | | Crops | | (34) | - | - | (34) | | Cattle | | - | - | - | - | | Dairy | | - | - | - | - | | Sugarcane | | - | - | - | - | | Agricultural Production Subtotal | | (34) | - | - | (34) | | Land Transformation and Sales | | - | - | - | - | | Agro-industrial | | - | - | - | - | | Others segments | | - | - | - | - | | Agricultural rental and Services | | - | - | - | - | | Subtotal Others | | - | - | - | - | | Total Agricultural Business | | (34) | - | - | (34) |
Income from holding inventories consistsChanges in the net realizable value of agricultural products after harvest increased significantly, from a loss of Ps. 34 million in fiscal year 2015 to income for Ps. 208 million in fiscal year 2016. In Argentina, it stems above all from a widespread price increase in late December caused by the suppression/reduction of withholdings on the agricultural industry, the major devaluation determined by the new government and today’s current free floating exchange rate market. There were neither interest in joint ventures nor inter-segment eliminations in income from changes in their carrying amount.the net realizable value of agricultural products after harvest. Gross profit As a result of the above mentioned factors, our gross profit increased 408.8%, from Ps. 2,203 million in fiscal year 2015 to Ps. 11,209 million in fiscal year 2016, which was primarily attributable to: · a 251.6% increase in the Agricultural Business, from income for Ps. 289 million in fiscal year 2015 to income for Ps. 1,016 million in fiscal year 2016; · income for Ps. 7,748 provided by the Operation Center in Israel at the Urban Properties and Investments Business; and · a 27.7% increase in the Operation Center in Argentina at the Urban Properties and Investments Business, from Ps. 1,914 million in fiscal year 2015 to Ps. 2,445 million in fiscal year 2016. Agricultural Business As a result of the above mentioned factors, gross profit increased by 251.6%, from Ps. 289 million in fiscal year 2015 to Ps. 1,016 million in fiscal year 2016. Crops Gross profit from this segment increased by 1,088.5%, from Ps. 52 million in fiscal year 2015 to Ps. 618 million in fiscal year 2016. Cattle Gross profit from this segment increased by 92.9%, from Ps. 85 million in fiscal year 2015 to Ps. 164 million in fiscal year 2016. Dairy Gross profit from this segment decreased by 71.4%, from Ps. 14 million in fiscal year 2015 to Ps. 4 million in fiscal year 2016. Sugarcane Gross profit from this segment increased by 494.1%, from Ps. 17 million in fiscal year 2015 to Ps. 101 million in fiscal year 2016. Agricultural Rental and Services Gross profit from this segment increased by 45.0%, from Ps. 40 million in fiscal year 2015 to Ps. 58 million in fiscal year 2016. Land Transformation and Sales Gross loss from this segment remained stable at Ps. 9 million in both fiscal years. Agro-industrial Gross profit from this segment decreased by 38.8% from Ps. 67 million in fiscal year 2015 to Ps. 41 million in fiscal year 2016. Other Gross profit from this segment increased by 69.6%, from Ps. 23 million in fiscal year 2015 to Ps. 39 million in fiscal year 2016.
Urban Properties and Investments Business ShoppingGross profit in Urban Properties and Investments Business rose by 432.5% from Ps. 1,914 million in fiscal year 2015 to Ps. 10,193 million in fiscal year 2016. This was mainly due to the income obtained through the Operation Center Properties
Revenues derivedin Israel for Ps. 7,748 million and a 27.7% increase in the Operation Center in Argentina, from our shopping center development activities are mostly comprised by revenues from operation leases, admission fees, commissions and revenues from several services renderedPs. 1,914 million in fiscal year 2015 to our lessees. In addition, certain lease agreements include provisions that set forth variable rentals based on specific sales volumes or some other type of index.
Revenues include revenues from managed operations, such as, parking lots. Revenues also include revenues from property management.Ps. 2,445 million in fiscal year 2016.
Offices Operation Center in Argentina Revenues from office and other property rentals include rental income from offices under operating leases, revenues
Shopping Center Gross profit from the recoveryShopping Centers segment increased by 34.7% up from Ps. 1,487 million for the fiscal year 2015 to Ps. 2,003 million during fiscal year 2016 mainly due to an increase in our tenants’ total sales, resulting in higher lease payments as a percentage of services and expenses paid by tenants.volume sales. Gross profit from the Shopping Centers segment as a percentage of this segment’s revenues experienced a slight decline from 83.6% during fiscal year 2015 to 83.3% during fiscal year 2016. Sale
Offices and Development of PropertiesOthers RevenuesGross profit from the saleOffices and developmentOthers segment fell by 3.4% from Ps. 297 million for the fiscal year 2015 down to Ps. 287 million in fiscal year 2016. Gross profit for the Offices and Others segment as a percentage of properties include the gains derivedthis segment’s revenues decreased from 89.2% during fiscal year 2015 to 84.4% during fiscal year 2016.
Sales and Developments Gross income/(loss) from the developmentsSales and the proceedsDevelopments segment rose by 240.0% from the salea loss of commercialPs. 5 million for fiscal year 2015 to a loss of Ps. 17 million during fiscal year 2016, mainly due to lower sales accounted for during fiscal year 2016 and an increase in maintenance and preservation costs in connection with these properties. Hotels RevenuesGross profit from hotel operations include mainly room services, cateringthe Hotels segment increased by 47.0% up from Ps. 117 million for the fiscal year 2015 to Ps. 172 million during fiscal year 2016. Gross profit for the Hotels segment, as a percentage of this segment’s revenues, rose from 29.5% during fiscal year 2015 to 32.2% during fiscal year 2016.
International Gross profit from the International segment decreased by 100%, compared to the Ps. 19 million posted during fiscal year 2015. Financial Operations and other services.Others There were no significant variations between the Income/(loss) from our Financial Operations and Others segment between the periods presented. Operations Center in Israel Real Estate. During fiscal year 2016, gross profit from the Real Estate segment totaled Ps. 701 million. Gross profit, as a percentage of the segment revenues, amounted to 45.6%. Supermarkets. During fiscal year 2016, gross profit from the Supermarkets segment totaled Ps. 4,685 million. Gross profit, as a percentage of the segment revenues, amounted to 25.2%. Shufersal’s results in the first half of the calendar year 2016 were affected by the following key factors: · Continued increased efficiency with respect to real estate. · Gradual launch of the new logistical center in Shoham, which began operating in February 2016. · Shufersal is continuing to prepare strategies for various scenarios in connection with the change in ownership of the Mega chain in the city centers. · Continued acceleration of the development of Shufersal’s digital platform, which primarily included the Shufersal Online, including the opening of designated warehouses. · Continued building of its private brand. Telecommunications. During fiscal year 2016, gross profit from the Telecommunications segment totaled Ps. 2,130 million. Gross profit, as a percentage of the segment revenues, amounted to 32.0%. Others. During fiscal year 2016, gross profit from the Others segment totaled Ps. 232 million. Gross profit, as a percentage of the segment revenues, amounted to 16.3%.
Gain from disposal of investment properties Gain from disposal of investment properties derived from our Sales and Developments segment experienced a 4.3% decrease from Ps. 1,150 million during fiscal year 2015 to Ps. 1,101 million during fiscal year 2016 (of which Ps. 1,056 million are attributable to the Operation Center in Argentina and Ps. 45 million to Operation Center in Israel). Without considering the effect of the Operation Center in Israel, total gain from the disposal of investment properties fell by 8.2%. Gain from disposal of farmlands Gain from disposal of farmlands derived from the Land Transformation and Sales segment decreased by 100.4%, from income for Ps. 570 million in fiscal year 2015 to a loss of Ps. 2 million in fiscal year 2016, primarily as a result of the absence of sales in this fiscal year and the following transactions in the preceding fiscal year: During fiscal year 2015 · On April 3, 2014, Cresca S.A. executed a deed of sale for an area of 24,624 hectares located in Chaco Paraguayo. The total price was US$ 14.7 million paid as follows: US$ 1.8 million was cashed upon the execution of the deed of sale; US$ 4.3 million at the time of the title conveyance; US$ 3.7 million on July 2015 interest-free; and US$ 4.9 million on July 2016 interest-free. Possession was surrendered upon the execution of the title deed and upon the creation of a mortgage as guarantee of the remaining balance on July 14, 2014. We recorded a gain of Ps. 19.1 million as a result of this transaction. · On June 10, 2015, Brasilagro sold the remaining area of 27,745 hectares of the Cremaq farm located in the municipal district of Baixa Grande do Ribeiro (Piaui). The transaction price was Rs. 270 million (equivalent to Ps. 694 million) which was fully paid. We recorded a gain of Ps. 525.9 million as a result of this transaction. · On October 17, 2013, Yuchán Agropecuaria executed an agreement providing for the sale, subject to retention of title, of a 1,643 hectare property in the “La Fon II” farm for a total price of US$ 7.21 million (equivalent to Ps. 59.0 million). As of the date of issuance of these financial statements, the amount of US$ 7.1 million was cashed, with the remaining balance of US$ 0.12 million being payable in two installments beginning in December this year and ending in December 2017. The agreement provides that title conveyance will be registered once the full price has been paid. On June 24, 2015, Yuchán Agropecuaria surrendered the possession of the property. We recorded a gain of US$ 2.7 million (equivalent to Ps. 24.6 million) as a result of this transaction in the fiscal year 2015. General and Administrative Expenses Our General and Administrative Expenses rose by 260.9%, from Ps. 625 million in fiscal year 2015 to Ps. 2,255 million in fiscal year 2016. This was mainly due to an increase of Ps. 67 million in the Agricultural business and an increase of Ps. 1,563 million in the Urban Properties and Investments Business. Within the Urban Properties and Investments Business the Variation is attributable to the Operation Center in Israel for Ps. 1,387 and to the Operation Center in Argentina for Ps. 176. Agricultural Business | | | Fiscal year ended June 30, 2016 | | General and Administrative Expenses | | Statement of Income | Interests in joint ventures | Inter-segment eliminations | Segment reporting | | | | (in million of Ps.) | | Crops | | (171) | (3) | - | (174) | | Cattle | | (40) | - | - | (40) | | Dairy | | (8) | - | - | (8) | | Sugarcane | | (34) | - | - | (34) | | Agricultural Production Subtotal | | (253) | (3) | - | (256) | | Land Transformation and Sales | | (1) | - | - | (1) | | Agro-industrial | | (38) | - | - | (38) | | Others segments | | (15) | - | - | (15) | | Agricultural rental and Services | | (4) | - | - | (4) | | Subtotal Others | | (57) | - | - | (57) | | Total Agricultural Business | | (311) | (3) | - | (314) |
| | | Fiscal Year ended June 30, 2015 | | General and Administrative Expenses | | Statement of Income | Interests in joint ventures | Inter-segment eliminations | Segment reporting | | | | (in million of Ps.) | | Crops | | (156) | (3) | - | (159) | | Cattle | | (26) | - | - | (26) | | Dairy | | (5) | - | - | (5) | | Sugarcane | | (20) | - | - | (20) | | Subtotal Agricultural production | | (207) | (3) | - | (210) | | Land Transformation and Sales | | (2) | - | - | (2) | | Agro-industrial | | (25) | - | - | (25) | | Others segments | | (8) | - | - | (8) | | Agricultural rental and Services | | (2) | - | - | (2) | | Subtotal Others | | (35) | - | - | (35) | | Total Agricultural Business | | (244) | (3) | - | (247) |
General and Administrative Expenses from the Agricultural business sales rose by 27.5%, from Ps. 244 million in fiscal year 2015 to Ps. 311 million in fiscal year 2016. This was due to the following increases: Ps. 14 million in the Crops segment, Ps. 15 million in the Cattle segment, Ps. 3 million in the Dairy segment, Ps. 14 million in the Sugarcane segment, Ps. 13 million in the Agro-industrial segment, Ps. 2 million in the Agricultural rental and Services segment and Ps. 7 million corresponding to Others segments.
The causes for the variation were: · The variation in Cresud’s administrative expenses is mostly due to the variation in wages, salaries and social security contributions due to the allowance for bonuses payable for fiscal year 2016. In addition, the reason for the variation is to be found also in the increases exhibited by the fees of the accountants associated to the consolidation of IDBD as well as the increase in legal fees associated to the Class Action. · An increase in the General and Administrative Expenses of the subsidiary Sociedad Anónima Carnes Pampeanas primarily attributable to the increases in the services hired for the project to implement the SAP system, consultancy fees and SOX standard testing and salary adjustments due to collective bargaining agreements; and · an increase in expenses as a result of the inflationary context. In turn, general and administrative expenses from our joint ventures remained stable at Ps. 3 million during fiscal years 2016 and 2015. There were no General and Administrative Expenses incurred by reason of Inter-segment eliminations. Hence, according to business segment reporting and considering all our joint ventures, General and Administrative Expenses grew by 27.1%, up from Ps. 247 million in fiscal year 2015 to Ps. 314 million in fiscal year 2016. Urban Properties and Investments Business | | | Fiscal year ended June 30, 2016 | | General and Administrative Expenses | | Statement of Income | Interests in joint ventures | Inter-segment eliminations | Maintenance Fee and Common Advertising Funds | Segment reporting | | | | (in million of Ps.) | | Operations Center in Argentina | | | | | | | | Shopping Centers | | (178) | - | (1) | - | (179) | | Offices and Otherss | | (50) | - | - | - | (50) | | Sales and Developments | | (126) | (1) | (4) | - | (131) | | Hotels | | (101) | - | (2) | - | (103) | | International | | (91) | - | - | - | (91) | | Financial Operations and Others | | - | - | - | - | - | | Total Operations Center in Argentina | | (546) | (1) | (7) | - | (554) | | | | | | | | | | Operations Center in Israel | | | | | | | | Real Estate | | (100) | - | - | - | (100) | | Supermarkets | | (203) | - | - | - | (203) | | Agrochemicals | | - | - | - | - | - | | Telecommunications | | (708) | - | - | - | (708) | | Insurance | | - | - | - | - | - | | Other | | (376) | - | - | - | (376) | | Total Operations Center in Israel | | (1,387) | - | - | - | (1,387) | | Total Urban Properties and Investments Business | | (1,933) | (1) | (7) | - | (1,941) | | | | | | | | |
| | | Fiscal year ended June 30, 2015 | | General and Administrative Expenses | | Statement of Income | Interests in joint ventures | Inter-segment eliminations | Maintenance Fee and Common Advertising Funds | Segment reporting | | | | (in million of Ps.) | | Operations Center in Argentina | | | | | | | | Shopping Centers | | (135) | - | - | - | (135) | | Offices and Others | | (58) | - | (1) | - | (59) | | Sales and Developments | | (48) | (1) | (1) | - | (50) | | Hotels | | (77) | - | (1) | - | (78) | | International | | (56) | - | - | - | (56) | | Financial Operations and Others | | - | - | - | - | - | | Total Urban Properties and Investments Business | | (374) | (1) | (3) | - | (378) |
General and Administrative Expenses in connection with the sales of the Urban Properties and Investments Business segment rose by 416.8%, from Ps. 374 million in fiscal year 2015 to Ps. 1,933 million in fiscal year 2016, of which Ps. 1,387 million are derived from the Operation Center in Israel, and Ps. 546 million are derived from the Operation Center in Argentina. Considering Operation Center in Argentina variation was due to the Ps. 43 million increase in the Shopping Center segment, an increase of Ps. 78 million in the Sales and Developments segment, an increase of Ps. 24 million in the Hotels segment, an increase of Ps. 35 million in the International segment, all of which was partially offset by a decrease of Ps. 8 million in the segment Offices and Others. In turn, the administrative expenses of our joint ventures did not exhibit variations between the fiscal years 2015 and 2016 and remained stable at Ps. 1 million. Inter-segment eliminations increased Ps. 4 million, up from Ps. 3 million in fiscal year 2015 to Ps. 7 million in fiscal year 2016. Hence, according to business segment reporting and considering all our joint ventures and inter-segment eliminations, administrative expenses increased by 413.5% up from Ps. 378 million in fiscal year 2015 to Ps. 1,941 million in fiscal year 2016 (of which Ps. 1,387 million are attributable to the Operation Center in Israel and Ps. 554 million to the Operation Center in Argentina). Without considering the general & administrative expenses from the Operation Center in Israel, general & administrative expenses rose by 46.6%. Furthermore, general & administrative expenses as a percentage of revenues, pursuant to business segment reporting, declined from 14.8% during fiscal year 2015 to 6.2% during fiscal year 2016. Without considering the effect of the Israeli Operation Center in Israel, total general & administrative expenses as a percentage of revenues experienced increase from 14.8% during fiscal year 2015 to 16.9% during fiscal year 2016. Operations Center in Argentina Shopping Centers Administrative expenses in the Shopping Centers segment increased by 32.6%, up from Ps. 135 million during fiscal year 2015 to Ps. 179 million during fiscal year 2016, mainly as a consequence of: · a Ps. 18 million increase in salaries, wages, social security contributions and other payroll expenses; · an increase of Ps. 13 million in Directors’ fees; · an increase of Ps. 7 million in fees and compensation for services, to name but a few items. Administrative expenses in the Shopping Centers segment as a percentage of revenues from the same segment decreased slightly from 7.7% during fiscal year 2015 to 7.4% during fiscal year 2016. Offices and Others General and Administrative Expenses in our Offices and Others segment decreased by 15.3%, from Ps. 59 million during fiscal year 2015 to Ps. 50 million during fiscal year 2016, primarily as a consequence of: (i) a Ps. 12 million decrease in salaries, wages, social security contributions and other payroll expenses; partially offset by (ii) an increase in directors’ fees in the amount of Ps. 6 million, amongst others items. When measured as a percentage of revenues from the same segment, General and Administrative Expenses decreased by 17.7% during fiscal year 2015 to 14.7% during fiscal year 2016. Sales and Developments General and Administrative Expenses associated to our Sales and Developments segment rose by 162.0%, from Ps. 50 million during fiscal year 2015 to Ps. 131 million during fiscal year 2016, primarily as a consequence of: (i) an increase in salaries, wages, social security contributions and other payroll expenses of Ps. 26 million, (ii) an increase of Ps. 24 million in fees and compensation for services; (iii) and an increase in directors’ fees of Ps. 21 million, amongst others items. Hotels The General and Administrative Expenses associated to our Hotels segment increased by 32.1% from Ps. 78 million during fiscal year 2015 to Ps. 103 million during fiscal year 2016, mainly as a consequence of: · (i) an increase of Ps. 12 million in salaries and wages, social security contributions and others payroll expenses; · (ii) an increase of Ps. 6 million in the cost of fees from services, amongst other items. The General and Administrative Expenses associated to the Hotels segment measured as a percentage of the revenues derived from this segment shrank from 19.6% in fiscal year 2015 to 19.3% in fiscal year 2016. International General and Administrative Expenses associated to our International segment rose by Ps. 35 million, from Ps. 56 million during fiscal year 2015 to Ps. 91 million during fiscal year 2016 primarily attributable to fees for services incurred in connection with the investment in IDBD.
Financial Operations and Others. General and Administrative Expenses associated to our Financial Operations and Others segment did not exhibit variations for the periods disclosed. Operations Center in Israel Real Estate During fiscal year 2016, general & administrative expenses associated to the Real Estate segment totaled Ps. 100 million. General & administrative expenses as a percentage of the segment revenues amounted to 6.6%. Supermarkets During fiscal year 2016, general & administrative expenses associated to the Supermarkets segment totaled Ps. 203 million. General & administrative expenses as a percentage of the segment revenues amounted to 1.1%. Telecommunications During fiscal year 2016, general & administrative expenses associated to the Telecommunications segment totaled Ps. 708 million. General & administrative expenses as a percentage of the segment revenues amounted to 10.6%. Others During fiscal year 2016, general & administrative expenses associated to the Others segment totaled Ps. 376 million. General & administrative expenses as a percentage of the segment revenues amounted to 26.4%. Selling expenses Our total selling expenses grew by 1,207.3%, from Ps. 481 million in fiscal year 2015 to Ps. 6,288 million in fiscal year 2016. This was primarily attributable to an increase of Ps. 52 million in the Agricultural business and an increase of Ps. 5,755 million in the Urban Properties and Investments Business which accounts for the Ps. 69 million increase in the Operation Center in Argentina and the Ps. 5,686 million increase in the Operation Center in Israel. Agricultural Business | | | Fiscal year ended June 30, 2016 | | Selling expenses | | Statement of Income | Interests in joint ventures | Inter-segment eliminations | Segment reporting | | | | (in million of Ps.) | | Crops | | (209) | (5) | (2) | (216) | | Cattle | | (19) | - | - | (19) | | Dairy | | (4) | - | - | (4) | | Sugarcane | | (8) | - | - | (8) | | Agricultural Production Subtotal | | (240) | (5) | (2) | (247) | | Land Transformation and Sales | | - | - | - | - | | Agro-industrial | | (67) | - | - | (67) | | Others segments | | (23) | - | - | (23) | | Agricultural Rental and Services | | (1) | - | - | (1) | | Subtotal Others | | (91) | - | - | (91) | | Total Agricultural Business | | (331) | (5) | (2) | (338) |
| | | Fiscal Year ended June 30, 2015 | | Selling expenses | | Statement of Income | Interests in joint ventures | Inter-segment eliminations | Segment reporting | | | | (in million of Ps.) | | Crops | | (157) | (3) | (1) | (161) | | Cattle | | (20) | - | - | (20) | | Dairy | | (4) | - | - | (4) | | Sugarcane | | (8) | - | - | (8) | | Agricultural Production Subtotal | | (189) | (3) | (1) | (193) | | Land Transformation and Sales | | (1) | (1) | - | (2) | | Agro-industrial | | (77) | - | - | (77) | | Others segments | | (13) | - | - | (13) | | Agricultural Rental and Services | | (1) | - | - | (1) | | Subtotal Others | | (91) | - | - | (91) | | Total Agricultural Business | | (281) | (4) | (1) | (286) |
The Selling expenses associated to the sales of the Agricultural business rose by 17.8%, from Ps. 281 million in fiscal year 2015 to Ps. 331 million in fiscal year 2016. This was primarily due to the Ps. 52 million increase in the Crops segment and the Ps. 10 million increase in the Others segments, partially offset by a reduction of Ps. 1 million in the Cattle segment, and the Ps. 10 million decrease in the Agro-industrial segment. In turn, selling expenses from our interests in joint ventures rose by 25% from Ps. 4 million in fiscal year 2015 to Ps. 5 million in fiscal year 2016, in connection with our Cresca joint venture. Besides, Inter-segment eliminations rose Ps. 1 million in the fiscal year 2016 compared to the figure posted for 2015. Hence, according to the business segment details reported by segment and considering all our joint ventures and the Inter-segment eliminations, Selling expenses grew by 18.2%, up from Ps. 286 million in fiscal year 2015 to Ps. 338 million in fiscal year 2016. Urban Properties and Investments Business | | | Fiscal year ended June 30, 2016 | | | Selling expenses | | Statement of Income | Interests in joint ventures | Inter-segment eliminations | Segment reporting | | | | | (in million of Ps.) | | | Operations Center in Argentina | | | | | | | | Shopping Centers | | (143) | (2) | - | (145) | | | Offices and Others | | (12) | - | - | (12) | | | Sales and Developments | | (36) | - | - | (36) | | | Hotels | | (69) | - | - | (69) | | | International | | - | - | - | - | | | Financial Operations and Others | | (2) | - | - | (2) | | | Total Operations Center in Argentina | | (262) | (2) | - | (264) | | | | | | | | | | | Operations Center in Israel | | | | | | | | Real Estate | | (29) | - | - | (29) | | | Supermarkets | | (4,058) | - | - | (4,058) | | | Agrochemicals | | - | - | - | - | | | Telecommunications | | (1,493) | - | - | (1,493) | | | Insurance | | - | - | - | - | | | Other | | (106) | - | - | (106) | | | Total Operations Center in Israel | | (5,686) | - | - | (5,686) | | | Total Selling expenses | | (5,948) | (2) | - | (5,950) | | | | | Fiscal year ended June 30, 2015 | | | | | | | Selling expenses | | Statement of Income | Interests in joint ventures | Inter-segment eliminations | Segment reporting | | | | | (in million of Ps.) | | | Operations Center in Argentina | | | | | | | | Shopping Centers | | (112) | (1) | - | (113) | | | Offices and Others | | (21) | - | - | (21) | | | Sales and Developments | | (8) | (1) | - | (9) | | | Hotels | | (52) | - | - | (52) | | | International | | - | - | - | - | | | Financial Operations and Others | | - | - | - | - | | | Total Urban Properties and Investments Business | | (193) | (2) | - | (195) | | | | | | | | | |
The Selling expenses associated to the sales completed by the Urban Properties and Investments Business rose by 2,981.9% from Ps. 193 million in fiscal year 2015 to Ps. 5,948 million in fiscal year 2016 of which Ps. 5,686 million are derived from the Operation Center in Israel, and Ps. 262 million are derived from the Operation Center in Argentina. Considering Operation Center in Argentina variation was due to an increase of Ps. 31 million in the Shopping Center segment, an increase of Ps. 28 million in the Sales and Developments segment, an increase of Ps. 17 million in the Hotels segment and an increase of Ps. 2 million in the Financial Operations and Others segment, partially offset by a reduction of Ps. 9 million in the Offices and Others segment. In turn, selling expenses in our joint ventures did not exhibit a decrease in the fiscal years 2016 and 2015. Hence, according to business segment reporting, Selling expenses experienced 2,951.3% growth from Ps. 195 million during fiscal year 2015 to Ps. 5,950 million during fiscal year 2016 (of which Ps. 5,686 million are attributable to the Operation Center in Israel and Ps. 264 million to the Operation Center in Argentina). Without considering the effect of the Operation Center in Israel, selling expenses rose by 35.4%. Furthermore, selling expenses as a percentage of revenues, pursuant to business segment reporting, rose from 7.7% during fiscal year 2015 to 18.9% during fiscal year 2016. Without considering the effect of the Israeli Operating Center, selling expenses as a percentage of total revenues pursuant to business segment reporting, experienced a slight increase from 7.7% during fiscal year 2015 to 8.0% during fiscal year 2016.
Operations Center in Argentina Shopping Centers Selling expenses in the Shopping Centers segment increased by 28.3%, up from Ps. 113 million during fiscal year 2015 to Ps. 145 million during fiscal year 2016, primarily as a consequence of: (i) an increase in the charge for taxes, rates and contributions of Ps. 29 million, primarily generated by an increase in charges for gross income tax, amongst other items. Selling expenses measured as a percentage of revenues from the Shopping Centers segment, went down from 6.3 % during fiscal year 2015 to 6.0% during fiscal year 2016. Offices and Others The Selling expenses associated to our Offices and Others segment decreased by 42.9% down from Ps. 21 million in fiscal year 2015 to Ps. 12 million in fiscal year 2016. The Selling expenses associated to our Offices and Others segment, measured as a percentage of the revenues derived from this segment diminished by 6.3% in fiscal year 2015 to 3.5% in fiscal year 2016. Sales and Developments Selling expenses in the Sales and Developments segment rose by 300.0%, up from Ps. 9 million during fiscal year 2015 to Ps. 36 million during fiscal year 2016, primarily as a result of an increased charge for taxes, rates and contributions that amounts to Ps. 21 million, primarily generated by an increase in charges for gross income tax. Hotels The selling expenses associated to our Hotels segment rose by 32.7%, from Ps. 52 million during fiscal year 2015 to Ps. 69 million during fiscal year 2016, primarily attributable to: · a Ps. 6 million increase in the charge for taxes, rates and contributions and · an increase of Ps. 5 million in fees for services amongst other items. The selling expenses associated to our Hotels segment measured as a percentage of the revenues derived from this segment fell slightly down from 13% during fiscal year 2015 to 12.9% during fiscal year 2016. Financial Operations and Others Selling expenses in the Financial Operations and Others segment rose by Ps. 2 million during fiscal year 2016 compared to fiscal year 2015. Operations Center in Israel Real Estate During fiscal year 2016, selling expenses associated to the Real Estate segment totaled Ps. 29 million. Selling expenses as a percentage of the revenues derived from this segment amounted to 1.9%. Supermarkets During fiscal year 2016, selling expenses associated to the Supermarkets segment totaled Ps. 4,058 million. Selling expenses as a percentage of the revenues derived from this segment amounted to 21.8%. Telecommunications During fiscal year 2016, selling expenses associated to the Telecommunications segment totaled Ps. 1,493 million. Selling expenses as a percentage of the revenues derived from this segment amounted to 22.4%. Others During fiscal year 2016, selling expenses associated to the Others segment totaled Ps. 106 million. Selling expenses as a percentage of the revenues derived from this segment amounted to 7.4%. Other Operating results, net Our Other operating results, net decreased by Ps. 48 million, from income for Ps. 10 million in fiscal year 2015 to a loss for Ps. 38 million in fiscal year 2016. This was mainly due to an increase of Ps. 3 million in the Urban Properties and Investments Business in the Argentine Operating Center, offset by a Ps. 51 million decrease in the Agricultural business.
Agricultural Business | | | Fiscal year ended June 30, 2016 | | Other Operating results, net | | Statement of Income | Interests in joint ventures | Inter-segment eliminations | Segment reporting | | | | (in million of Ps.) | | Crops | | (72) | (1) | (1) | (74) | | Cattle | | (2) | - | - | (2) | | Dairy | | - | - | - | - | | Land Transformation and Sales | | - | - | - | - | | Sugarcane | | 4 | - | - | 4 | | Agricultural Production Subtotal | | (70) | (1) | (1) | (72) | | Agro-industrial | | 1 | - | - | 1 | | Others segments | | 1 | - | - | 1 | | Agricultural Rental and Services | | - | - | - | - | | Subtotal Others | | 2 | - | - | 2 | | Total Agricultural Business | | (68) | (1) | (1) | (70) |
| | | Fiscal Year ended June 30, 2015 | | Other Operating results, net | | Statement of Income | Interests in joint ventures | Inter-segment eliminations | Segment reporting | | | | (in million of Ps.) | | Crops | | (7) | (1) | (1) | (9) | | Cattle | | (2) | (1) | - | (3) | | Dairy | | (1) | - | - | (1) | | Sugarcane | | (2) | - | - | (2) | | Agricultural Production Subtotal | | (12) | (2) | (1) | (15) | | Land Transformation and Sales | | (5) | - | - | (5) | | Agro-industrial | | - | - | - | - | | Others segments | | 1 | - | - | 1 | | Agricultural Rental and Services | | - | - | - | - | | Subtotal Others | | 1 | - | - | 1 | | Total Agricultural Business | | (16) | (2) | (1) | (19) |
The Other operating results, net, associated to sales in the Agricultural business increased their losses up from Ps. 16 million in fiscal year 2015 to Ps. 68 million in losses for fiscal year 2016. This was primarily due to an increase of Ps. 65 million in losses in the Crops segment, partially offset by an increase of Ps. 6 million in the Sugarcane segment, Ps. 5 million in the segment Land Transformation and Sales, and Ps. 1 million in the Dairy and Agro-industrial segments. In turn, Other operating results, net from our interests in joint ventures experienced a decrease in loss equivalent to 50% of Ps. 2 million in fiscal year 2015 to Ps. 1 million in fiscal year 2016, associated to our joint venture Cresca. Besides, there have not been any variations in the Inter-segment eliminations for other operating results, net which remain at a loss of Ps. 1 million for both fiscal years. Hence, according to business segment reporting and considering all our joint ventures, Other operating results, net went from a loss of Ps. 19 million in fiscal year 2015 to a loss of Ps. 70 million in fiscal year 2016. Crops Other operating results, net, in the Crops segment experienced an increase in losses for Ps. 65 million, up from Ps. 9 million in losses for fiscal year 2015 to Ps. 74 million in losses for fiscal year 2016, primarily as a result of the derivatives of Brasilagro and Cresud commodities (Ps. 84 million), partially offset by the results generated by FyO (equivalent to income for Ps. 12 million). Sugarcane Other operating results, net in the Sugarcane segment rose by Ps. 6 million, up from a Ps. 2 million loss in fiscal year 2015 to income for Ps. 4 million in fiscal year 2016. Land Transformation and Sales Other operating results, net in the Land Transformation and Sales segment in fiscal year 2016 were no associated to expenses whilst losses for these expenses in fiscal year 2015 had amounted to Ps. 5 million. The rest of the segments of the Agriculture business did not exhibit significant changes.
Urban Properties and Investments Business | | | Fiscal year ended June 30, 2016 | | | Other Operating results, net | | Statement of Income | Interests in joint ventures | Inter-segment eliminations | Segment reporting | | | | | (in million of Ps.) | | | Operations Center in Argentina | | | | | | | | Shopping Centers | | (40) | (2) | - | (42) | | | Offices and Others | | (7) | - | 1 | (6) | | | Sales and Developments | | (16) | 4 | 4 | (8) | | | Hotels | | (2) | - | - | (2) | | | International | | 89 | - | - | 89 | | | Financial Operations and Others | | 1 | - | - | 1 | | | Total Operations Center in Argentina | | 25 | 2 | 5 | 32 | | | | | | | | | | | Operations Center in Israel | | | | | | | | Real Estate | | - | - | - | - | | | Supermarkets | | - | - | - | - | | | Agrochemicals | | - | - | - | - | | | Telecommunications | | - | - | - | - | | | Insurance | | - | - | - | - | | | Other | | - | - | - | - | | | Total Operations Center in Israel | | - | - | - | - | | | Total Other operating results, net | | 25 | 2 | 5 | 32 | | | | | | | | | | | | | Fiscal year ended June 30, 2015 | | Other Operating results, net | | Statement of Income | Interests in joint ventures | Inter-segment eliminations | Segment reporting | | | | | (in million of Ps.) | | | Operations Center in Argentina | | | | | | | | Shopping Centers | | (48) | (1) | - | (49) | | | Offices and Others | | (120) | 1 | 1 | (118) | | | Sales and Developments | | 13 | - | - | 13 | | | Hotels | | - | - | - | - | | | International | | 185 | - | - | 185 | | | Financial Operations and Others | | (2) | - | - | (2) | | | Total Urban Properties and Investments Business | | 28 | - | 1 | 29 | |
The Other operating results, net in the Urban Properties and Investments Business segment decreased by Ps. 3 million, up from a gain of Ps. 28 million in fiscal year 2015 to a gain of Ps. 25 million in fiscal year 2016 (attributable to the Operation Center in Argentina), primarily attributable to income for Ps. 113 million in the Offices and Others segment, partially offset by a reduction of Ps. 96 million in the International segment. The effect of consolidation in our joint ventures rose by Ps. 2 million primarily due to larger operating revenues in the joint ventures Baicom and Cyrsa, partially offset by operating expenses in the Puerto Retiro joint venture. Besides, Inter-segment eliminations rose by Ps. 4 million, up from Ps. 1 million in income for the fiscal year 2015 to Ps. 5 million in income for the fiscal year 2016. In accordance with the details from the business segment reported by segment and considering all our joint ventures and the Inter-segment eliminations, the Other operating results, net went from income for Ps. 29 million as net income for the fiscal year 2015 to income for Ps. 32 million in the fiscal year 2016 (allocated to the Operation Center in Argentina).. Operation Center in Argentina Shopping Centers The net loss stemming from Other operating results in the Shopping Centers segment shrank by 14.3%, down from Ps. 49 million during fiscal year 2015 to Ps. 42 million during fiscal year 2016, primarily as a consequence of a smaller charge for lawsuits and contingencies of Ps. 8 million. The net loss stemming from Other operating results, measured as a percentage of revenues from the Shopping Centers segment, diminished from 2.7% during fiscal year 2015 to 1.7% during fiscal year 2016.
Offices and Others The net loss stemming from Other operating results associated to our Offices and Others segment decreased by Ps. 112 million, down from Ps. 118 million during fiscal year 2015 to Ps. 6 million during fiscal year 2016, primarily attributable to the expenses for conveyances of assets from IRSA to IRSA CP for Ps. 111 million generated during fiscal year 2015. Sales and Developments Our Sales and Developments segment diminished by Ps. 21 million from income for Ps. 13 million during fiscal year 2015 to a loss of Ps. 8 million during fiscal year 2016, primarily as a consequence of the income posted during fiscal year 2015 for the sale of our shareholding in Bitania for Ps. 16 million, among other items. Hotels The net loss stemming from Other operating results associated to our Hotels segment rose by Ps. 2 million recorded during fiscal year 2016, primarily attributable to an increased charge for provisions for lawsuits and contingencies. International The Other operating results, net in this segment exhibited a Ps. 96 million decrease, down from Ps. 185 million during fiscal year 2015 to Ps. 89 million during fiscal year 2016, primarily attributable to a reduction in income caused by the partial reversal of accumulated gains/(losses) from conversion. As of June 30, 2016, this reflects primarily the reversal of the gains/(losses) for conversion before the IDBD business combination whilst as of June 30, 2015 this reflects the reversal of the reserve for conversion generated at Rigby and due to the partial repayment of the company’s principal. Financial Operations and Others Other operating results, net associated to our Financial Operations and Others segment rose by Ps. 3 million, up from a loss of Ps. 2 million during fiscal year 2015 to income for Ps. 1 million during fiscal year 2016. Profit from operations As a consequence of the factors explained above, our profit from operations rose Ps. 900 million (31.8%), up from income for Ps. 2,827 million in fiscal year 2015 to income for Ps. 3,727 million in fiscal year 2016. Agricultural Business Profit from operations in the Agricultural business decreased Ps. 15 million (4.9%), down from income for 307 million in fiscal year 2015 to income for Ps. 292 million in fiscal year 2016. Crops Profit / (loss) from operations in this segment increased Ps. 431 million (155.6%) from a loss of Ps. 277 million in fiscal year 2015 to income for Ps. 154 million in fiscal year 2016. Cattle Profit from operations in this segment rose by Ps. 67 million (186.1%), from income for Ps. 36 million in fiscal year 2015 to income for Ps. 103 million in fiscal year 2016. Dairy Profit / (loss) from operations in this segment decreased Ps. 12 million (300.0%), from income for Ps. 4 million in fiscal year 2015 to a loss of Ps. 8 million in fiscal year 2016. Sugarcane Profit / (loss) from operations in this segment increased Ps. 76 million (584.6%), from a loss of Ps. 13 million in fiscal year 2015 to income for Ps. 63 million in fiscal year 2016. Agricultural Rental and Services Profit from operations in this segment increased Ps. 16 million (43.2%), from income for Ps. 37 million in fiscal year 2015 to income for Ps. 53 million in fiscal year 2016. Land Transformation and Sales Profit from operations in this segment decreased by Ps. 564 million (102.2%), from income for Ps. 552 million in fiscal year 2015 to a loss of Ps. 12 million in fiscal year 2016.
Agro-industrial Loss from operations in this segment decreased Ps. 28 million (80.0%), from a loss of Ps. 35 million in fiscal year 2015 to a loss of Ps. 63 million in fiscal year 2016. Others Profit from operations in this segment decreased Ps. 1 million (33.3%) from income for Ps. 3 million in fiscal year 2015 to income for Ps. 2 million in fiscal year 2016. Urban Properties and Investments Business Profit from operations in this segment rose by Ps. 915 million (36.3%), up from income for Ps. 2,520 million in fiscal year 2015 to income for Ps. 3,435 million in fiscal year 2016 of which Ps. 720 million are derived from the Operation Center in Israel, and Ps. 2,715 million are derived from the Operation Center in Argentina. Considering Operation Center in Argentina variation was due to an increase of Ps. 580 million in the segments Shopping Center, Offices and Others, Hotels and Financial Operations, partially offset by a Ps. 385 million reduction in the segments Sales and Developments and International. Shopping Centers Profit from operations in our Shopping Centers segment rose by 37.6%, from a gain of Ps. 1,190 million during fiscal year 2015 to a gain of Ps. 1,637 million during fiscal year 2016. Profit from operations in our Shopping Centers segment, as a percentage of the segment revenues, increased from 66.9% in fiscal year 2015 to 68.0% in fiscal year 2016. Offices and Others Profit from operations in our Offices and Others segment rose by 121.2%, from a gain of Ps. 99 million during fiscal year 2015 to a gain of Ps. 219 million during fiscal year 2016. Profit from operations in our Offices and Others segment, as a percentage of the revenues derived from this segment, increased from 29.7% in fiscal year 2015 to 64.4% in fiscal year 2016. Sales and Developments Profit from operations in our Sales and Developments segment decreased by 21.4%, from a gain of Ps. 1,099 million during fiscal year 2015 to a gain of Ps. 864 million during fiscal year 2016. Profit from operations in our Sales and Developments segment, as a percentage of the revenues derived from this segment, increased from 7,850.0% in fiscal year 2015 to 28,800.0% in fiscal year 2016. Hotels Loss from operations in our Hotels segment decreased losses by 84.6% down from Ps. 13 million during fiscal year 2015 to Ps. 2 million during fiscal year 2016. International Profit/(loss) from operations in our International segment decreased Ps. 150 million (101.3%), from a gain of Ps. 148 million during fiscal year 2015 to a loss of Ps. 2 million during fiscal year 2016. Financial Operations and Others Loss from operations in our Financial Operations and Others segment experienced a 66.7% decrease in losses, down from Ps. 3 million during fiscal year 2015 to Ps. 1 million during fiscal year 2016. Operations Center in Israel Real Estate During fiscal year 2016, operating income associated to the Real Estate segment totaled Ps. 617 million and, as a percentage of the revenues derived from this segment, amounted to 40.1%. Supermarkets During fiscal year 2016, operating income associated to the Supermarkets segment totaled Ps. 424 million and, as a percentage of the revenues derived from this segment, amounted to 2.3%.
Telecommunications During fiscal year 2016, operating loss associated to the Telecommunications segment totaled Ps. 71 million. Others During fiscal year 2016, operating loss associated to the Others segment totaled Ps. 250 million. Share of profit / (loss) of associates and joint ventures Share of profit / (loss) of associates and joint ventures increased by Ps. 1,499 million, up from a loss of Ps. 1,026 million in fiscal year 2015 to a gain of Ps. 473 million in fiscal year 2016. This was primarily attributable to: · a Ps. 1,136 million increase in our related companies’ interest in the Urban Properties and Investments business in fiscal year 2016. Such increase was mainly attributable to the income stemming from the share in the Profit of associates and joint ventures posted by our subsidiary IDBD which amounted to Ps. 338 million during fiscal year 2016, and the profit associated to the investment in IDBD previous to the consolidation which amounts to Ps. 1,080 million, which adds to the income stemming from our investment in our related company Banco Hipotecario which exhibited a Ps. 114 million variation during fiscal year 2016. This has all been partially offset by an increase in losses of Ps. 55 million in our ownership interest in New Lipstick LLC, partially offset by increased gains from Condor for Ps. 15 million. · a Ps. 22 million increase in the revenues provided by the Agricultural business, primarily attributable to the revenues earned by the Agro-Uranga investment (corresponding to the Crops segment). In turn, share of profit of associates and joint ventures from our interests in joint ventures increased by 30.0% from Ps. 10 million in fiscal year 2015 to Ps. 13 million in fiscal year 2016, mainly as a consequence of a 298.7% increase in our Cresca joint venture, up from a loss of Ps. 2 million in fiscal year 2015 to a gain of Ps. 3 million in fiscal year 2016. Hence, according to business segment reporting and considering all our joint ventures, share of profit / (loss) of associates and joint ventures increased by 144.4%, up from a loss of Ps. 1,036 million in fiscal year 2015 to a gain of Ps. 460 million in fiscal year 2016. Financial results, net We incurred a higher financial loss, net of Ps. 4,967 million, up from a loss of Ps. 1,288 million in fiscal year 2015 to a loss of Ps. 6,255 million in fiscal year 2016. This was primarily due to: · a higher loss, of Ps. 2,340 million in foreign exchange, net in fiscal year 2016; · a higher loss, of Ps. 1,160 million in financial interest, net recorded in fiscal year 2016; · a higher loss, of Ps. 1,428 million, stemming from the fair value measurement of financial assets and liabilities in fiscal year 2016; · a higher loss, of Ps. 353 million, stemming from the impairment in the investment properties of our IDBD subsidiary in fiscal year 2016; and · slightly offset by a gain of Ps. 1,172 million stemming from derivative financial instruments in fiscal year 2016. Our financial losses, net in fiscal year 2016 were primarily attributable to (i) an increase in the financial losses stemming from the consolidation of IDBD for Ps. 3,176 million; (ii) a Ps. 3,249 million loss stemming from foreign exchange primarily as a result of the depreciation sustained by the foreign exchange rate, whitout IDBD’s results; (iii) a Ps. 1,246 million loss stemming from the interest accrued on debt financing, mainly due to increased indebtedness and higher interest rates, whitout IDBD’s results; (iv) a gain of Ps. 662 million primarily attributable to the fair value measurement of financial assets, whitout IDBD’s results; and (v) a gain of Ps. 1,138 million attributable to derivative financial instruments (except commodities), whitout IDBD’s results. There was a 65.5% variation in the U.S. Dollar buying rate during fiscal year 2016 (it increased from Ps. 9.088 on June 30, 2015 to Ps. 15.040 as of June 30, 2016) as compared to the previous fiscal year, when the U.S. Dollar quotation had experienced a variation of 11.7% (from Ps. 8.133 as of June 30, 2014 to Ps. 9.088 as of June 30, 2015). Income tax Our income tax expense increased Ps. 500 million, from a Ps. 303 million loss in fiscal year 2015 to a Ps. 197 million gain in fiscal year 2016. We recognize the income tax expense on the basis of the deferred tax liability method, thus recognizing temporary differences between accounting and tax assets and liabilities measurements. The main temporary differences for the Agriculture business derive from valuation of cattle stock and sale and replacement of property, plant and equipment, while those corresponding to the Urban Properties and Investments business derive from the sale and replacement of investment properties. For purposes of determining the deferred assets and liabilities, the tax rate expected to be in force at the time of their reversion or use, according to the legal provisions enacted as of the date of issuance of these financial statements, has been applied to the identified temporary differences and tax losses. Profit / (loss) for the Fiscal Year Due to the above mentioned factors, our profit / (loss) for the fiscal year decreased Ps. 2,066 million (1,180.6%) from Ps. 175 million in net income for fiscal year 2015 to a net loss of Ps. 1,891 million in fiscal year 2016. Profit / (loss) for fiscal years 2016 and 2015 is attributable to the controlling company’s shareholders and non-controlling interest, as per the following detail: · Loss for the fiscal year attributable to the controlling company’s shareholders went from a loss of Ps. 250 million in fiscal year 2015 to a loss of Ps. 1,038 million in fiscal year 2016; and · Profit / (loss) attributable to the non-controlling interest in controlled companies went from a gain of Ps. 425 million in fiscal year 2015 to a loss of Ps. 853 million in fiscal year 2016, primarily due to the consolidation of our subsidiary IDBD.
Fiscal year ended June 30, 2015 compared to the fiscal year ended June 30, 2014 Operating Results REVENUES Total salesOur total revenues of the Company increased 23.7%24.5%, from Ps. 3,967.93,970 million for fiscal year 2014 to Ps. 4,908.14,942 million for fiscal year 2015. This was mainly due to a 30.3%32.1% increase in the Agricultural business, from Ps.1,812.1Ps.1,813 million in fiscal year 2014 to Ps. 2,361.02,395 million in fiscal year 2015 and a 18.2%18.1% increase in the Urban Properties and Investments business, from Ps. 2,155.82,157 million in fiscal year 2014 to Ps. 2,547.12,547 million in fiscal year 2015.
Agricultural Business
| | | Fiscal year ended on June 30, 2015 | | | Revenues | | Income statement | | | Interests in joint ventures | | | Inter-segment eliminations | | | Segment reporting | | | Crops | | | 963,300 | | | | 23,417 | | | | - | | | | 986,717 | | | Cattle | | | 56,650 | | | | 2,524 | | | | 84,388 | | | | 143,562 | | | Dairy | | | 71,940 | | | | - | | | | - | | | | 71,940 | | | Sugarcane | | | 197,828 | | | | - | | | | - | | | | 197,828 | | | Agricultural rental and services | | | 37,048 | | | | - | | | | 127 | | | | 37,175 | | | Agricultural Subtotal | | | 1,326,766 | | | | 25,941 | | | | 84,515 | | | | 1,437,222 | | | Land transformation and sales | | | - | | | | - | | | | - | | | | - | | | Agro-industrial | | | 806,018 | | | | - | | | | - | | | | 806,018 | | | Other segments | | | 117,770 | | | | - | | | | - | | | | 117,770 | | | Total Agricultural Business Revenues | | | 2,250,554 | | | | 25,941 | | | | 84,515 | | | | 2,361,010 | |
| | | Fiscal year ended on June 30, 2014 | | | Revenues | | Income statement | | | Interests in joint ventures | | | Inter-segment eliminations | | | Segment reporting | | | Crops | | | 817,702 | | | | 19,120 | | | | - | | | | 836,822 | | | Cattle | | | 61,691 | | | | 2,242 | | | | 26,382 | | | | 90,315 | | | Dairy | | | 53,935 | | | | - | | | | - | | | | 53,935 | | | Sugarcane | | | 123,851 | | | | - | | | | - | | | | 123,851 | | | Agricultural rental and services | | | 29,044 | | | | - | | | | 98 | | | | 29,142 | | | Agricultural Subtotal | | | 1,086,223 | | | | 21,362 | | | | 26,480 | | | | 1,134,065 | | | Land transformation and sales | | | - | | | | - | | | | - | | | | - | | | Agro-industrial | | | 548,740 | | | | - | | | | 5,344 | | | | 554,084 | | | Other segments | | | 123,872 | | | | 87 | | | | - | | | | 123,959 | | | Total Agricultural Business Revenues | | | 1,758,835 | | | | 21,449 | | | | 31,824 | | | | 1,812,108 | |
Sales | | Fiscal year ended June 30, 2015 | | Revenues | | Statement of Income | Interests in joint ventures | Inter-segment eliminations | Segment reporting |
| | | (in million of Ps.) | | Crops | | 964 | 23 | - | 987 | | Cattle | | 56 | 3 | 84 | 143 | | Dairy | | 72 | - | - | 72 | | Sugarcane | | 198 | - | - | 198 | | Subtotal Agricultural Business | | 1,290 | 26 | 84 | 1,400 | | Land Transformation and Sales | | - | - | - | �� - | | Agro-industrial | | 806 | - | - | 806 | | Others segments | | 118 | - | 10 | 128 | | Agricultural Rental and Services | | 37 | - | 24 | 61 | | Other Subtotal | | 961 | - | 34 | 995 | | Total Agricultural Business | | 2,251 | 26 | 118 | 2,395 |
| | | Fiscal year ended June 30, 2014 | | Revenues | | Statement of Income | Interests in joint ventures | Inter-segment eliminations | Segment reporting | | | | (in million of Ps.) | | Crops | | 818 | 19 | - | 837 | | Cattle | | 62 | 2 | 26 | 90 | | Dairy | | 54 | - | - | 54 | | Sugarcane | | 124 | - | - | 124 | | Subtotal Agricultural Business | | 1,058 | 21 | 26 | 1,105 | | Land Transformation and Sales | | - | - | - | - | | Agro-industrial | | 549 | - | 5 | 554 | | Others segments | | 124 | - | 1 | 125 | | Agricultural Rental and Services | | 28 | - | 1 | 29 | | Other Subtotal | | 701 | - | 7 | 708 | | Total Agricultural Business | | 1,759 | 21 | 33 | 1,813 |
Total revenues increased 28%28.0%, from Ps. 1,758.81,759 million in fiscal year 2014 to Ps. 2,250.62,251 in fiscal year 2015. This was due to an increase of of: · Ps. 149.9 million146 in the Crops segment, an increase of segment; · Ps. 53.2 million in the Cattle segment, an increase of Ps. 18.018 million in the Dairy segment, an increase of segment; · Ps. 74 million in the Sugarcane segment, an increase of segment; · Ps. 8257 million in the Agroindustrial segment; and · Ps. 9 million in the Agricultural rentalRental and services segment, an increaseServices segment. These increases were offset by a reduction of Ps. 251.96 million in the Agroindustrial segment, offset by a decrease of Ps. 6.2 million in Other segments.Cattle and Others segments, respectively. In turn, revenues from our interests in joint ventures increased 20.9%23.8% from Ps. 21.421 million in fiscal year 2014 to Ps. 25.926 million in fiscal year 2015, mainly as a result of a 22.5%21.1% increase in Cropscrops sold toin Cresca, from Ps. 19.119 million in fiscal year 2014 to Ps. 23.423 million in fiscal year 2015. Similarly, inter-segment revenues increased 165.6%257.6%, from Ps. 31.833 million in fiscal year 2014 to Ps. 84.5118 million in fiscal year 2015, mainly as a result of livestock sales during the year to our subsidiary Sociedad Anónima Carnes Pampeanas which was reclassified from the Cattle segment to the Agroindustrial segment, and the leases of farmlands between our subsidiary Brasilagro and its subsidiaries, which were reclassified from the Crops segment to the Agricultural Rental and Services segment. ��
Hence, according to business segment reporting and considering all our joint ventures and inter-segment eliminations, sales revenues increased 30.3%, from Ps. 1,812.1 million in fiscal year 2014 to Ps. 2,361.0 million in fiscal year 2015.
Crops Total sales revenuesRevenues from the Crops segment increased 17.9%, from Ps. 836.8837 million in fiscal year 2014 to Ps. 986.7987 million in fiscal year 2015, mainly as a result of:
· | an increase of 102,129 tons in the volume of Crops sold during fiscal year 2015 compared to the previous fiscal year; and |
· a reduction of 4.6% in the average price of sold crops, from Ps. 1,931 per ton in fiscal year 2014 to Ps. 1,842 per ton in fiscal year 2015; · | partially offset by a reduction of 4.6% in the average price of sold Crops, from Ps. 1,931 per ton in fiscal year 2014 to Ps. 1,843 per ton in fiscal year 2015 mainly due to lower prices of wheat and sunflower. |
· offset by an increase of 102,130 tons in the volume of crops sold during fiscal year 2015 compared to the previous fiscal year, a 17.9% increase in production volume, from 344,165 tons in fiscal year 2014 to 405,882 tons in fiscal year 2015. The following table shows the sales of Cropscrops in detail: | | | Sale of Crops (in tons) | | Sale of Crops (in tons) | | | | Fiscal year ended June 30, | | Fiscal year ended June 30, | | | | 2015 | | | 2014 | | | Variation | | 2015 | 2014 | Variation | | Corn | | | 269,701 | | | | 179,893 | | | | 89,808 | | 269,701 | 179,893 | 89,808 | | Soybean | | | 250,125 | | | | 222,051 | | | | 28,074 | | 250,125 | 222,051 | 28,074 | | Wheat | | | 7,083 | | | | 11,359 | | | | (4,276 | ) | 7,083 | 11,359 | (4,276) | | Sorghum | | | 1,569 | | | | 3,843 | | | | (2,274 | ) | 1,569 | 3,843 | (2,274) | | Sunflower | | | 5,181 | | | | 9,745 | | | | (4,564 | ) | 5,181 | 9,745 | (4,564) | | Other | | | 1,872 | | | | 6,509 | | | | (4,637 | ) | 1,872 | 6,509 | (4,637) | | Total Sales | | | 535,531 | | | | 433,400 | | | | 102,129 | | 535,531 | 433,400 | (102,131) |
Cattle
Total sales revenues
Revenues from the Cattle segment increased 59.0%58.9%, from Ps. 90.390 million in fiscal year 2014 to Ps. 143.6143 million in fiscal year 2015, mainly as a result of: · | a 59%· a 57.8% increase in the average price per kilogram sold, from Ps. 10.1 per kilogram in fiscal year 2014 to Ps. 16 per kilogram in fiscal year 2015. |
· | a 0.3% in the cattle sales volume, from 8,842 tons in fiscal year 2014 to 8,871 tons in fiscal year 2015. |
Dairy
Total sales revenues from the Dairy segment increased 33.4%, from Ps. 53.910.2 million in fiscal year 2014 to Ps. 71.916.1 million in fiscal year 2015;
· a slight decrease of 0.3% in the cattle sales volume, from 8,842 tons in fiscal year 2014 to 8,871 tons in fiscal year 2015; and · a 12.1% increase in the cattle production volume, from 6,970 tons in fiscal year 2014 to 7,812 tons in fiscal year 2015. Dairy Revenues from the Dairy segment increased 33.3%, from Ps. 54 million in fiscal year 2014 to Ps. 72 million in fiscal year 2015, mainly as a result of: · | a 42.8% increase in the average price of milk, from Ps. 2.49 per liter in fiscal year 2014 to Ps. 3.55 per ton in fiscal year 2015; |
· a 31.0% increase in the average price of milk, from Ps. 2.70 per liter in fiscal year 2014 to Ps. 3.55 per liter in fiscal year 2015; · | a 149% increase in the average price per kilogram sold of milking cows from Ps. 5.24 per kilogram in fiscal year 2014 to Ps. 13.06 per kilogram in fiscal year 2015; |
· a 10.3% decrease in the average amount number of milking cows; and · | a 94.3% increase in the volume of sales of milking cows, from 465 tons in fiscal year 2014 to 903 tons in fiscal year 2015; |
o a 9.9% decrease in the volume of sales, from 18.8 million liters in fiscal year 2014 to 16.9 million liters in fiscal year 2015. · | partially offset by a 9.9% decrease in the volume of sales of milk, from 18.7 million liters in fiscal year 2014 to 16,9 million liters in fiscal year 2015. |
Sugarcane Total sales revenues
Revenues from the Sugarcane segment increased 59.7%, from Ps. 123.9124 million in fiscal year 2014 to Ps. 197.8198 million in fiscal year 2015, mainly as a result of: · | 248,808 (36.8%) more tons of sugarcane sold in fiscal year 2015 as compared to the previous fiscal year, mainly by BrasilAgro; and |
· 248,808 more tons of sugarcane sold in fiscal year 2015 as compared to the previous fiscal year (36.8%), mainly by Brasilagro; and · | a 16,7% increase in the average price of sugarcane sold, from Ps. 183.3 per ton in fiscal year 2014 to Ps. 214 per ton in fiscal year 2015. |
· a 16.7% increase in the average price of sugarcane sold, from Ps. 183.3 per ton in fiscal year 2014 to Ps. 214.0 per ton in fiscal year 2015. Agricultural rentalRental and servicesServices Total revenues
Revenues from the Agricultural rentalRental and servicesServices segment increased by 27.6%110.3%, from Ps. 29.129 million in fiscal year 2014 to Ps. 37.261 million in fiscal year 2015, mainly as a result of: · | a 58% increase in leases, due to machinery rentals from Brasilagro and new lease agreements from Bolivia; |
· a 232.0% increase in leases due to higher leases and machinery rentals from Brasilagro for Ps. 2 and Ps. 35 million in 2015, respectively, as compared to no transactions in the previous fiscal year, and new lease agreements in Bolivia in San Rafael (900 hectares), 4 Vientos (169 hectares) and Primavera (92 hectares) farms from January to May 2015, which generated revenues of Ps. 1 million; · | a 3.7 % increase in revenues from production of seeds mainly due to an increase in the production volume of soybean; and |
· a 18.2% increase in revenues from irrigation services (Ps. 1 million) originated in a 57% increase in the price, offset by a 25% reduction in irrigation volume; · | a decrease of 2.6 % in revenues from irrigation services due to a decrease of 136 % in total milliliters sold compared to fiscal year 2014. |
· partially offset by a 71.4% reduction in revenues from agricultural management services (Ps. 1 million) due to the fact that in the previous fiscal year cotton management services had been rendered to Iazfin in La Suiza, whereas such agreement was discontinued in this fiscal year. Agro-industrial
Total revenues
Agro-industrial Activities Revenues from the Agro-industrial Activities increased 45.5%, from Ps. 554.1554 million in fiscal year 2014 to Ps. 806.0806 million in fiscal year 2015, mainly as a result of: · | a 17% increase in slaughtering volumes and the differential resulting from the higher price of beef and sub-products; and |
· a 50% increase in sales to the domestic market and by-products. Domestic market prices showed an upward trend of 15% for fiscal year 2015 as compared to fiscal year 2014, while export sales fell 3.2% in fiscal year 2015 as compared to fiscal year 2014; and · | a 50% increase in sales to the domestic market with upward price trend, offset by |
· in fiscal year 2015 average slaughtering stood at 6,398 heads per month, compared to 5,472 in fiscal year 2014. · | a 3.18% reduction in exports. |
Other Segmentssegment Total revenues
Revenues from the Other segments decreased 5.0%segment increased 2.4%, from Ps. 124.0125 million in fiscal year 2014 to Ps. 117.8128 million in fiscal year 2015, mainly as a result of: · | an increase of Ps. 21.1 million in sales on consignment, offset by |
· an increase of Ps. 19 million in revenues from consignment; and · | a reduction of Ps. 15.1 million in commodity brokerage services. |
· offset by a reduction of Ps. 6 million and Ps. 9 million in the sale of inputs and commodity brokerage services, respectively.
Urban Properties and Investments Business | | | | Fiscal year ended on June 30, 2015 | | | Revenues | | | Income Statement(1) | | | | Interests in joint ventures | | | | Inter-segment eliminations | | | | Common maintenance expenses and collective promotion fund | | | | Segment reporting | | | Shopping Center Properties | | | 2,570,868 | | | | 13,069 | | | | - | | | | (805,627 | ) | | | 1,778,310 | | | Offices | | | 397,326 | | | | 9,238 | | | | 5,487 | | | | (79,323 | ) | | | 332,728 | | | Sales and Developments | | | 8,482 | | | | 5,225 | | | | - | | | | - | | | | 13,707 | | | Hotels | | | 396,297 | | | | - | | | | - | | | | - | | | | 396,297 | | | International | | | 28,131 | | | | - | | | | - | | | | (2,258 | ) | | | 25,873 | | | Financial operations and Others | | | 147 | | | | - | | | | - | | | | - | | | | 147 | | | Total Urban Properties and Investments Business Revenues | | | 3,401,251 | | | | 27,532 | | | | 5,487 | | | | (887,208 | ) | | | 2,547,062 | |
(1)Includes revenues from sales, leases and services (Ps. 2,514.0 million) and revenues from expenses and collective promotion funds (Ps. 887.2 million).
|
| �� | | Fiscal year ended on June 30, 2014 | | | Revenues | | Income statement(1) | | | Interests in joint ventures | | | Inter-segment eliminations | | | Common maintenance expenses and collective promotion fund | | | Segment reporting | | | Shopping Center Properties | | | 2,031,625 | | | | 9,280 | | | | 1,808 | | | | (659,705 | ) | | | 1,383,008 | | | Offices | | | 327,954 | | | | 8,466 | | | | 4,442 | | | | (69,703 | ) | | | 271,159 | | | Sales and Developments | | | 62,641 | | | | 22,890 | | | | - | | | | - | | | | 85,531 | | | Hotels | | | 331,562 | | | | - | | | | - | | | | - | | | | 331,562 | | | International | | | 90,820 | | | | - | | | | - | | | | (6,894 | ) | | | 83,926 | | | Financial operations and Others | | | 574 | | | | - | | | | - | | | | - | | | | 574 | | | Total Urban Properties and Investments Business Revenues | | | 2,845,176 | | | | 40,636 | | | | 6,250 | | | | (736,302 | ) | | | 2,155,760 | | | | | | | | | | | | | | | | | | | | | | | |
(1) | Includes revenues from sales, leases and services (Ps. 2,108.9 million) and revenues from expenses and collective promotion funds (Ps. 736.3 million) |
| | | Fiscal year ended June 30, 2015 | | Revenues | | Statement of Income | Interests in joint ventures | Inter-segment eliminations | Maintenance Fee and Common Advertising Funds | Segment reporting | | | | (in million of Ps.) | | Shopping Centers | | 2,571 | 13 | - | (806) | 1,778 | | Offices and Others | | 397 | 10 | 5 | (79) | 333 | | Sales and Developments | | 9 | 5 | - | - | 14 | | Hotels | | 396 | - | - | - | 396 | | International | | 28 | - | - | (2) | 26 | | Financial Operations and Others | | - | - | - | - | - | | Total Urban Properties and Investments Business | | 3,401 | 28 | 5 | (887) | 2,547 | | | | | | | | | | | | Fiscal year ended June 30, 2014 | | Revenues | | Statement of Income | Interests in joint ventures | Inter-segment eliminations | Maintenance Fee and Common Advertising Funds | Segment reporting | | | | (in million of Ps.) | | Shopping Centers | | 2,032 | 9 | 2 | (660) | 1,383 | | Offices and Others | | 327 | 10 | 4 | (70) | 271 | | Sales and Developments | | 63 | 23 | - | - | 86 | | Hotels | | 332 | - | - | - | 332 | | International | | 90 | - | - | (6) | 84 | | Financial Operations and Others | | 1 | - | - | - | 1 | | Total Urban Properties and Investments Business | | 2,845 | 42 | 6 | (736) | 2,157 | | | | | | | | | |
Total revenues from the Urban Properties and Investments business increased 19.5%, from Ps. 2,845.22,845 million in fiscal year 2014 to Ps. 3,401.33,401 million in fiscal year 2015. This was mainly due to an increase of Ps. 395.3395 million in the Shopping Center PropertiesCenters segment, an increase of Ps. 61.662 million in the Offices and Others segment, and an increase of Ps. 64.764 million in the Hotel segment, offset by a decrease of Ps. 0.41 million in the Financial Operations and Others segment, a decrease of Ps. 58.158 million in the International segment, and a decrease of Ps. 71.872 million in the Sales and Developments segment. In turn, revenues from our interests in joint ventures decreased by 32.2%33.3%, from Ps. 40.642 million in fiscal year 2014 to Ps. 27.528 million in fiscal year 2015, mainly2015. Such decrease is mostly attributable to a reduction in sales revenues derived from the Horizons development, from our joint venture with CYRSA S.A. Similarly, inter-segment revenues decreased 12.2%16.7%, from Ps. 6.26 million in fiscal year 2014 (of(out of which Ps. 4.44 million is attributable to the Offices and Others segment) to Ps. 5.55 million in fiscal year 2015 (attributable to the Offices and Others segment). On the other hand, revenues from expensesMaintenance Fee and collective promotion fundCommon Advertising Funds increased by 20.5%, from Ps. 736.3736 million in fiscal year 2014 (of(out of which Ps. 659.7660 million is attributable to the Shopping Center PropertiesCenters segment) to Ps. 887.2887 million in fiscal year 2015 (of(out of which Ps. 805.6806 million is attributable to the Shopping Center PropertiesCenters segment). Hence, according to business segment reporting and considering all our joint ventures, inter-segment eliminations, and maintenance fee and common advertising funds, sales revenues increased 18.1%, from Ps. 2,155.82,157 million in fiscal year 2014 to Ps. 2,547.12,547 million in fiscal year 2015.
Shopping Center PropertiesCenters Revenues from the Shopping Center PropertiesCenters segment increased 28.6%, from Ps. 1,383.01,383 million in fiscal year 2014 to Ps. 1,778.31,778 million in fiscal year 2015. Such variation was mostly attributable to: · | an increase of Ps. 317.7 million in revenues from base and contingent rent· an increase of Ps. 317 million in revenues from fixed and variable rentals as a result of a 33.3% rise in our tenants’ sales, from Ps. 16,132.8 million in fiscal year 2014 to Ps. 21,508.7 million in fiscal year 2015; |
· | an increase of Ps. 30.0 million in revenues from admission fees; |
· | an increase of Ps. 30.6 million in parking fees; and |
· | an increase of Ps. 17.0 million in revenues from property letting fees, management fees and other. |
OfficesRevenues from the Offices segment increased 22.7%, from Ps. 271.216,133 million in fiscal year 2014 to Ps. 332.721,509 million in fiscal year 2015;
· an increase of Ps. 30 million in revenues from admission fees; · an increase of Ps. 31 million in parking revenues; and · an increase of Ps. 17 million in revenues from commissions, management fees and others. Offices and Others Revenues from the Offices and Others segment increased 22.9%, from Ps. 271 million in fiscal year 2014 to Ps. 333 million in fiscal year 2015. Such revenues were impacted by the partial sale of investment properties in fiscal year 2015, which resulted in a reduction of the segment total leasable area. Considering comparable properties in both fiscal years, rental revenues from properties which did not experience a decrease in their leasable area increased by 30.6%30.8%, from Ps. 214.0214 million in fiscal year 2014 to Ps. 279.6280 million in fiscal year 2015, mostly as a result of the currency devaluation and improved occupancy, whereas rental revenues from properties whichwhose leasable area was reduced went down by 45%44.4%, from Ps. 45.545 million in fiscal year 2014 to Ps. 25.025 million in fiscal year 2015.
As of year-end, the 2015 average occupancy rate of premium offices stood at 98.1% and the average rent was around 26 US$ 26 per m2.sqm. Sales and Developments Revenues attributable to this segment often vary significantly period over period. Without considering our joint ventures, revenues from the Sales and Developments segment decreased by 86.4%85.7% from Ps. 62.663 million in fiscal year 2014 to Ps. 8.59 million in fiscal year 2015. Such reduction was mainly attributable to reduced revenues from the sale of the Condominios I and II (Ps. 45.346 million) and El Encuentro (Ps. 7.58 million) developments. On the other hand, revenues from ourout joint ventures (Horizons) fell by 77.2%78.3%, accounting for a decrease of Ps. 17.718 million. Hence, total revenues derived from this segment fell by 84.0%83.7%, from Ps. 85.586 million in fiscal year 2014 to Ps. 13.714 million in fiscal year 2015. Hotels Revenues from our Hotels segment increased by 19.5%19.3% from Ps. 331.6332 million in fiscal year 2014 to Ps. 396.3396 million in fiscal year 2015, mainly as a result of a 34.2% increase in the average room rate of our hotels (in terms of Argentine Pesos)pesos), partially offset by a 67.2% decrease in the average occupancy rate from 67.2% in fiscal year 2014 to 65.7% in fiscal year 2015 (mainly at our Llao Llao hotel). International Revenues from the International segment decreased by 69.2%69.0% from Ps. 83.984 million in fiscal year 2014 to Ps. 25.926 million in fiscal year 2015, mostly due to the fact that the results of Rigby 183 LLC – owner of the rental building Madison 183 building -– were consolidated for only 3 months only in fiscal year 2015 because it was sold in September 2014, whereas such results were consolidated for 12 months in fiscal year 2014. This building was sold in September 2014. Financial operationsOperations and Others Revenues from the Financial Operations and Others segment decreased from Ps. 0.61 million in fiscal year 2014 to Ps. 0.10 million in fiscal year 2015, as a result of reduced revenues from the Company’sour personal financing residual activity. COSTS TotalOur total costs of the Company increased 23.1%24.1%, from Ps. 3,266.33,266 million in fiscal year 2014 to Ps. 4,019.14,052 million in fiscal year 2015. This was mainly as a result of a 29.3%30.6% increase in costs associated with the Agricultural business, from Ps. 2,618.02,617 million in fiscal year 2014 to Ps. 3,385.73,419 million in fiscal year 2015 and a 2.3%2.5% decrease in costs associated with the Urban Properties and Investments business from Ps. 648.3649 million in fiscal year 2014 to Ps. 633.5633 million in fiscal year 2015.
Agricultural Business | | | Fiscal year ended on June 30, 2015 | | | Fiscal year ended June 30, 2015 | | Costs | | Income Statement | | | Interests in joint ventures | | | Inter-segment eliminations | | | Segment reporting | | | Statement of Income | Interests in joint ventures | Inter-segment eliminations | Segment reporting | | | | | (in million of Ps.) | | Crops | | | (1,752,576 | ) | | | (42,867 | ) | | | - | | | | (1,795,443 | ) | | (1,744) | (42) | (33) | (1,819) | | Cattle | | | (135,452 | ) | | | (4,716 | ) | | | (84,388 | ) | | | (224,556 | ) | | (220) | (5) | - | (225) | | Dairy | | | (133,259 | ) | | | - | | | | - | | | | (133,259 | ) | | (133) | - | (133) | | Sugarcane | | | (368,172 | ) | | | - | | | | - | | | | (368,172 | ) | | (368) | - | (368) | | Agricultural rental and services | | | (19,201 | ) | | | - | | | | - | | | | (19,201 | ) | | | Agricultural Subtotal | | | (2,408,660 | ) | | | (47,583 | ) | | | (84,388 | ) | | | (2,540,631 | ) | | | Land transformations and sales | | | (9,002 | ) | | | - | | | | - | | | | (9,002 | ) | | | Subtotal Agricultural Production | | | (2,465) | (47) | (33) | (2,545) | | Land Transformation and Sales | | | (9) | - | (9) | | Agro-industrial | | | (739,074 | ) | | | - | | | | (127 | ) | | | (739,201 | ) | | (654) | - | (85) | (739) | | Other Segments | | | (96,841 | ) | | | - | | | | - | | | | (96,841 | ) | | | Total Agricultural Business Costs | | | (3,253,577 | ) | | | (47,583 | ) | | | (84,515 | ) | | | (3,385,675 | ) | | | Others segments | | | (105) | - | (105) | | Agricultural rental and Services | | | (21) | - | - | (21) | | Subtotal Others | | | (780) | - | (85) | (865) | | Total Agricultural Business | | | (3,254) | (47) | (118) | (3,419) |
| | | Fiscal year ended on June 30, 2014 | | | Costs | | Income Statement | | | Interests in joint ventures | | | Inter-segment eliminations | | | Segment reporting | | | Crops | | | (1,509,500 | ) | | | (31,181 | ) | | | - | | | | (1,540,681 | ) | | Cattle | | | (150,810 | ) | | | (4,408 | ) | | | (5,442 | ) | | | (160,660 | ) | | Dairy | | | (104,334 | ) | | | - | | | | - | | | | (104,334 | ) | | Sugarcane | | | (206,751 | ) | | | - | | | | - | | | | (206,751 | ) | | Agricultural rental and services | | | (17,374 | ) | | | - | | | | - | | | | (17,374 | ) | | Agricultural Subtotal | | | (1,988,769 | ) | | | (35,589 | ) | | | (5,442 | ) | | | (2,029,800 | ) | | Land transformations and sales | | | (8,228 | ) | | | - | | | | - | | | | (8,228 | ) | | Agro-industrial Activities | | | (453,307 | ) | | | - | | | | (26,382 | ) | | | (479,689 | ) | | Other Segments | | | (100,170 | ) | | | (85 | ) | | | - | | | | (100,255 | ) | | Total Agricultural Business Costs | | | (2,550,474 | ) | | | (35,674 | ) | | | (31,824 | ) | | | (2,617,972 | ) |
| | | Fiscal year ended June 30, 2014 | | Costs | | Statement of Income | Interests in joint ventures | Inter-segment eliminations | Segment reporting | | | | (in million of Ps.) | | Crops | | (1,506) | (32) | (1) | (1,539) | | Cattle | | (152) | (4) | (5) | (161) | | Dairy | | (104) | - | - | (104) | | Sugarcane | | (207) | - | - | (207) | | Subtotal Agricultural Production | | (1,969) | (36) | (6) | (2,011) | | Land Transformation and Sales | | (8) | - | - | (8) | | Agro-industrial | | (454) | - | (26) | (480) | | Others segments | | (101) | - | - | (101) | | Agricultural rental and Services | | (17) | - | - | (17) | | Subtotal Others | | (572) | - | (26) | (598) | | Total Agricultural Business | | (2,549) | (36) | (32) | (2,617) |
Total costs increased by 27.6%27.7% from Ps. 2,550.52,549 million in fiscal year 2014 to Ps. 3,253.63,254 million in fiscal year 2015. This was caused mainly by an increase of of: · Ps. 254.8238 million in the Crops segment, an increase of segment; · Ps. 63.968 million in the Cattle segment, an increase of segment; · Ps. 28.929 million in the Dairy segment, an increase of segment; · Ps. 161.4161 million in the Sugarcane segment, an increase of segment; · Ps. 1.84 million in the Agricultural rentalRental and services segment, an increase of Services segment; · Ps. 0.81 million in the Land transformationsTransformation and sales segment, and an increase ofSales segment; · Ps. 259.5200 million in the Agro-industrial segment, offset by a decrease of and · Ps. 3.44 million in the Other segments.segment. In turn, the cost of our joint ventures experienced a net increase of Ps. 11.911 million, from 35.636 million in fiscal year 2014 to Ps. 47.647 million in fiscal year 2015, mainly as a result of an increase of Ps. 11.712 million in the cost of Cresca’s Crops,crops, from Ps. 31.231 million in fiscal year 2014 to Ps. 42.943 million in fiscal year 2015. Similarly, inter-segment costs rose by Ps. 52.786 million from Ps. 31.832 million in fiscal year 2014 to Ps. 84.5118 million in fiscal year 2015, mainly as a result of the cost of Cattle sales during the year to our subsidiary Sociedad Anónima Carnes Pampeanas which was reclassified from the Cattle segment to the Agro-industrial segment and the leases of farmlands between our subsidiary Brasilagro and its subsidiaries, reclassified from the Agricultural Rental and Services segment to the Crops segment.
Hence, according to business segment reporting and considering all our joint ventures and inter-segment eliminations, costs increased by 29.3%30.6%, from Ps. 2,618.02,617 million in fiscal year 2014 to Ps. 3,385.73,419 million in fiscal year 2015. Crops Costs from the Crops segment increased by 16.5%18.2%, from Ps. 1,540.71,539 million in fiscal year 2014 to Ps. 1,795.41,819 million in fiscal year 2015. Costs from the Crops segment are detailed in the following table: | | | | | | | | | Fiscal year 2015 | | | Fiscal year 2014 | | Fiscal year 2015 | Fiscal year 2014 | | | | Thousands of Ps. | | In Millions of Ps. | | Cost of sales | | | 873,118 | | | | 778,362 | | 873 | 787 | | Cost of production | | | 922,325 | | | | 752,319 | | 946 | 752 | | Total Costs | | | 1,795,443 | | | | 1,540,681 | | 1,819 | 1,539 |
The cost of sales from the Crops segment increased by 10.8%10.9%, from Ps. 778.4787 million in fiscal year 2014 to Ps. 873.1873 million in fiscal year 2015, mainly as a result of: · | a 23.6% increase in the volume of tons sold as compared to the previous fiscal year; and |
· | partially offset by a 10.4% decrease in the average cost per ton of crops sold in fiscal year 2015, from Ps. 1,819 per ton in fiscal year 2014 to Ps. 1,630 per ton in fiscal year 2015, due to an increase in the average crops domestic market price. |
· a 23.6% increase in the volume of tons sold as compared to the previous fiscal year; · partially offset by a 10.2% decrease in the average cost per ton of grain sold in fiscal year 2015, from Ps. 1,816 in fiscal year 2014 to Ps. 1,631 in fiscal year 2015, due to an increase in the average grain domestic market price. The cost of sales as a percentage of sales was 93.0%94.1% in fiscal year 2014 and 88.5% in fiscal year 2015. The cost of production from the Crops segment increased by 22.6%25.8%, from Ps. 752.3752 million in fiscal year 2014 to Ps. 922.3946 million in fiscal year 2015, mainly as a result of: · | a 14.3% increase in direct production costs during this fiscal year as compared to the previous one, mainly affected by the inflationary context that impacts both on the prices of leases and supplies used (agrochemicals and seeds); |
· a 17.6% increase in direct production costs during this fiscal year as compared to the previous one, mainly affected by the inflationary context that impacts both on the prices of leases and supplies used (agrochemicals and seeds); · | higher production volumes in fiscal year 2015 as compared to fiscal year 2014; and |
· higher production volumes in fiscal year 2015 as compared to fiscal year 2014; · | a larger number of hectares in operation in our own farms in fiscal year 2015 as compared to fiscal year 2014. |
· a larger number of hectares in operation in own farms in fiscal year 2015 as compared to fiscal year 2014. Total cost ofdirect production costs per ton increased 3.0%decreased 0.3%, from Ps. 1,8631,904 per ton in fiscal year 2014 to Ps. 1,8081,899 per ton in fiscal year 2015, mainly as a result of higher yields and higher costs in fiscal year 2015 as compared to fiscal year 2014, exceeding the increase in costs.2014. Cattle Costs of the Cattle segment increased 39.8%, from Ps. 160.7161 million in fiscal year 2014 to Ps. 224.6225 million in fiscal year 2015. Costs from the Cattle segment are detailed in the following table: | | | Fiscal year 2015 | | | Fiscal year 2014 | | Fiscal year 2015 | Fiscal year 2014 | | | | Thousands of Ps. | | In Millions of Ps. | | Cost of sales | | | 121,580 | | | | 76,734 | | 122 | 77 | | Cost of production | | | 102,976 | | | | 83,926 | | 103 | 84 | | Total Costs | | | 224,556 | | | | 160,660 | | 225 | 161 |
The cost of sales increased by 58.4%, from Ps. 76.777 million in fiscal year 2014 to Ps. 121.6122 million in fiscal year 2015, mainly as a result of: · | a 57.3% increase in the cost per kilogram sold in fiscal year 2015; and |
· a 57.3% increase in the cost per kilogram sold in fiscal year 2015; and · | a 0.7% increase in cattle sales volumes in fiscal year 2015. |
· a 0.7% increase in beef sales volumes in fiscal year 2015. The cost of production from the Cattle segment rose by 22.7%22.6%, from Ps. 83.984 million in fiscal year 2014 to Ps. 103.0103 million in fiscal year 2015. The higher cost of production from the Cattle segment in fiscal year 2015 was mainly attributable to: · | an in increase of Ps. 13.5 million in feeding costs due to the rise in prices and higher feed costs due to the increase of animals in our own farms fattened in feedlots; |
· higher payroll expenses; · | an increase of Ps. 3.9 million in payroll expense. |
· higher feeding costs due to the rise in prices and higher feed costs due to the increase of animals in our own farms fattened in feedlots. Dairy Costs of the Dairy segment increased 27.7%27.9%, from Ps. 104.3104 million in fiscal year 2014 to Ps. 133.3133 million in fiscal year 2015. Costs from the Dairy segment are detailed in the following table: | | | Fiscal year 2015 | | | Fiscal year 2014 | | Fiscal year 2015 | Fiscal year 2014 | | | | Thousands of Ps. | | In Millions of Ps. | | Cost of sales | | | 68,359 | | | | 51,686 | | 68 | 52 | | Cost of production | | | 64,900 | | | | 52,648 | | 65 | 52 | | Total Costs | | | 133,259 | | | | 104,334 | | 133 | 104 |
The cost of sales from the Dairy segment increased by 32.3%30.8%, from Ps. 51.752 million in fiscal year 2014 to Ps. 68.468 million in fiscal year 2015, mainly as a result of: · | an increase of 32% and 119% in milk and milking cows price levels, respectively; and |
· an increase of 32% and 119% in milk and milking cows price levels, respectively; · | a 94.3% increase in the sales volume of milking cows, partially offset by |
· a 94.3% increase in the sales volume of milking cows, offset by · | a 9.9% reduction in milk sales volume. |
· a 9.9% reduction in milk sales volume.
Cost of production of the Dairy segment increased 23%25.0%, from Ps. 52.652 million in fiscal year 2014 to Ps. 64.965 million in fiscal year 2015. This increase was mainly due to the impact of increased feeding, health and payroll costs. Sugarcane Costs of the Sugarcane segment increased 78.1%77.8%, from Ps. 206.8207 million in fiscal year 2014 to Ps. 368.2368 million in fiscal year 2015. Costs from the Sugarcane segment are detailed in the following table: | | | Fiscal year 2015 | | | Fiscal year 2014 | | Fiscal year 2015 | Fiscal year 2014 | | | | Thousands of Ps. | | In Millions of Ps. | | Cost of sales | | | 188,432 | | | | 105,618 | | 188 | 106 | | Cost of production | | | 179,740 | | | | 101,133 | | 180 | 101 | | Total Costs | | | 368,172 | | | | 206,751 | | 368 | 207 |
The cost of sales from the Sugarcane segment increased by 78.4%77.4%, from Ps. 105.6106 million in fiscal year 2014 to Ps. 188.4188 million in fiscal year 2015, mainly as a result of: · | an increase of 248,808 tons of sugarcane sold in fiscal year 2015 compared to the previous fiscal year, mainly in our subsidiary Brasilagro; and |
· an increase of 248,808 tons of sugarcane sold in fiscal year 2015 compared to the previous fiscal year, mainly in our subsidiary Brasilagro; and · | an increase in the average cost per ton of sugarcane sold in fiscal year 2015, from Ps. 156 per ton in fiscal year 2014 to Ps. 204 per ton in fiscal year 2015. |
· an increase in the average cost per ton of sugarcane sold in fiscal year 2015, from Ps. 156 per ton in fiscal year 2014 to Ps. 204 per ton in fiscal year 2015. The cost of sales as a percentage of sales was 85.3% in fiscal year 2014 and 95.3%94.9% in fiscal year 2015. The cost of production of the Sugarcane segment increased 77.7%78.2%, from Ps. 101.1101 million in fiscal year 2014 to Ps. 179.7180 million in fiscal year 2015, mainly as a result of a higher production volume in fiscal year 2015 compared to fiscal year 2014. The total cost of production per ton increased 25.9%, from Ps. 154 per ton in fiscal year 2014 to Ps. 184194 per ton in fiscal year 2015. Agricultural rentalRental and servicesServices The cost of sales from the Agricultural rentalRental and servicesServices segment increased by 10.5%23.5%, from Ps. 17.417 million in fiscal year 2014 to Ps. 19.221 million in fiscal year 2015, mainly as a result of: · | higher lease costs in Brasilagro, due to the amortization of new soil improvement works and structural expenses in the Preferencia, Chaparral, Jatobá and Araucaria lands; |
· higher lease costs in Brasilagro, which rose by 28.8%, due to the amortization of new soil improvement works and structural expenses in the Preferencia, Chaparral, Jatobá and Araucaria farms; · | lower costs from seed production services by 2.8%; and |
· lower costs from seed production services by 2.8%; and · | a 3.9% increase in irrigation service costs. |
· a 3.9% increase in irrigation service costs. Land transformationsTransformation and salesSales Cost of sales from the Land transformationsTransformation and salesSales segment increased 9.4%12.5%, from Ps. 8.28 million in fiscal year 2014 to Ps. 9.09 million in fiscal year 2015. Such increase is mainly attributable to a reclassification due to discontinued activities at the feedlot land and, to a lesser extent, to increases in salary-related items in particular the share incentive plan.and fees. Agro-industrial Costs of the Agro-industrial segment increased 54.1%54.0%, from Ps. 479.7480 million in fiscal year 2014 to Ps. 739.2739 million in fiscal year 2015, due to an inflationary context that hindered the increase in the gross marginal contribution:contribution. Other Segments
Others segments The cost of sales of the Other segments decreased 3.4%segment increased 4.0%, from Ps. 100.3101 million in fiscal year 2014 to Ps. 96.8105 million in fiscal year 2015, mainly as a result of a 16% reduction12% increase in the costs from the brokerage business related to commodity trading transactions through our subsidiary FyO and lowerhigher costs generatedof consignment transactions (versus no such transactions in fiscal year 2014) offset by a reduction in the costs of resale of suppliesinputs and others by 8%.of 12% and 65%, respectively.
Urban Properties and Investments Business | | | Fiscal year ended on June 30, 2015 | | | Fiscal year ended June 30, 2015 | | Costs | | Income Statement | | | Interests in joint ventures | | | Inter-segment eliminations | | | Common maintenance expenses and collective promotion funds | | | Segment reporting | | | Statement of Income | Interests in joint ventures | Inter-segment eliminations | Maintenance Fee and Common Advertising Funds | Segment reporting | | Shopping Center Properties | | | (1,103,042 | ) | | | (3,983 | ) | | | (3,860 | ) | | | 819,702 | | | | (291,183 | ) | | | Offices | | | (110,443 | ) | | | (5,248 | ) | | | - | | | | 79,323 | | | | (36,368 | ) | | | | | | (in million of Ps.) | | Shopping Centers | | | (1,103) | (4) | (4) | 820 | (291) | | Offices and Others | | | (110) | (5) | - | 79 | (36) | | Sales and Developments | | | (13,936 | ) | | | (5,521 | ) | | | - | | | | | | | | (19,457 | ) | | (14) | (5) | - | - | (19) | | Hotels | | | (278,672 | ) | | | - | | | | - | | | | | | | | (278,672 | ) | | (279) | - | - | - | (279) | | International | | | (9,379 | ) | | | - | | | | - | | | | 2,258 | | | | (7,121 | ) | | (9) | - | - | 2 | (7) | | Financial operations and Others | | | (666 | ) | | | - | | | | - | | | | | | | | (666 | ) | | | Total Urban Properties and Investments Business Costs | | | (1,516,138 | ) | | | (14,752 | ) | | | (3,860 | ) | | | 901,283 | | | | (633,467 | ) | | | Financial Operations and Others | | | (1) | - | - | - | (1) | | Total Urban Properties and Investments Business | | | (1,516) | (14) | (4) | 901 | (633) |
| | | Fiscal year ended June 30, 2014 | | Costs | | Statement of Income | Interests in joint ventures | Inter-segment eliminations | Maintenance Fee and Common Advertising Funds | Segment reporting | | | | (in million of Ps.) | | Shopping Centers | | (955) | (4) | (5) | 667 | (297) | | Offices and Others | | (111) | (4) | - | 70 | (45) | | Sales and Developments | | (19) | (16) | - | - | (35) | | Hotels | | (217) | - | - | - | (217) | | International | | (61) | - | - | 7 | (54) | | Financial Operations and Others | | (1) | - | - | - | (1) | | Total Urban Properties and Investments Business | | (1,364) | (24) | (5) | 744 | (649) |
| | | Fiscal year ended on June 30, 2014 | | | Costs | | Income Statement | | | Interests in joint ventures | | | Inter-segment eliminations | | | Common maintenance expenses and collective promotion funds | | | Segment reporting | | | Shopping Center Properties | | | (956,719 | ) | | | (2,754 | ) | | | (4,321 | ) | | | 667,106 | | | | (296,688 | ) | | Offices | | | (110,273 | ) | | | (4,437 | ) | | | (360 | ) | | | 69,703 | | | | (45,367 | ) | | Sales and Developments | | | (18,971 | ) | | | (15,992 | ) | | | | | | | | | | | (34,963 | ) | | Hotels | | | (216,768 | ) | | | | | | | | | | | | | | | (216,768 | ) | | International | | | (60,404 | ) | | | | | | | | | | | 6,894 | | | | (53,510 | ) | | Financial operations and Others | | | (983 | ) | | | | | | | | | | | | | | | (983 | ) | | Total Urban Properties and Investments Business Costs | | | (1,364,118 | ) | | | (23,183 | ) | | | (4,681 | ) | | | 743,703 | | | | (648,279 | ) |
Cost of sales from our Urban Properties and Investments business increased 11.1%, from Ps. 1,364.11,364 million in fiscal year 2014 to Ps. 1,516.11,516 million in fiscal year 2015. This was mainly due to an increase of Ps. 61.962 million in the HotelHotels segment, slightly offset by a decrease of Ps. 9.09 million in the Offices and Others segment, a decrease of 5.56 million in the Shopping Center PropertiesCenters segment, a decrease of Ps. 15.516 million in the Sales and Developments segment, a decrease of Ps. 0.3 million in the Financial Operations and Others segment, and a decrease of Ps. 46.447 million in the International segment. On the other hand, expensesmaintenance fees and collective promotion fundsCommon Advertising Funds costs increased 21.2%21.1%, from Ps. 743.7744 million in fiscal year 2014 to Ps. 901.3901 million in fiscal year 2015, mainly due to expensesmaintenance fees and collective promotion fundsCommon Advertising Funds expenses from Shopping Center Properties,Centers, which increased by 22.9%, from Ps. 667.1667 million in fiscal year 2014 to Ps. 819.7820 in fiscal year 2015, as a result of: (i) an increase of Ps. 59.860 million in maintenance, security, cleaning, repair and similar expenses (mainly attributable to increases in security and cleaning services and utility rates), (ii) an increase of Ps. 27.928 million in advertising expenses, (iii) an increase of Ps. 30.130 million in salaries and wages, social security contributions and other payroll expenses; (iv) an increase of Ps. 20.821 million in taxes, rates and contributions and other expenses, and (v) an increase of Ps. 14.014 million in other items (mostly as a result of travel and office supplies expenses). In addition, costs from our joint ventures experienced a net decrease of 36.6%41.7%, from Ps. 23.224 million in fiscal year 2014 to Ps. 14.714 million in fiscal year 2015, mainly as a result of lower costs resulting from reduced sales of the Horizons development. Finally, costs from inter-segment operations decreased by 17.0%20.0%, from Ps. 4.75 million in fiscal year 2014 to Ps. 3.94 million in fiscal year 2015, mainly as a result of a change in the cost allocation of our Shopping Center Properties.Centers. Hence, according to business segment reporting and considering all our joint ventures and inter-segment eliminations, costs decreased by 2.3%2.5%, from Ps. 648.3649 million in fiscal year 2014 to Ps. 633.5633 million in fiscal year 2015. Shopping Center PropertiesCenters Costs from the Shopping Center PropertiesCenters segment decreased by 1.9%2.0%, from Ps. 296.7297 million in fiscal year 2014 to Ps. 291.2291 million in fiscal year 2015. This reduction is mainly attributable to: · | a reduction of Ps. 35.9 million in costs from a deficit in expenses and collective promotion funds from our Shopping Centers Properties; and |
· a reduction of Ps. 36 million in costs from a deficit in maintenance fees and Common Advertising Funds from our Shopping Centers; and · | a decrease of Ps. 4.2 million in our depreciation and amortization expense; |
· a decrease of Ps. 4 million in our depreciation and amortization expense; · | partially offset by increased costs resulting from: an increase of Ps. 12.9 million in maintenance, security, cleaning, repair and similar expenses (mainly attributable to increases in security and cleaning services and utility rates); an increase of Ps. 10.0 million in salaries and wages, social security contributions and other payroll expenses; an increase of Ps. 8.7 million in taxes, rates and contributions and other expenses (mostly attributable to an increase in provincial property taxes and municipal utility rates, among other things), and an increase of Ps. 5.6 million in fees and compensation from services. |
· partially offset by increased costs resulting from: an increase of Ps. 13 million in maintenance, security, cleaning, repair and similar expenses (mainly attributable to increases in security and cleaning services and utility rates); an increase of Ps. 10 million in salaries and wages, social security contributions and other payroll expenses; an increase of Ps. 9 million in taxes, rates and contributions and other expenses (mostly attributable to an increase in provincial property taxes and municipal utility rates, among other things), and an increase of Ps. 5 million in fees and compensation from services. Costs from the Shopping Center PropertiesCenters segment, as a percentage of revenues derived from this segment, decreased from 21.5% in fiscal year 2014 to 16.4% in fiscal year 2015. Offices and Others Costs from the Offices and Others segment decreased by 19.8%20.0%, from Ps. 45.445 million in fiscal year 2014 to Ps. 36.436 million in fiscal year 2015. Such decrease was attributable to the partial sales of investment property for rental completed in fiscal year 2015. Costs attributable to non-comparable properties decreased by 44.3%, from Ps. 5.55 million to Ps. 3.03 million, mainly as a result of the above mentioned sales. In the absence of partial sales, costs - considering comparable properties in both fiscal years - decreased by 19.3%, from Ps. 36.637 million to Ps. 30.430 million, mainly as a result of a lower amortization and depreciation expense.
Costs from the Offices and Others segment, as a percentage of segment revenues, derived from this segment, decreased from 16.7%16.6% in fiscal year 2014 to 10.9%10.8% in fiscal year 2015. Sales and Developments Costs attributable to this segment often vary significantly period over period, given that the several sales completed by the Companyus over the time are not recurring. Without considering our joint ventures, costs from our Sales and Developments segment decreased by 22.3%26.3% from Ps. 17.519 million in fiscal year 2014 to Ps. 13.614 million in fiscal year 2015. Such reduction was mainly attributable to lower costs from the sale of units of Condominios I and II (Ps. 6.87 million), partially offset by higher costs from maintenance of land reserves and real property for sale (Ps. 4.75 million). On the other hand, costsCosts from our joint ventures (Horizons) went down by 78.1%68.8%, accounting for a decrease of Ps. 11.011 million. Hence, total costs from this segment fell by 44.3%45.7%, from Ps. 35.035 million in fiscal year 2014 to Ps. 19.519 million in fiscal year 2015.
Costs from the Sales and Developments segment, as a percentage of revenues derived from this segment, increased by 40.9%40.7% in fiscal year 2014 to 141.9%135.7% in fiscal year 2015.
Hotels
Hotels Costs from the Hotels segment increased by 28.6%, from Ps. 216.8217 million in fiscal year 2014 to Ps. 278.7279 million in fiscal year 2015, mainly as a result of: · | an increase of Ps. 41.1 million in salaries and wages, social security contributions and other payroll expenses; |
· an increase of Ps. 41 million in salaries and wages, social security contributions and other payroll expenses; · | an increase of Ps. 11.1 million in the cost of food, beverages and other hotel-related expenses; and |
· an increase of Ps. 11 million in the cost of food, beverages and other hotel-related expenses; and · | an increase of Ps. 7.7 million in maintenance and repair expenses, among other items. |
· an increase of Ps. 8 million in maintenance and repair expenses, among other items. Costs from the Hotels segment, as a percentage of revenues derived from this segment, increased from 65.4% in fiscal year 2014 to 70.3%70.5% in fiscal year 2015. International Costs from the International segment decreased by 86.7%87.0%, from Ps. 53.554 million in fiscal year 2014 to Ps. 7.17 million in fiscal year 2015 mostly due to the fact that the results of Rigby 183 LLC – owner of the rental building Madison 183 building - were consolidated for only 3 months in fiscal year 2015 whereas such results were consolidated for 12 months in fiscal year 2014. This building was sold in September 2014. In addition, the three-month period in fiscal year 2015 does not include amortization and depreciation since the property had been classified as available for sale as of June 30, 2014. Costs from the International segment, as a percentage of revenues derived from this segment, decreased from 63.8%64.3% in fiscal year 2014 to 27.5%26.9% in fiscal year 2015. Financial Operations and Others Costs from the Financial Operations and OthersOther segment decreased by 32.2% fromremained stable at Ps. 1.01 million induring fiscal yearyears 2014 to Ps. 0.7 million in fiscal year 2015, as a result of lower costsand 2015. Costs from the Company’s personal financing residual activity. AsFinancial Operations and Other segment, as a percentage of revenues derived from this segment, it increased from 171.3% in fiscal year 2014 to 453.1% in fiscal year 2015.do not reflect any significant percentage amounts. Initial recognition and changes in the fair value of biological assets and agricultural produceproducts at the point of harvest.harvest | | | Fiscal year ended on June 30, 2015 | | | Fiscal year ended June 30, 2015 | | Initial recognition and changes in the fair value of biological assets and agricultural produce at the point of harvest | | Income Statement | | | Interests in joint ventures | | | Inter-segment eliminations | | | Segment reporting | | | | Initial recognition and changes in the fair value of biological assets and agricultural products at the point of harvest | | | Statement of Income | Interests in joint ventures | Inter-segment eliminations | Segment reporting | | | | | (in million of Ps.) | | Crops | | | 897,498 | | | | 20,821 | | | | - | | | | 918,319 | | | 897 | 21 | - | 918 | | Cattle | | | 164,260 | | | | 2,474 | | | | - | | | | 166,734 | | | 165 | 2 | - | 167 | | Dairy | | | 74,919 | | | | - | | | | - | | | | 74,919 | | | 75 | - | 75 | | Sugarcane | | | 187,475 | | | | - | | | | - | | | | 187,475 | | | 187 | - | 187 | | Agricultural rental and services | | | - | | | | - | | | | - | | | | - | | | | Agricultural Subtotal | | | 1,324,152 | | | | 23,295 | | | | - | | | | 1,347,447 | | | | Land transformations and sales | | | - | | | | - | | | | - | | | | - | | | | Subtotal Agricultural Production | | | 1,324 | 23 | - | 1,347 | | Land Transformation and Sales | | | - | - | - | - | | Agro-industrial | | | - | | | | - | | | | - | | | | - | | | - | - | - | | Other Segments | | | - | | | | - | | | | - | | | | - | | | | Others segments | | | - | - | - | - | | Agricultural rental and Services | | | - | - | - | | Subtotal Others | | | - | - | - | - | | Total Agricultural Business | | | 1,324,152 | | | | 23,295 | | | | - | | | | 1,347,447 | | | 1,324 | 23 | - | 1,347 |
| | | Fiscal year ended on June 30, 2014 | | | Initial recognition and changes in the fair value of biological assets and agricultural produce at the point of harvest | | Income Statement | | | Interests in joint ventures | | | Inter-segment eliminations | | | Segment reporting | | | Crops | | | 848,578 | | | | 19,773 | | | | - | | | | 868,351 | | | Cattle | | | 145,008 | | | | 313 | | | | - | | | | 145,321 | | | Dairy | | | 62,840 | | | | - | | | | - | | | | 62,840 | | | Sugarcane | | | 96,227 | | | | - | | | | - | | | | 96,227 | | | Agricultural rental and services | | | - | | | | - | | | | - | | | | - | | | Agricultural Subtotal | | | 1,152,653 | | | | 20,086 | | | | - | | | | 1,172,739 | | | Land transformations and sales | | | - | | | | - | | | | - | | | | - | | | Agro-industrial | | | - | | | | - | | | | - | | | | - | | | Other Segments | | | - | | | | - | | | | - | | | | - | | | Total Agricultural Business | | | 1,152,653 | | | | 20,086 | | | | - | | | | 1,172,739 | |
The Company’s
| | | Fiscal year ended June 30, 2014 | | Initial recognition and changes in the fair value of biological assets and agricultural products at the point of harvest | | Statement of Income | Interests in joint ventures | Inter-segment eliminations | Segment reporting | | | | (in million of Ps.) | | Crops | | 848 | 20 | - | 868 | | Cattle | | 145 | - | - | 145 | | Dairy | | 63 | - | - | 63 | | Sugarcane | | 96 | - | - | 96 | | Subtotal Agricultural Production | | 1,152 | 20 | - | 1,172 | | Land Transformation and Sales | | - | - | - | - | | Agro-industrial | | - | - | - | - | | Others segments | | - | - | - | - | | Agricultural rental and Services | | - | - | - | - | | Subtotal Others | | - | - | - | - | | Total Agricultural Business | | 1,152 | 20 | - | 1,172 |
Our revenues from initial recognition and changes in the fair value of biological assets and agricultural produceproducts at the point of harvest increased 14.9%, from Ps. 1,152.71,152 million in fiscal year 2014 to Ps. 1,324.21,324 million in fiscal year 2015. In turn, the Company’sour revenues from initial recognition and changes in the fair value of biological assets and agricultural produceproducts at the point of harvest derived from our interests in joint ventures increased 16.0%15.0%, from Ps. 20.120 million in fiscal year 2014 to Ps. 23.323 million in fiscal year 2015. On the other hand, there were no inter-segment eliminations in connection with revenues from initial recognition and changes in the fair value of biological assets and agricultural produceproducts at the point of harvest.
Hence, according to business segment reporting and considering all our joint ventures, revenues from initial recognition and changes in the fair value of biological assets and agricultural produceproducts at the point of harvest increased by 14.9%, from Ps. 1,172.71,172 million in fiscal year 2014 to Ps. 1,347.41,347 million in fiscal year 2015. Crops Production income from the Crops segment increased by 5.8%, from Ps. 868.4868 million in fiscal year 2014 to Ps. 918.3918 million in fiscal year 2015, mainly as a result of: · | a 17.8% increase in the total production volume from 351,759 tons in fiscal year 2014 to 414,331 tons in fiscal year 2015; |
· a 17.9% increase in the total production volume from 344,165 tons in fiscal year 2014 to 405,882 tons in fiscal year 2015; · | partially offset by a 3.3% decrease in crops production average price; and |
· a 3.3% decrease in grain production average price; and · | a 68.5% decrease in expected revenues. |
· partially offset by a 71.1% decrease in expected revenues. As of June 30, 2015 the harvested area was 98.3%100% of our total sown area, compared to 95.7%98.9% as of June 30, 2014. The following table shows the number of tons produced and total production income as of June 30, 2015 and 2014: | | | Crops Production Income (in tons and thousands of Ps.) | | | | | Fiscal year ended on June 30, | | | | | 2015 | | | 2014 | | | | | Tons | | | Ps. | | | Tons | | | Ps. | | | Corn | | | 100,543 | | | | 83,565 | | | | 86,300 | | | | 79,475 | | | Soybean | | | 279,356 | | | | 625,511 | | | | 241,205 | | | | 563,639 | | | Wheat | | | 16,211 | | | | 12,688 | | | | 12,373 | | | | 11,929 | | | Sorghum | | | 1,202 | | | | 694 | | | | 4,058 | | | | 1,468 | | | Sunflower | | | 11,720 | | | | 26,967 | | | | 5,883 | | | | 15,657 | | | Other | | | 5,300 | | | | 20,420 | | | | 1,940 | | | | 3,390 | | | Total | | | 414,331 | | | | 769,846 | | | | 351,759 | | | | 675,559 | |
Crops Production Income (in tons and millions of Ps.)
| | Fiscal year ended June 30 | | | 2015 | 2014 | | | Tons | Ps. | Tons | Ps. | | Corn | 92,093 | 84 | 79,239 | 79 | | Soybean | 279,356 | 625 | 241,205 | 564 | | Wheat | 16,211 | 13 | 12,373 | 12 | | Sorghum | 1,202 | 1 | 4,058 | 1 | | Sunflower | 11,720 | 27 | 5,884 | 16 | | Other | 5,300 | 20 | 1,406 | 3 | | Total | 405,882 | 770 | 344,165 | 675 |
Estimated results from the valuation of our crops in progress at fair value decreased 68.5%71.2%, from Ps. 168.0170 million in fiscal year 2014 to Ps. 52.949 million in fiscal year 2015, mainly due to a reduction of 65.4%68.4% in corn crops.
Cattle Production income from the Cattle segment increased by 14.7%15.2%, from Ps. 145.3145 million in fiscal year 2014 to Ps. 166.7167 million in fiscal year 2015, mainly as a result of: · | a 51.8% increase in the average price per kilogram produced, from Ps. 9.7 per kilogram in fiscal year 2014 to Ps. 14.8 per kilogram in fiscal year 2015; and |
· a 51.8% increase in the average price per kilogram produced, from Ps. 9.7 per kilogram in fiscal year 2014 to Ps. 14.8 per kilogram in fiscal year 2015; · | a 12.1% increase in cattle production volume from 6,948 tons in fiscal year 2014 to 7,905 tons in fiscal year 2015; |
· a 13.8% increase in cattle production volume from 6,948 tons in fiscal year 2014 to 7,905 tons in fiscal year 2015; · | offset by a 36% reduction in holding gains. |
· offset by a 36.5% reduction in holding gains. The calving rate decreased slightly (3.6%)3.6%, whereas the death rate decreased by 27.2% during fiscal year 2015 as compared to fiscal year 2014. This variation in the death rates of calves was mainly due to a 73.7% reduction in sheep deaths, partially offset by 21.6% increase in death of beef cattle. The number of hectares devoted to cattleCattle production decreased from 95,16095,745 hectares in fiscal year 2014 to 88,643 hectares in fiscal year 2015 due to a smaller number of leased land devoted to cattleCattle production. Dairy Production income from the Dairy segment increased by 19.2%19.0%, from Ps. 62.863 million in fiscal year 2014 to Ps. 74.975 million in fiscal year 2015, mainly as a result of: · | the result from holding of milking cows, which increased 3.0%, from a gain of Ps. 8.6 million in fiscal year 2014 to a gain of Ps. 8.9 million in fiscal year 2015, as the inflationary context led to a significant rise in prices; |
· the result from holding of milking cows, which increased 3.0%, from a gain of Ps. 8.6 million in fiscal year 2014 to a gain of Ps. 8.9 million in fiscal year 2015, as the inflationary context led to a significant rise in prices; · | a 31.9% increase in the average price of milk, from Ps. 2.59 per liter in fiscal year 2014 to Ps. 3.42 per liter in fiscal year 2015; and |
· a 31.9% increase in the average price of milk, from Ps. 2.59 per liter in fiscal year 2014 to Ps. 3.42 per liter in fiscal year 2015; and · | an increase of 7.1% in milk production volumes and a 41.6% increase in the average price, partially offset by |
· an increase of 7.1% in milk production volumes and a 41.6% increase in the average price, offset by · | a 9.3% decrease in the milk production volume, from 19.3 million of liters in fiscal year 2014 to 17.5 million of liters in fiscal year 2015. This reduction in production volume was mainly due to a lower average number of milking cows per day, from 2,439 in fiscal year 2014 to 2,189 in fiscal year 2015, partially offset by a 9.1% increase in the efficiency level of average daily milk production per cow, from 19.7 liters in fiscal year 2014 to 21.5 liters in fiscal year 2015. |
· a 9.3% decrease in the milk production volume, from 19.3 million of liters in fiscal year 2014 to 17.5 million of liters in fiscal year 2015. This reduction in production volume was mainly due to a lower average number of milking cows per day, from 2,439 in fiscal year 2014 to 2,189 in fiscal year 2015, partially offset by a 9.1% increase in the efficiency level of average daily milk production per cow, from 19.7 liters in fiscal year 2014 to 21.5 liters in fiscal year 2015. Sugarcane Production income from the Sugarcane segment increased by 94.8%, from Ps. 96.296 million in fiscal year 2014 to Ps. 187.5187 million in fiscal year 2015, mainly as a result of: · | a 41.2% increase in total production volume from 657,547 tons in fiscal year 2014 to 928,273 tons in fiscal year 2015; and |
· a 41.2% increase in total production volume from 657,547 tons in fiscal year 2014 to 928,273 tons in fiscal year 2015; and · | an 8.0%· a 23.1% increase in the average production price of sugarcane. |
The 41.2% increase in the production volume from the Sugarcane segment was attributable to a 12.3% increase in our average yield from 81.2 ton/ha to 91.2 ton/ha mainly due to higher harvested hectares in fiscal year 2015.ha. The following table shows the actual tons produced and income as of June 30, 2015 and 2014: | | | Sugarcane Production Income (in tons and thousands of Ps.) | | | | | Fiscal year ended on June 30, | | | | | 2015 | | | 2014 | | | | | Tons | | | Ps. | | | Tons | | | Ps. | | | Sugarcane | | | 928,273 | | | | 178,802 | | | | 657,547 | | | | 117,250 | |
Sugarcane Production Income (in tons and millions of Ps.) | | Fiscal year ended June 30 | | | 2015 | 2014 | | | Tons | Ps. | Tons | Ps. | | Sugarcane | 928,273 | 185 | 657,547 | 106 |
Estimated results from the valuation of our sugarcane crops in progress at fair value Estimated results from the valuation of our sugarcane crops in progress at fair value increased significantly from a loss of 10.310 million in fiscal year 2014 to a gain of Ps. 8.72 million in fiscal year 2015 mainly generated by Brasilagro. This variation originated mainly in Brazil, and was caused by the following factors: · | an increase in the number of estimated hectares from a year-on-year decrease of 13% in fiscal year 2014 to a year-on-year increase of 25% in fiscal year 2015; |
· the number of estimated hectares went up from a year-on-year decrease of 13.0% in fiscal year 2014 to a year-on-year increase of 33.4% in fiscal year 2015; · | an increase in the estimated yields from a from a year-on-year decrease of 2% in fiscal year 2014 to a year-on-year increase of 2% in fiscal year 2015; and |
· the estimated yields went up from a from a year-on-year decrease of 2.0% in fiscal year 2014 to a year-on-year increase of 2.4% in fiscal year 2015; and · | a decrease in the estimated unit costs from a year-on-year increase of 15% in fiscal year 2014 to a year-on-year increase of 9% in fiscal year 2015. |
· the estimated unit costs went down from a year-on-year increase of 15.0% in fiscal year 2014 to a year-on-year increase of 10.0% in fiscal year 2015.
Changes in the net realizable value of agricultural produceproducts after harvest | | | Fiscal year ended on June 30, 2015 | | | Fiscal year ended June 30, 2015 | | Changes in the net realizable value of agricultural produce after harvest | | Income statement | | | Interests in joint ventures | | | Inter-segment eliminations | | | Segment reporting | | | | Changes in the net realizable value of agricultural products after harvest | | | Statement of Income | Interests in joint ventures | Inter-segment eliminations | Segment reporting | | | | | (in million of Ps.) | | Crops | | | (34,474 | ) | | | - | | | | - | | | | (34,474 | ) | | (34) | - | (34) | | Cattle | | | 3 | | | | - | | | | - | | | | 3 | | | - | - | - | | Dairy | | | - | | | | - | | | | - | | | | - | | | - | - | - | | Sugarcane | | | - | | | | - | | | | - | | | | - | | | - | - | - | | Agricultural rental and services | | | - | | | | - | | | | - | | | | - | | | | Agricultural Subtotal | | | (34,471 | ) | | | - | | | | - | | | | (34,471 | ) | | | Land transformations and sales | | | - | | | | - | | | | - | | | | - | | | | Subtotal Agricultural Production | | | (34) | - | (34) | | Land Transformation and Sales | | | - | - | - | | Agro-industrial | | | - | | | | - | | | | - | | | | - | | | - | - | - | | Other Segments | | | - | | | | - | | | | - | | | | - | | | | Others segments | | | - | - | - | | Agricultural rental and Services | | | - | - | - | | Subtotal Others | | | - | - | - | | Total Agricultural Business | | | (34,471 | ) | | | - | | | | - | | | | (34,471 | ) | | (34) | - | (34) |
| | | Fiscal year ended on June 30, 2014 | | | Fiscal year ended June 30, 2014 | | Changes in the net realizable value of agricultural produce after harvest | | Income Statement | | | Interests in joint ventures | | | Inter-segment eliminations | | | Segment reporting | | | | Changes in the net realizable value of agricultural products after harvest | | | Statement of Income | Interests in joint ventures | Inter-segment eliminations | Segment reporting | | | | | (in million of Ps.) | | Crops | | | (17,624 | ) | | | - | | | | - | | | | (17,624 | ) | | (17) | - | (17) | | Cattle | | | 177 | | | | - | | | | - | | | | 177 | | | - | - | - | | Dairy | | | - | | | | - | | | | - | | | | - | | | - | - | - | | Sugarcane | | | - | | | | - | | | | - | | | | - | | | - | - | - | | Agricultural rental and services | | | - | | | | - | | | | - | | | | - | | | | Agricultural Subtotal | | | (17,447 | ) | | | - | | | | - | | | | (17,447 | ) | | | Land transformations and sales | | | - | | | | - | | | | - | | | | - | | | | Subtotal Agricultural Production | | | (17) | - | (17) | | Land Transformation and Sales | | | - | - | - | | Agro-industrial | | | - | | | | - | | | | - | | | | - | | | - | - | - | | Other Segments | | | - | | | | - | | | | - | | | | - | | | | Others segments | | | - | - | - | | Agricultural rental and Services | | | - | - | - | | Subtotal Others | | | - | - | - | | Total Agricultural Business | | | (17,447 | ) | | | - | | | | - | | | | (17,447 | ) | | (17) | - | (17) |
Income from changes in the net realizable value of agricultural produceproducts after harvest decreased significantly, from a loss of Ps. 17.417 million in fiscal year 2014 to a loss of Ps. 34.434 million in fiscal year 2015. This was caused mainly by a reduction of Ps. 16.817 million in the Crops segment (mainly due to the first quarter’s 21% reduction in the net realizable value of corn in Argentina) and, to a lesser extent, by a Ps. 0.2 million increase in the Cattle segment.. No interest in joint ventures or inter-segment elimination was recorded in income from changes in the net realizable value of agricultural produceproducts after harvest. GROSS PROFIT
Gross Profit As a result of the above mentioned factors, the Company’sour gross profit increased 18.6%18.5%, from Ps. 1,857.01,859 million in fiscal year 2014 to Ps. 2,201.92,203 million in fiscal year 2015. This was caused mainly by: · | a 17.5% decrease in the Agricultural Business, from Ps. 349.4 million income in fiscal year 2014 to Ps. 288.3 million income in fiscal year 2015; and |
· a 17.7% decrease in the Agricultural Business, from Ps. 351 million income in fiscal year 2014 to Ps. 289 million income in fiscal year 2015; and · | a 26.9% increase in the Urban Properties and Investments business, from a Ps. 1,507.5 million income in fiscal year 2014 to a Ps. 1,913.6 million income in fiscal year 2015. |
· a 26.9% increase in the Urban Properties and Investments business, from a Ps. 1,508 million income in fiscal year 2014 to a Ps. 1,914 million income in fiscal year 2015.
As a result of the above mentioned factors, gross profit decreased 17.5%17.7%, from Ps. 349.4351 million in fiscal year 2014 to Ps. 288.3289 million in fiscal year 2015. Crops Gross profit from this segment decreased by 48.9%65.1%, from Ps. 146.9149 million in fiscal year 2014 to Ps. 75.152 million in fiscal year 2015. Cattle Gross profit from this segment increased by 14.1%14.9%, from Ps. 75.274 million in fiscal year 2014 to Ps. 85.785 million in fiscal year 2015.
Dairy Gross profit from this segment increased by 9.3%7.7%, from Ps. 12.413 million in fiscal year 2014 to Ps. 13.614 million in fiscal year 2015. Sugarcane Gross profit from this segment increased by 28.5%30.8%, from Ps. 13.313 million in fiscal year 2014 to Ps. 17.117 million in fiscal year 2015. Agricultural rentalRental and servicesServices Gross profit from this segment increased by 52.7%233.3%, from Ps. 11.812 million in fiscal year 2014 to Ps. 18.040 million in fiscal year 2015. Land transformationsTransformation and salesSales Gross loss from this segment increased by 9.4%12.5%, from Ps. 8.28 million in fiscal year 2014 to Ps. 9.09 million in fiscal year 2015. Agro-industrial Gross profit from this segment decreased by 10.2%9.5%, from Ps. 74.474 million in fiscal year 2014 to Ps. 66.867 million in fiscal year 2015. Other Segments Gross profit from this segment decreased by 11.7%4.2%, from Ps. 23.724 million in fiscal year 2014 to Ps. 20.923 million in fiscal year 2015. Urban Properties and Investments Business Gross profit from the Urban Properties and Investments business increased 26.9% from Ps. 1,507.51,508 million in fiscal year 2014 to Ps. 1,913.61,914 million in fiscal year 2015. This was mainly due to an increase of Ps. 400.8401 million in the Shopping Center PropertiesCenters segment; an increase of Ps. 70.671 million in the Offices and Others segment; an increase of Ps. 2.82 million in the Hotels segment, partially offset by a reduction of Ps. 56.356 million in the Sales and Developments segment, a reduction of Ps. 11.711 million in the International segment and a reduction of Ps. 0.11 million in the Financial Operations and Others segment. Shopping Center PropertiesCenters Gross profit from the Shopping Center PropertiesCenters segment increased by 36.9%, from Ps. 1,086.31,086 million in fiscal year 2014 to Ps. 1,487.11,487 million in fiscal year 2015. Offices and Others Gross profit from the Offices and Others segment increased by 31.3%31.4%, from Ps. 225.8226 million in fiscal year 2014 to Ps. 296.4297 million in fiscal year 2015. Sales and Developments Gross profit from the Sales and Developments segment fell by 111.4%109.8% from a gain of Ps. 50.651 million in fiscal year 2014 to a loss of Ps. 5.75 million in fiscal year 2015. Hotels Gross profit from the Hotels segment increased by 2.5%1.7%, from Ps. 114.8115 million in fiscal year 2014 to Ps. 117.6117 million in fiscal year 2015. International Gross profit from the International segment decreased by 38.3%36.7%, from Ps. 30.430 million in fiscal year 2014 to Ps. 18.819 million in fiscal year 2015. Financial operationsOperations and Others Gross loss from the Financial operationsOperations and Others segment increased by Ps. 0.1 million, from a loss of Ps. 0.4 million in fiscal year 2014 to a loss of Ps. 0.51 million in fiscal year 2015. Income
Gain from saledisposal of investment properties IncomeGain from saledisposal of investment properties derived from the Urban PropertiesSales and Investments businessDevelopments segment increased 398.1%397.8%, from a Ps. 230.9231 million income in fiscal year 2014 to a Ps. 1,150.21,150 million income in fiscal year 2015, mainly as a result of the sale of functional units at:at Maipu 1300, Intercontinental Plaza, (Ps. 338.4 million), Madison Ave. office building (Ps. 296.5 million), an increase in sales of Bouchard 551 (Ps. 308.4 million) and Maipú 1300 (Ps. 25.3 million); partially offset by reduced sales from: Av. de Mayo 595 (Ps. 19.2 million), Constitución 1159 (Ps. 13.4 million) and Costeros Dique IV (Ps. 10.6 million), among other transactions.the sale of the 183 Madison building.
Gain from disposal of farmlands Gain from disposal of farmlands derived from the Land transformationsTransformation and salesSales segment increased 523.4%526.4%, from Ps. 91.491 million income in fiscal year 2014 to Ps. 569.5570 million income in fiscal year 2015, mainly as a result of:
During fiscal year 2015 · On April 3, 2014, Cresca S.A. executed a deed of sale for an area of 24,624 hectares located in Chaco Paraguayo. The total price was U$SUS$ 14.7 million payable as follows: U$SUS$ 1.8 million was cashed upon the execution of the deed of sale; U$SUS$ 4.3 million at the time of the title conveyance; U$SUS$ 3.7 million on July 2015 interest-free; and U$SUS$ 4.9 million on July 2016 interest-free. Possession was surrendered upon the execution of the title deed and upon the creation of a mortgage as guarantee of the remaining balance on July 14, 2014. The CompanyWe recorded a gain of Ps. 19.1 million as a result of this transaction. · On June 10, 2015, Brasilagro sold the remaining area of 27,74427,745 hectares of the Cremaq farm located in the municipal district of Baixa Grande do Ribeiro (Piaui). The transaction price was RS.Rs. 270 million (equivalent to Ps. 694694.0 million), out of which RSRs. 67.5 million was cashed (equivalent to Ps. 196.8 million), with the balance being payable in an estimated term of 90 days. The CompanyWe recorded a gain of Ps. 525.9 million as a result of this transaction. · On October 17, 2013, Yuchán Agropecuaria executed an agreement providing for the sale, subject to retention of title, of an 1,643 hectare property in the “La Fon Fon II” farm for a total price of U$SUS$ 7.21 million (equivalent to Ps. 59.0 million). As of the date of issuance of these financial statements, the amount of US$ 1.5 million was cashed, with the remaining balance of US$ 5.71 million being payable in six semi-annual installments beginning in December this year and ending in June 2018. The agreement provides that title conveyance will be registered once the full price has been paid. On June 24, 2015, Yuchán Agropecuarria surrendered the possession of the property. The CompanyWe recorded a gain of US$ 2.7 million (equivalent to Ps. 24.6 million) as a result of this transaction in this fiscal year. · On June 27, 2014, Brasilagro sold a fraction of 1,164 hectares in the “Araucaria” farm located in the municipal district of Mineiros, State of Goias, Brazil, that had been purchased in 2007. After the sale, the farm has a total area of 8,178 hectares, out of which approximately 5,982 hectares are arable land. The sale price was RS.Rs. 32.5 million (equivalent to Ps. 117.5 million). In July 2014, the buyer made an initial payment of RS.Rs. 4.5 million, and the remaining balance is payable in five installments, the first of which, for RS.Rs. 4.5 million, matures in November 2014 and the last one at the time of execution of the title deed, in August 2018. The CompanyWe recorded a gain of RS.Rs. 21.0 million (equivalent to Ps. 75.8 million) fromfor the sale of the Araucaria farm. · On May 27, 2014, Ombú Agropecuaria Argentina S.A. executed an agreement providing for the sale, subject to retention of title, of an 882.96 hectare property in the “San Cayetano I” farm for a total price of US$ 4.2 million. Out of this amount, the sum of US$ 1 million has been already collected and the balance is payable in 5 consecutive semi-annual installments, the last of which falls due in November 2016. The agreement provides that title conveyance will be registered once the full price has been paid. Possession was surrendered on the date of execution of the agreement. The CompanyWe recorded a gain of US$ 1.8 million for this sale. GENERAL AND ADMINISTRATIVE EXPENSES
Total
General and Administrative Expenses Our total general and administrative expenses of the Company increased 15.7%15.5%, from Ps. 539.7541 million for fiscal year 2014 to Ps. 624.6625 million for fiscal year 2015. This was mainly due to an increase of Ps. 6.86 million in the Agricultural business and an increase of Ps. 78.178 million in the Urban Properties and Investments business. Agricultural Business | | | Fiscal year ended on June 30, 2015 | | | Fiscal year ended June 30, 2015 | | General and Administrative Expenses | | Income Statement | | | Interests in joint ventures | | | Inter-segment eliminations | | | Segment reporting | | | Statement of Income | Interests in joint ventures | Inter-segment eliminations | Segment reporting | | | | | (in million of Ps.) | | Crops | | | (155,733 | ) | | | (3,303 | ) | | | - | | | | (159,036 | ) | | (156) | (3) | - | (159) | | Cattle | | | (25,925 | ) | | | 172 | | | | - | | | | (25,753 | ) | | (26) | - | (26) | | Dairy | | | (4,920 | ) | | | - | | | | - | | | | (4,920 | ) | | (5) | - | (5) | | Sugarcane | | | (19,821 | ) | | | - | | | | - | | | | (19,821 | ) | | (20) | - | (20) | | Agricultural rental and services | | | (2,140 | ) | | | - | | | | - | | | | (2,140 | ) | | | Agricultural Subtotal | | | (208,539 | ) | | | (3,131 | ) | | | - | | | | (211,670 | ) | | | Land transformations and sales | | | (2,106 | ) | | | - | | | | - | | | | (2,106 | ) | | | Subtotal Agricultural Production | | | (207) | (3) | - | (210) | | Land Transformation and Sales | | | (2) | - | (2) | | Agro-industrial | | | (25,334 | ) | | | - | | | | - | | | | (25,334 | ) | | (25) | - | (25) | | Other Segments | | | (7,360 | ) | | | - | | | | - | | | | (7,360 | ) | | | Total Agricultural Business General and Administrative Expenses | | | (243,339 | ) | | | (3,131 | ) | | | - | | | | (246,470 | ) | | | Others segments | | | (8) | - | (8) | | Agricultural rental and Services | | | (2) | - | (2) | | Subtotal Others | | | (35) | - | - | (35) | | Total Agricultural Business | | | (244) | (3) | - | (247) |
| | | Fiscal year ended June 30, 2014 | | General and Administrative Expenses | | Statement of Income | Interests in joint ventures | Inter-segment eliminations | Segment reporting | | | | (in million of Ps.) | | Crops | | (146) | (1) | - | (147) | | Cattle | | (26) | (1) | - | (27) | | Dairy | | (6) | - | - | (6) | | Sugarcane | | (28) | - | - | (28) | | Subtotal Agricultural Production | | (206) | (2) | - | (208) | | Land Transformation and Sales | | (1) | - | - | (1) | | Agro-industrial | | (17) | - | - | (17) | | Others segments | | (9) | (2) | - | (11) | | Agricultural rental and Services | | (4) | - | - | (4) | | Subtotal Others | | (30) | (2) | - | (32) | | Total Agricultural Business | | (237) | (4) | - | (241) |
| | | Fiscal year ended on June 30, 2014 | | | General and Administrative Expenses | | Income Statement | | | Interests in joint ventures | | | Inter-segment eliminations | | | Segment reporting | | | Crops | | | (146,512 | ) | | | (681 | ) | | | - | | | | (147,193 | ) | | Cattle | | | (27,118 | ) | | | (65 | ) | | | - | | | | (27,183 | ) | | Dairy | | | (5,746 | ) | | | - | | | | - | | | | (5,746 | ) | | Sugarcane | | | (28,261 | ) | | | - | | | | - | | | | (28,261 | ) | | Agricultural rental and services | | | (2,603 | ) | | | (66 | ) | | | - | | | | (2,669 | ) | | Agricultural Subtotal | | | (210,240 | ) | | | (812 | ) | | | - | | | | (211,052 | ) | | Land transformations and sales | | | (1,130 | ) | | | - | | | | - | | | | (1,130 | ) | | Agro-industrial | | | (16,880 | ) | | | - | | | | - | | | | (16,880 | ) | | Other Segments | | | (8,761 | ) | | | (1,807 | ) | | | - | | | | (10,568 | ) | | Total Agricultural Business General and Administrative Expenses | | | (237,011 | ) | | | (2,619 | ) | | | - | | | | (239,630 | ) |
General and administrative expenses from our Agricultural business increased 2.7%.1.7%, from Ps. 237.0237 million in fiscal year 2014 to Ps. 243.3244 million in fiscal year 2015. This was mainly due to an increase of Ps. 11.810 million in the Crops segment, an increase of Ps. 1.01 million in the Land transformationsTransformation and salesSales segment, and an increase of Ps. 8.58 million in the Agro-industrial segment, slightly offset by a reduction of Ps. 1.41 million in the Cattle segment, a reduction of Ps. 0.81 million in the Dairy segment, a reduction of Ps. 8.48 million in the Sugarcane segment, a reduction of Ps. 0.52 million in the Agricultural rentalRental and servicesServices segment, and a reduction of Ps. 3.21 million in the Other segments.segment. The main causes of this variation were: · | the changes in Doneldon’s administrative expenses from Bolivia since a severance payment was accrued for (HF) and bonus allowances started to be set up (US); bonuses for fiscal year 2014 were paid for (which had not been accrued for because of a subsequent change in the Company’s policy) and bonuses for fiscal year 2015 were accrued for in fiscal year 2015; |
· the changes in Doneldon’s administrative expenses from Bolivia since a severance payment was accrued for (HF) and bonus allowances started to be set up (US); bonuses for fiscal year 2014 were paid for (which had not been accrued for because of a subsequent change in the Company’s policy) and bonuses for fiscal year 2015 were accrued for in fiscal year 2015; · | an increase in Carnes Pampeanas S.A.’s headcount to support the increase in operation volume and overtime; and |
· an increase in Carnes Pampeanas S.A.’s headcount to support the increase in operation volume and overtime; and · | a 26% increase in expenses as a result of the effects of inflation. |
· a 26% rise in expenses as a result of the inflationary context. In turn, general and administrative expenses from our joint ventures increaseddecreased by 19.5%,Ps. 1 million, from Ps. 2.64 million in fiscal year 20142015 to Ps. 3.13 million in fiscal year 2015.2016. On the other hand, no general and administrative expenses arose from inter-segment eliminations. Hence, according to business segment reporting and considering all our joint ventures, general and administrative expenses increased by 2.9%3.0%, from Ps. 239.6241 million in fiscal year 2014 to Ps. 246.5247 million in fiscal year 2015.
Urban Properties and Investments Business | | | | Fiscal year ended June 30, 2015 | | General and Administrative Expenses | | Statement of Income | Interests in joint ventures | Inter-segment eliminations | Segment reporting | | | | (in million of Ps.) | | Shopping Centers | | (135) | - | - | (135) | | Offices and Others | | (58) | - | (1) | (59) | | Sales and Developments | | (48) | (1) | (1) | (50) | | Hotels | | (77) | - | (1) | (78) | | International | | (56) | - | - | (56) | | Financial Operations and Others | | - | - | - | - | | Total Urban Properties and Investments Business | | (374) | (1) | (3) | (378) |
| | | Fiscal year ended on June 30, 2015 | | | | Fiscal year ended June 30, 2014 | | General and Administrative Expenses | | Income Statement | | | Interests in joint ventures | | | Inter-segment eliminations | | | Segment reporting | | | Statement of Income | Interests in joint ventures | Inter-segment eliminations | Segment reporting | | Shopping Center Properties | | | (135,512 | ) | | | (233 | ) | | | (406 | ) | | | (136,151 | ) | | | Offices | | | (58,202 | ) | | | (279 | ) | | | (490 | ) | | | (58,971 | ) | | | | | | (in million of Ps.) | | Shopping Centers | | | (101) | - | (1) | (102) | | Offices and Others | | | (42) | - | - | (42) | | Sales and Developments | | | (48,750 | ) | | | (530 | ) | | | (410 | ) | | | (49,690 | ) | | (36) | (1) | - | (37) | | Hotels | | | (76,271 | ) | | | - | | | | (1,296 | ) | | | (77,567 | ) | | (59) | - | (1) | (60) | | International | | | (55,746 | ) | | | - | | | | - | | | | (55,746 | ) | | (59) | - | - | (59) | | Financial operations and Others | | | - | | | | - | | | | - | | | | - | | | | Total Urban Properties and Investments Business General and Administrative Expenses | | | (374,481 | ) | | | (1,042 | ) | | | (2,602 | ) | | | (378,125 | ) | | | Financial Operations and Others | | | - | - | - | - | | Total Urban Properties and Investments Business | | | (297) | (1) | (2) | (300) |
| | | Fiscal year ended on June 30, 2014 | | | General and Administrative Expenses | | Income Statement | | | Interests in joint ventures | | | Inter-segment eliminations | | | Segment reporting | | | Shopping Center Properties | | | (100,710 | ) | | | (148 | ) | | | (680 | ) | | | (101,538 | ) | | Offices | | | (41,169 | ) | | | (145 | ) | | | (631 | ) | | | (41,945 | ) | | Sales and Developments | | | (36,955 | ) | | | (511 | ) | | | - | | | | (37,466 | ) | | Hotels | | | (58,562 | ) | | | - | | | | (1,023 | ) | | | (59,585 | ) | | International | | | (59,476 | ) | | | - | | | | - | | | | (59,476 | ) | | Financial operations and Others | | | (56 | ) | | | - | | | | - | | | | (56 | ) | | Total Urban Properties and Investments Business General and Administrative Expenses | | | (296,928 | ) | | | (804 | ) | | | (2,334 | ) | | | (300,066 | ) |
General and administrative expenses from our Urban Properties and Investments Business increased 26.1%.25.9%, from Ps. 296.9297 million in fiscal year 2014 to Ps. 374.5374 million in fiscal year 2015. This was mainly due to an increase of Ps. 34.634 million in the Shopping Center PropertiesCenters segment; an increase of Ps. 17.016 million in the Offices and Others segment; an increase of Ps. 18.018 million in the Hotels segment, an increase of Ps. 12.212 million in the Sales and Developments segment, partially offset by a reduction of Ps. 3.73 million in the International segment and a reduction of Ps. 0.1 million in the Financial operations and Others segment. On the other hand, administrative expenses from our joint ventures increased by 30.0%, from Ps. 0.8 milliondid not change in fiscal year 20142015 compared to Ps. 1.0 million in fiscal year 2015.2014, remaining stable at Ps. 1 million. Hence, according to business segment reporting and considering all our joint ventures and inter-segment eliminations, administrative expenses increased by 26.0%, from Ps. 300.1300 million in fiscal year 2014 to Ps. 378.1378 million in fiscal year 2015. Based on the reported business segment reporting and considering our joint ventures and inter-segment eliminations, administrative expenses as a percentage of sales increased from 13.9% in fiscal year 2014 to 14.8% in fiscal year 2015. Shopping Center PropertiesCenters Administrative expenses from the Shopping Center PropertiesCenters segment increased by 34.1%32.4%, from Ps. 101.5102 million in fiscal year 2014 to Ps. 136.2135 million in fiscal year 2015, mainly due to: · | an increase of Ps. 25.7 million in Directors’ fees; |
· an increase of Ps. 25 million in Directors’ fees; · | an increase of Ps. 3.3 million in fees and compensation from services; |
· an increase of Ps. 3 million in fees and compensation from services; · | an increase of Ps. 1.9 million in amortization and depreciation, and |
· an increase of Ps. 2 million in amortization and depreciation, and · | an increase of Ps. 3.8 million in other miscellaneous items, such as, maintenance, security, cleaning, repair and similar expenses, and taxes, rates and contributions. |
· an increase of Ps. 3 million in other miscellaneous items, such as, maintenance, security, cleaning, repair and similar expenses, and taxes, rates and contributions. Administrative expenses from the Shopping Center PropertiesCenters segment as a percentage of revenues derived from that segment slightlyrevenues increased from 7.3% in fiscal year 2014 to 7.7% in fiscal year 2015.
Offices and Others Administrative expenses from the Offices and Others segment increased by 40.6%40.5%, from Ps. 41.942 million in fiscal year 2014 to Ps. 59.059 million in fiscal year 2015, mainly due to: (i) an increase of Ps. 5.35 million in fees and compensation from services; (ii) an increase of Ps. 5.25 million in salaries and wages, social security contributions and other payroll expenses; (iii) an increase of Ps. 2.42 million in Directors’ fees; (iv) an increase of Ps. 2.02 million in travel and office supplies expenses, and (v) an increase of Ps. 1.52 million in bank expenses. As a percentage of segment revenues, derived from the Offices segment, general and administrative expenses increased from 15.5%15.4% in fiscal year 2014 to 17.7% in fiscal year 2015. Sales and Developments General and administrative expenses from the Sale and Developments segment increased by 32.6%35.1%, from Ps. 37.537 million in fiscal year 2014 to Ps. 49.750 million in fiscal year 2015, mainly due to: (i) an increase of Ps. 4.44 million in fees and compensation from services; (ii) an increase of Ps. 2.02 million in salaries and wages, social security contributions and other payroll expenses; (iii) an increase of Ps. 2.02 million in Directors’ fees; (iv) an increase of Ps. 1.72 million in travel and office supplies expenses, and (v) an increase of Ps. 1.31 million in bank expenses. General and administrative expenses from the Sales and Developments segment, as a percentage of revenues derived from this segment, increased from 43.8%43.9% in fiscal year 2014 to 362.5% in fiscal year 2015. Considering the gain from disposal of investment properties, such percentages decreased from 16.2 %4% in fiscal year 2014 to 4.3%0.5% in fiscal year 2015. Hotels General and administrative expenses from the Hotels segment increased by 30.2%30%, from Ps. 59.660 million in fiscal year 2014 to Ps. 77.678 million in fiscal year 2015, mainly due to: · | an increase of Ps. 9.5 million in salaries and wages, social security contributions and other payroll expenses; |
· an increase of Ps. 10 million in salaries and wages, social security contributions and other payroll expenses; · | an increase of Ps. 3.3 million in maintenance and repair expenses, and |
· an increase of Ps. 3 million in maintenance and repair expenses, and · | an increase of Ps. 2.0 million in the cost of fees from services and an increase of Ps. 1.5 million in the cost of food, beverages and other hotel-related expenses, among other items. |
· an increase of Ps. 2 million in the cost of fees from services and an increase of Ps. 1 million in the cost of food, beverages and other hotel-related expenses, among other items. General and administrative expenses from the Hotels segment, as a percentage of revenues derived from this segment, increased from 18.0% in fiscal year 2014 to 19.6% in fiscal year 2015. International General and administrative expenses from the International segment decreased by Ps. 3.73 million from Ps. 59.559 million in fiscal year 2014 to Ps. 55.756 million in fiscal year 2015, mostly due to the fact that the results of Rigby 183 LLC – owner of the rental building Madison 183 which was sold in September 2014- were consolidated for only 3three months in fiscal year 2015 whereas such results were consolidated for 12 months in fiscal year 2014, and to lower expenses incurred in connection with our interest in IDBD. General and administrative expenses from the International segment, as a percentage of revenues derived from this segment, increased from 70.9% in fiscal year 2014 to 215.5% in fiscal year 2015. Financial Operations and Others
Selling expenses General and administrative expenses associated to our Financial Operations and Others segment did not show significant changes for the fiscal years under discussion.
SELLING EXPENSES
TotalOur total selling expenses of the Company increased 33.9%33.6%, from Ps. 359.0360 million for fiscal year 2014 to Ps. 480.7481 million for fiscal year 2015. This was mainly due to an increase of Ps. 75.976 million in the Agricultural business and an increase of Ps. 45.845 million in the Urban Properties and Investments business.
Agricultural Business | | | | | Fiscal year ended June 30, 2015 | | | | Selling Expenses | | Statement of Income | Interests in joint ventures | Inter-segment eliminations | Segment reporting | | | | | | (in million of Ps.) | | | | Crops | | (157) | (3) | (1) | (161) | | | | Cattle | | (20) | - | - | (20) | | | | Dairy | | (4) | - | - | (4) | | | | Sugarcane | | (8) | - | - | (8) | | | | Subtotal Agricultural Production | | (189) | (3) | (1) | (193) | | | | Land Transformation and Sales | | (1) | (1) | - | (2) | | | | Agro-industrial | | (77) | �� - | - | (77) | | | | Others segments | | (13) | - | - | (13) | | | | Agricultural rental and Services | | (1) | - | - | (1) | | | | Subtotal Others | | (91) | - | - | (91) | | | | Total Agricultural Business | | (281) | (4) | (1) | (286) | | | | Fiscal year ended on June 30, 2015 | | | | Fiscal year ended June 30, 2014 | | | Selling Expenses | | Income Statement | | | Interests in joint ventures | | | Inter-segment eliminations | | | Segment reporting | | Selling Expenses | | Statement of Income | Interests in joint ventures | Inter-segment eliminations | Segment reporting | | | | | | | (in million of Ps.) | | | Crops | | | (157,541 | ) | | | (2,837 | ) | | | - | | | | (160,378 | ) | Crops | | (113) | (2) | - | (115) | | | Cattle | | | (20,084 | ) | | | (25 | ) | | | - | | | | (20,109 | ) | Cattle | | (14) | - | - | (14) | | | Dairy | | | (3,667 | ) | | | | | | | - | | | | (3,667 | ) | Dairy | | (2) | - | - | (2) | | | Sugarcane | | | (7,770 | ) | | | | | | | - | | | | (7,770 | ) | Sugarcane | | (8) | - | - | (8) | | | Agricultural rental and services | | | (717 | ) | | | - | | | | - | | | | (717 | ) | | | Agricultural Subtotal | | | (189,779 | ) | | | (2,862 | ) | | | - | | | | (192,641 | ) | | | Land transformations and sales | | | (1,103 | ) | | | (1,280 | ) | | | - | | | | (2,383 | ) | | | Subtotal Agricultural Production | | Subtotal Agricultural Production | | (137) | (2) | - | (139) | | | Land Transformation and Sales | | Land Transformation and Sales | | (4) | - | - | (4) | | | Agro-industrial | | | (77,146 | ) | | | | | | | - | | | | (77,146 | ) | Agro-industrial | | (55) | - | - | (55) | | | Other Segments | | | (12,660 | ) | | | - | | | | - | | | | (12,660 | ) | | | Total Agricultural Business Selling Expenses | | | (280,688 | ) | | | (4,142 | ) | | | - | | | | (284,830 | ) | | | Others segments | | Others segments | | (11) | - | - | (11) | | | Agricultural rental and Services | | Agricultural rental and Services | | (1) | - | - | (1) | | | Subtotal Others | | Subtotal Others | | (67) | - | - | (67) | | | Total Agricultural Business | | Total Agricultural Business | | (208) | (2) | - | (210) | |
| | | Fiscal year ended on June 30, 2014 | | | Selling Expenses | | Income Statement | | | Interests in joint ventures | | | Inter-segment eliminations | | | Segment reporting | | | Crops | | | (115,497 | ) | | | (2,332 | ) | | | - | | | | (117,829 | ) | | Cattle | | | (13,769 | ) | | | (85 | ) | | | - | | | | (13,854 | ) | | Dairy | | | (2,249 | ) | | | - | | | | - | | | | (2,249 | ) | | Sugarcane | | | (4,871 | ) | | | - | | | | - | | | | (4,871 | ) | | Agricultural rental and services | | | (754 | ) | | | (25 | ) | | | - | | | | (779 | ) | | Agricultural Subtotal | | | (137,140 | ) | | | (2,442 | ) | | | - | | | | (139,582 | ) | | Land transformations and sales | | | (3,873 | ) | | | - | | | | - | | | | (3,873 | ) | | Agro-industrial | | | (54,751 | ) | | | - | | | | - | | | | (54,751 | ) | | Other Segments | | | (10,726 | ) | | | - | | | | - | | | | (10,726 | ) | | Total Agricultural Business Selling Expenses | | | (206,490 | ) | | | (2,442 | ) | | | - | | | | (208,932 | ) |
Selling expenses from our Agricultural business increased 35.9%35.1% from Ps. 206.5208 million in fiscal year 2014 to Ps. 280.7281 million in fiscal year 2015. This was caused mainly by an increase of Ps. 42.544 million in the Crops segment, an increase of Ps. 6.36 million in the Cattle segment, an increase of Ps. 1.42 million in the Dairy segment, an increase of Ps. 2.9 million in the Sugarcane segment, an increase of Ps. 22.422 million in the Agro-industrial segment, and an increase of Ps. 1.92 million in the Other segments,segment, partially offset by a reduction of Ps. 0.1 million in the Agricultural rental and services segment and a reduction of Ps. 1.53 million in the Land transformationTransformation and salesSales segment. In turn, selling expenses from our interests in joint ventures increased by 69.6%100% from Ps. 2.42 million in fiscal year 2014 to Ps. 4.14 million in fiscal year 2015, in connection with our Cresca joint venture. On the other hand, inter-segment eliminations increased by Ps. 1 million in fiscal year 2015 compared to fiscal year 2014, in which there had been no inter-segment eliminations arose from selling expenses. Hence, according to business segment reporting and considering all our joint ventures and inter-segment eliminations, selling expenses increased by 36.3%36.2%, from Ps. 208.9210 million in fiscal year 2014 to Ps. 284.8286 million in fiscal year 2015. Urban Properties and Investments Business | | | Fiscal year ended on June 30, 2015 | | | Fiscal year ended June 30, 2015 | | Selling Expenses | | Income Statement | | | Interests in joint ventures | | | Inter-segment eliminations | | | Segment reporting | | | | Shopping Center Properties | | | (111,922 | ) | | | (783 | ) | | | (120 | ) | | | (112,825 | ) | | | Offices | | | (20,633 | ) | | | (497 | ) | | | - | | | | (21,130 | ) | | | Selling expenses | | | Statement of Income | Interests in joint ventures | Inter-segment eliminations | Segment reporting | | | | | (in million of Ps.) | | Shopping Centers | | | (112) | (1) | - | (113) | | Offices and Others | | | (21) | - | - | (21) | | Sales and Developments | | | (8,351 | ) | | | (795 | ) | | | - | | | | (9,146 | ) | | (8) | (1) | - | (9) | | Hotels | | | (52,185 | ) | | | - | | | | (201 | ) | | | (52,386 | ) | | (52) | - | - | (52) | | International | | | - | | | | - | | | | - | | | | - | | | - | - | - | - | | Financial Operations and Others | | | (379 | ) | | | - | | | | - | | | | (379 | ) | | - | - | - | - | | Total Urban Properties and Investments Business Selling Expenses | | | (193,470 | ) | | | (2,075 | ) | | | (321 | ) | | | (195,866 | ) | | | Total Urban Properties and Investment Business | | | (193) | (2) | - | (195) |
| | | Fiscal year ended June 30, 2014 | | Selling expenses | | Statement of Income | Interests in joint ventures | Inter-segment eliminations | Segment reporting | | | | (in million of Ps.) | | Shopping Centers | | (72) | (1) | - | (73) | | Offices and Others | | (21) | - | - | (21) | | Sales and Developments | | (11) | (3) | - | (14) | | Hotels | | (42) | - | - | (42) | | International | | - | - | - | - | | Financial Operations and Others | | - | - | - | - | | Total Urban Properties and Investment Business | | (146) | (4) | - | (150) |
| | | Fiscal year ended on June 30, 2014 | | | Selling Expenses | | Income Statement | | | Interests in joint ventures | | | Inter-segment eliminations | | | Segment reporting | | | Shopping Center Properties | | | (72,531 | ) | | | (687 | ) | | | (209 | ) | | | (73,427 | ) | | Offices | | | (20,307 | ) | | | (444 | ) | | | - | | | | (20,751 | ) | | Sales and Developments | | | (11,330 | ) | | | (2,376 | ) | | | - | | | | (13,706 | ) | | Hotels | | | (42,178 | ) | | | - | | | | (157 | ) | | | (42,335 | ) | | International | | | - | | | | - | | | | - | | | | - | | | Financial operations and Others | | | 110 | | | | - | | | | - | | | | 110 | | | Total Urban Properties and Investments Business Selling Expenses | | | (146,236 | ) | | | (3,507 | ) | | | (366 | ) | | | (150,109 | ) |
Selling expenses from our Urban Properties and Investments business increased 32.3%32.2%, from Ps. 146.2146 million in fiscal year 2014 to Ps. 193.5193 million in fiscal year 2015. This was mainly due to an increase of Ps. 39.440 million in the Shopping Center PropertiesCenters segment, an increase of Ps. 10.110 million in the Hotels segment, an increase of Ps. 0.4 million in the Offices segment, and an increase of Ps. 0.5 million in the Financial Operations and Others segment, partially offset by a reduction of Ps. 4.63 million in the Sales and Developments segment. On the other hand, selling expenses from our joint ventures went down by 40.8%50%, from Ps. 3.54 million in fiscal year 2014 (out of which Ps. 2.42 million was allocated to the Sales and Developments segment) to Ps. 2.12 million (out of which Ps. 0.81 million was allocated to the Sales and Developments segment) in fiscal year 2015. This reduction is mainly attributable to lower expenses from our Cyrsa S.A. joint venture as a result of the recognition of fewer sales from the Horizons development in fiscal year 2015. Hence, based on the information by segment, selling expenses increased by 30.5%30.0% from Ps. 150.1150 million in fiscal year 2014 to Ps. 195.9195 million in fiscal year 2015. Based on the information by segment, selling expenses as a percentage of revenues experienced a slight increase from 7.0% in fiscal year 2014 to 7.7% in fiscal year 2015. Shopping Center PropertiesCenters Selling expenses from the Shopping Center PropertiesCenters segment increased by 53.7%54.8%, from Ps. 73.473 million in fiscal year 2014 to Ps. 112.8113 million in fiscal year 2015, mainly due to: · · | an increase of Ps. 18.1 million in taxes, rates and contributions, mainly due to a higher turnover tax liability; |
an increase of Ps. 18 million in taxes, rates and contributions, mainly due to a higher turnover tax liability; · | an increase of Ps. 7.7 million in advertising expenses; |
· an increase of Ps. 8 million in advertising expenses; · | an increase of Ps. 5.1 million in bad debtors; and |
· an increase of Ps. 5 million in bad debtors; and · | an increase of Ps. 6.1 million in salaries and wages, social security contributions and other payroll expenses. |
· an increase of Ps. 6 million in salaries and wages, social security contributions and other payroll expenses. Selling expenses from the Shopping Center PropertiesCenters segment as a percentage of revenues derived from that segment increased from 5.3 % in fiscal year 2014 to 6.3% in fiscal year 2015.
Offices and Others Selling expenses from our Offices and Others segment increased by 1.8%, from Ps. 20.8 million inremained stable during fiscal yearyears 2015 and 2014, amounting to Ps. 21.1 million in fiscal year 2015, mainly as a result of an increase in the turnover tax liability due to the transfer of buildings, offset by a reduction in bad debtors.21 million. Selling expenses from the Offices and Others segment, as a percentage of revenues derived from this segment, decreased from 7.6% in fiscal year 2014 to 6.3% in fiscal year 2015. Sales and Developments Selling expenses from the Sales and Developments segment decreased by 33.3%35.7%, from Ps. 13.714 million in fiscal year 2014 to Ps. 9.19 million in fiscal year 2015, mainly as a result of a reduction in expenses directly related to the sales volume: taxes, rates and contributions by Ps. 3.43 million and sales commissions by Ps. 1.11 million. Selling expenses from the Sales and Developments segment, as a percentage of revenues derived from this segment, increased from 16.0% in fiscal year 2014 to 66.7% in fiscal year 2015. Hotels Selling expenses from our Hotels segment increased by 23.7%23.8%, from Ps. 42.342 million in fiscal year 2014 to Ps. 52.452 million in fiscal year 2015, mainly due to: · | an increase of Ps. 3.1 million in advertising and other selling expenses; |
· an increase of Ps. 3 million in advertising and other selling expenses; · | an increase of Ps. 2.6 million in taxes, rates and contributions; and |
· an increase of Ps. 3 million in taxes, rates and contributions; and · | an increase of Ps. 2.6 million in salaries and wages, social security contributions and other payroll expenses, among other items. |
· an increase of Ps. 3 million in salaries and wages, social security contributions and other payroll expenses, among other items. Selling expenses from our Hotels segment as a percentage of revenues derived from this segment stood at approximatelyaround 13% in both fiscal years. Financial operationsOperations and Others Selling expenses from our Financial operationsOperations and Others segment increased by Ps. 0.5 million, from a gain of Ps. 0.1 milliondid not suffer significant changes in fiscal year 2014 to a loss of Ps. 0.4 million in fiscal yearyears 2015 mainly as a result of an increase in bad debtors in connection with the Company’s personal financing residual activity.and 2014. OTHER OPERATING RESULTS, NET
Other operating results, net of the Company Our other operating results, net increased Ps. 88.088 million, from a Ps. 77.578 million loss in fiscal year 2014 to ana Ps. 10 million income of Ps. 10.6 million in fiscal year 2015. This was mainly due to a Ps. 10 million increase in the Agricultural business and a Ps. 78 million increase in the Urban Properties and Investment business.
Agricultural Business | | | Fiscal year ended on June 30, 2015 | | | Fiscal year ended June 30, 2015 | | Other operating results, net | | Income Statement | | | Interests in joint ventures | | | Inter-segment eliminations | | | Segment reporting | | | Statement of Income | Interests in joint ventures | Inter-segment eliminations | Segment reporting | | | | | (in million of Ps.) | | Crops | | | (7,708 | ) | | | (928 | ) | | | - | | | | (8,636 | ) | | (7) | (1) | (9) | | Cattle | | | (2,242 | ) | | | (916 | ) | | | - | | | | (3,158 | ) | | (2) | (1) | - | (3) | | Dairy | | | (773 | ) | | | - | | | | - | | | | (773 | ) | | (1) | - | - | (1) | | Sugarcane | | | (1,669 | ) | | | - | | | | - | | | | (1,669 | ) | | (2) | - | - | (2) | | Agricultural rental and services | | | (336 | ) | | | - | | | | - | | | | (336 | ) | | | Agricultural Subtotal | | | (12,728 | ) | | | (1,844 | ) | | | - | | | | (14,572 | ) | | | Land transformations and sales | | | (4,601 | ) | | | - | | | | - | | | | (4,601 | ) | | | Subtotal Agricultural Production | | | (12) | (2) | (1) | (15) | | Land Transformation and Sales | | | (5) | - | - | (5) | | Agro-industrial | | | (288 | ) | | | - | | | | - | | | | (288 | ) | | - | - | - | - | | Other Segments | | | 1,338 | | | | - | | | | - | | | | 1,338 | | | | Total Agricultural Business Other operating results, net | | | (16,279 | ) | | | (1,844 | ) | | | - | | | | (18,123 | ) | | | Others segments | | | 1 | - | - | 1 | | Agricultural rental and Services | | | - | - | - | - | | Subtotal Others | | | 1 | - | - | 1 | | Total Agricultural Business | | | (16) | (2) | (1) | (19) |
| | | Fiscal year ended on June 30, 2014 | | | Fiscal year ended June 30, 2014 | | Other operating results, net | | Income Statement | | | Interests in joint ventures | | | Inter-segment eliminations | | | Segment reporting | | | Statement of Income | Interests in joint ventures | Inter-segment eliminations | Segment reporting | | | | | (in million of Ps.) | | Crops | | | (28,992 | ) | | | (363 | ) | | | - | | | | (29,355 | ) | | (27) | 1 | (1) | (27) | | Cattle | | | (1,955 | ) | | | (44 | ) | | | - | | | | (1,999 | ) | | (2) | - | - | (2) | | Dairy | | | (417 | ) | | | - | | | | - | | | | (417 | ) | | - | - | - | - | | Sugarcane | | | 104 | | | | - | | | | - | | | | 104 | | | - | - | - | - | | Agricultural rental and services | | | (189 | ) | | | (33 | ) | | | - | | | | (222 | ) | | | Agricultural Subtotal | | | (31,449 | ) | | | (440 | ) | | | - | | | | (31,889 | ) | | | Land transformations and sales | | | (82 | ) | | | - | | | | - | | | | (82 | ) | | | Subtotal Agricultural Production | | | (29) | 1 | (1) | (29) | | Land Transformation and Sales | | | - | - | - | - | | Agro-industrial | | | (868 | ) | | | - | | | | - | | | | (868 | ) | | (1) | - | - | (1) | | Other Segments | | | 3,261 | | | | 38 | | | | - | | | | 3,299 | | | | Total Agricultural Business Other operating results, net | | | (29,138 | ) | | | (402 | ) | | | - | | | | (29,540 | ) | | | Others segments | | | 1 | - | - | 1 | | Agricultural rental and Services | | | - | - | - | - | | Subtotal Others | | | - | - | - | - | | Total Agricultural Business | | | (29) | 1 | (1) | (29) |
Other operating results, net from the Agricultural business increased from a loss of Ps. 29.129 million in fiscal year 2014 to a loss of Ps. 16.316 million in fiscal year 2015, mainly as a result of a Ps. 20.720 million decrease in the CropsCroops segment, partially offset by a Ps. 1.82 million increase in the Sugarcane segment, Ps. 4.55 million in the Land transformationTransformation and sales segment and Ps. 2.0 million in the Other segments.Sales segment. In turn, other operating results, net from our interests in joint ventures decreasedincreased by 358.7%300% from a Ps. 0.41 million lossincome in fiscal year 2014 to a Ps. 1.82 million loss in fiscal year 2015, in connection with our Cresca joint venture.
On the other hand, no inter-segment eliminations arose from operating results, net. Hence, according to business segment reporting and considering all our joint ventures, other operating results, net increased from a Ps. 29.529 million loss in fiscal year 2014 to a Ps. 18.119 million loss in fiscal year 2015. Crops Other operating results, net of the Crops segment decreased Ps. 20.720 million, from a Ps. 29.427 million loss in fiscal year 2014 to a Ps. 8.67 million loss in fiscal year 2015, mainly as a result of the commodity derivatives held by Brasilagro and Cresud (Ps. 23.123 million), partially offset by the charge to income of the reversal of Brasilagro’s labor and legal contingency liability in fiscal year 2014. Sugarcane Other operating results, net of the Sugarcane segment increased by Ps. 1.82 million, from a Ps. 0.1 million gain in fiscal year 2014 to a Ps. 1.72 million loss in fiscal year 2015. Other Segments
Other operating results, net of the Other segments decreased by Ps. 1.9 million, from a Ps. 3.3 million gain in fiscal year 2014 to a Ps. 1.3 million gain in fiscal year 2015.
The rest of the segments of the Agricultural business did not record significant changes. Urban Properties and Investments Business | | | Fiscal year ended on June 30, 2015 | | | Fiscal year ended June 30, 2015 | | | Other operating results, net | | Income Statement | | | Interests in joint ventures | | | Inter-segment eliminations | | | Segment reporting | | | Statement of Income | Interests in joint ventures | Inter-segment eliminations | Segment reporting | | | Shopping Center Properties | | | (47,650 | ) | | | (1,160 | ) | | | - | | | | (48,810 | ) | | | Offices | | | (118,371 | ) | | | 56 | | | | 705 | | | | (117,610 | ) | | | | | | (in million of Ps.) | | | Shopping Centers | | | (48) | (1) | - | (49) | | | Offices and Others | | | (120) | 1 | 1 | (118) | | | Sales and Developments | | | 12,503 | | | | (1 | ) | | | 591 | | | | 13,093 | | | 13 | - | - | 13 | | | Hotels | | | (461 | ) | | | - | | | | - | | | | (461 | ) | | - | - | - | - | | | International | | | 184,886 | | | | - | | | | - | | | | 184,886 | | | 185 | - | - | 185 | | | Financial operations and Others | | | (2,419 | ) | | | - | | | | - | | | | (2,419 | ) | | | Total Urban Properties and Investments Business other operating results, net | | | 28,488 | | | | (1,105 | ) | | | 1,296 | | | | 28,679 | | | | Financial Operations and Others | | | (2) | - | - | (2) | | | Total Urban Properties and Investments Business | | | 28 | - | 1 | 29 | | | | | | | Fiscal year ended on June 30, 2014 | | Other operating results, net | | Other operating results, net | | Statement of Income | Interests in joint ventures | Inter-segment eliminations | Segment reporting | | | | | | (in million of Ps.) | | Shopping Centers | | Shopping Centers | | (46) | (1) | - | (47) | | Offices and Others | | Offices and Others | | (1) | (3) | 1 | (3) | | Sales and Developments | | Sales and Developments | | 8 | - | - | 8 | | Hotels | | Hotels | | (3) | - | - | (3) | | International | | International | | (1) | - | - | (1) | | Financial Operations and Others | | Financial Operations and Others | | (3) | - | - | (3) | | Total Urban Properties and Investments Business | | Total Urban Properties and Investments Business | | (46) | (4) | 1 | (49) |
| | | Fiscal year ended on June 30, 2014 | | | Other operating results, net | | Income Statement | | | Interests in joint ventures | | | Inter-segment eliminations | | | Segment reporting | | | Shopping Center Properties | | | (45,953 | ) | | | (723 | ) | | | 108 | | | | (46,568 | ) | | Offices | | | (1,786 | ) | | | (2,297 | ) | | | 1,023 | | | | (3,060 | ) | | Sales and Developments | | | 8,300 | | | | (163 | ) | | | - | | | | 8,137 | | | Hotels | | | (2,680 | ) | | | - | | | | - | | | | (2,680 | ) | | International | | | (895 | ) | | | - | | | | - | | | | (895 | ) | | Financial operations and Others | | | (2,856 | ) | | | - | | | | - | | | | (2,856 | ) | | Total Urban Properties and Investments Business other operating results, net | | | (45,870 | ) | | | (3,183 | ) | | | 1,131 | | | | (47,922 | ) |
Other operating results, net from the Urban Properties and Investments business increased by Ps. 74.474 million from a Ps. 45.946 million loss in fiscal year 2014 to a Ps. 28.528 million gain in fiscal year 2015, mainly as a result of a Ps. 184.9185 million gain derived from the International segment. The effect from the consolidation of our joint ventures is not material on this line. According to business segment reporting and considering all our joint ventures and inter-segment eliminations, other operating results, net improved from a Ps. 47.949 million loss in fiscal year 2014 to a Ps. 28.729 million gain in fiscal year 2015. Shopping Center PropertiesCenters The net loss from other operating results of the Shopping Center PropertiesCenters segment increased by 4.8%4.3%, from Ps. 46.646 million in fiscal year 2014 to Ps. 48.848 million in fiscal year 2015, mainly as a result of a Ps. 2.73 million increase in the donation charge. The net loss from other operating results, as a percentage of revenues derived from the Shopping Center PropertiesCenters segment, decreased from 3.4%3.3% in fiscal year 2014 to 2.7% in fiscal year 2015. Offices and Others The net loss from other operating results of our Offices and Others segment increased Ps. 114.5119 million from Ps. 3.11 million in fiscal year 2014 to Ps. 117.6120 million in fiscal year 2015, mainly as a result of expenses incurred in the transfer of assets from IRSA to IRSA Commercial PropertiesCP for Ps. 110.5.111 million. The net loss from operating results of our Offices and Others segment, as a percentage of revenues derived from this segment, increased from 1.1% in fiscal year 2014 to 35.3% in fiscal year 2015. Sales and Developments The net gain from other operating results of our Sales and Developments segment increased Ps. 4.95 million from Ps. 8.18 million in fiscal year 2014 to Ps. 13.113 million in fiscal year 2015, mainly due to: · | the gain recorded in fiscal year 2015 from the sale of our equity interest in Bitania for Ps. 16.1 million; |
· | a reduction of Ps. 2.1 million in the reserve for lawsuits and contingencies; and |
· | the non-recurrence in fiscal year 2015 of an “admission fee” charged in connection with the sale of a hotel plot in Neuquén recorded in fiscal year 2014. |
· the gain recorded in fiscal year 2015 from the sale of our interest in Bitania for Ps. 16 million; 128
· a reduction of Ps. 2 million in the provisions for lawsuits and contingencies; partially offset by · the non-recurrence, during fiscal year 2015, of a fee charged as “fee for admission to the undertaking” in connection with the sale of the Neuquén lot for development of a hotel that took place in fiscal year 2014. Hotels The net loss from operating results of our HotelHotels segment decreased by Ps. 2.33 million, from Ps. 2.73 million in fiscal year 2014 to Ps. 0.50 million in fiscal year 2015, mainly as a result of a reduction in the reserve for lawsuits and other contingencies. The net loss from operating results of our Hotels segment, as a percentage of revenues derived from this segment, decreased from 0.8% in fiscal year 2014 to 0.1% in fiscal year 2015. International Other operating results, net from this segment increased from a net loss of Ps. 0.91 million in fiscal year 2014 to a net gain of Ps. 184.9185 million in fiscal year 2015, mainly as a result of the gain from the partial reversal of accumulated translation differences following Rigby 183 LLC’s partial liquidation. Financial operationsOperations and Others Other operating results, net from our Financial operationsOperations and Others segment decreased by Ps. 0.51 million from Ps. 2.93 million in fiscal year 2014 to Ps. 2.42 million in fiscal year 2015, mainly due to lower taxes deducted by BHSA on lower dividends distributed in fiscal year 2015 to our subsidiaries Ritelco and Tyrus. PROFIT
Profit / (LOSS) FROM OPERATIONS(loss) from operations As a result of the above mentioned factors, the Company’sour profit / (loss) from operations increased by Ps. 1,607.51,625 million (135.6%(135.2%), from a gain of Ps. 1,185.21,202 million in fiscal year 2014 to a gain of Ps. 2,792.72,827 million in fiscal year 2015.
Agricultural Business Profit / (loss) from operations of the Agricultural business increased by Ps. 345.7345 million (926.4%(907.9%), from a 37.3Ps. 38 million loss in fiscal year 2014 to a Ps. 308.4307 million gain in fiscal year 2015. Crops Profit / (loss)Loss from operations of this segment increased by Ps. 105.4137 million (71.5%(97.9%), from a 147.5Ps. 140 million loss in fiscal year 2014 to a Ps. 252.9277 million loss in fiscal year 2015.
Cattle Profit / (loss) from operations of this segment increased by Ps. 4.65 million (14.3%(16.1%), from a Ps. 32.131 million gain in fiscal year 2014 to a Ps. 36.736 million gain in fiscal year 2015. Dairy Profit / (loss) from operations of this segment increaseddecreased by Ps. 0.21 million (5.2%(20.0%), from a Ps. 4.05 million gain in fiscal year 2014 to a Ps. 4.24 million gain in fiscal year 2015. Sugarcane Loss from operations of this segment decreased by Ps. 10 million (43.5%), from a Ps. 23 million loss in fiscal year 2014 to a Ps. 13 million loss in fiscal year 2015. Agricultural Rental and Services Profit from operations of this segment increased by Ps. 30 million (428.6%), from a Ps. 7 million gain in fiscal year 2014 to a Ps. 37 million gain in fiscal year 2015. Land Transformation and Sales Profit from operations of this segment increased by Ps. 474 million, from a Ps. 78 million gain in fiscal year 2014 to a Ps. 552 million gain in fiscal year 2015. Agro-industrial Profit / (loss) from operations of this segment decreased by Ps. 7.536 million, from a 19.7Ps. 1 million lossgain in fiscal year 2014 to a Ps. 12.135 million loss in fiscal year 2015. Agricultural rental and services
Other Profit / (loss) from operations of this segment increased by Ps. 6.7 million (82.5%), from a Ps. 8.0 million gain indid no record any changes for fiscal year 2014 to a Ps. 14.8 million gain invs. fiscal year 2015. Land transformations and sales
Profit / (loss) from operations of this segment increased by Ps. 473.4 million, from a Ps. 78.0 million gain in fiscal year 2014 to a Ps. 551.4 million gain in fiscal year 2015.
Agro-industrial Activities
Profit / (loss) from operations of this segment increased by Ps. 37.8 million, from a Ps. 1.9 million gain in fiscal year 2014 to a Ps. 35.6 million gain in fiscal year 2015.
Other Segments
Profit / (loss) from operations of this segment decreased by Ps. 3.5 million, from a Ps. 5.7 million gain in fiscal year 2014 to a Ps. 2.2 million gain in fiscal year 2015.
Urban Properties and Investments Business Profit from operations of this segment increased by Ps. 1,278.21,280 million (103.1%(103.2%), from a Ps. 1,240.31,240 million gain in fiscal year 2014 to a Ps. 2,518.52,520 million gain in fiscal year 2015. This was mainly due to an increase of Ps. 1,362.71,364 million in the Shopping Center Properties,Centers, Sales and Developments, and International segments, partially offset by a Ps. 84.584 million reduction in the Offices and Others, Hotels, and Financial Operations and Others segments. Shopping Center PropertiesCenters Profit / (loss) from operations of our Shopping Center PropertiesCenters segment increased by 37.5%, from a gain of Ps. 864.7864 million in fiscal year 2014 to a gain of Ps. 1,189.31,190 million in fiscal year 2015. Profit from operations of our Shopping Center PropertiesCenters segment, as a percentage of the revenues derived from this segment, decreased from 79.6%62.5% in fiscal year 2014 to 66.9% in fiscal year 2015. Offices and Others Profit from operations of our Offices and Others segment decreased by 38.4%39.6%, from a gain of Ps. 160.0160 million in fiscal year 2014 to a gain of Ps. 98.699 million in fiscal year 2015. Profit from operations of our Offices and Others segment, as a percentage of the revenues derived from this segment, decreased from 70.9%59.0% in fiscal year 2014 to 29.7% in fiscal year 2015. Sales and Developments Profit from operations of our Sales and Developments segment increased by 360.6%, from a gain of Ps. 238.5239 million in fiscal year 2014 to a gain of Ps. 1,098.71,099 million in fiscal year 2015. Profit from operations of our Sales and Developments segment, as a percentage of the revenues derived from this segment, increased from 471.7%277.9% in fiscal year 2014 to 8,015.9%7,850.0% in fiscal year 2015.
Hotels Profit / (loss) from operations of our Hotels segment decreased from a gain of Ps. 10.211 million in fiscal year 2014 to a loss of Ps. 12.812 million in fiscal year 2015. International Profit / (loss) from operations of our International segment increased from a loss of Ps. 30.030 million in fiscal year 2014 to a gain of Ps. 147.9148 million in fiscal year 2015. Financial operationsOperations and othersOthers Profit / (loss)Loss from operations of our Financial operationsOperations and Others segment increased fromdid not record any significant changes, amounting to a loss of Ps. 3.23 million induring fiscal yearyears 2014 to a gain of Ps. 3.3 million in fiscal yearand 2015.
Share of (loss) / profitloss of associates and joint ventures Share of loss of associates and joint ventures increased by Ps. 616.3615 million, from a loss of Ps. 408.7410 million in fiscal year 2014 to a loss of Ps. 1,025.01,025 million in fiscal year 2015. This was caused mainly by: · | a Ps. 613.7 million increase in our related companies’ interest in the Urban Properties and Investments business in fiscal year 2015. Such increase was mainly attributable to a Ps. 25.4 million increase in losses from our interest in New Lipstick LLC and a Ps. 65.7 million increase in losses from our interest in Condor (International segment), a Ps. 41.2 million increase in gains from our investment in BHSA, offset by negative results from our investment in IDBD for Ps. 588.9· a Ps. 614 million increase in our related companies’ interest in the Urban Properties and Investments business in fiscal year 2015. Such increase was mainly attributable to higher losses of Ps. 25 million from our interest in New Lipstick LLC and Ps. 66 million from our interest in Supertel (International segment), a Ps. 41 million increase in gains from our investment in BHSA, offset by negative results from our investment in IDBD for Ps. 589 million, mainly as a result of the recovery in the market value of this company’s stock; and |
· | a Ps. 2.6 million reduction in revenues from the Agricultural business, mainly as a result of the revenues incurred in the investment in Agro-Uranga (Crops segment). |
NET FINANCIAL RESULTS· lower revenues of Ps. 3 million from the Agricultural business, mainly as a result of the revenues incurred in the investment in Agro-Uranga (Crops segment). In turn, share of profit of associates and joint ventures decreased from our interests in joint ventures increased by 31.25% from Ps. 16 million income in fiscal year 2014 to a Ps. 11 million income in fiscal year 2015, mainly as a consequence of 83.3% increase in our Cresca joint venture, up from a loss of Ps. 10 million in fiscal year 2014 to a loss of Ps. 2 million in fiscal year 2015. On the other hand, no inter-segment eliminations arose from share of (loss) / profit of associates and joint ventures. Hence, according to business segment reporting and considering all our joint ventures, share of loss of associates and joint ventures increased by 143.19% from a Ps. 426 million loss in fiscal year 2014 to a Ps. 1,036 million loss in fiscal year 2015. Financial results, net We had a lower net financial loss of Ps. 1,286.21,286 million, from a loss of Ps. 2,574.42,574 million in fiscal year 2014 to a loss of Ps. 1,288.21,288 million in fiscal year 2015. This was primarily due to: · | a lower loss of Ps. 1,337.5 million in net exchange differences in fiscal year 2015; |
· a lower loss of Ps. 1,337 million in net exchange differences in fiscal year 2015; · | a higher loss of Ps. 167.9 million in net financial interest recorded in fiscal year 2015; |
· a higher loss of Ps. 168 million in net financial interest recorded in fiscal year 2015; · | a higher income of Ps. 32.2 million in revaluation of receivables from sale of farms in fiscal year 2015; |
· a higher income of Ps. 32 million in revaluation of receivables from sale of farms in fiscal year 2015; · | a lower loss of Ps. 282.2 million in derivative financial instruments in fiscal year 2015; and |
· a lower loss of Ps. 284 million in derivative financial instruments in fiscal year 2015; and · | slightly offset by a gain of Ps. 1.7 million generated by the results from Financial Operations and Others in fiscal year 2015. |
· slightly offset by a gain of Ps. 2 million generated by the results from Financial Operations and Others in fiscal year 2015. Our net financial loss in fiscal year 2015 was mainly attributable to (i) a Ps. 686.4686 million loss generated by exchange differences mainly as a result of a higher liability position in US dollars due to the issuance of new series of notes; (ii) a loss of Ps. 886.7887 million generated by interest accrued on debt financing, mainly due to increased indebtedness and higher interest rates; and (iii) a loss of Ps. 83.582 million generated mainly by derivative instruments due to IDBD’s tender offer. There was a 12%11.7% variation in the U.S. Dollar buying rate during fiscal year 2015 (it increased from Ps. 8.0338.133 as of June 30, 2014 to Ps. 8.9889.088 as of June 30, 2015) as compared to the previous fiscal year, when the U.S. Dollar quotation had experienced a larger variation of 50%50.9% (from Ps. 5.3485.388 as of June 30, 2013 to Ps. 8.0338.133 as of June 30, 2014). Income tax Our income tax expense increased Ps. 692.8693 million, from a Ps. 389.4389 million gain in fiscal year 2014 to Ps. 303.3303 million loss in fiscal year 2015. The Company recognizesWe recognize the income tax expense on the basis of the deferred tax liability method, thus recognizing temporary differences between accounting and tax assets and liabilities measurements. The main temporary differences for the AgriculturalAgriculture business derive from valuation of cattle stock and sale and replacement of property, plant and equipment, while those corresponding to the Urban Properties and Investments business derive from the sale and replacement of investment properties. For purposes of determining the deferred assets and liabilities, the tax rate expected to be in force at the time of their reversion or use, according to the legal provisions enacted as of the date of issuance of these financial statements, has been applied to the identified temporary differences and tax losses. Profit / (loss) for the Fiscal Year Due to the above mentioned factors, our profit / (loss) for the fiscal year increased by Ps. 1,584.62,165 million (112.51%(153.7%) from a Ps. 1,408.41,409 million net loss for fiscal year 2014 to a Ps. 176.2176 million net income in fiscal year 2015. Profit / (loss) for fiscal years 2015 and 2014 is attributable to the controlling company’s shareholders and non-controlling interest, as per the following detail: · | · Profit / (loss) for the fiscal year attributable to the controlling company’s shareholders increased from a loss of Ps. 1,067.9 million in fiscal year 2014 to a loss of Ps. 249.6 million in fiscal year 2015; and |
· | the non-controlling interest in controlled companies went from a loss of Ps. 340.5 million in fiscal year 2014 to a gain of Ps. 425.8 million in fiscal year 2015, mainly due to a increase of Ps. 356.2 million in the non-controlling interest of our subsidiary Brasilagro, a increase of Ps. 161.8 million in the non-controlling interest of our subsidiary IRSA, and a increase of Ps. 112.7 million in other companies from the Urban Properties and Investments business. |
Fiscal year ended June 30, 2014 compared to fiscal year ended June 30, 2013
Operating results
REVENUES
Total sales revenuesattributable to the controlling company’s shareholders increased from a loss of the Company increased 28.7% from Ps. 3,083.7 million for fiscal year 2013 to Ps. 3,967.9 million for fiscal year 2014. This was mainly due to a 33.7% increase in the Agricultural business, from Ps. 1,355.4 million in fiscal year 2013 to Ps. 1,812.11,068 million in fiscal year 2014 andto a 24.7% increase in the Urban Properties and Investments business, fromloss of Ps. 1,728.2250 million in fiscal year 2013 to Ps. 2,155.8 million in fiscal year 2014.2015; and
Agricultural Business
| | | Fiscal year ended on June 30, 2014 | | | Revenues | | Income Statement | | | Interests in joint ventures | | | Inter-segment eliminations | | | Segment Reporting | | | Crops | | | 817,702 | | | | 19,120 | | | | - | | | | 836,822 | | | Cattle | | | 61,691 | | | | 2,242 | | | | 26,382 | | | | 90,315 | | | Dairy | | | 53,935 | | | | - | | | | - | | | | 53,935 | | | Sugarcane | | | 123,851 | | | | - | | | | - | | | | 123,851 | | | Agricultural Rental and Services | | | 29,044 | | | | - | | | | 98 | | | | 29,142 | | | Agricultural Subtotal | | | 1,086,223 | | | | 21,362 | | | | 26,480 | | | | 1,134,065 | | | Land Transformation and Sales | | | - | | | | - | | | | - | | | | - | | | Agro-industrial | | | 548,740 | | | | - | | | | 5,344 | | | | 554,084 | | | Other Segments | | | 123,872 | | | | 87 | | | | - | | | | 123,959 | | | Total Agricultural Business Revenues | | | 1,758,835 | | | | 21,449 | | | | 31,824 | | | | 1,812,108 | |
| | | Fiscal year ended on June 30, 2013 | | | Revenues | | Income Statement | | | Interests in joint ventures | | | Inter-segment eliminations | | | Segment reporting | | | Crops | | | 745,932 | | | | 4,260 | | | | 184 | | | | 750,376 | | | Cattle | | | 74,534 | | | | 2,145 | | | | 6,260 | | | | 82,939 | | | Dairy | | | 38,818 | | | | - | | | | - | | | | 38,818 | | | Sugarcane | | | 160,259 | | | | - | | | | - | | | | 160,259 | | | Agricultural Rental and Services | | | 30,815 | | | | - | | | | 19 | | | | 30,834 | | | Agricultural Subtotal | | | 1,050,358 | | | | 6,405 | | | | 6,463 | | | | 1,063,226 | | | Land Transformation and Sales | | | - | | | | - | | | | - | | | | - | | | Agro-industrial | | | 207,755 | | | | - | | | | 1,166 | | | | 208,921 | | | Other Segments | | | 83,258 | | | | 25 | | | | - | | | | 83,283 | | | Total Agricultural Business Revenues | | | 1,341,371 | | | | 6,430 | | | | 7,629 | | | | 1,355,430 | |
Sales revenues increased 31.1%,· the non-controlling interest in controlled companies went from Ps. 1,341.4 million in fiscal year 2013 to 1,758.8 in fiscal year 2014. This was due to an increasea loss of Ps. 71.8 million in the Crops segment, an increase of Ps. 15.1 million in the Dairy segment, an increase of Ps. 341.0 million in the Agro-industrial segment, and an increase of Ps. 40.6 million in the Other segments, offset by a reduction of Ps. 12.8 million in the Cattle segment, a reduction of Ps. 36.4 million in the Sugarcane segment and a reduction of Ps. 1.7 million in the Agricultural rental and services segment. In turn, revenues from our joint ventures increased 233.6% from Ps. 6.4 million in fiscal year 2013 to Ps. 21.4341 million in fiscal year 2014 mainly asto a resultgain of a 344.2% increase in Crops sold by Cresca, from Ps. 4.3426 million in fiscal year 20132015, mainly due to a positive variation of Ps. 19.1356 million in fiscal year 2014.
Similarly, inter-segment revenues increased 317.1%, fromBrasilagro, a Ps. 7.6162 million variation in fiscal year 2013 to Ps. 31.8 million in fiscal year 2014, mainly as a result of livestock sales during the year to our subsidiary Sociedad Anónima Carnes Pampeanas which was reclassified from the Cattle segment to the Agro-industrial segment.
Hence, according to business segment reportingIRSA, and considering all our joint ventures and inter-segment eliminations, revenues increased by 33.7%, froma Ps. 1,355.4113 million variation in fiscal year 2013 to Ps. 1,812.1 million in fiscal year 2014.
Crops
Revenues from the Crops segment increased 11.5%, from Ps. 750.4 million in fiscal year 2013 to Ps. 836.8 million in fiscal year 2014, mainly as a result of:
· | a 34.1% increase in the average price of sold crops, from Ps. 1,440 per ton in fiscal year 2013 to Ps. 1,931 per ton in fiscal year 2014; |
· | partially offset by a reduction of 87,702 tons in the volume of crops sold during fiscal year 2014 compared to the previous fiscal year; and |
· | a reduction of 1.0% in the production volume from 355,390 tons in fiscal year 2013 to 351,759 in fiscal year 2014. |
The following table shows the sales of crops in detail:
| | | Sale of Crops (in tons) | | | | | Fiscal year ended on June 30, | | | | | 2014 | | | 2013 | | | Variation | | | Corn | | | 179,893 | | | | 271,144 | | | | (91,251 | ) | | Soybean | | | 222,051 | | | | 208,814 | | | | 13,237 | | | Wheat | | | 11,359 | | | | 10,735 | | | | 624 | | | Sorghum | | | 3,843 | | | | 5,807 | | | | (1,964 | ) | | Sunflower | | | 9,745 | | | | 10,551 | | | | (806 | ) | | Other | | | 6,509 | | | | 14,052 | | | | (7,543 | ) | | Total Sales | | | 433,400 | | | | 521,103 | | | | (87,703 | ) |
Cattle
Sales revenues from the Cattle segment increased 8.9%, from Ps. 82.9 million in fiscal year 2013 to Ps. 90.3 million in fiscal year 2014, mainly as a result of:
· | a 20.0% increase in the average price per kilogram sold, from Ps. 8.5 per ton in fiscal year 2013 to Ps. 10.2 million in fiscal year 2014; |
· | an 8.7% reduction in the cattle sales volume, from 9,627 tons in fiscal year 2013 to 8,791 tons in fiscal year 2014; and |
· | a 9.7% reduction in the volume of cattle production, from 7,723 tons in fiscal year 2013 to 6,973 tons in fiscal year 2014. |
Dairy
Sales revenues from the Dairy segment increased 38.9%, from Ps. 38.8 million in fiscal year 2013 to Ps. 53.9 million in fiscal year 2014, mainly as a result of:
· | a 33.6% increase in the average price of milk, from Ps. 2.02 per liter in fiscal year 2013 to Ps. 2.70 per liter in fiscal year 2014; |
· | a 6.1% increase in the average number of milking cows; and |
· | a 5.1% increase in the volume of sales, from 17,871 liters in fiscal year 2013 to 18,787 liters in fiscal year 2014. |
Sugarcane
Sales revenues from the Sugarcane segment decreased 22.7%, from Ps. 160.3 million in fiscal year 2013 to Ps. 123.9 million in fiscal year 2014, mainly as a result of:
· | 504,206 less tons of sugarcane sold in fiscal year 2014 as compared to the previous fiscal year, mainly by Brasilagro. The lower amount of tons of sugarcane sold during the fiscal year is explained by harvesting timing differences, as in the previous season it was concentrated from June to October 2012 and thus included the 11-12 and 12-13 harvests, while in the current season it was concentrated from April to September 2013; and |
· | partially offset by a 36.8% increase in the average price of sugarcane sold, from Ps. 136 per ton in fiscal year 2013 to Ps. 186 per ton in fiscal year 2014. |
Agricultural Rental and Services
Sales revenues from the Agricultural rental and services segment decreased by 5.5%, from Ps. 30.8 million in fiscal year 2013 to Ps. 29.1 million in fiscal year 2014, mainly as a result of:
· | a 39.3% reduction in leases, due to Cresud’s failure to renew several agreements, including Las Lajitas, Los Leones, Anta el dorado, Ancami and Ceiballito (for Ps. 9 million); |
· | a 117.6% increase in revenues from production of seeds (Ps. 4.9 million) mainly due to the higher price of corn and soybean and to a lesser extent, the production volume; and |
· | an increase of 24.6% in revenues from irrigation services originated by the impact of the exchange rate, showing an increase of Ps. 0.87 million and a rise of 20% in the milliliters sold as compared to fiscal year 2013. |
Agro-industrial
Sales revenues from the Agro-industrial segment increased 165.2%, from Ps. 208.9 million in fiscal year 2013 to Ps. 554.1 million in fiscal year 2014, mainly as a result of:
· | an 80% increase in slaughtering volumes and the differential resulting from the higher price of beef and sub-products; and |
· | it should be noted that from November 2013 to February 2014 the produce slaughtered under the kosher ritual was exported to Israel, increasing sales volumes; and |
· | another relevant factor in such increase has been the sustained appreciation of the exchange rate as compared to the previous year. |
Other Segments
Sales revenues from the Other Segments increased by 48.8%, from Ps. 83.3 million in fiscal year 2013 to Ps. 124.0 million in fiscal year 2014, mainly due to:
· | an increase of Ps. 22.5 million in resales of supplies and others; and |
· | an increase of Ps. 16.5 million in commodity brokerage services. |
Urban Properties and Investments Business
| | | | Fiscal year ended on June 30, 2014 | | | Revenues | | | Income Statement | | | | Interests in joint ventures | | | | Inter-segment eliminations | | | | Common maintenance expenses and collective promotion funds | | | | Segment reporting | | | Shopping Center Properties | | | 2.031.625 | | | | 9.280 | | | | 1.808 | | | | (659.705 | ) | | | 1.383.008 | | | Offices | | | 327.954 | | | | 8.466 | | | | 4.442 | | | | (69.703 | ) | | | 271.159 | | | Sales and Developments | | | 62.641 | | | | 22.890 | | | | | | | | | | | | 85.531 | | | Hotels | | | 331.562 | | | | - | | | | | | | | | | | | 331.562 | | | International | | | 90.820 | | | | - | | | | | | | | (6.894 | ) | | | 83.926 | | | Financial Operations and Others | | | 574 | | | | - | | | | | | | | | | | | 574 | | | Total Urban Properties and Investments business Revenues | | | 2.845.176 | | | | 40.636 | | | | 6.250 | | | | (736.302 | ) | | | 2.155.760 | |
(1)Includes revenues from sales, leases and services (Ps. 2,108.9 million) and revenues from expenses and collective promotion fund (Ps. 736.3 million)
| | |
| | | | Fiscal year ended on June 30, 2013 | | | Revenues | | | Income Statement | | | | Interests in joint ventures | | | Inter-segment eliminations | | | | Common maintenance expenses and collective promotion funds | | | | Segment reporting | | | Shopping Center Properties | | | 1,613,285 | | | | 6,958 | | | | | | | (517,199 | ) | | | 1,103,044 | | | Offices | | | 281,084 | | | | 7,372 | | | | 3,899 | | | | (75,184 | ) | | | 217,171 | | | Sales and Developments | | | 24,867 | | | | 117,129 | | | | | | | | | | | | 141,996 | | | Hotels | | | 225,836 | | | | | | | | | | | | | | | | 225,836 | | | International | | | 40,905 | | | | | | | | | | | | (1,907 | ) | | | 38,998 | | | Financial Operations and Others | | | 1,203 | | | | - | | | | | | | | - | | | | 1,203 | | | Total Urban Properties and Investments business Revenues | | | 2,187,180 | | | | 131,459 | | | | 3,889 | | | | (594,290 | ) | | | 1,728,248 | |
(1) | Includes revenues from sales, leases and services (Ps. 1,592.9 million) and revenues from expenses and collective promotion fund (Ps. 594.3 million). |
Sales revenuesother companies from the Urban Properties and Investments business increased 24.74%, from Ps. 2,187.2 million in fiscal year 2013 to Ps. 2,845.2 million in fiscal year 2014. This was mainly due to an increase of Ps. 418.3 million in the Shopping Center Properties segment, an increase of Ps. 46.9 million in the Offices segment, an increase of Ps. 105.7 million in the Hotels segment, an increase of Ps. 49.9 million in the International segment, and an increase of Ps. 37.8 million in the Sales and Developments segment, partially offset by a reduction of Ps. 0.6 million in the Financial operations and Others segment.
On the other hand, revenues from expenses and collective promotion fund increased by 23.9%, from Ps. 594.3 million in fiscal year 2013 (out of which Ps. 517.2 million is attributable to the Shopping Center Properties segment) to Ps. 736.3 million in fiscal year 2014 (out of which Ps. 659.7 million is attributable to the Shopping Center Properties segment).
In turn, revenues from our interests in joint ventures decreased by 69.0%, from Ps. 131.5 million in fiscal year 2013 to Ps. 40.6 million in fiscal year 2014. Such decrease is mostly attributable to reduced sales revenues derived from the Horizons project, from our joint venture with Cyrsa.
Similarly, inter-segment revenues increased 60.3%, from Ps. 3.9 million in fiscal year 2013 to Ps. 6.3 million in fiscal year 2014, mainly as a result of the refurbishment during the year of some square meters at Abasto shopping center. Also during the year, we started to lease a portion of the administrative offices of such establishment.
Hence, according to business segment reporting and considering all our joint ventures and inter-segment eliminations, revenues increased by 24.7%, from Ps. 1,728.2 million in fiscal year 2013 to Ps. 2,155.7 million in fiscal year 2014.
Shopping Center Properties
Revenues from the Shopping Center Properties segment increased 25.4%, from Ps. 1,103.0 million in fiscal year 2013 to Ps. 1,383.0 million in fiscal year 2014. Such variation was mainly due to:
· | an increase of Ps. 235.3 million in revenues from fixed and variable rentals as a result of a 30.8% rise in our tenant’s total sales, from Ps. 12,336.6 million in fiscal year 2013 to Ps. 16,132.7 million in fiscal year 2014; and |
· | an increase Ps. 37.9 million in revenues from admission fees and parking fees. |
Offices
Revenues from the Offices segment increased 24.9%, from Ps. 217.2 million in fiscal year 2013 to Ps. 271.2 million in fiscal year 2014. Such revenues were impacted by the partial sale of investment properties in fiscal year 2014, which resulted in a reduction of the segment total leasable area.
Considering comparable properties in both fiscal years, rental revenues from properties which did not experience a decrease in their leasable area increased by 35%, from Ps. 152.3 million in fiscal year 2013 to Ps. 205.6 million in fiscal year 2014, mostly as a result of the currency devaluation and improved occupancy, whereas rental revenues from properties which leasable area was reduced accounted for almost the same figure in both years (around Ps. 59 million).
As of year-end, the 2014 occupancy rate of premium offices stood at 98.3% and the average rent was around US$ 26 per m2.
Sales and Developments
Revenues from this segment often vary significantly period over period due to:
· | the non-recurrence of property sales and the agreed-upon sale price; |
· | the number of properties under construction; and |
· | the completion date of such developments. |
Without considering our joint ventures, revenues from the Sales and Developments segment increased 151.4% from Ps. 24.9 million in fiscal year 2013 to Ps. 62.6 million in fiscal year 2014. Such increase was mainly attributable to higher revenues from the sale of units of Condominios I and II for Ps. 47.7 million.
On the other hand, revenues from out joint ventures (Horizons) went down by Ps. 94.2 million, resulting in a 39.8% net reduction in the revenues derived from this segment, from Ps. 142.0 million in fiscal year 2013 to Ps. 85.5 million in fiscal year 2014.
Hotels
Revenues from our Hotels segment increased by 46.9% from Ps. 225.8 million in fiscal year 2013 to Ps. 331.6 million in fiscal year 2014, mainly as a result of a 38% increase in the average room rate (in terms of Argentine Pesos) and in the average occupancy rate of our hotels from 67.2% in fiscal year 2013 to 68.7% in fiscal year 2014 (mainly due to an improvement in the average occupancy rate at Llao Llao).
International
Revenues from the International segment increased 122.0%, from Ps. 40.9 million in fiscal year 2013 to Ps. 90.8 million in fiscal year 2014, mainly due to the following factors:
· | the abovementioned devaluation of the Argentine Peso and, to a lesser extent; |
· | the fact that the results of Rigby 183 LLC – owner of the rental Madison 183 building - were consolidated for 12 months in fiscal year 2014 whereas such results were consolidated for 9 months in fiscal year 2013. |
Financial Operations and Others
Revenues from the Financial operations and Others segment went down from Ps. 1.2 million in fiscal year 2013 to Ps. 0.6 million in fiscal year 2014, as a result of reduced revenues from APSAMedia S.A.’s personal financing residual activity (the continuing company of Metroshop S.A., currently merged with IRSA Commercial Properties).
COSTS
Total costs of the Company increased 23.4%, from Ps. 2,647.0 million in fiscal year 2013 to Ps. 3,266.3 million in fiscal year 2014. This was mainly as a result of a 28.0% increase in the Agricultural business, from Ps. 2,045.8 million in fiscal year 2013 to Ps. 2,618.0 million in fiscal year 2014 and a 7.8% increase in the Urban Properties and Investments business from Ps. 0.60 million in fiscal year 2013 to Ps. 0.65 million in fiscal year 2014.
Agricultural Business
| | | Fiscal year ended on June 30, 2014 | | | Costs | | Income Statement | | | Interests in joint ventures | | | Inter-segment eliminations | | | Segment reporting | | | Crops | | | (1,509,500 | ) | | | (31,181 | ) | | | - | | | | (1,540,681 | ) | | Cattle | | | (150,810 | ) | | | (4,408 | ) | | | (5,442 | ) | | | (160,660 | ) | | Dairy | | | (104,334 | ) | | | - | | | | - | | | | (104,334 | ) | | Sugarcane | | | (206,751 | ) | | | - | | | | - | | | | (206,751 | ) | | Agricultural Rental and Services | | | (17,374 | ) | | | - | | | | - | | | | (17,374 | ) | | Agricultural Subtotal | | | (1,988,769 | ) | | | (35,589 | ) | | | (5,442 | ) | | | (2,029,800 | ) | | Land Transformation and Sales | | | (8,228 | ) | | | - | | | | - | | | | (8,228 | ) | | Agro-industrial | | | (453,307 | ) | | | - | | | | (26,382 | ) | | | (479,689 | ) | | Other Segments | | | (100,170 | ) | | | (85 | ) | | | - | | | | (100,255 | ) | | Total Agricultural Business Costs | | | (2,550,474 | ) | | | (35,674 | ) | | | (31,824 | ) | | | (2,617,972 | ) |
| | | Fiscal year ended on June 30, 2013 | | | Costs | | Income Statement | | | Interests in joint ventures | | | Inter-segment eliminations | | | Segment reporting | | | Crops | | | (1,216,190 | ) | | | (11,642 | ) | | | - | | | | (1,227,832 | ) | | Cattle | | | (142,621 | ) | | | (3,319 | ) | | | (1,350 | ) | | | (147,290 | ) | | Dairy | | | (74,826 | ) | | | - | | | | - | | | | (74,826 | ) | | Sugarcane | | | (302,206 | ) | | | - | | | | - | | | | (302,206 | ) | | Agricultural Rental and Services | | | (12,052 | ) | | | - | | | | - | | | | (12,052 | ) | | Agricultural Subtotal | | | (1,747,895 | ) | | | (14,961 | ) | | | (1,350 | ) | | | (1,764,206 | ) | | Land Transformation and Sales | | | (5,675 | ) | | | - | | | | - | | | | (5,675 | ) | | Agro-industrial | | | (198,402 | ) | | | - | | | | (6,279 | ) | | | (204,681 | ) | | Other Segments | | | (71,286 | ) | | | 69 | | | | - | | | | (71,217 | ) | | Total Agricultural Business Costs | | | (2,023,258 | ) | | | (14,892 | ) | | | (7,629 | ) | | | (2,045,779 | ) |
Total costs increased 26.1%, from Ps. 2,023.3 million in fiscal year 2013 to Ps. 2,550.5 million in fiscal year 2014. This was caused mainly by an increase of Ps. 293.3 million in the Crops segment, an increase of Ps. 8.2 million in the Cattle segment, an increase of Ps. 29.5 million in the Dairy segment, an increase of Ps. 5.3 million in the Agricultural rental and services segment, an increase of Ps. 2.6 million in the Land transformation and sales segment, an increase of Ps. 254.9 million in the Agro-industrial segment and an increase of Ps. 28.9 million in the Other segments, offset by a reduction of Ps. 95.5 million in the Sugarcane segment.
In turn, the cost of our joint ventures experienced a net increase of Ps. 20.8 million, from 14.9 million in fiscal year 2013 to Ps. 35.7 million in fiscal year 2014, mostly as a result of an increase of Ps. 19.6 million in the cost of Cresca’s Crops, from Ps. 11.6 million in fiscal year 2013 to Ps. 31.2 million in fiscal year 2014.
Similarly, inter-segment costs rose by Ps. 24.2 million from Ps. 7.6 million in fiscal year 2013 to Ps. 31.8 million in fiscal year 2014, mainly as a result of the cost of cattle sales during the year to our subsidiary Sociedad Anónima Carnes Pampeanas which was reclassified from the Cattle segment to the Agro-industrial segment.
Hence, according to business segment reporting and considering all our joint ventures and inter-segment eliminations, revenues increased by 28.0%, from Ps. 2,045.8 million in fiscal year 2013 to Ps. 2,618.0 million in fiscal year 2014.
Crops
Costs from the Crops segment increased 25.5%, from Ps. 1,227.8 million for fiscal year 2013 to Ps. 1,540.7 million for fiscal year 2014. Costs from the Crops segment are detailed in the following table:
| | | | | | | | Fiscal year 2014 | | | Fiscal year 2013 | | | | | Thousands of Ps. | | | Cost of sales | | | 788,361 | | | | 626,922 | | | Cost of production | | | 752,319 | | | | 600,910 | | | Total Costs | | | 1,540,680 | | | | 1,227,832 | |
The cost of sales from the Crops segment increased 24.2%, from Ps. 626.9 million in fiscal year 2013 to Ps. 788.4 million in fiscal year 2014, mainly as a result of:
· | a 51.2% increase in the average cost per ton of crops sold in fiscal year 2014, from Ps. 1,203 in fiscal year 2013 to Ps. 1,819 in fiscal year 2014, mainly as a result of the higher average market prices of crops; and |
· | slightly offset by a 16.8% reduction in the volume of tons sold as compared to the previous fiscal year. |
The cost of sales as a percentage of sales was 83.5% in fiscal year 2013 and 94.3% in fiscal year 2014.
The cost of production from the Crops segment increased 25.2% from Ps. 600.9 million in fiscal year 2013 to Ps. 752.3 million in fiscal year 2014, mainly as a result of:
· | a 23.2% increase in direct production costs during this fiscal year as compared to the previous one, mainly affected by the inflationary context that impacts both on the prices of leases and supplies used (agrochemicals and seeds); |
· | slightly offset by lower production volumes in fiscal year 2014 as compared to fiscal year 2013; and |
· | a larger number of hectares in operation in own farms in fiscal year 2014 as compared to fiscal year 2013. |
Total cost of production per ton increased 24.5%, from Ps. 1,496 in fiscal year 2013 to Ps. 1,863 in fiscal year 2014, mainly as a result of higher direct costs of production in fiscal year 2014 as compared to fiscal year 2013.
Cattle
Costs of the Cattle segment increased 9.1%, from Ps. 147.3 million in fiscal year 2013 to Ps. 160.7 million in fiscal year 2014. Costs from the Cattle segment are detailed in the following table:
| | | Fiscal year 2014 | | | Fiscal year 2013 | | | | | Thousands of Ps. | | | Cost of sales | | | 76,734 | | | | 74,064 | | | Cost of production | | | 83,926 | | | | 73,226 | | | Total Costs | | | 160,660 | | | | 147,290 | |
The cost of sales decreased by 3.6%, from Ps. 74.1 million in fiscal year 2013 to Ps. 76.7 million in fiscal year 2014, mainly as a result of:
· | a 8.2% reduction in cattle sales volumes in fiscal year 2014; |
· | partially offset by a higher cost per kilogram sold in fiscal year 2014. |
The cost of production from the Cattle segment rose by 14.6%, from Ps. 73.2 million in fiscal year 2013 to Ps. 83.9 million in fiscal year 2014. The higher cost of production from the Cattle segment in fiscal year 2014 was mainly attributable to:
· | higher payroll expenses; |
· | higher lease expenses, as in 2014 various farms intended for livestock production in the Province of Buenos Aires were leased; and |
· | higher feed costs due to the increase of animals in our own farms fattened in feedlots; |
· | offset by lower costs from our subsidiary Cactus due to the discontinuance of its livestock activities in 2014. |
Dairy
Costs of the Dairy segment increased 39.4%, from Ps. 74.9 million in fiscal year 2013 to Ps. 104.3 million in fiscal year 2014. Costs from the Dairy segment are detailed in the following table:
| | | Fiscal year 2014 | | | Fiscal year 2013 | | | | | Thousands of Ps. | | | Cost of sales | | | 51,686 | | | | 37,667 | | | Cost of production | | | 52,648 | | | | 37,159 | | | Total Costs | | | 104,334 | | | | 74,826 | |
The cost of sales from the Dairy segment increased by 37.2%, from Ps. 37.7 million in fiscal year 2013 to Ps. 51.7 million in fiscal year 2014, mainly as a result of:
· | a 5.1% increase in milk sales volumes; and |
· | a 33.5% increase in milk price levels that impacted on the cost of sales. |
Cost of production of the Dairy segment increased 41.7%, from Ps. 37.2 million in fiscal year 2013 to Ps. 52.6 million in fiscal year 2014. This rise was mainly due to the impact of higher direct and indirect costs, affecting the cost of production per liter of milk, which increased from Ps. 2.01 in fiscal year 2013 to Ps. 2.73 in fiscal year 2014.
Sugarcane
Costs of the Sugarcane segment decreased 31.6%, from Ps. 302.2 million in fiscal year 2013 to Ps. 206.8 million in fiscal year 2014. Costs from the Sugarcane segment are detailed in the following table:
| | | Fiscal year 2014 | | | Fiscal year 2013 | | | | | Thousands of Ps. | | | Cost of sales | | | 105,618 | | | | 158,152 | | | Cost of production | | | 101,133 | | | | 144,054 | | | Total Costs | | | 206,751 | | | | 302,206 | |
The cost of sales from the Sugarcane segment decreased by 33.2%, from Ps. 158.2 million in fiscal year 2013 to Ps. 105.6 million in fiscal year 2014, mainly as a result of:
· | a reduction of 504,2016 tons of sugarcane sold in fiscal year 2014 compared to the previous fiscal year, mainly in our subsidiary Brasilagro; and |
· | offset by an increase in the average cost per ton of sugarcane sold in fiscal year 2014, from Ps. 134 per ton in fiscal year 2013 to Ps. 156 per ton in fiscal year 2014. |
The cost of sales as a percentage of sales was 98.7% in fiscal year 2013 and 85.3% in fiscal year 2014.
The cost of production of the Sugarcane segment decreased 29.8%, from Ps. 144.1 million in fiscal year 2013 to Ps. 101.1 million in fiscal year 2014, mainly as a result of a lower production volume in fiscal year 2014 as compared to fiscal year 2013, caused by harvesting timing differences, as in the previous season it was concentrated from June to October 2013 and thus included the 11-12 and 12-13 harvests, while in the current season it was concentrated from April to September 2013.
The total cost of production per ton increased 23.5%, from Ps. 124 per ton in fiscal year 2013 to Ps. 154 per ton in fiscal year 2014.
Agricultural rental and Services
The cost of sales from the Agricultural rental and Services segment increased by 44.2%, from Ps. 12.1 million in fiscal year 2013 to Ps. 17.4 million in fiscal year 2014, mainly as a result of:
· | higher lease costs in Brasilagro, due to the amortization of new soil improvement works and structural expenses in the Preferencia farm, which was leased after such expenses had been incurred; |
· | higher costs from seed production services, reflecting the increase in the cost of supplies (mostly in US$) and in production volumes; and |
· | a 42.2% increase in irrigation service costs. |
Land Transformation and Sales
Cost of sales from the Land transformation and sales segment increased 45.0%, from Ps. 5.7 million for fiscal year 2013 to Ps. 8.2 million for fiscal year 2014, mainly due to increases in salary-related items, in particular the share incentive plan.
Agro-industrial
Cost of sales from the Agro-industrial segment increased 134.4%, from Ps. 204.7 million for fiscal year 2013 to Ps. 479.7 million for fiscal year 2014, with a significantly lower incidence of raw materials from the meat packing plant on purchase prices, favoring the increase in the gross marginal contribution.
Other segments
The cost of sales of the Other segments increased 40.8%, from Ps. 71.2 million in fiscal year 2013 to Ps. 100.3 million in fiscal year 2014, mainly as a result of higher costs from the brokerage business related to the increase in the number of commodity trading transactions through FyO for Ps. 13.6 million and higher costs generated by the resale of supplies and others for Ps. 14.0 million.
Urban Properties and Investments Business
| | | Fiscal year ended on June 30, 2014 | | | Costs | | Income Statement | | | Interests in joint ventures | | | Inter-segment eliminations | | | Common maintenance expenses and collective promotion funds | | | Segment reporting | | | Shopping Center Properties | | | (956,359 | ) | | | (2,754 | ) | | | (4,321 | ) | | | 667,106 | | | | (296,688 | ) | | Offices | | | 110,633 | ) | | | (4,437 | ) | | | (360 | ) | | | 69,703 | | | | (45,367 | ) | | Sales and Developments | | | (18,971 | ) | | | (15,992 | ) | | | - | | | | - | | | | (34,963 | ) | | Hotels | | | (216,768 | ) | | | - | | | | - | | | | - | | | | (216,768 | ) | | International | | | (60,404 | ) | | | - | | | | - | | | | 6,894 | | | | (53,510 | ) | | Financial Operations and Others | | | (983 | ) | | | - | | | | - | | | | - | | | | (983 | ) | | Total Urban Properties and Investments Business Costs | | | (1,364,118 | ) | | | (23,183 | ) | | | (4,681 | ) | | | 743,703 | | | | (648,279 | ) |
| | | Fiscal year ended on June 30, 2013 | | | | | | Costs | | Income Statement | | | Interests in joint ventures | | | Inter-segment eliminations | | | Common maintenance expenses and collective promotion funds | | | Segment reporting | | | Shopping Center Properties | | | (763,460 | ) | | | (2,090 | ) | | | (2,667 | ) | | | 522,689 | | | | (245,528 | ) | | Offices | | | (117,349 | ) | | | (4,810 | ) | | | - | | | | 75,184 | | | | (46,975 | ) | | Sales and Developments | | | (12,346 | ) | | | (94,212 | ) | | | - | | | | - | | | | (106,558 | ) | | Hotels | | | (169,071 | ) | | | - | | | | - | | | | - | | | | (169,071 | ) | | International | | | (33,494 | ) | | | - | | | | - | | | | 1,907 | | | | (31,587 | ) | | Financial Operations and Others | | | (1,517 | ) | | | - | | | | - | | | | - | | | | (1,517 | ) | | Total Urban Properties and Investments Business Costs | | | (1,097,237 | ) | | | (101,112 | ) | | | (2,667 | ) | | | 599,780 | | | | (601,236 | ) |
Cost of sales from our Urban
Properties and Investments business increased 24.3%, from Ps. 1,097.2 million in fiscal year 2013 to Ps. 1,364.1 million in fiscal year 2014. This was mainly due to an increase of Ps. 192.9 million in the Shopping Center Properties segment, an increase of Ps. 6.6 million in the Sales and Developments segment, an increase of Ps. 47.7 million in the Hotels segment, and an increase of Ps. 26.9 million in the International segment, slightly offset by a decrease of Ps. 6.7 million in the Offices segment, and a decrease of Ps. 0.5 million in the Financial operations and Others segment.
In turn, costs from our joint ventures experienced a net decrease of 72.6%, from Ps. 101.1 million in fiscal year 2013 to Ps. 23.1 million in fiscal year 2014, mainly attributable to a reduction in costs as a result of fewer sales in the Horizons project.
Similarly, inter-segment costs rose by 74.1%, from Ps. 2.7 million in fiscal year 2013 to Ps. 4.7 million in fiscal year 2014, mainly as a result of changes in the cost allocation of our Shopping Center Properties.
Hence, according to business segment reporting and considering all our joint ventures and inter-segment eliminations, costs increased by 12.4%, from Ps. 601.2 million in fiscal year 2013 to Ps. 648.3 million in fiscal year 2014.
Shopping Center Properties
Costs from the Shopping Center Properties segment increased by 31.6%, from Ps. 245.5 million in fiscal year 2013 to Ps. 296.6 million in fiscal year 2014. This increase is mainly attributable to:
· | an increase of Ps. 15.6 million in salaries and wages, social security contributions and other payroll expenses; |
· | a Ps. 33.5 million increase in costs from a deficit in expenses and collective promotion fund from our Shopping Centers; |
· | an increase of Ps. 29.4 million in maintenance, security, cleaning, repair and similar expenses (mainly attributable to increases in security and cleaning services and utility rates); and |
· | a decrease of Ps. 17.9 million in our depreciation and amortization expense. |
The costs from the Shopping Center Properties segment as a percentage of revenues derived from this segment remained steady at around 47%.
Offices
Costs from the Offices segment decreased by 3.4%, from Ps. 47.0 million in fiscal year 2013 to Ps. 45.4 million in fiscal year 2014. Such decrease was attributable to the partial sales of investment property for rental completed in fiscal year 2014.
Costs in the Offices and Others segment, considering similar properties in both fiscal years on account of the inexistence of partial sales, rose by 16.5% from Ps. 68.1 million to Ps. 79.3 million, primarily owing to increased depreciation and amortization costs.
On the other hand, costs attributable to non-comparable properties decreased by 17.8%, from Ps. 5.7 million to Ps. 4.7 million, mostly as a result of the above mentioned sales.
Costs from the Offices segment, as a percentage of revenues derived from this segment, decreased by 40.6% in fiscal year 2013 to 32.8% in fiscal year 2014.
Sales and Developments
Costs from this segment often vary significantly period over period due to:
· | the non-recurrence of property sales and the agreed-upon sale price; |
· | the number of properties under construction; and |
· | the completion date of projects under construction. |
Costs from our Sales and Developments segment decreased by 67.2%, from Ps. 106.6 million in fiscal year 2013 to Ps. 35.0 million in fiscal year 2014. Such decrease is mainly attributable to lower costs from the sale of Horizons units (Ps. 77.0 million); partially offset by higher costs from the sale of units at Condominios I and II (Ps. 7.6 million).
Costs from the Sales and Developments segment, as a percentage of revenues derived from this segment, decreased by 74.9% in fiscal year 2013 to 39.2% in fiscal year 2014.
Hotels
Costs from the Hotels segment increased by 28.2%, from Ps. 169.1 million in fiscal year 2013 to Ps. 216.8 million in fiscal year 2014, mainly as a result of:
· | an increase of Ps. 25.2 million in salaries and wages, social security contributions and other payroll expenses; |
· | an increase of Ps. 20.1 million in the cost of food, beverages and other hotel-related expenses; and |
· | an increase of Ps. 4.6 million in maintenance and repair expenses, among others. |
Costs from the Hotels segment, as a percentage of revenues derived from this segment, decreased by 74.5% in fiscal year 2013 to 65.1% in fiscal year 2014.
International
Costs from the International segment increased by 80.3%, from Ps. 31.6 million in fiscal year 2013 to Ps. 53.5 million in fiscal year 2014, mainly as a result of:
· | the devaluation of the Argentine Peso and, to a lesser extent; |
· | the fact that the results of Rigby 183 LLC – owner of the rental building Madison 183 - were consolidated for 12 months in fiscal year 2014 whereas such results were consolidated for 9 months in fiscal year 2013. |
Costs from the International segment, as a percentage of revenues derived from this segment, decreased by 81.9% in fiscal year 2013 to 66.5% in fiscal year 2014.
Financial Operations and Others
Costs from the Financial operations and Others segment went down by 35.2% from Ps. 1.5 million in fiscal year 2013 to Ps. 1.0 million in fiscal year 2014, as a result of reduced revenues from APSAMedia S.A.’s personal financing residual activity (the continuing company of Metroshop S.A., currently merged with IRSA CP).
Costs from the Financial Operations and Others segment, as a percentage of revenues derived from this segment, decreased by 75.0% in fiscal year 2013 to 66.7% in fiscal year 2014.
Initial recognition and changes in the fair value of biological assets and agricultural produce at the point of harvest:
| | | Fiscal year ended on June 30, 2014 | | | Initial recognition and changes in the fair value of biological assets and agricultural produce at the point of harvest | | Income Statement | | | Interests in joint ventures | | | Inter-segment eliminations | | | Segment reporting | | | Crops | | | 848,578 | | | | 19,773 | | | | - | | | | 868,351 | | | Cattle | | | 145,008 | | | | 313 | | | | - | | | | 145,321 | | | Dairy | | | 62,840 | | | | - | | | | - | | | | 62,840 | | | Sugarcane | | | 96,227 | | | | - | | | | - | | | | 96,227 | | | Agricultural rental and Services | | | - | | | | - | | | | - | | | | - | | | Agricultural Subtotal | | | 1,152,653 | | | | 20,086 | | | | - | | | | 1,172,739 | | | Land Transformation and Sales | | | - | | | | - | | | | - | | | | - | | | Agro-industrial | | | - | | | | - | | | | - | | | | - | | | Other segments | | | - | | | | - | | | | - | | | | - | | | Total Agricultural Business | | | 1,152,653 | | | | 20,086 | | | | - | | | | 1,172,739 | |
| | | Fiscal year ended on June 30, 2013 | | | Initial recognition and changes in the fair value of biological assets and agricultural produce at the point of harvest | | Income Statement | | | Interests in joint ventures | | | Inter-segment eliminations | | | Segment reporting | | | Crops | | | 571,020 | | | | 1,061 | | | | - | | | | 572,081 | | | Cattle | | | 78,648 | | | | 688 | | | | - | | | | 79,336 | | | Dairy | | | 40,741 | | | | - | | | | - | | | | 40,741 | | | Sugarcane | | | 197,317 | | | | - | | | | - | | | | 197,317 | | | Agricultural rental and Services | | | - | | | | - | | | | - | | | | - | | | Agricultural Subtotal | | | 887,726 | | | | 1,749 | | | | - | | | | 889,475 | | | Land Transformation and Sales | | | - | | | | - | | | | - | | | | - | | | Agro-industrial | | | - | | | | - | | | | - | | | | - | | | Other segments | | | (982 | ) | | | - | | | | - | | | | (982 | ) | | Total Agricultural Business | | | 886,744 | | | | 1,749 | | | | - | | | | 888,493 | |
The Company’s revenues from initial recognition and changes in the fair value of biological assets and agricultural produce at the point of harvest increased 30.0%, from Ps. 886.7 million in fiscal year 2013 to Ps. 1,152.7 million in fiscal year 2014.
In turn, the Company’s revenues from initial recognition and changes in the fair value of biological assets and agricultural produce at the point of harvest derived from our interests in joint ventures increased 1.048,4%, from Ps. 1.7 million in fiscal year 2013 to Ps. 20.1 million in fiscal year 2014.
On the other hand, there were no inter-segment eliminations in connection with revenues from initial recognition and changes in the fair value of biological assets and agricultural produce at the point of harvest.
Hence, according to business segment reporting and considering all our joint ventures, revenues from initial recognition and changes in the fair value of biological assets and agricultural produce at the point of harvest increased by 32.0%, from Ps. 888.5 million in fiscal year 2013 to Ps. 1,172.7 million in fiscal year 2014.
Crops
Production income from the Crops segment increased by 51.8%, from Ps. 572.1 million in fiscal year 2013 to Ps. 868.4 million in fiscal year 2014, mainly as a result of:
· | a 44.2% increase in the average production price of crops; |
· | partially offset by a 1.0% reduction in the total production volume, from 355,390 tons in fiscal year 2013 to 351,759 tons in fiscal year 2014. |
As of June 30, 2014 the harvested area was 97.4% of our total sown area, compared to 94.9% as of June 30, 2013.
The following table shows the number of tons produced and total production income as of June 30, 2014 and 2013:
Crops Production Income (in tons and thousands of Ps.)
| | | Fiscal year ended on June 30, | | | | | 2014 | | | 2013 | | | | | Tons | | | Ps. | | | Tons | | | Ps. | | | Corn | | | 86,300 | | | | 85,737 | | | | 107,257 | | | | 83,416 | | | Soybean | | | 241,205 | | | | 563,639 | | | | 220,292 | | | | 354,485 | | | Wheat | | | 12,373 | | | | 11,929 | | | | 4,505 | | | | 3,740 | | | Sorghum | | | 4,058 | | | | 1,468 | | | | 5,486 | | | | 3,118 | | | Sunflower | | | 5,884 | | | | 15,657 | | | | 12,437 | | | | 21,230 | | | Other | | | 1,940 | | | | 3,390 | | | | 5,413 | | | | 11,766 | | | Total | | | 351,760 | | | | 681,820 | | | | 355,390 | | | | 477,755 | |
Estimated results from the valuation of our crops in progress at fair value increased 186.2%, from Ps. 56.6 million in fiscal year 2013 to Ps. 162.0 million in fiscal year 2014, mainly due to an increase of 186.8% in corn crops.
Cattle
Production income from the Cattle segment increased by 83.2%, from Ps. 79.3 million in fiscal year 2013 to Ps. 145.3 million in fiscal year 2014, mainly as a result of:
· | a 10,0% increase in the average price per kilogram produced, from Ps. 8.8 per kilogram in fiscal year 2013 to Ps. 9.7 per kilogram in fiscal year 2014; |
· | offset by a 9.7% reduction in the volume of cattle production, from 7,723 tons in fiscal year 2013 to 6,973 tons in fiscal year 2014. |
The calving rate increased slightly, whereas the death rate recorded a mild increase during fiscal year 2014 as compared to fiscal year 2013.
The number of hectares devoted to cattle production increased from 91,053 hectares in fiscal year 2013 to 95,745 hectares in fiscal year 2014 due to a smaller number of hectares devoted to cattle production leased to third parties.
Results from cattle holdings increased 717.7%, from a gain of Ps. 9.3 million in fiscal year 2013 to a gain of Ps. 75.8 million in fiscal year 2014, mainly as a result of the inflationary context and the currency devaluation occurred in the last semester, which resulted in a significant rise in prices.
Dairy
Production income from the Dairy segment increased 54.2%, from Ps. 40.7 million in fiscal year 2013 to Ps. 62.8 million in fiscal year 2014. This increase was mainly due to:
· | the result from holding of milking cows, which increased 168.8%, from a gain of Ps. 3.2 million in fiscal year 2013 to a gain of Ps. 8.6 million in fiscal year 2014, as the inflationary context and the devaluation occurred during the last semester led to a significant rise in prices; |
· | a 33.5% increase in the average price of milk, from Ps. 1.94 per liter in fiscal year 2013 to Ps. 2.59 per liter in fiscal year 2014; and |
· | to a lesser extent, an increase of 4.3% in milk production volumes, from 18.5 million liters in fiscal year 2013 to 19.3 million liters in fiscal year 2014. This increase in production volume was mainly due to a higher average number of milking cows per day, from 2,439 in fiscal year 2013 to 2,588 in fiscal year 2014, partially offset by a 2.9% reduction in the efficiency level of average daily milk production per cow, from 20.8 liters in fiscal year 2013 to 20.2 liters in fiscal year 2014. |
Sugarcane
Production income from the Sugarcane segment decreased 51.2%, from Ps. 197.3 million in fiscal year 2013 to Ps. 96.2 million in fiscal year 2014, mainly as a result of:
· | actual production income; and |
· | a decrease in total production volume of 43.2%, from 1,156,848 tons in fiscal year 2013 to 657,547 tons in fiscal year 2014; and |
· | partially offset by a 23.3% increase in the average production price of sugarcane. |
The 43.2% decrease in production volume from the Sugarcane segment was mainly due to a 11.5% reduction in our average yield and harvesting timing differences, as in the previous season it was concentrated from June to October 2012 and thus included the 11-12 and 12-13 harvests, while in the current season it was concentrated from April to September 2013.
The following table shows the actual tons produced and income as of June 30, 2014 and 2013:
Sugarcane Production Income (in tons and thousands of Ps.)
| | | Fiscal year ended on June 30, | | | | | 2014 | | | 2013 | | | | | Tons | | | Ps. | | | Tons | | | Ps. | | | Sugarcane | | | 657,547 | | | | 106,547 | | | | 1,156,848 | | | | 152,037 | |
Estimated results from the valuation of our sugarcane crops in progress at fair value
Estimated results from the valuation of our sugarcane crops in progress at fair value decreased significantly from a gain of Ps. 45.3 million in fiscal year 2013 to a loss of Ps. 10.3 million in fiscal year 2014 mainly generated by Brasilagro. This variation originated mainly in Brazil, and was caused by the following factors:
· | the number of estimated hectares went down from a year-on-year decrease of 2% in fiscal year 2013 to a year-on-year decrease of 12% in fiscal year 2014; |
· | the estimated yields went down from a from a year-on-year increase of 3% in fiscal year 2013 to a year-on-year decrease of 1% in fiscal year 2014; and |
· | the estimated unit costs went up from a year-on-year increase of 11% in fiscal year 2013 to a year-on-year increase of 18% in fiscal year 2014. |
Other Segments
Income from initial recognition and changes in the fair value of biological assets and agricultural produce at the point of harvest from the Other segments increased significantly, from a loss of Ps. 1.0 million in fiscal year 2013 to Ps. 0.0 million in fiscal year 2014, due to the variation in the valuation of the timber stocks at fair value in fiscal year 2014.
Changes in the net realizable value of agricultural produce after harvest
| | | Fiscal year ended on June 30, 2014 | | | Changes in the net realizable value of agricultural produce after harvest | | Income Statement | | | Interests in joint ventures | | | Inter-segment eliminations | | | Segment reporting | | | Crops | | | (17,624 | ) | | | - | | | | - | | | | (17,624 | ) | | Cattle | | | 177 | | | | - | | | | - | | | | 177 | | | Dairy | | | - | | | | - | | | | - | | | | - | | | Sugarcane | | | - | | | | - | | | | - | | | | - | | | Agricultural Rental and Services | | | - | | | | - | | | | - | | | | - | | | Agricultural Subtotal | | | (17,447 | ) | | | - | | | | - | | | | (17,447 | ) | | Land Transformation and sales | | | - | | | | - | | | | - | | | | - | | | Agro-industrial | | | - | | | | - | | | | - | | | | - | | | Other Segments | | | - | | | | - | | | | - | | | | - | | | Total Agricultural Business | | | (17,447 | ) | | | - | | | | - | | | | (17,447 | ) |
| | | Fiscal year ended on June 30, 2013 | | | Changes in the net realizable value of agricultural produce after harvest | | Income Statement | | | Interests in joint ventures | | | Inter-segment eliminations | | | Segment reporting | | | Crops | | | 11,801 | | | | - | | | | - | | | | 11,801 | | | Cattle | | | (45 | ) | | | - | | | | - | | | | (45 | ) | | Dairy | | | - | | | | - | | | | - | | | | - | | | Sugarcane | | | - | | | | - | | | | - | | | | - | | | Agricultural Rental and Services | | | - | | | | - | | | | - | | | | - | | | Agricultural Subtotal | | | 11,756 | | | | - | | | | - | | | | 11,756 | | | Land Transformation and sales | | | - | | | | - | | | | - | | | | - | | | Agro-industrial | | | - | | | | - | | | | - | | | | - | | | Other Segments | | | - | | | | - | | | | - | | | | - | | | Total Agricultural Business | | | 11,756 | | | | - | | | | - | | | | 11,756 | |
Income from changes in the net realizable value of agricultural produce after harvest decreased significantly, from a gain of Ps. 11.8 million in fiscal year 2013 to a loss of Ps. 17.4 million in fiscal year 2014. This was caused mainly by a reduction of Ps. 29.4 million in the Crops segment (due to the discontinuance in fiscal year 2014 of corn exports made in fiscal year 2013, which resulted in a higher valuation of corn), offset by a slight increase of Ps. 0.2 million in the Cattle segment.
No interest in joint ventures or inter-segment elimination was recorded in income from changes in the net realizable value of agricultural produce after harvest.
GROSS PROFIT
As a result of the above mentioned factors, the Company’s gross profit increased 38.9%, from Ps. 1,336.9 million in fiscal year 2013 to Ps. 1,856.9 million in fiscal year 2014. This was caused mainly by:
· | a 66.5% increase in the Agricultural Business, from a Ps. 209.9 million profit in fiscal year 2013 to a Ps. 349.4 million profit in fiscal year 2014; and |
· | a 33.7% increase in the Urban Properties and Investments business, from a Ps. 1,127.0 million profit in fiscal year 2013 to a Ps. 1,507.5 million profit in fiscal year 2014. |
Agricultural Business
As a result of the above mentioned factors, gross profit increased 66.5%, from Ps. 209.9 million in fiscal year 2013 to Ps. 349.4 million in fiscal year 2014.
Crops
Gross profit from this segment increased 38.0%, from Ps. 106.4 million in fiscal year 2013 to Ps. 146.9 million in fiscal year 2014.
Cattle
Gross profit from this segment increased 403.0%, from Ps. 14.9 million in fiscal year 2013 to Ps. 75.2 million in fiscal year 2014.
Dairy
Gross profit from this segment increased 162.9%, from Ps. 4.7 million in fiscal year 2013 to Ps. 12.4 million in fiscal year 2014.
Sugarcane
Gross profit from this segment decreased 75.9%, from Ps. 55.4 million in fiscal year 2013 to Ps. 13.3 million in fiscal year 2014.
Agricultural Rental and Services
Gross profit from this segment increased 37.3%, from Ps. 18.8 million in fiscal year 2013 to Ps. 11.8 million in fiscal year 2014.
Land Transformation and Sales
Gross loss from this segment increased 45.0%, from Ps. 5.7 million in fiscal year 2013 to Ps. 8.2 million in fiscal year 2014.
Agro-industrial
Gross profit from this segment increased significantly, from Ps. 4.2 million in fiscal year 2013 to Ps. 74.4 million in fiscal year 2014.
Other Segments
Gross profit from this segment increased 113.9%, from Ps. 11.1 million in fiscal year 2013 to Ps. 23.7 million in fiscal year 2014.
Urban Properties and Investments Business
Gross profit from the Urban Properties and Investments business increased 33.8% from Ps. 1,127.0 million in fiscal year 2013 to Ps. 1,507.5 million in fiscal year 2014. This was mainly due to an increase of Ps. 228.8 million in the Shopping Center Properties segment; an increase of Ps. 55.6 million in the Offices segment; an increase of Ps. 15.1 million in the Sales and Developments segment, an increase of Ps. 58.0 million in the Hotels segment, and an increase of Ps. 23.0 million in the International segment, partially offset by a reduction of Ps. 0.1 million in the Financial Operations and Others segment.
Shopping Center Properties
Gross profit from the Shopping Center Properties segment increased by 26.7% from Ps. 857.5 million in fiscal year 2013 to Ps. 1,086.3 million in fiscal year 2014. Gross profit from the Shopping Center Properties segment as a percentage of revenues derived from this segment stood around 78%.
Offices
Gross profit from the Offices segment increased by 32.7% from Ps. 170.2 million in fiscal year 2013 to Ps. 225.8 million in fiscal year 2014. Gross profit from the Offices segment as a percentage of revenues derived from this segment went up from 59.4% in fiscal year 2013 to 67.2% in fiscal year 2014.
Sales and Developments
Gross profit from the Sales and Developments segment increased by 42.7% from Ps. 35.4 million in fiscal year 2013 to Ps. 50.6 million in fiscal year 2014. Gross profit from the Sales and Developments segment as a percentage of revenues derived from this segment went up from 25.1% in fiscal year 2013 to 60.8% in fiscal year 2014.
Hotels
Gross profit from the Hotels segment rose by 102.2% from Ps. 56.8 million in fiscal year 2013 to Ps. 114.8 million in fiscal year 2014. Gross profit from the Hotels segment as a percentage of revenues derived from this segment went up from 25.5% in fiscal year 2013 to 34.9% in fiscal year 2014.
International
Gross profit from the International segment rose by 310.4% from Ps. 7.4 million in fiscal year 2013 to Ps. 30.4 million in fiscal year 2014. Gross profit from the International segment as a percentage of revenues derived from this segment went up from 19% in fiscal year 2013 to 36.2% in fiscal year 2014.
Financial Operations and Others
Gross profit from the Financial Operations and Others segment decreased Ps. 0.1 million from a loss of Ps. 0,3 million in fiscal year 2013 to a loss of Ps. 0,4 million in fiscal year 2014. Gross profit from the Financial Operations and Others segment as a percentage of revenues derived from this segment went up from 26.1% in fiscal year 2013 to 71.2% in fiscal year 2014.
Gain from disposal of investment properties
Gain from disposal of investment properties derived from the Urban Properties and Investments business increased 29.7%, from a Ps. 178.0 million income in fiscal year 2013 to a Ps. 230.9 million income in fiscal year 2014, mainly as a result of the sale of functional units at: Maipú 1300 building (Ps. 28.3 million), Bouchard 551 building (Ps. 24.1 million), Av. De Mayo 595 building (Ps. 19.2 million), Constitución 1159 building (Ps. 13.4 million), Costeros Dique IV building (Ps. 2.9 million) and Rivadavia 565 building (Ps. 1.1 million), offset by lower revenues from sales of units at the Libertador 498 building (Ps. 36.7 million).
Income from sale of farmlands
Income from sale of farmlands derived from the Land Transformation and Sales segment decreased 38.9%, from Ps. 149.6 million income in fiscal year 2013 to Ps. 91.4 million income in fiscal year 2014, mainly as a result of:
During fiscal year 2014
On June 27, 2014, Brasilagro sold a fraction of 1,164 hectares in the “Araucaria” farm located in the municipal district of Mineiros, State of Goias, Brazil, that had been purchased in 2007. After the sale, the farm has a total area of 8,178 hectares, out of which approximately 5,982 hectares are arable land. The sale price was RS. 32.5 million (equivalent to Ps. 117.5 million). In July 2014, the buyer made an initial payment of RS. 4.5 million, and the remaining balance is payable in five installments, the first of which, for RS. 4.5 million, matures in November 2014 and the last one at the time of execution of the title deed, in August 2018. The Company recorded a gain of RS. 21.0 million (equivalent to Ps. 75.8 million) for the sale of the Araucaria farm.
On May 27, 2014, Ombú Agropecuaria S.A. executed an agreement providing for the sale, subject to retention of title, of an 882.96 hectare property in the “San Cayetano I” farm for a total price of US$ 4.2 million. Out of this amount, the sum of US$ 1 million has been already collected and the balance is payable in 5 consecutive semi-annual installments, the last of which falls due in November 2016. The agreement provides that title conveyance will be registered once the full price has been paid. Possession was surrendered on the date of execution of the agreement. The Company recorded a gain of US$ 1.8 million for this sale
During fiscal year 2013
On June 19, 2013 the deed of sale for 5,613 hectares of the “La Suiza” farm, located in Villa Ángela, Province of Chaco, was executed. The transaction price was Ps. 34.9 million. The result from the sale was a gain of Ps. 29.8 million;
On October 11, 2012, Brasilagro sold the Horizontina farm, located in the municipal district of Tasso Fragoso. Sate of Maranhão, Brazil, for a total price of RS. 75 million (equivalent to Ps. 174.8 million). The Horizontina farm has a surface area of 14,359 hectares. The result from the sale was a gain of Ps. 53.9 million;
On April 25, 2013, Brasilagro sold an aggregate of 394 hectares of the Araucaria farm, located in the municipal district of Mineros – GO, Brazil. The sale price was RS. 11.7 million (equivalent to Ps. 26.6 million). The result from the sale was a gain of Ps. 12.6 million; and
On May 10, 2013, Brasilagro sold an aggregate of 4,895 hectares of the Cremaq farm, located in the municipal district of Ribeiro Gonçalves-PI, Brazil. The sale price was RS. 42.1 million. The result from the sale was a gain of Ps. 53.2 million.
General and Administrative Expenses
Total administrative expenses of the Company increased 53.1%, from Ps. 352.4 million for fiscal year 2013 to Ps. 539.7 million for fiscal year 2014. This was mainly due to an increase of Ps. 86.0 million in the Agricultural business and an increase of Ps. 101.3 million in the Urban Properties and Investments business.
Agricultural Business
| | | Fiscal year ended on June 30, 2014 | | | General and Administrative Expenses | | Income Statement | | | Interests in joint ventures | | | Inter-segment eliminations | | | Segment reporting | | | Crops | | | (146,512 | ) | | | (681 | ) | | | - | | | | (147,193 | ) | | Cattle | | | (27,118 | ) | | | (65 | ) | | | - | | | | (27,183 | ) | | Dairy | | | (5,746 | ) | | | - | | | | - | | | | (5,746 | ) | | Sugarcane | | | (28,261 | ) | | | - | | | | - | | | | (28,261 | ) | | Agricultural Rental and Services | | | (2,603 | ) | | | (66 | ) | | | - | | | | (2,669 | ) | | Agricultural Subtotal | | | (210,240 | ) | | | (812 | ) | | | - | | | | (211,052 | ) | | Land Transformation and Sales | | | (1,130 | ) | | | - | | | | - | | | | (1,130 | ) | | Agro-industrial | | | (16,880 | ) | | | - | | | | - | | | | (16,880 | ) | | Other Segments | | | (8,761 | ) | | | (1,807 | ) | | | - | | | | (10,568 | ) | | Total Agricultural Business General and Administrative Expenses | | | (237,011 | ) | | | (2,619 | ) | | | - | | | | (239,630 | ) |
| | | Fiscal year ended on June 30, 2013 | | | General and Administrative Expenses | | Income Statement | | | Interests in joint ventures | | | Inter-segment eliminations | | | Segment reporting | | | Crops | | | (87,683 | ) | | | (1,902 | ) | | | - | | | | (89,585 | ) | | Cattle | | | (13,487 | ) | | | (232 | ) | | | - | | | | (13,719 | ) | | Dairy | | | (3,125 | ) | | | - | | | | - | | | | (3,125 | ) | | Sugarcane | | | (24,163 | ) | | | - | | | | - | | | | (24,163 | ) | | Agricultural Rental and Services | | | (4,416 | ) | | | - | | | | - | | | | (4,416 | ) | | Agricultural Subtotal | | | (132,874 | ) | | | (2,134 | ) | | | - | | | | (135,008 | ) | | Land Transformation and Sales | | | (572 | ) | | | - | | | | - | | | | (572 | ) | | Agro-industrial | | | (10,986 | ) | | | - | | | | - | | | | (10,986 | ) | | Other Segments | | | (7,109 | ) | | | - | | | | - | | | | (7,109 | ) | | Total Agricultural Business General and Administrative Expenses | | | (151,541 | ) | | | (2,134 | ) | | | - | | | | (153,675 | ) |
General and administrative expenses from our Agricultural business increased 56.4%, from Ps. 151.5 million in fiscal year 2013 to Ps. 237.0 million in fiscal year 2014. This was mainly due to an increase of Ps. 58.8 million in the Crops segment, an increase of Ps. 13.6 million in the Cattle segment, an increase of Ps. 2.8 million in the Dairy segment, an increase of Ps. 4.1 million in the Sugarcane segment, an increase of Ps. 0.6 million in the Land transformation and sales segment, and an increase of Ps. 5.9 million in the Agro-industrial segment, slightly offset by a reduction of Ps. 1.8 million in the Agricultural rental and services segment and a reduction of Ps. 1.0 million in the Other segments. The main causes of this variation were:
· | higher fees to Directors: in fiscal year 2014, the amounts paid were Ps. 14.4 million higher than those provisioned by the Shareholders’ Meeting for fiscal year 2013; |
· | higher dues and contributions for permanent disability (pension plan): Ps. 12.9 million and 6.9 million were paid as bonus plan during fiscal year 2014; and |
· | a 25% rise in expenses as a result of the inflationary context. |
In turn, General and administrative expenses from our joint ventures went down 1.7%, from Ps. 2.1 million in fiscal year 2013 to Ps. 2.6 million in fiscal year 2014, mainly due to a 71% reduction in Cresca’s crop expenses, from Ps. 1.9 million in fiscal year 2013 to Ps. 0.7 million in fiscal year 2014 and a 100% increase in the expenses attributable to Cresca’s other segments, from Ps. 1.8 million in fiscal year 2014.
On the other hand, no general and administrative expenses arose from inter-segment eliminations.
Hence, according to business segment reporting and considering all our joint ventures, general and administrative expenses increased by 55.9%, from Ps. 153.7 million in fiscal year 2013 to Ps. 239.6 million in fiscal year 2014.
Urban Properties and Investments Business
| | | Fiscal year ended on June 30, 2014 | | | General and Administrative Expenses | | Income Statement | | | Interests in joint ventures | | | Inter-segment eliminations | | | Segment reporting | | | Shopping Center Properties | | | (100,710 | ) | | | (148 | ) | | | (680 | ) | | | (101,538 | ) | | Offices | | | (41,169 | ) | | | (145 | ) | | | (631 | ) | | | (41,945 | ) | | Sales and Developments | | | (36,955 | ) | | | (511 | ) | | | - | | | | (37,466 | ) | | Hotels | | | (58,562 | ) | | | - | | | | (1,023 | ) | | | (59,585 | ) | | International | | | (59,476 | ) | | | - | | | | - | | | | (59,476 | ) | | Financial Operations and Others | | | (56 | ) | | | - | | | | - | | | | (56 | ) | | Total Urban Properties and Investments Business General and Administrative Expenses | | | (296,928 | ) | | | (804 | ) | | | (2,334 | ) | | | (300,066 | ) |
| | | Fiscal year ended on June 30, 2013 | | | General and Administrative Expenses | | Income Statement | | | Interests in joint ventures | | | Inter-segment eliminations | | | Segment reporting | | | Shopping Center Properties | | | (66,350 | ) | | | (126 | ) | | | (1,120 | ) | | | (67,597 | ) | | Offices | | | (34,766 | ) | | | (110 | ) | | | (108 | ) | | | (34,984 | ) | | Sales and Developments | | | (30,979 | ) | | | (1,922 | ) | | | - | | | | (32,901 | ) | | Hotels | | | (49,337 | ) | | | - | | | | (546 | ) | | | (49,883 | ) | | International | | | (13,158 | ) | | | - | | | | - | | | | (13,158 | ) | | Financial Operations and Others | | | (250 | ) | | | - | | | | - | | | | (250 | ) | | Total Urban Properties and Investments Business General and Administrative Expenses | | | (194,840 | ) | | | (2,158 | ) | | | (1,774 | ) | | | (198,773 | ) |
General and administrative expenses from the Urban Properties and Investments business increased 52.4%, from Ps. 194.8 million in fiscal year 2013 to Ps. 296.9 million in fiscal year 2014. This was mainly due to an increase of Ps. 34.4 million in the Shopping Center Properties segment, an increase of Ps. 6.4 in the Offices segment, an increase of Ps. 9.2 million in the Hotels segment, an increase of Ps. 6.0 million in the Sales and Developments segment, and an increase of Ps. 46.3 million in the International segment, partially offset by reduction of Ps. 0.2 million in the Financial Operations and Others segment.
Administrative expenses from our joint ventures went down by 62.8%, from Ps. 2.2 million in fiscal year 2013 (this figure includes Ps. 1.9 million attributable to the Sales and Developments segment) to Ps. 0.8 million in fiscal year 2014 (this figure includes Ps. 0.5 million attributable to the Sales and Developments segment).
Hence, according to business segment reporting and considering all our joint ventures and inter-segment eliminations, administrative expenses increased by 51.0%, from Ps. 198.8 million in fiscal year 2013 to Ps. 300.1 million in fiscal year 2014. Based on the reported business segment reporting and considering our joint ventures and inter-segment eliminations, administrative expenses as a percentage of sales increased from 8.5% in fiscal year 2013 to 10.4% in fiscal year 2014.
Shopping Center Properties
Administrative expenses from the Shopping Center Properties segment increased by 50.2%, from Ps. 67.6 million in fiscal year 2013 to Ps. 101.5 million in fiscal year 2014, mainly due to:
· | an increase of Ps. 13.3 million in salaries and wages, social security contributions and other payroll expenses; |
· | an increase in Directors’ fees of Ps. 11.3 million; and |
· | an increase of Ps. 5.3 million in service fees. |
Administrative expenses as a percentage of revenues derived from this segment increased from 6.1% in fiscal year 2013 to 7.3% in fiscal year 2014.
Offices
General and administrative expenses from our Offices segment increased 19.9%, from Ps. 35.0 million in fiscal year 2013 to Ps. 41.9 million in fiscal year 2014, mainly as a result of a Ps. 9.1 million increase in salaries and wages, social security contributions and other payroll expenses, partially offset by a Ps. 3.1 million reduction in Directors’ fees.
General and administrative expenses as a percentage of revenues derived from this segment stood decreased from 16.1% to 15.4%.
Sales and Developments
General and administrative expenses from our Sales and Developments segment increased 13.9%, from Ps. 32.9 million in fiscal year 2013 to Ps. 37.5 million in fiscal year 2014, mainly as a result of a Ps. 6.5 million increase in salaries and wages, social security contributions and other payroll expenses, partially offset by a Ps. 2.6 million reduction in Directors’ fees.
General and administrative expenses from the Sales and Developments segment, as a percentage of revenues derived from this segment, increased by 23.2% in fiscal year 2013 to 43.9% in fiscal year 2014.
Hotels
General and administrative expenses from the Hotels segment increased by 19.4%, from Ps. 49.9 million in fiscal year 2013 to Ps. 59.6 million in fiscal year 2014, mainly due to:
· | an increase of Ps. 4.0 million in salaries and wages, social security contributions and other payroll expenses; |
· | an increase of Ps. 2.2 million in maintenance and repair expenses; and |
· | a Ps. 2.5 million increase in service fees, among other items. |
General and administrative expenses from the Hotels segment, as a percentage of revenues derived from this segment, decreased from 22.1% in fiscal year 2013 to 18.0% in fiscal year 2014.
International
General and administrative expenses from the International segment increased Ps. 46.3 million, from Ps. 13.2 million in fiscal year 2013 to Ps. 59.5 million in fiscal year 2014, mainly due to:
· | the devaluation of the Argentine Peso; |
· | expenses incurred in connection with our investment in IDBD and, to a lesser extent; and |
· | the fact that the results of Rigby 183 LLC – owner of the rental building Madison 183 - were consolidated for 12 months in fiscal year 2014 whereas such results were consolidated for 9 months in fiscal year 2013. |
General and administrative expenses from the International segment, as a percentage of revenues derived from this segment, increased from 33.7% in fiscal year 2013 to 70.9% in fiscal year 2014.
Selling expenses
Total selling expenses of the Company increased 23.3%, from Ps. 291.2 million in fiscal year 2013 to Ps. 359.0 million in fiscal year 2014. This was mainly due to an increase of Ps. 35.0 million in the Agricultural business and an increase of Ps. 32.9 million in the Urban Properties and Investments business.
Agricultural Business
| | | Fiscal year ended on June 30, 2014 | | | Selling Expenses | | Income Statement | | | Interests in joint ventures | | | Inter-segment eliminations | | | Segment reporting | | | Crops | | | (115,497 | ) | | | (2,332 | ) | | | - | | | | (117,829 | ) | | Cattle | | | (13,769 | ) | | | (85 | ) | | | - | | | | (13,854 | ) | | Dairy | | | (2,249 | ) | | | - | | | | - | | | | (2,249 | ) | | Sugarcane | | | (4,871 | ) | | | - | | | | - | | | | (4,871 | ) | | Agricultural Rental and Services | | | (754 | ) | | | (25 | ) | | | - | | | | (779 | ) | | Agricultural Subtotal | | | (137,140 | ) | | | (2,442 | ) | | | - | | | | (139,582 | ) | | Land Transformation and Sales | | | (3,873 | ) | | | - | | | | - | | | | (3,873 | ) | | Agro-industrial | | | (54,751 | ) | | | - | | | | - | | | | (54,751 | ) | | Other Segments | | | (10,726 | ) | | | - | | | | - | | | | (10,726 | ) | | Total Agricultural Business Selling Expenses | | | (206,490 | ) | | | (2,442 | ) | | | - | | | | (208,932 | ) |
| | | Fiscal year ended on June 30, 2013 | | | Selling Expenses | | Income Statement | | | Interests in joint ventures | | | Inter-segment eliminations | | | Segment reporting | | | Crops | | | (115,417 | ) | | | (506 | ) | | | - | | | | (115,923 | ) | | Cattle | | | (11,393 | ) | | | (89 | ) | | | - | | | | (11,482 | ) | | Dairy | | | (1,842 | ) | | | - | | | | - | | | | (1,842 | ) | | Sugarcane | | | (4,006 | ) | | | - | | | | - | | | | (4,006 | ) | | Agricultural Rental and Services | | | (1,711 | ) | | | - | | | | - | | | | (1,711 | ) | | Agricultural Subtotal | | | (134,369 | ) | | | (595 | ) | | | - | | | | (134,964 | ) | | Land Transformation and Sales | | | (10,628 | ) | | | - | | | | - | | | | (10,628 | ) | | Agro-industrial | | | (21,507 | ) | | | - | | | | - | | | | (21,507 | ) | | Other Segments | | | (6,834 | ) | | | (43 | ) | | | - | | | | (6,877 | ) | | Total Agricultural Business Selling Expenses | | | (173,338 | ) | | | (638 | ) | | | - | | | | (173,976 | ) |
Selling expenses from the Agricultural Business increased 19.1%, from Ps. 173.3 million in fiscal year 2013 to Ps. 206.5 million in fiscal year 2014. This was mainly due to an increase of Ps. 2.4 million in the Cattle segment, an increase of Ps. 0.4 million in the Dairy segment, an increase of Ps. 0.9 million in the Sugarcane segment, an increase of Ps. 33.2 million in the Agro-Industrial segment, and an increase of Ps. 3.9 million in the Other segments, partially offset by a reduction of Ps. 0.1 million in the Crops segment, a reduction of Ps. 0.9 million in the Agricultural rental and services segment, and a reduction of Ps. 6.7 million in the Land transformation and sales segment.
In turn, selling expenses from our interests in joint ventures increased by 282.8% from Ps. 0.6 million in fiscal year 2013 to Ps. 2.4 million in fiscal year 2014, in connection with our Cresca joint venture.
On the other hand, no inter-segment eliminations arose from selling expenses.
Hence, according to business segment reporting and considering all our joint ventures and inter-segment eliminations, selling expenses increased by 20.1%, from Ps. 174.0 million in fiscal year 2013 to Ps. 208.9 million in fiscal year 2014.
Urban Properties and Investments Business
| | | Fiscal year ended on June 30, 2014 | | | Selling Expenses | | Income Statement | | | Interests in joint ventures | | | Inter-segment eliminations | | | Segment reporting | | | Shopping Center Properties | | | (72,531 | ) | | | (687 | ) | | | (209 | ) | | | (73,427 | ) | | Offices | | | (20,307 | ) | | | (444 | ) | | | - | | | | (20,751 | ) | | Sales and Developments | | | (11,330 | ) | | | (2,376 | ) | | | - | | | | (13,706 | ) | | Hotels | | | (42,178 | ) | | | - | | | | (157 | ) | | | (42,335 | ) | | International | | | - | | | | - | | | | - | | | | - | | | Financial Operations and Others | | | 110 | | | | - | | | | - | | | | 110 | | | Total Urban Properties and Investments Business Selling Expenses | | | (146,236 | ) | | | (3,507 | ) | | | (366 | ) | | | (150,109 | ) |
| | | Fiscal year ended on June 30, 2013 | | | Selling Expenses | | Income Statement | | | Interests in joint ventures | | | Inter-segment eliminations | | | Segment reporting | | | Shopping Center Properties | | | (58,048 | ) | | | (747 | ) | | | (112 | ) | | | (58,907 | ) | | Offices | | | (10,886 | ) | | | (474 | ) | | | - | | | | (11,360 | ) | | Sales and Developments | | | (6,683 | ) | | | (9,773 | ) | | | - | | | | (16,456 | ) | | Hotels | | | (28,919 | ) | | | - | | | | - | | | | (28,919 | ) | | International | | | - | | | | - | | | | - | | | | - | | | Financial Operations and Others | | | (1,588 | ) | | | - | | | | - | | | | (1,588 | ) | | Total Urban Properties and Investments Business Selling Expenses | | | (106,124 | ) | | | (10,994 | ) | | | (112 | ) | | | (117,230 | ) |
Selling expenses of the Urban Properties and Investments business increased 37.8%. from Ps. 106.1 million in fiscal year 2013 to Ps. 146.2 million in fiscal year 2014. This was mainly due to an increase of Ps. 14.4 million in the Shopping Center Properties segment, an increase of Ps. 13.4 million in the Hotels segment, an increase of Ps. 4.6 million in the Sales and Developments segment, and an increase of Ps. 9.4 million in the Offices segment, partially offset by and a reduction of Ps. 1.7 million in the Financial operations and Others segment.
In turn, selling expenses from our joint ventures went down by 68.2%, from Ps. 11.0 million in fiscal year 2013 (this figure includes Ps. 9.8 million attributable to the Sales and Developments segment) to Ps. 3.5 million in fiscal year 2014 (this figure includes Ps. 2.4 million attributable to the Sales and Developments segment). This reduction is mainly due to lower expenses from our Cyrsa joint venture in connection with the recognition of fewer sales from the Horizons project in fiscal year 2014.
Hence, according to business segment reporting and considering all our joint ventures and inter-segment eliminations, selling expenses increased by 28.0%, from Ps. 117.3 million in fiscal year 2013 to Ps. 150.1 million in fiscal year 2014. According to the business segment reporting reported and considering all our joint ventures and inter-segment eliminations, selling expenses remained steady at around 5% in both fiscal years.
Shopping Center Properties
Selling expenses from the Shopping Center Properties segment increased by 24.6%, from Ps. 58.9 million in fiscal year 2013 to Ps. 73.4 million in fiscal year 2014, mainly due to:
· | a Ps. 10.2 million increase in taxes, rates and contributions; |
· | an increase of Ps. 5.2 in advertising and other selling expenses; and |
· | an increase of Ps. 2.7 million in salaries and wages, social security contributions and other payroll expenses; |
· | partially offset by a reduction of Ps. 4.1 million in bad debtors. |
Selling expenses from our Shopping Center Properties segment as a percentage of revenues derived from this segment stood at around 5.3% in both fiscal years.
Offices
Selling expenses from our Offices segment increased by 82.7%, from Ps. 11.4 million in fiscal year 2013 to Ps. 20.8 million in fiscal year 2014, mainly due to:
· | an increase of Ps. 4.6 million in bad debtors; |
· | an increase of Ps. 2.4 million in salaries and wages, social security contributions and other payroll expenses; and |
· | a Ps. 2.1 million increase in taxes, rates and contributions payable, mainly as a result of an increase in turnover tax. |
Selling expenses from the Offices segment, as a percentage of revenues derived from this segment, increased from 3.9% in fiscal year 2013 to 6.1% in fiscal year 2014.
Sales and Developments
Selling expenses from the Sales and Developments segment decreased by 16.7%, from Ps. 16.5 million in fiscal year 2013 to Ps. 13.7 million in fiscal year 2014, mainly as a result of:
· | a reduction of Ps. 2.7 million in taxes, rates and contributions; and |
· | a reduction of Ps. 2.7 million in fees and compensation from services, partially offset by an increase of Ps. 1.3 million in salaries and wages, social security contributions and other payroll expenses, and a Ps. 0.9 million increase in commissions. |
Selling expenses from the Sales and Developments segment, as a percentage of revenues derived from this segment, increased from 11.6% in fiscal year 2013 to 16.0% in fiscal year 2014.
Hotels
Selling expenses from our Hotels segment increased by 46.4%, from Ps. 28.9 million in fiscal year 2013 to Ps. 42.3 million in fiscal year 2014, mainly due to:
· | an increase of Ps. 6.5 million in taxes, rates and contributions; |
· | an increase of Ps. 2.1 million in salaries and wages, social security contributions and other payroll expenses; and |
· | an increase of Ps. 3.1 million in advertising and other selling expenses. |
Selling expenses from our Hotels segment as a percentage of revenues derived from this segment stood at around 12.8% in both fiscal years.
Financial Operations and Others
Selling expenses from our Financial Operations and Others segment decreased by Ps. 1.7 million, from a loss of Ps. 1.6 million in fiscal year 2013 to a gain of Ps. 0.1 million in fiscal year 2014, mainly as a result of the recovery of the allowance for bad debts in connection with APSAMedia S.A.’s personal financing residual activity (the continuing company of Metroshop S.A., currently merged with IRSA Commercial Properties).
Other operating results, net
Other operating results, net of the Company decreased Ps. 173.2 million, from a Ps. 95.8 million gain in fiscal year 2013 to a Ps. 77.4 million loss in fiscal year 2014.
Agricultural Business
| | | Fiscal year ended on June 30, 2014 | | | Other operating results, net | | Income Statement | | | Interests in joint ventures | | | Inter-segment eliminations | | | Segment reporting | | | Crops | | | (28,992 | ) | | | (363 | ) | | | - | | | | (29,355 | ) | | Cattle | | | (1,955 | ) | | | (44 | ) | | | - | | | | (1,999 | ) | | Dairy | | | (417 | ) | | | - | | | | - | | | | (417 | ) | | Sugarcane | | | 104 | | | | - | | | | - | | | | 104 | | | Agricultural Rental and Services | | | (189 | ) | | | (33 | ) | | | - | | | | (222 | ) | | Agricultural Subtotal | | | (31,449 | ) | | | (440 | ) | | | - | | | | (31,889 | ) | | Land Transformation and Sales | | | (82 | ) | | | - | | | | - | | | | (82 | ) | | Agro-industrial | | | (868 | ) | | | - | | | | - | | | | (868 | ) | | Other Segments | | | 3,261 | | | | 38 | | | | - | | | | 3,299 | | | Total Agricultural Business Other operating results, net | | | (29,138 | ) | | | (402 | ) | | | - | | | | (29,540 | ) |
| | | Fiscal year ended on June 30, 2013 | | | Other operating results, net | | Income Statement | | | Interests in joint ventures | | | Inter-segment eliminations | | | Segment reporting | | | Crops | | | (9,914 | ) | | | (1,100 | ) | | | - | | | | (11,014 | ) | | Cattle | | | (3,190 | ) | | | (355 | ) | | | - | | | | (3,545 | ) | | Dairy | | | (803 | ) | | | - | | | | - | | | | (803 | ) | | Sugarcane | | | (27 | ) | | | - | | | | - | | | | (27 | ) | | Agricultural Rental and Services | | | (1,135 | ) | | | - | | | | - | | | | (1,135 | ) | | Agricultural Subtotal | | | (15,069 | ) | | | (1,455 | ) | | | - | | | | (16,524 | ) | | Land Transformation and Sales | | | (147 | ) | | | - | | | | - | | | | (147 | ) | | Agro-industrial | | | (1,305 | ) | | | - | | | | - | | | | (1,305 | ) | | Other Segments | | | 21,321 | | | | - | | | | - | | | | 21,321 | | | Total Agricultural Business Other operating results, net | | | 4,800 | | | | (1,455 | ) | | | - | | | | 3,345 | |
Other operating results, net from the Agricultural business decreased by 707.0%, from a Ps. 4.8 million gain in fiscal year 2013 to a Ps. 29.1 million loss in fiscal year 2014. This was mainly caused by a Ps. 18.3 million reduction in the Crops segment and a Ps. 18.0 million reduction in the Other segments, partially offset by a Ps. 0.9 million increase in the Agricultural rental and services segment, a Ps. 1.5 million increase in the Cattle segment, a Ps. 0.4 million increase in the Dairy segment, a Ps. 0.1 million increase in the Sugarcane segment, a Ps. 0.1 million increase in the Land transformation and sales segment, and a Ps. 0.4 million increase in the Agro-industrial segment.
In turn, other operating results, net from our interests in joint ventures increased by 72% from a Ps. 1.5 million loss in fiscal year 2013 to a Ps. 0.4 million loss in fiscal year 2014, in connection with our Cresca joint venture.
On the other hand, no inter-segment eliminations arose from operating results, net.
Hence, according to business segment reporting and considering all our joint ventures, other operating results, net increased by 983.1%, from Ps. 3.3 million in fiscal year 2013 to Ps. 29.5 million in fiscal year 2014.
Crops
Other operating results of the Crops segment decreased Ps. 18.3 million, from a Ps. 11.0 million loss in fiscal year 2013 to a Ps. 29.4 million loss in fiscal year 2014, mainly as a result of the commodity derivatives held by Brasilagro and Cresud (Ps. 20.6 million), partially offset by the charge to income of Brasilagro’s contingency allowance for Ps. 12.1 million.
Other Segments
Other operating results, net of the Other segments decreased Ps. 18.0 million, from a Ps. 21.3 million income in fiscal year 2013 to a Ps. 3.3 million income in fiscal year 2014.
The rest of the segments of the Agricultural business did not record significant changes.
Urban Properties and Investments Business
| | | Fiscal year ended on June 30, 2014 | | | Other operating results, net | | Income Statement | | | Interests in joint ventures | | | Inter-segment eliminations | | | Segment reporting | | | Shopping Center Properties | | | (45,953 | ) | | | (723 | ) | | | 108 | | | | (46,568 | ) | | Offices | | | (1,786 | ) | | | (2,297 | ) | | | 1,023 | | | | (3,060 | ) | | Sales and Developments | | | 8,300 | | | | (163 | ) | | | - | | | | 8,137 | | | Hotels | | | (2,680 | ) | | | - | | | | - | | | | (2,680 | ) | | International | | | (895 | ) | | | - | | | | - | | | | (895 | ) | | Financial Operations and Others | | | (2,856 | ) | | | - | | | | - | | | | (2,856 | ) | | Total Urban Properties and Investments Business Other operating results, net | | | (45,870 | ) | | | (3,183 | ) | | | 1,131 | | | | (47,922 | ) |
| | | Fiscal year ended on June 30, 2013 | | | Other operating results, net | | Income Statement | | | Interests in joint ventures | | | Inter-segment eliminations | | | Segment reporting | | | Shopping Center Properties | | | (45,199 | ) | | | (475 | ) | | | 654 | | | | (45,020 | ) | | Offices | | | 743 | | | | (990 | ) | | | - | | | | (247 | ) | | Sales and Developments | | | 6,374 | | | | (32 | ) | | | - | | | | 6,342 | | | Hotels | | | (369 | ) | | | - | | | | - | | | | (369 | ) | | International | | | 135,082 | | | | - | | | | - | | | | 135,082 | | | Financial Operations and Others | | | (3,363 | ) | | | - | | | | - | | | | (3,363 | ) | | Total Urban Properties and Investments Business Other operating results, net | | | 93,268 | | | | (1,497 | ) | | | 654 | | | | 92,425 | |
Other operating results, net decreased from a Ps. 93.3 million gain in fiscal year 2013 to a Ps. 45.9 million net loss in fiscal year 2014, mainly due to a non-recurring gain of Ps. 137.0 million recognized in fiscal year 2013 as a result of the acquisition of an additional interest in Rigby 183 LLC.
The effect from the consolidation of our joint ventures is not material on this line. According to the information by segment and considering all our joint ventures and inter-segment eliminations, other operating results, net decreased from a net gain of Ps. 92.4 million in fiscal year 2013 to a net loss of Ps. 47.9 million in fiscal year 2014.
Shopping Center Properties
Other operating results, net from the Shopping Center Properties segment increased by 3.6%, from Ps. 45.0 million in fiscal year 2013 to Ps. 46.6 million in fiscal year 2014, mainly due to:
· | an increase in lawsuits and contingencies of Ps. 1,8 million; and |
· | an increase in donations of Ps. 0.6 million; |
· | partially offset by a Ps. 0.3 million decrease in the project analysis and assessment expense. |
The net loss from other operating results, as a percentage of revenues derived from the Shopping Center Properties segment, decreased from 4.1% in fiscal year 2013 to 3.4% in fiscal year 2014.
Offices
The net loss from other operating results of our Offices segment increased Ps. 2.9 million from Ps. 0.3 million in fiscal year 2013 to Ps. 3.1 million in fiscal year 2014, mainly due to:
· | a non-recurring recovery from the allowance for asset impairment recorded in 2013 for Ps. 1.8 million; and |
· | an increase of Ps. 0.7 million in lawsuits and other contingencies. |
The net loss from operating results of our Offices segment, as a percentage of revenues derived from this segment, increased from 0.1% in fiscal year 2014 to 1.1% in fiscal year 2014.
Sales and Developments
The net gain from other operating results of our Sales and Developments segment increased Ps. 1.8 million from Ps. 6.3 million in fiscal year 2013 to Ps. 8.1 million in fiscal year 2014, mainly due to:
· | an “admission fee” charged in connection with the sale of a hotel plot in Neuquén; |
· | a Ps. 2.2 million decrease in the project analysis and assessment expense; and |
· | a reduction in lawsuits and contingencies during this year; |
· | partially offset by a non-recurring gain of Ps. 15.1 million from the sale of our equity interest in Canteras Natal Crespo S.A. (one of the Company’s joint ventures), recognized in fiscal year 2013. |
Hotels
The net loss from operating results of our Hotel segment increased by Ps. 2.3 million, from Ps. 0.4 million in fiscal year 2013 to Ps. 2.7 million in fiscal year 2014, mainly as a result of an increase in the reserve for lawsuits and other contingencies.
The net loss from operating results of our Hotels segment, as a percentage of revenues derived from this segment, increased from 0.2% in fiscal year 2013 to 0.8% in fiscal year 2014.
International
Other operating results, net from this segment decreased from a Ps. 135.1 million net gain in fiscal year 2013 to a Ps. 0.9 million net loss in fiscal year 2014, mainly due to a non-recurring gain of Ps. 136.0 million generated in fiscal year 2013 as a result of the acquisition of an additional interest in Rigby 183 LLC.
Financial Operations and Others
The net loss from other operating results from our Financial Operations and Others segment decreased by Ps. 0.5 million from Ps. 3.4 million in fiscal year 2013 to Ps. 2.9 million in fiscal year 2014, mainly due to lower taxes deducted by BHSA on lower dividends distributed in fiscal year 2014 to our subsidiaries Ritelco and Tyrus.
Operating results
As a result of the above mentioned factors, the operating results of the Company increased by Ps. 86.4 million (7.7%), from a gain of Ps. 1,116.6 million in fiscal year 2013 to a gain of Ps. 1,203.0 million in fiscal year 2014.
Agricultural Business
Profit / (loss) from operations of the Agricultural business decreased Ps. 72.5 million (206.1%), from an income of Ps. 35.2 million in fiscal year 2013 to a loss of Ps.37.3 million in fiscal year 2014.
Crops
Profit / (loss) from operations of this segment decreased Ps. 37.4 million (34.0%) from a Ps. 110.1 million loss in fiscal year 2013 to a Ps. 147.5 million loss in fiscal year 2014.
Cattle
Profit / (loss) from operations of this segment increased Ps. 45.9 million (332.6%), from a loss of Ps. 13.8 million in fiscal year 2013 to an income of Ps.32.1 million in fiscal year 2014.
Dairy
Profit / (loss) from operations of this segment increased Ps. 5.1 million (488.5%), from a loss of Ps. 1.0 million in fiscal year 2013 to an income of Ps.4.0 million in fiscal year 2014.
Sugarcane
Profit / (loss) from operations of this segment decreased by Ps. 46.9 million (172.5%), from a gain of Ps. 27.2 million in fiscal year 2013 to a loss Ps.19.7 million in fiscal year 2014.
Agricultural Rental and Services
Profit / (loss) from operations of this segment decreased by Ps. 3.4 million (29.7%), from a Ps. 11.5 million gain in fiscal year 2013 to a Ps. 8.1 million gain in fiscal year 2014.
Land Transformation and Sales
Profit / (loss) from operations of this segment decreased by Ps. 54.5 million (41.1%), from a gain of Ps.132.6 million in fiscal year 2013 to a gain of Ps.78.0 million in fiscal year 2014.
Agro-industrial
Profit / (loss) from operations of this segment decreased by Ps. 31.5 million (106.4%), from a loss of Ps. 29.6 million in fiscal year 2013 to a gain of Ps.1.9 million in fiscal year 2014.
Other Segments
Profit / (loss) from operations of this segment decreased by Ps. 12.7 million (69.0%), from a gain of Ps.18.4 million in fiscal year 2013 to a gain of Ps.5.7 million in fiscal year 2014.
Urban Properties and Investments Business
Profit / (loss) from operations of this business increased Ps.158.9 million (14.7%) from an income of Ps.1,081.4 million in fiscal year 2013 to an income of Ps.1,240.3 million in fiscal year 2014. This was mainly due to an increase of Ps. 316.2 million in the Shopping Center Properties, Offices, Sales and Developments, Hotels and Financial operations and Others segment, partially offset by a Ps. 159.3 million reduction in the International segment.
Shopping Center Properties
Profit / (loss) from operations of our Shopping Center Properties segment increased by 26.1%, from a gain of Ps. 686.0 million in fiscal year 2013 to a gain of Ps. 864.7 million in fiscal year 2014.
Profit / (loss) from operations of our Shopping Center Properties segment as a percentage of revenues derived from this segment stood at approximately 62.0% in both fiscal years.
Offices
Profit / (loss) from operations of our Offices segment increased by 29.5%, from a gain of Ps. 123.6 million in fiscal year 2013 to a gain of Ps. 160.0 million in fiscal year 2014.
Profit / (loss) from operations of our Offices segment as a percentage of revenues derived from this segment increased from 43.5% in fiscal year 2013 to 48.0% in fiscal year 2014.
Sales and Developments
Profit / (loss) from operations of our Sales and Developments segment increased by 40.0%, from a gain of Ps. 170.4 million in fiscal year 2013 to a gain of Ps. 238.5 million in fiscal year 2014.
Profit / (loss) from operations of our Sales and Developments segment, as a percentage of the revenues derived from this segment, increased from 124.2% in fiscal year 2013 to 285.8% in fiscal year 2014.
Hotels
Profit / (loss) from operations of our Hotels segment went from a loss of Ps. 22.4 million in fiscal year 2013 to a gain of Ps. 10.2 million in fiscal year 2014.
International
Profit / (loss) from operations of our International segment decreased from a gain of Ps. 129.3 million in fiscal year 2013 to a loss of Ps. 30.0 million in fiscal year 2014.
Financial Operations and Others
Profit / (loss) from operations of our Financial Operations and Others segment increased from a loss of Ps. 5.5 million in fiscal year 2013 to a loss of Ps. 3.2 million in fiscal year 2014.
Share of (loss) / profit of associates and joint ventures
Share of (loss) / profit of associates and joint ventures decreased Ps. 398.9 million, from a Ps. 9.8 million loss in fiscal year 2013 to a Ps. 408.7 million loss in fiscal year 2014, mainly due to:
· | a reduction of Ps. 415.9 million in the share of (loss) / profit from our interest in companies related to our Urban Properties and Investments business recorded in fiscal year 2014; |
· | partially offset by a Ps. 2.3 million increase in the Agricultural business, mainly as a result of the revenues derived from the investment in Agro-Uranga (Crops segment). |
Net financial results
We had a higher net financial loss of Ps. 1,665.6 million, from a loss of Ps. 908.8 million in fiscal year 2013 to a loss of Ps. 2,574.4 million in fiscal year 2014. This was primarily due to:
· | a higher loss of Ps. 1,417.8 million in net exchange differences in fiscal year 2014; |
· | a higher loss of Ps. 207.7 million in net financial interest recorded in fiscal year 2014; |
· | a higher income of Ps. 23.9 million in revaluation of receivables from sale of farms in fiscal year 2014; |
· | a higher loss of Ps. 358.2 million in derivative financial instruments in fiscal year 2014; and |
· | a higher income of Ps. 294.7 million generated by the results from financial transactions and other in fiscal year 2014. |
Our net financial loss in fiscal year 2014 was mainly attributable to (i) a Ps. 1,900 million loss generated by exchange differences mainly as a result of a higher liability position in US Dollars due to the issuance of new series of notes; (ii) a loss of Ps. 737.9 million generated by interest accrued on debt financing, mainly due to increased indebtedness and higher interest rates; and (iii) a loss of Ps. 315.6 million generated mainly by derivative instruments due to IDBD’s tender offer.
There was a 50% variation in the U.S. Dollar buying rate during fiscal year 2014 (it increased from Ps. 5.348 as of June 30, 2013 to Ps. 8.033 as of June 30, 2014) as compared to the previous fiscal year, when the U.S. Dollar quotation had experienced a smaller variation, of 19% (from Ps. 4.487 as of June 30, 2012 to Ps. 5.348 as of June 30, 2013).
Income tax
Our income tax expense decreased Ps. 422.9 million, from a Ps. 33.5 million loss in fiscal year 2013 to Ps. 389.4 million income in fiscal year 2014. The Company recognizes the income tax expense on the basis of the deferred tax liability method, thus recognizing temporary differences between accounting and tax assets and liabilities measurements. The main temporary differences for the Agricultural business derive from valuation of cattle stock and sale and replacement of property, plant and equipment, while those corresponding to the Urban Properties and Investments business derive from the sale and replacement of investment properties.
For purposes of determining the deferred assets and liabilities, the tax rate expected to be in force at the time of their reversion or use, according to the legal provisions enacted as of the date of issuance of these financial statements, has been applied to the identified temporary differences and tax losses.
Profit / (loss) for the Fiscal Year
Due to the above mentioned factors, our profit / (loss) for the fiscal year decreased by Ps. 1,562.7 million (1,012.8%) from a net income Ps. 154.3 million for fiscal year 2013 to a net loss Ps. 1,408.4 million in fiscal year 2014. Profit / (loss) for fiscal years 2014 and 2013 is attributable to the controlling company’s shareholders and non-controlling interest, as per the following detail:
· | Profit / (loss) attributable to the controlling company’s shareholders decreased by Ps. 1,041.0 million, from a loss of Ps. 26.9 million in fiscal year 2013 to a loss of Ps. 1,067.9 million in fiscal year 2014; and |
· | the non-controlling interest in controlled companies decreased by Ps. 521.7 million (287.9%), from an income of Ps. 181.2 million in fiscal year 2013 to a loss of Ps. 340.5 million in fiscal year 2014, mainly due to a reduction of Ps. 69.2 million in Brasilagro, a reduction of Ps. 392.2 million in our subsidiary IRSA, and a reduction of Ps. 59.9 million in other companies from the Urban Properties and Investments business. |
Liquidity Our main sources of liquidity have historically been: · | cash generated by operations; |
· cash generated by operations; · | cash generated by our issuance of common shares and non-convertible notes; |
· | cash proceeds from borrowings (including cash from bank loans and overdrafts) and financing arrangements (including cash from the exercise of warrants); and |
· | cash proceeds from sale of investment and trading properties and property, plant and equipment (including cash proceeds from the sale of farmlands). |
Our main cash requirements or uses (other than in connection with our operating activities) have historically been: · | acquisition of subsidiaries and non-controlling interest in subsidiaries; |
· acquisition of subsidiaries and non-controlling interest in subsidiaries; · | acquisition of interest in associates and joint ventures; |
· acquisition of interest in associates and joint ventures; · | capital contributions to associates and joint ventures; |
· capital contributions to associates and joint ventures; · | capital expenditures in property, plant and equipment (including acquisitions of farmlands) and investment and trading properties; |
· capital expenditures in property, plant and equipment (including acquisitions of farmlands) and investment and trading properties; · | payments of short-term and long-term debt and payment of the related interest expense; and |
· payments of short-term and long-term debt and payment of the related interest expense; and Our liquidity and capital resources include our cash and cash equivalents, proceeds from operating activities, sales of investment properties, trading properties and farms, obtained bank borrowings, long-term debts incurred and capital funding. Cash Flows The table below shows our cash flow for the fiscal years ended June 30, 2016, 2015 2014 and 2013:2014: | | | For the fiscal year ended June 30, | | | | 2015 | | | 2014 | | | 2013 | | | | | (in millions of Pesos) | | Net cash generated by operating activities | | | 494.5 | | | | 883.2 | | | | 648.5 | | | Net cash generated from/ (used in) investing activities | | | 873.9 | | | | (885.9 | ) | | | (93.0 | ) | | Net cash used in financing activities | | | (1,778.2 | ) | | | (446.2 | ) | | | (17.2 | ) | | Net (decrease) increase in cash and cash equivalents | | | (409.8 | ) | | | (449.0 | ) | | | 538.3 | |
| | For the fiscal year ended June 30, | | | | | | | | (in million of Pesos) | | | | | | | Net cash generated from operating activities | 4,055 | 494 | 883 | | Net cash generated from / (used in) investing activities | 8,652 | 872 | (886) | | Net cash used in financing activities | (4,495) | (1,776) | (446) | | Net increase(decrease) in cash and cash equivalents | 8,212 | (410) | (449) | | | | | | | | | | |
As of June 30, 2015, we had cash and cash equivalents of Ps. 633.7 million, a decrease compared to Ps. 1,003.0 million as of June 30, 2014. The decrease was primarily due to cash outflows related with the cancellation of non-convertible notes, financial loans and financial interests for Ps. 3,205.9 million, the repurchase of non-convertibles notes and equity interest for Ps. 337.9 million, the payment of derivative financial instruments for Ps. 233.1 million, the acquisition of investments in financial assets for Ps. 4,609.6 million, the acquisition of investment properties for Ps. 249.7 million, the acquisition of property, plant and equipment for Ps. 220.6 million, and capital contributions and acquisitions of interest in associates and joint ventures for Ps. 1,368.0 millions; partially offset by the cash inflows from operating activities of Ps. 494.5 million, the issuance of non-convertible notes for Ps. 693.4 million, an increase in the short and long-term debt of Ps. 1,497.8 million, and the disposal of investments in financial assets, investment properties and farms for Ps. 4,486.6 million, Ps. 2,446.7 million and Ps. 326.0 million, respectively. As of June 30, 2014, we had cash and cash equivalents of Ps. 1,003.0 million, a decrease compared to Ps. 1,047.6 million as of June 30, 2013. The decrease was primarily due to cash inflows from operating activities of Ps. 883.2 million, the issuance of non-convertible notes for Ps. 1,051.8 million, an increase in the short and long-term debt of Ps. 793.5 million, and the disposal of investments in financial assets, investment properties and farms for Ps. 3,870.8 million, Ps. 402.2 million and Ps. 125.9 million, respectively; partially offset by the cash outflows related with the cancellation of non-convertible notes, financial loans and financial interests for Ps. 1,966.6 million, the acquisition of investments in financial assets for Ps. 3,683.0 million, the payment of dividends for Ps. 243.6 million, the acquisition of investment properties for Ps. 271.9 million, the acquisition of property, plant and equipment for Ps. 133.4 million, and capital contributions and acquisitions of interest in associates and joint ventures for Ps. 1,192.1 millions.
As of June 30, 2015,2016, we had negative working capital of Ps. 251.2478 million (calculated as current assets less current liabilities as of such date).
As of June 30, 2016, in our Agricultural business, we had positive working capital of Ps. 595 million (calculated as current assets less current liabilities as of such date).
As of June 30, 2016, in our Urban Properties and Investments Business, our Operation Center in Argentina had negative working capital of Ps. 185 million while our Operations Center in Israel had negative working capital of Ps.888 million, resulting in a consolidated negative working capital of Ps. 1073 million (calculated as current assets less current liabilities as of such date).
At the same date, our Operations Center in Argentina had cash and cash equivalents of Ps.95 million while our Operations Center in Israel had cash and cash equivalents of Ps.13,771 million, totaling consolidated cash and cash equivalents for Ps.13,866 million. IDBD has diverse debts containing certain covenants which have been successively negotiated, resulting in several waivers expiring in December 2016. IDBD estimates that if the original covenants of such loans were to become effective again, it would not be able to honor them. Non-compliance could have the effect of creditors requiring immediate repayment of the debt. As a holding company, IDBD’s main sources of funds derive from the dividends distributed by its subsidiaries, which have experienced a reduction in recent years. Yet, there are restrictions as to the payment of dividends based on the indebtedness level in some subsidiaries. IDBD has projected future cash flows and expects to have the required liquidity to meet its commitments by issuing new debt in Israel, selling financial assets such as Clal and dividend payouts by Clal. IDBD could also secure additional financing through the private issuance of equity securities. All factors mentioned above, mainly (i) IDBD’s current financial position and need of financing to honor its financial debt and other commitments, (ii) the renegotiation underway with financial creditors, and (iii) the term set by Israel’s governmental authorities to sell the equity interest in Clal and the potential effects of such sale, in particular, on its market value, raise significant uncertainties as to IDBD’s capacity to continue as a going-concern. The financial position of IDBD and its subsidiaries at the operations center in Israel does not affect the financial position of IRSA and its subsidiaries at the operations center in Argentina. The operation center in Argentina is not facing financial constraints and is compliant with their financial commitments. We believe our working capital (calculated by subtracting current liabilities from current assets) and our cash from operating activities are adequate for our present and future requirements. In the event thatIf cash generated from our operations is at any time insufficient to finance our working capital, we would seek to finance such working capital needs through debt financing or equity issuances or through the sale of selected non-coreselective assets.
In addition, the commitments and other covenants resulting from IDBD’s debt do not have impact on IRSA since such debt has no recourse against IRSA and it is not granted by IRSA’s assets. We do not have significant uncertainties as to the capacity as a group to operate as a going-concern perspective, with such uncertainties being limited to the operation center in Israel. For more information about our liquidity please see “Item 3(d) Risk Factors” and “Recent Developments.”Developments”. On September 10, 2015,8, 2016, IRSA Commercial Properties closed the sale to an unrelated third party of 5,963 square meters in the Intercontinental Plaza Building. The purchase price was Ps.324.5 million, which has been fully paid. For more information see “Recent Development”. On September 18, 2015, IRSA Commercial Properties issued Series IVII and VIII Notes in an aggregate principal amount of Ps.407.3 million.Ps.384.2 million and US$184.5 million, respectively. Series IVII and VIII Notes have a maturity of 1836 months from its issue date. In addition, on October 16, 2015 IRSA filed to de CNV the updated document of the Global Note Program for up to US$ 300,000,000.For more information, please see “Recent Developments”.
On November 6, 2015, IRSA closedAugust 2, 2016, IDBD issued a new Series of Notes in the sale toIsraeli market for NIS 325 million, bearing an unrelated third partyadjustable interest rate and maturing in 2019. Furthermore, DIC expended it issuance of 864 square meters of Maipú 1300 Builidng, that represent two floors of office space, and 4 parking units. After such sale, 2,134 square feet remain in our portfolio. The purchase price was U$S 3 million, which has been fully paid. Notes due 2025 for an additional NIS 360 million. For more information, please see “Recent Developments”. Net cash provided by operating activities Fiscal Year ended June 30, 2016 and 2015. Net cash provided by operations increased from a net cash inflow of Ps. 494 million during fiscal year ended June 30, 2015 to a net cash inflow of Ps. 4,055 million during fiscal year ended June 30, 2016. The increase in net cash provided by operating activities was primarily due to an increase in inventories of Ps. 53 million; a decrease in trade and other receivables of Ps. 7 million; a decrease in trading properties of Ps. 229 million, an increase in trade and other payables for Ps. 37 million that was partially offset by an increase of Ps. 50 million in derivative financial instruments, a decrease in payroll and social security liabilities of Ps. 33 million and an increase of Ps. 143 million in provisions during fiscal year ended June 30, 2016 compared to fiscal year ended June 30, 2015. Our operating activities resulted in net cash inflows of Ps. 4,055 million for the fiscal year ended on June 30, 2016, mainly due to operating gains of Ps. 5,035 million, an increase of 182 million in trade and other payables, a decrease of Ps. 135 million in biological assets, a decrease in trading properties of Ps. 229 million and an increase of Ps. 52 million in payroll and social security liabilities, partially offset by the income tax paid of Ps. 811 million, an decrease of Ps. 79 million in inventories, and an increase of Ps. 487 million in trade and other receivables. Fiscal Year ended June 30, 2015 and 20142014. Net cash provided by operations decreased from a net cash inflow of Ps.883.2Ps. 883 million during fiscal year ended June 30, 2014 to a net cash inflow of Ps. 494.5494 million during fiscal year ended June 30, 2015. The decrease in net cash provided by operating activities was primarily due to a decrease in biological assets of Ps. 171.9172 million and an increase of Ps. 748.2748 million in trade and other receivables; that was partially offset by an increase of Ps. 295.6296 million in operating gains, a decrease in inventories of Ps. 65.265 million and an increase of Ps. 314.7315 million in trade and other payables during fiscal year ended June 30, 2015 compared to fiscal year ended June 30, 2014. Our operating activities resulted in net cash inflows of Ps. 494.5494 million for the fiscal year ended on June 30, 2015, mainly due to operating gains of Ps. 1,199.71,199 million, an increase of Ps. 144.8145 million in trade and other payables, a decrease of Ps. 114.6115 million in biological assets, and an increase of Ps. 84.985 million in payroll and social security liabilities, partially offset by the income tax paid of Ps. 429.9430 million, an decrease of Ps. 131.7132 million in inventories, and an increase of Ps. 748.2480 million in trade and other receivables. Fiscal Year ended June 30, 2014 and 2013
Net cash provided by operations increased from a net cash inflow of Ps.648.5 million during fiscal year ended June 30, 2013 to a net cash inflow of Ps. 883.2 million during fiscal year ended June 30, 2014. The increase in net cash provided by operating activities was primarily due to an increase of Ps. 156.1 million in operating gains, a decrease of Ps. 533.7 million in trade and other receivables, and a decrease in derivative financial instruments of Ps. 25.7 million; that was partially offset by a decrease of Ps. 390.0 million in trade and other payables and an increase in inventories of Ps. 139.9 million during fiscal year ended June 30, 2014 compared to fiscal year ended June 30, 2013.
Our operating activities resulted in net cash inflows of Ps. 883.2 million for the fiscal year ended on June 30, 2014, mainly due to operating gains of Ps. 903.8 million, a decrease of Ps. 268.3 million in trade and other receivables, a decrease of Ps. 286.6 million in biological assets, and an increase of Ps. 71.6 million in payroll and social security liabilities, partially offset by the income tax paid of Ps. 279.9 million, an increase of Ps. 196.8 million in inventories, and a decrease of Ps. 170.0 million in trade and other payables.
Net cash used in investing activities Fiscal Year ended June 30, 20152016 and 20142015. Net cash used in investing activities increased from a net cash outflow of Ps. 885.9872 million during fiscal year ended on June 30, 2015 to a net cash inflow of Ps. 8,652 million during fiscal year ended on June 30, 2016. This variation was mainly due to an increase in cash incorporated by business combination of Ps. 9,193 million, a decrease in acquisition of interest in associates and joint ventures of Ps. 1,242 million, an increase in disposal of investment in financial assets for Ps. 9,642 million; this increase was partially offset by an increase purchases of investment properties of Ps. 638 million, a decrease of Ps. 1,053 million from sale of investment properties and an increase in purchases of property, plant and equipment of Ps. 924 million, an increase in acquisition of investment in financial instruments of Ps. 8,903 million and an increase in loans granted to associates and joint ventures of Ps. 852 million during fiscal year ended June 30, 2016 compared to fiscal year ended June 30, 2015. Our investing activities resulted in net cash inflows of Ps. 8,652 million for the fiscal year ended on June 30, 2016 mainly due to the sale of financial instruments, investment properties and associates and joint ventures of Ps. 14,129 million, and Ps. 1,394 million, respectively, and cash incorporated by business combination of Ps. 9,193 million and dividends received of Ps. 593 million; partially offset by cash outflows related to acquisitions of investments in financial assets of Ps. 13,513 million, investment properties of Ps. 888 million, property, plant and equipment (including suppliers advances) of Ps. 1,152 million, loans granted to associates and joint ventures of Ps. 852 million, and capital contributions to associates and joint ventures of Ps. 207 million.
Fiscal Year ended June 30, 2015 and 2014. Net cash used in investing activities increased from a net cash outflow of Ps. 886 million during fiscal year ended on June 30, 2014 to a net cash inflow of Ps. 873.9872 million during fiscal year ended on June 30, 2015. This variation was mainly due to a decrease in acquisition of investment properties forof Ps. 22.222 million, an increase of cash arising from the sale of farms forof Ps. 200.0201 million, an increase in the inflows of cash arising from the sale of financial instruments forof Ps. 615.8616 million and the sale of investment properties forof Ps. 2,044.52,045 million; this increase was partially offset by an increase in acquisitions of investments in financial assets forof Ps. 926.6927 million, a decrease in acquisition of interest in associates and joint ventures forof Ps. 109.8110 million and an increase in acquisition of property, plant and equipment forof Ps. 87.288 million during fiscal year ended June 30, 2015 compared to fiscal year ended June 30, 2014. Our investing activities resulted in net cash inflows of Ps. 873.9872 million for the fiscal year ended on June 30, 2015 mainly due to the sale of financial instruments, farms, investment properties and associates and joint ventures for Ps. 4,486.64,487 million, Ps. 326.0328 million, Ps. 2,446.72,447 million, and Ps. 55,856 million, respectively, and dividends collected for Ps. 18.018 million; partially offset by cash outflows related to acquisitions of investments in financial assetsinstruments for Ps. 4,609.64,610 million, investment properties for Ps. 249.7250 million, property, plant and equipment (including advances) for Ps. 234.6236 million and subsidiaries, associates and joint ventures for Ps. 1,241.61,242 million, and capital contributions to associates and joint ventures for Ps. 126.4 million. Fiscal Year ended June 30, 2014 and 2013
Net cash used in investing activities increased from a net cash outflow of Ps. 93.0 million during fiscal year ended on June 30, 2013 to a net cash outflow of Ps. 885.9 million during fiscal year ended on June 30, 2014. This variation was mainly due to an increase in acquisitions of investments in financial assets for Ps. 1,944.0 million, an increase in acquisition of interest in associates and joint ventures for Ps. 1,105.9 million, an increase in acquisition of investment properties for Ps. 58.9 million, and a decrease in the inflows of cash arising from the sale of farms for Ps. 104.5 million; this increase was partially offset by an increase in the inflows of cash arising from the sale of financial instruments for Ps. 2,002.3 million and the sale of investment properties for Ps. 273.6 million, and a decrease in the outflows of cash applied in loans granted to associates and joint ventures for Ps. 57.7 million and acquisition of subsidiaries for Ps. 117.9 million during fiscal year ended June 30, 2014 compared to fiscal year ended June 30, 2013.
Our investing activities resulted in net cash outflows of Ps. 885.9 million for the fiscal year ended on June 30, 2014 mainly due to acquisitions of investments in financial assets for Ps. 3,683.0 million, investment properties for Ps. 271.9 million, property, plant and equipment (including advances) for Ps. 163.1 million and subsidiaries, associates and joint ventures for Ps. 1,131.8 million, and capital contributions to associates and joint ventures for Ps. 60.3 million; partially offset by cash inflows related to the sale of financial instruments, farms, investment properties and associates and joint ventures for Ps. 3,870.8 million, Ps. 125.9 million, Ps. 402.2 million, and Ps. 22.8 million, respectively, and dividends collected for Ps. 22.4126 million.
Net cash used in financing activities Fiscal Year ended June 30, 20152016 and 20142015. Net cash used in financing activities decreased from a net cash outflow of Ps.446.2Ps.1,776 million during fiscal year ended June 30, 2015 to a net cash outflow of Ps. 4,495 million during fiscal year ended June 30, 2016, mainly due to an increase of Ps. 3,219 million in payments of non-convertible notes, an increase in payments of borrowings of Ps. 9,697 million, an increase of Ps. 1,160 million in acquisitions of non-controlling interest in subsidiaries, an increase in interest paid for Ps. 3,308, and an increase payment of derivative financial instruments of Ps. 387 million; the decrease was partially offset by an due to an increase cash inflows associated with the issuance of non-convertible notes of Ps. 7,319 million, increase in the cash arising from borrowings from financial entities of Ps. 5,689 million, an increase in proceeds from derivative financial instruments of Ps. 2,091 million, during fiscal year ended June 30, 2016 compared to fiscal year ended June 30, 2015. Our financing activities resulted in net cash outflows of Ps. 4,495 million for the fiscal year ended on June 30, 2016 mainly due to the cancellation of non-convertible notes, financial loans and financial interests for Ps. 4,291 million, Ps. 11,031 million and Ps. 4,107 million, respectively, acquisition of non-controlling interest in subsidiaries for Ps. 1,192, payment of dividends for Ps. 239 million, payment of derivative financial instruments for Ps. 620 million, and repurchase of non-convertible notes for Ps. 209 million; partially offset by cash inflows associated with the issuance of non-convertible notes for Ps. 8,012 million, borrowings taking from financial entities for Ps. 7,187 million and from derivative financial instruments for Ps. 2,093 million. Fiscal Year ended June 30, 2015 and 2014. Net cash used in financing activities decreased from a net cash outflow of Ps.446 million during fiscal year ended June 30, 2014 to a net cash outflow of Ps. 1,778.21,776 million during fiscal year ended June 30, 2015, mainly due to an increase of Ps. 494.9494. million in the cancellation of non-convertible notes and financial interests, an increase of Ps. 744.4744 million in payments of financial loans, a decrease in the inflow of cash arising from the issuance of non-convertible notes forof Ps. 358.4359 million, an increase of Ps. 31.131 million in acquisitions of non-controlling interest, an increase in the repurchase of non-convertible notes forof Ps. 141.6 million,142, a decrease in the proceeds from derivative financial instruments forof Ps. 60.760 million and a decrease of Ps. 123.1123 million in contributions from non-controlling interest; the decrease was partially offset by an increase in the cash arising from borrowings from financial entities forof Ps. 704.3705 million, a decrease in dividends paid forof Ps. 210.1210 million, a decrease in the repurchase of non-convertible notes forequity interest of Ps. 64.965 million and an increased of Ps. 181.5182 million in sale of equity interest in subsidiaries to non-controlling interest, during fiscal year ended June 30, 2015 compared to fiscal year ended June 30, 2014. Our financing activities resulted in net cash outflows of Ps. 1,778.21,776 million for the fiscal year ended on June 30, 2015 mainly due to the cancellation of non-convertible notes, financial loans and financial interests forof Ps. 1,072.01,072 million, Ps. 1,334.51,334 million and Ps. 799.4799 million, respectively, payment of dividends forof Ps. 33.534 million, payment of seller financing of shares forof Ps. 105.9106 million, capital reduction of subsidiaries forof Ps. 228.1228 million, payment of derivative financial instruments forof Ps. 233.1233 million, and repurchase of non-convertible notes and equity interest forof Ps. 305.0305 million and Ps. 32.933 million, respectively; partially offset by cash inflows associated with the issuance of non-convertible notes forof Ps. 693.4693 million, borrowings taking from financial entities forof Ps. 1,497.81,498 million and from associates and joint ventures forof Ps. 22.222 million, contribution from non-controlling interest forof Ps. 15.916 million, and sale of equity in subsidiaries to non-controlling interest for Ps. 181.8 million. Fiscal Year ended June 30, 2014 and 2013
Net cash used in financing activities decreased from Ps.17.2 million during fiscal year ended June 30, 2013 to Ps. 446.2 million during fiscal year ended June 30, 2014, mainly due to an increase of Ps. 577.6 million in the cancellation of non-convertible notes and financial interests, an increase of Ps. 81.6 million in payments of financial loans, a decrease in the cash inflows of cash arising from borrowings from financial entities for Ps. 85.2 million and from associates and joint ventures for Ps. 53.5 million; the decrease was partially offset by an increase in the inflow of cash arising from the issuance of non-convertible notes for Ps. 251.4 million, a decrease of Ps. 48,7 million in acquisitions of non-controlling interest, a decrease of Ps. 147.8 million in distribution of share capital of subsidiaries, and an increase of Ps. 131.0 million in contributions from non-controlling interest, during fiscal year ended June 30, 2014 compared to fiscal year ended June 30, 2013.
Our financing activities resulted in net cash outflows of Ps. 446.2 million for the fiscal year ended on June 30, 2014 mainly due to the cancellation of non-convertible notes, financial loans and financial interests for Ps. 799.6 million, Ps. 590.1 million and Ps. 576.9 million, respectively, payment of dividends for Ps. 243.6 million, and repurchase of non-convertible notes and equity interest for Ps. 163.5 million and Ps. 97.7 million, respectively; partially offset by cash inflows associated with the issuance of non-convertible notes for Ps. 1,051.8 million, borrowings taking from financial entities for Ps. 793.5 million and from associates and joint ventures for Ps. 17.2 million, contribution from non-controlling interest for Ps. 139.1 million, and proceeds from derivative financial instruments for Ps. 62.2182 million.
Indebtedness As of June 30, 2015, we had total loans in the amount of Ps. 8,299.1 million.
The following table below sets forth the scheduled maturities of our indebtedness by maturing date: | | Schedule of Maturities or Amortization | | | | Currency | | LESS THAN 1 YEAR (1) | | | MORE THAN 1 YEAR AND UP TO 2 YEARS | | | MORE THAN 2 YEARS AND UP TO 3 YEARS | | | MORE THAN 3 YEARS AND UP TO 4 YEARS | | | MORE THAN 4 YEARS | | | TOTAL(2) | | | ANNUAL AVERAGE INTEREST RATE | | | | (in million Pesos, constant currency as of June 30, 2015) (3) | | | Bank and Other debt | | | | | | | | | | | | | | | | | | | | | | | Bank loans (4) | Ps. | | | 616.0 | | | | - | | | | - | | | | - | | | | - | | | | 616.0 | | | 15.01%; 22.54% | | | Bank loans | Ps. | | | 7.6 | | | | 6.6 | | | | 3.3 | | | | - | | | | - | | | | 17.5 | | | Floating | | Bank loans (3) | US$ | | | 10.2 | | | | 13.8 | | | | 20.7 | | | | 20.7 | | | | 62.4 | | | | 127.8 | | | Floating | | Bank loans (4) | Ps. | | | 687.4 | | | | 5.8 | | | | 2.3 | | | | - | | | | - | | | | 695.5 | | | 20.2%' | | Bank loans (4) | Ps. | | | 106.5 | | | | - | | | | - | | | | - | | | | - | | | | 106.5 | | | 22.51% | | | Other borrowings | NIS | | | 15.1 | | | | - | | | | - | | | | - | | | | - | | | | 15.1 | | | | n/a | | Secured bank loans (3) | R$ | | | 139.2 | | | | 40.2 | | | | 39.8 | | | | 38.0 | | | | 43.1 | | | | 300.3 | | | Floating | | Cresud’s Series XIV Notes (3) | US$ | | | 0.1 | | | | - | | | | 290.2 | | | | - | | | | - | | | | 290.3 | | | 1.50% | | | Cresud’s Series XV Notes | Ps. | | | 120.8 | | | | - | | | | - | | | | - | | | | - | | | | 120.8 | | | 23.67% | | Cresud’s Series XVI Notes (3) | US$ | | | 5.0 | | | | - | | | | 499.3 | | | | 499.3 | | | | - | | | | 1,003.6 | | | 1.50% | | | Cresud’s Series XVII Notes | Ps. | | | 172.6 | | | | - | | | | - | | | | - | | | | - | | | | 172.6 | | | Badlar + 250 bps | | Cresud’s Series XVIII Notes (3) | US$ | | | 1.1 | | | | - | | | | - | | | | 154.0 | | | | 154.0 | | | | 309.1 | | | 4.00% | | | Cresud’s Series XIX Notes | Ps. | | | 0.8 | | | | 185.7 | | | | - | | | | - | | | | - | | | | 186.5 | | | 27.5% ; Badlar + 350 bps | | Cresud’s Series XX Notes (3) | US$ | | | 0.8 | | | | 56.2 | | | | - | | | | - | | | | - | | | | 57.0 | | | 2.5% | | IRSA Commercial Properties’s Series I Notes (3) | US$ | | | 10.7 | | | | 1,021.8 | | | | - | | | | - | | | | - | | | | 1,032.5 | | | 7.88% | | IRSA’s Series I Notes (3) | US$ | | | 47.3 | | | | 1,352.7 | | | | - | | | | - | | | | - | | | | 1,400.0 | | | 8.50% | | IRSA’s Series II Notes (3) | US$ | | | 62.8 | | | | - | | | | - | | | | - | | | | 1,202.1 | | | | 1,264.9 | | | 11.50% | | | IRSA’s Series I Notes | Ps. | | | 214.1 | | | | - | | | | - | | | | - | | | | - | | | | 214.1 | | | Badlar + 395 bps | | | IRSA’s Series II Notes | Ps. | | | 0.3 | | | | 10.7 | | | | - | | | | - | | | | - | | | | 11.0 | | | Badlar + 450 bps | | | Syndicated loans | Ps. | | | 75.5 | | | | - | | | | - | | | | - | | | | - | | | | 75.5 | | | 15.01% ; 15.25% | | Secured seller financing (3) | US$ | | | - | | | | - | | | | - | | | | - | | | | 71.0 | | | | 71.0 | | | | n/a | | Seller financing (3) | R$ | | | 143.1 | | | | - | | | | - | | | | - | | | | - | | | | 143.1 | | | Floating | | Finance lease obligations (3) | R$ | | | 9.9 | | | | 6.6 | | | | 3.2 | | | | 2.6 | | | | - | | | | 22.3 | | | 6.92%' | | Secured finance lease obligations (3) | US$ | | | 1.9 | | | | 0.8 | | | | 0.6 | | | | - | | | | - | | | | 3.3 | | | 10.75% ; from 7.14 to 13.28% | | | Secured obligations | Bol. | | | 3.1 | | | | 3.4 | | | | - | | | | - | | | | - | | | | 6.5 | | | From 7 to 10.19% | | | Related parties | Ps. | | | 7.8 | | | | 14.4 | | | | - | | | | - | | | | - | | | | 22.2 | | | Floating | | | Related parties | Ps. | | | 6.4 | | | | 5.9 | | | | 1.8 | | | | - | | | | - | | | | 14.1 | | | 15.25; 24%; Badlar + 300 bps | | | Total bank and other debt | | | | 2,466.1 | | | | 2,724.6 | | | | 861.2 | | | | 714.6 | | | | 1,532.6 | | | | 8,299.1 | | | | | |
(1) Includes accrued interest.
(2) Figures may not sum due to rounding.
(3) Exchange rateoutstanding debt as of June 30, 2015 US$ 1.00 = Ps.9.088, R$ 1.00 = Ps.2.93 and NIS 1.00 = Ps. 2.407
(4) Includes bank overdrafts.2016:
CRESUD’s Outstanding Notes| | Currency | Anual Average Interest Rate | Nominal value | | Agricultural business | | | | | Cresud ´s Series XIV Notes | US$ | 1.50% | 64 | | Cresud ´s Series XV Notes | Ps. | 23.63% | 176 | | Cresud ´s Series XVI Notes | US$ | 1.50% | 218 | | Cresud ´s Series XVII Notes | Ps. | Badlar + 375 bp. | 171 | | Cresud ´s Series XVIII Notes | US$ | 4.00% | 68 | | Cresud ´s Series XIX Notes | Ps. | 27.50% | 187 | | Cresud ´s Series XX Notes | US$ | 2.50% | 36 | | Cresud ´s Series XXI Notes | Ps. | Badlar + 375 bp. | 384 | | Cresud ´s Series XXII Notes | US$ | 4.00% | 44 | | Bank loans | US$ | Libor + 300 bp. or 6% (the higher) | 30 | | Bank loans | Ps. | 15.01% | 31 | | Bank loans | Ps. | Rate Survey PF 30-59 days | 40 | | Bank loans | US$ | 3.50% | 15 | | Bank loans | US$ | 10.75% - 7.14% to 14.5% | 6 | | Bank loans | Bol. | 7% - 10.19% | 14 | | Operations Center in Argentina | | | | | IRSA Commercial Properties’ 2017 Notes | $ | Badlar + 4 bp. | 407 | | IRSA Commercial Properties’ 2023 Notes | US$ | 8.75% | 360 | | IRSA Commercial Properties’ 2017 Notes | US$ | 7.88% | - | IRSA’s 2017 Notes(1) | US$ | 8.50% | 75 | | IRSA’s 2017 Notes | $ | Badlar + 450 bp. | 11 | | IRSA’s 2020 Notes | US$ | 11.50% | 75 | | Financial Leases | US$ | 3.2% al 14.3% | 1 | | Related Party | $ | Badlar | 15 | | Bank loans | $ | 15.25% | 1 | | Bank loans | $ | 26.50% | 7 | | Bank loans | $ | 23.00% | 36 | | Related Party | $ | Badlar / 8,50% | 6 | | Related Party | $ | 15.25% | 6 | | Related Party | $ | 24.00% | 6 | | Seller financing | US$ | N/A | 2 | | Seller financing | US$ | 3.50% | 5 | | Bank overdrafts | $ | from 22% to 39% | - |
| Operations Center in Israel | | | | | Non -convertible Notes IDBD Serie G | NIS | 4.50% | 802 | | Non -convertible Notes IDBD Serie I | NIS | 4.95% | 1.013 | | Non -convertible Notes IDBD Serie J | NIS | 6.60% | 309 | | Non -convertible Notes DIC Serie D | NIS | 5.00% | 103 | | Non -convertible Notes DIC Serie F | NIS | 4.95% | 2.719 | | Non -convertible Notes DIC Serie G | NIS | 6.35% | 8 | | Non -convertible Notes DIC Serie H | NIS | 4.45% | 124 | | Non -convertible Notes DIC Serie I | NIS | 6.70% | 513 | | Non -convertible Notes Shufersal Serie B | NIS | 5.20% | 1.024 | | Non -convertible Notes Shufersal Serie C | NIS | 5.45% | 114 | | Non -convertible Notes Shufersal Serie D | NIS | 2.99% | 413 | | Non -convertible Notes Shufersal Serie E | NIS | 5.09% | 392 | | Non -convertible Notes Shufersal Serie F | NIS | 4.30% | 317 | | Non -convertible Notes Cellcom Serie B | NIS | 5.30% | 185 | | Non -convertible Notes Cellcom Serie D | NIS | 5.19% | 599 | | Non -convertible Notes Cellcom Serie E | NIS | 6.25% | 164 | | Non -convertible Notes Cellcom Serie F | NIS | 4.60% | 715 | | Non -convertible Notes Cellcom Serie G | NIS | 6.99% | 285 | | Non -convertible Notes Cellcom Serie H | NIS | 1.98% | 950 | | Non -convertible Notes Cellcom Serie I | NIS | 4.14% | 804 | | Non -convertible Notes PBC Serie C | NIS | 5.00% | 550 | | Non -convertible Notes PBC Serie D | NIS | 4.95% | 1.317 | | Non -convertible Notes PBC Serie E | NIS | 4.95% | 974 | | Non -convertible Notes PBC Serie F | NIS | 7.05% | 669 | | Non -convertible Notes PBC Gav-Yam Serie E | NIS | 4.55% | 283 | | Non -convertible Notes PBC Gav-Yam Serie F | NIS | 4.75% | 1.226 | | Non -convertible Notes PBC Gav-Yam Serie G | NIS | 6.41% | 215 | | Non -convertible Notes PBC Ispro Serie B | NIS | 5.40% | 255 | | Bank loans and others | NIS | Prime + 1.3% | 333 | | Bank loans and others | NIS | Prime + 1% | 80 | | Bank loans and others | NIS | Prime + 0.65% | 63 | | Bank loans and others | NIS | 6.90% | 150 | | Bank loans and others | NIS | 4.95% | 1 | | Bank loans and others | NIS | 4.95% | 1 | | Bank loans and others | NIS | 3.25% | 1 | | Bank loans and others | US$ | 5.66% | 13 | | Bank loans and others | US$ | 5.21% | 197 | | Bank loans and others | US$ | Libor + 5% | 223 | | Bank loans and others | NIS | 4.60% | 200 |
| | | | | | | Total | | | | Agricultural business | | Urban properties and investments | | | | | | Operations Center in Argentina | Operations Center in Israel | Total | | | | | | | | | | | | | Less than 1 year | | 1,226 | | 2,813 | 19,437 | 22,250 | | 23,476 | | More than 1 and up to 2 years | | 1,210 | | 19 | 16,826 | 16,845 | | 18,055 | | More than 2 and up to 3 years | | 500 | | 1 | 19,535 | 19,536 | | 20,036 | | More than 3 and up to 4 years | | 1,332 | | 17 | 4,643 | 4,660 | | 5,992 | | More than 4 and up to 5 years | | 40 | | 1,063 | 7,092 | 8,155 | | 8,195 | | More than 5 years | | 34 | | 5,313 | 36,169 | 41,482 | | 41,516 | | | | 4,342 | | 9,226 | 103,702 | 112,928 | | 117,270 |
(1) On September 7, 2011,9, 2016, we issuedannounced our intention to redeem all outstanding Series VIII Notes which are denominated in U.S. Dollars in a principal nominal amount of US$ 60 million, due 36 months after the issue date and fully repayable at maturity. They bear interest at a fixed rate of 7.5% payable semiannually on September 7 and March 7 each year. As of June 30, 2015 this class has been fully paid.
On June 21, 2012, we issued three new series ofI Notes for a total amount of Ps. 383.5 million under our Global Note Program:
Series IX Notes, for a principal amount of Ps. 161.0 million, maturing 18 months after the issue date, and accruing interest at a variable rate (BADLAR Privada + 300 basis points), payableUS$74,554,000. The redemption took place on quarterly basis in arrears, and the principal amount is payable in quarterly payments due within 12, 15 and 18 months from the issue date.
Series X Notes, for a principal amount of US$ 31.5 million (equivalent to Ps. 142 million at issue date), maturing 24 months after the issue date, and payable in Pesos at an applicable exchange rate in connection with each payment date. The notes accrue interest at a fixed rate of 7.75% per annum, payable quarterly basis in arrears, and the principal amount is payable in quarterly payments due within 18, 21 and 24 months from the issue date.
Series XI Notes, for a nominal value of Ps. 80.5 million due 36 months after the issue date, accrues interest at a variable rate (Badlar plus 375 basis points). These are paid on a quarterly basis in arrears while amortization is made in three consecutive payments, the first two payments in an amount equal to 33.33% each of the face value, and the last one in an amount equal to 33.34% of the face value, all of which amount to 100% of the face value of Series XI Notes on the 24th, 30th and 36th months from the issue date.
As of June 30, 2015 these classes have been fully paid.
On September 19, 2013, the Company issued Series Five of the Second Tranche of Series X Notes for a nominal value of US$ 30 million. As a consequence, the aggregate principal amount of Series X Notes was US$ 61.5 million, taking into consideration the US$ 31.5 million issued on June 21, 2012. The Second Tranche of Series X Notes is fully exchangeable for Series X Notes.
As of June 30, 2015 this class has been fully paid.
On February 22, 2013, we issued two new series of Notes for a total amount of Ps. 500 million under our Global Note Program:
Series XII Notes, for a principal amount of Ps. 102.1 million, maturing 21 months after the issue date, and accruing interest at a variable rate (BADLAR Private + 410 basis points), payable on quarterly basis in arrears, and the principal amount is payable in quarterly payments due within 15, 18 and 21 months after the issue date.
Series XIII Notes, for a principal amount of US$ 79.4 million (equal to Ps. 397.9 million at issue date), maturing 27 months after the issue date, and payable in Pesos at an applicable exchange rate in connection with each payment date. The notes accrue interest at a fixed rate of 1.90% per annum, payable quarterly basis in arrears, and the principal amount is payable in quarterly payments due within 24 and 27 months after the issue date.
As of June 30, 2015 these classes have been fully paid.
On May 22, 2013, we issued series XIV Notes for a total amount of US$ 32 million (equivalent to Ps. 167.5 million at issue date) under our Global Note Program, which will mature from 60 months from the issue date, the aforementioned notes will be payable in Pesos at an applicable exchange rate in connection with each payment date. The notes accrue interest at a fixed rate of 1.5% per annum, on payable quarterly basis in arrears, and the principal amount is payable in quarterly payments due within 54 and 60 months after the issue date.
On November 18, 2013, we issued two new series of Notes for a total amount of Ps. 828 million under our Global Note Program:
Series XV Notes, for a principal amount of Ps. 176.4 million, maturing 24 months after the issue date, and accruing interest at a variable rate (BADLAR Private + 399 basis points), payable on quarterly basis in arrears, and the principal amount is payable in quarterly payments due within 18, 21 and 24 months after the issue date.
Series XVI Notes for a total amount of US$ 109.11 million with an issuance price of 102.3% (equivalent to Ps. 661.2 million at issue date), which will mature from 60 months from the issue date, the aforementioned notes will be payable in Pesos at an applicable exchange rate in connection with each payment date. The notes accrue interest at a fixed rate of 1.5% per annum, on payable quarterly basis in arrears, and the principal amount is payable in quarterly payments due within 54 and 60 months after the issue date.
On September 12, 2014, the Ninth Series of simple corporate notes was issued in the equivalent amount of Ps. 455.3 million, in two classes.
Series XVII Notes, for a face value of Ps. 171.8 million and falling due 18 months after the issuance date, will accrue interest at a variable rate (Badlar plus 250 basis points). Interest will be payable quarterly in arrears whereas the principal will be amortized in one payment 18 months following the issuance date. The issuance price was 100.0% of the nominal value.
Series XVIII Notes, for a face value of US$ 33.7 million, with an issuance price of 102.179% of the nominal value resulting US$ 34.4 million equivalent to Ps. 289.7 million at issuance date and falling due 60 months after the issuance date, will accrue interest at fixed annual rate of 4%. Interest will be payable quarterly in arrears whereas the principal will be amortized in two consecutive payments on the 54 and 60 months following the issuance date.
On March 13, 2015, the tenth Series of simple corporate notes was issued in the amount equivalent to Ps. 352.8 million nominal value, in two classes.
Series XIX Notes, for a face value of Ps. 187.0 million and falling due 18 months after the issuance date, will accrue interest at fixed rate of 27.5% during the first twelve months and will accrue interest at floating rate the remaining six months (Badlar plus 350 basis points). The issuance price was 100% of the nominal value. Interest will be payable quarterly in arrears whereas the principal will be amortized in one payment 18 months following the issuance date.
Series XX Notes, for a face value of US$ 18.2 million, with an issuance price of 104% of the nominal value resulting US$ 18.9 million equivalent to Ps. 165.8 million and falling due 24 months after the issuance date, will accrue interest at fixed annual rate of 2.5%. Interest will be payable quarterly in arrears whereas the principal will be amortized in one payment 24 months following the issuance date.
On August 12, 2015 the Eleventh Tranche of Notes was issued, comnsisting of two series, Series XXI and XXII, for a principal amount of Ps. 396.2 million, under the US$ 300 Million Program approved by the Shareholders’ Meeting. October 11, 2016. For more information see “Recent Development.”Development”
IRSA’S Series I
Operations Center in Argentina On March 3, 2016, IRSA and IRSA CP announced that they would launch offers to buy in cash: (i) 11.50% Class II Notes due 2020 and issued by IRSA for principal amount up to US$76.5 million, (ii) any and 8.50% Class 1 Notes due 2017 and 2020issued by IRSA, and (iii) any and 7.875% Class 1 Notes notes due 2017 and issued by IRSA CP. On February 2, 2007,March 23, 2016, IRSA CP issued US$ 150 million at a nominal fixed rate 8.5%. The notes are due February 2017 andNotes in an aggregate principal is paid at maturity. Interest is payable on February and August of each year from August 2007. This issue was in the framework of the global issuance program of notes for a nominal value of up to US$ 200 million authorized by Resolution N° 15,529 and 15,537 of the CNV dated December 7 and December 21, 2007. On February 25, 2010, the Board of Directors of IRSA expanded the amount to up to US$ 400 million as mandated by the Ordinary and Extraordinary Meeting of Shareholders held on October 29, 2009.
As part of the expanded program, on July 20, 2010 IRSA issued NCN for an amount of US$ 150360 million under its Global Notes Program. Class II Notes accrue interest semi-annually, at a nominalan annual fixed rate of 11.5%.8.75% and mature on March 23, 2023. The notes are due July 2020 and principal is paid at maturity. Interest is payable on January 20 and June 20issue price was 98.722% of each year from January 20, 2011.nominal value.
IRSA NCNCP’s Notes due 20172023 are subject to certain covenants, events of default and 2020 contain certain customary covenants and restrictions, including among others, limitations, forsuch as the limitation on incurrence of additional indebtedness, limitation on restricted payments, disposal of assets, and entering into certainlimitation on transactions with related companies.affiliates, and limitation on merger, consolidation and sale of all or substantially all assets. Under the NCN indentures, IRSA is permitted toTo incur additional indebtedness, provided its coverage of consolidated interest ratioIRSA CP is higher than 1.75.required to meet a minimum 2.00 to 1.00 Consolidated Interest Coverage Ratio. The coverage of consolidated interest ratioConsolidated Interest Coverage Ratio is defined as consolidatedConsolidated EBITDA divided by consolidated interest expense, subject to certain adjustments.expense. Consolidated EBITDA is defined as operating income plus depreciation and amortization and other consolidated non-cash charges.
The Class II Notes contain financial covenants limiting IRSA CP’s ability to declare or pay dividends in cash or in kind, unless the following conditions are met at the time of payment: a) no Event of Default shall have occurred and be continuing; Restricted payments include restrictions for paymentb) IRSA CP may incur at least US$1.00 worth of dividends additional debt pursuant to the “Restriction on Additional Indebtedness”; c) and other outflows relating to prepaymentsthe aggregate amount of indebtedness or to acquisition of certain investments. These restricted payments could not be made in excess ofsuch dividend exceeds the sum of: · | 50% of IRSA’s cumulative consolidated net income; or 75% of IRSA’s cumulative consolidated net income if the coverage of consolidated interest ratio is at least 3.0 to 1; or 100% of IRSA’s cumulative consolidated net income if the coverage of consolidated interest ratio is at least 4.0 to 1; |
· | net cash proceeds from new capital contributions; |
i. · | reduction of the indebtedness of IRSA or its restricted subsidiaries; |
· | reduction in investments in debt certificates (other than permitted investments); and |
· | distributions received from unrestricted subsidiaries. |
Issuance100% of Series III and Series IV Notes
On February 10, 2012, IRSA issued an aggregate principal amount of Ps. 300 million under the US$ 300 Million Program approved by the Shareholders’ Meeting:
· | Series III Notes, for a principal amount of Ps. 153.2 million, accrue interest at BADLAR rate plus 249 basis points, and mature 18 months from their issue date. They are repayable in three consecutive payments due within 12, 15 and 18 months after their issue date, and; |
· | Series IV Notes, for a principal amount of US$ 33.8 million (equivalent to Ps. 146.9 million), accrue interest at a fixed rate of 7.45%, are subscribed and repayable in Pesos at the applicable exchange rate, and mature 24 months after the issue date. They are repayable in 4 equal consecutive payments due within 15, 18, 21 and 24 months after their issue date. |
IRSA’S Series V and VI Notes due 2015 and 2017
On February 26, 2014, Series V and VI were issued for an amount of Ps. 220.2 million. Company's NCN due 2015 and Company's NCN due 2017 both contain certain customary covenants and restrictions, including among others, limitationscumulative EBITDA for the incurrenceperiod (treated as one accounting period) from July 1, 2015 through the last day of additional indebtedness, restricted payments, disposal of assets, and entering into certain transactions with related companies.
Series V Notes ("Class V"), were issued for an amount of Ps. 209.4 million. The securities were issued at par value and priced at a floating interest rate equalthe last fiscal quarter ended prior to Badlar rate plus 395 basis points. The principal of Class V will be repaid through a single payment on the maturity date. Class V matures within 18 months from the date of issue. Interest will be paid quarterly. Class V is fully canceled.such Restricted Payment minus an amount equal to 150% of consolidated interest expense for such period; and
Series VI Notes ("Class VI"), were issuedii. any reductions of Indebtedness of IRSA on a consolidated bais after the Issue Date any reductions of Indebtedness of after the Issue Date exchanged for an amountto Capital Stock of Ps. 10.8 million. The securities were issued at par value and priced at a floating interest rate equal to Badlar rate plus 450 basis points. The principal of Class VI will be repaid through a single payment on the maturity date. Class VI matures within 36 months from the date of issue. Interest will be paid quarterly on May 26, 2014, August 26, 2014, November 26, 2014, February 26, 2015, May 26, 2015 and August 26, 2015, November 26, 2015, February 26, 2016, May 26, 2016, August 26, 2016, November 28, 2016 and February 27, 2017.IRSA or its Subsidiaries. IRSA Commercial Properties Series I On April 7, 2016, the Meeting of IRSA’s Notes holders by majority vote approved the proposed amendments to IRSA’s 2017 Trust Indenture, which included basically the elimination of all restrictive covenants on such class effective as of April 8, 2016.
On During the months of March, April and May 11, 2007,of 2016, the Company acquired all IRSA Commercial Properties issued two parts of notesCP’s 7.875% Notes Class I due 2017 for a total amount of US$ 170 million. One of the series (Series I) consists of US$ 120 million notes at a nominal fixed rateand US$75.4 million of 7.87% due May 2017 while the other (Series II) comprises Ps. 154.0 million (equivalent to US$ 50 million) notes at a nominal fixed rate of 11.0% due in June 2012. Interest on the Series I is payable on May 11 and November 11 of each year from November 11, 2007; principal due in May 11, 2017. Interest on the Series II was paid on June 11 and December 11 of each year from December 11, 2007; principal was due in seven equal and consecutive semi-annual installments from June 11, 2009. As of June 30, 2012, Series II is completely canceled.
These issuances were part of a global issuance program of notes for a nominal value of up to US$ 200 million authorized by Resolution N° 15,614 of the CNV dated April 19, 2007.IRSA Notes. On October 29, 2009,11, 2016 the Ordinary and IRSA Commercial Properties' Extraordinary MeetingCompany acquired the remaining US$74.6 million of Shareholders expanded the amount to up to US$ 400 million.
IRSA Commercial Properties Series IIRSA’s 8.50% Notes due 2017, contain certain covenants, events of default and restrictions, as well as limitations on additional indebtedness, transactions with affiliates, mergers and total or partial disposal ofso the assets of IRSA Commercial Properties. For additional indebtedness IRSA Commercial Properties is required to comply with the financial ratio “coverage of consolidated interest”, which should be higher than 1.75. The coverage of consolidated interest ratio is defined as consolidated EBITDA divided by consolidated interest expense, subject to certain adjustments. EBITDA is defined as operating income plus, depreciation and amortization and certain other consolidated non-cash charges.following notes remains outstanding:
Issuance of Series I· IRSA’s Notes Class II at 11.50% maturing in 2020 US$71.4 million. On September 18, 2015 we issued Series I Notes under our Global Note Program in an aggregate principal amount Such payments were accounted for as a cancellation of Ps.407.3 million. Series I Notes have a maturity of 18 months from its issue date, and will bear a mixed interest rate of 26.5% per year during the first three months, and Private Badlar Rate (Tasa Badlar Privada) plus 400 bps per year during the remaining period, playable on a quarterly basis. For more information see “Recent Development.”debt.
Other Debts
CRESUD
Banco Ciudad Financial Loan In relation to financial covenants under 11.50% Notes due in 2020 issued by IRSA, the Meeting of Noteholders held on March 23, 2016 approved:
On January 10, 2012, we subscribed i) to modify the covenant on Limitation on Restricted Payments, so that the original covenant was replaced so as to take into consideration IRSA’s capability to make any restricted payment provided that (a) no Event of Default has occurred and persisted, and (b) IRSA may incur at least US$1.00 of additional debt pursuant to the Limitation on Additional Indebtedness; and ii) the exclusion of IDBD or any of its subsidiaries for purposes of the definition of “Subsidiary” or any of the definitions or commitments under the Trust Indenture of Notes due in 2020 and issued by IRSA (regardless of whether the financial statements of any of these companies has any time been consolidated into IRSA’s financial statements). iii) a loanSupplementary Trust Indenture reflecting all the amendments approved, entered into with Banco Ciudad for a total amountthe Bank of US$ 20 million, disbursable in several installments.New York Mellon on March 28, 2016. The principal amount accrues interest at the higher of an annual nominal rate equal to the 180 day LIBOR rate plus a spread of 300 basis points or an annual nominal fixed rate of 6%. Interest is payable semi-annually
Operations Center in Israel IDBD has certain financial restrictions and the principal amount is repayable on an annual basis, starting on the second anniversary of the first disbursement.covenants in connection with its financial debt, included in its debentures and loans from banks and financial institutions. As of June 30, 2016, IDBD reported that the application of the “Liquidity Covenant” and the “Economic Equity Covenant” (as described below) is currently suspended. Note that, it was agreed between IDBD and the relevant lending corporations that the parties would work to formulate an arrangement, to replace or amend the current financial covenants by December 31, 2016. If such arrangement is not reached, then with respect to the results for IDBDs first quarter of 2017 and thereafter, the previous financial covenants will re-apply, in which case IDBD estimates that it will not be able to comply with the thresholds which were determined in the past with respect to the Liquidity Covenant and the Economic Equity Covenant with respect to IDBD’s results for the first quarter of 2017 and thereafter. IDBD estimates it will not be able to fulfill the covenant which stipulates that the balance of cash and marketable securities will not fall below the scope of forecasted current maturities for the two quarters subsequent to the reporting quarter (the “Liquidity Covenant”). Regarding the Economic Equity Covenant, it is noted that the economic equity as of June 30, 2016, amounted to a positive balance of NIS 247 million, significantly lower than the thresholds which were determined in the past as part of the Economic Equity Covenant. In view of and due to the decrease in Mr. Ben Moshe’s ownership of IDBD, effective as of February 2015 disbursements had been madeand thereafter, in March 2016 IDBD reached understandings with its lending corporations with regard to an amendment of the control covenant and additional amendments relating to restrictions on the sale of main holdings. As per IDBD’s position, as of June 30, 2016, there were no conditions that established grounds for calling IDBD’s obligations to its financial creditors for immediate payment. Without derogating from the IDBD’s position, it is noted that the decision of the bondholders (Series I) dated April 21, 2016, to call the full balance of IDBD’s debt due to bondholders for immediate repayment and the decision to take steps for dissolution are liable to raise grounds for the financial creditors. According to an opinion that IDBD received, the conditions required for it to call the bonds were not fulfilled. On July 18, 2016, the Court handed down its judgment and accepted the consensus motion filed by the trustee to dismiss the claim. As of June 30, 2016, IDBD’s loans which are subject to the aforementioned financial covenants, were classified under current liabilities, in consideration of the fact that IDBD has reached agreement with its principal lenders to extend the arrangements as specified in the financial covenants of the loan agreements until March 31, 2017 for a total amount of US$ 15.2 million. The loan proceeds will be used for an investment project consisting of reconverting for agricultural purposes 15,934 hectares in the “Los Pozos” farm, currently assigned to livestock breeding. Production Investment Loanperiod shorter than twelve months.
On December 5, 2012, we subscribedAugust 2, 2016 IDBD issued a loan with Banco de la Provincia de Buenos Airesnew Series of Debentures in the Israeli market for an amount of Ps. 24.0NIS 325 million underdue November 2019 at an annual interest rate adjustable by CPI plus 4.25%. The notes are pledged by shares of Clal Insurance Enterprise Holdings Ltd, subject to the credit facilityapproval of the Commissioner of Capital Markets, Insurance and Savings. IDBD worked to get the authorization to constitute the guarantee through the filing of an application to the Supreme Court asking for production investment described in Communication A 5319 issuedsuch approval. In case IDBD does not get the required approval, funds must be repaid with interest plus a penalty. on September 15, 2016, the High Court of Justice gave a partial judgment and decision, according to which it was decided, to reject the petition for the most part and to grant an order which instructs the Commissioner to appear and show a reason for her opposition to the request of the company to pledge up to 5% of the shares of Clal Holdings, subject to an outline agreed to at the time by the Argentine Central Bank.company. Furthermore, the company maintains the right to accede to a proposal for compromise which was raised in the context of the discussion. A hearing date was set for January 2017. Likewise, on August 4, 2016, DIC reopened its Series of Debentures due 2025 an additional amount of NIS 360 million. The loan accrues interestplacement was made at a fixed ratean IRR of 15.01%, with interest payable on a semi-annual basis, and matures 42 months after5.70%. Pursuant to the disbursement date. The principal amount is repayabledecision of the Supreme Court sitting as the High Court of Justice in 7 semi-annual installments,connection with the first installment falling duepetition that the company submitted in June 2013.connection with the pledge of the shares of Clal Holdings in September 2016, on October 13, 2016, the Board of Directors of IDBD decided to execute a partial early redemption of the debentures of the company, that is to be carried out on November 1, 2016, as follows: FyO – Production Investment Loan
On November 22, 2013, FyO subscribed• The company will carry out a loan with Banco Hipotecario forpartial early redemption of the debentures in an amount of Ps. 840,000, under approximately NIS 239 million of par value (“the credit facility for production investment describedredeemed portion”) and in Communication A 5449 issued by the Argentine Central Bank. The loan accruesa total of approximately NIS 244 million with respect to principal, interest at a fixed rate of 15.25%, with interest payable on a monthly basis, and matures 36 months after the disbursement date. There is a grace period of one yearcompensation for the repaymentredeemed portion.
• The determining date for the eligibility to receive the early redemption of the principal amount, afterof the debentures is 25.10.2016. • The early redemption represents 73.7% of the unpaid balance of the principal of the debentures, which is also the original balance of the series of the debentures. • The rate of interest (including the compensation for carrying out the early redemption as an increment of 3% with respect to the period from August 3, 2016 through October 21 2016) that will be paid upon the partial early redemption of the redeemed portion of the principal is repayable in 24 monthly consecutive installments.approximately 1.8%. Bolivia Investment Loan
• The rate of interest (including the compensation for carrying out the early redemption as an increment of 3% with respect to the period from August 3, 2016 through October 31 2016) that will be paid in the context of the early redemption, which is calculated out of the balance of the unpaid balance of the principal on the date of the early redemption (NIS 325 million linked to the CPI) is approximately 1.3%. On December 17, 2012, Agropecuaria Acres Del Sud S.A., CRESUD’s subsidiary, subscribed a loan
• Pursuant to the “known” CPI (index with Banco Económico S.A. forrespect to the month of September 2016, which was published on 14.10.2016) as compared with the base index published with respect to the month of June 2016, no linkage increments will apply with respect to the redeemed portion upon early redemption. • The unpaid balance of the principal of the debentures after executing the early redemption (without linkage) will stand at an amount of BOB 13.5 million. The loan accrues interest at a fixed rateapproximately NIS 86 million par value, which represents approximately 26.3%, of 7.45%, with interest and principal being payable semi-annually. The loan matures 60 months after the disbursement date. The loan proceeds were used to plant sugarcane in the 4 Vientos and Primavera farms and to fund infrastructure expenses in channels, roads and bridges in 4 Vientos. Banco de la Pampa Loan
On August 3, 2012 we subscribed a loan with Banco de La Pampa for an amount of Ps. 20.0 million. The loan accrues interest at the Encuesta variable rate less 200 basis points, with an annual nominal rate subject to a bottom of 10.50% and a ceiling of 14.50%. There is a grace period of one year and a half for the repaymentoriginal balance of the principal amount, after which it is repayable in 6 semi-annual consecutive installments. The loan proceeds were used to make working capital investments in our subsidiary Sociedad Anónima Carnes Pampeanas S.A.
IRSA
Hoteles Argentinos Loan
On December 26, 2013, Hoteles Argentinos S.A. (“HASA”), IRSA’s subsidiary, subscribed a loan with Banco Hipotecario for an amount of Ps. 5.0 million, under the credit line for productive investment provided under Communication “A” 5449 of the Central Bank.debentures. The loan accrues interest at a fixed ratecompany will act to pledge the shares of 15.25%, with interest payable on a monthly basis, and matures 36 months afterClal Holdings against the disbursement date. There is a grace period of one year for the repaymentbalance of the unpaid principal amount, after which the principal is repayable in 24 monthly consecutive installments.
Llao Llao Loan
On December 23, 2013, Llao Llao Resorts S.A. (“Llao LLao”), IRSA’s subsidiary, subscribed a loan with Banco Hipotecario for an amount of Ps. 4.0 million, under the credit line for productive investment provided under Communication “A” 5449 of the Central Bank. The loan accrues interest at a fixed rate of 15.25%, with interest payable on a monthly basis, and matures 36 months afterdebentures (after carrying out the disbursement date. Thereearly redemption). As is a grace period of one year forrequired according to the repayment of the principal amount, after which the principal is repayable in 24 monthly consecutive installments.
Nuevas Fronteras Mortgage Loan
On December 30, 2014, Nuevas Fronteras S.A. (“Nuevas Fronteras”), IRSA’s subsidiary, subscribed a loan with Banco Hipotecario for Ps. 7.0 million, under the credit line for production investment described in Communication “A” 5600 issued by the Central Bank. The loan accrues interest at a fixed rate of 24.0% during the first twelve months and at a variable rate (corrected Badlar + 50 bps) during the remaining twenty-four months, payable monthly and it is due 36 months after the disbursement date. Principal is subject to one-year grace period and then it is payable in 24 consecutive monthly installments.
IRSA Propiedades Comerciales S.A. (“IRSA Commercial Properties”)
ARCOS Syndicated Loan
On November 16, 2012, IRSA Commercial Properties subscribed a syndicated loan with local banks in the amount of Ps. 118 million, under the credit line for production investment described in Communication “A” 5319 issued by the Central Bank. The loan accrues interest at a fixed rate of 15.01%, payable monthly and it is due 36 months after the disbursement date. Principal is subject to one-year grace period and then it is payable in nine consecutive quarterly installments.
Bank Loans Communication 5319
On December 12, 2012 IRSA Commercial Properties subscribed a loan with Banco de la Provincia de Buenos Aires for Ps. 29.0 million, under the credit facility for production investment described in Communication “A” 5319 issued by the Central Bank. The loan accrues interest at a fixed rate of 15.01%, payable monthly and it is due 36 months after the disbursement date. Principal is subject to a 9-month grace period and then it will be repaid in 9 consecutive quarterly installments.
Neuquén Syndicated Loan
On June 12, 2013, IRSA Commercial Properties executed a syndicated loan with local banks in the amount of Ps. 111 million, under the credit facility for production investment described in Communication “A” 5380 issued by the Central Bank. The loan accrues interest at a fixed rate of 15.25%, payable monthly and it is due 36 months after the disbursement date. Principal is subject to a one-year grace period and then it will be repaid in 9 consecutive quarterly installments.
Capex Citibank 5449 – Other Loans
On December 23, 2013, IRSA Commercial Properties subscribed a loan with the Citibank N.A. local branch for an aggregate amount of Ps. 5.9 million, under the credit facility for production Investment described in Communication “A” 5449 issued by the Central Bank. The loan accrues interest at a fixed rate of 15.25%, payable quarterly and it is due 39 months after the disbursement date. Principal is subject to a one-year grace period and then it will be repaid in 9 consecutive quarterly installments.
Capex Citibank 5620 – Other Loans
On December 30, 2014, IRSA Commercial Properties subscribed a loan with the Citibank N.A. local branch for an aggregate amount of Ps. 10.3 million, under the credit facility for production Investment described in Communication “A” 5620 issued by the Central Bank. The loan accrues interest at a fixed rate of 26.50%, payable quarterly and it is due 36 months after the disbursement date. Principal is subject to a one-year grace period and then it will be repaid in 9 consecutive quarterly installments.
Nuevo Puerto Santa Fe Loan
On December 26, 2013, NPSF, IRSA Commercial Properties’ subsidiary, executed a loan agreement with Banco Hipotecario for an aggregate amount of Ps. 10.0 million, under the credit facility for production investment described in Communication “A” 5449 issued by the Central Bank. The loan accrues interest at a fixed rate of 15.25%, payable monthly and it is due 36 months after the disbursement date. Principal is subject to a one-year grace period and then it will be repaid in 24 consecutive monthly installments.
Soleil Debt
On December 28, 2007, as a result of the purchase of Soleil plot of land, an agreement was executed with INCSA for the purpose of financing a balance price in the amount of US$ 12.6 million. Such loan accrues interest at a fixed rate of 5%, payable on annual basis. Principal shall be repaid when due on June 30, 2017. This financing agreement was prepaid in whole on August 22, 2014.trust indenture.
• Pursuant to what is stated in the trust indenture, the redeemed portion will be paid in relation to all of the holders of the debentures, pro- rata according to the par value of the held debentures.
IDBD is continuing to act in order to reach consents with the relevant financing corporations in order to arrange over time the calculated financial covenants that were determined in the provisions of its loan agreements, and additional contractual issues that exist in the loan agreements. Off balance sheet arrangements We currently have no agreement that is not included in the balance sheet or significant transactions with non-consolidated entities that are not reflected in our consolidatedAudited Consolidated Financial Statements. All of our interests and/or relationships with our subsidiaries or controlled entities on a joint basis are recorded in our consolidatedAudited Consolidated Financial Statements. Investments in technology, in our agricultural business, amounted to Ps.10.4 million, Ps.9.3 millionPs. 10, Ps. 10 and Ps.12.1Ps. 9 million for the fiscal years 2016, 2015 2014 and 20132014 respectively. Our total technology investments aimaimed to increase the productivity of purchased land have amounted to Ps.445.2Ps.455 million since fiscal year 1995. We reach our objectives within this area through the implementation of domestic and international technological development projects focusing mainly on: | • | Quality and productivity improvement. | | • | Increase in appreciation value of land through the development of marginal areas. | | • | Increase in the quality of food in order to achieve global food safety standards. We aim to implement and perform according to official and private quality protocols that allow us to comply with the requirements of our present and future clients. Regarding official regulations, in 2003 we implemented the Servicio Nacional de Sanidad y Calidad Agroalimentaria law on animal identification for livestock in six farms. Simultaneously, in 2004 we implemented Global GAP Protocols (formerly EurepGap) with the objective of complying with European Union food safety standards and as a mean for continuous improvement of the internal management and system production of our farms. Our challenge is to achieve global quality standards. | | • | Certification of suitable quality standards, since in recent years worldwide agriculture has evolved towards more efficient and sustainable schemes in terms of environmental and financial standpoints, where the innocuousness and quality of the production systems is becoming increasingly important. In this context, Good Agricultural Practices (GAP) have emerged, as a set of practices seeking to ensure the innocuousness of agricultural products, the protection of the environment, the workers’ safety and well-being, and agricultural health, with a view to improving conventional production methods. Certification of such standards allows to demonstrate the application of Good Agricultural Practices to production systems and ensures product traceability, allowing to impose stricter controls to verify the enforcement of the applicable laws. | | • | The implementation of a system of control and assessment of agricultural tasks for analyzing and improving efficiency in the use of agricultural machinery hired. For each of the tasks, a minimum standard to be fulfilled by contractors was set, which has led to do an improvement in the plant stand upon sowing, a better use of supplies and lower harvesting losses. |
We have several trademarks registered with the Instituto Nacional de la Propiedad Industrial, the Argentine institute for industrial property. We do not haveown any patents ornor benefit from licenses thatfrom third parties. A substantial part of Cellcom’s operations are material for conducting our business.subject to the Communications Law, regulations enacted by the Ministry of Communications, and the provisions of the licenses granted to Cellcom by the Minister of Communications. Cellcom’s activies which include providing cellular service, landline, international telephone services and internet access, and infrastructure services are subject to licensing. For more information, please see “Legal framework – Operations Center in Israel” International Outlook:Macroeconomic Outlook As reported byin the International Monetary Fund (“IMF”) in itsIMF’s “World Economic Outlook” (“WEO”), global GDP expanded by 3.1% in 2015, slightly below the projections mainly as a result of a strong decline in activity increased by 3.4%during the last quarter in 2014, and worldthe year. World growth is expected to reach 3.2% in 2016 and 3.5% in 20152017. In 2016 and 3.8%2017, growth in 2016. From 2015 to 2016, developed economies areis expected to growremain steady at values a bit in excess ofabout 2%, driven by the growth in the United States of 3.1%2.5%, and in the Euro area, of 1.5%. EmergingAs of April 2016, emerging and developing economies have recorded growth rates similar to those seen last year, and theyof 4%, also slightly below the projections. They are expected to grow 4.3%4.1% and 4.7% by the end of 20152016 and 2016. The recovery2017. Emerging economies continue facing challenges as regards the inflow of developed economies should have a positive impact on trade, although it could be lessened by lower commodity prices.foreign capital. Countries which are more flexible in terms of foreign exchange responded better to the global flow of capital than in previous decelerations.
During 20132014 and 2014,2015, the financialcommodities markets generally continued their pickup after their lower performance of 2011. The MSCI World index showedsuffered a strong decline. Mainly, oil exhibited a sustained negative trend until reaching a historical low in February 2016. During 2016, the commodities markets exhibited a strong recovery during 2013,with a 31.6% rise in oil prices. Soybean reversed the decline it had suffered in 2014 and a less strong recovery during 2014. On the other hand, the MSCI Emerging Markets index follows a negative trend since 2013. The continued currency stimulation programs2015 and rose 33.6%. IMF’s forecasts indicate that inflation in the world, led mainlyeconomies of emerging and developing markets will decrease from 4.7% in 2015 to 4.5% in 2016, due to the decline in the prices of raw materials and the effects of last year’s currency depreciations evening out. Average inflation in advanced economies will remain below the goals set by the FED, have brought mostcentral banks, mostly as a result of the upsurgelower price of oil. As of April 2016, the general level of inflation in advanced economies averaged 0.3%, the developed markets.lowest since the global financial crisis. Argentine Economy:macroeconomic context ArgentineOn October, 2016, IMF published its growth forecasts were revised down again as compared to those of last year. The IMF reduced its projection for GDP growth in 2014 to 0.5% and projected a slight contraction in GDP2016 for 20151.8% decline of 0.3%.the GDP. This correction was mainly due to deteriorated external financing conditions.the change in policies implemented by the new government administration aimed at balancing certain macroeconomic distortions. Growth is expected to strengthen to 2.7 percent in 2017 on the back of moderating inflation and more supportive monetary and fiscal policy stances.
Consumption remained as the main driver of economic activity, as shopping
Shopping center and supermarket sales grew at rates of 33.3% and 26.1%, respectively, comparing May 2015 and the same last year period. According to INDEC the unemployment rate was at 6.9% of the economically active population, showingreached a slighttotal Ps. 4,374 million in April 2016, which represents a 41.4% increase of 0.3% on a year-on-year basis in December. In turn, nominal salaries increased 31.5% during the same period.
Comparedas compared to the same period last year. Accumulated sales for the first four months of the previous year totaled Ps. 14,586 million, representing a 29.2% increase as compared to the same period last year.
The INDEC reports that, as of April 2016, industrial activity in Argentina decreased by 1.3%6.7% as compared to the same month in 2015. Manufacturing production accumulated a 2.4% decline during the first halffour months of 2015 (removing the seasonal component). Car production fell 11.8% on year-on-year basis in July 2015,year as compared to the same as car exports, which fell 21.1%.period last year. Regarding the balance of payments, in the first quarter of 20152016 the current account deficit reached US$ 3,7104,013 million, with US$ 4521,403 million allocated to the goods and services trade balance, and US$ 3,2312,572 million to the income account, which represents 72% of the foreign direct investment return. During the pastfirst quarter of 2016, the financial account showed a surplus of US$ 5,3798,510 million resulting from net income from the non-financial public sector and the BCRAArgentine Central Bank (“BCRA”) for US$ 3,3176,233 million, from the non-financial private sector for US$ 1,1961,701 million, and from the financial sector for US$ 866576 million. The stock of international Reserves atfell by US$ 5,844 million in 2015. During the beginningfirst half of August 20152016, reserves grew by US$ 4,944 million. At July, reserves stood at US$ 33,915 million, accounting for an increase of 17.4%, compared to last year and after the payment of the sovereign bond, BODEN 15, on October 3, 2015, the stock of of foreign currency reserves was US$ 27.7 billion.25,512 million. Total gross external debt atincreased by US$ 10,605 million during the closingfirst quarter of March 2015 was estimated2016 and stood at US$ 145,931163,236 million an increase of US$ 1,840 million compared to the previous quarter. at March 2016. The non-financial public sector and Argentine Central Bank debt for the quarter was estimated at US$ 78,15492,469 million, an increasehaving increased by US$ 8,593 million during the first quarter of 243 million from the previous quarter.2016. The Argentine Central Bank’s liabilities increased by US$ 2,320 million mainly explained by disbursements and new tranche capitalization of the swap with the Popular Republic of China. The government security and bond outstanding balance diminishedincreased by US$ 1,7023,431 million mainly due to depreciationduring the first quarter of 2016. At the Euro with respect toend of this quarter, the US Dollar and to a lesser extent due to secondary market transactions. balance was US$ 43,794 million. The non-financial private debt forgrew US$ 2,261 million during the first quarter was estimatedof 2016. At March 2016, such debt stood at US$ 64,931 million, increasing by US$ 1,390 million compared to the previous quarter. 67,621 million. The financial sector debt excluding the Argentine Central Bank was estimated atdecreased by US$ 2,846250 million showing an increase forduring the first quarter of 2016, reaching a total of US$ 2073,145 million. In connection with the fiscal sector, revenues recorded a year-on-year increase of 33.9%38.9% as of May 2015,March 2016, whereas primary expenditure grew by 34.3%, slightly over38.7% during the increase in revenues, and was mostly oriented to items related to the sustainment of domestic demand. same period. In local financial markets, the Private Badlar rate in Pesos ranged from 19%20% to 23%30% in the period from July 20142015 to June 2015,2016, averaging 20.47%28% in June 20152016 against 22.03%20% in June 2014.2015. The Argentine Central Bank continued withdiscontinued its controlled floating exchange rate policy:policy in December 2015; consequently, the Peso sustained a 11.7%63% nominal depreciation in the period from July 20142015 to June 2015. 2016. At June 2016, the exchange rate stands at Ps.14.50 pesos per US$1.00. In the fiscal year herein analyzed,June 2016, Argentina’s country risk measured as per the Emerging Market Bond Index, decreased by 9397 basis points in year-on-year terms, maintaining a high spread vis-à-vis the rest of the countries in the region. The debt premium paid by Argentina was at 631518 basis points in June 2015,2016, compared to the 304352 basis points paid by Brazil and the 194213 basis points paid by Mexico. Product Prospects
Agriculture and Cattle Raising Sector in Argentina Agriculture Argentina has positioned itself over the years as one of the world’s leading food producers and exporters. It is the second largest country in South America after Brazil and has particularly favorable natural conditions for diversified agricultural production: vast extensions of fertile land and varied soil and weather patterns. During the decade of the nineties, the Argentine agriculture and cattle raising industry experienced sweeping changes, such as a significant increase in production and yield (thanks to a sustained agricultural modernization process), relocation of production (crops vs. livestock) and a significant restructuring process within the industry, as well as increased land concentration. Taking advantage of a favorable international context, the agriculture and cattle raising sector has been one of the major drivers of the Argentine recovery after the economic and financial crisis of 2002. During the 2015/2016 crop season, soybean production was over 56 million tons, a decrease of 7% as compared to the previous season. Corn production reached 28 million tons, 2.5% lower than in the previous year. Wheat production reached 11.3 million tons, 19% lower than in the previous year. The sourcespolicies implemented by the new government have led to better projections for the agricultural industry. Mainly, the strong devaluation of the following informationpeso and tax reductions on exports have improved the situation of agricultural growers. Withholding taxes on corn and wheat have been fully eliminated, whereas withholding taxes on soybean have been lowered by 5% (to 30% down from 35%). As a result of these measures, the production of soybean, corn and wheat, are the Ministerio de Agricultura, Ganadería y Pesca de la República Argentina and the United States Department of Agriculture (“USDA”). Wheat
World wheat production for the 2015/2016 campaign is projected by USDA at 732.79 million tons, 7 million tons more than the 2014/2015 campaign. Estimated harvested area is expected to increase by almost 1 million hectares at global level, while production yields are expected to stay at similar levels as the 2014/2015 campaign. The wheat production forecast for Argentina is 10.557, 36.5 and 14.4 million tons 16% less than 2014/2015 campaign, with wheat planted area projected to decrease from 5.26 to 4 million hectares.respectively.
Corn
USDA projections for the 2015/2016 season estimates that world production will reach 972.60 million tons, showing a derease with respect to the previous year. 2015/2016 yield is estimated at 5.54 million tons per hectare, down 1.6% from previous campaign. In the case of Argentina, the planted area is expected to decrease from 3.20 to 3.10 million hectares, pushing the expected production down from 26.5 million to 25 million tons for the 2015/2016 campaign.
Soybean
The USDA projections for the 2015/2016 season estimates that the world soybean production will remain at its 2014/2015 levels, at 320.49 million tons. In particular, USDA estimates that Argentina’s soybean production will decrease by 3.8 million tons, to 57 million tons in the 2015/2016 campaign.
Cattle AccordingAs reported by SENASA, with an aggregate stock of 52,636,778 heads as of March 31, 2016, the Cattle stock has increased by 2.3% as compared to the USDA projections, worldsame period of the previous year. For the third year in a row, the Cattle stock surpassed 51 million heads.
As reported by the Argentine Chamber of Beef Commerce and Industry (Cámara de la Industria y Comercio de Carnes y Derivados de la República Argentina, “Ciccra”), consumption of cattle beef production is projected at 58.4 million tonsper capita was 55.9 kilograms per year on average for the first quarter of 2016, accounting for a year-on-year fall of 5.9%. This decrease in consumption reflects the fact that the consumers’ salaries were restated in 2015, down 1.3 million tons from previous year production. Inwhereas prices have risen after the casedevaluation of Argentina, the expected production remain stableArgentine peso in December 2015. However, the effects of the devaluation of the Argentine peso, along with the reduction in export taxes, generate a promising scenario for 2015 with 2.7 million tons. The beef cattle market has remained sound, with listed prices that surpassed the peaks set last spring when the Province of Buenos Aires became flooded.Cattle exports. Dairy
Milk Sector The USDA estimates show,United States Department of Agriculture projects that milk production in Argentina for 2015 will be 11.6 million tons, higher than in the previous year. However, milk production for 2016 faces a tough scenario, as the elimination of withholding taxes on corn adversely affected the input/product ratio as concerns milk. Moreover, international prices remain depressed. The challenge faced by the international context, coupled with unfavorable weather conditions in the sector would imply that the worldmost efficient producers will remain in business, causing production of milk will increase from the 2014 production levels of 485 million tons to 493 million tons by the end of 2015. In the case of Argentina, production is expected to increase to 10.7 million tons in 2015, 3.6% lower than 2014 due to unfavorable weather early in the year and ongoing adverse economic situation. As the dairy sector shrinks leaving the more efficient farmers, milk yields per cow are expected to rise.increase. Argentina continues to be the third largest exporter of whole powdered milk in the world. Exports for 2015 are estimated at 180,000 tons.
For additional information about our Agricultural business, please see Item 4. Information on the Company “B, Business Overview - Agricultural Business”.
Evolution of Shopping Centers in Argentina Private consumption continues to be the drivera significant component of economic activity. Theactivity, although in the past months there has been a slight deceleration in its growth rate. At June 2016, the Consumer Confidence Index (CCI), that measures the purchasing expectations, prepared by the Center for Research in Finances (Centro de Investigación en Finanzas) of the School of Business of Universidad Torcuato Di Tella increased by 30.9% in had shown a 22.2% decline as compared to June 2015, as well as a 1.9% increase as compared to the same monthJune 2014. Sales in 2014. The metric stood at the highest level since January 2012, and only 10% below the highest historical recordshopping centers in January 2007. The evolution of the Shopping Centers segment shows evidence thereof. Based on the information released by the Argentine Institute of Censuses and Statistics (“INDEC”), in June 2015 the sales at current prices –without removal of the seasonality component-April 2016 reached a total amount of Ps. 3,6694,374 million, which represented a 26.5%41.4% increase compared to the same month in 2014.2015. Accumulated sales for the first four months of the year totaled Ps. 14,586 million and reached a 29.2% variation compared to the same period the previous year. In relation to the office market, according
According to Colliers International, as of June 2016, the A+ and A office inventory remained stable since the fourth quarter of 2015 at 1,655,954 sqm. In terms of rental availability, there was a 1% decrease in the City of Buenos Aires remained stablevacancy rate to 6.4% during the second quarter of 2015 at 1,646,885 sqm. With regard2016 compared to the same period the previous year. Thus, the vacancy rate there washas remained at a slight decrease from 8.1%stable range between 6% and 8% since 2010. These values indicate that the market is healthy in terms of its operations, allowing an optimum level of supply with balanced values. According to the first quartermarket segments, class A properties show a vacancy rate of 7% for the year to 7.4% during the second quarter. Theentire stock, while A+ properties buildings show a vacancy rate of 6.5% (6.9% in the previous period) and class A properties showed a vacancy rate of 7.9%, 1.1pp lower than the 9% recorded in the first quarter of 2015.5%. In terms of available footage,During the second quarter of 2015 ended with 120,2482016, net absorption was negative at 400 sqm, offered for rental, 78%i.e., more meters than the ones that have been occupied have become vacant, a situation that was not seen since 2012. This behavior of which is represented by the sub-markets Macrocentro Sur, Zona Norte GBA and Puerto Madero. Net absorption recorded in the second quarter of the year was 12,838 sqm. This valuedemand is mainly explained by the performancesub-market Zona Norte GBA, which concentrates most of the spaces that have become vacant. On the other hand, it is verified that the area that has become vacant in A+ properties (-2,908 sqm) was mostly absorbed by class A properties while during the quarter an aggregate footage of 10,128 sqm has been absorbed. If the geographic distribution of this absorption is analyzed,(as it can be seen that the sub-market Zona Norte GBA accounts for 69% of this total area. Such area is followed –far behind- by the sub-markets Microcentro and Puerto Madero (accounting for 20 and 18%, respectively). Conversely, in Plaza Roma a negative absorption of 1,105 sqm was recorded, mainly explained by the vacancy of 6 floors in Torre Bouchard. In turn, the sub-markets Macrocentro, Macrocentro Sur and Plaza San Martin did no record changes in absorption, i.e. no new spaces have been occupied or have become vacant in the properties comprising such stock.2,474 sqm).
Average rental price recorded an increase inDuring the second quarter fromof 2016, rental prices remained steady as compared to the general average prices seen over the past ten years (US$ 24.8 per square meter). Compared to the previous quarter, a 2.5% increase was recorded (from US$ 23.824.1 per square meter to US$ 24.7 per square meter. Upon performing an analysis by building category, it is shown that the averagemeter). This slight increase shows a 1.4% increase in rental price of those in theprices for A+ segment is US$ 26.3 per square meterproperties (US$ 25.527.2 per square meter in the previous period), while the average price of those in class A issecond quarter against US$ 23.6 per square meter (US$ 22.726.8 per square meter in the previousfirst quarter) and a 2.4% increase in rental prices for A properties (US$ 23.4 per square meter in the second quarter against US$ 22.9 per square meter in the first quarter). The spread between both categories is US$ 3.8 and reached US$ 12 in low vacancy periods.
In turn, the sub-market Macrocentro NorteCatalinas is currently the marketone with the best prices in the market. The average value of the properties in such area amounts to US$ 31.227.9 per square meter. This value is expected to increase over the next few months due to the addition of new towers with prices already over US$ 35 per square meter (vacancy rate 2.8%).in the inventory. LateAt June 2016, the sub-market Zona Norte GBA shows average rental prices of US$ 23.3, almost at the same values of June 2015. Moreover, during the same month, the vacancy rate was 8.9%, compared to 9.5% in June 2015.
Israeli macroeconomic context
According to the OECD, for the year ended at December 31, 2015, Israel’s growth reached 2.5%. Israel’s economic growth is projected to remain at 2.5% in 2016, before rising to 3% in 2017. Since March 2015, the Bank of Israel has kept interest rates at 0.10% and has continued with its policy to intervene in the currency market to support economic policies. For both July and August 2016, the Monetary Committee also decided to leave the interest rate at the same level. Similar to the announcements of the interest rate decisions for November and December of 2015, all announcements in the first half of 2016 included guidance that monetary policy is expected to remain accommodative for a considerable time. Since March 2015, the Bank of Israel has pursued a policy to intervene in the currency market. It continued to purchase foreign currency, purchasing US$4 billion, about US$0.9 billion of which were purchased as part of the program intended to offset the effects of natural gas production on the exchange rate. The rest were purchased as part of a program designed to moderate excessive fluctuations in the exchange rate. During the twelve months ending June 30, 2016, the CPI in Israel declined by 0.8%. The energy component continued to contribute to the decline of the CPI, as a result of the sharp decline in global oil prices, even though this trend reversed itself during the first half of the year. During the first half of 2016, the shekel remained stable in terms of the nominal effective exchange rate (the average in June relative to the average in December), and relative to the U.S. dollar. Relative to the euro, the shekel appreciated by about 3%. Various models of the equilibrium exchange rate indicate that the shekel may be overvalued. Activity in the housing market remained roburst during the reviewed period: Home prices continued to increase, and the volumes of transactions and of new mortgages originated remain high. At the beginning of the first half of 2016, the Research Department presented a forecast in which it projected that inflation would return to within the target range at the beginning of 2017, and that the Bank of Israel interest rate would increase gradually starting in the last quarter of 2016. In regards to the seasonality, in Israel retail segment business results are subject to seasonal fluctuations as a result of the consumption behavior of the population proximate to the Pesach holidays (March and/or April) and Rosh Hashanah and Sukkoth holidays (September and/or October). This also affects the balance sheet values of inventory, customers and suppliers. Our revenues from cellular services are usually affected by seasonality with the third quarter of the year characterized by higher roaming revenues due to increased incoming and outgoing tourism. In 2016, the Passover holiday fell at the end of April, compared to 2015 when it was at the beginning of April. The timing of the holiday affects Shufersal’s sales and special offers in the second quarter of 2016, compared to last year. The Passover holiday in the second quarter of 2016 had a greater effect on Shufersal’s results than in the corresponding quarter in 2015, four new office buildings are expected to be included intherefore analysis of the office inventory with a total footageresults for the first half of 44,000 sqm. Two of them will be located in the Plaza San Martín sub-market and the remaining ones will be located in Zona Norte C.A.B.A. and Macrocentro Sur. It should be noted that 38% of this new area will be subjectyear compared to the LEED sustainability standards.corresponding period in 2015 better represents the changes between the periods. For information about Production and Sales, please see Item 5.A. “Consolidated Operating Results”.
Agricultural Business In the ordinary course of business, FyO guarantees certain brokerage transactions. Under the agreement, FyO guarantees the performance of the producer in case it In the ordinary course of business, FyO guarantees certain brokerage transactions. Under the agreement, FyO guarantees the performance of the producer in case it does not comply with the physical delivery. We have recourse against the non-performing party. As of June 30, 2015,2016, the value of transacted merchandise for which guarantees were granted amounted to Ps. 7.8102.7 million. As of the date of this annual report, there were non-performing parties under the agreements for which we had to respond as guarantor. As of the date of this annual report, the value of transacted merchandise for which guarantees were granted amounted to Ps. 26.265.8 million.
Urban Properties and Investment Business As of June 30, 2015,2016, IRSA did not have any off-balance sheet transactions, arrangements or obligations with unconsolidated entities or others that are reasonably likely to have a material effect on our financial condition, results of operations or liquidity.
The following table showsfollowings tables show our contractual obligations, as of June 30, 2015.2016. Where the interest payable is not fixed, the amount disclosed has been determined by reference to the existing conditions at the reporting date. | As of June 30, 2015 | | Less than 1 year | | | Between 1 and 2 years | | | Between 2 and 3 years | | | Between 3 and 4 years | | | More than 4 years | | | Total (i) | | | Trade and other payables | | | 943,713 | | | | 11,001 | | | | 4,698 | | | | 2,582 | | | - | | | | 961,994 | | | Borrowings (excluding finance lease liabilities) | | | 2,215,239 | | | | 3,296,084 | | | | 616,654 | | | | 717,850 | | | | 2,118,068 | | | | 8,963,895 | | | Finance lease | | | 11,785 | | | | 7,291 | | | | 3,859 | | | | 2,552 | | | | - | | | | 25,487 | | | Derivative financial instruments | | | 270,499 | | | | 269,949 | | | | - | | | | - | | | | - | | | | 540,448 | | | Total | | | 3,441,236 | | | | 3,584,325 | | | | 625,211 | | | | 722,984 | | | | 2,118,068 | | | | 10,491,824 | |
(in millions of Pesos) (i) | Includes accrued and prospecting interest, if applicable. |
| As of June 30, 2016 | Less than 1 year | Between 1 and 2 years | Between 2 and 3 years | Between 3 and 4 years | More than 4 years | Total | | Trade and other payables | 14,287 | 438 | 562 | 54 | 4 | 15,345 | | Borrowings (Excluding finance lease liabilities) | 25,260 | 21,093 | 31,601 | 10,176 | 59,037 | 147,167 | | Finance lease obligations | 2,265
| 2,093
| 1,809
| 1,487
| 3,398
| 11,052
| | Derivative financial instruments | 1128 | 178
| 15
| - | - | 1,321
| Purchase Obligations
| 105 | 47 | 58 | - | | 210 | | Total | 43,045 | 23,849 | 34,045 | 11,717 | 62,439 | 175,095 |
See the discussion at the beginning of this Item 5 and “Disclosure regarding forward looking statements” in the introduction of this annual report, for forward-looking statement safe harbor provisions. For information about Production and Sales, please see Item 5.A. “Consolidated Operating Results”. Board of Directors We are managed by a board of directors, which consists of ten directors and three alternate directors. Each director and alternate director is elected by our shareholders at an annual ordinary meeting of shareholders for a three-year term, provided, however, that only one third of the board of directors is elected each year. The directors and alternate directors may be re-elected to serve on the board unlimited number of times. There are no arrangements or understandings pursuant to which any director or person from senior managements is selected. Our current board of directors was elected at the shareholders’ meetings held on October 31, 2013, November 14, 2014 and October 30,2015,30, 2015, for terms expiring in the years 2016, 2017 and 2018, respectively. Our current directors are as follows: | | | | Date of Current Appointment | Current Position Held Since | | Eduardo Sergio Elsztain | 01/26/1960 | Chairman | 11/14/06/30/17 | 11/14/14 | 1994 | | Saúl Zang | 12/30/1945 | First Vice-Chairman | 11/14/06/30/17 | 11/14/14 | 1994 | | Alejandro Gustavo Elsztain | 03/31/1966 | Second Vice-Chairman and CEO | 06/30/16(3) | 10/31/13 | 1994 | | Gabriel A.G. Reznik | 11/18/1958 | Regular Director | 10/06/30/18 | 10/30/15 | 2003 | | Jorge Oscar Fernández | 01/08/1939 | Regular Director | 10/06/30/18 | 10/30/15 | 2003 | | Fernando Adrián Elsztain | 01/04/1961 | Regular Director | 06/30/16 | 10/31/13 | 2004 | David Alberto Perednik | 11/15/1957 | Regular Director and Chief Administrative Officer | 06/30/16(3) | 10/31/13 | 2004 | | Pedro Damaso Labaqui Palacio | 02/22/1943 | Regular Director | 10/06/30/18 | 10/30/15 | 2006 | | Daniel E. Mellicovsky | 01/17/1948 | Regular Director | 11/14/06/30/17 | 11/14/14 | 2008 | | Alejandro Gustavo Casaretto | 10/15/1952 | Regular Director | 11/14/06/30/17 | 11/14/14 | 2008 | | Gastón Armando Lernoud | 06/04/1968 | Alternate Director | 11/14/06/30/17 | 11/14/14 | 1999 | | Enrique Antonini | 03/16/1950 | Alternate Director | 06/30/16(3) | 10/31/13 | 2007 | | Eduardo Kalpakian | 03/03/1964 | Alternate Director | 06/30/16(3) | 10/31/13 | 2007 | | | | | | | |
| | The business address of our management is Moreno 877, 23rd Floor, (C1091AAQ) Buenos Aires, Argentina. |
| (2) | Term expires at the annual ordinary shareholders’ meeting. |
The business address of our management is Moreno 877, 23rd Floor, (C1091AAQ) Buenos Aires, Argentina.(2) Term expires at the annual ordinary shareholders’ meeting. (3) These position will be considerated in the annual ordinary shareholders´meeting that will take place October 28, 2016. Gabriel A. G. Reznik, Jorge Oscar Fernandez, Pedro Dámaso Labaqui Palacio, Daniel Elias Mellicovsky, Enrique Antonini and Eduardo Kalpakian, qualify as independent, in accordance with the CNV’s Rules. The following is a brief biographical description of each member of our board of directors: Eduardo Sergio Elsztain. Mr. Elsztain studied Economic Sciences at University of Buenos Aires (Universidad de Buenos Aires). He has been engaged in the real estate business for more than twenty five years. He is chairmanChairman of the boardBoard of directorsDirectors of IRSA Inversiones y Representaciones Sociedad Anónima, Consultores Asset Management S.A., Arcos del Gourmet S.A., BACS Banco de Crédito & Securitización S.A.,IRSA Commercial Properties, Cresud, BrasilAgro, Austral Gold Ltd. and Banco Hipotecario S.A., Brasilagro Companhia Brasileira de Propiedades Agricolas, Tarshop S.A., E-Commerce Latina S.A., and Dolphin Netherlands BV,SA, among other companies.others. He is also directorChairman of IDBD Development Corporation Ltd.Ltd, Discount Investment Corporation. Mr. Eduardo S. Elsztain is also member of the World Economic Forum, the Council of the Americas, the Group of 50 and Argentina’s Business Association (AEA). He is President of Fundacion IRSA, which promotes education among children and young people; President of TAGLIT - Birthright Argentina; Co-Founder of Endeavor Argentina; and Vice-President of the World Jewish Congress. He is Fernando A.Adrián Elsztain’s cousin and Alejandro G.Gustavo Elsztain and Daniel Ricardo Elsztain’s brother. Saúl Zang.Mr. Zang obtained a law degree from University of Buenos Aires (Universidad de Buenos Aires). He is a member of the International Bar Association and the Interamerican Federation of Lawyers. He is a founding member of Zang, Bergel & Viñes law firm. He is chairman of Puerto Retiro S.A., first vice-chairman of IRSA Inversiones y Representaciones Sociedad Anónima and vice-chairman of IRSA Propiedades Comerciales S.A., Tarshop S.A., and Fibesa S.A., among other companies. He is also director of Banco Hipotecario S.A., Nuevas Fronteras S.A., Brasilagro Companhia Brasileira de Propiedades Agricolas, IDBD Development Corporation Ltd, BACS Banco de Crédito & Securitización S.A., Tarshop S.A., and Palermo Invest S.A., among other companies.
Alejandro Gustavo Elsztain.Mr. Elsztain obtained a degree in agricultural engineering from University of Buenos Aires (Universidad de Buenos Aires). Currently he is chairman of Fibesa S.A. and Cactus Argentina S.A., and second vice-chairman of IRSA Inversiones y Representaciones Sociedad Anónima. He is also vice-chairman of Nuevas Fronteras S.A., and Hoteles Argentinos S.A. He is also director of Brasilagro Companhia Brasileira de Propiedades Agricolas and Emprendimientos Recoleta S.A., among other companies. Mr. Alejandro Gustavo Elsztain is brother of our Chairman Mr. Eduardo S. Elsztain and Daniel Ricardo Elsztain, and cousin of Fernando Adrián Elsztain. Gabriel A. G. Reznik.Mr. Reznik obtained a degree in Civil Engineering from University of Buenos Aires (Universidad de Buenos Aires). He worked for IRSA Inversiones y Representaciones Sociedad Anónima since 1992 until May 2005 at which time he resigned. He had formerly worked for an independent construction company in Argentina. He is director of Emprendimientos Recoleta S.A., and Puerto Retiro S.A., as well as member of the board of Banco Hipotecario S.A., among other companies. Jorge Oscar Fernández. Mr. Fernández obtained a degree in Economic Sciences from University of Buenos Aires (Universidad de Buenos Aires). He has performed professional activities at several banks, financial corporations, insurance firms and other companies related to financial services. He is also involved in many industrial and commercial institutions and associations. Fernando Adrián Elsztain.Mr. Elsztain studied architecture at University of Buenos Aires (Universidad de Buenos Aires). He has been engaged in the real estate business as a consultant and as managing officer of a real estate company. He is chairman of the board of directors of Llao Llao Resorts S.A., Palermo Invest S.A. and Nuevas Fronteras S.A. He is also a director of IRSA Inversiones y Representaciones Sociedad Anónima, IRSA Propiedades Comerciales S.A., and Hoteles Argentinos S.A. He is also alternate director of Puerto Retiro S.A. and Banco Hipotecario S.A., among other companies. He is cousin of our CEO, Alejandro Elsztain, and of our Chairman, Mr. Eduardo S. Elsztain. Pedro Damaso Labaqui Palacio. Mr. Labaqui obtained a law degree from University of Buenos Aires (Universidad de Buenos Aires). He is also director of Bapro Medios de Pago S.A., Permanent Syndic of Bayfe S.A. Fondos Comunes de Inversión, director and member of the Supervisory Committee of J. Minetti S.A.; and Director of REM Sociedad de Bolsa S.A. David Alberto Perednik. Mr. Perednik obtained a degree in accounting from University of Buenos Aires (Universidad de Buenos Aires). He has worked for several companies such as Marifran Internacional S.A., a subsidiary of Louis Dreyfus Amateurs where he worked as Financial Manager from 1986 to 1997. He also worked as a Senior Consultant in the administration and systems department of Deloitte & Touche from 1983 to 1986. He is also chief administrative officer of IRSA Inversiones y Representaciones S.A. and IRSA Propiedades Comerciales S.A.
Daniel E. Mellicovsky.Mr. Mellicovsky obtained a degree in accounting from the University of Buenos Aires (Universidad de Buenos Aires). He has served as director of several companies of the agricultural, food supplies, financial and hotel development sectors. Alejandro Gustavo Casaretto Mr. Casaretto obtained a degree in agricultural engineering from University of Buenos Aires (Universidad de Buenos Aires). He has served as our technical manager, farm manager, and technical coordinator since 1975. Gastón Armando Lernoud.Mr. Lernoud obtained a law degree from El Salvador University (Universidad de El Salvador) in 1992. He obtained a Masters degree in Corporate Law in 1996 from Palermo University (Universidad de Palermo). He was a senior associate member of Zang, Bergel & Viñes law firm until June 2002, when he joined our Company’s lawyers team. Enrique Antonini. Mr. Antonini holds a degree in law from the University of Buenos Aires (Universidad de Buenos Aires). He is currently a member of the board of directors of Banco Mariva S.A. (since 1992), and Mariva Bursátil S.A. (since 1997). He has also served as director of IRSA Inversiones y Representaciones Sociedad Anónima from 1993 to 2002, and at present he is alternate director of IRSA Inversiones y Representaciones Sociedad Anónima. He is member of the Banking Lawyers Committee and the International Bar Association. Eduardo Kalpakian. Mr. Kalpakian holds a degree in business from the University of Belgrano (Universidad de Belgrano). He has also an MBA from the CEMA University of Argentina. He has been director for 25 years of Kalpakian Hnos. S.A.C.I., a leading carpet manufacturer and flooring distributor in Argentina. Currently is vice-chairman of such company’s board and CEO. He is also vice-chairman of the board of La Dormida S.A.A.C.E I. Employment contracts with our directors and certain senior managers We do not have written contracts with our directors. However, Messrs. Eduardo S. Elsztain, Saúl Zang, Alejandro G. Elsztain, Fernando A. Elsztain, David A. Perednik, Alejandro G. Casaretto and Gastón Armando Lernoud are employed by us under the Labor Contract Law No. 20,744. Law No. 20,744 governs certain conditions of the labor relationship, including remuneration, protection of wages, hours of work, holidays, paid leave, maternity protection, minimum age requirements, protection of young workers and suspension and termination of the contract. Senior Management Senior management performs its duties in accordance with the instructions of our board of directors. There are no arrangements by which a person is selected as a member of our senior management. The following table shows information about our current senior management of the Operations Center in Argentina (designated by the board of directors meeting): | Name | Date of Birth | Position | Current Position Held Since | | Alejandro G. Elsztain | 03/31/1966 | CEO | 1994 | | Carlos Blousson | 09/21/1963 | General Manager for Argentina and Bolivia Operations | 2008 | David A. Perednik | 11/15/1957 | Chief Administrative Officer | 1997 | Matías I. Gaivironsky Alejandro Casaretto | 02/23/1976 10/15/1952 | Chief Financial and Administrative Officer | 2011 | Alejandro Casaretto | 10/15/1952 | Chief Regional Agricultural Officer | 2011 2008 |
The following is a biographical description of each of our senior managers who are not directors: Matias Ivan Gaivironsky. Matías Iván Gaivironsky. Mr. Matías Gaivironsky obtained a degree in business in the University of Burnos Aires (administration from Universidad de Buenos Aires).Aires. He holdshas a Master in Finance from CEMA University.Universidad del CEMA. Since 1997 he has held severalserved in various positions inat IRSA, IRSA Propiedades Comerciales S.A,CP and our Company. Since December 2011the Company, and he has beenserved as Chief Financial Officer since December 2011. In early 2016, he was also designated to add the funtions of Administrative Officer. Previously, inIn 2008 he was Tarshop S.A’sserved as Chief Financial Officer.Officer in Tarshop S.A. and was later appointed Manager of the Capital Markets and Investor Relations Division of IRSA, IRSA CP and the Company.
Carlos Blousson. Mr. Blousson obtained a degree in agricultural engineering from University of Burnos Aires (Universidad de Buenos Aires). He has been working as our Chief Sales Officer since 1996. Prior to joining us, he worked as a futures and options operator at Vanexva Bursátil –Sociedad de Bolsa. Previously, he worked as a farmland manager and a technical advisor at Leucon S.A. The following table shows information about our current senior management of the Operations Center in Israel:
Name | Date of birth | Position | Current position held since | Sholem Lapidot | 10/22/1979 | Chief Executive Officer | 2016 | Gil Kotler | 04/10/1966 | Chief Financial Officer | 2016 | Aaron Kaufman | 03/03/1970 | VP & General Counsel | 2015 |
Sholem Lapidot. Mr. Lapidot has studied Rabbinical Studies and Jewish Philosophy in Argentina, Canada and Israel. He serves as Director in Discount Investment Corp. He has been the chief executive officer of IDB Development since January 2016. Gil Kotler. Mr. Kotler obtained a bachelors’ degree in economics and accounting from Tel Aviv University in Israel in 1993. As well as a GMP at Harvard Business School in 2011. He has been the chief financial officer of IDB Development since April 2016. Aaron Kaufman. Mr. Kaufman obtained a law degree in Tel Aviv University in 1996. He has been partner in Epstein Law Firm until November 2015, when he joined IDBD as a VP and General Counsel.
Executive Committee Pursuant to our by-laws, our day-to-day business is managed by an executive committee consisting of a minimum of four and a maximum of seven directors and one alternate member, among which there should be the chairman, first vice-chairman and second vice-chairman of the board of directors. The current members of the Executive Committee are Messrs. Eduardo S. Elsztain, Saúl Zang, Alejandro Elsztain and Fernando A. Elsztain. The executive committee is responsible for the management of the day-to-day business pursuant to authority delegated by our board of directors in accordance with applicable law and our by-laws. Our by-laws authorize the executive committee to: | • | designate the managers and establish the duties and compensation of such managers; | | • | grant and revoke powers of attorney to attorneys-at-law on behalf of us; | | • | hire, discipline and fire personnel and determine wages, salaries and compensation of personnel; | | • | enter into contracts related to our business; | | • | manage our assets; | | • | enter into loan agreements for our business and set up liens to secure our obligations; and | | • | perform any other acts necessary to manage our day-to-day business. |
Supervisory Committee Our Supervisory Committee is responsible for reviewing and supervising our administration and affairs, and verifying compliance with the bylaws and the decisions adopted at shareholders’ meetings pursuant to the provision of the General Companies Law. The members of the Supervisory Committee are appointed at the annual general ordinary shareholders’ meeting for a term of one year. The Supervisory Committee is composed of three members and three alternate members. The following table shows information about the members of our Supervisory Committee, who were elected in the annual general ordinary shareholders’ meeting which was held on October 30, 2015: | | | | José Daniel Abelovich | 07/20/1956 | Member | | Marcelo Héctor Fuxman | 11/30/1955 | Member | | Noemí Ivonne Cohn | 05/20/1959 | Member | | Roberto Daniel Murmis | 04/07/1959 | Alternate Member | | Alicia Graciela Rigueira | 12/02/1951 | Alternate member | Sergio Leonardo Kolaczyk | 11/28/1964 | Alternate member |
All members of the supervisory committee qualify as independent, in accordance with CNV Resolution No. 400/2002 Rules. Set forth below is a brief biographical description of each member of our Supervisory Committee: José Daniel Abelovich. Mr. Abelovich obtained a degree in accounting from the University of Buenos Aires (Universidad de Buenos Aires). He is a founding member and partner of Abelovich, Polano & Asociados S.R.L. / firm member of Nexia International, a public accounting firm in Argentina. Formerly, he had been a manager of Harteneck, López y Cía/Coopers & Lybrand and has served as a senior advisor in Argentina for the United Nations and the World Bank. He is a member of the Supervisory Committees of IRSA Inversiones y Representaciones Sociedad Anónima, IRSA Propiedades Comerciales S.A, Shopping Alto Palermo S.A,, Hoteles Argentinos S.A., Inversora Bolívar, and Banco Hipotecario S.A, among other companies. Marcelo Héctor Fuxman. Mr. Fuxman obtained a degree in accounting from the University of Buenos Aires (Universidad de Buenos Aires). He is a partner of Abelovich, Polano & Asociados S.R.L. / firm member of Nexia International, a public accounting firm in Argentina. He is also a member of the Supervisory Committees of IRSA Inversiones y Representaciones Sociedad Anónima, IRSA Propiedades Comerciales S.A, Shopping Alto Palermo S.A, Hoteles Argentinos S.A., Inversora Bolívar, and Banco Hipotecario S.A, among other companies. Noemí Ivonne Cohn. Mrs. Cohn obtained a degree in accounting from the University of Buenos Aires (Universidad de Buenos Aires). Mrs. Cohn is a partner at Abelovich, Polano & Asociados S.R.L. / firm member of Nexia International a public accounting firm in Argentina, and works in the audit area. Mrs. Cohn worked in the audit area in Harteneck, Lopez and Company, Coopers & Lybrand in Argentina and in Los Angeles, California. Mrs. Cohn is member of the Supervisory Committees of IRSA Inversiones y Representaciones Sociedad Anónima and the Company, among other companies. Roberto Daniel Murmis. Mr. Murmis holds a degree in accounting from the University of Buenos Aires (Universidad de Buenos Aires). Mr. Murmis is a partner at Abelovich, Polano & Asociados S.R.L / firm member of Nexia International. Mr. Murmis worked as an advisor to the Public Revenue Secretariat, Argentine Ministry of Economy. Furthermore, he is a member of the Supervisory Committee of IRSA Inversiones y Representaciones Sociedad Anónima, Shopping Alto Palermo S.A,, Futuros y Opciones S.A., and Llao Llao Resorts S.A, among other companies. Alicia Graciela Rigueira. Mrs. Rigueira holds a degree in accounting from the University of Buenos Aires (Universidad de Buenos Aires). Since 1998 she has been a manager at Estudio Abelovich, Polano & Asociados / firm member of Nexia International. From 1974 to 1998, Mrs. Rigueira performed several functions in Harteneck, Lopez y Cia. affiliated with Coopers & Lybrand. Mrs. Rigueira lectured at the School of Economic Sciences of Lomas de Zamora University. Sergio Leonardo Kolaczyk. Mr. Kolaczyk obtained a degree in accounting from the Universidad de Buenos Aires (Universidad de Buenos Aires). He is a professional of Abelovich, Polano & Asociados S.R.L. / firm member of Nexia International. He is also an alternate member of IRSA Inversiones y Representaciones Sociedad Anónima and IRSA Propiedades Comerciales S.A’s Supervisory Committees. KEY EMPLOYEES There are no key employees.
Compensation of directors Under the Argentine Law, if the compensation of the members of the Board of Directors is not established in the by-laws of the Company, it should be determined by the shareholders’ meeting. The maximum amount of total compensation to the members of the Board of Directors, including compensation for technical or administrative permanent activities, cannot exceed 25% of the earnings of the Company. That amount should be limited to 5% when there is no distribution of dividends to shareholders and will be increased proportionally to the distribution, in accordance with the formulas and scales set forth under the CNV’s Technical Rules. When one or more directors perform special commissions or technical or administrative activities, and there are no earnings to distribute or they are reduced, , the shareholding meeting mayshall approve compensation in excess of the above metioned limitis.limits. The compensation of our directors for each fiscal year is determined pursuant to Argentine law, and taking into consideration whether the directors performed technical or administrative activities and our fiscal year’s results. Once the amount is determined, it is considered at the shareholders’ meeting. At our shareholders’ meeting held on October 30, 2015, was approveda compensations for an aggregate amount of Ps.14,310,941 was approved for all of our directors for the fiscal year ended June 30, 2015. Compensation of Supervisory Committee Our shareholders’ meeting held on October 30, 2015 further approved by majority vote not to pay a compensation to our Supervisory Committee. Compensation of Senior Management Our senior management is paid a fixed amount established by taking into consideration their background, capacity and experience and an annual bonus which varies according to their individual performance and our results. The total and aggregate compensation paid to our senior management of the Operations Center in Argentina and the Agricultural Business for the fiscal year 2014/2015,2015/2016, started in July 2014,2015, was Ps. 4.54,943,802. The aggregate compensation paid to our Senior Management of the Operations Center in Israel since we gained control of IDBD on October 11, 2015 and until June 30, 2016, was Ps.11,36 million. For our CEO and CFO total compensation was considered since they were appointed in January 2016. Compensation of the Audit Committee The members of our Audit Committee do not receive any additional compensation other than that received for their services as members of our board of directors. Capitalization Program for our executive staff During the fiscal year ended June 30, 2006,2007, the Company developed the design of a capitalization program for its executive staff consisting in contributions made by both the employees and the Company. Such program is intended for certain employees selected by the Company that it wishes to retain by increasing employee total compensation by means of an extraordinary reward in so far as certain requirements are fulfilled. The payment of contributions into the plan and participation therein are voluntary. Once the intended beneficiary accepts to take part in the plan, he/she may make two types of contributions: a monthly contribution based on his/her salary and an extraordinary contribution, based on his/her annual bonus. It is suggested that contributions should be of up to 2.5% of salaries and of up to 15% of the annual bonus. And then there is the contribution payable by the Company which shall amount to 200% of the monthly contributions and of 300% of the extraordinary contributions made by the employees. The funds resulting from the contributions made by the participants are transferred to an independent financial vehicle, specially created and situated in Argentina in the form of a mutual fund with the approval of the CNV. These funds can be freely redeemed at the request of participants. The funds resulting from the contributions made by both companies are transferred to another independent financial vehicle, separate from the one previously mentioned. In the future, the participants shall have access to 100% of the benefits under the plan (that is, including the contributions made by the Company for the benefit of the employees into the financial vehicle specially created) in any of the following circumstances: · | ordinary retirement as prescribed by labor law |
· ordinary retirement as prescribed by labor law · | total or permanent disability, and |
· total or permanent disability, and In case of resignation or termination without good cause, the participant may redeem the amounts contributed by us only if he or she has participated in the Plan for at least 5 years and if certain conditions have been fulfilled. During this fiscal year ended June 30, 2015, 2014 and 2013,2016, the Company has made contributions to the plan for Ps. 2.9 million, Ps. 10.2 million and Ps. 6.4 million, respectively.3.6 million. Mid and
Long Term Incentive Program The Shareholders’ Meetings held on October 31, 2011, October 31, 2012, and October 31, 2013, ratified the resolutions approved thereat as regards the incentive plan for ourthe Company’s executive officers, up to 1% of its shareholders’ equity by allocating the same number of own treasury stock (the “Plan”), and delegated on the Board of Directors the broadest powers to fix the price, term, form, modality, opportunity and other conditions to implement such plan. In this sense and in accordance with the new Capital Markets Law, the Company has made the relevant filing with the CNV and pursuant to the comments received from such entity, it has made the relevant amendments to the Plan which, after the CNV had stated to have no further comments, were explained and approved at the Shareholders’ Meeting held on November 14, 2014, where the broadest powers were also delegated to the Board of Directors to implement such plan. The Company has developed a medium and long term incentive and retention stock program for its management team and key employees under which share-based contributions were calculated based on the annual bonus for the years 2011, 2012, 2013 and 2014. The beneficiaries under the Plan are invited to participate by the Board of Directors and their decision to access the Plan iswas voluntary.
In the future, the Participants or their successors in interest will have access to 100% of the benefit (Cresud’s shares contributed by the Company) in the following cases: · | if an employee resigns or is dismissed for no cause, he or she will be entitled to the benefit only if 5 years have elapsed from the moment of each contribution |
· if an employee resigns or is dismissed for no cause, he or she will be entitled to the benefit only if 5 years have elapsed from the moment of each contribution. · | total or permanent disability |
· total or permanent disability. While participants are part of the program and until the conditions mentioned above are met to receive the shares corresponding to the contributions based on the 2011 to 2013 bonus, participants will receive the economic rights corresponding to the shares assigned to them. Regarding fiscal year As provided under the plan, the shares of stock corresponding to the 2014 bonus were delivered in April 2015; moreover, an amount equivalent to one salary was delivered in the program sets forth an extraordinary reward consistingform of freely availableshares of stock payable in a single opportunity on a date to be determined by the Company. The date was fixed for April 1, 2015 for payroll of ourthose employees (who received CRESUD’s shares) and June 26, 2015 for payroll employees of IRSA, IRSA Propiedades Comerciales S.A., PAMSA, ERSA, ARCOS and FIBESA (who received IRSA’s shares).
In addition, we have decided to grant a bonus to all the personnel with more than two years of seniority as of June 30, 2014, and who dodid not participate in the program described above, which bonus consistsplan and who had discharged services for a term of a number of shares equivalent to their compensation for June 2014.two years.
The shares allocated to the Plan by ourthe Company are shares purchased in 2009, which the Shareholders’ Meeting held on October 31, 2011, has specifically decided to allocate to the program. Our CEO of the Operations Centers in Isreal, has a stock option remuneration plan which includes 5,310,000 options, that will be given in five series, and which may be exercised for 5,310,000 ordinary shares, par value NIS 1 per share of Discount Investments.
Benefits upon Termination of Employment There are no contracts providing for benefits to directors upon termination of employment, other than those described under the following sections: (i) Item 6 “Directors, Senior Management and Employees – B. Compensation – Capitalization Plan and (ii) Item 6 “Directors, Senior Management and Employees – B. Compensation – Mid and Long Term Incentive Program. Audit Committee
Internal Control Management uses the Internal Control-Integrated Framework issued by the Committee of Sponsoring Organizations of the Treadway Commission (the “COSO Report”) to assess effectiveness of internal control over financial reporting. The COSO Report sets forth that internal control is a process, effected by an entity’s board of directors, management and other personnel, designed to provide reasonable assurance regarding the achievement of the entity’s objectives in the following categories: · | Effectiveness and efficiency of operations |
· Effectiveness and efficiency of operations · | Reliability of financial reporting |
· Reliability of financial reporting · | · Compliance with applicable laws and regulations |
Based on the above, the Company’s internal control system involves all levels of the company actively involved in exercising control: · | the board of directors, by establishing the objectives, principles and values, setting the tone at the top and making the overall assessment of results; |
· the board of directors, by establishing the objectives, principles and values, setting the tone at the top and making the overall assessment of results; · | the management of each area is responsible for internal control in relation to objectives and activities of the relevant area, i.e. the implementation of policies and procedures to achieve the results of the area and, therefore, those of the entity as a whole; |
· the management of each area is responsible for internal control in relation to objectives and activities of the relevant area, i.e. the implementation of policies and procedures to achieve the results of the area and, therefore, those of the entity as a whole; · | the other personnel plays a role in exercising control, by generating information used in the control system or taking action to ensure control. |
· the other personnel plays a role in exercising control, by generating information used in the control system or taking action to ensure control. AUDIT COMMITTEE In accordance with the Capital Markets Law No. 26.831 and the Rules of the CNV, our board of directors has established an audit committee which would focus on assisting the board in exercising its duty of care, compliance with disclosure requirements, the enforcement of accounting policies, the management of our business risks, the management of our internal control systems, ethical conduct of our businesses, monitoring the sufficiency of our financial statements, our compliance with the laws, independence and capacity of independent auditors and performance of audit duties both by our Company and our external auditors. These responsabilities are meant to comply with the duties assigned by Law 26.831, the Technical Rules of the CNV, and other applicable laws. On November 3, 2008,5, 2015, our board of directors appointed Jorge Oscar Fernández, Pedro Damaso Labaqui Palacio, and Daniel Elías Mellicovsky and Gabriel Adolfo Gregorio Reznik, all of them independent members, as members of the audit committee. The board of directors named Jorge Oscar Fernández as the financial expert in accordance with the relevant SEC rules. We have a fully independent audit committee as per the standards provided in Rule 10(A)-3(b)(1). Remuneration Committee There is no remuneration committee. Operations Center in Argentina As of June 30, 2015,2016, we had 2,8262,879 employees. As of such date, we had 1,0991,117 permanent and 9 temporary employees in our Agricultural Business in Argentina, including our employees, FyO and SACPSA but not those of Agro-Uranga S.A. Approximately 52% are under collective labor agreements. We have good relations with each of our employees. We employ 183161 people in our International Agricultural businesses, composed of 153122 employees of Brasilagro and 3039 employees in the companies located in Bolivia. Our Real Estate Business had 1,753 employees. Our Development and Sale of Properties and Other Non-Shopping Center Businesses segment had 3431 employees, 64 of whom are represented by the Commerce Labor Union (Sindicato de Empleados de Comercio, or SEC) and 10 by the Horizontal Property Union (SUTERH). The Shopping Center segment had 973964 employees including 472461 under collective labor agreements. Our Hotels segment had 704758 employees with 494622 represented by the Tourism, Hotels and Gastronomy Union from the Argentine Republic (Unión de Trabajadores del Turismo, Hoteleros y Gastronómicos de la República Argentina) (UTHGRA).
The following table shows the number of employees in the Company’s various businesses as of the dates mentioned below: | | | | Agricultural Business(1) | | | | Real Estate Business | | | | | | Permanent | | | | Temporary | | | | Development and Sale of Properties and Other Non-Shopping Center Businesses (2) | | | | Shopping Centers | | | | Hotels(3) | | | | Total | | | June 30, 2011 | | | 772 | | | | 48 | | | | 82 | | | | 811 | | | | 678 | | | | 2,391 | | | June 30, 2012 | | | 848 | | | | 17 | | | | 92 | | | | 833 | | | | 662 | | | | 2,452 | | | June 30, 2013 | | | 857 | | | | 11 | | | | 91 | | | | 787 | | | | 662 | | | | 2,408 | | | June 30, 2014 | | | 756 | | | | 16 | | | | 89 | | | | 872 | | | | 647 | | | | 2,380 | | June 30, 2015(4) | | | 1,099 | | | | 16 | | | | 34 | | | | 973 | | | | 704 | | | | 2,826 | |
| (1) | Agricultural Business includes our employees and employees of FyO and SACPSA, but not those of Agro-Uranga S.A. |
| (2) | Includes IRSA, Consorcio Libertador S.A., and Consorcio Maipú 1300 S.A. |
| (3) | Hotels include Intercontinental, Sheraton Libertador and Llao Llao. |
| (4) | Duing April and May 2015, the employees who were assigned to IRSA, and used to be in charge of the building’s operations and the real estate business, were transferred to IRSA Commercial Properties. |
| | | Real Estate Business | | | | | Development and Sale of Properties and Other Non-Shopping Center Businesses (2) | | | | | | June 30, 2011 | 772 | 48 | 82 | 811 | 678 | 2,391 | | | June 30, 2012 | 848 | 17 | 92 | 833 | 662 | 2,452 | | | June 30, 2013 | 857 | 11 | 91 | 787 | 662 | 2,408 | | | June 30, 2014 | 756 | 16 | 89 | 872 | 647 | 2,380 | | June 30, 2015(4) | 1,099 | 16 | 34 | 973 | 704 | 2,826 | | | June 30, 2016 | 1,117 | 9 | 31 | 964 | 758 | 2,879 | |
(1) Agricultural Business includes our employees and employees of FyO and SACPSA, but not those of Agro-Uranga S.A. 163(2)
Includes IRSA, Consorcio Libertador S.A., and Consorcio Maipú 1300 S.A.(3) Hotels include Intercontinental, Sheraton Libertador and Llao Llao. (4) During April and May 2015, the employees who were assigned to IRSA, and used to be in charge of the building’s operations and the real estate business, were transferred to IRSA Commercial Properties. Operations Center in Israel The following table shows the number of employees as of March 31, 2016 of our Israeli operating center divided by company: | IDBD | 29 | DIC (1) | 31 | | Shufersal | 13,726 | Cellcom (2) | 3,138 | PBC (3) | 221 | Other(4) | 1,042 | | Total | 18,187 |
(1) Includes Elron’s employees. (2) Does not include temporary or external employees. (3) Includes 106 hotel and cleaning employees. (4) Includes IDBG, Bartan and IDB Tourism Share ownership of directors, members of the supervisory committee, and senior management as of June 30, 2015.2016. The following table sets forth the amount and percentage (expressed on a fully diluted basis) of our shares beneficially owned by our directors, Supervisory Committee and senior management as of June 30, 2015:2016(2): | Name | Position | | Number of Shares | | | Percentage | | | | | | Directors | | | | | | | | | | Eduardo Sergio Elsztain (1) | Chairman | | | 187,772,805 | | | | 37.43 | % | Chairman | 154,993,977 | 30.90% | | Saúl Zang | First vice-chairman | | | 4,012,506 | | | | 0.80 | % | First vice-chairman | 4,012,506 | 0.80% | | Alejandro Gustavo Elsztain | Second vice- chairman / Chief Executive Officer | | | 7,145,810 | | | | 1.42 | % | Second vice- chairman / Chief Executive Officer | 7,145,810 | 1.42% | | Gabriel A. G. Reznik | Director | | | - | | | | - | | Director | - | - | | Jorge Oscar Fernández | Director | | | 3,034,219 | | | | 0.60 | % | Director | 3,034,219 | 0.60% | | Fernando Adrián Elsztain | Director | | | - | | | | - | | Director | - | - | | David Alberto Perednik | Director / Chief Administrative Officer | | | 104,971 | | | | 0.02 | % | | | Pedro Damaso Labaqui Palacio | Director | | | - | | | | - | | Director | 6,000 | 0.00% | | Daniel Elias Mellicovsky | Director | | | - | | | | - | | Director | - | - | | Alejandro Gustavo Casaretto | Director/Regional manager of Agricultural Real Estate | | | 136,260 | | | | 0.03 | % | Director/Regional manager of Agricultural Real Estate | 135,035 | 0.03% | | Salvador Darío Bergel | Alternate Director | | | - | | | | - | | | | Gastón Armando Lernoud | Alternate Director | | | 53,704 | | | | 0.01 | % | Alternate Director | 11,091 | 0.00% | | Enrique Antonini | Alternate Director | | | - | | | | - | | Alternate Director | - | - | | Eduardo Kalpakian | Alternate Director | | | - | | | | - | | Alternate Director | - | - | | | | | | | | | | | | | | | | Senior Management | | | | | | | | | | | | | | Matias Gaivironsky | Chief Financial Officer | | | 83,080 | | | | 0.02 | % | Chief Financial and Administrative Officer | 83,080 | 0.02% | | Carlos Blousson | Chief Executive Officer of the International Operation | | | 54,534 | | | | 0.01 | % | Chief Executive Officer of the International Operation | 9,986 | 0.00% | | | | | | | | | | | | | | | | Supervisory Committee | | | | | | | | | | | | | | José Daniel Abelovich | Member | | | - | | | | - | | Member | - | - | | Marcelo Héctor Fuxman | Member | | | - | | | | - | | Member | - | - | | Noemí Ivonne Cohn | Member | | | - | | | | - | | Member | - | - | | Roberto Daniel Murmis | Alternate member | | | - | | | | - | | Alternate member | - | - | | Alicia Graciela Rigueira | Alternate member | | | - | | | | - | | Alternate member | - | - | | Sergio Leonardo Kolaczyk | Alternate member | | | - | | | | - | | Alternate member | - | - | | Executive Committee | | | | | | | | | | | | | | Eduardo Sergio Elsztain | Member | | | 187,772,805 | | | | 37.43 | % | Member | 154,993,977 | 30.90% | | Saúl Zang | Member | | | 4,012,506 | | | | 0.80 | % | Member | 4,012,506 | 0.80% | | Alejandro Gustavo Elsztain | Member | | | 7,145,810 | | | | 1.42 | % | Member | 7,145,810 | 1.42% | | | | | | | | | | | | |
(1) Includes (i) 187,552,100154,898,780 shares beneficially owned by IFISA, for which Mr. Eduardo S. Elsztain may be deemed beneficial owner, (ii) 880 common shares beneficially owned by Consultores Venture Capital Uruguay S.A. (iii) 752 common shares held by Consultores Asset Management S.A. and (iii) 219,825(iv) 93,565 common shares owned directly by Mr. Eduardo S. Elsztain. (2) David Alberto Perednik resigned his position as alternate director on September 29, 2016. For more information please see “Recent DevelopmentsResignation as alternate director.”
Option Ownership No options to purchase shares have been granted to our Directors, Senior Managers, members of the Supervisory Committee, or Audit Committee. Employees’ Participation in our Capital Stock There are no arrangements for involving our employees in our capital stock or related to the issuance of options, shares or securities other than those described under the following sections: (i) ITEMItem 6: Directors, Senior Management and Employees – B. Compensation – Capitalization Plan and (ii) Item 6:6. Directors, Senior Management and Employees – B. Compensation – Mid and Long Term Incentive Program. Information about Major Shareholders Share Ownership The following table sets forth information regarding ownership of our capital stock by each person known to us to own beneficially at least 5% of our common shares, ANSES (The Argentine Social Security National Agency) and all our directors and officers as a group. Percentages are expressed on a fully diluted basis. | | | Share Ownership as of June 30, 2015 | | Share Ownership as of June 30, 2016 | | Shareholder | | Number of Shares | | | Percentage | | Number of Shares | Percentage | IFISA(1)(2) | | | 187,772,805 | | | | 37.43 | % | 154,993,977 | 30.90% | | Senvest Management LLC | | | 2,554,766 | | | | 5.09 | % | | Directors and officers(3) | | | 14,625,084 | | | | 2.91 | % | 14,541,717 | 2.90% | | ANSES | | | 17,862,157 | | | | 3.56 | % | 17,862,157 | 3.56% | | Total | | | 222,814,812 | | | | 49.0 | % | 187,397,851 | 37.36% |
(1) Eduardo S. Elsztain is the Chairman of the board of directors of IFIS Limited, a corporation organized under the laws of Bermuda and Inversiones Financieras del Sur S.A., a corporation organized under the laws of Uruguay. Mr. Elsztain holds (through companies controlled by him and proxies) a majority of the voting power in IFIS Ltd., which owns 100% of IFISA. (2) As a result, Mr. Elsztain may be deemed beneficial owner of 37.43%30.90% of our total shares, which includes (i) 187,552,100154,898,780 shares beneficially owned by Inversiones Financieras del Sur S.A., for which Mr. Eduardo S. Elsztain may be deemed beneficial owner, (ii) 880 common shares beneficially owned by Consultores Venture Capital Uruguay S.A., (iii) 219,825752 common shares held by Consultores Asset Management S.A. and (iv) 93,565 common shares owned directly by Mr. Eduardo S. Elsztain. (3) Includes only direct ownership of our Directors and Senior Management, other than Mr. Eduardo S. Elsztain.
Change in Capital Stock Ownership | | | As of June 30, (5) | | As of June 30, | | | | 2015 | | | 2014 | | | 2013 | | | 2012 | | | 2011 | | 2016 | 2015 | 2014 | 2013 | 2012 | IFISA(1)(2) | | | 37.43 | % | | | 39.3 | % | | | 39.3 | % | | | 38.8 | % | | | 38.2 | % | 30.9% | 37.4% | 39.3% | 39.3% | 38.8% | D.E. Shaw & Co L.P. (3) | | | - | | | | 0.7 | % | | | 2.1 | % | | | 3.2 | % | | | 8.1 | % | - | 0.7% | 2.1% | 3.2% | | Senvest Management LLC | | | 5.1 | % | | | 3.6 | % | | | 0.7 | % | | | 0.3 | % | | | 0.3 | % | 4.7% | 5.1% | 3.6% | 0.7% | 0.3% | Directors and officers(4) | | | 2.3 | % | | | 2.4 | % | | | 2.2 | % | | | 1.9 | % | | | 1.3 | % | 2.9% | 2.3% | 2.4% | 2.2% | 1.9% | | ANSES | | | 3.6 | % | | | 3.4 | % | | | 3.4 | % | | | 3.1 | % | | | 3.1 | % | 3.6% | 3.4% | 3.4% | 3.1% |
(1) (1) Mr. Eduardo S. Elsztain is the Chairman of the board of directors of IFIS Limited, a corporation organized under the laws of Bermuda and Inversiones Financieras del Sur S.A., a corporation organized under the laws of Uruguay. Mr. Elsztain holds (through companies controlled by him and proxies) a majority of the voting power in IFIS Ltd., which owns 100% of IFISA.
(2) As a result, Mr. Eduardo S. Elsztain may be deemed beneficial owner of 37.43%30.90% of our total shares, which includes (i) 187,552,100154,898,780 shares beneficially owned by Inversiones Financieras del Sur S.A., for which Mr. Eduardo S. Elsztain may be deemed beneficial owner, (ii) 880 common shares beneficially owned by Consultores Venture Capital Uruguay S.A., (iii) 219,825752 common shares held by Consultores Asset Management S.A. (iv) 93,565 common shares owned directly by Mr. Eduardo S. Elsztain. (3) According to the Form filed with the SEC as of June 30, 2015.SEC. (4) Includes only direct ownership of our Directors and Senior Management, other than Mr. Eduardo S. Elsztain. (5) On a fully diluted basis.
Difference in Voting Rights Our major shareholders do not have different voting rights. Arrangements for change in control There are no arrangements that may at a subsequent date in a change in control. Securities held in the host country As of June 30, 2015,2016, our total issued and outstanding capital stock outstanding consisted of 501,642,804 common shares. As of June 30, 2015,2016, there were approximately 46,292,70241,803,722 Global Depositary Shares (representing 462,927,021418,037,222 of our common shares, or 92.3%83.33% of all of our outstanding shares held) in the United States by approximately 8486 registered holders of Global Depositary Shares. As of June 30, 20152016 our directors and senior officers controlled, directly or indirectly, approximately 39.75%33.79% of our common shares. As a result, these shareholders have, and will continue to have, significant influence on the election of our directors and the outcome of any action requiring shareholder approval. We enter into transactions with related parties on an arm’s-length basis. A related party transaction means any transaction entered into directly or indirectly by us or any of our subsidiaries that is material based on the value of the transaction to (a) any director, officer or member of our management or shareholders; (b) any entity in which any such person described in clause (a) is interested; or (c) any person who is connected or related to any such person described in clause (a). LeaseAgreement for the Exchange of Corporate Services with IRSA and IRSA CP
Considering that each of IRSA, IRSA CP and us have operating areas which are somewhat similar, the Board of Directors deemed it advisable to implement alternatives aimed at reducing certain fixed costs of our Chairman’s officescombined activities and to lessen their impact on operating results while seizing and optimizing the individual efficiencies of each of them in the different areas comprising the management of operations. To such end, on June 30, 2004, a Master Agreement for the Exchange of Corporate Services (“Frame Agreement") was entered into between IRSA, IRSA CP and us, which was amended several times to bring it in line with evolving requirements. The agreement has a term of 24 months, is renewable automatically for equal periods, unless it is terminated by any of the parties upon prior notice. This agreement currently provides for the exchange and sharing of services among the following areas: Human Resources, Finance, Institutional Relations, Administration and Control, Insurance, Security, Agreements, Technical Tasks, Infrastructure and Services, Procurement, Architecture and Design, Development and Works, Real Estate, Hotels, Board of Directors, Board of directors of Real Estate Business, General Manager Office, Board Safety, Audit Committee, Real Estate Business Management, Human Resources of Real Estate Business, Fraud Prevention, Internal Audit and Agricultural Investment Management. Pursuant to this agreement, the companies hired Deloitte & Co., an external consulting firm to review and evaluate half-yearly the criteria used in the process of liquidating the corporate services, as well as the basis for distribution and source documentation used in the process indicated above, by means of a half-yearly report. The operations indicated above allow both IRSA and IRSA CP to keep our strategic and commercial decisions fully independent and confidential, with cost and profit apportionment being allocated on the basis of operating efficiency and equity, without pursuing individual economic benefits for any of the related companies. Offices and Shopping centers spaces leases Our Chairman’s offices are located at Bolívar 108, City of Buenos Aires. We have leased this property from Isaac Elsztain e Hijos S.C.A., a company controlled by certain relatives of Eduardo S. Elsztain, our chairman, and also from Hamonet S.A., a company controlled by Fernando A. Elsztain, one of our Directors, and certain of his relatives. A lease agreement was executed among us, IRSA, IRSA Commercial Properties and Isaac Elsztain e Hijos S.C.A., in March 2004, which is due in March 2017 and has a monthly payment lease of US$5 thousands, which is distributed and shared equally among the three companies.
In April 1, 2014,addition, we, IRSA, IRSA Commercial Properties and Hamonet S.A. entered into a lease agreement for the lease of the executive offices located in 108 Bolívar St., 3rd and 4th floors, City of Buenos Aires. This lease has a term of 36 months and rent of US$ 5.001 per month, which is distributed and shared equally among the three companies. Lease of our Headquarters
Our administrative headquarters are located at Intercontinental Plaza Building, located at 877 Moreno St., floor 23, in the Autonomous City of Buenos Aires, which belongs to IRSA Commercial Properties since December 2014, for more information about the acquisition of the Intercontinental Plaza Building, see Item 4.A. History and Development of the Company. We lease certain floors and this lease extends up to June, 2016, January, 2017 and August, 2017. The monthly lease is US$24.0 thousands plus maintenance fees and the applicable taxes and charges in proportion to the leased space. Additionally, IRSA leases part of the second floor of the Intercontinental Plaza Building, on a lease that extends up to December, 2017. The monthly lease payment is US$7.7 thousands plus maintenance fees and the applicable taxes and charges in proportion to the leased space.
In addition IRSA leases from IRSA Commercial Properties a space in the Abasto shopping center. The agreements are valid until November, 2015 and September, 2016. The monthly rent is US$19.0 thousands, plus a fixed amount for common expenses.
Tarshop, leases from IRSA Commercial Properties three floors and certain parking lot spaces of our building located at 652 Suipacha St. The term of this lease extends up to 2017. The monthly lease payment is US$52.1 thousands plus maintenance fees and the applicable taxes and charges in proportion to the leased space. Llao Llao Resorts S.A. rents from IRSA a floor on our Maipu 1300 building. This lease shall last until 2015 and has a monthly rate of US$ 1,950 plus any common expenses, taxes and fees, the parties are currently negotiation its extension.
Fibesa S.A. leases from IRSA Commercial Properties part of a floor in the Intercontinental Plaza Building, located in 877 Moreno St., of the Autonomous City of Buenos Aires, for a monthly rent of US$11.6 thousands plus maintenance fees, in proportion to the lease space. This agreement extends up to October, 2017.
BACS, leases from IRSA Commercial Properties a floor in the República Building, located in 1 Tucuman St., of the Autonomous City of Buenos Aires, for a monthly average amount of US$20.9 thousands plus maintenance fees, in proportion to the lease space. This agreement extends up to October, 2017. BHN Sociedad de Inversión S.A., BHN Seguros Generales S.A. and BHN VidaVisa S.A. rent offices owned by IRSA CP in different buildings. Furthermore, we also let various spaces in our Shopping Centers (stores, stands, storage space or advertising space) to third parties and related parties such us Tarshop S.A. and BHSA. Lease agreements entered into with associates included similar provisions and amounts to those included in agreements with third parties. Donations granted to Fundación IRSA and Fundación Museo de los Niños Fundación IRSA is a non-profit charity institution that seeks to support and generate initiatives concerning education, the promotion of corporate social responsibility and the entrepreneurial spirit of the youth. It carries out corporate volunteering programs and fosters donations by the Company’s employees. The main members of Fundación IRSA's Board of Directors are: Eduardo S. Elsztain (President); Saul Zang (Vice President I), Alejandro Elsztain (Vice President II) and Mariana C. de Elsztain (secretary). It finances its activities with donations from IRSA, IRSA CP, Cresud and others related companies.
On October 31, 1997, IRSA CP entered into an agreement with Fundación IRSA whereby 3,800 square meters of the constructed area at the Abasto shopping center was granted under a gratuitous bailment agreement for a term of 30 years. Subsequently, on October 29, 1999, Fundación IRSA assigned free of cost all the rights of use over such store and its respective obligations to Fundación Museo de los Niños. On November 29, 2005, IRSA CP signed another agreement with Fundación Museo de los Niños granting under gratuitous bailment 2,670.11 square meters of the constructed area at Alto Rosario shopping center for a term of 30 years. Fundación Museo de los Niños has used these spaces to set up “Museo de los Niños”, Abasto and “Museo de los Niños, Rosario”, two interactive learning centers intended for children and adults. Both agreements establish the payment of common expenses and direct expenses related to the services performed by these stores should be borne by Fundación Museo de los Niños. Legal Services We hire legal services from Estudio Zang, Bergel & Viñes, in which Saúl Zang is a partner. Mr. Zang is a member of our Board of Directors and that of our related companies. During the fiscal years ended June 30, 2016, 2015 and 2014 we paid Zang, Bergel & Viñes Abogados an aggregate amount of approximately Ps.6 million, Ps.5 million and Ps.4 million, respectively, as payment for legal services. Purchase of agrochemicals from Adama Adama is a company specialized in agrochemicals, particularly used in farming, and is a worldwide leader in active ingredients used in agricultural production. CRESUD, in the normal course of its business, acquires agrochemical products and/or hires services from Adama. On July 17, 2016, DIC reported that it had signed an agreement with ChemChina to sell 40% of Adama Agricultural Solutions Ltd.’s shares, indirectly controlled by IDBD through DIC. For more information see “Recent Developments.” Hospitality Services We and our related parties hire, in certain occasions, hotel services and lease conference rooms for events to Nuevas Fronteras S.A. and Hoteles Argentinos S.A., leasessubsidiaries of IRSA. Purchase and sale of goods and/or service hiring In the normal course of its business and with the aim of making resources more efficient, we, or our related parties, including our parent company, in certain occasions purchases and/or hires services which later sells and/or recovers for companies or other related parties, based upon their actual utilization. Borrowings In the normal course of its activities, we enter into diverse loan agreements or credit facilities between our subsidiaries and/or other related parties. These borrowings generally accrue interests at market rates. Financial and service operations We work with several financial entities in Argentina for operations including, but not limited to, credit, investment, purchase and sale of securities and financial derivatives. Such entities include Banco Hipotecario S.A. and its subsidiaries. Furthermore, Banco Hipotecario S.A. and BACS Banco de Crédito y Securitización S.A. usually act as underwriters in Capital Market transactions. In addition, we have entered into agreements with BHSA, who provides collection services for our Shopping Centers. Transactions with IFISA On February 10, 2015, Dolphin, sold 71,388,470 IDBD shares to IFISA, for an amount of US$ 25.6 million, US$ 4.0 million of which were paid upon execution and the remaining balance of US$ 21.6 million were financed for a term of up to 360 days and priced at Libor 1M (one month) + 3%. On May 9, 2016, the parties agreed to extend the expiration date for 30 days as from execution of the addenda, to be automatically renewable every 30 days for a maximum term of 180 days, and increasing the rate to 9% since February 10, 2016. On May 31, 2015, IRSA, through Dolphin, sold to IFISA 46 million of warrants Series 4 for a total amount of NIS 0.46 million (equivalent to US$ 0.12 million at the time of the transaction), provided IFISA agreed to exercise them fully when Dolphin were so required by IDBD. On July 28, 2015, Dolphin granted a loan to IFISA for an amount of US$ 7.2 million, due in July 2016, which accrues interest at Libor 1M (one month) + 3%. On May 9, the parties agreed to extend the expiration date to June 8, 2016, to be automatically renewable every 30 days for a maximum term of 180 days, and increased the rate to 9%. On October 9, 2015, IRSA granted a loan in the amount of US$ 40 million to IFISA. The term of the loan is one year calculated from the disbursement and will bear interest at a rate of 3% + Libor 1M, to be determined monthly. On October 9, 2016, the parties agreed to extend the expiration date to be automatically renewable every 30 days for a maximum term of 180 days and increase the rate to 9%. In February 2016, DN B.V., a subsidiary of Dolphin, entered into an option contract with IFISA whereby Dolphin is granted the right, but not the obligation to acquire 92,665,925 shares of IDBD held by IFISA at a share price of NIS 1.64 plus an annual interest of 8.5%. The exercise date for the option extends for two years. All transactions are carried out at arm’s length. On June 2014, the Company – through its subsidiary, Real Estate Investment Group IV LP – renewed a credit facility granted by IFISA, a company indirectly controlled by Eduardo Sergio Elsztain, for a total amount of 1.4 million shares of Hersha Hospitality Trust. The transaction was agreed upon for a term of 30 days, which could be renewed for up to 360 days; the facility was priced at Libor (3 months) + 50 bp. This credit facility was cancelled after the end of fiscal year 2014 in order to sell the remaining amount of Hersha. As of June 30, 2016 we had current a credit line with IFISA of shares and/or GDRs of IRSA for up to 3,500,000 GDRs. The expiration of this line will operate in June 2017 and bears an annual fixed rate of 6%.
On June 18, 2012 we entered a credit facility agreement with IFISA, pursuant to which we agreed to lend to IFISA up to US$ 6.0 million, which will mature on November 24, 2012, then it was extended until November 24, 2015, at an interest rate equivalent to LIBOR (12 months) + 300 bp., date in which was canceled. Investment in mutual funds of BACS Administradora de Activos S.A. S.G.F.C.I. We invest from time to time our liquid fund in mutual funds managed by BACS Administradora de Activos S.A. S.G.F.C.I., which is a subsidiary of Banco Hipotecario, among other entities. Credit line with IRSA Propiedades Comerciales S.A. On July 5, 2016, IRSA renewed and increased the credit line with IRSA Propiedades Comerciales S.A. for up to US$ 120 million, in which IRSA Propiedades Comerciales S.A. is the lender and IRSA is, directly or indirectly, the borrower. The loan bears annual interest at a rate of 9% and matures on June 24, 2017. As of the date of this annual report, the total amount due by IRSA to IRSA Commercial Properties a floor in the República Building, located in 1 Tucuman St., of the Autonomous City of Buenos Aires, for a monthly average amount ofamounts to US$26.5 thousands plus maintenance fees, in proportion to the lease space. This agreement extends up to September, 2016.45 million. Farmland Lease Agreement San Bernardo We lease a farmland located in the Province of Córdoba, from San Bernardo de Córdoba S.A. (formerly known as Isaac Elsztain e Hijos S.C.A.), pursuant to a lease agreement effective as of June, 2014.August 2015. The leased farmland has an extension of 12,63512,600 hectares. The rent to be paid is the equivalent in Pesos of 3.5 Kg.3,5kg of beef per hectare. The beef price will be set, taking into account the price per kilo of beef quoted on Mercado de Hacienda de Liniers, the previous week of the payment date. In addition, the parties have agreed in a productivity prize of 15% of the weight that the cattle achieve above 240.000kg. This prize will be payable on September only if2016. This lease contemplates the cattle achieves the amountpossibility of kilos.extension up to two periods per year. Currently being agreed conditions of its extension. We pay a rent of Ps. 0.5 million during the fiscal year ended June 30, 2014. Fernando Adrián Elsztain, our director is also president of Isaac Elsztain e Hijos S.C.A. In addition, Alejandro G. Elsztain who is alternate director of Isaac Elsztain e Hijos S.C.A. is also our second vice-chairman and CEO.
The referred lease agreement finished on June 30, 2015, and it was renewed for one year. The farmland extension of 12.600 hectares, and the rent to be paid is the equivalent in Pesos of 3,5kg of beef per hectare. The beef price will be set, taking into account the price per kilo of beef quoted on Mercado de Hacienda de Liniers, the previous week of the payment date.
In addition, the parties have agreed in a productivity prize of 15% of the weight that the cattle achieve above 240.000kg. This prize will be payable on September, only if the cattle achieves the amount of kilos.
We pay a rent of Ps. 0.7 million during the fiscal year ended June 30, 2015.
Consulting AgreementLegal Services
Pursuant to the terms of the Consulting Agreement with Consultores Asset Management effective as of November 7, 1994, Consultores Asset Management provides us advisoryWe hire legal services on matters related to capital investmentsfrom Estudio Zang, Bergel & Viñes, in all aspects of the agricultural business. Onewhich Saúl Zang is a partner. Mr. Zang is a member of our shareholdersBoard of Directors and the Chairmanthat of our board of directors is the owner of 85% of the capital stock of Consultores Asset Management and our First Vice Chairman of the board of directors holds the remaining 15% of its capital stock.
Pursuant to the terms of the Consulting Agreement, Consultores Asset Management provides us with the following services:
| • | advises with respect to the investment of our capital in all aspects of agricultural operations, including, among others, sales, marketing, distribution, financing, investments, technology and business proposals; | | • | acts on our behalf in such transactions, negotiating the prices, conditions, and other terms of each operation; and | | • | gives advice regarding securities investments with respect to such operations. |
The Consulting Agreement expressly provides that Consultores Asset Management may not advise us with respect to transactions that are entirely related to real estate.
Under the Consulting Agreement, we pay Consultores Asset Management for its services, an annual fee equal to 10% of our annual after-tax net income. We also reimburse Consultores Asset Management the administrative expenses incurred by it in performing its duties under the Consulting Agreement and: (i) remuneration to the directors and certifying accountants; (ii) remuneration of legal consultants; (iii) remuneration of auditors; (iv) representation costs; and (v) all other costs incurred by it in performing its services.
During fiscal year ended June 30, 2014 and 2013 there were not charges for consulting agreement fees. During fiscal year ended June 30, 2015 the charge for consulting agreement fees was of Ps. 11.4 million.
The Consulting Agreement is subject to termination by either party upon not less than 60 days prior written notice. If we terminate the Consulting Agreement without cause, we will be liable to Consultores Asset Management for twice the average of the amounts of the management fee paid to Consultores Asset Management for the two fiscal years prior to such termination.
Space for Fundación IRSA and Fundación Museo de los Niños at No Cost
On October, 1997, IRSA trough its subsidiary IRSA Commercial Properties granted Fundación IRSA the right to use 3,800 square meters of constructed area in the Abasto Shopping Center free of charge for a 30-year period.
Moreover, on November, 2005, IRSA Commercial Properties granted Fundación Museo de los Niños the right to use approximately 2,670 square meters of constructed area in the Shopping Rosario free of charge for a 30-year period.
Fundación IRSA is a charitable, non-profit organization whose Chairman is Eduardo S. Elsztain and whose Secretary, is Mariana Carmona de Elsztain, Mr. Elsztain’s wife. Fundación IRSA has used the available area to house a museum called “Museo de los Niños, Abasto,” an interactive learning center for children and adults, which opened to the public in April 1999. On September 27, 1999, Fundación IRSA assigned and transferred at no cost, the entirety of Museo de los Niños, as well as Abasto’s rights and obligations to Fundación Museo de los Niños.
Fundación Museo de los Niños is a charitable non-profit organization created by the same founders of Fundación IRSA and has the same members of the administration committee as Fundación IRSA. Fundación Museo de los Niños acts as special vehicle for the developments of “Museo de los Niños, Abasto” and “Museo de los Niños, Rosario.” On October 29, 1999, our shareholders approved the assignment of “Museo de los Niños, Abasto” agreement to Fundación Museo de los Niños. In addition, on December 12, 2005, an agreement granting the right to use of the space designated for Museo de los Niños, Rosario, at no cost, was signed.
companies. During the fiscal years ended June 30, 2016, 2015 and 2014 and 2013, we made donations to Fundación IRSA and Fundación Museo los Niños for a totalpaid Zang, Bergel & Viñes Abogados an aggregate amount of Ps. 4.7approximately Ps.6 million, Ps. 3.3Ps.5 million and Ps. 1.4Ps.4 million, respectively, Sale of Advertising Space in Media as payment for legal services.
We and our related parties usually execute agreements with third parties by which we sell/acquire, for their future use rights to advertise
Purchase of agrochemicals from Adama Adama is a company specialized in media (TV, radio, newspapers, etc.) that are lateragrochemicals, particularly used in advertising campaigns.farming, and is a worldwide leader in active ingredients used in agricultural production. CRESUD, in the normal course of its business, acquires agrochemical products and/or hires services from Adama. On July 17, 2016, DIC reported that it had signed an agreement with ChemChina to sell 40% of Adama Agricultural Solutions Ltd.’s shares, indirectly controlled by IDBD through DIC. For more information see “Recent Developments.” Special reimbursement with different payment methods
We and our related parties undertake different commercial actions and promotions intended to promote the influx and consumption of the public in our shopping centers.
In some particular promotions it is offered, in specific dates or periods, different discount rates to the clients and/or financing planes with zero interest rates. We and our related parties entered into agreements with different financial entities outside of our economic group and/or related parties such as Banco Hipotecario and Tarshop.
These agreements generally establish different reimbursement rates to those costumers that do purchases in all the shops that are part of them using the payment methods specified by each financial entity and, in certain opportunities, additional financing plans with zero interest rates. The costs of the reimbursements given to the customers generally are distributed proportionally among the entities, while the cost of the financing at zero interest rate is assumed by the financial entities. We and our related parties act as intermediaries, making sure that the tenants adhere to the plan and advertising of these promotions. This operation doesn’t generate any cash influx or transfer of income or cost between us and our related parties.
Hospitality Services We and our related parties hire, in certain occasions, hotel services and lease conference rooms for events to Nuevas Fronteras S.A., and Hoteles Argentinos S.A. and Llao Llao Resorts S.A., subsidiaries of IRSA. Occasionally, we
Purchase and our related parties acquire rights to stay in the hotelssale of those companies, for their use in different corporate goods and/or promotional activities. As of June 30, 2015 and June 30, 2014, we and our related party had 128 and 723, days accommodation pending of utilization. Agreement for the Exchange of Corporate Services between us, IRSA and IRSA Commercial Properties.
Considering that each of IRSA Commercial Properties, IRSA and us, have operating areas which are somewhat similar, the Board of Directors deemed it advisable to implement alternatives aimed at reducing certain fixed costs of its activities and to lessen their impact on operating results while seizing and optimizing the individual efficiencies of each of them in the different areas comprising the management of operations.
In this regard, on June 30, 2004, IRSA Commercial Properties, IRSA and us, entered into an agreement for the exchange of corporate services, which was amended on August 23, 2007, August 14, 2008, November 27, 2009, March 12, 2010, July 11, 2011, October 15, 2012, November 12, 2013, February 24, 2014 and February 18, 2015.
The agreement for the exchange of corporate services among IRSA Commercial Properties, IRSA and us, currently provides for the exchange of services among the following areas: human resources, finance, institutional relationships, administration and control, insurance, contracts, technical, infrastructure and services, purchases, architecture and design and development and works department, real estate, hotels, board of directors, board of directors of the real estate business, general management department, security, audit committee, real estate administration, human resources of the real estate business, fraud prevention, internal audit, administration of the agribusiness investments environment and quality, among others
The exchange of services consists in the provision of services in relation to any of the aforementioned areas by one or more of the parties to the agreement for the benefit of the other party or parties, which are invoiced and paid primarily by an offset against the services provided by any of the areas and, secondarily, in case of a difference between the value of the services rendered, in cash.
Under this agreement the companies have entrusted to an external consultant the review and evaluation, on a semiannual basis, of the criteria applied in the corporate service settlement process and of the distribution bases and supporting documentation used in such process, through the issuance of a semiannual report.
On March 12, 2010, an amendment to the agreement for the exchange of corporate services was entered into to simplify issues originating from the consolidation of financial statements as a result of the increase in IRSA’s equity interest. As a result, certain employment agreements of, IRSA Commercial Properties and our corporate employees were transferred to us.
Later, as consequence of the ongoing process of generating the most efficient distribution of corporate resources among the different areas, on February 24, 2014, a new amendment to the agreement was entered by virtue of which the parties agreed to transfer to IRSA Commercial Properties and us the employments agreements of the corporate employees that develop exclusively in the real estate business. The labor costs of the employees continued to be distributed in accordance with the terms of the agreement for the exchange of corporate services, as amended.hiring
In the futurenormal course of its business and with the aim of making resources more efficient, we, or our related parties, including our parent company, in certain occasions purchases and/or hires services which later sells and/or recovers for companies or other related parties, based upon their actual utilization. Borrowings In the normal course of its activities, we enter into diverse loan agreements or credit facilities between our subsidiaries and/or other related parties. These borrowings generally accrue interests at market rates. Financial and service operations We work with several financial entities in Argentina for operations including, but not limited to, credit, investment, purchase and sale of securities and financial derivatives. Such entities include Banco Hipotecario S.A. and its subsidiaries. Furthermore, Banco Hipotecario S.A. and BACS Banco de Crédito y Securitización S.A. usually act as underwriters in Capital Market transactions. In addition, we have entered into agreements with BHSA, who provides collection services for our Shopping Centers. Transactions with IFISA On February 10, 2015, Dolphin, sold 71,388,470 IDBD shares to IFISA, for an amount of US$ 25.6 million, US$ 4.0 million of which were paid upon execution and the remaining balance of US$ 21.6 million were financed for a term of up to 360 days and priced at Libor 1M (one month) + 3%. On May 9, 2016, the parties agreed to extend the expiration date for 30 days as from execution of the addenda, to be automatically renewable every 30 days for a maximum term of 180 days, and increasing the rate to 9% since February 10, 2016. On May 31, 2015, IRSA, through Dolphin, sold to IFISA 46 million of warrants Series 4 for a total amount of NIS 0.46 million (equivalent to US$ 0.12 million at the time of the transaction), provided IFISA agreed to exercise them fully when Dolphin were so required by IDBD. On July 28, 2015, Dolphin granted a loan to IFISA for an amount of US$ 7.2 million, due in July 2016, which accrues interest at Libor 1M (one month) + 3%. On May 9, the parties agreed to extend the expiration date to June 8, 2016, to be automatically renewable every 30 days for a maximum term of 180 days, and increased the rate to 9%. On October 9, 2015, IRSA granted a loan in the amount of US$ 40 million to IFISA. The term of the loan is one year calculated from the disbursement and will bear interest at a rate of 3% + Libor 1M, to be determined monthly. On October 9, 2016, the parties agreed to extend the expiration date to be automatically renewable every 30 days for a maximum term of 180 days and increase the rate to 9%. In February 2016, DN B.V., a subsidiary of Dolphin, entered into an option contract with IFISA whereby Dolphin is granted the right, but not the obligation to acquire 92,665,925 shares of IDBD held by IFISA at a share price of NIS 1.64 plus an annual interest of 8.5%. The exercise date for the option extends for two years. All transactions are carried out at arm’s length. On June 2014, the Company – through its subsidiary, Real Estate Investment Group IV LP – renewed a credit facility granted by IFISA, a company indirectly controlled by Eduardo Sergio Elsztain, for a total amount of 1.4 million shares of Hersha Hospitality Trust. The transaction was agreed upon for a term of 30 days, which could be renewed for up to 360 days; the facility was priced at Libor (3 months) + 50 bp. This credit facility was cancelled after the end of fiscal year 2014 in order to continuesell the remaining amount of Hersha. As of June 30, 2016 we had current a credit line with IFISA of shares and/or GDRs of IRSA for up to 3,500,000 GDRs. The expiration of this line will operate in June 2017 and bears an annual fixed rate of 6%.
On June 18, 2012 we entered a credit facility agreement with IFISA, pursuant to which we agreed to lend to IFISA up to US$ 6.0 million, which will mature on November 24, 2012, then it was extended until November 24, 2015, at an interest rate equivalent to LIBOR (12 months) + 300 bp., date in which was canceled. Investment in mutual funds of BACS Administradora de Activos S.A. S.G.F.C.I. We invest from time to time our liquid fund in mutual funds managed by BACS Administradora de Activos S.A. S.G.F.C.I., which is a subsidiary of Banco Hipotecario, among other entities. Credit line with IRSA Propiedades Comerciales S.A. On July 5, 2016, IRSA renewed and increased the policycredit line with IRSA Propiedades Comerciales S.A. for up to US$ 120 million, in which IRSA Propiedades Comerciales S.A. is the lender and IRSA is, directly or indirectly, the borrower. The loan bears annual interest at a rate of generating9% and matures on June 24, 2017. As of the most efficient distributiondate of corporate resources amongthis annual report, the different areas, this agreement may be extendedtotal amount due by IRSA to other areas shared by us with IRSA Commercial Properties and IRSA.amounts to US$45 million. In spite
Farmland Lease Agreement San Bernardo We lease a farmland located in the Province of Córdoba, from San Bernardo de Córdoba S.A. (formerly known as Isaac Elsztain e Hijos S.C.A.), pursuant to a lease agreement effective as of August 2015. The leased farmland has an extension of 12,600 hectares. The rent to be paid is the equivalent in Pesos of 3,5kg of beef per hectare. The beef price will be set, taking into account the price per kilo of beef quoted on Mercado de Hacienda de Liniers, the previous week of the payment date. In addition, the parties have agreed in a productivity prize of 15% of the weight that the cattle achieve above we, IRSA and IRSA Commercial Properties continue240.000kg. This prize will be payable on September 2016. This lease contemplates the possibility of extension up to be independent in regard to the executiontwo periods per year. Currently being agreed conditions of their business and strategic decisions. Costs and benefits are allocated on the basis of operating efficiency and fairness without pursuing economic benefits for the companies. its extension. Legal Services We hire legal services from Estudio Zang, Bergel & Viñes, in which Saúl Zang is a partner. Mr. Zang is a member of our Board of Directors and that of our related companies. During the fiscal years ended June 30, 2016, 2015 and 2014 and 2013, we and our subsidiaries paid Zang, Bergel & Viñes Abogados an aggregate amount of approximately Ps.4.7Ps.6 million, Ps.4.2Ps.5 million and Ps.3.3Ps.4 million, respectively, as payment for legal services. Certain of our directors are partners of Zang, Bergel & Viñes Abogados. Purchase of agrochemicals from Adama Adama is a company specialized in agrochemicals, particularly used in farming, and is a worldwide leader in active ingredients used in agricultural production. CRESUD, in the normal course of its business, acquires agrochemical products and/or hires services from Adama. On August 6, 2008, Agrology (merged with Cresud) entered into a securities loanJuly 17, 2016, DIC reported that it had signed an agreement with IFISA,ChemChina to sell 40% of Adama Agricultural Solutions Ltd.’s shares, indirectly controlled by virtue if which Agrology granted 1,275,022 Global Depositary Shares, representing 10 common shares with a face value of Ps.1.0 per shareIDBD through DIC. For more information see “Recent Developments.” Hospitality Services We and our related parties hire, in certain occasions, hotel services and lease conference rooms for events to Nuevas Fronteras S.A. and Hoteles Argentinos S.A., subsidiaries of IRSA. This loan does not imply
Purchase and sale of goods and/or service hiring In the transfernormal course of any voting or economic rights related to the Global Depositary Shares which will be held by Agrology. With regards to the voting rights, the parties agreed that we will grant a power of attorney to IFISAits business and with the respective voting instructions. With regards to dividends, IFISA will transfer the funds to Agrology. This loan will accrue interest at a monthly rate equivalent to 3-month LIBOR, plus 150 basis points. It will be effectiveaim of making resources more efficient, we, or our related parties, including our parent company, in certain occasions purchases and/or hires services which later sells and/or recovers for 30 days and may be renewed for up to a maximum of 360 days. Later on, IFISA returned 21,080 Global Depositary Shares to Agrology S.A., representing 10 common shares, with a face value of Ps.1.0 per share.companies or other related parties, based upon their actual utilization. Borrowings In the normal course of its activities, we enter into diverse loan agreements or credit facilities between our subsidiaries and/or other related parties. These borrowings generally accrue interests at market rates. Financial and service operations We work with several financial entities in Argentina for operations including, but not limited to, credit, investment, purchase and sale of securities and financial derivatives. Such entities include Banco Hipotecario S.A. and its subsidiaries. Furthermore, on July 30, 2009, AgrologyBanco Hipotecario S.A. made an offer to IFISA, which was accepted, to extend the agreed due date of the loan for 360 days, modifying the amount of Global Depositary Shares of IRSA grantedand BACS Banco de Crédito y Securitización S.A. usually act as underwriters in loan from 1,275,022 to 1,253,942 million which are free of encumbrances and are freely available to Agrology S.A. On July 25, 2010, Agrology made a new offer, which was also accepted by IFISA, to extend the agreed due date of the loan for an additional 360 days. On September 8, 2010, Agrology S.A.Capital Market transactions. In addition, we have entered into a new loan agreementagreements with IFISA which granted 800,000 additional Global Depositary Shares of IRSA, under the same terms and conditions as the previous loan.BHSA, who provides collection services for our Shopping Centers. On July 20, 2011, Agrology made a new offer, which was also accepted byFebruary 10, 2015, Dolphin, sold 71,388,470 IDBD shares to IFISA, to extend the agreed due date of the original loan for an additional 360 days. The companies agreed that the credit can be taken completely or partially at any moment and that IFISA can ask for the Global Depositary Sharesamount of IRSA or ordinary equity, and to lower the spread over Libor rate from 150 bps to 50 bps. On September 1, 2011, Agrology made a new offer, to extend the “800,000 additional Global Depositary Shares of IRSA” agreed due date of the loan for an additional 360 days. The offer to IFISA included the possibility for them to take the credit completely or partially at any moment, to ask either for the Global Depositary Shares of IRSA or for ordinary equity, and to lower the spread over Libor rate from 150 bps to 50 bps. On September 3, 2011, IFISA accepted the September 1, 2011 offer. On April 20, 2012, we entered into a securities loan agreement with IFISA, by virtueUS$ 25.6 million, US$ 4.0 million of which we granted 2,000,022 Global Depositary Shares, representing 10 common shares withwere paid upon execution and the remaining balance of US$ 21.6 million were financed for a face value of Ps.1.0 per share of IRSA. On August 22, 2012, we agreed with IFISA that due to our merger with Agrology, the three above-mentioned agreements will be combined into one agreement between IFISA and us.
On July 15, 2013, we signed a renewable credit line with Inversiones Financieras del Sur S.A. ("IFISA"), in which the company is the lender and IFISA the borrower. The credit line consists in the sumterm of up to 4,053,942 ADRs of IRSA, of which 3,334,517 have already been lended.360 days and priced at Libor 1M (one month) + 3%. On June 26, 2015May 9, 2016, the parties agreed to extend the credit line and the maturity of this credit facility agreement was set toexpiration date for 30 days withas from execution of the possibilityaddenda, to be automatically renewable every 30 days for a maximum term of 180 days, and increasing the rate to 9% since February 10, 2016.
On May 31, 2015, IRSA, through Dolphin, sold to IFISA 46 million of warrants Series 4 for a total amount of NIS 0.46 million (equivalent to US$ 0.12 million at the time of the transaction), provided IFISA agreed to exercise them fully when Dolphin were so required by IDBD. On July 28, 2015, Dolphin granted a loan to IFISA for an amount of US$ 7.2 million, due in July 2016, which accrues interest at Libor 1M (one month) + 3%. On May 9, the parties agreed to extend itthe expiration date to upJune 8, 2016, to 365be automatically renewable every 30 days for a maximum term of 180 days, and increased the rate to 9%. On October 9, 2015, IRSA granted a loan in the amount of US$ 40 million to IFISA. The term of the loan is one year calculated from the disbursement and will bear interest at an applicable annuala rate of 3 month3% + Libor + 50 bp.1M, to be determined monthly. On October 9, 2016, the parties agreed to extend the expiration date to be automatically renewable every 30 days for a maximum term of 180 days and increase the rate to 9%. In February 2016, DN B.V., a subsidiary of Dolphin, entered into an option contract with IFISA whereby Dolphin is granted the right, but not the obligation to acquire 92,665,925 shares of IDBD held by IFISA at a share price of NIS 1.64 plus an annual interest of 8.5%. The exercise date for the option extends for two years. Credit facility IFISA-Cresud.
All transactions are carried out at arm’s length. On June 25,2014, the Company – through its subsidiary, Real Estate Investment Group IV LP – renewed a credit facility granted by IFISA, a company indirectly controlled by Eduardo Sergio Elsztain, for a total amount of 1.4 million shares of Hersha Hospitality Trust. The transaction was agreed upon for a term of 30 days, which could be renewed for up to 360 days; the facility was priced at Libor (3 months) + 50 bp. This credit facility was cancelled after the end of fiscal year 2014 in order to sell the remaining amount of Hersha. As of June 30, 2016 we had current a credit line with IFISA of shares and/or GDRs of IRSA for up to 3,500,000 GDRs. The expiration of this line will operate in June 2017 and bears an annual fixed rate of 6%.
On June 18, 2012 we entered a credit facility agreement with IFISA, pursuant to which we agreed to lend to IFISA up to US$ 6.0 million, for a term of 180 days, at an annual interest rate of 7.75%. Onwhich will mature on November 24, 2012, this agreementthen it was renegotiated and as a result extended for another 365 days,until November 24, 2015, at an annual interest rate equivalent to LIBOR (12 months) + 300 bp., date in which was canceled. Investment in mutual funds of 5.5%. BACS Administradora de Activos S.A. S.G.F.C.I. We invest from time to time our liquid fund in mutual funds managed by BACS Administradora de Activos S.A. S.G.F.C.I., which is a subsidiary of Banco Hipotecario, among other entities. Credit line with IRSA Propiedades Comerciales S.A. On November 22, 2013 the parties agreed to extendJuly 5, 2016, IRSA renewed and increased the credit line with IRSA Propiedades Comerciales S.A. for another 365 days and decided to set a rate equivalent to 1 year Libor + 300 bp. On December 18, 2014 the parties agreed to extend the credit line in the sum up to US$6.000.000 for another 365 days starting upon 120 million, in which IRSA Propiedades Comerciales S.A. is the termination oflender and IRSA is, directly or indirectly, the current agreement operating on November 25, 2015. In this negotiation, the parties agreed to setborrower. The loan bears annual interest at a rate of 1 year Libor + 3% (annual interest rate).
Credit facility IRSA – Cresud
In September 2011, we entered into a credit facility agreement with IRSA, pursuant to which IRSA agreed to lend us up to US$25 million for a term of 90 days, , at an annual interest rate of 7.75%. In May 2012, we entered into a credit facility agreement with IRSA, pursuant to which IRSA agreed to lend us up to US$7 million for a term of 180 days, at an annual interest rate of 7.5%.As of9% and matures on June 30, 2015, all amounts due under this line of credit were cancelled.
Loan agreement between FYO and us24, 2017.
As of December, 2013, we entered intothe date of this annual report, the total amount due by IRSA to IRSA Commercial Properties amounts to US$45 million. Farmland Lease Agreement San Bernardo We lease a credit facility agreement with FYO,farmland located in the Province of Córdoba, from San Bernardo de Córdoba S.A. (formerly known as Isaac Elsztain e Hijos S.C.A.), pursuant to a lease agreement effective as of August 2015. The leased farmland has an extension of 12,600 hectares. The rent to be paid is the equivalent in Pesos of 3,5kg of beef per hectare. The beef price will be set, taking into account the price per kilo of beef quoted on Mercado de Hacienda de Liniers, the previous week of the payment date. In addition, the parties have agreed in a productivity prize of 15% of the weight that the cattle achieve above 240.000kg. This prize will be payable on September 2016. This lease contemplates the possibility of extension up to two periods per year. Currently being agreed conditions of its extension. Consulting Agreement Pursuant to the terms of the Consulting Agreement with Consultores Asset Management effective as of November 7, 1994, Consultores Asset Management provides us advisory services on matters related to capital investments in all aspects of the agricultural business. One of our shareholders and the Chairman of our board of directors is the owner of 85% of the capital stock of Consultores Asset Management and our First Vice Chairman of the board of directors holds the remaining 15% of its capital stock. Pursuant to the terms of the Consulting Agreement, Consultores Asset Management provides us with the following services: | • | advises with respect to the investment of our capital in all aspects of agricultural operations, including, among others, sales, marketing, distribution, financing, investments, technology and business proposals; | | • | acts on our behalf in such transactions, negotiating the prices, conditions, and other terms of each operation; and | | • | gives advice regarding securities investments with respect to such operations. |
The Consulting Agreement expressly provides that Consultores Asset Management may not advise us with respect to transactions that are entirely related to real estate. Under the Consulting Agreement, we pay Consultores Asset Management for its services, an annual fee equal to 10% of our annual after-tax net income. During fiscal year ended June 30, 2016 and 2014 there were not charges for consulting agreement fees. During fiscal year ended June 30, 2015 the charge for consulting agreement fees was of Ps. 11.4 million. The Consulting Agreement is subject to termination by either party upon not less than 60 days prior written notice. If we terminate the Consulting Agreement without cause, we will be liable to Consultores Asset Management for twice the average of the amounts of the management fee paid to Consultores Asset Management for the two fiscal years prior to such termination. Sale of Advertising Space in Media We and our related parties usually execute agreements with third parties by which we agreedsell/acquire, for their future use rights to lend FYO up to US$4.3 million, which may be payableadvertise in Pesos at an exchangemedia (TV, radio, newspapers, etc.) that are later used in complianceadvertising campaigns. Purchase and sale of goods and/or service hiring In the normal course of its business and with the Communication “A” 3500aim of the Central Bank. The term of this loan agreement extends up to August, 2014, with an interest rate of 3.0%. This loan was fully cancelled.making resources more efficient, we, or our related parties, including our parent company, in certain occasions purchases and/or hires services which later sells and/or recovers for companies or other related parties, based upon their actual utilization. Loan agreement between IRSA and usInvestment in Dolphin Fund Ltd.
As of November, 2013, we entered into a loan agreement in favor of IRSA for a total amount of approximately US$ 26.5 million, which may be payable in Pesos at an exchange in compliance with the Communication “A” 3500 of the Central Bank. The termdate of this loan agreementannual report, we have invested approximately US$544 million in Dolphin, through our subsidiaries. Dolphin Fund Ltd, is set on 6 months, with an interest rateinvestment fund incorporated under the laws of 1.5%. This loan was fully cancelled. Line of Credit with Cyrsa
On August 27 2012, Cyrsa granted IRSA and Cyrela, its shareholders (50% each)Bermuda, whose investment manager is Consultores Venture Capital Uruguay S.A., individual credit line for a maximum amount of Ps. 190 million, each, maturing in February 2017. Daily interest accrued on each disbursed amount will be based on the Badlar Privada interest Rate.
Sale of Cresca S.A. to BrasilAgro Companhia Brasileira de Propriedades Agricolas S.A.
In December 2013, we sold to BrasilAgro Companhia Brasileira de Propriedes Agrícolas S.A.company controlled indirectly by our indirect interest in Cresca S.A. which amounted to 50% of its capital stock, for a total amount of US$18.5 million. CrescaChairman, Eduardo S. Elsztain. Dolphin Netherlands is a company owning 141,931 hectaressubsidiary of rural landDolphin Fund Ltd, incorporated in Paraguay, of which approximately 71,000the Netherlands. Such investments were arable atmade in order to carry out the moment of the transaction but less than 12,000 hectares of which were cultivated when acquired and approximately 71,000 hectares were protected by environmental regulation. In addition, Cresca has an option granted by Carlos Casado for the purchase of 100,000 additional hectares locatedinvestment in Paraguay. As of the closing date, Brasilagro made an initial payment of US$ 5 million and the remaining balance plus accrued interest was collected on December 2014.
Loan agreements with Banco Hipotecario
As of June 30, 2015 we have loans from Banco Hipotecario for a total amount of approximately Ps.29.8 million, which include credit facility for production investment (not includes bank overdraft), with an average interest rate of 17.3%, forIDB Development Corp. For more information please see “LiquidityItem 4. Information on the Company – A. History and Capital Resources Exchange Rates and Exchange Controls - Indebtedness”. We believe that eachdevelopment of these loans was made by Banco Hipotecario in the ordinary courseCompany – “Investment of its consumer credit business, is of a type generally made available by Banco Hipotecario to the public and was made on market terms.IDB Development Corporation Ltd. (IDBD).
Master agreement for US Dollar-denominated forward transactions with Banco Hipotecario
We entered into a master agreement for the performance of Dollar-denominated forward transactions with Banco Hipotecario. This master agreement provides that the parties may carry out this type of transactions by fixing a certain forward price (“the Agreed Price”). Such transactions are settled in cash by paying the difference between the Agreed Price and the quoted price of the US Dollar on the settlement date. As of June 30, 2015 we have not derivative financial instruments from Banco Hipotecario.
Sale of “La Adela” Farmfarmland "La Adela" In July 2014 we sold to our subsidiary IRSA the “La Adela” farm, with an area approximately 1,058 hectares, located in the District of Luján, Province of Buenos Aires, for a total amount of Ps. 210 million. Given its degree of development and closeness to the City of Buenos Aires, this farm has a high urbanistic potential; therefore, the purpose of selling it to IRSA is for it to launch a new real estate development. Agreement for the lease or use of spaces in Shopping Centers
IRSA Commercial Properties regularly lease different spaces in its Shopping Centers (stores, stands, storage units and/or advertising spaces) to related parties such as Tarshop or Banco Hipotecario, among others.
The lease agreements generally have a three year term with monthly payments, percentages of participation over the maintenance fees and over the collective promotion fund, and the payment of expenses and taxes. The monthly payment is indexed on an annual basis. The agreements also establish the payment of a right of admission and a special payment regarding the collective promotion fund which is paid at the beginning of each agreement.
The right to use the stands located in the shopping centers generally is given by use permit agreements or, in particular cases, comodato agreements. In the first case, the agreements have a term that might be of one or two years, establish monthly payments and a down payment used for the payment of maintenance fees and the applicable charges to the collective promotion fund and the applicable taxes and charges in proportion to the leased space. In the comodato agreements, the gratuitous bailee is in charge of any maintenance fees and expenses related to the stand, but has not any monthly lease payment or any fee related to the collective promotion fund.
Regarding the storage units, these agreements are accessory to the lease of stores or the use of the stands, so as a consequence, their term matches the term of the main agreement. These agreements only establish the payment of a monthly lease, which is indexed on an annual basis, and does not include the payment of fees to the collective promotion fund or maintenance fees.
Moreover, IRSA Commercial Properties and our controlling companies offer different spaces located in its shopping centers for advertising of different businesses, brands and/or products (non-traditional advertising). The taxes generated due to the execution of these agreements are generally burden by the counterparty.
Transfer of tax credits During the fiscal year ended June 30, 2015, We and Sociedad Anónima Carnes Pampeanas S.A (a company controlled by us),S.A. (subsidiary of Cresud) and Cresud, assigned uponcredits to IRSA Propiedades Comerciales S.A., Ps.1.63 millionCP and Ps.30.4 million, respectively,other related parties corresponding to Value Added Taxvalue added tax export refunds related to such company’scompanies’ business activity.
Related party Agreement with PAMSA
On December 1, 2006, IRSA Commercial Properties entered into an administration agreement with PAMSA. (IRSA commercial Properties control 80% of PAMSA). The management fee set forth in such agreement amounts to 12% of revenues from common maintenance expenses and collective promotion fund, plus 12% of capital expenditures and maintenance cost of the Dot and adjoining buildings.
Acquisition of investment properties from IRSA and intercompany loan between IRSA Commercial Properties and IRSA.
On December 22, 2014, IRSA transferred to IRSA Commercial Properties, 83,789 m2 of its premium office portfolio including the República building, Bouchard 710, Della Paolera 265, Intercontinental Plaza and Suipacha 652 and the “Intercontinental II” plot of land in order to consolidate a vehicle which main corporate purpose is to develop and operate commercial properties in Argentina.
The total amount of the transaction was US$308 million, US$61.6 million of which have already been paid, and the balance of US$246.4 million has been financed at an annual effective rate of 8.5% maturing on January 23, 2017 and July 13, 2020.
Convertible Notes of IRSA Commercial Properties.
IRSA Commercial Properties’ Convertible Notes originally matured on July 19, 2006. But a meeting of noteholders resolved to extend the maturity date of such Convertible Notes through July 19, 2014, the remaining terms and conditions remain unchanged. The Convertible Notes accrue interest (payable semi-annually) at a fixed annual rate of 10% and are convertible, at any time at the option of the holder, into shares of IRSA Commercial Properties’ common stock, par value of Ps. 0.10. The conversion rate per U.S. Dollar is the lesser of Ps. 3.08642 and the result obtained from dividing the exchange rate in effect at the conversion date by the par value of IRSA Commercial Properties’ common shares.
On December 31, 2012, the outstanding principal amount of such convertible notes was US$ 31.8 million, and IRSA owned US$ 31.7 millon principal amount of such convertible note on such date. On January 14, 2013, IRSA accepted the repurchase offer submitted by IRSA Commercial Properties for an amount face value of US$ 31.7 million, for a total price of US$ 35.4 million. On January 15, 2013, IRSA Commercial Properties paid to us the amount of Ps. 175.2 million.
IRSA Commercial Properties’ Convertible Notes expired on July 19, 2014.
Debt assignment
During the month of December 2014, IRSA Commercial Properties acquired the obligations arising from a line of credit for US$13.1 million that Panamerican Mall S.A. had granted to, IRSA´s subsidiary, Tyrus. As a result, we assumed the obligations of Tyrus as debtor in such line of credit.
Investment in mutual funds of BACS Administradora de Activos S.A. S.G.F.C.I.
We invest from time to time our liquid fund in mutual funds administrated by BACS Administradora de Activos S.A. S.G.F.C.I., which is a subsidiary of Banco Hipotecario. As of June 30, 2015, our investments in the mutual funds administrated by BACS Administradora de Activos S.A. S.G.F.C.I. amounted to Ps.28.7 million.
Investment in Dolphin Fund Ltd.
As of the date of this annual report, we have invested approximately US$300 million in Dolphin Fund Ltd., trough our subsidiaries. Dolphin Fund Ltd, is an investment fund incorporated under the laws of Bermuda, whose investment manager is Consultores Venture Capital Uruguay S.A., a company controlled indirectly by our Chairman, Eduardo S. Elsztain. Such investments were made in order to carry out the investment in IDB Development Corp. For more information please see Item 4. Information on the Company – A. History and development of the Company – “Investment of IDB Development Corporation Ltd. (IDBD).
Line of Credit granted to IRSA
In November 2012, IRSA Commercial Properties and IRSA entered into an agreement by which IRSA Commercial Properties granted a line of credit for up to US$ 14.5 million for a period of one year at a rate of 5.5% to IRSA. In November 2013, the line of credit was renewed and in April 2014, was extended for up to a total amount of US$ 20 million.
On June 25, 2014, IRSA Commercial Properties has extended the Line of Credit, for up to US$ 60 million, due June 2015, at the rate of Libor 1 year + 3.0%. Additionally, the parties involved in the agreement were modified, including IRSA Commercial Properties and any of its subsidiaries as lenders and as loan takers Tyrus and IRSA. As of the date of this annual report the total amount granted from IRSA Commercial Properties to IRSA amounts to US$49.5 million.
Consequently, as of June 30, 2014, disbursements were made from ERSA to Tyrus of US$ 2.6 million, from IRSA Commercial Properties to Tyrus of US$ 10.6 million, and from Pamsa to Tyrus of US$ 10.2 million. As of June 30, 2015 the amounts described above were cancelled.
Line of Credit Inversiones Financieras del Sur S.A.
In June 2014, IRSA, through its subsidiary, Real Estate Investment Group IV LP, renewed a line of credit with Inversiones Financieras del Sur S.A. for an amount of up to 1.4 million shares of Hersha Hospitality Trust. The transaction was set for 30 days renewable for up to 360 calendar days and with an annual interest rate of Libor 3 months plus 50 basic points. This line of credit was cancelled during fiscal year 2015.
Loan agreements with Inversiones Financieras del Sur S.A.
On July 28, 2015, IRSA´s subsidiary Dolphin granted a loan to IFISA, a company indirectly controlled by Eduardo Sergio Elsztain for an aggregate amount of US$7.2 million, which will mature on July 2016 and will accrue interests at a rate of f Libor 1M + 3%.
In addition, on October 9, 2015, though IRSA's subsidiary Reig V, IRSA granted another loan for an aggregate amount of US$40 million to IFISA, which will mature on October 2016 and will accrue interests at a rate of f Libor 1M + 3%.
Shares and Convertible Notes of BACS Banco de Crédito y Securitización S.A.
IRSA through Tyrus, subscribed a purchase-sale agreement of shares of BACS Banco de Crédito y Securitización S.A., representing an interest of 6.125%. The transaction amounts to US$ 1.35 million. This operation is yet to be approved by the Banco Central de la República Argentina, according to regulations in force. The advance payment related to this transaction is disclosed in “Trade and other receivables”.
On June 17, 2015, IRSA subscribed Convertible Notes, issued by BACS Banco de Crédito y Securitización S.A. for a nominal value of 100,000,000, which are convertible into common stock.
This section is not applicable. See Item 18 for our Audited Consolidated Financial Statements. Legal or arbitration proceedings We are not engaged in any material litigation or arbitration and no material litigation or claim is known to us to be pending or threatened against us, other than those described below. Litigation with Exagrind S.A. Cresud filed a lawsuit through Inversiones Ganaderas S.A. (IGSA) (a former subsidiary merged with the Company) on claims for damages and losses produced by a fire in one of the Company's farms, “San Rafael” farm, which is close to Exagrind’s property, Tali Sumaj, in the Province of Catamarca, Argentina. The fire took place on September 6, 2000. Exagrind claimed an amount of Ps. 2.9 million at that date. The extraordinary appeal to the High Court of Justice of the Province of Catamarca, questioning the resolution that ended the term to respond the case, arguing that at that moment, the period was not completed, was favorably received. Therefore, Cresud finally responded the case and showed proofs. As of the consolidated financial statements date, the parties have been notified that the term to submit allegations has started to run. In March 2007, the court ordered an inhibition of assets which was subsequently lifted. This decision was lifted in June 2007 and Tali Sumaj farm on attachment has been accepted in replacement. Exagrind S.A. requested that the measure be extended with an attachment of bank accounts; this ruling has been challenged and to date the accounts have not been attached. In June, 2010, the Company sold the farm to a third party. Since the litigation is still pending, the bond posted in favor of the buyer remains effective as security for the obligations undertaken The Company has recorded a provision amounting to Ps. 1.5 million, which is included within “Labor, legal and other claims”. In addition, the Company is involved in several legal proceedings, including tax, labor, civil, administrative and other matters for which the Company has not established provisions based on the information assessed to date. In the opinion of management, the ultimate disposition of any threatened or pending matters, either individually or collectively, will not have a material adverse effect on the consolidated financial position, liquidity and results of operations of the Company. For ease of presentation, the Company has categorized these matters between those arising out of the Company’sour agricultural and agro-industrial activities and those arising out of the Company’sour investment and development properties business activities. IRSA’s and IRSA Commercial Properties’ legal or arbitration proceedings Operations Center in Argentina Set forth below is a description of certain material legal proceedings to which IRSA and IRSA Commercial Properties are a party. IRSA and IRSA Commercial Properties are not engaged in any other material litigation or arbitration and no other material litigation or claim is known to IRSA to be pending or threatened against it or its subsidiaries. Nevertheless, IRSA may be involved in other litigation from time to time in the ordinary course of business. Acquisition of the building known as Ex- Escuela Gobernador Vicente de Olmos (City of Córdoba)
On November 20, 2006, the Company, through IRSA Commercial Properties, acquired through a public bidding the building known as Ex-Escuela Gobernador Vicente de Olmos located in the city of Córdoba for the amount of Ps. 32,522. As explained in Note 29, this property is affected to a concession contract.
After the title deed was made, the government of the province of Córdoba declared the property to be of public use and subject to partial expropriation in order to be used exclusively for the Libertador San Martin theatre.
IRSA Commercial Properties has answered a complaint in an action and to challenge the law that declared such public interest on unconstitutional grounds. In the alternative, it has challenged the appraisal made by the plaintiff and, additionally, it has claimed damages not included in the appraisal and resulting immediately and directly from expropriation.
At June 30, 2015, the property is still operated by the Company and is recorded under Investment properties.
Puerto Retiro On November 18, 1997, in connection with our acquisition of our subsidiary Inversora Bolívar, we indirectly acquired 35.2% of the capital stock of Puerto Retiro. Inversora Bolívar had purchased such common shares of Puerto Retiro from Redona Investments Ltd. N.V. in 1996. In 1999, we, through Inversora Bolívar, increased our interest in Puerto Retiro to 50.0% of its capital stock. On April 18, 2000, Puerto Retiro was served notice of a filing made by the Argentine government, through the Ministry of Defense, seeking to extend the bankruptcy of Indarsa to the Company. Upon filing of the complaint, the bankruptcy court issued an order restraining the ability of Puerto Retiro to dispose of, in any manner, the real property it had purchased in 1993 from Tandanor. Puerto Retiro appealed the restraining order which was confirmed by the Court on December 14, 2000. In 1991, Indarsa had purchased 90% of Tandanor, a former goverment-ownedgovernment-owned company, which owned a piece of land near Puerto Madero of approximately 8 hectares, divided into two parcels: Planta 1 and 2. After the purchase of Tandanor by Indarsa, in June 1993, Tandanor sold “Planta 1” to Puerto Retiro, for a sum of US$18 million pursuant to a valuation performed by J.L. Ramos, a well-known real estate brokerage firm in Argentina. Indarsa failed to pay to the Argentine government the price for its purchase of the stock of Tandanor, and as a result the Ministry of Defense requested the bankruptcy of Indarsa. Since the only asset of Indarsa was its holding in Tandanor, the Argentine government is seeking to extend Indarsa’s bankruptcy to other companies or individuals which, according to its view, acted as a single economic group. In particular, the Argentine government has requested the extension of Indarsa’s bankruptcy to Puerto Retiro which acquired Planta 1 from Tandanor. The deadline for producing evidence in relation to these legal proceedings has expired. The parties have submitted their closing arguments and are awaiting a final judgment. However, the judge has delayed his decision until a final judgment in the criminal proceedings against the former Defense Minister and former directors of Indarsa has been delivered. It should be noticed, regarding the abovementioned criminal procedure, that on February 23, 2011 it was resolved to declare its expiration, and to dismiss certain defendants. However, this resolution is not final because it was appealed. We cannot give you any assurance that we will prevail in this proceeding, and if the plaintiff’s claim is upheld by the courts, all of the assets of Puerto Retiro would likely be used to pay Indarsa’s debts and our investment in Puerto Retiro, would be lost. As of June 30, 2014,2016, we had not established any reserve with respect of this contingency.
Tandanor has filed a civil action against Puerto Retiro and the people charged in the referred criminal case looking forward to be reimbursed from all the losses which have arose upon the fraud committed. On 7th March,2015March 7, 2015 Puerto Retiro respondresponded filing certain preliminary objections, such as prescription among others. Toor limitation, lack of information to respond the date, this proceeding has not been resolved.lawsuit, lack of legitimacy (active and passive). On July 12, 2016 Puerto Retiro was legally notified of the decision adopted by the Tribunal Oral Federal N° 5 related to the preliminary objections above mentioned. Two of them were rejected –lack of information and lack of legitimacy (passive). We filed an appeal with regard to the rejection of these two objections. But, on the other hand, the other two objections will be studied at the moment of deliver the sentence, which is an important step in order to obtain a favorable decision. Legal issues with the City Hall of Neuquén In June 2001, Shopping Neuquén requested that the City of Neuquén allow it to transfer certain parcels of land to third parties so that each participant in the commercial development to be constructed would be able to build on its own land. Neuquén´sn’s Executive Branch previously rejected this request under Executive Branch Decree No.N° 1437/2002 which also established the expiration of the rights arising from Ordinance 5178 due to not building the shopping center in time, including the loss of the land and of any improvement and expenses incurred. As a result, Shopping Neuquén had no right to claim indemnity charges and annulled its buy-sell land contracts. Shopping Neuquén submitted a written appeal to this decision on January 21, 2003. It also sought permission to submit a revised schedule of time terms for the construction of the shopping center, taking into account the economic situation at that time and including reasonable short and medium term projections. Neuquén´sn’s Executive Branch rejected this request in their Executive Branch Decree 585/2003. Consequently, on June 25, 2003, Shopping Neuquén filed an “Administrative Procedural Action” with the High Court of Neuquén requesting, among other things, the annulment of Executive Branch Decrees 1,437/2002 and 585/2003 issued by the City Executive Branch. On December 21, 2004, the High Court of Neuquén communicated its decision that the administrative procedural action that Shopping Neuquén had filed against the City of Neuquén had expired. Shopping Neuquén filed an extraordinary appeal for the case to be sent to the Argentine Supreme Court. On December 13, 2006, while the case was under study in the Argentine Supreme Court, Shopping Neuquén signed an agreement with both the City and the Province of Neuquén that put an end to the lawsuit between them and stipulated a new timetable for construction of the commercial and housing enterprises (the “Agreement”). Also, Shopping Neuquén was permitted to transfer certain parcels to third parties so that each participant in the commercial development to be constructed would be able to build on its own land, with the exception of the land in which the shopping center would be constructed. The Legislative Council of the City of Neuquén duly ratified the Agreement. The City Executive Branch promulgated the ordinance issued on February 12, 2007. The only pending issue was the determination of the City of Neuquén attorneys’ fees that were to be borne by Shopping Neuquén. As the date of their annual report Shopping Neuquén came to an agreement orand paid all of the City´sCity’s lawyers, but one, with whom the amount of theincluding pending fees are being contested in Court.court.
Shopping Neuquén finished the construction and opened the shopping center in March, 2015, obtaining also all necessary provincial and city authorizations for it. Arcos del Gourmet In December 2011, IRSA Commercial Properties started to develop, through our subsidiary Arcos, the “Arcos” project located in the neighborhood of Palermo, City of Buenos Aires. On December 10, 2013, Administrative and Tax Contentious Court of Appeal of the City of Buenos Aires ratified an injunction that suspends the opening of the shopping center on the grounds that it has failed to obtain certain government permits. Despite the fact that the construction has all government permits in place, IRSA Commercial Properties has filed an appeal against the decision and have requested that the injunction be lifted, with favorable expectations.lifted. In such sense, on April 10, 2014, the government of the City of Buenos Aires issued a new environmental compliance certificate. TheIRSA Commercial Properties obtained a favorable decision on this case based on procedural grounds. Notwithstanding, the plaintiff appealed this decision, and the file has beenwas placed on the Court of Appeal sinceon September 23, 2014. On the other hand, there is another judicial process currently being heard entitled “Federación de Comercio e Industria de la Ciudad de Buenos Aires y Otros c/ Gobierno de la Ciudad Autónoma de Buenos Aires s/ Amparo”. On August 29, 2014 the lower court rendered a decision rejecting the case.Thiscase. This resolution was appealed but afterwards, was confirmed in December, 2014. Therefore, on December 18th, 2014, the “Arcos” Project was opened to the public, operating normally nowadays. Notwithstanding, the plaintiff appeared before the Superior Court of the City of Buenos Aires to request the review of the case based on the constitutional’s matters involved. The Court has not rendered a decision yet. Furthermore,Moreover, on May 18,18th, 2015 IRSA Commercial Properties was notified of the revocation of the Agreement for the Reorganization for Use and Exploitation Nº AF000261 (“Contrato de Readecuación de Concesión de Uso y Explotación NºAF000261”AF000261” issued by the Agency for the Management of the State Assets (“Agencia de Administración de Bienes del Estado”Estado” or “AABE”) through Resolution Nº 170/2014. This Resolution was not enacted due to breach of contract by Arcos del Gourmet nor it has implied up to the date of this annual report the interruption of the economic exploitation neither of the functioning of the shopping center that IRSA Commercial Properties operate there. IRSA Commercial Properties has filed the proper administrative and judicial motions to revoke the Resolution and as of the date of this annual report these proceedings are ongoing.
Notwithstanding the aforesaid, the “Federación de Comercio e Industria de la Ciudad de Buenos Aires” has filed a motion for the unhold of the injuction. On March 17, 2015 this request was rejected. As a consequence, it has filed a complaint appeal, process that has not been ended yet. Other Litigation As of July 5, 2006, the Administración Federal de Ingresos Públicos (“AFIP”) filed a preliminary injunction with the Federal Court for Administrative Proceedings against IRSA Commercial Properties for an aggregate amount of Ps.3.7 million, plus an added amount, provisionally estimated, of Ps.0.9 million for legal fees and interest. The main dispute is about the income tax due for admission rights. In the first instance, AFIP pleaded for a general restraining order. On November 29, 2006, the Federal Court issued an order substituting such restraining order for an attachment on the parcel of land located in Caballito neighborhood, City of Buenos Aires, where IRSA Commercial Properties is planning to develop a shopping center. As of June 30, 2011, under court proceedings, the building was subject to a legal attachment for Ps. 36.8 million. On December 12, 2012, the legal attachment was lifted and accredited in the file concerned in February 2013. After we sold the Edificio Costeros, dique II, on November 20, 2009, we requested an opinion to the Argentine Antitrust Authority as to whether it was necessary to report this transaction. The Argentine Antitrust Authoriry advise us that it was required to notify the transaction. We challenged this decision, but it was confirmed. On December 5, 2011, we notified the transaction and on April 30, 2013 the transaction was appovedapproved by the Argentine Antitrust Authority by Resolution 38.No. 38 as a result of that this legal proceeding was concluded. On January 15, 2007 we were notified of two claims filed against us before the Argentine Antitrust Authority, one by a private individual and the other one by the licensee of the shopping center, both opposing the acquisition from the province of Córdoba of a property known as Ex-Escuela Gobernador Vicente de Olmos. On February 1, 2007 we responded the claims. On June 26, 2007, the Argentine Antitrust Authority notified us that it has initiated a summary proceeding to determine whether the completion of the transaction breaches the Antitrust Law. As of the date of this filing the result of this proceeding has not been determined.
On December 3, 2009, IRSA Commercial Properties filed a request for the Argentine Antitrust Authority’s opinion regarding IRSA Commercial Properties’ acquisition of common shares of Arcos del Gourmet S.A. The Argentine Antitrust Authority advised the parties that the transaction has to be notified. On December, 2010 the transaction was filed with the Argentine Antitrust Authority. As of the date of this annual report, the decision of the Argentine Antitrust Authority is still pending. On April 11, 2011, Quality Invest requested the Argentine Antitrust Authority opinion regarding Quality’s acquisition Property of a warehouse owned by Nobleza Piccardo S.A.I.C. y F. located in San Martín, Province of Buenos Aires. The Argentine Antitrust Authority stated that there was an obligation to notify the situation, but Quality Invest filed an appeal against this decision. Subsequently, the Court of Appeals confirmed the Argentine Antitrust Authorities'Authorities’ decision regarding the obligation to notify and, therefore, on February 23, 2012, the transaction was filed. As of the date of this annual report, the Argentine Antitrust Authority is analyzing this decision. On Augustaugust 23, 2011, IRSA Commercial Properties notified the Argentine Antitrust Authority the direct and indirect adquisitionacquisition of common shares of NPSF, the transaction involved the direct acquisition of 33.33% of NPSF and 16.66% through our controlled vehicle Torodur S.A. As of the date of this annual report the transaction is being analyzed by the Argentine Antitrust Authority. On June 16, 2012, we sold to Cabaña Don Francisco S.A. certain Costeros Dique IV´sIV’s functional units, to be used for office space, and complementary units to be used for parking. In addition, we assigned upon the purchaser all rights and interests arising from lease agreements involving the conveyed units. As a result, an advisory opinion was requested from the Argentine Antitrust Authority as to the need to report such transaction. The Argentine Antitrust Authority resolved that the transaction was exempt from report on May 21, 2014.2014, so this legal process was finished. On December 7, 2012, we filed with the Argentine Antitrust Authority the adquisition of EHSA, which has the beneficial ownership of 50% of La Rural S.A That company runs an exposition center known as Predio Ferial de Palermo. As of the date of this annual report, the Argentine Antitrust Authority is analyzing the transaction. Through the issuance of Resolution No.N°. 16,521 dated February 17, 2011 the CNV commenced a summary proceeding against the members of IRSA´sIRSA’s board of directors and its supervisory committee members (all of them at that time, including among others Mr. Eduardo S. Elsztain), alleging certain formal errors in the Inventory and Balance Sheet Book, specifically the failure by the Company to comply with certain formalities in the presentation of a table included in the Memoria (Annual Report)(annual report); arising from an investigation carried out by the CNV in October 2010. Applicable law requires that the corrections of any errors in the Annual Reportannual report include a legend identifying each error and the way in which it was corrected, including insertion of the holographic signature from the chairman of the board. In this case, we first corrected the mistake and after the request from the CNV included the legend and the holographic signature of the chairman, required by the relevant formalities. IRSA´s response to the CNV’s allegations containing the arguments for the defense was filed in March 2011 and the first hearing was held in May 2011. In April, 2013, the CNV imposed (as a result of the aforementioned alleged charge) a fine on the members of IRSA´s board of directors and its supervisory committee members. The fine imposed by the CNV amounts to Ps. 270,000 equivalent to US$ 49,632 and it was imposed to IRSA and the members of the board together. The amount of the fine demonstrates the immaterial nature of the alleged violations. Even though the fine was paid, in April 2013, IRSA appealed such resolution, which is still ongoing in Court Room No.N°. IV of the National Chamber of Appeals in Federal Administrative Procedures (Cámara Nacional de Apelaciones en lo Contencioso Administrativo Federal). For more information see “Item. 3(d) Risk Factors—Risk related to our Business—Our business is subject to extensive regulation and additional regulations may be imposed in the future”. DividendsClass actions in the United States
On May 9, 2016, a putative shareholder class action was filed in the United States District Court for the Eastern District of Pennsylvania against IRSA, certain of its officers and dividenddirectors, and Cresud. The complaint asserts violations of the federal securities laws on behalf of persons that purchased IRSA’s American Depositary Receipts between November 3, 2014 and December 30, 2015, and alleges that defendants made materially false and misleading statements and omissions relating to IRSA’s investment in IDBD. More specifically, the complaint alleges that IRSA’s disclosures during that time period misrepresented and failed to disclose that (1) IDBD’s US$6.7 billion net debt should have been consolidated in IRSA’s financial statements and (2) as so consolidated, IRSA’s debt would violate the covenants specified in IRSA’s Global Notes Indenture. This class action was transferred to the United States District Court for the Southern District of New York on July 14, 2016, and referred to Judge Vernon S. Broderick on July 19, 2016. A putative class representative has filed a motion to be appointed as lead plaintiff and to appoint class counsel. Such motion remains pending before the Court. Defendants believe that there is no merit to the claims alleged and intend to vigorously defend these actions. Nevertheless, no assurance can be given that we will be successful in defending these claims. Operations Center in Israel Litigation against IDB In recent years there has been an increasing trend of filing derivative and class action claims in the area of corporate and securities laws in Israel. While taking into account such issues and the financial position of IDB and its holding structure, claims in considerable amounts may be filed against IDB, including in connection with its financial position and cash flows, with offerings that it makes, and transactions that were carried out or not completed, including with regards to the contentions and claims of the controlling shareholders that took place in IDB. Arbitration proceedings relating to the obtainment of control in IDBD. On May 7, 2014, a transaction was agreed whereby the Company, acting indirectly through Dolphin, acquired jointly with ETH (a non-related company established under the laws of the State of Israel, which was presented to Dolphin as a company controlled by Mordechay Ben Moshé), an aggregate number of 106.6 million common shares in IDBD, representing 53.30% of its stock capital, under the scope of the debt restructuring Arrangement of IDBH, IDBD's parent company, with its creditors. Under the terms of the agreement entered into between Dolphin and ETH (the “Shareholders’ Agreement”), Dolphin acquired 50% interest in this investment, and ETH acquired the remaining 50%. The initial total investment amount was NIS 950, equivalent to approximately US$ 272 at the exchange rate prevailing on that date. On May 28, 2015, ETH launched the BMBY mechanism provided in the Shareholders’ Agreement (clause which establishes that each party of the Shareholders' Agreement may offer to the counterparty to acquire (or sell, as the case may be), the shares it holds in IDBD at a fixed price). In addition, ETH further added that the purchaser thereunder required to assume all obligations of seller.
On June 10 and 11, 2015, Dolphin gave notice to ETH of its intention to buy all the shares of IDBD held by ETH. After certain aspects of the offer were resolved through an arbitration process brought by Dolphin and ETH, on September 24, 2015, the competent arbitrator resolved that: (i) Dolphin and IFISA (related company to the Company) were entitled to act as buyers in the BMBY process, and ETH had to sell all of the IDBD shares held by it (92,665,925 shares) at a price of NIS 1.64 per share; (ii) The buyer had to fulfill all of the commitments included in the Arrangement, including the commitment to carry out Tender Offers; (iii) The buyer had to pledge in favor of the Arrangement Trustees the shares that were previously pledged in favor of the Arrangement Trustees by the seller. On October 11, 2015, the BMBY process concluded, and IFISA acquired all IDBD's shares of stock held by ETH. Consequently, the Shareholders' Agreement ceased and members of IDBD's Board of Directors representing ETH submitted their irrevocable resignation to the Board, therefore Dolphin was hence empowered to appoint the new members to the Board. Additionally, on the same date, Dolphin pledged additional shares as collateral to secure compliance with the IDBD stock purchase agreement, thereby increasing the number of pledged shares to 64,067,710. As a consequence, the Company gained control of IDBD and started to consolidate financial statements as from that date. In addition to the competent arbitrator’s decision issued on September 24, 2015, ETH and Dolphin still have counterclaims of different kinds which are subject to such arbitration proceeding. As of the filing date of this Annual Report, the proceeding is still being heard. Litigation against Clal Insurance and its subsidiaries This exposure is especially high in the areas of long-term savings and long-term health insurance in which Clal Insurance operates, inter alia, in view of the fact that in these areas the policies were issued decades ago, while at present, after significant changes in the regulatory environment and against the background of developments in legal precedent and the Israeli authority’s position, the same policies may be interpreted differently, retrospectively, and may be subjected to different interpretation standards than those that were customary at the time that the policies were made. Moreover, in these areas the policies are valid for dozens of years and, therefore, there is a risk that in those cases in which a customer’s claim is accepted and a new interpretation is given to the policy, the future profitability of Clal Insurance in respect of the existing policy portfolio will also be affected. This is in addition to the possible compensation that could be given to the customers due to past activity. Alongside these aspects, during 2015 amendments were made to reflect a significant reform in the field of approving an insurance program which allows the Israeli authority, under certain conditions, to order the insurer to stop introducing an insurance policy or to order an insurer to make a change to an insurance policy, even with regard to policies that have already been marketed by the insurer. It is not possible to foresee to what extent insurers are exposed to claims in connection with the provisions of the policy, the manner of implementing the Israeli authority’s powers pursuant to the insurance policy reform and its implications, which may be raised, inter alia, by means of the procedural mechanism provided in the Israeli Class Actions Law. There are claims that have been recognized as class action suits, claims for which there are pending motions to have them certified as class action suits, and other claims which are immaterial. These claims include mainly claims of improper actions, not in accordance with laws, licenses or breaches of agreements with customers or performance of tort damages toward customers (especially misleading a customer, or a negligent misrepresentation), causing damage, either monetary or non-monetary, to customers. A significant amount of these claims also include claims of charging excessive premiums and payment of lower than called for insurance compensation. In addition, there are pending motions to have claims certified as derivative actions. Sale of shares of Clal Insurance Enterprises Holdings Ltd On August 21, 2013, on the background of concerns about the ability of the previous controlling shareholders of IDBD (Dankner group) to meet the requirements to have control over an insurance company, set forth by the Commissioner of Capital Markets, Insurance and Savings (which is a division within the Ministry of Finance of Israel; the "Commissioner"), the Commissioner required that IDBD transfer 51% of the shares in Clal to Mr. Moshe Terry ("the Trustee") and to grant the Trustee an irrevocable power of attorney with regard to the voting of such shares in Clal. On November 27, 2013, and as part of the debt arrangement In IDB Holdings Corporation Ltd., the Commissioner set forth an outline to enable the change of control in IDBD (as part of the debt arrangement), whereby the Commissioner would not view such change of control as being a breach of the Supervision of Financial Services (Insurance) Law, 1981 (the "Insurance Law"), subject to certain conditions, including terms whereby if until 31.12.2014 a control permit for Clal Insurance will not be obtained for the new controlling shareholders in IDBD, or, that an agreement for the sale of the controlling stake in Clal Insurance will not have been signed, then the Trustee will be authorized to sell the Clal Insurance shares that the Trustee holds. Both groups that had submitted proposals in the debt arrangement process (including the Dolphin group) approved such outline. On December 30, 2014, the Commissioner sent an additional letter setting a term by which IDBD’s control over and equity interests in Clal were to be sold and giving directions as to the Trustee’s continuity in office, among other aspects. The sale arrangement outlined in the letter involves IDBD’s and the Trustee’s interests in the sale process under different options and timeframes. As of June 30, 2016, the current sale arrangement involved the sale of the interest, as per the following detail and by the following dates: a. IDBD would have to sell at least 5% of its equity interest in Clal per each 4 month period beginning as of January 7, 2016. b. During each of the subsequent four-month periods, IDBD would have to sell at least an additional 5% of its equity interest in Clal. c. If IDBD sells more than 5% of its equity interest in Clal in any given four-month period, the percentage in excess of the required 5% would be offset against the percentage required in the following 4 month period.
IDBD would be required to continue to sell all of its holdings in Clal apart for such holdings that do not require a permit pursuant to applicable law, or, alternatively, such holdings that IDBD will be permitted to hold pursuant to applicable law. In case IDBD does not fulfill its obligation in the manner described in the above paragraph the Trustee would be entitled to act upon the specified arrangement in lieu of IDBD, pursuant to all powers that had been vested under the representations of the trust letter. The consideration for the sale would be transferred to IDBD, with the expenses incurred in the sale process to be solely borne by IDBD. On May 7 ,2016 the Commissioner requested that the Trustee act to sell 5% of the shares of Clal Insurance according to the December 30, 2014 letter. IDBD has objected to such sale, and notified the Trustee that in case the Trustee shall sell shares then IDBD will consider claiming against the Trustee for damages. As a result, on July 13, 2016 the Trustee applied to the Tel Aviv District Court to obtain instruction on whether and how to sell such 5% of Clal Insurance shares. On May 26, 2016 IDBD's board decided to commence a competitive process for the sale of a control stake in Clal. Following such decision, on July 1, 2016 IDBD entered into an agreement with JP Morgan to serve as an investment bank on behalf of IDBD for the sale of a control stake in Clal.
In addition, in June 2015, an application for a Israeli court to approve the commencement of a class action against IDBD, IDBD’s directors (some of which are also our directors), Dolphin Netherlands B.V. and C.A.A Extra Holdings Ltd. was filed by individuals who argue that IDBD’s controlling shareholders and board of directors acted in concert to frustrate the sale of shares of Clal Insurance Enterprises Holdings Ltd (or Clal) to JT Capital Fund. The applicants argue that this caused them material damages as under the terms of the debt restructuring of IDBD’s holding company, IDB Holdings Corporation Ltd. with its creditors, they would have been entitled to receive a larger payment had the above mentioned sale been consummated. Furthermore, they allege that the 2014 and 2015 rights offerings of IDBD discriminated against the minority shareholders. On March 21, 2016, the respondents filed a motion to dismiss this class action application. On June 2, 2016, the Court partially accepted this motion, and ordered the applicants to file an amended class action application that would include only the arguments and remedies with respect to the said Clal transaction. On August 2, 2016, the respondents filed a motion to appeal (regarding the decision not to dismiss the arguments concerning the Clal transaction) and, on August 14, 2016, the applicants filed an appeal (regarding the decision to dismiss the arguments concerning the rights offering) both before the Israeli Supreme Court. As of the date of this annual report, the Supreme Court has decided that the motion to appeal and the appeal will be heard jointly, and has ordered stay of the proceedings.
Litigation against Cellcom and its subsidiaries In the normal course of business, claims have been filed against Cellcom by its customers. These are mostly motions for approval of class actions, primarily concerning allegations of illegal collection of funds, unlawful conduct or breach of license, or a breach of agreements with customers, causing monetary and non-monetary damage to them. In addition, in the normal course of business, claims have been filed against Cellcom in issues related to the environment, including claims regarding non-ionizing radiation from cellular handsets and claims in respect of sites belonging to Cellcom. These are mostly motions for approval of class actions, relating to allegations of unlawful conduct or breach of license causing monetary and non-monetary damage (including claims for future damages). Litigation against Adama and its subsidiaries In the normal course of business, Adama is involved in various legal claims involving environmental claims for smell and noise hazards relating to its site. claims by employees, subcontractors, suppliers, authorities and others which concern, inter alia, claims for breaches of provisions of the law regarding termination of employment and obligatory payments to employees, claims for breach of contract and patent infringement, and compulsory payments to authorities. Litigation against Shufersal In the normal course of business, legal claims were filed against Shufersal by its customers. These are mostly motions for certification of class actions, which mainly concern claims of charging money unlawfully, acting contrary to the law or a license, or a breach of the agreements with customers, causing financial and non-financial loss to them. In addition in the normal course of business, legal claims were filed with the courts against Shufersal by employees, subcontractors, suppliers, authorities and others, which relate mainly to claims of breaches of the provisions of the law in relation to the termination of workers’ employment and compulsory payments to employees, claims of breaches of contract and compulsory payments to authorities.
Dividends policy Pursuant to Argentine law, the distribution and payment of dividends to shareholders is valid only if they result from net and realized earnings of the company pursuant to annual audited financial statements approved by the shareholders. The approval, amount and payment of dividends are subject to the approval by our shareholders at our annual ordinary shareholders meeting. The approval of dividends requires the affirmative vote of a majority of the shares entitled to vote at the meeting. In accordance with Argentine law and our by-laws, net and realized profits for each fiscal year are allocated as follows: | • | 5% of such net profits is allocated to our legal reserve, until such reserve amounts to 20% of our capital stock; | | • | a certain amount determined at a shareholders’ meeting is allocated to compensation of our directors and the members of our supervisory committee; and | | • | additional amounts are allocated for the payment of dividends or to optional reserve funds, or to establish reserves for whatever other purpose our shareholders determine. |
The following table shows the dividend payout ratio and the amount of dividends paid on each fully paid common share for the mentioned years. Amounts in Pesos are presented in historical, non-inflation adjusted Pesos as of the respective payment dates and refers to our unconsolidated dividends. | Year | | Total Dividend | | | Dividend per Common Share (1) | | Total Dividend | Dividend per Common Share (1) | | | | (in million of Ps.) | | | (in Ps.) | | (in million of Ps.) | (in Ps.) | | 2010 | | | - | | | | - | | - | - | | 2011 | | | 69.0 | | | | 0.138 | | 69.0 | 0.138 | | 2012 | | | 63.8 | | | | 0.149 | | 63.8 | 0.149 | | 2013 | | | 120.0 | | | | 0.242 | | 120.0 | 0.242 | | 2014 | | | 120.0 | | | | 0.242 | | 120.0 | 0.242 | | 2015 | | | - | | | | - | | - | - | | 2016 | | - | - |
(1) (1) | Corresponds to per share payments. To calculate the dividend paid per ADS, the payment per share should be multiplied by ten. Amounts in Pesos are presented in historical Pesos as of the respective payment date. See “Exchange Controls”. |
Corresponds to per share payments. To calculate the dividend paid per ADS, the payment per share should be multiplied by ten. Amounts in Pesos are presented in historical Pesos as of the respective payment date. See “Exchange Controls”. From December 12, 2014, as resolved at the Shareholders’ Meeting held on October 31, 2014 and reconvened on November 14, 2014, the ratable distribution among the shareholders of 5,565,479 treasury shares was approved, representing 0.0114% per share and 1.1406% of the outstanding capital stock of 487,928,660.Future dividends with respect to our common shares, if any, will depend on, among other things, our results of operations, cash requirements, financial condition, contractual restrictions, business opportunities, provisions of applicable law and other factors that our shareholders at a general shareholders’ meeting may deem relevant. As a result, we cannot give you any assurance that we will pay any dividends at any time in the future. Annual Shareholders’ Meeting OnOur annual shareholders’ meeting will be held on October 30, 2015, was held the Ordinary and Extraordinary Shareholders’ Meeting in which was approved the following items:
• | Consideration of documents contemplated in section 234, paragraph 1, of the Argentine Companies Law No. 19,550 for the fiscal year ended June 30, 2015. |
• | Reinstatement of the “Legal Reserve” account. Treatment of allocation of the “Additional Paid-In Capital” account. Consideration of Reclassification of Reserves. |
• | Consideration of Board of Directors’ performance. |
• | Consideration of Supervisory Committee’s performance. |
• | Consideration of compensation payable to the Board of Directors for $14,310,941 (total compensation) for the fiscal year ended June 30, 2015. Delegation on the Board of Directors of powers to approve the Audit Committee’s budget. |
• | Consideration of compensation payable to the Supervisory Committee for the fiscal year ended June 30, 2015. |
• | Determination of the number and election of Regular Directors and Alternate Directors, as applicable. |
• | Appointment of Regular and Alternate Members of the Supervisory Committee. |
• | Appointment of Certifying Accountant for the next fiscal year and determination of its compensation. Delegation of powers. |
• | Updating of report on Shared Services Agreement. |
• | Treatment of amounts paid as personal assets tax levied on the shareholders. |
• | Consideration of increase of the amount of the Global Note Program for a maximum outstanding amount of up to US$ 300,000,000 (three hundred million dollars) (or its equivalent in other currencies) the creation of which was approved by the shareholders’ meeting dated October 31, 2012 (the “Program”) by an additional amount of up to US$ 200,000,000 (two hundred million Dollars) (or its equivalent in other currencies). |
• | Consideration of: (i) delegation to the Board of Directors of the broadest powers to implement the increase and/or reduction in the Program amount; (ii) renewal of the Board of Directors’ powers to (a) approve, enter into, deliver and/or execute any agreement, contract, document, instrument and/or security related to the Program and/or the issuance of the various series and/or tranches of notes thereunder; (b) apply for and process before the Argentine Securities Commission the authorization for the public offering of such notes; (c) if applicable, apply for and process before any authorized securities exchange or market of Argentina and/or abroad the authorization for listing and trading of such notes; and (d) carry out any acts, dealings, filings and/or proceedings related to the Program and/or the increase in its amount and/or the issuance of the various series and/or tranches of notes thereunder; and (iii) authorization for the Board of Directors to subdelegate the powers and authorizations referred to in items (i) and (ii) above to one or more of its members. |
In addition it was approved to adjourn the Ordinary and Extraordinary Shareholders’ Meeting to November 26, 2015,31, 2016, in order to consider and approve, among others, the following items:
• | Consideration of net income for the fiscal year ended June 30, 2015 for $114,009 thousand. Consideration of payment of a cash dividend for up to $88,100 thousand. |
• | Consideration of allocationmatters: (i) consideration of documents contemplated in section 234, paragraph 1, of the Argentine Companies Law No. 19,550 for the fiscal year ended June 30, 2016; (ii) Consideration of the result of the fiscal year ended June 30, 2016 which resulted in a loss for the amount of Ps. 1,401,856,585; (iii) consideration of Board of Directors’ performance; (iv) consideration of Supervisory Committee’s performance; (v) consideration of compensation payable to the Board of Directors for Ps. 18,985,218 (total compensation) for the fiscal year ended June 30, 2016; (vi) consideration of compensation payable to the Supervisory Committee for the fiscal year ended June 30, 2016; (vii) consideration of the appointment of Regular Directors and Alternate Directors, as applicable; (viii) appointment of Regular and Alternate Members of the Supervisory Committee; (ix) appointment of Certifying Accountant for the next fiscal year and determination of its compensation. Delegation of powers; (x) updating of report on Shared Services Agreement; (xi) treatment of amounts paid as personal assets tax levied on the shareholders; (xii) consideration of the renewal of the delegation to the Board of Directors of the broadest powers to establish the time and currency of issuance, and other terms and conditions of the issuance of notes under the global note program, for up to US$300.000.000 currently in force in accordance with approved by the shareholders' meeting dated October 31, 2012, and November 14, 2014 and its extension for an additional amount of US$200.000.000 in accordance with approved by the shareholders' meeting dated October 30, 2015; (xiii) consideration of granting indemnities to Messrs. Directors, Syndics and Managers who work or have worked in the Company in a manner subsidiary to D&O policies; (xiv) consideration of special financial merger statement of AGRO MANAGERS S.A .; special separate financial merger statements of Cresud and consolidated financial merger statements of Cresud with AGRO MANAGERS S.A. as June 30, 2016 as well as the reports of the supervisory committee and the auditor. Consideration of the preliminary merger by absorption with AGRO MANAGERS S.A. and other related documentation. Authorizations and delegations. Appointment of proxy to grant definitive agreements and other formalities; (xv) consideration of the distribution of treasury shares. Delegation of powers. |
The following summary provides information concerning our share capital and briefly describes all material provisions of our bylaws and the Argentine Corporation Law. Stock Exchanges in which our securities are listed Our common shares are listed on the BASE under the trading symbol “CRES” and on NASDAQ under the trading symbol “CRESY.” As of June 30, 20152016 our outstanding capital stock consisted of 501,642,804 common shares, Ps.1.00 par value per share. As of that date of this annual report: (1) we had no other shares of any class or series issued and outstanding; and (2) there are no outstanding convertible notes to acquire our shares. Our common shares have one vote per share. All outstanding shares are validly issued, fully paid and non assessable. As of June 30, 2015,2016, there were approximately 1,7414,782 holders of our common shares.
Price history of our stock on the Buenos Aires Stock Exchange and NASDAQ Our common shares are traded in Argentina on the BASE, under the trading symbol “CRES.” Since March 1997, our ADRs, each presenting 10 common shares, have been listed on the NASDAQ under the trading symbol “CRESY.” The Bank of New York is the depositary with respect to the ADRs. The table below shows the high and low daily closing prices of our common shares in Pesos and the quarterly trading volume of our common shares on the BASE for the first quarter of 20092012 through October 22, 2015.28, 2016. The table below also shows the high and low daily closing prices of our ADRs in U.S. Dollars and the quarterly trading volume of our ADRs on the NASDAQ. Each ADR represents ten common shares.
| | | BASE | | | NASDAQ | | | | | | | Share Volume | | | Price Per Share (Ps.) | | | ADS Volume | | | US$ per ADS | | | | | | | | High | | | Low | | | High | | | Low | | | | | | | Fiscal Year 2012 | | | | | | | | | | | | | | | | | | | | | | | | | | 1st Quarter | | | 812,635 | | | | 7.03 | | | | 5.30 | | | | 5,037,399 | | | | 16.49 | | | | 10.70 | | 812,635 | 7.03 | 5.30 | 5,037,399 | 16.49 | 10.70 | | 2nd Quarter | | | 644,629 | | | | 5.95 | | | | 4.68 | | | | 5,890,807 | | | | 12.18 | | | | 10.15 | | 644,629 | 5.95 | 4.68 | 5,890,807 | 12.18 | 10.15 | | 3rd Quarter | | | 609,305 | | | | 6.90 | | | | 5.33 | | | | 10,708,801 | | | | 13.38 | | | | 11.20 | | 609,305 | 6.90 | 5.33 | 10,708,801 | 13.38 | 11.20 | | 4th Quarter | | | 1,328,881 | | | | 6.45 | | | | 4.45 | | | | 15,006,469 | | | | 12.06 | | | | 6.86 | | 1,328,881 | 6.45 | 4.45 | 15,006,469 | 12.06 | 6.86 | | Annual | | | 3,395,450 | | | | 7.03 | | | | 4.45 | | | | 36,643,476 | | | | 16.49 | | | | 6.86 | | 3,395,450 | 7.03 | 4.45 | 36,643,476 | 16.49 | 6.86 | | Fiscal Year 2013 | | | | | | | | | | | | | | | | | | | | | | | | | | | | | | | | 1st Quarter | | | 1,324,543 | | | | 5.87 | | | | 4.83 | | | | 6,183,866 | | | | 8.80 | | | | 7.35 | | 1,324,543 | 5.87 | 4.83 | 6,183,866 | 8.80 | 7.35 | | 2nd Quarter | | | 644,473 | | | | 5.80 | | | | 4.95 | | | | 3,520,607 | | | | 8.48 | | | | 7.79 | | 644,473 | 5.80 | 4.95 | 3,520,607 | 8.48 | 7.79 | | 3rd Quarter | | | 1,376,099 | | | | 8.10 | | | | 5.70 | | | | 6,124,332 | | | | 9.66 | | | | 8.29 | | 1,376,099 | 8.10 | 5.70 | 6,124,332 | 9.66 | 8.29 | | 4th Quarter | | | 1,299,335 | | | | 8.30 | | | | 5.75 | | | | 5,946,018 | | | | 9.61 | | | | 7.04 | | 1,299,335 | 8.30 | 5.75 | 5,946,018 | 9.61 | 7.04 | | Annual | | | 4,644,450 | | | | 8.30 | | | | 4.83 | | | | 21,774,823 | | | | 9.66 | | | | 7.04 | | 4,644,450 | 8.30 | 4.83 | 21,774,823 | 9.66 | 7.04 | | Fiscal Year 2014 | | | | | | | | | | | | | | | | | | | | | | | | | | | | | | | | 1st Quarter | | | 2,178,046 | | | | 8.30 | | | | 5.70 | | | | 5,589,075 | | | | 8.73 | | | | 8.73 | | 2,178,046 | 8.30 | 5.70 | 5,589,075 | 8.73 | 7.15 | | 2nd Quarter | | | 2,188,815 | | | | 11.10 | | | | 7.95 | | | | 5,872,993 | | | | 11.51 | | | | 11.51 | | 2,188,815 | 11.10 | 7.95 | 5,872,993 | 11.51 | 8.56 | | 3rd Quarter | | | 1,022,808 | | | | 11.20 | | | | 8.60 | | | | 3,422,480 | | | | 9.87 | | | | 9.87 | | 1,022,808 | 11.20 | 8.60 | 3,422,480 | 9.87 | 8.37 | | 4th Quarter | | | 2,459,599 | | | | 14.15 | | | | 9.16 | | | | 6,982,485 | | | | 12.90 | | | | 12.90 | | 2,459,599 | 14.15 | 9.16 | 6,982,485 | 12.90 | 9.01 | | Annual | | | 7,849,268 | | | | 14.15 | | | | 5.70 | | | | 21,867,033 | | | | 12.90 | | | | 8.73 | | 7,849,268 | 14.15 | 5.70 | 21,867,033 | 12.90 | 7.15 | | Fiscal Year 2015 | | | | | | | | | | | | | | | | | | | | | | | | | | | | | | | | 1st Quarter | | | 1,688,010 | | | | 16.45 | | | | 12.00 | | | | 5,524,817 | | | | 14.08 | | | | 10.58 | | 1,688,010 | 16.45 | 12.00 | 5,524,817 | 14.08 | 10.58 | | 2nd Quarter | | | 2,259,425 | | | | 15.80 | | | | 10.80 | | | | 3,634,128 | | | | 12.04 | | | | 9.18 | | 2,259,425 | 15.80 | 10.80 | 3,634,128 | 12.04 | 9.18 | | 3rd Quarter | | | 1,331,000 | | | | 17.90 | | | | 12.00 | | | | 7,600,906 | | | | 14.83 | | | | 9.92 | | 1,331,000 | 17.90 | 12.00 | 7,600,906 | 14.83 | 9.92 | | 4th Quarter | | | 1,483,096 | | | | 16.90 | | | | 15.00 | | | | 5,736,086 | | | | 13.98 | | | | 12.50 | | 1,483,096 | 16.90 | 15.00 | 5,736,086 | 13.98 | 12.50 | | Annual | | | 6,761,531 | | | | 17.90 | | | | 10.80 | | | | 22,495,937 | | | | 14.83 | | | | 9.18 | | 6,761,531 | 17.90 | 10.80 | 22,495,937 | 14.83 | 9.18 | | Fiscal Year 2016 | | | | | | | | | | | | | | | | | | | | | | | | | | | | | | | | 1st Quarter | | | 728,810 | | | | 17.50 | | | | 12.10 | | | | 4,299,192 | | | | 13.14 | | | | 9.33 | | 728,810 | 17.50 | 12.10 | 4,299,192 | 13.14 | 9.33 | | July 2015 | | | 231,643 | | | | 17.50 | | | | 12.10 | | | | 1,256,840 | | | | 13.14 | | | | 11.24 | | | | August 2015 | | | 188,699 | | | | 15.50 | | | | 13.00 | | | | 1,806,420 | | | | 11.67 | | | | 9.49 | | | | September 2015 | | | 308,468 | | | | 14.55 | | | | 12.10 | | | | 1,235,932 | | | | 10.41 | | | | 9.33 | | | | October, 2015 | | | 1,295,996 | | | | 17.50 | | | | 13.00 | | | | 1,435,169 | | | | 12.78 | | | | 9.64 | | | | November 12, 2015 | | | 775,333 | | | | 19.70 | | | | 17.80 | | | | 1,100,206 | | | | 13.51 | | | | 12.71 | | | | 2nd Quarter | | 6,416,350 | 19.70 | 13.00 | 8,291,480 | 13.51 | 9.64 | | 3rd Quarter | | 3,388,664 | 18.70 | 12.70 | 5,390,231 | 12.63 | 9.22 | | 4th Quarter | | 51,785,675 | 21.30 | 14.15 | 12,876,863 | 14.13 | 9.88 | | Annual | | 62,319,499 | 21.30 | 12.10 | 30,857,766 | 14.13 | 9.22 | | Fiscal Year 2017 | | | | | | | | | 1st Quarter | | 48,775,713 | 27.50 | 22.00 | 8,216,910 | 18.00 | 14.62 | | July 2016 | | 25,327,616 | 26.35 | 22.00 | 4,118,010 | 17.24 | 14.62 | | August 2016 | | 11,900,312 | 27.00 | 24.20 | 2,263,618 | 17.75 | 16.19 | | September 2016 | | 11,547,785 | 27.50 | 24.70 | 1,835,282 | 18.00 | 16.32 | | October 28, 2016 | | 9,553,286 | 27.70 | 26.2 | 1,807,161 | 18.05 | 17.31 |
Source: Bloomberg As of June 30, 20152016 the outstanding ADRs represented 46,292,70241,803,722 ADSs (equivalent to 462,927,021418,037,220 common shares or 92.3%83.33% of our total common stock capital). This item is not applicable. Argentine Securities Markets In December 2012 the Argentine government has enacted a new Capital Markets Law, No. 26,831, which sets out the rules to govern capital markets, its players, and the securities traded therein subject to the CNV regulation and monitoring. On September 5, 2013, the CNV has enacted the Standards of the Comisión Nacional de Valores,CNV Rules, by virtue of which it regulates the new provisions of the Capital Markets Law for issuers of securities, in regard to the initial public offering and reporting duties. Almost all the provisions of the former Executive branch Decree No. 677/2011 (the “Transparency Decree”) have been incorporated in the Capital MarketMarkets Law and in the Standards of the Comisión Nacional de Valores.CNV Rules. The Capital MarketMarkets Law provides rules and provisions guided by the following goals and principles: · | Promoting the participation of small investors, union associations, industry groups and trade associations, professional associations and all public savings entities in the capital market, particularly encouraging mechanisms designed to promote domestic savings and channel such funds towards the development of production; |
· Promoting the participation of small investors, union associations, industry groups and trade associations, professional associations and all public savings entities in the capital market, particularly encouraging mechanisms designed to promote domestic savings and channel such funds towards the development of production; · | Strengthening mechanisms for the protection of and prevention of abuses against small investors for the protection of consumers’ rights; |
· Strengthening mechanisms for the protection of and prevention of abuses against small investors for the protection of consumers’ rights; · | Promoting access of small and medium-sized companies to the capital market; |
· Promoting access of small and medium-sized companies to the capital market; · | Fostering the creation of a federally integrated capital market through mechanisms designed to achieve an interconnection of computer systems from different trading markets, with the use of state-of-the-art technology; |
· Fostering the creation of a federally integrated capital market through mechanisms designed to achieve an interconnection of computer systems from different trading markets, with the use of state-of-the-art technology; · | Encouraging simpler trading procedures available to users to attain greater liquidity and competitiveness in order to provide the most favorable conditions for the implementation of transactions. |
· Encouraging simpler trading procedures available to users to attain greater liquidity and competitiveness in order to provide the most favorable conditions for the implementation of transactions.
The CNV is a self-administered agency of the Argentine Government with jurisdiction covering the territory of Argentina, governed by the provisions contained inof the Capital MarketMarkets Law, and the Standards of the CNV Rules among other related statutory regulations. The relationship of the CNV and the Argentine Executive is maintained through the Ministerio de Economía y Finanzas Públicas (Ministry of Economy and Public Finance), which shall hear any appeals filed against decisions made by the CNV, notwithstanding any other legal actions and remedies contemplated in the Capital MarketMarkets Law. The CNV supervises and regulates the authorized markets in which the securities and the collective investment products are traded, the corporations authorized in the public offer regime, and all the other players authorized to operate in the public offer regime, as the registered agents, the trading agents, the financial advisors, the underwriters and distributors, the brokers, the settlement and clearing agents, the managers of collective investment products, the custodians of collective investment products, the collective depositories, and the risk rating agencies, among others. Argentine institutional investors and insurance companies are regulated by separate government agencies, whereas financial institutions are regulated mainly by the Argentine Central Bank. Before offering securities to the public in Argentina, an issuer must meet certain requirements established by the CNV with regard to the issuer’s assets, operating history and management. Only securities approved for a public offering by the CNV may be listed on a stock exchange. However, CNV approval does not imply any kind of certification as to the quality of the securities or the solvency of the issuer, even though issuers of listed securities are required to file unaudited quarterly financial statements and audited annual financial statements in accordance with IFRS, as issued by the IASB (excluding financial institutions under the supervision of the Argentine Central Bank, insurance companies under the supervision of the Insurance Superintendence and medium and small enterprises) and various other periodic reports with the CNV and the stock exchange on which their securities are listed, as well as to report to the CNV and the relevant stock exchange any event related to the issuer and its shareholders that may affect materially the value of the securities traded. In Argentina, debt and equity securities traded on an exchange must, unless otherwise instructed by their shareholders, be deposited with a Central Securities Depository, in Argentina. Currently the only depositary authorized to act in accordance with the Capital MarketMarkets Law and Standards of the CNV Rules, is Caja de Valores S.A. a corporation owned by the BASE,BCBA, the Mercado de Valores de Buenos Aires (the “MERVAL”)MVBA and certain provincial exchange, and provides central depositary facilities, as well as acting as a clearinghouse for securities trading and as a transfer and paying agent for securities transactions. Before the enactment of the Capital Markets Law and the Standards of the CNV Rules there were 12 securities exchanges in Argentina, which were located in the City of Buenos Aires, Bahía Blanca, Chaco, Corrientes, Córdoba, La Plata, La Rioja, Mendoza, Rosario, Salta, Santa Fe, and Tucumán. Six of these exchanges (the BASE, Rosario, Córdoba, La Rioja, Mendoza, and Santa Fe) had affiliated stock markets in accordance with the requirements of Law No. 17,811 which was derogated by the Capital MaretsMarkets Law. Pursuant to the new Capital Markets Law, the CNV has authorized 96 stock markets since September 2014, which are: Mercado Abierto Electrónico S.A. (“MAE”), Mercado a Término de Buenos Aires S.A., Mercado a Término de Rosario S.A., Mercado de Valores de Buenos Aires S.A.,MVBA, Mercado de Valores de Córdoba S.A., y Mercado de Valores de Mendoza S.A., Mercado de Valores de Rosario S.A., Mercado de Valores del Litoral S.A. and Mercado FederalArgentino de Valores S.A. The principal exchange for the Argentine securities market under the previous legislation was the BASE.BCBA. Under the new Capital Markets Law the BASEBCBA has been authorized to operate as qualified entity, under the appointment of the MERVAL.MVBA. As a result of the foregoing, we estimate that the MERVAL will beMVBA is currently the principal exchange market in Argentina in which the securities will beare listed. The MERVALMVBA is a corporation consisting of 134183 shareholders who used to be the sole and exclusive individuals or entities authorized to trade in the BASE,MVBA, either as principals or agents, before Capital Markets Law became into force. Since then, all agents registered and authorized to act as intermediaries by the CNV will be able to trade in any securities exchange, including the BASEBCBA as long as they obtain a membership of such stock exchange, not applying any longer the requirements to be a shareholder of such stock exchange. The securities that may be listed on the MERVALMVBA are: Stocks, Corporate Bonds, Convertible Corporate Bonds, Close-ended Investment Funds, Financial Trust, Indexes, Derivativesstocks, corporate bonds, convertible corporate bonds, close-ended investment funds, financial trust, indexes, derivatives and Public Bonds.public bonds. The MERVALMVBA is legally qualified for admission, suspension, and delisting of securities according to its own rules approved by the CNV. Furthermore, the MERVAL works very closely with the CNV in surveillance activities. Another relevant exchange of the securities market in Argentina is the Mercado Abierto Electrónico S.A. (“MAE”),MAE, which was recently authorized to operate by the CNV under the new regulations of the Capital Markets Law.regulations. The MAE works as an electronic platform to process Over the Counter transactions. It is an electronic exchange where both government securities and corporate bonds are traded through spot and forward contracts. MAE brokers/dealers members, include national banks, provincial banks, municipal banks, private national banks, foreign banks, cooperative banks, financial institutions, foreign exchange entities and pure brokers/dealers (exclusively engaged in brokerage activities). Both Argentine or foreign capital banks and financial institutions may be the MAE’s brokers/dealers. Securities to be traded must be registered with the pertinent supervising authorities and may be traded in the MAE, in other exchanges or in both of them concurrently. Argentina’s equity markets have historically been composed of individual investors, though in recent years there has been an increase in the level of investment by banks and insurance companies in these markets; however, Argentine mutual funds (fondos comunes de inversión) continue to have very low participation. Acording to the informationInformation regarding the Argentine Institute of Capital Markets:BCBA:
| | | As of June 30, | | | As of June 30, | | | | 2015 | | | 2014 | | | 2016 | | 2015 | | Market capitalization (Ps. billion) | | | 4,025 | | | | 3,958 | | | 3,625 | | 4,025 | | Average daily trading volume (Ps. million) | | | 149.6 | | | | 43,9 | | | Average daily trading volume(1) (Ps. million) | | Average daily trading volume(1) (Ps. million) | 310 | | 150 | | Number of listed companies | | | 99 | | | | 104 | | | 100 | | 99 |
(1) During the month of June. Although companies may list all of their capital stock on the MVBA, in many cases a controlling block is retained by the principal shareholders resulting in only a relatively small percentage of many companies’ stock being available for active trading by the public on the MVBA. As of June 30, 2016, approximately 100 companies had equity securities listed on the MVBA. The Argentine securities markets are substantially more volatile than the securities markets in the United States and certain other developed countries The Merval Index experienced a 30.1% decrease in 2011, a 15.9% increase in 2012, a 88.9% increase in 2013, a 59.1% increase in 2014, a 36.1% increase in 2015 and a 35.9%25.8% increase during the first six months of 2015.2016. In order to control price volatility, the MERVALMVBA operates a system pursuant to which the negotiation of a particular stock or debt security is suspended for a 15 minute period when the price of the security registers a variation on its price between 10% and 15% and between 15% and 20%. Any additional 5% variation on the price of the security after that results in additional 10 minute successive suspension periods.
This sectionitem is not applicable. This sectionitem is not applicable. This sectionitem is not applicable. This sectionitem is not applicable. Our Corporate Purpose Our legal name is Cresud Sociedad Anónima Comercial, Inmobiliaria, Financiera y Agropecuaria. We were incorporated under the laws of Argentina on December 31, 1936 as a sociedad anónima (Stock Corporation) and were registered with Public Registry of Commerce on February 19, 1937 under number 26, on page 2, book 45 of National by-laws Volume. Pursuant to our by-laws, our term of duration expires on June 6, 2082. Pursuant to article 4 of our by-laws our purpose is to perform the following activities: • commercial activities with respect to cattle and products pertaining to farming and animal husbandry; • real estate activities with respect to urban and rural properties; • financial activities, except for those regulated by Law No. 21,526 of financial entities; • farming and animal husbandry activities, for properties owned by us or by third parties; and • agency and advice activities for which there is not required a specific qualifying title. Limited Liability Shareholders’ liability for losses is limited to their equity interest in us. Notwithstanding the foregoing, under the Argentine Corporation Law No. 19,550, shareholders who voted in favor of a resolution that is subsequently declared void by a court as contrary to Argentine law or a company’s by-laws (or regulation, if any) may be held jointly and severally liable for damages to such company, other shareholders or third parties resulting from such resolution. In addition, a shareholder who votes on a business transaction in which the shareholder’s interest conflicts with that of the company may be liable for damages under the Argentine Corporation Law, but only if the transaction would not have been validly approved without such shareholder’s vote. Capitalization We may increase our share capital upon authorization by our shareholders at an ordinary shareholders’ meeting. Capital increases must be registered with the public registry of commerce referred to as the Public Registry of Commerce, and published in the Boletín Oficial. Capital reductions may be voluntary or mandatory and must be approved by the shareholders at an extraordinary shareholders’ meeting (asamblea extraordinaria). Reductions in capital are mandatory when losses have depleted reserves and exceeded 50% of capital. As of june 30, 20152016 our share capital consisted of 501,642,804 common shares. Our bylaws provide that preferred stock may be issued when authorized by the shareholders at an extraordinary shareholders’ meeting (asamblea extraordinaria) and in accordance with applicable regulations. Such preferred stock may have a fixed cumulative dividend, with or without additional participation in our profits, resolved by the shareholders’ meetings. We currently do not have outstanding preferred stock. Preemptive Rights and Increases of Share Capital Pursuant to our by-laws and Argentine Corporation Law No. 19,550, in the event of an increase in our share capital, each of our existing holders of our common shares has a preemptive right to subscribe for new common shares in proportion to such holder’s share ownership. For any shares of a class not preempted by any holder of that class, the remaining holders of the class will be entitled to accretion rights based on the number of shares they purchased when they exercised their own preemptive rights. Rights and accretion rights must be exercised simultaneously within 30 days following the time in which notices to the shareholders of a capital increase and of the rights to subscribe thereto are published for three days in the Boletín Oficial and a widely circulated newspaper in Argentina. Pursuant to the Argentine Corporation Law, such 30-day period may be reduced to 10 days by a decision of our shareholders adopted at an extraordinary shareholders’ meeting (asamblea extraordinaria). Additionally, the Argentine Corporation Law permits shareholders at an extraordinary shareholders’ meeting (asamblea extraordinaria) to suspend or limit the preemptive rights relating to the issuance of new shares in specific and exceptional cases in which the interest of the Company requires such action and, additionally, under the following specific conditions: • the issuance is expressly included in the list of matters to be addressed at the shareholders’ meeting; and • the shares to be issued are to be paid in-kind or in exchange for payment under pre-existing obligations. Furthermore, Article 12 of the Negotiable Obligations Law permits shareholders at an extraordinary shareholders’ meeting (asamblea extraordinaria) to suspend preemptive subscription rights for the subscription of convertible bonds under the above-mentioned conditions. Preemptive rights may also be eliminated, so long as a resolution providing so has been approved by at least 50% of the outstanding capital stock with a right to decide such matters and so long as the opposition to such resolution does not surpass 5% of the share capital.
Shareholders’ Meetings and Voting Rights Our bylaws provide that shareholders’ meetings may be called by our board of directors or by our Supervisory Committee or at the request of the holders of shares representing no less than 5% of the common shares. Any meetings called at the request of shareholders must be held within 30 days after the request is made. Any shareholder may appoint any person as its duly authorized representative at a shareholders meeting, by granting a proxy. Co-owners of shares must have single representation. In general, the following matters can be considered only at an extraordinary shareholders’ meeting (asamblea extraordinaria): | • | matters that may not be approved at an ordinary shareholders’ meeting; | | • | the amendment of our bylaws; | | • | reductions in our share capital; | | • | redemption, reimbursement and amortization of our shares; | | • | mergers, and other corporate changes, including dissolution and winding-up; | | • | limitations or suspensions to preemptive rights to the subscription of the new shares; and | | • | issuance of debentures, convertible negotiable obligations and bonds that do not qualify as notes (obligaciones negociables)(obligaciones negociables). |
In accordance with our by-laws, ordinary and special shareholders’ meetings (asamblea extraordinaria) are subject to a first and second quorum call, the second to occur upon the failure of the first. The first and second notice of ordinary shareholders’ meetings may be made simultaneously. In the event that both are made on the same day, the second must occur at least one hour after the first. If simultaneous notice was not given, the second notice must be given within 30 days after the failure to reach quorum at the first. Such notices must be given in compliance with applicable regulations. A quorum for an ordinary shareholders’ meeting on the first call requires the presence of a number of shareholders holding a majority of the shares entitled to vote and, on the second call, the quorum consists of the number of shareholders present, whatever that number. Decisions at ordinary shareholders’ meetings must be approved by a majority of the votes validly exercised by the shareholders. A quorum for an special shareholders’ meeting (asamblea extraordinaria) on the first call requires the presence of persons holding 60% of the shares entitled to vote and, on the second call, the quorum consists of the number of shareholders present, whatever that number. Decisions at special shareholders’ meeting (asamblea extraordinaria) generally must be approved by a majority of the votes validly exercised. However, pursuant to the Argentine Corporation Law, all shareholders’ meetings, whether convened on a first or second quorum call, require the affirmative vote of the majority of shares with right to vote in order to approve the following decisions: | • | advanced winding-up of the company; | | • | transfer of the domicile of the company outside of Argentina; | | • | fundamental change to the purpose of the company; | | • | total or partial mandatory repayment by the shareholders of the paid-in capital; and | | • | a merger or a spin-off, when our company will not be the surviving company. |
Holders of common shares are entitled to one vote per share. Owners of common shares represented by ADRs exercise their voting rights through the ADR Depositary, who acts upon instructions received from such shareholders and, in the absence of instructions, votes in the same manner as our majority of the shareholders present in the shareholders’ meeting. The holders of preferred stock may not be entitled to voting rights. However, in the event that no dividends are paid to such holders for their preferred stock, the holders of preferred stock are entitled to voting rights. Holders of preferred stock are also entitled to vote on certain special matters, such as a transformation of the corporate type, early dissolution, change to a foreign domicile, fundamental change in the corporate purposes, total or partial replacement of capital losses, mergers in which our company is not the surviving entity, and spin-offs. The same exemption will apply in the event the preferred stock is traded on any stock exchange and such trading is suspended or canceled. Dividends and Liquidation Rights The Argentine Corporation Law establishes that the distribution and payment of dividends to shareholders is valid only if they result from realized and net earnings of the company pursuant to an annual balance sheet approved by the shareholders. Our board of directors submits our financial statements for the previous fiscal year, together with the reports of our Supervisory Committee, to the Annual Ordinary Shareholders’ Meeting. This meeting must be held by October 30 of each year to approve the financial statements and decide on the allocation of our net income for the year under review. The distribution, amount and payment of dividends, if any, must be approved by the affirmative vote of the majority of the present votes with right to vote at the meeting. The shareholders’ meeting may authorize payment of dividends on a quarterly basis provided no applicable regulations are violated. In that case, all and each of the members of the board of directors and the supervisory committee will be jointly and severally unlimitedly liable for the refund of those dividends if, as of the end of the respective fiscal year, the realized and net earnings of the company are not sufficient to allow the payment of dividends. When we declare and pay dividends on the common shares, the holders of our ADRs, each representing the right to receive ten ordinary shares, outstanding on the corresponding registration date, are entitled to receive the dividends due on the common shares underlying the ADRs, subject to the terms of the Deposit Agreement dated March 18, 1997 executed by and between us, The Bank of New York, as depositary and the eventual holders of ADRs. The cash dividends are to be paid in Pesos and, except under certain circumstances, are to be converted by the Depositary into U.S. Dollars at the exchange rate prevailing at the conversion date and are to be paid to the holders of the ADRs net of any applicable fee on the dividend distribution, costs and conversion expenses, taxes and public charges. Since January 2002 and due to the devaluation of the Peso, the exchange rate for the dividends will occur at a floating market rate. Our dividend policy is proposed from time to time by our board of directors and is subject to shareholders’ approval at an ordinary shareholders’ meeting. Declarations of dividends are based upon our results of operations, financial condition, cash requirements and future prospects, as well as restrictions under debt obligations and other factors deemed relevant by our board of directors and our shareholders. Dividends may be lawfully paid only out of our retained earnings determined by reference to the financial statements prepared in accordance with Argentine GAAP. In accordance with the Argentine Corporation Law, net income is allocated in the following order: (i) 5% is retained in a legal reserve until the amount of such reserve equals 20% of the company’s outstanding capital; (ii) dividends on preferred stock or common shares or other amounts may be retained as a voluntary reserve, contingency reserve or new account, or (iii) for any other purpose as determined by the company’s shareholders at an ordinary shareholders’ meeting.
Our legal reserve is not available for distribution. Under the applicable regulations of the Comisión Nacional de Valores, dividends are distributed pro rata in accordance with the number of shares held by each holder within 30 days of being declared by the shareholders for cash dividends and within 90 days of approval in the case of dividends distributed as shares. The right to receive payment of dividends expires three years after the date on which they were made available to shareholders. The shareholders’ meeting may authorize payment of dividends on a quarterly basis provided no applicable regulations are violated. In such case, all and each of the members of the board of directors and the supervisory committee will be jointly and severally liable for the refund of those dividends if, at the end of the respective fiscal year, the realized and net earnings of the company are not sufficient to allow for the payment of dividends. | • | to be applied to satisfy its liabilities; and | | • | to be proportionally distributed among holders of preferred stock in accordance with the terms of the preferred stock. If any surplus remains, our shareholders are entitled to receive and share proportionally in all net assets available for distribution to our shareholders, subject to the order of preference established by our bylaws. |
Approval of Financial Statements Our fiscal year ends on June 30 of each year, after which we prepare an annual report which is presented to our board of directors and Supervisory Committee. The board of directors submits our financial statements for the previous fiscal year, together with the reports of our Supervisory Committee, to the annual ordinary shareholders’ meeting, which must be held within 120 days of the close of our fiscal year, in order to approve our financial statements and determine our allocation of net income for such year. At least 20 days before the ordinary shareholders’ meeting, our annual report must be available for inspection at our principal office. Right of Dissenting Shareholders to Exercise Their Appraisal Right Whenever certain actions are approved at an extraordinary shareholders’ meeting (asamblea extraordinaria) (such as the approval of a merger, a spin-off (except when the shares of the acquired company are publicly traded), a fundamental change of corporate purpose, a transformation from one type of corporation to another, a transfer of the domicile of our company outside of Argentina or, as a result of the action approved, the shares cease to be publicly traded) any shareholder dissenting from the adoption of any such resolution may withdraw from our company and receive the book value per share determined on the basis of our latest financial statements, whether completed or to be completed, provided that the shareholder exercises its appraisal rights within ten days following the shareholders’ meeting at which the resolution was adopted. In addition, to have appraisal rights, a shareholder must have voted against such resolution or act within 15 days following the shareholders’ meeting if the shareholder was absent and can prove that he was a shareholder of record on the day of the shareholders meeting. Appraisal rights are extinguished with respect to a given resolution if such resolution is subsequently overturned at another shareholders’ meeting held within 75 days of the previous meeting at which the original resolution was adopted. Payment on the appraisal rights must be made within one year of the date of the shareholders’ meeting at which the resolution was adopted, except where the resolution involved a decision that our stock ceases to be publicly traded, in which case the payment period is reduced to 60 days from the date of the resolution. Ownership Restrictions The CNV regulations require that transactions that cause a person’s holdings of capital stock of a registered Argentine company, to hold 5% or more of the voting power, should be immediately notified to the CNV. Thereafter, every change in the holdings that represents a multiple of 5% of the voting power should also be notified. Directors, senior managers, executive officers, members of the supervisory committee, and controlling shareholders of an Argentine company whose securities are publicly listed, should notify the CNV on a monthly basis, of their beneficial ownership of shares, debt securities, and call and put options related to securities of such companies and their controlling, controlled or affiliated companies. Holders of more than 50% of the common shares of a company or who otherwise have voting control of a company, as well as directors, officers and members of the supervisory committee, must provide the CNV with annual reports setting forth their holdings in the capital stock of such companies and monthly reports of any change in their holdings. Tender Offers Tender offers under Argentine law may be voluntary or mandatory. In either case, the offer must be made addressed to all shareholders. In the case of a mandatory tender offer, the offer must also be made to the holders of subscription rights, stock options or convertible debt securities that directly or indirectly may grant a subscription, acquisition or conversion right on voting shares. Capital Markets Law No. 26,831 establishes that a person or entity wishing to acquire a “significant holding” (“participaciones significativas”) shall be required to launch a mandatory tender offer: - | A mandatory tender offer will not be required in those cases in which the purpose of the acquisition of the “significant holding” is not to acquire the control of a company. |
- A mandatory tender offer will not be required in those cases in which the purpose of the acquisition of the “significant holding” is not to acquire the control of a company. The CNV defines a “significant holding” as holdings that represent an equal or a higher percentage than 15% and 51% of the voting shares as the case may be: - | When a person or an entity intends to acquire more than 15% of the shares of a company, a mandatory tender offer to purchase 50% of the corporate voting capital is required by law. |
- When a person or an entity intends to acquire more than 15% of the shares of a company, a mandatory tender offer to purchase 50% of the corporate voting capital is required by law. - | If a person or an entity owns between 15% and 51% of the shares of a company, and wishes to increase its holdings by at least 6% within a 12 month period, a mandatory tender offer to acquire shares representing at least 10% of the voting capital will be legally required. |
- If a person or an entity owns between 15% and 51% of the shares of a company, and wishes to increase its holdings by at least 6% within a 12 month period, a mandatory tender offer to acquire shares representing at least 10% of the voting capital will be legally required. - | When a person or an entity wishes to acquire more than 51% of the shares of a company, a mandatory tender offer to acquire 100% of the voting capital will be legally required. |
- When a person or an entity wishes to acquire more than 51% of the shares of a company, a mandatory tender offer to acquire 100% of the voting capital will be legally required. - | Finally, when a shareholder controls 95% or more of the outstanding shares of a company, (i) any minority shareholder may, at any time, demand that the controlling party make an offer to purchase all of the remaining shares of the minority shareholders and (ii) the controlling party can issue a unilateral statement of intention to acquire all of the remaining shares owned by the other stockholders. |
- Finally, when a shareholder controls 95% or more of the outstanding shares of a company, (i) any minority shareholder may, at any time, demand that the controlling party make an offer to purchase all of the remaining shares of the minority shareholders and (ii) the controlling party can issue a unilateral statement of intention to acquire all of the remaining shares owned by the other stockholders.
Pursuant to the Argentine Corporation Law we may redeem our outstanding common shares only under the following circumstances: | • | to cancel such shares and only after a decision to reduce our capital stock (with shareholder approval at an extraordinary shareholders’ meeting (asamblea extraordinaria); | | • | to avoid significant damage to our company under exceptional circumstances, and then only using retained earnings or free reserves that have been fully paid, which action must be ratified at the following ordinary shareholders’ meeting; or | | • | in the case of the acquisition by a third-party of our common shares. |
The Capital Markets Law provides for other circumstances under which our company, as a corporation whose shares are publicly listed, can repurchase our shares. The following are necessary conditions for the acquisition of our shares: | • | the shares to be acquired shall be fully paid, | | • | there shall be a board of directors’ resolution containing a report of our supervisory committee and audit committee. Our board of director’s resolution must provide the purpose of the acquisition, the maximum amount to be invested, the maximum number of shares or the maximum percentage of capital that may be acquired and the maximum price to be paid for our shares. Our board of directors must give complete and detailed information to both shareholders and investors, | | • | the purchase shall be carried out with net profits or with free or optional reserves, and we must prove to the CNV that we have the necessary liquidity and that the acquisition will not affect our solvency, | | • | under no circumstances may the shares acquired by our company, including those that may have been acquired before and held by us as treasury stock, be more than 10% of our capital stock or such lower percentage established by the CNV after taking into account the trading volume of our shares. |
Any shares acquired by us that exceed 10% of our capital stock must be disposed of within 90 days from the date of acquisition originating the excess without prejudice of the liability corresponding to our board of directors. Transactions relating to the acquisition of our own shares may be carried out through open market transactions or through a public offering: | • | in the case of acquisitions in the open market, the amount of shares purchased daily cannot exceed 25% of the mean daily traded volume of our shares during the previous 90 days. | | • | in either case, the CNV can require the acquisition to be carried out through a public offering if the shares to be purchased represent a significant percentage in relation to the mean traded volume. |
Regulation of the CNV as amended, provides general requirements that any company must comply with in the case of the acquisition of its shares under the Corporations Law or under the Capital Markets Law. The acquisition of its shares by a company must be: | • | approved by a resolution of the board of directors with a report of its supervisory committee, | | • | notice must be given to the CNV with the expression of the motives of the decision, | | • | be carried out with net profits or free reserves from the last financial statements and approved by the board of directors, | | • | the board of directors has to prove to the CNV, that the company has the necessary liquidity and that the acquisition does not affect its solvency, | | • | all shares acquired by the company, including those that may have been acquired before and held by it as treasury stock, may not exceed 10% of its capital stock. |
There are no legal limitations to ownership of our securities or to the exercise of voting rights pursuant to the ownership of our securities, by non-resident or foreign shareholders. Registrations and Transfers Our common shares are held in registered, book-entry form. The registry for our shares is maintained by Caja de Valores S.A. at its executive offices located at 25 de mayo 362, (C1002ABH) Buenos Aires, Argentina. Only those persons whose names appear on such share registry are recognized as owners of our common shares. Transfers, encumbrances and liens on our shares must be registered in our share registry and are only enforceable against us and third parties from the moment registration takes place. Amendment to the by-laws. On the shareholders’ meeting held on October 10, 2007, our shareholders decided to amend the following sections of the by-laws: (i) Section Thirteen in order to adapt the performance bonds granted by directors to current rules and regulations, and (ii) Section Sixteen in order to incorporate the possibility of holding remote board meetings pursuant the provisions of section 65 of Executive Branch Decree 677/01. On the shareholders’ meeting held on October 31, 2012, our shareholders decided to amend the Section XVII of the by-laws in order to modify the quorum and majorities of the remote board meetings. On the shareholder´s meeting held on October 31, 2014, our shareholders decided to amend the following sections of the by-laws: (i) Section First in order to comply with the Capital Markets Law No. 26,831 and (ii) Section Twenty-Four in order to incorporate the regulation of the shareholders’ meeting held with shareholders present or communicated through teleconference technologies.
We do not have any material contract entered into outside the ordinary course of business other than some of the operations previously described under the Related Party Transactions, the Recent Developments and Our Indebtedness sections. Foreign Currency Regulation All transactions involving the purchase and sale of foreign currency must be settled through the single free exchange market (Mercado Único Libre de Cambios, or “MULC”) where the Argentine Central Bank supervises the purchase and sale of foreign currency. Under Executive Branch Decree No. 260/No.260/2002, the Argentine government had set up an exchange market through which all foreign currency exchange transactions are made. Such transactions arewere subject to the regulations and requirements imposed by the Argentine Central Bank. Under Communication “A” 3471, as amended, the Argentine Central Bank established certain restrictions and requirements applicable to foreign currency exchange transactions. If such restrictions
Under Communication “A” 6037, dated August 8th, 2016, no further authorization is required for residents and requirements are not met, criminal penalties shall be applied.non-residents to have access to local exchange market and there is no amount or matter that limits the access thereto. Outflow and Inflow of Capital Inflow of capital Under Argentine Foreign Investment Law No.N° 21,382, as amended, and the wording restated under Executive Branch Decree No.N° 1853/1993, the purchase of stock of an Argentine company by an individual or legal entity domiciled abroad or by an Argentine “foreign capital” company (as defined under the Foreign Investment Law) represents a foreign investment. Under Executive Branch Decree No.N° 616/2005, as amended by Decree Nº. 3/2015, the Argentine government imposedsoftened certain restrictions on the inflow and outflow of foreign currency into and from the Argentine exchange market, including that inflowing new indebtedness and debt renewals by persons domiciled abroad must be agreed and cancelled within periods not shorter than 365120 calendar days –instead of the 365.day period as originally established-, irrespective of the method of payment. Additionally, such debt may not be prepaid before the lapse of such period. Such restrictions do not apply to (i) foreign trade financing, or (ii) primary public offering of equity or debt instruments issued under the public offering procedure and listed on self-regulated markets. Pursuant to Communication “A” 4359, as amended, which regulated the Executive Branch Decree N° 616/2005, a registered, non-transferable and non-interest bearing deposit must be kept in Argentina for a period of 365 calendar days, in an amount equal to 30% of any inflow of funds into the domestic exchange market arising from (i) foreign debt (excluding foreign trade); and (ii) purchase of interests in Argentine companies that are not listed on self-regulated markets, except for direct investments and other transactions that may result in the inflow of foreign currency, or in indebtedness of a resident towards a nonresident. However, primary debt offerings by means of public offerings which are listed on a self-regulated market are exempted from such requirements. The mandatory deposit must be made in US Dollars and held in Argentine financial institutions and it may not be used to guarantee or as collateral of any type of credit transactions.
Communication “A” 4377, amended by Communication “A” 4762, 4933 and 5532, exempted from keeping the 30% mandatory deposit the following transactions:
i) Inflows of funds made by Multilateral and Bilateral Credit Agencies, either directly or through their related agencies.
ii) Financial indebtedness with non-resident financial or private sector, to the extent the funds, net of taxes and expenses, are applied to the purchase of foreign currency for the payment of external debt services or the formation of long-term assets.
iii) Any other financial indebtedness with non-resident financial or private sector, to the extend the inflows had been incurred and repaid in an average term no less than two years, including principal and interests and, to the extent, the funds are applied to investment in non financial assets by the private sector.
iv) Foreign currency settlements by Argentine residents derived from foreign currency loans granted by local financial institutions.
v) Direct investment contributions in local companies (pursuant to Communication “A” 4237 which defines “direct investment” as the participation in the capital stock which must be no less than 10%) and sale of interests in the capital stock of local companies to direct investors.
With respect to item v), there are some requirements aiming to comply with the accurate capitalization of the direct investment contribution regarding the actual capitalization and registration of the contribution with the Public Registry of Commerce in a term of 540 calendar days, otherwise, the mandatory deposit shall be made within 10 calendar days. This term shall be considered from the date in which the local company resolves not to accept the contribution and/or the rejection and/or suspension thereof. Regarding the sale of interest in the capital stock of a local company by a direct investor, it shall be required the filing of the sale and purchase agreement or the public offer of acquisition, as the case may be. Within 20 business days of the settlement of the transaction through the MULC, it shall be required the filing of the registration of the amendment to the by-laws with the Public Registry of Commerce or a legalized copy of the Ledger Book, depending on the type of company (corporation or limited liability company).
Additionally, Communication “A” 4901, dated February 5, 2009, exempts from the obligation to keep such mandatory deposit in the case of inflows into the exchange market made by non residents, when the Pesos resulting from the settlement of the foreign currency are applied within the following ten business days to any of the purposes set forth by the classification of current transactions in international accounts, namely: a) discharge of advance payments or liabilities for income and personal asset taxes payable by individuals who are regarded as residents from a tax standpoint; b) payment by nonresidents of contributions to the social security system or payments to employee-owned or prepaid healthcare systems; c) payment of other taxes which, given their nature, are borne by nonresidents in their capacity as taxpayers, and always provided that such payment does not entitle the nonresident to claims vis-à-vis the tax authorities or third parties; and d) other rates and services supplied by residents. In addition, such exemption on mandatory deposits, subject to certain additional requirements, is also applicable to funds remitted from abroad by nonresident companies on behalf of employees from international corporate groups who are temporarily abroad, to local companies responsible for the settlement of taxes and for making the relevant payments.
As result of the enactment of Communication “A” 5604, dated on July 10, 2014, which introduced item 2.7. in the Communication “A” 5526 as it is mentioned below, which in turn was modified by Communication “A” 5643, including direct investments, and the latter modified by Communication “A” 5692, direct investments made by non residents to local companies, shall be maintained in local account in foreign currency from October 9 until December 31, 2015 to the extent such funds comply with the provisions set forth in item 2.7. of Communication “A” 5526.
Obligation for the settlement of funds through the MULC. General rules. Exports. Pursuant to Executive Decree No.N° 1606/2011 and Communications “A” 3602 and “A” 3493 of the Central Bank any foreign currency derived from foreign trade must be settled through the MULC. Pursuant to Communication “A” 5300, as amended, within 15 businessWithin 365 running days as of the date of the disbursement of the funds abroad, corresponding to the payment of exportation of goods, advance payments of exports and pre financing loans for exports, such funds must be settled through the MULC. In all cases, the due date for the settlement of the funds derived from exports shall be the shortest time between 15 business day and the date applicable to the specific good according to the current rules. Such funds shall be credited in a local bank account duly opened in favor of the client.
In connection with the fundsclient, which were disbursedmay be either in bank accounts abroad, for the same concept referred toPesos or in the paragraph above, the due date for the transfer of such funds to a representative account of a local bank entity is 10 business days.
According to several regulations enacted by Argentine Central Bank, it is allowed the application of payment for exports abroad for the cancellations of exporter’s debt in the following cases:
| a. advance payments and prefinancing loans for exports. |
| b. financing of local new investment projects for the increase of production of exportable goods or importation substitutes, among others. |
| c. other financial indebtedness for bonds offering abroad and financial loans granted by foreign banks. |
| d. financial indebtedness with local financial entities to the extent the term (no less than 10 years), an average term (no less than 5 years) and interest rate (up to a 100 b.p. over labor 180 days) has been accomplished. |
another currency. Services Communication “A” 5264 set forth that the payments in foreign currency received by residents for the export of services and payment of losses for insurance policies hired with non residentsnonresidents under the applicable rules must be settled through the MULC within fifteen business365 running days as of its collection abroad or locally or its deposit in foreign bank accounts. Such funds are exempted to be settled through the MULC to the extent such exemption is actually contemplated in the foreign exchange regulations and such amounts are applied for the cancellation of foreign financial indebtedness. Outflow of capital, including the availability of cash or cash equivalents Exchange Transactions Inquiry Program OnCommunication “A” 5850, of December 2015, revoke Communication “A” 5245 that regulated an Exchange Transaction Inquiry Program established on October 28, 2011, by the Federal Administration of Public Revenues (Administración Federal de Ingresos Públicos, “AFIP”) established an Exchange Transactions Inquiry Program (“Inquiry Program”) through which the entities authorized by the Central Bank to deal in foreign exchange mustwere supposed to inquire and register through an IT system the total Peso amount of each exchange transaction at the moment it is closed.
All foreign exchange sale transactions, whether involving foreign currency or banknotes, irrespective of their purpose or allocation, are subject to this inquiry and registration system, which determines whether transactions are “Validated” or “Inconsistent”.
Pursuant to Communication “A” 5239, later replaced by Communication “A” 5245, in the case of sales of foreign exchange (foreign currency or banknotes) for the formation of off-shore assets by residents without the obligation of subsequently allocating it to specific purpose, entities authorized to deal in foreign exchange may only allow transactions through the MULC by those clients who have obtained the validation and who comply with the rest of the requirements set forth in the applicable foreign exchange regulations. The following are exempted from the Inquiry Program, among others: a) international agencies and institutions that act as official export credit agencies, diplomatic and consular offices, bilateral agencies established under International Treaties; and b) local governments.
Sales of foreign exchange other than for the formation of off-shore assets by residents without a specific purpose are also exempted from the Inquiry Program, although, the financial entities must verify that the other requirements established by the MULC are accomplished.
On December 20, 2012, Resolution No. 3421 replaced Resolution No. 3356, both enacted by AFIP. The latest one sets forth a unified registration system to be fulfilled for the access to the foreign exchange market, in particular for the outflow of funds made by residents or non residents, in whichever purpose or destiny. Such resolution is related with Communications “A” 5245.
Financial Indebtedness In accordance with Communication “A” 5265, as amended by Communication “A” 5604 (as of July 10, 2014) theAny transactions arising from financial indebtedness of the financial sector, private non-financial sector and local governments mustare no longer subject to be settled in the foreign exchange market. However, if settled in the foreign exchange market, then according to Decree No. 616/2005 and 3/2015, these cannot be set off before the minimum term of stay, which is 120 running days (except for bonds listed in the authorized exchange stock markets).
The provisions reach indebtedness with bonds, financial loans and any other transaction by which a disbursement of funds from a non-resident had been carried out. The obligation of settlement through the MULC shall be conducted within 30 calendar days from the date of the disbursement abroad and the transfer shall be deposited in a local bank account.
Any new financial indebtedness paid through the MULC and any debt renewal with financial non-residents and private non-residents shall be settled, maintained and renewed for at least 365 calendar days from the date of the disbursement, and they may not be prepaid before such term, whatever the manner of the cancellation of the obligation with the creditor had been agreed and independently of whether said cancellation is channeled through the MULC or not.
The primary issuance of publicly securities traded in self regulated markets is exempted of the foregoing provisions.
On January 8, 2015, through Communication “A” 5692, the Central Bank extended the term established by Communication “A” 5643 through which the conditions established in item 2.7. of the Communication “A” 5526 related to the purchase of foreign currency for the formation of off-shore assets by residents, shall be applied to the financial indebtedness from October 9, 2014 until December 31, 2015. The inflow of funds through this channel shall be subject to provisions set forth in Decree 616/2005, meaning that mandatory deposit of 30% shall apply. Nevertheless, it shall be considered the final destination of the funds that are exempted from such mandatory deposit (i.e. financial indebtedness with non-resident financial or private sector, to the extend the inflows had been incurred and repaid in an average term no less than two years, including principal and interests and, to the extent, the funds are applied to investment in non financial assets by the private sector). By this regulation, the funds may be maintained in local account in foreign currency during the term authorized thereof.
Formation of off-shore assets by residents with and without subsequent allocation to specific purposes On January 27, 2014,Under Communication “A” 5850, 5899 and 6037 of the Argentine Central Bank, enacted Communication “A” 5526 which abrogated item II of Communication “A” 5318 (as of July 5, 2012) rule that, in turn, had suspended item 4.2. of Communication “A” 5236 (as of October 27, 2011) relatedresidents shall have access to the local exchange market without prior authorization of the Central Bank in order to purchase of foreign currency for the formation of off-shore assets by residents.. Communication “A” 5526, by entirely replacing item 4 of Communication “A” 5236 (which regulated the outflow of funds for the formation of off-shore assets for subsequent allocation without specific purposes to individuals who were Argentine residents, legal entities organized in Argentina and trust set up with contributions from the national public sector), made void the restrictions to the foreign exchange market to individuals who are residents, allowing them to purchase foreign currency as savings based on the income declared with the AFIP, prior to a validation system to be accomplished by such individuals. Additionally, the referred rule rearranged and, therefore replaced Annex to Communication “A” 5236.
On July 10, 2014, through Communication “A” 5604, the Argentine Central Bank made some additional changes to Communication “A” 5526, including the item 2.7. This item was amended by Communication “A” 5604 and Communication “A” 5757, the latter dated on May 21, 2015. As a result of such amendments it was set forth that new bond offerings and debt instruments issued under public offering procedure and listed on self regulated markets by local governments and /or private non-financial sector, that may be considered as external issuance, it shall be allowed the access to the foreign exchange market for the purchase of foreign currency to be deposited in local financial institutions (in a fixed term or special foreign currency account), simultaneously to the settlement of the funds received for the acquisition of such bonds or debt instruments abroad. Such permit shall be made for the total amount of the funds settled through the foreign exchange market and for a term of no longer than 270 calendar days. At least 80% of such funds must be applied to any future needs of net foreign currency required by the company involved. After the due date of 270 calendar days established by the Communication, the funds that had not been used, must be settled through the foreign exchange market within 10 business days. The referred funds shall not be subject to the mandatory deposit of 30% regulated by Communication “A” 4359, as amended.
Outflow of funds for payment to non-residents According to Communication “A” 5264, amended by Communication “A” 5377 (issued on December 14, 2012) and Communication “A” 5604,6037, there are no limits or restrictions applicable for residents who access the foreign exchange market to pay services, debts and profits to non-residents. The access to the MULC requires the filing of certain documentation by residents demonstrating the validity of transactions in which the funds are purchased for its remittance abroad. Payment of services As it was mentioned above, there is no restriction applicable for payments to be made to non-residents for performed services. The regulation covers all types of services without making any specifications. The financial entity shall require the filing of documentation supporting the authenticity of the transaction, the service rendered by the non-resident to the resident and the amount to be transferred abroad. Should performed services are not related to the activities actually developed by the resident; the financial entity shall require a copy of the contract by which the payment obligation arises from and an auditor report. Such requirements intend to demonstrate the actual rendering of services to the non-resident and the existence of the debt.
Payment of rents (interest, profits and dividends) As of January 8, 2003, Communication “A” 3859, item 3, allowed Argentine companies to transfer abroad profits and dividends related to closed financial statements certified by independent accountants without being required to obtain the prior authorization of the Central Bank. Such Communication was replaced by Communication “A” 5264, amended by Communication “A” 5377.5377 and Communication “A” 6037. The payments of profits and dividends to non-residents or ADR’s areis authorized, insofar such payments are made according to financial statements duly closed, audited and approved by shareholders’ meeting. The financial entity shall verify the accomplishment of the formalities established by Communication “A” 3602, as amended, and the fulfillment of the report of direct investment ruled by Communication “A” 4237 (please see below the Reporting System).
Payment of foreign financial indebtedness Access to the exchange market is allowed for payments of principal amounts due, with the exception of the financial institutions subject to rediscounts granted by the Central Bank and which have restructured their debt with foreign creditors (Executive Branch Decree No. 739/2003 and Communication “A” 3940 of the Central Bank).due. In general terms, access to MULC for payment of principal, interest and prepayment of financial indebtedness incurred by Argentine residents in the private non-financial sector and financial sector are allowed subject to regulations set forth by Communications “A” 5265 as6037 of January 3, 2012.August 8th, 2016. The sale of foreign currencyPursuant to Communication “A” 6037, no settlement in the local exchange market is required for the paymentrepayment of financial indebtedness must be made through check issued by the resident or debit to the resident local bank account. The financial entity must verifyprincipal and interests, as long as it has been verified that the reporting system has been complied with in accordance with Communication “A” 3602. Additionally, the payment may only proceed if the funds disbursed remain in Argentina for at least 365120 calendar days, in accordance with Executive Branch Decree N° 616/No.616/2005.
Interest payments: Pursuant to Communication “A” 5264, item 3.7., modified by Communication “A” 5604 on July 10, 2014 (after several amendments since its issuance), the access to the MULC for the purchase of foreign currency to pay interests for financial indebtedness may be made:
a. | Up to 10 business day prior to the due date of each interest installment and to pay interest accrued within such interest period; |
b. | To pay interest accrued from the date of the settlement of the disbursement through the local foreign exchange market; or |
c. | To pay interest accrued from the date of the actual disbursement; provided that the funds disbursed abroad were credited in correspondent accounts of entities authorized to settle such funds through the local exchange market, within 48 hours from the date of their disbursement. |
In all cases, the financial entity must verify the filing of the documents required by Communication “A” 3602 (affidavit related to the financial indebtedness) and Communication “A” 4237 (reporting of direct investment owned by non-residents) in case the creditor is part of the debtor’s economic group.
Principal Repayments and Prepayments: Pursuant to Communication “A” 5265, amended by Communication “A” 5604 (enacted on July 10, 2014) foreign currency necessary to pay principal on foreign indebtedness owed by the private non-financial sector may be acquired:
a. | within 10 business days prior to the stated maturity of the applicable obligation; provided that the funds disbursed under such obligation have remained in Argentina for at least 365 days; or |
b. | with the anticipation required from an operating standpoint in order to pay to the creditor at maturity, in case of principal installments the payment of which depends on the satisfaction of specific conditions expressly contemplated in the contracts executed by and between the parties involved. |
c. | with an anticipation of more than 10 business day –partial or full- to the extent the disbursed funds have remained in Argentina for at least 365 and the payment is financed with the inflow of funds from abroad for capital contribution. |
d. | with the anticipation of more than 10 business day –partially or full- to the extent the minimum term of 365 days as of the disbursement of the funds has been accomplished and the prepayment is fully offset with the inflow through the MULC of new external financial with international entities and their agencies, official credit entities and financial entities from abroad, to the extent that such cancellation implies a condition for the new indebtedness and/or for the new bond offerings and debt instruments issued under public offering procedure and listed on self regulated markets, that may be considered as external issuance. In each case, it is a condition: (a) the average term of the new indebtedness is higher than the average term of the outstanding debt that it is prepaid considering both capital and interest, and (b) it may not imply an increase in the present value of the indebtedness for the debtor. |
Direct Investment Reporting System Direct Investments made in Argentina by non residentsnonresidents Under Communication “A” 4237, the Argentine Central Bank established a reporting system in connection with direct investments and real estate investments made by non residentsnonresidents in Argentina and by residents abroad. Non residentsNonresidents must comply every semester with the above mentioned reporting system if the amount of the investment in Argentina reaches or exceeds US$U.S. 500,000. If such amount is not reached, the reporting system is optional.
Direct investments made outside Argentina by Argentine residents Argentine residents are required to meet the reporting system set forth in Communication “A” 4237 every year if the value of their investments abroad reaches or exceeds US$1.0 million and its under US$5.0 million, and every semester if it reaches or exceeds US$5.0 million. If the value of such investments abroad does not reach US$1.0 million, compliance with the reporting system is optional. Sales of foreign exchange to non residentsnonresidents The consentAccess to local exchange market shall be given as well to non residents for them to transfer to their own foreign accounts the payments collected in the country. Specific documentation that backs up the cause of the Argentinepayment may be required by the Central Bank is not required, unless the following conditions are met:
a. | evidence is given that a smaller amount of foreign currency than the one intended to be purchased previously entered through the MULC during the nonresident’s period of stay in Argentina; |
b. | the original foreign exchange certificate through which the foreign currency entered is produced; |
c. | an equivalent to US$ 5,000 per client and per period of stay in Argentina is not exceeded. |
Bank. For further details regarding the exchange regulations applicable in Argentina, investors should consult their professional advisers and read the full text of Executive Branch Decree 616/No.616/2005, Resolution No. 365/2005and Communication “A” 6037 of the Ministry of Economy and Production and Criminal Exchange Law No. 19,359, as well as the relevant regulations and supplementary provisions.Central Bank. Interested parties may consult such regulations through the website of the Ministry of Economy and Public Finance (http://www.infoleg.gob.ar) or the Central Bank (http://www.bcra.gob.ar). Money Laundering Argentine Law No.N° 25,246, as amended by Laws No. 26,118,Nos.26,118, 26,268 and 26,683, categorizes money laundering as a crime, which is defined as the exchange, transfer, management, sale or any other use of money or other assets obtained through a crime, by a person who did not take part in such original crime, with the potential result that such original assets (or new assets resulting from such original assets) have the appearance of having been obtained through legitimate means. In spite of the fact that there is a specific amount for the money laundering category (Ps.300,000), the crimes committed for a lower amount are also punished, but the prison sentence is reduced. After the enactment of Law N° 26,683, money laundering was included in the Penal Code as an independent crime against economic and financial order and it was split from the title “Concealment” as originally disposed. Therefore, money laundering is a crime which may be prosecuted independently. The money laundering law created the Financial Information Unit (“UIF”)(UIF). The UIF is in charge of the analysis, treatment and transmission of information to prevent and impede the money laundering originating from, among others: a. | Crimes related to the traffic and illegal commercialization of drugs (Law No.a) Crimes related to the traffic and illegal commercialization of drugs (Law N° 23,737) |
b. | Crimes related to arms traffic (Law No.b) Crimes related to arms traffic (Law N° 22,415); |
c. | c) Crimes related to illegal association of terrorist association o terrorist association; |
d. | d) Crimes committed by illegal associations organized to commit crimes for political or racial purposes; |
e. | Crimes against Public Administration; |
e) Crimes against Public Administration f. | Crimes of minor’s prostitution and child pornography; |
f) Crimes of minor’s prostitution and child pornography g. | Crimes related to terrorism financing. |
g) Crimes related to terrorism financing The UIF analyzes the information received by entities that have the obligation to report suspicious activities or operations and, as the case may be, inform the Public Ministry to carry out the investigations that may be considered relevant or necessary. The money laundering legal framework in Argentina also assigns information and control duties to certain private sector entities, such as banks, agents, non-profits organizations, stock exchanges, insurance companies, according to the regulations of the Financial Information Unit, and for financial entities, the Argentine Central Bank. These regulations apply to many Argentine companies, including us. These obligations consist mainly of: (i) maintaining internal policies and procedures aimed at money laundering prevention and financing of terrorism, especially through the application of the policy “know your client”; (ii) reporting any suspicious activity or operation and (iii) acting according the Money Laundering Law with respect to the confidentiality of the information obtained from the clients. For that purpose, each entity involved must appoint an officer responsible for the monitoring and control under the Money Laundering Law. On May 8, 2009, and in its capacity as obliged subject under the rules enacted by UIF, the CNV issued Resolution No. 554 which incorporated within the exchange market many provisions aimed at comply with money laundering prevention pursuant to Law 25,246, as amended. In that regard, such resolution established that any entity subject to the supervision of CNV could only take part in securities transactions if they were ordered by parties that were registered or domiciled in jurisdictions not included in the list of tax havens detailed in Executive Branch Decree No 1344/98. Furthermore, the Resolution provided that securities transactions made by parties registered or domiciled in jurisdictions that are not included in such list, but that act as intermediaries of securities’ markets under the supervision of an agency similar to the CNV, were allowed only if such agency has signed a memorandum of mutual understanding with the CNV.
On February 2, 2012, Resolution No.N° 554 was replaced by Resolution No.N° 602 so as to adapt and complement the instructions issued by UIF applying to the entities under the supervision of CNV, including some payment modalities and control proceedings for the reception and deliver of funds to the clients, fixing amounts and instruments to be used. Moreover, such resolution updated the reference to the Executive Branch Decree which referred to tax havens (No.(N° 1,037). As part of a more comprehensive modification of the rules that govern the scope of supervision of CNV, derive from the enactment of the Capital Markets Law No. 26,831,and the CNV Rules, which approvedstablished a new regulatory regime for the public offer of securities, CNV issued a new re-arranged text of its rules. By Resolution No. 622/2013,Through the CNV Rules, the CNV incorporates a new chapter of Money Laundering and Terrorist Financing including dispositions related to the fulfillment of duties to be complied by “Agentes de Negociación”, “Agentes de Liquidación y Compensación”, “Agentes de Distribución y Colocación” and “Agentes de Administración de Productos de Inversión Colectiva”, considered as obliged subject under the terms of sections 4, 5 and 22 of article 20 of Law No.N° 25,246. Such agents are obliged to comply with any provision arising from Law No.N° 25,246 and its amendments, regulations enacted by UIF, including decrees of National Executive Power with reference to the decisions adopted by the United Nations Security Council, in the fight against terrorism and to comply with the resolutions issued by the Ministry of Foreign Affairs, International Trade and Religion. Furthermore, “Agentes de custodiaCustodia de productosProductos de inversióInversión colectivaColectiva (Sociedades Depositarias de Fondos Comunes de Inversión”); “Agentes de corretaje”, “Agentes de depósito colectivo” and listed companies with respect to contribution, irrevocable contributions or indebtedness made by a shareholder or a third person to become a shareholder in the future, are also reached by the resolution. Those subjects must send by internet (through the online application of CNV) their tax identification number. Additionally, in case of companies, it must be informed the personal data of the “Compliance Officer” (both regular and alternate). The CNV regulationsRules provide that the subjects under their jurisdiction, may only take action to transactions in the scope of public offering of securities, stipulated, future or optional contracts of any nature and other instruments and financial products when made or directed by registered, domiciled or domestic subjects or those who reside in dominions, jurisdictions, territories or associated states that appear included in the list of cooperating countries provided in article 2º, subsection b) of executive branch Decree N° 589/2013. When those subjects are not included in the referred list and, in their origin jurisdictions, are only registered intermediates of an entity subject to control and supervision of a body who fulfills similar duties such as the CNV, the transactions shall only have effect provided that the body in their origin jurisdiction has signed a memorandum of understanding, cooperation and exchange of information with the CNV. With the purpose of strengthen the requirements in order to grant the authorization to operate in the exchange market, some new requisites were established in connection with: (i) competence and capacity; (ii) moral integrity and honesty and (iii) solvency. Such requisites are subject to the appraisal of CNV and must be fulfilled by managers, directors, auditors and any other individual who perform duties or activities within the company. Pursuant to Decree 360/2016 dated February 16, 2016, the Argentine government created the “National Coordination Program for Combating Money Laundering and Terrorist Financing” within the purview of the Ministry of Justice and Human Rights. Its purpose is to rearrange, coordinate and strengthen the anti-money laundering and anti-terrorist financing system at national level, in light of the actual risks that could impact the Argentine territory and the global requirements to be met under the scope of the obligations and international recommendations of the United Nations and FATF standards. Moreover, Law No. 27.260, which introduced certain tax modifications and a new regime for residents to disclose undeclared assets, established that the UIF would now be within the purview of the Ministry of Economy and Finances. Some other measures are set forth related to listed companies or their shareholders or beneficial owners who had been convicted or condemned in connection with money laundering and/or terrorist financing activities or appeared in the list published by the United Nation Security Council. United States Taxation The following summary describes the material United States federal income tax consequences of the ownership of our common shares and ADSs as of the date hereof. The discussion set forth below is applicable to U.S. Holders (as defined below). Except where noted, this discussion deals only with U.S. Holders that hold our common shares or ADSs as capital assets. This summary does not represent a detailed description of the United States federal income tax consequences applicable to you if you are subject to special treatment under the United States federal income tax laws, including if you are: | • | a bank; | | • | a dealer in securities or currencies; | | • | a financial institution; | | • | a regulated investment company; | | • | a real estate investment trust; | | • | an insurance company; | | • | a tax exempt organization; | | • | a person holding our common shares or ADSs as part of a hedging, integrated or conversion transaction, constructive sale or straddle; | | • | a trader in securities that has elected the mark-to-market method of accounting for your securities; | | • | a person liable for alternative minimum tax; | | • | a person who owns or is deemed to own 10% or more of the voting stock of our company; | | • | a partnership or other pass-through entity for United States federal income tax purposes; or | | • | a person whose “functional currency” is not the U.S. Dollar. |
Furthermore, the discussion below is based upon the provisions of the Internal Revenue Code of 1986, as amended (the “Code”), and regulations, rulings and judicial decisions thereunder as of the date hereof, and such authorities may be repealed, revoked or modified so as to result in United States federal income tax consequences different from those discussed below. This summary does not contain a detailed description of all the United States federal income tax consequences to you in light of your particular circumstances and does not address the Medicare tax on net investment income, or the effects of any state, local or non-United States tax laws. In addition, this summary is based, in part, upon representations made by the depositary (the “Depositary”) to us and assumes that the deposit agreement governing the ADSs, and all other related agreements, will be performed in accordance with their terms.
As used herein, the term “U.S. Holder” means a beneficial owner of common shares or ADSs that is for United States federal income tax purposes: | • | an individual citizen or resident of the United States; | | • | a corporation created or organized in or under the laws of the United States, any state thereof or the District of Columbia; | | • | an estate the income of which is subject to United States federal income taxation regardless of its source; or | | • | a trust if it (1) is subject to the primary supervision of a court within the United States and one or more United States persons have the authority to control all substantial decisions of the trust or (2) has a valid election in effect under
| | applicable United States Treasury regulations to be treated as a United States person. |
If a partnership holds our common shares or ADSs, the tax treatment of a partner will generally depend on the status of the partner and the activities of the partnership. If you are a partner of a partnership holding our common shares or ADSs, you should consult your tax advisors. IF YOU ARE CONSIDERING THE PURCHASE, OWNERSHIP OR DISPOSITION OF COMMON SHARES OR ADSS YOU SHOULD CONSULT YOUR OWN TAX ADVISOR CONCERNING THE UNITED STATES FEDERAL INCOME TAX CONSEQUENCES TO YOU AS WELL AS ANY CONSEQUENCES ARISING UNDER THE LAWS OF ANY OTHER TAXING JURISDICTION. ADSs In general, for United States federal income tax purposes, U.S. Holders of ADSs will be treated as the owners of the underlying common shares that are represented by the ADSs. Accordingly, deposits or withdrawals of our common shares by U.S. Holders for ADSs will not be subject to United States federal income tax. Distributions on Common Shares or ADSs Subject to the discussion under “Passive Foreign Investment Company” below, the gross amount of distributions on our common shares or ADSs (including amounts withheld to reflect Argentine withholding taxes, if any) will be taxable as dividends to the extent paid out of our current or accumulated earnings and profits (as determined under United States federal income tax principles). Such income (including withheld taxes) will be includable in your gross income as ordinary income on the day actually or constructively received by you, in the case of common shares, or by the Depositary, in the case of ADSs. Such dividends will not be eligible for the dividends-received deduction allowed to corporations under the Code. With respect to non-corporate United States investors, certain dividends received from a qualified foreign corporation may be subject to reduced rates of taxation. A foreign corporation is treated as a qualified foreign corporation with respect to dividends received from that corporation on shares (or ADSs representing such shares) that are readily tradable on an established securities market in the United States. United States Treasury Department guidance indicates that our ADSs (which are listed on the NASDAQ), but not our common shares, are readily tradable on an established securities market in the United States. Thus, we do not believe that dividends that we pay on our common shares that are not represented by ADSs currently meet the conditions required for these reduced tax rates. Non-corporate holders that do not meet a minimum holding period requirement during which they are not protected from the risk of loss or that elect to treat the dividend income as “investment income” pursuant to Section 163(d)(4) of the Code will not be eligible for the reduced rates of taxation regardless of our status as a qualified foreign corporation. In addition, the rate reduction will not apply to dividends if the recipient of a dividend is obligated to make related payments with respect to positions in substantially similar or related property. This disallowance applies even if the minimum holding period has been met. The amount of any dividend paid in Pesos will equal the U.S. Dollar value of the Pesos received calculated by reference to the exchange rate in effect on the date the dividend is actually or constructively received by you, in the case of common shares, or by the Depositary, in the case of ADSs, regardless of whether the Pesos are converted into U.S. Dollars. If the Pesos received are not converted into U.S. Dollars on the day of receipt, you will have a basis in the Pesos equal to their U.S. Dollar value on the date of receipt. Any gain or loss you realize on a subsequent conversion or other disposition of the Pesos will be treated as United States source ordinary income or loss. Subject to certain significant conditions and limitations, Argentine tax withheld from dividends, if any, may be treated as foreign income tax eligible for credit or deduction against your United States federal income tax liability. For purposes of the foreign tax credit, dividends paid on the common shares or ADSs will be treated as income from sources outside the United States and will generally constitute passive category income. Further, in certain circumstances, if you have held ADSs or common shares for less than a specified minimum period during which you are not protected from risk of loss, or are obligated to make payments related to the dividends, you will not be allowed a foreign tax credit for foreign taxes imposed on dividends paid on ADSs or common shares. The rules governing the foreign tax credit are complex. Investors are urged to consult their tax advisors regarding the availability of the foreign tax credit under their particular circumstances. To the extent that the amount of any distribution (including amounts withheld to reflect Argentine withholding taxes, if any) exceeds our current and accumulated earnings and profits for a taxable year, as determined under United States federal income tax principles, the distribution will first be treated as a tax-free return of capital, causing a reduction in the adjusted basis of the ADSs or common shares, and the balance in excess of adjusted basis will be taxed as capital gain recognized on a sale or exchange. However, we do not expect to keep earnings and profits in accordance with United States federal income tax principles. Therefore, you should expect that a distribution will generally be treated as a dividend (as discussed above). Taxation of Capital Gains Subject to the discussion under “Passive Foreign Investment Company” below, upon the sale, exchange or other disposition of common shares or ADSs, you generally will recognize capital gain or loss equal to the difference between the U.S. Dollar value of the amount realized upon the sale, exchange or other disposition and the adjusted tax basis of the common shares or ADSs, determined in U.S. Dollars. The capital gain or loss will be long-term capital gain or loss if at the time of sale, exchange or other disposition you have held the common shares or ADSs for more than one year. Capital gains of individuals derived with respect to capital assets held for more than one year are eligible for reduced rates of taxation. The deductibility of capital losses is subject to limitations. Any gain or loss you recognize will generally be treated as United States source gain or loss. Consequently, you may not be able to use the foreign tax credit arising from any Argentine tax imposed on the disposition of common shares or ADSs unless such credit can be applied (subject to applicable limitations) against tax due on other income treated as derived from foreign sources.
Passive Foreign Investment Company Based on the current and projected composition of our income and the valuation of our assets, including goodwill, we do not believe we were a PFIC for United States federal income tax purposes for the taxable year ending June 30, 2015,2016, and we do not currently expect to become a PFIC, although there can be no assurance in this regard. The determination of whether we are a PFIC is made annually. Accordingly, it is possible that we may be a PFIC in the current or any future taxable year due to changes in our asset or income composition or if our projections are not accurate. The volatility and instability of Argentina’s economic and financial system may substantially affect the composition of our income and assets and the accuracy of our projections. In addition, this determination is based on the interpretation of certain U.S. Treasury regulations relating to rental income, which regulations are potentially subject to differing interpretation. In general, we will be a PFIC for any taxable year in which either (i) at least 75% of the gross income of our company for the taxable year is passive income or (ii) at least 50% of the value (determined on the basis of a quarterly average) of our assets is attributable to assets that produce or are held for the production of passive income. For this purpose, passive income generally includes dividends, interest, royalties and rents (other than royalties and rents derived in the active conduct of a trade or business and not derived from a related person), annuities and gains from assets that produce passive income. If we own at least 25% by value of the stock of another corporation, we will be treated for purposes of the PFIC tests as owning a proportionate share of the assets of the other corporation, and as receiving directly a proportionate share of the other corporation’s income. If we are a PFIC for any taxable year during which you hold common shares or ADSs in our company, unless you make the mark-to-market election discussed below, you will be subject to special tax rules discussed below. If we are a PFIC for any taxable year during which you hold our common shares or ADSs, you will be subject to special tax rules with respect to any “excess distribution” received and any gain realized from a sale or other disposition, including a pledge, of such common shares or ADSs. Distributions received in a taxable year that are greater than 125% of the average annual distributions received during the shorter of the three preceding taxable years or your holding period for the common shares or ADSs will be treated as excess distributions. Under these special tax rules (i) the excess distribution or gain will be allocated ratably over your holding period for the common shares or ADSs, (ii) the amount allocated to the current taxable year, and any taxable year prior to the first taxable year in which we were a PFIC, will be treated as ordinary income, and (iii) the amount allocated to each other year will be subject to tax at the highest tax rate in effect for that year and the interest charge generally applicable to underpayments of tax will be imposed on the resulting tax attributable to each such year. If we are a PFIC for any taxable year during which you hold our common shares or ADSs and any of our non-United States subsidiaries is also a PFIC, you would be treated as owning a proportionate amount (by value) of the common shares of the lower tier PFIC for purposes of the application of these rules. You are urged to consult your tax advisors about the application of the PFIC rules to any of our subsidiaries. In addition, non-corporate U.S. Holders will not be eligible for reduced rates of taxation on any dividends received from us if we are a PFIC in the taxable year in which such dividends are paid or in the preceding taxable year. In certain circumstances, in lieu of being subject to the excess distribution rules discussed above, you may make an election to include gain on the stock of a PFIC as ordinary income under a mark-to-market method provided that such stock is regularly traded on a qualified exchange. Under current law, the mark-to-market election is only available for stock traded on certain designated United States exchanges and foreign exchanges which meet certain trading, listing, financial disclosure and other requirements to be treated as a qualified exchange under applicable United States Treasury regulations. Consequently, the mark-to-market election may be available to you with respect to the ADSs because the ADSs are listed on the NASDAQ, which constitutes a qualified exchange under the regulations, although there can be no assurance that the ADSs will be regularly traded. You should note that only the ADSs and not the common shares are listed on the NASDAQ. The common shares are listed on the BASE. Consequently, the BASE would need to meet the trading, listing, financial disclosure and other requirements of the United States Treasury regulations. The ADSs or common shares would also need to be regularly traded on such exchanges in order for the ADSs or common shares to be potentially eligible for the mark-to-market election. If we are a PFIC in any taxable year in which you hold our common shares or ADSs, but you do not make a mark-to-market election until a subsequent taxable year, you will be subject to special rules in the taxable year of the election. You should consult your own tax advisors regarding the application of the mark-to-market election in your particular situation. If you make an effective mark-to-market election, you will include in income each year that we are a PFIC as ordinary income, rather than capital gain, the excess, if any, of the fair market value of your common shares or ADSs at the end of the taxable year over your adjusted tax basis in the common shares or ADSs and will be permitted an ordinary loss in respect of the excess, if any, of the adjusted basis of such common shares or ADSs over their fair market value at the end of each such taxable year, but only to the extent of the net amount previously included in income as a result of the mark-to-market election. Your basis in the common shares or ADSs will be adjusted to reflect any such income or loss amounts. Any gain or loss on the sale of the common shares or ADSs will be ordinary income or loss, except that such loss will be ordinary loss only to the extent of the previously included net mark-to-market gain. If you make a mark-to-market election it will be effective for the taxable year for which the election is made and all subsequent taxable years unless the common shares or ADSs are no longer regularly traded on a qualified exchange or the Internal Revenue Service consents to the revocation of the election. Mark-to-market inclusions and deductions will be suspended during taxable years in which we are not a PFIC, but would resume if we subsequently become a PFIC. You are urged to consult your own tax advisor about the availability of making such a mark-to-market election. Alternatively, a United States investor that owns common shares or ADSs in a PFIC can sometimes avoid the rules described above by electing to treat the company as a “qualified electing fund” under Section 1295 of the Code. This option is not available to you because we do not intend to comply with the requirements necessary to permit you to make this election. A United StatesU.S. Holder who owns common shares or ADSs during any year that we are a PFIC must generally file IRS Form 8621. You should consult your own tax advisors concerning the United States federal income tax consequences of holding the common shares or ADSs if we are considered a PFIC in any taxable year. Argentine Personal Assets Tax Amounts paid on account of the Argentine personal assets tax, if any, will not be eligible as a credit against your United States federal income tax liability, but may be deductible subject to applicable limitations in the Code. Information Reporting and Backup Withholding In general, information reporting requirements will apply to distributions on common shares or ADSs and to the proceeds of sale of a common share or ADS paid to you within the United States (and in certain cases, outside the United States), unless you are an exempt recipient. Backup withholding may apply to such payments if you fail to provide a correct taxpayer identification number or certification of other exempt status or fail to report in full dividend and interest income. Any amounts withheld under the backup withholding rules will be allowed as a refund or a credit against your United States federal income tax liability provided you furnish the required information to the Internal Revenue Service.
Argentine Taxation The following discussion is a summary of certain Argentine tax considerations associated with an investment in, ownership or disposition of, the common shares or the ADSs by (i) an individual holder that is resident in Argentina, (ii) an individual holder that is neither domiciled nor resident in Argentina, (iii) a legal entity organized under the laws of Argentina, (iv) a permanent establishment in Argentina of a foreign entity and (v) a legal entity that is not organized under the laws of Argentina, that does not have a permanent establishment in Argentina and is not otherwise doing business in Argentina on a regular basis. The discussion is for general information only and is based on current Argentine tax laws. Moreover, while this summary is considered to be a correct interpretation of existing laws in force as of the date of this filing, no assurance can be given that the courts or administrative authorities responsible for the administration of such laws will agree with this interpretation or that changes in such laws or interpretations will not occur. PROSPECTIVE INVESTORS ARE URGED TO CONSULT THEIR OWN TAX ADVISOR REGARDING THE PARTICULAR TAX CONSEQUENCES ARISING UNDER ANY TAXING JURISDICTION. Income tax Law No. 26,893, enacted on September 12, 2013 and published in the Official Gazette on September 23, 2013, introduced several amendments to Income Tax Law No. 20,628 in connection with, among others, the taxation of dividend distributions and gains derived from transfers of shares and other securities, including the derogation of Section 78 of Decree No. 2,284/1991, which provided that foreign holders with no permanent establishment in Argentina were exempt from paying income tax on the capital gains arising from the sale or other disposition of shares or ADSs. On February 7, 2014, the Executive Branch issued Decree No. 2,334/13, which regulates Law No. 26,893. The changes introduced by Law No. 26,893 are effective from the date of publication of such law in the Official Gazette and are applicable to taxable events consummated from such date onwards. Taxation of Dividends Until Law No. 26,893 became effective, dividends, whether in cash, in shares or in kind, approved by our shareholders were not subject to income tax withholding except for the application of the “Equalization Tax” described below. From the effectiveness of Law No. 26,893, dividends are subject to an income tax withholding (the “Dividend Tax”) at a 10% rate on the amount of such dividends in respect of both Argentine and non-Argentine resident shareholders. However, dividends receivedThe “Dividend Tax” has been repealed by Argentine entities (generally entities organized or incorporated under Argentine law, certain traders and intermediaries, local branches of non-Argentine entities, sole proprietorships and individuals carrying on certain commercial activities in Argentina) are not subject to the 10% tax . 185
Law No. 27.260 for dividend payments since July 22, 2016. Notwithstanding the foregoing, according to Argentine law, and irrespective of the 10% tax mentioned in the previous paragraph, an additionalAn income tax withholding will be applied to the amount of dividends distributed in excess of a company’s net taxable income determined in accordance with general income tax regulations for the fiscal years preceding the date of the distribution of such dividends (the “Equalization Tax”). The legislation requires that companies withhold 35% of the amount of distributed dividends in excess of the net taxable income of such distribution, as determined in accordance with the income tax law. Dividends distributed by an Argentine company are not subject to this tax to the extent that those dividends arise from dividend income or other distributions received by such company from other Argentine companies.
Dividend distributions made in kind (other than cash) will be subject to the same tax rules as cash dividends. Stock dividends on fully paid shares are neithernot subject to Dividend Tax nor to Equalization Tax. In case both the Dividend Tax and the Equalization Tax apply, the latter should be applied first and then the 10% rate of the Dividend Tax should be applied on the remaining amount of dividends (i.e. the effective rate of both taxes on dividends would be 41.5%). Certain tax treaties contemplate the application of a ceiling tax rate on dividends (i.e. 10% on gross dividends).
Taxation of Capital Gains From the effectiveness of Law No. 26,893 income from sale, exchange, disposition or transfer of shares or ADSs is subject to income tax, irrespective of the person that obtains such income, exception made of transactions made by resident individuals involving shares and other securities that are listed on securities exchanges or markets and/or authorized to be offered to the public. Resident individuals Capital gains obtained by resident individuals from the sale of shares and other securities are subject to income tax at a 15% rate on net income, unless such securities were traded in stock markets and/or have public offering authorization, in which case an exemption applies. The amendments introduced by the implementing Decree No. 2,334/13 state that the exemption includes income derived from the sale of shares and other securities made through a stock exchange market duly authorized by the CNV. It is not clear whether the term “includes” (as used in the implementing Decree 2334/2013) means that the exemption only refers to sales of securities made through a stock exchange market duly authorized by the CNV or whether the implementing Decree 2334/2013 intended to clarify that such sales were just one of the possibilities that may be covered by the exemption (in addition to publicly offering authorized securities, as provided in the Argentine Income Tax Law). Certain qualified tax authorities have publicly opined that the exemption exclusively refers to sales of securities made through a stock exchange market duly authorized by the CNV. Losses arising from the sale, exchange or other disposition of shares or ADSs can be applied only to offset such capital gains arising from the sale, exchange or other disposition of these securities, for a five-year carryover period. 186
Foreign beneficiaries Capital gains obtained by non-Argentine individuals or non-Argentine entities from the sale, exchange or other disposition of shares are subject to income tax, as the abovementioned exemption for shares is not applicable to non-Argentine beneficiaries. Therefore, the gain derived from the disposition of shares by foreign beneficiaries is subject to Argentine income tax at a 15% rate on the net capital gain or at a 13.5% rate on the gross price at the seller´s election. However there is currently no regulation under Argentine law with respect to how this election is made. When both seller and buyer are non-residents, the person liable to pay the tax shall be the buyer of the shares, quotas, equity interests and other securities transferred. However, as of the date of this annual report , no regulations have been issued stipulating the withholding and payment mechanism that the non-resident buyer should follow. Notwithstanding the above, based on certain tax precedents, there may be support to argue that gains obtained by a non-resident from the disposal of ADSs should be regarded as foreign source income and, therefore, not subject to Argentine income tax. As this is a controversial issue, further analysis is required.
Argentine entities Capital gains obtained by Argentine entities (in general entities organized or incorporated under Argentine law, certain traders and intermediaries, local branches of non-Argentine entities, sole proprietorships and individuals carrying on certain commercial activities in Argentina) derived from the sale, exchange or other disposition of shares or ADSs are subject to income tax at the rate of 35%. Losses arising from the sale, exchange or other disposition of shares or ADSs can be applied only to offset such capital gains arising from the sale, exchange or other disposition of these securities, for a five-year carryover period. WE RECOMMEND PROSPECTIVE INVESTORS TO CONSULT THEIR OWN TAX ADVISOR REGARDING THE PARTICULAR TAX CONSEQUENCES CONCERNING THE SALE OR OTHER DISPOSITIONS OF SHARES AND ADSs. Value Added Tax The sale, exchange, disposition, or transfer of common shares or ADSs is not subject to Value Added Tax. Tax on Personal Assets Argentine entities, such as us, have to pay the personal assets tax corresponding to Argentine and foreign domiciled individuals and foreign domiciled entities for the holding of our shares. The applicable tax rate for fiscal year 2016 is 0.5%0.25% and is levied on the proportional net worth value (valor patrimonial proporcional), or the book value, of the shares arising from the last balance sheet of the Argentine entity calculated under Argentine GAAP. Pursuant to the Personal Assets Tax Law, the Argentine company is entitled to seek reimbursement of such paid tax from the applicable Argentine domiciled individuals and/or foreign domiciled shareholders. Our shareholders approved the absorption of personal asset tax by us for the years 2002 to 2014.2015. There can be no assurance that in the future this tax will be absorbed by us. Tax on Minimum Notional Income (Impuesto a la Ganancia Mínima Presunta, “IGMP”) Entities domiciled in Argentina, partnerships, foundations, sole proprietorships, trusts, certain mutual funds organized in Argentina, and permanent business establishments owned by foreign persons, among other taxpayers, shall apply a 1% rate to the total value of assets held by such persons, above an aggregate nominal amount of Ps.200,000. Nevertheless, common shares and ADSs issued by entities subject to such tax are exempt from the IGMP. Law No. 27.260 has repealed this tax for fiscal years commenced since January 1, 2019. Turnover Tax The gross turnover tax is a local tax; therefore, the rules of the relevant provincial jurisdiction should be considered, which may levy this tax on the purchase and sale, exchange or other disposition of common shares or ADSs, and/or the collection of dividends at an average rate of 6%, unless an exemption is applicable. In the particular case of the City of Buenos Aires, any transaction involving common shares and/or the collection of dividends and revaluations is exempt from this tax. There is no gross income tax withholding system applicable to the payments made to foreign beneficiaries. Stamp Tax Stamp tax is a local tax that is generally levied on the formal execution of onerous transactions within a certain provincial jurisdiction or outside a certain provincial jurisdiction but with effects in such jurisdiction;jurisdiction. Therefore, the rules of the relevant provincial jurisdiction should be considered for the issuance of instruments which implement onerous transactions (including issuance, subscription, placement and transfer) involving the common shares or ADSs, executed in those jurisdictions, or with effects in those jurisdictions. Notwithstanding, for the City of Buenos Aires, any instrument related to the transfer of shares which public offering is authorized by the CNV is exempt from this tax. Tax on Credits and Debits in Bank Accounts Credits to and debits from bank accounts held at Argentine financial institutions, as well as certain cash payments, are subject to this tax, which is assessed at a general rate of 0.6%. There are also increased rates of 1.2% and reduced rates of 0.075%. Owners of bank accounts subject to the general 0.6% rate may consider 34% of the tax paid upon credits to such bank accounts as a tax credit while taxpayers subject to the 1.2% rate may consider 17% of all tax paid upon credits to such bank accounts as a credit. Such amounts can be utilized as a credit for income tax or tax on presumed minimum income. Other Taxes There are no Argentine federal inheritance or succession taxes applicable to the ownership, transfer or disposition of our common shares or ADSs. The provinces of Buenos Aires and Entre Ríos establish a tax on free transmission of assets, including inheritance, legacies, donations, etc. Free transmission of our shares could be subject to this tax. In the case of litigation regarding the shares before a court of the City of Buenos Aires, a 3% court fee would be charged, calculated on the basis of the claim. Tax Treaties Argentina has entered into tax treaties with several countries. There is currently no tax treaty or convention in effect between Argentina and the United States.
This section is not applicable This section is not applicable. We file annual, quarterly and other information with the SEC. You may read and copy any document that we file at the public reference rooms of the SEC at 450 Fifth Street, N.W., Washington, D.C. 20549 and 500 West Madison Street, Suite 1400, Chicago, Illinois 60661. You may obtain information on the operation of the public reference rooms by calling the SEC at 1-800-SEC-0330. Our Internet address is http://www.cresud.com.ar. It should be noted that nothing on our website should be considered part of this annual report on Form 20-F. You may request a copy of these filings at no cost, by writing or calling the office at +54 (11)-4814-7800. This section is not applicable. In the normal course of business, we are exposed to foreign exchange risk, interest rate risks and other price risk, primarily related to changes in exchange rates and interest rates. We manage our exposure to these risks through the use of various financial instruments, none of which are entered into for trading purposes. We have established policies and procedures governing the use of financial instruments, specifically as they relate to the type and volume of such financial instruments. For further information on our market risks, please see Note 4 to our Audited Consolidated Financial Statements. This item is not applicable This item is not applicable This item is not applicable The Bank of New York Mellon, as depositary for the ADSs (the “Depositary”) collects its fees for delivery directly from investors depositing shares or surrendering ADSs for the purpose of withdrawal. The Depositary also collects taxes and governmental charges from the holders of ADSs. The Depositary collects these fees and charges by deducting those fees from the amounts distributed or by selling a portion of distributable property to pay the fees (after attempting by reasonable means to notify the holder prior to such sale). The Depositary has agreed to reimburse or pay on our behalf, certain reasonable expenses related to our ADS program and incurred by us in connection with the program (such as NASDAQ listing fees, legal and accounting fees incurred with preparation of Form 20-F and ongoing SEC compliance and listing requirements, distribution of proxy materials, investor relations expenses, etc). The Depositary has covered all such expenses incurred by us. During fiscal yearus for the period 2014 - 2015 no such reimbursement was received.for an amount of US$ 50,000, net of taxes. The amounts the Depositary reimbursed or paid are not perforce related to the fees collected by the depositary from ADS holders. The following charges shall be incurred by any party depositing or withdrawing shares or by any party surrendering receipts or to whom receipts are issued (including, without limitation, issuance pursuant to a stock dividend or stock split declared by us or an exchange regarding the receipts or deposited securities or a distribution of receipts), whichever applicable: (1) taxes and other governmental charges, (2) such registration fees as may from time to time be in effect for the registration of transfers of shares generally on the share register of the Company or foreign registrar and applicable to transfers of shares to the name of the Depositary or its nominee or the custodian or its nominee on the making of deposits or withdrawals hereunder, (3) such cable, telex and fax transmission expenses as are expressly provided in the deposit agreement, (4) such expenses as are incurred by the Depositary in the conversion of foreign currency (5) a fee of US$ 5.00 or less per 100 ADS (or portion), (6) a fee of US$ 0.02 or less per ADS (or portion) for any cash distribution made pursuant to the deposit agreement including, but not limited to, and (7) a fee for the distribution of securities, such fee being in an amount equal to the fee for the execution and delivery of ADS referred to above which would have been charged as a result of the deposit of such securities, but which securities are instead distributed by the Depositary to owners. PART II This section is not applicable. A. This section is not applicable. B. This section is not applicable. C. This section is not applicable. D. This section is not applicable. E. This section is not applicable. We maintain disclosure controls and procedures that are designed to ensure that information required to be disclosed in the reports we file or submit under the Exchange Act is recorded, processed, summarized and reported within the time periods specified in the SEC’s rules and forms, and that such information is accumulated and communicated to management, including our Chief Executive Officer and Chief Financial Officer and Chief Administrative Officer, to allow our management to make timely decisions regarding required disclosure. Any controls and procedures, no matter how well designed and operated, can provide only reasonable assurance of achieving the desired control objective. In connection with the preparation of this Annual Report on Form 20-F, we carried out an evaluation under the supervision and with the participation of members of our management team, including our Chief Executive Officer and Chief Financial Officer and Chief Administrative Officer, of the effectiveness of the design and operation of our disclosure controls and procedures (as defined in Rules 13a-15(e) and 15d-15(e) under the Exchange Act) as of June 30, 2015.2016. Based upon this evaluation our Chief Executive Officer and Chief Financial Officer and Chief Administrative Officer concluded that our disclosure controls and procedures as of the end of the period covered by this Annual Report on Form 20-F were effective at the reasonable assurance level. We have been unable to obtain financial statements for IDBD for the year ended December 31, 2014 audited in accordance with U.S. GAAS that may be required to be included in this Annual Report on Form 20-F by Rule 3-09. As of June 30, 2015, we held 49% of IDBD and, as such, we did not control IDBD and did not have the power to direct IDBD or its management to provide us with such audited consolidated financial statements. In reliance on Rule 12b-21 promulgated under the Exchange Act we have provided unaudited consolidated financial statements for IDBD for the year ended December 31, 2014, which do not comply with Rule 3-09. As a result of including such financial information, we do not believe that the omission of the audited consolidated financial statements in accordance with Rule 3-09 will have a material impact on a reader’s understanding of our financial condition or our results of operations.
We are in the process of requesting a waiver from the SEC for filing the audited consolidated financial statements of IDBD for the year ended December 31, 2014 as may be required by Rule 3-09. We cannot provide you with any assurances that we will obtain this waiver. If the SEC does not grant this waiver to us, we will have to file an amendment to this annual report including the financial statements of IDBD for the year ended December 31, 2104 audited in accordance with U.S. GAAS as soon as such financial statements become available. See “Item 3. Key Information – D. Risk Factors.”
Our management is responsible for establishing and maintaining adequate Internal Control over Financial Reporting (as defined in Rules 13a-15(f) and 15d-15(f) under the Exchange Act). Our Internal Control over Financial Reporting includes a series of procedures designed to provide reasonable assurance regarding the reliability of financial reporting and the preparation of consolidated financial statements for external purposes, in accordance with International Financial Reporting Standards and includes those policies and procedures that (1) pertain to the maintenance of records that, in reasonable detail, accurately and fairly reflect the transactions and dispositions of our assets, (2) provide reasonable assurance that transactions are recorded as necessary to permit preparation of consolidated financial statements in accordance with International Financial Reporting Standards and that a company’s receipts and expenditures are being made only in accordance with authorizations of our management and directors, and (3) provide reasonable assurance regarding prevention or timely detection of unauthorized acquisition, use, or disposition of our assets that could have a material effect on our consolidated financial statements. Because of its inherent limitations, Internal Control over Financial Reporting may not prevent or detect misstatements. Also, projections of any evaluation of effectiveness to future periods are subject to the risk that controls may become inadequate because of changes in conditions, or that the degree of compliance with policies and procedures may deteriorate. Management assessed the effectiveness of our Internal Control over Financial Reporting as of June 30, 2015.2016. In making this assessment, management used the criteria set forth by the Committee of Sponsoring Organizations of the Treadway Commission (COSO) in Internal Control–Integrated Framework (1992)(2013). Based on this evaluation, management concluded that our Internal Control over Financial Reporting was effective as of June 30, 2015. Remediation2016. However, the management has excluded IDB Development from its assessment of Prior Year Material Weakness
We have previously disclosedInternal Control over Financial Reporting as of June 30, 2016 because it was acquired by us in purchase business combinations during the fiscal year 2016. IDB Development is an indirect subsidiary (through Tyrus S.A.) whose total assets and total revenues represent 89% and 80%, respectively, of our annual report on Form 20-FAudited Consolidated Financial Statements amount as of and for the year ended June 30, 2014 that we and our independent registered public accounting firm identified the following material weakness. The material weakness related to the failure to effectively interpret the impact of significant, non-routine complex contractual clauses associated with the investment in the associate IDBD.
A material weakness is a deficiency, or combination of deficiencies, in Internal Control over Financial Reporting, such that there is a reasonable possibility that a material misstatement of the Company’s annual or interim financial statements will not be prevented or detected on a timely basis.
We have undertaken the following remedial steps to address the material weakness:
· | Hired additional qualified accounting personnel versed in the technical requirements of IFRS at the subsidiary level to interpret, analyze and account for significant complex contractual provisions; | · | Implemented a process to collect and consolidate all material contractual provisions at the subsidiary level to assist in the appropriate evaluation and documentation requirements required by IFRS; |
· | Implemented additional review by management to confirm proper identification, analysis and implementation of relevant accounting standards going forward; and | · | Trained personnel at both corporate and subsidiary levels to better assess and evaluate contractual provisions and the impact of derivative financial instruments. |
We have implemented and executed these actions above as part of our remediation plans and we have successfully tested them. As of June 30, 2015, we have concluded that the material weakness described in our annual report on Form 20-F for the year ended June 30, 2014 has been remediated.2016.
The effectiveness of the Company’s internal control over financial reporting as of June 30, 20152016 has been audited by Price Waterhouse & Co S.R.L, Buenos Aires Argentina- member firm of PricewaterhouseCoopers International Limited-, an independent registered public accounting firm, as stated in their report which appears herein.
Other than the implementation and refinement of the controls necessary to remediate the previous year’s material weakness, thereThere was no change in our internal control over financial reporting occurred during the period covered by this annual report that has materially affected, or is reasonably likely to materially affect, our internal control over financial reporting.
Item 16. In our annual ordinary shareholders’ meeting held on October 31, 2003, the audit committee was unanimously approved. Pursuant to this plan, the board of directors had to appoint the members of the audit committee who hold expertise in corporate administration, finance and accounting. Our board of directors established an audit committee which would assist the Board in exercising its duty of care on disclosure requirements, the enforcement of accounting policies, management of our business risks, the management of our internal control systems, ethical conduct of our businesses, monitoring the sufficiency of our financial statements, our compliance with laws, independence and capacity of independent auditors and performance of our internal audit and our external auditors. On November 3, 2008,5, 2015, our board of directors officially appointed Jorge Oscar Fernández, Daniel Mellicovsky, and Pedro Damaso Labaqui Palacio, Daniel Elías Mellicovsky and Gabriel Adolfo Gregorio Reznik, all of them independent members, as members of the audit committee. The board of directors named Jorge Oscar Fernández isas the financial expert in accordance with the relevant SEC rules. We have a fully independent audit committee as per the standardstandards provided in Rule 10(A)-3(b)(1). We have adopted a code of ethics that applies to our directors, officers and employees. Our code of ethics is posted in our website www.cresud.com.ar. On July 25, 2005, our Code of Ethics was amended by our board of directors. The amendment was reported in a report on Form 6K on August 1, 2005. If we make any substantive amendment to the code of ethics or if we grant any waivers, including any implicit waiver, from a provision of the code of ethics, we will disclose the nature of such amendment or waiver in a Form 6-K or in our next Forms 20-F to be filed with the SEC. Audit Fees During the fiscal years ended June 30, 20152016 and 2014,2015, we were billed a total amount of Ps. 9.715.7 million and Ps. 8.09.7 million, respectively, for professional services rendered by our principal accountants for the audit of our financial statements and other services normally provided in connection with regulatory filings or engagements. Audit-Related Fees During the fiscal year ended june 30, 2016 no audit-related services were provided. while as of June 30, 2015 and 2014 we were billed a total amount of Ps. 0.1 million and Ps. 0.1 million, respectively, for professional services rendered by our principal accountants for other services related to the audit of our financial statements and other services normally provided in connection with regulatory filings or engagements. Tax Fees During the fiscal year ended June 30, 20152016 and 2014,2015, we were billed a total amount of Ps. 0.01nil and Ps.0.01 million, and Ps. 0.03, respectively for professional services rendered by our principal accountants for tax compliance, tax advice and tax planning. planning All Other Fees During the fiscal years ended June 30, 2015, no such services were provided, while as of June 30, 2014,2016 we were billed for a total amount of Ps. 0.8 million for other professional services rendered by our principal accountants., while as of June 30, 2015 no such services were provided. Audit Committee Pre-Approval Policies and Procedures Our audit committee approves, in advance, the engagement of auditors and their fees for audit and non-audit services pursuant to paragraph (c)(7)(i)(c) of Rule 2-01 of Regulation S-X. Our Audit Committee pre-approves all services, fees and services provided by the external auditors to ensure auditors’ independence. One of the main tasks of the Audit Committee is to give it opinion in relation to the appointment of the external auditors, proposed by the Board of Directors to the General Shareholder’s Meeting. In order to accomplish such task, the Audit Committee shall: • Require any additional and complementary documentation related to this analysis; • Verify the independence of the external auditors; • Analyze different kinds of services that the external auditor would provide to the company. This description must also include an estimate of the fees payable for such services, specifically in order to maintain the principle of independence; • Inform the fees billed by the external auditor, separating the services related to audit services and other special services that could be not included in the audit services previously mentioned. • Take notice of any strategy proposed by of the external auditors and review it in accordance with the reality other business and the risks involved; • Analyze and supervise the working plan of the external auditors considering the business’ reality and the estimated risks; • Propose adjustments (if necessary) to such working plan; • Hold meetings with the external auditors in order to: (a) analyze the difficulties, results and conclusions of the proposed working plan; (b) analyze eventual possible conflicts of interests, related party transactions, compliance with the legal framework and information transparency; • Evaluate the performance of external auditors and their opinion regarding the Financial Statements. This section is not applicable. Issuer Purchases of Equity Securities On August 26, 2008, our Board of Directors decided to establish a share repurchase plan (the “2009 Plan”) under the provisions of the former Section 68 of the Law No. 17,811 (as amended by the transparency decree), currently amended and restated by the Capital Markets Law, in order to help reduce the decline and fluctuations of the price of our shares in the market.
During the fiscal year 2009, under the 2009 Plan, we purchased 30,000,000 common shares, for which we paid US$ 21.0 million and Ps.1.7 million, thus fulfilling the terms and conditions of the 2009 Plan. As a result, by the end of the fiscal year 2009 our investment in our own shares amounted to 5.98% of total capital stock. | Period | Total Number of Shares Purchased | Average Price Paid per Share (Ps.) | Total Number of Shares Purchased as Part of the Publicly Announced Plan | Maximum Number of Shares that may yet be purchased under the plan | | 08/29/08 – 08/31/08 | 31,000 | 3.38 | 31,000 | 9,969,000 | | 09/01/08 – 09/30/08 | 2,122,886 | 3.36 | 2,153,886 | 7,846,114 | | 10/01/08 – 10/31/08 | 9,650,493 | 2.03 | 11,804,379 | 18,195,621 | | 11/01/08 – 11/30/08 | 5,756,140 | 2.02 | 17,560,519 | 12,439,481 | | 12/01/08 – 12/31/08 | 4,382,783 | 2.63 | 21,943,302 | 8,056,698 | | 01/01/09 – 01/31/09 | 2,047,461 | 2.94 | 23,990,763 | 6,009,237 | | 02/01/09 – 02/28/09 | 2,173,860 | 2.70 | 26,164,623 | 3,835,377 | | 03/01/09 – 03/31/09 | 563,692 | 2.61 | 26,728,315 | 3,271,685 | | 04/01/09 – 04/30/09 | 428,052 | 2.91 | 27,156,367 | 2,843,633 | | 05/01/09 – 05/31/09 | 2,843,633 | 3.45 | 30,000,000 | - | | Total | 30,000,000 | | | |
In addition, during November 2009, our Board of Directors, in accordance with the resolutions of the Shareholders’ Meeting dated October 29, 2009, decided to initiate the process of distribution among the shareholders, on a pro rata basis, of 25,000,000 common shares, repurchased under the 2009 Plan. The allotment of shares was calculated over the outstanding capital stock up to October 29, 2009 of Ps. 471,538,610 (0.05301792784 shares per ADR). As a result of the calculation of the allotment, the fractions were settled in cash. 754 shares were not distributed. On April 11, 2014 our Board of Directors decided to initiate a new shares repurchase plan (the “2014 Plan”), under the terms of Article 64 of the Capital Markets Law and the rules of the CNV. Such repurchases were made with our liquid and realized profits and free reserves. As of November 14, 2014, we finalized the 2014 Plan having repurchased a total of 8,633,316 shares, equivalent to 1.72% of the share capital, by a total of Ps. 87.1 million.
| Period | | Total Number of Common Shares Purchased (1) | | | Average Price Paid per Share | | | Total Number of ADR’s Purchased | | | Average Price Paid per Share | | | Total Number of Shares Purchased as Part of the Publicly Announced Plan (2) | | | Maximum Number of Shares that may yet be purchased under the plan | | | | | | | | (Ps.) | | | | | | (US$) | | | | | | | | | 04/17/2014 - 04/30/2014 | | | 14,7 | | | | 6.74 | | | | 59,162 | | | | 11.18 | | | | 606,32 | | | | 18,506,949 | | | 05/01/2014 - 05/31/2014 | | | 33,537 | | | | 10.23 | | | | 171,5 | | | | 12.11 | | | | 1,748,537 | | | | 16,758,412 | | | 06/01/2014 - 06/30/2014 | | | 100,512 | | | | 12.81 | | | | 313,011 | | | | 12.33 | | | | 3,230,622 | | | | 13,527,790 | | | 07/01/2014 - 07/31/2014 | | | 4 | | | | 13.40 | | | | 115,111 | | | | 13.62 | | | | 1,155,110 | | | | 12,372,680 | | | 08/01/2014 - 08/31/2014 | | | 13,657 | | | | 13.23 | | | | 142,989 | | | | 12.28 | | | | 1,443,547 | | | | 10,929,133 | | | 09/01/2014 - 09/30/2014 | | | - | | | | - | | | | 44,918 | | | | 11.86 | | | | 449,18 | | | | 10,479,953 | | | Total | | | 166,406 | | | | | | | | 846,691 | | | | | | | | 8,633,316 | | | | | |
| Period | Total Number of Common Shares Purchased(1) | Average Price Paid per Share | Total Number of ADR’s Purchased | Average Price Paid per Share | Total Number of Shares Purchased as Part of the Publicly Announced Plan (2) | Maximum Number of Shares that may yet be purchased under the plan | | | | (Ps.) | | (US$) | | | | 04/17/2014 - 04/30/2014 | 14,7 | 6.74 | 59,162 | 11.18 | 606,32 | 18,506,949 | | 05/01/2014 - 05/31/2014 | 33,537 | 10.23 | 171,5 | 12.11 | 1,748,537 | 16,758,412 | | 06/01/2014 - 06/30/2014 | 100,512 | 12.81 | 313,011 | 12.33 | 3,230,622 | 13,527,790 | | 07/01/2014 - 07/31/2014 | 4 | 13.40 | 115,111 | 13.62 | 1,155,110 | 12,372,680 | | 08/01/2014 - 08/31/2014 | 13,657 | 13.23 | 142,989 | 12.28 | 1,443,547 | 10,929,133 | | 09/01/2014 - 09/30/2014 | - | - | 44,918 | 11.86 | 449,18 | 10,479,953 | | Total | 166,406 | | 846,691 | | 8,633,316 | |
(1) As of the date of transaction. (2) Correspond to the sum of common shares and ADR’s purchased. Each ADR represents 10 common shares. In addition, during December 2014, our Board of Directors, in accordance with the resolutions of the Shareholders’ Meeting dated November 14, 2014, decided to initiate the process of distribution among the shareholders, on a pro rata basis, of 5,565,479 common shares, repurchased under the 2014 Plan. The allotment of shares was calculated over the outstanding capital stock up to December 12, 2014 of Ps. 487,928,660 (10 shares per ADR). As a result of the calculation of the allotment, the fractions were settled in cash. 746 shares were not distributed. As a result as of the date of this annual report, theJune 30, 2016, our investment in own shares amounts to 1,37%1.30% of total capital stock.stock. This section is not applicable. Compliance with NASDAQ listing standards on corporate governance Significant differences between our corporate governance practices and U.S. companies’ practices under NASDAQ Rules: Our corporate governance practices are governed by the applicable Argentine law; particularly, the Argentine Corporations Law, the Capital Markets Law and the rules of the CNV, as well as by ours by-laws. We have securities that are registered with the Securities and Exchange Commission and are listed on the NASDAQ, and are therefore subject to corporate governance requirements applicable to NASDAQ-listed non-US companies (a “NASDAQ-listed” company). Pursuant to NASDAQ Rule 5615(a)(3), NASDAQ -listed non-U.S. companies that are categorized as “Foreign Private Issuers” may follow home country corporate governance practices in lieu of certain of the corporate governance requirements provided in NASDAQ Rules, provided that the foreign private issuer complies with certain mandatory sections of NASDAQ Rules, discloses each requirement that it does not follow and describes the home country practice followed in lieu of such requirement. The requirements of the NASDAQ Rules and the Argentine corporate governance practices that we follow in lieu thereof are described below:
| NASDAQ Standards for U.S. companies | CRESUD’S CORPORATE PRACTICES | | Rule 5250(d) - Distribution of Annual and Interim Reports. | In lieu of the requirements of Rule 5250(d), we follow Argentine law, which requires that companies issue publicly a Spanish language annual report, including annual Audited Consolidated Financial Statements prepared in accordance with generally accepted accounting principles in Argentina, by filing such annual report with the CNV and the stock exchange in which the securities are listed, within 70 calendar days following the close of our fiscal year. Interim reports must be filed with the CNV and the stock exchange in which the securities are listed within 42 calendar days following the close of each fiscal quarter. We provide our shareholders a copy of the annual and interim financial reports upon request. English language translations of our annual reports and interim reports are filed with the SEC on Form 20-F and Form 6-K, respectively. We also send the English language translation of our annual report and quarterly press releases on its website. Furthermore, under the terms of the Deposit Agreement, dated as of March 18, 1997, among us, The Bank of New York Mellon, as depositary, and owners of ADSs issued thereunder, we are required to furnish The Bank of New York Mellon with, among other things, English language translations of their annual reports. Annual reports are available for inspection by ADR holders at the offices of The Bank of New York located at, 101 Barclay Street, 22 Floor, New York, New York. Finally, Argentine law requires that 20 calendar days before the date of a shareholders’ meeting, the board of directors must provide to our shareholders, at our executive office or through electronic means, all information relevant to the shareholders’ meeting, including copies of any documents to be considered by the shareholders (which includes the annual report). | | Rule 5605(b)(1) - Majority of Independent Directors. | In lieu of the requirements of Rule 5605(b)(1), we follow Argentine law which does not require that a majority of the board of directors be comprised of independent directors. Argentine law instead requires that public companies in Argentina, such as, us must have a sufficient number of independent directors to be able to form an audit committee of at least three members, the majority of which must be independent pursuant to the criteria established by the CNV. | | Rule 5605(b)(2) - Executive Sessions of the Board of Directors. | In lieu of the requirements of Rule 5605(b)(2), we follow Argentine law which does not require independent directors to hold regularly scheduled meetings at which only such independent directors are present (i.e., executive sessions). Our board of directors as a whole is responsible for monitoring our affairs. In addition, under Argentine law, the board of directors may approve the delegation of specific responsibilities to designated directors or non-director managers of the Company. Also, it is mandatory for public companies to form a supervisory committee (composed of “syndics”) which is responsible for monitoring our legal compliance under Argentine law and compliance with our by-laws. Finally, our audit committee has regularly scheduled meetings and, as such, such meetings will serve a substantially similar purpose as executive sessions. | | Rule 5605(d)(B) - Compensation of Officers. | In lieu of the requirements of Rule 5605(d)(B), we follow Argentine law which does not require companies to form a compensation committee comprised solely of independent directors. For the determination of the compensation of the chief executive officer and all other executive officers no decision of a majority of independent directors or a compensation committee comprised solely of independent directors is required under Argentine law. Under Argentine law, the board of directors is the corporate body responsible for determining the compensation of the chief executive officer and all other executive officers, so long as they are not directors. In addition, under Argentine law, the audit committee shall give its opinion about the reasonableness of management’s proposals on fees and option plans for our directors or managers. | | Rule 5605(e) - Nomination of Directors. | In lieu of the requirements of Rule 5605(e), we follow Argentine law which requires that directors be nominated directly by the shareholders at the shareholders’ meeting and that they be selected and recommended by the shareholders themselves. Under Argentine law, it is the responsibility of the ordinary shareholders’ meeting to appoint and remove directors and to set their compensation. | | Rule 5605(c)(1) - Audit Committee Charter. | In lieu of the requirements of Rule 5605(c)(1), we follow Argentine law which requires that audit committees have a charter but does not require that companies certify as to the adoption of the charter nor does it require an annual review and assessment thereof. Argentine law instead requires that companies prepare a proposed plan or course of action with respect to those matters which are the responsibility of our audit committee. Such plan or course of action could, at the discretion of our audit committee, include a review and assessment of the audit committee charter. We believe that we are in compliance with the requirements for audit committee charters provided for in the Sarbanes Oxley Act. | | Rule 5605(c)(2) - Audit Committee Composition. | Argentine law does not require that companies have an audit committee comprised solely of independent directors and it is equally not customary business practice in Argentina to have such a committee. Argentine law instead requires that companies establish an audit committee with at least three members comprised of a majority of independent directors as defined by Argentine law. Nonetheless, although not required by Argentine law, we have a three member audit committee comprised of entirely independent directors in accordance with Rule 10(A)-3(b)(1) of the General rules and regulations promulgated under the Securities Exchange Act of 1934, as independence is defined in Rule 10(A)-3(b)(1). Further, Argentine law does not require companies to identify or designate a financial expert. As such, Although all the members of the audit committee have large corporate experience, as of the date of this annual report, the Board of Directors have not named designated a financial expert in accordance with the relevant SEC ruleson the audit committee. Although it is noted that all members of the audit committee have had significant corporate experience. In addition, we have a supervisory committee (“comisión fiscalizadora”) composed of three ‘syndics’ which are in charge of monitoring the legality, under Argentine law, of the actions of our board of directors and the conformity of such actions with our by-laws. | | Rule 5620(c) - Quorum. | In lieu of the requirements of Rule 4350(f), we follow Argentine law and our bylaws, which distinguish between ordinary meetings and extraordinary meetings and require,both of them can be celebrated using teleconference technology, as long as the regulations related to accreditation, registration and quorum are complied with and the simultaneity of the shareholders and immediately of the process of verbal communication and issuance of votes is guaranteed. The supervisory committee shall state the regularity of the resolutions adopted. The board of directors shall establish the rules and technical matters related to remote participation pursuant to the current rules and in conformity with the National Exchange Commission regulations. Shareholders physically present at the time and those using teleconference technologies will be taken into consideration for the quorum. In connection with ordinary meetings, that a quorum consistconsists of a majority of stocks entitled to vote. If no quorum is present at the first meeting, a second meeting may be called, in which the shareholders present or communicated through teleconference technologies, regardless of their number, constitute a quorum. Resolutions may be adopted by an absolute majority of the votes present.present or communicated through teleconference technologies. Argentine law, and our bylaws, requires in connection with extraordinary meetings, that a quorum consist of 60% of the stock entitled to vote. However, if such quorum is not present at the first meeting, our bylaws provide that a second meeting may be called and may be held with the number of shareholders present.present or communicated through teleconference technologies. In both ordinary and extraordinary meetings, decisions are adopted by an absolute majority of votes present at the meeting or communicated through teleconference technologies, except for certain fundamental matters (such as mergers and spin-offs (when we are not the surviving entity and the surviving entity is not listed on any stock exchange), anticipated liquidation, change in its domicile outside of Argentina, total or partial recapitalization of its statutory capital following a loss, any transformation in our corporate legal form or a substantial change in our corporate purpose, or the issue of bonds) which require an approval by vote of the majority of all the stock entitled to vote (all stock being entitled to only one vote.vote). | | Rule 5620(b) -- Solicitation of Proxies. | In lieu of the requirements of Rule 5620(b), we follow Argentine law which requires that notices of shareholders’ meetings be published, for five consecutive days, in the Official Gazette and in a widely published newspaper in Argentina no earlier than 45 calendar days prior to the meeting and at least 20 calendar days prior to such meeting. In order to attend a meeting and be listed on the meeting registry, shareholders are required to submit evidence of their book-entry share account held at Caja de Valores S.A. up to three business days prior to the scheduled meeting date. If entitled to attend the meeting, a shareholder may be represented by proxy (properly executed and delivered with a certified signature) granted to any other person, with the exception of a director, syndic, member of the Supervisory Committee, manager or employee of the issuer, which are prohibited by Argentine law from acting as proxies. In addition, our ADS holders receive, prior to the shareholders’ meeting, a notice listing the matters on the agenda, a copy of the annual report and a voting card. | | Rule 5630(s) -- Conflicts of Interest | In lieu of the requirements of Rule 5630(a), we follow Argentine law which requires that related party transactions be approved by the audit committee when the transaction exceeds one percent (1%) of the corporation’s net worth, measured pursuant to the last audited balance sheet,. Directors can contract with the corporation only on an arm’s length basis. If the contract is not in accordance with prevailing market terms, such transaction must be pre-approved by the board of directors (excluding the interested director). In addition, under Argentine law, a shareholder is required to abstain from voting on a business transaction in which its interests may be in conflict with the interests of the company. In the event such shareholder votes on such business transaction and such business transaction would not have been approved without such shareholder’s vote, such shareholder may be liable to the company for damages and the resolution may be declared void. |
This section is not applicable.
We have responded to Item 18 in lieu of responding to this Item. Reference is made to pages F-1 through F-374.F-309 Index to Financial Statements (see page F-1). Exhibit No.Description of Exhibit | 1.1* | By-laws (Estatutos) of the registrant, which serve as the registrant’s articles of incorporation and by-laws, and an English translation thereof. | | 1.2**** | English translation of the amendment to the bylaws. | | 1.3********* | Amended and restated English translation of the bylaws. | 1.41.4********** | bylaws. | | 2.1******* | Indenture dated September 7, 2011, among us, as issuer, the Bank of New York Mellon, as trustee, co-registrar, principal paying agent and transfer agent, Banco Santander Rio, S.A., as registrar, paying agent, transfer agent and representative of the trustee in Argentina, and The Bank of New York Mellon (Luxembourg) S.A., as Luxembourg Paying and Transfer Agent, for the issuance of the U.S.$US$ 60,000,000, 7.50% Fourth Series, Class VIII Senior Notes Due 2014. | | 2.2 | Indenture, dated July 20, 2010, between IRSA Inversiones y Representaciones Sociedad Anónima as Issuer, The Bank of New York Mellon as Trustee, Co-Registrar, Principal Paying Agent and Transfer Agent, and Banco Santander Río S.A. as Registrar, Paying Agent, Transfer Agent and Representative of the Trustee in Argentina, with respect to IRSA Inversiones y Representaciones S.A.’s US$400,000,000 Global Note Program, pursuant to which US$150,000,000 aggregate principal amount of IRSA Inversiones y Representaciones Sociedad Anónima’s 11.500% Notes due 2020, Series No. 2, were issued. | | 2.3 | First Supplemental Indenture, dated March 28, 2016, between IRSA Inversiones y Representaciones Sociedad Anónima as Issuer and The Bank of New York Mellon as Trustee, Co-Registrar, Principal Paying Agent and Transfer Agent to the Indenture, dated July 20, 2010, between IRSA Inversiones y Representaciones Sociedad Anónima as Issuer, The Bank of New York Mellon as Trustee, Co-Registrar, Principal Paying Agent and Transfer Agent, and Banco Santander Río S.A. as Registrar, Paying Agent, Transfer Agent and Representative of the Trustee in Argentina, with respect to IRSA Inversiones y Representaciones Sociedad Anónima’s US$400,000,000 Global Note Program, pursuant to which US$150,000,000 aggregate principal amount of IRSA Inversiones y Representaciones Sociedad Anónima’s 11.500% Notes due 2020, Series No. 2, were issued. | | 2.4 | Indenture, dated March 23, 2016, between IRSA Propiedades Comerciales S.A. as Issuer, The Bank of New York Mellon as Trustee, Co-Registrar, Principal Paying Agent and Transfer Agent, and Banco Santander Río S.A. as Registrar, Paying Agent, Transfer Agent and Representative of the Trustee in Argentina, with respect to IRSA Propiedades Comerciales S.A.’s US$500,000,000 Global Note Program, pursuant to which US$360,000,000 000 aggregate principal amount of IRSA Propiedades Comerciales S.A.’s 8.750% Notes due 2023, Series No. 2, were issued. | | 2.5 | First Supplemental Indenture, dated March 23, 2016, between IRSA Propiedades Comerciales S.A., as Issuer and The Bank of New York Mellon, as Trustee, Co-Registrar, Principal Paying Agent and Transfer Agent, The Bank of New York Mellon (Luxembourg) S.A., as Luxembourg Paying Agent and Luxembourg Transfer Agent and Banco Santander Río S.A., as Registrar, Paying Agent, Transfer Agent and Representative of the Trustee in Argentina to the Indenture, dated March 23, 2016, between IRSA Propiedades Comerciales S.A. as Issuer, The Bank of New York Mellon as Trustee, Co-Registrar, Principal Paying Agent and Transfer Agent, and Banco Santander Río S.A. as Registrar, Paying Agent, Transfer Agent and Representative of the Trustee in Argentina, with respect to IRSA Propiedades Comerciales S.A.’s US$500,000,000 Global Note Program, pursuant to which US$360,000,000 000 aggregate principal amount of IRSA Propiedades Comerciales S.A.’s 8.750% Notes due 2023, Series No. 2, were issued. | | 4.1* | Consulting Agreement among Cresud S.A.C.I.F. y A. and Dolphin Fund Management S.A. dated October 25, 1994. | | 4.2** | | | 4.3**** | | | 4.4***** | | | 4.5****** | | | 4.6******* | | | 4.7******** | | | 4.8********* | | | 4.9********* | | 4.104.10********** | | | 4.11 | English translation of the Eighth Agreement for the Implementation of the Amendment to the Corporate Services Master Agreement dated November 12, 2015. | | 8.1 | List of Subsidiaries. | | 11.1*** | Code of Ethics. | | 12.1 | | | 12.2 | | | 13.1 | |
| 13.2 | Certification pursuant to 18 U.S.C. 1350, as adopted pursuant to Section 906 of the Sarbanes-Oxley Act of 2002 for Chief Financial Officer. | 15.1 | Consolidated financial statements of IDBD Development Corporation Ltd. as of and for the year ended December 31, 2014 unaudited (not in compliance with U.S. GAAS) |
*Incorporated herein by reference to the exhibit to the registrant’s registration statement on Form F-1 (File No. 333-06548) filed with the SEC on March 3, 1997. ** Incorporated herein by reference to the report statement on Form 6-K (File No. 333-06548) filed with the SEC on July 1, 2004. *** Incorporated herein by reference to the registrant’s report on Form 6-K (File No. 333-06548) filed with the SEC on August 1, 2005. **** Incorporated herein by reference to the annual report on Form 20-F (File No. 333-06548) filed with the SEC on December 27, 2007. ***** Incorporated herein reference to the annual report on Form 20-F (File No. 333-06548) filed with the SEC on December 30, 2009. ****** Incorporated herein reference to the annual report on Form 20-F (File No. 333-06548) filed with the SEC on December 30, 2010. ******* Incorporated herein reference to the annual report on Form 20-F (File No. 333-06548) filed with the SEC on December 28, 2011. ******** Incorporated herein reference to the annual report on Form 20-F (File No. 333-06548) filed with the SEC on October 30, 2012. ********* Incorporated herein reference to the annual report on Form 20-F (File No. 333-06548) filed with the SEC on October 31, 2014. ********** Incorporated herein reference to the annual report on Form 20-F (File No. 333-06548) filed with the SEC on November 17, 2015.
SIGNATURES The registrant hereby certifies that it meets all of the requirements for filing on Form 20-F and that it has duly caused and authorized the undersigned to sign this Form 20-Fannual report on its behalf. | | Cresud S.A.C.I.F. y A.CRESUD SOCIEDAD ANÓNIMA COMERCIAL INMOBILIARIA FINANCIERA Y AGROPECUARIA | | | | | | | Date Novermber 17, 2015October 31, 2016 | By: | /s/ MatíasMatias I. Gaivironsky | | | | | Name Matías I. Gaivironsky | | | | | Title Chief Financial and Administrative Officer | | | | | |
INDEX TO THE CONSOLIDATED FINANCIAL STATEMENTS
| Cresud Sociedad Anónima Comercial, Inmobiliaria, Financiera y Agropecuaria | | | Page | | Report of Independent Registered Public Accounting Firm | | | Glossary of terms | F - 21 | Consolidated Statements of Financial Position as of June 30, 20152016 and 20142015 | F - 42
| Consolidated Statements of (Operations) / Income for the fiscal years ended June 30, 2016, 2015 2014 and 20132014 | F - 64
| Consolidated Statements of Comprehensive (Operations) / Income for the fiscal years ended June 30, 2016, 2015 2014 and 20132014 | F - 75
| Consolidated Statements of Changes in Shareholders’Shareholders’ Equity for the fiscal years ended June 30, 2016, 2015 2014 and 2013 2014 | F - 86
| Consolidated Statements of Cash Flows for the fiscal years ended June 30, 2016, 2015 2014 and 20132014 | F - 119
| | Notes to the Consolidated Financial Statements | F - 1210 | Schedule I
| F – 194 | Schedule II
| F - 197 | Schedule III
| F - 199 |
Report of Independent Registered Public Accounting Firm
To the Board of Directors and Shareholders of Cresud Sociedad Anónima Comercial, Inmobiliaria, Financiera y Agropecuaria
In our opinion, the accompanying consolidated statements of financial position and the related consolidated statements of income, comprehensive income, changes in shareholders’ equity and cash flows present fairly, in all material respects, the financial position of Cresud Sociedad Anónima, Comercial, Inmobiliaria, Financiera y Agropecuaria and its subsidiaries at June 30, 20152016 and 2014,2015, and the results of their operations and their cash flows for each of the three years in the period ended June 30, 20152016 in conformity with International Financial Reporting Standards as issued by the International Accounting Standards Board. In addition, in our opinion, the financial statement schedules listed in the accompanying indexpresent fairly, in all material respects, the information set forth therein when read in conjunction with the related consolidatedfinancial statements. Also, in our opinion, the Company maintained, in all material respects, effective internal control over financial reporting as of June 30, 2015,2016, based on criteria established in Internal Control - Integrated Framework (1992) 2013 issued by the Committee of Sponsoring Organizations of the Treadway Commission (COSO). The Company's management is responsible for these financial statements and financial statement schedules, for maintaining effective internal control over financial reporting and for its assessment of the effectiveness of internal control over financial reporting, included in accompanying Management’s Annual Report on Internal Control Over Financial Reporting under Item 15.
Our responsibility is to express opinions on these financial statements,on the financial statement schedules, and on the Company's internal control over financial reporting based on our integrated audits. We conducted our audits in accordance with the standards of the Public Company Accounting Oversight Board (United States). Those standards require that we plan and perform the audits to obtain reasonable assurance about whether the financial statements are free of material misstatement and whether effective internal control over financial reporting was maintained in all material respects. Our audits of the financial statements included examining, on a test basis, evidence supporting the amounts and disclosures in the financial statements, assessing the accounting principles used and significant estimates made by management, and evaluating the overall financial statement presentation. Our audit of internal control over financial reporting included obtaining an understanding of internal control over financial reporting, assessing the risk that a material weakness exists, and testing and evaluating the design and operating effectiveness of internal control based on the assessed risk. Our audits also included performing such other procedures as we considered necessary in the circumstances. We believe that our audits provide a reasonable basis for our opinions.
The accompanying financial statements have been prepared assuming that the Company will continue as a going concern. As discussed in Note 1 to the consolidated financial statements, there are risks and uncertainties in relation to the Company’s subsidiary IDB Development. These financial statements do not include any adjustments related to the valuation of IDBD’s assets and liabilities that would be required if IDBD were not able to continue as a going-concern.
A company’s internal control over financial reporting is a process designed to provide reasonable assurance regarding the reliability of financial reporting and the preparation of financial statements for external purposes in accordance with generally accepted accounting principles. A company’s internal control over financial reporting includes those policies and procedures that (i) pertain to the maintenance of records that, in reasonable detail, accurately and fairly reflect the transactions and dispositions of the assets of the company; (ii) provide reasonable assurance that transactions are recorded as necessary to permit preparation of financial statements in accordance with generally accepted accounting principles, and that receipts and expenditures of the company are being made only in accordance with authorizations of management and directors of the company; and (iii) provide reasonable assurance regarding prevention or timely detection of unauthorized acquisition, use, or disposition of the company’s assets that could have a material effect on the financial statements. Because of its inherent limitations, internal control over financial reporting may not prevent or detect misstatements. Also, projections of any evaluation of effectiveness to future periods are subject to the risk that controls may become inadequate because of changes in conditions, or that the degree of compliance with the policies or procedures may deteriorate.
As described in “Management´s Annual Report on Internal Control over Financial Reporting”, management has excluded IDB Development from its assessment of internal control over financial reporting as June 30, 2016 because it was acquired by the Company in a purchase business combination during 2016. We have also excluded IDB Development from our audit of internal control over financial reporting. IDB Development is an indirect subsidiary (through Tyrus S.A.) whose total assets and total revenue represent 89 % and 80 %, respectively, of the related consolidated financial statement amounts as of and for the year ended June 30, 2016.
PRICE WATERHOUSE & Co. S.R.L.
By:/s/Carlos Martin Barbafina(Partner) /s/ Carlos Martín Barbafina (Partner) Buenos Aires, Argentina November 17, 2015October 31, 2016
Glossary of terms The followings are not technical definitions, but help the reader to understand certain terms used in the wording of the notes to the Group’s Financial Statements. | Terms | | Definitions | | Acres | | Agropecuaria Acres del Sud S.A. | | Adama | | Adama Agricultural Solutions Ltd. | | BACS | | Banco de Crédito y Securitización S.A. | | Baicom | | Baicom Networks S.A. | | Bartan | | Bartan Holdings and Investments Ltd. | | BASE | | Buenos Aires Stock Exchange | | BCRA | | Central Bank of the Argentine Republic | | BHSA | | Banco Hipotecario S.A. | | Bitania | | Bitania 26 S.A. | | BMBY | | Buy Me Buy You (Note 3.A.a) | | Brasilagro | | Brasilagro-Companhia Brasileira de Propriedades Agrícolas | | CAMSA | | Consultores Assets Management S.A. | | Carnes Pampeanas | | Sociedad Anónima Carnes Pampeanas S.A. | | Cellcom | | Cellcom Israel Ltd. | | Clal | | Clal Holdings Insurance Enterprises Ltd. | | CNV | | Securities Exchange Commission | | CODM | | Chief Operating Decision Maker | | Condor | | Condor Hospitality Trust Inc. | | Cresud, the Company or us | | Cresud S.A.C.I.F. y A. | | Cyrsa | | Cyrsa S.A. | | DFL | | Dolphin Fund Ltd. | | DIC | | Discount Investment Corporation Ltd. | | DN B.V. | | Dolphin Netherlands B.V. | | Dolphin | | Dolphin Fund Ltd. and Dolphin Netherlands B.V. | | EHSA | | Entertainment Holdings S.A. | | ENUSA | | Entretenimiento Universal S.A. | | ERSA | | Emprendimiento Recoleta S.A. | | Financial Statements | | Consolidated Financial Statements | | ETHB | | ETH Bioenergía S.A. | | ETH | | C.A.A. Extra Holdings Ltd. | | CPF | | Collective Promotion Funds | | IAS | | International Accounting Standards | | IASB | | International Accounting Standards Board | | IDB Tourism | | IDB Tourism (2009) Ltd. | | IDBD | | IDB Development Corporation Ltd. | | IDBGI | | IDB Group Investment Inc. | | IDBH | | IDB Holdings Corporation Ltd. | | IFISA | | Inversiones Financieras del Sur S.A. | | IFRIC | | International Financial Reporting Standards Interpretation Committee | | IFRS | | International Financial Reporting Standard | | MPIT | | Minimun Presumed Income Tax | | Indarsa | | Inversora Dársena Norte S.A. | | IRSA | | IRSA Inversiones y Representaciones Sociedad Anónima | | IRSA CP | | IRSA Propiedades Comerciales S.A. | | Koor | | Koor Industries Ltd. | | Lipstick | | Lipstick Management LLC | | LRSA | | La Rural S.A. | | Metropolitan | | Metropolitan 885 Third Avenue Leasehold LLC | | NASDAQ | | National Association of Securities Dealers Automated Quotation | | NCN | | Non-convertible Notes | | NFSA | | Nuevas Fronteras S.A. | | New Lipstick | | New Lipstick LLC | | NIS | | New Israeli Shekel | | NPSF | | Nuevo Puerto Santa Fe S.A. | | NYSE | | New York Stock Exchange | | Ombú | | Ombú Agropecuaria S.A. | | PAMSA | | Panamerican Mall S.A. | | PBC | | Property & Building Corporation Ltd. | | PBEL | | PBEL Real Estate Ltd. | | Puerto Retiro | | Puerto Retiro S.A. | | Quality | | Quality Invest S.A. | | Rigby | | Rigby 183 LLC | | Shufersal | | Shufersal Ltd. | | SRA | | Sociedad Rural Argentina | | Tarshop | | Tarshop S.A. | | TASE | | Tel Aviv Stock Exchange | | Tender offers | | Share repurchase commitment | | Yuchan | | Yuchán Agropecuaria S.A. | | Yatay | | Yatay Agropecuaria S.A. |
Cresud Sociedad Anónima, Comercial, Inmobiliaria, Financiera y Agropecuaria
Consolidated Statements of Financial Position as of June 30, 20152016 and 20142015 (All amounts in thousandsmillions of Argentine Pesos, except shares and per share data and as otherwise indicated)
| | | Note | 06.30.16 | | 06.30.15 | ASSETS | Note | | | 06.30.15 | | | | 06.30.14 | | | | | | | Non-current assets | | | | | | | | | | | | | | | Investment properties | 10 | | | 3,474,959 | | | | 3,454,616 | | 10 and Schedule I
| 49,766 | | 3,475 | | Property, plant and equipment | 11 | | | 1,977,195 | | | | 2,381,956 | | 11 | 26,300 | | 1,977 | | Trading properties | 12 | | | 129,654 | | | | 132,555 | | 12 | 4,472 | | 130 | | Intangible assets | 13 | | | 175,763 | | | | 175,007 | | 13 | 11,814 | | 176 | | Biological assets | 14 | | | 458,879 | | | | 444,853 | | 14 | 677 | | 459 | | Investments in associates and joint ventures | 8, 9 | | | 2,772,685 | | | | 2,375,339 | | | | Investments in joint ventures and associates | | 8,9 | 16,534 | | 2,772 | | Deferred income tax assets | 28 | | | 652,186 | | | | 852,642 | | 25 | 1,658 | | 653 | | Income tax credit | | | | 160,457 | | | | 177,547 | | | 173 | | 160 | | Restricted assets | 17 | | | 4,301 | | | | 50,897 | | | 129 | | 4 | | Trade and other receivables | 18 | | | 426,777 | | | | 475,349 | | 17 | 3,773 | | 427 | | Financial assets held for sale | | 18 | 3,346 | | - | | Investment in financial assets | 19 | | | 622,845 | | | | 275,012 | | 16 | 2,226 | | 623 | | Derivative financial instruments | 20 | | | 207,602 | | | | 233 | | 19 | 8 | | 208 | | Employee benefits | | | 4 | | - | | Total non-current assets | | | | 11,063,303 | | | | 10,796,006 | | | 120,880 | | 11,064 | | Current Assets | | | | | | | | | | | | | | | Trading properties | 12 | | | 3,300 | | | | 4,596 | | 12 | 241 | | 3 | | Biological assets | 14 | | | 119,998 | | | | 195,830 | | 14 | 455 | | 120 | | Inventories | 15 | | | 511,350 | | | | 439,771 | | 15 | 3,900 | | 511 | | Restricted assets | 17 | | | 607,021 | | | | - | | | 748 | | 607 | | Income tax credit | | | | 30,749 | | | | 19,694 | | | 541 | | 31 | | Assets held for sale | 44 | | | - | | | | 1,357,866 | | | | Financial assets held for sale | | 18 | 1,256 | | - | | Trade and other receivables | 18 | | | 1,772,373 | | | | 1,438,408 | | 17 | 14,158 | | 1,772 | | Investment in financial assets | 19 | | | 504,102 | | | | 495,633 | | 16 | 9,673 | | 504 | | Derivative financial instruments | 20 | | | 29,554 | | | | 32,897 | | 19 | 53 | | 30 | | Cash and cash equivalents | 21 | | | 633,693 | | | | 1,002,987 | | 20 | 14,096 | | 634 | | Total current assets | | | | 4,212,140 | | | | 4,987,682 | | | 45,121 | | 4,212 | | TOTAL ASSETS | | | | 15,275,443 | | | | 15,783,688 | | | 166,001 | | 15,276 | | SHAREHOLDERS’ EQUITY | | | | | | | | | | | | | | | Capital and reserves attributable to equity holders of the parent | | | | | | | | | | | | | | | Share capital | | | | 494,777 | | | | 490,997 | | | 495 | | 495 | | Treasury stock | | | | 6,866 | | | | 10,566 | | | | Inflation adjustment of share capital | | | | 64,530 | | | | 64,047 | | | | Inflation adjustment of treasury stock | | | | 895 | | | | 1,378 | | | | Treasury shares | | | 7 | | 7 | | Inflation adjustment of share capital and treasury shares | | | 65 | | 65 | | Share premium | | | | 659,464 | | | | 773,079 | | | 659 | | 659 | | Additional paid-in capital from treasury stock | | | | 12,678 | | | | - | | | | Cost of treasury stock | | | | (32,198 | ) | | | (54,876 | ) | | | Share warrants | | | | - | | | | 106,264 | | | | Changes in non-controlling interests | | | | 53,806 | | | | (15,429 | ) | | | Cumulative translation adjustment | | | | 443,096 | | | | 633,607 | | | | Equity-settled compensation | | | | 81,988 | | | | 70,028 | | | | Additional paid-in capital from treasury shares | | | 16 | | 13 | | Legal reserve | | | | - | | | | 81,616 | | | 83 | | - | | Reserve for new developments | | | | - | | | | 17,065 | | | | Special Reserve | | | | - | | | | 633,940 | | | | Reserve for the acquisition of securities issued by the company | | | | 32,198 | | | | 200,000 | | | | Accumulated deficits | | | | (246,069) | | | | (1,066,428 | ) | | | Other reserves | | 27 | 1,086 | | 579 | | Accumulated Deficit | | | (1,390) | | (245) | | Equity attributable to equity holders of the parent | | | | 1,572,031 | | | | 1,945,854 | | | 1,021 | | 1,573 | | Non-controlling interest | | | | 2,329,927 | | | | 2,488,932 | | | 14,211 | | 2,330 | | TOTAL SHAREHOLDERS’ EQUITY | | | | 3,901,958 | | | | 4,434,786 | | | 15,232 | | 3,903 |
The accompanying notes are an integral part of these Consolidated Financial Statements.
Cresud Sociedad Anónima, Comercial, Inmobiliaria, Financiera y Agropecuaria
Consolidated Statements of Financial Position(Continued) as of June 30, 20152016 and 20142015 (Continued) (All amounts in thousandsmillions of Argentine Pesos, except shares and per share data and as otherwise indicated)
| | Note | 06.30.16 | | 06.30.15 | | LIABILITIES | | | | | | Non-current liabilities | | | | | | Trade and other payables | 21 | 1,528 | | 264 | | Borrowings | 23 | 93,808 | | 5,833 | | Deferred income tax liabilities | 25 | 7,662 | | 151 | | Derivative financial instruments | 19 | 121 | | 270 | | Payroll and social security liabilities | | 21 | | 5 | | Provisions | 22 | 1,341 | | 387 | | Employee benefits | 24 | 689 | | - | | Total non-current liabilities | | 105,170 | | 6,910 | | Current liabilities | | | | | | Trade and other payables | 21 | 18,443 | | 1,307 | | Income tax and minimum presumed income tax liabilities | | 624 | | 142 | | Payroll and social security liabilities | | 1,856 | | 230 | | Borrowings | 23 | 23,488 | | 2,466 | | Derivative financial instruments | 19 | 147 | | 263 | | Provisions | 22 | 1,041 | | 55 | | Total current liabilities | | 45,599 | | 4,463 | | TOTAL LIABILITIES | | 150,769 | | 11,373 | | TOTAL SHAREHOLDERS’ EQUITY AND LIABILITIES | | 166,001 | | 15,276 |
| | Note | | | 06.30.15 | | | | 06.30.14 | | | LIABILITIES | | | | | | | | | | | Non-current liabilities | | | | | | | | | | | Trade and other payables | 22 | | | 264,054 | | | | 216,760 | | | Borrowings | 25 | | | 5,832,973 | | | | 5,315,335 | | | Deferred income tax liabilities | 28 | | | 150,691 | | | | 470,045 | | | Derivative financial instruments | 20 | | | 269,949 | | | | 320,847 | | | Payroll and social security liabilities | 23 | | | 5,539 | | | | 5,041 | | | Provisions | 24 | | | 386,948 | | | | 220,489 | | | Total non-current liabilities | | | | 6,910,154 | | | | 6,548,517 | | | Current liabilities | | | | | | | | | | | Trade and other payables | 22 | | | 1,306,835 | | | | 1,004,180 | | | Income tax liabilities | | | | 142,361 | | | | 73,429 | | | Payroll and social security liabilities | 23 | | | 230,400 | | | | 202,546 | | | Borrowings | 25 | | | 2,466,030 | | | | 2,639,491 | | | Derivative financial instruments | 20 | | | 262,734 | | | | 53,419 | | | Provisions | 24 | | | 54,971 | | | | 20,708 | | | Liabilities held for sale | 44 | | | - | | | | 806,612 | | | Total current liabilities | | | | 4,463,331 | | | | 4,800,385 | | | TOTAL LIABILITIES | | | | 11,373,485 | | | | 11,348,902 | | | TOTAL SHAREHOLDERS’ EQUITY AND LIABILITIES | | | | 15,275,443 | | | | 15,783,688 | |
The accompanying notes are an integral part of these Consolidated Financial Statements.
Cresud Sociedad Anónima, Comercial, Inmobiliaria, Financiera y Agropecuaria Consolidated Statements of (Operations) / Income for the fiscal years ended June 30, 2016, 2015 and 2014 (All amounts in millions of Argentine Pesos, except otherwise indicated) | | Note | 06.30.16 | | 06.30.15 | | 06.30.14 | | Revenues | 28 | 35,384 | | 5,652 | | 4,604 | | Costs | 29 | (26,090) | | (4,770) | | (3,913) | | Initial recognition and changes in the fair value of biological assets and agricultural produce at the point of harvest | | 1,660 | | 1,324 | | 1,152 | | Changes in the net realizable value of agricultural produce after harvest | | 208 | | (34) | | (17) | | Gross profit | | 11,162 | | 2,172 | | 1,826 | | Gain from disposal of investment properties | 10 | 1,101 | | 1,150 | | 231 | | (Loss) / Gain from disposal of farmlands | | (2) | | 550 | | 91 | | General and administrative expenses | 30 | (2,244) | | (618) | | (533) | | Selling expenses | 30 | (6,279) | | (474) | | (354) | | Other operating results, net | 32 | (44) | | 12 | | (75) | | Profit from operations | | 3,694 | | 2,792 | | 1,186 | | Share of profit / (loss) of joint ventures and associates | 8,9
| 473 | | (1,026) | | (410) | | Profit from operations before financing and taxation | | 4,167 | | 1,766 | | 776 | | Finance income | 33 | 1,974 | | 241 | | 288 | | Finance cost | 33 | (7,719) | | (1,685) | | (2,852) | | Other financial results | 33 | (510) | | 156 | | (10) | | Financial results, net | 33 | (6,255) | | (1,288) | | (2,574) | | (Loss) / Profit before income tax | | (2,088) | | 478 | | (1,798) | | Income tax | 25 | 197 | | (303) | | 389 | | (Loss) / Profit for the year | | (1,891) | | 175 | | (1,409) | | | | | | | | | | Attributable to: | | | | | | | | Equity holders of the parent | | (1,038) | | (250) | | (1,068) | | Non-controlling interest | | (853) | | 425 | | (341) | | | | | | | | | | (Loss) / Profit per share attributable to equity holders of the parent during the year: | | | | | | | | Basic | | (3.82) | | 0.36 | | (2.15) | | Diluted | | (i) (3.82) | | 0.32 | | (i) (2.15) |
(i) Due to the loss for the year, there is no diluted effect on this result. The accompanying notes are an integral part of these Consolidated Financial Statements. Cresud Sociedad Anónima, Comercial, Inmobiliaria, Financiera y Agropecuaria
Consolidated Statements of Comprehensive (Operations) / Income Statements for the fiscal years ended June 30, 2016, 2015 2014 and 20132014 (All amounts in thousandsmillions of Argentine Pesos, except shares and per share data and as otherwise indicated)
| | Note | | | 06.30.15 | | | | 06.30.14 | | | | 06.30.13 | | | Revenues | 31 | | | 5,651,805 | | | | 4,604,011 | | | | 3,528,551 | | | Costs | 32 | | | (4,769,715 | ) | | | (3,914,592 | ) | | | (3,120,495 | ) | | Initial recognition and changes in the fair value of biological assets and agricultural produce at the point of harvest | | | | 1,324,152 | | | | 1,152,653 | | | | 886,744 | | | Changes in the net realizable value of agricultural produce after harvest | | | | (34,471 | ) | | | (17,447 | ) | | | 11,756 | | | Gross profit | | | | 2,171,771 | | | | 1,824,625 | | | | 1,306,556 | | | Gain from disposal of investment properties | 3 | | | 1,150,230 | | | | 230,918 | | | | 177,999 | | | Gain from disposal of farmlands | 3 | | | 550,462 | | | | 91,356 | | | | 149,584 | | | General and administrative expenses | 33 | | | (617,820 | ) | | | (533,939 | ) | | | (346,383 | ) | | Selling expenses | 33 | | | (474,158 | ) | | | (352,726 | ) | | | (279,463 | ) | | Other operating results, net | 35 | | | 12,209 | | | | (75,008 | ) | | | 98,068 | | | Profit from operations | | | | 2,792,694 | | | | 1,185,226 | | | | 1,106,361 | | | Share of loss of associates and joint ventures | 8,9 | | | (1,024,972 | ) | | | (408,651 | ) | | | (9,818 | ) | | Profit from operations before financing and taxes | | | | 1,767,722 | | | | 776,575 | | | | 1,096,543 | | | Finance income | 36 | | | 241,109 | | | | 288,188 | | | | 200,857 | | | Finance cost | 36 | | | (1,684,328 | ) | | | (2,852,000 | ) | | | (1,124,746 | ) | | Other financial results | 36 | | | 155,058 | | | | (10,586 | ) | | | 15,128 | | | Financial results, net | | | | (1,288,161 | ) | | | (2,574,398 | ) | | | (908,761 | ) | | Profit / (Loss) before income tax | | | | 479,561 | | | | (1,797,823 | ) | | | 187,782 | | | (Loss) /Income tax expense | 28 | | | (303,350 | ) | | | 389,415 | | | | (33,519 | ) | | Profit / (Loss) for the year | | | | 176,211 | | | | (1,408,408 | ) | | | 154,263 | | | | | | | | | | | | | | | | | | Attributable to: | | | | | | | | | | | | | | | Equity holders of the parent | | | | (249,619) | | | | (1,067,880 | ) | | | (26,907 | ) | | Non-controlling interest | | | | 425,830 | | | | (340,528 | ) | | | 181,170 | | | | | | | | | | | | | | | | | | Loss per share attributable to equity holders of the parent during the year: | | | | | | | | | | | | | | | Basic | | | | (0.51) | | | | (2.15 | ) | | | (0.05 | ) | | Diluted | | | | (i)(0.51) | | | (i) (2.15) | | | (i) (0.05) | |
(i) | Due to the loss attributable to equity holders of the parent during the fiscal years 2015, 2014 and 2013, there is no diluted effect on this result. |
| The accompanying notes are an integral part of these Consolidated Financial Statements. |
F
| | 06.30.16 | | 06.30.15 | | 06.30.14 | | (Loss) / Profit for the year | (1,891) | | 175 | | (1,409) | | Other comprehensive income / (loss): | | | | | | | Items that may be reclassified subsequently to profit or loss: | | | | | | | Currency translation adjustment | 37 | | (521) | | 1,285 | | Share of currency translation adjustment of joint ventures and associates accounted for using the equity method | 4,818 | | 81 | | (17) | | Share of change in fair value of hedging instruments net of associates and joint ventures accounted for using the equity method | (93) | | - | | - | | Items that may not be reclassified subsequently to profit or loss: | | | | | | | Actuarial loss from defined benefit plans net of income taxes | (42) | | - | | - | | Other comprehensive income / (loss) for the year (i) | 4,720 | | (440) | | 1,268 | | Total comprehensive income / (loss) for the year | 2,829 | | (265) | | (141) | | | | | | | | | Attributable to: | | | | | | | Equity holders of the parent | (646) | | (441) | | (437) | | Non-controlling interest | 3,475 | | 176 | | 296 |
The accompanying notes are an integral part of these Consolidated Financial Statements. Cresud Sociedad Anónima, Comercial, Inmobiliaria, Financiera y Agropecuaria
Consolidated Statements of Comprehensive Income
for the fiscal years ended June 30, 2015, 2014 and 2013
(All amounts in thousands of Argentine Pesos, except shares and per share data and as otherwise indicated)
| | | | 06.30.15 | | | | 06.30.14 | | | | 06.30.13 | | | Profit / (Loss) for the year | | | 176,211 | | | | (1,408,408 | ) | | | 154,263 | | | Other comprehensive income: | | | | | | | | | | | | | | Items that may be reclassified subsequently to profit or loss: | | | | | | | | | | | | | | Currency translation adjustment | | | (521,489 | ) | | | 1,284,550 | | | | 180,908 | | | Currency translation adjustment from associates and joint ventures | | | 81,606 | | | | (17,409 | ) | | | 1,715 | | | Other comprehensive (loss) / income for the year (i) | | | (439,883 | ) | | | 1,267,141 | | | | 182,623 | | | Total comprehensive loss for the year | | | (263,672) | | | | (141,267 | ) | | | 336,886 | | | | | | | | | | | | | | | | | Attributable to: | | | | | | | | | | | | | | Equity holders of the parent | | | (440,130 | ) | | | (436,557 | ) | | | 65,647 | | | Non-controlling interest | | | 176,458 | | | | 295,290 | | | | 271,239 | |
(i) | Components of other comprehensive income have no impact on income tax. |
| The accompanying notes are an integral part of these Consolidated Financial Statements. |
Cresud Sociedad Anónima,
Comercial, Inmobiliaria, Financiera y Agropecuaria
Consolidated Statements of Changes in Shareholders’ Equity for the fiscal years ended June 30, 2016, 2015 2014 and 20132014 (All amounts in thousandsmillions of Argentine Pesos, except shares and per share data and as otherwise indicated)
| | | Share Capital | | | Treasury Stock | | | Inflation adjustment of Share Capital | | | Inflation adjustment of Treasury Stock | | | Share premium | | | Additional paid-in capital from treasury stock | | | Cost of Treasury Stock | | | Share warrants | | | Subtotal | | | Changes in non-controlling interests | | | Cumulative translation adjustment | | | Equity-settled compensation | | | Legal reserve | | | Reserve for new developments | | | Special reserve (1) | | | Reserve for the acquisition of securities issued by the company | | | Accumulated deficit | | | Subtotal | | | Non-controlling interest | | | Total shareholders’ equity | | | Balances as of June 30, 2014 | | | 490,997 | | | | 10,566 | | | | 64,047 | | | | 1,378 | | | | 773,079 | | | | - | | | | (54,876 | ) | | | 106,264 | | | | 1,391,455 | | | | (15,429 | ) | | | 633,607 | | | | 70,028 | | | | 81,616 | | | | 17,065 | | | | 633,940 | | | | 200,000 | | | | (1,066,428 | ) | | | 1,945,854 | | | | 2,488,932 | | | | 4,434,786 | | | (Loss) /Profit for the year | | | - | | | | - | | | | - | | | | - | | | | - | | | | - | | | | - | | | | - | | | | - | | | | - | | | | - | | | | - | | | | - | | | | - | | | | - | | | | - | | | | (249,619) | | | | (249,619) | | | | 425,830 | | | | 176,211 | | | Other comprehensive (loss) for the year | | | - | | | | - | | | | - | | | | - | | | | - | | | | - | | | | - | | | | - | | | | - | | | | - | | | | (190,511) | | | | - | | | | - | | | | - | | | | - | | | | - | | | | - | | | | (190,511) | | | | (249,372) | | | | (439,883 | ) | | Total comprehensive (loss) / income for the year | | | - | | | | - | | | | - | | | | - | | | | - | | | | - | | | | - | | | | - | | | | - | | | | - | | | | (190,511) | | | | - | | | | - | | | | - | | | | - | | | | - | | | | (249,619) | | | | (440,130) | | | | 176,458 | | | | (263,672) | | | Appropriation of retained earnings resolved by Shareholders’ Meeting held on November 14, 2014: | | | | | | | | | | | | | | | | | | | | | | | | | | | | | | | | | | | | | | | | | | | | | | | | | | | | | | | | | | | | | | | | | | | | | | | | | | | | | | | | | | - Share Distribution | | | 5,565 | | | | (5,565 | ) | | | 726 | | | | (726 | ) | | | - | | | | - | | | | 54,876 | | | | - | | | | 54,876 | | | | - | | | | - | | | | - | | | | - | | | | - | | | | - | | | | (54,876 | ) | | | - | | | | - | | | | - | | | | - | | | - Share Premium | | | - | | | | - | | | | - | | | | - | | | | (220,881 | ) | | | - | | | | - | | | | - | | | | (220,881 | ) | | | - | | | | - | | | | - | | | | - | | | | - | | | | - | | | | - | | | | 220,881 | | | | - | | | | - | | | | - | | | - Legal Reserve | | | - | | | | - | | | | - | | | | - | | | | - | | | | - | | | | - | | | | - | | | | - | | | | - | | | | - | | | | - | | | | (81,616 | ) | | | - | | | | - | | | | - | | | | 81,616 | | | | - | | | | - | | | | - | | | - Reserve for new developments | | | - | | | | - | | | | - | | | | - | | | | - | | | | - | | | | - | | | | - | | | | - | | | | - | | | | - | | | | - | | | | - | | | | (17,065 | ) | | | - | | | | - | | | | 17,065 | | | | - | | | | - | | | | - | | | - Other reserves | | | - | | | | - | | | | - | | | | - | | | | - | | | | - | | | | - | | | | - | | | | - | | | | - | | | | - | | | | - | | | | - | | | | - | | | | (633,940 | ) | | | - | | | | 633,940 | | | | - | | | | - | | | | - | | | - Reserve for the repurchase of equity interest | | | - | | | | - | | | | - | | | | - | | | | - | | | | - | | | | - | | | | - | | | | - | | | | - | | | | - | | | | - | | | | - | | | | - | | | | - | | | | (112,926 | ) | | | 112,926 | | | | - | | | | - | | | | - | | | - Exercise of warrants | | | 80 | | | | - | | | | - | | | | - | | | | 1,132 | | | | - | | | | - | | | | (130 | ) | | | 1,082 | | | | - | | | | - | | | | - | | | | - | | | | - | | | | - | | | | - | | | | - | | | | 1,082 | | | | - | | | | 1,082 | | | Cash dividends (Note 30) | | | - | | | | - | | | | - | | | | - | | | | - | | | | - | | | | - | | | | - | | | | - | | | | - | | | | - | | | | - | | | | - | | | | - | | | | - | | | | - | | | | - | | | | - | | | | (136,696 | ) | | | (136,696 | ) | | Capital reduction | | | - | | | | - | | | | - | | | | - | | | | - | | | | - | | | | - | | | | - | | | | - | | | | - | | | | - | | | | - | | | | - | | | | - | | | | - | | | | - | | | | - | | | | - | | | | (228,101 | ) | | | (228,101 | ) | | Equity-settled compensation (Note 27) | | | - | | | | - | | | | - | | | | - | | | | - | | | | - | | | | - | | | | - | | | | - | | | | - | | | | - | | | | 27,678 | | | | - | | | | - | | | | - | | | | - | | | | - | | | | 27,678 | | | | 7,837 | | | | 35,515 | | | Purchase of Treasury stock (Note 30) | | | (3,068 | ) | | | 3,068 | | | | (400 | ) | | | 400 | | | | - | | | | - | | | | (32,198 | ) | | | - | | | | (32,198 | ) | | | - | | | | - | | | | - | | | | - | | | | - | | | | - | | | | - | | | | - | | | | (32,198 | ) | | | - | | | | (32,198 | ) | | Maturity of share warrants (Note 30) | | | - | | | | - | | | | - | | | | - | | | | 106,134 | | | | - | | | | | | | | (106,134 | ) | | | - | | | | - | | | | - | | | | - | | | | - | | | | - | | | | - | | | | - | | | | - | | | | - | | | | - | | | | - | | | Equity incentive plan granted (Note 27) | | | 1,203 | | | | (1,203 | ) | | | 157 | | | | (157 | ) | | | - | | | | 12,678 | | | | - | | | | - | | | | 12,678 | | | | - | | | | - | | | | (15,718 | ) | | | - | | | | - | | | | - | | | | - | | | | 3,040 | | | | - | | | | - | | | | - | | | Changes in non- controlling interest (Note 3) | | | - | | | | - | | | | - | | | | - | | | | - | | | | - | | | | - | | | | - | | | | - | | | | 69,235 | | | | - | | | | - | | | | - | | | | - | | | | - | | | | - | | | | | | | | 69,235 | | | | 5,282 | | | | 74,517 | | | Reimbursement of expired dividends (Note 30) | | | - | | | | - | | | | - | | | | - | | | | - | | | | - | | | | - | | | | - | | | | - | | | | - | | | | - | | | | - | | | | - | | | | - | | | | - | | | | - | | | | 510 | | | | 510 | | | | 301 | | | | 811 | | | Capital contribution from non-controlling interest | | | - | | | | - | | | | - | | | | - | | | | - | | | | - | | | | - | | | | - | | | | - | | | | - | | | | - | | | | - | | | | - | | | | - | | | | - | | | | - | | | | - | | | | - | | | | 15,914 | | | | 15,914 | | | Balance as of June 30, 2015 | | | 494,777 | | | | 6,866 | | | | 64,530 | | | | 895 | | | | 659,464 | | | | 12,678 | | | | (32,198 | ) | | | - | | | | 1,207,012 | | | | 53,806 | | | | 443,096 | | | | 81,988 | | | | - | | | | - | | | | - | | | | 32,198 | | | | (246,069) | | | | 1,572,031 | | | | 2,329,927 | | | | 3,901,958 | |
| | Attributable to equity holders of the parent | | | | | Share capital | Treasury Shares | Inflation adjustment of share capital and treasury shares (i) | Share premium | Additional paid-in capital from Treasury Shares | Legal reserve | Other reserves (Note 27) | Accumulated Deficit | Subtotal | Non-controlling interest | Total Shareholders’ equity | Balances as of June 30, 2015
| 495 | 7 | 65 | 659 | 13 | - | 579 | (245) | 1,573 | 2,330 | 3,903 | | Loss for the year | - | - | - | - | - | - | - | (1,038) | (1,038) | (853) | (1,891) | | Other comprehensive income for the year | - | - | - | - | - | - | 392 | - | 392 | 4,328 | 4,720 | | Total comprehensive income / (loss) for the year | - | - | - | - | - | - | 392 | (1,038) | (646) | 3,475 | 2,829 | | As provided by Ordinary and Extraordinary Shareholders’ Meeting held on October 30, 2015 and on November 26, 2015: | | | | | | | | | | | | | - Legal reserve | - | - | - | - | - | 83 | - | (83) | - | - | - | | - Reserve for future dividends | - | - | - | - | - | - | 31 | (31) | - | - | - | | - Cash dividends | - | - | - | - | - | - | - | - | - | (75) | (75) | | IDBD business combination (Note 3) | - | - | - | - | - | - | - | - | - | 8,609 | 8,609 | | Reserve for share-based compensation | - | - | - | - | - | - | 17 | - | 17 | 39 | 56 | | Equity incentive plan granted | - | - | - | - | 3 | - | (4) | 1 | - | - | - | | Transaction with non-controlling interest | - | - | - | - | - | - | 106 | - | 106 | 387 | 493 | | Cumulative translation adjustment for interest held before business combination | - | - | - | - | - | - | (58) | - | (58) | (33) | (91) | | Acquisition of subsidiaries | - | - | - | - | - | - | - | - | - | 36 | 36 | | Capital reduction | - | - | - | - | - | - | - | - | - | (4) | (4) | | Share of changes in subsidiaries’ equity | - | - | - | - | - | - | 23 | - | 23 | 51 | 74 | | Dividends distribution to non-controlling interest | - | - | - | - | - | - | - | - | - | (615) | (615) | | Reimbursement expired dividends | - | - | - | - | - | - | - | 6 | 6 | - | 6 | | Capital contributions from non-controlling interest | - | - | - | - | - | - | - | - | - | 11 | 11 | | Balances as of June 30, 2016 | 495 | 7 | 65 | 659 | 16 | 83 | 1,086 | (1,390) | 1,021 | 14,211 | 15,232 |
(1) Related to CNV General Resolution N° 609/12. See Note 2.29.(i)
Includes Ps. 1 and Ps. 1 of inflation adjustment of Treasury Shares as of June 30, 2016 and June 30, 2015, respectively.
The accompanying notes are an integral part of these Consolidated Financial Statements. Cresud Sociedad Anónima, Comercial, Inmobiliaria, Financiera y Agropecuaria
Consolidated Statements of Changes in Shareholders’ Equity
for the fiscal years ended June 30, 2014, 2013 and 2012
(All amounts in thousands of Argentine Pesos, except shares and per share data and as otherwise indicated)
| | | Share Capital | | | Treasury Stock | | | Inflation adjustment of Share Capital | | | Inflation adjustment of Treasury Stock | | | Share premium | | | Cost of Treasury Stock | | | Share warrants | | | Subtotal | | | Changes in non-controlling interests | | | Cumulative translation adjustment | | | Equity-settled compensation | | | Legal reserve | | | Reserve for new developments | | | Special reserve (1) | | | Reserve for the acquisition of securities issued by the company | | | Accumulated deficit | | | Subtotal | | | Non-controlling interest | | | Total shareholders’ equity | | | Balance as of June 30, 2013 | | | 496,562 | | | | 5,001 | | | | 64,773 | | | | 652 | | | | 773,079 | | | | - | | | | 106,264 | | | | 1,446,331 | | | | (21,996 | ) | | | 2,284 | | | | 8,345 | | | | 46,835 | | | | 337,065 | | | | 695,628 | | | | - | | | | (26,522 | ) | | | 2,487,970 | | | | 2,231,096 | | | | 4,719,066 | | | Loss for the year | | | - | | | | - | | | | - | | | | - | | | | - | | | | - | | | | - | | | | - | | | | - | | | | - | | | | - | | | | - | | | | - | | | | - | | | | - | | | | (1,067,880 | ) | | | (1,067,880 | ) | | | (340,528 | ) | | | (1,408,408 | ) | | Other comprehensive income for the year | | | - | | | | - | | | | - | | | | - | | | | - | | | | - | | | | - | | | | - | | | | - | | | | 631,323 | | | | - | | | | - | | | | - | | | | - | | | | - | | | | - | | | | 631,323 | | | | 635,818 | | | | 1,267,141 | | | Total comprehensive income / (loss) for the year | | | - | | | | - | | | | - | | | | - | | | | - | | | | - | | | | - | | | | - | | | | - | | | | 631,323 | | | | - | | | | - | | | | - | | | | - | | | | - | | | | (1,067,880 | ) | | | (436,557 | ) | | | 295,290 | | | | (141,267 | ) | | Appropriation of retained earnings resolved by Shareholders’ Meeting held on October 31, 2013: | | | | | | | | | | | | | | | | | | | | | | | | | | | | | | | | | | | | | | | | | | | | | | | | | | | | | | | | | | | | | | | | | | | | | | | | | | | | | | - Legal reserve | | | - | | | | - | | | | - | | | | - | | | | - | | | | - | | | | - | | | | - | | | | - | | | | - | | | | - | | | | 34,781 | | | | - | | | | (34,781 | ) | | | - | | | | - | | | | - | | | | - | | | | - | | | - Other reserves | | | - | | | | - | | | | - | | | | - | | | | - | | | | - | | | | - | | | | - | | | | - | | | | - | | | | - | | | | - | | | | - | | | | (26,907 | ) | | | - | | | | 26,907 | | | | - | | | | - | | | | - | | | - Cash dividends (Note 30) | | | - | | | | - | | | | - | | | | - | | | | - | | | | - | | | | - | | | | - | | | | - | | | | - | | | | - | | | | - | | | | (120,000 | ) | | | - | | | | - | | | | - | | | | (120,000 | ) | | | (134,432 | ) | | | (254,432 | ) | | Equity-settled compensation (Note 27) | | | - | | | | - | | | | - | | | | - | | | | - | | | | - | | | | - | | | | - | | | | - | | | | - | | | | 62,742 | | | | - | | | | - | | | | - | | | | - | | | | - | | | | 62,742 | | | | 16,429 | | | | 79,171 | | | Changes in non- controlling interest (Note 3) | | | - | | | | - | | | | - | | | | - | | | | - | | | | - | | | | - | | | | - | | | | 6,567 | | | | | | | | - | | | | - | | | | - | | | | - | | | | - | | | | - | | | | 6,567 | | | | 84,089 | | | | 90,656 | | | Purchase of Treasury stock (Note 30) | | | (5,565 | ) | | | 5,565 | | | | (726 | ) | | | 726 | | | | - | | | | (54,876 | ) | | | - | | | | (54,876 | ) | | | - | | | | - | | | | - | | | | - | | | | - | | | | - | | | | - | | | | - | | | | (54,876 | ) | | | - | | | | (54,876 | ) | | Cancellation of Brasilagro warrants | | | - | | | | - | | | | - | | | | - | | | | - | | | | - | | | | - | | | | - | | | | - | | | | - | | | | (1,059 | ) | | | - | | | | - | | | | - | | | | - | | | | - | | | | (1,059 | ) | | | - | | | | (1,059 | ) | | Capital reduction | | | - | | | | - | | | | - | | | | - | | | | - | | | | - | | | | - | | | | - | | | | - | | | | - | | | | - | | | | - | | | | - | | | | - | | | | - | | | | - | | | | - | | | | (4,163 | ) | | | (4,163 | ) | | Release of Reserve for new developments resolved by Shareholders’ Meeting held on April 11, 2014 (Note 30) | | | - | | | | - | | | | - | | | | - | | | | - | | | | - | | | | - | | | | - | | | | - | | | | - | | | | - | | | | - | | | | (200,000 | ) | | | - | | | | 200,000 | | | | - | | | | - | | | | - | | | | - | | | Reimbursement expired dividends (Note 30) | | | - | | | | - | | | | - | | | | - | | | | - | | | | - | | | | - | | | | - | | | | - | | | | - | | | | - | | | | - | | | | - | | | | - | | | | - | | | | 1,067 | | | | 1,067 | | | | 623 | | | | 1,690 | | | Balance as of June 30, 2014 | | | 490,997 | | | | 10,566 | | | | 64,047 | | | | 1,378 | | | | 773,079 | | | | (54,876 | ) | | | 106,264 | | | | 1,391,455 | | | | (15,429 | ) | | | 633,607 | | | | 70,028 | | | | 81,616 | | | | 17,065 | | | | 633,940 | | | | 200,000 | | | | (1,066,428 | ) | | | 1,945,854 | | | | 2,488,932 | | | | 4,434,786 | |
(1) | Related to CNV General Resolution N° 609/12. See Note 2.29. |
The accompanying notes are an integral part of these Consolidated Financial Statements.
Cresud Sociedad Anónima,
Comercial, Inmobiliaria, Financiera y Agropecuaria
Consolidated Statements of Changes in Shareholders’ Equity for the fiscal years ended June 30, 2016, 2015 2014 and 20132014 (All(All amounts in thousandsmillions of Argentine Pesos, except shares and per share data and as otherwise indicated)
| | | Share Capital | | | Treasury Stock | | | Inflation adjustment of Share Capital | | | Inflation adjustment of Treasury Stock | | | Share premium | | | Share warrants | | | Subtotal | | | Changes in non-controlling interest | | | Cumulative translation adjustment | | | Equity-settled compensation | | | Legal reserve | | | Reserve for new developments | | | Special reserve (1) | | | Retained earnings / Accumulated deficit | | | Subtotal | | | Non-controlling interest | | | Total shareholders’ equity | | | Balance as of June 30, 2012 | | | 496,562 | | | | 5,001 | | | | 164,561 | | | | 1,657 | | | | 773,079 | | | | 106,263 | | | | 1,547,123 | | | | (6,889 | ) | | | (81,939 | ) | | | 1,833 | | | | 42,922 | | | | 389,202 | | | | - | | | | 666,611 | | | | 2,558,863 | | | | 2,132,648 | | | | 4,691,511 | | | (Loss) Gain for the year | | | - | | | | - | | | | - | | | | - | | | | - | | | | - | | | | - | | | | - | | | | - | | | | - | | | | - | | | | - | | | | - | | | | (26,907 | ) | | | (26,907 | ) | | | 181,170 | | | | 154,263 | | | Other comprehensive income for the year | | | - | | | | - | | | | - | | | | - | | | | - | | | | - | | | | - | | | | - | | | | 92,554 | | | | - | | | | - | | | | - | | | | - | | | | - | | | | 92,554 | | | | 90,069 | | | | 182,623 | | | Total comprehensive income / (loss) for the year | | | - | | | | - | | | | - | | | | - | | | | - | | | | - | | | | - | | | | - | | | | 92,554 | | | | - | | | | - | | | | - | | | | - | | | | (26,907 | ) | | | 65,647 | | | | 271,239 | | | | 336,886 | | | Appropriation of retained earnings resolved by Shareholders’ Meeting held on October 31, 2012: | | | | | | | | | | | | | | | | | | | | | | | | | | | | | | | | | | | | | | | | | | | | | | | | | | | | | | | | | | | | | | | | | | | | | | - Legal reserve | | | - | | | | - | | | | - | | | | - | | | | - | | | | - | | | | - | | | | - | | | | - | | | | - | | | | 3,913 | | | | - | | | | - | | | | (3,913 | ) | | | - | | | | - | | | | - | | | - Other reserves | | | - | | | | - | | | | - | | | | - | | | | - | | | | - | | | | - | | | | - | | | | - | | | | - | | | | - | | | | (52,137 | ) | | | - | | | | 52,137 | | | | - | | | | - | | | | - | | | - Appropriation of retained earnings | | | - | | | | - | | | | (99,788 | ) | | | (1,005 | ) | | | - | | | | - | | | | (100,793 | ) | | | - | | | | - | | | | - | | | | - | | | | - | | | | - | | | | 100,793 | | | | - | | | | - | | | | - | | | - Cash dividends (Note 30) | | | - | | | | - | | | | - | | | | - | | | | - | | | | - | | | | - | | | | - | | | | - | | | | - | | | | - | | | | - | | | | - | | | | (120,000 | ) | | | (120,000 | ) | | | (93,816 | ) | | | (213,816 | ) | | Changes in non-controlling interest (Note 3) | | | - | | | | - | | | | - | | | | - | | | | - | | | | - | | | | - | | | | (15,107 | ) | | | - | | | | - | | | | - | | | | - | | | | - | | | | - | | | | (15,107 | ) | | | (37,509 | ) | | | (52,616 | ) | | Acquisition of non-controlling interest | | | - | | | | - | | | | - | | | | - | | | | - | | | | - | | | | - | | | | - | | | | - | | | | - | | | | - | | | | - | | | | - | | | | - | | | | - | | | | 102,723 | | | | 102,723 | | | Capital contribution of non-controlling interest | | | - | | | | - | | | | - | | | | - | | | | - | | | | - | | | | - | | | | - | | | | - | | | | - | | | | - | | | | - | | | | - | | | | - | | | | - | | | | 8,092 | | | | 8,092 | | | Conversion of notes | | | - | | | | - | | | | - | | | | - | | | | - | | | | - | | | | - | | | | - | | | | - | | | | - | | | | - | | | | - | | | | - | | | | - | | | | - | | | | 126 | | | | 126 | | | Capital distribution | | | - | | | | - | | | | - | | | | - | | | | - | | | | - | | | | - | | | | - | | | | - | | | | - | | | | - | | | | - | | | | - | | | | - | | | | - | | | | (152,101 | ) | | | (152,101 | ) | | Equity-settled compensation (Note 27) | | | - | | | | - | | | | - | | | | - | | | | - | | | | - | | | | - | | | | - | | | | - | | | | 6,512 | | | | - | | | | - | | | | - | | | | - | | | | 6,512 | | | | 4,037 | | | | 10,549 | | | Exercise of warrants | | | - | | | | - | | | | - | | | | - | | | | - | | | | 1 | | | | 1 | | | | - | | | | - | | | | - | | | | - | | | | - | | | | - | | | | - | | | | 1 | | | | - | | | | 1 | | | Cumulative translation adjustment for interest held before business combination | | | - | | | | - | | | | - | | | | - | | | | - | | | | - | | | | - | | | | - | | | | (8,331 | ) | | | - | | | | - | | | | - | | | | - | | | | - | | | | (8,331 | ) | | | (4,584 | ) | | | (12,915 | ) | | Reimbursement of expired dividends (Note 30) | | | - | | | | - | | | | - | | | | - | | | | - | | | | - | | | | - | | | | - | | | | - | | | | - | | | | - | | | | - | | | | - | | | | 385 | | | | 385 | | | | 241 | | | | 626 | | | Reallocation RG 609/12 CNV | | | - | | | | - | | | | - | | | | - | | | | - | | | | - | | | | - | | | | - | | | | - | | | | - | | | | - | | | | - | | | | 695,628 | | | | (695,628 | ) | | | - | | | | - | | | | - | | | Balance as of June 30, 2013 | | | 496,562 | | | | 5,001 | | | | 64,773 | | | | 652 | | | | 773,079 | | | | 106,264 | | | | 1,446,331 | | | | (21,996 | ) | | | 2,284 | | | | 8,345 | | | | 46,835 | | | | 337,065 | | | | 695,628 | | | | (26,522 | ) | | | 2,487,970 | | | | 2,231,096 | | | | 4,719,066 | |
| | Attributable to equity holders of the parent | | | | | Share capital | Treasury shares | Inflation adjustment of share capital and treasury shares (i) | Share premium | Additional paid- in capital from treasury shares | Share warrants | Legal reserve | Special reserve (1) | Other reserves (Note 27) | Accumulated Deficit | Subtotal | Non-controlling interest | Total Shareholders’ equity | | Balances as of June 30, 2014 | 491 | 11 | 65 | 773 | - | 106 | 82 | 634 | 851 | (1,066) | 1,947 | 2,489 | 4,436 | | Profit for the year | - | - | - | - | - | - | - | - | - | (250) | (250) | 425 | 175 | | Other comprehensive loss for the year | - | - | - | - | - | - | - | - | (191) | - | (191) | (249) | (440) | | Total comprehensive (loss) / income for the year | - | - | - | - | - | - | - | - | (191) | (250) | (441) | 176 | (265) | | As provided by Ordinary Shareholders’ Meeting held on November 14, 2014: | | | | | | | | | | | | | | | - Share distribution | 6 | (6) | - | - | - | - | - | - | - | - | - | - | - | | - Share premium | | | | (221) | - | - | - | - | - | 221 | - | - | - | | - Legal reserve | - | - | - | - | - | - | (82) | - | - | 82 | - | - | - | | - Reserve for new developments | - | - | - | - | - | - | - | - | (17) | 17 | - | - | - | | - Other reserves | - | - | - | - | - | - | - | (634) | - | 634 | - | - | - | | - Reserve for repurchase of shares | - | - | - | - | - | - | - | - | (113) | 113 | - | - | - | | - Exercise of warrants | - | - | - | 1 | - | - | - | - | - | - | 1 | - | 1 | | Cash dividends | - | - | - | - | - | - | - | - | - | - | - | (137) | (137) | | Capital reduction | - | - | - | - | - | - | - | - | - | - | - | (228) | (228) | | Reserve for share-based compensation | - | - | - | - | - | - | - | - | 28 | - | 28 | 8 | 36 | | Acquisition of treasury shares | (3) | 3 | - | - | - | - | - | - | (32) | - | (32) | - | (32) | | Maturity of share warrants | - | - | - | 106 | - | (106) | - | - | - | - | - | - | - | | Equity incentive plan granted | 1 | (1) | - | - | 13 | - | - | - | (16) | 3 | - | - | - | | Transaction with non-controlling interest | - | - | - | - | - | - | - | - | 69 | - | 69 | 5 | 74 | | Reimbursement of expired dividends | - | - | - | - | - | - | - | - | - | 1 | 1 | - | 1 | | Capital contribution from non-controlling interest | - | - | - | - | - | - | - | - | - | - | - | 17 | 17 | | Balances as of June 30, 2015 | 495 | 7 | 65 | 659 | 13 | - | - | - | 579 | (245) | 1,573 | 2,330 | 3,903 |
(1) | Related to CNV General Resolution N° 609/12. See Note 2.29. |
(i)
Includes Ps. 1 and Ps. 1 of inflation adjustment of Treasury Shares as of June 31, 2015 and June 30, 2014, respectively.
The accompanying notes are an integral part of these Consolidated Financial Statements. Cresud Sociedad Anónima, Comercial, Inmobiliaria, Financiera y Agropecuaria
Consolidated Statements of Cash FlowsChanges in Shareholders’ Equity for the fiscal years ended June 30, 2016, 2015 2014 and 20132014 (All(All amounts in thousandsmillions of Argentine Pesos, except shares and per share data and as otherwise indicated)
| | Note | | 06.30.15 | | | 06.30.14 | | | 06.30.13 | | | Operating activities: | | | | | | | | | | | | Cash generated from operations before income tax paid | 21 | | | 924,421 | | | | 1,163,074 | | | | 931,318 | | | Income tax paid | | | | (429,907 | ) | | | (279,911 | ) | | | (282,799 | ) | | Net cash generated from operating activities | | | | 494,514 | | | | 883,163 | | | | 648,519 | | | Investing activities: | | | | | | | | | | | | | | | Acquisition of subsidiaries, net of cash acquired | | | | - | | | | - | | | | (117,874 | ) | | Acquisition of interest in associates and joint ventures | | | | (1,241,562 | ) | | | (1,131,806 | ) | | | (25,899 | ) | | Capital contributions to associates and joint ventures | | | | (126,386 | ) | | | (60,299 | ) | | | (67,438 | ) | | Proceeds from sale of associates and joint ventures | | | | 55,842 | | | | 22,754 | | | | - | | | Purchases of investment properties | | | | (249,677 | ) | | | (271,921 | ) | | | (212,988 | ) | | Proceeds from sale of investment properties | | | | 2,446,687 | | | | 402,218 | | | | 128,595 | | | Purchases of property, plant and equipment | | | | (220,633 | ) | | | (133,423 | ) | | | (137,534 | ) | | Proceeds from sale of property, plant and equipment | | | | 2,391 | | | | 796 | | | | 3,225 | | | Proceeds from sale of farmlands | | | | 325,962 | | | | 125,935 | | | | 230,412 | | | Payments of purchase of properties | | | | - | | | | (6,048 | ) | | | - | | | Purchases of intangible assets | | | | (10,134 | ) | | | (14,559 | ) | | | (2,691 | ) | | Advances for purchase of property, plant and equipment | | | | (13,995 | ) | | | (29,647 | ) | | | (15,780 | ) | | Acquisition of Investment in financial assets | | | | (4,609,605 | ) | | | (3,682,960 | ) | | | (1,738,968 | ) | | Proceeds from disposals of Investment in financial assets | | | | 4,486,616 | | | | 3,870,820 | | | | 1,868,547 | | | Loans granted to associates and joint ventures | | | | - | | | | (2,090 | ) | | | (59,836 | ) | | Loans repayments received from associates and joint ventures | | | | 10,443 | | | | 1,913 | | | | 1,774 | | | Dividends received | | | | 17,961 | | | | 22,372 | | | | 53,443 | | | Net cash generated from / (used in) investing activities | | | | 873,910 | | | | (885,945 | ) | | | (93,012 | ) | | Financing activities: | | | | | | | | | | | | | | | Repurchase of convertible notes | | | | (305,026 | ) | | | (163,466 | ) | | | - | | | Repurchase of equity interest | | | | (32,851 | ) | | | (97,726 | ) | | | - | | | Proceeds from issuance of non-convertible notes | | | | 693,382 | | | | 1,051,823 | | | | 800,404 | | | Payment of non-convertible notes | | | | (1,071,997 | ) | | | (799,559 | ) | | | (423,118 | ) | | Issuance of trust debt titles | | | | - | | | | 14,950 | | | | - | | | Payment of trust debt titles | | | | (9,733 | ) | | | (5,424 | ) | | | - | | | Borrowings | | | | 1,497,750 | | | | 793,447 | | | | 878,622 | | | Repayments of borrowings | | | | (1,334,494 | ) | | | (590,114 | ) | | | (508,490 | ) | | Payment of seller financing of shares | | | | (105,861 | ) | | | - | | | | - | | | Payments of borrowings from associates and joint ventures | | | | (2,250 | ) | | | (1,640 | ) | | | - | | | Borrowings from associates and joint ventures | | | | 22,151 | | | | 17,246 | | | | 70,714 | | | Exercise of warrants | | | | 1,082 | | | | - | | | | 1 | | | Cancellation of Brasilagro warrants | | | | - | | | | (1,059 | ) | | | - | | | Payment of seller financing | | | | (3,142 | ) | | | (2,250 | ) | | | (26,347 | ) | | Acquisition of non-controlling interest in subsidiaries | | | | (32,306 | ) | | | (1,208 | ) | | | (49,868 | ) | | Distribution of share capital of subsidiaries | | | | - | | | | (4,263 | ) | | | (152,102 | ) | | Dividends paid | | | | (33,509 | ) | | | (243,637 | ) | | | (239,352 | ) | | Sale of equity in subsidiaries to non-controlling interest | | | | 181,781 | | | | 313 | | | | - | | | Capital reduction of subsidiaries | | | | (228,101 | ) | | | - | | | | - | | | Acquisition of derivative financial instruments | | | | - | | | | (37,961 | ) | | | - | | | Payment of derivative financial instruments | | | | (233,135 | ) | | | - | | | | - | | | Proceeds from derivative financial instruments | | | | 1,506 | | | | 62,158 | | | | - | | | Contributions from non-controlling interest | | | | 15,914 | | | | 139,058 | | | | 8,092 | | | Interest paid | | | | (799,402 | ) | | | (576,937 | ) | | | (375,716 | ) | | Net cash used in financing activities | | | | (1,778,241 | ) | | | (446,249 | ) | | | (17,160 | ) | | Net (decrease) increase in cash and cash equivalents | | | | (409,817 | ) | | | (449,031 | ) | | | 538,347 | | | Cash and cash equivalents at beginning of year | 21 | | | 1,002,987 | | | | 1,047,586 | | | | 471,922 | | | Foreign exchange gain on cash and cash equivalents | | | | 40,523 | | | | 404,432 | | | | 37,317 | | | Cash and cash equivalents at end of year | | | | 633,693 | | | | 1,002,987 | | | | 1,047,586 | |
| | Attributable to equity holders of the parent | | | | | Share capital | Treasury shares | Inflation adjustment of share capital and treasury shares (i) | Share premium | Share warrants | Legal reserve | Special reserve (1) | Other reserves (Note 27) | Accumulated Deficit | Subtotal | Non-controlling interest | Total Shareholders’ equity | | Balances as of June 30, 2013 | 497 | 5 | 65 | 773 | 106 | 47 | 696 | 326 | (27) | 2,488 | 2,231 | 4,719 | | Loss for the year | - | - | - | - | - | - | - | - | (1,068) | (1,068) | (341) | (1,409) | | Other comprehensive income for the year | - | - | - | - | - | - | - | 631 | - | 631 | 637 | 1,268 | | Total comprehensive income / (loss) for the year | - | - | - | - | - | - | - | 631 | (1,068) | (437) | 296 | (141) | | As provided by Ordinary Shareholders´ Meeting held on October 31, 2013: | | | | | | | | | | | | | | - Legal reserve | - | - | - | - | - | 35 | (35) | - | - | - | - | - | | - Other reserves | - | - | - | - | - | - | (27) | - | 27 | - | - | - | | - Cash dividends | - | - | - | - | - | - | - | (120) | - | (120) | (134) | (254) | | Reserve for share-based compensation | - | - | - | - | - | - | - | 63 | - | 63 | 16 | 79 | | Transaction with non-controlling interest | - | - | - | - | - | - | - | 7 | - | 7 | 84 | 91 | | Acquisition of treasury shares | (6) | 6 | - | - | - | - | - | (55) | - | (55) | - | (55) | | Cancellation of Brasilagro warrants | - | - | - | - | - | - | - | (1) | - | (1) | - | (1) | | Capital reduction | - | - | - | - | - | - | - | - | - | - | (4) | (4) | | Release of Reserve for new developments resolved by Ordinary Shareholders’ Meeting held on April 11, 2014 | - | - | - | - | - | - | - | - | - | - | - | - | | Reimbursement expired dividends | - | - | - | - | - | - | - | - | 2 | 2 | - | 2 | | Balances as of June 30, 2014 | 491 | 11 | 65 | 773 | 106 | 82 | 634 | 851 | (1,066) | 1,947 | 2,489 | 4,436 |
(i) Includes Ps. 1 and Ps. 1 of inflation adjustment of Treasury Shares as of June 30, 2014 and June 30, 2013, respectively. The accompanying notes are an integral part of these Consolidated Financial Statements. Cresud Sociedad Anónima, Comercial, Inmobiliaria, Financiera y Agropecuaria
Notes to Consolidated Financial Statements of Cash Flows
for the fiscal years ended June 30, 2016, 2015 and 2014 (All amounts in thousandsmillions of Argentine Pesos, except shares and per share data and as otherwise indicated) Free translation from the original prepared in Spanish for publication in Argentina
| | Note | 06.30.16 | | 06.30.15 | | 06.30.14 | | Operating activities: | | | | | | | | Cash generated from operations | 20 | 4,866 | | 924 | | 1,163 | | Income tax paid | | (811) | | (430) | | (280) | | Net cash generated from operating activities | | 4,055 | | 494 | | 883 | | Investing activities: | | | | | | | | Cash incorporated by business combination | | 9,193 | | - | | - | | Acquisition of interest in joint ventures and associates | | - | | (1,242) | | (1,132) | | Capital contributions to joint ventures and associates | | (207) | | (126) | | (60) | | Sale of associates and joint ventures | | 9 | | - | | - | | Acquisition of investment properties | | (888) | | (250) | | (272) | | Sale of joint ventures and associates | | - | | 56 | | 23 | | Sale of investment properties | | 1,394 | | 2,447 | | 402 | | Acquisition of property, plant and equipment | | (1,145) | | (221) | | (133) | | Sale of property, plant and equipment | | 3 | | 12 | | 1 | | Sale of farmlands | | - | | 316 | | 126 | | Purchase of properties | | - | | - | | (6) | | Acquisition of intangible assets | | (137) | | (10) | | (15) | | Acquisition of investments in financial instruments | | (13,513) | | (4,610) | | (3,683) | | Sale of investments in financial instruments | | 14,129 | | 4,487 | | 3,871 | | Loans granted to joint ventures and associates | | (852) | | - | | (2) | | Proceeds from loans granted to joint ventures and associates | | 80 | | 10 | | 2 | | Dividends received | | 593 | | 18 | | 22 | | Suppliers advances | | (7) | | (15) | | (30) | | Net cash generated from (used in) investing activities | | 8,652 | | 872 | | (886) | | Financing activities: | | | | | | | | Repurchase of non-convertible notes | | (209) | | (305) | | (163) | | Repurchase of treasury stock | | - | | (33) | | (98) | | Issuance of non-convertible notes | | 8,012 | | 693 | | 1,052 | | Issuance of trust debt titles | | - | | - | | 15 | | Repayment of non-convertible notes | | (4,291) | | (1,072) | | (800) | | Proceeds from borrowings | | 7,187 | | 1,498 | | 793 | | Repayments of trust debt titles | | - | | (10) | | (5) | | Repayments of seller financing of shares | | - | | (106) | | - | | Repayment of borrowings | | (11,031) | | (1,334) | | (590) | | Repayment of borrowings to joint ventures and associates | | (6) | | - | | (2) | | Proceeds from exercise of options granted | | 6 | | - | | - | | Proceeds of borrowings from joint ventures and associates | | 4 | | 22 | | 17 | | Cancellation of Brasilagro warrants | | - | | - | | (1) | | Repayments of seller financing | | (72) | | (3) | | (1) | | Acquisition of non-controlling interest in subsidiaries | | (1,192) | | (32) | | (1) | | Dividends paid | | (239) | | (34) | | (244) | | Capital distribution to non-controlling interest in subsidiaries | | (207) | | (228) | | (4) | | Repayments of derivative financial instruments | | (620) | | (233) | | (38) | | Proceeds from derivative financial instruments | | 2,093 | | 2 | | 62 | | Receipts from claims | | 90 | | - | | - | | Contributions from non-controlling interest | | 1 | | 16 | | 139 | | Sale of equity interest in subsidiaries to non-controlling interest | | 86 | | 182 | | - | | Interest paid | | (4,107) | | (799) | | (577) | | Net cash used in financing activities | | (4,495) | | (1,776) | | (446) | | Net increase (decrease) in cash and cash equivalents | | 8,212 | | (410) | | (449) | | Cash and cash equivalents at beginning of year | 20 | 634 | | 1,003 | | 1,048 | | Foreign exchange gain on cash and cash equivalents | | 5,250 | | 41 | | 404 | | Cash and cash equivalents at end of year | 20 | 14,096 | | 634 | | 1,003 |
The accompanying notes are an integral part of these Consolidated Financial Statements.
1. | The Group’s business and general information |
Cresud Sociedad Anónima, Comercial, Inmobiliaria, Financiera y Agropecuaria (“Cresud” or Notes to the “Company”)Consolidated Financial Statements (Amounts in millions of Argentine Pesos, except otherwise indicated) 1. The Group’s business and general information Cresud was founded in 1936 as a subsidiary of Credit Foncier, a Belgian company primarily engaged in providing rural and urban loans in Argentina and administering real estate holdings foreclosed by Credit Foncier. Credit Foncier was liquidated in 1959, and as part of such liquidation, the shares of Cresud were distributed to Credit Foncier’s shareholders. From the 1960s through the end of the 1970s, the business of Cresud shifted exclusively to agricultural activities.
In 2002, Cresud acquired a 19.85% interest in IRSA, Inversiones y Representaciones Sociedad Anónima (“IRSA”), a real estate company related to certain shareholders of Cresud. In 2009, Cresud increased its ownership percentage in IRSA to 55.64% and IRSA became Cresud’s directly principal subsidiary.
Cresud and its subsidiaries are collectively referred to hereinafter as the Group. See Note 2.3.for2.3. for a description of the Group’s companies.
The Company is domiciled in the Republic of Argentina. The address of its registered office is Moreno 877, 23rd Floor, Buenos Aires, Argentina. IFISA is our parent company and is a corporation established and domiciled in Uruguay and IFIS Limited is the ultimate parent company of the group. The Board of Directors has approved these Financial Statements for issue on October 31, 2016. As of the end of year,June 30, 2016, the Group operates in two major lines of business: (i) Agriculturalagricultural business and (ii) Urban Propertiesurban properties and Investments business. See Note 6 for a descriptioninvestments business, which is divided into two operations centers: (a) Operations Center in Argentina and (b) Operations Center in Israel. They are developed through several operating companies and the main ones are listed below (Note 7): Cresud Sociedad Anónima, Comercial, Inmobiliaria, Financiera y Agropecuaria Notes to the Consolidated Financial Statements(Continued) (Amounts in millions of the Group’s segments.Argentine Pesos, except otherwise indicated)
1. The Group’s business and general information (Continued) (i) Remains in current and non-current assets, as financial assets and other assets held for sale (see Note 18). (ii) Corresponds to Group’s joint ventures and associates, which are hence excluded from consolidation. Cresud Sociedad Anónima, Comercial, Inmobiliaria, Financiera y Agropecuaria Notes to the Consolidated Financial Statements(Continued) (Amounts in millions of Argentine Pesos, except otherwise indicated) 1. The Group’s business and general information (Continued) Agricultural business operations are comprised Within the agricultural business, the Group, through Cresud, engaged in the operation of crop production, cattle feeding, raising, fattening and slaughtering, milk production, sugarcane production, brokerage activities and brokerage activities.sale of supplies. The Group currently has agricultural operations and investments in Argentina, Brazil, Uruguay, Paraguay and Bolivia.
The Cresud's shares are listed on the Buenos Aires Stock Exchange ("BCBA", as per its Spanish acronym) and in NASDAQ (National Association of Securities Dealers Automated Quotation). Brasilagro’s shares are listed and traded on both the Novo Mercado del BOVESPA and the NYSE.
Urban Properties and Investments business Operations Center in Argentina The activities of the operations center in Argentina are conducted primarilymainly developed through IRSA and IRSA’s principal subsidiary, IRSA Propiedades Comerciales (“IRSA CP” formerly Alto Palermo S.A.).CP. Through IRSA and IRSA CP, the Group owns, manages and develops 16 shopping centers across Argentina, a portfolio of office and other rental properties in the Autonomous City of Buenos Aires, the capital of Argentina, and since 2009 it entered into the United StatedStates of AmericansAmerica (“USA”) real estate market, mainly through the acquisition of non-controlling interests in office buildings and hotels. Through IRSA orand IRSA CP, the Group also develops residential properties for sale. The Group, through IRSA, is also involved in the operation of branded hotels. The Group uses the term “real estate” indistinctively in these consolidated financial statementsFinancial Statements to denote investment, development and/or trading properties activities.
IRSA CP's shares are listed and traded both on the BASE (Merval: IRCP) and the NASDAQ (NASDAQ: IRCP). IRSA's shares are listed both on the BASE (NASDAQ: IRSA) and the NYSE (NYSE: IRS). Cresud Sociedad Anónima,
Comercial, Inmobiliaria, Financiera y Agropecuaria
Notes to Consolidated Financial Statements (Continued)
(All amounts in thousands of Argentine Pesos, except shares and per share data and as otherwise indicated)
1. | The Group’s business and general information (Continued)
|
During fiscal year ended June 30, 2014, the Group made an investment in the Israeli market, through Dolphin Fund Ltd. (“DFL”) and Dolphin Netherlands B.V. (“DN B.V.”, and together with DFL “Dolphin”), in IDB Development Corporation Ltd. ("IDBD") an Israeli Company, with an initial interest of 26.65%. As of June 30, 2015 the indirect equity interest in IDBD amounts to 49.0%. IDBD is one of the Israeli largest and most diversified conglomerates, which is involved, through its subsidiaries, in several markets and industries, including real estate, retail, agribusiness, insurance, telecommunications, etc.; controlling or having non controlling interests in companies as: Clal Insurance (Insurance Company), Cellcom (Mobile phone services), Adama (Agrochemicals), Super-Sol (supermarket), PBC (Real Estate), among others. IDBD went public in Tel Aviv Stock Exchange ("TASE") since May, 2014.
The activities of the Group’s segment “Financial operations and others” is carried out mainly through Banco Hipotecario S.A. (“BHSA”),BHSA, where it haswe have a 29.99%29.91% interest (without considering treasury shares). BHSA is a commercial bank offering a wide variety of banking activities and related financial services to individuals, small, medium-sized and large corporations, including the provision of mortgaged loans. BHSA’s shares are listed on the Buenos Aires Stock Exchange (“BCBA”).BCBA. Additionally, the Group has a 43.15% interest42.81% indirect equityinterest in Tarshop S.A (“Tarshop”) whose main business comprisesactivities are credit cards activitiescard and the provision of loans.loan origination transactions.
Cresud’s and IRSA Propiedades Comerciales’s shares are listed and traded on both the Buenos Aires Stock Exchange (“BCBA”) and the National Association of Securities Dealers Automated Quotation (“NASDAQ”). IRSA’s shares are listed and traded on both the BCBA and the New York Stock Exchange (“NYSE”). Brasilagro’s shares are listed and traded on both the Novo Mercado del BOVESPA and the New York Stock Exchange (“NYSE”).
These consolidated financial statements have been approved for issue by the Board of Directors on November 17, 2015.
2. | Summary of significant accounting policies |
The principal accounting policies applied in the preparation of these consolidated financial statements are set out below. These policies have been consistently applied to all the years presented, unless otherwise stated.
Cresud Sociedad Anónima, Comercial, Inmobiliaria, Financiera y Agropecuaria
Notes to the Consolidated Financial Statements(Continued) (All amountsAmounts in thousandsmillions of Argentine Pesos, except shares and per share data and as otherwise indicated)
1. The Group’s business and general information (Continued) Operations Center in Israel During the fiscal year ended June 30, 2014, the Group made an investment in the Israeli market, through DFL and DN B.V., in IDBD -an Israeli company-, with an initial interest of 26.65%. IDBD is one of the Israeli largest and most diversified conglomerates, which is involved, through its subsidiaries and other investments, in several markets and industries, including real estate, retail, agribusiness, insurance, telecommunications, etc.; controlling or equity interest in companies such as Clal (Insurance Company), Cellcom (Telecommunications), Adama (Agrochemicals), Shufersal (Supermarkets), PBC (Real Estate), among others. IDBD traded its shares in TASE between May 2014 and March 2016. To date, it is only listed as a “Debentures Company” under the Israeli law, because some of its bonds are trading. On October 11, 2015, the Group gained effective control over IDBD (Note 3). As a result, the Group has consolidated significant figures of several industries from IDBD and its subsidiaries. IDBD has diverse debts containing certain covenants which have been successively negotiated, resulting in several waivers actually expiring in December 2016. IDBD estimates that if the original covenants of such loans were to become effective again, it would not be able to honor them. Non-compliance could have the effect of creditors requiring immediate repayment of the debt. As a holding company, IDBD’s main sources of funds derive from the dividends distributed by its subsidiaries, which have experienced a reduction in recent years. Yet, there are restrictions as to the payment of dividends based on the indebtedness level in some subsidiaries. IDBD has projected future cash flows and expects to have the required liquidity to meet its commitments by issuing new debt in Israel, selling financial assets including Clal and dividend payouts by Clal. IDBD could also secure additional financing through the private issuance of equity securities. On December 2013, it was published in the Official Gazette of Israel the Promotion of Competition and Reduction of Concentration The Law, 5774-2013 (“the Concentration Law”). This law has material implications for IDBD and its investments, including the disposal of the controlling interest in Clal, a potential delisting of IDBD or DIC so as to no longer trade its shares publicly or a merger between IDBD and DIC. Cresud Sociedad Anónima, Comercial, Inmobiliaria, Financiera y Agropecuaria Notes to the Consolidated Financial Statements(Continued) (Amounts in millions of Argentine Pesos, except otherwise indicated) 1. The Group’s business and general information (Continued) All factors mentioned above, mainly (i) IDBD’s current financial position and need of financing to honor its financial debt and other commitments, (ii) the renegotiation underway with financial creditors, and (iii) the term set by Israel’s governmental authorities to sell the equity interest in Clal and the potential effects of such sale, in particular, on its market value, raise significant uncertainties as to IDBD’s capacity to continue as a going-concern. These financial statements do not include the adjustments or reclassifications related to the valuation of IDBD’s assets and liabilities that would be required if IDBD were not able to continue as a going-concern. The Group is and will continue working to address the uncertainties described above. The Group The financial position of IDBD and its subsidiaries at the operations center in Israel does not affect the financial position of Cresud and its subsidiaries at the operations center in Argentina. Cresud and its subsidiaries are not facing financial constraints and are compliant with their financial commitments. In addition, the commitments and other covenants resulting from IDBD´s debt do not have impact on Cresud since such debt has no recourse against Cresud and it is not granted by Cresud’s assets. There are no significant uncertainties as to the capacity of the Group, as a whole, to operate as a going-concern perspective, with such uncertainties being limited to the operation center in Israel. 2. Summary of significant accounting policies(Continued)
Basis of preparation of the Financial Statements
These Consolidated Financial Statements have been prepared in accordance with and compliance with International Financial Reporting Standards (“IFRS”)IFRS issued by International Accounting Standards Board (“IASB”)IASB and interpretations from International Financial Reporting Interpretation Committee (“IFRIC” and knownIFRIC (known before as the Standards Interpretation Committee “SIC”). All IFRS applicable as of the date of these consolidated financial statements have been applied. Additionally, Under IAS 29 “Financial Reporting in Hyperinflationary Economies”, the Group has adopted certain IFRS that are not effectivefinancial statements of an entity whose functional currency belongs to a hyperinflationary economy, regardless of whether they apply historic cost or current cost methods, should be stated at the current unit of measure as of the date of this consolidated financial statements. For such purpose, in general, inflation is to be computed in non-monetary items from the acquisition or revaluation date, as applicable. In order to determine whether an economy is to be considered hyperinflationary, the standard lists a set of factors to be taken into account, including an accumulated inflation rate near or above 100% over a three years period. Cresud Sociedad Anónima, Comercial, Inmobiliaria, Financiera y Agropecuaria Notes to the Consolidated Financial Statements(Continued) (Amounts in millions of Argentine Pesos, except otherwise indicated) 2. Summary of significant accounting policies (Continued) As of June 30, 2015, but for which early adoption2016, it is accepted.
The Comisión Nacional de Valores (“CNV”),not possible to compute the National Securities Commission in Argentina, through General Resolutions N° 562/09 and 576/10, has providedaccumulated inflation rate for the application of Technical Resolutions N° 26 and 29three years period ending on that date based on the official statistics of the Federación Argentina de Consejos Profesionales de Ciencias Económicas (“FACPCE”)INDEC (Argentina Statistics Office), which adoptbecause in October 2015, the International Financial Reporting Standards (“IFRS”)INDEC ceased to compute the Wholesale Domestic Price Index (IPIM, as per its Spanish acronym), issued byand started to compute it again as from January 2016.
As of the IASB, for companies subjectdate of this consolidated financial statements, the Argentine peso does not meet the conditions to be treated as the currency of a hyperinflationary economy, pursuant to the public offering regime ruledguidelines set forth by Law 17,811, dueIAS 29. Therefore, these consolidated financial statements have not been restated in constant currency. However, over the last years, certain macroeconomic variables affecting the agricultural business and the urban properties and investment business of the operations center Argentina, such as payroll costs, input prices and service rates, have experienced significant annual changes. This factor should be taken into consideration in assessing and interpreting the financial situation and results of operations of the Group in these consolidated financial statements. On October 11, 2015, the Group took over IDBD. IDBD’s fiscal year ends on December 31 each year and the Group’s fiscal year ends on June 30. IDBD’s quarterly and annual reporting follows the guidelines of Israeli standards, which means that the information is only available after the applicable statutory terms in Argentina. Therefore, the Group is not able to include IDBD’s quarterly results in its consolidated financial statements to be filed with the CNV within the applicable statutory terms in Argentina. The Group has started to consolidate IDBD’s results of operations with a three-month lag, adjusted for the effects of material transactions that may have taken place during the reported period. Hence, IDBD’s results of operations for the period beginning on October 11, 2015 (the acquisition date) through March 31, 2016 are included in the Group’s consolidated statement of comprehensive income for the fiscal year ended June 30, 2016, adjusted by such material transactions occurred between April 1 and June 30, 2016. Given the materiality of IDBD’s figures incorporated, the Group had to change the format of its financial statements for the ease of reading and analysis. The most significant change is in line with the new organizational structure, which is split into two large operations center, agricultural and urban properties and investments business, the last one divided into Argentina and Israel. In this regard, changes have been made to the listing of their shares or corporate notes and for entities that have applied for authorizationtables and their respective order, classification and content in the financial statements, on a geographic basis and taking into consideration the significance of the Group's global operations following IDBD's consolidation. Cresud Sociedad Anónima, Comercial, Inmobiliaria, Financiera y Agropecuaria Notes to be listed under the mentioned regime.Consolidated Financial Statements(Continued)
(Amounts in millions of Argentine Pesos, except otherwise indicated)
(ii) | Current and non-current classification |
2. Summary of significant accounting policies (Continued) (ii) Current and non-current classification The Group presents current and non-current assets, and current and non-current liabilities, as separate classifications in its statement of financial position according to the operating cycle of each activity.
The operating cycle for the activities of investment property, hotels and agricultural operations of the Group is 12 months. As such, currentCurrent assets and current liabilities include assets and liabilities that are either realized or settled within 12 months from the end of the fiscal year. The operating cycle of the Group’s trading property activities depends on each specific project, and thus cannot be clearly defined. Generally, assets and liabilities classified as trading properties are realized and settled in several years, ranging between 1 and 3 years or, in exceptional cases, even longed. As such, for purposes of classification, the Group has assumed the operating cycle for the activities to be 12 months.
All other assets and liabilities are classified as non-current assets or non-current liabilities. Current and deferred tax assets and liabilities (income tax payable) are presented separately from each other and from other assets and liabilities as current and non-current, respectively. Cresud Sociedad Anónima,(iii) Comercial, Inmobiliaria, Financiera y Agropecuaria
Notes to Consolidated Financial Statements (Continued)
(All amounts in thousands of Argentine Pesos, except shares and per share data and as otherwise indicated)Presentation currency
2. | Summary of significant accounting policies (Continued)
|
(iii) | Presentation currency |
The consolidated financial statements are presented in thousandsmillions of Argentine Pesos. Unless otherwise stated or the context otherwise requires, references to ‘Peso amounts’ or ‘Ps.’, are toof Argentine Pesos, references to ‘US$’ or ‘US dollars’ are toof United States dollars, and references to ‘Rs.’ are of Brazilian Reais and references to Brazilian Reais."NIS" are of New Israeli Shekel.
| Fiscal and harvest year-end |
Fiscal year-end
The fiscal year begins on July 1 and ends on June 30 of the following year. However, the Group’s agricultural production is based on the harvest year for crops. A harvest year varies by plant according to the climate in which it is grown. Due to the geographic diversity of the farms, the planting period for a given plant may start earlier on one farm than on another, causing differences in their respective harvesting periods. The financial results are presented on a fiscal year basis.
Accounting criteria
The consolidated financial statements have been prepared under the historical cost convention,criteria, as modified by financial assets and financial liabilities (including derivative instruments) at fair value through profit or loss, share-based payments at fair value, biological assets and agricultural produce at the point of harvest measured at fair value less costs to sell, and agricultural produce after harvest measured at net realizable value and financial assets and other assets held for sale and share-based compensation at fair value.
Reporting cash flows
The Group reports cash flows from operating activities using the indirect method. Interest paid is presented within financing cash flows. Interest received is presented within investing activities. The acquisitions and disposals of investment properties are disclosed as cash flows from investing activities becauseas this most appropriately reflects the Group’s business activities. Cash flows in respect to trading properties are disclosed as cash flows from operating activities because these items are routinely sold in the ordinary course of business.
Cresud Sociedad Anónima, Comercial, Inmobiliaria, Financiera y Agropecuaria
Notes to the Consolidated Financial Statements(Continued) (All amountsAmounts in thousandsmillions of Argentine Pesos, except shares and per share data and as otherwise indicated)
2. 2. Summary of significant accounting policies(Continued)
Use of estimates
The preparation of consolidated financial statements at a certain date requires the Management of the Group to make estimationsmaking estimates and evaluations affecting the amount of assets and liabilities recorded and contingent assets and liabilities disclosed at such date, as well as income and expenses recorded during the period.year. Actual results might differ from the estimates and evaluations made at the date of preparation of these financial statements. The most significant judgments made by Management in applying the Group’s accounting policies and the major estimations and significant judgments are described in Note 5.
2.1. | New accounting standards |
2.2.
New accounting standards
The following standards, amendments and interpretations have been published by the IASB and by the IFRIC. Below we outline the standards, amendments and interpretations that may potentially have an impact on the Group at the time of application.
IFRS 16 "Leases". Will supersede IAS 17 currently in force (and associated interpretations) and its scope includes all leases, with a few specific exceptions. Under the new standard, lessees are required to account for leases under one single model in the balance sheet that is similar to the one used to account for financial leases under IAS 17. There are two exceptions to this rule: to recognize the lease of low-cost assets (for example, personal computers) and short-term leases (for instance, leases for a 12 months or shorter term). As regards the lease commencement date, the lessee shall recognize the obligation to make rental payments (for instance, leases payable) and an asset that represents the right to use the leased asset during the term of the lease agreement (rights of use). There is almost no changes to lessor accounting. Become effective for the fiscal year beginning on January 1, 2019, that is, fiscal year ended on June 30, 2020 for the Group. It may be applied earlier provided IFRS 15 is also adopted. The Group is currently assessing the potential impact of the amendments on its financial statements. Amendments to IAS 7 "Disclosure initiative". Amendments provide that the entity shall disclose information so that users of the financial statements may assess the changes in liabilities resulting from financing activities, including both cash-flow and non-cash-flow derivatives. Become effective for the fiscal year beginning on January 1, 2017, that is, fiscal year ended on June 30, 2018 for the Group. Comparative information for prior fiscal years is not mandatory. Earlier adoption is permitted. The Group is currently assessing the potential impact of the amendments on its financial statements. Amendments to IAS 12 "Recognition of deferred tax assets for unrealized losses". The amendments clarify the accounting of deferred income tax assets in the case of unrealized losses on instruments measured at fair value. Become effective for the fiscal year beginning on January 1, 2017, that is, fiscal year ended on June 30, 2018 for the Group. Earlier adoption is permitted. The Group is currently assessing the potential impact of the amendments on its financial statements. Cresud Sociedad Anónima, Comercial, Inmobiliaria, Financiera y Agropecuaria Notes to the Consolidated Financial Statements(Continued) (Amounts in millions of Argentine Pesos, except otherwise indicated) 2. Summary of significant accounting policies (Continued) Amendments to IAS 1 "Presentation of financial statements"
In December 2014, the IASB has released amendments to IAS 1 “Presentation of Financial Statements”. These amendments Amendments establish guidance on grouping significant items, provides for the disclosure of relevant information for certain items and disclosures that are to be included in relation to accounting policies adopted by each entity and other additional disclosures in financial statements.
The application of this amendments become Become effective for the fiscal year beginning on January 1, 2016, that is, fiscal year ended on June 30, 2017 for the Group. Earlier adoption is permitted. The Group is currently assessing the potential impact of the amendments on its financial statements.
Amendments to IFRS 10 “Consolidated Financial Statements”, IFRS 12 “Disclosure of Interests in Other Entities” and IAS 28 “Investments in Associates and Joint Ventures”
In December 2014, the IASB has released amendments to IFRS 10, IFRS 12 and IAS 28. These amendments refer to the treatment of the consolidation exception for financial entities and their subsidiaries.
Cresud Sociedad Anónima,
Comercial, Inmobiliaria, Financiera y Agropecuaria
NotesCycle of annual improvements 2014. IFRS 5 “Non-current Assets Held for Sale and Discontinued Operations”: A new classification category has been established for these assets and the amendment adds guidance on how to Consolidated Financial Statements (Continued)
(All amounts in thousands of Argentine Pesos, except shares and per share data andtreat changes to disposal plans for those assets classified as otherwise indicated)
2. Summary of significant accounting policies (Continued)
Amendments to IFRS 10 clarifies that the exemption from preparing consolidated financial statementsheld for an intermediate parent entity is available to a parent entity that is a subsidiary of an investment entity. The exception may be applicable where the company controlling the investment entity accounts for subsidiaries at fair value. Additionally, amendments to IFRS 10 clarify that an investment entity should consolidate a subsidiary that is not an investment company and that provides services that support the investment entity’s activities, so that it acts as an extension of the investment entity. The remaining investments in subsidiaries of an investment entity should be measured at fair value through profit or loss.
Amendments to IAS 28 allow an entity which is not an investment entity, but has an interest in an associate or joint venture which is an investment entity, a policy choice when applying the equity method of accounting. The entity may choose to retain the fair value measurement applied by the investment entity associate or joint venture, or to unwind the fair value measurement and instead perform a consolidation at the level of the investment entity associate or joint venture.
Amendments becomesale. Become effective for the fiscal year beginning on January 1, 2016, that is, fiscal year ended June 30, 2017 for the Group. Earlier adoption is permitted. The Group is currently assessing the potential impact of the amendments on its consolidated and separate financial statements on this balance sheet date.
Amendments to IFRS 10 “Consolidated Financial Statements” and IAS 28 “Investments in Associates and Joint Ventures” – Treatment afforded to sales or contributions of assets between an investor and its associate or joint venture
On September 2014, the IASB has released amendments to IFRS 10 “Consolidated Financial Statements” and IAS 28 “Investments in Associates and Joint Ventures”. The first amendment adds guidance on how to treat losses of control in subsidiaries that does not contain a business as established by IFRS 3 “Business combinations”, thus limiting the amount that may be reclassified from other comprehensive income to income for the year solely to the participation of other investors not related to the investor; it further provides how the residual participation in these investments should be valued, after such loss of control. In the second case, the modifications refer to the recognition of profits and losses resulting from upstream and downstream transactions, between an entity and its associates or joint ventures, when they involve assets that may constitute or not a business, as such is defined in IFRS 3.
Amendments become effective for the fiscal year beginning January 1, 2016, that is, fiscal year ended June 30, 2017 for the Group. The Group is currently assessing the potential impact of the amendments on its financial statements.
Cresud Sociedad Anónima,
Comercial, Inmobiliaria, Financiera y Agropecuaria
Notes to Consolidated Financial Statements (Continued)
(All amounts in thousands of Argentine Pesos, except shares and per share data and as otherwise indicated)
2. Summary of significant accounting policies (Continued)
Cycle of annual improvements to IFRS: Amendments to IFRS 5 “Non-current Assets Held for Sale and Discontinued Operations”;2014. IFRS 7 “Financial Instruments: Disclosures”: It clarifies that amendments established in December, 2011 on offsetting financial assets and IAS 34 “Interim Financial Reporting”
Onliabilities, and amendments established in September, 2014 will be of retroactive application to annual fiscal years as from January 1, 2013, in the IASB,first case, and January 1, 2016 in its annual improvements, has released amendmentsthe second case. In addition, it sets forth the specific disclosure requirements related to the following standards:
· | IFRS 5 “Non-current Assets Held for Sale and Discontinued Operations”: A new classification category has been established for these assets and the amendment adds guidance on how to treat changes to disposal plans for those assets classified as held for sale.
|
· | IFRS 7 “Financial Instruments: Disclosures”: It clarifies that amendments established in December, 2011 on offsetting financial assets and liabilities, and amendments established in September, 2014 will be of retroactive application to annual fiscal years as from January 1, 2013, in the first case, and January 1, 2016 in the second case. In addition, it sets forth the specific disclosure requirements related to servicing contracts related to financial assets transferred.
|
· | IAS 34 “Interim Financial Reporting”: It clarifies that supplementary information included in interim financial statements through cross reference with other statements or reference information should be available with such interim financial statements.
|
The application of this amendments becomeservicing contracts related to financial assets transferred. Become effective for the fiscal year beginning on January 1, 2016, that is, fiscal year ended on June 30, 2017 for the Group. The Group is currently assessing the potential impact of the amendments on its financial statements.
IAS 27 Revised “Separate Financial Statements”
.On August 12, 2014 the IASB has released an amendment to IAS 27 “Equity method in Separate Financial Statements”. The amendment reinstates the equity method as an option to account for investments in subsidiaries, joint ventures and associates in separate financial statements. Amendments become effective for the fiscal year beginning January 1, 2016, that is, fiscal year ended June 30, 2017 for the Group. Earlier adoptionIt may be applied earlier. The Group is permitted.currently assessing the potential impact of the amendments on its financial statements.
Cresud Sociedad Anónima,
Comercial, Inmobiliaria, Financiera y Agropecuaria
Notes to Consolidated Financial Statements (Continued)
(All amounts in thousands of Argentine Pesos, except shares and per share data and as otherwise indicated)
2. | Summary of significant accounting policies (Continued)
|
IFRS 9 “Financial Instruments”
On July 24, 2014, the IASB released the final version of IFRS 9 “Financial instruments”, which includes in one single standard all stages of the IASB project to replace IAS 39 “Financial instruments: Recognition and measurement”. Such stages are classification and measurement of financial instruments, impairment and accounting for hedging. This version It adds a new impairment model based on expected losses and introduces some minor amendments to the classification and measurement of financial assets. Additionally, this amendment to IFRS 9 includes the new general hedge accounting model, allow adoption of the treatment of fair value changes due to own credit on liabilities designated at fair value through profit or loss. The new standard replaces all previous versions of IFRS 9 and becomes effective for fiscal years starting on or after January 1, 2018, this is, for financial statements ended on June 30, 2019 for the Group. Earlier adoption is permitted.
The Group has adoptedis currently assessing the first stagespotential impact of IFRS 9the amendments on its financial statements. Cresud Sociedad Anónima, Comercial, Inmobiliaria, Financiera y Agropecuaria Notes to the transition date.Consolidated Financial Statements(Continued)
(Amounts in millions of Argentine Pesos, except otherwise indicated)
2. Summary of significant accounting policies (Continued) IFRS 15 “Revenue from contracts with customers”. Replaces IAS 11 “Construction contracts”, IAS 18 “Revenue”, IFRIC 13 “Customer loyalty programs”, IFRIC 15 “Agreements for the construction of real estate”, IFRIC 18 “Transfer of assets from customers” and SIC-31 “Revenue – Barter transactions involving advertising services”. Provides the new revenue recognition model derived from contracts with customers. The core principle underlying the model is satisfaction of obligations assumed with customers. Applies to all contracts with customers, other than those covered by other IFRSs, such as leases insurance and financial instruments contracts. The standard does not address recognition of interest or dividend income. IFRS 15 becomes effective for all fiscal years beginning as from January 1, 2018, that is, for financial statements ended on June 30, 2019 and may be adopted earlier. Application is retroactive. As of the date of these consolidated financial statements, the Group is assessing the impact that this standard shall have on its financial position and the results of operations. Amendments to IAS 16 “Property, plant and equipment” and IAS 38 “Intangible assets”. The amendments provide further guidance on the calculation of depreciation and amortization. Become effective for fiscal years beginning on or after January 1, 2016, that is, fiscal year ended June 30, 2017 for the Group. It may be applied earlier. The Group is currently assessing the potential impact of the amendments on its financial statements. Modification to IFRS 11 “Joint Arrangements”. The amendments clarify accounting for acquisitions where the business involves joint operations. Amendments become effective for fiscal years beginning on or after January 1, 2016, that is, fiscal year ended June 30, 2017 for the Group. It may be applied earlier. The Group is currently assessing the potential impact of the amendments on its financial statements. Amendments to IAS16IAS 16 “Property, Plant and Equipment” and IAS 41 “Agriculture”
On June, 2014 the International Accounting Standards Board issued the amendments to IAS 16 “Property, Plant and Equipment” and to IAS 41 “Agriculture” whereby the bearer plant concept is defined and bearer plants become part of the scope of IAS 16. A bearer plant is defined as a living plant that is used in the production or supply of agricultural produce, is expected to bear produce for more than one period and has a remote likelihood of being sold as agricultural produce, except for incidental scrap sales. Before, bearer plants were not defined and those related to agricultural production were covered by IAS 41.
Bearer plants are solely used to develop produce. The only significant future economic benefits derived from bearer plants result from the sale of the agricultural produce they generate.
Bearer plants meet the definition of property, plant and equipment of IAS 16 and their operation is similar to that of manufacturing. As a result, amendments require that bearer plants be accounted for as property, plant and equipment and covered by IAS 16, rather than IAS 41. The produce growing on bearer plants will continue to be governed by IAS 41.
Cresud Sociedad Anónima, Comercial, Inmobiliaria, Financiera y Agropecuaria Notes to the Consolidated Financial Statements(Continued) (Amounts in millions of Argentine Pesos, except otherwise indicated) 2. Summary of significant accounting policies (Continued) Amendments become effective for the fiscal year beginning January 1, 2016, that is, fiscal year ended June 30, 2017 for the Group. Earlier adoption is permitted. The Group's sugarcane fields are recognized as bearer plants under the new definition included in IAS 41. Under IAS 8, modifications are to be applied retrospectively; therefore, the sugar cane field will be reclassified under “Property, plant and equipment” and valued at depreciated cost and depreciated over its useful life under the balance declining method based on the expected yield as from June 30, 2016, with comparative balances being revised retrospectively. However, the agricultural production growing in sugar cane field will remain under “Biological assets” and will continue to be valued at fair value minus selling costs. These amendments will imply changes in accounting policies and will have the following impact on the financial situation and results of operations of the Group, is currently assessing the potential impactalready recognized in the preparation of consolidated financial statements on this balance sheet date.as of June 30, 2016, 2015 and 2014:
| Income statement (summary) | | June 30, 2016 (Published) | Increase / (Decrease) | June 30, 2016 (Adjusted) | June 30, 2015 (Published) | Increase / (Decrease) | June 30, 2015 (Adjusted) | June 30, 2014 (Published) | Increase / (Decrease) | June 30, 2014 (Adjusted) | | Costs | | (26,090) | (240) | (26,330) | (4,770) | (165) | (4,935) | (3,913) | (114) | (4,027) | | Initial recognition and changes in the fair value of biological assets and agricultural produce at the point of harvest | | 1,660 | 108 | 1,768 | 1,324 | 95 | 1,419 | 1,152 | 48 | 1,200 | | Income tax expense | | 197 | 6
| 203 | (303) | (5) | (308) | 389 | (4)
| 385
| | (Loss) / Profit for the year | | (1,891) | (126) | (2,017) | 175 | (75) | 100
| (1,409) | (70) | (1,479) | | Attributable to: | | | | | | | | | | | | Equity holders of the parent | | (1,038) | (85) | (1,123) | (250) | (57) | (307) | (1,068) | (54) | (1,122) | | Non-controlling interests | | (853) | (41) | (894) | 425 | (18) | 407 | (341) | (16) | (357) | | (Loss) / Profit per share attributable to equity holders of the parent during the year: | | | | | | | | | | | | Basic | | (3.82) | - | (3.82) | (0.36) | - | (0.36) | (2.15) | - | (2.15) | | Diluted | | (3.82) | - | (3.82) | (0.36) | - | (0.36) | (2.15) | - | (2.15) |
Cresud Sociedad Anónima, Comercial, Inmobiliaria, Financiera y Agropecuaria
Notes to the Consolidated Financial Statements(Continued) (All amountsAmounts in thousandsmillions of Argentine Pesos, except shares and per share data and as otherwise indicated)
2. | Summary of significant accounting policies (Continued)
|
IFRS 15 “Revenue from contracts with customers”
On May 28, 2014, the IASB has published the new IFRS 15 “Revenue from contracts with customers” (IFRS 15) that replaces IAS 11 “Construction contracts”, IAS 18 “Revenue from ordinary operating activities”, IFRIC 13 “Customer loyalty programs”, IFRIC 15 “Agreements for the construction of real estate”, IFRIC 18 “Transfer of assets from customers” and SIC-31 “Revenue – Barter transactions involving advertising services”. IFRS 15 provides the new revenue recognition model derived from contracts with customers. The core principle underlying the model is satisfaction of the obligations assumed with customers. IFRS 15 bases this principle on a single, five-step model that is developed extensively and in detail, including examples.
The new model of ordinary income applies to all contracts with customers, other than those covered by other IFRSs, such as leases insurance and financial instruments contracts. The standard does not address recognition of interest or dividend income.
IFRS 15 becomes effective for all fiscal years beginning as from January 1, 2017 and may be adopted earlier. Application is retroactive. On the balance sheet date, the Company is still assessing the impact that this standard shall have on its financial position and the results of operations.
Amendments to IAS 16 “Property, plant and equipment” and IAS 38 “Intangible assets”
On May 12, 2014, the IASB has published amendments to the IAS 16 “Property, plant and equipment” and IAS 38 “Intangible assets” denominated “Clarification of acceptable methods of depreciation and amortization” (Amendments to IAS 16 and IAS 38)”. The amendments provide further guidance on the calculation of depreciation and amortization of property, plant and equipment and intangible assets. The application of this amendments become effective for the fiscal year beginning January 1, 2016, that is, fiscal year ended June 30, 2017 for the Group. Earlier adoption is permitted. The Company has not yet assessed the impact that this standard shall have on its financial position and the results of its operations
Amendments to IFRS 11 “Joint Arrangements”
On May 6, 2014, the IASB has published amendments to IFRS 11 “Joint Arrangements”, entitled “Accounting for acquisition of interests in joint operations (Amendment to IFRS 11)”. The amendments clarify accounting for such acquisitions where the business involves joint operations. Amendments become effective for the fiscal year beginning January 1, 2016, that is, fiscal year ended June 30, 2017 for the Group. Earlier adoption is permitted. The Company has not yet assessed the impact that this standard shall have on its financial position and the results of its operations.
2. Summary of significant accounting policies (Continued) | Statements of financial position (summary) | | June 30, 2016 (Published) | Increase / (Decrease) | June 30, 2016 (Adjusted) | June 30, 2015 (Published) | Increase / (Decrease) | June 30, 2015 (Adjusted) | | Biological assets | | 1,132 | (20) | 1,112 | 579 | (18) | 561 | | Property, plant and equipment | | 26,300 | 549 | 26,849 | 1,977 | 348 | 2,325 | | Deferred income tax assets | | 2,199 | 47
| 2,246 | 684 | 19 | 703
| | Total Assets | | 45,121 | 576 | 45,697 | 15,276 | 349 | 15,625 | | Retained earnings | | (1,390) | 21
| (1,369) | (245) | 44
| (201) | | Cumulative translation adjustment | | 807 | 235 | 1,042 | 443 | 87 | 530 | | Total Shareholders’ Equity | | 15,232 | 256 | 15,488 | 3,903 | 131 | 4,034 |
Cresud Sociedad Anónima,
Comercial, Inmobiliaria, Financiera y Agropecuaria
Notes to Consolidated Financial Statements (Continued)
(All amounts in thousands of Argentine Pesos, except shares and per share data and as otherwise indicated)
2. | Summary of significant accounting policies (Continued)
|
On the issue date of these financial statements there are no other standards, amendments and interpretations issued by the IASB and IFRIC that are yet to become effective and that are expected to have a material effect on the Group.
Scope of consolidation
Subsidiaries are all entities (including structured entities) over which the Group has control. The Group controls an entity when the Group is exposed to, or has rights to, variable returns from its involvement with the entity and has the ability to affect those returns through its power over the entity. The Group also analyzeanalyzes whether there is control when it does not hold more than 50% of the voting rights of an entity, but does have capacity to define its relevant activities because of de-facto control.
There may be de-facto control where the relative size of voting rights held by the Group in an entity in relation to the size and dilution of other shareholders gives the Group power to define the relevant activities of such entity.
Subsidiaries are fully consolidated from the date on which control is transferred to the Group. They are deconsolidated from the date that control ceases.
The Group uses the acquisition method of accounting to account for business combinations The consideration transferred for the acquisition of a subsidiary is the fair value of the assets transferred, the liabilities incurred and the equity interests issued by the Group. The consideration transferred includes the fair value of any asset or liability resulting from a contingent consideration arrangement. Acquisition costs are charged to expenseexpensed as incurred. Identifiable assets acquired and liabilities and contingent liabilities assumed in a business combination are measured initially at their fair values at the acquisition date.
IFRS 3 “Business Combination” allows up to 12 months to finalize the accounting for a business combination. Where the accounting for a business combination is not complete by the end of the reporting period in which the business combination occurred, the Group reports provisional amounts.
The Group has elected to recognize acquisition of assets or group of assets carried out between entities under common control who also qualify as “Business Combination” according to IFRS 3, using acquisition method.
The Group recognizes any non-controlling interest in the acquireeacquire on an acquisition-by-acquisition basis either at fair value or at the non-controlling interest’s proportionate share of the acquiree’sacquire’s net assets.
The Group chooses the method to be used on a case by case base. Cresud Sociedad Anónima,
Comercial, Inmobiliaria, Financiera y Agropecuaria
Notes to Consolidated Financial Statements (Continued)
(All amounts in thousands of Argentine Pesos, except shares and per share data and as otherwise indicated)
2. | Summary of significant accounting policies (Continued)
|
The excess of the sum of the consideration transferred, the amount of any non-controlling interest in the acquire and the acquisition-date fair value of any previous equity interest in the acquireeacquire over the fair value of the identifiable net assets acquired is recorded as goodwill. If the total of consideration transferred, non-controlling interest recognized and previously held interest measured is less than the fair value of the net assets of the subsidiary acquired in the case of a bargain purchase, the difference is recognized directly in the statements of income statements as “Bargain purchases gains”.
Inter-company transactions, balances and unrealized gains and/or losses on transactions between group companies are eliminated. Unrealized losses are also eliminated. AccountingCresud Sociedad Anónima, Comercial, Inmobiliaria, Financiera y Agropecuaria Notes to the Consolidated Financial Statements(Continued) (Amounts in millions of Argentine Pesos, except otherwise indicated) 2. Summary of significant accounting policies of subsidiaries are changed where necessary to ensure consistency with the policies adopted by the Group. The majority of subsidiaries have the same year-end as the Group’s, however, a small number of subsidiaries have different year-ends. In these circumstances, special-purpose financial statements prepared as of June 30 of each year are used for purposes of the Group consolidation. (Continued)
The Group conducts its business through several operating and holding subsidiaries. Unless otherwise stated,investment companies, the subsidiariesprincipal companies are listed below have share capital consisting solely of ordinary shares, which are held directly or indirectly by the Group and the proportion of ownership interests held equals to the voting rights held by the Group.below:
The country of incorporation or registration is also their place of business. Subsidiaries are shown in alphabetical order.
Ownership interest is shown considering ultimate percentage held by the Company. Subsidiaries are either controlled directly by the Company (i.e. IRSA), or indirectly by other subsidiary (i.e. IRSA Propiedades Comerciales S.A. through IRSA).
| | | | June 30, 2016 | June 30, 2015 | June 30, 2014 | | Name of the entity | Country | Main activity | % of ownership interest held by the Group (6) | % of ownership interest held by the NCI | % of ownership interest held by the Group (6) | % of ownership interest held by the NCI | % of ownership interest held by the Group (6) | % of ownership interest held by the NCI | | Direct equity interest: | | | | | | | | | | Brasilagro-Companhia Brasileira de Propiedades Agrícolas (1) | Brazil | Agricultural | 42.18% | 57.82% | 39.76% | 60.23% | 39.63% | 60.37% | | Cactus Argentina S.A. (2) | Argentina | Agro-industrial | - | - | - | - | 97.13% | - | | Sociedad Anónima Carnes Pampeanas S.A. | Argentina | Agro-industrial | 95.00% | 5.00% | 95.00% | - | 39.38% | - | | Futuros y Opciones.Com S.A. | Argentina | Brokerage | 59.59% | 40.41% | 59.59% | 40.41% | 59.59% | 40.41% | | FyO Trading S.A. | Argentina | Brokerage | 2.20% | 97.80% | - | - | - | - | | Granos Olavarría S.A. | Argentina | Warehousing and brokerage | 2.20% | 97.80% | - | - | - | - | | Helmir S.A. | Uruguay | Investment | 100.00% | - | 100.00% | - | 100.00% | - | | IRSA Inversiones y Representaciones Sociedad Anónima | Argentina | Real Estate | 63.38% | 36.23% | 63.91% | 35.70% | 64.56% | 34.55% | | Doneldon S.A. | Uruguay | Investment | 100.00% | - | 100.00% | - | 100.00% | - | | Interest indirectly held through BrasilAgro: | | | | | | | | | | Araucária Ltda. | Brazil | Agricultural | 99.99% | 0.01% | 39.63% | 60.37% | 39.63% | 60.37% | | Cajueiro Ltda. | Brazil | Agricultural | 99.99% | 0.01% | 39.63% | 60.37% | 39.63% | 60.37% | | Ceibo Ltda. | Brazil | Agricultural | 99.99% | 0.01% | 39.63% | 60.37% | 39.63% | 60.37% | | Cremaq Ltda. | Brazil | Agricultural | 99.99% | 0.01% | 39.63% | 60.37% | 39.63% | 60.37% | | Engenho de Maracajú Ltda. | Brazil | Agricultural | 99.99% | 0.01% | 39.63% | 60.37% | 39.63% | 60.37% | | Flamboyant Ltda. | Brazil | Agricultural | 99.99% | 0.01% | 39.63% | 60.37% | 39.63% | 60.37% | | Jaborandi Agrícola Ltda. | Brazil | Agricultural | 99.99% | 0.01% | 39.63% | 60.37% | 39.63% | 60.37% | | Jaborandi Propriedades Agrícolas S.A. | Brazil | Agricultural | 99.99% | 0.01% | 39.63% | 60.37% | 39.63% | 60.37% | | Mogno Ltda. | Brazil | Agricultural | 99.99% | 0.01% | 39.63% | 60.37% | 39.63% | 60.37% | | Interest indirectly held through Futuros y Opciones.Com. S.A.: | | | | | | | | | | FyO Trading S.A. | Argentina | Brokerage | 96.37% | 3.63% | 59.63% | 40.37% | 59.63% | 40.37% | | Granos Olavarría S.A. | Argentina | Warehousing and brokerage | 96.37% | 3.63% | 59.63% | 40.37% | 59.63% | 40.37% | | Interest indirectly held through Helmir S.A.: | | | | | | | | | | IRSA Inversiones y Representaciones Sociedad Anónima | Argentina | Real Estate | 0.39% | 99.61% | 0.39% | 35.70% | - | - | | Sociedad Anónima Carnes Pampeanas S.A. | Argentina | Agro-industrial | 5.00% | 95.00% | - | 5% | - | - | | Cactus Argentina S.A. (2) | Argentina | Agro-industrial | - | - | - | - | 2.87% | - | | Agropecuaria Acres del Sud S.A. | Bolivia | Agricultural | 39.76% | 60.24% | 39.76% | - | 39.76% | - | | Yatay Agropecuaria S.A. | Bolivia | Agricultural | 30.70% | 69.30% | 30.70% | - | 30.70% | - |
Cresud Sociedad Anónima, Comercial, Inmobiliaria, Financiera y Agropecuaria
Notes to the Consolidated Financial Statements(Continued) (All amountsAmounts in thousandsmillions of Argentine Pesos, except shares and per share data and as otherwise indicated)
2. | Summary of significant accounting policies (Continued)
|
| | | | | June 30, 2015 | | | June 30, 2014 | | | June 30, 2013 | | | Name of the entity | Place of business / country of incorporation | Main Activities (*) | | % of ownership interest by the Group | | | % of ownership interest by the NCI (7) | | | % of ownership interest by the Group | | | % of ownership interest by the NCI (7) | | | % of ownership interest by the Group | | | % of ownership interest by the NCI (7) | | | Direct equity interest: | | | | | | | | | | | | | | | | | | | | | | Agrotech S.A (1) | Argentina | Investment | | | - | | | | - | | | | - | | | | - | | | | 95.00 | % | | | - | | | Brasilagro-Companhía Brasileira de Propiedades Agrícolas (2) | Brazil | Agricultural | | | (***) 39.76 | % | | | 60.24 | % | | | (***) 39.63 | % | | | 60.37 | % | | | 39.64 | % | | | 60.36 | % | | Cactus Argentina S.A. (3) | Argentina | Agro-industrial | | | - | | | | - | | | | 97.13 | % | | | - | | | | 95.00 | % | | | - | | | Sociedad Anónima Carnes Pampeanas S.A. | Argentina | Agro-industrial | | | 95.00 | % | | | - | | | | 39.38 | % | | | - | | | | 38.92 | % | | | - | | | Futuros y Opciones.Com S.A. | Argentina | Brokerage | | | 59.59 | % | | | 40.41 | % | | | 59.59 | % | | | 40.41 | % | | | 60.50 | % | | | 39.50 | % | | Helmir S.A. | Uruguay | Investment | | | 100 | % | | | - | | | | 100.00 | % | | | - | | | | 100.00 | % | | | - | | | IRSA | Argentina | Real Estate | | | (***) 63.91 | % | | | 35.70 | % | | | (***) 64.56 | % | | | 34.55 | % | | | 64.56 | % | | | 34.55 | % | | Northagro S.A. (4) | Argentina | Investment | | | - | | | | - | | | | - | | | | - | | | | 100.00 | % | | | - | | | Pluriagro S.A. (4) | Argentina | Investment | | | - | | | | - | | | | - | | | | - | | | | 100.00 | % | | | - | | | Doneldon S.A. | Uruguay | Investment | | | 100 | % | | | - | | | | 100.00 | % | | | - | | | | 100.00 | % | | | - | | | Interest indirectly held through IRSA: | | | | | | | | | | | | | | | | | | | | | | | | | | | | IRSA Propiedades Comerciales S.A. | Argentina | Real Estate | | | 62.06 | % | | | 37.94 | % | | | 63.18 | % | | | 36.82 | % | | | 62.62 | % | | | 37.38 | % | | Apsamedia S.A. | Argentina | Consumer financing (**) and advertising | | | - | | | | - | | | | - | | | | - | | | | 62.62 | % | | | 37.38 | % | | Emprendimiento Recoleta S.A. | Argentina | Real Estate | | | 33.31 | % | | | 66.69 | % | | | 33.91 | % | | | 66.09 | % | | | 33.62 | % | | | 66.38 | % | | Fibesa S.A. | Argentina | Real Estate | | | 62.06 | % | | | 37.94 | % | | | 63.18 | % | | | 36.82 | % | | | 62.62 | % | | | 37.38 | % | | Hoteles Argentinos S.A. | Argentina | Hotel | | | 51.82 | % | | | 48.18 | % | | | 52.81 | % | | | 47.19 | % | | | 52.36 | % | | | 47.64 | % | | Dolphin Fund Ltd. (6) | Bermudas | Investment | | | 59.32 | % | | | 40.68 | % | | | 56.88 | % | | | 43.12 | % | | | - | | | | - | | | I Madison LLC | United States | Investment | | | 64.78 | % | | | 35.22 | % | | | 66.01 | % | | | 33.99 | % | | | 65.45 | % | | | 34.55 | % | | Inversora Bolívar S.A. | Argentina | Investment | | | 64.78 | % | | | 35.22 | % | | | 66.01 | % | | | 33.99 | % | | | 65.45 | % | | | 34.55 | % | | IRSA Development LP | United States | Investment | | | 64.78 | % | | | 35.22 | % | | | 66.01 | % | | | 33.99 | % | | | 65.45 | % | | | 34.55 | % | | IRSA International LLC | United States | Investment | | | 64.78 | % | | | 35.22 | % | | | 66.01 | % | | | 33.99 | % | | | 65.45 | % | | | 34.55 | % | | Jiwin S.A. | Uruguay | Investment | | | 64.78 | % | | | 35.22 | % | | | 66.01 | % | | | 33.99 | % | | | 65.45 | % | | | 34.55 | % | | Liveck S.A. | Uruguay | Investment | | | 64.78 | % | | | 35.22 | % | | | 66.01 | % | | | 33.99 | % | | | 65.45 | % | | | 34.55 | % | | Llao Llao Resorts S.A. (5) | Argentina | Hotel | | | 32.39 | % | | | 67.61 | % | | | 33.01 | % | | | 66.99 | % | | | 32.73 | % | | | 67.28 | % | | Nuevas Fronteras S.A. | Argentina | Hotel | | | 49.45 | % | | | 50.55 | % | | | 50.39 | % | | | 49.61 | % | | | 49.96 | % | | | 50.04 | % | | Palermo Invest S.A. | Argentina | Investment | | | 64.78 | % | | | 35.22 | % | | | 66.01 | % | | | 33.99 | % | | | 65.45 | % | | | 34.55 | % | | Real Estate Investment Group LP | Bermudas | Investment | | | 41.46 | % | | | 58.54 | % | | | 42.25 | % | | | 57.75 | % | | | 41.89 | % | | | 58.11 | % |
2. Summary of significant accounting policies (Continued) | | | | June 30, 2016 | June 30, 2015 | June 30, 2014 | | Name of the entity | Country | Main activity | % of ownership interest held by the Group (6) | % of ownership interest held by the NCI | % of ownership interest held by the Group (6) | % of ownership interest held by the NCI | % of ownership interest held by the Group (6) | % of ownership interest held by the NCI | | Interest indirectly held through Doneldon: S.A.: | | | | | | | | | | Agropecuaria Acres del Sud S.A. | Bolivia | Agricultural | 60.24% | 39.76% | 59.24% | - | 59.24% | - | | Ombú Agropecuaria S.A. | Bolivia | Agricultural | 100.00% | - | 100.00% | - | 100.00% | - | | Yatay Agropecuaria S.A. | Bolivia | Agricultural | 69.30% | 30.70% | 69.31% | - | 69.31% | - | | Yuchán Agropecuaria S.A. | Bolivia | Agricultural | 100.00% | - | 100.00% | - | 100.00% | - | | Sedelor S.A. | Uruguay | Investment | 100.00% | - | 100.00% | - | 100.00% | - | | Codalis S.A. | Uruguay | Investment | 100.00% | - | 100.00% | - | 100.00% | - | | Alafox S.A. | Uruguay | Investment | 100.00% | - | 100.00% | - | 100.00% | - |
Urban properties and investments business | Interest indirectly held through IRSA: | | | | | | | | | | IRSA CP (5) | Argentina | Real Estate | 60.33% | 39.67% | 62.00% | 37.94% | 63.18% | 36.82% | | E-Commerce Latina S.A. (5) | Argentina | Investment | 63.77% | 36.23% | 65.00% | 35.22% | 66.01% | 33.99% | | Efanur S.A. | Uruguay | Investment | 63.77% | 36.23% | 65.00% | 35.22% | 66.01% | 33.99% | | Hoteles Argentinos S.A. | Argentina | Hotel | 51.02% | 48.98% | 52.00% | 48.18% | 52.81% | 47.19% | | Inversora Bolívar S.A. | Argentina | Investment | 63.77% | 36.23% | 65.00% | 35.22% | 66.01% | 33.99% | | Llao Llao Resorts S.A. (3) | Argentina | Hotel | 31.89% | 68.11% | 32.00% | 67.61% | 33.01% | 66.99% | | Nuevas Fronteras S.A. | Argentina | Hotel | 48.68% | 51.32% | 49.00% | 50.55% | 50.39% | 49.61% | | Palermo Invest S.A. | Argentina | Investment | 63.77% | 36.23% | 65.00% | 35.22% | 66.01% | 33.99% | | Ritelco S.A. | Uruguay | Investment | 63.77% | 36.23% | 65.00% | 35.22% | 66.01% | 33.99% | | Tyrus S.A. | Uruguay | Investment | 63.77% | 36.23% | 65.00% | 35.22% | 66.01% | 33.99% | | Interest indirectly held through IRSA CP: | | | | | | | | | | Arcos del Gourmet S.A. | Argentina | Real Estate | 57.40% | 42.60% | 56.00% | 44.15% | 56.86% | 43.14% | | Emprendimiento Recoleta S.A. | Argentina | Real Estate | 34.24% | 65.76% | 33.00% | 66.69% | 33.91% | 66.09% | | Fibesa S.A. | Argentina | Real Estate | 63.77% | 36.23% | 62.00% | 37.94% | 63.18% | 36.82% | | Panamerican Mall S.A. | Argentina | Real Estate | 51.02% | 48.98% | 50.00% | 50.35% | 50.54% | 49.46% | | Shopping Neuquén S.A. | Argentina | Real Estate | 63.47% | 36.53% | 99.14% | 0.86% | 99.07% | 0.93% | | Torodur S.A. | Uruguay | Investment | 63.77% | 36.23% | 62.00% | 37.94% | 63.18% | 36.82% | Interest indirectly held through Tyrus S.A.: | | | | | | | | | | Dolphin Fund Ltd. (4) | Bermudas | Investment | 58.00% | 41.60% | 55.00% | 40.68% | 56.88% | 43.12% | | I Madison LLC | United States | Investment | 64.00% | 36.23% | 65.00% | 35.22% | 66.01% | 33.99% | | IRSA Development LP | United States | Investment | 64.00% | 36.23% | 65.00% | 35.22% | 66.01% | 33.99% | | IRSA International LLC | United States | Investment | 64.00% | 36.23% | 65.00% | 35.22% | 66.01% | 33.99% | | Jiwin S.A. | Uruguay | Investment | 64.00% | 36.23% | 65.00% | 35.22% | 66.01% | 33.99% | | Liveck S.A. | Uruguay | Investment | 64.00% | 36.23% | 65.00% | 35.22% | 66.01% | 33.99% | | Real Estate Investment Group IV LP | Bermudas | Investment | 100.00% | - | 100.00% | - | 100.00% | - | | Real Estate Investment Group V LP | Bermudas | Investment | 100.00% | - | 100.00% | - | 100.00% | - | | Real Estate Strategies LLC | United States | Investment | 64.00% | 36.23% | 65.00% | 35.22% | 66.01% | 33.99% | Interest indirectly held through Efanur S.A.: | | | | | | | | | | Real Estate Strategies LP | United States | Investment | 43.00% | 57.38% | 43.00% | 56.71% | 44.12% | 55.88% | | Interest indirectly held through Dolphin Fund Ltd. | | | | | | | | | | IDB Development Corporation Ltd. (7) | Israel | Investment | 44.00% | 56.46% | - | - | - | - |
Cresud Sociedad Anónima, Comercial, Inmobiliaria, Financiera y Agropecuaria
Notes to the Consolidated Financial Statements(Continued) (All amountsAmounts in thousandsmillions of Argentine Pesos, except shares and per share data and as otherwise indicated)
2. | Summary of significant accounting policies (Continued)
|
| | | | | June 30, 2015 | | | June 30, 2014 | | | June 30, 2013 | | | Name of the entity | Place of business / Country of incorporation | Main Activities (*) | | % of ownership interest by the Group | | | % of ownership interest by the NCI (7) | | | % of ownership interest by the Group | | | % of ownership interest by the NCI (7) | | | % of ownership interest by the Group | | | % of ownership interest by the NCI (7) | | | Real Estate Investment Group II LP | Bermudas | Investment | | | 52.17 | % | | | 47.83 | % | | | 53.17 | % | | | 46.83 | % | | | 52.71 | % | | | 47.29 | % | | Real Estate Investment Group III LP | Bermudas | Investment | | | 52.59 | % | | | 47.41 | % | | | 53.59 | % | | | 46.41 | % | | | 53.14 | % | | | 46.86 | % | | Real Estate Investment Group IV LP | Bermudas | Investment | | | 64.78 | % | | | 35.22 | % | | | 66.01 | % | | | 33.99 | % | | | 65.45 | % | | | 34.55 | % | | Real Estate Investment Group V LP | Bermudas | Investment | | | 64.78 | % | | | 35.22 | % | | | 66.01 | % | | | 33.99 | % | | | 65.45 | % | | | 34.55 | % | | Real Estate Strategies LP | Bermudas | Investment | | | 43.29 | % | | | 56.71 | % | | | 44.12 | % | | | 55.88 | % | | | 43.74 | % | | | 56.26 | % | | Real Estate Strategies LLC | United States | Investment | | | 64.78 | % | | | 35.22 | % | | | 66.01 | % | | | 33.99 | % | | | 65.45 | % | | | 34.55 | % | | Arcos del Gourmet S.A. | Argentina | Real Estate | | | 55.85 | % | | | 44.15 | % | | | 56.86 | % | | | 43.14 | % | | | 56.37 | % | | | 43.63 | % | | Conil S.A. | Argentina | Real Estate | | | - | | | | - | | | | 63.18 | % | | | 36.82 | % | | | 62.62 | % | | | 37.38 | % | | Panamerican Mall S.A. | Argentina | Real Estate | | | 49.65 | % | | | 50.35 | % | | | 50.54 | % | | | 49.46 | % | | | 50.10 | % | | | 49.90 | % | | E-Commerce Latina S.A. | Argentina | Investment | | | 64.78 | % | | | 35.22 | % | | | 66.01 | % | | | 33.99 | % | | | 65.45 | % | | | 34.55 | % | | Efanur S.A. | Uruguay | Investment | | | 64.78 | % | | | 35.22 | % | | | 66.01 | % | | | 33.99 | % | | | 65.45 | % | | | 34.55 | % | | Ritelco S.A. | Uruguay | Investment | | | 64.78 | % | | | 35.22 | % | | | 66.01 | % | | | 33.99 | % | | | 65.45 | % | | | 34.55 | % | | Shopping Neuquén S.A. | Argentina | Real Estate | | | 61.78 | % | | | 35.22 | % | | | 62.68 | % | | | 37.32 | % | | | 62.05 | % | | | 37.95 | % | | Solares de Santa María S.A. | Argentina | Real Estate | | | 64.78 | % | | | 35.22 | % | | | 66.01 | % | | | 33.99 | % | | | 65.45 | % | | | 34.55 | % | | Torodur S.A. | Uruguay | Investment | | | 62.06 | % | | | 37.94 | % | | | 63.18 | % | | | 36.82 | % | | | 62.62 | % | | | 37.38 | % | | Tyrus S.A. | Uruguay | Investment | | | 64.78 | % | | | 35.22 | % | | | 66.01 | % | | | 33.99 | % | | | 65.45 | % | | | 34.55 | % | | Unicity S.A. | Argentina | Investment | | | 64.78 | % | | | 35.22 | % | | | 65.45 | % | | | 33.99 | % | | | 65.45 | % | | | 34.55 | % | | Doneldon S.A. | Uruguay | Investment | | | 100 | % | | | - | | | | 100 | % | | | - | | | | 100 | % | | | - | | | Interest indirectly held through BrasilAgro: | | | | | | | | | | | | | | | | | | | | | | | | | | | | Araucária Ltda. | Brazil | Agricultural | | | 39.63 | % | | | 60.37 | % | | | 39.63 | % | | | 60.37 | % | | | 39.64 | % | | | 60.36 | % | | Cajueiro Ltda. | Brazil | Agricultural | | | 39.63 | % | | | 60.37 | % | | | 39.63 | % | | | 60.37 | % | | | 39.64 | % | | | 60.36 | % | | Ceibo Ltda. | Brazil | Agricultural | | | 39.63 | % | | | 60.37 | % | | | 39.63 | % | | | 60.37 | % | | | 39.64 | % | | | 60.36 | % | | Cremaq Ltda. | Brazil | Agricultural | | | 39.63 | % | | | 60.37 | % | | | 39.63 | % | | | 60.37 | % | | | 39.64 | % | | | 60.36 | % | | Engenho de Maracajú Ltda. | Brazil | Agricultural | | | 39.63 | % | | | 60.37 | % | | | 39.63 | % | | | 60.37 | % | | | 39.64 | % | | | 60.36 | % | | Flamboyant Ltda. | Brazil | Agricultural | | | 39.63 | % | | | 60.37 | % | | | 39.63 | % | | | 60.37 | % | | | 39.64 | % | | | 60.36 | % | | Jaborandi Agrícola Ltda. | Brazil | Agricultural | | | 39.63 | % | | | 60.37 | % | | | 39.63 | % | | | 60.37 | % | | | 39.64 | % | | | 60.36 | % | | Jaborandi Propriedades Agrícolas S.A. | Brazil | Agricultural | | | 39.63 | % | | | 60.37 | % | | | 39.63 | % | | | 60.37 | % | | | 39.64 | % | | | 60.36 | % | | Mogno Ltda. | Brazil | Agricultural | | | 39.63 | % | | | 60.37 | % | | | 39.63 | % | | | 60.37 | % | | | 39.64 | % | | | 60.36 | % |
Cresud Sociedad Anónima,
Comercial, Inmobiliaria, Financiera y Agropecuaria
2.
Notes to Consolidated Financial Statements (Continued)
(All amounts in thousands of Argentine Pesos, except shares and per share data and as otherwise indicated)
2. | Summary of significant accounting policies (Continued)
|
| | | | | June 30, 2015 | | | June 30, 2014 | | | June 30, 2013 | | | Name of the entity | Place of business / country of incorporation | Main Activities (*) | | % of ownership interest by the Group | | | % of ownership interest by the NCI (7) | | | % of ownership interest by the Group | | | % of ownership interest by the NCI (7) | | | % of ownership interest by the Group | | | % of ownership interest by the NCI (7) | | | Interest indirectly held through Cactus S.A. (3): | | | | | | | | | | | | | | | | | | | | | | Sociedad Anónima Carnes Pampeanas S.A. | Argentina | Agro-industrial | | | - | | | | - | | | | 60.62 | % | | | - | | | | 61.08 | % | | | - | | | Agrotech S.A. (1) | Argentina | Investment | | | - | | | | - | | | | - | | | | - | | | | 5.00 | % | | | - | | | IRSA | Argentina | Real Estate | | | - | | | | - | | | | (***) 0.89 | % | | | - | | | | 0.89 | % | | | - | | | Interest indirectly held through Futuros y Opciones.Com. S.A.: | | | | | | | | | | | | | | | | | | | | | | | | | | | | FyO Trading S.A. | Argentina | Brokerage | | | 59.63 | % | | | 40.37 | % | | | 59.63 | % | | | 40.37 | % | | | 60.50 | % | | | 39.50 | % | | Granos Olavarría S.A. | Argentina | Warehousing and brokerage | | | 59.63 | % | | | 40.37 | % | | | 59.63 | % | | | 40.37 | % | | | - | | | | - | | | Interest indirectly held through Helmir. S.A.: | | | | | | | | | | | | | | | | | | | | | | | | | | | | IRSA | Argentina | Real Estate | | | (***) 0.39 | % | | | 35.70 | % | | | - | | | | - | | | | - | | | | - | | | Sociedad Anónima Carnes Pampeanas S.A. | Argentina | Agro-industrial | | | - | | | | 5 | % | | | - | | | | - | | | | - | | | | - | | | Cactus Argentina S.A. (3) | Argentina | Agro-industrial | | | - | | | | - | | | | 2.87 | % | | | - | | | | 5.00 | % | | | - | | | Agropecuaria Acres del Sud S.A. | Bolivia | Agricultural | | | 39.76 | % | | | - | | | | 39.76 | % | | | - | | | | - | | | | - | | | Yatay Agropecuaria S.A. | Bolivia | Agricultural | | | 30.70 | % | | | - | | | | 30.70 | % | | | - | | | | - | | | | - | | | Interest indirectly held through Doneldon. S.A.: | | | | | | | | | | | | | | | | | | | | | | | | | | | | Agropecuaria Acres del Sud S.A. | Bolivia | Agricultural | | | 59.24 | % | | | - | | | | 59.24 | % | | | - | | | | 100.00 | % | | | - | | | Ombú Agropecuaria S.A. | Bolivia | Agricultural | | | 100.00 | % | | | - | | | | 100.00 | % | | | - | | | | 100.00 | % | | | - | | | Yatay Agropecuaria S.A. | Bolivia | Agricultural | | | 69.31 | % | | | - | | | | 69.31 | % | | | - | | | | 100.00 | % | | | - | | | Yuchán Agropecuaria S.A. | Bolivia | Agricultural | | | 100.00 | % | | | - | | | | 100.00 | % | | | - | | | | 100.00 | % | | | - | | | Sedelor S.A. | Uruguay | Investment | | | 100.00 | % | | | - | | | | 100.00 | % | | | - | | | | 100.00 | % | | | - | | | Codalis S.A. | Uruguay | Investment | | | 100.00 | % | | | - | | | | 100.00 | % | | | - | | | | 100.00 | % | | | - | | | Alafox S.A. | Uruguay | Investment | | | 100.00 | % | | | - | | | | 100.00 | % | | | - | | | | 100.00 | % | | | - | |
(1) | As from January 1, 2014, all transactions carried out by Agrotech S.A, are understood as if they had been made by and for Cactus S.A. due to the pre-merger commitment signed on February 25, 2014. |
(2) | The Group has consolidated the investment in Brasilagro-Companhía Brasileira de Propiedades Agrícolas (“Brasilagro”) considering that the Company exercises “de facto control” over it. See Note 7 for further information regarding to Brasilagro. |
(3) | As from July 1st, 2014, all transactions carried out by Cactus Argentina S.A., are understood as if they had been made by and for Cresud S.A.C.I.F. y A. due to the pre-merger commitment signed in September 2014. |
(4) | On August 22, 2013 the Board of Directors of Cresud approved the withdrawal of the process of incorporation against the Superintendence of Corporations. |
(5) | The Group has consolidated the investment in Llao Llao Resorts S.A. considering their ownership interest together with the Company's participation in the making decisions. |
(6) | The Group has consolidated its indirect interest in Dolphin Fund Ltd. (DFL) considering its exposure to variable returns coming from its investment in DFL and the nature of the relationship between the Group and the shareholders with right to vote of DFL. |
(7) | Non-controlling interest (NCI) |
(*) | Companies whose principal activity is “investment” are substantially holding companies that do not have significant assets and liabilities other than their respective interest holdings in operating entities. |
(***) | The effect of treasury shares as of June 30, 2015 and 2014 was not considered. |
Cresud Sociedad Anónima,
Comercial, Inmobiliaria, Financiera y Agropecuaria
Notes to Consolidated Financial Statements (Continued)
(All amounts in thousands of Argentine Pesos, except shares and per share data and as otherwise indicated)
2. Summary of significant accounting policies(Continued)
| Name of the entity | Country | Main activity | % of ownership interest held by the Group (5) | % of ownership interest held by the NCI | | Interest indirectly held through IDBD: | | | | | | Discount Investment Corporation Ltd. | Israel | Investment | 76.43% | 23.57% | | IDB Tourism (2009) Ltd. | Israel | Holding company in tourist services sector | 100.00% | - | | IDB Group Investment Inc. | Israel | Investment | 100.00% | - | | Interest indirectly held through Discount Investment Corporation Ltd.: | | | | | | Property & Building Corporation Ltd. | Israel | Real Estate | 76.45% | 23.55% | | Gav Yam Land Ltd. | Israel | Real Estate | 52.80% | 47.20% | | Israel Property Rental Corporation Ltd. (ISPRO) | Israel | Real Estate | 76.45% | 23.55% | | MATAM - Haifa Science Industries Center | Israel | Real Estate | 38.30% | 61.70% | | Neveh-Gad Building & Development Ltd. | Israel | Real Estate | 76.45% | 23.55% | | Hadarim Properties Ltd. | Israel | Real Estate | 76.45% | 23.55% | | PBC USA Investment Inc. | United States | Real Estate | 76.45% | 23.55% | | Shufersal Ltd. | Israel | Supermarket | 52.95% | 47.05% | | Shufersal Real Estate Ltd. | Israel | Supermarket | 52.95% | 47.05% | | Koor Industries Ltd.(8) | Israel | Holding company in the agrochemical sector | 100.00% | - | | Cellcom Israel Ltd. (9) | Israel | Communication services | 41.77% | 58.23% | | Netvision Ltd. | Israel | Communication services | 41.77% | 58.23% | | Elron Electronic Industries Ltd. | Israel | Technology development – Holding | 50.32% | 49.68% | | Bartan Holdings and Investment Ltd. | Israel | Holding | 55.68% | 44.32% | | Epsilon Investment House Ltd. | Israel | Holding | 68.75% | 31.25% |
(1) The Group has consolidated the investment in Brasilagro considering that the Company exercises “de facto control” over it. See Note 7 for further information regarding to Brasilagro. (2) As from July 1st, 2014, all transactions carried out by Cactus Argentina S.A., are understood as if they had been made by and for Cresud S.A.C.I.F. y A. due to the pre-merger commitment signed in September 2014. (3) The Group has consolidated the investment in Llao Llao Resorts S.A. considering their ownership interest held together with the Company's participation in the making decisions. (4) Includes interest indirectly held through Ritelco S.A. (5) Includes interest indirectly held through Tyrus S.A. (6) Correspond to interest directly held in each company. (7) Owns a 40% equity interest of Adama. (8) The Group has consolidated the interest in Cellcom taking into consideration its equity interest and decision-making power given the fact that the remaining interests are too disperse. (9) Until takeover was secured, IDBD was valued at fair value in accordance with IAS 28 exception. The Group takes into account both quantitative and qualitative aspects in order to determine which non-controlling interests in subsidiaries are considered significant. In quantitative terms, the investments that individually represent at least 20% of the total equity attributable to non-controlling interest (b) Changes in ownership interests in subsidiaries at the each year end. Therefore, in qualitative terms, are considered, among other factors, the specific risks to which each company is exposed to, their returns and the importance that eachwithout change of them has for the Group.control
Summarized financial information on subsidiaries with material non-controlling interests and other information are included in Note 7.
(b) | Changes in ownership interests in subsidiaries without change of control |
Transactions with non-controlling interests that do not result in loss of control are accounted for as equity transactions – that is, as transactions with the owners in their capacity as owners. The recorded amount is the difference between the fair value of the consideration paid and/or receive and the relevant share acquired and/or given of the carrying value of net assets of the subsidiary.
(c) | Disposal of subsidiaries with loss of control |
Cresud Sociedad Anónima, Comercial, Inmobiliaria, Financiera y Agropecuaria Notes to the Consolidated Financial Statements(Continued) (All amounts in millions of Argentine Pesos, except otherwise indicated) 2. Summary of significant accounting policies (Continued) (c) Disposal of subsidiaries with loss of control When the Group ceases to have control any retained interest in the entity is re-measured at its fair value at the date when control is lost, with changes in carrying amount recognized in profit or loss. The fair value is the initial carrying amount for the purposes of subsequently accounting for the retained interest as an associate, joint venture or financial asset. In addition, any amounts previously recognized in other comprehensive income in respect of that entity are accounted for as if the Group had directly disposed of the related assets or liabilities. This may mean that amounts previously recognized in other comprehensive income are reclassified to profit or loss.
Associates
Associates are all entities over which the Group has significant influence but not control, generally accompanying a shareholding of between 20% and less than 50% of the voting rights. Investments in associates are accounted for using the equity method of accounting.accounting, except as otherwise indicated as explained below. Under the equity method, the investment is initially recognized at cost, and the carrying amount is increased or decreased to recognize the investor’s share of the profit or loss of the investee after the date of acquisition. The Group’s investment in associates includes goodwill identified on acquisition.
Investments in associates are accounted for using the equity method of accounting, except as otherwise indicated as explained below.
Cresud Sociedad Anónima,
Comercial, Inmobiliaria, Financiera y Agropecuaria
Notes to Consolidated Financial Statements (Continued)
(All amounts in thousands of Argentine Pesos, except shares and per share data and as otherwise indicated)
2. | Summary of significant accounting policies (Continued)
|
If the ownership interest in an associate is reduced but significant influence is retained, only a proportionate share of the amounts previously recognized in other comprehensive income is reclassified to profit or loss where appropriate.
The Group’s share of post-acquisition profit or loss is recognized in the income statements, and its share of post- acquisition movements in other comprehensive income is recognized in other comprehensive income with a corresponding adjustment to the carrying amount of the investment. When the Group’s share of losses in an associate equals or exceeds its interest in the associate, including any other unsecured receivables, the Group recognizes such losses until the carrying amount of the associate reduces to zero, unless it has incurred legal or constructive obligations or made payments on behalf of the associate.
The Group determines at each reporting date whether there is any objective evidence that the investment in the associate is impaired. If this is the case, the Group calculates the amount of impairment as the difference between the recoverable amount of the associate and its carrying value and recognizes the amount adjacent to ‘share of profit / (loss) of associates and joint ventures’ in the income statements.
Profits and losses resulting from upstream and downstream transactions between the Group and its associate are recognized in the Group’s financial statements only to the extent of unrelated investor’s interests in the associates. Unrealized losses are eliminated unless the transaction provides evidence of an impairment of the asset transferred. Accounting policies of associates have been changed where necessary to ensure consistency with the policies adopted by the Group.
For purposes of including the earnings of associates by applying the equity method, the Group uses financial statements of the associates as of the same date or a later date, provided the difference between the reporting date of the associate and that of the Group cannot be longer than three months. In these cases, the Group assesses and adjusts the results of such associates for material transactions or other material events occurred during the interim period.
The Group takes into account both quantitative and qualitative aspects in order to determine which non-controlling interests in associates are considered significant. In quantitative terms, the investments that individually represent at least 20% of the result of joint ventures in the Consolidated Income statements, and at least 20% of the total equity attributable to non-controlling interest in joint ventures at the each year-end are considered significant. Therefore, in qualitative terms, are considered, among other factors, the specific risks to which each company is exposed to, their returns and the importance that each of them has for the Group.
Cresud Sociedad Anónima,
Comercial, Inmobiliaria, Financiera y Agropecuaria
Notes to Consolidated Financial Statements (Continued)
(All amounts in thousands of Argentine Pesos, except shares and per share data and as otherwise indicated)
2. | Summary of significant accounting policies (Continued)
|
As indicated above, the Group generally accounts for its investments in associates under the equity method. However, IAS 28 “Investments in Associates” provides an exemption from applying the equity method where investments in associates are held through “Venture Capital Organizations” (VCO) or venture capital entities, as defined in Spanish, even when the Group is not a VCO. This type of investment may be accounted for at fair value through profit or loss for the years because such measure proves to be more useful to users of financial statements than the equity method.
Summarized financial informationAs of each year end or upon the existence of evidence of impairment, a determination is made as to whether there is any objective indication of impairment in the value of the investments in associates. If this is the case, the Group calculates the amount of impairment as the difference between the recoverable amount of the associates and other information for associates are includedits carrying value and recognizes the amount adjacent to "Share of profit / (loss) of joint ventures and associates" in Note 9.the statements of income.
Joint arrangements
Joint arrangements are arrangements of which the Group and other party or parties have joint control bound by a contractual arrangement. Under IFRS 11, investments in joint arrangements are classified as either joint operations or joint ventures depending on the contractual rights and obligations each investor has rather than the legal structure of the joint arrangement. A joint venture is a joint arrangement whereby the parties that have joint control of the arrangement have rights to the net assets of the arrangement. A joint operation is a joint arrangement whereby the parties that have joint control of the arrangement have rights to the assets, and obligations for the liabilities, relating to the arrangement.
The Group has assessed the nature of its joint arrangements and determined them to be joint ventures. Cresud Sociedad Anónima, Comercial, Inmobiliaria, Financiera y Agropecuaria Notes to the Consolidated Financial Statements(Continued) (All amounts in millions of Argentine Pesos, except otherwise indicated) 2. Summary of significant accounting policies (Continued) Investments in joint ventures are accounted for under the equity method.
Under the equity method of accounting, interests in joint ventures are initially recognized in the consolidated statementstatements of financial position at cost and adjusted thereafter to recognize the Group’s share of the post-acquisition of profits or losses and movements in other comprehensive income in the income statements and in other comprehensive income respectively.
When the Group’s share of losses in a joint venture equals or exceeds its interests in the joint ventures (which includes any long-term interests that, in substance, form part of the Group’s net investment in the joint ventures), the Group does not recognize further losses, unless it has incurred obligations or made payments on behalf of the joint ventures.
Cresud Sociedad Anónima,
Comercial, Inmobiliaria, Financiera y Agropecuaria
Notes to Consolidated Financial Statements (Continued)
(All amounts in thousands of Argentine Pesos, except shares and per share data and as otherwise indicated)
2. | Summary of significant accounting policies (Continued)
|
The Group determines at each reporting date whether there is any objective evidence that the investment amount in the joint ventures is impaired. If this is the case, the Group calculates the amount of impairment as the difference between the recoverable amount of the joint venture and its carrying value and recognizes the difference to ‘share"Share of profit / (loss) of associatesjoint ventures and joint ventures’associates" in the income statements.statements of income.
Unrealized gains on transactions between the Group and its joint ventures are eliminated to the extent of the Group’s interest in the joint ventures. Unrealized losses are also eliminated unless the transaction provides evidence of an impairment of the asset transferred. Accounting policies of the joint ventures have been changed where necessary to ensure consistency with the policies adopted by the Group.The Group takes into account both quantitative and qualitative aspects in order to determine which non-controlling interests in joint ventures are considered significant In quantitative terms, the investments that individually represent at least 20% of result of joint ventures in the Consolidated Income statements, and at least 20% of the total equity attributable to non-controlling interest in joint ventures at the each year-end are considered significant. Therefore, in qualitative terms, are considered, among other factors, the specific risks to which each company is exposed to, their returns and the importance that each of them has for the Group.
Therefore, in qualitative terms, are considered, among other factors, the specific risks to which each company is exposed to, their returns and the importance that each of them has for the Group.
Summarized financial information and other information for significant joint ventures are included in Note 8.
Operating segments are reported in a manner consistent with the internal reporting provided to the chief operating decision-maker (“CODM”), the Group’s Executive Committee. This CODM, who isCommitter, responsible for allocating resources and assessing performance of the operating segments, has been identified as the Executive Committee of the Group that makes strategic decisions.them. The operating segments are included in Note 6.
Cresud Sociedad Anónima,2.5. Comercial, Inmobiliaria, Financiera y Agropecuaria
Notes to Consolidated Financial Statements (Continued)
(All amounts in thousands of Argentine Pesos, except shares and per share data and as otherwise indicated)Foreign currency translation
(a) 2. | Summary of significant accounting policies (Continued)Functional and presentation currency
|
2.5. | Foreign currency translation |
(a) | Functional and presentation currency |
Items included in the financial statements of each of the Group’s entities are measured using the currency of the primary economic environment in which the entity operates (‘the functional currency’). The consolidated financial statements are presented in Argentine Pesos, which is the Group’s presentation currency.
| Transactions and balances |
Transactions and balances in foreign currency
Foreign currency transactions are translated into the functional currency using the exchange rates prevailing at the dates of the transactions. Foreign exchange gains and losses resulting from the settlement of such transactions and from the translation at year-end exchange rates of monetary assets and liabilities denominated in foreign currencies are recognized in the profit or loss for the year.
Foreign exchange gains and losses are presented in the statements of income statements within finance costs and finance income, as appropriate, unless they are capitalized as explainedcapitalized. Cresud Sociedad Anónima, Comercial, Inmobiliaria, Financiera y Agropecuaria Notes to the Consolidated Financial Statements(Continued) (All amounts in Note 2.22.millions of Argentine Pesos, except otherwise indicated)
2. Summary of significant accounting policies (Continued) The results and financial position of all the group entities (none of which has the currency of a hyperinflationary economy) that have a functional currency different from the presentation currency are translated into the presentation currency as follows:
(i) Assets, liabilities and liabilitiesgoodwill for each statement of financial position presented are translated at the closing rate at the date of that financial position; (ii)Income and expenses for each statement of comprehensive income are translated at average exchange rates (unless this average is not a reasonable approximation of the cumulative effect of the rates prevailing on the transaction dates, in which case income and expenses are translated at the rate on the dates of the transactions); and (iii) All resulting exchange differences are recognized in the statement of comprehensive income.
On the disposal of a foreign operation (that is, a disposal of the Group’s entire interest in a foreign operation, or a disposal involving loss of control over a subsidiary that includes a foreign operation) all of the exchange differences accumulated in equity in respect of that operation attributable to the equity holders of the Company are reclassified to profit or loss.
2.6. F-30Investment properties
Cresud Sociedad Anónima,
Comercial, Inmobiliaria, Financiera y Agropecuaria
Notes to Consolidated Financial Statements (Continued)
(All amounts in thousands of Argentine Pesos, except shares and per share data and as otherwise indicated)
2. | Summary of significant accounting policies (Continued)
|
In the case of a partial disposal that does not result in the Group losing control over a subsidiary that includes a foreign operation, the proportionate share of accumulated exchange differences are re-attributed to non-controlling interests and are not recognized in profit or loss.
Goodwill and fair value adjustments arising on the acquisition of a foreign entity are treated as assets and liabilities of the foreign entity and translated at the closing rate. Exchange differences arising are recognized in other comprehensive income.
2.6. | Investment properties |
Investment properties are those properties owned by the Group that are held either to earn long-term rental income or for capital appreciation, or both, and that is not occupied by the companies in the consolidated Group. Properties owned by the Group occupied by associates or joint ventures are accounted for as investment properties in the Consolidated Financial Statements. Investment property also includes property that is being constructed or developed for future use as investment property. The Group also classifies land whose future use has not been determined yet as investment properties.
Where a property is partially occupied by the Group, with the rest being held for rental income or capital appreciation, the Group accounts for the portions separately. The portion that is occupied by the Group is accounted for as property, plant and equipment under IAS 16 “Property, Plant and Equipment” and the portion that is held for rental income or capital appreciation, or both, is treated as investment properties under IAS 40 “Investment Property”.
The Group’s investment properties primarily comprise the Group’s portfolio of shopping centers and offices, farmland leased out to third parties, certain property under development and undeveloped land.
Investment properties are measured initially at cost. Cost comprises the purchase price and including directly attributable expenditures, such as legal fees, certain direct taxes, letting fees and in the case ofexpenditures. For properties under construction, thedevelopment, capitalization of costs includes not only financial costs.costs, but also all costs directly attributable to works in process, from commencement of construction until it is completed and property is in conditions to start operating.
Direct expenses related to lease contract negotiation (as well as payment to third parties for services rendered and certain specific taxes related to execution of such contracts) are capitalized as part of the book value of the relevant investment properties and amortized over the term of the lease. Cresud Sociedad Anónima, Comercial, Inmobiliaria, Financiera y Agropecuaria
Notes to the Consolidated Financial Statements(Continued) (All amounts in thousandsmillions of Argentine Pesos, except shares and per share data and as otherwise indicated)
2. | Summary of significant accounting policies (Continued)
|
2.
Summary of significant accounting policies (Continued)
For properties under development, capitalization of costs includes not only financial costs. Also includes all costs directly attributable to works in process, from commencement of construction until it is completed and property is in conditions to start operating. Capitalized costs include mainly the part attributable to third-party service costs, as well as the materials necessary for construction. Capitalization of such costs ceases when the property reaches the operating conditions indicated above.
Borrowing costs associated with direct expenditure on properties under development or undergoing major refurbishment are capitalized. The finance cost capitalized is calculated using the Group’s weighted average cost of borrowings after adjusting for borrowings associated with specific developments. Where borrowings are associated with specific developments, the amount capitalized is the gross interest incurred on those borrowings less any investment income arising on their temporary investment. Finance cost is capitalized as from the commencement of the development work until the date of practical completion. The capitalization of finance costs is suspended if there are prolonged periods when development activity is interrupted. Finance cost is also capitalized on the purchase cost of land or property acquired specifically for redevelopment in the short term but only where activities necessary to prepare the asset for redevelopment are in progress.
The Group has adopted the cost model for all of its investment properties. Therefore, at the date of each statement of financial position, investment properties are carried at amortized cost, less impairment losses, if any. Under the cost model, an investment property is impaired if its carrying amount exceeds its recoverable amount. Where individual components of an item of investment property have different useful lives, they are accounted for as separate items, which are depreciated separately. Subsequent costs are included in the asset’s carrying amount or recognized as a separate asset, as appropriate, only when it is probable that future economic benefits associated with the item will flow to the Group and the cost of the item can be measured reliably. These costs may include the cost of improving or replacing parts that are eligible for capitalization when the costs of replacing the parts are incurred. The carrying amount of the replaced part is derecognized. Repairs and maintenance are charged to the income statements during the period in which they are incurred.
If an investment property becomes occupied by the Group, it is reclassified as property, plant and equipment at the commencement of such occupation. An item of property occupied by the Group is reclassified to investment property when its use has changed and occupation by the Group ceases. Where an investment property undergoes a change in use, evidenced by commencement of development with a view to sale, the property is transferred to trading properties.
Transfers in and out of the respective categories as described above do not change the carrying amount of the properties transferred, and they do not change the cost of the properties for measurement or disclosure purposes.
Cresud Sociedad Anónima,
Comercial, Inmobiliaria, Financiera y Agropecuaria
Notes to Consolidated Financial Statements (Continued)
(All amounts in thousands of Argentine Pesos, except shares and per share data and as otherwise indicated)
2. | Summary of significant accounting policies (Continued)
|
Land and property under constructions are not depreciated. Depreciation of the remaining investment properties is calculated, based on a component approach, using the straight-line method over the estimated useful life of each component. The remaining useful life as of June 30, 20152016 is as follows:
| Shopping center portfolio | Between 311 and 2530 years | | Offices and other rental properties portfolio | Between 98 and 29100 years |
AtAs of each period-end, assets are reviewed for any sign ofyear-end an impairment to itstest is performed on the recoverable value and/or residual useful life of the assets. If there arebe any indicators of impairment, the recoverable amount and/or theresidual useful life of the impaired assetsasset(s) is estimated,computed, and then they are adjusted,an impairment adjustment is made, if applicable. The asset’s residual values and useful lives are reviewed, if appropriate, at least at each financial year-end.
An asset’s carrying amount is written down immediately to the asset’sits recoverable amount if its carrying amount is greater than its estimated recoverable amount (See Note 2.10).amount.
Asset transfers, whether assets classified under investments properties are reclassified under other items or vice-versa, may only be carried out where there is a change of use evidenced by: a) commencement of occupation by the owner, where investment property is transferred to property, plant and equipment; b) commencement of development activities for sale purposes, where investment property is transferred to trading properties; c) the end of owner occupation, where it is transferred from property, plant and equipment to investment property; or d) commencement of an operating lease transactions with a third party, where trading properties is transferred to investment property.
The Group may sell its investment property when it considers that such property no longer forms part of the lease business. Investment properties are derecognized when they are disposed of or when they are permanently withdrawn from use and no future economic benefits are expected to arise from their disposals. Gains or losses on disposals or retirements of investment properties are determined by comparing the net disposal proceeds and their carrying amounts at the date of disposal. The gains or losses are recognized in the statements of income statements and disclosed separately under the line item “Gain from disposal of investment property”. Proceeds from the sale of such property are accounted for when the material risks and benefits have been transferred to the purchaser. As for unconditional agreements, proceeds are accounted for generally when title to property passes to the buyer and the buyer intends to make the respective payment therefor. In the case of conditional agreements, the sale is accounted for where such conditions have been met. Where consideration receivable for the sale of the properties is deferred, it is discounted to present value. The difference between the discounted amount and the amount receivable is treated as interest income and recognized over the period using the effective interest method.
Cresud Sociedad Anónima,2.7. Comercial, Inmobiliaria, Financiera y Agropecuaria
Notes to Consolidated Financial Statements (Continued)
(All amounts in thousands of Argentine Pesos, except sharesProperty, plant and per share data and as otherwise indicated)equipment
2. | Summary of significant accounting policies (Continued)
|
2.7. | Property, plant and equipment |
This category primarily comprises land used for agricultural purposes, buildings or portions of a building used for administrative and corporate purposes, machines, computers and other equipment, motor vehicles, furniture, fixtures and fittings and improvements to the Group’s corporate offices.
The Group has also several hotel properties. Based on the respective contractual arrangements with hotel managers and / or given their direct operators nature, the Group considers it retains significant exposure to the variations in the cash flows of the hotel operations, and accordingly, hotels are treated as owner-occupied properties and classified under the line item “Property, plant and equipment”.
Cresud Sociedad Anónima, Comercial, Inmobiliaria, Financiera y Agropecuaria Notes to the Consolidated Financial Statements(Continued) (All amounts in millions of Argentine Pesos, except otherwise indicated) 2. Summary of significant accounting policies (Continued) All property, plant and equipment (“PPE”) are stated at historicalacquisition cost less depreciation and accumulated impairment, if any. HistoricalThe acquisition cost includes expenditure that is directly attributable to the acquisition of the items.
For properties under development, capitalization of costs includes not only financial costs, but also all costs directly attributable to works in process, from commencement of construction until it is completed and property is in conditions to start operating. Capitalized costs include mainly the part attributable to third-party service costs, as well as the materials necessary for construction. Capitalization of such costs ceases when the property reaches the operating conditions indicated above. Borrowing costs incurred for the purpose of acquiring, constructing or producing a qualifying PPE are capitalized as part of its cost. A qualifying PPE is an asset that necessarily takes a substantial period of time to get ready for its intended use. Borrowing costs are capitalized while acquisition, construction or production is actively underway and cease once the asset is substantially complete or suspended if the development of the asset is suspended.
Cresud Sociedad Anónima,
Comercial, Inmobiliaria, Financiera y Agropecuaria
Notes to Consolidated Financial Statements (Continued)
(All amounts in thousands of Argentine Pesos, except shares and per share data and as otherwise indicated)
2. | Summary of significant accounting policies (Continued)
|
Subsequent costs are included in the asset’s carrying amount or recognized as a separate asset, as appropriate, only when it is probable that future economic benefits associated with the item will flow to the Group and the cost of the item can be measured reliably. TheseSuch costs may include the cost of improving or replacingimprovements and replacement of parts that are eligible for capitalization.as they meet the conditions to be capitalized. The carrying amount of those parts that are replaced is derecognized.derecognized Repairs and maintenance expenses are charged toas incurred in the income statements during the period in which they are incurred.statement of income. Depreciation, based on a component approach, is calculated using the straight-line method to allocate the cost over the assets’ estimated useful lives,lives. The remaining useful life as of June 30, 2016 is as follows:
Hotel buildingsBuildings and facilities | Between 14 and 24 years | Other buildings and facilities | Between 155 and 50 years | FurnitureMachinery and fixturesequipment | Between 3 and 1017 years | Machinery and equipmentCommunication networks | Between 3 and 1020 years | VehiclesOthers | 5 years | Others | Between 3 and 25 years |
The assets’ net book amount and useful lives are reviewed, and adjusted if appropriate, at least at each financial year-end.
An asset’s carrying amount is written down immediately to its recoverable amount if its carrying amount is greater than its estimated recoverable amount (See Note 2.10).amount.
Gains from the sale of these assets are recognized when the significant risks and rewards have transferred to the buyer. This will normally take place on unconditional exchange, generally when legal title passes to the buyer and it is probable that the buyer will pay. For conditional exchanges, sales are recognized when these conditions are satisfied.
Gains and losses on disposals are determined by comparing the proceeds, with the carrying amount. Gains and losses from the disposal of farmlands are disclosed within “Gains from disposal of farmlands” in the income statements. All other gains and losses from the disposal of property, plant and equipment items are recognized within “Other operating results, net” in the income statements.statement of comprehensive income.
Cresud Sociedad Anónima, Comercial, Inmobiliaria, Financiera y Agropecuaria Notes to the Consolidated Financial Statements(Continued) (All amounts in millions of Argentine Pesos, except otherwise indicated) 2. Summary of significant accounting policies (Continued) Leases are classified at their inception as either operating or finance leases based on the economic substance of the agreement. Cresud Sociedad Anónima,
Comercial, Inmobiliaria, Financiera y Agropecuaria
Notes to Consolidated Financial Statements (Continued)
(All amounts in thousands of Argentine Pesos, except shares and per share data and as otherwise indicated)
2. | Summary of significant accounting policies (Continued)
|
A Group company is the lessor:
Properties leased out to tenants under operating leases are included in “Investment properties” in the statement of financial position. See Note 2.282.23 for the recognition of rental income (Finance lease – theincome. The Group does not have any assets leased out under finance leases).leases.
A Group company is the lessee:
Operating lease – leases in which substantially all risks and rewards of ownership are retained by another party, the lessor, are classified as operating leases.
The Group has entered into some operating lease agreements, mainly related to farming activities. By virtue of these contracts, the Group leases land open for agricultural exploitation during the harvest year. The lease price is generally set at a fixed amount in dollars or at a certain number of quintals of soybeans (or equivalent measurement unit) during the entire lease term. Lease payments can be made in installments or in advance at the beginning of the lease. The lease costs are recognized in the income statements in relation toaccording the degree of ripenessharvest of the harvest since thecrops The Group considers that this systematic base is more representative of the time pattern of the leases’ benefits.
Additionally, the Group acts as a lessee in other operating leases, mainly related to agricultural business. Payments, including prepayments, made under operating leases (net of any incentives received from the lessor) are charged to the income statement on a straight-line basis over the period of the lease.
Finance lease – leases ofThe Group acquires certain specific assets where the Group has substantially all the risks(especially machinery and rewards of ownership are classified ascomputer equipment) under finance leases. Finance leases are capitalized at the commencement of the lease at the lower of the fair value of the property and the present value of the minimum lease payments. Capitalized lease assets are depreciated over the shorter of the estimated useful life of the assets and the lease term. The finance charges arewill be charged to the statements of income statements over the lease period so as to produce a constant periodic rate of interest on the remaining balance of the liability for each period. TheLiabilities corresponding rental obligations, net ofto finance charges,leases, measured at discounted value, are included in current and non-current borrowings Leases
Operating leases where the Group acts as lessee under finance leasesmainly include machinery and computer equipment.offices. Cresud Sociedad Anónima, Comercial, Inmobiliaria, Financiera y Agropecuaria
Notes to the Consolidated Financial Statements(Continued) (All amounts in thousandsmillions of Argentine Pesos, except shares and per share data and as otherwise indicated)
| Summary of significant accounting policies (Continued)
|
Summary of significant accounting policies (Continued)
Goodwill represents future economic benefits arising from assets that are not capable of being individually identified and separately recognized by the Group on an acquisition. Goodwill is initially measured as the difference between the fair value of the consideration transferred, plus the amount of non-controlling interest in the acquireeacquisition and, in business combinations achieved in stages, the acquisition-date fair value of the previously held equity interest in the acquiree;acquisition; and the net fair value of the identifiable assets and liabilities assumed on the acquisition date.
At acquisition goodwill is allocated to those cash generating units expected to benefit from the acquisition for the purpose of impairment testing (See Note 2.10). Following initial recognition, goodwill is measured at cost less any accumulated impairment losses. Goodwill arising on the acquisition of subsidiaries is included within “Intangible assets” in the statement of financial position.
Goodwill may also arise upon investments in associates and joint ventures, being the surplus of the cost of investment over the Group’s share of the fair value of the net identifiable assets. Such goodwill is recorded within investments in associates or joint ventures and tested for impairment as part of the overall balances.
Goodwill arising on the acquisition of foreign entities is treated as an asset of the foreign entity denominated in the local currency and translated at the closing rate.
Goodwill is not amortized but tested for impairment on an annual basis, or more frequently if there is indicator of impairment.
For the purpose of impairment testing, assets are grouped at the lowest levels for which there are separately identifiable cash flows, known as cash-generating units (“CGU”). In order to determine whether any impairment loss should be recognized, the book value of CGU or CGU groups is compared against its recoverable value. Net book value of CGU and CGU groups include goodwill and assets with limited useful life (such as, investment properties, property, plant and equipment, intangible assets and working capital net).
If the recoverable amount of the CGU is less than the carrying amount of the unit, the impairment loss is allocated first to reduce the carrying amount of any goodwill allocated to the unit and then to the other assets of the unit pro-rata on the basis of the carrying amount of each asset in the unit. Impairment losses recognized for goodwill are recorded in the statement of income as a deduction from operating income and not reversed in a subsequent periods. Recoverable amount of a CGU is the higher of fair value less costs-to-sell and value-in-use. The fair value is the amount at which a cash-generating unit may be sold in a current transaction between unrelated, willing and duly informed parties. Value-in-use is the present value of all estimated future cash flows expected to be derived from CGU or CGU groups. Acquired computer software licenses are capitalized on the basis of the costs incurred to acquire and bring to use the specific software. These costs are amortized over their estimated useful lives of 3 years. Cresud Sociedad Anónima,
Comercial, Inmobiliaria, Financiera y Agropecuaria
Notes to Consolidated Financial Statements (Continued)
(All amounts in thousands of Argentine Pesos, except shares and per share data and as otherwise indicated)
2. | Summary of significant accounting policies (Continued)
|
Costs associated with maintaining computer software programs are recognized as an expense as incurred. Development costs that are directly attributable to the design and testing of identifiable and unique software products controlled by the Group are recognized as intangible assets when the following criteria are met: (i) it is technically feasible to complete the software product so that it will be available for use; (ii) management intends to complete the software product and use or sell it; (iii) there is an ability to use or sell the software product; (iv) it can be demonstrated how the software product will generate probable future economic benefits; (v) adequate technical, financial and other resources to complete the development and to use or sell the software product are available; and (vi) the expenditure attributable to the software product during its development can be reliably measured.
Directly attributable costs that are capitalized as part of the software product include the software development employee costs and an appropriate portion of relevant overheads.
Other development expenditures that do not meet these criteria are recognized as an expense as incurred. Development costs previously recognized as an expense are not recognized as an asset in a subsequent period.
Computer software development costs recognized as assets are amortized over their estimated useful lives, which does not exceed 3 years.
The Group acquired certain rights to develop land and facilities. These rights primarily comprise the right to develop the land and attached buildings and facilities known as Arcos del Gourmet (“Arcos”) and the “Anta Right Agreement”.
The Arcos land and attached facilities is owned by Administration of Railway Infrastructure ("ADIF"), a governmental agency created for the management of certain State´s properties, particularly assets pertaining to the railway system. The Arcos (or "Arches") are the old warehouse and adjacent spaces below the tracks of the San Martin railway lines which were abandoned. The right was acquired as part of the Arcos acquisition and is carried at acquisition cost less accumulated amortization. Amortization is calculated using the straight-line method over the period in which the economic benefits from the use of the asset. The Group must pay ADIF a fee on a monthly basis.
Cresud Sociedad Anónima, Comercial, Inmobiliaria, Financiera y Agropecuaria
Notes to the Consolidated Financial Statements(Continued) (All amounts in thousandsmillions of Argentine Pesos, except shares and per share data and as otherwise indicated)
2. | Summary of significant accounting policies (Continued)
|
2.
Summary of significant accounting policies (Continued)
The Anta Right Agreement comprises
(c) Branding and client relationships This relates to the right to exploit 132,000 hectaresfair value of land for agriculture purposes inbrands and client relationships arising at the Provincetime of Salta, in Northern Argentina, under an agreementthe business combination with the Provincial Government expiring on November 2038 with an option to extend it for an additional 29-year period.
The right was acquired by the Group in December 2005 and is carriedIDBD. They are subsequently valued at acquisition cost, less the accumulated amortization. Amortization is calculated using the straight-line method over 35 years. Under the Anta amortization or impairment. Client relationships have a 12-year useful life, while brands have an indefinite useful life.
(d) Right Agreement, the Group must pay to the Province of Salta a fee equivalent to a 10% of the annual turnover obtained by the development of the premises.receive future units under barter agreements
(d) | Right to receive future units under barter agreements |
The Group also enters into barter transactions where the Group normally exchanges undeveloped parcels of land with third-party developers for future property to be constructed on the bartered land. The Group generally receives monetary assets as part of the transactions and/or a right to receive future units to be constructed by developers. Such rights are initially recognized at cost (which is the fair value of the land assigned) and such rights are not adjusted later, unless there is any sign of impairment.
2.10. | Impairment of assets |
(a) Goodwill
For the purpose of impairment testing, assets are grouped at the lowest levels for which there are separately identifiable cash flows, known as cash-generating units (“CGU”). In order to determine whether any impairment loss should be recognized, the carrying amount of the CGU or groups of CGUs is compared to their recoverable amount. Net book value of CGU and group of CGUs include goodwill and assets with limited useful life, including investment properties, property, plant and equipment, intangible assets and working capital net.
If the recoverable amount of the CGU is less than the carrying amount of the unit, the impairment loss is allocated first to reduce the carrying amount of any goodwill allocated to the unit and then to the other assets of the unit pro rata on the basis of the carrying amount of each asset in the unit. Impairment losses recognized for goodwill are recorded in the income statement as a deduction from operating income and not reversed in a subsequent period.
The recoverable amount of a CGU is the higher of its fair value less costs-to-sell and its value-in-use. Fair value less costs to sell is the best estimate of the amount obtainable from the sale of a CGU in an arm’s length transaction between knowledgeable, willing parties less the costs of disposal. Value in use is the present value of the future cash flows expected to be derived from the CGUs or groups of CGUs.
Cresud Sociedad Anónima,
Comercial, Inmobiliaria, Financiera y Agropecuaria
Notes to Consolidated Financial Statements (Continued)
(All amounts in thousands of Argentine Pesos, except shares and per share data and as otherwise indicated)
2. | Summary of significant accounting policies (Continued)
|
(b) Property, plant and equipment, investment property and finite-life intangible assets
At the date of each statementstatements of financial position, the Group reviews the carrying amounts of its property, plant and equipment, investment property and finite-life intangible assets to determine whether there is any indicator that those assets have suffered an impairment loss. If any such indicator exists, the recoverable amount of the asset is estimated in order to determine the extent, if any, of the impairment loss. Where the asset does not generate cash flows that are independent from other assets, the Group estimates the recoverable amount of the CGU to which the asset belongs.
If the recoverable amount of an asset or CGU is estimated to be less than its carrying amount, the carrying amount of the asset or CGU is reduced to its recoverable amount. An impairment loss is recognized immediately in the income statements.Assets or CGU that have suffered an impairment loss are revised as of each balance sheet date to assess a potential reversal of such impairment. The impairment loss recognized in prior fiscal years may only be reversed if there has been a change in the estimates used to assess the recoverable value of assets or the CGU since the recognition of the impairment loss.
Where an impairment loss subsequently reverses the carrying amount of the asset or CGU is increased to the revised estimate of its recoverable amount, not to exceed the carrying amount that would have been determined had no impairment loss been recognized for the asset or CGU in prior years. A reversal of an impairment loss is recognized immediately in the income statements.
Trading properties comprises those properties either intended for sale in the process of construction for sale. Trading properties are carried at the lower of cost and net realizable value. Where there is a change in use of investment properties evidenced by the commencement of development with a view to sale, the properties are reclassified as trading properties at their cost, which is the carrying value at the date of change in use. They are subsequently carried at the lower of cost and net realizable value.
Cost comprises all costs of purchase, costs of conversion and other costs incurred in bringing the trading properties to their present location and condition. Cresud Sociedad Anónima,2.11. Comercial, Inmobiliaria, Financiera y Agropecuaria
Notes to Consolidated Financial Statements (Continued)
(All amounts in thousands of Argentine Pesos, except shares and per share data and as otherwise indicated)Inventories
2. | Summary of significant accounting policies (Continued)
|
For properties under development, capitalization of costs includes not only financial costs, but also all costs directly attributable to works in process, from commencement of construction until it is completed and property is in conditions to start operating. Capitalized costs include mainly the part attributable to third-party service costs, as well as the materials necessary for construction. Capitalization of such costs ceases when the property reaches the operating conditions indicated above.
Borrowing costs incurred for the purpose of acquiring, constructing or producing a qualifying trading properties are capitalized as part of its cost. A qualifying trading property is an asset that necessarily takes a substantial period of time to get ready for its intended use. Borrowing costs are capitalized while acquisition, construction or production is actively underway and cease once the asset is substantially complete or suspended if the development of the asset is suspended.
Net realizable value is the estimated selling price in the ordinary course of business less costs to complete redevelopment and selling expenses. If the net realizable value is lower than the carrying amount, a write down is recognized for the amount by which the carrying amount exceeds its net realizable value. Write-downs are reversed when circumstances that caused the write-down cease to exist, or when net realizable value increases.
Inventories include assets held for sale in the ordinary course of the Group’s business activities, assets in production or construction process for sale purposes, and materials, supplies or other assets held for consumption in the process of producing sales and/or services. Inventories primarily comprise harvested agricultural produce and consumable supplies, inventories from hotel properties, and other supplies and materials required to offer different services.
Consumable suppliesSupplies used in the Group's farming activities comprise fertilizers, agrochemicals, vaccines, seeds, feed for livestock and other items used in the Group’s farming activities.items. Harvested agricultural produce comprise harvested crops, and raw meat.
Cresud Sociedad Anónima, Comercial, Inmobiliaria, Financiera y Agropecuaria
Notes to the Consolidated Financial Statements(Continued) (All amounts in thousandsmillions of Argentine Pesos, except shares and per share data and as otherwise indicated)
2. | Summary of significant accounting policies (Continued)
|
2.
Summary of significant accounting policies (Continued)
For the Group’s operations in Argentina and Brazil, harvested crops are perpetually measured at net realizable value until the point of sale because there is an active market in the produce, there is a negligible risk that the produce will not be sold and there is a well-established practice in the industry carrying the inventories at net realizable value. Changes in net realizable value are recognized in the income statements in the periodyear in which they arise under the line item “Changes in net realizable value of agricultural produce after harvest”.
On the other hand, harvested crops for the Group’s operations in BoliviaInventories are measured at the lower of cost or net realizable value.
Net realizable value because there is no an active marketthe estimated selling price in that country. Costthe ordinary course of business less selling expenses. It is determined usingon an ongoing basis, taking into account the weighted average cost method.product type and aging, based on the accumulated prior experience with the useful life of the product. The Group periodically reviews the inventory and its aging and books an allowance for impairment, as necessary.
Consumable supplies and inventories from hotel operations and the rest of materials and assets classified in this category are measured at the lower of cost or net realizable value. The cost of consumable supplies, materials and hotel inventoriesother assets is determined using the weighted average cost method, whereasthe cost of inventories of mobile phones, related accessories and spare parts is priced under the moving average method, and the cost of the hotelremaining inventories is determined usingpriced under the first-in-firstfirst in, first out (FIFO) method.
Cost comprises all costs of purchase, costs of conversion and other costs incurred in bringing the inventories to their present location and condition. Inventories are recorded at the cash cost and the difference between that and the actual amount paid is treated as finance cost.
2.13. | Biological assets and agriculture produce at the point of harvest |
2.12.
Biological assets and agriculture produce at the point of harvest
Biological assets comprise unharvested crops (mainly corn, wheat, soybeans and sunflower), sugarcane, livestock (breeding and dairy cattle and cattle held for sale or meat production) and other less significant biological assets such as sheep and tree plantations.
The Group distinguishes between consumable and bearer biological assets. Consumable biological assets are those assets that may be harvested as agricultural produce or sold as biological assets, for example livestock intended for the production of meat and/or livestock held for sale. Bearer biological assets are those assets capable of producing more than one harvest, for example sugarcane, dairy cattle and breeding cattle. Consumable biological assets are generally classified as current while bearer biological assets are generally classified as non-current. Cresud Sociedad Anónima,
Comercial, Inmobiliaria, Financiera y Agropecuaria
Notes to Consolidated Financial Statements (Continued)
(All amounts in thousands of Argentine Pesos, except shares and per share data and as otherwise indicated)
2. | Summary of significant accounting policies (Continued)
|
Expenses relating to the agricultural activity include items as planting, harvesting, irrigation, agrochemicals, fertilizers, veterinary services and others. The Group elected to expense all such costs when incurred and includes them as “Cost of agriculture production” within Costs in the income statements (See Note 32)30). Therefore, “Cost of agriculture production” represents the costs expensed whilst the biological assets are growing. Cresud Sociedad Anónima, Comercial, Inmobiliaria, Financiera y Agropecuaria Notes to the Consolidated Financial Statements(Continued) (All amounts in millions of Argentine Pesos, except otherwise indicated) 2. Summary of significant accounting policies (Continued) The line item “Cost of sales of biological assets and agricultural produce” within “Costs” in the income statements represents the recognition as an expense of agricultural produce held in inventory, valued at either cost or net realizable value, as applicable (See Note 2.12)2.11), or biological assets valued at fair value less costs to sell.
The fair value of a biological asset in its present location and condition is determined based on either the present value of expected net cash flows from the biological asset discounted at a current market-determined pre-tax rate or the current quoted market price in the most relevant market.
Biological assets are measured at fair value less costs to sell on initial recognition and at each statement of financial position date, except where fair value cannot be reliably measured. Cost approximates fair value when little or no biological transformation has taken place since the costs were originally incurred or the impact of biological transformation on price is not expected to be material. Costs to sell include all incremental costs directly attributable to the sale of the biological assets, excluding finance costs and income taxes.
In determining the fair value of a biological asset based on the expected net discounted cash flows, the following factors have been taken into account:
(i) | The productive life of the asset; |
(ii) | The period over which the asset will mature; |
(iii) | The expected future sales price; |
(iv) | The cost expected to arise throughout the life of the asset; and |
(v) | A pre-tax nominal discount rate. |
Expected future sale prices for all biological assets are determined by reference to observable data in the relevant market. Costs expected to arise throughout the life of the biological assets are estimated based on historical and statistical data.
Cresud Sociedad Anónima,
Comercial, Inmobiliaria, Financiera y Agropecuaria
Notes to Consolidated Financial Statements (Continued)
(All amounts in thousands of Argentine Pesos, except shares and per share data and as otherwise indicated)
| 2. | Summary of significant accounting policies (Continued)
|
The gain or loss arising from initial recognition of aa) agricultural produce and b) biological assetassets at fair value less costs to sell and from a change in fair value less costs to sell of a biological asset is recognized in profit or loss in the period in which they are incurred within the line item “Initial recognition and changes in fair value of biological assets and agricultural produce at the point of harvest”.
Agricultural produce harvested from the Group’s biological assets is initially measured at its fair value less costs to sell at the point of harvest. The fair value of agricultural produce is determined based on market price in the most relevant markets of each product. The gain or loss arising from initial recognition of agricultural produce as a result of harvesting is also recognized in profit or loss in the period in which it arises in the line item “Initial recognition and changes in fair value of biological assets and agricultural produce at the point of harvest”. Harvested produce is transferred to inventory at their fair value less costs to sell at the point of harvest. See Note 2.12 for measurement of inventories.2.13.
Financial instruments
2.14. | Financial instruments |
The Group has adopted IFRS 9 in advance as well as the related consequential amendments to other IFRSs, because this new accounting policy provides reliable and more relevant information for users to assess the amounts, timing and uncertainty of future cash flows.
Accordingly, the Group classifies its financial assets in the following categories: those to be measured subsequently at fair value, and those to be measured at amortized cost. This classification depends on whether the financial asset is a debt or an equity investment.
Debt investments
(i) Financial assets at amortized cost
A debt investment is classified as “amortized cost” only if both of the following criteria are met: (i) the objective of the Group’s business model is to hold the asset to collect the contractual cash flows; and (ii) the contractual terms give rise on specified dates to cash flows that are solely payments of principal and interest on the principal outstanding. The nature of any derivatives embedded in the debt investment are considered in determining whether the cash flows of the investment are solely payment of principal and interest on the principal outstanding and are not accounted for separately. Cresud Sociedad Anónima,
Comercial, Inmobiliaria, Financiera y Agropecuaria
Notes to Consolidated Financial Statements (Continued)
(All amounts in thousands of Argentine Pesos, except shares and per share data and as otherwise indicated)
2. | Summary of significant accounting policies (Continued)
|
As of the end of the current financial statements, the Group’s financial assets at amortized cost comprise certain items of cash and cash equivalents, trade and other receivables and investment in financial assets.
(ii) Financial assets at fair value through profit or loss
If either of the two criteria abovementioned in the previous paragraph is not met, the debt instrument is classified as “fair value through profit or loss”. The Group has not designated any debt investment as measured at fair value through profit or loss to eliminate or significantly reduce an accounting mismatch.
Changes in fair values and gains from disposal of financial assets at fair value through profit or loss (except for derivative financial instruments mentioned in Note 2.15) are recorded within “Financial results, net” in the income statements.statements of income. Cresud Sociedad Anónima, Comercial, Inmobiliaria, Financiera y Agropecuaria Notes to the Consolidated Financial Statements(Continued) (All amounts in millions of the endArgentine Pesos, except otherwise indicated) 2. Summary of the current financial statements, the Group’s financial assets at fair value through profit or loss comprise derivative financial instruments, mutual funds, mortgage bonds, government bonds and preferred shares, among others.significant accounting policies (Continued)
Equity investments
All equity investments, which are not subsidiaries, associate companies and joint venture of the Group, are measured at fair value. Equity investments that are held for trading are measured at fair value through profit or loss. For all other equity investments, the Group can make an irrevocable election at initial recognition to recognize changes in fair value through other comprehensive income rather than profit or loss.
The Group decided to recognize changes in the fair value of equity investments through profit or loss.
Changes in fair values and gains or losses from disposal of equity investments at fair value through profit or loss and dividends income are recorded within “Financial results, net” in the income statements.
(b) | Recognition and measurement |
Regular purchases and sales of financial assets are recognized on the date on which the Group commits to purchase or sell the asset. Financial assets are derecognized when the rights to receive cash flows from the investments have expired or have been transferred and the Group has transferred substantially all risks and rewards of ownership.
Cresud Sociedad Anónima,
Comercial, Inmobiliaria, Financiera y Agropecuaria
Notes to Consolidated Financial Statements (Continued)
(All amounts in thousands of Argentine Pesos, except shares and per share data and as otherwise indicated)
2. | Summary of significant accounting policies (Continued)
|
At initial recognition, the Group measures a financial asset at its fair value plus, in the case of a financial asset not at fair value through profit or loss, transaction costs that are directly attributable to the acquisition of the financial asset. Transaction costs of financial assets carried at fair value though profit or losses are expensed in the income statements.statements of income.
In general, the Group uses the transaction price method to determine fair value of a financial instrument upon initial recognition. In the other cases, the Group merely records a gain or a loss upon initial recognition only if the fair value of the instrument is supported by other comparable and observable current market transactions in the same instrument or from other available observable market data. Any gain or loss not recognized upon initial recognition of a financial asset are recognized later, only to the extent that there are changes in the factors (including time) that market participants would consider at the time of agreeing upon a price.
A gain or loss on a debt investment that is subsequently measured at amortized cost and is not part of a hedging relationship is recognized in profit or loss when the financial asset is derecognized or impaired and through the amortization process using the effective interest rate method.
All equity investments, which are not subsidiaries, associate companies and joint venture of the Group, are measured at fair value.
The Group is required to reclassify all affected debt investments when and only when its business model for managing those assets changes.
(c) | Impairment of financial assets |
The Group assesses at the end of each reporting period whether there is objective evidence that a financial asset or group of financial assets measured at amortized cost is impaired. A financial asset or a group of financial assets is impaired and impairment losses are incurred only if there is objective evidence of impairment as a result of one or more events that occurred after the initial recognition of the asset and that impairment can be reliably estimated.
Evidence of impairment may include indicators that the debtors or a group of debtors is experiencing significant financial difficulty, default or delinquency in interest or principal payments, the probability that they will enter bankruptcy or other financial reorganization, and where observable data indicate that there is a measurable decrease in the estimated future cash flows.
Cresud Sociedad Anónima,
Comercial, Inmobiliaria, Financiera y Agropecuaria
Notes to Consolidated Financial Statements (Continued)
(All amounts in thousands of Argentine Pesos, except shares and per share data and as otherwise indicated)
2. | Summary of significant accounting policies (Continued)
|
The amount of the loss is measured as the difference between the asset’s carrying amount and the present value of estimated future cash flows (excluding future credit losses that have not been incurred) discounted at the financial asset’s original effective interest rate. The carrying amount of the asset is reduced and the amount of the loss is recognized in the income statements. As a practical expedient, the Group may measure impairment on the basis of an instrument’s fair value using an observable market price. If, in a subsequent period, the amount of the impairment loss decreases and the decrease can be related objectively to an event occurring after the impairment was recognized, the reversal of the previously recognized impairment loss is recognized in the consolidated income statements.
(d) | Offsetting financial instruments |
Financial assets and liabilities are offset when there is a legally enforceable right to offset the recognized amounts and there is an intention to settle on a net basis, or realize the asset and settle the liability simultaneously.
2.15. | Derivative financial instruments and hedging activities |
Cresud Sociedad Anónima, Comercial, Inmobiliaria, Financiera y Agropecuaria Notes to the Consolidated Financial Statements(Continued) (All amounts in millions of Argentine Pesos, except otherwise indicated) 2. Summary of significant accounting policies (Continued) 2.14. Derivative financial instruments and hedging activities and options Derivative financial instruments are initially recognized at fair value on the date a derivative contract is entered into and are subsequently re-measured at their fair value. The method of recognizing the resulting gain or loss depends on whether the derivative is designated as a hedging instrument, and if so, the nature of the item being hedged.
The Group manages exposures to various risks using hedging instruments that provide the appropriate economic outcome. The Group does not use derivative financial instruments for speculative purposes. To date, the Group has used future contracts, commodities put and call options, foreign exchange contracts and interest rate swaps as deemed appropriate.
The Group’s policy is to apply hedge accounting to hedging relationships where it is both permissible under IFRS 9, practical to do so and its application reduces volatility, but transactions that may be effective hedges in economic terms may not always qualify for hedge accounting under IFRS 9. To date the Group has not applied hedge accounting to any of its derivative financial instruments. Trading derivatives are classified as a current asset or liability on the statement of financial position. Gains and losses on derivatives are classified according to their nature. Gains and losses on commodity derivatives are classified within the line item “Other operating income, net”. Gain and losses on all other derivatives are classified in the income statements where the results of the items covered are recognized. Cresud Sociedad Anónima,
Comercial, Inmobiliaria, Financiera y Agropecuaria
Notes to Consolidated Financial Statements (Continued)
(All amounts in thousands of Argentine Pesos, except shares and per share data and as otherwise indicated)
2. | Summary of significant accounting policies (Continued)
|
The fair values of financial instruments that are traded in active markets are computed by reference to market prices. The fair value of financial instruments that are not traded in an active market is determined by using valuation techniques. The Group uses its judgment to select a variety of methods and make assumptions that are mainly based on market conditions existing at the end as each reporting period.
2.16. | Groups of assets and liabilities available for sale |
The stock purchase options involving shares of subsidiaries agreed at a fixed price are accounted for under shareholders’ equity.
2.15. Groups of assets and liabilities held for sale Groups of assets and liabilities are classified as availableheld for sale when the Group is expected to recover their value by means of a sale transaction (rather than through use) and where such sale is highly probable. Groups of assets and liabilities availableheld for sale are valued at the lower of their net book value and fair value less selling costs.
2.16.
Trade and other receivables
This item is comprised by: (i) cash in guarantee directly associated with the sale of the office building for rental located at Madison Ave. 183, New York, U.S. (Note 44) and sale of farmlands, (ii) deposits in investment mutual funds held as guarantee of certain short and long term loans, obtained for financing harvest expenses, development of lands and acquisitions of farmlands. According to the IFRS 9, these escrow accounts are to be accounted for as financial assets, and are initially recognized at fair value and then, at amortized cost.
Trade receivables are recognized initially at fair value and subsequently measured at amortized cost using the effective interest method.
An impairment provision of doubtful accounts is established when there is objective evidence that the Group will not be able to collect all amounts due according to the original terms of the receivables. Significant financial difficulties of the debtor, probability that the debtor will enter bankruptcy or financial reorganization, and default or delinquency in payments are considered indicators that the trade receivable is impaired.
In the case of larger homogeneous receivables, the impairment provision is calculated on an individual basis. When individually assessed, the Group records a provision for impairment which amounts to the difference between the value of the discounted expected future cash flows of the receivable and its carrying amount, taking into account the existing collateral, if any. This provision takes into consideration the financial situation of the debtor, the resources, payment record and, if applicable, the realizable value of any collateral.
Cresud Sociedad Anónima, Comercial, Inmobiliaria, Financiera y Agropecuaria
Notes to the Consolidated Financial Statements(Continued) (All amounts in thousandsmillions of Argentine Pesos, except shares and per share data and as otherwise indicated)
2. 2. Summary of significant accounting policies(Continued)
An allowance for bad debts is recorded where there is objective evidence that the Group may not be able to collect all receivables within their original payment term. Indicators of bad debts include significant financial distress of the debtor, the debtor potentially filing a petition for reorganization or bankruptcy, or any event of default or past due account. In the case of larger non-homogeneous receivables, the impairment provision is calculated on an individual basis. The Group collectively evaluates for impairment smaller-balance homogeneous receivables whichfor impairment. For that purpose they are grouped on the basis of similar risk characteristics taking intoand account asset type, collateral type, past-due status and other relevant factors. The Group applies allowance factors which in the judgment of management represent the expected losses over the life of the receivables. In determining those factors, the Group considers the following: (i) delinquencies, (ii) loss history and the general behavior of clients, (iii) trends in volume and terms of receivables, (iv) the experience and depth of the debtors’ management, (v) national and local economic trends, (vi) concentrations of credit by individual credit size and by class of receivable, and (vii) the effect of external factors.are taken into account.
The amount of the provision is the difference between the asset’s carrying amount and the present value of estimated future cash flows, discounted at the original effective interest rate. The carrying amount of the asset is reduced through the use of an allowancea provision account, and the amount of the loss is recognized in the statements of income statements within “Selling expenses”. Subsequent recoveries of amounts previously written off are credited against “Selling expenses” in the income statements.statements of income.
2.17. Trade and other payables Trade payables are initially recognized at fair value and subsequently measured at amortized cost using the effective interest method.
The Group generally obtains deposits from tenants as a guarantee for returning the property at the end of the lease term in a specified good condition or for the lease payments for the leases period (which is generally 3 years). The deposits generally amount to one month of lease rentals. In accordance with IFRS 9, such deposits are treated as both a financial assets and a financial liability, and they are initially recognized at fair value. The difference between fair value and cash received is considered to be part of the minimum lease payments received for the operating lease (refer to Note 2.28 for the recognition of rental income). The deposits are subsequently measured at amortized cost.
Borrowings are recognized initially at fair value, net of costs incurred in the transaction. Borrowings are subsequently stated at amortized cost. Any difference between the proceeds (net of transaction costs) and the redemption value is recognized as finance cost over the period of the borrowings using the effective interest method. Cresud Sociedad Anónima,2.19. Comercial, Inmobiliaria, Financiera y Agropecuaria
Notes to Consolidated Financial Statements (Continued)
(All amounts in thousands of Argentine Pesos, except shares and per share data and as otherwise indicated)Provisions
2. | Summary of significant accounting policies (Continued)
|
General and specific borrowing costs directly attributable to the acquisition, construction or production of qualifying assets, which are assets that necessarily take a substantial period of time to get ready for their intended use or sale, are added to the cost of those assets, until the assets are substantially ready for their intended use or sale.
Investment income earned on the temporary investment of specific borrowings is deducted from the borrowing costs eligible for capitalization. All other borrowing costs are recognized in profit or loss in the period in which they are incurred.
In accordance with what we mentioned above, the Group capitalizes borrowing costs on qualifying investment properties, property, plant and equipment and trading properties.
Provisions are recognized when (i) the Group has a present legal or constructive obligation as a result of past events; (ii) it is probable that an outflow of resources will be required to settle the obligation; and (iii) a reliable estimate of the amount of the obligation can be made. Provisions are not recognized for future operating losses.
Cresud Sociedad Anónima, Comercial, Inmobiliaria, Financiera y Agropecuaria Notes to the Consolidated Financial Statements(Continued) (All amounts in millions of Argentine Pesos, except otherwise indicated) 2. Summary of significant accounting policies (Continued) The Group bases its accruals on up-to-date developments, estimates of the outcomes of the matters and legal counsel experience in contesting, litigating and settling matters. As the scope of the liabilities becomes better defined or more information is available, the Group may be required to change its estimates of future costs, which could have a material effect on its results of operations and financial condition or liquidity.
Provisions are measured at the present value of the expenditures expected to be required to settle the obligation using a pre-tax rate that reflects current market assessments of the time value of money and the risks specific to the obligation. The increase in the provision due to passage of time is recognized as finance cost. A provision for warranties is recognized when the underlying products or services are sold. The provision is based on historic data of the warranties granted and all potential results are weighted against associated probabilities. F-50
(b) Onerous contractsA provision for onerous contracts is recognized when the expected benefits are lower than the costs of complying with contract obligations. The provision is measured at the present value of the lower of expected cost of terminating the contract and the net expected cost of continuing the contract. Before recognizing a provision, the Group recognizes the impairment of the assets related to the mentioned contract. Cresud Sociedad Anónima,2.20. Comercial, Inmobiliaria, Financiera y Agropecuaria
Notes to Consolidated Financial Statements (Continued)
(All amounts in thousands of Argentine Pesos, except shares and per share data and as otherwise indicated)Employee benefits
(a) 2. | Summary of significant accounting policies (Continued)Defined contribution plans
|
The Group operates a defined contribution plan. A defined contribution plan is a pension plan under which the Group pays fixed contributions into a separate entity. The Group has no legal or constructive obligations to pay further contributions if the fund does not hold sufficient assets to pay all employees the benefits relating to employee service in the current and prior periods. The contributions are recognized as employee benefit expenses in the statements of income statementsin the fiscal year when they are incurred.
Cresud Sociedad Anónima, Comercial, Inmobiliaria, Financiera y Agropecuaria Notes to the Consolidated Financial Statements(Continued) (All amounts in millions of Argentine Pesos, except otherwise indicated) 2. Summary of significant accounting policies (Continued) Termination benefits are payable when employment is terminated by the Group before the normal retirement date, or whenever an employee accepts voluntary redundancy in exchange for these benefits. The Group recognizes termination benefits when it is demonstrably committed to either terminating the employment of current employees according to a detailed formal plan without possibility of withdrawal; or providing termination benefits as a result of an offer made to encourage voluntary redundancy.
Bonus plans
The Group recognizes a liability and an expense for bonuses based on a formula that takes into consideration the profit attributable to the Company’s shareholders after certain adjustments. The Group recognizes a provision where it is contractually obliged or where there is a past practice that has created a constructive obligation.
2.25. | Share-based payments |
The Group operates
Group’s net obligation concerning defined benefit plans is calculated on an equity incentiveindividual basis for each plan, under which certain selectedestimating the future benefits employees directors and top management of the Company, IRSA and IRSA CP have a right to receive shares of their respective employer companies, although they must remain with the employer entity for a certain period of time.
The Group’s subsidiary undertaking, Brasilagro, also operates a stock option plan, under which Brasilagro receives services from certain directors and top management. Additionally, Brasilagro issued warrants as consideration for the services received from its founding shareholders. On the other hand, the Group’s subsidiary Jaborandí S.A. issued warrantsgained in exchange for their services received fromin the current and prior years. The benefit is disclosed at its shareholders.present value, net of the fair value of the plan assets. Calculations are made on an annual basis by a qualified actuary.
(e) Other long-term employee benefits The net obligation of IDBD and its subsidiaries concerning employee long-term benefits, other than retirement plans, is the amount of the future benefits employees have gained in exchange for their services in the current and prior periods. These benefits are discounted at their present values. Cresud Sociedad Anónima,(f) Comercial, Inmobiliaria, Financiera y Agropecuaria
Notes to Consolidated Financial Statements (Continued)
(All amounts in thousands of Argentine Pesos, except shares and per share data and as otherwise indicated)Share-based compensation plan
2. | Summary of significant accounting policies (Continued)
|
The fair value of the equity settled awards is measured at the date of grant. ManagementThe Group measures the fair value using the valuation technique that it considers to be the most appropriate to value each class of award. Methods used may include Black-Scholes calculations or other models as appropriate. The valuations take into account factors such as non-transferability, exercise restrictions and behavioral considerations.
The fair value of the equity settled awards is recognized as an expense in the income statements over the vesting period on a straight-line basis, taking into consideration the best estimation of the awards that will eventually vest. Such estimate shall be revised provided subsequent information available indicates that the number of equity instruments expected to vest differs from original estimates.
If an equity instrument is cancelled duringCresud Sociedad Anónima, Comercial, Inmobiliaria, Financiera y Agropecuaria Notes to the vesting period, it is accounted for as an accelerationConsolidated Financial Statements(Continued) (All amounts in millions of vesting,Argentine Pesos, except otherwise indicated) 2. Summary of significant accounting policies (Continued) 2.21. Income tax, deferred income tax and the amount that otherwise could have been recognized for services received over the remaining of vesting period is recognized immediately in theminimum presumed income statements. Any payment made by a counterparty due to cancellation of share-based payment shall be accounted for as a repurchase of equity instruments (that is, it is deducted from shareholders’ equity) unless the payment exceeds the fair value of the repurchased equity instruments measure at the repurchase date. The excess, if any, is recognized as an expense.tax
2.26. | Current and deferred income tax |
The Group’s tax expense for the year comprises the charge for tax currently payable and deferred income. Tax is recognized in the statements of income, statements, except to the extent that it relates to items recognized in other comprehensive income or directly in equity, in which case, the tax is also recognized in other comprehensive income or directly in equity, respectively.
The current income tax charge is calculated on the basis of the tax laws enacted or substantively enacted at the date of the statementstatements of financial position in the countries where the Company and its subsidiaries operate and generate taxable income. ManagementThe Group periodically evaluates positions taken in tax returns with respect to situations in which applicable tax regulation is subject to interpretation. It establishes provisions where appropriate on the basis of amounts expected to be paid to the tax authorities. Cresud Sociedad Anónima,
Comercial, Inmobiliaria, Financiera y Agropecuaria
Notes to Consolidated Financial Statements (Continued)
(All amounts in thousands of Argentine Pesos, except shares and per share data and as otherwise indicated)
2. | Summary of significant accounting policies (Continued)
|
Deferred income tax is recognized, using the liability method, on temporary differences arising between the tax bases of assets and liabilities and their carrying amounts. However, deferred tax liabilities are not recognized if they arise from the initial recognition of goodwill; deferred income tax is not accounted for if it arises from initial recognition of an asset or liability in a transaction other than a business combination that at the time of the transaction affects neither accounting nor taxable profit or loss. Deferred income tax is determined using tax rates (and laws) that have been enacted or substantively enacted by the closing date of the consolidated financial statements and are expected to apply when the related deferred income tax asset is realized or the deferred income tax liability is settled.
Deferred income tax assets are recognized only to the extent that it is probable that future taxable profit will be available against which the temporary differences can be utilized.
Deferred income tax is provided on temporary differences arising on investments in subsidiaries, associatesjoint ventures and joint ventures,associates, except when opportunity of the reversal of the temporary difference is controlled by the Group and it is probable that the temporary difference will not reverse in the foreseeable future.
Deferred income tax assets and liabilities are offset when there is a legally enforceable right to offset current tax assets against current tax liabilities and when the deferred income taxes assets and liabilities relate to income taxes levied by the same taxation authority on either the same taxable entity or different taxable entities where there is an intention to settle the balances on a net basis.
The Group is able to control the timing of dividends from its subsidiaries and hence does not expect taxable profit. Hence deferred tax is recognized in respect of the retained earnings of overseas subsidiaries only if at the closing date of the Consolidated Statement of Financial Position, dividends have been accrued as receivable or a binding agreement to distribute past earnings in future has been entered into by the subsidiary. Cresud Sociedad Anónima, Comercial, Inmobiliaria, Financiera y Agropecuaria Notes to the Consolidated Financial Statements(Continued) (All amounts in millions of Argentine Pesos, except otherwise indicated) 2. Summary of significant accounting policies (Continued) Entities in Argentina are subject to the Minimum Presumed Income Tax (“MPIT”). Pursuant to this tax regime, an entity is required to pay the greater of the income tax or the MPIT. The MPIT provision is calculated on an individual entity basis at the statutory asset tax rate of 1% and is based upon the taxable assets of each company as of the end of the year, as defined by Argentine law. Any excess of the MPIT over the income tax may be carried forward and recognized as a tax credit against future income taxes payable over a 10-year period. When the Group assesses that it is probable that it will use the MPIT payment against future taxable income tax charges within the Groupapplicable 10-year period recognizes the MPIT as a current or non-current receivable, as applicable, within “Trade and other receivables” in the Consolidated StatementStatements of Financial Position. 2.22. Cash and cash equivalents Cresud Sociedad Anónima,
Comercial, Inmobiliaria, Financiera y Agropecuaria
Notes to Consolidated Financial Statements (Continued)
(All amounts in thousands of Argentine Pesos, except shares and per share data and as otherwise indicated)
2. | Summary of significant accounting policies (Continued)
|
2.27. | Cash and cash equivalents |
In the consolidated statement of cash flows, cash and cash equivalents includes cash in hand, deposits held at call with banks, and other short-term highly liquid investments with original maturities of three months or less. DoBank overdrafts are not include bank overdrafts.included.
2.28. | Revenue recognition |
The Group is engaged in diverse operations primarily including agricultural and agro-industrial activities; investment and development properties and hotel operations. Revenue
Group's revenue is measured at the fair value of the consideration received or receivable.
Revenue derived from the sale of goods is recognized when: (a) material risks and benefits derived from title to property have been transferred; (b) the company does not retain any management function on the assets sold nor does it have any control whatsoever on such assets; (c) the amount of revenues and costs associated to the transaction may be measured on a reliable basis; and (d) the company is expected to accrue the economic benefits associated to the transaction.
Revenue derived from the provision of services is recognized when (a) the amount of revenue and costs associated to the services may be measured on a reliable basis; (b) the company is expected to accrue the economic benefits associated to the transaction, and (c) the level of completion of services may be measured on a reliable basis.
Agricultural and agricultural-related activities of the Group:
Revenue from Group’s agricultural activities comes primarily from sales of agricultural produce and biological assets, from provision of services related to the activity and from leases from farmlands.
Cresud Sociedad Anónima, Comercial, Inmobiliaria, Financiera y Agropecuaria Notes to the Consolidated Financial Statements(Continued) (All amounts in millions of Argentine Pesos, except otherwise indicated) 2. Summary of significant accounting policies (Continued) The Group recognizes revenue on product sales when the agricultural produce or biological assets are delivered and the customers take ownership and assume risk of loss, which is when the products are received by the customer at its or a designated location or collected directly by the customer from the cultivation bases, collection of the relevant receivable is probable and the selling price is fixed or determinable. Net sales of products represent the invoiced value of goods, net of trade discounts and allowances, if any. The Group also provides agricultural-related (including but not limited to watering and feedlot services) and brokerage services to third parties. Revenue from services is recognized as services are rendered. Cresud Sociedad Anónima,
Comercial, Inmobiliaria, Financiera y Agropecuaria
Notes to Consolidated Financial Statements (Continued)
(All amounts in thousands of Argentine Pesos, except shares and per share data and as otherwise indicated)
2. | Summary of significant accounting policies (Continued)
|
The Group also leases land to third parties under operating lease agreements. Lease income is recognized on a straight-line basis over the period of the lease.
Investment property activities:
·● Rental and services - Shopping centers portfolio
Revenues derived from business activities developed in the Group’s shopping centers mainly include rental income under operating leases, admission rights, commissions and revenue from several services provided to the Group’s lessees.
All lease agreements in Argentina are cancelable pursuant to Argentine Law 23,091 “Lease law” as amended by Law 24,808 “Lease Law”. Under the law, a lease is not cancelable within the first six months of the agreement, but provides that after that initial non-cancelable period, tenants may rescind agreements at any time upon giving prior written notice to lessors. Cancellations are subject to one-and-a-half month’s rent if rescinded during the first year of the lease and one month’s rent if rescinded after the first year of the lease.
The Group analyzed the definition of the lease term in IAS 17, for its cancelable option, and which provides that a non-cancelable lease is a lease that is cancelable only (a) upon the occurrence of some remote contingency, (b) with the permission of the lessor, (c) if the lessee enters into a new lease with the same lessor or (d) upon payment by the lessee of such an additional amount that, at inception of the lease, continuation of the lease is reasonably certain.
The Group considered that all of its operating leases should be considered non-cancellable for accounting. The Group concluded that, even though a lease is cancelable under the law, tenants would incur significant “economic penalties” if the leases are terminated prior to expiry. The Group considered that these economic penalties are of such amount that continuation of the lease contracts by tenants appears to be reasonably certain at the inception of the respective agreements. Group reached this conclusion based on factors such as (i) the strategic geographical location and accessibility to customers of the Group’s investment properties; (ii) the nature and tenure of tenants (mostly well-known local and international retail chains), (iii) limited availability of identical revenue-producing space in the areas where the Group’s investment properties are located; (iv) the tenants’ brand image and other competitive considerations; (v) tenants’ significant expenses incurred in renovation, maintenance and improvements on the leased space to fit their own image; (vi) the majority of the Group’s tenants only have stores in shopping centers with some or none street stores.
Cresud Sociedad Anónima,
Comercial, Inmobiliaria, Financiera y Agropecuaria
Notes to Consolidated Financial Statements (Continued)
(All amounts in thousands of Argentine Pesos, except shares and per share data and as otherwise indicated)
2. | Summary of significant accounting policies (Continued)
|
Lessees of shopping centers are generally required to pay the higher of: (i) a base monthly rent (the “Base Rent”) and (ii) a specific percentage of gross monthly sales recorded by the Lessee (the “Supplementary Rent”), which generally ranges between 4% and 10% of gross sales. Moreover, in accordance with agreements entered into for most locations, the Base Rent is subject to scheduled increases, typically between 7% and 24% per year over the term of the lease.
In addition, some lease contracts include provisions that set forth variable rent based on specific volumes of sales and other types of ratios.
Rental income from shopping center properties leased out under operating leases, isadmission rights and fees related to their real estate agent business are recognized in the statements of income statements on a straight-line basis over the term of the leases. When lease incentives are granted, they are recognized as an integral part of the net consideration for the use of the property and are therefore recognized on the same straight-line basis.
Contingent rents, being lease payments that are not fixed at the inception of a lease, are recorded as income in the periodsyears in which they are earned. Rent reviews are recognized when such reviews have been agreed with tenants.
Tenants in the Group’s shopping centers are also generally charged a non-refundable admission right upon entering a lease contract or renewing an existing one. Admission rights are treated as additional rental income and recognized in the income statements under a straight-line basis over the term of the respective lease agreement.
The Group acts as its own leasing agent for arranging and closing lease agreements in its shopping center properties and consequently earns letting fees. Letting fees are paid by tenants upon the successful closing of an agreement. A transaction is considered successfully concluded when both parties have signed the related lease contract. Letting fees received by the Group are treated as additional rental income and are recognized in the income statements on a straight-line basis over the term of the lease agreements.
Lease contracts also provide that common area maintenance charges and collective promotion funds of the Group’s shopping centers are borne by the corresponding lessees, generally on a proportionally basis. These common area maintenance charges include all such expenses convenient and necessary for various purposes including, but not limited to, the operation, maintenance, management, safety, preservation, repair, supervision, insurance and enhancement of the shopping centers. The lessor is responsible for determining the need and suitability of incurring a common area expense. The Group makes the original payment for such expenses, which are then reimbursed by the lessees. The Group has assessed the substance of the transactions and concludedconsiders that the group is actingit acts as a principal since it has exposure to the significant risks and rewards associated with the rendering of services. Cresud Sociedad Anónima,
Comercial, Inmobiliaria, Financiera y Agropecuaria
Notes to Consolidated Financial Statements (Continued)
(All amounts in thousands of Argentine Pesos, except shares and per share data and as otherwise indicated)
2. | Summary of significant accounting policies (Continued)
|
these cases. Service charge income is presented within rental income and services, separately from property operating expenses. Property operating expenses are expensed as incurred.
UnderCresud Sociedad Anónima, Comercial, Inmobiliaria, Financiera y Agropecuaria Notes to the lease contracts entered into, lessees also agree to participateConsolidated Financial Statements(Continued) (All amounts in collective promotion funds (“FPC”) to be used in advertising and promoting the Group’s shopping centers. Each lessee’s participation is generally calculated as a percentagemillions of the monthly rent accrued. Revenue so derived is also included under rental incomeArgentine Pesos, except otherwise indicated) 2. Summary of significant accounting policies (Continued) ●Rental and services segregated from advertising and promotion expenses. Such expenses are charged to income when incurred.
Revenue includes income from managed operations such as car parking lots. In addition, revenue includes income from property management fees. Revenue from services and management fees is recognized on an accrual basis as services are provided.
·Office- Offices and other rental properties portfolio
Rental income from officeoffices and other rental properties include rental income from office leased out under operating leases, income for services and expenses recovery paid from tenants.
Rental income from officeoffices and other rental properties leased out under operating leases is recognized in the income statements on a straight-line basis over the term of the leases. When lease incentives are granted, they are recognized as an integral part of the net consideration for the use of the property and are therefore recognized on the same straight-line basis.
Contingent rents, being lease payments that are not fixed at the inception of a lease, are recorded as income in the periods in which they are earned. Rent reviews are recognized when such reviews have been agreed with tenants.
Lease contracts also provide that common area maintenance expenses of the Group’s offices and other rental properties are borne by the corresponding lessees, generally on a proportionally basis. These common area maintenance expenses include all such expenses convenient and necessary for various purposes including, but not limited to, the operation, maintenance, management, safety, preservation, repair, supervision, insurance and enhancement of the offices and other rental properties. The Group makes the original payment for such expenses, which are then reimbursed by the lessees. The Group considered that it acts as a principal in these cases. The Group accrues reimbursements from tenants for recoverable portions of all these expenses as service charge revenue in the period the applicable expenditures are incurred and is presented separately from property operating expenses. Property operating expenses are recognized as incurred. ●Revenue from supermarkets Revenue from the sale of goods in the ordinary course of business are recognized at the fair value of the consideration collected or receivable, net of returns and discounts. When the credit term is short and financing is that typical in the industry, consideration is not discounted. When the credit term is longer than the industry’s average, in accounting for the consideration, the Group discounts it to its net present value by using the client’s risk premium or the market rate. The difference between the fair value and the nominal amount is accounted for under financial income. If discounts are granted and their amount can be measured reliably, the discount is recognized as a reduction of revenue. Generally, the Group recognizes revenue upon delivery of goods to the client. In international sales, revenue is recognized upon loading goods with the forwarder. Where two or more products are sold under one single contract, the Group separates each component and gives them a separate accounting treatment. The attribution of value to each component is based on the relative fair value of each unit. Should the fair value not be measurable on a reliable basis, then revenue is attributed based on the difference arising between the total amount of the executed contract and the fair value of the goods delivered. Cresud Sociedad Anónima, Comercial, Inmobiliaria, Financiera y Agropecuaria
Notes to the Consolidated Financial Statements(Continued) (All amounts in thousandsmillions of Argentine Pesos, except shares and per share data and as otherwise indicated)
| Summary of significant accounting policies (Continued)
|
·Summary of significant accounting policies Development and sale property activities(Continued)
As regards client loyalty programs, the fair value of the Group:consideration received or receivable in relation to the initial sale is allocated across the rewards credits and the other components of the sale. The amount allocated to rewards credits is estimated based on the market value of the goods to be delivered. The fair value of the right to purchase products at a discount is calculated considering the expected exchange ratio and the expected terms. Such amount is deferred and revenue is recognized only where rewards credits are exchanged and the Group has complied with its obligation to provide the products at a discount, or else when such reward credits have expired. The amount of revenue recognized under such circumstances is based on the number of reward credits that have been exchanged for products with discounts, in relation to the total number of reward credits expected to be exchanged. Deferred revenue is then reversed when reward credits are no longer likely to be exchanged.
In addition, when the Group acts as agent and not as main supplier in a transaction, revenue is recognized at the net amount of commissions. Revenue primarily comprisesfrom commissions is recognized based on transactions conducted by credit card companies at the proceedsrate and on the date they are credited. Revenue from developmentcredit margins of credit cards is recognized on the date the client is bound to pay and revenue for subscription fees is recognized on a monthly basis. ●Revenue from communication services and sale of trading properties. communication equipment Revenue derived from the use of communication networks by the Group, including mobile phones, Internet services, international calls, fixed line calls, interconnection rates and roaming service rates, are recognized when the service is provided, proportionally to the extent the transaction has been realized, and provided all other criteria have been met for revenue recognition. Revenue from the sale of properties ismobile phone cards are initially recognized only when the significant risksas deferred revenue and rewards have transferred to the buyer. This will normally takethen recognized as revenue as they are used or upon expiration, whichever takes place on unconditional exchange of contracts (except where payment or completion is expected to occur significantly after exchange). For conditional exchanges, sales are recognized when these conditions are satisfied.earlier.
The Group applies IFRIC 15 “Agreements for the Construction of Real Estate”. IFRIC 15 gives guidance as to which standard applies when accounting for the construction of real estate; that is IAS 11 “Construction Contracts” or IAS 18 “Revenue”. IFRIC 15 interprets that an agreement meets the definition of a construction contract under IAS 11 when the buyer is able to specify the major structural elements of the design of the property either before or during construction. Furthermore, IFRIC 15 interprets that an agreement is forA transaction involving the sale of goods under IAS 18 when construction takes place independentlyequipment to a final user normally also involves a service sale transaction. In general, this type of sale is performed without a contractual obligation by the agreement and the buyer has onlyclient to consume telephone services for a limited ability to influence the design. The Group has assessed the nature of its agreements and determined that they are within the scope of IAS 18.minimum amount over a predetermined period. As a result, the Group records the sale of equipment separately and recognizes revenue pursuant to the transaction value upon delivery of the equipment to the client. Revenue from telephone services are recognized and accounted for as they are provided. When the client is bound to make a minimum consumption of services during a predefined period, the contract formalizes a transaction of several elements and, therefore, revenue from the sale of open market private homesequipment is recorded at an amount that should not exceed its fair value, and commercial units entirely atis recognized upon delivery of the point of legal completion in accordance with IAS 18.
equipment to the client and provided the criteria for recognition are met. The Group also enters into barter transactions where the Group normally exchanges undeveloped parcels of land with third-party developers for future property to be developed on the bartered land. In certain circumstances, the Group also receives cash as part of these transactions. The legal title together with all risks and rewards of ownership to the land are transferred to the developer upon sale. The Group generally requires the developer of the subject parcel to issue surety insurance or to mortgage the land in favor of the Group as performance guarantee. If the developer does not fulfill its obligations, the Group forecloses on the land through the execution of the mortgage or the surety insurance policy, in addition to imposing a cash penalty for breach.
The Group determines that its barter transactions have commercial substance and that the conditions for revenue recognition on the transfer of land are met at the time the transaction is consummated. Revenue is then recognized atascertains the fair value of the goods delivered, adjusted by the amount of cash received, if any. In exchange for delivery of the land, the Group receives cash, if any, and an in-kind receivable. Such receivable is initially recognized at fair value but is not subsequently re-measured. In exchange for delivering the parcel, the Group receives cash and/or a right to receive future units to be developedindividual elements, based on the subject parcels. The in-kind receivableprice at which it is initially recognized at cost (beingnormally sold, after taking into account the fair value of the transferred land) as an intangible asset in the statement of financial position in the line item “Right to receive future units (Barter transactions)”. The mentioned intangible asset is not adjusted in subsequent years unless there are indicia of impairment.relevant discounts.
Cresud Sociedad Anónima, Comercial, Inmobiliaria, Financiera y Agropecuaria
Notes to the Consolidated Financial Statements(Continued) (All amounts in thousandsmillions of Argentine Pesos, except shares and per share data and as otherwise indicated)
| Summary of significant accounting policies (Continued)
|
Summary of significant accounting policies (Continued)
The Group may sell
Revenue derived from long-term contracts is recognized at the residential apartments to third-party homebuyers once they are finalizedpresent value of future cash flows, discounted at market rates prevailing on the transaction date. Any difference between the original credit and transferredits net present value is accounted for as interest income over the credit term. ● Revenue from tourism services Revenue from the developer. In these circumstances, revenueprovision of tourist services is recognized when the significant risks and rewardsfollowing conditions are transferredmet: ● the revenue amount may be reliably measured; ● the economic benefits associated to the buyer. This will normally take place whentransaction are expected to have an impact on the title deeds are transferredGroup; ● the degree of completion of the transaction may be measured on a reliable basis; and ● expenses incurred in relation to the homebuyer.transaction as well as all necessary costs to finalize the transaction may be reliably measured.
The cost of sales of supermarkets, includes the acquisition costs for the products less discounts granted by suppliers, as well as all expenses associated with storing and handling inventories. It also includes operational and management costs for shopping centers held by the Group may market the residential apartments during construction or even before construction commences. In these situations, homebuyers generally surrenders a downpaymentas part of its real estate investments. The Group’s cost of sales in relation to the Group withsupply of communication services mainly includes the remaining amount being paid when the developer completes the propertycosts to purchase equipment, salaries and transfers itrelated expenses, service costs, royalties, ongoing license dues, interconnection and roaming expenses, cell tower lease costs, depreciation and amortization expenses and maintenance expenses directly related to the Group, and the Group in turn transfers it to the buyer. Revenue is not recognized until the apartments are completed and the transaction is legally completed, that is when the apartments are transferred to the homebuyers and deeds of title are executed. This is because in the event the residential apartments are not completed by the developer and consequently not delivered to the homebuyer, the Group is contractually obligated to return to the homebuyer any down payment received plus a penalty amount. The Group may then seek legal remedy against the developer for non-performance of its obligations under the agreement. The Group exercised judgment and considers that the most significant risk associated with the asset the Group holds (i.e. the right to receive the apartments) consisting of the unfulfillment of the developer's obligations (i.e. to complete the construction of the apartments) has not been transferred to the homebuyers upon reception of the down payment.services provided.
·Hotel operations of the Group:
Revenue from hotel operations primarily comprises room accommodation, catering and other services. Revenue from product sales in hotels are recognized when the product is delivered and the significant risks and rewards of ownership are transferred to the buyer. Revenues from sales of services are recognized when the service is rendered. All revenues are recognized on an accruals basis.
2.25.
Share Capital, Treasury Stock, Inflation Adjustment of Share Capital, Share Premium, Additional paid-in Capital from Treasury Stock, Cost of Treasury Stockcapital
Ordinary shares are classified as equity. Incremental costs directly attributable to the issue of new ordinary shares or options are shown in equity as a deduction, net of tax, from the proceeds from this issuance. Cresud Sociedad Anónima,
Comercial, Inmobiliaria, Financiera y Agropecuaria
Notes to Consolidated Financial Statements (Continued)
(All amounts in thousands of Argentine Pesos, except shares and per share data and as otherwise indicated)
2. Summary of significant accounting policies (Continued)
Share repurchases made this fiscal year, as established by the amended CNV Rules issued in relation to the new Capital Markets Act 26,831 and its implementing Executive Order 1023/13 (published by CNV in 2013) are to be recorded as follows: 1) the acquisition cost of the repurchased shares is charged to “Cost of Treasury Stock”, 2) the nominal value of the repurchased shares is charged to “Share Capital”, the proportional part of the adjustment for inflation corresponding to such repurchased shares is charged to “Inflation Adjustment of Share Capital”, and is matched by a credit to “Treasury Stock” and “Inflation Adjustment of Share Capital and Treasury Stock”. This entry is reverted upon the sale of shares. Upon sale of the treasury shares, the difference between the net realizable value of the treasury shares sold and their acquisition cost shall be recorded, whether it is a gain or a loss, as part of owners’ contributions not yet capitalized to be called “Additional Paid-in Capital from Treasury Stock”.
Before CNV rules 2013 become effective, whereWhen any Group company purchases the Company’s equity share capital (treasury shares), the consideration paid, including any directly attributable incremental costs (net of income taxes) wasis deducted from equity attributable to the Company’s equity holders until the shares wereare cancelled or reissued. WhereWhen such ordinary shares wereare subsequently reissued, any consideration received, net of any directly attributable incremental transaction costs and the related income tax effects, and wasis included in equity attributable to the Company’s equity holders.
Cresud Sociedad Anónima, Comercial, Inmobiliaria, Financiera y Agropecuaria Notes to the Consolidated Financial Statements(Continued) (All amounts in millions of Argentine Pesos, except otherwise indicated) 2. Summary of significant accounting policies (Continued) Instruments issued by the Group that will be settled by the Company delivering a fixed number of its own equity instruments in exchange for a fixed amount of cash or another financial asset are classified as equity.
Inflation adjustment of share capital
Under Argentine GAAP, the Group’s financial statements were previously prepared on the basis of general price-level accounting which reflected changes in the purchase price of the Argentine Peso in the historical financial statements through February 28, 2003. The inflation adjustment related to share capital was appropriated to an inflation adjustment reserve that formed part of shareholders' equity. The balance of this reserve could be applied only towards the issuance of common stock to shareholders of the Company. Resolution 592/11 of the CNV requires that at the transition date to IFRS certain equity accounts, such as the inflation adjustment reserve, are not adjusted and are considered an integral part of share capital.
2.26.
Comparability of information
Cresud Sociedad Anónima,
Comercial, Inmobiliaria, Financiera y Agropecuaria
Notes to Consolidated Financial Statements (Continued)
(All amounts in thousands of Argentine Pesos, except shares and per share data and as otherwise indicated)
2. | Summary of significant accounting policies (Continued)
|
Legal Reserve
According to Argentine law, 5% of the profit of the year is separated to constitute a legal reserve until they reach legal capped amounts (20% of total capital). This legal reserve is not available for dividend distribution and can only be released to absorb losses. The Group has not reached the legal limit of this reserve.
Special Reserve
Pursuant to CNV General Ruling N° 609/12, the Company set up a special reserve, to reflect the positive difference between the balance at the beginning of retained earnings disclosed in the first financial statements prepared according to IFRS and the balance at closing of retained earnings disclosed in the last financial statements prepared in accordance with previously effective accounting standards. This reserve may not be used to make distributions in kind or in cash, and may only be reversed to be capitalized, or otherwise to absorb potential negative balances in Retained Earnings.
Reserve for New Developments
The Company and subsidiaries may separate portions of their profits of the year to constitute voluntary reserves according to company law and practice. These special reserves may be for general purposes or for specific uses such as new developments. The voluntary reserves may be released for dividend distribution.
Reserve for the repurchase of securities issued by the Company
On April 11, 2014, Cresud reported on a potential repurchase of shares intended to curb the drop in prices and reduce fluctuations on the Company’s shares and ADR and strengthen its position in the market, thus minimizing potential temporary imbalances that may arise between supply and demand. On that same date, the Shareholders’ Meeting approved a partial release of the account “Reserve for new developments” in an amount of up to Ps. 200 million, in order to appropriate such amount of money to set up a reserve entitled “Reserve for the repurchase of securities” issued by the Company.
Cresud Sociedad Anónima,
Comercial, Inmobiliaria, Financiera y Agropecuaria
Notes to Consolidated Financial Statements (Continued)
(All amounts in thousands of Argentine Pesos, except shares and per share data and as otherwise indicated)
2. | Summary of significant accounting policies (Continued)
|
Basic profit / (loss) per share is calculated by dividing the net profit / (loss) for the year attributable to equity holders of the parent by the weighted average number of common shares outstanding during the year. Diluted net profit / (loss) per share is computed by dividing the net profit / (loss) for the year by the weighted average number of common shares outstanding, and when dilutive, adjusted for the effect of all potentially dilutive shares, including share options, on an as-if converted basis.
In computing diluted profit / (loss) per share, income available to common shareholders used in the basic profit / (loss) per share calculation is adjusted to any other income or lossBalance items that would result from the assumed conversion of potential common shares. The weighted-average number of common shares outstanding is adjusted to include the number of additional common shares that would have been outstanding if the dilutive potential common shares had been issued. Diluted profit / (loss) per share is based on the most advantageous conversion rate or exercise price over the entire term of the instrument from the standpoint of the security holder. The calculation of diluted profit / (loss) per share excludes potential common shares if their effect is anti-dilutive. The Company has considered the dilutive effect of outstanding warrants in calculating diluted profit / (loss) per share. See Note 37 for details.
2.31. | Dividend distribution |
Cash dividend distribution to the Group’s shareholders is recognized as a liability in the Group’s financial statements in the period in which the dividends are approved.
As indicated in Note 30, the Group has been refunded dividends deposited with the Caja de Valores. Such amounts have been recorded either under Retained Earnings, if already forfeited or under Trade and other payables, if not forfeited.
Dividends earned are recorded when declared.
Cresud Sociedad Anónima,
Comercial, Inmobiliaria, Financiera y Agropecuaria
Notes to Consolidated Financial Statements (Continued)
(All amounts in thousands of Argentine Pesos, except shares and per share data and as otherwise indicated)
2. | Summary of significant accounting policies (Continued)
|
2.33. | Comparative information |
Amounts as of June 30, 2015 and 2014 which are disclosedshown in these financial statements for comparative purposes have been takenarise from the Consolidated Financial Statements as of such date. The financial statements originally issuedthen ended. Certain reclassifications have been subject to certain reclassifications requiredmade in order to present these figures comparatively with those of this year. See Note 2.1 (a)
As required by IFRS 3, the information of IDBD is included in the consolidated financial statements of the Group as from the acquisition date, and the prior periods are not modified by this situation. Therefore, the consolidated financial information for years after the acquisition is not comparative with prior years. During the fiscal year ended June 30, 2016, the Argentine Peso devalued against the US$ and other currencies by around 65%. This has an impact in comparative information presented in these Financial Statements, due mainly to the currency exposure of our income and costs of Agricultural Business and of income from Urban properties and investments business line, especially from the “office and other rental properties” segment, and our net assets and liabilities (mainly assets and liabilities of the Operations Center in Israel), in foreign currency. Moreover, during the year ended June 30, 2015,2016, the Real Brasileño (RS)Brazilian Reais (Rs.) has depreciated against the Argentine Peso and other currencies by around 20.0%17%, respectively, which affects the comparability of the figures reported in the current financial statements given its negative impact on the financial position and results of operations of the Group, due mainly to the foreign exchange rate exposure to net assets and liabilities denominated in foreign currency and investments in joint ventures with a functional currency different from the Real.Brazilian Reais.
3. | Acquisitions and disposals |
2.27.
Irrevocable right of use of the capacity of underground communication lines
Year ended June 30, 2015
SaleTransactions carried out to acquire an irrevocable right of Cresca farmland
On April 3, 2014, Cresca S.A. signeduse of the capacity of underground communication lines are accounted for as service contracts. The amount paid for the rights of use of the communication lines is recognized as “Prepaid expenses” under trade and other receivables, and is amortized over a bill of sale whereby it sells an area of 24,624 hectares locatedstraight-line basis during the period set forth in Chaco Paraguayo. The total price is US$ 14.7 million (Ps. 56.3 million)the contract (including the option term), which amount shall be collectable as follows US$ 1.8 million were collected upon executionis the estimated useful life of the bill of sale, US$ 4.3 million upon execution of the conveyance deed; US$ 3.7 million interest-free in July, 2015; US$ 4.9 million interest-free in July, 2016. Possession was delivered upon execution of the conveyance deed of title and constitution of a mortgage to secure payment of the balance, on July 14, 2014.such capacity.
The Group has recognized gains of Ps. 19.1 million as result of this transaction.
Sale of Cremaq farmland
On June 10, 2015, Brasilagro sold the remaining area of 27,745 hectares of Cremaq field, an establishment, located in the municipality of Baixa Grande do Ribeiro (Piaui). The sale was priced at Rs. 270 million (Ps. 694.0 million), of which Rs. 67.5 million (Ps. 196.8 million) were collected, and the remaining balance will be collected within an estimated term of de 90 days.
The Group has recognized gains of Ps. 525.9 million as result of this transaction.
Cresud Sociedad Anónima, Comercial, Inmobiliaria, Financiera y Agropecuaria
Notes to the Consolidated Financial Statements(Continued) (All amounts in thousandsmillions of Argentine Pesos, except shares and per share data and as otherwise indicated)
3. | Acquisitions and disposals (Continued)
|
Sale of La Fon Fon II farmlands
On October 17, 2013, Yuchán Agropecuaria signed a purchase-sale agreement involving a sale subject to retention of title involving 1,643 hectares of "La Fon Fon II" for an overall amount of US$ 7.21 million (equivalents to Ps. 59.0 million). As of the consolidated financial statements date, the amount of US$ 1.5 million has been collected, and the remaining balance amounts to US$ 5.71 million that will be cancelled in 6 semi-annual installments, starting in December this year, and concluding in June, 2018. Under the contract, the conveyance shall be recorded with the Registry once the price has been fully paid off. On June 24, 2015, possession was granted by Yuchán Agropecuaria. During this year the Group recognized a profit before tax of US$ 2.7 million (equivalents to Ps. 24.6 million) as result of this transaction.
Sale of investment properties
On July 7, 2014, IRSA signed the transfer deed for the sale of the 19th and 20th floors of the Maipú 1300 Building. The total price of the transaction was Ps. 24.7. Such transaction generated a profit before tax of approximately Ps. 20.3 million.
On September 29, 2014, the Group through its subsidiary Rigby 183 LLC (“Rigby 183”) finalized the sale of the Madison 183 Building, located in the city of New York, United States, in the sum of US$ 185 million, thus paying off the mortgage levied on the asset in the amount of US$ 75 million. Such transaction generated a gain before tax of approximately Ps. 296.5 million.
On October 8, 2014, the Group through IRSA signed the transfer deed for the sale of the 22th and 23th floors of the Bouchard 551 Building. The total price of the transaction was Ps. 168.7 million. Such transaction generated a gain before tax of approximately Ps. 150.1 million.
On October 22, 2014, the Group through IRSA signed the transfer deed for the sale of the 10th floor and two parking units of the Maipú 1300 Building and one parking unit of the building Libertador 498. The total price of the transaction was Ps. 12.0 million. Such transaction generated a gain before tax of approximately Ps. 10.1 million.
On October 28, 2014, the Group through IRSA signed the transfer deed for the sale of 9th, 10th and 11th floors of the Bouchard 551 Building. The total price of the transaction was Ps. 279.4 million. Such transaction generated a gain before tax of approximately Ps. 238.6 million.
3. Acquisitions and disposals A. Cresud Sociedad Anónima,(a) Comercial, Inmobiliaria, Financiera y Agropecuaria
Notes to Consolidated Financial Statements (Continued)
(All amounts in thousands of Argentine Pesos, except shares and per share data and as otherwise indicated)Control obtainment
3. | Acquisitions and disposals (Continued)
|
On November 7, 2014, the Group through IRSA signed the transfer deed for the sale of the 21th floor of the Bouchard 551 Building. The total price of the transaction was Ps. 75.6 million. Such transaction generated a gain before tax of approximately Ps. 66.1 million.
On December 10, 2014, the Group through IRSA signed the transfer deed for the sale of the 9th floor of the Maipú 1300 Building. The total price of the transaction was Ps. 12.5 million. Such transaction generated a gain before tax of approximately Ps. 10.7 million.
On May 5, 2015, the Group through IRSA CP has signed a bill of sale to transfer 8,470 square meters corresponding to nine offices floors and 72 parking units of Intercontinental Plaza Building. The transaction price was Ps. 376.4 million, which has already been fully paid. On June 30, 2015, the title deed was executed and the possession of the units previously mentioned was granted. Gross profit before tax of this operation amounted to Ps. 338.4 million.
On May 19, 2015, the Group through IRSA signed the transfer deed for the sale of the 15th floor of the Maipú 1300 Building and one parking unit in Libertador 498 Building. The total price of the transaction was US$ 13.5 million. Such transaction generated a profit before tax of approximately Ps. 11.6 million.
On June 5, 2015, the Group through IRSA signed the transfer deed for the sale of the 14th floor of the Maipú 1300 Building. The total price of the transaction was US$ 13.3 million. Such transaction generated a profit before tax of approximately Ps. 11.5 million.
All sales of the period led to a combined profit for the Group of Ps. 1,150.2 million approximately, disclosed within the line “Gain from disposal of investment properties” in the income statement.
Decreased shareholding in Avenida Inc.
On July 18, 2014, the Group, through Torodur S.A., exercised the warrant that remained associated to this investment and consequently its interest in Avenida Inc. increased to 6,172,840 shares or 35.46%. However, simultaneously, a new investor acquired 35.12% of interest in the Company, diluting the Group’s holding to 23.01% at such date.
On September 2, 2014, Torodur S.A. sold 1,430,000 shares representing 5% of the Avenida Inc.’s capital stock in the amount of Ps. 19.1 million (US$ 2.3 million), thus reducing equity interest to 17.68% of its share capital. Such transaction generated a gain of Ps. 8.8 million which are shown in the line "Other operating results, net" in the income statement.
Cresud Sociedad Anónima,
Comercial, Inmobiliaria, Financiera y Agropecuaria
Notes to Consolidated Financial Statements (Continued)
(All amounts in thousands of Argentine Pesos, except shares and per share data and as otherwise indicated)
3. | Acquisitions and disposals (Continued)
|
As a result of the sale of the interest, the Group has ceased to recognize the equity interest in Avenida Inc. as investment in associates and began to consider it as a financial asset at fair value in the financial statements as of June 30, 2015.
Acquisition of additional interest in BHSA
During the year ended June 30, 2015, the Group acquired 3,289,029 additional shares of BHSA in a total amount of Ps. 14.2 million, thus increasing its interest in such company from 29.77% to 29.99%, without consideration of Treasury shares.
Investment in IDBD
On May 7, 2014, a transaction was closedagreed whereby the Group, acting indirectly through Dolphin, acquired jointly with C.A.A. Extra Holdings Limited, aETH (a non-related company incorporatedestablished under the laws of the State of Israel to the Company best knowledge controlled by Mordechay Ben Moshé (hereinafter, “ETH”), an aggregate number of 106.6 million common shares in IDBD, representing 53.30% of its stock capital, under the scope of the debt restructuring arrangement of IDBD’s holdingIDBH, IDBD's parent company, IDB Holdings Corporation Ltd. (“IDBH”), with its creditors (the “Arrangement”"Arrangement"). Under the terms of the agreement entered into between Dolphin and E.T.H.M.B.M. Extra Holdings Ltd., a company controlled by Mordechay Ben Moshé, to which Dolphin and ETH acceded to (the “Shareholders' Agreement”"Shareholders' Agreement"), Dolphin acquired a 50% interest in this investment, whileand ETH acquired the remaining 50%. The total initial investment amount was NIS 950 million, equivalent to approximately US$ 272 million at the exchange rate prevailing on that date. As of June 30, 2014, IRSA’s indirect interest in IDBD was approximately 23%. Under the Arrangement, Dolphin and ETH agreed to participate on a joint and several basis in the capital increases resolved by IDBD’s Board of Directors in order to carry out its business plan for 2014 and 2015, in amounts of at least NIS 300 million in 2014 and NIS 500 million in 2015. As of June 30, 2014, Dolphin and ETH had contributed NIS 231.09 million of the commitment of NIS 300 million corresponding to the year 2014.
Moreover, as part of the Arrangement, Dolphin and ETH committed jointly and severally to make one or more tender offers (the “Tender Offers”) for the purchase of IDBD’s shares for a total amount of NIS 512.09 million (equivalent to approximately US$ 135.7 million at the exchange rate prevailing as of June 30, 2015), as follows: (i) by December 31, 2015 at least NIS 249.8 million for a price per share of NIS 7.798 (value as of June 30, 2015, subject to adjustment) and (ii) by December 31, 2016, for at least NIS 512.09 million, less the offer made in 2015, for a price per share of NIS 8.188 (value as of June 30, 2015, subject to adjustment). As security for the performance of the tender offers, a total of 28,020,191 shares of IDBD were pledged at the closing of the transaction.
Cresud Sociedad Anónima,
Comercial, Inmobiliaria, Financiera y Agropecuaria
Notes to Consolidated Financial Statements (Continued)
(All amounts in thousands of Argentine Pesos, except shares and per share data and as otherwise indicated)
3. | Acquisitions and disposals (Continued)
|
On the other hand, the Arrangement provided that Dolphin and ETH had to pay on a joint and several basis to the creditors who are parties to the Arrangement an additional amount of NIS 100 million in the event that IDBD executed the sale of its interest in Clal Insurance Enterprises Holdings Ltd. (“Clal”) before December 31, 2014, provided that: (i) the sale price was not lower than NIS 4,200 million and (ii) the closing of the transaction took place before June 30, 2015, with IDBD having received as of such date a payment of not less than NIS 1,344 million (gross). As of December 31, 2014, IDBD had not executed the sale of its interest in Clal and accordingly this commitment undertaken by Dolphin and ETH became ineffective.
On May 12, 2014, IDBD’s shares became listed on the “TASE”. Consequently, all the shares (including the pledged shares) were deposited in escrow with Bank Leumi Le-Israel as security in compliance with the lock-up provisions set forth in Chapter D of the TASE Regulations, which provide that initially listed shares may not be disposed of for a term of 18 months as from initial listing allowing the release of a 2.5% of the locked ups shares per month beginning on the fourth month since the initial listing date.
Pursuant to the provisions of IDBD’s rights offering memorandum dated June 9, 2014, on June 26, 2014, a total of 1,332,500 rights to subscribe shares and warrants were granted by IDBD to Dolphin at a ratio of 1 for every 40 shares held, which were exercised on July 1, 2014. Later on, during IDBD’s rights issuance process, Dolphin and ETH acquired 0.89 million additional rights for NIS 2.83 million, equivalent to approximately US$ 0.83 million, out of which 50% corresponded to Dolphin and 50% to ETH, all in accordance with the terms of the Shareholders´ Agreement.
The rights offered by IDBD allowed to subscribe in July 2014 for 13 common shares of IDBD for a price of NIS 65 (NIS 5 per share) and 27 warrants, 9 of each series (series 1, 2 and 3) to be issued by IDBD, at no cost. Each warrant issued by IDBD would allow acquiring one common share in IDBD. Series 1 expired on November 1, 2014 and were exercisable at NIS 5.50 per warrant. Series 2 matured on May 1, 2015 and were exercisable at NIS 6 per warrant. Series 3 matures on December 1, 2015 and is exercisable at NIS 6.50 per warrant.
Cresud Sociedad Anónima,
Comercial, Inmobiliaria, Financiera y Agropecuaria
Notes to Consolidated Financial Statements (Continued)
(All amounts in thousands of Argentine Pesos, except shares and per share data and as otherwise indicated)
3. | Acquisitions and disposals (Continued)
|
On July 1, 2014 Dolphin exercised all granted and acquired rights it held as of June 30, 2014 to acquire the additional shares in IDBD. As a result, Dolphin received 23.1 million shares and 16 million Series 1, 2 and 3 warrants. ETH held the same number of rights and acquired the same number of shares and warrants as Dolphin.
During the period from July 9 to July 14, 2014, Dolphin acquired through transactions in the open market 0.42 million shares and 0.34 million additional Series 2 warrants for NIS 1.77 million (equivalent to approximately US$ 0.52 million as of such date). 50% of such shares and Series 2 warrants were sold to ETH pursuant to the provisions of the Shareholders’ Agreement.
On November 2, 2014, Dolphin exercised 15,998,787 Series 1 warrants and ETH exercised its respective share of Series 1 warrants.
On January 19, 2015, Dolphin acquired in the open market 94,000 shares in IDBD for a total amount of NIS 0.13 million (equivalent to US$ 0.03 million as of the purchase date) and subsequently sold 50% to ETH in accordance with the terms of the Shareholders´ Agreement. In addition, Dolphin acquired 42,564 shares in Discount Investment Corporation Ltd (“DIC”), IDBD's subsidiary, for NIS 0.24 million (equivalent to US$ 0.06 million as of the purchase date), 50% of which was offered to ETH under the terms of the Shareholders´ Agreement. This time ETH decided not to acquire 50% of such shares.
Furthermore, on January 19, 2015, IDBD issued a shelf offering report for subscription rights (the “Rights Offering”) for approximately NIS 800 million (the “Maximum Immediate Consideration”) pursuant to an irrevocable offer from Dolphin, (as described in Note 9 to these financial statements), to grant on January 26, 2015, 1 right (the “New Right”) for every 25 shares held in IDBD. Each New Right would allow to subscribe on February 10, 2015 a number of 45 common shares in IDBD for NIS 68.04 (NIS 1.512 per share) and 20 Series 4 warrants, 19 Series 5 warrants and 17 Series 6 warrants issued by IDBD, at no cost. Each warrant issued by IDBD would allow acquiring a common share in IDBD. The Series 4 warrants expire on February 10, 2016 and are exercisable at NIS 1.663 per warrant. Series 5 warrants expire on February 12, 2017 and are exercisable at NIS 1.814 per warrant. Series 6 warrants expire on February 12, 2018 and are exercisable at NIS 1.966 per warrant
Cresud Sociedad Anónima,
Comercial, Inmobiliaria, Financiera y Agropecuaria
Notes to Consolidated Financial Statements (Continued)
(All amounts in thousands of Argentine Pesos, except shares and per share data and as otherwise indicated)
3. | Acquisitions and disposals (Continued)
|
As a result of the Rights Offering, on January 26, 2015, Dolphin received 3.7 million New Rights. ETH received the same number of New Rights. The Rights Offering shelf offering report also stipulated that on February 5, 2015 the rights received could be traded on the public market during such single day only.
In addition, on February 5, 2015, Dolphin acquired 2.05 million New Rights for a total amount of NIS 0.94 million (equivalent to US$ 0.24 million as of the purchase date), 50% of which was offered to ETH under the terms of the Shareholders´ Agreement. At this time ETH decided not to acquire 50% of such New Rights.
On February 10, 2015 Dolphin exercised all New Rights received and acquired on the market. As a result, Dolphin received 258,970,184 shares, 115,097,859 Series 4 warrants, 109,342,966 Series 5 warrants and 97,833,180 Series 6 warrants. ETH did not exercise any of the New Rights it held. On such same date, Dolphin sold 71.39 million shares in IDBD to Inversiones Financieras del Sur S.A. (“IFISA”), an entity that is indirectly controlled by Eduardo Sergio Elsztain, at the closing price of NIS 1.39 per share, totaling NIS 99.23 million, equivalent to US$ 25.65 million at the exchange rate prevailing on the date of the transaction.
In addition, between February 9 and February 16, 2015, Dolphin acquired on the market 0.36 million shares of DIC for NIS 2.88 million, equivalent to US$ 0.74 million at the exchange rate prevailing on the date of each transaction, part of which was offered to ETH under the terms of the Shareholders´ Agreement. At this time ETH also decided not to acquire its pro rata interest of such shares according ti the Shareholders´ Agreement.
On May 1, 2015 the IDBD Series 2 warrants expired unexercised.
On May 31, 2015 Dolphin sold to IFISA 46 million Series 4 warrants for a total amount of NIS 0.46 million (equivalent to US$ 0.12 million as of the date of the transaction), on condition that IFISA agreed to exercise all of them when so required by IDBD to Dolphin, in accordance with the proposal made on May 6, 2015 as described in Note 9 to these financial statements.
Cresud Sociedad Anónima,
Comercial, Inmobiliaria, Financiera y Agropecuaria
Notes to Consolidated Financial Statements (Continued)
(All amounts in thousands of Argentine Pesos, except shares and per share data and as otherwise indicated)
3. | Acquisitions and disposals (Continued)
|
On June 3, 2015 in accordance with the, Dolphin May 6 proposal (as described in Note 9 to these financial statements), Dolphin exercised 44.2 million Series 4 warrants for a total amount of NIS 73.5 million (equivalent to US$ 19.2 million at the exchange rate prevailing on such date) and IFISA exercised 46 million Series 4 warrants for a total amount of NIS 76.5 million.
As a result of the transactions described above, as of June 30, 2015, Dolphin held an aggregate number of 324,445,664 shares, 15,988,787 Series 3 warrants, 24,897,859 Series 4 warrants, 109,342,966 Series 5 warrants and 97,833,180 Series 6 warrants, accounting for a 49.0% share interest in IDBD. In addition, as of June 30, 2015 Dolphin held 406,978 shares of DIC, accounting for a direct interest of 0.48%.
As of June 30, 2015, IDBD’s Board of Directors consisted of nine members, three of which were appointed by Dolphin as regular directors: Eduardo Sergio Elsztain, Alejandro Gustavo Elsztain (on July 7 Roni Bar- On replaced him) and Saúl Zang.
During February and March 2015 Dolphin and ETH exchanged letters mainly in relation to claims from ETH in connection with the Rights Offering and ETH’s claim demanding a pro rata acquisition of the IDBD shares owned by Dolphin and subscribed for under the Rights Offering and all the shares acquired thereafter by IFISA asserting in the latter case the rights under the Shareholders´ Agreement (first refusal).Based on the foregoing and in accordance with the provisions of the Shareholders’ Agreement with respect to dispute resolution, on April 30, 2015 (the “Preliminary Hearing”) arbitration proceedings were initiated in Tel Aviv, under Israeli law. The arbitration proceedings were intended to settle the dispute and the application and the interpretation of certain clauses of the Shareholders´ Agreement.
The arbitration proceedings are intended to settle the issues referred to above, and application and interpretation of certain clauses of the Shareholders' Agreement.
In addition, during the Preliminary Hearing, the parties agreed on the rules and procedures that would govern the conduct of the arbitration proceedings and a schedule for such purposes.
On May 28, 2015, beforeETH launched the filing of the arbitration claim, ETH triggered the Buy Me Buy You (“BMBY”) clause,BMBY mechanism provided in the Shareholders´Shareholders’ Agreement (clause which establishes that each party toof the Shareholders’ Agreement may offer to the counterparty to acquire (or sell, as the case may be), the shares it holds in IDBD at a fixed price; and within 14 days from delivery of the BMBY notice (the “Notice”) recipient should let it know whether it desires to sell or acquire the other party’s shares pursuant to the terms of the Notice, in accordance with the provisions of the Shareholders’ Agreement.price). In such petition,addition, ETH further added that the purchaser thereunder would be required to assume all obligations of the seller under the Arrangement. Cresud Sociedad Anónima,
Comercial, Inmobiliaria, Financiera y Agropecuaria
Notes to Consolidated Financial Statements (Continued)
(All amounts in thousands of Argentine Pesos, except shares and per share data and as otherwise indicated)
3. | Acquisitions and disposals (Continued)
|
seller. In addition, onOn June 10 and 11, 2015, Dolphin gave notice to ETH of its intention to buy all the shares inof IDBD held by ETH, asserted its defenses and its interpretation about application and constructionETH.
After certain aspects of the BMBY, establishing that ETH’s interpretation of such mechanism was inaccurate,tender offer were resolved through an arbitration process brought by Dolphin and that pursuantETH, on September 24, 2015, the competent arbitrator resolved that: (i) Dolphin and IFISA (related Company to the Group) were entitled to act as buyers in the BMBY Dolphin was not requiredprocess, and ETH had to assumesell all IDBD shares held by it (92,665,925 shares) at price of NIS 1.64 per share; (ii) The buyer had to fulfill all of the obligations undercommitments included in the Arrangement, butincluding the commitment to carry out Tender Offers whose responsibility belonged to Dolphin; (iii) The buyer had to pledge the shares that if the arbitrator shall decide that Dolphin is requiredseller had pledged to assume such obligations, then Dolphin would still be the purchasing partythem in the BMBY.As a result, the parties pursued arbitration to settle their disputes and in respectfavor of the correct interpretation ofArrangement trustees. On October 11, 2015, the BMBY clause, in orderprocess concluded, and IFISA acquired all IDBD's shares of stock held by ETH. Consequently, the Shareholders' Agreement ceased and members of IDBD's Board of Directors representing ETH submitted their irrevocable resignation to firstly determine, who would be the purchaser underBoard Dolphin was hence empowered to appoint the BMBY clause,new members to the Board. Additionally, on the same date, Dolphin pledged additional shares as collateral to secure compliance with the IDBD stock purchase agreement, thereby increasing the number of pledged shares to 64,067,710. Consequently, the Group gained control of IDBD and secondly whether such party would havestarted to assume all of the obligations of the seller under the Arrangement.consolidate financial statements as from that date. For such purposes, the arbitrator decided to divide the arbitration proceedings into two phases: the first one to deal with the disputes related to application and interpretation of the mechanism under the BMBY clause and the second one in relation to the parties’ additional claims. The parties then filed their respective arguments related to the application and interpretation of the BMBY clause mechanism, and two hearings were held on July 19 and July 22, 2015 in order to reach a decision on this matter.
Moreover, on June 28 and 30, 2015 ETH filed a motion with the arbitratir requesting an injunction preventing changes in IDBD’s current Board of Director’s composition at IDBD’s annual shareholders’ meeting held on July 7, 2015.
On July 6, 2015, the arbitrator granted such injunction as requested by ETH, for which reason Dolphin appointed only 3 directors for the July 7 meeting and may appoint such number of directors until the arbitrator issues a final decision about who is the purchaser under the BMBY process. For more information, please see Note 44 about subsequent events to these financial statements.
F- 47 As Dolphin is a subsidiary that qualifies as a VCO in accordance with the IAS 28 exemption referred to in Note 2.3 (d), the Company has recorded its interest in IDBD at fair value with changes in the income statement.
Disposal of financial assets
During August 2014, IRSA has sold, through its subsidiary REIG IV, the balance of 1 million shares of Hersha Hospitality Trust, at an average price of US$ 6.74 per share.
Cresud Sociedad Anónima, Comercial, Inmobiliaria, Financiera y Agropecuaria
Notes to the Consolidated Financial Statements(Continued) (All amounts in thousandsmillions of Argentine Pesos, except shares and per share data and as otherwise indicated)
3. Acquisitions and disposals (Continued) In addition to the competent arbitrator’s decision issued on September 24, 2015, ETH and Dolphin still have counterclaims of different kinds which are subject to such arbitration proceeding. As of the filing date of these financial statements, the proceeding is still being heard. The following chart shows the consideration, the fair value of the acquired assets, the assumed liabilities and the non-controlling interest as of the acquisition date. 3. | Acquisitions10.11.15
| Fair value of the interest in IDBD’s equity held before the business combination and disposals (Continued)warrants | 1,416 | | Total consideration | 1,416 |
Transactions | 10.11.15 | | Fair value of identifiable assets and assumed liabilities: | | | Investment properties | 29,586 | | Property, plant and equipment | 15,104 | | Intangible assets | 6,603 | | Investment in joint ventures and associates | 9,268 | | Financial assets and other assets held for sale | 5,129 | | Trading properties | 2,656 | | Inventories | 1,919 | | Income tax credits for the year | 91 | | Trade and other receivables | 9,713 | | Investments in financial assets | 5,824 | | Cash and cash equivalents | 9,193 | | Deferred income tax | (4,681) | | Provisions | (969) | | Borrowings | (60,306) | | Derivative financial instruments, net | (54) | | Income tax liabilities | (267) | | Employee benefits | (405) | | Trade and other payables | (19,749) | | Total net identifiable assets | 8,655 | | Non-controlling interest | (8,630) | | Goodwill | 1,391 | | Total | 1,416 |
The Group assessed the fair value of the investment property with the assistance of qualified independent appraisers. As of the acquisition date, the Group estimates that recognized assets are recoverable. The value of the non-controlling interestsinterest in IDBD has been determined on a proportional basis to the fair value of net acquired assets and the fair value of warrants.
Following the control of IDBD, the cumulative currency translation accumulated in shareholders’ equity from the interest held in IDBD before the business combination in the amount of Ps. 91 was recognized in the statement of income. Such result was disclosed under "Other operating results, net" line in the statement of income. Cresud Sociedad Anónima, Comercial, Inmobiliaria, Financiera y Agropecuaria Notes to the Consolidated Financial Statements(Continued) (All amounts in millions of Argentine Pesos, except otherwise indicated) 3. Acquisitions and disposals (Continued) The revenues IDBD has generated since October 11, 2015 and that have been disclosed in the consolidated statement of income amount to Ps. 28,229. IDBD has also run a net result of Ps. (1,984) during said period. If IDBD had been included in the consolidation since July 1st, 2015, the Group´s consolidated income statement would have shown pro-forma revenues in the amount of Ps. 49,637 and pro-forma net result of Ps. (1,992). Later on, following the exercise of BMBY, Dolphin has entered into an option agreement with IFISA that grants Dolphin the right, but not the obligation, to acquire 92,665,925 shares in IDBD which IFISA acquired in the BMBY process at a price per share of NIS 1.64 plus an annual interest rate of 8.5%. The exercise date for the option extends for two years. Additionally, Dolphin is entitled to a first refusal right in case that IFISA agrees to sell these shares to a third party. The value of the option agreement as of June 30, 2016 is zero. (b) Acquisition of non-controlling interest Dolphin was required to carry out the first tranche of tender offers in December 2015. Before expiration of such first tranche, Dolphin and the agreement trustees (the " trustees") entered into an extension agreement (the "Extension Agreement"), which was replaced by the final agreement approved by approximately 95% of the non-controlling shareholders of IDBD (excluding IFISA) and by warrants holders of IDBD on March 2, 2016 and by the competent court on March 10, 2016. The major amendments to the Agreement were: (i) Replacement of the obligation to conduct tender offers as previously established under an agreement whereby Dolphin would purchase all the shares outstanding on March 29, 2016 from non-controlling shareholders of IDBD (except for those held by IFISA) on March 31, 2016. On March 29, 2016, all IDBD shares would cease to be traded in the TASE. On that date, all IDBD warrants held by non-controlling shareholders would expire and Dolphin would make capital contributions to IDBD or grant subordinate loans, as described hereafter. (ii) The price to be paid for each IDBD share held by non-controlling shareholders on March 29, 2016 would be NIS 1.25 in cash, plus NIS 1.20 adjusted nominal value in bonds of the IDBD Series 9 (the “IDBD Bonds”), which IDBD will issue directly to non-controlling shareholders and holders of warrants, and Dolphin will inject funds into IDBD equal to the adjusted nominal value of IDBD Bonds. Additionally, Dolphin would undertake to pay NIS 1.05 (subject to adjustments) in cash if Dolphin, either directly or indirectly, gain control of Clal, or else if IDBD sells a controlling shareholding in Clal under certain parameters (the “Clal payment”), which refers mainly to Clal’s sale price (at a price which exceeds 75% of its book value upon execution of the sale agreement, subject to adjustments) and, under certain circumstances, the proportion of Clal shares sold by IDBD. Cresud Sociedad Anónima, Comercial, Inmobiliaria, Financiera y Agropecuaria Notes to the Consolidated Financial Statements(Continued) (All amounts in millions of Argentine Pesos, except otherwise indicated) 3. Acquisitions and disposals (Continued) (iii) The warrants held by non-controlling shareholders that have not been exercised until March 28, 2016 expired on March 31, 2016. Each warrant holder was entitled to elect whether: (a) to receive IDBD bonds (based on the adjusted nominal value) in an amount equal to the difference between NIS 2.45 and the exercise price of the warrants and be entitled to the Clal payment; or (b) to receive a payment determined by an independent appraiser. (iv) Dolphin compromised that would provide IDBD a total amount of NIS 515 million (the “Contribution to IDBD”), out of which it has already contributed NIS 15 million in February 2016 and NIS 85 million in March 2016. The amount injected to IDBD would be reduced by any capital contribution resulting from the exercise of warrants held by non-controlling shareholders (maximum amount of approximately NIS 37.5 million). The contribution to IDBD would further cover the IDBD Bonds necessary to comply with the transactions described above (between NIS 166.5 million and NIS 178 million), and the balance would be contributed until completing the amount committed by Dolphin either as a capital contribution or as a subordinated loan (between NIS 284.5 million and NIS 333.5 million). (v) Dolphin had to pledge 28% of its IDBD shares, as well as all rights held by Dolphin in relation to the subordinated loan granted in the amount of NIS 210 million in December 2015, until the payment obligation for Clal has been completed or has expired, after which the pledge will be discharged. Should new shares be issued by IDBD, Dolphin will have to pledge additional shares until completing the 28% of all IDBD share capital. This pledge supersedes the existing pledge on approximately 64 million shares of IDBD and all Dolphin’s rights in relation to the Subordinated Loan. (vi) Additionally, Dolphin agreed not to exercise its right to convert the subordinated loans into shares of IDBD until the pledge described above has been released. Should the pledge on subordinated loans be exercised by the Arrangement Trustees, then those trustees may convert the subordinated loans into shares; however, in such case, the maximum percentage of the IDBD capital that may be pledged is 35%, and any shares in excess of such amount will be released from the pledge. As a result of the description above, on March 31, 2016: (i) Dolphin acquired all shares from IDBD’ non-controlling shareholders (except for IFISAS), (ii) all warrants held by IDBD non-controlling shareholders expired, and (iii) Dolphin made additional contributions to IDBD via subordinated loans pursuant to the agreement. All commitments to invest in IDBD by Dolphin have been fully complied so that the only obligation still pending is the Clal payment, provided the conditions herein described are met. Additionally, Dolphin is bound to exercise its warrants in the event the following conditions occur jointly: (i) An agreement is reached to renegotiate the debt covenants of IDBD and its subsidiaries; (ii) Control over Clal is secured. Cresud Sociedad Anónima, Comercial, Inmobiliaria, Financiera y Agropecuaria Notes to the Consolidated Financial Statements(Continued) (All amounts in millions of Argentine Pesos, except otherwise indicated) 5. Acquisitions and disposals (Continued) Should both situations take place, the obligation would amount to NIS 391 million. The warrants mature on February 10, 2018. As of June 30, 2016, IRSA’s indirect interest in IDBD was 68.28% without considering dilution. The transaction described above represented the acquisition of an additional interest of 19.28% in IDBD for a total amount of Ps. 1,249. As a result of this transaction, the non-controlling interest was increased by Ps. 346 and the interest attributable to the shareholders’ of the controlling parents was increased by Ps. 234. B. Acquisition and disposal of investment properties During the fiscal year ended June 30, 2016, the Group has sold certain floors corresponding to Maipú 1300 Building, Intercontinental Plaza, all the floors corresponding to Dique IV and Isla Sirgadero, among others for a total amount of Ps. 1,393. All sales mentioned above led to a combined profit for the Group of Ps. 1,101, disclosed within the line “Gain from disposal of investment properties” in the statement of income. During the fiscal year ended June 30, 2015, the Group acquired five plots of farmlands in Luján for Ps. 210 and, through IRSA CP, a plot of land in Córdoba for Ps. 3.1. Additionally the Group has sold floors corresponding to Maipú 1300 building, Intercontinental Plaza, Bouchard 551, the entire Madison 183 building and parking spaces in Bouchard 551, Libertador 498 and Maipú 1300 for a total amount of Ps. 2,447. All sales mentioned above led to a combined profit for the Group of Ps. 1,150, disclosed within the line “Gain from disposal of investment properties” in the statement of income. During the fiscal year ended June 30, 2014, the Group acquired, through IRSA CP, a building next to Alto Palermo Shopping for US$ 3.8 million. Additionally the Group sold floors corresponding to Maipú 1300 building, Bouchard 551 and the entire buildings Mayo 589, Rivadavia 565, Costeros Dique IV Constitución 1159 and parking spaces in Maipú 1300, Bouchard 551 and Libertador 498 buildings for a total amount of Ps. 402. All sales mentioned above led to a combined profit for the Group of Ps. 231, disclosed within the line “Gain from disposal of investment properties” in the statement of income. C. Changes in non-controlling interest IRSA
During the fiscal year ended June 30, 2016, the Group sold a 0.93% interest in IRSA for a total amount of Ps. 86.4. This resulted in an increase in non-controlling interests of Ps. 20.6 and a increase in equity attributable to holders of the parent of Ps. 40.3, net of tax effect. Cresud Sociedad Anónima, Comercial, Inmobiliaria, Financiera y Agropecuaria Notes to the Consolidated Financial Statements(Continued) (All amounts in millions of Argentine Pesos, except otherwise indicated) 3. Acquisitions and disposals (Continued) During the fiscal year ended June 30, 2015, the Group sold a 1.81% interest in IRSA for a total amount of Ps. 181.8 million.181.8. This resulted in an increase in non-controlling interests of Ps. 33.7 million and a decreaseincrease in equity attributable to holdersowners of the parent of Ps. 97.7, million, net of tax effect. The effecteffects of disposals of the ownership interest of IRSA on shareholders’ equity of this change in the equity interest in IRSAattributable to owners of the Group is summarized as follows:
| | Ps. (million) | | Carrying amount of the non-controlling interests sold by the Group | | | (33.7 | ) | Consideration collected | | | 181.8 | | Tax effect | | | (50.4 | ) | Reserve recorded in shareholders’ equity | | | 97.7 | |
| | June 30, 2016 Ps. | | June 30, 2015 Ps. | | Carrying amount of the non-controlling interests sold by the Group | (20.6) | | (33.7) | | Consideration collected | 86.4 | | 181.8 | | Tax effect | (25.5) | | (50.4) | | Reserve recorded in equity | 40.3 | | 97.7 |
During the fiscal year ended June 30, 2015, the Group acquired a 0.65% interest in IRSA for a total amount of Ps. 50.7 million.50.7. This resulted in a decrease in non-controlling interests of Ps. 12.7 million and an increasedecrease in equity attributable to holders of the parent of Ps. 38.0 million,38, net of tax effect. The effect on shareholders’ equity of this change inacquisition of the ownership interest of IRSA on the equity interest in IRSAattributable to owners of the Group is summarized as follows:
| | | Ps. (million) | | Carrying amount of group´s interest acquired of | | | 12.7 | | Consideration paid for non-controlling interests | | | (50.7 | ) | Reserve recorded in shareholders’ equity | | | (38.0 | ) |
As a result of the transactions mentioned above, as of June 30, 2015, the equity interest in IRSA amounts to 64.30%, not considering effects of treasury stock.
Cresud Sociedad Anónima,
Comercial, Inmobiliaria, Financiera y Agropecuaria
Notes to Consolidated Financial Statements (Continued)
(All amounts in thousands of Argentine Pesos, except shares and per share data and as otherwise indicated)
3. | Acquisitions and disposals (Continued)
|
IRSA CP
During the fiscal year ended June 30, 2015 the Group, through IRSA, acquired an additional 0.10% interest in IRSA CP for a total amount of Ps. 5.7 million. This resulted in a decrease in non-controlling interests of Ps. 0.9 million and an increase in equity attributable to the holders of the parent of Ps. 4.7 million. As of June 30, 2015, IRSA's equity interest in IRSA CP amounts to 95.80%. The effect on shareholders’ equity of this change in the equity interest in IRSA CP is summarized as follows:
| | Ps. (million) | | | Carrying amount of group’s interest acquired of | | | 0.9 | 12.7 | | Consideration paid for non-controlling interests | | | (5.6 | )(50.7) | Reserve recorded in shareholders’ equity | | (i) (4.7) | (38.0) |
(i) | The reserve includes Ps. 1.6 million for non-controlling interest |
On June 10, 2014, the Board of Directors of IRSA resolved to finish the stock repurchase plan that was approved by resolution of the Board on July 25, 2013, and modified by resolutions adopted on September 18, 2013, October 15, 2013 and October 22, 2013. During the term of the Stock Repurchase Plan, IRSA has repurchased 4,904,697 shares for an aggregate amount of Ps. 37,905,631.
During Februaryyear 2015, the Group through its subsidiaries, contributed an amount of US$ 146 million in Dolphin. Such amount was also allocated to increase Dolphin’s investment in IDBD. This resulted in a decrease in non-controlling interests of Ps. 21.0 million21 and an increase in equity attributable to the holders of the parent.
| | Ps. (million) | | Carrying amount of non-controlling interest | | | 21.0 | | Consideration paid for non-controlling interests | | | - | | Reserve recorded in shareholders’ equity | | (i) 21.0 | |
(i) | The reserve includes Ps. 6.9 million for non-controlling interest |
Cresud Sociedad Anónima, Comercial, Inmobiliaria, Financiera y Agropecuaria Notes to the Consolidated Financial Statements(Continued) (All amounts in millions of Argentine Pesos, except otherwise indicated) 3. Acquisitions and disposals (Continued) Cresca On April 3, 2014, Cresca S.A. signed a bill of sale whereby it sells an area of 24,624 hectares located in Chaco Paraguayo. The total price was US$ 14.7 million (equivalents to Ps. 116.9), which amount shall be collectable as follows: US$ 1.8 million (equivalents to Ps. 14.3) were collected upon the execution of the bill of sale, US$ 4.3 million (equivalents to Ps. 34.2) upon execution of the conveyance deed; US$ 3.7 million (equivalents to Ps. 33.1) interest-free between April and July, 2015; and US$ 4.9 million (equivalents to Ps. 73.1) interest-free were collected in July, 2016, thus being canceled all the mortgage had been granted in guarantee price balance. Possession was delivered upon execution of the conveyance deed. The Group has recognized gains of Ps. 19.1 as result of this transaction. Cremaq On June 10, 2015, Brasilagro sold the remaining area of 27,745 hectares of Cremaq field, an establishment, located in the municipality of Baixa Grande do Ribeiro (Piaui). The transaction price was fixed at Rs. 270 million (equal to Ps. 694), which have already been fully collected, and Rs. 49.7 million (equal to Ps. 127.7) of which remain under “Restricted Assets” on condition that the public deed for 6,020 be registered and that an agreement for the termination of possessory actions related to a disputed fraction be notarized. The Group has recognized gains of Ps. 525.9 as result of this transaction. La Fon Fon II On October 17, 2013, Yuchán signed a purchase-sale agreement involving a sale subject to retention of title involving 1,643 hectares of "La Fon Fon II" for an overall amount of US$ 7.21 million (equivalents to Ps. 59). As of the balance sheet date, the amount of US$ 7.1 million (equivalents to Ps. 58.1) has been collected, and the remaining balance amounts to US$ 0.12 million (equivalents to Ps. 0.9) that will be cancelled in 2 installments, starting in December this year, and concluding in December 2017. Under the contract, the conveyance will be recorded with the Registry once the price has been fully paid off. On June 24, 2015, possession was granted by Yuchán. During the year 2015 the Group recognized a profit before tax of US$ 2.7 million (equivalents to Ps. 24.6) as result of this transaction. Araucária On June 27, 2014, Brasilagro sold a total area of 1,164 hectares of Araucaria field. The sale was priced at Rs. 32.5 million (Ps. 117.5). The Group recorded a profit before tax on the sale of the Araucaria farmland for an amount of Rs. 21.0 million (or Ps. 75.8). Cresud Sociedad Anónima, Comercial, Inmobiliaria, Financiera y Agropecuaria Notes to the Consolidated Financial Statements(Continued) (All amounts in millions of Argentine Pesos, except otherwise indicated) 3. Acquisitions and disposals (Continued) San Cayetano On May 27, 2014, Ombú signed a purchase-sale agreement involving a sale subject to retention of title involving 883 hectares of "San Cayetano I" establishment for an overall amount of US$ 4.2 million (equivalents to Ps. 31). On June 20, 2016, an Agreement was signed to modify a Purchase-Sale Private Deed with Reserve of Property Rights where the precise area of the property has been determined to cover 855,3213; the parties have agreed to adjust the sale price of the property by deduction US$ 0.1 million (Ps. 1.4) from the total price. The amount of US$ 3.2 million (Ps. 23.6) of the price has already been paid, and the balance will be paid in three installments, with the last installment being due upon execution of the title conveyance deed. Under the contract, the conveyance shall be recorded once the price has been fully collected off. Possession was granted upon execution of the contract. The Group recorded a gain of US$ 1.8 million (Ps.15.6) on the sale. E. Acquisition of additional interest in BHSA During the year ended June 30, 2015, the Group acquired 3,289,029 additional shares of BHSA in a total amount of Ps. 14.2, thus increasing its interest in such company from 29.77% to 29.99%, without consideration of treasury shares. During the year ended June 30, 2016, the Group sold 1,115,165 shares of BHSA in a total amount of Ps. 7.7, thus increasing its interest to 29.91%, without considering treasury shares. F. Disposal of financial assets During August 2014, IRSA has sold through its subsidiary, Real Estate Investment Group IV, the balance of 1 million shares in Hersha Hospitality Trust, at an average price of US$ 6.74 per share.
On February 5, 2014, the Group, through Ritelco, sold its interest in Bitania, 26 S.A., representing 49% of its capital stock, for an amount of US$ 4.2 million. Such transaction generated a net gain of approximately Ps. 13.3 million which are shown in the line "Other operating results, net" in the income statement.statement of income. Cresud Sociedad Anónima, Comercial, Inmobiliaria, Financiera y Agropecuaria
Notes to the Consolidated Financial Statements(Continued) (All amounts in thousandsmillions of Argentine Pesos, except shares and per share data and as otherwise indicated)
| Acquisitions and disposals (Continued)
|
Acquisitions and disposals (Continued)
H. BACS Banco de Crédito y Securitización S.A.
The Group through Tyrus, subscribed a purchase-sale agreement of shares of BACS, Banco de Crédito y Securitización S.A., representing an interest of 6.125%. The transaction amounts to US$ 1.35 million. This operation is yet to be approved by the Banco Central de la República Argentina,BCRA as of June 30, 2016, according to regulations in force. The advance payment related to this transaction is disclosed in “Trade and other receivables”. On August 24, 2016 the operation was approved by the BCRA.
The Group through IRSA, on June 17, 2015, subscribed Convertible Notes, issued by BACS Banco de Crédito y Securitización S.A. for a nominal value of 100,000,000, which are convertible into common stock.shares.
On June 21, 2016 we notified BACS on their right to convert all of the Convertible notes into common shares. As a consequence, BACS initiated the relevant diligence before the Argentine Central Bank in order to secure the authorization to issue the shares in our favor. I. Rigby capital reduction Capital reduction of Rigby 183 LLC
On October 17, 2014, Rigby 183 LLC reduced its capital stock by distributing among existing shareholders, proportionally to their shareholdings, the gain made on the sale of the Madison building. The total amount distributed is US$ 103.8 million, of which the Group received US$ 77.4 million (US$ 26.5 million through IRSA International and US$ 50.9 million through IMadison LLC) and US$ 26.4 million were distributed to other shareholders. As a result of such reduction, the Group has decided to reverse the corresponding accumulated currency translationconversion difference on a pro rata basis, which amounted to Ps. 188.3 million.188.3. This reversal has been recognized in the line “Other operating results, net" in the statement of income.
4. Financial risk management and fair value Year ended June 30, 2014
Sale of farmlands
On June 27, 2014, Brasilagro sold a total area of 1,164 hectares of Araucaria field.
The sale was valued at Rs. 32.5 million (or Ps.117.5 million). In July 2014Group's activities expose it to a variety of financial risk: market risk (including foreign currency risk, interest rate risk, indexing risk due to specific clauses and other price risk), credit risk, liquidity risk and capital risk. Within the buyer made an initial paymentGroup, risk management functions are conducted in relation to financial risks associated to financial instruments to which the Group is exposed during a certain period or as of Rs. 4.5 milliona specific date. The general risk management policies of the Group and remaining balance will be collected in five annual installments. The first installmentseek both to minimize adverse potential effects on the financial performance of Rs. 4.5 million was collected in November 2014the Group and to manage and control the second installment, of Rs. 6.9 million, in June 2015.financial risks effectively. The Group recorded a profit before taxuses financial instruments to hedge certain risk exposures when deemed appropriate based on the sale of the Araucaria farmland for an amount of Rs. 21.0 million (or Ps. 75.8 million).its internal management risk policies, as explained below. Cresud Sociedad Anónima, Comercial, Inmobiliaria, Financiera y Agropecuaria
Notes to the Consolidated Financial Statements(Continued) (All amounts in thousandsmillions of Argentine Pesos, except shares and per share data and as otherwise indicated) 4.
Financial risk management and fair value (Continued)
3. | Acquisitions and disposals (Continued)
|
Given the diversity of characteristics in the activities conducted under its business and operations center, the Group has decentralized the risk management policies based on two significant line of business: (i) agricultural business and (ii) urban properties and investments business, which is divided into two: (a) Argentina and (b) Israel, in order to identify and properly analyze the various types of risks to which each of the subsidiaries is exposed.
On May 27, 2014 Ombú Agropecuaria S.A. executed
4.1 Risk management in the Agricultural Business: The risks management function within the Group is carried out in respect of financial risks. Financial risks are risks arising from financial instruments to which the Group is exposed during or at the end of the reporting year. Financial risk comprises market risk (including foreign currency risk, interest rate risk and other price risk), credit risk, liquidity risk and capital risk. The Group’s diverse activities are exposed to a purchase-sale agreement involving a condition salevariety of real property covering 883 hectaresfinancial risks in the normal course of “San Cayetano I” for a total amountbusiness. The Group’s overall risk management program focuses on the unpredictability of US$ 4.2 million (equivalentsfinancial markets and seeks to Ps. 31.0 million). US$ 2.3 million have already been collected whereasminimize the balance shall be collectedGroup’s capital costs by using suitable means of financing and to manage and control the Group’s financial risks effectively. The Group uses financial instruments to hedge certain risk exposures when deemed appropriate based on its internal management risk policies. The Group’s principal financial instruments comprise cash and cash equivalents, receivables, payables, interest bearing assets and liabilities, other financial liabilities, other investments and derivative financial instruments. The Group manages its exposure to key financial risks in five consecutive semi-annual installments,accordance with the last falling due in November 2016. Under the contract, the conveyance shall be recorded once the priceGroup’s risk management policies. The Group’s management framework includes policies, procedures, limits and allowed types of derivative financial instruments. The Group has been fully collected off. Possession was granted upon executionestablished a Risk Committee, comprising Senior Management and a member of the contract. The Group recordedAudit Committee, which reviews and oversees management’s compliance with these policies, procedures and limits and has overall accountability for the identification and management of risk across the Group. This section provides a profit before taxdescription of US$ 1.8 million (Ps.15.6 million)the principal risks and uncertainties that could have a material adverse effect on the sale.Group’s strategy, performance, results of operations and financial condition. The risks and uncertainties, set out below, do not appear in any particular order of potential materiality or probability of occurrence.
Subscription of shares of Avenida Inc.
On August 29, 2013, the Group, through Torodur S.A., subscribed 3,703,704 shares of Avenida Inc., a Company incorporated in Delaware, United States, representing 24.79% of its outstanding capital. At that moment, this company had neither activity nor significant assets. Additionally, the Group acquired a warrant to increase such equity interest up to 37.04% of the company. The transaction price was Ps. 13 million, which were already paid in full. After acquisition, Avenida Inc. established a Company named "Avenida Compras S.A.", a Company incorporated in Argentina and engaged in e-commerce activity. Avenida Inc. owns 100% of Avenida Compras S.A..
Stock call option Agreement for the shares of Arcos del Gourmet S.A.
On September 16, 2013 IRSA CP entered into an agreement with Messrs. Eduardo Giana, Pablo Bossi and Patricio Tobal (non-controlling shareholders of Arcos del Gourmet S.A.), whereby the latter grant to IRSA CP an exclusive and irrevocable option to purchase 10% of the equity interest of Arcos del Gourmet S.A., which can be executed up to December 31, 2018. In the event the option is exercised, IRSA CP should pay the amount of US$ 8.0 million.
Furthermore, in the mentioned agreement a fixed amount of US$ 2.0 million was arranged, which was cancelled, and another variable amount to be paid on a monthly basis, that results from applying a 4.5% on the amounts accrued on each prior calendar month as rental and admission fees, net of certain expenses, during 5 years from the opening of the shopping mall, in relation to the assignment of rights to collect dividends of Arcos during such period.
Cresud Sociedad Anónima, Comercial, Inmobiliaria, Financiera y Agropecuaria
Notes to the Consolidated Financial Statements(Continued) (All amounts in thousandsmillions of Argentine Pesos, except shares and per share data and as otherwise indicated) 4.
Financial risk management and fair value (Continued)
3. | Acquisitions and disposals (Continued)
|
4.1 Risk management in the Agricultural Business (Continued)
Acquisition
(a) Market risk management Market risk is the risk that the fair value or future cash flows of common sharesa financial instrument will fluctuate because of Condor Hospitality Trust Inc. (formerly Supertel Hospitality, Inc. duechanges in market prices. The Group’s market risks arise from open positions in foreign currencies, interest-bearing assets and liabilities, commodity price risk and equity securities price risks, to change of corporate name) (“Condor”)
On January 9, 2014, the Group, through its subsidiary, Real Estate Strategies L.P. (“RES”), granted a loanextent that these are exposed to Condor for an amount of US$ 2.0 million. This loan included a conversion option whereby RES was allowedgeneral and specific market movements. Management sets limits on the exposure to apply the aggregate amount of the loan to purchase common shares of Condor under a “Subscription Rights Offering” or convert the loan directly into common shares of Condor. Additionally, from February 2012, the Group holds two financial instruments in Condor, preferred shares and warrants,these risks that may be accepted, which are still heldmonitored on the balance sheet date. On June 6, 2014, under the "Subscription Rights Offering", RES exerciseda regular basis.
Foreign exchange risk and associated derivative financial instruments: The Group publishes its conversion right to acquire 1,250,000 common shares at US$ 1.60 per share.consolidated financial statements in Argentine pesos but conducts operations and holds positions in other currencies. As a result, of this acquisition, the Group –is exposed to foreign currency exchange risk through RES – acquired a 26.9% equity interest in Condor.
The fairexchange rate movements, which affect the value of the Group’s investmentforeign currency positions. Foreign exchange risk arises when future commercial transactions or recognized assets or liabilities are denominated in Condor was baseda currency that is not the entity’s functional currency.
The commercial and/or agro-industrial activities of the Group's subsidiaries are primarily developed in Argentina and have as functional currency the Argentine Peso. The agricultural activities of the Group’s subsidiaries are primarily developed in Argentina, Brazil and Bolivia, where the functional currencies are the respective local currencies. An important part of the business activities of these subsidiaries is conducted in such local currencies, thus not exposing the Group to foreign exchange risk. Net financial position exposure to the functional currencies is managed on a case-by-case basis, partly by entering into foreign currency derivative instruments and/or by borrowing in foreign currencies, or other methods, considered adequate by the fair valueManagement, according to circumstances. Financial instruments are considered sensitive to foreign exchange rates only when they are not in the functional currency of the entity that holds them. The following table shows the net carrying amounts of its net assets. Condor´s main assets consist of 65 hotelsfinancial instruments denominated in United States operatedUS$, broken down by various hotel chains. The Group has allocatedfunctional currency in which the price paid at the fair value of net assets acquired based on the information available on the balance sheet date. Such fair value amounted to Ps. 31.5 million, resulting in a gain on the acquisition of Ps. 15.4 million, which has been recognized under “Share of loss of associates and joint ventures” in the income statementsCompany operates, for the fiscal yearyears ended June 30, 2014.
Significant sale of investment properties
On November 15, 2013 IRSA signed2016 and 2015. The amounts are presented in Argentine Pesos, the transfer deed for the salepresentation currency of the 12th floor and two parking units of the Maipú 1300 Building and two parking units of the Libertador 498 Building. The price of the transaction was Ps. 9.0 million (US$ 1.5 million). Such transaction generated a profit before tax of approximately Ps. 7.2 million.Group:
On January 14, 2014, IRSA signed the transfer deed for the sale of the 11th floor and seven parking units of the Maipú 1300 Building. The total price of the transaction was Ps. 9.6 million (US$ 1.4 million). Such transaction generated a profit before tax of approximately Ps. 7.6 million.| | | Net monetary position (Liability)/Asset (in million) | | Net monetary position (Liability)/Asset (in million) | | | | June 30, 2016 | | June 30, 2015 | | Functional currency | | US$ | | US$ | | Argentine Peso | | (3,303) | | (1,618) | | Brazilian Reais | | 268 | | 153 | | Bolivian Peso | | (127) | | (107) | | Total | | (3,162) | | (1,572) |
On January 24, 2014, IRSA signed the transfer deed for the sale of the 7th floor and 28 parking units of the Bouchard 551 Building. The total price of the transaction was Ps. 124.6 million equivalents to US$ 16.0 million. Such transaction generated a profit before tax of approximately Ps. 98.8 million.
Cresud Sociedad Anónima, Comercial, Inmobiliaria, Financiera y Agropecuaria
Notes to the Consolidated Financial Statements(Continued) (All amounts in thousandsmillions of Argentine Pesos, except shares and per share data and as otherwise indicated) 4.
Financial risk management and fair value (Continued)
3. | Acquisitions and disposals (Continued)
|
4.1 Risk management in the Agricultural Business (Continued)
On April 1, 2014, IRSA signed
The Group estimates that, other factors being constant, a 10% appreciation of the transfer deedUS dollar against the respective functional currencies at year-end would result in an additional loss before income tax for the saleyear ended June 30, 2016 and 2015 for an amount of Ps. 316 and Ps. 157, respectively. A 10% depreciation of the 5thUS dollar against the functional currencies would have an equal and 6th floor and complementary units inopposite effect on the Costeros Dique IV Building. The total price of the transaction was Ps. 12.4 million (US$ 1.5 million). Such transaction generated a profit before tax of approximately Ps. 10.3 million.
On April 7, 2014, IRSA signed the transfer deed for the sale of the 21th and 22th floors and two parking units of the Maipú 1300 Building and four parking units of the Libertador 498 Building. The price of the transaction was Ps. 24.1 million (US$ 3.0 million). Such transaction generated a profit before tax of approximately Ps. 19.6 million.
On April 10, 2014, IRSA signed the transfer deed for the sale of the 2nd floor of the Avenida de Mayo 589 Building and ten parking units of the Rivadavia 565 Building. The total price of the transaction was Ps. 24.2 million (US$ 3.0 million). Such transaction generated a profit before tax of approximately Ps. 19.9 million.
On May 6, 2014, IRSA signed the transfer deed for the sale of the Constitución 1159 Building. The price of the transaction was Ps. 23.3 million (US$ 2.9 million). Such transaction generated a profit before tax of approximately Ps. 13.4 million.
On May 14, 2014, IRSA signed the transfer deed for the sale to Transportadora de Caudales Juncadella of the unit 449 of the 8th floor of the Bouchard 551 Building. The price of the transaction was Ps. 61.8 million (US$ 7.7 million). Such transaction generated a profit before tax of approximately Ps. 49.2 million.
On May 19, 2014, IRSA signed the transfer deed for the sale to Inco Sociedad Anónima de Inversión, Industria y Comercio of the unit 1 of the ground floor of the Maipú 1300 Building. The price of the transaction was Ps. 6.5 million (US$ 0.8 million). Such transaction generated a profit before tax of approximately Ps. 5.2 million.
The properties mentioned above were classified as investment properties until the above mentioned transactions were executed, which represents a gross lease area of approximately 10,816 m2.
All sales of the year led to a combined profit for the Group of Ps. 230.9 million, disclosed within the line “Gain from disposal of investment properties” in the statementstatements of income.
On May 22, 2014 IRSA CP acquired commercial premises with an areathe other hand, the Group also uses derivative instruments, such as forward foreign exchange contracts to manage its exposure to foreign exchange risk. As of 40 m2, next to our shopping Alto Palermo, located onJune 30, 2016 the ground floor of the building located in Av. Santa Fe 3255/57/59 inGroup has future exchanges contract pending for an amount of US$ 3.8 million.Ps. 25 (asset) and Ps. 31 (liability). As of June 30, 2015 there were future exchanges contract pending for an amount of Ps. 10 (liability). Interest rate risk: The Group is exposed to interest rate risk on its investments in debt instruments, short-term and long-term borrowings and derivative financial instruments. The primary objective of the Group’s investment activities is to preserve principal while at the same time maximizing yields without significantly increasing risk. To achieve this objective, the Group diversifies its portfolio in accordance with the limits set by the Group. The Group maintains a portfolio of cash equivalents and short-term investments in a variety of securities, including both government and corporate obligations and money market funds. The Group’s interest rate risk principally arises from long-term borrowings (Note 23). Borrowings issued at variable rates expose the Group to cash flow interest rate risk. Borrowings issued at fixed rates expose the Group to fair value interest rate risk. The Group manages this risk by maintaining an appropriate mix between fixed and floating rate interest bearing liabilities. These activities are evaluated regularly to determine that the Group is not exposed to interest rate movements that could adversely impact its ability to meet its financial obligations and to comply with its borrowings covenants. The Group manages its cash flow interest rate risk exposure by different hedging instruments, including but not being limited to interest rate swap, depending on each particular case. For example, interest rate swaps have the economic effect of converting borrowings from floating rates to fixed rates or viceversa. Cresud Sociedad Anónima, Comercial, Inmobiliaria, Financiera y Agropecuaria
Notes to the Consolidated Financial Statements(Continued) (All amounts in thousandsmillions of Argentine Pesos, except shares and per share data and as otherwise indicated)
4. 3. AcquisitionsFinancial risk management and disposals fair value(Continued)
Transactions4.1 Risk management in the Agricultural Business (Continued)
The interest rate risk policy is approved by the Board of Directors. Management analyses the Group’s interest rate exposure on a dynamic basis. Various scenarios are simulated, taking into consideration refinancing, renewal of existing positions and alternative financing sources. Based on these scenarios, the Group calculates the impact on profit and loss of a defined interest rate shift. The scenarios are run only for liabilities that represent the major interest-bearing positions. Trade payables are normally interest-free and have settlement dates within one year. The simulation is done on a regular basis to verify that the maximum potential loss is within the limits set by management. Note 23 shows a breakdown of the Group’s fixed-rate and floating-rate borrowings per currency denomination and functional currency of the subsidiary issuing the loans for the years ended June 30, 2016 and 2015. The Group estimates that, other factors being constant, a 1% increase in floating rates at year-end would decrease profit before income tax for the years ended June 30, 2016 and 2015, in Ps. 70 and Ps. 14. A 1% decrease in floating rates would have an equal and opposite effect on the income statements. This sensitivity analysis provides only a limited, point-in-time view of this market risk sensitivity of certain of the Group’s financial instruments. The actual impact of the interest rate changes on the Group’s financial instruments may differ significantly from the impact shown in the sensitivity analysis. Commodity price risk and associated derivative financial instruments: The Group’s agricultural activities expose it to specific financial risks related to commodity prices. Prices for commodities have historically been cyclical, reflecting overall economic conditions and changes in capacity within the industry, which affect the profitability of entities engaged in the agricultural industry. Generally, the Group uses derivative instruments to hedge risks arising out of its agricultural business operations. The Group uses a variety of commodity-based derivative instruments to manage exposure to price volatility stemming from its integrated crop production activities. These instruments consist mainly of crop forwards, future contracts and put and call option contracts. Contract positions are designed to ensure that the Group will receive a defined minimum price for certain quantities of its production. The Group combines option contracts with future contracts only as a means of reducing the exposure towards the decrease in commodity prices, as being a producer means that the price is uncertain until the time the products are harvested and sold. The Group manages maximum and minimum prices for each commodity and the idea is to choose the best spot price at which to sell. Cresud Sociedad Anónima, Comercial, Inmobiliaria, Financiera y Agropecuaria Notes to the Consolidated Financial Statements(Continued) (All amounts in millions of Argentine Pesos, except otherwise indicated) 4. Financial risk management and fair value (Continued) 4.1 Risk management in the Agricultural Business (Continued) The Group generally covers up to 50% of its crop production in order to finance its operating costs. The hedge consists of taking positions on purchased puts or sold futures and calls that assure a fixed exit price. In the past, the Group has never kept a short position greater than its crop inventories and does not intend to. On the other hand, it is not the Group’s current intention to be exposed in a long derivative position in excess of its actual production. The following tables show the outstanding positions for each type of derivative contract for the years ended June 30, 2016 and 2015. The amounts are presented in thousands of Argentine Pesos. | | | June 30, 2016 | Type of derivative contract | | Tons | | Margin | | Premium paid or (collected) | | Derivatives at fair value | | Gain / (Loss) for valuation at fair value at year-end | | Futures: | | | | | | | | | | | | Sell | | | | | | | | | | | | Corn | | 30,500 | | - | | - | | 3 | | (4) | | Soybeans | | 94,271 | | 10 | | - | | (29) | | (15) | | Purchase | | | | | | | | | | | | Corn | | 11,100 | | - | | - | | (1) | | - | | Soybeans | | 2,300 | | - | | - | | - | | - | | Wheat | | 5,400 | | - | | - | | 1 | | - | | Options: | | | | | | | | | | | | Sell put | | | | | | | | | | | | Soybeans | | 12,247 | | - | | (1) | | - | | - | | Purchase put | | | | | | | | | | | | Soybeans | | 12,747 | | - | | 5 | | 3 | | (2) | | Sale call | | | | | | | | | | | | Soybeans | | 13,347 | | - | | (4) | | (7) | | (3) | | Wheat | | 2,900 | | - | | - | | - | | (1) | | Total | | 184,812 | | 10 | | - | | (30) | | (25) |
Cresud Sociedad Anónima, Comercial, Inmobiliaria, Financiera y Agropecuaria Notes to the Consolidated Financial Statements(Continued) (All amounts in millions of Argentine Pesos, except otherwise indicated) 4. Financial risk management and fair value (Continued) 4.1 Risk management in the Agricultural Business (Continued) | | | June 30, 2015 | Type of derivative contract | | Tons | | Margin | | Premium paid or (collected) | | Derivatives at fair value | | Gain / (Loss) for valuation at fair value at year-end | | Futures: | | | | | | | | | | | | Sell | | | | | | | | | | | | Corn | | 8,600 | | 1 | | - | | (1) | | (1) | | Soybeans | | 107,727 | | 5 | | - | | (10) | | (4) | | Wheat | | 7,000 | | - | | - | | - | | - | | Purchase | | | | | | | | | | | | Corn | | 1,400 | | - | | - | | - | | - | | Soybeans | | 2,200 | | - | | - | | - | | - | | Wheat | | 1,000 | | 1 | | - | | - | | (1) | | Options: | | | | | | | | | | | | Sell put | | | | | | | | | | | | Soybeans | | 9,952 | | (1) | | - | | (1) | | (1) | | Purchase put | | | | | | | | | | | | Soybeans | | 20,412 | | - | | 3 | | 1 | | (2) | | Sale call | | | | | | | | | | | | Soybeans | | 44,124 | | - | | (3) | | (7) | | (4) | | Total | | 202,415 | | 6 | | - | | (18) | | (13) |
| | | June 30, 2014 | Type of derivative contract | | Tons | | Margin | | Premium paid or (collected) | | Derivatives at fair value | | Gain / (Loss) for valuation at fair value at year-end | | Futures: | | | | | | | | | | | | Sell | | | | | | | | | | | | Corn | | 20,225 | | 1 | | - | | 1 | | 1 | | Soybeans | | 197,428 | | 1 | | - | | 3 | | 1 | | Wheat | | 1,100 | | - | | - | | - | | - | | Purchase | | | | | | | | | | | | Corn | | 2,400 | | - | | - | | - | | - | | Soybeans | | 4,300 | | - | | - | | - | | - | | Wheat | | 1,700 | | - | | - | | - | | - | | Options: | | | | | | | | | | | | Sell put | | | | | | | | | | | | Soybeans | | 16,204 | | - | | - | | 1 | | 4 | | Total | | 243,357 | | 2 | | - | | 5 | | 6 |
Gains and losses on commodity-based derivative instruments were Ps. 77 (loss), Ps. 8 (gain) and Ps. 15 (loss) for the years ended June 30, 2016, 2015 and 2014, respectively. These gains and losses are included in “Other operating results, net” in the income statements. Cresud Sociedad Anónima, Comercial, Inmobiliaria, Financiera y Agropecuaria Notes to the Consolidated Financial Statements(Continued) (All amounts in millions of Argentine Pesos, except otherwise indicated) 4. Financial risk management and fair value (Continued) 4.1 Risk management in the Agricultural Business (Continued) Crops future contract fair values are computed with reference to quoted market prices on future exchanges. Other price risk (b) Credit risk management Credit risk refers to the risk that counterparty will default on its contractual obligations resulting in a financial loss to the Group. Credit limits have been established to ensure that the Group deals only with approved counterparties and that counterparty concentration risk is addressed and the risk of loss is mitigated. Counterparty exposure is measured as the aggregate of all obligations of any single legal entity or economic entity to the Group. The Group is subject to credit risk arising from deposits with banks and financial institutions, investments of surplus cash balances, the use of derivative financial instruments and from outstanding receivables. Credit risk is managed on a country-by-country basis. Each local entity is responsible for managing and analyzing the credit risk. The Group’s policy is to manage credit exposure to deposits, short-term investments and other financial instruments by maintaining diversified funding sources in various financial institutions. All the institutions that operate with the Group are well known because of their experience in the market and high quality credit. The Group places its cash and cash equivalents, investments, and other financial instruments with various high credit quality financial institutions, thus mitigating the amount of credit exposure to any one institution. The maximum exposure to credit risk is represented by the carrying amount of cash and cash equivalents and short-term investments in the statement of financial position. The Group’s primary objective for holding derivative financial instruments is to manage currency exchange rate risk and interest rate risk and commodities prices. The Group generally enters into derivative transactions with high-credit-quality counterparties and, by policy, limits the amount of credit exposure to each counter party. The amounts subject to credit risk related to derivative instruments are generally limited to the amounts, if any, by which counterparty’s obligations exceed the obligations that the Group has with that counterparty. The credit risk associated with derivative financial instruments is representing by the carrying value of the assets positions of these instruments. The Group’s policy is to manage credit risks associated with trade and other receivables within defined trading limits. All Group’s significant counterparties have internal trading limits. The Group’s customers are distinguished between those customers arising out of the investment and development properties activities of the Group from those arising out of its agricultural and agro-industrial operations. These two groups of customers are monitored separately due to their distinct characteristics. Cresud Sociedad Anónima, Comercial, Inmobiliaria, Financiera y Agropecuaria Notes to the Consolidated Financial Statements(Continued) (All amounts in millions of Argentine Pesos, except otherwise indicated) 4. Financial risk management and fair value (Continued) 4.1 Risk management in the Agricultural Business (Continued) Trade receivables from agriculture and agro-industrial activities are primarily derived from the sale of commodities, raw milk, cattle, and sugarcane; receivables from feed lot operations and raw meat products; receivables from the lease of farmland properties; receivables from the sale of farmland properties; and, other receivables from ancillary activities. Trade receivables from agriculture and agro-industrial activities represent 39% and 24% of the Group’s total trade receivables as of June 30, 2016 and 2015, respectively. In contrast with the investment and development properties activities of the Group, the Group’s agribusiness is conducted through several international subsidiaries. The Group has subsidiaries in Argentina, Brazil and Bolivia. However, Argentina and Brazil together concentrate more than 87% and 88% of the Group’s grain production for the years ended June 30, 2016 and 2015, respectively. For the years ended June 30, 2016 and 2015, the grain production in Bolivia has not been significant representing only 10% and 9% of the total Group’s crop sales, respectively. Each country has its own established market for the respective grain production. Generally, the entire country’s grain production is sold in the domestic market to well-known multinational exporters such as Molinos, Cargill or Bunge, and/or local exporters. Prices for grains are also generally based on the market prices quoted in the domestic markets which normally take as reference the prices in international grain exchanges such as the Chicago Board of Trade. For the years ended June 30, 2016 and 2015, 34% and 27% of sales of crops in Argentina and Brazil were sold to well-known exporters. The Group performs credit evaluations of its customers and generally does not require collateral. Although sales are highly concentrated, the Group does not believe that significant credit risk exists at the reporting period due to the high credit rating of these customers. The Group concentrates its cattle production in Argentina, where it is entirely sold in the domestic market. The main buyers are slaughterhouses and supermarkets and are well dispersed. Prices in the cattle market in Argentina are basically fixed by local supply and demand. The principal market is the Liniers Market in Buenos Aires, which provides a standard in price formation for the rest of the domestic markets. Live animals are sold by auction on a daily basis in the market, whereas prices are negotiated by kilogram of live weight and are mainly determined by local supply and demand. Some supermarkets and meat packers establish their prices by kilogram of processed meat. In these cases, processing yields influences the final price. Our cattle sales are diversified, we are and will continue to be significantly dependent on a number of third party relationships, mainly with our customers for crop and milk sales. During the fiscal year 2016, we sold our products to approximately 850 customers. Sales of agricultural products to our ten largest customers represented approximately 72% of our net sales for the fiscal year ended June 30, 2016. During fiscal year 2016, our biggest three customers were Bunge Argentina S. A., Cargill S.A.C.I. and Vicentin S.A.I.C. which represented, in the aggregate, approximately 31% of our net sales in agricultural products, while the remaining seven customers in the aggregate represented approximately 41% of our net sales in the fiscal year 2016. Cresud Sociedad Anónima, Comercial, Inmobiliaria, Financiera y Agropecuaria Notes to the Consolidated Financial Statements(Continued) (All amounts in millions of Argentine Pesos, except otherwise indicated) 4. Financial risk management and fair value (Continued) 4.1 Risk management in the Agricultural Business (Continued) The Group’s milk production is also based in Argentina. The Group has historically sold its entire milk production to Mastellone Hnos. S.A., which is the largest dairy company in Argentina. Sales to Mastellone amounted to Ps. 65.0 and Ps. 71.9 for the years ended June 30, 2016 and 2015, respectively, representing 2% and 3% of the Group’s agricultural consolidated revenue for those years, respectively, and 0.2% and 1% of the Group’s total revenues in the respective years. Although sales are concentrated, the Group does not believe that significant credit risk exists at the reporting period due to the high credit rating of Mastellone. As milk is a perishable product there is no ability for the Group to mitigate pricing risk through inventory management. The Group negotiates the prices of raw milk on a monthly basis in accordance with domestic supply and demand. Prices for milk are based on a large number of factors including fat and protein content, bacteria levels and temperature. However, dairy prices have historically tended to have reasonable correlation with prices of agricultural inputs such as feed and fertilizer, and the Group monitors these relationships in order to adapt its tactics to suit. The Group’s sugarcane production is based in Brazil and to a lesser extent in Bolivia. Brazil concentrates more than 92% and 96% of the Group's total sugarcane production as of June 30, 2016 and 2015, respectively. Currently, the Group has a farm in Brazil dedicated to sugar production and the entire output is sold to a third-party, ETHB, under an exclusive agreement dated March 2008. ETHB is the largest ethanol producer in Brazil. Under the agreement, ETHB is contractually obligated to purchase the entire production of two crop cycles of sugarcane comprising six agricultural years with five cuts, with the possibility of extending them for another full agricultural cycle upon prior agreement of the parties. The duration of each cycle may be extended if the parties wish to do so. Currently, the Group is selling to ETHB at market price. Sales to ETHB amounted to Ps. 256 and Ps. 178 for the years ended June 30, 2016 and 2015, respectively, representing 9% and 8% of the Group’s agricultural consolidated revenue for those years, respectively. Although sales are concentrated, the Group does not believe that significant credit risk exists at the reporting period due to the high credit rating of ETHB. The management does not expect any significant losses resulting from the non-performance by these counterparties. The maximum exposure to Group’s credit risk is represented by the carrying amount of each financial asset in the statement of financial position after deducting any impairment allowance. The Group’s overall exposure of credit risk arising from trade receivables is set out in Note 17. Cresud Sociedad Anónima, Comercial, Inmobiliaria, Financiera y Agropecuaria Notes to the Consolidated Financial Statements(Continued) (All amounts in millions of Argentine Pesos, except otherwise indicated) 4. Financial risk management and fair value (Continued) 4.1 Risk management in the Agricultural Business (Continued) (c) Liquidity risk management The Group is exposed to liquidity risks, including risks associated with refinancing borrowings as they mature, the risk that borrowing facilities are not available to meet cash requirements, and the risk that financial assets cannot readily be converted to cash without loss of value. Failure to manage liquidity risks could have a material impact on the Group’s cash flow and statements of financial position. Prudent liquidity risk management implies maintaining sufficient cash, the availability of funding through an adequate amount of committed credit facilities and the ability to close out market positions. Due to the dynamic nature of the underlying businesses, the Group aims to maintain flexibility in funding its existing and prospective debt requirements by maintaining diversified funding sources. The Group monitors its current and projected financial position using several key internally generated reports: cash flow; debt maturity; and interest rate exposure. The Group also undertakes sensitivity analysis to assess the impact of proposed transactions, movements in interest rates and changes in property values on the key profitability, liquidity and balance sheet ratios. The Group’s debt and derivative positions are continually reviewed to meet current and expected debt requirements. The Group maintains a balance between longer-term and shorter-term financings. Short-term financing is principally raised through bank facilities and overdraft positions. Medium- to longer-term financing comprises public and private bond issues, including private placements. Financing risk is spread by using a variety of types of debt. The maturity profile is managed in accordance with Group’s needs, by spreading the repayment dates and extending facilities, as appropriate. The tables below show financial liabilities, including Group’s derivative financial liabilities groupings based on the remaining period at the statement of financial position to the contractual maturity date. The amounts disclosed in the tables are the contractual undiscounted cash flows and as a result, they do not reconcile to the amounts disclosed on the statement of financial position. However, undiscounted cash flows in respect of balances due within 12 months generally equal their carrying amounts in the statement of financial position, as the impact of discounting is not significant. The tables include both interest and principal flows. Cresud Sociedad Anónima, Comercial, Inmobiliaria, Financiera y Agropecuaria Notes to the Consolidated Financial Statements(Continued) (All amounts in millions of Argentine Pesos, except otherwise indicated) 4. Financial risk management and fair value (Continued) 4.1 Risk management in the Agricultural Business (Continued) When the interest payable is not fixed, the amount disclosed has been determined by reference to the existing conditions at the reporting date. | As of June 30, 2016 | Less than 1 year | Between 1 and 2 years | Between 2 and 3 years | Between 3 and 4 years | More than 4 years | Total | | Trade and other payables | 614 | - | - | - | - | 614 | | Borrowings (Excluding finance lease liabilities) | 1,028 | 1,271 | 1,604 | 250 | 45 | 4,198 | | Finance lease obligations | 9 | 6 | 6 | - | - | 21 | | Derivative financial instruments | 36 | 16 | - | - | - | 52 | | Total | 1,687 | 1,293 | 1,610 | 250 | 45 | 4,885 |
| As of June 30, 2015 | Less than 1 year | Between 1 and 2 years | Between 2 and 3 years | Between 3 and 4 years | More than 4 years | Total | | Trade and other payables | 391 | - | 2 | 2 | - | 395 | | Borrowings (Excluding finance lease liabilities) | 1,342 | 474 | 699 | 575 | 608 | 3,698 | | Finance lease obligations | 11 | 7 | 3 | 3 | - | 24 | | Derivative financial instruments | 33 | 5 | - | - | - | 38 | | Total | 1,777 | 486 | 704 | 580 | 608 | 4,155 |
(d) Capital risk management The capital structure of the Group consists of equity and net borrowings. The type and maturity of the Group’s borrowings are analyzed further in Note 23. The Group’s equity is analyzed into its various components in the statements of changes in equity. Capital is managed so as to promote the long-term success of the business and to maintain sustainable returns for shareholders. The Group seeks to manage its capital requirements to maximize value through the mix of debt and equity funding, while ensuring that Group entities continue to operate as going concerns, comply with applicable capital requirements and maintain strong credit ratings. The Group assesses the adequacy of its capital requirements, cost of capital and gearing (i.e. debt/equity mix) as part of its broader strategic plan. The Group continuously reviews its capital structure to ensure that (i) sufficient funds and financing facilities are available to implement the Group’s property development and business acquisition strategies, (ii) adequate financing facilities for unforeseen contingencies are maintained, and (iii) distributions to shareholders are maintained within the Group’s dividend distribution policy. The Group also protects its equity by taking out insurance. Cresud Sociedad Anónima, Comercial, Inmobiliaria, Financiera y Agropecuaria Notes to the Consolidated Financial Statements(Continued) (All amounts in millions of Argentine Pesos, except otherwise indicated) 4. Financial risk management and fair value (Continued) 4.1 Risk management in the Agricultural Business (Continued) The Group’s strategy is to maintain key financing metrics namely, net debt to total equity ratio (gearing) and loan-to value ratio (LTV) to ensure that asset level performance is translated into enhanced returns for shareholders whilst maintaining an appropriate risk reward balance to accommodate changing financial and operating market cycles. The following table details the key metrics in relation to managing its capital structure of the Group. The levels of these metrics are within the ranges established by the Group’s strategy. | | June 30, 2016 | | June 30, 2015 | | | | Gearing ratio (i) | 65.33% | | 56.63% | | LTV ratio (ii) | 56.44% | | 55.21% |
(i) Calculated as total debt over total capital (including equity plus total debt). (ii) Calculated as total debt over total property at fair value (including trading properties, properties, plant and equipment, investment properties, farmland rights to receive units under barter agreements). (e) Other non-financial risks Nature risk: The Group’s revenue arising from agricultural activities depends significantly on the ability to manage biological assets and agricultural produce. The ability to manage biological assets and agricultural produce may be affected by unfavorable local weather conditions and natural disasters. Weather conditions such as floods, droughts, hail, windstorms and natural disasters such as fire, disease, insect infestation and pests are examples of such unpredictable events. The Group manages this risk by locating its farmlands in different geographical areas. The Group has not taken out insurance for this kind of risks. The occurrence of severe weather conditions or natural disasters may affect the growth of our biological assets, which in turn may have a material adverse effect on the Group’s ability to harvest agricultural produce in sufficient quantities and in a timely way. Cresud Sociedad Anónima, Comercial, Inmobiliaria, Financiera y Agropecuaria Notes to the Consolidated Financial Statements(Continued) (All amounts in millions of Argentine Pesos, except otherwise indicated) 4. Financial risk management and fair value (Continued) 4.2 Risk management in the Urban Properties and investment business in Argentina: The risk management function within the Group is carried out in respect of financial risks. Financial risks are risks arising from financial instruments to which the Group is exposed during or at the end of the reporting period. Financial risk comprises market risk (including foreign currency risk, interest rate risk and other price risk), credit risk, liquidity risk and capital risk. The Group’s diverse activities are exposed to a variety of financial risks in the normal course of business. The Group’s overall risk management program focuses on the unpredictability of financial markets and seeks to minimize the Group’s capital costs by using suitable means of financing and to manage and control the Group’s financial risks effectively. The Group uses financial instruments to hedge certain risk exposures when deemed appropriate based on its internal management risk policies. The Group’s principal financial instruments comprise cash and cash equivalents, receivables, payables, interest bearing assets and liabilities, other financial liabilities, other investments and derivative financial instruments. The Group manages its exposure to key financial risks in accordance with the Group’s risk management policies. The Group’s management framework includes policies, procedures, limits and allowed types of derivative financial instruments. The Group has established a Risk Committee which was detailed in note 4.1. This section provides a description of the principal risks that could have a material adverse effect on the Group’s strategy, performance, results of operations and financial condition. The risks facing the businesses, set out below, do not appear in any particular order of potential materiality or probability of occurrence. The analysis of sensitivities to market risks included below are based on a change in one factor while holding all other factors constant. In practice this is unlikely to occur, and changes in some of the factors may be correlated – for example, changes in interest rate and changes in foreign currency rates. This sensitivity analysis provides only a limited, point-in-time view. The actual impact on the Group’s financial instruments may differ significantly from the impact shown in the sensitivity analysis. (f) Market risk management The market risk is the risk of changes in the market price of financial instruments with whom the Group operates. The Group’s market risks arise from open positions in foreign currencies, interest-bearing assets and liabilities and equity securities of certain entities, to the extent that these are exposed to market value movements. Management sets limits on the exposure to these risks that may be accepted, which are monitored on a regular basis. Cresud Sociedad Anónima, Comercial, Inmobiliaria, Financiera y Agropecuaria Notes to the Consolidated Financial Statements(Continued) (All amounts in millions of Argentine Pesos, except otherwise indicated) 4. Financial risk management and fair value (Continued) 4.2 Risk management in the Urban Properties and investment business in Argentina (Continued) Foreign exchange risk and associated derivative financial instruments As mentioned in note 4.1, the Group publishes its consolidated financial statements in Argentine pesos but conducts operations and holds positions in other currencies. As a result, the Group is exposed to foreign currency exchange risk through exchange rate movements, which affect the value of the Group’s foreign currency positions. Foreign exchange risk arises when future commercial transactions or recognized assets or liabilities are denominated in a currency that is not the entity’s functional currency. The real estate, commercial and/or financial activities of the Group's subsidiaries in the operations center in Argentina have as functional currency the Argentine Peso. A significant majority of the activity of these subsidiaries is conducted in such local currency, thus not exposing the Group to foreign exchange risk. Other Group's subsidiaries have other functional currencies, principally US dollar. In the ordinary course of business, the Group, through its subsidiaries, transacts in currencies other than the respective functional currencies of the subsidiaries. These transactions are primarily denominated in US dollars and New Israeli Shekel. Net financial position exposure to the functional currencies is managed on a case-by-case basis, partly by entering into foreign currency derivative instruments and/or by borrowing in foreign currencies, or other methods, considered adequate by the Management, according to circumstances. Financial instruments are considered sensitive to foreign exchange rates when they are not in the functional currency of the entity that holds them. The following table shows the net carrying amounts of the Company’s financial instruments nominated in US$ and NIS broken down by functional currency in which the Company operates, for the years ended June 30, 2016 and 2015. The amounts are presented in Argentine Pesos, the presentation currency of the Group: | | Net monetary position (Liability)/Asset | | Functional currency | June 30, 2016 | June 30, 2015 | | | US$ | NIS | US$ | NIS | | Argentine Peso | (5,370) | - | (2,576) | - | | Uruguayan Peso | 6 | - | (67) | - | | US Dollar | - | (7) | - | (245) | | Total | (5,364) | (7) | (2,643) | (245) |
The Group estimates that, other factors being constant, a 10% appreciation of the US dollar against the respective functional currencies at year-end would increase loss before income tax for the year ended June 30, 2016 for an amount of Ps. 536. A 10% depreciation of the US dollar against the functional currencies would have an equal and opposite effect on the income statements. Cresud Sociedad Anónima, Comercial, Inmobiliaria, Financiera y Agropecuaria Notes to the Consolidated Financial Statements(Continued) (All amounts in millions of Argentine Pesos, except otherwise indicated) 4. Financial risk management and fair value (Continued) 4.2 Risk management in the Urban Properties and investment business in Argentina (Continued) On the other hand, the Group in its operations center Argentina, also uses derivative instruments, such as forward foreign exchange contracts to manage its exposure to foreign exchange risk. As of June 30, 2016 there are exchanges contract pending for an amount of US$ 21 million. Net book value of contracts amounts to Ps. (3). Interest rate risk As explained in note 4.1, the Group is exposed to interest rate risk on its investments in debt instruments, short-term and long-term borrowings and derivative financial instruments. The Note 23 shows a breakdown of the Group’s fixed-rate and floating-rate borrowings per currency denomination and functional currency of the subsidiary issuing the loans for the years ended June 30, 2016 and 2015. The Group estimates that, other factors being constant, a 1% increase in floating rates at year-end would increase net loss before income tax for the year ended June 30, 2016, in Ps. 13.7. A 1 % decrease in floating rates would have an equal and opposite effect on the income statement. Other price risk The Group is exposed to equity securities price risk because of investments held in entities that are publicly traded, which are classified on the consolidated statement of financial position at “fair value through profit or loss”. The Group regularly reviews the prices evolution of these equity securities in order to identify significant movements. As of June 30, 2016 and 2015 the total value of Group´s investments in shares and derivative financial instruments of public companies, in the operations center Argentina, amounts to Ps. 822 and Ps. 1,803, respectively. The Group estimates that, other factors being constant, a 10% decrease in quoted prices of equity securities and in derivative financial instruments portfolio at year-end would generate a loss before income tax for the year ended June 30, 2016 of Ps. 82. An increase of 10% on these prices would have an equal and opposite effect in the statement of income. Cresud Sociedad Anónima, Comercial, Inmobiliaria, Financiera y Agropecuaria Notes to the Consolidated Financial Statements(Continued) (All amounts in millions of Argentine Pesos, except otherwise indicated) 4. Financial risk management and fair value (Continued) 4.2 Risk management in the Urban Properties and investment business in Argentina (Continued) (g) Credit risk management The credit risk arises from the potential non-performance of contractual obligations by the parties, with a resulting financial loss for the Group. Credit limits have been established to ensure that the Group deals only with approved counterparties and that counterparty concentration risk is addressed and the risk of loss is mitigated. Counterparty exposure is measured as the aggregate of all obligations of any single legal entity or economic entity to the Group. The Group is subject to credit risk arising from deposits with banks and financial institutions, investments of surplus cash balances, the use of derivative financial instruments and from outstanding receivables. Credit risk is managed on a country-by-country basis. Each local entity is responsible for managing and analyzing the credit risk. The Group’s policy is to manage credit exposure to deposits, short-term investments and other financial instruments by maintaining diversified funding sources in various financial institutions. All the institutions that operate with the Group are well known because of their experience in the market and high quality credit. The Group places its cash and cash equivalents, investments, and other financial instruments with various high credit quality financial institutions, thus mitigating the amount of credit exposure to any one institution. The maximum exposure to credit risk is represented by the carrying amount of cash and cash equivalents and short-term investments in the statement of financial position. Trade receivables related to leases and services provided by the Group represent a diversified tenant base and account for 11% and 38% of the Group’s total trade receivables as of June 30, 2016 and 2015, respectively. The Group has specific policies to ensure that rental contracts are transacted with counterparties with appropriate credit quality. The majority of the Group’s shopping center, offices and other rental properties’ tenants are well recognized retailers, diversified companies, professional organizations, and others. Owing to the long-term nature and diversity of its tenancy arrangements, the credit risk of this type of trade receivables is considered to be low. Generally, the Group has not experienced any significant losses resulting from the non-performance of any counterpart to the lease contracts and, as a result, the allowance for doubtful account balance is low. Individual risk limits are set based on internal or external ratings in accordance with limits set by the Group. If customers are independently rated, these ratings are used. If there is no independent rating, risk control assesses the credit quality of the customer, taking into account its past experience, financial position, actual experience and other factors. Based on the Group’s analysis, the Group determines the size of the deposit that is required from the tenant at inception. Management does not expect any losses from non-performance by these counterparties. See Note 17 for details. Cresud Sociedad Anónima, Comercial, Inmobiliaria, Financiera y Agropecuaria Notes to the Consolidated Financial Statements(Continued) (All amounts in millions of Argentine Pesos, except otherwise indicated) 4. Financial risk management and fair value (Continued) 4.2 Risk management in the Urban Properties and investment business in Argentina (Continued) On the other hand, property receivables related to the sale of trading properties represent 0.3% and 17% of the Group’s total trade receivables as of June 30, 2016 and 2015, respectively. Payments on these receivables have generally been received when due. These receivables are generally secured by mortgages on the properties. Therefore, the credit risk on outstanding amounts is considered very low. (h) Liquidity risk management The Group is exposed to liquidity risks, including risks associated with refinancing borrowings as they mature, the risk that borrowing facilities are not available to meet cash requirements, and the risk that financial assets cannot readily be converted to cash without loss of value. Failure to manage liquidity risks could have a material impact on the Group’s cash flow and statement of financial position. Prudent liquidity risk management implies maintaining sufficient cash, the availability of funding through an adequate amount of committed credit facilities and the ability to close out market positions. Due to the dynamic nature of the underlying businesses, the Group aims to maintain flexibility in funding its existing and prospective debt requirements by maintaining diversified funding sources. The Group monitors its current and projected financial position using several key internally generated reports: cash flow; debt maturity; and interest rate exposure. The Group also undertakes sensitivity analysis to assess the impact of proposed transactions, movements in interest rates and changes in property values on the key profitability, liquidity and balance sheet ratios. The Group’s debt and derivative positions are continually reviewed to meet current and expected debt requirements. The Group maintains a balance between longer-term and shorter-term financings. Short-term financing is principally raised through bank facilities and overdraft positions. Medium to longer-term financing comprises public and private bond issues, including private placements. Financing risk is spread by using a variety of types of debt. The maturity profile is managed in accordance with Group’s needs, by spreading the repayment dates and extending facilities, as appropriate. The following tables show financial liabilities, including Group’s derivative financial liabilities groupings based on the remaining period at the statement of financial position to the contractual maturity date. The amounts disclosed in the tables are the contractual undiscounted cash flows and as a result, they do not reconcile to the amounts disclosed on the statement of financial position. However, undiscounted cash flows in respect of balances due within 12 months generally equal their carrying amounts in the statement of financial position, as the impact of discounting is not significant. The tables include both interest and principal flows. Cresud Sociedad Anónima, Comercial, Inmobiliaria, Financiera y Agropecuaria Notes to the Consolidated Financial Statements(Continued) (All amounts in millions of Argentine Pesos, except otherwise indicated) 4. Financial risk management and fair value (Continued) 4.2 Risk management in the Urban Properties and investment business in Argentina (Continued) Where the interest payable is not fixed, the amount disclosed has been determined by reference to the existing conditions at each reporting date. | As of June 30, 2016 | Less than 1 year | Between 1 and 2 years | Between 2 and 3 years | Between 3 and 4 years | More than 4 years | Total | | Trade and other payables | 627 | 204 | 1 | - | - | 832 | | Borrowings (Excluding finance lease liabilities) | 3,518 | 494 | 475 | 491 | 6,760 | 11,738 | | Finance lease obligations | 2 | 1 | 1 | - | - | 4 | | Derivative financial instruments | 3 | - | - | - | - | 3 | | Total | 4,150 | 699 | 477 | 491 | 6,760 | 12,577 |
| As of June 30, 2015 | Less than 1 year | Between 1 and 2 years | Between 2 and 3 years | Between 3 and 4 years | More than 4 years | Total | | Trade and other payables | 356 | 11 | 3 | - | - | 370 | | Borrowings (Excluding finance lease liabilities) | 883 | 2,822 | 32 | 143 | 1,510 | 5,390 | | Finance lease obligations | 2 | 1 | 1 | - | - | 4 | | Derivative financial instruments | 264 | 237 | - | - | - | 501 | | Total | 1,505 | 3,071 | 36 | 143 | 1,510 | 6,265 |
(i) Capital risk management The capital structure of the Group consists of shareholders’ equity and net borrowings. The type and maturity of the Group’s borrowings are analyzed further in Note 23. The Group’s equity is analyzed into its various components in the statement of changes in equity. Capital is managed so as to promote the long-term success of the business and to maintain sustainable returns for shareholders. The Group seeks to manage its capital requirements to maximize value through the mix of debt and equity funding, while ensuring that Group entities continue to operate as going concerns, comply with applicable capital requirements and maintain strong credit ratings. The Group assesses the adequacy of its capital requirements, cost of capital and gearing (i.e. debt/equity mix) as part of its broader strategic plan. The Group continuously reviews its capital structure to ensure that (i) sufficient funds and financing facilities are available to implement the Group’s property development and business acquisition strategies, (ii) adequate financing facilities for unforeseen contingencies are maintained, and (iii) distributions to shareholders are maintained within the Group’s dividend distribution policy. The Group also protects its equity in assets by taking out insurance. Cresud Sociedad Anónima, Comercial, Inmobiliaria, Financiera y Agropecuaria Notes to the Consolidated Financial Statements(Continued) (All amounts in millions of Argentine Pesos, except otherwise indicated) 4. Financial risk management and fair value (Continued) 4.2 Risk management in the Urban Properties and investment business in Argentina (Continued) The Group’s strategy is to maintain key financing metrics namely, net debt to total equity ratio (gearing) and loan-to-value ratio (LTV) to ensure that asset level performance is translated into enhanced returns for shareholders whilst maintaining an appropriate risk reward balance to accommodate changing financial and operating market cycles. The following table details the key metrics in relation to managing its capital structure of the Group. The levels of these metrics are within the ranges established by the Group’s strategy. | | June 30, 2016 | | June 30, 2015 | | Gearing ratio (i) | 89.24% | | 63.45% | | LTV ratio (ii) | 29.39% | | 20.42% |
(i) Calculated as total of current and non-current borrowings over total current and non-current borrowings plus equity of the parent company. (ii) Calculated as total current and non-current borrowings over total properties at fair value (including trading properties, property, plants and equipment, investment properties and rights to receive future units under barter agreements). Property risk There are several risks affecting the Group’s property investments. The composition of the Group’s property portfolio including asset concentration and lot size may affect liquidity and relative property performance. The Group has a large multi-asset portfolio and monitors its concentration and average lot size. A change in trends and economic conditions causes shifts in customer demands for properties and impacts on new lettings, renewal of existing leases and reduces rental growth. In addition, increases risk of tenant insolvencies. The Group conducts several actions to mitigate some of these risks whenever possible. The variety of asset types and geographical spread as well as a diversified tenant base, with monitoring of its concentration, helps mitigating these risks. Cresud Sociedad Anónima, Comercial, Inmobiliaria, Financiera y Agropecuaria Notes to the Consolidated Financial Statements(Continued) (All amounts in millions of Argentine Pesos, except otherwise indicated) 4. Financial risk management and fair value (Continued) 4.2 Risk management in the Urban Properties and investment business in Argentina (Continued) The development, administration and profitability of shopping centers are impacted by various factors including: the accessibility and the attractiveness of the area where the shopping center is located, the intrinsic attractiveness of them, the flow of people, the level of sales of each rental unit, the increasing competition from internet sales, the amount of rent collected from each rental unit and the fluctuations in occupancy levels. In the event that there is an increase in operational costs, caused by inflation or other factors, it could have a material adverse effect on the Group if its tenants are unable to pay their higher rent obligations due to the increase in expenses. Argentine Law No. 24,808 provides that tenants may rescind commercial lease agreements after the initial six months upon not less than sixty days written notice, subject to penalties of only one-and-a-half month rent if the tenant rescinds during the first year of the lease, and one-month rent if the tenant rescinds during the second year of the lease. The exercise of such rescission rights could materially and adversely affect the Group. Risks associated with development properties activities include the following: a) the potential abandonment of development opportunities; b) construction costs exceeding original estimates, possibly making a project uneconomical; c) occupancy rates and rents at newly completed projects may be insufficient to make the project profitable. On the other hand: a) the Group may not be able to obtain financing on favorable terms for the development of the project; b) construction and lease-up may not be completed on schedule, resulting in increased debt service expense and construction costs; c) the Group may not be able to obtain, or delay in obtaining, all necessary zoning, land-use, building, occupancy and other required governmental permits and authorizations; d) preconstruction buyers may default on their purchase contracts or units in new buildings may remain unsold upon completion of constructions; and e) prices for residential units may be insufficient to cover development cost. The Group also takes several actions to monitor these risks and respond appropriately whenever it is under its control. The Group has in-house property market research capability and development teams that monitor development risks closely. The Group generally adopts conservative assumptions on leasing and other variables and monitors the level of committed future capital expenditure on development programs relative to the level of undrawn facilities. The Group’s hotel properties face specific risks as well. The success of the Group’s hotel properties will depend, in large part, upon the Group’s ability to compete in areas such as access, location, quality of accommodations, room rate structure, quality and scope of food and beverage facilities and other services and amenities. The Group’s hotels may face additional competition if other companies decide to build new hotels or improve their existing hotels such that they are more attractive to potential guests. In addition, their profitability depends on (i) the Group’s ability to form successful relationships with international operators to run the hotels; (ii) changes in travel patterns, including seasonal changes; and (iii) taxes and governmental regulations which influence or determine wages, prices, interest rates, construction procedures and costs. Cresud Sociedad Anónima, Comercial, Inmobiliaria, Financiera y Agropecuaria Notes to the Consolidated Financial Statements(Continued) (All amounts in millions of Argentine Pesos, except otherwise indicated) 4. Financial risk management and fair value (Continued) 4.3 Risk management in the Urban Properties and investment business in Israel Given the diversity of the activities conducted by IDBD and its subsidiaries, and the resulting risks, IDBD manages the exposure to its own key financial risks and those of its wholly-owned subsidiaries (except for IDB Tourism) in conformity with a centralized risk management policy, with the non-wholly owned IDBD subsidiaries being responsible for establishing the risk policy, taking action to cover market risks and managing their activities in a decentralized fashion. Both IDBD as holding and each subsidiary are responsible for managing their own financial risks in accordance with agreed global guidelines. The Chief Financial Officers of each entity are responsible for managing the risk management policies and systems, the definition of hedging strategies, insofar as applicable and based on any restriction that may be apply as a result of financial liability, the supervision of its implementation and the answer to such restrictions. The management framework includes policies, procedures, limits and allowed types of derivative financial instruments. This section provides a description of the principal risks related to the operations center in Israel that could have a material adverse effect on the IDBD’s strategy, performance, results of operations and financial condition. The risks facing the businesses, set out below, do not appear in any particular order of potential materiality or probability of occurrence. (a)Market risk management Foreign currency risk Real estate, business and/or financial activities of IDBD subsidiaries in the operations center in Israel are developed mainly in Israeli currency, although some operations, mostly borrowing, are expressed in US’ dollars, thereby exposing IDBD to a foreign currency risk. Net financial position exposure to the functional currencies is managed in a decentralized way on a case-by-case basis, by using different foreign currency derivative instruments and/or by borrowing in foreign currencies, as the case may be, or by other methods considered adequate by the Management, according to circumstances. As of June 30, 2016, the Israeli subsidiaries’ net financial position which exposes the Group to the foreign currency risk amounts to Ps. 1,686. The Group estimates that, other factors being constant, a 5% appreciation of the US dollar against the Israeli currency would increase loss before income tax for the year ended June 30, 2016 for an amount of Ps. 84.3. An equivalent depreciation of the Israeli currency would have an equal but opposite effect in the income statement. Cresud Sociedad Anónima, Comercial, Inmobiliaria, Financiera y Agropecuaria Notes to the Consolidated Financial Statements(Continued) (All amounts in millions of Argentine Pesos, except otherwise indicated) 4. Financial risk management and fair value (Continued) 4.3 Risk management in the Urban Properties and investment business in Israel (Continued) Risk of fluctuations of the Consumer Price Index ("CPI") of Israel IDBD has financial liabilities indexed by the Israeli CPI. As of the date of this consolidated financial statements, more than half of the financial liabilities arising from the center of operations in Israel were adjusted by the Israeli CPI. Net financial position exposure to the Israeli CPI fluctuations is managed in a decentralized way on a case-by-case basis, by using different derivative financial instruments, as the case may be, or by other methods, considered adequate by the Management, according to circumstances. The Group estimates that, other factors being constant, a 1% appreciation of the CPI would increase loss before income tax for the year ended June 30, 2016 for an amount of Ps. 415. An equivalent depreciation of the CPI would have result in a profit before income tax for the year June 30, 2016 for an amount of Ps. 319. Interest rate risk The IDBD’s interest rate risk principally arises from long-term borrowings (Note 23). Borrowings issued at a flooting rate expose IDBD to cash flow interest rate risk, are partially offset by financial assets at floating interest rate. Borrowings issued at fixed rates expose IDBD to fair value interest rate risk. IDBD manages the exposure to this risk on a dynamic basis. Various scenarios are simulated by IDBD, taking into consideration refinancing, renewal of existing positions, alternative financing sources or hedging instruments, maintaining an appropriate mix between fixed and floating rate interest bearing liabilities. The exposure to the interest rate risk is managed in a decentralized way and is monitored regularly by different management offices with a view to confirming that there are no adverse effects over its ability to meet its financial obligations and to comply with its borrowings covenants. As of the date of these financial statements, the 96% of the Group’s long-term financial borrowings in the operations center in Israel are at fixed interest rate; therefore, IDBD is not significantly exposed to the interest rate fluctuation risk IDBD estimates that, other factors being constant, a 1% increase in floating rates at year-end would increase net loss before income tax for the year ended June 30, 2016, in Ps. 25, approximately. An equivalent decrease of the floating rates would have result in a profit before income tax for the year June 30, 2016 for an amount of Ps. 26. Cresud Sociedad Anónima, Comercial, Inmobiliaria, Financiera y Agropecuaria Notes to the Consolidated Financial Statements(Continued) (All amounts in millions of Argentine Pesos, except otherwise indicated) 4. Financial risk management and fair value (Continued) 4.3 Risk management in the Urban Properties and investment business in Israel (Continued) Other price risk IDBD is exposed to equity securities price risk or derivative financial instruments price risk because of investments held in entities that are publicly traded. As indicated in Note 18, investment in Clal is classified on the statements of financial position at “fair value through profit or loss” and represents the most significant IDBD’s exposure to price risk. IDBD has not used hedging against these risks. IDBD regularly reviews the prices evolution of these equity securities in order to identify significant movements. (b) Credit risk management The credit risk arises from the potential non-performance of contractual obligations by the parties, with a resulting financial loss for IDBD. IDBD’s credit risk, as well as that of its wholly-owned subsidiaries (except for IDB Tourism), is managed in a centralized manner by IDBD. In contrast, the credit risk of the other subsidiaries is managed in a decentralized fashion by each subsidiary. Each entity is responsible for managing and analyzing the credit risk and limits have been established to ensure that IDBD deals only with approved counterparties and that counterparty concentration risk is addressed and the risk of loss is mitigated. Counterparty exposure is measured as the aggregate of all obligations of any single legal entity or economic entity to IDBD. IDBD and subsidiaries invest their surplus liquidity so as to obtain a fair return on it, while maintaining a suitable return-risk ratio, in solid channels – mainly short-term shekel deposits in a number of major Israeli financial institutions, and they also invest in liquid securities, which mainly include trust funds, exchange traded funds, government and corporate bonds with a rating of at least A- and corporate bonds abroad have been rated with the international rating of Investment Grade and above. In addition, the maximum percentage of securities of a single issuer, which IDBD or a subsidiary holds in its portfolio does not exceed 10% of the value of its investment portfolio. IDBD and subsidiaries carry out transactions in derivative financial instruments only through banking corporations and entities that are required to maintain collateral levels in accordance with scenarios. Cresud Sociedad Anónima, Comercial, Inmobiliaria, Financiera y Agropecuaria Notes to the Consolidated Financial Statements(Continued) (All amounts in millions of Argentine Pesos, except otherwise indicated) 4. Financial risk management and fair value (Continued) 4.3 Risk management in the Urban Properties and investment business in Israel (Continued) IDBD’s primary objective for holding derivative financial instruments is to manage currency exchange rate risk, interest rate risk and interest risk. IDBD generally enters into derivative transactions with high-credit-quality counterparties and, by policy, limits the amount of credit exposure to each counter party. The amounts subject to credit risk related to derivative instruments are generally limited to the amounts, if any, by which counterparty’s obligations exceed the obligations that IDBD has with that counterparty. The credit risk associated with derivative financial instruments is representing by the carrying value of the assets positions of these instruments. IDBD’s policy is to manage credit exposure to trade and other receivables counterparties within defined trading limits. All of IDBD’s significant counterparties are assigned internal credit limits. Trade receivables from investment and development property activities are primarily derived from leases and services from shopping centers, offices and other rental properties; receivables from the sale of trading properties and investment properties (primarily undeveloped land and non-retail rental properties). IDBD has a large customer base and is not dependent on any single customer. (Note 17). There is not a high credit risk concentration in trade receivables from telecommunications and supermarket activity, as the business does not rely on few customers and most of the transactions are paid in cash or by credit card. (Note 17). (c) Liquidity risk management The most important risk in the operations center in Israel is liquidity risk, including risks associated with refinancing borrowings as they mature, the risk that borrowing facilities are not available to meet cash requirements, and the risk that financial assets cannot readily be converted to cash without loss of value. Failure to manage liquidity risks could have a material impact on IDBD’s cash flow and statements of financial position. Prudent liquidity risk management implies maintaining sufficient cash, the availability of funding through an adequate amount of committed credit facilities and the ability to close out market positions. Due to the dynamic nature of the underlying businesses, IDBD aims to maintain flexibility in funding its existing and prospective debt requirements by maintaining diversified funding sources. IDBD monitors its current and projected financial position using several key internally generated reports: cash flow forecasts, debt maturity and interest rate exposure. IDBD also undertakes sensitivity analysis to assess the impact of proposed transactions, movements in interest rates and changes in property values on the key profitability, liquidity and balance sheet ratios. Cresud Sociedad Anónima, Comercial, Inmobiliaria, Financiera y Agropecuaria Notes to the Consolidated Financial Statements(Continued) (All amounts in millions of Argentine Pesos, except otherwise indicated) 4. Financial risk management and fair value (Continued) 4.3 Risk management in the Urban Properties and investment business in Israel (Continued) The IDBD’s debt and derivative positions are continually reviewed to meet current and expected debt requirements. IDBD maintains a balance between longer-term and shorter-term financings. Short-term financing is principally raised through bank facilities and overdraft positions. Medium- to longer-term financing comprises public and private bond issues, including private placements. Financing risk is spread by using a variety of types of debt. The maturity profile is managed in accordance with IDBD’s needs, by spreading the repayment dates and extending facilities, as appropriate. The table below shows financial liabilities, including Group’s derivative financial liabilities in the operations center Israel, groupings based on the remaining period at the statements of financial position to the contractual maturity date. The amounts disclosed in the table are the contractual undiscounted cash flows and as a result, they do not reconcile to the amounts disclosed on the statements of financial position. However, undiscounted cash flows in respect of balances due within 12 months generally equal their carrying amounts in the statements of financial position, as the impact of discounting is not significant. The tables include both interest and principal flows. Where the interest payable is not fixed, the amount disclosed has been determined by reference to the existing conditions at the reporting date. | As of June 30, 2016 | Less than 1 year | Between 1 and 2 years | Between 2 and 3 years | Between 3 and 4 years | More than 4 years | Total | | Trade and other payables | 13,046 | 234 | 561 | 54 | 4 | 13,899 | | Borrowings | 20,714 | 19,328 | 29,522 | 9,435 | 52,232 | 131,231 | Financial/ Operating leases
| 2,254 | 2,086 | 1,802 | 1,487 | 3,398 | 11,027 | | Derivative financial instruments | 105 | 47 | 58 | - | - | 210 | Purchase obligations
| 1,089 | 162 | 15 | - | - | 1,266 | | Total | 37,208 | 21,857 | 31,958 | 10,976 | 55,634 | 157,633 |
Given the current financial liability conditions of the Operations Center in Israel, in particular in the holding company IDBD, the main source of funding has been capital contributions. See Note 26 that includes a description of commitments and restrictions related to loans and renegotiation processes under way. Cresud Sociedad Anónima, Comercial, Inmobiliaria, Financiera y Agropecuaria Notes to the Consolidated Financial Statements(Continued) (All amounts in millions of Argentine Pesos, except otherwise indicated) 5. Significant judgments, key assumptions and estimates The Group’s significant accounting policies are stated in Note 2. Not all of these significant accounting policies require management to make subjective or complex judgments or estimates. The following section is intended to provide an understanding of the policies that management considers critical because of the level of complexity, judgment or estimation involved in their application and their impact on the consolidated financial statements. These judgments involve assumptions or estimates in respect of future events. Actual results may differ from these estimates. | Estimation | Main assumptions | Potential implications | Main references | | Business combination - Allocation of acquisition prices | Assumptions regarding timing, amount of future revenues and expenses, revenue growth, expected rate of return, economic conditions, discount rate, among others. | Should any of the assumptions made be inaccurate the recognized combination may not be correct. | Note 3 – Acquisitions and disposals | | Recoverable amounts of cash-generating units (even those including goodwill), associates and assets. | The discount rate and the expected growth rate before taxes – in connection with cash-generating units. The discount rate and the expected growth rate after taxes – in connection with associates. Cash flows are determined based on past experiences with the asset or with similar assets and in accordance with the Group’s best factual assumption relative to the economic conditions expected to prevail. Business continuity and share market value of the public companies in connection with cash-generating units. Appraisals made by external appraisers and valuators with relation to the assets’ fair value, net of realization costs (including real estate assets). | Should any of the assumptions made be inaccurate, this could lead to differences in the recoverable values of cash-generating units. | Note 10 - Investment properties Note 11 - Property, plant and equipment Note 13 - Intangible assets | | Control, joint control or significant influence | Judgment relative to the determination that the Group holds an interest in the shares of investees (considering the existence and influence of significant potential voting rights), its right to designate members in the executive management of such companies (usually the Board of directors) based on the investees’ bylaws; the composition and the rights of other shareholders of such investees and their capacity to establish operating and financial policies for investees or to take part in the establishment thereof. | Accounting treatment of investments as subsidiaries (consolidation) or associates (equity method). | Note 2.3 | | Estimated useful life of intangible assets, investment properties and property, plant and equipment | Estimated useful life of assets based on their conditions. | Recognition of accelerated or decelerated depreciation by comparison against final actual earnings (losses). | Note 10 - Investment properties Note 11 - Property, plant and equipment Note 13 - Intangible assets | | Fair value valuation of investment properties | Fair value valuation made by external appraisers and valuators. | Incorrect exposure of investment property values. | Note 10 - Investment properties | | Income tax | The Group estimates the income tax amount payable for transactions where the Treasury’s Claim cannot be clearly determined. Additionally, the Group evaluates the recoverability of assets due to deferred taxes considering whether some or all of the assets will not be recoverable. | Upon the improper determination of the provision for income tax, the Group will be bound to pay additional taxes, including fines and compensatory and punitive interest. | Note 25 – Taxation | | Allowance for doubtful accounts | A periodic review is conducted of receivables risks in the Group’s clients’ portfolios. Bad debts based on the expiration of account receivables and account receivables’ specific conditions. | Improper recognition of charges / reimbursements of the allowance for bad debt. | Note 17 – Trade and other receivables | | Hybrid financial instrument related to the non-recourse loan from Koor (Adama) | ●The value of Adama’s shares. ●Unobserved data underlying the binomial model applied to the determination of the embedded derivative instruments’ value. | Changes in losses or profits resulting from the variation in the fair value of the embedded derivative, and variations in the book amount of the primary contract recognized as revenues or expenses from financing. | Note 23 – Borrowings | | Level 2 and 3 financial instruments | Main assumptions used by the Group are: ●Discounted projected income as per discount rate ●Values determined in accordance with the company’s shares in equity funds on the basis of its financial statements, based on fair value or investment assessments. ●Comparable market multiple (EV/GMV ratio). ●Underlying asset price (market price) and share price volatility (historical) and market interest rate (Libor curve). | Wrong recognition of a charge to income. | Note 16 – Financial instruments by category | | Probability estimate of contingent liabilities | Whether more economic resources may be spent in relation to litigation against the Group; such estimate is based on legal advisors’ opinions. | Charge / reversal of provision in relation to a claim. | Note 22 – Provisions | | Biological assets | Main assumptions used in valuation are: yields, operating costs, selling expenses, future of sales prices, discount rate. | Wrong recognition/valuation of biological assets. See sensitivities modeled on these parameters in Note 14. | Note 14 – Biological assets |
Cresud Sociedad Anónima, Comercial, Inmobiliaria, Financiera y Agropecuaria Notes to the Consolidated Financial Statements(Continued) (All amounts in millions of Argentine Pesos, except otherwise indicated) IFRS 8 requires an entity to report financial and descriptive information about its reportable segments, which are operating segments or aggregations of operating segments that meet specified criteria. Operating segments are component of an entity about which separate financial information is available that is evaluated regularly by the CODM. According to IFRS 8, the CODM represents a function whereby strategic decisions are made and resources are assigned. The CODM function is carried out by the President of the Group, Mr. Eduardo S. Elsztain. In addition, and due to the acquisition of IDBD, two responsibility levels have been established for resource allocation and assessment of results of the two operations centers, through executive committees in Argentina and Israel. Following the control of IDBD, the Group reports its financial and equity performance based on the new segment structure for the year-end 2016. Segment information is reported from the perspective of products and services: (i) agricultural business and (ii) urban properties and investment business. In addition, this last segment is reported divided from the geographic point of view in two Operations Centers to manage its global interests: Argentina and Israel. Within each operations center, the Group considers separately the various activities being developed, which represent reporting operating segments given the nature of its products, services, operations and risks. Management believes the operating segment clustering in each operations center reflects similar economic characteristics in each region, as well as similar products and services offered, types of clients and regulatory environments. Agricultural business: In the third quarter, the Group has changed the presentation of the agricultural business segments which are reviewed by the CODM for a better alignment with the current business vision and the metrics used to such end. Four operating segments (crops, cattle, dairy and sugarcane) have been aggregated into a single operating segment named “Agricultural production”. Management consider for the aggregation the nature of the production processes (growing of biological assets), the methods used to distribute their products and the nature of the regulatory environment (agricultural business). Therefore this quarter three segments are considered: ● The"Agricultural production"segment consists of planting, harvesting and sale of crops as wheat, corn, soybeans, cotton and sunflowers; breeding, purchasing and/or fattening of free-range cattle for sale to slaughterhouses and local livestock auction markets; breeding and/or purchasing dairy cows for the production of raw milk for sale to local milk and milk-related products producers; and planting, harvesting and sale of sugarcane. ● The“Land transformation and sales”segment comprises gains from the disposal and development of farmlands activities. Cresud Sociedad Anónima, Comercial, Inmobiliaria, Financiera y Agropecuaria Notes to the Consolidated Financial Statements(Continued) (All amounts in millions of Argentine Pesos, except otherwise indicated) 6. Segment information (Continued) ● The"Other segments"column includes, principally, agricultural services (for example, irrigation); leasing of the Group's farms to third parties; feedlot farming, slaughtering and processing in the meat refrigeration plant; and brokerage activities, among others. The amounts corresponding to the fiscal year ended June 30, 2015 and 2014, have been retroactively adjusted to reflect changes in segment information. Urban properties and investments: ●Operations Center in Argentina Within this center, the Group operates in the following segments: o The “Shopping centers” segment includes assets and results of the activity of shopping centers portfolio, principally comprised of lease and service revenues related to rental of commercial space and other spaces in the shopping centers of the Group. o The “Office and others” segment includes the assets and the operating results of the activity of lease of office space and other rental properties and service revenues related to this activity. o The “Sales and developments” segment includes assets and the operating results of the sales of undeveloped parcels of land and/or trading properties, as the results related with its development and maintenance. Also included in this segment are the results of the sales of real property intended for rent, sales of hotels and other properties included in the International segment. o The "Hotels" segment includes the operating results of the hotels principally comprised of room, catering and restaurant revenues. o The “International” segment primarily includes assets and operating profit or loss from business related to associates Condor and Lipstick. Through these associates, the Group derives revenue from hotels and an office building in United States, respectively. Until September 30, 2014, this segment included revenue from a subsidiary that owned the building located at 183 Madison Ave in New York, United States, which was sold on September 29, 2014. Additionally, until October 11, 2015, this international segment only included results from the investment in IDBD carried at fair value. o The “Financial operations and others” segment primarily includes the financial activities carried out by BHSA and Tarshop and other residual financial operations. Cresud Sociedad Anónima, Comercial, Inmobiliaria, Financiera y Agropecuaria Notes to the Consolidated Financial Statements(Continued) (All amounts in millions of Argentine Pesos, except otherwise indicated) 6. Segment information (Continued) The CODM periodically reviews the results and certain asset categories and assesses performance of the operating segments corresponding to the agricultural business and urban properties and investment business of the operations center Argentina based on a measure of profit or loss of the segment composed by the operating income plus the equity in earnings of joint ventures and associates. The valuation criteria used in preparing this information are consistent with IFRS standards used for the preparation of the financial statements, except for the following: ● Operating results of joint ventures: Cresca, Cyrsa, NPSF, Puerto Retiro, Baicom and Quality are evaluated by the CODM applying proportional consolidation method. Under this method the income/loss generated and assets, are reported in the income statement line-by-line based on the percentage held in joint ventures rather than in a single item as required by IFRS. Management believes that the proportional consolidation method provides more useful information to understand the business return. Moreover, operating results of EHSA joint venture is accounted for under the equity method. Management believes that, in this case, this method provides more adequate information for this type of investment, given its low materiality and considering it is a company without direct trade operations, where the main asset consists of an indirect interest of 25% of LRSA. ● Operating results from shopping centers and offices do not include the amounts pertaining to building administration expenses and collective promotion funds ("FPC", as per its Spanish acronym) as well as total recovered costs, whether by way of building administration expenses or other concepts included under financial results (for example default interest and other concepts). The CODM examines the net amount from both concepts (total surplus or deficit between building administration expenses and FPC and recoverable expenses). The assets’ categories examined by the CODM are: investment properties, property, plant and equipment, trading properties, inventories, right to receive future units under barter agreements, investment in associates and goodwill. The sum of these assets, classified by business segment, is reported under “assets by segment”. Assets are allocated to each segment based on the operations and/or their physical location. Within the operations center in Argentina, most revenue from its operating segments is derived from, and their assets are located in, Argentina, except for earnings of associates included in the “International” segment located in United States. Revenues for each reporting segments derive from a large and diverse client base and, therefore, there is no revenue concentration in any particular segment. Cresud Sociedad Anónima, Comercial, Inmobiliaria, Financiera y Agropecuaria Notes to the Consolidated Financial Statements(Continued) (All amounts in millions of Argentine Pesos, except otherwise indicated) 6. Segment information (Continued) ●Operations Center in Israel: Within this center, the Group operates in the following segments: o The “Real Estate” segment includes mainly assets and operating income derived from business related to the subsidiary PBC. Through PBC, the Group operates rental properties and residential properties in Israel, United States and other parts of the world and carries out commercial projects in Las Vegas, United States. o The “Supermarkets” segment includes assets and operating income derived from the business related to the subsidiary Shufersal. Through Shufersal, the Group mainly operates a supermarket chain in Israel. o The “Agrochemicals” segment includes income derived from the associate Adama. Adama is a company specialized in agrochemicals, particularly for the production of crops. o The “Telecommunications” segment includes assets and operating income derived from the business related to the subsidiary Cellcom. Cellcom is a provider of telecommunication services and its main activities include the provision of mobile phone services, fixed line phone services, data and Internet, among others. o The "Insurance" segment includes the investment in Clal. This company is one of the most important insurance groups in Israel, and is mainly engaged in pension and social security insurance, among others. As indicated in Note 18, 51% of the controlling shares of Clal are held in a trust following the instructions of the Israel Securities Commission in order to comply with the sale of the controlling shares of Clal. As a result, the Company is not fully consolidated on a line-by-line basis but rather in a single line as a financial instrument at fair value, as required by the IFRS under the current circumstances where no control is exercised. o The "Others" segment includes the assets and income derived from other diverse business activities, such as technological developments, tourism, gas and oil assets, electronics, and others. The CODM periodically reviews the results and certain asset categories and assesses performance of this operating segment based on a measure of profit or loss of the segment composed by the operating income plus the equity in earnings of joint ventures and associates. The valuation criteria used in preparing this information are consistent with IFRS standards used for the preparation of the consolidated financial statements. As indicated under Note 2, the Group decided to consolidate income derived from its operations center in Israel with a three month lag, adjusted for the effects of significant transactions. Hence, operating results of IDBD for the period extending from October 11, 2015 (acquisition date) through March 31, 2016 are included in the Group’s comprehensive income for the fiscal year ended June 30, 2016. Cresud Sociedad Anónima, Comercial, Inmobiliaria, Financiera y Agropecuaria Notes to the Consolidated Financial Statements(Continued) (All amounts in millions of Argentine Pesos, except otherwise indicated) 6. Segment information (Continued) Furthermore, comparative information has not been modified for as of that date the Group did not exercise control over IDBD. The assessment of this investment was part of the international segment of the urban properties and investment business in the operations center in Argentina. Goods and services exchanged between segments are calculated based on market prices. Intercompany transactions between segments, if any, are eliminated. As to those business segments involving the operations center in Argentina where assets are reported under the proportional consolidation method, each reported asset includes the proportional share of the Group in the same class of assets of the associates and/or joint ventures. Only as an example, the amount of investment properties reported includes (i) the balance of investment properties as stated in the statement of financial position, plus (ii) the Group’s share in the balances of investment properties of joint ventures. Within the agricultural business, most revenue from its operating segments are generated from and their assets are located in Argentina and Brazil, mainly. Within the urban properties and investment business in the operations center in Argentina, most revenue from its operating segments are generated from and their assets are located in Argentina, except for earnings of associates included in the “International” segment located in USA. Within the urban properties and investment business in the operations center in Israel, most revenue from its operating segments are generated from and their assets are located in Israel, except for certain earnings from the Real Estate segment generated outside Israel, mainly in USA. Within the agricultural business and the urban properties and investments business from the operations center in Argentina, the assets categories reviewed by the CODM are: investment properties, property, plant and equipment, trading properties, inventories, biological assets, right to receive future units under barter agreements, investment in joint ventures and associates and goodwill. The aggregate of these assets, classified by business segment, are disclosed as “segment assets”. Assets are allocated to each segment based on the operations and/or their physical location. Cresud Sociedad Anónima, Comercial, Inmobiliaria, Financiera y Agropecuaria Notes to the Consolidated Financial Statements(Continued) (All amounts in millions of Argentine Pesos, except otherwise indicated) 6. Segment information (Continued) Below is a summarized analysis of the lines of business of the Group for the year ended June 30, 2016: | | Agricultural business | | Urban properties and investments business | | Total | | | | | Operations Center in Argentina | | Operations Center in Israel | | Subtotal | | | | Revenues | 2,912 | | 3,284 | | 28,229 | | 31,513 | | 34,425 | | Costs | (3,821) | | (839) | | (20,481) | | (21,320) | | (25,141) | | Initial recognition and changes in the fair value of biological assets and agricultural produce at the point of harvest | 1,717 | | - | | - | | - | | 1,717 | | Changes in the net realizable value of agricultural produce after harvest | 208 | | - | | - | | - | | 208 | | Gross profit | 1,016 | | 2,445 | | 7,748 | | 10,193 | | 11,209 | | Gain from disposal of investment properties | - | | 1,056 | | 45 | | 1,101 | | 1,101 | | Loss from disposal of farmlands | (2) | | - | | - | | - | | (2) | | General and administrative expenses | (314) | | (554) | | (1,387) | | (1,941) | | (2,255) | | Selling expenses | (338) | | (264) | | (5,686) | | (5,950) | | (6,288) | | Other operating results, net | (70) | | 31 | | - | | 31 | | (39) | | Profit from operations | 292 | | 2,714 | | 720 | | 3,434 | | 3,726 | | Share of profit / (loss) of joint ventures and associates | 23 | | 99 | | 338 | | 437 | | 460 | | Segment profit | 315 | | 2,813 | | 1,058 | | 3,871 | | 4,186 | | | | | | | | | | | | | Investment properties | 11 | | 3,340 | | - | | 3,340 | | 3,351 | | Property, plant and equipment | 2,736 | | 244 | | - | | 244 | | 2,980 | | Trading properties | - | | 253 | | - | | 253 | | 253 | | Goodwill | 10 | | 25 | | - | | 25 | | 35 | | Rights to receive future units under barter agreements | - | | 90 | | - | | 90 | | 90 | | Biological assets | 1,144 | | - | | - | | - | | 1,144 | | Inventories | 660 | | 28 | | - | | 28 | | 688 | | Interests in joint ventures and associates | 54 | | 964 | | - | | 964 | | 1,018 | | Operating assets from Operations Center in Israel | - | | - | | 146,989 | | 146,989 | | 146,989 | | Total segment assets | 4,615 | | 4,944 | | 146,989 | | 151,933 | | 156,548 | | | | | | | | | | | | | Operating liabilities from Operations Center in Israel | - | | - | | 132,865 | | 132,865 | | 132,865 |
Cresud Sociedad Anónima, Comercial, Inmobiliaria, Financiera y Agropecuaria Notes to the Consolidated Financial Statements(Continued) (All amounts in millions of Argentine Pesos, except otherwise indicated) 6. Segment information (Continued) Below is a summarized analysis of the lines of business of the Group for the year ended June 30, 2015: | | Agricultural business | | Urban properties and investments business | | Total | | | | | Operations Center in Argentina | | | | Revenues | 2,395 | | 2,547 | | 4,942 | | Costs | (3,419) | | (633) | | (4,052) | | Initial recognition and changes in the fair value of biological assets and agricultural produce at the point of harvest | 1,347 | | - | | 1,347 | | Changes in the net realizable value of agricultural produce after harvest | (34) | | - | | (34) | | Gross profit | 289 | | 1,914 | | 2,203 | | Gain from disposal of investment properties | - | | 1,150 | | 1,150 | | Gain from disposal of farmlands | 570 | | - | | 570 | | General and administrative expenses | (247) | | (378) | | (625) | | Selling expenses | (286) | | (195) | | (481) | | Other operating results, net | (19) | | 29 | | 10 | | Profit from operations | 307 | | 2,520 | | 2,827 | | Share of profit / (loss) of joint ventures and associates | 1 | | (1,037) | | (1,036) | | Segment profit | 308 | | 1,483 | | 1,791 | | | | | | | | | Investment properties | 77 | | 3,494 | | 3,571 | | Property, plant and equipment | 2,079 | | 256 | | 2,335 | | Trading properties | - | | 136 | | 136 | | Goodwill | 8 | | 25 | | 33 | | Rights to receive future units under barter agreements | - | | 90 | | 90 | | Biological assets | 588 | | - | | 588 | | Inventories | 496 | | 23 | | 519 | | Interests in joint ventures and associates | 33 | | 2,382 | | 2,415 | | Total segment assets | 3,281 | | 6,406 | | 9,687 |
Cresud Sociedad Anónima, Comercial, Inmobiliaria, Financiera y Agropecuaria Notes to the Consolidated Financial Statements(Continued) (All amounts in millions of Argentine Pesos, except otherwise indicated) 6. Segment information (Continued) Below is a summarized analysis of the lines of business of the Group for the year ended June 30, 2014: | | Agricultural business | | Urban properties and investments business | | Total | | | | | Operations Center in Argentina | | | | Revenues | 1,813 | | 2,157 | | 3,970 | | Costs | (2,617) | | (649) | | (3,266) | | Initial recognition and changes in the fair value of biological assets and agricultural produce at the point of harvest | 1,172 | | - | | 1,172 | | Changes in the net realizable value of agricultural produce after harvest | (17) | | - | | (17) | | Gross profit | 351 | | 1,508 | | 1,859 | | Gain from disposal of investment properties | - | | 231 | | 231 | | Gain from disposal of farmlands | 91 | | - | | 91 | | General and administrative expenses | (241) | | (300) | | (541) | | Selling expenses | (210) | | (150) | | (360) | | Other operating results, net | (29) | | (49) | | (78) | | (Loss) / Profit from operations | (38) | | 1,240 | | 1,202 | | Share of profit / (loss) of joint ventures and associates | 11 | | (437) | | (426) | | Segment (loss) / profit | (27) | | 803 | | 776 | | | | | | | | | Investment properties | 51 | | 3,539 | | 3,590 | | Property, plant and equipment | 2,417 | | 238 | | 2,655 | | Trading properties | - | | 143 | | 143 | | Goodwill | 11 | | 26 | | 37 | | Rights to receive future units under barter agreements | - | | 85 | | 85 | | Assets held for sale | - | | 1,358 | | 1,358 | | Biological assets | 652 | | - | | 652 | | Inventories | 433 | | 18 | | 451 | | Interests in joint ventures and associates | 37 | | 1,966 | | 2,003 | | Total segment assets | 3,601 | | 7,373 | | 10,974 |
Cresud Sociedad Anónima, Comercial, Inmobiliaria, Financiera y Agropecuaria Notes to the Consolidated Financial Statements(Continued) (All amounts in millions of Argentine Pesos, except otherwise indicated) 6. Segment information (Continued) (I) Agriculture line of business: The following tables present the reportable segments of the agriculture line of business: | | June 30, 2016 | | | Agricultural production | | Land transformation and sales | | Others | | Total Agricultural business (i) | | Revenues | 1,689 | | - | | 1,223 | | 2,912 | | Costs | (2,727) | | (9) | | (1,085) | | (3,821) | | Initial recognition and changes in the fair value of biological assets and agricultural produce at the point of harvest | 1,717 | | - | - | - | | 1,717 | Changes in the net realizable value of agricultural produce after harvest | 208 | | - | - | - | | 208 | | Gross profit / (loss) | 887 | | (9) | | 138 | | 1,016 | | Loss from disposal of farmlands | - | | (2) | | - | | (2) | | General and administrative expenses | (256) | | (1) | | (57) | | (314) | | Selling expenses | (247) | | - | | (91) | | (338) | | Other operating results, net | (72) | | - | | 2 | | (70) | | Profit / (Loss) from operations | 312 | | (12) | | (8) | | 292 | | Share of profit / (loss) of associates | 26 | | - | | (3) | | 23 | | Segment profit / (loss) | 338 | | (12) | | (11) | | 315 | | | | | | | | | | | Investment properties | - | - | - | | 11 | | 11 | | Property, plant and equipment | 2,673 | | 13 | | 50 | | 2,736 | | Goodwill | 10 | | - | | - | | 10 | | Biological assets | 1,144 | | - | | - | | 1,144 | | Inventories | 499 | | - | | 161 | | 660 | | Investments in associates | 54 | | - | | - | | 54 | | Total segment assets (ii) | 4,380 | | 13 | | 222 | | 4,615 |
(i) From all of the Group’s revenues corresponding to Agricultural Business, Ps. 2,212 are generated in Argentina and Ps. 700 in other countries, principally in Brazil for Ps. 503. (ii) From all of the Group’s assets included in the segment corresponding to Agricultural Business, Ps. 2,062 are located in Argentina and Ps. 2,556 in other countries, principally in Brazil for Ps. 1,470. Cresud Sociedad Anónima, Comercial, Inmobiliaria, Financiera y Agropecuaria Notes to the Consolidated Financial Statements(Continued) (All amounts in millions of Argentine Pesos, except otherwise indicated) 6. Segment information (Continued) | | June 30, 2015 | | | Agricultural production | | Land transformation and sales | | Others | | Total Agricultural business (i) | | Revenues | 1,400 | | - | | 995 | | 2,395 | | Costs | (2,545) | | (9) | | (865) | | (3,419) | | Initial recognition and changes in the fair value of biological assets and agricultural produce at the point of harvest | 1,347 | | - | | - | | 1,347 | Changes in the net realizable value of agricultural produce after harvest | (34) | | - | | - | | (34) | | Gross profit / (loss) | 168 | | (9) | | 130 | | 289 | | Gain from disposal of farmlands | - | | 570 | | - | | 570 | | General and administrative expenses | (210) | | (2) | | (35) | | (247) | | Selling expenses | (193) | | (2) | | (91) | | (286) | | Other operating results, net | (15) | | (5) | | 1 | | (19) | | (Loss) / Profit from operations | (250) | | 552 | | 5 | | 307 | | Share of profit of associates | 1 | | - | | - | | 1 | | Segment (loss) / profit | (249) | | 552 | | 5 | | 308 | | | | | | | | | | | Investment properties | - | | - | | 77 | | 77 | | Property, plant and equipment | 1,997 | | 13 | | 69 | | 2,079 | | Goodwill | 7 | | - | | 1 | | 8 | | Biological assets | 587 | | - | | 1 | | 588 | | Inventories | 370 | | - | | 126 | | 496 | | Investments in associates | 33 | | - | | - | | 33 | | Total segment assets (ii) | 2,994 | | 13 | | 274 | | 3,281 |
(i) From all of the Group’s revenues corresponding to Agricultural Business, Ps. 1,679 are generated in Argentina and Ps. 716 in other countries, principally in Brazil for Ps. 578. (ii) From all of the Group’s assets included in the segment corresponding to Agricultural Business, Ps. 1,379 are located in Argentina and Ps. 1,902 in other countries, principally in Brazil for Ps. 1,186. Cresud Sociedad Anónima, Comercial, Inmobiliaria, Financiera y Agropecuaria Notes to the Consolidated Financial Statements(Continued) (All amounts in millions of Argentine Pesos, except otherwise indicated) 6. Segment information (Continued) | | June 30, 2014 | | | Agricultural production | | Land transformation and sales | | Others | | Total Agricultural business (i) | | Revenues | 1,105 | | - | | 708 | | 1,813 | | Costs | (2,011) | | (8) | | (598) | | (2,617) | | Initial recognition and changes in the fair value of biological assets and agricultural produce at the point of harvest | 1,172 | | - | | - | | 1,172 | Changes in the net realizable value of agricultural produce after harvest | (17) | | - | | - | | (17) | | Gross profit / (loss) | 249 | | (8) | | 110 | | 351 | | Gain from disposal of farmlands | - | | 91 | | - | | 91 | | General and administrative expenses | (208) | | (1) | | (32) | | (241) | | Selling expenses | (139) | | (4) | | (67) | | (210) | | Other operating results, net | (29) | | - | | - | | (29) | | (Loss) / Profit from operations | (127) | | 78 | | 11 | | (38) | | Share of profit of associates | 11 | | - | | - | | 11 | | Segment (loss) / profit | (116) | | 78 | | 11 | | (27) | | | | | | | | | | | Investment properties | - | | - | | 51 | | 51 | | Property, plant and equipment | 2,365 | | 7 | | 45 | | 2,417 | | Goodwill | 10 | | - | | 1 | | 11 | | Biological assets | 647 | | - | | 5 | | 652 | | Inventories | 334 | | - | | 99 | | 433 | | Investments in associates | 34 | | - | | 3 | | 37 | | Total segment assets (ii) | 3,390 | | 7 | | 204 | | 3,601 |
(i) From all of the Group’s revenues corresponding to Agricultural Business, Ps. 1,279 million are generated in Argentina and Ps. 534 million in other countries, principally in Brazil for Ps. 415 million. (ii) From all of the Group’s assets included in the segment corresponding to Agricultural Business, Ps. 1,252 million are located in Argentina and Ps. 2,348 million in other countries, principally in Brazil for Ps. 1,727 million. Cresud Sociedad Anónima, Comercial, Inmobiliaria, Financiera y Agropecuaria Notes to the Consolidated Financial Statements(Continued) (All amounts in millions of Argentine Pesos, except otherwise indicated) 6. Segment information (Continued) (II) Urban properties line of business and investments The following tables present the reportable segments from the Operations Center in Argentina: | | June 30, 2016 | | | Shopping Center
| | Offices and others | | Sales and developments | | Hotels | | International | | Financial operations and others | | Total | | Revenues (i) | 2,406 | | 340 | | 3 | | 534 | | - | | 1 | | 3,284 | | Costs | (403) | | (53) | | (20) | | (362) | | - | | (1) | | (839) | | Gross profit / (loss) | 2,003 | | 287 | | (17) | | 172 | | - | | - | | 2,445 | | Gain from disposal of investment properties | - | | - | | 1,056 | | - | | - | | - | | 1,056 | | General and administrative expenses | (179) | | (50) | | (131) | | (103) | | (91) | | - | | (554) | | Selling expenses | (145) | | (12) | | (36) | | (69) | | - | | (2) | | (264) | | Other operating results, net | (42) | | (6) | | (8) | | (2) | | 88 | | 1 | | 31 | | Profit / (Loss) from operations | 1,637 | | 219 | | 864 | | (2) | | (3) | | (1) | | 2,714 | | Share of profit / (loss) of joint ventures and associates | - | | 14 | | 5 | | - | | (151) | | 231 | | 99 | | Segment profit / (loss) | 1,637 | | 233 | | 869 | | (2) | | (154) | | 230 | | 2,813 | | | | | | | | | | | | | | | | | Investment properties | 2,282 | | 879 | | 173 | | - | | - | | 6 | | 3,340 | | Property, plant and equipment | 49 | | 25 | | 2 | | 166 | | 2 | | - | | 244 | | Trading properties | 1 | | - | | 252 | | - | | - | | - | | 253 | | Goodwill | 14 | | 6 | | 5 | | - | | - | | - | | 25 | | Rights to receive future units under barter agreements | - | | - | | 90 | | - | | - | | - | | 90 | | Inventories | 19 | | - | | 1 | | 8 | | - | | - | | 28 | | Investment in joint ventures and associates | - | | 31 | | 62 | | - | | (832) | | 1,703 | | 964 | | Total segment assets (ii) | 2,365 | | 941 | | 585 | | 174 | | (830) | | 1,709 | | 4,944 |
(i) From all the Group's revenues corresponding to the urban properties and investment business of the Operations Center in Argentina, Ps. 3,284 are generated in Argentina. No external client represents 10% or more of revenue of any of the reportable segments. (ii) From all of the Group's assets included in the segment corresponding to the urban properties and investment business of the operations Center in Argentina, Ps. 5,618 are located in Argentina and Ps. (674) in other countries, principally in United States for Ps. (832) and Uruguay for Ps. 158, respectively. Cresud Sociedad Anónima, Comercial, Inmobiliaria, Financiera y Agropecuaria Notes to the Consolidated Financial Statements(Continued) (All amounts in millions of Argentine Pesos, except otherwise indicated) 6. Segment information (Continued) | | June 30, 2015 | | | Shopping Center
| | Offices and others | | Sales and developments | | Hotels | | International | | Financial operations and others | | Total | | Revenues (i) | 1,778 | | 333 | | 14 | | 396 | | 26 | | - | | 2,547 | | Costs | (291) | | (36) | | (19) | | (279) | | (7) | | (1) | | (633) | | Gross profit / (loss) | 1,487 | | 297 | | (5) | | 117 | | 19 | | (1) | | 1,914 | | Gain from disposal of investment properties | - | | - | | 1,150 | | - | | - | | - | | 1,150 | | General and administrative expenses | (135) | | (59) | | (50) | | (78) | | (56) | | - | | (378) | | Selling expenses | (113) | | (21) | | (9) | | (52) | | - | | - | | (195) | | Other operating results, net | (49) | | (118) | | 13 | | - | | 185 | | (2) | | 29 | | Profit / (Loss) from operations | 1,190 | | 99 | | 1,099 | | (13) | | 148 | | (3) | | 2,520 | | Share of (loss) / profit of joint ventures and associates | - | | (3) | | (2) | | 1 | | (1,191) | | 158 | | (1,037) | | Segment profit / (loss) | 1,190 | | 96 | | 1,097 | | (12) | | (1,043) | | 155 | | 1,483 | | | | | | | | | | | | | | | | | Investment properties | 2,321 | | 978 | | 188 | | - | | - | | 7 | | 3,494 | | Property, plant and equipment | 48 | | 31 | | 1 | | 175 | | 1 | | - | | 256 | | Trading properties | 1 | | - | | 135 | | - | | - | | - | | 136 | | Goodwill | 14 | | 6 | | 5 | | - | | - | | - | | 25 | | Rights to receive future units under barter agreements | - | | - | | 90 | | - | | - | | - | | 90 | | Inventories | 16 | | - | | - | | 7 | | - | | - | | 23 | | Interests in joint ventures and associates | - | | 21 | | 47 | | - | | 910 | | 1,404 | | 2,382 | | Total segment assets (ii) | 2,400 | | 1,036 | | 466 | | 182 | | 911 | | 1,411 | | 6,406 |
(i) From all the Group's revenues corresponding to the urban properties and investment business of the Operations Center in Argentina, Ps. 2,521 are originated in Argentina and Ps. 26 in United States. No external client represents 10% or more of revenue of any of the reportable segments. (ii) From all of the Group's assets included in the segment corresponding to the urban properties and investment business of the Operations Center in Argentina, Ps. 4,767 are located in Argentina and Ps. 1,639 in other countries, principally in United States for Ps. 1,533 and Uruguay for Ps. 106, respectively. Cresud Sociedad Anónima, Comercial, Inmobiliaria, Financiera y Agropecuaria Notes to the Consolidated Financial Statements(Continued) (All amounts in millions of Argentine Pesos, except otherwise indicated) 6. Segment information (Continued) | | June 30, 2014 | | | Shopping Center
| | Offices and others | | Sales and developments | | Hotels | | International | | Financial operations and others | | Total | | Revenues (i) | 1,383 | | 271 | | 86 | | 332 | | 84 | | 1 | | 2,157 | | Costs | (297) | | (45) | | (35) | | (217) | | (54) | | (1) | | (649) | | Gross profit | 1,086 | | 226 | | 51 | | 115 | | 30 | | - | | 1,508 | | Gain from disposal of investment properties | - | | - | | 231 | | - | | - | | - | | 231 | | General and administrative expenses | (102) | | (42) | | (37) | | (60) | | (59) | | - | | (300) | | Selling expenses | (73) | | (21) | | (14) | | (42) | | - | | - | | (150) | | Other operating results, net | (47) | | (3) | | 8 | | (3) | | (1) | | (3) | | (49) | | Profit / (Loss) from operations | 864 | | 160 | | 239 | | 10 | | (30) | | (3) | | 1,240 | | Share of (loss) / profit of joint ventures and associates | - | | (1) | | 6 | | 1 | | (616) | | 173 | | (437) | | Segment profit / (loss) | 864 | | 159 | | 245 | | 11 | | (646) | | 170 | | 803 | | | | | | | | | | | | | | | | | Investment properties | 2,275 | | 834 | | 423 | | - | | - | | 7 | | 3,539 | | Property, plant and equipment | 20 | | 36 | | 4 | | 176 | | 2 | | - | | 238 | | Trading properties | 1 | | - | | 142 | | - | | - | | - | | 143 | | Goodwill | 9 | | 12 | | 5 | | - | | - | | - | | 26 | | Rights to receive future units under barter agreements | - | | - | | 85 | | - | | - | | - | | 85 | | Assets held for sale | - | | - | | - | | - | | 1,358 | | - | | 1,358 | | Inventories | 11 | | - | | 1 | | 6 | | - | | - | | 18 | | Interests in joint ventures and associates | - | | 23 | | 38 | | 22 | | 629 | | 1,254 | | 1,966 | | Total segment assets (ii) | 2,316 | | 905 | | 698 | | 204 | | 1,989 | | 1,261 | | 7,373 |
(i) From all the Group's revenues corresponding to the urban properties and investment business of the Operations Center in Argentina, Ps. 2,073 are originated mainly in Argentina and Ps. 84 in United States. No external client represents 10% or more of revenue of any of the reportable segments. (ii) From all of the Group's assets included in the segment corresponding to the urban properties and investment business of the Operations Center in Argentina, Ps. 5,274 are located in Argentina and Ps. 2,099 in other countries, principally in United States for Ps. 1,988. Cresud Sociedad Anónima, Comercial, Inmobiliaria, Financiera y Agropecuaria Notes to the Consolidated Financial Statements(Continued) (All amounts in millions of Argentine Pesos, except otherwise indicated) 6. 6. Segment information (Continued) The following table presents the reportable segments of the Operations Center in Israel: | | June 30, 2016 | | | Real Estate | | Supermarkets | | Agrochemicals | | Telecommunications | | Insurance | | Others | | Total | | Revenues (i) | 1,538 | | 18,610 | | - | | 6,655 | | - | | 1,426 | | 28,229 | | Costs | (837) | | (13,925) | | - | | (4,525) | | - | | (1,194) | | (20,481) | | Gross profit | 701 | | 4,685 | | - | | 2,130 | | - | | 232 | | 7,748 | | Gain from disposal of investment properties | 45 | | - | | - | | - | | - | | - | | 45 | | General and administrative expenses | (100) | | (203) | | - | | (708) | | - | | (376) | | (1,387) | | Selling expenses | (29) | | (4,058) | | - | | (1,493) | | - | | (106) | | (5,686) | | Profit / (Loss) from operations | 617 | | 424 | | - | | (71) | | - | | (250) | | 720 | | Share of profit / (loss) of joint ventures and associates | 97 | | - | | 334 | | - | | - | | (93) | | 338 | | Segment profit / (loss) | 714 | | 424 | | 334 | | (71) | | - | | (343) | | 1,058 | | | | | | | | | | | | | | | | | Operating assets (ii) | 60,197 | | 29,440 | | - | | 27,345 | | 4,602 | | 25,405 | | 146,989 | | Operating liabilities | (49,452) | | (23,614) | | - | | (21,657) | | - | | (38,142) | | (132,865) | | | 10,745 | | 5,826 | | - | | 5,688 | | 4,602 | | (12,737) | | 14,124 |
(i) From all the Group's revenues corresponding to the urban properties and investment business of the Operations Center in Israel, Ps. 512 are originated in United States and Ps. 27,717 in Israel. No external client represents 10% or more of revenue of any of the reportable segments. (ii) From all of the Group's assets included in the segment corresponding to the urban properties and investment business of the Operations Center in Israel, Ps. 14,070 are located in United States, Ps. 786 in India and the remaining in Israel. Cresud Sociedad Anónima, Comercial, Inmobiliaria, Financiera y Agropecuaria Notes to the Consolidated Financial Statements(Continued) (All amounts in millions of Argentine Pesos, except otherwise indicated) 6. Segment information (Continued) The following tables present a reconciliation between the total results of operations as per the segment information and the profit from operation as per the statement of income. The adjustments relate to the presentation of the results of operations of joint ventures accounted for under the equity method under IFRS and the non-elimination of the inter-segment transactions. | | June 30, 2016 | | | | | | | Total segment information | Adjustment for share of profit / (loss) of joint ventures | Expenses and collective promotion funds | Adjustment to income for elimination of inter-segment transactions | Total statement of income | | Revenues | 34,425 | (89) | 1,194 | (146) | 35,384 | | Costs | (25,141) | 111 | (1,207) | 147 | (26,090) | | Initial recognition and changes in the fair value of biological assets and agricultural produce at the point of harvest | 1,717 | (57) | - | - | 1,660 | | Changes in the net realizable value of agricultural produce after harvest | 208 | - | - | - | 208 | | Gross profit / (loss) | 11,209 | (35) | (13) | 1 | 11,162 | | Gain from disposal of investment properties | 1,101 | - | - | - | 1,101 | | Loss from disposal of farmlands | (2) | - | - | - | (2) | | General and administrative expenses | (2,255) | 5 | - | 6 | (2,244) | | Selling expenses | (6,288) | 8 | - | 1 | (6,279) | | Other operating results, net | (39) | (2) | - | (3) | (44) | Profit / (Loss) from operations before share of Profit / (Loss) of joint ventures and associates | 3,726 | (24) | (13) | 5 | 3,694 | | Share of (loss) / profit of joint ventures and associates | 460 | 13 | - | - | 473 | | Profit / (Loss) from operations before financing and taxation | 4,186 | (11) | (13) | 5 | 4,167 |
Cresud Sociedad Anónima, Comercial, Inmobiliaria, Financiera y Agropecuaria Notes to the Consolidated Financial Statements(Continued) (All amounts in millions of Argentine Pesos, except otherwise indicated) 6. Segment information (Continued) | | June 30, 2015 | | | Total segment information | | Adjustment for share of Profit / (Loss) of joint ventures | | Expenses and collective promotion funds | | Adjustment to income for elimination of inter-segment transactions | | Total statement of income | | Revenues | 4,942 | | (53) | | 887 | | (124) | | 5,652 | | Costs | (4,052) | | 61 | | (901) | | 122 | | (4,770) | | Initial recognition and changes in the fair value of biological assets and agricultural produce at the point of harvest | 1,347 | | (23) | | - | | - | | 1,324 | | Changes in the net realizable value of agricultural produce after harvest | (34) | | - | | - | | - | | (34) | | Gross profit / (loss) | 2,203 | | (15) | | (14) | | (2) | | 2,172 | | Gain from disposal of investment properties | 1,150 | | - | | - | | - | | 1,150 | | Gain / (Loss) from disposal of farmlands | 570 | | (20) | | - | | - | | 550 | | General and administrative expenses | (625) | | 4 | | - | | 3 | | (618) | | Selling expenses | (481) | | 6 | | - | | 1 | | (474) | | Other operating results, net | 10 | | 3 | | - | | (1) | | 12 | | Profit / (Loss) from operations before share of Profit / (Loss) of joint ventures and associates | 2,827 | | (22) | | (14) | | 1 | | 2,792 | | Share of (loss) / profit of joint ventures and associates | (1,036) | | 10 | | - | | - | | (1,026) | | Profit / (Loss) from operations before financing and taxation | 1,791 | | (12) | | (14) | | 1 | | 1,766 |
| | June 30, 2014 | | | Total segment information | | Adjustment for share of Profit / (Loss) of joint ventures | | Expenses and collective promotion funds | | Adjustment to income for elimination of inter-segment transactions | | Total statement of income | | Revenues | 3,970 | | (63) | | 736 | | (39) | | 4,604 | | Costs | (3,266) | | 60 | | (744) | | 37 | | (3,913) | | Initial recognition and changes in the fair value of biological assets and agricultural produce at the point of harvest | 1,172 | | (20) | | - | | - | | 1,152 | | Changes in the net realizable value of agricultural produce after harvest | (17) | | - | | - | | - | | (17) | | Gross profit / (loss) | 1,859 | | (23) | | (8) | | (2) | | 1,826 | | Gain from disposal of investment properties | 231 | | - | | - | | - | | 231 | | Gain from disposal of farmlands | 91 | | - | | - | | - | | 91 | | General and administrative expenses | (541) | | 5 | | - | | 3 | | (533) | | Selling expenses | (360) | | 6 | | - | | - | | (354) | | Other operating results, net | (78) | | 4 | | - | | (1) | | (75) | | Profit / (Loss) from operations before share of Profit / (Loss) of joint ventures and associates | 1,202 | | (8) | | (8) | | - | | 1,186 | | Share of (loss) / profit of joint ventures and associates | (426) | | 16 | | - | | - | | (410) | | Profit / (Loss) from operations before financing and taxation | 776 | | 8 | | (8) | | - | | 776 |
Cresud Sociedad Anónima, Comercial, Inmobiliaria, Financiera y Agropecuaria Notes to the Consolidated Financial Statements(Continued) (All amounts in millions of Argentine Pesos, except otherwise indicated) 6. Segment information (Continued) The following tables present a reconciliation between total segment assets and liabilities and total assets as per the statement of financial position. Adjustments are mainly related to the filing of certain classes of assets in segment information and to the proportional consolidation of joint ventures mentioned previously. | | June 30, 2016 | | June 30, 2015 | | June 30, 2014 | | | Agricultural business | | Urban properties and investments business | | Total | | Agricultural business | | Urban properties and investments business | | Total | | Agricultural business | | Urban properties and investments business | | Total | | | | | Operations Center in Argentina | Operations Center in Israel | Subtotal | | | | | | Operations Center in Argentina | | | | | | Operations Center in Argentina | | | Total Assets per segment
| 4,615 | | 4,944 | 146,989 | 151,933 | | 156,548 | | 3,281 | | 6,406 | | 9,687 | | 3,601 | | 7,373 | | 10,974 | | Less: | | | | | | | | | | | | | | | | | | | | | Proportionate share in reportable assets per segment of joint ventures (*) | (529) | | (117) | - | (117) | | (646) | | (382) | | (95) | | (477) | | (294) | | (149) | | (443) | | Measurement adjustments at fair value | | | | | | | | | | | | | | | | | | | | | Plus: | | | | | | | | | | | | | | | | | | | | | Investments in joint ventures (**) | 233 | | 203 | - | 203 | | 436 | | 177 | | 181 | | 358 | | 64 | | 308 | | 372 | | Other non-reportable assets (***) | 3,102 | | 6,561 | - | 6,561 | | 9,663 | | 2,794 | | 2,914 | | 5,708 | | 2,606 | | 2,275 | | 4,881 | | Total Consolidated assets as per Statement of financial position | 7,421 | | 11,591 | 146,989 | 158,580 | | 166,001 | | 5,870 | | 9,406 | | 15,276 | | 5,977 | | 9,807 | | 15,784 |
Cresud Sociedad Anónima, Comercial, Inmobiliaria, Financiera y Agropecuaria Notes to the Consolidated Financial Statements(Continued) (All amounts in millions of Argentine Pesos, except otherwise indicated) 6. Segment information (Continued) (*) Below is a detail of the proportionate share in assets by segment of joint ventures included in the information reported by segment. | | June 30, 2016 | | June 30, 2015 | | June 30, 2014 | | | Agricultural business | | Urban properties and investments business | | Total | | Agricultural business | | Urban properties and investments business | | Total | | Agricultural business | | Urban properties and investments business | | Total | | | | | Operations Center in Argentina | Operations Center in Israel | Subtotal | | | | | | Operations Center in Argentina | | | | | | Operations Center in Argentina | | | | Investment properties | 2 | | 115 | - | 115 | | 117 | | - | | 96 | | 96 | | - | | 135 | | 135 | | Property, plant and equipment | 509 | | (5) | - | (5) | | 504 | | 366 | | (9) | | 357 | | 273 | | - | | 273 | | Trading properties | - | | 1 | - | 1 | | 1 | | - | | 3 | | 3 | | - | | 6 | | 6 | | Goodwill | - | | 5 | - | 5 | | 5 | | - | | 5 | | 5 | | - | | 7 | | 7 | | Biological assets | 12 | | - | - | - | | 12 | | 9 | | - | | 9 | | 11 | | - | | 11 | | Inventories | 6 | | 1 | - | 1 | | 7 | | 7 | | - | | 7 | | 10 | | 1 | | 11 | | Total proportionate share in assets per segment of joint ventures | 529 | | 117 | - | 117 | | 646 | | 382 | | 95 | | 477 | | 294 | | 149 | | 443 |
Cresud Sociedad Anónima, Comercial, Inmobiliaria, Financiera y Agropecuaria Notes to the Consolidated Financial Statements(Continued) (All amounts in millions of Argentine Pesos, except otherwise indicated) 6. Segment information (Continued) (**) Represents the equity-accounted amount of those joint ventures, which were proportionate-consolidated for segment information purposes. | | June 30, 2016 | | June 30, 2015 | | June 30, 2014 | | | Agricultural business | | Urban properties and investments business | | Total | | Agricultural business | | Urban properties and investments business | | Total | | Agricultural business | | Urban properties and investments business | | Total | | | | | Operations Center in Argentina | Operations Center in Israel | Subtotal | | | | | | Operations Center in Argentina | | | | | | Operations Center in Argentina | | | | Total Liabilities per segment | - | | - | 132,865 | 132,865 | | 132,865 | | - | | - | | - | | - | | - | | - | | Plus: | | | | | | | | | | | | | | | | | | | | | Liabilities corresponding to agricultural business and urban properties and investment business of the operations center in Argentina | 5,323 | | 12,581 | - | 12,581 | | 17,904 | | 4,209 | | 7,165 | | 11,374 | | 4,213 | | 7,136 | | 11,349 | | Total Consolidated liabilities as per Statement of financial position | 5,323 | | 12,581 | 132,865 | 145,446 | | 150,769 | | 4,209 | | 7,165 | | 11,374 | | 4,213 | | 7,136 | | 11,349 |
(***) Includes deferred income tax assets, income tax credit, restricted assets, trade and other receivables, financial assets held for sale, investment in financial assets, derivative financial instruments, employee benefits, cash and cash equivalents and intangible assets except for goodwill and right to receive units. Cresud Sociedad Anónima, Comercial, Inmobiliaria, Financiera y Agropecuaria Notes to the Consolidated Financial Statements(Continued) (All amounts in millions of Argentine Pesos, except otherwise indicated) 7. Information about principal subsidiaries The Group conducts its business through several operating subsidiaries and holdings. The Group considers that the subsidiaries below are the ones with non-controlling interests material to the Group. As of June 30, 2016 and 2015 correspond to urban properties and investment business from the operations center in Argentina and agricultural business. | | As of June 30, 2016 | | Year ended June 30, 2016 | | | Non-controlling shareholders’ interest % | | Current assets | | Non-current assets | | Current liabilities | | Non- current liabilities | | Net assets | | Book value of non-controlling shareholders | | Revenues | | Net (Loss)/ Incomes | | Other comprehensive (Loss)/ Income | | Total comprehensive Loss/ income | | Profit (loss) attributable to non-controlling shareholders | | Other comprehensive loss attributable to non-controlling shareholders | | Cash of operating activities | | Cash of investment activities | | Cash of financial activities | | Net increase (decrease) in cash and cash equivalents | | Dividends distributed to non-controlling shareholders | | Elron (1) | 49.68% | | 2,145 | | 922 | | 82 | | 31 | | 2,954 | | 2,522 | | 3 | | (97) | | (103) | | (200) | | (55) | | (71) | | (171) | | (58) | | 13 | | (216) | | - | | PBC (1) | 23.55% | | 10,435 | | 47,546 | | 9,925 | | 37,567 | | 10,489 | | 8,419 | | 1,538 | | 621 | | (267) | | 354 | | 370 | | (116) | | 1,039 | | 280 | | (2,414) | | (1,095) | | (322) | | Cellcom (1) | 58.23% | | 9,368 | | 16,113 | | 7,629 | | 13,210 | | 4,642 | | 3,795 | | 6,655 | | (64) | | (3) | | (67) | | (39) | | - | | 1,442 | | (241) | | (776) | | 425 | | (6) | | Shufersal (1) | 47.05% | | 9,929 | | 18,764 | | 13,202 | | 10,411 | | 5,080 | | 3,596 | | 18,610 | | 312 | | (19) | | 293 | | 193 | | (13) | | 769 | | (483) | | (2,436) | | (2,150) | | (151) | | BrasilAgro | 57.82% | | 898 | | 2,260 | | 415 | | 205 | | 2,538 | | 1,380 | | 467 | | (21) | | 619 | | 598 | | (12) | | 358 | | (66) | | 353 | | (426) | | (139) | | (9) | | IRSA | 36.23% | | 42,763 | | 116,237 | | 43,600 | | 101,899 | | 13,501 | | 12,386 | | 32,675 | | (1,872) | | 3,892 | | 2,020 | | (618) | | 3,400 | | 4,139 | | 8,210 | | (3,968) | | 8,381 | | (615) |
| | As of June 30, 2015 | | Year ended June 30, 2015 | | | Non-controlling shareholders’ interest % | | Current assets | | Non-current assets | | Current liabilities | | Non- current liabilities | | Net assets | | Book value of non-controlling shareholders | | Revenues | | Net Income / (Loss) | | Other comprehensive income | | Total comprehensive income | | Profit (loss) attributable to non-controlling shareholders | | Other comprehensive loss attributable to non-controlling shareholders | | Cash of operating activities | | Cash of investment activities | | Cash of financial activities | | Net increase (decrease) in cash and cash equivalents | | Dividends distributed to non-controlling shareholders | | | | | | | | | | | | | | | | | | | | | | | | | | | | | | | | | | | | | | | BrasilAgro | 64.30% | | 1,896 | | 8,347 | | 2,691 | | 4,682 | | 2,870 | | 872 | | 2,509 | | 164 | | 106 | | 270 | | 81 | | | | 736 | | 301 | | (1,298) | | (261) | | | | IRSA | 39.77% | | 1,315 | | 1,667 | | 583 | | 195 | | 2,204 | | 1,257 | | 321 | | 59 | | (472) | | (413) | | - | | | | (161) | | (46) | | 11 | | (196) | | |
N/A: Not applicable. Not considered a significant non-controlling interest. (1) Corresponds to the Group's indirect interest. The percentage of the non-controlling interest represents the equity interest which is not owned by DIC. Cresud Sociedad Anónima, Comercial, Inmobiliaria, Financiera y Agropecuaria Notes to the Consolidated Financial Statements(Continued) (All amounts in millions of Argentine Pesos, except otherwise indicated) 7. Information about principal subsidiaries (Continued) Significant events Cellcom is the largest provider of mobile telecommunications in Israel, it offers its services approximately to 2.9 million subscribers with a wide range of services. By the end of 2014, the Company launched television services over the Internet. Under Israeli laws, in order for a shareholder to be able to exert control over a Telecommunications Company, such shareholder must first secure the approval of the Ministry of Communications of Israel. Such approval, consequence of change in control of IDBD, has not yet been obtained. In November 2015, Cellcom entered into an agreement, subject to approval, with Golan Telecom Ltd. ("Golan") and its shareholders to acquire all of Golan’s shares for a price of NIS 1,170 million, subject to certain adjustments. To complete the transaction, Cellcom intends to raise funds by way of a public offering and DIC expects to subscribe shares for up to NIS 100 million at that public offering to maintain its current equity interests. During April 2016, the Anti-trust Commission of Israel and the Ministry of Communications notified Cellcom their objection to the transaction described above but failed to state the grounds for such objection. In June 2016, Hot Mobile Ltd. ("Hot"), a mobile phone carrier of Israel, announced it intended to enter into a non-exclusive long-term agreement for the provision of hosting services to Golan for the network used by Hot, which is subject to approval and directives by the Israel regulatory authorities. Cellcom informed Golan that the transaction with Hot amounts to a material breach of the stock purchase agreement (“SPA”) mentioned above and of the intra-national roaming agreement (the “Roaming Agreement”) between Cellcom and Golan, including an exclusivity commitment in relation to the provision of services and the commitment to not apply any material change to the business acquired. Cellcom notified Golan and its shareholders that unless the breach to the SPA and the Roaming Agreement were cured, Cellcom would be entitled to terminate the SPA and claim the immediate reimbursement of an aggregate amount of NIS 600 million, in addition to the reimbursement of sums of money already paid by Cellcom to Golan. Non-performance will allow Cellcom to claim damages for the future payments that should have been made by Golan until the end of the exclusivity period agreed upon between the parties. In July 2016, Cellcom started a legal action against Golan, including a motion filed to suspend the agreement between Golan and Hot; in this respect, on July 21, 2016 the District Court issued a temporary restraining order against finalizing the agreement between Golan and Hot, as requested by Cellcom. In August 2016, Golan filed a motion with the Supreme Court challenging the temporary order. Cresud Sociedad Anónima, Comercial, Inmobiliaria, Financiera y Agropecuaria Notes to the Consolidated Financial Statements(Continued) (All amounts in millions of Argentine Pesos, except otherwise indicated) 7. Information about principal subsidiaries (Continued) Analysis of the impact of the Concentration Act law As mentioned in note 1 to these financial statements, IDBD is analyzing the implications of the Concentration Act law. The alternatives under evaluation include: (i) delisting of IDBD or DIC so that it becomes a private company, or (ii) a merger between IDBD and DIC. At the time of approval of these financial statements, the preceding alternatives are merely under evaluation and there is no certainty as to implementation of the structural changes described above or the date of any such implementation. IDBD and DIC estimate that one of these alternatives are likely to be carried out, allowing the Group to continue holding control of Cellcom after December 2019. As indicated for IDBD, PBC is also assessing the implications of this Act in relation to its holdings in controlled companies, for the purpose of continuing to exercise control; and it believes it will continue to do so. IDBD and DIC assess whether it is necessary to recognize deferred tax liabilities for the temporary differences arising in relation to its investments in subsidiaries. In this respect, IDBD, DIC and PBC estimate that if each of them is required to dispose of its respective holdings in subsidiaries, they would not be liable to income tax on the sale and, for such reason, they did not recognize the deferred tax liabilities related to this difference in these financial statements. 8. Interests in joint ventures Evolution in the Group’s investments in joint ventures for the years ended June 30, 2016 and 2015 were as follows: | | June 30, 2016 | | June 30, 2015 | | Beginning of the year | 378 | | 395 | | Capital contribution | 77 | | 95 | | Balance incorporated by business combination (Note 3) | 960 | | - | | Share of profit | 143 | | 5 | | Currency translation adjustment | 645 | | 28 | | Cash dividends (i) | (17) | | (34) | | Capital reduction (ii) | - | | (111) | | End of the year | 2,186 | | 378 |
(i) During the fiscal year ended June 30, 2016, Ps. 7 corresponds to Cyrsa, Ps. 4 to NPSF and Ps. 6 to Manaman. During the fiscal year ended June 30, 2015, Ps. 31 corresponds to Cyrsa and Ps. 3 to NPSF. (ii) During the fiscal year ended June 30, 2015, Cyrsa carried out a distribution to IRSA due to capital reduction for Ps. 111. Cresud Sociedad Anónima, Comercial, Inmobiliaria, Financiera y Agropecuaria Notes to the Consolidated Financial Statements(Continued) (All amounts in millions of Argentine Pesos, except otherwise indicated) 8. Interests in joint ventures (Continued) The table below shows the value of interests in joint ventures for the fiscal years ended June 30, 2016 and 2015, as well as the Group’s interest in comprehensive income/(loss) of such companies for the fiscal years ended June 30, 2016, 2015 and 2014: | Name of the entity | Place of business / Country of incorporation | Main activity | Nature of the relationship | Common shares 1 vote | Value of Group's interest in equity | | Group's interest in comprehensive income / (Operations) | | % of ownership interest held | | | June 30, | June 30, | | June 30, | Last financial statement issued | | 2016 | 2015 | | 2016 | 2015 | 2014 | | 2016 | 2015 | 2014 | Share Capital (nominal value) | (Loss) / profit for the year | Shareholders' equity | Cresca S.A.
| Paraguay | Agricultural | (1) | 138,154 | 230 | 176 | | 54 | 26 | 2 | | 50% | 50% | 50% | 144 | (i) 27 | 588 | | Mehadrin | Israel | Agricultural | (2) | 1,509,889 | 985 | - | | 433 | - | - | | 45.41% | - | - | (*) 3 | (*) 70 | (*) 499 | | Others joint ventures | | | (3) | | 971 | 202 | | 301 | 7 | 25 | | | | | - | - | - | | | | | | | 2,186 | 378 | | 788 | 33 | 27 | | | | | | | |
(1) Cresca is a joint venture between the Company and Carlos Casado S.A. with agriculture operations in Paraguay. (2) Mehadrin is a company engaged in the production and exports of citrus, fruits and vegetables. The Group has entered into a joint venture agreement in relation to this company. (3) The group also has interest in a number of individually immaterial joint ventures that are accounted for using the equity method. (i) As per financial statements for the six-month period ended June 30, 2016. (*) Amounts in millions of NIS. Cresud Sociedad Anónima, Comercial, Inmobiliaria, Financiera y Agropecuaria Notes to the Consolidated Financial Statements(Continued) (All amounts in millions of Argentine Pesos, except otherwise indicated) 8. Interests in joint ventures (Continued) Information about significant joint ventures Set out below is the summarized financial information for those joint ventures that are material to the Group: | | As of June 30, 2016 | | Year ended June 30, 2016 | | | Current assets | | Non-current assets | | Current liabilities | | Non- current liabilities | | Net assets | | Dividends distribution | | Net assets at end of the year | | % of ownership interest held | | Investments in joint venture | | Goodwill and others | | Net book amount | | Revenues | | Net Income / (loss) | | Total comprehensive income | | Cash od operating activities | | Cash of investment activities | | Cash of financial activities | | Changes in cash and cash equivalents | | Cresca S.A. | 144 | | 668 | | 325 | | 25 | | 462 | | - | | 462 | | 50% | | 231 | | (1) | | 230 | | 120 | | 6 | | (6) | | 77 | | (60) | | - | | 17 | | Mehadrin | 2,475 | | 2,814 | | 2,678 | | 673 | | 1,938 | | - | | 1,938 | | 45.41% | | 880 | | 105 | | 985 | | (*) 819 | | (*) 68 | | (*) 68 | | (*) 96 | | (*) (4) | | (*) 64 | | (*) 156 |
| | As of June 30, 2015 | | Year ended June 30, 2015 | | | Current assets | | Non-current assets | | Current liabilities | | Non- current liabilities | | Net assets | | Dividends distribution | | Net assets at end of the year | | % of ownership interest held | | Investments in joint venture | | Goodwill and others | | Net book amount | | Revenues | | Net Income / (loss) | | Total comprehensive income | | Cash od operating activities | | Cash of investment activities | | Cash of financial activities | | Changes in cash and cash equivalents | | Cresca S.A. | 71 | | 544 | | 54 | | 205 | | 356 | | - | | 356 | | 50% | | 178 | | (1) | | 177 | | 52 | | (3) | | 56 | | - | | - | | - | | - | | Cyrsa | 17 | | 43 | | 24 | | 1 | | 35 | | 31 | | 35 | | 50% | | 18 | | - | | 18 | | 11 | | 14 | | 14 | | 7 | | (7) | | 1 | | 1 | | Puerto Retiro (i) | 1 | | 46 | | 4 | | 9 | | 34 | | - | | 34 | | 50% | | 17 | | 28 | | 45 | | 2 | | (2) | | (2) | | (2) | | - | | 3 | | 1 | | Quality (ii) | 4 | | 150 | | 6 | | 2 | | 146 | | - | | 146 | | 50% | | 73 | | 1 | | 74 | | 16 | | 4 | | 4 | | (16) | | - | | 15 | | (1) |
(i) On April 18, 2000, Puerto Retiro was notified of a filing made by the National Government, through the Ministry of Defense, to extend the petition in bankruptcy of Indarsa to Puerto Retiro. At the request of plaintiff, the bankruptcy court for the Buenos Aires District issued an order restraining the ability of Puerto Retiro to sell or dispose in any manner the land. Indarsa had acquired 90% of the capital stock of Tandanor to a formerly estate owned company in 1991. Indarsa did not comply with the payment of the outstanding price for the acquisition of the stock of Tandanor, and therefore the Ministry of Defense requested the bankruptcy of Indarsa, pursuing to extend the bankruptcy to Puerto Retiro. In addition, Tandanor filed a civil action against Puerto Retiro and other accused parties in the criminal case for violation of section 174 subsection 5, under section 173 subsection 7 of Criminal Code. The claim expects that upon invalidation of executive order that approved the bid of Dársena Norte plot of land, Tandanor be reimbursed any other sum of money that it claims to have lost due to the alleged fraudulent purchase-sale transaction of the real property disputed in the case. The Management and legal advisors of Puerto Retiro estimate that there are legal and technical arguments sufficient to consider that the request for bankruptcy will be denied by the court. However, given the current status of the case, we cannot predict its outcome. On July 12, 2016, Puerto Retiro S.A. has been notified of a ruling rendered by the Federal Court 5 which decided on the defenses raised by all co-defendants in the civil case. As regards the defenses raised by Puerto Retiro S.A., the Court rejected them on the grounds of legal defect and lack of procedural standing as defendant, whereas in relation to the lack of standing to sue and the statute of limitations defense, it deferred its treatment until it renders a judgment on the merits of the case. Puerto Retiro S.A. has filed a remedy for reversal with right to an appeal, challenging both defenses. (ii) In March 2011, Quality purchased an industrial plant located in San Martín, Province of Buenos Aires. The facilities have the necessary features and scales for multiple uses. On January 20, 2015, Quality entered into an Urbanization Agreement with the Municipality of San Martín which contemplates a monetary compensation to the City Council totaling Ps. 40, payable in two installments of Ps. 20 each. The first of such installments was actually paid on June 30, 2015. On January 5, 2016 the Official Bulletin of the Province of Buenos Aires published the Order of Provincial Ratification (of the Municipal Ordinance), whereby the urban parameters originally requested entered into full force, thus concluding the legislative enactment process. Even though validation is a condition precedent to the Agreement’s effectiveness, the obligation to pay the second installment will not become in force until the first drawing is registered with the Dirección de Geodesia (Geodesy Office) of the province of Buenos Aires. Quality is assessing several alternatives in order to file the plan with the final project.
(*) Amount in million of NIS. Cresud Sociedad Anónima, Comercial, Inmobiliaria, Financiera y Agropecuaria Notes to the Consolidated Financial Statements(Continued) (All amounts in millions of Argentine Pesos, except otherwise indicated) 9. Investments in associates Evolution of the Group’s investment in associates for the years ended June 30, 2016 and 2015 were as follows: | | June 30, 2016 | | June 30, 2015 | | Beginning of the year | 2,031 | | 1,803 | | Acquisition / increase in equity interest in associates | 157 | | 1,257 | | Unrealized profit / (loss) from investments at fair value | 77 | | (1,001) | | Decrease for IDBD business combination | (1,047) | | - | | Associates incorporated by business combination (Note 3) | 8,308 | | - | | Capital contribution | 180 | | 31 | | Share of profit / (loss) | 311 | | (30) | | Currency translation adjustment | 4,173 | | 53 | | Cash dividends (ii) | (518) | | (18) | | Sale of equity interest in associates | (4) | | (34) | | Reclassification to financial instruments | - | | (30) | | Hedging instruments | (93) | | - | | Defined benefit plans | (10) | | - | | Impairment | (58) | | - | | End of the year (i) | 13,507 | | 2,031 |
(i) Includes a balance of Ps. (841) and Ps. (363) reflecting interests in companies with negative equity as of June 30, 2016 and 2015, respectively, which are reclassified to “Provisions” (Note 22). (ii) During the fiscal year ended June 30, 2016 the balance corresponds Ps. 10 to Millenium, Ps. 495 to Adama, Ps. 10 to Emco and Ps. 3 to Agro-Uranga. During the fiscal year ended June 30, 2015 the balance corresponds to dividends received from BHSA. Cresud Sociedad Anónima, Comercial, Inmobiliaria, Financiera y Agropecuaria Notes to the Consolidated Financial Statements(Continued) (All amounts in millions of Argentine Pesos, except otherwise indicated) 9. Interests in associates (Continued) The table below shows the value of the Group´s interest in associates for the years ended June 30, 2016 and 2015, as well as the Group’s interest in comprehensive income/(loss) of these companies for the fiscal years ended June 30, 2016, 2015 and 2014: | Name of the entity | Place of business / country of incorporation | Main activity | Nature of the relationship | Common shares 1 vote | Value of Group's interest in equity | Group's interest in comprehensive income / (operations) | % of ownership interest held | | | | | June 30, | June 30, | June 30, | Last financial statement issued | | 2016 | 2015 | 2016 | 2015 | 2014 | 2016 | 2015 | 2014 | Share capital (nominal value) | Profit / (Loss) for the year | Shareholders' equity | | BHSA | Argentina | Financing | (1) | 448,689,072 | 1,609 | 1,356 | 259 | 143 | 184 | 29.91% | 29.99% | 29.77% | 1,500 | 837 | 5,234 | | IDBD | Israel | Investment | (2) | 324,445,664 | - | 908 | 137 | (917) | (508) | N/A | 49.00% | 26.65% | - | - | - | | Adama | Israel | Agrochemical | (3) | 55,196,352 | 10,847 | - | 4,141 | - | - | 40% | N/A | N/A | (**) 138 | (**) 319 | (**) 6,155 | | PBEL | India | Real Estate | (4) | 450,000 | 864 | - | 194 | - | - | 45.40% | N/A | N/A | (**) 1 | (**) (29) | (**) (523) | Agro-Uranga S.A.
| Argentina | Agricultural | | 893,069 | 54 | 30 | 26 | 1 | 11 | 35.72% | 35.72% | 35.72% | 3 | 74 | 119 | Others associates
| | | (5) | | 133
| (263)
| (254) | (205) | (145) | N/A | N/A | N/A | - | - | - | | | | | | | 13,507 | 2,031 | 4,503 | (978) | (458) | | | | | | |
(1) BHSA is a full-service commercial bank offering a wide variety of banking activities and related financial services to individuals, small- and medium-sized companies and large corporations. (2) The Group acquired IDBD on May 7, 2014. IDBD is one of the Israeli biggest and most diversified investment groups. The Group has valued its interest in IDBD at fair value through profit or loss according to an exemption under IAS 28. See Note 3 for further information. Since interest in IDBD was valued at fair value, participation in financial statements and other comprehensive statement of income of IDBD is not shown in the table above. Share market value was 1.957 NIS as of June 30, 2015. (Note 3) (3) Adama is specialized in the chemical industry, mainly, in the agrochemical industry. (4) PBEL is a real estate company with developments mainly in India. (5) The group also has interest in a number of individually immaterial associates that are accounted for using the equity method. (*) Amount in million of dollars. (**) Amount in million of NIS. Cresud Sociedad Anónima, Comercial, Inmobiliaria, Financiera y Agropecuaria Notes to the Consolidated Financial Statements(Continued) (All amounts in millions of Argentine Pesos, except otherwise indicated) 9. Interests in associates (Continued) Information about significant associates Set out below are the summarized financial information of the significant Group's associates as of June 30, 2016 and 2015: | | As of June 30, 2016 | | Year ended June 30, 2016 | | | Current assets | | Non-current assets | | Current liabilities | | Non- current liabilities | | Net assets | | Dividends distribution | | Net assets at end of the year (i) | | % of ownership interest held | | Interest in associates | | Goodwill and others | | Net book amount | | Revenues | | Net income / (loss) | | Total comprehensive income | | Cash on operating activities | | Cash of investment activities | | Cash financial activities | | Changes in cash and cash equivalents | | BHSA | 20,307 | | 20,544 | | 28,255 | | 7,244 | | 5,352 | | - | | 5,234 | | (ii) 30.66% | | 1,605 | | 4 | | 1,609 | | 6,821 | | 837 | | 837 | | (9,462) | | (410) | | 4,099 | | (2,756) | | Adama | 41,879 | | 25,470 | | 23,018 | | 20,336 | | 23,995 | | 495 | | 23,995 | | 40.00% | | 9,598 | | 1,249 | | 10,847 | | 5,854 | | 328 | | 265 | | 87 | | (337) | | (825) | | (1,075) | | PBEL | 1,510 | | 257 | | 354 | | 3,456 | | (2,043) | | - | | (2,043) | | 45.40% | | (928) | | 1,792 | | 864 | | - | | (*) (30) | | (*) (28) | | (*) 45 | | (*) (18) | | (*) (28) | | (*) (1) |
| | As of June 30, 2015 | | Year ended June 30, 2015 | | | Current assets | | Non-current assets | | Current liabilities | | Non- current liabilities | | Net assets | | Dividends distribution | | Net assets at end of the year (i) | | % of ownership interest held | | Interest in associates (iii) | | Goodwill and others | | Net book amount | | Revenues | | Net income / (loss) | | Total comprehensive income | | Cash on operating activities | | Cash of investment activities | | Cash financial activities | | Changes in cash and cash equivalents | | BHSA | 24,850 | | 10,234 | | 26,893 | | 3,725 | | 4,466 | | 13 | | 4,398 | | (ii) 30.74% | | 1,352 | | 4 | | 1,356 | | 4,500 | | 461 | | 461 | | (3,334) | | (46) | | 1,515 | | 193 | | IDBD (iii) | 30,344 | | 64,935 | | 24,209 | | 61,684 | | 9,386 | | - | | 9,386 | | 49% | | N/A | | N/A | | 1,529 | | 43,296 | | 713 | | 151 | | 2,909 | | 1,389 | | (4,505) | | (207) |
(i) Net of non-controlling interest. (ii) Considering the effect of treasury shares. (iii) The book value has been computed based on the fair value of the investment (Note 3). (*) Amount in million of NIS. Cresud Sociedad Anónima, Comercial, Inmobiliaria, Financiera y Agropecuaria Notes to the Consolidated Financial Statements(Continued) (All amounts in millions of Argentine Pesos, except otherwise indicated) 9. Interests in associates (Continued) BHSA In accordance with the regulations of the “BCRA”, there are certain restrictions on the distribution of profits by BHSA. The fair value of the Group’s investment in BHSA was estimated based on the present value of future business cash flows. The principal premises used to calculate the fair value as of June 30, 2016 were the following: -
The Group considered the period 2017-2024 as horizon for the projection of BHSA cash flows. -
The “Private BADLAR” interest rate was projected based on internal data and information gathered from external consultants. -
The projected exchange rate was estimated in accordance with internal data and external information provided by independent consultants. -
The discount rate used to discount real dividend flows and calculate the fair value is 12.41%. Based on the described premises, the Group estimated the fair value of its investment in BHSA as of June 30, 2016 to be Ps. 3,246. Adama Adama is specialized in the chemical industry, mainly, in the agrochemical industry. In this framework, Adama is engaged in developing, manufacturing and selling crop protection products, while also operating in other areas based on its basic capacities (the agricultural and chemical sectors), but to a immaterial extent. In 2011, Koor (a wholly own subsidiary of DIC) sold 60% of Adama’s shares to China National Agrochemical Corporation (“ChemChina”) and was also granted a non-recourse loan in the aggregate amount of US$ 960 million, which is secured by the remaining 40% of ADAMA shares held by Koor as of June 30, 2016. The loan is disclosed in Note 21 under non-current loans. On July 17, 2016 DIC informed the market that it has accepted the tender offer by ChemChina who intends to acquire 40% of Adama’s shares currently held by Koor, indirectly controlled by IDBD through DIC. In August 2016, Koor and a subsidiary of ChemChina executed the corresponding agreement. The price of the transaction includes a payment in cash of US$ 230 million plus the total repayment of the non-recourse loan and its interests, which had been granted to Koor by a Chinese bank.
The Group expects that this sale transaction will be finalized during November, 2016, subject to compliance with certain conditions, including obtaining approvals by the Chinese regulatory and antitrust authorities. Cresud Sociedad Anónima, Comercial, Inmobiliaria, Financiera y Agropecuaria Notes to the Consolidated Financial Statements(Continued) (All amounts in millions of Argentine Pesos, except otherwise indicated) Changes in the Group’s investment properties for the years ended June 30, 2016 and 2015 were as follows: | | Leased-out farmland | | Rental properties (iii) | | Undeveloped parcels of land | | Properties under development | | Total (iv) | | At July 1, 2014 | | | | | | | | | | | Costs | 53 | | 4,244 | | 422 | | 364 | | 5,083 | | Accumulated depreciation | (2) | | (1,626) | | - | | - | | (1,628) | | Net book amount | 51 | | 2,618 | | 422 | | 364 | | 3,455 | | Year ended June 30, 2015: | | | | | | | | | | | Opening net book amount | 51 | | 2,618 | | 422 | | 364 | | 3,455 | | Additions | 8 | | 66 | | 2 | | 186 | | 262 | | Reclassifications to trading properties | - | | (3) | | - | | - | | (3) | | Reclassification of property, plant and equipment | 41 | | 20 | | - | | - | | 61 | | Reclassification to property, plant and equipment | (12) | | (8) | | - | | (9) | | (29) | | Transfers (ii) | - | | 514 | | 25 | | (539) | | - | | Disposals | - | | (103) | | (3) | | (2) | | (108) | | Depreciation charges (i) | (5) | | (152) | | - | | - | | (157) | | Currency translation adjustment | (6) | | - | | - | | - | | (6) | | Closing net book amount | 77 | | 2,952 | | 446 | | - | | 3,475 | | At June 30, 2015 | | | | | | | | | | | Costs | 84 | | 4,599 | | 446 | | - | | 5,129 | | Accumulated depreciation | (7) | | (1,647) | | - | | - | | (1,654) | | Net book amount | 77 | | 2,952 | | 446 | | - | | 3,475 | | Year ended June 30, 2016: | | | | | | | | | | | Opening net book amount | 77 | | 2,952 | | 446 | | - | | 3,475 | | Assets incorporated by business combination (Note 3) | - | | 25,256 | | 1,439 | | 2,891 | | 29,586 | | Currency translation adjustment | 8 | | 14,437 | | 805 | | 1,512 | | 16,762 | | Additions | - | | 260 | | 11 | | 919 | | 1,190 | | Reclassification to trading properties | - | | (4) | | (67) | | - | | (71) | | Transfers | - | | 1,330 | | (67) | | (1,263) | | - | | Reclassification to property, plant and equipment | (74) | | 63 | | - | | (1) | | (12) | | Reclassification of property, plant and equipment | (1) | | - | | - | | - | | (1) | | Impairment (Note 33) | - | | (182) | | (77) | | (80) | | (339) | | Disposals | (1) | | (272) | | (7) | | - | | (280) | | Depreciation charges (i) | - | | (538) | | (6) | | - | | (544) | | Closing net book amount | 9 | | 43,302 | | 2,477 | | 3,978 | | 49,766 | | At June 30, 2016 | | | | | | | | | | | Costs | 14 | | 45,517 | | 2,485 | | 3,978 | | 51,994 | | Accumulated depreciation | (5) | | (2,215) | | (8) | | - | | (2,228) | | Net book amount | 9 | | 43,302 | | 2,477 | | 3,978 | | 49,766 |
(i) Depreciation charges of investment property has been charged in “Costs” in the income statement (Note 30). (ii) Includes transfers due to the inauguration of Alto Comahue and Distrito Arcos Shopping Centers. (iii) Distrito Arcos - Injuction: In December 2013, the Judicial Branch confirmed an injunction order that suspended the opening of the shopping center on the grounds that it did not have certain governmental permits in the context of two legal proceedings, where a final decision has been rendered for the company. The plaintiff filed a petition for the continuation of the preliminary injunction by means of an extraordinary appeal of unconstitutionality which was by the lower and appellate courts; consequently, it filed an appeal with the Supreme Court of Justice of the Autonomous City of Buenos Aires, which so far has not rendered a decision. Nowadays, the Shopping Center Distrito Arcos is open to the public and operating normally.
Distrito Arcos - Concession status: The National State issued Executive Order 1723/2012 whereby several plots of land located in prior rail yards of Palermo, Liniers and Caballito rail stations ceased to be used for rail purposes, in order to be used for development of integral urbanization projects. In this respect and as part of several measures related to other licensed persons and/or concessionaires, we have notified in the file of proceedings the corresponding Resolution 170/2014 revoking the Contract for Reformulation of the Concession of Rights of use and Development No. AF000261 issued by the Agencia de Administración de Bienes del Estado (State Assets Administration Office, or AABE as per its Spanish acronym). It should further be pointed out that such measure: (i) has not been adopted due to non-compliance of our subsidiary; (ii) to date has not involved the interruption of the commercial development or operation of the shopping center, which continues to operate under normal conditions. Notwithstanding the foregoing, Arcos del Gourmet S.A. has filed the relevant administrative remedies (appeal) and has also filed a judicial action requesting that the revocation of such concession be overruled. Furthermore, it has started a so-called “juicio de consignación”, that is an action where the plaintiff deposits with the court sums of money that the defendant refuses to accept. Under this legal action, the company has deposited in due time and form all rental payments under the Contract for Reformulation of the Concession of Rights of Use and Development, which the Company considers to have been unduly revoked. (iv) Certain of the Group’s investment property assets have been mortgaged or otherwise restricted to secure some of the Group’s borrowings and other payables. Book amount of those properties amounts to Ps. 15,544, Ps. 61 and Ps. 154 as June 30, 2016, 2015 and 2014, respectively. Cresud Sociedad Anónima, Comercial, Inmobiliaria, Financiera y Agropecuaria Notes to the Consolidated Financial Statements(Continued) (All amounts in millions of Argentine Pesos, except otherwise indicated) 10. Investment properties (Continued) The following amounts have been recognized in the statement of income: | | June 30, 2016 | | June 30, 2015 | | June 30, 2014 | | Rental and services income | 5,264 | | 2,995 | | 2,449 | | Cost of rental and services | (2,396) | | (1,234) | | (1,142) | | Development expenses | (11) | | (4) | | (2) | | Gain from disposal of investment properties | 1,101 | | 1,150 | | 231 |
As of June 30, 2016 and 2015, fair value of investment properties corresponding to the urban properties and investment business of the operations center in Argentina, amounts to Ps. 28,304 and Ps. 22,446, respectively. The fair values are based on comparable values of certain qualified external appraisers (Level 2 of fair value hierarchy) except in the case of shopping centers, where fair value is based on the market capitalization valuation (Level 3 of the fair value hierarchy). In the first case, sale prices of comparable properties are adjusted considering the specific aspects of each property, being the square meter the most relevant premise. In the second case, was computed considering the specific aspects of each property using a weighted average capitalization rate of 10.9% and 12%, respectively (a 9.8% to 13.3% range was considered for fiscal year 2016 and 10% to 15% for fiscal year 2015). As of June 30, 2016, the fair value of investment properties of the operations center in Israel, amounts to Ps. 48,032. The fair values are based on valuations performed by independent appraisers, who used the methodologies of discounted cash flows and market capitalization rates, as appropriate (Level 3 and 2 of the fair value hierarchy). Independent appraisers estimated cash flows of the properties to which they applied discount rates and / or capitalization rates according to market data. They were determined considering the specific characteristics of each asset (location, sales, occupation, surface condition and type of property, etc.). Discount rates used ranged fron 7% to 10% and capitalization rate used ranged from 6% to 11%. The average occupancy of the properties was 96%. Cresud Sociedad Anónima, Comercial, Inmobiliaria, Financiera y Agropecuaria Notes to the Consolidated Financial Statements(Continued) (All amounts in millions of Argentine Pesos, except otherwise indicated) 11. Property, plant and equipment Changes in the Group’s property, plant and equipment for the years ended June 30, 2016 and 2015 are as follows: | | Owner occupied farmland (iii) | | Buildings and facilities | | Machinery and equipment | | Communication networks | | Others (i) | | Total | | At July 1, 2014 | | | | | | | | | | | | | Cost | 2,261 | | 545 | | 37 | | - | | 192 | | 3,035 | | Accumulated depreciation | (204) | | (302) | | (20) | | - | | (127) | | (653) | | Net book amount | 2,057 | | 243 | | 17 | | - | | 65 | | 2,382 | | Year ended June 30, 2015: | | | | | | | | | | | | | Opening net book amount | 2,057 | | 243 | | 17 | | - | | 65 | | 2,382 | | Currency translation adjustment | (223) | | (6) | | - | | - | | (7) | | (236) | | Additions | 144 | | 40 | | 23 | | - | | 17 | | 224 | | Reclassifications of investment properties | 12 | | 8 | | 5 | | - | | 4 | | 29 | | Reclassifications to investment properties | (41) | | (20) | | - | | - | | | | (61) | | Disposals | (255) | | (7) | | | | - | | (4) | | (266) | | Depreciation charge (ii) | (54) | | (19) | | (9) | | - | | (13) | | (95) | | Closing net book amount | 1,640 | | 239 | | 36 | | - | | 62 | | 1,977 | | At June 30, 2015 | | | | | | | | | | | | | Cost | 1,833 | | 560 | | 125 | | - | | 140 | | 2,658 | | Accumulated depreciation | (193) | | (321) | | (89) | | - | | (78) | | (681) | | Net book amount | 1,640 | | 239 | | 36 | | - | | 62 | | 1,977 | | Year ended June 30, 2016: | | | | | | | | | | | | | Opening net book amount | 1,640 | | 239 | | 36 | | - | | 62 | | 1,977 | | Incorporated by business combination (Note 3) | - | | 8,224 | | 1,719 | | 3,536 | | 1,625 | | 15,104 | | Currency translation adjustment | 401 | | 4,840 | | 1,018 | | 2,034 | | 901 | | 9,194 | | Additions | 64 | | 392 | | 291 | | 310 | | 203 | | 1,260 | | Reclassifications of investment properties | 84 | | (72) | | - | | - | | - | | 12 | | Reclassifications to investment properties | 1 | | - | | - | | - | | - | | 1 | | Disposals | - | | - | | - | | - | | (1) | | (1) | | Impairments (Note 33) | - | | (10) | | - | | (3) | | - | | (13) | | Depreciation charge (ii) | (52) | | (278) | | (251) | | (467) | | (186) | | (1,234) | | Closing net book amount | 2,138 | | 13,335 | | 2,813 | | 5,410 | | 2,604 | | 26,300 | | At June 30, 2016 | | | | | | | | | | | | | Cost | 1,957 | | 13,970 | | 3,203 | | 5,974 | | 2,852 | | 27,956 | | Accumulated depreciation | 181 | | (635) | | (390) | | (564) | | (248) | | (1,656) | | Net book amount | 2,138 | | 13,335 | | 2,813 | | 5,410 | | 2,604 | | 26,300 |
(i) Includes furniture and fixtures, vehicles and aircrafts. (ii) For the fiscal years ended June 30, 2016 and 2015, depreciation charges of property, plant and equipment were included in “Costs” for an amount of Ps. 693 and Ps. 88, "General and administrative expenses" for an amount of Ps. 131 and Ps. 6 and “Selling expenses” for an amount of Ps. 413 and Ps. 1, respectively in the statement of income. (iii) The active establishments include (Cremaq, Jatobá, Preferencia, Chaparral, Araucaria and Planta frigorífica) have been mortgaged to secure certain Group's borrowings for a total amount of Ps. 844 and Ps. 855 as of June 30, 2016 and 2015, respectively Cresud Sociedad Anónima, Comercial, Inmobiliaria, Financiera y Agropecuaria Notes to the Consolidated Financial Statements(Continued) (All amounts in millions of Argentine Pesos, except otherwise indicated) Changes in the Group’s trading properties for the years ended June 30, 2016 and 2015 are as follows: | | Completed properties | | Properties under development (i) | | Undeveloped sites (ii) | | Total | | At July 1, 2014 | 7 | | 119 | | 11 | | 137 | | Additions | - | | 1 | | - | | 1 | | Currency translation adjustment | - | | (6) | | - | | (6) | | Reclassifications of investment properties | - | | - | | 3 | | 3 | | Disposals | (2) | | - | | - | | (2) | | At June 30, 2015 | 5 | | 114 | | 14 | | 133 | | Additions | 51 | | 291 | | 13 | | 355 | | Currency translation adjustment | 73 | | 1,120 | | 457 | | 1,650 | | Reclassifications of investment properties | - | | 67 | | 4 | | 71 | | Disposals | (1) | | (151) | | - | | (152) | | Transfers | - | | 142 | | (142) | | - | | Assets incorporated by business combination (see Note 3) | 108 | | 1,724 | | 824 | | 2,656 | | At June 30, 2016 | 236 | | 3,307 | | 1,170 | | 4,713 |
(i) Include Liveck´s plots of land have been mortgaged to secure Group's borrowings. The net book value of these assets amounts to Ps. 156 and Ps. 106 as of June 30, 2016 and 2015, respectively. Additionally, the Group has contractual obligations not provisioned related to these plots of land committed when certain properties were acquired or real estate projects were approved, and amounts to Ps. 120 and Ps. 71, respectively. The projected developments are expected to be completed in 2029. (ii) The Group is owner of an air space of approximately 23,000 square meters area on top of Hipermercado Coto, near the Abasto Shopping Center. The Group acquired rights to receive functional units, parking spaces, and the rights to increase the height of such property. On June 2016, a conditional Exchange Agreement was executed for a one year term, to be later formalized through the execution of a conveyance deed. The project will be a residential development for a consideration of apartments covering an area of 3,621 square meters plus US$ 1 million. The consideration will be delivered no later than June 2021 for Tower I, and no later than September 2022 for Tower II. The value in the bill of sale was set at US$ 7.5 million. The Group also owns a plot of land next to Córdoba Shopping. In May 2016, an Exchange Agreement was executed for a building capacity of 13,500 square meters, subject to conditions for a term of one year, after which it may be formalized through a title conveyance deed. The project will be a mixed development, combining residential and office space, and the consideration will include apartments covering 2,160 square meters, parking space, and procedures to obtain permits, combinations and subdivisions of 3 plots of land. Delivery of the consideration will take place no later than May 2021 for Tower I and no later than July 2023 for Tower II. The Exchange Value was set at US$ 4 million. Both above-mentioned contracts that are part of the Coto residential project and the Córdoba Shopping exchange project include conditions precedent and/or suspensive clauses | | June 30, 2016 | | June 30, 2015 | | Non-current | 4,472 | | 130 | | Current | 241 | | 3 | | Total | 4,713 | | 133 |
Cresud Sociedad Anónima, Comercial, Inmobiliaria, Financiera y Agropecuaria Notes to the Consolidated Financial Statements(Continued) (All amounts in millions of Argentine Pesos, except otherwise indicated) 13. Intangible assets Changes in the Group’s intangible assets for the years ended June 30, 2016 and 2015 are as follows: | | Goodwill | | Trademarks | | Licenses | | Customer relations | | Information systems and software | | Contracts and others (ii) (iii) | | Total | | At July 1, 2014 | | | | | | | | | | | | | | | Cost | 30 | | - | | - | | - | | 36 | | 137 | | 203 | | Accumulated amortization | - | | - | | - | | - | | (27) | | (2) | | (29) | | Net book amount | 30 | | - | | - | | - | | 9 | | 135 | | 174 | | Year ended June 30, 2015 | | | | | | | | | | | | | | | Opening net book amount | 30 | | - | | - | | - | | 9 | | 135 | | 174 | | Currency translation adjustment | (2) | | - | | - | | - | | (1) | | - | | (3) | | Additions | - | | - | | - | | - | | 7 | | 5 | | 12 | | Amortization charge (i) | - | | - | | - | | - | | (5) | | (2) | | (7) | | Closing net book amount | 28 | | - | | - | | - | | 10 | | 138 | | 176 | | At June 30, 2015 | | | | | | | | | | | | | | | Cost | 28 | | - | | - | | - | | 41 | | 142 | | 211 | | Accumulated amortization | - | | - | | - | | - | | (31) | | (4) | | (35) | | Net book amount | 28 | | - | | - | | - | | 10 | | 138 | | 176 | | Year ended June 30, 2016 | | | | | | | | | | | | | | | Opening net book amount | 28 | | - | | - | | - | | 10 | | 138 | | 176 | | Assets incorporated by business combination (Note 3) | 1,391 | | 2,131 | | 515 | | 2,474 | | 635 | | 848 | | 7,994 | | Currency translation adjustment | 819 | | 1,243 | | 292 | | 1,327 | | 363 | | 455 | | 4,499 | | Additions | - | | - | | - | | - | | 137 | | - | | 137 | | Disposals | - | | - | | - | | - | | (1) | | - | | (1) | | Amortization charge (i) | - | | (19) | | (48) | | (582) | | (187) | | (155) | | (991) | | Closing net book amount | 2,238 | | 3,355 | | 759 | | 3,219 | | 957 | | 1,286 | | 11,814 | | At June 30, 2016 | | | | | | | | | | | | | | | Cost | 2,238 | | 3,378 | | 817 | | 3,923 | | 1,202 | | 1,478 | | 13,036 | | Accumulated amortization | - | | (23) | | (58) | | (704) | | (245) | | (192) | | (1,222) | | Net book amount | 2,238 | | 3,355 | | 759 | | 3,219 | | 957 | | 1,286 | | 11,814 |
(i) Amortization charges of intangible assets are included in “General and administrative expenses” in the statement of income. (Note 30). There are no impairment charges for any of the years presented. (ii) Includes "Rights of use". Correspond to Distrito Arcos Depreciation began in January, 2015, upon delivery of the shopping center. (iii) Includes "Right to receive future units under barter agreements". Correspond to in kind receivables representing the right to receive residential apartments in the future under barter agreements. The ongoing transactions are: A) Caballito: on June 29, 2011, the Group and TGLT entered into a barter agreement for US$ 12.8 million. A neighborhood association secured a preliminary injunction that suspended the works to be carried out by TGLT in the property. Once said preliminary injunction was deemed final, the Government of the City of Buenos Aires and TGLT were served notice of the complaint. The Group is not involved in these proceedings and has not been sued or summoned as a third party by any of the parties involved in the legal action. B) Beruti: on October 13, 2010, the Group and TGLT entered into an agreement for US$ 18.8 million. An association named Asociación Amigos Alto Palermo presented an injunction requesting the prohibition of the construction and obtained a suspense interim measure for this purpose. Later, the Court of Appeals from the Autonomous City of Buenos Aires ordered the lifting of such interim measure suspending the continuation of the work. On June 11, 2015 final judgment was rendered in favor of IRSA CP and TGLT. Cresud Sociedad Anónima, Comercial, Inmobiliaria, Financiera y Agropecuaria Notes to the Consolidated Financial Statements(Continued) (All amounts in millions of Argentine Pesos, except otherwise indicated) Changes in the Group’s biological assets for the years ended June 30, 2016 and 2015 are as follows: | Agricultural business | | | Crops fields | Sugarcane fields | Cattle | Dairy | Other cattle | Others | Total | | At June 30, 2014 | 147 | 143 | 303 | 37 | 6 | 5 | 641 | | Purchases | - | - | 14 | - | 1 | - | 15 | | Initial recognition and changes in fair value of biological assets (i) | 897 | 162 | 162 | 13 | - | 1 | 1,235 | | Decrease due to harvest | (960) | (198) | - | - | - | - | (1,158) | | Sales | - | - | (118) | (10) | - | - | (128) | | Addition from lease agreement | - | 22 | - | - | - | - | 22 | | Consume | - | - | (1) | - | - | (1) | (2) | | Currency translation adjustment | (30) | (16) | - | - | - | - | (46) | | At June 30, 2015 | 54 | 113 | 360 | 40 | 7 | 5 | 579 | | Purchases | - | - | 31 | - | 4 | - | 35 | | Initial recognition and changes in fair value of biological assets (i) | 1,016 | 341 | 244 | 20 | 3 | 3 | 1,627 | | Decrease due to harvest | (749) | (296) | - | - | - | - | (1,045) | | Sales | - | - | (125) | (11) | (3) | - | (139) | | Consume | - | - | (1) | - | - | (1) | (2) | | Currency translation adjustment | 57 | 22 | (2) | - | - | - | 77 | | At June 30, 2016 | 378 | 180 | 507 | 49 | 11 | 7 | 1,132 |
(i) Biological assets with a production cycle of more than one year (that is, sugarcane and cattle) generated “Initial recognition and changes in fair value of biological assets” amounting to Ps. 608 and Ps. 337 for the years ended June 30, 2016 and 2015, respectively. For the years ended June 30, 2016 and 2015, amounts of Ps. 145 and Ps. 16, was attributable to price changes, and amounts of Ps. 124 and Ps. 144, was attributable to physical changes, respectively. Crops and oilseeds The Group’s crops generally include crops and oilseeds (corn, wheat, soybean and sunflower) as well as peanut. The Group measures biological assets that have attained significant biological growth at fair value less costs to sell. The Group measures biological assets that have not attained significant biological growth or when the impact of biological transformation on price is not expected to be material, at cost less any impairment losses, which approximates fair value. Cresud Sociedad Anónima, Comercial, Inmobiliaria, Financiera y Agropecuaria Notes to the Consolidated Financial Statements(Continued) (All amounts in millions of Argentine Pesos, except otherwise indicated) 14. Biological assets (Continued) The following table shows the stages and average periods where the Group´s crops have a significant biological growth, based on agronomical studies and other inputs: Argentina | Crops | Total days (planting/harvest) | Average days (planting/harvest) | Significant biological growth | Total days (planting/significant growth) | Average days (planting/significant growth) | | Wheat | From 150 to 180 | 165 | 7 (milk grain stage) | From 110 to 140 | 125 | | Corn | From 150 to 180 | 165 | R3 (milk grain stage) | From 80 to 110 | 95 | | Soybeans | From 120 to 160 | 140 | R5 (beginning of seed filling) | From 75 to 90 | 82.5 | | Sunflowers | From 120 to 150 | 135 | R6 (end of flowering stage) | From 80 to 100 | 90 | | Peanut | From 180 to 270 | 240 | R5 (beginning of seed filling) | From 90 to 100 | 95 | | Cotton | From 130 to 180 | 155 | 3 (end of flowering stage) | From 90 to 120 | 105 |
Bolivia | Crops | Total days (planting/harvest) | Average days (planting/harvest) | Significant biological growth | Total days (planting/significant growth) | Average days (planting/significant growth) | | Wheat | From 100 to 112 | 106 | 7 (milk grain stage) | From 80 to 90 | 85 | | Corn | From 130 to 140 | 130 | R3 (milk grain stage) | From 88 to 96 | 92 | | Sorghum | From 110 to 130 | 120 | 7 (milk grain stage) | From 80 to 90 | 85 | | Soybeans | From 110 to 120 | 117 | R5 (Start of seed filling at node) | From 75 to 85 | 80 | | Sunflowers | From 105 to 115 | 110 | R6 (end of flowering stage) | From 75 to 85 | 80 |
Brazil | Crops | Total days (planting/harvest) | Average days (planting/harvest) | Significant biological growth | Total days (planting/significant growth) | Average days (planting/significant growth) | | Corn | From 125 to 150 | 137.5 | R3 (milk grain stage) | From 88 to 96 | 92 | | Soybeans | From 100 to 140 | 120 | R5 (Start of seed filling at node) | From 75 to 90 | 82.5 |
Sugarcane The Group’s sugarcane production is based in Brazil and to a lesser extent in Bolivia. This crop’s production requires specific weather conditions (tropical and subtropical climates) because it is a perennial and long-term crop with an average life cycle of five years. Each sugarcane planting generally yields five harvests. Once the production life cycle is over, crop renewal is brought about. The Group recognizes these crops at a fair value net of costs of sales from the moment of planting. Cresud Sociedad Anónima, Comercial, Inmobiliaria, Financiera y Agropecuaria Notes to the Consolidated Financial Statements(Continued) (All amounts in millions of Argentine Pesos, except otherwise indicated) 14. Biological assets (Continued) Fair value of biological assets When an active market exists for biological assets, the Group uses the quoted market price in the principal market as a basis to determine the fair value of its biological. Live cattle is measured at fair value less selling costs, based on market quoted at an auction involving cattle of the same age, breed and genetic merit adjusted, if applicable, to reflect any difference. When there is no active market or market-determined prices are not available, (for example, unharvested crops with significant growth), the Group determines the fair value of a biological asset in its present location and condition based on the present value of expected net cash flows from the biological asset discount (“DCF”). The DCF model requires the input of highly subjective assumptions including observable and unobservable data. The not observable information is determined based on the best information available for example, by reference to historical information of past practices and results, statistics and agricultural information and other analytical techniques. Key assumptions utilized in the DCF method include future market prices, estimated yields at the point of harvest and estimated future costs of harvesting and other costs. Market prices are generally determined by reference to observable data in the principal market for the agricultural produce. Harvesting costs and other costs are estimated based on historical and statistical data. Yields are estimated based on several factors including the location of the farmland and soil type, environmental conditions, infrastructure and other restrictions and growth at the time of measurement. Yields are subject to a high degree of uncertainty and may be affected by several factors out of the Group’s control including but not limited to extreme or unusual weather conditions, plagues and other crop diseases. The key assumptions discussed above are highly sensitive. Reasonable shifts in assumptions including but not limited to increases or decreases in prices, costs and discount factors used may result in a significant increase or decrease to the fair value of biological assets recognized at any given time. Cash flows are projected based on estimated production. Estimates of production in themselves are dependent on various assumptions, in addition to those described above, including but not limited to several factors such as location, environmental conditions and other restrictions. Changes in these estimates could materially impact on estimated production, and could therefore affect estimates of future cash flows used in the assessment of fair value. The valuation models and their assumptions are reviewed periodically, and, if necessary, adjusted. As of June 30 of each year, the Group’s biological assets that are subject to a valuation model include unharvested crops and sugarcane plantations. Cresud Sociedad Anónima, Comercial, Inmobiliaria, Financiera y Agropecuaria Notes to the Consolidated Financial Statements(Continued) (All amounts in millions of Argentine Pesos, except otherwise indicated) 14. Biological assets (Continued) The following tables present the Group’s biological assets as of June 30, 2016 and 2015 and their allocation to the fair value hierarchy: | | | June 30, 2016 | | | Classification | Level 1 | | Level 2 | | Level 3 | | Total | | Dairy | Production | - | | 49 | | - | | 49 | | Cattle | Production | - | | 432 | | - | | 432 | | Sugarcane fields | Production | - | | - | | 180 | | 180 | | Other cattle | Production | - | | 9 | | - | | 9 | | Others biological assets | Production | 7 | | - | | - | | 7 | | Total non-current biological assets | | 7 | | 490 | | 180 | | 677 | | Cattle and cattle for sale | Consumable | - | | 75 | | - | | 75 | | Other cattle | Consumable | - | | 2 | | - | | 2 | | Crops fields | Consumable | 23 | | - | | 355 | | 378 | | Total current biological assets | | 23 | | 77 | | 355 | | 455 | | Total biological assets | | 30 | | 567 | | 535 | | 1,132 |
| | | June 30, 2015 | | | Classification | Level 1 | | Level 2 | | Level 3 | | Total | | Dairy | Production | - | | 40 | | - | | 40 | | Cattle | Production | - | | 295 | | - | | 295 | | Sugarcane fields | Production | - | | - | | 113 | | 113 | | Other cattle | Production | - | | 6 | | - | | 6 | | Others biological assets | Production | 5 | | - | | - | | 5 | | Total non-current biological assets | | 5 | | 341 | | 113 | | 459 | | Cattle and cattle for sale | Consumable | - | | 65 | | - | | 65 | | Other cattle | Consumable | - | | 1 | | - | | 1 | | Crops fields | Consumable | 14 | | - | | 40 | | 54 | | Total current biological assets | | 14 | | 66 | | 40 | | 120 | | Total biological assets | | 19 | | 407 | | 153 | | 579 |
During years ended June 30, 2016 and 2015, there have been no transfers between the several tiers used in estimating the fair value of the Group’s biological assets, or reclassifications among their respective categories. The fair value less estimated point of sale costs of agricultural produce at the point of harvest amount to Ps. 1,097 and Ps. 1,218 for the years ended June 30, 2016 and 2015, respectively. Cresud Sociedad Anónima, Comercial, Inmobiliaria, Financiera y Agropecuaria Notes to the Consolidated Financial Statements(Continued) (All amounts in millions of Argentine Pesos, except otherwise indicated) 14. Biological assets (Continued) The following table presents the changes in Level 3 instruments for the years ended June 30, 2016 and 2015: | | Crops fields with significant biological growth | | Sugarcane fields | | At June 30, 2014 | 137 | | 143 | | Initial recognition and changes in the fair value of biological assets | 462 | | 162 | | Harvest | (558) | | (198) | | Lease contract | - | | 22 | | Currency translation adjustment | (1) | | (16) | | At June 30, 2015 | 40 | | 113 | | Initial recognition and changes in the fair value of biological assets | 836 | | 341 | | Harvest | (522) | | (296) | | Currency translation adjustment | 1 | | 22 | | At June 30, 2016 | 355 | | 180 |
Cresud Sociedad Anónima, Comercial, Inmobiliaria, Financiera y Agropecuaria Notes to the Consolidated Financial Statements(Continued) (All amounts in millions of Argentine Pesos, except otherwise indicated) 14. Biological assets (Continued) When no quoted prices in an active market are available, the Group uses a range of valuation models. The following table presents main parameters: | | | Pricing model | | | | | | Sensitivity (i) | | | | | | | | | 2016 | 2015 | 2014 | | Description | | | Parameters | | Range | | Increase | Decrease | Increase | Decrease | Increase | Decrease | | Cattle (Level 2) | | Comparable market prices | | Price per livestock head/kg and per category | | | | | | | | | | | Crops fields (Level 3) | | Discounted cash flows | | Yields – Operating costs –Selling expenses - Future of sale prices | | Argentina | | | | | | | | | Yields: 0.0 - 11.5 tn./ha. | | 42 | (42) | 8 | (8) | 19 | (19) | | Future of sale prices: 2,587 - 12,861 Ps./tn. | | 59 | (59) | 17 | (17) | 26 | (26) | | Operating cost: 833 - 7,659 Ps./ha. | | (24) | 24 | (11) | 11 | (14) | 14 | | | | | | | | | | | | | | | | Sugarcane fields (Level 3) | | Discounted cash flows | | Yields – Operating costs –Selling expenses - Future of sale prices Discount rate | | Brazil: | | | | | | | | | Yields: 86.06 tn./ha. | | 32 | (32) | 21 | (21) | 23 | (23) | | | | | Future of sale prices: 79.51 Rs./tn. | | 92 | (92) | 12 | (12) | 7 | (7) | | | | | Operating cost: 59.23 Rs./tn. | | (43) | 43 | (31) | 31 | (25) | 25 | | | | | | | | | | | | | | | | | Bolivia: | | | | | | | | | | | | Yields: 51 - 116 tn./ha. | | 7 | (7) | 5 | (5) | 4 | (4) | | | | | Future of sale prices: 23.50 - 23.40 US$/tn. | | 13 | (13) | 8 | (8) | 6 | (6) | | | | | Operating cost: 275 - 500 US$/ha. | | (9) | 9 | (5) | 5 | (3) | 3 | | | | | | | | Others: | | | | | | | |
(i) Sensitivities have been modeled considering a 10% change in the indicated variable, all else being equal. As of June 30, 2016 and 2015, the better and maximum use of biological assets shall not significantly differ from the current use. Cresud Sociedad Anónima, Comercial, Inmobiliaria, Financiera y Agropecuaria Notes to the Consolidated Financial Statements(Continued) (All amounts in millions of Argentine Pesos, except otherwise indicated) Breakdown of Group’s inventories as of June 30, 2016 and 2015 are as follows: | | June 30, 2016 | | June 30, 2015 | | Crops | 325 | | 270 | | Materials and inputs | 250 | | 154 | | Seeds and fodders | 109 | | 61 | | Beef | 31 | | 19 | | Hotel supplies | 9 | | 7 | | Goods for resale and supplies | 2,849 | | - | | Telephones and others communication equipment | 327 | | - | | Total inventories | 3,900 | | 511 |
As of June 30, 2016 and 2015 the cost of inventories recognized as expense amounted to Ps. 946 and Ps. 950, respectively and they have been included in “Costs” in the statements of income. 16. Financial instruments by category The following note shows the carrying amount of financial assets and financial liabilities by category of financial instrument and a reconciliation to the corresponding line item in the statements of financial position, as appropriate. Since the line items “Trade and other receivables” and “Trade and other payables” contain both financial instruments and non-financial assets or liabilities (such as prepayments, trade payables in-kind and tax payables), the reconciliation is shown in the columns headed “Non-financial assets” and “Non-financial liabilities”. Financial assets and liabilities measured at fair value are assigned based on their different levels in the fair value hierarchy. IFRS 9 defines the fair value of a financial instrument as the amount for which an asset could be exchanged, or a financial liability settled, between knowledgeable, willing parties in an arm’s length transaction. All financial instruments recognized at fair value are allocated to one of the valuation hierarchy levels of IFRS 7. This valuation hierarchy provides for three levels. In the case of Level 1, valuation is based on quoted prices (unadjusted) in active markets for identical assets or liabilities that the Company can refer to at the date of valuation. In the case of Level 2, fair value is determined by using valuation methods based on inputs directly or indirectly observable in the market. If the financial instrument concerned has a fixed contract period, the used inputs for valuation must be observable for the whole of this period. Cresud Sociedad Anónima, Comercial, Inmobiliaria, Financiera y Agropecuaria Notes to the Consolidated Financial Statements(Continued) (All amounts in millions of Argentine Pesos, except otherwise indicated) 16. Financial instruments by category (Continued) In the case of Level 3, the Group uses valuation techniques not based on inputs observable in the market. This is only permissible insofar as that information is not available. The inputs used reflect the Group’s assumptions regarding the factors which any market player would consider in their pricing. The Group’s Finance Division has a team in place in charge of estimating valuation of financial assets required to be reported in the financial statements, including the fair value of Level 3 instruments. The team directly reports to the Chief Financial Officer ("CFO"). The CFO and the valuation team discuss the valuation methods and results upon the acquisition of an asset and, if necessary, on a quarterly basis, in line with the Group’s quarterly reports. According to the Group’s policy, transfers among the several categories of valuation tiers are recognized when occurred, or when there are changes in the prevailing circumstances requiring the transfer. Financial assets and financial liabilities as of June 30, 2016 were as follows: | | Financial assets at amortized cost | | Financial assets at fair value through profit or loss | | Subtotal financial assets | | Non-financial assets | | Total | | | | | Level 1 | Level 2 | Level 3 | | | | | | | | June 30, 2016 | | | | | | | | | | | | | Assets as per statement of financial position | | | | | | | | | | | | | Trade and other receivables (excluding the allowance for doubtful accounts and other receivables) (Note 17) | 13,211 | | 102 | - | 1,931 | | 15,244 | | 2,878 | | 18,122 | | Investment in financial assets: | | | | | | | | | | | | | - Public companies´ securities | - | | 1,400 | - | 499 | | 1,899 | | - | | 1,899 | | - Private companies´ securities | - | | - | 15 | 1,324 | | 1,339 | | - | | 1,339 | | - Deposits | 1,172 | | 49 | - | - | | 1,221 | | - | | 1,221 | | - Bonds | (i) 121 | | 4,169 | - | - | | 4,290 | | - | | 4,290 | | - Mutual funds | - | | 2,920 | - | - | | 2,920 | | - | | 2,920 | | - Others | - | | 90 | - | 140 | | 230 | | - | | 230 | | Derivative financial instruments (Note 19) | - | | 20 | 41 | - | | 61 | | - | | 61 | | Financial assets held for sale (Note 18) | | | 4,602 | - | - | | 4,602 | | - | | 4,602 | | Restricted assets | (i) 877 | | - | - | - | | 877 | | - | | 877 | | Cash and cash equivalents (excluding bank overdrafts) (Note 20) | 6,359 | | 7,737 | - | - | | 14,096 | | - | | 14,096 | | Total assets | 21,740 | | 21,089 | 56 | 3,894 | | 46,779 | | 2,878 | | 49,657 |
(i) The fair values approximate their respective carrying amounts. Cresud Sociedad Anónima, Comercial, Inmobiliaria, Financiera y Agropecuaria Notes to the Consolidated Financial Statements(Continued) (All amounts in millions of Argentine Pesos, except otherwise indicated) 16. Financial instruments by category (Continued) | | Financial liabilities at amortized cost | | Financial liabilities at fair value | | Subtotal financial liabilities | | Non-financial liabilities | | Total | | | | | Level 1 | Level 2 | Level 3 | | | | | | | | June 30, 2016 | | | | | | | | | | | | | Liabilities as per statement of financial position | | | | | | | | | | | | | Trade and other payables (Note 21) | 18,917 | | - | - | - | | 18,917 | | 1,054 | | 19,971 | | Borrowings (excluding finance lease liabilities) (Note 23) | 106,271 | | - | - | 10,999 | | 117,270 | | - | | 117,270 | | Derivative financial instruments (Note 19) | - | | 265 | 3 | - | | 268 | | - | | 268 | | Total liabilities | 125,188 | | 265 | 3 | 10,999 | | 136,455 | | 1,054 | | 137,509 |
Financial assets and financial liabilities as of June 30, 2015 were as follows: | | Financial assets at amortized cost | | Financial assets at fair value through profit or loss | | Subtotal financial assets | | Non-financial assets | | Total | | | | | Level 1 | Level 2 | Level 3 | | | | | | | | June 30, 2015 | | | | | | | | | | | | | Assets as per statement of financial position | | | | | | | | | | | | | IDBD (i) | - | | 907 | - | - | | 907 | | - | | 907 | | Trade and other receivables (excluding the allowance for doubtful accounts and other receivables) (Note 17) | 1,807 | | 56 | - | - | | 1,863 | | 456 | | 2,319 | | Investment in financial assets: | | | | | | | | | | | | | - Equity securities in public companies | - | | 88 | - | 349 | | 437 | | - | | 437 | | - Equity securities in private companies | - | | 102 | - | - | | 102 | | - | | 102 | | - Mutual funds | - | | 384 | - | - | | 384 | | - | | 384 | | - Bonds | (ii) 100 | | 104 | - | - | | 204 | | - | | 204 | | Derivative financial instruments (Note 19) | - | | 231 | - | 7 | | 238 | | - | | 238 | | Restricted assets | 611 | | - | - | - | | 611 | | - | | 611 | | Cash and cash equivalents (excluding bank overdrafts) (Note 20) | 521 | | 113 | - | - | | 634 | | - | | 634 | | Total assets | 3,039 | | 1,985 | - | 356 | | 5,380 | | 456 | | 5,836 |
(i) The Group has reported its interest in the associate IDBD at fair value with changes through profit or loss, as per IAS 28. (ii) The fair values approximate their respective carrying amounts. Cresud Sociedad Anónima, Comercial, Inmobiliaria, Financiera y Agropecuaria Notes to the Consolidated Financial Statements(Continued) (All amounts in millions of Argentine Pesos, except otherwise indicated) 16. Financial instruments by category (Continued) | | Financial liabilities at amortized cost | | Financial liabilities at fair value | | Subtotal financial liabilities | | Non-financial liabilities | | Total | | | | | Level 1 | Level 2 | Level 3 | | | | | | | | June 30, 2015 | | | | | | | | | | | | | Liabilities as per statement of financial position | | | | | | | | | | | | | Trade and other payables (Note 21) | 763 | | - | - | - | | 763 | | 808 | | 1,571 | | Borrowings (excluding finance lease liabilities)(Note 23) | 8,259 | | - | 15 | - | | 8,274 | | - | | 8,274 | | Derivative financial instruments (Note 19) | | | | | | | | | | | | | - Commitment to tender offer shares in IDBD | - | | - | - | 503 | | 503 | | - | | 503 | | - Foreign-currency contracts | - | | - | 10 | - | | 10 | | - | | 10 | | - Crops futures | - | | 11 | - | - | | 11 | | - | | 11 | | - Crops options | - | | 9 | - | - | | 9 | | - | | 9 | | Total liabilities | 9,022 | | 20 | 25 | 503 | | 9,570 | | 808 | | 10,378 |
Liabilities carried at amortized cost also include liabilities under finance leases where the Group is the lessee and which therefore have to be measured in accordance with IAS 17 “Leases”. The categories disclosed are determined by reference to IFRS 9. Finance leases are excluded from the scope of IFRS 7 “Financial Instruments: Disclosures”. Therefore, finance leases have been shown separately. There were no level transfers in the fiscal years filed. The following are details of the book value of financial instruments recognized, which were offset in the statements of financial position: | | As of June 30, 2016 | | | | Gross amounts recognized | | Gross amounts offset | | Net amount presented | | | June 30, 2016 | | | | | | | | Financial assets | | | | | | | | Trade and other receivables (excluding the allowance for doubtful accounts and other receivables) (Note 17) | 16,779 | | (1,296) | | 15,483 | | | Financial Liabilities | | | | | | | | Trade and other payables (Note 21) | (15,546) | | 1,296 | | (14,250) | |
| | As of June 30, 2015 | | | | Gross amounts recognized | | Gross amounts offset | | Net amount presented | | | June 30, 2015 | | | | | | | | Financial assets | | | | | | | | Trade and other receivables (excluding the allowance for doubtful accounts and other receivables) (Note 17) | 1,961 | | (98) | | 1,863 | | | Financial Liabilities | | | | | | | | Trade and other payables (Note 21) | (859) | | 98 | | (761) | |
Cresud Sociedad Anónima, Comercial, Inmobiliaria, Financiera y Agropecuaria Notes to the Consolidated Financial Statements(Continued) (All amounts in millions of Argentine Pesos, except otherwise indicated) 16. Financial instruments by category (Continued) Income, expense, gains and losses on financial instruments can be assigned to the following categories: | | Financial assets / liabilities at amortized cost | | Financial assets / liabilities at fair value through profit or loss | | | Total | | June 30, 2016 | | | | | | | | Interest income | 689 | | 116 | | | 805 | | Interest expense | (2,716) | | (23) | | | (2,739) | | Foreign exchange losses | (2,908) | | 6 | | | (2,902) | | Dividends income | - | | 72 | | | 72 | | Fair value loss in financial assets at fair value through profit or loss (i)) | - | | (1,241) | | | (1,241) | | Gain on the revaluation of receivables arising from the sale of farmland | - | | 33 | | | 33 | | Gain from derivative financial instruments (except commodities) | - | | 1,089 | | | 1,089 | | Fair value gain on associates | - | | 77 | | | 77 | | Loss from repurchase of non-convertibles notes | (39) | | - | | | (39) | | Other financial results | (875) | | (106) | | | (981) | | Net result | (5,849) | | 23 | | | (5,826) |
| | Financial assets / liabilities at amortized cost | | Financial assets / liabilities at fair value through profit or loss | | | Total | | June 30, 2015 | | | | | | | | Interest income | 100 | | - | | | 100 | | Interest expense | (874) | | - | | | (874) | | Foreign exchange losses | (562) | | - | | | (562) | | Dividends income | 17 | | - | | | 17 | | Fair value gains financial assets at fair value through profit or loss | - | | 188 | | | 188 | | Gain on the revaluation of receivables arising from the sale of farmland | - | | 53 | | | 53 | | Loss from derivative financial instruments (except commodities) | - | | (83) | | | (83) | | Fair value gain on associates | - | | (1,001) | | | (1,001) | | Loss from repurchase of Non-convertible notes | (2) | | - | | | (2) | | Other financial results | (125) | | - | | | (125) | | Net result | (1,446) | | (843) | | | (2,289) |
Cresud Sociedad Anónima, Comercial, Inmobiliaria, Financiera y Agropecuaria Notes to the Consolidated Financial Statements(Continued) (All amounts in millions of Argentine Pesos, except otherwise indicated) 16. Financial instruments by category (Continued) | | Financial assets / liabilities at amortized cost | | Financial assets / liabilities at fair value through profit or loss | | | Total | | June 30, 2014 | | | | | | | | Interest income | 119 | | - | | | 119 | | Interest expense | (715) | | - | | | (715) | | Foreign exchange losses | (1,900) | | - | | | (1,900) | | Dividends income | 15 | | - | | | 15 | | Fair value gains in financial assets at fair value through profit or loss | - | | 379 | | | 379 | | Loss from repurchase of Non-convertible Notes | (45) | | - | | | (45) | | Loss from derivative financial instruments (except commodities) | - | | (365) | | | (365) | | Gain on the revaluation of receivables arising from the sale of farmland | - | | 21 | | | 21 | | Other financial results | (83) | | - | | | (83) | | Net result | (2,609) | | 35 | | | (2,574) |
The following table presents the changes in Level 3 financial instruments for the years ended June 30, 2016 and 2015: | | Equity securities in public companies | | Equity securities in private companies | | Others | | Warrants of Condor | | Investment in associate IDBD | | Commitment to tender offer shares in IDBD | | Trade and other receivables - Cellcom | | Non-recourse loans | | Total | | Total as of June 30, 2014 | 211 | | - | | - | | - | | - | | (321) | | - | | - | | (110) | | Currency translation adjustment | - | | - | | - | | - | | 83 | | (45) | | - | | 19 | | 57 | | Transfer to Level 3 | - | | - | | - | | - | | 1,826 | | - | | - | | (86) | | 1,740 | | Transfer from associates | - | | 30 | | - | | - | | - | | - | | - | | - | | 30 | | Gains or losses for the year (Note 33) | 138 | | 72 | | - | | 7 | | (1,001) | | (137) | | - | | 52 | | (869) | | Balance as of June 30, 2015 | 349 | | 102 | | - | | 7 | | 908 | | (503) | | - | | (15) | | 848 | | Additions and acquisitions | 50 | | 27 | | - | | - | | - | | - | | - | | - | | 77 | | Write off | - | | - | | - | | - | | - | | 500 | | - | | - | | 500 | | Currency translation adjustment | - | | 291 | | 52 | | - | | 60 | | (18) | | 705 | | (3,610) | | (2,520) | | Obtainment of control over IDBD | - | | 861 | | 88 | | - | | (1,047) | | - | | 1,187 | | (7,336) | | (6,247) | | Gains and losses for the year (Note 33) | 100 | | 43 | | - | | (7) | | 79 | | 21 | | 39 | | (38) | | 237 | | Balance as of June 30, 2016 | 499 | | 1,324 | | 140 | | - | | - | | - | | 1,931 | | (10,999) | | (7,105) |
Securities and warrants of Condor Upon initial recognition of the new instrument (January, 2012), the consideration paid for the Shares and Warrants of Condor was assigned to both instruments based on the relative fair values of those instruments upon acquisition. The fair value of these instruments exceeded the transaction price and were determined using a valuation technique that uses inputs not observable in the market. As a result of the use of this technique, the Group has not recognized a gain at the time of initial recognition. Cresud Sociedad Anónima, Comercial, Inmobiliaria, Financiera y Agropecuaria Notes to the Consolidated Financial Statements(Continued) (All amounts in millions of Argentine Pesos, except otherwise indicated) 16. Financial instruments by category (Continued) In March 2016, the Group has exchanged its preferred Class C shares for a new Class D preferred shares issued by Condor and, additionally, it has received cash in the amount of US$ 1.2 million and a promissory note for US$ 1.1 million related to dividends receivable. In this new issue the company “Stepstone Real Estate” has been added as new partner by making a contribution of US$ 30 million, which will be used to redeem Class A and B preferred shares and for the acquisition of new hotels. The new Class D preferred shares will accrue annual interest at a rate of 6.25% and will be convertible into common shares at a price of US$ 1.60 share. There were no changes to the warrants held by the Group. The Board of Directors of Condor is now formed by four directors of the company, three directors appointed by Stepstone Real Estate and two independent directors. In addition, the voting power held by the company in Condor amounts to 49%, thus keeping significant influence. Investment in IDBD, associate and warrants As described in Note 3 until taking control over IDBD, the Group stated its equity interest in IDBD as an associate measured at fair value, invoking the exception under IAS 28 and the warrants to acquire IDBD’s common shares were booked at their quoted prices. Since October 11, 2015, as result of consolidation, the equity interest in IDBD as an associate and the warrants were eliminated following the consolidation to add IDBD’s assets and liabilities on a line-by-line basis. Non-recourse loans IDBD relied on an independent appraiser to determine the value of the non-recourse loan. The valuation model is a binomial tree where the main variable is Adama’s share price. Cresud Sociedad Anónima, Comercial, Inmobiliaria, Financiera y Agropecuaria Notes to the Consolidated Financial Statements(Continued) (All amounts in millions of Argentine Pesos, except otherwise indicated) 16. Financial instruments by category (Continued) When no quoted prices in an active market are available, fair values (particularly with derivatives) are based on recognized valuation methods. The Group uses a range of valuation models for the measurement of Level 2 and Level 3 instruments, details of which may be obtained from the following table: | Description | | Pricing model | | Pricing method | | Parameters | | Range | | Investment in financial assets – Public companies securities - Preferred shares of Condor | | Binomial tree | | Theoretical price | | Underlying asset price (Market price); share price volatility (historical) and market interest-rate (Libor rate curve). | | Underlying asset price 1.4 to 1.7 Share price volatility 58% to 78% Money market interest-rate 1.0% to 1.3% | | Investment in financial assets – Public companies securities - Promissory note | | Discounted cash flow | | Theoretical price | | Market interest-rate (Libor rate curve) | | Money market interest-rate 1.0% to 1.3% | | Derivative financial instruments - Warrants of Condor | | Black-Scholes | | Theoretical price | | Underlying asset price (Market price); share price volatility (historical) and interest-rate curve (Libor rate). | | Underlying asset price 1.4 to 1.7 Share price volatility 58% to 78% Money market interest-rate 1.0% to 1.3% | | Interest rate swaps | | Cash flow | | Theoretical price | | Interest rate futures contract and cash flow | | - | | Call option of Arcos | | Discounted cash flow | | - | | Projected revenues and discounting rate. | | - | | Investments in financial assets - Private companies - Avenida Inc. | | Market multiples | | Theoretical price | | Comparable market multiple (EV/GMV ratio) | | Comparable market multiple (EV/GMV ratio) 2.94x to 3.59x | | Investments in financial assets - Private companies - Others | | Discounted cash flows / NAV | | Theoretical price | | Projected revenue discounted at the discount rate / The value is calculated in accordance with the company’s shares in the equity funds on the basis of their financial statements, based on fair value or investment assessments. | | 1 - 3.5 | | Investments in financial assets - Others | | Discounted cash flows / NAV | | Theoretical price | | Projected revenue discounted at the discount rate / The value is calculated in accordance with the company’s shares in the equity funds on the basis of its financial statements, based on fair value or investment assessments | | 1 - 3.5 | | Borrowings - Non-recourse loan | | Binomial tree | | Theoretical price | | Underlying asset price (obtained by discounted cash flow valuation), capital cost, market rate; control premium, underlying asset volatility. | | Underlying asset price US$ 760MM to US$ 940MM, capital cost 11.8% to 14.4%, discounted market interest rate 7.9% to 12.9%, control premium 3.3% to 6.6%, underlying asset volatility 25.7% to 33.1%. |
Cresud Sociedad Anónima, Comercial, Inmobiliaria, Financiera y Agropecuaria Notes to the Consolidated Financial Statements(Continued) (All amounts in millions of Argentine Pesos, except otherwise indicated) 17. Trade and other receivables The table below shows trade and other receivables of the Group as of June 30, 2016 and 2015: | | June 30, 2016 | | June 30, 2015 | | Non-current | | | | | Trade receivables | | | | | Trade, leases and services receivable | 2,015 | | 63 | | Trade receivables related to agricultural properties | 54 | | 104 | | Less: allowance for doubtful accounts | (2) | | (2) | | Non-current trade receivables | 2,067 | | 165 | | Other receivables | | | | | Tax credits | 119 | | 73 | | Guarantee deposits | 24 | | 17 | | Prepayments | 1,320 | | 11 | | VAT receivables | - | | 27 | | Loans | 239 | | 116 | | Others | 4 | | 18 | | Non-current other receivables | 1,706 | | 262 | | Non-current trade and other receivables | 3,773 | | 427 |
| Current | | | | | Trade receivables | | | | | Trade, leases and services receivable | 921 | | 695 | | Receivables from sale of agricultural products and farmlands leases | 362 | | 268 | | Trade receivables related to agricultural properties | 22 | | 88 | | Deferred checks received | 304 | | - | | Trade receivables | 5,970 | | - | | Credit card receivables | 3,872 | | - | | Less: allowance for doubtful accounts | (189) | | (118) | | Current trade receivables | 11,262 | | 933 | | Other receivables | | | | | Tax credits | 180 | | 117 | | Guarantee deposits | 78 | | 39 | | Prepayments | 681 | | 145 | | VAT credit to be transferred | 11 | | - | | Borrowings granted, deposits, and other balances | 1,243 | | 392 | | Advance payments | 328 | | 105 | | Others | 375 | | 41 | | Current other receivables | 2,896 | | 839 | | Current trade and other receivables | 14,158 | | 1,772 | | Total trade and other receivables | 17,931 | | 2,199 |
The carrying amounts of the Group’s trade and other receivables in foreign currencies are detailed in Note 37. Trade receivables are generally presented in the statements of financial position net of allowances for doubtful receivables. Impairment polices and procedures by type of receivables are discussed in detail in Note 2. Cresud Sociedad Anónima, Comercial, Inmobiliaria, Financiera y Agropecuaria Notes to the Consolidated Financial Statements(Continued) (All amounts in millions of Argentine Pesos, except otherwise indicated) 17. Trade and other receivables (Continued) The fair values of current trade and other receivables approximate their respective carrying amounts, due to their short-term nature, as the impact of discounting is not significant. Present value of non-current trade receivables related to sales of equipment installments, as performed by Cellcom (mainly in 36 installments), as of June 30, 2016 were calculated at a 3.3% discount rate. Other non-current receivables conform to or approximate their fair values. Fair values are based on discounted cash flows. (Level 3 of the fair value hierarchy). The evolution of the Group’s provision for impairment of trade receivables were as follows: | | June 30, 2016 | | June 30, 2015 | | June 30, 2014 | | Beginning of the year | 120 | | 90 | | 87 | | Recovery | (53) | | 21 | | (14) | | Used during the year | (4) | | (14) | | (9) | | Creation | 113 | | 21 | | 24 | | Currency translation adjustment | 15 | | 2 | | 2 | | End of the year | 191 | | 120 | | 90 |
The Group’s trade receivables comprise several classes. The maximum exposure to credit risk at the reporting date is the carrying value of each class of credit. (Note 4) The Group has also receivables with related parties. Neither of which are due nor impaired. Due to the distinct characteristics of each type of receivables, an aging analysis of past due unimpaired and impaired receivables are shown by type and class as of June 30, 2016 and 2015 (includes receivables not past due to reconcile with the amounts in the statements of financial position): | | Expired | | | | | | | | Up to 3 months | 3 to 6 months | Over 6 months | Not past due | Allowance | Total | % of representation | Additions (reversals) for bad debts | | | Agricultural products | 60 | 7 | 8 | 256 | 18 | 349 | 2.6% | 1 | | | Shopping leases and services | 50 | 5 | 3 | 776 | 78 | 912 | 6.7% | 12 | | | Office leases and services | 1 | 3 | 7 | 18 | 6 | 35 | 0.3% | (6) | | | Hotel leases and services | 16 | 12 | 23 | 312 | 27 | 390 | 2.9% | 1 | | | Consumer financing | - | - | - | - | 15 | 15 | 0.1% | 1 | | | Hotel operations | 1 | - | - | 48 | 1 | 50 | 0.4% | - | | | Disposal of properties | - | - | 16 | 99 | - | 115 | 0.9% | - | | | Sale of communication equipment | 2,250 | - | - | 1,714 | 66 | 4,030 | 29.8% | - | | | Telecommunication services | 1,763 | 356 | 672 | 19 | 672 | 3,482 | 25.8% | 61 | | | Tourism activities | 16 | 12 | 20 | 219 | 51 | 318 | 2.3% | (3) | | | Sale of products (supermarkets) | 27 | 19 | 55 | 3,665 | 58 | 3,824 | 28.3% | 4 | | | Total as of June 30, 2016 | 4,184 | 414 | 804 | 7,126 | 992 | 13,520 | 100% | 71 | | | | | | | | | | | | | | Agricultural products | 4 | 1 | 3 | 199 | 16 | 223 | 18.3% | 16 | | | Shopping leases and services | 42 | 10 | 14 | 562 | 70 | 698 | 57.3% | 14 | | | Office leases and services | 40 | 4 | 2 | 12 | 9 | 67 | 5.5% | - | | | Hotel leases and services | 1 | - | - | 16 | 1 | 18 | 1.5% | - | | | Consumer financing | - | - | - | 5 | 15 | 20 | 1.6% | - | | | Disposal of properties | - | - | - | 183 | 9 | 192 | 15.8% | - | | | Total as of June 30, 2015 | 87 | 15 | 19 | 977 | 120 | 1,218 | 100% | 30 | |
Cresud Sociedad Anónima, Comercial, Inmobiliaria, Financiera y Agropecuaria Notes to the Consolidated Financial Statements(Continued) (All amounts in millions of Argentine Pesos, except otherwise indicated) 18. Financial assets held for sale Group’s financial assets and other assets held for sale as of June 30, 2016 and 2015 were as follows: | June 30, 2016 | | June 30, 2015 | | Non-current | | | | | Clal | 3,346 | | - | | Non-current financial assets held for sale | 3,346 | | - | | | | | | Current | | | | | Clal | 1,256 | | - | | Current financial assets held for sale | 1,256 | | - | | Total Financial assets held for sale | 4,602 | | - |
Clal is a holding company that mainly operates in the insurance and pension markets and in segments of pension funds. The company holds assets and other businesses (such as insurance agencies) and is one of the largest insurance groups in Israel. Clal mainly develops its activities in three operating segments: long-term savings, general insurance and health insurance. Given that IDBD failed to meet the requirements set forth by the Capital Markets, Insurance and Savings Commission, which is dependent on the Ministry of Finance of Israel, to have control over an insurance company, on August 21, 2013, such commission required that IDBD granted an irrevocable power of attorney to Mr. Moshe Tery ("the Trustee") by 51% of the shareholding capital and vote in Clal, thus transferring control over that investee. On December 30, 2014, the Insurance Commission sent an additional letter setting a term by which IDBD’s control over and equity interests in Clal were to be sold and giving directions as to the Trustee’s continuity in office, among other aspects. The sale arrangement outlined in the letter involves IDBD’s and the Trustee’s interests in the sale process under different options and timeframes. As of June 30, 2016, the current sale arrangement involved the sale of the interest in the stock exchange or by over-the-counter trades, as per the following detail and by the following dates: a. IDBD would have to sell at least 5% of its equity interest in Clal from May 7, 2016. b. During each of the subsequent four-month periods, IDBD would have to sell at least an additional 5% of its equity interest in Clal. c. If IDBD sells more than 5% of its equity interest in Clal in any given four-month period, the percentage in excess of the required 5% would be offset against the percentage required in the following period. Cresud Sociedad Anónima, Comercial, Inmobiliaria, Financiera y Agropecuaria Notes to the Consolidated Financial Statements(Continued) (All amounts in millions of Argentine Pesos, except otherwise indicated) 18. Financial assets held for sale (Continued) In case IDBD does not fulfills its obligation in the manner described in the above paragraph the Trustee would be entitled to act upon the specified arrangement in lieu of IDBD, pursuant to all powers that had been vested under the representations of the trust letter. The consideration for the sale would be transferred to IDBD, with the expenses incurred in the sale process to be solely borne by IDBD. During February 2016, bondholders and minority shareholders filed a complaint against the Insurance Commission and the Trustee so that the order by the Trustee to sell the shares in the market was revoked, for this would cause irreversible damage to the company and its bondholders. As of the date of these Consolidated Financial Statements, no decision has been rendered on the complaint. In June 30, 2016 the holding of IDBD to Clal was of 55%, and as a result of the circumstances mentioned above, IDBD has accounted for it as an available-for-sale financial asset. Valuation as of June 30, 2016 amounts to Ps. 4,602, and a loss of Ps. 1,951 were recorded, reflecting the fall in the market price, in financial results, net. Claims against Clal Clal set up a reserve for all legal actions brought against Clal’s investees out of the ordinary course of business in the amount of approximately NIS 96 million (equivalent to Ps. 376 million at the closing exchange rate). Most legal actions are related to consumer claims and actions erasing from those claims. The total amount claimed is NIS 29,200 million (equivalent to Ps. 114,275 million at the closing exchange rate). Cresud Sociedad Anónima, Comercial, Inmobiliaria, Financiera y Agropecuaria Notes to the Consolidated Financial Statements(Continued) (All amounts in millions of Argentine Pesos, except otherwise indicated) 19. Derivative financial instruments Group’s derivative financial instruments as of June 30, 2016 and 2015 are as follows: | | June 30, 2016 | | June 30, 2015 | | Assets | | | | | Non-current | | | | | Crops options | - | | 2 | | Warrants IDBD (Note 3) | - | | 199 | | Warrant Condor | - | | 7 | | Others | 8 | | - | | Total non-current | 8 | | 208 |
| Current | | | | | Foreign-currency futures contracts | 25 | | - | | Crops futures | - | | 1 | | Crops options | 7 | | - | | Foreign-currency options | 2 | | - | | Warrants IDBD (Note 3) | - | | 29 | | Interest-rate swaps | 4 | | - | | Others | 15 | | - | | Total current | 53 | | 30 | | Total assets | 61 | | 238 |
| Liabilities | | | | | Non-current | | | | | Crops options | 16 | | 2 | | Foreign-currency futures contracts | - | | 3 | | Commitment to tender offer shares in IDBD (Note 3) | - | | 265 | | Forward contracts | 105 | | - | | Total non-current | 121 | | 270 |
| Current | | | | | Foreign-currency futures contracts | 31 | | 7 | | Foreign-currency options | 1 | | - | | Crops options | 5 | | 7 | | Crops futures | 17 | | 11 | | Commitment to tender offer shares in IDBD (Note 3) | - | | 238 | | Forward contracts | 93 | | - | | Total current | 147 | | 263 | | Total liabilities | 268 | | 533 |
Cresud Sociedad Anónima, Comercial, Inmobiliaria, Financiera y Agropecuaria Notes to the Consolidated Financial Statements(Continued) (All amounts in millions of Argentine Pesos, except otherwise indicated) The following table shows the balances of cash and cash equivalents as of June 30, 2016 and 2015: | | June 30, 2016 | | June 30, 2015 | | Cash at bank and in hand | 6,259 | | 438 | | Short-term bank in deposits | 100 | | 84 | | Mutual funds | 7,737 | | 112 | | Total cash and cash equivalents | 14,096 | | 634 |
Following is a detailed description of cash flows generated by the Group’s operations for the years ended as of June 30, 2016, 2015 and 2014. | | | June 30, 2016 | | June 30, 2015 | | June 30, 2014 | | (Loss) Profit for the year | | (1,891) | | 175 | | (1,409) | Adjustments for: | | | | | | | | Income tax expense | | (197) | | 303 | | (389) | | Depreciation and amortization | | 2,769 | | 259 | | 297 | | Gain from disposal of investment properties | | (1,101) | | (1,150) | | (231) | | Loss / (Gain) from disposal of farmlands | | 2 | | (550) | | (91) | | Gain on the revaluation of receivables arising from the sale of farmland | | (33) | | (53) | | (21) | | (Gain) / Loss from disposal of property, plant and equipment | | (6) | | 1 | | - | | Release of investment property and property, plant and equipment | | - | | 2 | | 2 | | Impairment of investment property | | 352 | | - | | - | | Dividends income | | (72) | | (17) | | (15) | | Share based payments | | 54 | | 31 | | 69 | | Unrealized (Gain) / Loss on derivative financial instruments | | (1,064) | | 131 | | 350 | | Changes in fair value of financial assets | | 1,286 | | (187) | | (379) | | Unrealized initial recognition and changes in fair value of biological assets and agricultural produce at the point of harvest | | (615) | | (105) | | (406) | | Changes in the net realizable value of agricultural produce after harvest | | (208) | | 34 | | 17 | | Provisions | | 255 | | 90 | | 113 | | Financial results, net | | 6,038 | | 1,418 | | 2,542 | | Share of loss of joint ventures and associates | | (473) | | 1,026 | | 409 | | Reversal of currency translation adjustment | | (96) | | (189) | | - | | Gain from disposal of subsidiaries and joint ventures | | (4) | | (22) | | - | | Loss from repurchase of Non-convertible notes | | 39 | | 2 | | 45 | | Changes in operating assets and liabilities: | | | | | | | | Decrease in biological assets | | 135 | | 115 | | 287 | | Increase in inventories | | (79) | | (132) | | (197) | | Decrease in trading properties | | 229 | | - | | 7 | | (Increase) Decrease in trade and other receivables | | (487) | | (480) | | 268 | | (Increase) Decrease in derivative financial instruments | | (46) | | 4 | | (6) | | Increase (Decrease) in trade and other payables | | 182 | | 145 | | (170) | | Increase in employee benefits | | 52 | | 85 | | 72 | | Decrease in provisions | | (155) | | (12) | | (1) | | Net cash generated from operating activities before income tax paid | | 4,866 | | 924 | | 1,163 |
Cresud Sociedad Anónima, Comercial, Inmobiliaria, Financiera y Agropecuaria Notes to the Consolidated Financial Statements(Continued) (All amounts in millions of Argentine Pesos, except otherwise indicated) 20. Cash flow information (Continued) The following table shows a detail of non-cash transactions occurred in the years ended June 30, 2016, 2015 and 2014: | | June 30, 2016 | | June 30, 2015 | | June 30, 2014 | | Increase in restricted funds from the sale of farmlands | - | | 590 | | - | | Reimbursement of expired dividends | 6 | | 1 | | 3 | | Dividends payable | 64 | | 48 | | 57 | | Dividends not collected | 4 | | - | | - | | Acquisition of non-controlling interest | 139 | | - | | - | | Payment of non-convertible notes through a decrease in trade and other receivables | 22 | | - | | - | | Decrease in borrowings through a decrease in investment in joint ventures and associates | 9 | | 137 | | - | | Increase in financial assets through a decrease in trade and other receivables | 71 | | - | | - | | Increase in financial assets through a decrease in investment in joint ventures and associates | - | | 30 | | - | | Increase in financial assets through an increase in trade and other payables | 180 | | - | | - | | Increase in property, plant and equipment through an increase in trade and other payables and borrowings | 116 | | 2 | | 1 | | Decrease in property, plant and equipment and investment properties through an increase in trade and other receivables | - | | - | | 24 | | Decrease in intangible assets through an increase in assets held for sale | - | | - | | 77 | | Increase in trading properties through a decrease in intangible assets | - | | - | | 7 | | Increase in trading properties through a decrease in investment properties | 71 | | - | | - | | Decrease in trading properties through a decrease in trade and other payables | - | | 1 | | - | | Increase in investment properties through an increase in borrowings | 302 | | - | | - | | Increase in investment properties through a decrease in property, plant and equipment | 1 | | - | | - | | Decrease in investment properties through an increase in property, plant and equipment | - | | - | | 12 | | Decrease in investment properties through an increase in intangible assets | - | | - | | 1 | | Decrease in investment properties through an increase in assets held for sale | - | | - | | 1,099 | | Decrease in trade and other receivables through an increase in assets held for sale | - | | - | | 18 | | Decrease in trade and other payables through an increase in liabilities directly associated with assets classified as held for sale | - | | - | | 170 | | Decrease in borrowings through an increase in liabilities directly associated with assets classified as held for sale | - | | - | | 603 | | Decrease in deferred income tax liabilities through an increase in liabilities directly associated with assets classified as held for sale | - | | - | | 33 | | Increase in restricted assets through a decrease in trade and other payables | - | | - | | 146 | | Stock plan granted | (4) | | (16) | | - | | Distribution of treasury stock | - | | (55) | | - | | Options expired | - | | 106 | | - | | Increase in non-controlling interest hrough a decrease in assets from derivative financial instruments | 128 | | - | | - | | Decrease in restricted assets through an increase in assets held for sale | - | | 9 | | 164 | | Decrease in borrowings trough an increase of investment in associates, and joint ventures | - | | - | | 24 |
Cresud Sociedad Anónima, Comercial, Inmobiliaria, Financiera y Agropecuaria Notes to the Consolidated Financial Statements(Continued) (All amounts in millions of Argentine Pesos, except otherwise indicated) 20. Cash flow information (Continued) Incorporation for business combination | June 30, 2016 | | June 30, 2015 | | June 30, 2014 | | Investment properties | 29,586 | | - | | - | | Property, plant and equipment | 15,104 | | - | | - | | Trading properties | 2,656 | | - | | - | | Intangible assets | 6,603 | | - | | - | | Investments in joint ventures and associates | 9,268 | | - | | - | | Deferred income tax | (4,681) | | - | | - | | Trade and other receivables | 9,713 | | - | | - | | Investment in financial assets | 5,824 | | - | | - | | Derivative financial instruments, net | (54) | | - | | - | | Inventories | 1,919 | | - | | - | | Income tax credits | 91 | | - | | - | | Financial assets and other assets held for sale | 5,129 | | - | | - | | Trade and other payables | (19,749) | | - | | - | | Borrowings | (60,306) | | - | | - | | Provisions | (969) | | - | | - | | Income tax liabilities | (267) | | - | | - | | Employee benefits | (405) | | - | | - | | Total | (538) | | - | | - | | Non-controlling interest | (8,630) | | - | | - | | Goodwill | 1,391 | | - | | - | | Total assets incorporated by business combination, net of cash and cash equivalents | (7,777) | | - | | - | | Cash incorporated by business combination | 9,193 | | - | | - |
Cresud Sociedad Anónima, Comercial, Inmobiliaria, Financiera y Agropecuaria Notes to the Consolidated Financial Statements(Continued) (All amounts in millions of Argentine Pesos, except otherwise indicated) 21. Trade and other payables Group’s trade and other payables as of June 30, 2016 and 2015 were as follows: | | June 30, 2016 | | June 30, 2015 | | Non-current | | | | | Trade payables | | | | | Trade payables | 525 | | 216 | | Total non-current trade payables | 525 | | 216 | | Other payables | | | | | Payment plan for payable taxes | - | | 24 | | Deferred income | 65 | | 7 | | Taxes payable | 8 | | 7 | | Others | 930 | | 10 | | Total non-current other payables | 1,003 | | 48 | | Total non-current trade and other payables | 1,528 | | 264 |
| Current | | | | | Trade payables | | | | | Admission rights | 188 | | 143 | | Trade payables | 11,180 | | 316 | | Accrued invoices | 612 | | 223 | | Leases and services payments received in advance | 4,594 | | 226 | | Guarantee deposits | 24 | | - | | Total current trade payables | 16,598 | | 908 | | Other payables | | | | | Deferred incomes | 2 | | 24 | | Taxes payable | 333 | | 220 | | Dividends payable to non-controlling shareholders | 435 | | 124 | | Others | 1,075 | | 31 | | Total current other payables | 1,845 | | 399 | | Total current trade and other payables | 18,443 | | 1,307 | | Total trade and other payables | 19,971 | | 1,571 |
The fair value of trade and other payables approximate their respective carrying amounts, due to their short-term nature, the effect of discounting is not significant. Fair values are based on discounted cash flows Cresud Sociedad Anónima, Comercial, Inmobiliaria, Financiera y Agropecuaria Notes to the Consolidated Financial Statements(Continued) (All amounts in millions of Argentine Pesos, except otherwise indicated) The Group is subject to claims, lawsuits and other legal proceedings in the ordinary course of business, including claims from clients where a third party seeks reimbursement or damages. The Group’s responsability under such claims, lawsuits and legal proceedings cannot be estimated with certainty. From time to time, the status of each major issue is evaluated and its potential financial exposure is assessed. If the potential loss involved in the claim or proceeding is deemed probable and the amount may be reasonably estimated, a liability is recorded. The Group estimates the amount of such liability based on the available information and in accordance with the provisions of the IFRS. If additional information becomes available, the Group will make an evaluation of claims, lawsuits and other outstanding proceeding, and will revise its estimates. The table below shows the evolution in the Group's provisions for other liabilities categorized by type of provision: | | Legal claims (i) | | Investments in associates and joint ventures (ii) | | Sited dismantling and remediation (iii) | | Onerous contracts (iv) | | Guarantees and other provisions (v) | | Total | | At July 1, 2014 | 65 | | 177 | | - | | - | | - | | 242 | | Additions | 48 | | 159 | | - | | - | | - | | 207 | | Unused amounts reversed | (34) | | - | | - | | - | | - | | (34) | | Contributions | - | | (2) | | - | | - | | - | | (2) | | Currency translation adjustment | - | | 29 | | - | | - | | - | | 29 | | As of June 30, 2015 | 79 | | 363 | | - | | - | | - | | 442 | | Additions | 17 | | 234 | | 39 | | (16) | | (10) | | 264 | | Unused amounts reversed | (64) | | - | | - | | - | | (6) | | (70) | | Contributions | - | | (18) | | - | | - | | - | | (18) | | Liabilities incorporated by business combination (Note 3) | 424 | | - | | 47 | | 199 | | 299 | | 969 | | Currency translation adjustment | 248 | | 262 | | 28 | | 113 | | 144 | | 795 | | As of June 30, 2016 | 704 | | 841 | | 114 | | 296 | | 427 | | 2,382 |
(i) Additions and recoveries are included in "Other operating results, net". (ii) Corresponds to equity interests in associates with negative equity, mainly New Lipstick. Additions and recoveries are included in "Share of profit / (loss) of joint ventures and associates". Additions and recoveries are included in Costs. (iii) The Group’s companies are required to recognize certain costs related to dismantling assets and remediating sites here such assets are located. The calculation of expenses are based on the dismantling value for the current year, taking into consideration the best estimate of future changes in prices, inflation, etc. and such costs are capitalized at a risk-free interest rate. Volume projections for retired or built assets are restated based on expected changes from technological rulings and requirements. Additions and recoveries are included in Costs. (iv) Provisions for other contractual liabilities include a series of liabilities resulting from a contractual liability or laws, regarding which there is a high degree of certainty as to the terms and the necessary amounts to discharge such liability. Additions and recoveries are included in Costs. (v) Additions and recoveries are included in Costs. Cresud Sociedad Anónima, Comercial, Inmobiliaria, Financiera y Agropecuaria Notes to the Consolidated Financial Statements(Continued) (All amounts in millions of Argentine Pesos, except otherwise indicated) 22. Provisions (Continued) Disclosure of total provisions is as follows: | | June 30, 2016 | | June 30, 2015 | | Non-current | 1,341 | | 387 | | Current | 1,041 | | 55 | | Total | 2,382 | | 442 |
On February 23, 2016, a class action was filed against IRSA, the Company, some first-line managers and directors with the District Court of the United States for the Central District of California. The complaint, on behalf of people holding American Depositary Receipts of IRSA between November 3, 2014 and December 30, 2015, claims presumed violations to the US federal securities laws. In addition, it argues that defendants have made material misrepresentations and made some omissions related to the IRSA’s investment in IDBD. Such complaint was voluntarily waived on May 4, 2016 by the plaintiff and filed again on May 9, 2016 with the US District Court by the East District of Pennsylvania. Furthermore, the Company, some of its first-line managers and directors are defendants in a class action filed on April 29, 2016 with the US District Court of the East District of Pennsylvania. The complaint, on behalf of people holding American Depositary Receipts of the Company between May 13, 2015 and December 30, 2015, claims violations to the US federal securities laws. In addition, it argues that defendants have made material misrepresentations and made some omissions related to the IRSA’s investment in IDBD. Subsequently, Cresud and IRSA requested that the complaint be moved to the district of New York, which request was later granted. The Company holds that such allegations are meritless and intends to make a strong defense in both actions. No provision was set up in connection with the above mentioned. IRSA CP
During the fiscal year ended June 30, 2014, the Group, through IRSA, acquired an additional 0.02% interest in IRSA CP for a total amount of Ps. 1.2 million. This resulted in a decrease in non-controlling interests of Ps. 0.2 million and an increase in equity attributable to holders of the parent of Ps. 1.0 million. The effect on shareholders’ equity of this change in the equity interest in IRSA CP is summarized as follows:
| | Ps. | | Carrying amount of group’s interest acquired of | | | 0.18 | | Consideration paid for non-controlling interests | | | (1.21 | ) | Reserve recorded in shareholders’ equity | | (i) (1.03) | |
(i) | The Reserve includes Ps. 0.36 million for non-controlling interest |
Futuros y Opciones.com S.A.
On December 20, 2013 Cresud sold 14,812 non-transferable nominative common shares, with a nominal value of Ps. 1 each and entitled to one vote per share, representing a 0.9075% interest of FyO for a total amount of Ps. 0.1 million.
| | Ps. (million) | | Sale’s collected value | | | 0.11 | | Increase in non-controlling interest �� | | | (0.21 | ) | Reserve recorded in shareholders’ equity | | | (0.10 | ) |
BRASILAGRO
During the current fiscal year, the Group sold 10,400 shares of Brasilagro, representing a 0.02% interest, for a total amount of Ps. 0.27 million. Consequently, the Company recognized an increase in non-controlling interest for an amount of Ps. 0.25 million and a decrease in equity attributable to holders of the parent of Ps. 0.02 million. The effect on shareholders’ equity of this change in the equity interest in Brasilagro is summarized as follows:
| | Ps. (million) | | Carrying amount of the non-controlling interests sold by the Group | | | (0.25 | ) | Consideration collected | | | 0.27 | | Reserve recorded in shareholders’ equity | | | 0.02 | |
Cresud Sociedad Anónima,
Comercial, Inmobiliaria, Financiera y Agropecuaria
Notes to Consolidated Financial Statements (Continued)
(All amounts in thousands of Argentine Pesos, except shares and per share data and as otherwise indicated)
3. | Acquisitions and disposals (Continued)
|
On the other hand, on September 2, 2013, Brasilagro approved a share repurchase program for up to 3,511,130 common shares and for up to an aggregate amount not to exceed the balance of profits or available reserves disclosed in Brasilagro’s latest financial statements. As of June 30, 2014, Brasilagro purchased 99,900 common shares for an aggregate amount of Rs. 1.9 million. Below is a summary of the effects of such transaction on shareholders’ equity:
| | Ps. (million) | | Amount paid for repurchase | | | (4.94 | ) | Decrease in non-controlling interest | | | 4.92 | | Reserve recorded in shareholders’ equity | | | (0.02 | ) |
IRSA
On July 25, 2013, IRSA’s Board of Directors set forth the terms and conditions governing the purchase of the Company's own stock pursuant to Section 64 of Law N° 26,831 and the CNV’s regulations, for up to an aggregate amount of Ps. 200.0 million and up to 5% of the capital stock, in the form of common shares or Global Depositary Shares (GDS) representing 10 common shares each, and up to a daily limit of 25% of the average daily transaction volume experienced by the Company’s shares, along with the markets where they are listed, during the prior 90 business days, and at a price ranging from a minimum of Ps. 1 up to Ps. 8 per share. On September 18, 2013 the Board of Directors approved an increase to the maximum price, raising it to Ps.10 per common share and US$ 10.50 per GDS. On October 15, 2013, the Board of Directors approved a new increase to the maximum price, raising it to Ps.11.00 per common share and US$ 11.50 per GDS. On October 22, 2013 the Board of Directors approved a new increase to the maximum price, raising it to Ps.14.50 per common share and US$ 15.00 per GDS. During the fiscal year ended June 30, 2014, the Company purchased 533,947 common shares (N.V. Ps. 1 per share) for a total amount of Ps. 5.2 million and 437,075 GDS (representing 4,370,750 common shares) for a total amount of US$ 5.2 million.
On June 10, 2014, the Board of Directors of IRSA resolved to terminate the stock repurchase plan that was approved by resolution of the Board on July 25, 2013, and modified by resolutions adopted on September 18, 2013, October 15, 2013 and October 22, 2013. During the term of the Stock Repurchase Plan, IRSA has repurchased 4,904,697 shares for an aggregate amount of Ps. 37,905,631.
Cresud Sociedad Anónima,
Comercial, Inmobiliaria, Financiera y Agropecuaria
Notes to Consolidated Financial Statements (Continued)
(All amounts in thousands of Argentine Pesos, except shares and per share data and as otherwise indicated)
3. | Acquisitions and disposals (Continued)
|
Year ended June 30, 2013
Sale of farmlands
On June 19, 2013, the title deed was executed, by which Cresud sold to Vargas Derka SH a portion of “La Suiza” ranch of 5,613 hectares engaged in livestock activities located near “Villa Angela”, Province of Chaco, remaining in this establishment 36,380 hectares used by the Company to cattle and crop activities.
The offer price amounts to US$ 6.7 million, which had been totally collected by the date of the execution of the title deed, generating a gain of Ps. 29.8 million.
On October 11, 2012 Brasilagro sold Horizontina, a field of land located in Tasso Fragoso, State of Maranhão, Brazil for a total amount of Rs. 75 million (Ps. 174.8 million). The payments were collected as follows: an initial payment of Rs. 1 million, Rs. 26 million in October, 2012 and Rs. 45 million upon execution of the conveyance, on January 22, 2013. The remaining balance as of June 30, 2015 amounts to Rs. 3 million, and its collection is subject to compliance with certain conditions. The gain of the sale was Ps. 53.9 million less commission, expenses and taxes.
The Horizontina field had an area of 14,359 hectares and was acquired on March 10, 2010 by the subsidiary Inmobiliaria Ceibo for a total amount of Rs. 37.7 million.
On April 25, 2013, Brasilagro sold a total area of 394 hectares of Araucaria field. The establishment, located in the municipality of Mineros – GO was acquired in 2007 and had, at the time of sale, a total area of 9,862 hectares.
The sale was priced at Rs. 11.7 million (Ps. 26.6 million). The buyer made an initial payment of Rs. 1.7 million and the remaining balance will be collected in eight installments every six months. The first installment of Rs. 2.1 million was collected in August, 2013, the second, of Rs 2.0 million in March 2014, the third, of Rs.1.9 million, in August 2014 and the fourth, of Rs. 1.9 million, in March 2015. The remaining balance as of June 30, 2015 will be collected in three semi-annual installments. The last installment is due at the moment of the execution of the title deed, in August, 2016. The Group recognized a profit before tax for the sale of the Araucaria field for an amount of Rs. 6.7 million (equivalent to Ps. 12.6 million).
On May 10, 2013, Brasilagro sold a total area of 4,895 hectares of Cremaq field. The establishment, located in the municipality of Ribeiro Gonçalves-PI, Brazil was purchased in 2007 and had, at the time of sale, a total area of 32,702 hectares.
Cresud Sociedad Anónima,
Comercial, Inmobiliaria, Financiera y Agropecuaria
Notes to Consolidated Financial Statements (Continued)
(All amounts in thousands of Argentine Pesos, except shares and per share data and as otherwise indicated)
3. | Acquisitions and disposals (Continued)
|
On February 20, 2015, while studying the acquired zone, a difference of 62 hectares between measures and the sales agreement, dated May 11, 2013, was verified. This resulted into an increase of 11,166 bags in the sales price.
The sale was priced at Rs. 42.6 million (Ps. 97.6 million). The buyer made an initial installment of Rs. 4.6 million and the remaining balance will be collected in five installments. The first installment of Rs. 4.3 million was collected in August, 2013, the second, of Rs 4.0 million was collected in October 2013, the third, of Rs.17.5 million, in June 2014 and the fourth, of Rs. 17.1 million, in June 2015. The remaining balance will be collected upon execution of the conveyance deed, in June, 2016. The Group recognized a profit before tax for the sale Cremaq field of Rs. 26.5 million (Ps. 53.2 million).
Transactions with non-controlling interests
IRSA
During the fiscal year ended June 30, 2013, the Group acquired an additional 1.25% interest in IRSA for a total consideration of Ps. 45.8 million. This resulted in a decrease in non-controlling interests of Ps. 33.9 million and an increase in equity attributable to holders of the parent of Ps. 11.9 million. The effect on shareholders’ equity of this change in the equity interest in IRSA is summarized as follows:
| | Ps. (million) | | Carrying amount of group’s interest acquired of | | | 33.9 | | Consideration paid for non-controlling interests | | | (45.8 | ) | Reserve recorded in shareholders’ equity | | | (11.9 | ) |
IRSA CP
During the fiscal year ended June 30, 2013, the Group, through IRSA and E-Commerce Latina S.A., acquired an additional 0.1% interest in IRSA CP for a total consideration of Ps. 2.3 million. This resulted in a decrease in non-controlling interests of Ps. 0.8 million and an increase in equity attributable to holders of the parent of Ps. 1.5 million. The effect on shareholders’ equity of this change in the equity interest in IRSA CP is summarized as follows:
| Ps. (million) | | Carrying amount of group’s interest acquired of | | | 0.8 | | Consideration paid for non-controlling interests | | | (2.3 | ) | Reserve recorded in shareholders’ equity | | | (i) (1.5 | ) |
(i) | The Reserve includes Ps. 0.5 million for non-controlling interest |
Cresud Sociedad Anónima,
Comercial, Inmobiliaria, Financiera y Agropecuaria
Notes to Consolidated Financial Statements (Continued)
(All amounts in thousands of Argentine Pesos, except shares and per share data and as otherwise indicated)
3. | Acquisitions and disposals (Continued)
|
Arcos del Gourmet S.A. (“Arcos”)
On June 07, 2013, the Group, through IRSA CP, acquired an additional 1.815% equity interest of its controlled company Arcos for a total amount of US$ 0.8 million. The carrying amount of the non-controlling interest in Arcos on the date of acquisition was Ps. 7,357 (representing an 11.815% interest). This resulted in a decrease in non-controlling interest of Ps. 857 and an increase in equity attributable to holders of the parent of Ps. 3,687. The effect on shareholder´s equity of the parent of this change in the equity interest in Arcos during year 2013, is summarized as follows:
| Ps. (million) | | Carrying amount of group’s interest acquired of | | | 0.8 | | Consideration paid for non-controlling interests | | | (4.5 | ) | Reserve recorded in shareholders’ equity | | | (i) (3.7 | ) |
(i) | The reserve includes Ps. 1.4 million for non-controlling interest |
Acquisition of joint venture
On November 29, 2012, IRSA CP acquired shares of common stock, representing 50% of Entertainment Holdings S.A. (“EHSA”)’s capital stock and votes for Ps. 32.0 million. Under the acquisition agreement, IRSA CP is entitled to exercise joint control over EHSA. EHSA is an Argentine company whose main asset consists of an indirect interest of 50% in the capital and voting rights of La Rural S.A. (“LRSA”), whereby it has joint control over this Company together with Sociedad Rural Argentina (“SRA”), who owns the remaining 50%. Thus, IRSA CP is the owner of an indirect interest of 25% in LRSA, whose main asset consists of an usufruct agreement on the Predio Ferial de Buenos Aires, located between Cerviño, Sarmiento, Santa Fe Avenues and Oro street, in the City of Buenos Aires (the “Predio Ferial”) entered in 1999 into with SRA, owner of such Predio Ferial.
The amount of Ps. 6.1 million has been included as an asset, in the line trade and other receivables together with accrued interests.
The fair value of the IRSA CP’s investment in the joint venture was determined based on the fair value of EHSA’s net assets, with the rights of use being the main asset. IRSA CP has allocated the price paid at the fair value of the net assets acquired. Such fair value amounted to Ps. 15.2 million, which means a goodwill amount of Ps. 10.7 million recognized under the line “Investments in associates and joint venture” in the statement of Financial position as of June 30, 2013.
Cresud Sociedad Anónima,
Comercial, Inmobiliaria, Financiera y Agropecuaria
Notes to Consolidated Financial Statements (Continued)
(All amounts in thousands of Argentine Pesos, except shares and per share data and as otherwise indicated)
3. | Acquisitions and disposals (Continued)
|
The fair value of the right of use has been determined by the application of the discounted cash flow method. This estimate considered a discount rate that reflects the market assessments regarding uncertainties in terms of the cash flow amount and timing. The amount of net future cash flows was estimated based on the specific features of the property, the agreements in force, market information and future forecasts as of the valuation date. Net income forecasts, revenues growth rates and discount rates are among the most important assumptions used in the valuation.
Disposal of financial assets
During fiscal year ended June 30, 2013, the Group sold 17,105,629 ordinary shares of Hersha’s Hospitality Trust (Hersha) for a total amount of US$ 92.5 million, with a decrease on the equity interest from 9.13% (at the beginning of the year) to 0.49%.
In November and December 2012, IRSA sold all of its shareholdings in NH Hoteles S.A. (138,572 shares for a consideration of € 0.38 million) and in NH Hoteles S.A. (387,758 shares for a total consideration of US$ 1.4 million).
In December 2012, IRSA sold all of its shareholdings in Metrovacesa F (1,238,990 shares for a consideration of € 2.7 million); Metrovacesa SM (229,995 shares for a total consideration of € 0.5 million) and Metrovacesa F (919,087 shares for a consideration of US$ 2.7 million).
Significant sales of investment properties
On August 31, 2012, the Group sold through IRSA certain functional units of the “Libertador 498 Building” of the Autonomous City of Buenos Aires. The total price of the transaction amounted to Ps. 15 million and was collected upon the execution of the title conveyance deeds. This transaction generated a profit before tax of Ps. 12.3 million.
On September 14, 2012, IRSA sold certain functional units on floors 18 and 19, as well as parking areas, of the Bouchard 551 Building. The total price of the transaction was US$ 8.5 million paid upon execution of the conveyance deed. This transaction generated a profit before tax of Ps. 16.6 million.
On October 4 and 11, 2012, IRSA signed the transfer deed for the sale of several functional units (stores and parking spaces) of the “Libertador 498 Building”. The transactions price was set at Ps. 29.4 million, amount that has been completely collected. This transaction generated a profit before tax of Ps. 24.1 million.
Cresud Sociedad Anónima,
Comercial, Inmobiliaria, Financiera y Agropecuaria
Notes to Consolidated Financial Statements (Continued)
(All amounts in thousands of Argentine Pesos, except shares and per share data and as otherwise indicated)
3. | Acquisitions and disposals (Continued)
|
On January 8, 2013, IRSA sold several functional units (stores and parking spaces) of the “Costeros Dique IV Building”. The total price of the transaction was Ps. 9.2 million. This transaction generated a profit before tax of Ps. 7.5 million.
On May 8, 2013, IRSA signed the transfer deed for the sale of the 17th floor and two parking units of the Maipú 1300 Building and two parking units of the Libertador 498 Building. The total price of the transaction was Ps. 7.8 million (US$ 1.5 million). Such transaction generated a profit before tax of approximately Ps. 5.7 million.
On May 20, 2013, IRSA signed the transfer deed for the sale of the 6th floor and two parking units of the Maipú 1300 Building and two parking units of the Libertador 498 Building. The transactions price was set at Ps. 7.6 million (US$ 1.45 million), amount that has been completely collected. This transaction generated a profit before tax of Ps. 5.7 million.
On June 28, 2013, IRSA signed the transfer deed for the sale of 4th, 5th and 6th floors and 56 parking units of the Bouchard 551 Building. The total price of the transaction was Ps. 148.7 million, equivalent to US$ 27.6 million. This transaction generated a profit before tax of Ps. 106.2 million.
The properties mentioned above were classified as investment properties until the above mentioned transactions were executed, which represents a gross lease area of approximately 14,442 square meters.
All sales of the year led to a combined profit for the Group of Ps. 178.0 million, disclosed within the line “Gain from disposal of investment properties” in the income statement.
Acquisition of Rigby 183 LLC
On June 30, 2012, the Group held, through its subsidiary IMadison LLC, a 49% interest in the capital stock of Rigby 183 LLC (“Rigby”), a company that owns office buildings for rental at Madison Avenue 183, New York, USA. On November 27, 2012, the Group, through its subsidiary IRSA International LLC, acquired an additional equity interest of 25.5% in Rigby’s capital stock, thus taking control over said company. As a result of the acquisition, the Group expects to increase its footprint in the US real estate market. The goodwill from the acquisition, which amounts to Ps. 45.7 million, is attributable to the synergies expected to be achieved by combining the Group’s and Rigby’s operations.
Cresud Sociedad Anónima,
Comercial, Inmobiliaria, Financiera y Agropecuaria
Notes to Consolidated Financial Statements (Continued)
(All amounts in thousands of Argentine Pesos, except shares and per share data and as otherwise indicated)
3. | Acquisitions and disposals (Continued)
|
The acquisition-related costs, which amount to Ps. 2.6 million, were charged under “General and administrative expenses” line in the statements of income.
The fair value of the investment property acquired for Ps. 679.2 million was assessed by a qualified independent appraiser. The fair value of trade and other receivables amounts to Ps. 2.3 million, including trade receivables in the amount of Ps. 0.1 million. As of the acquisition date, the Group estimates that these receivables are recoverable. The fair value of the non-controlling interest in Rigby, an unlisted company, has been determined on a proportional basis to the fair value of net acquired assets.
The Group has recognized gains of Ps. 124.1 million derived from the reassessment of the fair value of the 49% ownership interest in Rigby before the business combination. In addition, all exchange gains (losses) accumulated in shareholder’s equity from the ownership interest in Rigby before the business combination (Ps. 12.9 million) were charged to income. These gains were disclosed under "Other operating results, net" line in the income statements.
The incomes Rigby has generated since November 27, 2012 and that have been disclosed in the consolidated income statements amount to Ps. 40.9 million. Rigby has also run a net gain of Ps. 8.1 million during said period. If Rigby had been included in the consolidation since July 1, 2012, the consolidated income statements would have shown pro forma revenues in the amount of Ps. 2,202.9 million and pro-forma net income of Ps. 297.5 million.
Disposal of joint ventures
On June 28, 2013, IRSA sold, assigned and transferred to Euromayor S.A. de Inversiones the 100% of its equity interest in Canteras Natal Crespo S.A., accounting for a 50% interest in that company’s capital stock for an aggregate amount of US$ 4.2 million; out of that amount, US$ 1.4 million was cashed in July 2013, with the balance being collected as follows: US$ 2.4 million on March 31, 2014 and US$ 0.4 million against delivery to IRSA of certain lots in the development to be carried out in Canteras Natal Crespo S.A.’s property. IRSA was granted a security interest on the 100% of Canteras Natal Crespo S.A.’s shares to secure payment of the remaining balance.
Disposal of subsidiaries
During the fiscal year ended June 30, 2013, IRSA sold to Doneldon S.A., the 100% of Sedelor S.A.'s, Alafox S.A.'s and Codalis S.A.'s capital stock, all of them companies incorporated in the Republic of Uruguay, with no business activity. Later, IRSA sold to Cresud the 100% of Doneldon S.A.'s capital stock.
Cresud Sociedad Anónima,
Comercial, Inmobiliaria, Financiera y Agropecuaria
Notes to Consolidated Financial Statements (Continued)
(All amounts in thousands of Argentine Pesos, except shares and per share data and as otherwise indicated)
3. | Acquisitions and disposals (Continued)
|
Transactions and authorizations pending
Urban properties and investments
Paraná plot of land
On June 30, 2009, the Group, through IRSA CP, subscribed a “Letter of Intent” by which it stated its intention to acquire from Wal-Mart Argentina S.A. a plot of land of about 10,022 square meters located in Paraná, Province of Entre Ríos, to be used to build, develop and operate a shopping center or mall.
On August 12, 2010, the agreement of purchase was executed. The purchase price stood at US$ 0.5 million to be paid as follows: i) US$ 0.05 million had been settled as a prepayment on July 14, 2009, ii) US$ 0.1 million was settled upon executing such agreement, and iii) US$ 0.35 million will be paid upon executing the title deed. The mentioned payments were recorded as an advance under “Trade and other receivables” line.
On December 29, 2011, possession of the real estate was granted, and a minute was signed in which the parties agreed that the deed transferring ownership would be granted on June 30, 2012, or within sixty (60) consecutive days as from the date in which the selling party evidenced with a certified copy before the buying party that the real estate was not subject to any encumbrance, burden, limit or restriction to the ownership, except for the electroduct administrative easement in favor of EDEER S.A..
On June 29, 2012, the parties have agreed to extend the term for the execution of the title conveyance deed, which shall be executed within sixty (60) days as from the date the seller provides reliable notification to the buyer that the property is not subject to any levy, encumbrance, restrictions on ownership, except for the right of way already mentioned. As of the consolidated financial statements date, evidence of such notice has not been provided.
Acquisition of commercial center goodwill
The Group, through IRSA CP, signed an offering letter for acquiring, building and running a commercial center in a real estate owned by INC S.A., located in the City of San Miguel de Tucumán, Province of Tucumán. The price of this transaction was US$ 1.3 million, of which US$ 0.05 million were paid. The mentioned payment was recorded as an advance under “Trade and other receivables” line.
Cresud Sociedad Anónima,
Comercial, Inmobiliaria, Financiera y Agropecuaria
Notes to Consolidated Financial Statements (Continued)
(All amounts in thousands of Argentine Pesos, except shares and per share data and as otherwise indicated)
3. Acquisitions and disposals (Continued)
This transaction was subject to certain conditions precedent, among which the Group through IRSA CP should acquire from INC S.A. the goodwill constituted by the commercial center operating in Soleil Factory. Having complied with such condition on July 1, 2010, IRSA CP should have started the works: i) 12 months after complying with such conditions, or ii) on May 2, 2011, whichever occurs earlier. However, before starting with the works, INC S.A. should have: i) granted the title deeds to IRSA CP's future units to IRSA CP, and ii) transferred to IRSA CP the rights to the registered architectural project and the effective permissions and authorizations to be carried out in IRSA CP's future units. As of June 30, 2015, the two conditions have not been fulfilled.
Antitrust Law
Law N° 25,156, known as "Antitrust Law" as amended, prevents anticompetitive practices and requires administrative authorization for transactions that according to the Antitrust Law would lead to market concentration According to this law, such transactions include mergers, acquisitions and/or transfers either of businesses or assets by which the acquirer controls or substantially influences another party. Transactions completed by entities with an annual sales volume of more than Ps. 200.0 million must be submitted to the Comisión Nacional de Defensa de la Competencia (hereinafter referred to as the "Antitrust Commission") for approval. Certain exemptions apply. Submissions may be filed either prior to the transaction or within a week after its completion. The Antitrust Commission may (i) authorize the transaction, (ii) condition the transaction to the accomplishment of certain acts, or (iii) reject the authorization.
In general, acquisitions effected by the Group are within the scope of the Antitrust Law. In this cases, the Group directly requests authorization. In other cases, the Group may request the Antitrust Commission to issue a prior statement about whether a particular transaction should be either notified or submitted for approval by the Group.
As of June 30, 2015 and 2014, the following cases are pending resolution by the Antitrust Commision:
(i)The Group requested the Antitrust Commission to issue a statement about the Group's obligation to either notify or submit for authorization the acquisition of the property formerly owned by Nobleza Piccardo S.A.I.C.y F. The Antitrust Commission stated that the operation had to be notified. The Group appealed this decision. Subsequently, the Court of Appeals confirmed the Antitrust Commission’s decision regarding the obligation to notify and, therefore, on February 23, 2012, local form F1 was filed, which is being processed as of the date these consolidated financial statements are issued.
Cresud Sociedad Anónima,
Comercial, Inmobiliaria, Financiera y Agropecuaria
Notes to Consolidated Financial Statements (Continued)
(All amounts in thousands of Argentine Pesos, except shares and per share data and as otherwise indicated)
3. Acquisitions and disposals (Continued)
(ii)Purchase of Arcos shares: On December 3, 2009 the Group requested that the CNDC issued a ruling on the notification requirement. The CNDC confirmed that the transaction had to be notified; as a result, notice was served in December 2010 and as of the consolidated financial statements date it is still pending.
(iii)Acquisition of shares in Nuevo Puerto Santa Fe (NPSF): On August 23, 2011 the Group informed the CNDC of the direct and indirect acquisition of NPSF (IRSA CP directly acquired 33.33% of NPSF and indirectly a 16.66% through its controlled company Torodur SA). On December 14, 2014 the CNDC notified approval of the transaction.
(iv)Acquisition of shares in Entertainment Holdings SA (EHSA): On December 7, 2012, the Group informed the CNDC of the acquisition of shares in EHSA, which indirectly owns 50% of La Rural S.A. – a company that operates a convention center known as Predio Ferial de Palermo. As of the consolidated financial statements date, the transaction is pending approval by the CNDC.
4. Financial risk management
Risk management principles and processes
The risk management function within the Group is carried out in respect of financial risks. Financial risks are risks arising from financial instruments to which the Group is exposed during or at the end of the reporting period. Financial risk comprises market risk (including foreign currency risk, interest rate risk and other price risk), credit risk, liquidity risk and capital risk.
The Group’s diverse activities are exposed to a variety of financial risks in the normal course of business. The Group’s overall risk management program focuses on the unpredictability of financial markets and seeks to minimize the Group’s capital costs by using suitable means of financing and to manage and control the Group’s financial risks effectively. The Group uses financial instruments to hedge certain risk exposures when deemed appropriate based on its internal management risk policies.
The Group’s principal financial instruments comprise cash and cash equivalents, receivables, payables, interest bearing assets and liabilities, other financial liabilities, other investments and derivative financial instruments. The Group manages its exposure to key financial risks in accordance with the Group’s risk management policies.
Cresud Sociedad Anónima,
Comercial, Inmobiliaria, Financiera y Agropecuaria
Notes to Consolidated Financial Statements (Continued)
(All amounts in thousands of Argentine Pesos, except shares and per share data and as otherwise indicated)
4. | Financial risk management (Continued)
|
The Group´s risk management policies are established to all its subsidiaries companies in order to identify and analyze the risks faced by the Group, to set appropriate risk limits and controls to monitor risks and adherence to limits. Risk management policies and systems are reviewed regularly to reflect changes in market conditions and the Group’s activities. The Group’s management framework includes policies, procedures, limits and allowed types of derivative financial instruments. The Group has established a Risk Committee, comprising Senior Management and a member of the Audit Committee, which reviews and oversees management’s compliance with these policies, procedures and limits and has overall accountability for the identification and management of risk across the Group.
This section provides a description of the principal risks and uncertainties that could have a material adverse effect on the Group’s strategy, performance, results of operations and financial condition. The principal risks and uncertainties facing the businesses, set out below, do not appear in any particular order of potential materiality or probability of occurrence.
(a) | Market risk management |
Market risk is the risk that the fair value or future cash flows of a financial instrument will fluctuate because of changes in market prices. The Group’s market risks arise from open positions in foreign currencies, interest-bearing assets and liabilities, commodity price risk and equity securities price risks, to the extent that these are exposed to general and specific market movements. Management sets limits on the exposure to these risks that may be accepted, which are monitored on a regular basis.
The examples of sensitivities to market risks included below are based on a change in one factor while holding all other factors constant. In practice this is unlikely to occur, and changes in some of the factors may be correlated – for example, changes in interest rate and changes in foreign currency rates.
Foreign exchange risk and associated derivative financial instruments:
The Group publishes its consolidated financial statements in Argentine Pesos but conducts business in many foreign currencies. As a result, the Group is subject to foreign currency exchange risk due to exchange rate movements, which affect the Group’s transaction cost. Foreign exchange risk arises when future commercial transactions or recognized assets or liabilities are denominated in a currency that is not the entity’s functional currency.
Cresud Sociedad Anónima,
Comercial, Inmobiliaria, Financiera y Agropecuaria
Notes to Consolidated Financial Statements (Continued)
(All amounts in thousands of Argentine Pesos, except shares and per share data and as otherwise indicated)
4. | Financial risk management (Continued)
|
The real estate, commercial, agro-industrial and/or financial activities of the Group's subsidiaries are primarily developed in Argentina and have as functional currency the Argentine Peso. The agricultural activities of the Group’s subsidiaries are primarily developed in Argentina, Brazil and Bolivia, where the functional currencies are the respective local currencies. A significant majority of the activity of these subsidiaries is conducted in such local currencies, thus not exposing the Group to foreign exchange risk. Other Group's subsidiaries have other functional currencies, principally US dollar. In the ordinary course of business, the Group, through its subsidiaries, transacts in currencies other than the respective functional currencies of the subsidiaries. These transactions are primarily denominated in US dollars and new Israeli shekel. Net financial position exposure to the functional currencies is managed on a case-by-case basis, partly by entering into foreign currency derivative instruments and/or by borrowing in foreign currencies, or other methods, considered adequate by the Management, according to circumstances.
Financial instruments are considered sensitive to foreign exchange rates when they are not in the functional currency of the entity that holds them. The following table shows the Group's US dollar-denominated (US$) and new Israeli shekel (NIS), net carrying amounts of its financial instruments broken down by functional currency in which the Company operates, for the years ended June 30, 2015 and 2014. The amounts are presented in Argentine Pesos, the presentation currency of the Group:
| | | Net monetary position (Liability)/Asset | | | Net monetary position (Liability)/Asset | | | | | June 30, 2015 | | | June 30, 2014 | | | Functional currency | | US$ | | | NIS | | | US$ | | | NIS | | | Argentine Peso | | | (4,826,015 | ) | | | - | | | | (4,866,439 | ) | | | - | | | Brazilian Reais | | | 152,764 | | | | - | | | | 68,525 | | | | - | | | Uruguayan Peso | | | (67,082 | ) | | | - | | | | (63,254 | ) | | | - | | | Bolivian Peso | | | 122 | | | | - | | | | (68,464 | ) | | | - | | | US Dollar | | | - | | | | (244,923 | ) | | | - | | | | (86,581 | ) | | Total | | | (4,740,211 | ) | | | (244,923 | ) | | | (4,929,632 | ) | | | (86,581 | ) |
The Group estimates that, other factors being constant, a 10% appreciation of the US dollar against the respective functional currencies at year-end would result in an additional loss before income tax for the year ended June 30, 2015, 2014 and 2013 for an amount of Ps. 474.02 million, Ps. 492.96 million and Ps. 269.6 million, respectively. A 10% depreciation of the US dollar against the functional currencies would have an equal and opposite effect on the income statements.
Cresud Sociedad Anónima,
Comercial, Inmobiliaria, Financiera y Agropecuaria
Notes to Consolidated Financial Statements (Continued)
(All amounts in thousands of Argentine Pesos, except shares and per share data and as otherwise indicated)
4. | Financial risk management (Continued)
|
Moreover, the Group estimates that, all other factors being equal, a depreciation of the NIS to the US$ by 10% as of the balance sheet date would increase loss before tax by Ps. 24.5 million as of June 30, 2015. An appreciation of 10% of the new Israeli shekel against functional currencies would have the same and opposite effect on the income statements.
This sensitivity analysis provides only a limited, point-in-time view of the foreign exchange risk sensitivity of certain of the Group’s financial instruments. The actual impact of the foreign exchange rate changes on the Group’s financial instruments may differ significantly from the impact shown in the sensitivity analysis.
On the other hand, the Group also uses derivative instruments, such as forward foreign exchange contracts to manage its exposure to foreign exchange risk. As of June 30, 2015 and 2014 foreign exchange contracts were pending, for a total amount of (Ps. 25,333) and (Ps. 36,361), respectively.
Interest rate risk and associated derivative financial instruments:
The Group is exposed to interest rate risk on its investments in debt instruments, short-term and long-term borrowings and derivative financial instruments.
The primary objective of the Group’s investment activities is to preserve principal while at the same time maximizing yields without significantly increasing risk. To achieve this objective, the Group diversifies its portfolio in accordance with the limits set by the Group. The Group maintains a portfolio of cash equivalents and short-term investments in a variety of securities, including both government and corporate obligations and money market funds.
Cresud Sociedad Anónima,
Comercial, Inmobiliaria, Financiera y Agropecuaria
Notes to Consolidated Financial Statements (Continued)
(All amounts in thousands of Argentine Pesos, except shares and per share data and as otherwise indicated)
4. | Financial risk management (Continued)
|
Investments in both fixed rate and floating rate instruments carry varying degrees of interest rate risk. Fixed rate securities may have their fair market value adversely impacted due to a rise in interest rates. In general, longer dated securities are subject to greater interest rate risk than shorter dated securities. While floating rate securities are generally subject to less interest rate risk than fixed rate securities, floating rate securities may produce less income than expected if interest rates decrease. Due in part to these factors, the Group’s investment income may fall short of expectations or the Group may suffer losses in principal if securities that have declined in market value due to changes in interest rates are sold. As of June 30, 2014, the nominal value of rate interest swaps was US$ 10 million and Ps. 280 million and due between September 1, 2014 and December 31, 2014. These agreements were not subject to hedge accounting. On June 30, 2014, the Group recorded an asset in the amount of Ps. 1,089, related to the estimated fair value of the swaps on that date. The fair value of swaps was calculated using a discounted cash flow analysis. On June 30, 2014, the impact on the fair value of interest rate swaps in the event of a change in interest rates does not materially affect the results of operations or the financial position of the Group. As of June 30, 2015, the Group has no balances related to interest rate swaps.
The Group’s interest rate risk principally arises from long-term borrowings (Note 25). Borrowings issued at variable rates expose the Group to cash flow interest rate risk. Borrowings issued at fixed rates expose the Group to fair value interest rate risk. The Group manages this risk by maintaining an appropriate mix between fixed and floating rate interest bearing liabilities. These activities are evaluated regularly to determine that the Group is not exposed to interest rate movements that could adversely impact its ability to meet its financial obligations and to comply with its borrowing covenants.
The Group manages its cash flow interest rate risk exposure by different hedging instruments, including but not limited to interest rate swap, depending on each particular case. For example, interest rate swaps have the economic effect of converting borrowings from floating rates to fixed rates or viceversa. Under the interest rate swaps, the Group agrees with other parties to exchange, at specified intervals, the difference between fixed contract rates and floating-rate interest amounts calculated by reference to the agreed notional amounts.
Cresud Sociedad Anónima,
Comercial, Inmobiliaria, Financiera y Agropecuaria
Notes to Consolidated Financial Statements (Continued)
(All amounts in thousands of Argentine Pesos, except shares and per share data and as otherwise indicated)
4. | Financial risk management (Continued)
|
The interest rate risk policy is approved by the Board of Directors. Management analyses the Group’s interest rate exposure on a dynamic basis. Various scenarios are simulated, taking into consideration refinancing, renewal of existing positions and alternative financing sources. Based on these scenarios, the Group calculates the impact on profit and loss of a defined interest rate shift. The scenarios are run only for liabilities that represent the major interest-bearing positions. Trade payables are normally interest-free and have settlement dates within one year. The simulation is done on a regular basis to verify that the maximum potential loss is within the limits set by management.
The following tables show a breakdown of the Group’s fixed-rate and floating-rate borrowings per currency denomination and functional currency of the subsidiary issuing the loans (excluding finance leases) for the years ended June 30, 2015 and 2014. All amounts are shown in thousands of Argentine Pesos the Group’s presentation currency:
| | | June 30, 2015 Functional currency | | | Rate per currency denomination | | Argentine Peso | | | Brazilian Reais | | | Bolivian Peso | | | Uruguayan Peso | | | US Dollar | | | Total | | | Fixed rate: | | | | | | | | | | | | | | | | | | | | Argentine Peso | | | 826,038 | | | | - | | | | - | | | | - | | | | - | | | | 826,038 | | | Bolivian Peso | | | - | | | | - | | | | - | | | | - | | | | - | | | | | | | Brazilian Reais | | | - | | | | 184,631 | | | | - | | | | - | | | | - | | | | 184,631 | | | US Dollar | | | 5,361,806 | | | | - | | | | - | | | | 70,959 | | | | 10,784 | | | | 5,443,549 | | | Subtotal fixed-rate borrowings | | | 6,187,844 | | | | 184,631 | | | | - | | | | 70,959 | | | | 10,784 | | | | 6,454,218 | | | Floating rate: | | | | | | | | | | | | | | | | | | | | | | | | | | Argentine Peso | | | 1,426,226 | | | | - | | | | - | | | | - | | | | - | | | | 1,426,226 | | | Bolivian Peso | | | - | | | | - | | | | 6,509 | | | | - | | | | - | | | | 6,509 | | | Brazilian Reais | | | - | | | | 258,805 | | | | - | | | | - | | | | - | | | | 258,805 | | | US Dollar | | | 127,778 | | | | - | | | | - | | | | - | | | | - | | | | 127,778 | | | Subtotal floating rate borrowings | | | 1,554,004 | | | | 258,805 | | | | 6,509 | | | | - | | | | - | | | | 1,819,318 | | | Total borrowings as per analysis | | | 7,741,848 | | | | 443,436 | | | | 6,509 | | | | 70,959 | | | | 10,784 | | | | 8,273,536 | | | Finance leases | | | 3,270 | | | | 22,197 | | | | - | | | | - | | | | - | | | | 25,467 | | | Total borrowings as per statement of financial position | | | 7,745,118 | | | | 465,633 | | | | 6,509 | | | | 70,959 | | | | 10,784 | | | | 8,299,003 | |
Cresud Sociedad Anónima,
Comercial, Inmobiliaria, Financiera y Agropecuaria
Notes to Consolidated Financial Statements (Continued)
(All amounts in thousands of Argentine Pesos, except shares and per share data and as otherwise indicated)
4. | Financial risk management (Continued)
|
| | | June 30, 2014 Functional currency | | | | Rate per currency denomination | | Argentine Peso | | | Brazilian Reais | | | Bolivian Peso | | | Uruguayan Peso | | | US Dollar | | | Total | | | | Fixed rate: | | | | | | | | | | | | | | | | | | | | | Argentine Peso | | | 386,007 | | | | - | | | | - | | | | - | | | | - | | | | 386,007 | | | | Bolivian Peso | | | - | | | | - | | | | 8,402 | | | | - | | | | - | | | | 8,402 | | | | Brazilian Reais | | | - | | | | 371,981 | | | | - | | | | - | | | | - | | | | 371,981 | | | | US Dollar | | | 5,614,494 | | | | - | | | | - | | | | 64,672 | | | | 677,365 | | | | 6,356,531 | | | | Subtotal fixed-rate borrowings | | | 6,000,501 | | | | 371,981 | | | | 8,402 | | | | 64,672 | | | | 677,365 | | | | 7,122,921 | | | | Floating rate: | | | | | | | | | | | | | | | - | | | | - | | | | | | | | Argentine Peso | | | 1,073,710 | | | | - | | | | - | | | | - | | | | - | | | | 1,073,710 | | | | Bolivian Peso | | | - | | | | - | | | | - | | | | - | | | | - | | | | | | | | Brazilian Reais | | | - | | | | 237,298 | | | | - | | | | - | | | | - | | | | 237,298 | | | | US Dollar | | | 120,629 | | | | - | | | | - | | | | - | | | | - | | | | 120,629 | | | | Subtotal floating rate borrowings | | | 1,194,339 | | | | 237,298 | | | | - | | | | - | | | | - | | | | 1,431,637 | | | | Total borrowings as per analysis | | | 7,194,840 | | | | 609,279 | | | | 8,402 | | | | 64,672 | | | | 677,365 | | | | 8,554,558 | | | | Finance leases | | | 3,289 | | | | - | | | | - | | | | - | | | | - | | | | 3,289 | | | | Total borrowings as per statement of financial position | | | 7,198,129 | | | | 609,279 | | | | 8,402 | | | | 64,672 | | | | 677,365 | | | | 8,557,847 | | (i) |
(i) | Includes Ps. 603,021 included in Liabilities directly associated with assets classified as held for sale (Note 44). |
The Group estimates that, other factors being constant, a 1% increase in floating rates at year-end would decrease profit before income tax for the years ended June 30, 2015 and 2014, in Ps. 14 million. A 1% decrease in floating rates would have an equal and opposite effect on the income statements. The table below shows the Group’s sensitivity to interest rate risks. The amounts are presented in Argentine Pesos.
| | | June 30, 2015 | | | Rate per currency denomination | | Argentine Peso | | | Brazilian Reais | | | Bolivian Peso | | | Uruguayan Peso | | | Total | | | Floating rate: | | | | | | | | | | | | | | | | | Argentine Peso | | | 14.26 | | | | - | | | | - | | | | - | | | | 14.26 | | | Bolivian Peso | | | - | | | | - | | | | 0.07 | | | | - | | | | 0.07 | | | Brazilian Reais | | | - | | | | 2.72 | | | | - | | | | - | | | | 2.72 | | | US Dollar | | | 1.28 | | | | - | | | | - | | | | - | | | | 1.28 | | | Total effects on Profit before income tax | | | 15.54 | | | | 2.72 | | | | 0.07 | | | | - | | | | 18.33 | |
Cresud Sociedad Anónima,
Comercial, Inmobiliaria, Financiera y Agropecuaria
Notes to Consolidated Financial Statements (Continued)
(All amounts in thousands of Argentine Pesos, except shares and per share data and as otherwise indicated)
4. | Financial risk management (Continued)
|
| | | June 30, 2014 | | | Rate per currency denomination | | Argentine Peso | | | Brazilian Reais | | | Bolivian Peso | | | Uruguayan Peso | | | Total | | | Floating rate: | | | | | | | | | | | | | | | | | Argentine Peso | | | 10.74 | | | | - | | | | - | | | | - | | | | 10.74 | | | Bolivian Peso | | | - | | | | - | | | | - | | | | - | | | | | | | Brazilian Reais | | | - | | | | 2.37 | | | | - | | | | - | | | | 2.37 | | | US Dollar | | | 1.21 | | | | - | | | | - | | | | - | | | | 1.21 | | | Total effects on Profit before income tax | | | 11.95 | | | | 2.37 | | | | - | | | | - | | | | 14.32 | |
This sensitivity analysis provides only a limited, point-in-time view of this market risk sensitivity of certain of the Group’s financial instruments. The actual impact of the interest rate changes on the Group’s financial instruments may differ significantly from the impact shown in the sensitivity analysis.
Commodity price risk and associated derivative financial instruments:
The Group’s agricultural activities expose it to specific financial risks related to commodity prices. Prices for commodities have historically been cyclical, reflecting overall economic conditions and changes in capacity within the industry, which affect the profitability of entities engaged in the agricultural industry.
Generally, the Group uses derivative instruments to hedge risks arising out of its agricultural business operations. The Group uses a variety of commodity-based derivative instruments to manage exposure to price volatility stemming from its integrated crop production activities. These instruments consist mainly of crop forwards, future contracts and put and call option contracts. Contract positions are designed to ensure that the Group will receive a defined minimum price for certain quantities of its production. The Group combines option contracts with future contracts only as a means of reducing the exposure towards the decrease in commodity prices, as being a producer means that the price is uncertain until the time the products are harvested and sold. The Group manages maximum and minimum prices for each commodity and the idea is to choose the best spot price at which to sell.
Cresud Sociedad Anónima,
Comercial, Inmobiliaria, Financiera y Agropecuaria
Notes to Consolidated Financial Statements (Continued)
(All amounts in thousands of Argentine Pesos, except shares and per share data and as otherwise indicated)
4. | Financial risk management (Continued)
|
The Group generally covers up to 50% of its crop production in order to finance its operating costs. The hedge consists of taking positions on purchased puts or sold futures and calls that assure a fixed exit price. In the past, the Group has never kept a short position greater than its crop inventories and does not intend to. On the other hand, it is not the Group’s current intention to be exposed in a long derivative position in excess of its actual production.
The following tables show the outstanding positions for each type of derivative contract for the years ended June 30, 2015 and 2014. The amounts are presented in thousands of Argentine Pesos.
| | | June 30, 2015 | | Type of derivative contract | | Tons | | | Margin | | | Premium paid or (collected) | | | Derivatives at fair value | | | Gain/ (loss) for valuation at fair value at year-end | | | Futures: | | | | | | | | | | | | | | | | | Sell | | | | | | | | | | | | | | | | | Corn | | | 8,600 | | | | 527 | | | | - | | | | (879 | ) | | | (560 | ) | | Soybeans | | | 107,727 | | | | 4,792 | | | | - | | | | (10,202 | ) | | | (3,668 | ) | | Wheat | | | 7,000 | | | | 6 | | | | - | | | | - | | | | (6 | ) | | Purchase | | | | | | | | | | | | | | | | | | | | | | Corn | | | 1,400 | | | | (50 | ) | | | - | | | | - | | | | 27 | | | Soybeans | | | 2,200 | | | | (178 | ) | | | - | | | | - | | | | (201 | ) | | Wheat | | | 1,000 | | | | 503 | | | | - | | | | - | | | | (515 | ) | | Options: | | | | | | | | | | | | | | | | | | | | | | Sell put | | | | | | | | | | | | | | | | | | | | | | Soybeans | | | 9,952 | | | | (1,312 | ) | | | (431 | ) | | | (1,389 | ) | | | (1,323 | ) | | Purchase put | | | | | | | | | | | | | | | | | | | | | | Soybeans | | | 20,412 | | | | - | | | | 2,877 | | | | 995 | | | | (1,883 | ) | | Sale call | | | | | | | | | | | | | | | | | | | | | | Soybeans | | | 44,124 | | | | 322 | | | | (2,903 | ) | | | (6,911 | ) | | | (4,009 | ) | | Total | | | 202,415 | | | | 4,610 | | | | (457 | ) | | | (18,386 | ) | | | (12,138 | ) |
| | | June 30, 2014 | | Type of derivative contract | | Tons | | | Margin | | | Premium paid or (collected) | | | Derivatives at fair value | | | Gain/ (loss) for valuation at fair value at year-end | | | Futures: | | | | | | | | | | | | | | | | | Sell | | | | | | | | | | | | | | | | | Corn | | | 20,225 | | | | 1,377 | | | | - | | | | 1,328 | | | | 1,090 | | | Soybeans | | | 197,428 | | | | 1,482 | | | | - | | | | 2,980 | | | | 1,317 | | | Wheat | | | 1,100 | | | | 72 | | | | - | | | | 6 | | | | (132 | ) | | Purchase | | | | | | | | | | | | | | | | | | | | | | Corn | | | 2,400 | | | | (116 | ) | | | - | | | | (116 | ) | | | (117 | ) | | Soybeans | | | 4,300 | | | | 415 | | | | - | | | | 415 | | | | (358 | ) | | Wheat | | | 1,700 | | | | 137 | | | | - | | | | 137 | | | | (227 | ) | | Options: | | | | | | | | | | | | | | | | | | | | | | Sell put | | | | | | | | | | | | | | | | | | | | | | Soybeans | | | 16,204 | | | | - | | | | - | | | | 753 | | | | 4,066 | | | Total | | | 243,357 | | | | 3,367 | | | | - | | | | 5,503 | | | | 5,639 | |
Cresud Sociedad Anónima,
Comercial, Inmobiliaria, Financiera y Agropecuaria
Notes to Consolidated Financial Statements (Continued)
(All amounts in thousands of Argentine Pesos, except shares and per share data and as otherwise indicated)
4. | Financial risk management (Continued)
|
| | | June 30, 2013 | | Type of derivative contract | | Tons | | | Margin | | | Premium paid or (collected) | | | Derivatives at fair value | | | Gain/ (loss) for valuation at fair value at year-end | | | Futures: | | | | | | | | | | | | | | | | | Sell | | | | | | | | | | | | | | | | | Corn | | | 12,640 | | | | 235 | | | | - | | | | 4,058 | | | | 715 | | | Soybeans | | | 61,760 | | | | 821 | | | | - | | | | 28,682 | | | | 4,431 | | | Options: | | | | | | | | | | | | | | | | | | | | | | Sell put | | | | | | | | | | | | | | | | | | | | | | Soybeans | | | 12,240 | | | | - | | | | 6,168 | | | | 7,135 | | | | 967 | | | Corn | | | 300 | | | | 3 | | | | - | | | | - | | | | (9 | ) | | Total | | | 86,940 | | | | 1,059 | | | | 6,168 | | | | 39,875 | | | | 6,104 | |
Gains and losses on commodity-based derivative instruments were Ps. 8.1 million (gain), Ps. 14.8 million (loss) and Ps. 5.1 million (gain) for the years ended June 30, 2015, 2014 and 2013, respectively. These gains and losses are included in “Other operating results, net” in the income statements.
Crops future contract fair values are computed with reference to quoted market prices on future exchanges.
Other price risk:
The Group is exposed to equity securities price risk because of investments held in entities that are publicly traded (principally TGLT, preferred shares and warrants of Condor, shares and warrants of IDBD, and others), which are classified on the consolidated statement of financial position at “fair value through profit or loss”. The Group regularly reviews the prices evolution of these equity securities in order to identify significant movements.
As of June 30, 2015 and 2014 equity investments of the Group amounts to Ps. 1,179.4 million and Ps. 617.4 million, respectively.
Cresud Sociedad Anónima,
Comercial, Inmobiliaria, Financiera y Agropecuaria
Notes to Consolidated Financial Statements (Continued)
(All amounts in thousands of Argentine Pesos, except shares and per share data and as otherwise indicated)
4. | Financial risk management (Continued)
|
The Group estimates that, other factors being constant, a 10% decrease in quoted prices of equity securities and in derivative financial instruments portfolio at year-end would generate a loss before income tax for the year ended June 30, 2015 of Ps. 186:
| | Increase in loss before income tax
(in millions of Ps.)
| | Company | | June 30, 2015 | | IDBD | | | 127.9 | | Condor | | | 39.0 | | TGLT | | | 7.2 | | Avenida | | | 10.2 | | Others | | | 1.7 | | Total | | | 186 | |
An increase of 10% on these prices would have an equal and opposite effect in the statement of income.
This sensitivity analysis provides only a limited point-in-time view of the price risk sensitivity of certain of the Group’s equity securities. The actual impact of the price changes on the equity securities may differ significantly from the impact shown in the sensitivity analysis.
(b) | Credit risk management |
Credit risk refers to the risk that counterparty will default on its contractual obligations resulting in a financial loss to the Group. Credit limits have been established to ensure that the Group deals only with approved counterparties and that counterparty concentration risk is addressed and the risk of loss is mitigated. Counterparty exposure is measured as the aggregate of all obligations of any single legal entity or economic entity to the Group.
The Group is subject to credit risk arising from deposits with banks and financial institutions, investments of surplus cash balances, the use of derivative financial instruments and from outstanding receivables. Credit risk is managed on a country-by-country basis. Each local entity is responsible for managing and analyzing the credit risk.
The Group’s policy is to manage credit exposure to deposits, short-term investments and other financial instruments by maintaining diversified funding sources in various financial institutions. All the institutions that operate with the Group are well known because of their experience in the market and high quality credit. The Group places its cash and cash equivalents, investments, and other financial instruments with various high credit quality financial institutions, thus mitigating the amount of credit exposure to any one institution. The maximum exposure to credit risk is represented by the carrying amount of cash and cash equivalents and short-term investments in the statement of financial position.
Cresud Sociedad Anónima,
Comercial, Inmobiliaria, Financiera y Agropecuaria
Notes to Consolidated Financial Statements (Continued)
(All amounts in thousands of Argentine Pesos, except shares and per share data and as otherwise indicated)
4. | Financial risk management (Continued)
|
The Group’s primary objective for holding derivative financial instruments is to manage currency exchange rate risk and interest rate risk and commodities prices. The Group generally enters into derivative transactions with high-credit-quality counterparties and, by policy, limits the amount of credit exposure to each counter party. The amounts subject to credit risk related to derivative instruments are generally limited to the amounts, if any, by which counterparty’s obligations exceed the obligations that the Group has with that counterparty. The credit risk associated with derivative financial instruments is representing by the carrying value of the assets positions of these instruments.
The Group’s policy is to manage credit risks associated with trade and other receivables within defined trading limits. All Group’s significant counterparties have internal trading limits. The Group’s customers are distinguished between those customers arising out of the investment and development properties activities of the Group from those arising out of its agricultural and agro-industrial operations. These two groups of customers are monitored separately due to their distinct characteristics.
Investment and development properties activities
Trade receivables from investment and development property activities are primarily derived from leases and services from shopping centers, office and other rental properties; receivables from the sale of trading properties and investment properties (primarily undeveloped land and non-retail rental properties). The Group has a large customer base and is not dependent on any single customer.
Trade receivables related to leases and services provided by the Group represent a diversified tenant base and account for 38% and 28% of the Group’s total trade receivables as of June 30, 2015 and 2014, respectively. The Group has specific policies to ensure that rental contracts are transacted with counterparties with appropriate credit quality. The majority of the Group’s shopping center, office and other rental properties’ tenants are well recognized retailers, diversified companies, professional organizations, and others. Owing to the long-term nature and diversity of its tenancy arrangements, the credit risk of this type of trade receivables is considered to be low. Generally, the Group has not experienced any significant losses resulting from the non-performance of any counterpart to the lease contracts and, as a result, the allowance for doubtful account balance is low. Individual risk limits are set based on internal or external ratings in accordance with limits set by the Group. If customers are independently rated, these ratings are used. If there is no independent rating, risk control assesses the credit quality of the customer, taking into account its past experience, financial position, actual experience and other factors. Based on the Group’s analysis, the Group determines the size of the deposit that is required from the tenant at inception. Management does not expect any losses from non-performance by these counterparties. See Note 18 for details.
Cresud Sociedad Anónima,
Comercial, Inmobiliaria, Financiera y Agropecuaria
Notes to Consolidated Financial Statements (Continued)
(All amounts in thousands of Argentine Pesos, except shares and per share data and as otherwise indicated)
4. | Financial risk management (Continued)
|
On the other hand, property receivables related to the sale of trading properties represent 26% and 13% of the Group’s total trade receivables as of June 30, 2015 and 2014, respectively. Payments on these receivables have generally been received when due. These receivables are generally secured by mortgages on the properties. Therefore, the credit risk on outstanding amounts is considered very low.
Agricultural and agro-industrial activities
Trade receivables from agriculture and agro-industrial activities are primarily derived from the sale of commodities, raw milk, cattle, and sugarcane; receivables from feed lot operations and raw meat products; receivables from the lease of farmland properties; receivables from the sale of farmland properties; and, other receivables from ancillary activities. Trade receivables from agriculture and agro-industrial activities represent 23% and 20% of the Group’s total trade receivables as of June 30, 2015 and 2014, respectively. In contrast with the investment and development properties activities of the Group, the Group’s agribusiness is conducted through several international subsidiaries. The Group has subsidiaries in Argentina, Brazil and Bolivia. However, Argentina and Brazil together concentrate more than 89% and 93% of the Group’s grain production for the years ended June 30, 2015 and 2014, respectively. Each country has its own established market for the respective grain production. Generally, the entire country’s grain production is sold in the domestic market to well-known multinational exporters such as Molinos, Cargill or Bunge, and/or local exporters. Prices for grains are also generally based on the market prices quoted in the domestic markets which normally take as reference the prices in international grain exchanges such as the Chicago Board of Trade.
For the year ended June 30, 2015, 27% of sales of the combined sales of Argentina and Brazil were sold to well-known exporters, while for the year ended on June 30, 2014, 10% of sales of crops in Brazil were sold to two well-known exporters. The Group performs credit evaluations of its customers and generally does not require collateral. Although sales are highly concentrated, the Group does not believe that significant credit risk exists at the reporting period due to the high credit rating of these customers.
For the years ended June 30, 2015 and 2014, the grain production in Bolivia has not been significant representing only 9% and 5% of the total Group’s crop sales, respectively.
Cresud Sociedad Anónima,
Comercial, Inmobiliaria, Financiera y Agropecuaria
Notes to Consolidated Financial Statements (Continued)
(All amounts in thousands of Argentine Pesos, except shares and per share data and as otherwise indicated)
4. | Financial risk management (Continued)
|
The Group concentrates its cattle production in Argentina where it is entirely sold in the domestic market. The main buyers are slaughterhouses and supermarkets and are well dispersed. Prices in the beef cattle market in Argentina are basically fixed by local supply and demand. The principal market is the Liniers Meat Market in Buenos Aires, which provides a standard in price formation for the rest of the domestic markets. Live animals are sold by auction on a daily basis in the market, whereas prices are negotiated by kilogram of live weight and are mainly determined by local supply and demand. Some supermarkets and meat packers establish their prices by kilogram of processed meat; in these cases, processing yields influences the final price.
The Group’s milk production is also based in Argentina. The Group has historically sold its entire milk production to Mastellone Hnos S.A., which is the largest dairy company in Argentina. Sales to Mastellone amounted to Ps. 71.9 and Ps. 50.8 million for the years ended June 30, 2015 and 2014, respectively, representing 3% and 2.8% of the Group’s agricultural consolidated revenue for those years, respectively, and 1% of the Group’s total revenues in both years. Although sales are concentrated, the Group does not believe that significant credit risk exists at the reporting period due to the high credit rating of Mastellone. As milk is a perishable product there is no ability for the Group to mitigate pricing risk through inventory management. The Group negotiates the prices of raw milk on a monthly basis in accordance with domestic supply and demand. Prices for milk are based on a number of factors including fat and protein content, bacteria levels and temperature. However, dairy prices have historically tended to have reasonable correlation with prices of agricultural inputs such as feed and fertilizer, and the Group monitors these relationships in order to adapt its tactics to suit.
The Group’s sugarcane production is based in Brazil and to a lesser extent in Bolivia. Brazil concentrates more than 95.5% of the Group’s total sugar production. Currently, the Group has one farm in Brazil dedicated to sugarcane production and the entire output is sold to a third-party, ETH Bioenergia S.A. (“ETH”), under an exclusive agreement dated March 2008. ETH is the largest ethanol producer in Brazil. Under the agreement, ETH is contractually obligated to purchase the entire production of two crop cycles of sugarcane comprising six agricultural years with five cuts, with the possibility of extending them for another full agricultural cycle upon prior agreement of the parties. The duration of each cycle may be extended if the parties wish to do so. Currently, the Group is selling to ETH at market price. Sales to ETH amounted to Ps. 178.4 million and Ps. 106 million for the years ended June 30, 2015 and 2014, respectively, representing el 7.5% and 6% of the Group’s agricultural consolidated revenue for those years, respectively. Although sales are concentrated, the Group does not believe that significant credit risk exists at the reporting period due to the high credit rating of ETH.
Cresud Sociedad Anónima,
Comercial, Inmobiliaria, Financiera y Agropecuaria
Notes to Consolidated Financial Statements (Continued)
(All amounts in thousands of Argentine Pesos, except shares and per share data and as otherwise indicated)
4. | Financial risk management (Continued)
|
The management does not expect any significant losses resulting from the non-performance by these counterparties.
The maximum exposure to Group’s credit risk is represented by the carrying amount of each financial asset in the statement of financial position after deducting any impairment allowance. The Group’s overall exposure of credit risk arising from trade receivables is set out in Note 18.
(c) | Liquidity risk management |
The Group is exposed to liquidity risks, including risks associated with refinancing borrowings as they mature, the risk that borrowing facilities are not available to meet cash requirements, and the risk that financial assets cannot readily be converted to cash without loss of value. Failure to manage liquidity risks could have a material impact on the Group’s cash flow and statement of financial position. Prudent liquidity risk management implies maintaining sufficient cash, the availability of funding through an adequate amount of committed credit facilities and the ability to close out market positions. Due to the dynamic nature of the underlying businesses, the Group aims to maintain flexibility in funding its existing and prospective debt requirements by maintaining diversified funding sources.
The Group monitors its current and projected financial position using several key internally generated reports: cash flow; debt maturity; and interest rate exposure. The Group also undertakes sensitivity analysis to assess the impact of proposed transactions, movements in interest rates and changes in property values on the key profitability, liquidity and balance sheet ratios.
The Group’s debt and derivative positions are continually reviewed to meet current and expected debt requirements. The Group maintains a balance between longer-term and shorter-term financings. Short-term financing is principally raised through bank facilities and overdraft positions. Medium- to longer-term financing comprises public and private bond issues, including private placements. Financing risk is spread by using a variety of types of debt. The maturity profile is managed in accordance with Group’s needs, by spreading the repayment dates and extending facilities, as appropriate.
4. | Financial risk management (Continued)
|
The tables below show financial liabilities, including Group’s derivative financial liabilities groupings based on the remaining period at the statement of financial position to the contractual maturity date. The amounts disclosed in the tables are the contractual undiscounted cash flows and as a result, they do not reconcile to the amounts disclosed on the statement of financial position. However, undiscounted cash flows in respect of balances due within 12 months generally equal their carrying amounts in the statement of financial position, as the impact of discounting is not significant. The tables include both interest and principal flows.
Where the interest payable is not fixed, the amount disclosed has been determined by reference to the existing conditions at the reporting date.
| At June 30, 2015 | | Less than 1 year | | | Between 1 and 2 years | | | Between 2 and 3 years | | | Between 3 and 4 years | | | More than 4 years | | | Total | | | Trade and other payables | | | 943,713 | | | | 11,001 | | | | 4,698 | | | | 2,582 | | | | - | | | | 961,994 | | | Borrowings (Excluding finance leases liabilities) (i) | | | 2,215,239 | | | | 3,296,084 | | | | 616,654 | | | | 717,850 | | | | 2,118,068 | | | | 8,963,895 | | | Finance leases | | | 11,785 | | | | 7,291 | | | | 3,859 | | | | 2,552 | | | | - | | | | 25,487 | | | Derivative financial instruments | | | 270,499 | | | | 269,949 | | | | - | | | | - | | | | - | | | | 540,448 | | | Total | | | 3,441,236 | | | | 3,584,325 | | | | 625,211 | | | | 722,984 | | | | 2,118,068 | | | | 10,491,824 | |
| At June 30, 2014 | | Less than 1 year | | | Between 1 and 2 years | | | Between 2 and 3 years | | | Between 3 and 4 years | | | More than 4 years | | | Total | | | Trade and other payables | | | 914,782 | | | | 67,232 | | | | 47,809 | | | | 16,646 | | | | 47,322 | | | | 1,093,791 | | | Borrowings (Excluding finance leases liabilities) (i) | | | 3,555,212 | | | | 882,910 | | | | 2,677,153 | | | | 1,004,124 | | | | 2,067,023 | | | | (ii)10,186,422 | | | Finance leases | | | 2,130 | | | | 678 | | | | 531 | | | | - | | | | - | | | | 3,339 | | | Derivative financial instruments | | | 53,419 | | | | 144,808 | | | | 176,039 | | | | - | | | | - | | | | 374,266 | | | Total | | | 4,525,543 | | | | 1,095,628 | | | | 2,901,532 | | | | 1,020,770 | | | | 2,114,345 | | | | 11,657,818 | |
(i) | Includes accrued and prospecting interests. |
(ii) | Includes Ps. 603,021 included in Liabilities directly associated with assets classified as held for sale (Note 44). |
(d) | Capital risk management |
The capital structure of the Group consists of shareholders’ equity and net borrowings. The type and maturity of the Group’s borrowings are analyzed further in Note 25. The Group’s equity is analyzed into its various components in the statement of changes in equity.
Capital is managed so as to promote the long-term success of the business and to maintain sustainable returns for shareholders.
Cresud Sociedad Anónima,
Comercial, Inmobiliaria, Financiera y Agropecuaria
Notes to Consolidated Financial Statements (Continued)
(All amounts in thousands of Argentine Pesos, except shares and per share data and as otherwise indicated)
4. | Financial risk management (Continued)
|
The Group seeks to manage its capital requirements to maximize value through the mix of debt and equity funding, while ensuring that Group entities continue to operate as going concerns, comply with applicable capital requirements and maintain strong credit ratings.
The Group assesses the adequacy of its capital requirements, cost of capital and gearing (i.e. debt/equity mix) as part of its broader strategic plan. The Group continuously reviews its capital structure to ensure that (i) sufficient funds and financing facilities are available to implement the Group’s property development and business acquisition strategies, (ii) adequate financing facilities for unforeseen contingencies are maintained, and (iii) distributions to shareholders are maintained within the Group’s dividend distribution policy. The Group also protects its equity in assets by taking out insurance.
The Group’s strategy is to maintain key financing metrics namely, net debt to total equity ratio (gearing) and loan-to-value ratio (LTV) to ensure that asset level performance is translated into enhanced returns for shareholders whilst maintaining an appropriate risk reward balance to accommodate changing financial and operating market cycles.
The following table details the key metrics in relation to managing its capital structure of the Group. The levels of these metrics are within the ranges established by the Group’s strategy.
| | | June 30, 2015 | | | June 30, 2014 | | | Gearing ratio (i) | | | 74.46 | % | | | 71.90 | % | | LTV ratio (ii) | | | 12.18 | % | | | 14.33 | % |
(i) | Calculated as total debt divided by total capital (including equity plus total debt). |
(ii) | Calculated as total debt divided by total property at fair value (including trading properties, properties, plant and equipment, investment properties, farmland rights to receive units under barter agreements). |
Cresud Sociedad Anónima,
Comercial, Inmobiliaria, Financiera y Agropecuaria
Notes to Consolidated Financial Statements (Continued)
(All amounts in thousands of Argentine Pesos, except shares and per share data and as otherwise indicated)
4. | Financial risk management (Continued)
|
(e) | Other non-financial risks |
Nature risk:
The Group’s revenue arising from agricultural activities depends significantly on the ability to manage biological assets and agricultural produce. The ability to manage biological assets and agricultural produce may be affected by unfavorable local weather conditions and natural disasters. Weather conditions such as floods, droughts, hail, windstorms and natural disasters such as fire, disease, insect infestation and pests are examples of such unpredictable events. The Group manages this risk by locating its farmlands in different geographical areas. The Group has not taken out insurance for this kind of risks. The occurrence of severe weather conditions or natural disasters may affect the growth of our biological assets, which in turn may have a material adverse effect on the Group’s ability to harvest agricultural produce in sufficient quantities and in a timely manner.
Property risk:
There are several risks affecting the Group’s property investments. The composition of the Group’s property portfolio including asset concentration and lot size may impact liquidity and relative property performance. The Group has a large multi-asset portfolio and monitors its concentration and average investment property lot size.
A change in trends and economic conditions causes shifts in customer demands for properties with impact on new lettings, renewal of existing leases and reduced rental growth. Also changes increase risk of tenant insolvencies. The Group conducts several actions to mitigate some of these risks whenever possible. The variety of asset types and geographical spread as well as a diversified tenant base, with monitoring of tenant concentration, helps mitigating these risks.
The development, administration and profitability of shopping centers are impacted by various factors including: the accessibility and the attractiveness of the area where the shopping center is located, the intrinsic attractiveness of the shopping center, the flow of people, the level of sales of each shopping center rental unit, the increasing competition from internet sales, the amount of rent collected from each shopping center rental unit and the fluctuations in occupancy levels in the shopping centers. In the event that there is an increase in operational costs, caused by inflation or other factors, it could have a material adverse effect on the Group if its tenants are unable to pay their higher rent obligations due to the increase in expenses. Argentine Law N° 24,808 provides that tenants may rescind commercial lease agreements after the initial six months upon not less than sixty days written notice, subject to penalties of only one-and-a-half month rent if the tenant rescinds during the first year of the lease, and one-month rent if the tenant rescinds during the second year of the lease. The exercise of such rescission rights could materially and adversely affect the Group.
Cresud Sociedad Anónima,
Comercial, Inmobiliaria, Financiera y Agropecuaria
Notes to Consolidated Financial Statements (Continued)
(All amounts in thousands of Argentine Pesos, except shares and per share data and as otherwise indicated)
4. | Financial risk management (Continued)
|
Risks associated with development properties activities include the following: the potential abandonment of development opportunities; construction costs exceeding original estimates, possibly making a project uneconomical; occupancy rates and rents at newly completed projects may be insufficient to make the project profitable. On the other hand, the Group’s inability to obtain financing on favorable terms for the development of the project; construction and lease-up may not be completed on schedule, resulting in increased debt service expense and construction costs; and the Group’s inability to obtain, or the delays in obtaining, all necessary zoning, land-use, building, occupancy and other required governmental permits and authorizations; preconstruction buyers may default on their purchase contracts or units in new buildings may remain unsold upon completion of constructions; prices for residential units may be insufficient to cover development cost. The Group also takes several actions to monitor these risks and respond appropriately whenever it is under its control. The Group has in-house property market research capability and development teams that monitor development risks closely. The Group generally adopts conservative assumptions on leasing and other variables and monitors the level of committed future capital expenditure on development programs relative to the level of undrawn facilities.
The Group’s hotel properties face specific risks as well. The success of the Group’s hotel properties will depend, in large part, upon the Group’s ability to compete in areas such as access, location, quality of accommodations, room rate structure, quality and scope of food and beverage facilities and other services and amenities. The Group’s hotels may face additional competition if other companies decide to build new hotels or improve their existing hotels such that they are more attractive to potential guests. In addition, their profitability depends on (i) the Group’s ability to form successful relationships with international operators to run the hotels; (ii) changes in travel patterns, including seasonal changes; and (iii) taxes and governmental regulations which influence or determine wages, prices, interest rates, construction procedures and costs.
5. | Critical accounting estimates, assumptions and judgments |
The Group’s significant accounting policies are stated in Note 2. Not all of these significant accounting policies require management to make subjective or complex judgments or estimates. The following section is intended to provide an understanding of the policies that management considers critical because of the level of complexity, judgment or estimation involved in their application and their impact on the consolidated financial statements. These judgments involve assumptions or estimates in respect of future events. Actual results may differ from these estimates.
Cresud Sociedad Anónima,
Comercial, Inmobiliaria, Financiera y Agropecuaria
Notes to Consolidated Financial Statements (Continued)
(All amounts in thousands of Argentine Pesos, except shares and per share data and as otherwise indicated)
5. | Critical accounting estimates, assumptions and judgments (Continued)
|
(a) Business combinations – purchase price allocation
The acquisition of subsidiaries is accounted for using the acquisition method. Accounting for business combinations requires the determination of the fair value of to the various assets and liabilities of the acquired business. The Group uses all available information to make these fair value determinations, and for major acquisitions, may hire an independent appraisal firm to assist in making fair value estimates. In some instances, assumptions with respect to the timing and amount of future revenues and expenses associated with an asset might have to be used in determining its fair value. These assumptions may differ materially from those initial estimates, and if the timing is delayed significantly or if the net cash flows decline significantly, the asset could become impaired.
(b) Impairment testing of goodwill and other non-current assets
As of the end of each fiscal year, the Group reviews the carrying amounts of its property, plant and equipment, investment property and finite-life intangible assets to determine whether there is any indicator that those assets have suffered an impairment loss. The indicators that must be taken into account in the analysis are, among other points, physical damage or significant changes to the manner in which the asset is used, worse than expected economic performance or a drop in revenues. Where the asset does not generate cash flows that are independent from others assets, the Group estimates the recoverable amount of the cash-generating unit (“CGU”) to which the asset belongs.
Goodwill and Intangible assets that are not amortized are tested for impairment on an annual basis, or more frequently if there is an indicator of impairment. For the purposes of the impairment testing, goodwill is to be allocated since acquisition among each of the CGU or groups of cash generating units that are expected to benefit from the synergies of the respective business combinations, regardless of the allocation of other assets or liabilities owned by the acquired entity to these cash-generating units or groups of cash-generating units.
If the recoverable amount of an asset or CGU is lower than its carrying amount, the carrying value of the asset or CGU is thus written down to its recoverable value. The impairment losses are recorded immediately in the income statements.
Given the nature of its assets and activities, most of the Group´s individual assets do not generate cash flows that are independent of those from CGU. Therefore, the Group estimates the recoverable amount of the CGU for the purposes of the impairment test.
Cresud Sociedad Anónima,
Comercial, Inmobiliaria, Financiera y Agropecuaria
Notes to Consolidated Financial Statements (Continued)
(All amounts in thousands of Argentine Pesos, except shares and per share data and as otherwise indicated)
5. | Critical accounting estimates, assumptions and judgments (Continued)
|
Generally, each shopping center, office building and undeveloped property is deemed to be separate CGU. As regards, farmlands used for agricultural activities, when farmland is used for single activities (i.e. crops), it is considered as one CGU, but when farmlands are used for more than one activity (i.e. crops and cattle), the farmland is further subdivided into two or more CGUs, as appropriate, for purposes of impairment testing.
There are no indicators of impairment in goodwill and other assets during the year ended June 30, 2014. As of June 30, 2015, the circumstances mentioned in Note 7 referred to Arcos del Gourmet S.A. were deemed to be potential proof of impairment and, therefore, the Company carried out relevant analysis on consolidated net assets in this transaction. To such end, the Company has determined the recoverable value of such assets using the discounted cash flow valuation method upon weighing various scenarios. The main inputs used in the model include projected operating income and a discount rate in line with the business. Each revenue and cost scenario was assigned an occurrence probability rate based on information available at the time of conducting the analysis. The Company concluded that it is not necessary to record any impairment of its related assets.
The following table shows the amounts of goodwill and non-current assets other than goodwill of the CGUs where goodwill was allocated at the date of acquisition for each of June 30, 2015 and 2014:
| CGU | Country | Segment | Method of valuation | | | 06.30.15 | | | | 06.30.14 | | | Abasto | Argentina | Shopping Centers | (i) | | | 3,307 | | | | 3,307 | | | Alto Palermo | Argentina | Shopping Centers | (i) | | | 3,609 | | | | 3,608 | | | Arcos del Gourmet S.A. | Argentina | Shopping Centers | (i) | | | 30,260 | | | | 20,873 | | | Bouchard 551 | Argentina | Offices and other rental properties | (i) | | | 2,878 | | | | 2,878 | | | Santa María del Plata | Argentina | Sales and development | (i) | | | 4,535 | | | | 4,535 | | | Torre Bank Boston | Argentina | Offices and other rental properties | (i) | | | 4,873 | | | | 4,873 | | | Conil | Argentina | Sales and development | (i) | | | - | | | | 344 | | | Jatobá | Brazil | Agriculture | (i) | | | 2,708 | | | | 2,721 | | | Chaparral | Brazil | Agriculture | (i) | | | 2,035 | | | | 2,046 | | | Cremaq | Brazil | Agriculture | (i) | | | - | | | | 2,415 | | | Araucaria | Brazil | Agriculture | (i) | | | 3,667 | | | | 3,250 | | | | | | | | | 57,872 | | | | 50,850 | | | Closing value of non-current assets other tan goodwill (ii) | | | 1,725,644 | | | | 1,918,578 | | | Total assets allocated to CGUs | | | 1,783,516 | | | | 1,969,428 | |
(i) | The following table details the models used for each segment. |
(ii) | Non-current assets include investment properties (primarily shopping centers and offices), properties, plant and equipment; intangible assets and net working capital. |
Cresud Sociedad Anónima,
Comercial, Inmobiliaria, Financiera y Agropecuaria
Notes to Consolidated Financial Statements (Continued)
(All amounts in thousands of Argentine Pesos, except shares and per share data and as otherwise indicated)
5. | Critical accounting estimates, assumptions and judgments (Continued)
|
The Group carried out the impairment test on these CGU on the basis of its value in use and determined that no impairment should be recognized on the value of these assets for any of the reported years.
For the CGU included in segments “International”, “Offices and others” and “Shopping centers” ” the Group uses the fair value of investment property estimated by independent appraisers. The involvement of an independent appraiser is required according to CNV Resolution N° 576/10.
For purposes of calculating the fair value for impairment tests and/or to disclose it in a note to the financial statements the Group uses various valuation techniques: discounted cash flows, capitalization method and market comparables, depending on the type of ownership involved, as indicated below.
Under the cash flows model, or discounted cash flows independent appraisers estimate the amount of net future cash flows based on the specific features of each property (including but not limited to location, sales, occupation and turnout, useful lives, among others), existing agreements, market information and future forecasts as of the valuation date. Net income forecasts and revenues growth rates are among the most important assumptions used in the valuation. This estimate also considers the discount rates that reflect the market assessments regarding uncertainties in terms of the cash flow amount and timing. Any inaccuracy in the most sensitive assumptions used by the appraisers may result in differences in the fair value of the Group’s properties.
The Group uses the capitalization method ("cap rate") for valuation of its investment properties at fair value. The methodology involves designing simulation models whereby the current annual operating income flaw of a given asset is considered to be a stabilized low in perpetuity, and is divided by a capitalization rate derived from market comparables; the rate is adjusted for any difference in the major features (either size, location and condition of asset) to determine its fair value. The Group considers that the new methodology reflects more reliably the fair market value of its shopping centers for it is based on the current annual net operating income of various assets and uses market information to determine the capitalization rate; as such, it is a more transparent method internationally recognized in the industry. Additionally, it is the same methodology used to value the shopping center segments in other companies, hence, it is more useful to make comparisons against such valuations.
Cresud Sociedad Anónima,
Comercial, Inmobiliaria, Financiera y Agropecuaria
Notes to Consolidated Financial Statements (Continued)
(All amounts in thousands of Argentine Pesos, except shares and per share data and as otherwise indicated)
5. | Critical accounting estimates, assumptions and judgments (Continued)
|
As of June 30, 2015 and 2014 fair value of investment was computed using a weighted average capitalization rate of 12% and 10% (a 10% to 15% range was considered for the year 2015 and 9% to 12% for the year 2014).
Generally, an increase in the annual flow of operating income will lead to an increase in the fair value of investment properties. An increase in the capitalization rate will lead to a decline in the fair value of investment properties.
For those assets that are not currently operating under a concession contract, the discounted cash flow valuation is used.
Under the model of sales comparison approach (or comparable market data), the sale price of comparable property located nearby is adjusted by the differences in the most significant features of such property, such as, size and condition. The most relevant data included in this method is the price per square meter.
The following table details the models used for each segment:
| CGU | | | 06.30.15 | | | | 06.30.14 | | | Operating Shopping Center Properties | | Capitalization | | | Capitalization | | | Shopping Center Properties (Concession) | | Discounted cash flows | | | Discounted cash flows | | | Offices and other rental properties | | Comparable market data | | | Comparable market data | | | International | | | - | | | Discounted cash flows | | | Sales and developments | | Comparable market data | | | Comparable market data | | | Agriculture | | Comparable market data | | | Comparable market data | |
Finally, for the CGUs included in the “Agriculture” business segment, the fair value of farmland is also estimated using the comparative sales method. In these cases, farmland is valued based on its production value, that is, its capacity to produce grains and/or raise cattle, as well as other factors, such as the weather or the geographic location. Farmland is classified in accordance with factors such as texture and quality, yield, topography, rain levels and soil drainage. Based on the factors listed before, different land classifications are assigned to each rural property in order to ascertain its value. Soil classifications quantify factors that contribute to the agricultural capacity of such soil, and range from the most productive to the least productive soil for agricultural activity. A price is assigned per hectare to each type of soil. This price per hectare is based on a quantitative and qualitative analysis which takes into consideration the current yield and productivity of that soil, the potential productivity of the soil based on its best use, the projected gross margin derived from the use of the soil, the rental value obtained from the use of the soil, if applicable, and the existence of comparable farmland of similar characteristics in the same topographic area. The results obtained as a result of the description above are compared to actual sale prices, if available, and the market current conditions, in order to ensure that such values are correct, consistent and fair.
Cresud Sociedad Anónima,
Comercial, Inmobiliaria, Financiera y Agropecuaria
Notes to Consolidated Financial Statements (Continued)
(All amounts in thousands of Argentine Pesos, except shares and per share data and as otherwise indicated)
5. | Critical accounting estimates, assumptions and judgments (Continued)
|
Management believes these assumptions are conservative and that any reasonable change in them would not increase the book value of the CGUs so as to exceed its recoverable value.
(c) Biological assets and agricultural produce at the point of harvest
The Group measures biological assets that have attained significant biological growth and agricultural produce at the point of harvest at fair value less costs to sell. Biological assets include mainly unharvested crops, beef and dairy cattle, sheep and sugarcane plantations. The agricultural produce includes harvested crop, raw meat, raw milk, wool and others.
Crops and oilseeds
The Group’s crops generally include crops and oilseeds (corn, wheat, soybean and sunflower) as well as peanut. The Group measures biological assets that have attained significant biological growth at fair value less costs to sell. The Group measures biological assets that have not attained significant biological growth or when the impact of biological transformation on price is not expected to be material, at cost less any impairment losses, which approximates fair value.
The following table shows the stages and average periods where the Group´s crops have a significant biological growth, based on agronomical studies and other inputs:
Argentina
| Crops | Total days (planting/harvest) | | Average days (planting/harvest) | | Significant Biological Growth | Total days (planting/significant growth) | | Average days (planting/significant growth) | | | Wheat | From 150 to 180 | | | 165 | | 7 (milk grain stage) | From 110 to 140 | | | 125 | | | Corn | From 150 to 180 | | | 165 | | R3 (milk grain stage) | From 80 to 110 | | | 95 | | | Soybeans | From 120 to 160 | | | 140 | | R5 (Start of seed filling at node) | From 75 to 90 | | | 82.5 | | | Sunflowers | From 120 to 150 | | | 135 | | R6 (end of flowering stage) | From 80 to 100 | | | 90 | | | Peanut | From 180 to 270 | | | 240 | | R5 (Start of seed filling at node) | From 90 to 100 | | | 95 | | | Cotton | From 130 to 180 | | | 155 | | 3 (end of flowering stage) | From 90 to 120 | | | 105 | |
Cresud Sociedad Anónima,
Comercial, Inmobiliaria, Financiera y Agropecuaria
Notes to Consolidated Financial Statements (Continued)
(All amounts in thousands of Argentine Pesos, except shares and per share data and as otherwise indicated)
5. | Critical accounting estimates, assumptions and judgments (Continued)
|
Bolivia
| Crops | Total days (planting/harvest) | | Average days (planting/harvest) | | Significant Biological Growth | Total days (planting/significant growth) | | Average days (planting/significant growth) | | | Wheat | From 100 to 112 | | | 106 | | 7 (milk grain stage) | From 80 to 90 | | | 85 | | | Corn | From 130 to 140 | | | 130 | | R3 (milk grain stage) | From 88 to 96 | | | 92 | | | Sorghum | From 110 to 130 | | | 120 | | 7 (milk grain stage) | From 80 to 90 | | | 85 | | | Soybeans | From 110 to 120 | | | 117 | | R5 (start of seed filling) | From 75 to 85 | | | 80 | | | Sunflowers | From 105 to 115 | | | 110 | | R6 (end of flowering stage) | From 75 to 85 | | | 80 | |
Brazil
| Crops | Total days (planting/harvest) | | Average days (planting/harvest) | | Significant Biological Growth | Total days (planting/significant growth) | | Average days (planting/significant growth) | | | Corn | From 125 to 150 | | | 137.5 | | R3 (milk grain stage) | From 88 to 96 | | | 92 | | | Soybeans | From 100 to 140 | | | 120 | | R5 (start of seed filling) | From 75 to 90 | | | 82.5 | |
The Group’s fiscal year begins on July 1 and ends the following June 30 of the following year. However, production is based on the harvest year of each one of these crops. The harvest year varies according to the crop, the type or variety of hybrid and the climate where they are grown. The planting period for a given plant may start earlier on one farm than on another, causing differences in their respective harvesting periods.
The following table shows the production process for each of Group’s most significant crops and oilseeds, reflecting the average periods at which each stage of production occurs:
Argentina
Crops | Planting | Harvesting | Sell | Soybeans | Between September and February | Between March and June | From March onwards | Corn | Between August and February | Between March and September | From March onwards | Wheat | Between May and July | Between October and January | From October onwards | Sunflowers | Between August and December | Between December and May | From December onwards | Peanut | Between September and October | Between April and July | From April onwards | Cotton | Between November and December | Between July and August | From July onwards |
Cresud Sociedad Anónima,
Comercial, Inmobiliaria, Financiera y Agropecuaria
Notes to Consolidated Financial Statements (Continued)
(All amounts in thousands of Argentine Pesos, except shares and per share data and as otherwise indicated)
5. | Critical accounting estimates, assumptions and judgments (Continued)
|
Bolivia
Crops | Planting | Harvesting | Sell | Summer Soybeans | Between November and December | Between March and May | From April to June | Winter Soybeans | Between June and July | Between October and November | From October to December | Winter corn | April | September | From September to December | Winter sorghum | March | July | From August to December | Wheat | Between April and May | Between August and September | From August to December | Sunflowers | April | Between August and September | From August to December | Corn / Summer Sorghum | Between October and November | Between March and April | From April to June/July |
Brazil
Crops | Planting | Harvesting | Sell | Soybeans | Between October and December | Between February and May | From February onwards | Corn | Between October and November | Between March and May | From March onwards | Corn (2) | Between February and March | Between June and July | From June onwards |
Sugarcane
The Group’s sugarcane production is based in Brazil and to a lesser extent in Bolivia. This crop’s production requires specific weather conditions (tropical and subtropical climates) because it is a perennial and long-term crop with an average life cycle of five years. Each sugarcane planting generally yields five harvests. Once the production life cycle is over, crop renewal is brought about. Sugarcane planting is done between January and April each year, while harvesting and subsequent sale take place between April and November each year. The Group recognizes these crops at a fair value net of costs of sales from the moment of planting.
The following table shows the production process for each of Group’s sugarcane, reflecting the average periods at which each stage of production occurs.
Bolivia
Crops | Planting | Harvesting | Sell | Sugarcane | Between April and June | Between July and November | From July onwards |
Brazil
Crops | Planting | Harvesting | Sell | Sugarcane | Between January and April | Between April and November | From April and November |
Cresud Sociedad Anónima,
Comercial, Inmobiliaria, Financiera y Agropecuaria
Notes to Consolidated Financial Statements (Continued)
(All amounts in thousands of Argentine Pesos, except shares and per share data and as otherwise indicated)
5. | Critical accounting estimates, assumptions and judgments (Continued)
|
Other biological assets:
The mares and sheep are measured at fair value less costs to sell at birth or acquisition date, accordingly.
Fair value of biological assets:
When an active market exists for biological assets, the Group uses the quoted market price in the principal market as a basis to determine the fair value of its biological. Live cattle is measured at fair value less selling costs, based on market quoted at an auction involving cattle of the same age, breed and genetic merit adjusted, if applicable, to reflect any difference. When there is no active market or market-determined prices are not available, (for example, unharvested crops with significant growth), the Group determines the fair value of a biological asset in its present location and condition based on the present value of expected net cash flows from the biological asset discount (“DCF”). The DCF model requires the input of highly subjective assumptions including observable and unobservable data. Generally the estimation of the fair value of biological assets is based on models or inputs that are not observable in the market and the use of unobservable inputs is significant to the overall valuation of the assets. Key assumptions utilized in the DCF method include future market prices, estimated yields at the point of harvest and estimated future costs of harvesting and other costs.
Market prices are generally determined by reference to observable data in the principal market for the agricultural produce. Harvesting costs and other costs are estimated based on historical and statistical data. Yields are estimated based on several factors including the location of the farmland and soil type, environmental conditions, infrastructure and other restrictions and growth at the time of measurement. Yields are subject to a high degree of uncertainty and may be affected by several factors out of the Group’s control including but not limited to extreme or unusual weather conditions, plagues and other crop diseases.
The key assumptions discussed above are highly sensitive. Reasonable shifts in assumptions including but not limited to increases or decreases in prices, costs and discount factors used may result in a significant increase or decrease to the fair value of biological assets recognized at any given time. Cash flows are projected based on estimated production. Estimates of production in themselves are dependent on various assumptions, in addition to those described above, including but not limited to several factors such as location, environmental conditions and other restrictions. Changes in these estimates could materially impact on estimated production, and could therefore affect estimates of future cash flows used in the assessment of fair value. (The valuation models and their assumptions are reviewed periodically, and, if necessary, adjusted).
Cresud Sociedad Anónima,
Comercial, Inmobiliaria, Financiera y Agropecuaria
Notes to Consolidated Financial Statements (Continued)
(All amounts in thousands of Argentine Pesos, except shares and per share data and as otherwise indicated)
5. | Critical accounting estimates, assumptions and judgments (Continued)
|
As of June 30 of each year, the Group’s biological assets that are subject to a valuation model include unharvested crops and sugarcane plantations. The sensitivity analysis included below is divided among countries due to the existing differences between the different markets in which it operates.
Argentina
As of June 30, 2015, 2014 and 2013, a decrease of 10% in estimated market prices, with all other variables held constant, would result in a decrease in the fair value less cost to sell of the unharvested crops of Ps. 16.6 million, Ps. 26.2 million and Ps. 7.4 million, respectively. An increase of 10% in estimated market prices, with all other variables held constant, would result in a same and opposed effect at the fair value less costs to sell of unharvested crops.
As of June 30, 2015, 2014 and 2013, an increase of 10% in estimated costs, with all other variables held constant, would result in a decrease in the fair value less cost to sell of the unharvested crops of Ps. 11.4 million, Ps. 14 million and Ps. 3.6 million, respectively. A decrease of 10% in estimated costs, with all other variables held constant, would result in a same and opposed effect at the fair value less costs to sell of unharvested crops.
As of June 30, 2015, 2014 and 2013, a decrease of 10% in estimated yield, with all other variables held constant, would result in a decrease in the fair value less cost to sell of the unharvested crops of Ps. 8.4 million, 18.5 million and Ps. 5.8 million, respectively. An increase of 10% in estimated yields, with all other variables held constant, would result in a same and opposed effect at the fair value less costs to sell of unharvested crops.
Brazil
As of June 30, 2015, 2014 and 2013, a decrease of 10% in estimated market prices, with all other variables held constant, would result in a decrease in the fair value less cost to sell of the unharvested crops and sugarcane plantations of Ps. 11.7 million, Ps. 6.7 million and Ps. 21.6 million, respectively. An increase of 1% in estimated market prices, with all other variables held constant, would result in a same and opposed effect at the fair value less costs to sell of unharvested crops and sugarcane plantations.
Cresud Sociedad Anónima,
Comercial, Inmobiliaria, Financiera y Agropecuaria
Notes to Consolidated Financial Statements (Continued)
(All amounts in thousands of Argentine Pesos, except shares and per share data and as otherwise indicated)
5. | Critical accounting estimates, assumptions and judgments (Continued)
|
As of June 30, 2015, 2014 and 2013, an increase of 10% in estimated costs, with all other variables held constant, would result in a decrease in the fair value less cost to sell of the unharvested crops of Ps. 31.0 million, Ps. 24.8 million and Ps. 15.6 million, respectively. A decrease of 1% in estimated costs, with all other variables held constant, would result in a same and opposed effect at the fair value less costs to sell of unharvested crops.
As of June 30, 2015, 2014 and 2013, a decrease of 10% in estimated yields, with all other variables held constant, would result in a decrease in the fair value less cost to sell of the unharvested crops and sugarcane plantations of Ps. 21.3 million, Ps. 23.5 million and Ps. 15.6 million, respectively. An increase of 1% in estimated yield, with all other variables held constant, would result in a same and opposed effect at the fair value less costs to sell of unharvested crops.
Bolivia
As of June 30, 2015, 2014 and 2013, a decrease of 10% in estimated market prices, with all other variables held constant, would result in a decrease in the fair value less cost to sell of the unharvested crops and sugarcane plantations of Ps. 7.8 million, Ps. 6.0 million and Ps. 5.4 million, respectively. An increase of 10% in estimated market prices, with all other variables held constant, would result in a same and opposed effect at the fair value less costs to sell of unharvested crops.
As of June 30, 2015, 2014 and 2013, an increase of 10% in estimated costs, with all other variables held constant, would result in a decrease in the fair value less cost to sell of the unharvested crops and sugarcane plantations of Ps. 5.1 million, Ps. 3.7 million and Ps. 3.0 million, respectively. A decrease of 10% in estimated market price, with all other variables held constant, would result in a same and opposed effect at the fair value less costs to sell of unharvested crops.
As of June 30, 2015, 2014 and 2013, a decrease of 10% in estimated yield, with all other variables held constant, would result in a decrease in the fair value less cost to sell of the unharvested crops and sugarcane plantations of Ps. 4.6 million, Ps. 3.7 million and Ps. 3.4 million, respectively. An increase of 10% in estimated yield, with all other variables held constant, would result in a same and opposed effect at the fair value less costs to sell of unharvested crops.
Cresud Sociedad Anónima,
Comercial, Inmobiliaria, Financiera y Agropecuaria
Notes to Consolidated Financial Statements (Continued)
(All amounts in thousands of Argentine Pesos, except shares and per share data and as otherwise indicated)
5. | Critical accounting estimates, assumptions and judgments (Continued)
|
(d) Trading properties
Trading properties include land and work in progress in respect of development sites with a view to sale. Trading properties are carried at the lower between cost and net realizable value. On each development, judgment is required to assess whether the cost of land and any associated construction work in progress is in excess of its net realizable value. Net realizable value is the estimated selling price in the ordinary course of business less estimated costs to completion and estimated selling costs.
The estimation of the net realizable value of the Group’s trading properties under development, is inherently subjective due to a number of factors, including their complexity, unusually large size, the substantial expenditure required and long timescales to completion. In addition, as a result of these timescales to completion, the plans associated with these developments could be subject to significant variation. As a result, the net realizable values of the Group’s trading properties are subject to a degree of uncertainty and are made on the basis of assumptions which may not prove to be accurate.
If actual results differ from the assumptions upon which the external valuer has based its valuation, this may have an impact on the net realizable value of the Group’s trading properties, which would in turn have an effect on the Group’s financial condition.
(e) Fair value of derivatives and other financial instruments
Fair values of derivative financial instruments are computed with reference to quoted market prices on trade exchanges, when available. The fair values of financial instruments that are not traded in an active market are determined by using valuation techniques. The Group uses its judgment to select a variety of methods and make assumptions that are mainly based on market conditions existing at statement of financial position.
(f) Allowance for doubtful accounts
As described on Note 2.18, the Group makes some estimation in order to calculate the provision for doubtful accounts. If the amount estimated differs to the present value, actual write-offs would be more/less than expected.
Cresud Sociedad Anónima,
Comercial, Inmobiliaria, Financiera y Agropecuaria
Notes to Consolidated Financial Statements (Continued)
(All amounts in thousands of Argentine Pesos, except shares and per share data and as otherwise indicated)
5. | Critical accounting estimates, assumptions and judgments (Continued)
|
(g) Income taxes
The Group is subject to income taxes in different jurisdictions. Significant judgment is required in determining the overall provision for income taxes. There are many transactions and calculations for which the ultimate tax determination is uncertain. The Group recognizes liabilities for anticipated tax audit issues based on estimates of whether additional taxes will be due. Where the final tax outcome of these matters is different from the amounts that were initially recorded, such differences will impact the current and deferred income tax assets and liabilities in the period in which such determination is made.
The Group assesses the realizability of deferred tax assets, by considering whether it is probable that some portion or all of the deferred tax assets will not be realized. In order to make this assessment, management considers the scheduled reversal of deferred tax liabilities, projected future taxable income and tax planning strategies. See Note 28 for details.
IFRS 8 requires an entity to report financial and descriptive information about its reportable segments, which are operating segments or aggregations of operating segments that meet specified criteria. Operating segments are components of an entity about which separate financial information is available that is evaluated regularly by the chief operating decision maker (“CODM”). Such function is carried out by the Group’s Executive Committee in deciding how to allocate resources and in assessing performance, without prejudice of the powers and responsibilities of the management body, that is to say, the Board of Directors. CODM evaluates the business based on the differences in the nature of its products, operations and risks. The amount reported for each segment item is the measure reported to the CODM for these purposes. In turn, the Board of Directors’ management is assessed by the Shareholders’ Meeting, which is the governance body.
Operating segments identified are disclosed as reportable segments if they meet any of the following quantitative thresholds:
· | The operating segment’s reported revenue, including both sales to external customers and inter-segment sales or transfers, is 10% or more of the combined revenue, internal and external, of all operating segments; |
Cresud Sociedad Anónima,
Comercial, Inmobiliaria, Financiera y Agropecuaria
Notes to Consolidated Financial Statements (Continued)
(All amounts in thousands of Argentine Pesos, except shares and per share data and as otherwise indicated)
6. | Segment information (Continued)
|
· | The absolute amount of its reported profit or loss is 10% or more of the greater, in absolute amount, of: |
o | the combined reported profit of all operating segments that do not report a loss; and |
o | the combined reported loss of all operating segments that report a loss. |
· | Its assets are 10% or more of the combined assets of all operating segments. |
As well as this, the operating segments that do not meet any of the quantitative thresholds can be considered as reportable segments if the management estimates that this information could be useful for the users of the financial statements.
If, after determining reportable segments in accordance with the preceding quantitative thresholds, the total external revenue attributable to those segments amounts to less than 75% of the total Group’s consolidated external revenue, additional segments are identified as reportable segments, even if they do not meet the thresholds described above, until at least 75% of the Group’s consolidated external revenue is included in reportable segments. Once the 75% of the Group’s consolidated external revenue is included in reportable segments, the remaining operating segments may be aggregated in the "All other segments" column.
Segment information has been prepared and classified according to different types of businesses in which the Group conducts its activities. The Group operates in two businesses areas, namely, Agricultural business and Investment and Development Properties business.
The Group’s Agricultural business is further comprised of eight reportable segments: (the reporting segments of crops, cattle, dairy, sugarcane, agricultural rentals and services and other segments are included within “Agriculture” activities):
· | The “Crops” Segment consists of planting, harvesting and sale of crops as wheat, corn, soybeans, cotton, and sunflowers. The Group is focused on the long-term performance of the land and seeks to maximize the use of the land through crop rotation; the use of technology and techniques. In this way, the type and quantity of harvested crops change in each agricultural campaign.
|
Cresud Sociedad Anónima,
Comercial, Inmobiliaria, Financiera y Agropecuaria
Notes to Consolidated Financial Statements (Continued)
(All amounts in thousands of Argentine Pesos, except shares and per share data and as otherwise indicated)
6. | Segment information (Continued)
|
· | The “Cattle” Segment consists of breeding, purchasing and/ or fattening of free-range beef cattle for sale to meat processors and local livestock auction markets.
|
· | The “Dairy” Segment consists of breeding and/ or purchasing dairy cows for the production of raw milk for sale to local milk and milk-related products producers.
|
· | The “Sugarcane” Segment consists of planting, harvesting and sale of sugarcane.
|
· | The “Agriculture Rentals and Services” Segment consists of services (for example: irrigation) and leasing of the Group’s farms to third parties.
|
· | The “Land transformation and sales” Segment comprises gains from the disposal and development of farmlands activities.
|
· | The “Agro-industrial” Segment consists of feedlot farming and the slaughtering and processing in the meat refrigerating plant. Feedlot farming is distinctive and requires specific care and diets which differ from those provided to free-range cattle. This activity represents a separate operating segment due to the distinctive characteristics of the cattle feedlot system and the industrialized meat processing in the packing plant.
|
· | The "Other Segments" column consists of the aggregation of the remaining operating segments, which do not meet the quantitative thresholds for disclosure includes the brokerage and sale of inputs activities.
|
The Group’s Urban Properties and Investments business is further comprised of six operative segments:
·The “Shopping centers Properties” Segment includes results from the commercial exploitation and development of shopping centers. Such results originate mainly from the lease and the delivery of services related to the lease of commercial facilities and other spaces in the Group’s shopping centers.
·The “Office” Segment includes the operating results of the Group’s lease of office space and other rental properties and service revenues related to this activity.
·The “Development and sale of properties” Segment includes the operating results of the sales of undeveloped parcels of land and/or trading properties, as the results related with its development and maintenance. Also included in this segment are the results of the sales of real property intended for rent, sales of hotels and other properties included in the International segment.
Cresud Sociedad Anónima,
Comercial, Inmobiliaria, Financiera y Agropecuaria
Notes to Consolidated Financial Statements (Continued)
(All amounts in thousands of Argentine Pesos, except shares and per share data and as otherwise indicated)
6. | Segment information (Continued)
|
·The “Hotels” Segment includes the operating results of the Group’s hotels principally comprised of room, catering and restaurant revenues.
·The “International” Segment includes the return on investments in subsidiaries and/or associates that mainly operate in the United States in relation to the lease of office buildings and hotels in that country and the return on investment in IDBD at fair value.
·The "Financial operations and others" Segment primarily includes the financial activities carried out by the Group's associates, Banco Hipotecario S.A. and Tarshop S.A. and consumer finance residual financial operations of Apsamedia S.A. (currently merged with IRSA CP). The e-commerce activities conducted through the associate Avenida Inc. are also included until the first quarter of the current fiscal year. This investment began to be considered a financial asset as from the second quarter of this fiscal year.
For ease of presentation, the following table present summarized information for the two lines of business of the Group, i.e. agriculture and Urban Properties and Investments activities. The following tables represent the reportable segments of each of the Group’s lines of business.
Cresud Sociedad Anónima,
Comercial, Inmobiliaria, Financiera y Agropecuaria
Notes to Consolidated Financial Statements (Continued)
(All amounts in thousands of Argentine Pesos, except shares and per share data and as otherwise indicated)
6. | Segment information (Continued)
|
Below is a summarized analysis of the lines of business of the Group for the years ended June 30, 2015, 2014 and 2013:
| | | Year ended June 30, 2015 | | | | | Agricultural business (I) | | | Urban properties and investments (II) | | | Total | | | Revenues | | | 2,361,010 | | | | 2,547,062 | | | | 4,908,072 | | | Costs | | | (3,385,675 | ) | | | (633,467 | ) | | | (4,019,142 | ) | | Initial recognition and changes in the fair value of biological assets and agricultural produce at the point of harvest | | | 1,347,447 | | | | - | | | | 1,347,447 | | | Changes in the net realizable value of agricultural produce after harvest | | | (34,471 | ) | | | - | | | | (34,471 | ) | | Gross Profit | | | 288,311 | | | | 1,913,595 | | | | 2,201,906 | | | Gain from disposal of investment properties | | | - | | | | 1,150,230 | | | | 1,150,230 | | | Gain from disposal of farmlands | | | 569,521 | | | | - | | | | 569,521 | | | General and administrative expenses | | | (246,470 | ) | | | (378,125 | ) | | | (624,595 | ) | | Selling expenses | | | (284,830 | ) | | | (195,866 | ) | | | (480,696 | ) | | Other operating results, net | | | (18,123 | ) | | | 28,679 | | | | 10,556 | | | Profit from operations | | | 308,409 | | | | 2,518,513 | | | | 2,826,922 | | | Share of profit / (loss) of associates and joint ventures | | | 846 | | | | (1,036,256 | ) | | | (1,035,410 | ) | | Segment Profit | | | 309,255 | | | | 1,482,257 | | | | 1,791,512 | | | Investment properties | | | 77,202 | | | | 3,493,645 | | | | 3,570,847 | | | Property, plant and equipment | | | 2,078,497 | | | | 256,891 | | | | 2,335,388 | | | Trading properties | | | - | | | | 136,084 | | | | 136,084 | | | Goodwill | | | 8,395 | | | | 24,440 | | | | 32,835 | | | Units to be received under barters | | | - | | | | 90,486 | | | | 90,486 | | | Biological assets | | | 586,847 | | | | - | | | | 586,847 | | | Inventories | | | 495,919 | | | | 23,134 | | | | 519,053 | | | Interests in associates and joint ventures | | | 33,343 | | | | 2,381,670 | | | | 2,415,013 | | | Total segment assets | | | 3,280,203 | | | | 6,406,350 | | | | 9,686,553 | |
Cresud Sociedad Anónima,
Comercial, Inmobiliaria, Financiera y Agropecuaria
Notes to Consolidated Financial Statements (Continued)
(All amounts in thousands of Argentine Pesos, except shares and per share data and as otherwise indicated)
6. | Segment information (Continued)
|
| | | Year ended June 30, 2014 | | | | | Agricultural business (I) | | | Urban properties and investments (II) | | | Total | | | Revenues | | | 1,812,108 | | | | 2,155,760 | | | | 3,967,868 | | | Costs | | | (2,617,972 | ) | | | (648,279 | ) | | | (3,266,251 | ) | | Initial recognition and changes in the fair value of biological assets and agricultural produce at the point of harvest | | | 1,172,739 | | | | - | | | | 1,172,739 | | | Changes in the net realizable value of agricultural produce after harvest | | | (17,447 | ) | | | - | | | | (17,447 | ) | | Gross Profit | | | 349,428 | | | | 1,507,481 | | | | 1,856,909 | | | Gain from disposal of investment properties | | | - | | | | 230,918 | | | | 230,918 | | | Gain from disposal of farmlands | | | 91,356 | | | | - | | | | 91,356 | | | General and administrative expenses | | | (239,630 | ) | | | (300,066 | ) | | | (539,696 | ) | | Selling expenses | | | (208,932 | ) | | | (150,109 | ) | | | (359,041 | ) | | Other operating results, net | | | (29,540 | ) | | | (47,922 | ) | | | (77,462 | ) | | (Loss) / Profit from operations | | | (37,318 | ) | | | 1,240,302 | | | | 1,202,984 | | | Share of profit / (loss) of associates and joint ventures | | | 11,479 | | | | (436,766 | ) | | | (425,287 | ) | | Segment (Loss) / Profit | | | (25,839 | ) | | | 803,536 | | | | 777,697 | | | Investment properties | | | 51,432 | | | | 3,540,437 | | | | 3,591,869 | | | Property, plant and equipment | | | 2,417,078 | | | | 237,860 | | | | 2,654,938 | | | Trading properties | | | - | | | | 143,059 | | | | 143,059 | | | Goodwill | | | 10,428 | | | | 24,784 | | | | 35,212 | | | Units to be received under barters | | | - | | | | 85,077 | | | | 85,077 | | | Assets held for sale | | | - | | | | 1,357,866 | | | | 1,357,866 | | | Biological assets | | | 651,582 | | | | - | | | | 651,582 | | | Inventories | | | 432,634 | | | | 17,220 | | | | 449,854 | | | Interests in associates and joint ventures | | | 37,226 | | | | 1,966,019 | | | | 2,003,245 | | | Total segment assets | | | 3,600,380 | | | | 7,372,322 | | | | 10,972,702 | |
Cresud Sociedad Anónima,
Comercial, Inmobiliaria, Financiera y Agropecuaria
Notes to Consolidated Financial Statements (Continued)
(All amounts in thousands of Argentine Pesos, except shares and per share data and as otherwise indicated)
6. | Segment information (Continued)
|
| | | Year ended June 30, 2013 | | | | | Agricultural business (I) | | | Urban properties and investments (II) | | | Total | | | Revenues | | | 1,355,430 | | | | 1,728,248 | | | | 3,083,678 | | | Costs | | | (2,045,779 | ) | | | (601,236 | ) | | | (2,647,015 | ) | | Initial recognition and changes in the fair value of biological assets and agricultural produce at the point of harvest | | | 888,493 | | | | - | | | | 888,493 | | | Changes in the net realizable value of agricultural produce after harvest | | | 11,756 | | | | - | | | | 11,756 | | | Gross Profit | | | 209,900 | | | | 1,127,012 | | | | 1,336,912 | | | Gain from disposal of investment properties | | | - | | | | 177,999 | | | | 177,999 | | | Gain from disposal of farmlands | | | 149,584 | | | | - | | | | 149,584 | | | General and administrative expenses | | | (153,675 | ) | | | (198,773 | ) | | | (352,448 | ) | | Selling expenses | | | (173,976 | ) | | | (117,230 | ) | | | (291,206 | ) | | Other operating results, net | | | 3,345 | | | | 92,425 | | | | 95,770 | | | Profit from operations | | | 35,178 | | | | 1,081,433 | | | | 1,116,611 | | | Share of profit / (loss) of associates and joint ventures | | | 9,191 | | | | (20,864 | ) | | | (11,673 | ) | | Segment Profit | | | 44,369 | | | | 1,060,569 | | | | 1,104,938 | | | | | | | | | | | | | | | | | Investment properties | | | 25,317 | | | | 4,306,984 | | | | 4,332,301 | | | Property, plant and equipment | | | 1,675,420 | | | | 231,734 | | | | 1,907,154 | | | Trading properties | | | - | | | | 129,677 | | | | 129,677 | | | Goodwill | | | 6,438 | | | | 75,852 | | | | 82,290 | | | Units to be received under barters | | | - | | | | 93,225 | | | | 93,225 | | | Biological assets | | | 402,594 | | | | - | | | | 402,594 | | | Inventories | | | 239,010 | | | | 16,428 | | | | 255,438 | | | Interests in associates and joint ventures | | | 31,223 | | | | 1,154,830 | | | | 1,186,053 | | | Total segment assets | | | 2,380,002 | | | | 6,008,730 | | | | 8,388,732 | |
Cresud Sociedad Anónima,
Comercial, Inmobiliaria, Financiera y Agropecuaria
Notes to Consolidated Financial Statements (Continued)
(All amounts in thousands of Argentine Pesos, except shares and per share data and as otherwise indicated)
6. | Segment information (Continued)
|
(I) | Agriculture line of business: |
The following tables present the reportable segments of the agriculture line of business of the Group for the years ended June 30, 2015, 2014 and 2013:
| | | June 30, 2015 | | | | | Agriculture | | | | | | | | | | | | | | | | | Crops | | | Cattle | | | Dairy | | | Sugarcane | | | Agricultural Rental and services | | | Agricultural Subtotal | | | Land Transformation and Sales | | | Agro-industrial | | | Other segments | | | Total Agricultural business (i) | | Revenues (i) | | | 986,717 | | | | 143,562 | | | | 71,940 | | | | 197,828 | | | | 37,175 | | | | 1,437,222 | | | | - | | | | 806,018 | | | | 117,770 | | | | 2,361,010 | | | Costs | | | (1,795,443 | ) | | | (224,556 | ) | | | (133,259 | ) | | | (368,172 | ) | | | (19,201 | ) | | | (2,540,631 | ) | | | (9,002 | ) | | | (739,201 | ) | | | (96,841 | ) | | | (3,385,675 | ) | | Initial recognition and changes in the fair value of biological assets and agricultural produce at the point of harvest | | | 918,319 | | | | 166,734 | | | | 74,919 | | | | 187,475 | | | | - | | | | 1,347,447 | | | | - | | | | - | | | | - | | | | 1,347,447 | | | Changes in the net realizable value of agricultural produce after harvest | | | (34,474 | ) | | | 3 | | | | - | | | | - | | | | - | | | | (34,471 | ) | | | - | | | | - | | | | - | | | | (34,471 | ) | | Gross Profit / (Loss) | | | 75,119 | | | | 85,743 | | | | 13,600 | | | | 17,131 | | | | 17,974 | | | | 209,567 | | | | (9,002 | ) | | | 66,817 | | | | 20,929 | | | | 288,311 | | | Gain from disposal of farmlands | | | - | | | | - | | | | - | | | | - | | | | - | | | | - | | | | 569,521 | | | | - | | | | - | | | | 569,521 | | | General and administrative expenses | | | (159,036 | ) | | | (25,753 | ) | | | (4,920 | ) | | | (19,821 | ) | | | (2,140 | ) | | | (211,670 | ) | | | (2,106 | ) | | | (25,334 | ) | | | (7,360 | ) | | | (246,470 | ) | | Selling expenses | | | (160,378 | ) | | | (20,109 | ) | | | (3,667 | ) | | | (7,770 | ) | | | (717 | ) | | | (192,641 | ) | | | (2,383 | ) | | | (77,146 | ) | | | (12,660 | ) | | | (284,830 | ) | | Other operating results, net | | | (8,636 | ) | | | (3,158 | ) | | | (773 | ) | | | (1,669 | ) | | | (336 | ) | | | (14,572 | ) | | | (4,601 | ) | | | (288 | ) | | | 1,338 | | | | (18,123 | ) | | Profit / (Loss) from Operations | | | (252,931 | ) | | | 36,723 | | | | 4,240 | | | | (12,129 | ) | | | 14,781 | | | | (209,316 | ) | | | 551,429 | | | | (35,951 | ) | | | 2,247 | | | | 308,409 | | | Share of profit of associates | | | 845 | | | | 1 | | | | - | | | | - | | | | - | | | | 846 | | | | - | | | | - | | | | - | | | | 846 | | | Segment Profit / (Loss) | | | (252,086 | ) | | | 36,724 | | | | 4,240 | | | | (12,129 | ) | | | 14,781 | | | | (208,470 | ) | | | 551,429 | | | | (35,951 | ) | | | 2,247 | | | | 309,255 | | | | | | | | | | | | | | | | | | | | | | | | | | | | | | | | | | | | | | | | | | | | | Investment properties | | | - | | | | - | | | | - | | | | - | | | | 77,202 | | | | 77,202 | | | | - | | | | - | | | | - | | | | 77,202 | | | Property, plant and equipment | | | 1,420,781 | | | | 187,100 | | | | 21,951 | | | | 293,386 | | | | 28,681 | | | | 1,951,899 | | | | 53,522 | | | | 18,102 | | | | 54,974 | | | | 2,078,497 | | | Goodwill | | | 5,352 | | | | - | | | | - | | | | 2,400 | | | | - | | | | 7,752 | | | | - | | | | - | | | | 643 | | | | 8,395 | | | Biological assets | | | 57,813 | | | | 375,357 | | | | 40,555 | | | | 113,122 | | | | - | | | | 586,847 | | | | - | | | | - | | | | - | | | | 586,847 | | | Inventories | | | 307,853 | | | | 58,529 | | | | 1,010 | | | | 2,418 | | | | - | | | | 369,810 | | | | - | | | | 23,415 | | | | 102,694 | | | | 495,919 | | | Interests in associates | | | 30,530 | | | | 20 | | | | - | | | | - | | | | - | | | | 30,550 | | | | - | | | | - | | | | 2,793 | | | | 33,343 | | | Total segment assets (ii) | | | 1,822,329 | | | | 621,006 | | | | 63,516 | | | | 411,326 | | | | 105,883 | | | | 3,024,060 | | | | 53,522 | | | | 41,517 | | | | 161,104 | | | | 3,280,203 | |
(i) | From all of the Group’s revenues corresponding to agricultural business, Ps. 1,668.86 million is originated in Argentina and Ps. 692.15 million in other countries, principally Brazil for Ps. 553.97 million. |
(ii) | From all of the Group’s assets included in the segment corresponding to agricultural business, Ps. 1,378.99 million is located in Argentina and Ps. 1,902.36 million in other countries, principally Brazil for Ps. 1,187.37 million. |
Cresud Sociedad Anónima,
Comercial, Inmobiliaria, Financiera y Agropecuaria
Notes to Consolidated Financial Statements (Continued)
(All amounts in thousands of Argentine Pesos, except shares and per share data and as otherwise indicated)
6. | Segment information (Continued)
|
| | | June 30, 2014 | | | | | Agriculture | | | | | | | | | | | | | | | | | Crops | | | Cattle | | | Dairy | | | Sugarcane | | | Agricultural Rental and services | | | Agricultural Subtotal | | | Land Transformation and Sales | | | Agro-industrial | | | Other segments | | | Total Agricultural business (i) | | Revenues (i) | | | 836,822 | | | | 90,315 | | | | 53,935 | | | | 123,851 | | | | 29,142 | | | | 1,134,065 | | | | - | | | | 554,084 | | | | 123,959 | | | | 1,812,108 | | | Costs | | | (1,540,681 | ) | | | (160,660 | ) | | | (104,334 | ) | | | (206,751 | ) | | | (17,374 | ) | | | (2,029,800 | ) | | | (8,228 | ) | | | (479,689 | ) | | | (100,255 | ) | | | (2,617,972 | ) | | Initial recognition and changes in the fair value of biological assets and agricultural produce at the point of harvest | | | 868,351 | | | | 145,321 | | | | 62,840 | | | | 96,227 | | | | - | | | | 1,172,739 | | | | - | | | | - | | | | - | | | | 1,172,739 | | | Changes in the net realizable value of agricultural produce after harvest | | | (17,624 | ) | | | 177 | | | | - | | | | - | | | | - | | | | (17,447 | ) | | | - | | | | - | | | | | | | | (17,447 | ) | | Gross Profit / (Loss) | | | 146,868 | | | | 75,153 | | | | 12,441 | | | | 13,327 | | | | 11,768 | | | | 259,557 | | | | (8,228 | ) | | | 74,395 | | | | 23,704 | | | | 349,428 | | | Gain from disposal of farmlands | | | - | | | | - | | | | - | | | | - | | | | - | | | | - | | | | 91,356 | | | | - | | | | - | | | | 91,356 | | | General and administrative expenses | | | (147,193 | ) | | | (27,183 | ) | | | (5,746 | ) | | | (28,261 | ) | | | (2,669 | ) | | | (211,052 | ) | | | (1,130 | ) | | | (16,880 | ) | | | (10,568 | ) | | | (239,630 | ) | | Selling expenses | | | (117,829 | ) | | | (13,854 | ) | | | (2,249 | ) | | | (4,871 | ) | | | (779 | ) | | | (139,582 | ) | | | (3,873 | ) | | | (54,751 | ) | | | (10,726 | ) | | | (208,932 | ) | | Other operating results, net | | | (29,355 | ) | | | (1,999 | ) | | | (417 | ) | | | 104 | | | | (222 | ) | | | (31,889 | ) | | | (82 | ) | | | (868 | ) | | | 3,299 | | | | (29,540 | ) | | Profit / (Loss) from Operations | | | (147,509 | ) | | | 32,117 | | | | 4,029 | | | | (19,701 | ) | | | 8,098 | | | | (122,966 | ) | | | 78,043 | | | | 1,896 | | | | 5,709 | | | | (37,318 | ) | | Share of profit of associates | | | 11,029 | | | | 7 | | | | - | | | | - | | | | - | | | | 11,036 | | | | - | | | | - | | | | 443 | | | | 11,479 | | | Segment Profit / (Loss) | | | (136,480 | ) | | | 32,124 | | | | 4,029 | | | | (19,701 | ) | | | 8,098 | | | | (111,930 | ) | | | 78,043 | | | | 1,896 | | | | 6,152 | | | | (25,839 | ) | | | | | | | | | | | | | | | | | | | | | | | | | | | | | | | | | | | | | | | | | | | | Investment properties | | | - | | | | - | | | | - | | | | - | | | | 51,432 | | | | 51,432 | | | | - | | | | - | | | | - | | | | 51,432 | | | Property, plant and equipment | | | 1,701,388 | | | | 158,507 | | | | 19,451 | | | | 423,902 | | | | 9,794 | | | | 2,313,042 | | | | 51,534 | | | | 18,930 | | | | 33,572 | | | | 2,417,078 | | | Goodwill | | | 6,745 | | | | - | | | | - | | | | 3,025 | | | | - | | | | 9,770 | | | | - | | | | - | | | | 658 | | | | 10,428 | | | Biological assets | | | 154,630 | | | | 312,068 | | | | 37,263 | | | | 142,873 | | | | - | | | | 646,834 | | | | - | | | | 65 | | | | 4,683 | | | | 651,582 | | | Inventories | | | 302,052 | | | | 28,881 | | | | 651 | | | | 1,702 | | | | - | | | | 333,286 | | | | - | | | | 25,878 | | | | 73,470 | | | | 432,634 | | | Interests in associates | | | 34,395 | | | | 23 | | | | - | | | | - | | | | - | | | | 34,418 | | | | - | | | | - | | | | 2,808 | | | | 37,226 | | | Total segment assets (ii) | | | 2,199,210 | | | | 499,479 | | | | 57,365 | | | | 571,502 | | | | 61,226 | | | | 3,388,782 | | | | 51,534 | | | | 44,873 | | | | 115,191 | | | | 3,600,380 | |
(i) | From all of the Group’s revenues corresponding to agricultural business, Ps. 1,277.62 million is originated in Argentina and Ps. 534.49 million in other countries, principally Brazil for Ps. 415.02 million. |
(ii) | From all of the Group’s assets included in the segment corresponding to agricultural business, Ps. 1,252.06 million is located in Argentina and Ps. 2,348.32 million in other countries, principally Brazil for Ps. 1,727.36 million. |
Cresud Sociedad Anónima,
Comercial, Inmobiliaria, Financiera y Agropecuaria
Notes to Consolidated Financial Statements (Continued)
(All amounts in thousands of Argentine Pesos, except shares and per share data and as otherwise indicated)
6. | Segment information (Continued)
|
| | | June 30, 2013 | | | | | Agriculture | | | | | | | | | | | | | | | | | Crops | | | Cattle | | | Dairy | | | Sugarcane | | | Agricultural Rental and services | | | Agricultural Subtotal | | | Land Transformation and Sales | | | Agro-industrial | | | Other segments | | | Total Agricultural business (i) | | Revenues (i) | | | 750,376 | | | | 82,939 | | | | 38,818 | | | | 160,259 | | | | 30,834 | | | | 1,063,226 | | | | - | | | | 208,921 | | | | 83,283 | | | | 1,355,430 | | | Costs | | | (1,227,832 | ) | | | (147,290 | ) | | | (74,826 | ) | | | (302,206 | ) | | | (12,052 | ) | | | (1,764,206 | ) | | | (5,675 | ) | | | (204,681 | ) | | | (71,217 | ) | | | (2,045,779 | ) | | Initial recognition and changes in the fair value of biological assets and agricultural produce at the point of harvest | | | 572,081 | | | | 79,336 | | | | 40,741 | | | | 197,317 | | | | - | | | | 889,475 | | | | - | | | | - | | | | (982 | ) | | | 888,493 | | | Changes in the net realizable value of agricultural produce after harvest | | | 11,801 | | | | (45 | ) | | | - | | | | - | | | | - | | | | 11,756 | | | | - | | | | - | | | | - | | | | 11,756 | | | Gross Profit / (Loss) | | | 106,426 | | | | 14,940 | | | | 4,733 | | | | 55,370 | | | | 18,782 | | | | 200,251 | | | | (5,675 | ) | | | 4,240 | | | | 11,084 | | | | 209,900 | | | Gain from disposal of farmlands | | | - | | | | - | | | | - | | | | - | | | | - | | | | - | | | | 149,584 | | | | - | | | | - | | | | 149,584 | | | General and administrative expenses | | | (89,585 | ) | | | (13,719 | ) | | | (3,125 | ) | | | (24,163 | ) | | | (4,416 | ) | | | (135,008 | ) | | | (572 | ) | | | (10,986 | ) | | | (7,109 | ) | | | (153,675 | ) | | Selling expenses | | | (115,923 | ) | | | (11,482 | ) | | | (1,842 | ) | | | (4,006 | ) | | | (1,711 | ) | | | (134,964 | ) | | | (10,628 | ) | | | (21,507 | ) | | | (6,877 | ) | | | (173,976 | ) | | Other operating results, net | | | (11,014 | ) | | | (3,545 | ) | | | (803 | ) | | | (27 | ) | | | (1,135 | ) | | | (16,524 | ) | | | (147 | ) | | | (1,305 | ) | | | 21,321 | | | | 3,345 | | | Profit / (Loss) from Operations | | | (110,096 | ) | | | (13,806 | ) | | | (1,037 | ) | | | 27,174 | | | | 11,520 | | | | (86,245 | ) | | | 132,562 | | | | (29,558 | ) | | | 18,419 | | | | 35,178 | | | Share of profit of associates | | | 8,117 | | | | - | | | | - | | | | - | | | | - | | | | 8,117 | | | | - | | | | 16 | | | | 1,058 | | | | 9,191 | | | Segment Profit / (Loss) | | | (101,979 | ) | | | (13,806 | ) | | | (1,037 | ) | | | 27,174 | | | | 11,520 | | | | (78,128 | ) | | | 132,562 | | | | (29,542 | ) | | | 19,477 | | | | 44,369 | | | | | | | | | | | | | | | | | | | | | | | | | | | | | | | | | | | | | | | | | | | | | Investment properties | | | - | | | | - | | | | - | | | | - | | | | 25,317 | | | | 25,317 | | | | - | | | | - | | | | - | | | | 25,317 | | | Property, plant and equipment | | | 1,115,211 | | | | 136,824 | | | | 21,440 | | | | 303,283 | | | | 456 | | | | 1,577,214 | | | | 58,026 | | | | 20,287 | | | | 19,893 | | | | 1,675,420 | | | Goodwill | | | 4,443 | | | | - | | | | - | | | | 1,995 | | | | - | | | | 6,438 | | | | - | | | | - | | | | - | | | | 6,438 | | | Biological assets | | | 56,395 | | | | 197,136 | | | | 28,134 | | | | 111,063 | | | | - | | | | 392,728 | | | | - | | | | 66 | | | | 9,800 | | | | 402,594 | | | Inventories | | | 154,730 | | | | 23,184 | | | | 433 | | | | 939 | | | | - | | | | 179,286 | | | | - | | | | 10,419 | | | | 49,305 | | | | 239,010 | | | Interests in associates | | | 28,858 | | | | - | | | | - | | | | - | | | | - | | | | 28,858 | | | | - | | | | - | | | | 2,365 | | | | 31,223 | | | Total segment assets (ii) | | | 1,359,637 | | | | 357,144 | | | | 50,007 | | | | 417,280 | | | | 25,773 | | | | 2,209,841 | | | | 58,026 | | | | 30,772 | | | | 81,363 | | | | 2,380,002 | |
(i) | From all of the Group’s revenues corresponding to agricultural business, Ps. 803.9 million is originated in Argentina and Ps. 551.6 million in other countries, principally Brazil for Ps. 453.2 million. |
(ii) | From all of the Group’s assets included in the segment corresponding to agricultural business, Ps. 883.1 million is located in Argentina and Ps. 1,496.9 million in other countries, principally Brazil for Ps. 1,190.1 million. |
Cresud Sociedad Anónima,
Comercial, Inmobiliaria, Financiera y Agropecuaria
Notes to Consolidated Financial Statements (Continued)
(All amounts in thousands of Argentine Pesos, except shares and per share data and as otherwise indicated)
6. | Segment information (Continued)
|
(ii) | Urban properties and investments |
The following tables present the reportable segments of the Urban Properties and Investments line of business of the Group for the years ended June 30, 2015, 2014 and 2013:
| | | June 30, 2015 | | | | | Shopping Center Properties | | | Offices | | | Sales and developments | | | Hotels | | | International | | | Financial operations and others | | | Total Urban Properties and Investments | | | Revenues (i) | | | 1,778,310 | | | | 332,728 | | | | 13,707 | | | | 396,297 | | | | 25,873 | | | | 147 | | | | 2,547,062 | | | Costs | | | (291,183 | ) | | | (36,368 | ) | | | (19,457 | ) | | | (278,672 | ) | | | (7,121 | ) | | | (666 | ) | | | (633,467 | ) | | Gross Profit / (Loss) | | | 1,487,127 | | | | 296,360 | | | | (5,750 | ) | | | 117,625 | | | | 18,752 | | | | (519 | ) | | | 1,913,595 | | | Gain from disposal of investment properties | | | - | | | | - | | | | 1,150,230 | | | | - | | | | - | | | | - | | | | 1,150,230 | | | General and administrative expenses | | | (136,151 | ) | | | (58,971 | ) | | | (49,690 | ) | | | (77,567 | ) | | | (55,746 | ) | | | - | | | | (378,125 | ) | | Selling expenses | | | (112,825 | ) | | | (21,130 | ) | | | (9,146 | ) | | | (52,386 | ) | | | - | | | | (379 | ) | | | (195,866 | ) | | Other operating results, net | | | (48,810 | ) | | | (117,610 | ) | | | 13,093 | | | | (461 | ) | | | 184,886 | | | | (2,419 | ) | | | 28,679 | | | Profit / (Loss) from Operations | | | 1,189,341 | | | | 98,649 | | | | 1,098,737 | | | | (12,789 | ) | | | 147,892 | | | | (3,317 | ) | | | 2,518,513 | | | Share of profit / (loss) of associates and joint ventures | | | - | | | | (2,570 | ) | | | (1,712 | ) | | | 1,254 | | | | (1,191,116 | ) | | | 157,888 | | | | (1,036,256 | ) | | Segment Profit / (Loss) | | | 1,189,341 | | | | 96,079 | | | | 1,097,025 | | | | (11,535 | ) | | | (1,043,224 | ) | | | 154,571 | | | | 1,482,257 | | | | | | | | | | | | | | | | | | | | | | | | | | | | | | | | | Investment properties | | | 2,320,845 | | | | 978,125 | | | | 187,824 | | | | - | | | | - | | | | 6,851 | | | | 3,493,645 | | | Property, plant and equipment | | | 48,345 | | | | 30,599 | | | | 1,242 | | | | 175,386 | | | | 1,319 | | | | - | | | | 256,891 | | | Trading properties | | | 1,484 | | | | - | | | | 134,600 | | | | - | | | | - | | | | - | | | | 136,084 | | | Goodwill | | | 13,719 | | | | 6,180 | | | | 4,541 | | | | - | | | | - | | | | - | | | | 24,440 | | | Units to be received under barters | | | - | | | | - | | | | 90,486 | | | | - | | | | - | | | | - | | | | 90,486 | | | Inventories | | | 15,711 | | | | - | | | | 497 | | | | 6,926 | | | | - | | | | - | | | | 23,134 | | | Investments in associates and joint ventures | | | - | | | | 20,746 | | | | 46,555 | | | | - | | | | 909,911 | | | | 1,404,458 | | | | 2,381,670 | | | Total segment assets (ii) | | | 2,400,104 | | | | 1,035,650 | | | | 465,745 | | | | 182,312 | | | | 911,230 | | | | 1,411,309 | | | | 6,406,350 | |
(i) | From all of the Group’s revenues corresponding to urban properties and investment business, Ps. 2,522 million is originated in Argentina and Ps. 26 million in United States. |
(ii) | From all of the Group’s assets included in urban properties and investment business, Ps. 5,389 million is located in Argentina and Ps. 1,639 million in other countries, principally in Israel for Ps. 907 and Uruguay for Ps. 106 million, respectively. |
Cresud Sociedad Anónima,
Comercial, Inmobiliaria, Financiera y Agropecuaria
Notes to Consolidated Financial Statements (Continued)
(All amounts in thousands of Argentine Pesos, except shares and per share data and as otherwise indicated)
6. | Segment information (Continued)
|
| | | June 30, 2014 | | | | | Shopping Center Properties | | | Offices | | | Sales and developments | | | Hotels | | | International | | | Financial operations and others | | | Total Urban Properties and Investments | | | Revenues (i) | | | 1,383,008 | | | | 271,159 | | | | 85,531 | | | | 331,562 | | | | 83,926 | | | | 574 | | | | 2,155,760 | | | Costs | | | (296,688 | ) | | | (45,367 | ) | | | (34,963 | ) | | | (216,768 | ) | | | (53,510 | ) | | | (983 | ) | | | (648,279 | ) | | Gross Profit / (Loss) | | | 1,086,320 | | | | 225,792 | | | | 50,568 | | | | 114,794 | | | | 30,416 | | | | (409 | ) | | | 1,507,481 | | | Gain from disposal of investment properties | | | (82 | ) | | | - | | | | 231,000 | | | | - | | | | - | | | | - | | | | 230,918 | | | General and administrative expenses | | | (101,538 | ) | | | (41,945 | ) | | | (37,466 | ) | | | (59,585 | ) | | | (59,476 | ) | | | (56 | ) | | | (300,066 | ) | | Selling expenses | | | (73,427 | ) | | | (20,751 | ) | | | (13,706 | ) | | | (42,335 | ) | | | - | | | | 110 | | | | (150,109 | ) | | Other operating results, net | | | (46,568 | ) | | | (3,060 | ) | | | 8,137 | | | | (2,680 | ) | | | (895 | ) | | | (2,856 | ) | | | (47,922 | ) | | Profit / (Loss) from Operations | | | 864,705 | | | | 160,036 | | | | 238,533 | | | | 10,194 | | | | (29,955 | ) | | | (3,211 | ) | | | 1,240,302 | | | Share of profit / (loss) of associates and joint ventures | | | - | | | | (895 | ) | | | 6,368 | | | | 789 | | | | (616,313 | ) | | | 173,285 | | | | (436,766 | ) | | Segment Profit / (Loss) | | | 864,705 | | | | 159,141 | | | | 244,901 | | | | 10,983 | | | | (646,268 | ) | | | 170,074 | | | | 803,536 | | | | | | | | | | | | | | | | | | | | | | | | | | | | | | | | | Investment properties | | | 2,275,053 | | | | 834,480 | | | | 423,442 | | | | - | | | | - | | | | 7,462 | | | | 3,540,437 | | | Property, plant and equipment | | | 20,455 | | | | 36,415 | | | | 3,744 | | | | 175,745 | | | | 1,501 | | | | - | | | | 237,860 | | | Trading properties | | | 1,484 | | | | - | | | | 141,575 | | | | - | | | | - | | | | - | | | | 143,059 | | | Goodwill | | | 8,582 | | | | 11,661 | | | | 4,541 | | | | - | | | | - | | | | - | | | | 24,784 | | | Units to be received under barters | | | - | | | | - | | | | 85,077 | | | | - | | | | - | | | | - | | | | 85,077 | | | Assets held for sale (iii) | | | - | | | | - | | | | - | | | | - | | | | 1,357,866 | | | | - | | | | 1,357,866 | | | Inventories | | | 10,625 | | | | - | | | | 584 | | | | 6,011 | | | | - | | | | - | | | | 17,220 | | | Investments in associates and joint ventures | | | - | | | | 23,208 | | | | 38,289 | | | | 22,129 | | | | 628,658 | | | | 1,253,735 | | | | 1,966,019 | | | Total segment assets (ii) | | | 2,316,199 | | | | 905,764 | | | | 697,252 | | | | 203,885 | | | | 1,988,025 | | | | 1,261,197 | | | | 7,372,322 | |
(i) | From all of the Group’s revenues corresponding to urban properties and investment business, Ps. 2,072 million is originated in Argentina and Ps. 84 million in United States. |
(ii) | From all of the Group’s assets included in urban properties and investment business, Ps. 5,273 million is located in Argentina and Ps. 2,099 million in other countries, principally in United States for Ps. 1,988 million. |
(iii) | See Note 44 for details. |
Cresud Sociedad Anónima,
Comercial, Inmobiliaria, Financiera y Agropecuaria
Notes to Consolidated Financial Statements (Continued)
(All amounts in thousands of Argentine Pesos, except shares and per share data and as otherwise indicated)
6. | Segment information (Continued)
|
| | | June 30, 2013 | | | | | Shopping Center Properties | | | Offices | | | Sales and developments | | | Hotels | | | International | | | Financial operation and others | | | Total Urban Properties and Investments | | | Revenues (i) | | | 1,103,044 | | | | 217,171 | | | | 141,996 | | | | 225,836 | | | | 38,998 | | | | 1,203 | | | | 1,728,248 | | | Costs | | | (245,528 | ) | | | (46,975 | ) | | | (106,558 | ) | | | (169,071 | ) | | | (31,587 | ) | | | (1,517 | ) | | | (601,236 | ) | | Gross Profit / (Loss) | | | 857,516 | | | | 170,196 | | | | 35,438 | | | | 56,765 | | | | 7,411 | | | | (314 | ) | | | 1,127,012 | | | Gain from disposal of investment properties | | | - | | | | - | | | | 177,999 | | | | - | | | | - | | | | - | | | | 177,999 | | | General and administrative expenses | | | (67,597 | ) | | | (34,984 | ) | | | (32,901 | ) | | | (49,883 | ) | | | (13,158 | ) | | | (250 | ) | | | (198,773 | ) | | Selling expenses | | | (58,907 | ) | | | (11,360 | ) | | | (16,456 | ) | | | (28,919 | ) | | | - | | | | (1,588 | ) | | | (117,230 | ) | | Other operating results, net | | | (45,020 | ) | | | (247 | ) | | | 6,342 | | | | (369 | ) | | | 135,082 | | | | (3,363 | ) | | | 92,425 | | | Profit / (Loss) from Operations | | | 685,992 | | | | 123,605 | | | | 170,422 | | | | (22,406 | ) | | | 129,335 | | | | (5,515 | ) | | | 1,081,433 | | | Share of profit / (loss) of associates and joint ventures | | | - | | | | (2,514 | ) | | | 1,569 | | | | 83 | | | | (82,552 | ) | | | 62,550 | | | | (20,864 | ) | | Segment Profit / (Loss) | | | 685,992 | | | | 121,091 | | | | 171,991 | | | | (22,323 | ) | | | 46,783 | | | | 57,035 | | | | 1,060,569 | | | | | | | | | | | | | | | | | | | | | | | | | | | | | | | | | Investment properties | | | 2,249,180 | | | | 857,782 | | | | 447,363 | | | | - | | | | 744,587 | | | | 8,072 | | | | 4,306,984 | | | Property, plant and equipment | | | 17,385 | | | | 29,830 | | | | 3,972 | | | | 180,348 | | | | 199 | | | | - | | | | 231,734 | | | Trading properties | | | 1,484 | | | | 106 | | | | 128,087 | | | | - | | | | - | | | | - | | | | 129,677 | | | Goodwill | | | 8,582 | | | | 11,661 | | | | 4,540 | | | | - | | | | 51,069 | | | | - | | | | 75,852 | | | Units to be received under barters | | | - | | | | - | | | | 93,225 | | | | - | | | | - | | | | - | | | | 93,225 | | | Inventories | | | 10,003 | | | | - | | | | 463 | | | | 5,962 | | | | - | | | | - | | | | 16,428 | | | Investments in associates and joint ventures | | | - | | | | 23,385 | | | | 32,759 | | | | 21,339 | | | | 802 | | | | 1,076,545 | | | | 1,154,830 | | | Total segment assets (ii) | | | 2,286,634 | | | | 922,764 | | | | 710,409 | | | | 207,649 | | | | 796,657 | | | | 1,084,617 | | | | 6,008,730 | |
(i) | From all of the Group’s revenues corresponding to urban properties and investment business, Ps. 1,689 million is originated in Argentina and Ps. 39 million in United States, respectively. |
(ii) | From all of the Group’s assets included in the urban properties and investment business, Ps. 5,131 million is located in Argentina and Ps. 877 million in other countries, principally in United States for Ps. 797 million. |
Cresud Sociedad Anónima,
Comercial, Inmobiliaria, Financiera y Agropecuaria
Notes to Consolidated Financial Statements (Continued)
(All amounts in thousands of Argentine Pesos, except shares and per share data and as otherwise indicated)
6. | Segment information (Continued)
|
Concerning agricultural business, cattle, dairy cattle and agroindustrial activities are mainly concentrated in Argentina. The crop activities of the Group are primarily concentrated in Argentina, Brazil, Bolivia and Paraguay, while sugar cane production is developed in Brazil and Bolivia.
The shopping center properties of the Group are all located in Argentina, the country of domicile of the Group. Substantially, offices and other rental properties of the Group are located in Argentina. Properties of the Group located in the United States, are disclosed in column "International". Hotels of the Group are located in Argentina and the United States. The trading properties of the Group are also located in Argentina and Uruguay.
During the fiscal years ended as of June 30, 2015, 2014 and 2013, the “Office and other rental properties” segment revenues include Ps. 52,693, Ps. 44,067 and Ps. 34,229, which represent 16% of the segment total revenues in the three fiscal years and correspond to a particular tenant.
In the last quarter of the fiscal year, the Group has changed the presentation of the income statement which is reviewed by the CODM for purposes of assigning resources and assessing performance for the fiscal year for a better alignment with the current business vision and the metrics used to such end. These amendments affected the shopping centers and office segments. The information examined by the CODM does not include the amounts pertaining to income from building administration expenses and collective promotion funds (“FPC”, as per its Spanish acronym) from the income statement, and so does it exclude total recovered costs, as they are not analyzed to assess the operating performance of the segment. The CODM examines the net amount from these items (total surplus or deficit between building administration expenses and collective promotion funds and recoverable expenses). These costs and income are presented now for reconciliation of all segments and their respective consolidating operating income. The amounts corresponding to prior fiscal years have been retroactively adjusted to reflect these changes in segment information.
In addition, in the last quarter of the fiscal year, the Group has modified how it presents the gain/loss on the sale of investment property in segment information, which is revised by CODM. The information revised by CODM includes the gain/loss on the sale of investment properties within sales and development segment, regardless of the segment where the property would have been originally located. These modifications affected the segments of sales and development and international. Considering that in the comparative periods presented there were not sales of investment properties in the international segment, it was not necessary to retroactively adjust the amounts pertaining to prior fiscal years.
Cresud Sociedad Anónima,
Comercial, Inmobiliaria, Financiera y Agropecuaria
Notes to Consolidated Financial Statements (Continued)
(All amounts in thousands of Argentine Pesos, except shares and per share data and as otherwise indicated)
6. | Segment information (Continued)
|
The CODM regularly reviews the following categories of assets: investment properties; property, plant and equipment; trading properties; goodwill; rights to receive future units under barter agreements; inventories; biological assets; investments in associates; and the investment in the Entertainment Holding S.A. joint venture. The aggregate of these assets are disclosed in these financial statements as “operating segment assets”. The measurement principles for the operating segment assets are based on the IFRS principles adopted in the preparation of the consolidated financial statements, except for the Group’s share of assets of the joint ventures Cresca S.A., CYRSA S.A., Nuevo Puerto Santa Fe S.A., Puerto Retiro S.A., Baicom Networks S.A., and Quality Invest S.A., which are all reported to the CODM under the proportionate consolidation method. Under this method, each of the operating segment assets reported to the CODM includes the proportionate share of the Group in the same operating assets of these joint ventures. As an example, the investment properties amount reported to the CODM includes (i) the investment property balance as per the statement of financial position plus (ii) the Group’s share of the investment properties of these joint ventures. Under IFRS 11, the investment properties of these joint ventures are included together with all other of the joint ventures’ net assets in the single line item titled “Investments in associates and joint ventures” in the statement of financial position.
The CODM evaluates performance of business segments based on segment profit, defined as profit or loss from operations before financing and taxes. The measurement principles for the Group’s segment reporting structure are based on the IFRS principles adopted in the Consolidated Financial Statements, except for the Group’s share of profit or loss of joint ventures.
At the time of assessing the performance of business segments and deciding upon the allocation of resources, the Executive Committee uses information on operating income assets and liabilities of each such segment In the Consolidated Financial Statements, the transactions and balances between related parties which may affect more than one segment are eliminated.
Goods and services exchanged between segments are calculated on the basis of market prices. Intercompany transactions between segments, if any, are eliminated.
Cresud Sociedad Anónima,
Comercial, Inmobiliaria, Financiera y Agropecuaria
Notes to Consolidated Financial Statements (Continued)
(All amounts in thousands of Argentine Pesos, except shares and per share data and as otherwise indicated)
6. | Segment information (Continued)
|
The following tables present a reconciliation between the total results of segment operations and the results of operations as per the income statements. The adjustments relate to the presentation of the results of operations of joint ventures accounted for under the equity method under IFRS.
| | | June 30, 2015 | | | | | Total segment information | | | Adjustment for share of profit / (loss) of joint ventures | | | Adjustment to income for elimination of inter-segment transactions | | | Expenses and collective promotion fund | | | Total Income Statements | | | Revenues | | | 4,908,072 | | | | (53,473 | ) | | | (90,002 | ) | | | 887,208 | | | | 5,651,805 | | | Costs | | | (4,019,142 | ) | | | 62,335 | | | | 88,375 | | | | (901,283 | ) | | | (4,769,715 | ) | | Initial recognition and changes in the fair value of biological assets and agricultural produce at the point of harvest | | | 1,347,447 | | | | (23,295 | ) | | | - | | | | - | | | | 1,324,152 | | | Changes in the net realizable value of agricultural produce after harvest | | | (34,471 | ) | | | - | | | | - | | | | - | | | | (34,471 | ) | | Gross Profit / (Loss) | | | 2,201,906 | | | | (14,433 | ) | | | (1,627 | ) | | | (14,075 | ) | | | 2,171,771 | | | Gain from disposal of investment properties | | | 1,150,230 | | | | - | | | | - | | | | - | | | | 1,150,230 | | | Gain from disposal of farmlands | | | 569,521 | | | | (19,059 | ) | | | - | | | | - | | | | 550,462 | | | General and administrative expenses | | | (624,595 | ) | | | 4,173 | | | | 2,602 | | | | - | | | | (617,820 | ) | | Selling expenses | | | (480,696 | ) | | | 6,217 | | | | 321 | | | | - | | | | (474,158 | ) | | Other operating results, net | | | 10,556 | | | | 2,949 | | | | (1,296 | ) | | | - | | | | 12,209 | | | Profit from Operations before share of Profit / (Loss) of Associates and Joint Ventures | | | 2,826,922 | | | | (20,153 | ) | | | - | | | | (14,075 | ) | | | 2,792,694 | | | Share of profit / (loss) of associates and joint ventures | | | (1,035,410 | ) | | | 10,438 | | | | - | | | | - | | | | (1,024,972 | ) | | Profit from operations before Financing and Taxes | | | 1,791,512 | | | | (9,715 | ) | | | - | | | | (14,075 | ) | | | 1,767,722 | |
Cresud Sociedad Anónima,
Comercial, Inmobiliaria, Financiera y Agropecuaria
Notes to Consolidated Financial Statements (Continued)
(All amounts in thousands of Argentine Pesos, except shares and per share data and as otherwise indicated)
6. | Segment information (Continued)
|
| | | June 30, 2014 | | | | | Total segment information | | | Adjustment for share of profit / (loss) of joint ventures | | | Adjustment to income for elimination of inter-segment transactions | | | Expenses and collective promotion fund | | | Total Income Statements | | | Revenues | | | 3,967,868 | | | | (62,085 | ) | | | (38,074 | ) | | | 736,302 | | | | 4,604,011 | | | Costs | | | (3,266,251 | ) | | | 58,857 | | | | 36,505 | | | | (743,703 | ) | | | (3,914,592 | ) | | Initial recognition and changes in the fair value of biological assets and agricultural produce at the point of harvest | | | 1,172,739 | | | | (20,086 | ) | | | - | | | | - | | | | 1,152,653 | | | Changes in the net realizable value of agricultural produce after harvest | | | (17,447 | ) | | | - | | | | - | | | | - | | | | (17,447 | ) | | Gross Profit / (Loss) | | | 1,856,909 | | | | (23,314 | ) | | | (1,569 | ) | | | (7,401 | ) | | | 1,824,625 | | | Gain from disposal of investment properties | | | 230,918 | | | | - | | | | - | | | | - | | | | 230,918 | | | Gain from disposal of farmlands | | | 91,356 | | | | - | | | | - | | | | - | | | | 91,356 | | | General and administrative expenses | | | (539,696 | ) | | | 3,423 | | | | 2,334 | | | | - | | | | (533,939 | ) | | Selling expenses | | | (359,041 | ) | | | 5,949 | | | | 366 | | | | - | | | | (352,726 | ) | | Other operating results, net | | | (77,462 | ) | | | 3,585 | | | | (1,131 | ) | | | - | | | | (75,008 | ) | | Profit / (Loss) from Operations before share of Profit / (Loss) of Associates and Joint Ventures | | | 1,202,984 | | | | (10,357 | ) | | | - | | | | (7,401 | ) | | | 1,185,226 | | | Share of (loss) / profit of associates and joint ventures | | | (425,287 | ) | | | 16,636 | | | | - | | | | - | | | | (408,651 | ) | | Profit / (Loss) from operations before Financing and Taxes | | | 777,697 | | | | 6,279 | | | | - | | | | (7,401 | ) | | | 776,575 | |
| | | June 30, 2013 | | | | | Total segment information | | | Adjustment for share of profit / (loss) of joint ventures | | | Adjustment to income for elimination of inter-segment transactions | | | Expenses and collective promotion fund | | | Total Income Statements | | | Revenues | | | 3,083,678 | | | | (137,889 | ) | | | (11,528 | ) | | | 594,290 | | | | 3,528,551 | | | Costs | | | (2,647,015 | ) | | | 116,004 | | | | 10,296 | | | | (599,780 | ) | | | (3,120,495 | ) | | Initial recognition and changes in the fair value of biological assets and agricultural produce at the point of harvest | | | 888,493 | | | | (1,749 | ) | | | - | | | | - | | | | 886,744 | | | Changes in the net realizable value of agricultural produce after harvest | | | 11,756 | | | | - | | | | - | | | | - | | | | 11,756 | | | Gross Profit / (Loss) | | | 1,336,912 | | | | (23,634 | ) | | | (1,232 | ) | | | (5,490 | ) | | | 1,306,556 | | | Gain from disposal of investment properties | | | 177,999 | | | | - | | | | - | | | | - | | | | 177,999 | | | Gain from disposal of farmlands | | | 149,584 | | | | - | | | | - | | | | - | | | | 149,584 | | | General and administrative expenses | | | (352,448 | ) | | | 4,291 | | | | 1,774 | | | | - | | | | (346,383 | ) | | Selling expenses | | | (291,206 | ) | | | 11,631 | | | | 112 | | | | - | | | | (279,463 | ) | | Other operating results, net | | | 95,770 | | | | 2,952 | | | | (654 | ) | | | - | | | | 98,068 | | | Profit / (Loss) from Operations before share of Profit / (Loss) of Associates and Joint Ventures | | | 1,116,611 | | | | (4,760 | ) | | | - | | | | (5,490 | ) | | | 1,106,361 | | | Share of (loss) / profit of associates and joint ventures | | | (11,673 | ) | | | 1,855 | | | | - | | | | - | | | | (9,818 | ) | | Profit / (Loss) from operations before Financing and Taxes | | | 1,104,938 | | | | (2,905 | ) | | | - | | | | (5,490 | ) | | | 1,096,543 | |
Cresud Sociedad Anónima,
Comercial, Inmobiliaria, Financiera y Agropecuaria
Notes to Consolidated Financial Statements (Continued)
(All amounts in thousands of Argentine Pesos, except shares and per share data and as otherwise indicated)
6. | Segment information (Continued)
|
Total segment assets are allocated based on the operations of the segment and the physical location of the asset. According to the analysis above, segment assets include the proportionate share of the assets of joint ventures. The statement of financial position under IFRS shows the net investment in these joint ventures as a single item.
The following tables present a reconciliation between total segment assets as per segment information and total assets as per the statement of financial position. Adjustments are mainly related to the filing of certain classes of assets in segment information and to the proportional consolidation of joint ventures mentioned previously.
| | | June 30, 2015 | | | June 30, 2014 | | | June 30, 2013 | | | Total Operating Assets as per Segment Information | | | 9,686,553 | | | | 10,972,702 | | | | 8,388,732 | | | Less: | | | | | | | | | | | | | | Proportionate share in reportable assets per segment of certain joint ventures (*) | | | (478,107 | ) | | | (442,360 | ) | | | (256,962 | ) | | Plus: | | | | | | | | | | | | | | Investments in joint ventures (**) | | | 357,673 | | | | 372,034 | | | | 300,809 | | | Other non-reportable assets | | | 5,709,324 | | | | 4,881,312 | | | | 3,978,146 | | | Total Consolidated Assets as per Statement of financial position | | | 15,275,443 | | | | 15,783,688 | | | | 12,410,725 | |
| (*) The following amounts related to the proportionate share of operating segment assets of certain of The Group´s joint ventures are reported as part of the total operating segment assets by segment: |
| | | June 30, 2015 | | | June 30, 2014 | | | June 30, 2013 | | | Investment properties | | | 95,888 | | | | 137,253 | | | | 160,900 | | | Property, plant and equipment | | | 358,193 | | | | 272,982 | | | | 65,700 | | | Trading properties | | | 3,130 | | | | 5,908 | | | | 20,160 | | | Goodwill | | | 5,223 | | | | 5,235 | | | | 5,238 | | | Biological assets | | | 7,970 | | | | 10,899 | | | | 1,902 | | | Inventories | | | 7,703 | | | | 10,083 | | | | 3,062 | | | Total proportionate share in assets per segment of joint ventures | | | 478,107 | | | | 442,360 | | | | 256,962 | |
(**) | Represents the equity-accounted amount of those joint ventures, which were proportionate-consolidated for segment information purposes |
Cresud Sociedad Anónima,
Comercial, Inmobiliaria, Financiera y Agropecuaria
Notes to Consolidated Financial Statements (Continued)
(All amounts in thousands of Argentine Pesos, except shares and per share data and as otherwise indicated)
7. | Information about subsidiaries |
The Group conducts its business through several operating and holding subsidiaries. See breakdown of Group, their percentage of ownership interest, materiality criteria and other relevant information on the Group’s subsidiaries in Note 2.3.a).
Restrictions, commitments and other matters in respect of subsidiaries
According to the laws of certain of the countries in which the Group operates, 5% of the profit of the year is separated to constitute legal reserves until they reach legal capped amounts (20% of total capital). These legal reserves are not available for dividend distribution and can only be released to absorb losses. The Group’s subsidiaries under this law have not reached the legal limits of these reserves. Dividends distribution of Group’s subsidiaries is on the basis of their separate financial statement.
IRSA
IRSA’s dividends are paid when and if declared by its board of directors and approved by its shareholders’ meeting. In accordance with IRSA’s dividend policy, the amount of dividends that could be declared in each fiscal year shall not exceed the higher of (i) 20% of the aggregate gross revenue from leases and services of its Office and other Rental Properties segment for its most recent fiscal year; and (ii) 20% of the net income as per IRSA’s consolidated income statements for its most recent fiscal year.
However, the amount of dividends payable is subject to the payment restrictions imposed by IRSA’s borrowing agreements (i.e. IRSA NCN due 2017 and IRSA NCN due 2020).
IRSA CP
Distrito Arcos
Injunction order:
In December 2013, the Judicial Branch confirmed an injunction order that suspended the opening of the shopping center on the grounds that it did not have certain governmental permits in the context of two legal proceedings, where a final decision has been rendered for the company.
The plaintiff filed a petition for the continuation of the preliminary injunction by means of an extraordinary appeal of unconstitutionality which was by the lower and appellate courts; consequently, it filed an appeal with the Supreme Court of Justice of the Autonomous City of Buenos Aires, which so far has not rendered a decision.
Cresud Sociedad Anónima,
Comercial, Inmobiliaria, Financiera y Agropecuaria
Notes to Consolidated Financial Statements (Continued)
(All amounts in thousands of Argentine Pesos, except shares and per share data and as otherwise indicated)
7. | Information about subsidiaries (Continued)
|
Nowadays, the Shopping Center Distrito Arcos is open to the public and operating normally.
Concession Status:
The National State issued Executive Order 1723/2012 whereby several plots of land located in prior rail yards of Palermo, Liniers and Caballito rail stations ceased to be used for rail purposes, in order to be used for development of integral urbanization projects.
In this respect and as part of several measures related to other licensed persons and/or concessionaires, we have notified in the file of proceedings of the corresponding Resolution 170/2014 revoking the Contract for Reformulation of the Concession of Rights of use and Development N° AF000261 issued by the Agencia de Administración de Bienes del Estado (State Assets Administration Office, or AABE as per its Spanish acronym).
It should further be pointed out that such measure:
(i) has not been adopted due to non-compliance of our controlled company;
(ii) to date has not involved the interruption of the commercial development or operation of the shopping center, which continues to operate under normal conditions;
Notwithstanding the foregoing, Arcos del Gourmet S.A. has filed the relevant administrative remedies (appeal) and has also filed a judicial action requesting that the revocation of such concession be overruled.
Furthermore, it has started a so-called “juicio de consignación”, that is an action where the plaintiff deposits with the court sums of money that the defendant refuses to accept. Under this legal action, the company has deposited in due time and form all rental payments under the Contract for Reformulation of the Concession of Rights of Use and Development, which the Company considers to have been unduly revoked.
Cresud Sociedad Anónima,
Comercial, Inmobiliaria, Financiera y Agropecuaria
Notes to Consolidated Financial Statements (Continued)
(All amounts in thousands of Argentine Pesos, except shares and per share data and as otherwise indicated)
7. | Information about subsidiaries (Continued)
|
Rigby
Rigby has received a statement of proposed audit changes from New York State relating to New York State Real Property Transfer Tax concerning a transfer of shareholdings between shareholders in November 2012 in the amount of US$ 0.4 million including penalties and interes of US$ 0.1 millon. In addition, Rigby has been contacted by New York City regarding a potential adjustment for New York City Real Property Transfer Tax. However, Rigby has not received an assessment from the New York City Deparment of Finance, so it is not clear the nature of the New York City inquiry. IRSA International and Cam Communications II LP (members of Rigby) would be jointly liable under law. Under the agreements in place, however, Rigby might also be liable due to the indemnity granted to Rigby Madison. Rigby had sufficient grounds to believe that it would be resolved in its favor, therefore, no provision had been made in the financial statement for any liabilities that could have aroused. On September 8th, 2015 Rigby has been notified of a favorable resolution by New York State.
Sociedad Anónima Carnes Pampeanas S.A.
As of June 30, 2015, the working capital and shareholders’ equity of Carnes Pampeanas were negative, and they were included in the presumption established in section N° 94 (subsection 5) and section N° 206 of Act N° 19,550. Shareholders agreed to make the capital contributions necessary to meet the Company’s liabilities, clean up the balance sheet and absorb accumulated losses, as described in Note 45.
Information on subsidiaries with material non-controlling interests
As mentioned in Note 2.3.a), the following non-controlling interest are considered significant to the Group:
| | | Equity attributable to non-controlling interest (in millions) | | | Subsidiary | | June 30, 2015 | | | June 30, 2014 | | | IRSA | | | 1,061.5 | | | | 1,254.3 | | | Brasilagro | | | 1,256.8 | | | | 1,225.0 | |
The non-controlling interest for the remaining subsidiaries aggregate Ps. 11.7 million and Ps. 9.6 million as of June 30, 2015 and 2014, respectively. None of these subsidiaries have non-controlling interests which are individually considered material to the Group.
Cresud Sociedad Anónima,
Comercial, Inmobiliaria, Financiera y Agropecuaria
Notes to Consolidated Financial Statements (Continued)
(All amounts in thousands of Argentine Pesos, except shares and per share data and as otherwise indicated)
7. | Information about subsidiaries (Continued)
|
Set out below is the summarized financial information for the subsidiaries that have non-controlling interests that are considered material to the Group:
Summarized statements of financial position
| | | IRSA | | | Brasilagro | | | | | | 06.30.15 | | | | 06.30.14 | | | | 06.30.15 | | | | 06.30.14 | | | Assets | | | | | | | | | | | | | | | | | | Non-current assets | | | 7,725,053 | | | | 6,851,085 | | | | 1,545,596 | | | | 2,049,257 | | | Current assets | | | 1,904,320 | | | | 2,959,021 | | | | 1,319,751 | | | | 879,255 | | | Total assets | | | 9,629,373 | | | | 9,810,106 | | | | 2,865,347 | | | | 2,928,512 | | | Liabilities | | | | | | | | | | | | | | | | | | Non-current liabilities | | | 4,683,493 | | | | 4,834,086 | | | | 183,160 | | | | 239,790 | | | Current liabilities | | | 2,687,522 | | | | 2,419,424 | | | | 595,441 | | | | 655,174 | | | Total liabilities | | | 7,371,015 | | | | 7,253,510 | | | | 778,601 | | | | 894,964 | | | Net assets | | | 2,258,358 | | | | 2,556,596 | | | | 2,086,746 | | | | 2,033,548 | |
Summarized income statements and statements of comprehensive income
| | | IRSA | | | Brasilagro | | | | | June 30, 2015 | | | June 30, 2014 | | | June 30, 2013 | | | June 30, 2015 | | | June 30, 2014 | | | June 30, 2013 | | | | | hjyyRevenues | | | 3,402,629 | | | | 2,845,176 | | | | 2,187,180 | | | | 553,966 | | | | 415,022 | | | | 453,191 | | | Profit / (loss) before income tax | | | 558,335 | | | | (895,884 | ) | | | 430,055 | | | | 573,834 | | | | (103,791 | ) | | | 56,506 | | | Income tax | | | (488,266 | ) | | | 64,267 | | | | (132,847 | ) | | | (31,737 | ) | | | 54,518 | | | | 9,044 | | | Profit / (loss) for the year | | | 70,069 | | | | (831,617 | ) | | | 297,208 | | | | 542,097 | | | | (49,273 | ) | | | 65,550 | | | Other comprehensive (loss) / income | | | (108,097 | ) | | | 442,844 | | | | 56,799 | | | | - | | | | - | | | | 335,625 | | | Total comprehensive income | | | (38,028) | | | | (388,773 | ) | | | 354,007 | | | | 542,097 | | | | (49,273 | ) | | | 401,175 | | | Profit / (loss) attributable to non-controlling interest | | | 127,429 | | | | 49,559 | | | | 66,081 | | | | - | | | | - | | | | - | | | Dividends paid to non-controlling interest | | | - | | | | 88,110 | | | | 62,190 | | | | - | | | | - | | | | - | |
Cresud Sociedad Anónima,
Comercial, Inmobiliaria, Financiera y Agropecuaria
Notes to Consolidated Financial Statements (Continued)
(All amounts in thousands of Argentine Pesos, except shares and per share data and as otherwise indicated)
7. | Information about subsidiaries (Continued)
|
Summarized cash flows
| | | IRSA | | | Brasilagro | | | | | June 30, 2015 | | | June 30, 2014 | | | June 30, 2013 | | | June 30, 2015 | | | June 30, 2014 | | | June 30, 2013 | | | Cash flow from operating activities | | | | | | | | | | | | | | | | | | | | Net cash generated from (used in) operating activities | | | 833,888 | | | | 1,021,979 | | | | 863,373 | | | | (48,890 | ) | | | 67,243 | | | | (209,447 | ) | | Cash flow from investing activities | | | | | | | | | | | | | | | | | | | | | | | | | | Net cash used in (generated from) investing activities | | | 261,333 | | | | (917,120 | ) | | | (45,892 | ) | | | 39,134 | | | | (34,078 | ) | | | 243,280 | | | Cash flow from financing activities | | | | | | | | | | | | | | | | | | | | | | | | | | Net cash (generated from) used in financing activities | | | (1,389,685 | ) | | | (596,767 | ) | | | (306,268 | ) | | | (66,513 | ) | | | 4,947 | | | | 5,225 | | | Net (Decrease) Increase in cash and cash equivalents | | | (294,464 | ) | | | (491,908 | ) | | | 511,213 | | | | (76,269 | ) | | | 38,112 | | | | 39,058 | | | Cash and cash equivalents at beginning of year | | | 609,907 | | | | 796,902 | | | | 259,169 | | | | 320,349 | | | | 197,113 | | | | 151,063 | | | Foreign exchange gain on cash and cash equivalents | | | 59,737 | | | | 304,913 | | | | 26,520 | | | | (22,513 | ) | | | 85,124 | | | | 6,992 | | | Cash and cash equivalents at end of year | | | 375,180 | | | | 609,907 | | | | 796,902 | | | | 221,567 | | | | 320,349 | | | | 197,113 | |
The information above is the corresponding to balances and transactions before inter-company eliminations.
8. | Interests in joint ventures |
General information
The accounting policy used by the Group to value its interest in joint ventures, materiality criteria and other relevant information concerning these investments are described in Note 2.3 (e).
Cresud Sociedad Anónima,
Comercial, Inmobiliaria, Financiera y Agropecuaria
Notes to Consolidated Financial Statements (Continued)
(All amounts in thousands of Argentine Pesos, except shares and per share data and as otherwise indicated)
| 8. | Interests in joint ventures (Continued)
|
The table below lists the Group’s investments and the values of interests in joint ventures for the fiscal years ended June 30, 2015, 2014 and 2013:
| | | | | | | | | Value of Group's interest in equity | | | Group's interest in comprehensive income | | | % of ownership interest | | | | | | | | | | | | | | | | | | | | June 30, | | | June 30, | | | June 30, | | | Last financial statement issued | | | Name of the entity | Place of business / Country of incorporation | Main activity | Nature of the relationship | | Common shares 1 vote | | | 2015 | | | 2014 | | | 2015 | | | 2014 | | | 2013 | | | 2015 | | | 2014 | | | 2013 | | | Share capital (nominal value) | | | Income (loss) for the year | | | Shareholders’ Equity | | | Quality Invest S.A. (1) | Argentina | Real Estate | (2) | | | 70,314,342 | | | | 74,485 | | | | 65,927 | | | | 2,055 | | | | 1,181 | | | | (3,056 | ) | | | 50 | % | | | 50 | % | | | 50 | % | | | 140,629 | | | | 4,129 | | | | 146,932 | | | Nuevo Puerto Santa Fe S.A. | Argentina | Commercial real estate | (3) | | | 138,750 | | | | 28,803 | | | | 26,869 | | | | 4,559 | | | | 4,874 | | | | 2,729 | | | | 50 | % | | | 50 | % | | | 50 | % | | | 27,750 | | | | 9,468 | | | | 47,351 | | | Canteras Natal Crespo S.A. | Argentina | Real Estate | (4) | | | - | | | | - | | | | - | | | | - | | | | - | | | | (870 | ) | | | - | | | | - | | | | - | | | | - | | | | - | | | | - | | | Cyrsa S.A. (1) | Argentina | Real Estate | (5) | | | 119,608,531 | | | | 17,655 | | | | 154,982 | | | | 4,522 | | | | 22,602 | | | | 15,898 | | | | 50 | % | | | 50 | % | | | 50 | % | | | 239,217 | | | | 14,306 | | | | 35,064 | | | Puerto Retiro S.A. (1) | Argentina | Real Estate | (6) | | | 23,067,250 | | | | 57,696 | | | | 56,809 | | | | (881 | ) | | | (1,828 | ) | | | (1,434 | ) | | | 50 | % | | | 50 | % | | | 50 | % | | | 46,135 | | | | (1,763 | ) | | | 33,073 | | | Baicom Networks S.A. | Argentina | Real Estate | (7) | | | 4,701,455 | | | | 2,850 | | | | 3,566 | | | | (714 | ) | | | (475 | ) | | | (580 | ) | | | 50 | % | | | 50 | % | | | 50 | % | | | 9,403 | | | | (1,431 | ) | | | 5,148 | | | Cresca S.A. (1) | Paraguay | Agricultural | (10) | | | 138,154 | | | | 176,184 | | | | 63,881 | | | | 25,212 | | | | 1,997 | | | | (7,978 | ) | | | 50 | % | | | 50 | % | | | 50 | % | | | 67,979 | | | | (2,051 | ) | | | 185,095 | | | Entertainment Holdings S.A. | Argentina | Investment | (8) | | | 22,395,574 | | | | 20,736 | | | | 23,268 | | | | (2,632 | ) | | | (838 | ) | | | (2,516 | ) | | | 50 | % | | | 50 | % | | | 50 | % | | | 44,791 | | | | 1,187 | | | | 41,348 | | | Entretenimiento Universal S.A. | Argentina | Event organization and others | (9) | | | 300 | | | | 10 | | | | (59 | ) | | | 80 | | | | (47 | ) | | | - | | | | 50 | % | | | 50 | % | | | - | | | | 12 | | | | 2,457 | | | | 764 | | | | | | | | | | | | | 378,419 | | | | 395,243 | | | | 32,201 | | | | 27,466 | | | | 2,193 | | | | | | | | | | | | | | | | | | | | | | | | | |
(1) | It is deemed material to the Group. |
(2) | Quality Invest S.A. (“Quality”) is a joint venture between the Group and Efesul S.A. and is a company engaged in the operation of the San Martín premises (formerly owned by Nobleza Piccardo S.A.I.C. y F.). |
(3) | Nuevo Puerto Santa Fe S.A. (“NPSF”) is a joint venture of the Group and Grainco S.A, Argentina society. Investment in NPSF includes the right to use and operate a shopping center in the port of the city of Santa Fe, Province of Santa Fe (“La Ribera Shopping”). (Note 3). |
(4) | On June 28, 2013 IRSA sold, assigned and transferred to Euromayor S.A. de Inversiones the 100% of its interest in Canteras Natal Crespo S.A. This represents the 50% of Canteras Natal Crespo S.A.’s share capital (see Note 3). |
(5) | Cyrsa S.A. (“Cyrsa”) is a joint venture between the Group and Cyrela Brazil Realty S.A. Empreendimentos e Participaçoes, a Brazilian corporation, engaged in developing a residential apartment complex known as "Horizons" in the Northern part of Greater Buenos Aires. |
(6) | Puerto Retiro S.A. ("Puerto Retiro") is a joint venture of the Group and Havord Corporation N.V. Puerto Retiro owns a land reserve. |
(7) | Baicom Networks S.A. (“Baicom”) is a joint venture between the Group and Héctor Masoero, Octopus S.A. and Rafael Garfunkel. Baicom owns a land reserve. |
(8) | Entertainment Holdings S.A. is an investment company which principal assets is an indirect interest of 25% in La Rural S.A. (“LRSA”), engaged in the operation of the exhibition grounds in Buenos Aires. See Note 3. |
(9) | Entretenimiento Universal S.A. is a company engaged in event organization, shows and food services. See Note 3. |
(10) | Cresca S.A. is a joint venture between the Company and Carlos Casado S.A. with agriculture operations in Paraguay. |
Cresud Sociedad Anónima,
Comercial, Inmobiliaria, Financiera y Agropecuaria
Notes to Consolidated Financial Statements (Continued)
(All amounts in thousands of Argentine Pesos, except shares and per share data and as otherwise indicated)
8. | Interests in joint ventures (Continued)
|
The shares in these joint ventures are not publicly traded, so they have no listed market price available.
Changes in the Group’s investments in joint ventures for the year ended June 30, 2015 and 2014 are as follows:
| | | June 30, 2015 | | | June 30, 2014 | | | Beginning of the year | | | 395,243 | | | | 324,194 | | | Capital contribution | | | 95,449 | | | | 43,583 | | | Capital reduction (iii) | | | (110,860 | ) | | | - | | | Cash dividends (i) | | | (33,614 | ) | | | - | | | Share of profit / (loss) | | | 5,356 | | | | 15,742 | | | Exchange differences | | | 26,845 | | | | 11,724 | | | End of the year (ii) | | | 378,419 | | | | 395,243 | |
(i) | During the year ended June 30, 2015, the Group cashed dividends from Cyrsa S.A. for an amount of Ps. 31.0 million and from Nuevo Puerto Santa Fe S.A. for an amount of Ps. 2.6 million. |
(ii) | Includes a balance of Ps. (59) reflecting investments in companies with negative equity as of June 30, 2014 which is included in “Provisions” (see Note 24). |
(iii) | During the year ended June 30, 2015, Cyrsa S.A. carried out a distribution to IRSA due to capital reduction in the amount of Ps. 110.9 million. |
Restrictions, commitments and other matters in respect of joint ventures
According to the laws of certain of the countries in which the Group operates, 5% of the profit of the year is separated to constitute legal reserves until they reach legal capped amounts (20% of total capital). These legal reserves are not available for dividend distribution and can only be released to absorb losses. The Group’s joint ventures have not reached the legal capped amounts.
Quality Invest
In March 2011, Quality subscribed an agreement of purchase for the property of an industrial plant owned by Nobleza Piccardo S.A.I.C. y F. (hereinafter “Nobleza”) located in San Martin, Province of Buenos Aires. The facilities have the necessary features and scales for multiple uses. The purchase price was agreed on USD 33.0 million. At the same time, Quality subscribed a lease agreement with Nobleza, by means of which Nobleza will rent the property for a maximum term of 3 years. On March 2, 2015, an Agreement Letter has been signed for the completion of lease agreement and restitution of San Martín plant. On April 2011, Quality requested the National Antitrust Commission to issue an advisory opinion on the obligation to notify the operation or not. Later, the Court of Appeals confirmed the CNDC’s decision regarding the obligation to serve notice and consequently, therefore, on February 23, 2012 local Form F1 was filed, which as of the date of these consolidated financial statements is still in process.
Cresud Sociedad Anónima,
Comercial, Inmobiliaria, Financiera y Agropecuaria
Notes to Consolidated Financial Statements (Continued)
(All amounts in thousands of Argentine Pesos, except shares and per share data and as otherwise indicated)
8. | Interests in joint ventures (Continued)
|
As authorized by the relevant Ordinance, on January 20, 2015 Quality Invest S.A. entered into an Urbanization Agreement with the Municipality of San Martín which governs several regulatory aspects and sets forth a binding assignment of meters in exchange for cash contributions subject to formalization of certain administrative milestones included in the rezoning process. The Agreement contemplates a monetary compensation to the City Council totaling Ps. 40.0 million, payable in two installments of Ps. 20.0 million each. The first of such installments was actually paid on June 30, 2015, while the second, will be paid within 60 days after the registration of the plan of subdivision parcel in the Department of Geodesy of the Province of Buenos Aires.
Entertainment Holdings S.A.
As noted in Note 3, IRSA CP acquired shares of common stock, representing 50% of Entertainment Holdings S.A. (“EHSA”)’s capital stock and votes and as a consequence IRSA CP holds a jointly indirect interest in LRSA of 25% which operates the fairground Predio Ferial de Buenos Aires.
In connection with the Fairground, as publicly known, in December 2012 the Executive Branch issued Executive Order 2552/12 that annulled an executive order dated 1991 which approved the sale of the Fairground to the SRA; the effect of this new order was to revoke the sale transaction. Subsequent to December 21, 2012, the Executive Branch notified the SRA of said executive order and further ordered that the property be returned to the Federal Government within 30 subsequent days. Then, the SRA issued a press release publicly disclosing the initiation of legal actions. Furthermore, as it has become publicly known, on August 21, 2013, the Supreme Court of Justice rejected the appeal filed by the National State against the interim measure timely requested by the SRA.
Neither has IRSA CP been served notice formally nor is it a party involved in the legal actions brought by the SRA.
Given the potential dimension of the dispute, as it has been known to the public, we estimate that if Executive Order 2552/2012 was found to be unconstitutional, such order shall have no legal effects either in EHSA or in the acquisition by IRSA CP of an equity interest in EHSA. However, if the opposite happen, that is, a court order declaring the nullity of Executive Order 2699/91 could have a real impact on acquired assets. In this scenario, the judicial decision may render the purchase of the Plot of Land by SRA null and void , and all acts executed by SRA in relation to the Plot of Land, including the right of use currently held by the entity where EHSA has an indirect equity interest, through vehicle entities, would also become null and void.
On June 1, 2015, a ruling was issued in case 4573/2012 Sociedad Rural Argentina vs. National State – Executive Power on Declaratory Action, whereby the injunction staying the effects of Executive Order 2552/12 was lifted.
Cresud Sociedad Anónima,
Comercial, Inmobiliaria, Financiera y Agropecuaria
Notes to Consolidated Financial Statements (Continued)
(All amounts in thousands of Argentine Pesos, except shares and per share data and as otherwise indicated)
8. | Interests in joint ventures (Continued)
|
On June 2, 2015 the Sociedad Rural Argentina filed a writ of appeals against the ruling indicated above and on that same date the appeal was admitted with staying effects. While a decision on the appeal filed with the Court of Appeals is pending, the motion to lift the injunction filed by the National State will have no effect.
The Court of Appeals may sustain the ruling that has been appealed and then lift the injunction requested by Sociedad Rural Argentina or else revoke the ruling that was appealed and sustain the injunction until a final decision has been rendered.
Notwithstanding the above, to the date we are not aware of any judicial measure petitioned by the owner of the Plot of Land and/or the National Government, or the corresponding appeals or rulings, may have affected the actual use of the Plot of Land.
There are no contingent liabilities relating to the Group’s interest in joint ventures, and there are no contingent liabilities of the joint ventures themselves, different to the mentioned above.
Puerto Retiro S.A.
On April 18, 2000, Puerto Retiro S.A. was notified of a filing made by the National Government, through the Ministry of Defense, to extend the petition in bankruptcy of Inversora Dársena Norte S.A. (Indarsa) to Puerto Retiro. At the request of plaintiff, the bankruptcy court for the Buenos Aires District issued an order restraining the ability of Puerto Retiro to sell or dispose in any manner the land.
Indarsa had acquired 90% of the capital stock of Tandanor to a formerly estate owned company in 1991. Tandanor is mainly engaged in ship repairs, which activity was carried out in premises with a surface of 19 hectares located near La Boca and where Syncrolift is currently installed.
Indarsa did not comply with the payment of the outstanding price for the acquisition of the stock of Tandanor, and therefore the Ministry of Defense requested the bankruptcy of Indarsa, pursuing to extend the bankruptcy to Puerto Retiro.
The evidence steps of the legal procedures have been completed. Puerto Retiro appealed the precautionary measure, being the same confirmed by the Court on December 14, 2000. The parties have submitted their claims in due time. The file was passed for the judge to issue a pronouncement, the judge issued a decree adjourning the summoning of decisions to pronouncement in the understanding that there exists pre-judgment in respect of the penal cause filed against ex-officers of the Ministry of Defense and ex-directors of the Company. Consequently, the matter will not be solved until there is final judgment in penal jurisdiction.
Cresud Sociedad Anónima,
Comercial, Inmobiliaria, Financiera y Agropecuaria
Notes to Consolidated Financial Statements (Continued)
(All amounts in thousands of Argentine Pesos, except shares and per share data and as otherwise indicated)
8. | Interests in joint ventures (Continued)
|
Notice has been served upon the commercial court that the criminal cause of action was declared extinguished by operation of the statutes of limitation and that the accused were acquitted. However, this ruling was revoked by the Criminal Cassation Court; an extraordinary remedy was filed, which was denied. Then a grievance remedy was filed with the Argentine Supreme Court, which has not yet decided on the dispute.
The Management and legal advisors of Puerto Retiro estimate that there are legal and technical arguments sufficient to consider that the request for bankruptcy will be denied by the court. However, given the current status of the case, we cannot predict its outcome.
In addition, Tandanor filed a civil action against Puerto Retiro and other accused parties in the criminal case for violation of section 174 subsection 5, under section 173 subsection 7 of Criminal Code. The claim expects that upon invalidation of executive order that approved the bid of Dársena Norte plot of land, Tandanor be reimbursed any other sum of money that it claims to have lost due to the alleged fraudulent purchase-sale transaction of the real property disputed in the case.
Puerto Retiro filed an answer to the complaint in due course in relation to the civil action, and filed some affirmative defenses. Tandanor requested the intervention of the National State as third party in the proceedings, which was admitted by the Court. In March 2015 both the National State and the plaintiffs answered the motion for affirmative defenses filed by the defendant. To date, no decision has been made regarding such defenses. Until the court rules on the admissibility of such affirmative defenses, we cannot predict the outcome; yet, there are some technical legal arguments that support the company’s position.
Cresud Sociedad Anónima,
Comercial, Inmobiliaria, Financiera y Agropecuaria
Notes to Consolidated Financial Statements (Continued)
(All amounts in thousands of Argentine Pesos, except shares and per share data and as otherwise indicated)
8. | Interests in joint ventures (Continued)
|
Information about significant joint ventures
Set out below is the summarized financial information for each joint venture of the Group, which is considered material as of June 30, 2015 and 2014:
Summarized statements of financial position
| | | June 30, 2015 | | | | | Cresca | | | Cyrsa | | | Puerto Retiro | | | Quality Invest S.A. | | | Total | | | Assets | | | | | | | | | | | | | | | | | Total non-current assets | | | 543,570 | | | | 42,512 | | | | 45,941 | | | | 150,042 | | | | 782,065 | | | Current | | | | | | | | | | | | | | | | | | | | | | Cash and cash equivalents | | | 1,380 | | | | 4,506 | | | | - | | | | 1 | | | | 5,887 | | | Other current assets | | | 69,204 | | | | 12,941 | | | | 597 | | | | 4,476 | | | | 87,218 | | | Total current assets | | | 70,584 | | | | 17,447 | | | | 597 | | | | 4,477 | | | | 93,105 | | | Total assets | | | 614,154 | | | | 59,959 | | | | 46,538 | | | | 154,519 | | | | 875,170 | | | Liabilities | | | | | | | | | | | | | | | | | | | | | | Non-current | | | | | | | | | | | | | | | | | | | | | | Financial liabilities (i) | | | 187,675 | | | | 1,104 | | | | 9,133 | | | | 1,195 | | | | 199,107 | | | Other liabilities | | | 17,281 | | | | - | | | | 126 | | | | 368 | | | | 17,775 | | | Total non-current liabilities | | | 204,956 | | | | 1,104 | | | | 9,259 | | | | 1,563 | | | | 216,882 | | | Current | | | | | | | | | | | | | | | | | | | | | | Financial liabilities (i) | | | 35,887 | | | | 1,529 | | | | 3,823 | | | | 2,045 | | | | 43,284 | | | Other liabilities | | | 18,166 | | | | 22,262 | | | | 383 | | | | 3,978 | | | | 44,789 | | | Total current liabilities | | | 54,053 | | | | 23,791 | | | | 4,206 | | | | 6,023 | | | | 88,073 | | | Total liabilities | | | 259,009 | | | | 24,895 | | | | 13,465 | | | | 7,586 | | | | 304,955 | | | Net assets | | | 355,145 | | | | 35,064 | | | | 33,073 | | | | 146,933 | | | | 570,215 | |
| | | June 30, 2014 | | | | | Cresca | | | Cyrsa | | | Puerto Retiro | | | Quality Invest S.A. | | | Total | | | Assets | | | | | | | | | | | | | | | | | Total non-current assets | | | 204,877 | | | | 286,950 | | | | 45,484 | | | | 132,806 | | | | 670,117 | | | Current | | | | | | | | | | | | | | | | | | | | | | Cash and cash equivalents | | | 3,183 | | | | 4,144 | | | | - | | | | 1,572 | | | | 8,899 | | | Other current assets | | | 151,295 | | | | 44,814 | | | | 215 | | | | 902 | | | | 197,226 | | | Total current assets | | | 154,478 | | | | 48,958 | | | | 215 | | | | 2,474 | | | | 206,125 | | | Total assets | | | 359,355 | | | | 335,908 | | | | 45,699 | | | | 135,280 | | | | 876,242 | | | Liabilities | | | | | | | | | | | | | | | | | | | | | | Non-current | | | | | | | | | | | | | | | | | | | | | | Financial liabilities (i) | | | 188,771 | | | | - | | | | 9,006 | | | | 1,378 | | | | 199,155 | | | Other liabilities | | | 20,799 | | | | - | | | | 78 | | | | 299 | | | | 21,176 | | | Total non-current liabilities | | | 209,570 | | | | - | | | | 9,084 | | | | 1,677 | | | | 220,331 | | | Current | | | | | | | | | | | | | | | | | | | | | | Financial liabilities (i) | | | 18,705 | | | | - | | | | 4,655 | | | | 63 | | | | 23,423 | | | Other liabilities | | | 543 | | | | 31,449 | | | | 662 | | | | 3,737 | | | | 36,391 | | | Total current liabilities | | | 19,248 | | | | 31,449 | | | | 5,317 | | | | 3,800 | | | | 59,814 | | | Total liabilities | | | 228,818 | | | | 31,449 | | | | 14,401 | | | | 5,477 | | | | 280,145 | | | Net assets | | | 130,537 | | | | 304,459 | | | | 31,298 | | | | 129,803 | | | | 596,097 | |
(i) | Excluding trade and other payables and provisions. |
Cresud Sociedad Anónima,
Comercial, Inmobiliaria, Financiera y Agropecuaria
Notes to Consolidated Financial Statements (Continued)
(All amounts in thousands of Argentine Pesos, except shares and per share data and as otherwise indicated)
8. | Interests in joint ventures (Continued)
|
Summarized statement of comprehensive income
| | | Cresca | | | Cyrsa | | | Puerto Retiro | | | Quality Invest S.A. | | | Total | | | | | June 30, 2015 | | | June 30, 2014 | | | June 30, 2015 | | | June 30, 2014 | | | June 30, 2015 | | | June 30, 2014 | | | June 30, 2015 | | | June 30, 2014 | | | June 30, 2015 | | | June 30, 2014 | | | Revenues | | | 52,249 | | | | 42,879 | | | | 10,806 | | | | 46,185 | | | | 2,199 | | | | 52 | | | | 15,920 | | | | 16,476 | | | | 81,174 | | | | 105,592 | | | Interest income | | | 6,806 | | | | - | | | | 25,052 | | | | 66,290 | | | | 63 | | | | 134 | | | | 283 | | | | 178 | | | | 32,204 | | | | 66,602 | | | Income tax | | | (4,108 | ) | | | (3,786 | ) | | | (9,829 | ) | | | (25,275 | ) | | | (34 | ) | | | (187 | ) | | | 182 | | | | 1,796 | | | | (13,789 | ) | | | (27,452 | ) | | (Loss) / Profit for the year | | | (3,244 | ) | | | (19,266 | ) | | | 14,306 | | | | 45,206 | | | | (1,763 | ) | | | (3,657 | ) | | | 4,129 | | | | 2,383 | | | | 13,428 | | | | 24,666 | | | Other comprehensive income / (loss) | | | - | | | | - | | | | - | | | | - | | | | - | | | | - | | | | - | | | | - | | | | | | | | - | | | Total comprehensive (loss) / income for the year | | | (3,244 | ) | | | (19,266 | ) | | | 14,306 | | | | 45,206 | | | | (1,763 | ) | | | (3,657 | ) | | | 4,129 | | | | 2,383 | | | | 13,428 | | | | 24,666 | | | Dividends received | | | - | | | | - | | | | 30,990 | | | | - | | | | - | | | | - | | | | - | | | | - | | | | 30,990 | | | | - | |
The information above reflects the amounts presented in the financial statements of the joint ventures (and not the Group’s share of those amounts) adjusted for differences in accounting policies and fair value adjustments made at the time of the acquisition.
Reconciliation of the summarized financial information presented with regard to the carrying amount of the Group’s interest in material joint ventures is as follows:
| | | Cresca | | | Cyrsa | | | Puerto Retiro | | | Quality Invest S.A. | | | Total | | | | | June 30, 2015 | | | June 30, 2014 | | | June 30, 2015 | | | June 30, 2014 | | | June 30, 2015 | | | June 30, 2014 | | | June 30, 2015 | | | June 30, 2014 | | | June 30, 2015 | | | June 30, 2014 | | | Net assets at beginning of the year | | | 130,559 | | | | 43,288 | | | | 304,459 | | | | 259,253 | | | | 31,298 | | | | 31,393 | | | | 129,803 | | | | 126,420 | | | | 596,119 | | | | 460,354 | | | (Loss) / Profit for the year | | | (1,622 | ) | | | (19,266 | ) | | | 14,306 | | | | 45,206 | | | | (1,763 | ) | | | (3,657 | ) | | | 4,129 | | | | 2,383 | | | | 15,050 | | | | 24,666 | | | Capital reduction | | | - | | | | - | | | | (221,721 | ) | | | - | | | | - | | | | - | | | | - | | | | - | | | | (221,721 | ) | | | - | | | Release of reserves | | | - | | | | - | | | | (15,335 | ) | | | - | | | | - | | | | - | | | | - | | | | - | | | | (15,335 | ) | | | - | | | Dividend distribution | | | - | | | | - | | | | (46,645 | ) | | | - | | | | - | | | | - | | | | - | | | | - | | | | (46,645 | ) | | | - | | | Loss absorption | | | - | | | | - | | | | - | | | | - | | | | 3,538 | | | | - | | | | - | | | | - | | | | 3,538 | | | | - | | | Exchange gain | | | 52,048 | | | | 26,013 | | | | - | | | | - | | | | - | | | | - | | | | - | | | | - | | | | 52,048 | | | | 26,013 | | | Irrevocable contributions | | | 174,160 | | | | 80,502 | | | | - | | | | - | | | | - | | | | 3,562 | | | | 13,001 | | | | 1,000 | | | | 187,161 | | | | 85,064 | | | Net assets at end of the year | | | 355,145 | | | | 130,537 | | | | 35,064 | | | | 304,459 | | | | 33,073 | | | | 31,298 | | | | 146,933 | | | | 129,803 | | | | 570,215 | | | | 596,097 | | | Ownership interest | | | 50.00 | % | | | 50.00 | % | | | 50.00 | % | | | 50.00 | % | | | 50.00 | % | | | 50.00 | % | | | 50.00 | % | | | 50.00 | % | | | 50.00 | % | | | 50.00 | % | | Investments in joint ventures | | | 177,573 | | | | 65,270 | | | | 17,532 | | | | 152,229 | | | | 16,537 | | | | 15,649 | | | | 73,467 | | | | 64,902 | | | | 285,109 | | | | 298,050 | | | Fair value adjustment on acquisition of joint venture | | | (1,389 | ) | | | (1,389 | ) | | | 123 | | | | 2,753 | | | | 41,159 | | | | 41,160 | | | | 1,018 | | | | 1,025 | | | | 40,911 | | | | 43,549 | | | Closing net book amount | | | 176,184 | | | | 63,881 | | | | 17,655 | | | | 154,982 | | | | 57,696 | | | | 56,809 | | | | 74,485 | | | | 65,927 | | | | 326,020 | | | | 341,599 | |
Cresud Sociedad Anónima,
Comercial, Inmobiliaria, Financiera y Agropecuaria
Notes to Consolidated Financial Statements (Continued)
(All amounts in thousands of Argentine Pesos, except shares and per share data and as otherwise indicated)
9. | Interests in associates |
General information
The accounting policy used by the Group to value its interest in associates, materiality criteria and other relevant information concerning these investments are described in Note 2.3 (d).
Cresud Sociedad Anónima,
Comercial, Inmobiliaria, Financiera y Agropecuaria
Notes to Consolidated Financial Statements (Continued)
(All amounts in thousands of Argentine Pesos, except shares and per share data and as otherwise indicated)
9. | Interests in associates (Continued)
|
The table below lists the Group’s investments and the values of interests in associates for the fiscal years ended June 30, 2015 and 2014:
| | | | | | | | | | Value of Group's interest in equity | | | Group's interest in comprehensive income | | | % of ownership interest | | | | | | | | | | | | | | | June 30, | | | June 30, | | | June 30, | | | Last financial statement issued | | | Name of the entity | Place of business / Country of incorporation | Main activity | | Nature of the relationship | | Common shares 1 vote | | | 2015 | | | 2014 | | | 2015 | | | 2014 | | | 2013 | | | 2015 | | | 2014 | | | 2013 | | | Share capital (nominal value) | | | Income / (Loss) for the year | | | Shareholders’ Equity | | | Tarshop | Argentina | Consumer financing | | | (1) | | | 26,759,288 | | | | 32,401 | | | | 18,861 | | | | (8,476 | ) | | | (16,348 | ) | | | 2,601 | | | | 20 | % | | | 20 | % | | | 20 | % | | | 243,796 | | | | (46,377 | ) | | | 181,271 | | | New Lipstick LLC | United States | Real State | | | (2) | | | N/A | | | | (344,627 | ) | | | (176,923 | ) | | | (169,226 | ) | | | (154,499 | ) | | | (88,706 | ) | | | 49.73 | % | | | 49.80 | % | | | 49.87 | % | | | - | | | | (*) (33,111 | ) | | | (*) (105,449 | ) | | Rigby | United States | Real State | | | (3) | | | N/A | | | | - | | | | - | | | | - | | | | - | | | | 4,414 | | | | - | | | | - | | | | - | | | | - | | | | - | | | | - | | | Lipstick Management LLC | United States | Management company | | | (4) | | | N/A | | | | 2,827 | | | | 1,739 | | | | 1,020 | | | | 900 | | | | 447 | | | | 49 | % | | | 49 | % | | | 49 | % | | | - | | | | (*) (188 | ) | | | (*) (630 | ) | | Manibil S.A. | Argentina | Real Estate | | | (6) | | | 30,397,880 | | | | 46,556 | | | | 38,289 | | | | 918 | | | | 6,369 | | | | 2,329 | | | | 49 | % | | | 49 | % | | | 49 | % | | | 77,037 | | | | 1,871 | | | | 94,992 | | | Banco de Crédito & Securitización S.A. | Argentina | Financing | | | (7) | | | 3,984,375 | | | | 15,814 | | | | 13,610 | | | | 2,205 | | | | 3,709 | | | | 1,198 | | | | 6.38 | % | | | 6.38 | % | | | 6.38 | % | | | 62,500 | | | | 34,587 | | | | 248,070 | | | Banco Hipotecario S.A. | Argentina | Financing | | | | | | 446,515,208 | | | | 1,356,242 | | | | 1,210,168 | | | | 144,750 | | | | 187,865 | | | | 58,744 | | | | 29.99 | % | | | 29.77 | % | | | 29.77 | % | | | 1,500,000 | | | | 465,157 | | | | 4,397,569 | | | Bitania 26 S.A | Argentina | Real Estate | | | (8) | | | - | | | | - | | | | 22,129 | | | | 1,254 | | | | 789 | | | | 84 | | | | - | | | | 49 | % | | | 49 | % | | | - | | | | - | | | | - | | | Agro-Uranga S.A. | Argentina | Agricultural | | | (9) | | | 893,069 | | | | 30,550 | | | | 34,418 | | | | 846 | | | | 11,036 | | | | 8,117 | | | | 35.72 | % | | | 35.72 | % | | | 35.72 | % | | | 8,512 | | | | 2,425 | | | | 54,226 | | | Agromanagers S.A. | Argentina | Investment | | | (10) | | | 981,029 | | | | 2,793 | | | | 2,808 | | | | - | | | | 443 | | | | 476 | | | | 46.84 | % | | | 46.84 | % | | | 46.84 | % | | | 2,094 | | | | - | | | | 4,262 | | | Condor Hospitality Trust | United States | Hotel | | | (11) | | | 1,261,723 | | | | (18,304 | ) | | | 31,577 | | | | (49,881 | ) | | | 15,517 | | | | - | | | | 26.91 | % | | | 26.91 | % | | | - | | | | - | | | | - | | | | 4,262 | | | IDB Development Corporation Ltd. | Israel | Investment | | | (12) | | | 324,445,664 | | | | 907,083 | | | | 595,342 | | | | (918,365 | ) | | | (507,363 | ) | | | - | | | | 48.90 | % | | | 26.65 | % | | | - | | | | - | | | | - | | | | - | | | Avenida Inc. S.A. | United States | Investment | | | (13) | | | - | | | | - | | | | 11,096 | | | | 19,388 | | | | (1,944 | ) | | | - | | | | - | | | | 24.79 | % | | | - | | | | - | | | | - | | | | - | | | | | | | | | | | | | | | 2,031,335 | | | | 1,803,114 | | | | (975,567 | ) | | | (453,526 | ) | | | (10,296 | ) | | | | | | | | | | | | | | | | | | | | | | | | |
(1) | Tarshop S.A. (“Tarshop”) is primarily engaged in credit card and loan origination activities. |
(2) | New Lipstick LLC (“New Lipstick”) net equity comprises a rental office building in New York City known as the “Lipstick Building” with related debt. |
(3) | Rigby 183 LLC (“Rigby”) owns a rental office building located at 183 Madison Avenue, New York, NY. Since December 31, 2012, Rigby began to be reported on a consolidated basis and ceased to be an associate. The building is classified as held for sale as of June 30, 2014. See Note 44. |
(4) | Lipstick Management LLC is engaged in managing the Lipstick Building, an office building for rent located in New York City. |
(5) | BHSA is a full-service commercial bank offering a wide variety of banking activities and related financial services to individuals, small- and medium-sized companies and large corporations. |
(6) | Manibil S.A. is engaged in the development and sale of real estate investment projects in the City of Buenos Aires and its surrounding areas. |
(7) | Banco de Crédito & Securitización S.A. (“BACS”) is a second-tier commercial bank established in 2000 in order to foster asset securitization. The bank also offers products, such as, export financing and pre-financing and purchase of mortgage-backed and personal assets. Its product and service offering is mainly distributed through a network of financial entities. BACS is controlled by BHSA. In addition, the Group directly holds an additional 6.38% interest. |
(8) | The main asset of Bitania 26 S.A. (“Bitania”) is a hotel located in the City of Rosario known as Esplendor Savoy Rosario. |
(9) | Agrouranga S.A. (“Agro-Uranga”) is engaged in agricultural activities. |
(10) | The main asset of Agromanagers S.A. (“Agromanagers”) consists of a shareholding in Brasilagro. |
(11) | Condor Hospitality Trust Inc. is an investment Company engaged in hotels in United States. (See Note 3). |
(12) | The Group acquired IDB on May 7, 2014. IDBD is one of the Israeli biggest and most diversified investment groups. The Group has valued its interest in IDBD at fair value through profit or loss according to an exemption under IAS 28. See Notes 2.3 (d) and 3 for further information. Since interest in IDBD is valued at fair value, participation in financial statements and other comprehensive income statements of IDBD is not shown in the table above. |
(13) | Avenida Inc. is principally engaged in investing activities. As of June 30, 2015, holds 100% of Avenida Compras S.A., a Company engaged in e-commerce activity. As of June 30, 2015, the Group no longer has significant influence in the company (see Note 3).
|
(*) | The amounts are presented in thousands of US dollars. |
Cresud Sociedad Anónima,
Comercial, Inmobiliaria, Financiera y Agropecuaria
Notes to Consolidated Financial Statements (Continued)
(All amounts in thousands of Argentine Pesos, except shares and per share data and as otherwise indicated)
9. | Interests in associates (Continued)
|
Group's interest in IDBD is carried at fair value. The remaining material associates are private companies and there is no quoted market price available for their shares.
Changes in the Group’s investment in associates for the years ended June 30, 2015 and 2014 are as follows:
| | | June 30, 2015 | | | June 30, 2014 | | | Beginning of the year | | | 1,803,114 | | | | 1,123,577 | | | Acquisition of associates | | | 1,254,306 | | | | 1,131,806 | | | Capital contribution | | | 30,937 | | | | 16,716 | | | Share in (losses) / profit | | | (29,328 | ) | | | 92,568 | | | Exchange differences | | | 54,761 | | | | (29,133 | ) | | Disposal of associates | | | (33,769 | ) | | | - | | | Reclassification to financial instruments | | | (30,089 | ) | | | - | | | Cash dividends (i) | | | (17,597 | ) | | | (15,459 | ) | | Unrealized loss from investments at fair value | | | (1,001,000 | ) | | | (516,961 | ) | | End of the year (ii) | | | 2,031,335 | | | | 1,803,114 | |
(i) | As of June 30, 2015, the Group cashed dividends from Agro-Uranga S.A. and BHSA in the amount of Ps. 4.7 million and Ps. 12.9 million, respectively. During the fiscal year 2014, the Group cash dividends from Agro-Uranga S.A., Manibil S.A. and BHSA in the amount of Ps. 5.5 million, Ps. 9.2 million and Ps. 0.8 million, respectively. |
(ii) | Includes a balance of Ps. (362,931) and Ps. (39,091) reflecting interests in companies with negative equity as of June 30, 2015 and 2014, respectively, which is reclassified to “Provisions” (see Note 24). |
Commitments and restrictions in respect of associates
According to the laws of certain of the countries in which the Group operates, 5% of the profit of the year is separated to constitute legal reserves until they reach legal capped amounts (20% of total capital). These legal reserves are not available for dividend distribution and can only be released to absorb losses. The Group’s associates under this law have not reached the legal limits of these reserves.
Tarshop S.A.
Over the past two fiscal years, the BCRA modified certain aspects of the regulatory framework carried out by Tarshop S.A. Based on these changes, our Associate is going through a business reformulation process.
In addition, during October 2014 Banco Hipotecario S.A and IRSA CP approved a gradual capitalization plan to be carried out by shareholders pro rata their holdings; the first tranche of such capitalization has already been made for a total amount of Ps. 110.0 million.
Cresud Sociedad Anónima,
Comercial, Inmobiliaria, Financiera y Agropecuaria
Notes to Consolidated Financial Statements (Continued)
(All amounts in thousands of Argentine Pesos, except shares and per share data and as otherwise indicated)
9. | Interests in associates (Continued)
|
Non-competition agreement for the sale of the equity interest
Due to the sale assignment and transfer of the 80% of the equity interest in Tarshop to BHSA, made during the fiscal year ended June 30, 2011, the Group committed itself to not competing for 5 years in the credit card and/or consumer loan business in which Tarshop has a presence.
New Lipstick
New Lipstick has a pledge over the shares of its operating subsidiary Metropolitan 885 Third Avenue Leasehold LLC (“Metropolitan”). Metropolitan owns the building known as Lipstick Building in Manhattan.
IDBD
Under the Agreement, Dolphin and ETH agreed to participate on a joint and several basis in the capital increases resolved by IDBD’s Board of Directors in order to carry out its business plan for 2014 and 2015, for at least NIS 300 million in 2014 and NIS 500 million in 2015. As of June 30, 2015, Dolphin has contributed NIS 668.6 million in aggregate and ETH has contributed NIS 203.5 million in IDBD. In this way, Dolphin has completed its committed contributions, while IDBD is claiming from ETH, and jointly and severally to Dolphin, to pay the balance committed by ETH for an aggregate of NIS 196.5 million (equivalent to approximately US$ 52.1 million at the exchange rate prevailing as of June 30, 2015).
Moreover, as part of the Arrangement, Dolphin and ETH committed jointly and severally to make Tender Offers for the purchase of IDBD’s shares for a total amount of NIS 512.09 million (equivalent to approximately US$ 135.7 million at the exchange rate prevailing as of June 30, 2015), as follows: (i) by December 31, 2015 at least NIS 249.8 million for a price per share of NIS7.798 (value as of June 30, 2015, subject to adjustment) and (ii) by December 31, 2016, for at least NIS 512.09 million, less the offer made in 2015, for a price per share of NIS 8.188 (value as of June 30, 2015, subject to adjustment). As security for the performance of the tender offers, a total of 34,130,119 shares in IDBD were pledged as of June 30, 2015. In addition, as of June 30, 2015, 49,695,135 shares, 23,950,072 Series 4 warrants, 22,752,569 Series 5 warrants and 20,357,561 Series 6 warrants of IDBD held by Dolphin were deposited in the same escrow account in which the pledged shares are deposited, and are expected to be transferred to an account which is not an escrow account. As of the date of issuance of these financial statements, the Tender Offer has not been consummated.
Cresud Sociedad Anónima,
Comercial, Inmobiliaria, Financiera y Agropecuaria
Notes to Consolidated Financial Statements (Continued)
(All amounts in thousands of Argentine Pesos, except shares and per share data and as otherwise indicated)
9. | Interests in associates (Continued)
|
On May 12, 2014, IDBD’s shares became listed on the TASE. Consequently, all the shares (including the pledged shares) were deposited in escrow with Bank Leumi Le-Israel as security in compliance with the lock-up provisions set forth in Chapter D of the TASE Regulations, which provide that initially listed shares may not be disposed of for a term of 18 months and allow the release of 2.5% per month beginning on the fourth month since the initial listing date. Consequently, pursuant to the TASE´s regulations as of June 30, 2015 39,237,461 shares and 243,394 Series 3 warrants remained deposited as set forth above (including part of the pledged shares).
On December 29, 2014, Dolphin agreed to inject funds in IDBD, directly or through another company controlled by Eduardo S. Elsztain, for at least NIS 256 million and up to NIS 400 million, as follows: (i) NIS 256 million through the exercise of the New Rights arising from the Rights Offering by Dolphin; (ii) an additional investment (the “Additional Investment”) for an amount equivalent to (a) the Maximum Immediate Consideration (as such term is defined in note 3 to these financial statements), less (b) the amount received by IDBD under the Rights Offering, excluding the exercise of the new warrants, but in no case for an amount higher than NIS 144 million. The Additional Investment will be made by Dolphin or a vehicle controlled by Eduardo Sergio Elsztain exercising additional rights to be acquired by them or, if such rights are not acquired, by participating in another rights offering to be made by IDBD. On February 10, 2015, Dolphin subscribed a total of NIS 391.5 million, with a remaining contribution commitment of NIS 8.5 million.In addition, as set forth in Note 3 to these financial statements, Dolphin committed to (i) exercise the Series 4 warrants for a total amount of NIS 150 million if so requested by IDBD’s Board of Directors within 6 to 12 months of the Rights Offering date; and (ii) exercise the remaining Series 4, 5 and 6 warrants received under the Rights Offering, subject to the satisfaction of two conditions simultaneously: (a) that IDBD and its lenders reach an agreement to amend certain covenants; and (b) that a control permit over Clal is given by the Capital Markets, Insurance and Savings Commissioner of Israel.
Cresud Sociedad Anónima,
Comercial, Inmobiliaria, Financiera y Agropecuaria
Notes to Consolidated Financial Statements (Continued)
(All amounts in thousands of Argentine Pesos, except shares and per share data and as otherwise indicated)
9. | Interests in associates (Continued)
|
On May 6, 2015, Dolphin submitted to IDBD’s Board of Directors the following binding and irrevocable proposal. Following is a summary of the terms of the proposal:
(i)Appointment of Eduardo Sergio Elsztain as single Chairmen of IDBD’s Board of Directors;
(ii) Dolphin’s commitment (directly or through any vehicle controlled by Eduardo Sergio Elsztain) to accelerate its obligation to exercise the Series 4 warrants for NIS 150 million, and thus IDBD will have the possibility to require their exercise since May 20, 2015 instead of on July 19, 2015, provided that before May 20, 2015 (later it was clarified that this date would be no later than June 2, 2015) IDBD receives a written irrevocable commitment from the representatives of the bondholders to the effect that until July 20, 2015 they will not call a bondholders meeting (unless they are required to do so under the applicable laws) that includes in its agenda any of the following items:
(a)appointment of advisors (financial, legal or otherwise);
(b)appointment of a committee representing IDBD’s bondholders (as defined below);
(c)File legal actions against IDBD; and
(d)Request of an early or immediate payment of any indebtedness of IDBD.
Cresud Sociedad Anónima,
Comercial, Inmobiliaria, Financiera y Agropecuaria
Notes to Consolidated Financial Statements (Continued)
(All amounts in thousands of Argentine Pesos, except shares and per share data and as otherwise indicated)
9. Interests in associates (Continued)
(iii)IDBD’s Board of Directors should set up a committee composed of two members of IDBD’s monitoring committee and two members of IDBD’s board appointed by Dolphin, which shall have the following duties, subject to the applicable law (later it was clarified that such committee shall not have the authority to make any decisions but rather only to make recommendations to the Board of Directors):
(a)Manage, discuss, negotiate and conclude negotiations with the representatives of IDBD’s bondholders regarding their requests;
(b)Negotiate with IDBD’s financial creditors a new set of covenants for IDBD’s financial indebtedness; and
(c)Devise a business and financial plan for IDBD.
(iv)Dolphin (directly or through any vehicle controlled by Eduardo Sergio Elsztain), promises to submit offers to purchase IDBD in the public phase of the public offering at an amount of up to NIS 100 million at a price per share which is no less than the opening price in the public phase of the public offering and, subject to the following conditions, inter alia:
(a)That IDBD makes a public offering of its shares under terms acceptable to the market and approved by IDBD’s Board of Directors, for an amount of at least NIS 100 million and not to exceed NIS 125 million, and that the offering is made between October 1, 2015 and November 15, 2015.
(b)The commitment assumed by Dolphin would automatically expire upon the occurrence of any of the following events before the day of the public auction under the public offering: (i) if any of IDBD’s creditors or any of the representatives of IDBD’s bondholders files legal actions against IDBD, including a request for early or immediate repayment or acceleration of any portion of IDBD’s debt; (ii) if a meeting of any of IDBD’s bondholders is called including in its agenda any of the matters set forth in paragraph (ii); (iii) if IDBD receives capital contributions for a total amount of NIS 100 million in any manner, whether through a rights offering, the exercise of warrants, a private or public placement, and if such contributions are made by Dolphin directly or through any vehicle controlled by Eduardo Sergio Elsztain (apart from the capital contributions creditable against the remaining NIS 8.5 million obligation under Dolphin’s irrevocable proposal dated December 29, 2014), or by any other individual or legal entity, or the investor public, and at any event when the aggregate amount of such capital contributions under paragraph 5 (d) (iii) of the proposal so submitted is lower than NIS 100 million, Dolphin’s commitment under Section 5 (iv. a) above would be reduced accordingly; or (iv) if a material adverse event or change occurs in IDBD or its control structure or in any of its material affiliates.
On May 7, IDBD’s Board of Directors approved the proposal and Eduardo Sergio Elsztain was appointed sole Chairman of IDBD’s Board of Directors.
Cresud Sociedad Anónima,
Comercial, Inmobiliaria, Financiera y Agropecuaria
Notes to Consolidated Financial Statements (Continued)
(All amounts in thousands of Argentine Pesos, except shares and per share data and as otherwise indicated)
9. Interests in associates (Continued)
On June 3, 2015, pursuant to the original Dolphin proposal of December 29, 2014, as amended by paragraph (ii) of the proposal dated May 6, 2015, Dolphin exercised 44.2 million Series 4 warrants, while IFISA exercised the remaining Series 4 warrants required to complete the total NIS 150 million commitment. Therefore, the commitment was satisfied as of June 30, 2015.
On May 27, 2015, Dolphin submitted to the Arrangement Trustees an alternative proposal to the Tender Offers to be made (the “Tender Offer Alternative Proposal”) which mainly provided as follows:
- Replacement of the obligation to make Tender Offers in the market for a total of NIS 512 million pursuant to the Arrangement for Dolphin’s obligation to inject in IDBD NIS 512 million in two installments of NIS 256 million against the issuance of Bonds by the company.
- The NIS 512 million injected by Dolphin would be against IDBD Bonds for a principal amount of 512 million.
- Following the first injection of NIS 256 million, the shares currently pledged in favor of ETH would be assigned to Dolphin, plus 2.1 million additional shares in IDBD owned by ETH.
- After completion of the injection of NIS 512 million, all the shares to be acquired under the Tender Offer would be assigned to Dolphin. In addition, Dolphin would buy all shares and warrants of all remaining series of IDBD for a total amount of NIS 30 million and would inject NIS 20 million in IDBD against the issuance of Bonds for a principal amount of NIS 20 million in favor of the holders of the shares and warrants so purchased.
- The bonds to be purchased by Dolphin would have the following features (the “Bonds”):
• The principal amount would be repayable in six annual, equal installments, on December 15, 2022 through 2027.
• They would have a dividend coupon attached, accruing interest at 4% per annum, payable on a yearly basis.
• They would be indexed (principal amount and interest) according to the Israeli Price Index.
• They would not be secured by any collateral and would not have any preference over IDBD’s existing bonds.
- ETH would be able to participate on a joint and several basis in 50% of this Tender Offer Alternative Proposal.
The Tender Offer Alternative Proposal was rejected by the Arrangement Trustees and therefore, it is ineffective as of the date of these financial statements.
Cresud Sociedad Anónima,
Comercial, Inmobiliaria, Financiera y Agropecuaria
Notes to Consolidated Financial Statements (Continued)
(All amounts in thousands of Argentine Pesos, except shares and per share data and as otherwise indicated)
9. Interests in associates (Continued)
On June 29, 2015, Dolphin submitted an irrevocable proposal to IDBD and DIC (the “Proposal to IDBD and DIC”) which offered that, subject to its approval by the Boards of Directors of both companies, DIC would start as soon as possible a rights offering for up to approximately NIS 500 million (“DIC’s Rights Offering”) (equivalent to US$ 132.5 million at the exchange rate prevailing as of June 30, 2015). Under DIC’s Rights Offering, each shareholder of DIC would receive, for no consideration, DIC’s right units consisting of 4 series of warrants issued by DIC (which would be registered for trading in the TASE), each of which would be exercisable for one common share of DIC (“DIC’s Warrants”), with the following features:
- DIC’s Warrants would be divided into 4 series, and the exercise price of each of such series would be approximately NIS 125 million, as follows:
• The first series of warrants would be exercisable until December 21, 2015, for a price to be determined based on acceptable market conditions and after consultation with capital market experts, but in no case for a higher price than NIS 6.53 (“DIC’s 1 Warrants”).
• The second series of warrants would be exercisable until December 21, 2016, for an exercise price equivalent to 110% of DIC’s 1 Warrants’ exercise price.
• The third series of warrants would be exercisable until December 21, 2017, for an exercise price of: (i) 110% of DIC’s 1 Warrants’ exercise price, in the event they are exercised before December 21, 2016; or (ii) 120% of DIC’s 1 Warrants’ exercise price if they are exercised between December 21, 2016 and December 21, 2017.
• The fourth series of warrants would be exercisable until December 21, 2018, for an exercise price of: (i) 110% of DIC’s 1 Warrants’ exercise price, in the event they are exercised before December 21, 2016; or (ii) 130% of DIC’s 1 Warrants’ exercise price if they are exercised between December 21, 2016 and December 21, 2018.
- As part of DIC’s Rights Offering, IDBD would promise to exercise all DIC’s 1 Warrants issued in favor of IDBD, for a total amount of approximately NIS 92.5 million (“IDBD’s Investment Amount”) by December 21, 2015, provided that the following conditions have been satisfied as of such date:
• IDBD should have the written consent of IDBD’s main lenders for IDBD to exercise DIC’s 1 Warrants issued in its favor under DIC’s Rights Offering.
• IDBD should have conducted and completed a Rights Public Offering (as such term is defined below), under which it should have raised an amount of at least NIS 200 million.
• IDBD should have received the written consent of its main lenders in order for any amount injected as capital in IDBD after the date of such proposal in excess of NIS 100 million and up to NIS 350 million, to be used at any time for injection from IDBD into DIC, through any capital injection method.
• IDBD´s obligation expires upon the occurrence of any of the events which result in the expiration of Dolphin´s commitment pursuant to the proposal (as described below) or in case of a material adverse event or change occurs in IDBD or its control structure or in any of its material affiliates.
Cresud Sociedad Anónima,
Comercial, Inmobiliaria, Financiera y Agropecuaria
Notes to Consolidated Financial Statements (Continued)
(All amounts in thousands of Argentine Pesos, except shares and per share data and as otherwise indicated)
9. | Interests in associates (Continued)
|
In turn, Dolphin proposes the following to IDBD:
- IDBD’s public offering amount under Dolphin’s proposal dated May 6 would be increased by at least NIS 100 million and up to NIS 125 million (the “Rights Public Offering under the Proposal to IDBD and DIC”). In other words, the total amount would be increased from a minimum of NIS 100 million to a minimum of NIS 200 million, and the maximum amount would be increased from a maximum of NIS 125 million to a maximum of NIS 250 million (the “Total Increased Amount”).
- Therefore, Dolphin’s obligation to participate in the Rights Public Offering under the Proposal to IDBD and DIC would be increased (compared to the proposal dated May 6, 2015) by an amount equal to the difference between the Total Increased Amount and the total amount of commitments received, always provided that such amount were not higher than NIS 200 million (the “Capital Contribution Amount”).
- The approval of this proposal would constitute IDBD’s confirmation and approval that all of Dolphin’s commitments under this proposal would imply the full and complete settlement of its remaining obligations to inject NIS 8.5 million in IDBD, pursuant to Dolphin’s irrevocable proposal dated December 29, 2014 (provided however that Dolphin shall participate in an amount exceeding NIS 8.5 million).
- The amount mention in section 5(d)(iii) of the May 6 proposal shall be NIS 200 million. Dolphin’s commitment would automatically expire upon the occurrence of any of the following events: (i) if any of DIC’s creditors or any of the trustees of DIC’s bonds filed any legal action against DIC, including a request for the early repayment or acceleration of any portion of DIC’s debt; and/or (ii) if any meeting of DIC’s bondholders included in its agenda any or many of the following matters: (a) appointment of advisers (financial, legal or otherwise); (b) appointment of a committee of representatives of DIC’s bondholders; (c) filing of any legal action against DIC; and/or (d) requests for early or immediate repayment of any portion of DIC’s debt, or any similar discussion.
The Proposal to IDBD and DIC was binding and irrevocable, and it was valid up to July 13, 2015 (later extended to July 16, 2015)and expired on such date if the Boards of Directors of IDBD and DIC did not accept it and approve it unconditionally (in this regard, see note on subsequent events). The Proposal to IDBD and DIC was approved by IDBD’s Board of Directors on July 16, 2015.
On July 9 and 16, 2015, Dolphin submitted clarifications on the Proposal to IDBD and DIC. For further information, see note on subsequent events in these financial statements.
9. | Interests in associates (Continued)
|
Class Action Claim
In June 2015, an application for the court to approve the commencement of a class action (the “Class Action”) was filed by four individuals who were among the creditors of IDBH that were entitled to participate in IDBH’s approved Arrangement and the Rights Offerings made in 2014 and 2015.
The Class action was filed before the applicable courts of Israel against IDBD, Dolphin, Eduardo Sergio Elsztain, ETH and Mordechay Ben Moshe (in their capacities as controlling shareholders of IDBD) and against the members of IDBD’s Board of Directors who were in office between 2014 and 2015. The amount of the claim is NIS 1,048 million (equivalent to US$ 277.6 million as of June 30, 2015).
As concerns the legal action, pursuant to the applicable laws the proceedings are divided into two stages: (i) the preliminary stage, in which the plaintiff pleads the court to allow the complaint as a class action; and (ii) the certification stage, in which the plaintiff shall prove by producing reasonable evidence that it satisfies the minimum requirements for the class action to qualify as such pursuant to the applicable laws. If such requirements are met and the case is admitted as a class action, the substantive proceedings will start.
At present, the Class Action is at the certification stage.
Pursuant to the applicable laws the defendants have a 90-day term to file its defense (such term does not include the period from July 21 to September 5, 2015, when the Israeli courts are on recess).
Based on the Israeli legal counsel, it is more likely than not that the Class Action will be dismissed against Dolphin.
In the application for Class Action, the plaintiffs argued that IDBD’s controlling shareholders and its Board of Directors acted in concert to frustrate the sale of Clal’s shares to JT Capital Fund (“JT”) and privileged their own interests, causing them material damages as under the terms of the Arrangement they would have been entitled to receive a larger payment had the above mentioned sale been consummated.
In addition, they sustain that the Rights Offerings made in 2014 and 2015 discriminated against the minority shareholders and were carried out without obtaining the required consents (given the personal interest of the controlling shareholders), resulting in the dilution of plaintiffs’ rights’ economic value.
Cresud Sociedad Anónima,
Comercial, Inmobiliaria, Financiera y Agropecuaria
Notes to Consolidated Financial Statements (Continued)
(All amounts in thousands of Argentine Pesos, except shares and per share data and as otherwise indicated)
9. | Interests in associates (Continued)
|
BHSA
In accordance with the regulations of the “BCRA”, there are certain restrictions on the distribution of profits by BHSA.
As of June 30, 2015, BHSA has a remainder of 36.6 million Class C shares Ps. 1 par value received in 2009 as a result of certain financial transactions. The General Shareholders’ Meeting decided to allocate 35.1 million of such shares, to an employee compensation plan pursuant to Section 67 of Law 26,831. The remaining 1.5 million shares belong to third party holders of Stock Appreciation Rights, who had failed to produce the documentation required for redemption purposes. As of June 30, 2015, excluding said treasury stock, the Group’s interest in BHSA amounts to 29.99% (or to 30.74%, including said treasury stock).
Information about significant associates
Set out below are the summarized financial information for each associate considered to be material to the Group as of June 30, 2015 and 2014:
Summarized statements of financial position
| | | BHSA | | | | | June 30, 2015 | | | June 30, 2014 | | | Assets | | | | | | | | Total Non-current assets | | | 10,233,808 | | | | 8,794,304 | | | Current | | | | | | | | | | Cash and cash equivalents | | | 3,312,594 | | | | 3,111,615 | | | Other assets | | | 21,537,466 | | | | 15,432,874 | | | Total current assets | | | 24,850,060 | | | | 18,544,489 | | | Total Assets | | | 35,083,868 | | | | 27,338,793 | | | Liabilities | | | | | | | | | | Non-current | | | | | | | | | | Financial liabilities (i) | | | 3,625,045 | | | | 4,208,630 | | | Other liabilities | | | 100,132 | | | | (129,996 | ) | | Total non-current liabilities | | | 3,725,177 | | | | 4,078,634 | | | Current | | | | | | | | | | Financial liabilities (i) | | | 25,775,030 | | | | 18,140,073 | | | Other liabilities | | | 1,117,945 | | | | 1,095,056 | | | Total current liabilities | | | 26,892,975 | | | | 19,235,129 | | | Total Liabilities | | | 30,618,152 | | | | 23,313,763 | | | Net assets | | | 4,465,716 | | | | 4,025,030 | | | Non-controlling interest | | | 68,147 | | | | 50,662 | | | Net assets attributable to equity holders of the parent | | | 4,397,569 | | | | 3,974,368 | |
(i) | Excluding trade and other payables and provisions. |
Cresud Sociedad Anónima,
Comercial, Inmobiliaria, Financiera y Agropecuaria
Notes to Consolidated Financial Statements (Continued)
(All amounts in thousands of Argentine Pesos, except shares and per share data and as otherwise indicated)
9. | Interests in associates (Continued)
|
Summarized statement of comprehensive income
| | | BHSA | | | | | June 30, 2015 | | | June 30, 2014 | | | Revenues | | | 4,499,581 | | | | 3,046,657 | | | Depreciation and amortization | | | (140,747 | ) | | | (86,035 | ) | | Interest income | | | 4,215,729 | | | | 3,729,649 | | | Interest expense | | | (2,785,449 | ) | | | (2,059,377 | ) | | Allowances for doubtful accounts | | | (343,471 | ) | | | (333,025 | ) | | Administrative expenses | | | (3,273,162 | ) | | | (2,297,449 | ) | | Other expenses | | | (1,211,684 | ) | | | (1,022,315 | ) | | Other earnings, net | | | (145,254 | ) | | | (94,463 | ) | | Income tax expense | | | (354,828 | ) | | | (301,273 | ) | | Profit for the year | | | 460,715 | | | | 582,369 | | | Other comprehensive income | | | - | | | | 14,760 | | | Total other comprehensive income for the year | | | 460,715 | | | | 597,129 | | | Profit attributable to non-controlling interest | | | (4,303 | ) | | | (9,760 | ) | | Dividends received | | | 12,873 | | | | 9,144 | |
The information above reflects the amounts presented in the financial statements of the associates (and not the Group’s share of those amounts) adjusted for differences in the Group's accounting policies and fair value adjustments made at the time of the acquisition.
Reconciliation between the summarized financial information presented regarding the carrying amount of the Group’s interest in material associates is as follows:
| | | BHSA | | | | | June 30, 2015 | | | June 30, 2014 | | | Net assets at beginning of the year | | | 3,974,368 | | | | 3,397,479 | | | Profit for the year | | | 465,018 | | | | 592,129 | | | Other comprehensive income | | | - | | | | 14,760 | | | Dividend distribution | | | (41,817 | ) | | | (30,000 | ) | | Net assets at end of the year | | | 4,397,569 | | | | 3,974,368 | | | Ownership interest | | | 30.74 | % | | | 30.51 | % | | Investment in associates | | | 1,351,718 | | | | 1,212,781 | | | Goodwill | | | 4,904 | | | | 30,177 | | | Fair value adjustment on acquisition of associate | | | 5 | | | | (1,457 | ) | | Intergroup transactions | | | (385 | ) | | | (31,333 | ) | | Net book amount at year-end | | | 1,356,242 | | | | 1,210,168 | |
Cresud Sociedad Anónima,
Comercial, Inmobiliaria, Financiera y Agropecuaria
Notes to Consolidated Financial Statements (Continued)
(All amounts in thousands of Argentine Pesos, except shares and per share data and as otherwise indicated)
9. | Interests in associates (Continued)
|
The fair value of the Group’s investment in BHSA was estimated based on the present value of future business cash flows. The premises used to calculate the fair value as of June 30, 2015 were the following:
-The Group considered the period 2016-2023 as horizon for the projection of BHSA cash flows. Cash flows were projected based on the business plan filed with BCRA, as indicated by Argentine applicable regulations. Cash flows assume an annual growth based on historic performance of bank, market research and peer information, among others. On the other hand, perpetuity was computed at decreasing rates over the first years after 2023, and is later stabilized in the long term.
-Projected cash flows include interest income resulting from the main source of income of BHSA, including income resulting from mortgage loans, personal loans, credit cards and corporate loans. In addition, cash flows include interest expenses related to client deposits, which volumes were determined based on current demand, percentage of market share and competition as of June 30, 2015. To estimate such projections, a financial model was used where the business plan abovementioned was the starting point.
-The “Private BADLAR” interest rate was projected based on internal data and information gathered from external consultants. The “Private BADLAR” is the average of interest rates paid by financial entities on term deposits of more than 1 million pesos, with maturities of 30 to 35 days. This rate is calculated daily by the BCRA based on a survey that includes interest rate data provided by the main banks and financial institutions in the City of Buenos Aires and Gran Buenos Aires (C.A.B.A. and G.B.A. as per their Spanish acronyms). The “Private BADLAR” is the most representative interest rate in the Argentine financial system.
-The projected exchange rate was estimated in accordance with internal data and external information provided by independent consultants.
-Projected cash flows include the amortization of a revolving loan of BHSA.
-Projections consider capital requirements as per BCRA regulations.
Cresud Sociedad Anónima,
Comercial, Inmobiliaria, Financiera y Agropecuaria
Notes to Consolidated Financial Statements (Continued)
(All amounts in thousands of Argentine Pesos, except shares and per share data and as otherwise indicated)
9. | Interests in associates (Continued)
|
-Projected cash flows are stated in Pesos in real terms, deflated pursuant to inflation projections estimated by BHSA.
- The discount rate used to discount real dividend flows and calculate the fair value is 15.97%.
Based on the described premises, the Group estimated the fair value of its investment in BHSA as of June 30, 2015 to be Ps. 3,389.7 million.
IDBD
| | | IDBD (in millions of pesos) | | | | | June 30, 2015 | | | June 30, 2014 | | | Assets | | | | | | | | Non-current assets | | | | | | | | Investments in associates | | | 8,866 | | | | 9,118 | | | Other investments and derivative financial instruments | | | 833 | | | | 5,856 | | | Property, plant and equipment | | | 13,450 | | | | 12,791 | | | Investment properties | | | 27,299 | | | | 24,317 | | | Intangible assets | | | 11,419 | | | | 12,580 | | | Other non-current assets | | | 3,068 | | | | 3,375 | | | Total Non-current assets | | | 64,935 | | | | 68,037 | | | Current assets | | | | | | | | | | Other investments and derivative financial instruments | | | 5,251 | | | | 8,354 | | | Trade receivables | | | 6,101 | | | | 6,878 | | | Cash and cash equivalents | | | 8,375 | | | | 10,829 | | | Other current assets | | | 10,617 | | | | 5,762 | | | Total current assets | | | 30,344 | | | | 31,823 | | | Total assets | | | 95,279 | | | | 99,860 | | | Liabilities | | | | | | | | | | Non-current liabilities | | | | | | | | | | Obligations | | | 41,961 | | | | 45,756 | | | Bank loans and other financial liabilities | | | 7,553 | | | | 6,747 | | | Financial instruments | | | 7,274 | | | | 8,072 | | | Other non-current liabilities | | | 4,896 | | | | 4,767 | | | Total Non-current Liabilities | | | 61,684 | | | | 65,342 | | | Current Liabilities | | | | | | | | | | Obligations | | | 7,002 | | | | 7,899 | | | Bank loans and other financial liabilities | | | 5,338 | | | | 6,340 | | | Trade and other payables | | | 6,053 | | | | 5,923 | | | Other current liabilities | | | 5,816 | | | | 6,502 | | | Total current liabilities | | | 24,209 | | | | 26,664 | | | Total liabilities | | | 85,893 | | | | 92,006 | | | Net assets | | | 9,386 | | | | 7,854 | | | Non-controlling interest | | | 8,526 | | | | 8,643 | | | Net assets of the parent | | | 860 | | | | (789 | ) |
Cresud Sociedad Anónima,
Comercial, Inmobiliaria, Financiera y Agropecuaria
Notes to Consolidated Financial Statements (Continued)
(All amounts in thousands of Argentine Pesos, except shares and per share data and as otherwise indicated)
9. | Interests in associates (Continued)
|
| | | IDBD (in millions of pesos) | | | | | June 30, 2015 (period of twelve months) | | | June 30, 2014 (period of six months) | | | Net cash generated by operating activities | | | 2,909 | | | | 3,346 | | | Net cash generated by investing activities | | | 1,389 | | | | 4,228 | | | Net cash used in financing activities | | | (4,505 | ) | | | (11,805 | ) | | Net decrease in cash and cash equivalents | | | (207 | ) | | | (4,231 | ) | | | | | | | | | | | | Net decrease in cash and cash equivalents from continuing operations | | | (207 | ) | | | (6,935 | ) | | Net increase in cash and cash equivalents from discontinued operations | | | - | | | | 2,704 | | | Net decrease in cash and cash equivalents | | | (207 | ) | | | (4,231 | ) | | | | | | | | | | | | Cash and cash equivalents at beginning of the year | | | 8,480 | | | | 11,870 | | | Foreign exchange gain on cash and cash equivalents | | | 107 | | | | 2,846 | | | Changes in cash included in assets held for sale | | | (5 | ) | | | 344 | | | Cash and cash equivalents at end of the year | | | 8,375 | | | | 10,829 | |
| | | IDBD (in millions of pesos) | | | | | June 30, 2015 (period of twelve months) | | | June 30, 2014 (period of six months) | | | Gross profit | | | 7,316 | | | | 9,564 | | | Profit before income tax | | | 945 | | | | 1,013 | | | Income tax | | | (232 | ) | | | (592 | ) | | Profit from continuing operations | | | 713 | | | | 421 | | | Profit from discontinued operations | | | - | | | | 144 | | | Net income for the year | | | 713 | | | | 565 | | | Other comprehensive (loss) / income | | | (562 | ) | | | 221 | | | Total comprehensive income for the year | | | 151 | | | | 786 | | | Profit attributable to non-controlling interest | | | 140 | | | | 833 | |
Cresud Sociedad Anónima,
Comercial, Inmobiliaria, Financiera y Agropecuaria
Notes to Consolidated Financial Statements (Continued)
(All amounts in thousands of Argentine Pesos, except shares and per share data and as otherwise indicated)
10. | Investment properties |
Changes in the Group’s investment properties for the year ended June 30, 2015 and 2014 are as follows:
| | | Shopping Center | | | Office buildings and other rental properties | | | Undeveloped parcels of land | | | Leased out farmland | | | Properties under development | | | Total | | | Year ended June 30, 2014 | | | | | | | | | | | | | | | | | | | | Opening net book amount | | | 1,890,531 | | | | 1,630,509 | | | | 421,240 | | | | 42,998 | | | | 186,123 | | | | 4,171,401 | | | Additions | | | 61,108 | | | | 23,988 | | | | 454 | | | | 7,069 | | | | 156,927 | | | | 249,546 | | | Reclassification to available for sale | | | - | | | | (1,098,990 | ) | | | - | | | | - | | | | - | | | | (1,098,990 | ) | | Reclassification to property, plant and equipment | | | - | | | | (12,231 | ) | | | - | | | | (3,657 | ) | | | - | | | | (15,888 | ) | | Reclassifications of trading properties | | | - | | | | 251 | | | | 1,550 | | | | - | | | | (803 | ) | | | 998 | | | Capitalized borrowing costs | | | - | | | | - | | | | - | | | | - | | | | 22,376 | | | | 22,376 | | | Disposals | | | (35 | ) | | | (51,457 | ) | | | - | | | | (1,080 | ) | | | (766 | ) | | | (53,338 | ) | | Depreciation charge (i) | | | (134,325 | ) | | | (68,529 | ) | | | - | | | | (2,134 | ) | | | - | | | | (204,988 | ) | | Currency translation adjustment | | | - | | | | 375,261 | | | | - | | | | 8,238 | | | | - | | | | 383,499 | | | Transfers | | | (25,332 | ) | | | 27,056 | | | | (1,724 | ) | | | - | | | | - | | | | - | | | Closing net book amount | | | 1,791,947 | | | | 825,858 | | | | 421,520 | | | | 51,434 | | | | 363,857 | | | | 3,454,616 | | | As of June 30, 2014 | | | | | | | | | | | | | | | | | | | | | | | | | | Cost | | | 3,166,103 | | | | 1,077,824 | | | | 421,520 | | | | 51,434 | | | | 363,857 | | | | 5,080,738 | | | Accumulated depreciation | | | (1,374,156 | ) | | | (251,966 | ) | | | - | | | | - | | | | - | | | | (1,626,122 | ) | | Net book amount | | | 1,791,947 | | | | 825,858 | | | | 421,520 | | | | 51,434 | | | | 363,857 | | | | 3,454,616 | | | Year ended June 30, 2015 | | | | | | | | | | | | | | | | | | | | | | | | | | Opening net book amount | | | 1,791,947 | | | | 825,858 | | | | 421,520 | | | | 51,434 | | | | 363,857 | | | | 3,454,616 | | | Additions | | | 60,361 | | | | 5,893 | | | | 1,569 | | | | 8,354 | | | | 173,500 | | | | 249,677 | | | Transfers | | | 491,047 | | | | 23,080 | | | | 25,331 | | | | - | | | | (539,458 | ) | | | - | | | Reclassifications to trading properties | | | (3,107 | ) | | | - | | | | - | | | | - | | | | - | | | | (3,107 | ) | | Reclassification to property, plant and equipment | | | (140 | ) | | | (8,305 | ) | | | - | | | | (11,732 | ) | | | (8,779 | ) | | | (28,956 | ) | | Reclassification of property, plant and equipment | | | - | | | | 20,224 | | | | - | | | | 40,521 | | | | - | | | | 60,745 | | | Capitalized borrowing costs | | | - | | | | - | | | | - | | | | - | | | | 12,957 | | | | 12,957 | | | Disposals | | | (114 | ) | | | (102,599 | ) | | | (3,251 | ) | | | (192 | ) | | | (2,077 | ) | | | (108,233 | ) | | Depreciation charge (i) | | | (124,790 | ) | | | (26,769 | ) | | | - | | | | (5,237 | ) | | | - | | | | (156,796 | ) | | Currency translation adjustment | | | - | | | | - | | | | - | | | | (5,944 | ) | | | - | | | | (5,944 | ) | | Closing net book amount | | | 2,215,204 | | | | 737,382 | | | | 445,169 | | | | 77,204 | | | | - | | | | 3,474,959 | | | As of June 30, 2015 | | | | | | | | | | | | | | | | | | | | | | | | | | Cost | | | 3,736,761 | | | | 1,028,507 | | | | 445,169 | | | | 77,204 | | | | - | | | | 5,287,641 | | | Accumulated depreciation | | | (1,521,557 | ) | | | (291,125 | ) | | | - | | | | - | | | | - | | | | (1,812,682 | ) | | Net book amount | | | 2,215,204 | | | | 737,382 | | | | 445,169 | | | | 77,204 | | | | - | | | | 3,474,959 | |
(i) | Depreciation charge of investment property has been charged in “Costs” in the income statements (Note 33). |
Cresud Sociedad Anónima,
Comercial, Inmobiliaria, Financiera y Agropecuaria
Notes to Consolidated Financial Statements (Continued)
(All amounts in thousands of Argentine Pesos, except shares and per share data and as otherwise indicated)
10. | Investment properties (Continued)
|
The following amounts have been recognized in the income statements:
| | | June 30, 2015 | | | June 30, 2014 | | | June 30, 2013 | | | Rental and service income | | | 2,994,947 | | | | 2,450,399 | | | | 1,935,275 | | | Direct operating expenses | | | 1,234,538 | | | | 1,142,405 | | | | 915,117 | | | Development expenses | | | 4,106 | | | | 1,671 | | | | 1,884 | | | Gain from disposal of investment properties | | | 1,150,230 | | | | 230,918 | | | | 177,999 | |
Borrowing costs incurred during the fiscal years ended June 30, 2015, 2014 and 2013 were Ps. 12,957, Ps. 22,376 and Ps. 10,307 respectively, capitalized at the rate of the Group's general borrowings, which amounts to 15%. Those costs correspond to Distrito Arcos, Alto Comahue and Soleil Premium Outlet. Capitalization of financial costs has ceased since the completion of the shopping mall.
Certain of the Group’s investment properties have been mortgaged or otherwise restricted to secure some of the Group’s borrowings and other payables. The net book value of the Group´s investment properties as of June 30, 2015 and 2014 is as follows:
| | | June 30, 2015 | | | June 30, 2014 | | | Soleil Premium Outlet (i) | | | - | | | | 88,634 | | | Córdoba Shopping (ii) | | | 61,111 | | | | 64,951 | | | Total | | | 61,111 | | | | 153,585 | |
(i) | On August 22, 2014, IRSA Propiedades Comerciales S.A. paid the remaining balance of the purchase price for the shopping center known as “Soleil Premium Outlet” in the amount of Ps. 105.8 million (US$ 12.6 million plus interest). As a result, the mortgage granted in favor of INC S.A. was fully discharged. |
(ii) | A portion of the Córdoba Shopping center property is encumbered with an antichresis right as collateral for a debt amounting to Ps. 11.3 and Ps. 13.2 million as of June 30, 2015 and 2014, respectively. The debt is included in "Trade and other payables" in the statement of financial position. |
Cresud Sociedad Anónima,
Comercial, Inmobiliaria, Financiera y Agropecuaria
Notes to Consolidated Financial Statements (Continued)
(All amounts in thousands of Argentine Pesos, except shares and per share data and as otherwise indicated)
10. | Investment properties (Continued)
|
As of June 30, 2015 and 2014, the fair value of investment properties amounts to Ps. 22,445.8 million and Ps. 19,554.5 million, respectively. The fair values are based on comparable values of certain qualified external appraisers (Level 2 of fair value hierarchy) except in the case of shopping centers, where fair value is based on the market capitalization valuation (Level 3 of the fair value hierarchy). In the first case, sale prices of comparable properties are adjusted considering the specific aspects of each property, the most relevant premise being the price for m2 (square meter). In the second case, the capitalization rates used also take into account specific aspects of each property. See Note 5.(b).
Cresud Sociedad Anónima,
Comercial, Inmobiliaria, Financiera y Agropecuaria
Notes to Consolidated Financial Statements (Continued)
(All amounts in thousands of Argentine Pesos, except shares and per share data and as otherwise indicated)
| 10. | Investment properties (Continued)
|
| | | | | | Initial costs | | | Subsequent costs | | | Costs at year-end | | | | | | | | | | | | | | | | Name | | Encumbrances | | | Plot of land | | | Buildings, facilities and improvements (i) | | | Improvements / Additions / Disposals / Transfers | | | Plot of land | | | Buildings, facilities and improvements | | | Total | | | Accumulated depreciation | | | Net book value | | | Date of construction | | Date of acquisition | | Useful life for calculating depreciation | | | Shopping Center Properties: | | | | | | | | | | | | | | | | | | | | | | | | | | | | | | | | | | | | Abasto de Buenos Aires | | | - | | | | 9,754 | | | | 455,787 | | | | 10,552 | | | | 9,754 | | | | 466,339 | | | | 476,093 | | | | (204,233 | ) | | | 271,860 | | | nov-98 | | jul-94 | | | 17 | | | Alto Palermo Shopping | | | - | | | | 8,695 | | | | 583,834 | | | | 13,608 | | | | 8,695 | | | | 597,442 | | | | 606,137 | | | | (384,631 | ) | | | 221,506 | | | oct-90 | | nov-97 | | | 15 | | | Alto Avellaneda | | | - | | | | 18,089 | | | | 312,584 | | | | 22,073 | | | | 18,089 | | | | 334,657 | | | | 352,746 | | | | (220,896 | ) | | | 131,850 | | | oct-95 | | dec-97 | | | 12 | | | Paseo Alcorta | | | - | | | | 8,006 | | | | 193,528 | | | | 12,128 | | | | 8,006 | | | | 205,656 | | | | 213,662 | | | | (97,712 | ) | | | 115,950 | | | jun-92 | | jun-97 | | | 16 | | | Alto Noa | | | - | | | | 227 | | | | 72,044 | | | | 2,706 | | | | 227 | | | | 74,750 | | | | 74,977 | | | | (43,661 | ) | | | 31,316 | | | sep-94 | | mar-95 | | | 14 | | | Buenos Aires Design | | | - | | | | - | | | | 75,156 | | | | 9,332 | | | | - | | | | 84,488 | | | | 84,488 | | | | (71,558 | ) | | | 12,930 | | | nov-93 | | nov-97 | | | 3 | | | Patio Bullrich | | | - | | | | 9,814 | | | | 206,956 | | | | 7,840 | | | | 9,814 | | | | 214,796 | | | | 224,610 | | | | (118,362 | ) | | | 106,248 | | | sep-88 | | oct-98 | | | 17 | | | Alto Rosario | | | - | | | | 25,686 | | | | 139,262 | | | | 3,237 | | | | 25,686 | | | | 142,499 | | | | 168,185 | | | | (52,277 | ) | | | 115,908 | | | nov-04 | | nov-04 | | | 19 | | | Mendoza Plaza | | | - | | | | 10,546 | | | | 174,705 | | | | 14,210 | | | | 10,546 | | | | 188,915 | | | | 199,461 | | | | (96,680 | ) | | | 102,781 | | | jun-94 | | dec-94 | | | 16 | | | Dot Baires Shopping | | | - | | | | 84,890 | | | | 328,443 | | | | 89,632 | | | | 53,462 | | | | 449,503 | | | | 502,965 | | | | (120,341 | ) | | | 382,624 | | | may-09 | | nov-06 | | | 26 | | | Córdoba Shopping | | Antichresis | | | | 5,009 | | | | 103,629 | | | | (352 | ) | | | 5,009 | | | | 103,277 | | | | 108,286 | | | | (51,835 | ) | | | 56,451 | | | mar-90 | | dec-06 | | | 15 | | | Distrito Arcos | | | - | | | | - | | | | - | | | | 236,656 | | | | - | | | | 236,656 | | | | 236,656 | | | | (6,856 | ) | | | 229,800 | | | | - | | nov-09 | | | 31 | | | Alto Comahue | | | - | | | | 1,143 | | | | 11,139 | | | | 302,639 | | | | 1,143 | | | | 313,778 | | | | 314,921 | | | | (4,962 | ) | | | 309,959 | | | | - | | may-06 | | | 22 | | | Patio Olmos | | | - | | | | 11,532 | | | | 22,212 | | | | - | | | | 11,532 | | | | 22,212 | | | | 33,744 | | | | (6,425 | ) | | | 27,319 | | | may-95 | | sep-07 | | | 17 | | | Soleil Factory | | | - | | | | 23,267 | | | | 55,905 | | | | 36,113 | | | | 23,267 | | | | 92,018 | | | | 115,285 | | | | (30,984 | ) | | | 84,301 | | | | - | | jul-10 | | | 9 | | | Ocampo parking spaces | | | - | | | | 3,201 | | | | 21,137 | | | | 207 | | | | 3,201 | | | | 21,344 | | | | 24,545 | | | | (10,144 | ) | | | 14,401 | | | | | | sep-06 | | | 23 | | | Total Shopping Center Properties | | | | | | | 219,859 | | | | 2,756,321 | | | | 760,581 | | | | 188,431 | | | | 3,548,330 | | | | 3,736,761 | | | | (1,521,557 | ) | | | 2,215,204 | | | | | | | | | | |
Cresud Sociedad Anónima,
Comercial, Inmobiliaria, Financiera y Agropecuaria
Notes to Consolidated Financial Statements (Continued)
(All amounts in thousands of Argentine Pesos, except shares and per share data and as otherwise indicated)
| 10. | Investment properties (Continued)
|
| | | | | | Initial costs | | | Subsequent costs | | | Costs at year-end | | | | | | | | | | | | | | | | | | Name | | Encumbrances | | | Plot of land | | | Buildings, facilities and improvements (i) | | | Improvements / Additions / Disposals / Transfers | | | Plot of land | | | Buildings, facilities and improvements | | | Total | | | Accumulated depreciation | | | Net book value | | | Date of construction | | | Date of acquisition | | | Useful life for calculating depreciation | | | Office buildings and Other Rental Properties portfolio: | | | | | | | | | | | | | | | | | | | | | | | | | | | | | | | | | | | | | | Bouchard 551 | | | - | | | | 4,963 | | | | 10,322 | | | | (4,389 | ) | | | 4,963 | | | | 5,933 | | | | 10,896 | | | | (2,670 | ) | | | 8,226 | | | | - | | | mar-07 | | | | 29 | | | Bouchard 710 | | | - | | | | 40,167 | | | | 50,290 | | | | 129 | | | | 40,167 | | | | 50,419 | | | | 90,586 | | | | (8,542 | ) | | | 82,044 | | | | - | | | jun-05 | | | | 26 | | | Dique IV | | | - | | | | 3,660 | | | | 68,921 | | | | 1,941 | | | | 3,660 | | | | 70,862 | | | | 74,522 | | | | (18,256 | ) | | | 56,266 | | | apr-09 | | | | - | | | | 32 | | | Intercontinental Plaza | | | - | | | | 2,811 | | | | 59,155 | | | | (4,159 | ) | | | 2,811 | | | | 54,996 | | | | 57,807 | | | | (9,024 | ) | | | 48,783 | | | jun-96 | | | nov-97 | | | | 24 | | | Libertador 498 | | | - | | | | 1,088 | | | | 5,419 | | | | 874 | | | | 1,088 | | | | 6,293 | | | | 7,381 | | | | (2,870 | ) | | | 4,511 | | | | - | | | dec-95 | | | | 23 | | | Madero 1020 | | | - | | | | 70 | | | | 350 | | | | - | | | | 70 | | | | 350 | | | | 420 | | | | (300 | ) | | | 120 | | | | - | | | dec-95 | | | | 5 | | | Maipú 1300 | | | - | | | | 4,992 | | | | 28,468 | | | | (1,189 | ) | | | 4,992 | | | | 27,279 | | | | 32,271 | | | | (13,905 | ) | | | 18,366 | | | | - | | | sep-95 | | | | 22 | | | Rivadavia 2768 | | | - | | | | 88 | | | | 751 | | | | 1 | | | | 88 | | | | 752 | | | | 840 | | | | (506 | ) | | | 334 | | | jun-95 | | | sep-91 | | | | 12 | | | Suipacha 652 | | | - | | | | 2,712 | | | | 13,290 | | | | 1,019 | | | | 2,712 | | | | 14,309 | | | | 17,021 | | | | (3,310 | ) | | | 13,711 | | | jun-94 | | | nov-91 | | | | 10 | | | Torre BankBoston | | | - | | | | 78,362 | | | | 58,750 | | | | - | | | | 78,362 | | | | 58,750 | | | | 137,112 | | | | (2,188 | ) | | | 134,924 | | | | - | | | aug-07 | | | | 27 | | | República Building | | | - | | | | 111,070 | | | | 90,581 | | | | 96 | | | | 111,070 | | | | 90,677 | | | | 201,747 | | | | (6,208 | ) | | | 195,539 | | | | - | | | apr-08 | | | | 26 | | | Constitución 1111 | | | - | | | | 256 | | | | 1,084 | | | | - | | | | 256 | | | | 1,084 | | | | 1,340 | | | | (656 | ) | | | 684 | | | mar-95 | | | jun-94 | | | | 21 | | | La Adela | | | - | | | | 10,155 | | | | - | | | | - | | | | 10,155 | | | | - | | | | 10,155 | | | | - | | | | 10,155 | | | | - | | | jul-14 | | | | - | | | Edificio Dot | | | - | | | | 13,346 | | | | 75,482 | | | | 54,466 | | | | 44,775 | | | | 98,519 | | | | 143,294 | | | | (16,929 | ) | | | 126,365 | | | | - | | | nov-06 | | | | 30 | | | Anchorena 559 | | | - | | | | 3,018 | | | | 14,851 | | | | - | | | | 3,018 | | | | 14,851 | | | | 17,869 | | | | (4,697 | ) | | | 13,172 | | | | - | | | agu-08 | | | | - | | | Zelaya 310, 3103 and 3105 | | | - | | | | 1,723 | | | | - | | | | - | | | | 1,723 | | | | - | | | | 1,723 | | | | - | | | | 1,723 | | | | - | | | jul-05 | | | | - | | | Abasto offices | | | - | | | | - | | | | 40 | | | | 14,288 | | | | - | | | | 14,328 | | | | 14,328 | | | | (3,216 | ) | | | 11,112 | | | mar-13 | | | nov-12 | | | | 17 | | | Santa María del Plata | | | - | | | | 12,494 | | | | 46 | | | | 30 | | | | 12,500 | | | | 70 | | | | 12,570 | | | | (28 | ) | | | 12,542 | | | | - | | | jun-97 | | | | - | | | Alto Palermo Shopping Annex | | | - | | | | - | | | | 38,201 | | | | - | | | | - | | | | 38,201 | | | | 38,201 | | | | (5,659 | ) | | | 32,542 | | | | - | | | jun-06 | | | | 9 | | | Office buildings and Other Rental Properties portfolio | | | | | | | 290,975 | | | | 516,001 | | | | 63,107 | | | | 322,410 | | | | 547,673 | | | | 870,083 | | | | (98,964 | ) | | | 771,119 | | | | | | | | | | | | | |
Cresud Sociedad Anónima,
Comercial, Inmobiliaria, Financiera y Agropecuaria
Notes to Consolidated Financial Statements (Continued)
(All amounts in thousands of Argentine Pesos, except shares and per share data and as otherwise indicated)
| 10. | Investment properties (Continued)
|
| | | | | | Initial costs | | | Subsequent costs | | | Costs at year-end | | | | | | | | | | | | | | | | | | Name | | Encumbrances | | | Plot of land | | | Buildings, facilities and improvements (i) | | | Improvements / Additions / Disposals / Transfers | | | Plot of land | | | Buildings, facilities and improvements | | | Total | | | Accumulated depreciation | | | Net book value | | | Date of construction | | | Date of acquisition | | | Useful life for calculating depreciation | | | Undeveloped parcels of lands: | | | | | | | | | | | | | | | | | | | | | | | | | | | | | | | | | | | | | | DOT Annex | | | - | | | | 25,336 | | | | - | | | | - | | | | 25,336 | | | | - | | | | 25,336 | | | | - | | | | 25,336 | | | | - | | | nov-06 | | | | - | | | Santa María del Plata | | | - | | | | 158,523 | | | | 63,836 | | | | 428 | | | | 158,951 | | | | 63,836 | | | | 222,787 | | | | - | | | | 222,787 | | | | - | | | jun-97 | | | | - | | | Catalinas Norte | | | - | | | | 100,862 | | | | 1,803 | | | | 6,831 | | | | 100,862 | | | | 8,634 | | | | 109,496 | | | | - | | | | 109,496 | | | | - | | | dec-09 | | | | - | | | Luján plot of land | | | - | | | | 41,861 | | | | (17,681 | ) | | | 111 | | | | 41,972 | | | | (17,681 | ) | | | 24,291 | | | | - | | | | 24,291 | | | | - | | | may-12 | | | | - | | | Caballito - Ferro | | | - | | | | 45,812 | | | | 3,885 | | | | - | | | | 45,812 | | | | 3,885 | | | | 49,697 | | | | - | | | | 49,697 | | | | - | | | nov-97 | | | | - | | | Intercontinental Tower B plot of land | | | - | | | | 1,564 | | | | - | | | | - | | | | 1,564 | | | | - | | | | 1,564 | | | | - | | | | 1,564 | | | | - | | | feb-98 | | | | - | | | Pilar | | | - | | | | 1,550 | | | | 658 | | | | - | | | | 1,550 | | | | 658 | | | | 2,208 | | | | - | | | | 2,208 | | | | - | | | jul-97 | | | | - | | | Others | | | - | | | | 3,272 | | | | 2,951 | | | | 3,567 | | | | 6,839 | | | | 2,951 | | | | 9,790 | | | | - | | | | 9,790 | | | | - | | | | - | | | | - | | | Total Undeveloped parcels of land | | | | | | | 378,780 | | | | 55,452 | | | | 10,937 | | | | 382,886 | | | | 62,283 | | | | 445,169 | | | | - | | | | 445,169 | | | | | | | | | | | | | | | Total | | | | | | | 889,614 | | | | 3,327,774 | | | | 834,625 | | | | 893,727 | | | | 4,158,286 | | | | 5,052,013 | | | | (1,620,521 | ) | | | 3,431,492 | | | | | | | | | | | | | |
(i) | The breakdown of investment properties as of June 30, 2015 includes property, plant and equipment in the amount of 33,737 that reflects offices used by the Company. |
Cresud Sociedad Anónima,
Comercial, Inmobiliaria, Financiera y Agropecuaria
Notes to Consolidated Financial Statements (Continued)
(All amounts in thousands of Argentine Pesos, except shares and per share data and as otherwise indicated)
11. | Property, plant and equipment |
Changes in the Group’s property, plant and equipment for the years ended June 30, 2015 and 2014 are as follows:
| | | Owner occupied farmland | | | Hotel buildings and facilities | | | Other buildings and facilities | | | Furniture and fixtures | | | Machinery and equipment | | | Vehicles | | | Total | | | Year ended June 30, 2014 | | | | | | | | | | | | | | | | | | | | | | | Opening net book amount | | | 1,538,708 | | | | 180,348 | | | | 57,239 | | | | 7,178 | | | | 52,961 | | | | 5,020 | | | | 1,841,454 | | | Currency translation adjustment | | | 518,869 | | | | - | | | | 3,363 | | | | 1,238 | | | | 13,751 | | | | 240 | | | | 537,461 | | | Additions | | | 96,785 | | | | 9,980 | | | | 4,633 | | | | 3,953 | | | | 15,581 | | | | 3,247 | | | | 134,179 | | | Reclassifications of investment properties | | | 3,657 | | | | - | | | | 12,231 | | | | - | | | | - | | | | - | | | | 15,888 | | | Reclassifications to intangibles assets | | | - | | | | - | | | | (30 | ) | | | - | | | | - | | | | - | | | | (30 | ) | | Disposals | | | (56,763 | ) | | | (24 | ) | | | (133 | ) | | | (7 | ) | | | (2,589 | ) | | | (497 | ) | | | (60,013 | ) | | Depreciation charge (i) | | | (44,062 | ) | | | (14,559 | ) | | | (10,559 | ) | | | (1,524 | ) | | | (14,519 | ) | | | (1,760 | ) | | | (86,983 | ) | | Closing net book amount | | | 2,057,194 | | | | 175,745 | | | | 66,744 | | | | 10,838 | | | | 65,185 | | | | 6,250 | | | | 2,381,956 | | | At June 30, 2014 | | | | | | | | | | | | | | | | | | | | | | | | | | | | | | Cost | | | 2,261,176 | | | | 402,647 | | | | 141,704 | | | | 25,144 | | | | 191,561 | | | | 12,578 | | | | 3,034,810 | | | Accumulated depreciation | | | (203,982 | ) | | | (226,902 | ) | | | (74,960 | ) | | | (14,306 | ) | | | (126,376 | ) | | | (6,328 | ) | | | (652,854 | ) | | Net book amount | | | 2,057,194 | | | | 175,745 | | | | 66,744 | | | | 10,838 | | | | 65,185 | | | | 6,250 | | | | 2,381,956 | | | Year ended June 30, 2015 | | | | | | | | | | | | | | | | | | | | | | | | | | | | | | Opening net book amount | | | 2,057,194 | | | | 175,745 | | | | 66,744 | | | | 10,838 | | | | 65,185 | | | | 6,250 | | | | 2,381,956 | | | Currency translation adjustment | | | (223,146 | ) | | | - | | | | (6,364 | ) | | | (449 | ) | | | (7,082 | ) | | | 80 | | | | (236,961 | ) | | Additions | | | 153,336 | | | | 14,737 | | | | 14,892 | | | | 3,442 | | | | 28,980 | | | | 7,572 | | | | 222,959 | | | Reclassifications of investment properties | | | 11,732 | | | | - | | | | 8,305 | | | | 3,618 | | | | 5,301 | | | | - | | | | 28,956 | | | Reclassifications to investment properties | | | (50,341 | ) | | | - | | | | (10,404 | ) | | | - | | | | - | | | | - | | | | (60,745 | ) | | Disposals | | | (255,345 | ) | | | (3,508 | ) | | | (2,125 | ) | | | (775 | ) | | | (2,779 | ) | | | (407 | ) | | | (264,939 | ) | | Depreciation charge (i) | | | (53,606 | ) | | | (15,097 | ) | | | (3,751 | ) | | | (2,220 | ) | | | (16,596 | ) | | | (2,761 | ) | | | (94,031 | ) | | Closing net book amount | | | 1,639,824 | | | | 171,877 | | | | 67,297 | | | | 14,454 | | | | 73,009 | | | | 10,734 | | | | 1,977,195 | | | At June 30, 2015 | | | | | | | | | | | | | | | | | | | | | | | | | | | | | | Cost | | | 1,832,645 | | | | 414,310 | | | | 146,297 | | | | 30,753 | | | | 213,231 | | | | 19,563 | | | | 2,656,799 | | | Accumulated depreciation | | | (192,821 | ) | | | (242,433 | ) | | | (79,000 | ) | | | (16,299 | ) | | | (140,222 | ) | | | (8,829 | ) | | | (679,604 | ) | | Net book amount | | | 1,639,824 | | | | 171,877 | | | | 67,297 | | | | 14,454 | | | | 73,009 | | | | 10,734 | | | | 1,977,195 | |
(i) | As of June 30, 2015 and 2014 depreciation charges of property, plant and equipment were included in “Costs” for an amount of Ps. 87,139 and Ps. 80,150, "General and administrative expenses" for an amount of Ps. 5,663 and Ps. 5,025 and “Selling expenses” for an amount of Ps. 1,229 and Ps. 1,808, respectively in the income statements (Note 33). |
Cresud Sociedad Anónima,
Comercial, Inmobiliaria, Financiera y Agropecuaria
Notes to Consolidated Financial Statements (Continued)
(All amounts in thousands of Argentine Pesos, except shares and per share data and as otherwise indicated)
11. | Property, plant and equipment (Continued)
|
Properties under development as of June 30, 2015 and 2014 amount to Ps. 15.6 million and Ps. 17.6 million, respectively, and mainly comprise improvements being made on property included in this item.
During the years ended June 30, 2015, 2014 and 2013, no borrowing costs were capitalized.
Certain properties included in property, plant and equipment have been mortgaged to secure certain Group’s borrowings. The net book value of these Group’s properties as of June 30, 2015 and 2014 is set out below:
| | | June 30, 2015 | | | June 30, 2014 | | | Sheraton Libertador | | | 31,690 | | | | 35,499 | | | Cremaq | | | - | | | | 256,445 | | | Jatobá | | | 182,520 | | | | 275,461 | | | Preferencia | | | 85,192 | | | | 98,881 | | | Chaparral | | | 259,907 | | | | - | | | Araucaria | | | 190,606 | | | | - | | | La Fon Fon | | | - | | | | 32,690 | | | Meet processing plant | | | 12,608 | | | | - | | | Total | | | 762,523 | | | | 698,976 | |
The Group leases machinery and computer equipment under non-cancellable finance lease agreements. The lease terms are between 2 and 5 years, and ownership of the assets lie within the Group (Note 29). The net book value of these assets, included in “Machinery and equipment” is as follows:
| | | June 30, 2015 | | | June 30, 2014 | | | Cost – Finance leases | | | 8,683 | | | | 6,615 | | | Accumulated depreciation | | | (6,133 | ) | | | (4,608 | ) | | Net book amount | | | 2,550 | | | | 2,007 | |
The following is a detailed summary of property, plant and equipment of the Group by type at June 30, 2015:
Cresud Sociedad Anónima,
Comercial, Inmobiliaria, Financiera y Agropecuaria
Notes to Consolidated Financial Statements (Continued)
(All amounts in thousands of Argentine Pesos, except shares and per share data and as otherwise indicated)
11. | Property, plant and equipment (Continued)
|
| | | | | | Initial costs | | | Subsequent costs | | | Costs at year-end | | | | | | | | | | | | | Name | | Encumbrances | | | Plot of land | | | Buildings, facilities and improvements (i) | | | Improvements / Additions / Disposals / Transfers | | | Plot of land | | | Buildings, facilities and improvements | | | Total | | | Accumulated depreciation | | | Net book value | | Date of acquisition | | Useful life for calculating depreciation | | | Livestock and farmlands: | | | | | | | | | | | | | | | | | | | | | | | | | | | | | | | | | El Recreo | | | - | | | | - | | | | 1,257 | | | | - | | | | - | | | | 1,257 | | | | 1,257 | | | | - | | | | 1,257 | | may-95 | | | - | | | Los Pozos | | | - | | | | 5,281 | | | | 89,669 | | | | 70,046 | | | | 5,281 | | | | 159,715 | | | | 164,996 | | | | (12,422 | ) | | | 152,574 | | may-95 | | | 26 | | | Administración Cactus | | | - | | | | - | | | | - | | | | 5,105 | | | | 318 | | | | 4,787 | | | | 5,105 | | | | (3,627 | ) | | | 1,478 | | jun-14 | | | 19 | | | Agro Riego San Luis | | | - | | | | 9,318 | | | | 18,360 | | | | 31,079 | | | | 9,318 | | | | 49,439 | | | | 58,757 | | | | (13,829 | ) | | | 44,928 | | nov-97 | | | 12 | | | Las Vertientes | | | - | | | | - | | | | 1,167 | | | | 590 | | | | - | | | | 1,757 | | | | 1,757 | | | | (1,018 | ) | | | 739 | | mar-98 | | | 11 | | | La Suiza | | | - | | | | 22,361 | | | | 6,578 | | | | 17,580 | | | | 22,361 | | | | 24,158 | | | | 46,519 | | | | (2,776 | ) | | | 43,743 | | jun-98 | | | 22 | | | La Esmeralda | | | - | | | | 7,210 | | | | 4,324 | | | | 6,750 | | | | 7,210 | | | | 11,074 | | | | 18,284 | | | | (1,937 | ) | | | 16,347 | | jun-98 | | | 36 | | | El Tigre | | | - | | | | 28,225 | | | | 6,155 | | | | 3,094 | | | | 28,225 | | | | 9,249 | | | | 37,474 | | | | (3,280 | ) | | | 34,194 | | apr-03 | | | 14 | | | El Invierno | | | - | | | | 9,030 | | | | 320 | | | | - | | | | 9,030 | | | | 320 | | | | 9,350 | | | | (121 | ) | | | 9,229 | | jun-05 | | | 25 | | | San Pedro | | | - | | | | 40,889 | | | | 6,994 | | | | 2,484 | | | | 40,889 | | | | 9,478 | | | | 50,367 | | | | (1,406 | ) | | | 48,961 | | sep-05 | | | 44 | | | Jatoba | | Mortgage | | | | 130,886 | | | | 67,034 | | | | 90,720 | | | | 110,923 | | | | 177,717 | | | | 288,640 | | | | (61,146 | ) | | | 227,494 | | oct-06 | | | 33 | | | Araucaria | | | - | | | | 211,589 | | | | 1,948 | | | | (21,573 | ) | | | 185,732 | | | | 6,232 | | | | 191,964 | | | | (1,358 | ) | | | 190,606 | | mar-07 | | | 25 | | | 8 de Julio | | | - | | | | 10,040 | | | | 439 | | | | 703 | | | | 10,040 | | | | 1,142 | | | | 11,182 | | | | (139 | ) | | | 11,043 | | may-07/may-08 | | | 24 | | | Alto Tacuarí | | | - | | | | 100,075 | | | | 145 | | | | 10,694 | | | | 110,330 | | | | 584 | | | | 110,914 | | | | (198 | ) | | | 110,716 | | aug-07 | | | 33 | | | Chaparral | | Mortgage | | | | 160,620 | | | | 37,823 | | | | 110,287 | | | | 141,617 | | | | 167,113 | | | | 308,730 | | | | (48,823 | ) | | | 259,907 | | nov-07 | | | 25 | | | Nova Buriti | | | - | | | | 64,653 | | | | 1,069 | | | | 7,113 | | | | 71,313 | | | | 1,522 | | | | 72,835 | | | | (160 | ) | | | 72,675 | | dec-07 | | | 25 | | | La Esperanza | | | - | | | | 4,307 | | | | - | | | | - | | | | 4,307 | | | | - | | | | 4,307 | | | | - | | | | 4,307 | | apr-08 | | | 34 | | | Preferencia | | Mortgage | | | | 30,647 | | | | 18,847 | | | | 81,753 | | | | 16,900 | | | | 114,347 | | | | 131,247 | | | | (24,695 | ) | | | 106,552 | | sep-08 | | | 33 | | | Avarandado | | | - | | | | - | | | | - | | | | 4,357 | | | | - | | | | 4,357 | | | | 4,357 | | | | (302 | ) | | | 4,055 | | | | | | |
Cresud Sociedad Anónima,
Comercial, Inmobiliaria, Financiera y Agropecuaria
Notes to Consolidated Financial Statements (Continued)
(All amounts in thousands of Argentine Pesos, except shares and per share data and as otherwise indicated)
11. | Property, plant and equipment (Continued)
|
| | | | | | Initial costs | | | Subsequent costs | | | Costs at year-end | | | | | | | | | | | | | | | Name | | Encumbrances | | | Plot of land | | | Buildings, facilities and improvements (i) | | | Improvements / Additions / Disposals / Transfers | | | Plot of land | | | Buildings, facilities and improvements | | | Total | | | Accumulated depreciation | | | Net book value | | | Date of acquisition | | | Useful life for calculating depreciation | | | San Rafael | | | - | | | | 26,303 | | | | 824 | | | | 48,414 | | | | 72,797 | | | | 2,744 | | | | 75,541 | | | | (547 | ) | | | 74,994 | | | nov-08 | | | | 35 | | | Las Londras | | | - | | | | 38,846 | | | | 706 | | | | 57,972 | | | | 89,739 | | | | 7,785 | | | | 97,524 | | | | (863 | ) | | | 96,661 | | | jan-09 | | | | 36 | | | Establecimiento Mendoza | | | - | | | | 6,810 | | | | - | | | | - | | | | 6,810 | | | | - | | | | 6,810 | | | | - | | | | 6,810 | | | mar-11 | | | | - | | | ANTA | | | - | | | | - | | | | 44,425 | | | | 55,668 | | | | - | | | | 100,093 | | | | 100,093 | | | | (12,863 | ) | | | 87,230 | | | | - | | | | 23 | | | San Bernardo | | | - | | | | - | | | | 79 | | | | 114 | | | | - | | | | 193 | | | | 193 | | | | (18 | ) | | | 175 | | | | - | | | | 10 | | | Venado Tuerto | | | - | | | | - | | | | - | | | | 25 | | | | - | | | | 25 | | | | 25 | | | | (1 | ) | | | 24 | | | | | | | | 34 | | | El Pinar | | | - | | | | - | | | | - | | | | 19 | | | | - | | | | 19 | | | | 19 | | | | (1 | ) | | | 18 | | | | - | | | | 23 | | | Finca Mendoza | | | - | | | | 32 | | | | - | | | | - | | | | 32 | | | | - | | | | 32 | | | | - | | | | 32 | | | | - | | | | - | | | Cuatro vientos | | | - | | | | 36,301 | | | | 146 | | | | 28,565 | | | | 58,586 | | | | 6,426 | | | | 65,012 | | | | (1,618 | ) | | | 63,394 | | | jun-11 | | | | 38 | | | La primavera | | | - | | | | 19,245 | | | | - | | | | 28,022 | | | | 47,267 | | | | - | | | | 47,267 | | | | (382 | ) | | | 46,885 | | | jun-11 | | | | 38 | | | Total | | | - | | | | 962,668 | | | | 308,309 | | | | 639,581 | | | | 1,049,025 | | | | 861,533 | | | | 1,910,558 | | | | (193,530 | ) | | | 1,717,028 | | | | | | | | | | | | | | | | | | | | | | | | | | | | | | | | | | | | | | | | | | | | | | | | | | | | | | | | | Other buildings | | | | | | | | | | | | | | | | | | | | | | | | | | | | | | | | | | | | | | | | | | | | | | Edificio Intercontinental | | | - | | | | - | | | | 819 | | | | 84 | | | | - | | | | 903 | | | | 903 | | | | (750 | ) | | | 153 | | | | | | | | | | | Total Other buildings | | | - | | | | - | | | | 819 | | | | 84 | | | | - | | | | 903 | | | | 903 | | | | (750 | ) | | | 153 | | | | | | | | | | | | | | | | | | | | | | | | | | | | | | | | | | | | | | | | | | | | | | | | | | | | | | | | | Hotels: | | | | | | | | | | | | | | | | | | | | | | | | | | | | | | | | | | | | | | | | | | | | | | Llao Llao | | | - | | | | 24,666 | | | | 92,011 | | | | 7,196 | | | | 24,666 | | | | 99,207 | | | | 123,873 | | | | (39,826 | ) | | | 84,047 | | | jun-97 | | | | 10 | | | Hotel Intercontinental | | | - | | | | 17,326 | | | | 122,714 | | | | 17,391 | | | | 17,325 | | | | 140,106 | | | | 157,431 | | | | (101,291 | ) | | | 56,140 | | | nov-97 | | | | 10 | | | Sheraton Libertador | | Mortgage | | | | 3,755 | | | | 120,670 | | | | 8,581 | | | | 3,755 | | | | 129,251 | | | | 133,006 | | | | (101,316 | ) | | | 31,690 | | | mar-98 | | | | 9 | | | Total Hotels | | | | | | | 45,747 | | | | 335,395 | | | | 33,168 | | | | 45,746 | | | | 368,564 | | | | 414,310 | | | | (242,433 | ) | | | 171,877 | | | | | | | | | |
(i) | The breakdown of property, plant and equipment as of June 30, 2015, includes investment properties in the amount of Ps. 77,204 that reflects leased farmlands. |
Cresud Sociedad Anónima,
Comercial, Inmobiliaria, Financiera y Agropecuaria
Notes to Consolidated Financial Statements (Continued)
(All amounts in thousands of Argentine Pesos, except shares and per share data and as otherwise indicated)
Changes in the Group’s trading properties for the years ended June 30, 2015 and 2014 are as follows:
| | | Completed properties | | | Properties under development | | | Undeveloped sites | | | Total | | | At June 30, 2013 | | | 8,659 | | | | 88,879 | | | | 11,979 | | | | 109,517 | | | Additions | | | 1,400 | | | | 2,694 | | | | - | | | | 4,094 | | | Currency translation adjustment | | | - | | | | 27,630 | | | | - | | | | 27,630 | | | Reclassifications of investment properties and intangible assets | | | 7,897 | | | | - | | | | (747 | ) | | | 7,150 | | | Disposals | | | (11,225 | ) | | | (15 | ) | | | - | | | | (11,240 | ) | | At June 30, 2014 | | | 6,731 | | | | 119,188 | | | | 11,232 | | | | 137,151 | | | Additions | | | - | | | | 1,066 | | | | - | | | | 1,066 | | | Currency translation adjustment | | | - | | | | (6,124 | ) | | | - | | | | (6,124 | ) | | Reclassifications of investment properties | | | - | | | | - | | | | 3,107 | | | | 3,107 | | | Disposals | | | (2,246 | ) | | | - | | | | - | | | | (2,246 | ) | | At June 30, 2015 | | | 4,485 | | | | 114,130 | | | | 14,339 | | | | 132,954 | |
As of June 30, 2015 and 2014 properties under construction mainly comprise works in "Zetol” and "Vista al Muelle" for the amounts of Ps. 105.9 and Ps. 111.0 million, respectively.
The Group has contractual obligations not provisioned related to future works committed when certain properties were acquired or real estate projects were approved. As of June 30, 2015 and 2014, contractual obligations mainly correspond to constructions regarding “Zetol” and "Vista al Muelle" projects and amount to Ps. 69 million and Ps. 56 million, respectively. Both projects are expected to be completed in 2023.
Certain of the Group’s trading properties have been mortgaged or restricted to secure some of the Group’s borrowings and other payables. The net book value of the Group’s trading properties as of June 30, 2015 and 2014 is as follows:
| | | June 30, 2015 | | | June 30, 2014 | | | Vista al Muelle | | | 43,362 | | | | 45,368 | | | Zetol | | | 62,568 | | | | 65,620 | | | Total | | | 105,930 | | | | 110,988 | |
Cresud Sociedad Anónima,
Comercial, Inmobiliaria, Financiera y Agropecuaria
Notes to Consolidated Financial Statements (Continued)
(All amounts in thousands of Argentine Pesos, except shares and per share data and as otherwise indicated)
12. | Trading properties (Continued)
|
The following is a detailed summary of the Group’s trading properties by type as of June 30, 2015:
Description | | Encumbrances | | | Book value | | | Date of construction | | | Date of acquisition | | Undeveloped sites: | | | | | | | | | | | | | Coto Air Space | | | - | | | | 10,429 | | | | - | | | sep-97 | | Neuquén Project | | | - | | | | 803 | | | | - | | | | - | | Córdoba plot of land | | | - | | | | 3,107 | | | | - | | | may-15 | | Total undeveloped sites | | | | | | | 14,339 | | | | | | | | | | Properties under development: | | | | | | | | | | | | | | | | | Vista al Muelle plot of land | | Mortgage | | | | 43,362 | | | | - | | | jun-09 | | Zetol plot of land | | Mortgage | | | | 62,568 | | | | - | | | jun-09 | | Pereiraola | | | - | | | | 8,200 | | | | - | | | dec-96 | | Total Properties under development | | | | | | | 114,130 | | | | | | | | | | Completed properties: | | | | | | | | | | | | | | | | | Abril | | | - | | | | 2,357 | | | | - | | | jan-95 | | San Martín de Tours | | | - | | | | 181 | | | | - | | | mar-03 | | Entre Rios 465/9 apartments | | | - | | | | 1,400 | | | | - | | | jan-00 | | Condominio I and II | | | - | | | | 547 | | | | - | | | apr-99 | | Total Completed properties | | | | | | | 4,485 | | | | | | | | | | Total | | | | | | | 132,954 | | | | | | | | | |
Cresud Sociedad Anónima,
Comercial, Inmobiliaria, Financiera y Agropecuaria
Notes to Consolidated Financial Statements (Continued)
(All amounts in thousands of Argentine Pesos, except shares and per share data and as otherwise indicated)
Changes in the Group’s intangible assets for the years ended June 30, 2015 and 2014 are as follows:
| | | Goodwill | | | Compute software | | | Rights of use | | | Units to be received under barters | | | Others | | | Total | | | Year ended June 30, 2014 | | | | | | | | | | | | | | | | | | | | Opening net book amount | | | 77,052 | | | | 8,189 | | | | 39,939 | | | | 93,225 | | | | 132 | | | | 218,537 | | | Currency translation adjustment | | | 29,352 | | | | 2,955 | | | | - | | | | - | | | | - | | | | 32,307 | | | Additions | | | 658 | | | | 2,947 | | | | - | | | | - | | | | 10,954 | | | | 14,559 | | | Disposals | | | - | | | | (245 | ) | | | - | | | | - | | | | - | | | | (245 | ) | | Reclassification to trading properties | | | - | | | | - | | | | - | | | | (8,148 | ) | | | - | | | | (8,148 | ) | | Reclassification to assets held for sale | | | (77,085 | ) | | | - | | | | - | | | | - | | | | - | | | | (77,085 | ) | | Reclassification of property, plant and equipment | | | - | | | | 30 | | | | - | | | | - | | | | - | | | | 30 | | | Amortization charge (i) | | | - | | | | (4,116 | ) | | | (752 | ) | | | - | | | | (80 | ) | | | (4,948 | ) | | Closing net book amount | | | 29,977 | | | | 9,760 | | | | 39,187 | | | | 85,077 | | | | 11,006 | | | | 175,007 | | | At June 30, 2014 | | | | | | | | | | | | | | | | | | | | | | | | | | Cost | | | 29,977 | | | | 36,680 | | | | 40,691 | | | | 85,077 | | | | 11,861 | | | | 204,286 | | | Accumulated amortization | | | - | | | | (26,920 | ) | | | (1,504 | ) | | | - | | | | (855 | ) | | | (29,279 | ) | | Net book amount | | | 29,977 | | | | 9,760 | | | | 39,187 | | | | 85,077 | | | | 11,006 | | | | 175,007 | | | Year ended June 30, 2015 | | | | | | | | | | | | | | | | | | | | | | | | | | Opening net book amount | | | 29,977 | | | | 9,760 | | | | 39,187 | | | | 85,077 | | | | 11,006 | | | | 175,007 | | | Currency translation adjustment | | | (2,022 | ) | | | (1,565 | ) | | | - | | | | - | | | | - | | | | (3,587 | ) | | Additions | | | - | | | | 6,391 | | | | - | | | | 5,409 | | | | - | | | | 11,800 | | | Disposals | | | (343 | ) | | | (119 | ) | | | - | | | | - | | | | - | | | | (462 | ) | | Amortization charge (i) | | | - | | | | (4,625 | ) | | | (1,224 | ) | | | - | | | | (1,146 | ) | | | (6,995 | ) | | Closing net book amount | | | 27,612 | | | | 9,842 | | | | 37,963 | | | | 90,486 | | | | 9,860 | | | | 175,763 | | | At June 30, 2015 | | | | | | | | | | | | | | | | | | | | | | | | | | Cost | | | 27,612 | | | | 41,387 | | | | 40,692 | | | | 90,486 | | | | 11,862 | | | | 212,039 | | | Accumulated amortization | | | - | | | | (31,545 | ) | | | (2,729 | ) | | | - | | | | (2,002 | ) | | | (36,276 | ) | | Net book amount | | | 27,612 | | | | 9,842 | | | | 37,963 | | | | 90,486 | | | | 9,860 | | | | 175,763 | |
(i) | As of June 30, 2015 and 2014 depreciation charges has been charged in “General and administrative expenses” in the Income statements (Note 33). |
Cresud Sociedad Anónima,
Comercial, Inmobiliaria, Financiera y Agropecuaria
Notes to Consolidated Financial Statements (Continued)
(All amounts in thousands of Argentine Pesos, except shares and per share data and as otherwise indicated)
Changes in the Group’s biological assets for the years ended June 30, 2015 and 2014 are as follows:
| | | Crops | | | Sugarcane | | | Beef cattle | | | Dairy | | | Other cattle | | | Others | | | Total | | | At June 30, 2013 | | | 55,879 | | | | 111,063 | | | | 195,750 | | | | 28,134 | | | | 7,136 | | | | 2,730 | | | | 400,692 | | | Purchases | | | - | | | | - | | | | 37,651 | | | | - | | | | 172 | | | | - | | | | 37,823 | | | Initial recognition and changes in fair value of biological assets (i) | | | 837,037 | | | | 82,778 | | | | 143,096 | | | | 11,445 | | | | (661 | ) | | | 1,872 | | | | 1,075,567 | | | Decrease due to harvest | | | (815,080 | ) | | | (100,791 | ) | | | - | | | | - | | | | - | | | | - | | | | (915,871 | ) | | Decrease due to sales | | | - | | | | - | | | | (73,897 | ) | | | (2,316 | ) | | | (181 | ) | | | - | | | | (76,394 | ) | | Consume | | | - | | | | - | | | | (501 | ) | | | - | | | | (57 | ) | | | 81 | | | | (477 | ) | | Currency translation adjustment | | | 69,520 | | | | 49,823 | | | | - | | | | - | | | | - | | | | - | | | | 119,343 | | | At June 30, 2014 | | | 147,356 | | | | 142,873 | | | | 302,099 | | | | 37,263 | | | | 6,409 | | | | 4,683 | | | | 640,683 | | | Purchases | | | - | | | | - | | | | 14,097 | | | | - | | | | 873 | | | | - | | | | 14,970 | | | Initial recognition and changes in fair value of biological assets (i) | | | 896,520 | | | | 162,352 | | | | 161,104 | | | | 13,142 | | | | 463 | | | | 1,796 | | | | 1,235,377 | | | Decrease due to harvest | | | (959,572 | ) | | | (198,026 | ) | | | - | | | | - | | | | - | | | | - | | | | (1,157,598 | ) | | Decrease due to sales | | | - | | | | - | | | | (118,041 | ) | | | (9,850 | ) | | | (273 | ) | | | - | | | | (128,164 | ) | | Addition from lease agreement | | | - | | | | 22,474 | | | | - | | | | - | | | | - | | | | - | | | | 22,474 | | | Consume | | | - | | | | - | | | | (705 | ) | | | - | | | | (49 | ) | | | (1,084 | ) | | | (1,838 | ) | | Currency translation adjustment | | | (30,476 | ) | | | (16,551 | ) | | | - | | | | - | | | | - | | | | - | | | | (47,027 | ) | | At June 30, 2015 | | | 53,828 | | | | 113,122 | | | | 358,554 | | | | 40,555 | | | | 7,423 | | | | 5,395 | | | | 578,877 | |
(i) | Biological assets with a production cycle of more than one year (that is, sugarcane and cattle) generated “Initial recognition and changes in fair value of biological assets” amounting to Ps. 337,061 and Ps. 236,658 for the years ended June 30, 2015 and 2014, respectively. For the years ended June 30, 2015 and 2014, amounts of Ps. 15,993 and Ps. 79,351, was attributable to price changes, and amounts of Ps. 143,643 and Ps. 58,315, was attributable to physical changes, respectively. |
Biological assets as of June 30, 2015 and 2014 are as follows:
| | Classification | | June 30, 2015 | | | June 30, 2014 | | | Non-current | | | | | | | | | Cattle for dairy production | Production | | | 40,478 | | | | 37,217 | | | Breeding cattle | Production | | | 293,709 | | | | 254,397 | | | Sugarcane fields | Production | | | 113,122 | | | | 142,873 | | | Other cattle | Production | | | 6,175 | | | | 5,683 | | | Others biological assets | Production | | | 5,395 | | | | 4,683 | | | Non-current biological assets | | | | 458,879 | | | | 444,853 | | | Current | | | | | | | | | | | Cattle for dairy production | Consumable | | | 77 | | | | 46 | | | Cattle for sale | Consumable | | | 64,845 | | | | 47,702 | | | Crops fields | Consumable | | | 53,828 | | | | 147,356 | | | Other cattle | Consumable | | | 1,248 | | | | 726 | | | Current biological assets | | | | 119,998 | | | | 195,830 | | | Total biological assets | | | | 578,877 | | | | 640,683 | |
Cresud Sociedad Anónima,
Comercial, Inmobiliaria, Financiera y Agropecuaria
Notes to Consolidated Financial Statements (Continued)
(All amounts in thousands of Argentine Pesos, except shares and per share data and as otherwise indicated)
14. | Biological assets (Continued)
|
The fair value less estimated point of sale costs of agricultural produce at the point of harvest amount to Ps. 1,218,242 and Ps. 789,284 for the years ended June 30, 2015 and 2014, respectively.
The following tables present the Group’s biological assets measured at fair value as of June 30, 2015 and 2014 and their allocation to the fair value hierarchy:
| | | June 30, 2015 | | | | | Level 1 | | | Level 2 | | | Level 3 | | | Total | | | Cattle for dairy production | | | - | | | | 40,555 | | | | - | | | | 40,555 | | | Breeding cattle and cattle for sale | | | - | | | | 358,554 | | | | - | | | | 358,554 | | | Sugarcane fields | | | - | | | | - | | | | 113,122 | | | | 113,122 | | | Other cattle | | | - | | | | 7,423 | | | | - | | | | 7,423 | | | Others biological assets | | | 5,395 | | | | - | | | | - | | | | 5,395 | | | Crops fields | | | 13,477 | | | | - | | | | 40,351 | | | | 53,828 | | | Total | | | 18,872 | | | | 406,532 | | | | 153,473 | | | | 578,877 | |
| | June 30, 2014 | | | Level 1 | | Level 2 | | Level 3 | | Total | | Cattle for dairy production | - | | 37,263 | | - | | 37,263 | | Breeding cattle and cattle for sale | - | | 302,099 | | - | | 302,099 | | Sugarcane fields | - | | - | | 142,873 | | 142,873 | | Other cattle | - | | 6,409 | | - | | 6,409 | | Others biological assets | 4,683 | | - | | - | | 4,683 | | Crops fields | 10,736 | | - | | 136,620 | | 147,356 | | Total | 15,419 | | 345,771 | | 279,493 | | 640,683 |
The following table presents the changes in Level 3 financial instruments for the years ended June 30, 2015 and 2014:
| | | Crops fields with significant biological growth | | | Sugarcane fields | | | At June 30, 2014 | | | 136,620 | | | | 142,873 | | | Initial recognition and changes in the fair value of biological assets (i) | | | 462,116 | | | | 162,352 | | | Harvest | | | (557,591 | ) | | | (198,026 | ) | | Addition from lease agreement | | | - | | | | 22,474 | | | Currency translation adjustment | | | (794 | ) | | | (16,551 | ) | | At June 30, 2015 | | | 40,351 | | | | 113,122 | |
Cresud Sociedad Anónima,
Comercial, Inmobiliaria, Financiera y Agropecuaria
Notes to Consolidated Financial Statements (Continued)
(All amounts in thousands of Argentine Pesos, except shares and per share data and as otherwise indicated)
14. | Biological assets (Continued)
|
When no quoted prices in an active market are available, values are based on recognized valuation methods. The company uses a range of valuation models for the measurement of Level 2 and Level 3 biological assets. The following table presents models and main parameters:
Level 2
Description | Pricing model | Parameters | Cattle | Comparable market | Price per livestock head/kg and per category |
Level 3
Description | Pricing model | | Pricing method | | Parameters | Range | Crops | Discounted cash flows | | | - | | Yields – Operating cost –Selling expenses - Future of sale prices | Argentina: | | | | | | | Discount rate | Yields 1.65 - 11.72 tn/ha | | | | | | | | Future of sale prices: 949 -1,233 Ps. /tn | | | | | | | | Selling expenses: 170 - 680 Ps./tn | | | | | | | | Operating cost: 756 -4,001 Ps. /ha | | | | | | | | Brazil: | | | | | | | | Yields 3.42 tn/ha | | | | | | | | Future of sale prices: 366.67 Rs./tn | | | | | | | | Selling expenses: 57.07 Rs./tn | | | | | | | | Operating cost: 125 Rs./ha | Sugarcane | Discounted cash flows | | | - | | Yields – Operating cost –Selling expenses - Future of sale prices | Brazil: | | | | | | | Discount rate | Yields 60 - 112.5 tn/ha | | | | | | | | Future of sale prices: 66.9-82.7 Rs./tn | | | | | | | | Operating cost: 4,536.23 Rs./ha | | | | | | | | Bolivia: | | | | | | | | Yields 58 - 113 tn/ha | | | | | | | | Future of sale prices: 21.87 – 23.89 US$/tn | | | | | | | | Selling expenses: 4.05 US$/tn | | | | | | | | Operating cost: 275 – 520 US$/tn | | | | | | | | Discount rate: 11.62% |
Cresud Sociedad Anónima,
Comercial, Inmobiliaria, Financiera y Agropecuaria
Notes to Consolidated Financial Statements (Continued)
(All amounts in thousands of Argentine Pesos, except shares and per share data and as otherwise indicated)
14. | Biological assets (Continued)
|
During years ended June 30, 2015 and 2014, there have been no transfers between the several tiers used in estimating the fair value of the Group’s biological assets, or reclassifications among their respective categories.
See information on valuation processes used by the entity and on the sensitivity of fair value valuation to changes in material non-observable input data in Note 5.c.
As of June 30, 2015 and 2014, the better and maximum use of biological assets shall not significantly differ from the current use.
Breakdown of Group’s inventories as of June 30, 2015 and 2014 are as follows:
| | | June 30, 2015 | | | June 30, 2014 | | | Current | | | | | | | | Crops | | | 269,861 | | | | 241,061 | | | Materials and inputs | | | 154,492 | | | | 141,495 | | | Seeds and fodders | | | 60,839 | | | | 28,329 | | | Hotel supplies | | | 6,926 | | | | 6,011 | | | Beef | | | 19,232 | | | | 22,875 | | | Current inventories | | | 511,350 | | | | 439,771 | | | Total inventories | | | 511,350 | | | | 439,771 | |
As of June 30, 2015 and 2014 the cost of inventories recognized as expense amounted to Ps. 950,354 and Ps. 1,314,146, respectively and they have been included in “Costs” in the income statements.
16. | Financial instruments by category |
The following tables show the carrying amount of financial assets and financial liabilities by category of financial instrument and a reconciliation to the corresponding line item in the Statements of Financial position, as appropriate. Since the line items “Trade and other receivables” and “Trade and other payables” contain both financial instruments and non-financial assets or liabilities (such as prepayments, tax receivables and payables in kind), the reconciliation is shown in the columns headed “Non-financial assets” and “Non-financial liabilities”.
Cresud Sociedad Anónima,
Comercial, Inmobiliaria, Financiera y Agropecuaria
Notes to Consolidated Financial Statements (Continued)
(All amounts in thousands of Argentine Pesos, except shares and per share data and as otherwise indicated)
16. | Financial instruments by category (Continued)
|
Financial assets and financial liabilities as of June 30, 2015 are as follows:
| | | Financial assets at amortized cost | | | Financial assets at fair value through profit or loss | | | Subtotal financial assets | | | Non-financial assets | | | Total | | | June 30, 2015 | | | | | | | | | | | | | | | | | Assets as per statement of financial position | | | | | | | | | | | | | | | | | Investments in associates and joint ventures (Note 9) (i) | | | - | | | | 907,083 | | | | 907,083 | | | | - | | | | 907,083 | | | Trade and other receivables (Note 18) | | | 684,104 | | | | 56,181 | | | | 1,740,285 | | | | 458,865 | | | | 2,199,150 | | | Investment in financial assets (Note 19) | | | 100,452 | | | | 1,026,495 | | | | 1,126,947 | | | | - | | | | 1,126,947 | | | Derivative financial instruments (Note 20) | | | - | | | | 237,156 | | | | 237,156 | | | | - | | | | 237,156 | | | Cash and cash equivalents (excluding bank overdrafts) (Note 21) | | | 521,353 | | | | 112,340 | | | | 633,693 | | | | - | | | | 633,693 | | | Total | | | 2,305,909 | | | | 2,339,255 | | | | 4,645,164 | | | | 458,865 | | | | 5,104,029 | |
| | | Financial liabilities at amortized cost | | | Financial liabilities at fair value through profit or loss | | | Subtotal financial liabilities | | | Non-financial liabilities | | | Total | | | Liabilities as per statement of financial position | | | | | | | | | | | | | | | | | Trade and other payables (Note 22) | | | 761,390 | | | | - | | | | 761,390 | | | | 809,499 | | | | 1,570,889 | | | Borrowings (excluding finance lease liabilities) (Note 25) | | | 8,258,448 | | | | 15,088 | | | | 8,273,536 | | | | - | | | | 8,273,536 | | | Derivative financial instruments (Note 20) | | | - | | | | 532,683 | | | | 532,683 | | | | - | | | | 532,683 | | | Total | | | 9,019,838 | | | | 547,771 | | | | 9,567,609 | | | | 809,499 | | | | 10,377,108 | |
(i) | The Group has valued its interest in its associate IDBD at fair value through profit or loss according to IAS 28. Therefore, the Group has included it in the chart in order to show the respective results. |
Financial assets and financial liabilities as of June 30, 2014 are as follows:
| | | Financial assets at amortized cost | | | Financial assets at fair value through profit or loss | | | Subtotal financial assets | | | Non-financial assets | | | Total | | | June 30, 2014 | | | | | | | | | | | | | | | | | Assets as per statement of financial position | | | | | | | | | | | | | | | | | Trade and other receivables (Note 18) | | | 1,362,245 | | | | 66,722 | | | | 1,428,967 | | | | 484,790 | | | | 1,913,757 | | | Investments in associates and joint ventures (Note 9) (i) | | | - | | | | 595,342 | | | | 595,342 | | | | - | | | | 595,342 | | | Investment in financial assets (Note 19) | | | - | | | | 770,645 | | | | 770,645 | | | | - | | | | 770,645 | | | Derivative financial instruments (Note 20) | | | - | | | | 33,130 | | | | 33,130 | | | | - | | | | 33,130 | | | Cash and cash equivalents (excluding bank overdrafts) (Note 21) | | | 978,397 | | | | 24,590 | | | | 1,002,987 | | | | - | | | | 1,002,987 | | | Total | | | 2,340,642 | | | | 1,490,429 | | | | 3,831,071 | | | | 484,790 | | | | 4,315,861 | |
(i) | The Group has valued its interest in its associate IDBD at fair value through profit or loss according to IAS 28. Therefore, the Group has included it in the chart in order to show the respective results. |
Cresud Sociedad Anónima,
Comercial, Inmobiliaria, Financiera y Agropecuaria
Notes to Consolidated Financial Statements (Continued)
(All amounts in thousands of Argentine Pesos, except shares and per share data and as otherwise indicated)
16. | Financial instruments by category (Continued)
|
| | | Financial liabilities at amortized cost | | | Financial liabilities at fair value through profit or loss | | | Subtotal financial liabilities | | | Non-financial liabilities | | | Total | | | Liabilities as per statement of financial position | | | | | | | | | | | | | | | | | Trade and other payables (Note 22) | | | 568,826 | | | | - | | | | 568,826 | | | | 652,114 | | | | 1,220,940 | | | Borrowings (excluding finance lease liabilities) (Note 25) | | | 7,900,094 | | | | 51,443 | | | | 7,951,537 | | | | - | | | | 7,951,537 | | | Derivative financial instruments (Note 20) | | | - | | | | 374,266 | | | | 374,266 | | | | - | | | | 374,266 | | | Total | | | 8,468,920 | | | | 425,709 | | | | 8,894,629 | | | | 652,114 | | | | 9,546,743 | |
Liabilities carried at amortized cost also include liabilities under finance leases where the Group is the lessee and which therefore have to be measured in accordance with IAS 17 “Leases”. The categories disclosed are determined by reference to IFRS 9. Finance leases are excluded from the scope of IFRS 7 “Financial Instruments: Disclosures”. Therefore, finance leases have been shown separately.
Income, expense, gains and losses on financial instruments are included in “Financial results, net” in the income statements, except for those generated by commodities, which are disclosed in “Other operating results, net” can be assigned to the following categories:
| | | Financial assets/ liabilities at amortized cost | | | Financial assets / liabilities at fair value through profit or loss | | | Subtotal Financial assets and liabilities | | | Non-Financial assets and liabilities | | | Total | | | June 30, 2015 | | | | | | | | | | | | | | | | | Interest income | | | 100,094 | | | | - | | | | 100,094 | | | | - | | | | 100,094 | | | Interest expense | | | (886,710 | ) | | | - | | | | (886,710 | ) | | | - | | | | (886,710 | ) | | Foreign exchange losses | | | (562,042 | ) | | | - | | | | (562,042 | ) | | | - | | | | (562,042 | ) | | Dividends income | | | 16,622 | | | | - | | | | 16,622 | | | | - | | | | 16,622 | | | Capitalized borrowing costs | | | 12,957 | | | | - | | | | 12,957 | | | | - | | | | 12,957 | | | Fair value gain on financial assets at fair value through profit or loss, net | | | - | | | | 187,529 | | | | 187,529 | | | | - | | | | 187,529 | | | Loss from repurchase of Non-convertible Notes | | | (1,945 | ) | | | - | | | | (1,945 | ) | | | - | | | | (1,945 | ) | | Loss from derivative financial instruments (except commodities) | | | - | | | | (83,510 | ) | | | (83,510 | ) | | | - | | | | (83,510 | ) | | Gain on the revaluation of receivables arising from the sale of farmland | | | - | | | | 52,984 | | | | 52,984 | | | | - | | | | 52,984 | | | Other financial results | | | (124,140 | ) | | | - | | | | (124,140 | ) | | | - | | | | (124,140 | ) | | Net result | | | (1,445,164 | ) | | | 157,003 | | | | (1,288,161 | ) | | | - | | | | (1,288,161 | ) |
Cresud Sociedad Anónima,
Comercial, Inmobiliaria, Financiera y Agropecuaria
Notes to Consolidated Financial Statements (Continued)
(All amounts in thousands of Argentine Pesos, except shares and per share data and as otherwise indicated)
16. | Financial instruments by category (Continued)
|
| | | Financial assets / liabilities at amortized cost | | | Financial assets / liabilities at fair value through profit or loss | | | Subtotal Financial assets and liabilities | | | Non-Financial assets and liabilities | | | Total | | | June 30, 2014 | | | | | | | | | | | | | | | | | Interest Income | | | 119,291 | | | | - | | | | 119,291 | | | | - | | | | 119,291 | | | Interest expense | | | (737,913 | ) | | | - | | | | (737,913 | ) | | | - | | | | (737,913 | ) | | Foreign exchange losses, net | | | (1,899,521 | ) | | | - | | | | (1,899,521 | ) | | | - | | | | (1,899,521 | ) | | Dividends income | | | 15,041 | | | | - | | | | 15,041 | | | | - | | | | 15,041 | | | Capitalized borrowing costs | | | 22,376 | | | | - | | | | 22,376 | | | | - | | | | 22,376 | | | Fair value gain on financial assets at fair value through profit or loss, net | | | - | | | | 379,091 | | | | 379,091 | | | | - | | | | 379,091 | | | Loss from repurchase of Non-convertible Notes | | | (44,688 | ) | | | - | | | | (44,688 | ) | | | - | | | | (44,688 | ) | | Loss from derivative financial instruments (except commodities) | | | - | | | | (365,740 | ) | | | (365,740 | ) | | | - | | | | (365,740 | ) | | Gain on the revaluation of receivables arising from the sale of farmland | | | - | | | | 20,751 | | | | 20,751 | | | | - | | | | 20,751 | | | Other finance results | | | (83,086 | ) | | | - | | | | (83,086 | ) | | | - | | | | (83,086 | ) | | Net result | | | (2,608,500 | ) | | | 34,102 | | | | (2,574,398 | ) | | | - | | | | (2,574,398 | ) |
| | | Financial assets / liabilities at amortized cost | | | Financial assets / liabilities at fair value through profit or loss | | | Subtotal Financial assets and liabilities | | | Non-Financial assets and liabilities | | | Total | | | June 30, 2013 | | | | | | | | | | | | | | | | | Interest income | | | 72,813 | | | | - | | | | 72,813 | | | | - | | | | 72,813 | | | Interest expense | | | (483,772 | ) | | | - | | | | (483,772 | ) | | | - | | | | (483,772 | ) | | Foreign exchange losses, net | | | (481,696 | ) | | | - | | | | (481,696 | ) | | | - | | | | (481,696 | ) | | Dividends income | | | 23,249 | | | | - | | | | 23,249 | | | | - | | | | 23,249 | | | Capitalized borrowing costs | | | 10,307 | | | | - | | | | 10,307 | | | | - | | | | 10,307 | | | Fair value gain of financial assets at fair value through profit or loss, net | | | - | | | | 23,739 | | | | 23,739 | | | | - | | | | 23,739 | | | Loss from derivative financial instruments (except commodities) | | | - | | | | (7,567 | ) | | | (7,567 | ) | | | - | | | | (7,567 | ) | | Net loss on the revaluation of receivables arising from the sale of farmland | | | - | | | | (3,165 | ) | | | (3,165 | ) | | | - | | | | (3,165 | ) | | Gain from repurchase of Non-convertible Notes | | | 2,057 | | | | - | | | | 2,057 | | | | - | | | | 2,057 | | | Fair value gain on embedded derivatives | | | - | | | | 64 | | | | 64 | | | | - | | | | 64 | | | Other finance results | | | (64,790 | ) | | | - | | | | (64,790 | ) | | | - | | | | (64,790 | ) | | Net result | | | (921,832 | ) | | | 13,071 | | | | (908,761 | ) | | | - | | | | (908,761 | ) |
Cresud Sociedad Anónima,
Comercial, Inmobiliaria, Financiera y Agropecuaria
Notes to Consolidated Financial Statements (Continued)
(All amounts in thousands of Argentine Pesos, except shares and per share data and as otherwise indicated)
16. | Financial instruments by category (Continued)
|
Determining fair values
IFRS 9 defines the fair value of a financial instrument as the amount for which a financial asset could be exchanged, or a financial liability settled, between knowledgeable, willing parties in an arm’s length transaction. All financial instruments recognized at fair value are allocated to one of the valuation hierarchy levels of IFRS 7. This valuation hierarchy provides for three levels. The initial basis for the allocation is the “economic investment class”. Only if this does not result in an appropriate allocation the Company deviates from such an approach in individual cases. The allocation reflects which of the fair values derive from transactions in the market and where valuation is based on models because market transactions are lacking.
In the case of Level 1, valuation is based on non-adjusted quoted prices in active markets for identical financial assets or liabilities that the Group can refer to at the date of the statement of financial position. A market is deemed active if transactions take place with sufficient frequency and in sufficient quantity for price information to be available on an ongoing basis. Since a quoted price in an active market is the most reliable indicator of fair value, this should always be used if available. The financial instruments the Group has allocated to this level mainly comprise equity investments, mutual funds, government bonds and corporate bonds for which quoted prices in active markets are available. In the case of securities, the Group allocates them to this level when either a stock market price is available or prices are provided by a price quotation on the basis of actual market transactions.
In the case of Level 2, fair value is determined by using valuation methods based on inputs directly or indirectly observable in the market. If the financial instrument concerned has a fixed contract period, the inputs for valuation must be observable for the whole of this period. The financial instruments the Group has allocated to this level mainly comprise interest rate swaps and foreign currency future contracts.
In the case of Level 3, the Group uses valuation techniques not based on inputs observable in the market. This is only permissible insofar as no observable market data are available. The inputs used reflect the Group’s assumptions regarding the factors which market players would consider in their pricing. The Group uses the best available information for this, including internal company data. The financial instruments the Group has allocated to this level mainly comprise equity securities of Condor, shares, other borrowings and commitment to tender offer of shares in IDBD.
Cresud Sociedad Anónima,
Comercial, Inmobiliaria, Financiera y Agropecuaria
Notes to Consolidated Financial Statements (Continued)
(All amounts in thousands of Argentine Pesos, except shares and per share data and as otherwise indicated)
16. | Financial instruments by category (Continued)
|
The Group’s Finance Division has a team in place in charge of estimating valuation of financial assets required to be reported in the financial statements, including the fair value of Level 3 instruments. The team directly reports to the Chief Financial Officer (CFO).
The CFO and the valuation team discuss the valuation methods and results upon the acquisition of an asset and, if necessary, on a quarterly basis, in line with the Group’s quarterly reports.
According to the Group’s policy, transfers among the several categories of valuation tiers are recognized when occurred, or when there are changes in the prevailing circumstances requiring the transfer.
As described in Note 3 to the consolidated financial statements as of June 30, 2015 and for the fiscal year then ended, the Group has valued its investment in IDBD at fair value, applying the exception contemplated under IAS 28 (see Note 2 for further details). The investment in IDBD consists of 324 million common shares representing 49% of IDBD’s stock capital and 248 million warrants to purchase common shares.
Up to the third quarter ended March 31, 2015, the Group estimated that the quoted market price of IDBD’s shares in the Tel Aviv Stock Exchange represented the fair value of its investment and therefore, it valued its investment based on such quoted price, classifying this measurement as Level 1 in the fair value hierarchy.
As further described in Note 9 to the consolidated financial statements, as part of the Arrangement, Dolphin promised to make one or more Tender Offers for the purchase of IDBD’s outstanding shares at a fixed price for a total amount of NIS 512.09 million.
On October 20, 2015, a judge of the Tel Aviv-Jaffo court of first instance sustained a request filed by the trustees representing the Creditors under the Arrangement and ruled that the shares held by Dolphin or any other company controlled by Eduardo S. Elsztain would not be eligible to participate in the Tender Offers scheduled for December 2015 and December 2016. Dolphin decided to appeal against the ruling before the Supreme Court of Justice of Israel.
Although IDBD’s capital is composed of a single class of common shares, all entitled to the same rights, the judge’s ruling de facto created two classes of shares with different rights: one class that would be eligible to be tendered and another class, belonging to any company controlled by Eduardo S. Elsztain, that would not be eligible to be tendered. Since IDBD’s share carries a right to be tendered for a fixed price at a predetermined date, the quoted price contains an embedded feature representing the value of the future commitment for the Tender Offers. Upon the judge’s ruling, such value would only be representative for purposes of valuing the interest held in IDBD by parties other than Dolphin or any other company controlled by Eduardo S. Elsztain, i.e. Creditors under the Arrangement representing approximately 127 million shares of IDBD as of June 30, 2015.
16. | Financial instruments by category (Continued)
|
Based on the circumstances described above, the Group considers that the quoted market price of IDBD share would no longer be representative of the fair value of Dolphin’s interest because under the judge’s ruling, Dolphin’s shares would not have the same rights as the ones currently trading in the Tel Aviv stock exchange. As such, the Group considered departing from its Level 1 measurement (quoted market price) and considering a Level 3 measurement by using a valuation model with significant unobservable inputs to estimate the fair value of its investment in IDBD. It is the Group’s policy to recognize transfers to and from different levels in the fair value hierarchy under IFRS 13 as of the date of the event or change in the circumstances that lead to such transfer.
The Group developed an internal valuation model to determine the fair value of the IDBD shares under these circumstances. This model is principally based and is sensitive to the number of shares eligible to be tendered. In one end of the spectrum, all of the shares outstanding (Dolphin’s, any other company controlled by Eduardo S. Elsztain and the Creditors) may be tendered, and on the opposite end, only the Creditors’ shares are eligible for tendering as per the judge’s ruling. The objective of the methodology is to arrive at a fair value of the IDBD’s share by subtracting from the quoted market price the value of the right to participate in the tender offer embedded in such quoted price. The relative weight of the “right to participate in the tender offer” embedded in IDBD’s quoted market price is sensitive and varies depending on the number of shares deemed eligible for tendering. Each scenario reflects a different number of shares eligible for tendering. A probability of occurrence has been assigned to each scenario based on available evidence. This methodology results in a weighted-probability value representing the fair value of IDBD’s shares recognized in the financial statements. The Company considers this value as a reasonable proxy for the fair value of the IDBD share.
Based on the opinion of its legal counsel, Dolphin considers that it has a reasonable probability that the Supreme Court of Justice overturns the judge’s ruling. In this regard, the model assigned equal probabilities to either succeeding in or losing the appeal. In the event that Dolphin is not successful in its appeal, the Group considers that the Supreme Court may sustain the first instance’s ruling or may allow a number of shares of IDBD held by Dolphin or any other company controlled by Eduardo S. Elsztain to be tendered.
This is translated into the model as the following scenarios:
Scenario 1: “Win Scenario”
The Group has a 50% chance of succeeding in its appeal before the Supreme Court of Justice and, therefore, all of the shares held by Dolphin and any other company controlled by Eduardo S. Elsztain would be eligible to be tendered. This scenario affirms that the quoted market price of the IDBD’s shares would still be representative of the fair value, because no distinction of classes of shares is made and all continue to have the same rights as before the judge’s ruling.
Scenario 2: “Loss Scenario”
The Group has a 50% chance of not succeeding in its appeal before the Supreme Court of Justice. This scenario is further divided into various sub-scenarios depending on the number of shares – held by Dolphin or other companies controlled by Eduardo S. Elsztain- that a Supreme Court’s sentence might allow to participate in the Tender Offers. A sentence could determine different amounts of shares eligible for participating in the Tender Offers, and accordingly the Group weighed different probabilities of occurrence to the sub-scenarios based on such amounts.
This methodology is based on the following assumptions:
· | Quoted market price of IDBD share as of June 30, 2015 as published in the TASE: NIS 1.96 per share | · | Number of shares eligible to participate in the tender offer under the various scenarios and assigned probability of occurrence; and |
· | Discount rate to be applied to the fixed-price tender offer obligation of 0.07% |
Cresud Sociedad Anónima,
Comercial, Inmobiliaria, Financiera y Agropecuaria
Notes to Consolidated Financial Statements (Continued)
(All amounts in thousands of Argentine Pesos, except shares and per share data and as otherwise indicated)
16. | Financial instruments by category (Continued)
|
The following tables present the Group’s financial assets and financial liabilities that are measured at fair value as of June 30, 2015 and 2014 and their allocation to the different levels of the fair value hierarchy:
| | | June 30, 2015 | | | | | Level 1 | | | Level 2 | | | Level 3 | | | Total | | | Assets | | | | | | | | | | | | | | Financial assets at fair value through profit or loss: | | | | | | | | | | | | | | - Investment in equity securities in TGLT | | | 71,573 | | | | - | | | | - | | | | 71,573 | | | - Investment in equity securities in Avenida Inc. S.A. | | | 102,316 | | | | - | | | | - | | | | 102,316 | | | - Corporate bonds | | | 1,789 | | | | - | | | | - | | | | 1,789 | | | - Government bonds | | | 101,649 | | | | | | | | - | | | | 101,649 | | | - Mutual funds | | | 383,572 | | | | - | | | | - | | | | 383,572 | | | - Other securities in public Companies | | | 16,742 | | | | - | | | | - | | | | 16,742 | | | - Preferred Shares of Condor Hospitality Trust Inc. (formerly Supertel Hospitality Inc. due to change of corporate name) | | | - | | | | - | | | | 348,854 | | | | 348,854 | | | Derivative financial instruments: | | | | | | | | | | | | | | | | | | - Warrants of Condor Hospitality Trust Inc. (formerly Supertel Hospitality Inc. due to change of corporate name) | | | - | | | | - | | | | 7,151 | | | | 7,151 | | | - Crops futures | | | 396 | | | | - | | | | - | | | | 396 | | | - Commodities options �� | | | 1,195 | | | | - | | | | - | | | | 1,195 | | | - IDBD Warrants | | | 228,414 | | | | - | | | | - | | | | 228,414 | | | - Investments in associates | | | | | | | | | | | | | | | | | | - IDBD | | | - | | | | - | | | | 907,083 | | | | 907,083 | | | Cash and cash equivalents | | | 112,340 | | | | - | | | | - | | | | 112,340 | | | Total Assets | | | 1,019,986 | | | | - | | | | 1,263,088 | | | | 2,283,074 | | | Liabilities | | | | | | | | | | | | | | | | | | Derivative financial instruments: | | | | | | | | | | | | | | | | | | - Foreign-currency contracts | | | - | | | | 10,065 | | | | - | | | | 10,065 | | | - Crops futures | | | 11,477 | | | | - | | | | - | | | | 11,477 | | | - Commodities options | | | 8,500 | | | | - | | | | - | | | | 8,500 | | | - Commitment to tender offer shares in IDBD | | | - | | | | - | | | | 502,641 | | | | 502,641 | | | Borrowings | | | | | | | | | | | | | | | | | | - Other borrowings | | | - | | | | - | | | | 15,089 | | | | 15,089 | | | Total Liabilities | | | 19,977 | | | | 10,065 | | | | 517,730 | | | | 547,772 | |
Cresud Sociedad Anónima,
Comercial, Inmobiliaria, Financiera y Agropecuaria
Notes to Consolidated Financial Statements (Continued)
(All amounts in thousands of Argentine Pesos, except shares and per share data and as otherwise indicated)
16. | Financial instruments by category (Continued)
|
| | | June 30, 2014 | | | | | Level 1 | | | Level 2 | | | Level 3 | | | Total | | | Assets | | | | | | | | | | | | | | Financial assets at fair value through profit or loss: | | | | | | | | | | | | | | - Investment in equity securities in TGLT | | | 63,546 | | | | - | | | | - | | | | 63,546 | | | - Investment in equity securities in Hersha | | | 53,901 | | | | - | | | | - | | | | 53,901 | | | - Corporate bonds | | | 1,438 | | | | - | | | | - | | | | 1,438 | | | - Government bonds | | | 203,216 | | | | - | | | | - | | | | 203,216 | | | - Mutual funds | | | 222,760 | | | | - | | | | - | | | | 222,760 | | | - Other securities in public Companies | | | 14,614 | | | | - | | | | - | | | | 14,614 | | | - Preferred Shares of Condor Hospitality Trust Inc. (formerly Supertel Hospitality Inc. due to change of corporate name) | | | - | | | | - | | | | 211,170 | | | | 211,170 | | | Derivative financial instruments: | | | | | | | | | | | | | | | | | | - Crops futures | | | 4,750 | | | | - | | | | - | | | | 4,750 | | | - IDBD Rights (i) | | | 10,986 | | | | - | | | | - | | | | 10,986 | | | - Foreign-currency contracts | | | - | | | | 16,305 | | | | - | | | | 16,305 | | | - Interest-rate swaps | | | - | | | | 1,089 | | | | - | | | | 1,089 | | | Cash and cash equivalents | | | 24,590 | | | | - | | | | - | | | | 24,590 | | | Total Assets | | | 599,801 | | | | 17,394 | | | | 211,170 | | | | 828,365 | | | Liabilities | | | | | | | | | | | | | | | | | | Derivative financial instruments: | | | | | | | | | | | | | | | | | | - Foreign-currency future contracts | | | - | | | | 52,666 | | | | - | | | | 52,666 | | | - Commodities options | | | 753 | | | | - | | | | - | | | | 753 | | | - Commitment to tender offer shares in IDBD | | | - | | | | - | | | | 320,847 | | | | 320,847 | | | Total Liabilities | | | 753 | | | | 52,666 | | | | 320,847 | | | | 374,266 | |
(i) | On July 3 rights for the purchase of additional shares and warrants of IDBD were exercised. |
The following table presents the changes in Level 3 financial instruments for the years ended June 30, 2015 and 2014:
| | | Warrants of Condor Hospitality Trust Inc. | | | Investment in associate IDBD | | | Other borrowings | | | Preferred Shares of Condor Hospitality Trust Inc. | | | Commitment to tender offer shares in IDBD | | | Total | | | Balances as of July 1st, 2013 | | | 16,949 | | | | - | | | | - | | | | 139,120 | | | | - | | | | 156,069 | | | Currency translation adjustment | | | - | | | | - | | | | - | | | | - | | | | (5,247 | ) | | | (5,247 | ) | | Total gains or losses for the year 2013 | | | (16,949 | ) | | | - | | | | - | | | | 72,050 | | | | (315,600 | ) | | | (260,499 | ) | | Balance as of June 30, 2014 | | | - | | | | - | | | | - | | | | 211,170 | | | | (320,847 | ) | | | (109,677 | ) | | Transfers to Level 3 | | | - | | | | 1,825,449 | | | | (86,210 | ) | | | - | | | | - | | | | 1,739,239 | | | Currency translation adjustment | | | - | | | | 82,634 | | | | 18,580 | | | | - | | | | (45,260 | ) | | | 55,954 | | | Gain and losses recognized in profit or loss (i) | | | 7,151 | | | | (1,001,000 | ) | | | 52,541 | | | | 137,684 | | | | (136,534 | ) | | | (940,158 | ) | | Balance as of June 30, 2015 | | | 7,151 | | | | 907,083 | | | | (15,089 | ) | | | 348,854 | | | | (502,641 | ) | | | 745,358 | |
(i) | The gain / (loss) is not realized as of June 30, 2015 and is accounted for under “Other financial results” in the income statements (Note 36) |
Cresud Sociedad Anónima,
Comercial, Inmobiliaria, Financiera y Agropecuaria
Notes to Consolidated Financial Statements (Continued)
(All amounts in thousands of Argentine Pesos, except shares and per share data and as otherwise indicated)
16. | Financial instruments by category (Continued)
|
Upon initial recognition (January 2012), the consideration paid for the Shares and Warrants of Condor was assigned to both instruments based on the relative fair values of those instruments upon acquisition. The fair value of these instruments exceeded the transaction price and were determined using a valuation technique that uses inputs not observable in the market. As a result of the use of this technique, the Group has not recognized a gain at the time of initial recognition in the amount of US$ 7.9 million.
According to Group estimates, all factors being constant, a 10% decline in the price of the underlying assets of Level 3 Shares and Warrants of Condor (data observed in the market) as of June 30, 2015, would reduce pre-tax income by Ps. 39 million.
According to Group estimates, all factors being constant, a 10% decrease in the credit spread (data which is not observable in the market) of shares and warrants of Condor used in the valuation model applied to Level 3 financial instruments as of June 30, 2015, would increase pre-tax income by Ps. 0.15 million. The rate used as of June 30, 2015 was 14.25%.
According to Group estimates, all things being constant, a 10% decline in the price of IDBD shares, will change the value of our financial assets and liabilities related to this investment, wich are classified as Level 3 as of June 30, 2015, and would reduce pre-tax income by Ps. 127,9 million.According to Group estimates, all things being constant, assigning 100% probability to scenario 1 (succeeding in the appeal) would increase pre-tax income by Ps. 615.2 million. On the other hand, assigning 100% probability to scenario 2 (not succeeding in the appeal) would reduce pre-tax income by Ps. 615.2 million.
16. | Financial instruments by category (Continued)
|
When no quoted prices in an active market are available, fair values (particularly with derivatives) are based on recognized valuation methods. The Group uses a range of valuation models for the measurement of Level 2 and Level 3 instruments, details of which may be obtained from the following table:
Description | Pricing model | | Pricing method | | Parameters | | Range | | Foreign currency-contracts | Present value method | | Theoretical price | | Money market curve, interest-rate curve; Foreign exchange curve. | | | - | | Commitment to tender offer IDBD | Black-Scholes | | Theoretical price | | Underlying asset price; share price volatility (historical) and interest-rate curve (NIS rate curve). | | Underlying asset price 3.5 to 4.7
Share price volatility
30% to 40%
Money market interest rate 0.7% to 1%
| | Other Borrowings | Weighted probability of the difference between market price and the Commitment to tender offer of shares in IDBD | | Theoretical price | | Underlying asset price; share price volatility (historical) and interest-rate curve (NIS rate curve). IRSA 2017 interest-rate and scenario weights. | | Underlying asset price 1.55 to 2.35
Share price volatility
60% to 80%
Money market interest rate 0.02% to 0.9%
| | IDBD Shares | Weighted probability of the difference between market price and the Commitment to tender offer of shares in IDBD | | Theoretical price | | Underlying asset price; share price volatility (historical) and interest-rate curve (NIS rate curve). IRSA 2017 interest-rate and scenario weights. | | Underlying asset price 1.55 to 2.35
Share price volatility
60% to 80%
Money market interest rate 0.02% to 0.9%
| | Call option of Arcos
| Discounted cash flow | | | - | | Projected income and discounted interest rate. | | | - | | Interest rate swaps
| Cash flow | | Theoretical price | | Interest rate and cash flow forward contract. | | | - | | Preferred shares of Condor | Binomial tree | | Theoretical price | | Underlying asset price (market price), share price volatility (historical) and money market interest-rate curve (Libor rate). | | Underlying asset price 1.96 to 2.65
Share price volatility 56% to 76%
Money market interest rate 0.67% to
0.83%
| | Warrants of Condor | Black-Scholes | | Theoretical price | | Underlying asset price (market price), share price volatility (historical) and money market interest-rate curve (Libor rate). | | Underlying asset price 1.96 to 2.65
Share price volatility 56% to 76%
Money market interest rate 0.67% to
0.83%
| |
Cresud Sociedad Anónima,
Comercial, Inmobiliaria, Financiera y Agropecuaria
Notes to Consolidated Financial Statements (Continued)
(All amounts in thousands of Argentine Pesos, except shares and per share data and as otherwise indicated)
The table below shows presents the restricted assets as of June 30, 2015 and 2014:
| | | June 30, 2015 | | | June 30, 2014 | | | Non-current | | | | | | | | Mutual funds | | | 4,301 | | | | 50,897 | | | Total Non-Current | | | 4,301 | | | | 50,897 | | | Current | | | | | | | | | | Escrow deposits | | | 607,021 | | | | - | | | Total Current | | | 607,021 | | | | - | | | Total restricted assets | | | 611,322 | | | | 50,897 | |
Cresud Sociedad Anónima,
Comercial, Inmobiliaria, Financiera y Agropecuaria
Notes to Consolidated Financial Statements (Continued)
(All amounts in thousands of Argentine Pesos, except shares and per share data and as otherwise indicated)
18. | Trade and other receivables |
The table below shows trade and other receivables as of June 30, 2015 and 2014:
| | | June 30, 2015 | | | June 30, 2014 | | | Non-current | | | | | | | | Leases and services receivable | | | 62,080 | | | | 55,105 | | | Receivables from sale of agriculture products | | | 1,154 | | | | 2,090 | | | Property sales receivable (i) | | | 104,064 | | | | 154,582 | | | Less: allowance for doubtful accounts | | | (2,208 | ) | | | (2,208 | ) | | Non-current trade receivables | | | 165,090 | | | | 209,569 | | | Trade receivables from disposal of joint ventures | | | 3,595 | | | | 3,213 | | | Prepayments | | | 11,274 | | | | 14,332 | | | VAT receivables | | | 26,745 | | | | 22,342 | | | Other tax receivables | | | 73,131 | | | | 110,238 | | | Guarantee deposits | | | 17,027 | | | | 17,150 | | | Advances for shares purchases | | | 12,134 | | | | - | | | Others | | | 2,060 | | | | 1,093 | | | Non-current other receivables | | | 145,966 | | | | 168,368 | | | Related parties (Note 38) | | | 115,721 | | | | 97,412 | | | Non-current trade and other receivables | | | 426,777 | | | | 475,349 | | | Current | | | | | | | | | | Consumer financing receivables | | | 14,620 | | | | 14,861 | | | Leases and services receivable | | | 356,217 | | | | 256,123 | | | Receivables from sale of agriculture products and farmlands leases | | | 253,355 | | | | 281,711 | | | Receivables from hotel operations | | | 21,144 | | | | 33,861 | | | Deferred checks received | | | 247,030 | | | | 211,278 | | | Debtors under legal proceedings | | | 71,343 | | | | 61,573 | | | Property sales receivable (i) | | | 88,032 | | | | 131,573 | | | Less: allowance for doubtful accounts | | | (117,514 | ) | | | (88,088 | ) | | Current trade receivables | | | 934,227 | | | | 902,892 | | | Contributions to be paid in by non-controlling interests | | | - | | | | 12,840 | | | Prepayments | | | 144,982 | | | | 90,754 | | | VAT receivables | | | 51,593 | | | | 61,030 | | | Gross sales tax credit | | | 6,594 | | | | 4,957 | | | Other tax receivables | | | 36,316 | | | | 33,457 | | | Loans | | | 22,977 | | | | 12,751 | | | Expenses and services to recover | | | 3,125 | | | | 3,024 | | | Suppliers advances | | | 105,105 | | | | 144,656 | | | Guarantee deposits | | | 39,154 | | | | 49,572 | | | Dividends receivable | | | - | | | | 11,778 | | | Others | | | 37,505 | | | | 24,892 | | | Less: allowance for doubtful accounts | | | (185 | ) | | | (195 | ) | | Current other receivables | | | 447,166 | | | | 449,516 | | | Related parties (Note 38) | | | 390,980 | | | | 86,000 | | | Current trade and other receivables | | | 1,772,373 | | | | 1,438,408 | | | Total trade and other receivables | | | 2,199,150 | | | | 1,913,757 | |
(i) | Property sales receivables primarily comprise the sale of trading properties, investment properties and farmlands. |
Cresud Sociedad Anónima,
Comercial, Inmobiliaria, Financiera y Agropecuaria
Notes to Consolidated Financial Statements (Continued)
(All amounts in thousands of Argentine Pesos, except shares and per share data and as otherwise indicated)
18. | Trade and other receivables (Continued)
|
As of June 30, 2015, all non-current receivables are due within 4 years from the end of the reporting period.
The fair value of current trade and other receivables approximate their respective carrying amounts due to their short-term nature, as the impact of discounting is not considered significant. Fair values are based on discounted cash flows (Level 2 of fair value hierarchy).
The carrying amounts of the Group’s trade and other receivables denominated in foreign currencies are detailed in Note 41.
Trade receivables are generally presented in the statement of financial position net of allowances for doubtful receivables. Impairment policies and procedures by type of receivables are discussed in detail in Note 2.18.
The evolution of the Group’s provision for impairment of trade receivables are as follows:
| | | June 30, 2015 | | | June 30, 2014 | | | Beginning of the year | | | 90,491 | | | | 86,902 | | | Creation | | | 45,968 | | | | 24,150 | | | Recovery | | | (16,800 | ) | | | (13,689 | ) | | Unused amounts reversed | | | - | | | | (23 | ) | | Used during the year | | | (1,924 | ) | | | (9,347 | ) | | Currency translation adjustment | | | 2,172 | | | | 2,498 | | | End of the year | | | 119,907 | | | | 90,491 | |
The creation and release of provision for impairment receivables have been included in “Selling expenses” in the income statements (Note 33). Amounts charged to the provision account are generally written off when there is no expectation of recovering additional cash.
The Group’s trade receivables comprise several classes. The maximum exposure to credit risk at the reporting date is the carrying value of each class of credit.
The Company has also receivables with related parties. Neither of which are due nor impaired.
Cresud Sociedad Anónima,
Comercial, Inmobiliaria, Financiera y Agropecuaria
Notes to Consolidated Financial Statements (Continued)
(All amounts in thousands of Argentine Pesos, except shares and per share data and as otherwise indicated)
18. | Trade and other receivables (Continued)
|
Due to the distinct characteristics of each type of receivables, an aging analysis of past due unimpaired and impaired receivables are shown by type and class as of June 30, 2015 and 2014 (includes receivables not past due to reconcile with the amounts in the statements of financial position):
| | | Expired | | | | | | | | | | | | | | Up to 3 months | | | 3 to 6 months | | | Over 6 months | | | Not past due | | | Allowance | | | Total | | | Leases and services | | | 39,737 | | | | 10,437 | | | | 13,986 | | | | 562,113 | | | | 69,846 | | | | 696,119 | | | Office leases | | | 3,761 | | | | 3,645 | | | | 1,801 | | | | 11,888 | | | | 9,540 | | | | 30,635 | | | Hotel leases and services | | | 854 | | | | - | | | | - | | | | 16,195 | | | | 757 | | | | 17,806 | | | Consumer financing: | | | | | | | | | | | | | | | | | | | | | | | | | | Credit card | | | - | | | | - | | | | - | | | | 4,635 | | | | 14,620 | | | | 19,255 | | | Disposal of properties | | | 64 | | | | 63 | | | | 277 | | | | 184,388 | | | | 9,170 | | | | 193,962 | | | Agriculture products | | | 42,126 | | | | 1,191 | | | | 3,415 | | | | 198,741 | | | | 15,789 | | | | 261,262 | | | Total as of June 30, 2015 | | | 86,542 | | | | 15,336 | | | | 19,479 | | | | 977,960 | | | | 119,722 | | | | 1,219,039 | | | Leases and services | | | 25,767 | | | | 9,555 | | | | 11,312 | | | | 423,334 | | | | 56,405 | | | | 526,373 | | | Office leases | | | 5,845 | | | | 708 | | | | 8,177 | | | | 3,272 | | | | 7,968 | | | | 25,970 | | | Hotel leases and services | | | 16,890 | | | | - | | | | - | | | | 16,583 | | | | 388 | | | | 33,861 | | | Consumer financing: | | | | | | | | | | | | | | | | | | | | | | | | | | Credit card | | | - | | | | - | | | | - | | | | - | | | | 14,861 | | | | 14,861 | | | Disposal of properties | | | 11,120 | | | | 43 | | | | 218 | | | | 276,174 | | | | 2,512 | | | | 290,067 | | | Agriculture products | | | 22,673 | | | | 121 | | | | 3,621 | | | | 277,048 | | | | 8,162 | | | | 311,625 | | | Total as of June 30, 2014 | | | 82,295 | | | | 10,427 | | | | 23,328 | | | | 996,411 | | | | 90,296 | | | | 1,202,757 | |
Leases and services receivables from investment properties:
Trade receivables related to leases and services provided from shopping centers and offices represent 40% and 31% of the Group’s total trade receivables as of June 30, 2015 and 2014, respectively. The Group has a large customer base and is not dependent on any single customer. Leases and services receivables that are not due and for which no allowance has been recorded relate to a wide and varied number of customers for whom there is no external credit rating available. Most of these customers have reached a minimum period of six months and have no previous non-compliance records. New customers with less than six months are regularly monitored. At the end of the year, the Group has not experience credit issues with these new customers.
As of June 30, 2015 and 2014 the Group recognized losses from impairment of leases and services receivables for an amount of Ps. 15.4 million and Ps. 12.9 million, respectively.
Cresud Sociedad Anónima,
Comercial, Inmobiliaria, Financiera y Agropecuaria
Notes to Consolidated Financial Statements (Continued)
(All amounts in thousands of Argentine Pesos, except shares and per share data and as otherwise indicated)
18. | Trade and other receivables (Continued)
|
Consumer financing receivables:
Trade receivables related to the residual consumer activities of the Group represent only 1% and 1% of the Group’s total trade receivables as of June 30, 2015 and 2014, respectively
As of June 30, 2015, the Group has recorded the recovery of consumer financing receivables in the amount of Ps. 0.2 million, whereas as of June 30, 2014 the Group provided for recorded net gains (losses) on impairment of consumer financing receivables for an amount of Ps. 0,9 million. The estimation of the credit risk is complex and requires the use of rating and scoring models which are essential to measure default risk. In measuring the consumption credit risks of credit purchases made through credit cards and cash advances, the Group considers two components: (i) the probability of default by client or counterparty, and (ii) the likeable recovery rate of obligations in arrears. The models are reviewed regularly to check their effectiveness with respect to actual performance and, where necessary, to enhance them.
Receivables from the disposal of properties:
Trade receivables related to the disposal of properties represent 17% and 26% of the Group’s total trade receivables as of June 30, 2015 and 2014, respectively. Payments on these receivables are generally received when due and are generally secured by mortgages on the properties, thus credit risk on outstanding amounts is considered low.
As of June 30, 2015, the Group recorded losses under receivables from the disposal of property in the amount of Ps. 6.7 million, whereas as of June 30, 2014 the Group recorded the recovery of receivables from the disposal of property in the amount of Ps. 0.3 million.
Receivables from the sale of agriculture products:
Trade receivables related to the sale of agriculture products and farmlands leases represent 23% and 26% of the Group’s total trade receivables as of June 30, 2015 and 2014, respectively. The Group has a large customer base and is not dependent on any single customer.
As of June 30, 2015 and 2014, the Company has recognized losses with respect to receivables from the sale of agriculture products for an amount of Ps. 7.6 million and Ps. 8.2 million, respectively.
Cresud Sociedad Anónima,
Comercial, Inmobiliaria, Financiera y Agropecuaria
Notes to Consolidated Financial Statements (Continued)
(All amounts in thousands of Argentine Pesos, except shares and per share data and as otherwise indicated)
18. | Trade and other receivables (Continued)
|
As of June 30, 2015 and 2014, approximately 73% and 75% of the outstanding unimpaired receivables from the sale of agricultural products (neither past due nor impaired), respectively, relate to sales to 10 and 12 well-known companies with good credit quality standing. These entities or their parents have an available external credit rating. The Group reviews theses external ratings in credit agencies. As of June 30, 2015 and 2014, the remaining percentage of the outstanding unimpaired receivables from the sale of agricultural products is related to sales to a large number of customers whose external rating is not available. However, the total number of clients without an external credit rating is relatively stable. Most customers for which an external credit rating is unavailable are customers with more than six months in the Company and have had no defaults in the past. New customers with less than six months are regularly monitored. To date, the Group has not experience credit issues with these new customers.
Cresud Sociedad Anónima,
Comercial, Inmobiliaria, Financiera y Agropecuaria
Notes to Consolidated Financial Statements (Continued)
(All amounts in thousands of Argentine Pesos, except shares and per share data and as otherwise indicated)
19. | Investment in financial assets |
The following table shows investments in financial assets as of June 30, 2015 and 2014:
| | | June 30, 2015 | | | June 30, 2014 | | | Non-current | | | | | | | | Financial assets at fair value | | | | | | | | Investment in equity securities in TGLT (i) | | | 71,573 | | | | 63,546 | | | Investment in equity securities in Avenida Inc. S.A. | | | 102,316 | | | | - | | | Investments in equity securities of Condor Hospitality Trust Inc. (formerly Supertel Hospitality Inc. due to change of corporate name) | | | 348,854 | | | | 211,170 | | | Non-convertible notes related parties (Note 38) | | | 100,000 | | | | - | | | Other securities in public companies | | | 102 | | | | 296 | | | Total Investment in financial assets non-current | | | 622,845 | | | | 275,012 | | | Current | | | | | | | | | | Financial assets at fair value | | | | | | | | | | Mutual funds | | | 383,572 | | | | 222,760 | | | Investment in equity securities in Hersha (ii) | | | - | | | | 53,901 | | | Non-convertible notes related parties (Note 38) | | | 452 | | | | - | | | Corporate bonds | | | 1,789 | | | | 1,438 | | | Government bonds | | | 101,649 | | | | 203,216 | | | Other securities in public companies | | | 16,640 | | | | 14,318 | | | Total Investment in financial assets current | | | 504,102 | | | | 495,633 | | | Total Investment in financial assets | | | 1,126,947 | | | | 770,645 | |
(i) | On November 4, 2010, the Group, acquired 5,214,662 shares of common stock of TGLT following TGLT initial public offering in the Buenos Aires Stock Exchange for Ps. 47.1 million in cash. TGLT is a residential housing developer with operations in Argentina and Uruguay. Following the initial acquisition, through successive purchases, the Group acquired 1,474,359 additional TGLT shares for an aggregate of Ps. 13.1 million. As of June 30, 2015, the Group’s interest in TGLT amounted to 6,689,021 shares, representing 9.51% of the capital stock. |
(ii) | As of June 30, 2014, the balances consist of the Group’s interest in Hersha of 0.498%. Hersha is a Real Estate Investment Trust (REIT) listed in the NYSE, with interests in hotels throughout the United States of America. |
Book value of the Group's investments in financial instruments denominated in foreign currencies is detailed in Note 41.
The maximum exposure to credit risk at the reporting date is the carrying value of these assets.
Cresud Sociedad Anónima,
Comercial, Inmobiliaria, Financiera y Agropecuaria
Notes to Consolidated Financial Statements (Continued)
(All amounts in thousands of Argentine Pesos, except shares and per share data and as otherwise indicated)
20. | Derivative financial instruments |
Group’s derivative financial instruments as of June 30, 2015 and 2014 are as follows:
| | | June 30, 2015 | | | June 30, 2014 | | | Assets | | | | | | | | Non-current | | | | | | | | Commodities options | | | 1,195 | | | | - | | | Foreign-currency contracts | | | - | | | | 233 | | | Warrant IDBD | | | 199,256 | | | | - | | | Warrant Condor Hospitality Trust Inc. (i) | | | 7,151 | | | | - | | | Total non-current | | | 207,602 | | | | 233 | | | Current | | | | | | | | | | Crops futures | | | 396 | | | | 4,750 | | | Warrant IDBD (Note 3) | | | 29,158 | | | | 10,986 | | | Foreign-currency contracts (Note 38) | | | - | | | | 16,072 | | | Interest-rate swaps | | | - | | | | 1,089 | | | Total Current | | | 29,554 | | | | 32,897 | | | Total assets | | | 237,156 | | | | 33,130 | | | | | | | | | | | | | Liabilities | | | | | | | | | | Non-current | | | | | | | | | | Commodities options | | | 1,863 | | | | - | | | Foreign-currency contracts | | | 3,030 | | | | - | | | Commitment to tender offer shares in IDBD (Note 3) | | | 265,056 | | | | 320,847 | | | Total non-current | | | 269,949 | | | | 320,847 | | | Current | | | | | | | | | | Commodities options | | | 6,637 | | | | 753 | | | Crops futures | | | 11,477 | | | | - | | | Commitment to tender offer shares in IDBD (Note 3) | | | 237,585 | | | | - | | | Foreign-currency contracts | | | 7,035 | | | | 52,666 | | | Total Current | | | 262,734 | | | | 53,419 | | | Total liabilities | | | 532,683 | | | | 374,266 | |
(i)The balance represents the fair value of Condor Hospitality Trus Inc.’s warrants, which were acquired in February 2012.
Book value of Group's derivative financial instruments denominated in foreign currencies is detailed in Note 41.
The maximum exposure to credit risk at the reporting date is the carrying value of derivative financial instruments.
Cresud Sociedad Anónima,
Comercial, Inmobiliaria, Financiera y Agropecuaria
Notes to Consolidated Financial Statements (Continued)
(All amounts in thousands of Argentine Pesos, except shares and per share data and as otherwise indicated)
21. | Cash flow information |
| | | June 30, 2015 | | | June 30, 2014 | | | June 30, 2013 | | | Cash at bank and on hand | | | 437,337 | | | | 724,900 | | | | 769,485 | | | Short-term bank deposits | | | 84,016 | | | | 251,822 | | | | 148,221 | | | Financial trust | | | - | | | | 1,675 | | | | - | | | Mutual funds | | | 112,340 | | | | 24,590 | | | | 129,880 | | | Total cash and cash equivalents | | | 633,693 | | | | 1,002,987 | | | | 1,047,586 | |
Following is a detailed description of cash flows generated by the Group’s operations for the years ended as of June 30, 2015, 2014 and 2013:
| | | | June 30, 2015 | | | June 30, 2014 | | | June 30, 2013 | | | Profit (Loss) for the year | | | | 176,211 | | | | (1,408,408 | ) | | | 154,263 | | Adjustments for: | | | | | | | | | | | | | | | Income tax expense | 28 | | | 303,350 | | | | (389,415 | ) | | | 33,519 | | | Depreciation and amortization | 10,11,13 | | | 257,822 | | | | 296,919 | | | | 279,738 | | | Gain from disposal of investment property | | | | (1,150,230 | ) | | | (230,918 | ) | | | (177,999 | ) | | Gain from disposal of farmlands | | | | (550,462 | ) | | | (91,356 | ) | | | (149,584 | ) | | Loss / (Gain) from disposal of property, plant and equipment | 35 | | | 893 | | | | 366 | | | | (1,379 | ) | | (Gain) / Loss on the revaluation of receivables arising from the sale of farmland | | | | (52,984 | ) | | | (20,751 | ) | | | 3,165 | | | Disposal of unused intangible assets | | | | 380 | | | | 162 | | | | - | | | Release of investment property and property, plant and equipment | | | | 1,963 | | | | 2,623 | | | | 5,226 | | | Dividends income | | | | (16,622 | ) | | | (15,041 | ) | | | (23,249 | ) | | Share-based payments | | | | 30,823 | | | | 68,614 | | | | 10,549 | | | Unrealized loss / (gain) on derivative financial instruments | 35, 36 | | | 131,006 | | | | 350,133 | | | | (49,468 | ) | | Changes in fair value of investments in financial assets | 36 | | | (187,529 | ) | | | (379,091 | ) | | | (23,739 | ) | | Interest expense, net | 36 | | | 773,659 | | | | 596,246 | | | | 400,652 | | | Unrealized initial recognition and changes in fair value of biological assets and agricultural produce at the point of harvest. | | | | (105,094 | ) | | | (405,771 | ) | | | (176,471 | ) | | Changes in the net realizable value of agricultural produce after harvest | | | | 34,471 | | | | 17,447 | | | | (11,756 | ) | | Provisions | | | | 90,244 | | | | 112,653 | | | | 98,723 | | | Share of profit of associates and joint ventures | 8,9 | | | 1,024,972 | | | | 408,651 | | | | 9,818 | | | Reversal of currency translation adjustment | | | | (188,323 | ) | | | - | | | | - | | | Unrealized foreign exchange, net | | | | 645,098 | | | | 1,946,071 | | | | 517,755 | | | Loss from repurchase of Non-convertible Notes | | | | 1,945 | | | | 44,688 | | | | - | | | Gain from purchase of subsidiaries | | | | - | | | | - | | | | (136,724 | ) | | Gain from disposal of equity interest in subsidiaries, associates and joint ventures | | | | (22,075 | ) | | | - | | | | (15,433 | ) | | Changes in operating assets and liabilities: | | | | | | | | - | | | | | | | Decrease in biological assets | | | | 114,618 | | | | 286,554 | | | | 286,731 | | | Increase in inventories | | | | (131,678 | ) | | | (196,831 | ) | | | (56,929 | ) | | Decrease in trading properties | | | | 44 | | | | 7,145 | | | | 4,466 | | | (Decrease) Increase in trade and other receivables | | | | (479,919 | ) | | | 268,270 | | | | (265,428 | ) | | (Decrease) Increase in derivative financial instruments | | | | 4,225 | | | | (6,331 | ) | | | (32,019 | ) | | (Decrease) Increase in trade and other payables | | | | 144,786 | | | | (169,958 | ) | | | 220,067 | | | Increase in payroll and social security liabilities | | | | 84,939 | | | | 71,633 | | | | 19,734 | | | (Decrease) Increase in provisions | | | | (12,112 | ) | | | (1,230 | ) | | | 7,090 | | | Net cash generated from operating activities before income tax paid | | | | 924,421 | | | | 1,163,074 | | | | 931,318 | |
Cresud Sociedad Anónima,
Comercial, Inmobiliaria, Financiera y Agropecuaria
Notes to Consolidated Financial Statements (Continued)
(All amounts in thousands of Argentine Pesos, except shares and per share data and as otherwise indicated)
21. | Cash flow information (Continued)
|
The following table shows a detail of significant non-cash transactions occurred in the years ended June 30, 2015, 2014 and 2013:
| | | June 30, 2015 | | | June 30, 2014 | | | June 30, 2013 | | | Increase in restricted funds from the sale of farmlands | | | 590,490 | | | | - | | | | - | | | Reimbursement of expired dividends | | | 811 | | | | 2,771 | | | | - | | | Dividends payable | | | 42,772 | | | | 56,625 | | | | 4,169 | | | Decrease of borrowings trough a decrease in investment in associates and joint ventures | | | 136,685 | | | | - | | | | - | | | Increase of financial assets through a decrease in investment in associates and joint ventures | | | 30,089 | | | | - | | | | - | | | Increase in investments in associates and joint ventures through a decrease in financial assets | | | 12,744 | | | | - | | | | - | | | Decrease of investment in associates and joint venture through an increase in trade and other receivables | | | - | | | | 476 | | | | - | | | Decrease in equity through an increase in trade and other payables | | | - | | | | - | | | | 1,164 | | | Decrease in equity through an increase in borrowings | | | - | | | | - | | | | 1,640 | | | Decrease of investment in subsidiaries through an increase in trade and other receivables | | | - | | | | - | | | | 20,869 | | | Increase of investment in joint ventures through a decrease in trade and other receivables | | | - | | | | - | | | | 13,175 | | | Increase in property, plant and equipment through an increase in trade and other payables and borrowings | | | 2,326 | | | | 756 | | | | 2,480 | | | Decrease in property, plant and equipment and investment properties through an increase in trade and other receivables | | | - | | | | 23,581 | | | | 174,847 | | | Decrease in intangible assets through an increase in assets held for sale | | | - | | | | 77,085 | | | | - | | | Increase in trading properties through a decrease in intangible assets | | | - | | | | 7,150 | | | | - | | | Decrease in trading properties through a decrease in trade and other payables | | | 1,135 | | | | - | | | | - | | | Decrease in investment properties through an increase in property, plant and equipment | | | - | | | | 12,231 | | | | - | | | Decrease in investment properties through an increase in trade and other receivables | | | - | | | | - | | | | 118,936 | | | Decrease in investment properties through an increase in intangible assets | | | - | | | | 998 | | | | - | | | Decrease in investment properties through an increase in assets held for sale | | | - | | | | 1,098,990 | | | | - | | | Decrease in trade and other receivables through an increase in assets held for sale | | | - | | | | 17,990 | | | | - | | | Decrease in trade and other receivables through a decrease in borrowings | | | - | | | | - | | | | 12,503 | | | Decrease in trade and other payables through an increase in liabilities directly associated with assets classified as held for sale | | | - | | | | 170,245 | | | | - | | | Decrease in borrowings through an increase in liabilities directly associated with assets classified as held for sale | | | - | | | | 603,021 | | | | - | | | Decrease in deferred income tax liabilities through an increase in liabilities directly associated with assets classified as held for sale | | | - | | | | 33,346 | | | | - | | | Increase in restricted assets through a decrease in trade and other payables | | | - | | | | 146,394 | | | | - | | | Stock plan granted | | | (15,718 | ) | | | - | | | | - | | | Distribution of treasury stock | | | (54,876 | ) | | | - | | | | - | | | Options expired | | | 106,134 | | | | - | | | | - | | | Distribution of dividends not yet paid | | | 4,594 | | | | - | | | | - | | | Decrease in derivative financial instruments through an increase in assets held for sale | | | - | | | | 299 | | | | - | | | Decrease in restricted assets through an increase in assets held for sale | | | 8,742 | | | | 163,501 | | | | - | | | Decrease in borrowings trough an increase of investment in associates, subsidiaries and joint ventures | | | - | | | | 23,829 | | | | - | | | Increase in investments in financial assets through an increase in borrowings | | | - | | | | - | | | | 18,767 | |
Cresud Sociedad Anónima,
Comercial, Inmobiliaria, Financiera y Agropecuaria
Notes to Consolidated Financial Statements (Continued)
(All amounts in thousands of Argentine Pesos, except shares and per share data and as otherwise indicated)
22. | Trade and other payables |
The table below shows trade and other payables as of June 30, 2015 and 2014:
| | | June 30, 2015 | | | June 30, 2014 | | | Non-current | | | | | | | | Admission rights | | | 146,036 | | | | 113,617 | | | Sales, rent and services payments received in advance | | | 63,986 | | | | 51,638 | | | Guarantee deposits | | | 6,236 | | | | 6,759 | | | Total non-current trade payables | | | 216,258 | | | | 172,014 | | | Other tax payables | | | 6,404 | | | | 9,166 | | | Deferred income | | | 7,420 | | | | 7,914 | | | Shareholders’ personal tax payable | | | 865 | | | | 1,170 | | | Tax amnesty plan for payable taxes | | | 24,268 | | | | 15,014 | | | Others | | | 8,793 | | | | 11,287 | | | Total non-current other payables | | | 47,750 | | | | 44,551 | | | Related parties (Note 38) | | | 46 | | | | 195 | | | Total non-current trade and other payables | | | 264,054 | | | | 216,760 | | | Current | | | | | | | | | | Trade payables | | | 301,719 | | | | 289,825 | | | Accrued invoices | | | 222,831 | | | | 173,193 | | | Admission rights | | | 142,709 | | | | 111,024 | | | Sales, rent and services payments received in advance | | | 226,237 | | | | 244,700 | | | Guarantee deposits | | | 14,302 | | | | 13,413 | | | Total current trade payables | | | 907,798 | | | | 832,155 | | | Withholdings tax | | | 6,048 | | | | 3,020 | | | VAT payables | | | 43,953 | | | | 28,521 | | | Gross sales tax payable | | | 2,004 | | | | 1,150 | | | Other tax payables | | | 110,257 | | | | 59,303 | | | Deferred revenue | | | 24,366 | | | | 495 | | | Dividends payable | | | 123,888 | | | | 24,032 | | | Tax amnesty plan for payable taxes | | | 280 | | | | 306 | | | Shareholders’ personal tax payable | | | 4,666 | | | | 5,076 | | | Others | | | 30,174 | | | | 11,117 | | | Total current other payables | | | 345,636 | | | | 133,020 | | | Related parties (Note 38) | | | 53,401 | | | | 39,005 | | | Total current trade and other payables | | | 1,306,835 | | | | 1,004,180 | | | Total trade and other payables | | | 1,570,889 | | | | 1,220,940 | |
The fair values of current trade and other payables approximate their respective carrying amounts due to their short-term nature, as the impact of discounting is considered as not significant. Fair values are based on discounted cash flows (Level 2 of fair value hierarchy).
Book value of Group's trade and other payables denominated in foreign currencies are detailed in Note 41.
Cresud Sociedad Anónima,
Comercial, Inmobiliaria, Financiera y Agropecuaria
Notes to Consolidated Financial Statements (Continued)
(All amounts in thousands of Argentine Pesos, except shares and per share data and as otherwise indicated)
23. | Payroll and social security liabilities |
The table below shows payroll and social security liabilities as of June 30, 2015 and 2014:
| | | June 30, 2015 | | | June 30, 2014 | | | Non-current | | | | | | | | Provision for vacations and bonuses | | | 1,594 | | | | - | | | Social security liabilities | | | 2,323 | | | | 4,598 | | | Others | | | 1,622 | | | | 443 | | | Non-current payroll and social security liabilities | | | 5,539 | | | | 5,041 | | | Current | | | | | | | | | | Provision for vacations and bonuses | | | 184,316 | | | | 166,276 | | | Social security liabilities | | | 38,619 | | | | 28,600 | | | Salaries payable | | | 3,066 | | | | 2,247 | | | Share-based payments | | | 852 | | | | - | | | Others | | | 3,547 | | | | 5,423 | | | Current payroll and social security liabilities | | | 230,400 | | | | 202,546 | | | Total payroll and social security liabilities | | | 235,939 | | | | 207,587 | |
The Group is subject to several Argentine laws, regulations and business practices. In the ordinary course of business, the Group is subject to certain contingent liabilities with respect to existing or potential claims, lawsuits and other proceedings, including those involving tax, labor and social security, administrative and civil and other matters. The Group accrues liabilities when it is probable that future costs will be incurred and can reasonably estimate them. The Group bases its accruals on up-to-date developments, estimates of the outcomes of the matters and legal counsel experience in contesting, litigating and settling matters. As the scope of the liabilities becomes better defined or more information is available, the Group may be required to change its estimates of future costs, which could have a material effect on its results of operations and financial condition or liquidity.
The table below shows the movements in the Group's provisions for other liabilities categorized by type of provision:
| | | Labor and legal claims | | | Tax and social security claims | | | Investments in associates and joint ventures (i) | | | Total | | | At June 30, 2013 | | | 47,054 | | | | 1,691 | | | | 39,091 | | | | 87,836 | | | Additions | | | 31,710 | | | | 478 | | | | 115,359 | | | | 147,547 | | | Used/ recovered during fiscal year | | | (21,088 | ) | | | (577 | ) | | | - | | | | (21,665 | ) | | Contributions | | | - | | | | - | | | | (16,667 | ) | | | (16,667 | ) | | Currency translation adjustment | | | 4,947 | | | | - | | | | 39,199 | | | | 44,146 | | | At June 30, 2014 | | | 62,623 | | | | 1,592 | | | | 176,982 | | | | 241,197 | | | Additions | | | 47,479 | | | | 285 | | | | 159,022 | | | | 206,786 | | | Used/ recovered during fiscal year | | | (32,767 | ) | | | (399 | ) | | | (59 | ) | | | (33,225 | ) | | Contributions | | | - | | | | - | | | | (1,522 | ) | | | (1,522 | ) | | Currency translation adjustment | | | 175 | | | | - | | | | 28,508 | | | | 28,683 | | | At June 30, 2015 | | | 77,510 | | | | 1,478 | | | | 362,931 | | | | 441,919 | |
(i)Corresponds to equity interests in associates and joint ventures with negative equity.
Cresud Sociedad Anónima,
Comercial, Inmobiliaria, Financiera y Agropecuaria
Notes to Consolidated Financial Statements (Continued)
(All amounts in thousands of Argentine Pesos, except shares and per share data and as otherwise indicated)
24. | Provisions (Continued)
|
The analysis of total provisions is as follows:
| | | June 30, 2015 | | | June 30, 2014 | | | Non-current | | | 386,948 | | | | 220,489 | | | Current | | | 54,971 | | | | 20,708 | | | | | | 441,919 | | | | 241,197 | |
Included within provisions are certain amounts the Group provided for the following cases which are further detailed below:
Litigation with Exagrind S.A.
Cresud filed a lawsuit through Inversiones Ganaderas S.A. (IGSA) (a former subsidiary merged with the Company) on claims for damages and losses produced by a fire in one of the Company's farms, “San Rafael” farm, which is close to Exagrind’s property, Tali Sumaj, in the Province of Catamarca, Argentina. The fire took place on September 6, 2000. Exagrind claimed an amount of Ps. 2.9 million at that date. The extraordinary appeal to the High Court of Justice of the Province of Catamarca, questioning the resolution that ended the term to respond the case, arguing that at that moment, the period was not completed, was favorably received. Therefore, Cresud finally responded the case and showed proofs. As of the consolidated financial statements date, the parties have been notified that the term to submit allegations has started to run. In March 2007, the court ordered an inhibition of assets which was subsequently lifted. This decision was lifted in June 2007 and Tali Sumaj farm on attachment has been accepted in replacement. Exagrind S.A. requested that the measure be extended with an attachment of bank accounts; this ruling has been challenged and to date the accounts have not been attached. In June, 2010, the Company sold the farm to a third party. Since the litigation is still pending, the bond posted in favor of the buyer remains effective as security for the obligations undertaken The Group has recorded a provision amounting to Ps. 1.5 million, which is included within “Labor, legal and other claims”.
In addition, the Group is involved in several legal proceedings, including tax, labor, civil, administrative and other matters for which the Group has not established provisions based on the information assessed to date. In the opinion of management, the ultimate disposition of any threatened or pending matters, either individually or collectively, will not have a material adverse effect on the consolidated financial position, liquidity and results of operations of the Group. For ease of presentation, the Group has categorized these matters between those arising out of the Group’s agricultural and agro-industrial activities and those arising out of the Group’s investment and development properties business activities:
Cresud Sociedad Anónima,
Comercial, Inmobiliaria, Financiera y Agropecuaria
Notes to Consolidated Financial Statements (Continued)
(All amounts in thousands of Argentine Pesos, except shares and per share data and as otherwise indicated)
24. | Provisions (Continued)
|
Real Estate Business
Acquisition of the building known as Ex- Escuela Gobernador Vicente de Olmos (City of Córdoba)
On November 20, 2006, the Group, through IRSA Propiedades Comerciales S.A., acquired through a public bidding the building known as Ex-Escuela Gobernador Vicente de Olmos located in the city of Córdoba for the amount of Ps. 32,522. As explained in Note 29, this property is affected to a concession contract.
After the title deed was made, the government of the province of Córdoba declared the property to be of public use and subject to partial expropriation in order to be used exclusively for the Libertador San Martin theatre.
IRSA Propiedades Comerciales S.A. has answered a complaint in an action and to challenge the law that declared such public interest on unconstitutional grounds. In the alternative, it has challenged the appraisal made by the plaintiff and, additionally, it has claimed damages not included in the appraisal and resulting immediately and directly from expropriation.
At June 30, 2015, the property is still operated by the Group and is recorded under Investment properties.
Cresud Sociedad Anónima,
Comercial, Inmobiliaria, Financiera y Agropecuaria
Notes to Consolidated Financial Statements (Continued)
(All amounts in thousands of Argentine Pesos, except shares and per share data and as otherwise indicated)
Group’s borrowings at June 30, 2015 and 2014 are as follows:
| | | | | | | | | | Book Value | | | | Secured/ unsecured | Currency | Fixed/ Floating | Effective Interest rate % | | Nominal value (in million) | | | June 30, 2015 | | | June 30, 2014 | | | Non-current | | | | | | | | | | | | | | | CRESUD NCN Class XIV due 2018 | Unsecured | US$ | Fixed | 1.50% | | | 32 | | | | 290,205 | | | | 259,192 | | | CRESUD NCN Class XV due 2015 | Unsecured | Ps. | Floating | Badlar + 400 bps | | | 176 | | | | - | | | | 117,299 | | | CRESUD NCN Class XVI due 2018 | Unsecured | US$ | Fixed | 1.50% | | | 109 | | | | 998,594 | | | | 896,032 | | | CRESUD NCN Class XVIII due 2019 | Unsecured | US$ | Fixed | 4.00% | | | 34 | | | | 308,022 | | | | - | | | CRESUD NCN Class XIX due 2016 | Unsecured | Ps. | Floating | Badlar + 350 bps | | | 187 | | | | 185,684 | | | | - | | | CRESUD NCN Class XX due 2017 (iii) | Unsecured | US$ | Fixed | 2.50% | | | 18.2 | | | | 56,278 | | | | - | | | IRSA NCN Class I due 2015 | Unsecured | Ps. | Floating | Badlar + 395 bps | | | - | | | | - | | | | 209,297 | | | IRSA NCN Class II due 2017 | Unsecured | Ps. | Floating | Badlar + 450 bps | | | 10.8 | | | | 10,730 | | | | 10,734 | | | IRSA NCN Class I due 2017 | Unsecured | US$ | Fixed | 8.50% | | | 149 | | | | 1,352,655 | | | | 1,210,359 | | | IRSA NCN Class II due 2020 | Unsecured | US$ | Fixed | 11.50% | | | 139.5 | | | | 1,202,130 | | | | 1,070,428 | | | IRSA Propiedades Comerciales NCN Class I due 2017 | Unsecured | US$ | Fixed | 7.88% | | | 114.3 | | | | 1,021,782 | | | | 839,081 | | | Syndicated loan (iv) | Unsecured | Ps. | Fixed | (iv) | | | 126.5 | | | | - | | | | 74,964 | | | Long term loans | Unsecured | US$ | Floating | Libor + 300 bps or 6% (the higher) | | | 15 | | | | 117,574 | | | | 111,363 | | | Long term loans | Unsecured | Ps. | Floating | Rate Survey PF 30-59 days | | | 20 | | | | 9,911 | | | | 16,665 | | | Long term loans | Unsecured | Ps. | Fixed | 15.01% | | | 24 | | | | - | | | | 6,804 | | | Long term loans | Secured | Rs. | Floating | 4.00 to 7.23 and TJLP + 3.45 to 4.45 Selic | | | - | | | | 155,727 | | | | 204,012 | | | Seller financing (v) | Secured | US$ | Fixed | 3.50% | | | 6.8 | | | | 70,959 | | | | 121,256 | | | Finance lease obligations | Secured | US$ | Fixed | 10.75% - 7.14% to 13.28% | | | 0.5 | | | | 1,389 | | | | 1,187 | | | Finance lease obligations | Unsecured | Rs. | Fixed | 6.92% | | | | | | | 12,308 | | | | - | | | Long term loans (vi) | Unsecured | Ps. | Fixed | (vi) | | | 14.3 | | | | 8,158 | | | | 13,359 | | | Long term loans | Secured | Bol. | Floating | 7% to 10.19% | | | 13.5 | | | | 3,396 | | | | 5,799 | | | Long term loans | Secured | Rs. | Floating | TJLP + 3.00 to 3.10 | | | - | | | | 5,028 | | | | 5,946 | | | Long term loans | Secured | Rs. | Floating | 5.50 to 8.70 | | | - | | | | 331 | | | | 3,900 | | | Related parties | Unsecured | Ps. | Fixed/ Floating | | | | | | | | 22,112 | | | | 137,658 | | | Non-current borrowings | | | | | | | | | | | 5,832,973 | | | | 5,315,335 | |
Cresud Sociedad Anónima,
Comercial, Inmobiliaria, Financiera y Agropecuaria
Notes to Consolidated Financial Statements (Continued)
(All amounts in thousands of Argentine Pesos, except shares and per share data and as otherwise indicated)
25. | Borrowings (Continued)
|
| | | | | | | | | | | | | | | | Book value | | | | | | Secured/ unsecured | | | Currency | | | Fixed/ Floating | | Effective Interest rate % | | Nominal value (in million) | | | June 30, 2015 | | | June 30, 2014 | | Current | | | | | | | | | | | | | | | | | | | | CRESUD NCN Class VIII due 2014 | | Unsecured | | | US$ | | | Fixed | | 7.5% | | | 60 | | | | - | | | | 499,113 | | | CRESUD NCN Class XI due 2015 (i) | | Unsecured | | | Ps. | | | Floating | | Badlar + 375 bps | | | 80.5 | | | | - | | | | 39,647 | | | CRESUD NCN Class XII due 2014 | | Unsecured | | | Ps. | | | Floating | | Badlar + 410 bps | | | 102 | | | | - | | | | 69,971 | | | CRESUD NCN Class XIII due 2015 | | Unsecured | | | US$ | | | Fixed | | 1.90% | | | 79 | | | | - | | | | 644,965 | | | CRESUD NCN Class XIV due 2018 | | Unsecured | | | US$ | | | Fixed | | 1.50% | | | 32 | | | | 102 | | | | 150 | | | CRESUD NCN Class XV due 2015 | | Unsecured | | | Ps. | | | Floating | | Badlar + 400 bps | | | 176 | | | | 120,760 | | | | 63,883 | | | CRESUD NCN Class XVI due 2018 | | Unsecured | | | US$ | | | Fixed | | 1.50% | | | 109 | | | | 4,986 | | | | 4,222 | | | CRESUD NCN Class XVII due 2016 | | Unsecured | | | Ps. | | | Floating | | Badlar + 250 bps | | | 176 | | | | 172,602 | | | | - | | | CRESUD NCN Class XVIII due 2019 | | Unsecured | | | US$ | | | Fixed | | 4.00% | | | 34 | | | | 1,141 | | | | - | | | CRESUD NCN Class XIX due 2016 | | Unsecured | | | Ps. | | | Fixed | | 27.50% | | | 187 | | | | 803 | | | | - | | | CRESUD NCN Class XX due 2017 (ii) | | Unsecured | | | US$ | | | Fixed | | 2.50% | | | 18.2 | | | | 812 | | | | - | | | IRSA NCN Class I due 2017 | | Unsecured | | | US$ | | | Fixed | | 8.50 | | | 149 | | | | 47,318 | | | | 41,472 | | | IRSA NCN Class I due 2015 | | Unsecured | | | Ps. | | | Floating | | Badlar + 395 bps | | | 209.4 | | | | 214,084 | | | | 4,325 | | | IRSA NCN Class II due 2017 | | Unsecured | | | Ps. | | | Floating | | Badlar + 450 bps | | | 10.8 | | | | 258 | | | | 255 | | | IRSA NCN Class II due 2020 | | Unsecured | | | US$ | | | Fixed | | 11.50% | | | 139.5 | | | | 62,798 | | | | 55,494 | | | IRSA Propiedades Comerciales S.A. NCN Class I due 2017 | | Unsecured | | | US$ | | | Fixed | | 7.88% | | | 114.3 | | | | 10,677 | | | | 8,732 | | | Bank overdrafts | | Unsecured | | | Ps. | | | Fixed | | 22.54% | | | 19,430 | | | | 609,153 | | | | 153,330 | | | Bank overdrafts (vii) | | Unsecured | | | Ps. | | | Floating | | - | | | - | | | | 681,553 | | | | 401,963 | | | Short term loans (vi) | | Unsecured | | | Ps. | | | Fixed | | 15.25% | | | 14.43 | | | | 106,469 | | | | 2,873 | | | Short term loans | | | - | | | Ps. | | | Fixed | | - | | | - | | | | - | | | | 9,733 | | | Short term loans (viii) | | Unsecured | | | Ps. | | | Fixed | | (viii) | | | 106.4 | | | | 5,854 | | | | 12,886 | | | Short term loans | | Unsecured | | | US$ | | | Floating | | Libor + 300 bps or 6% (the higher) | | | 15 | | | | 10,204 | | | | 9,267 | | | Short term loans | | Unsecured | | | Ps. | | | Floating | | Rate Survey PF 30-59 days | | | 20 | | | | 7,576 | | | | 4,285 | | | Short term loans | | Unsecured | | | Rs. | | | Floating | | TJLP + 3.00 to 4.40 | | | - | | | | 4,750 | | | | 11,024 | | | Short term loans | | Unsecured | | | Rs. | | | Floating | | 7.51 to 15.12%% | | | - | | | | 74,990 | | | | 165,121 | | | Short term loans | | Unsecured | | | Ps. | | | Fixed | | 15.01% | | | 24 | | | | 6,875 | | | | 6,880 | | | Short term loans | | Secured | | | Rs. | | | Floating | | 4.00 to 7.23 and TJLP + 3.45 to 4.45 Selic | | | - | | | | 27,744 | | | | 47,056 | | | Other short term loans | | Unsecured | | | | - | | | | - | | - | | | - | | | | 15,088 | | | | 74,344 | | | Short term loans | | Secured | | | Rs. | | | Floating | | 5.5 to 8.70 | | | - | | | | 2,763 | | | | 6,699 | | | Syndicated loans (iv) | | Unsecured | | | Ps. | | | Fixed | | (iv) | | | 75.6 | | | | 75,485 | | | | 101,339 | | | Seller financing | | Secured | | | US$ | | | Fixed | | 3.5% and 5% | | | 16.4 | | | | - | | | | 28,670 | | | Seller financing | | Secured | | | Rs. | | | Floating | | - | | | - | | | | 85,037 | | | | 165,521 | | | Seller financing | | Secured | | | Rs. | | | Floating | | IGP-M | | | - | | | | 58,064 | | | | - | | | Short term loans | | Secured | | | Rs. | | | Floating | | 1.6905 + Exchange rate variation | | | - | | | | 29,001 | | | | - | | | Finance lease obligations | | Secured | | | US$ | | | Fixed | | 10.75% and 7.5% | | | 0.5 | | | | 1,880 | | | | 2,102 | | | Finance lease obligations | | Unsecured | | | Rs. | | | Fixed | | 6.92% | | | - | | | | 9,890 | | | | - | | | Other short term loans | | Secured | | | Bol. | | | Floating | | 7% and 10.19% | | | 13.5 | | | | 3,115 | | | | 2,603 | | | Related parties (Note 38) | | | | | | | | | | | | | | | | | | | | 14,198 | | | | 1,566 | | | Current borrowings | | | | | | | | | | | | | | | | | | | | 2,466,030 | | | | 2,639,491 | | | Total borrowings | | | | | | | | | | | | | | | | | | | | 8,299,003 | | | | 7,954,826 | |
(i) | Includes an outstanding balance of Ps. 5,068 and Ps. 9,011 with ERSA and PAMSA, respectively, as of 06.30.14. |
(ii) | Includes an outstanding balance of Ps. 437 and Ps. 1,871 with ERSA and PAMSA, respectively, as of 06.30.15. |
(iii) | Includes an outstanding balance of Ps. 21,048 and Ps. 90,212 with ERSA and PAMSA, respectively, as of 06.30.15. |
(iv) | On November 16, 2012 the Company subscribed a syndicated loan for Ps. 118,000. Principal will be payable in 9 quarterly consecutive installments and shall accrue interest at rate of 15.01%. On June 12, 2013 the Company subscribed a new syndicated loan for Ps. 111,000. Principal will be payable in 9 quarterly consecutive installments and shall accrue interest at rate of 15.25%. Both loans have been entered into with various banking institutions, one of which is Banco Hipotecario (Note 37). |
(v) | Debt incurred to fund the purchase of Soleil Factory net assets (investment property): Mortgage financing of US$ 20.7 million with a fixed 5 % interest rate due in June 2017. As of the date of these financial statements, the mentioned capital is fully canceled. Debt incurred to the purchase of Zetol S.A.'s shares (trading properties): Mortgage financing of US$ 7 million with a fixed 3.5% interest rate. The balance is payable, by choice of the seller, in money or with the delivery of units in buildings to be built representative of 12% of the total marketable square meters built. Seller financing of plot of land - Vista al Muelle S.A. in Canelones, Uruguay (trading properties). |
(vi) | On December 23, 2013 the Company subscribed a new loan with Banco Citibank N.A. for an amount of Ps. 5.9 million and shall accrue interest at a rate of 15.25%. Principal will be repaid in 9 consecutive quarterly installments beginning in December 2014. Additionally, on December 30, 2014 the Company subscribed a new loan with Banco Citibank N.A. for an amount of Ps. 10 million and shall accrue interest at a rate of 26.50%. Principal will be repaid in 9 consecutive quarterly installments beginning in December 2015. |
(vii) | As of June 30, 2015 and 2014, bank overdrafts were drawn on several domestic financial institutions. The Company has bank overdrafts of less than three months bearing floating interest rates ranging from 15% to 55% per annum. |
(viii) | On December 12, 2012, a loan has been entered into with Banco Provincia de Buenos Aires in the amount of Ps. 29 million. Principal will be repaid in 9 consecutive quarterly installments beginning in December 2013. Finally, on June 3, 2015, a loan has been entered into with Banco Provincia de Buenos Aires in the amount of Ps. 100 million. Principal will be repaid at due date December 2015. On February 3, 2014 a loan has been entered into for an amount of Ps. 20 million and on December 23, 2014, a loan has been entered into with Banco Provincia for an amount of Ps. 120 million. At the date of issuance of these financial statements are both fully canceled. |
Cresud Sociedad Anónima,
Comercial, Inmobiliaria, Financiera y Agropecuaria
Notes to Consolidated Financial Statements (Continued)
(All amounts in thousands of Argentine Pesos, except shares and per share data and as otherwise indicated)
25.Borrowings (Continued)
At June 30, 2015 and 2014, total borrowings include collateralized liabilities (seller financing and loans) of Ps. 444.4 million and Ps. 594.8 million, respectively. These borrowings are mainly collateralized by investment property and properties, plant and equipment of the Group (Notes 10 and 11).
Borrowings also include liabilities under finance leases where the Group is the lessee and which therefore have to be measured in accordance with IAS 17 “Leases”. Information related to liabilities under finance leases is disclosed in Note 29.
The maturity of the Group's borrowings (excluding obligations under finance leases) and the Group's exposure to fixed and variable interest rates is as follows:
| | | June 30, 2015 | | | June 30, 2014 | | | Fixed rate: | | | | | | | | Less than one year | | | 923,763 | | | | 1,740,894 | | | Between 1 and 2 years | | | 2,577,736 | | | | 137,819 | | | Between 2 and 3 years | | | 691,857 | | | | 871,361 | | | Between 3 and 4 years | | | 670,514 | | | | 805,440 | | | Between 4 and 5 years | | | 171,309 | | | | 1,722,431 | | | More than 5 years | | | 1,273,090 | | | | 1,106,081 | | | | | | 6,308,269 | | | | 6,384,026 | | | Floating rate: | | | | | | | | | | Less than one year | | | 1,329,516 | | | | 753,708 | | | Between 1 and 2 years | | | 254,301 | | | | 355,614 | | | Between 2 and 3 years | | | 43,137 | | | | 175,371 | | | Between 3 and 4 years | | | 39,804 | | | | 32,880 | | | Between 4 and 5 years | | | 46,731 | | | | 29,546 | | | More than 5 years | | | 40,485 | | | | 70,373 | | | | | | 1,753,974 | | | | 1,417,492 | | | Do not accrue interest: | | | | | | | | | | Less than one year | | | 200,981 | | | | 142,787 | | | Between 1 and 2 years | | | 5,360 | | | | 426 | | | Between 2 and 3 years | | | 3,803 | | | | 294 | | | Between 3 and 4 years | | | 1,124 | | | | 2,520 | | | Between 4 and 5 years | | | 27 | | | | 3,992 | | | | | | 211,923 | | | | 150,019 | | | | | | 8,273,536 | | | | 7,951,537 | |
Cresud Sociedad Anónima,
Comercial, Inmobiliaria, Financiera y Agropecuaria
Notes to Consolidated Financial Statements (Continued)
(All amounts in thousands of Argentine Pesos, except shares and per share data and as otherwise indicated)
25.Borrowings (Continued)
The fair value of current borrowings at fixed-rate and current and non-current borrowings at floating-rate equals their carrying amount, as the impact of discounting is not significant. The fair value of all debts that are not quoted in the market are valued at their technical value, that is, nominal value plus accrued interest.
The fair values of non-current borrowings at fixed-rate (excluding finance leases) are as follows:
| | | June 30, 2015 | | | June 30, 2014 | | | Cresud Class XIII NCN due 2015 | | | - | | | | 647,198 | | | Cresud Class XIV NCN due 2018 | | | 291,247 | | | | 260,673 | | | Cresud Class XX NCN due 2017 | | | 165,614 | | | | - | | | Cresud Class XVI NCN due 2018 | | | 993,220 | | | | 888,920 | | | Cresud Class XVIII NCN due 2019 | | | 306,890 | | | | - | | | IRSA NCN due 2017 | | | 1,430,459 | | | | 1,244,281 | | | IRSA CP NCN Class I due 2017 | | | 1,091,287 | | | | 976,661 | | | IRSA NCN due 2020 | | | 1,585,947 | | | | 1,422,987 | | | Seller financing | | | - | | | | 354,900 | | | Syndicated loan | | | - | | | | 191,185 | | | Long term loans | | | 161,213 | | | | 501,592 | | | Related parties loans (Banco Hipotecario) | | | 630 | | | | - | | | Total | | | 6,026,507 | | | | 6,488,397 | |
The following classes of NCN were outstanding as of each of June 30, 2015 and 2014:
On September 7, 2011, Cresud issued Class VIII NCN which are denominated in US$ for a nominal amount of US$ 60 million, due 36 months after the issue date and fully repayable at maturity. They bear interest at a fixed rate of 7.5% payable semiannually on September 7 and March 7 each year.
As of June 30, 2015 this class has been fully paid.
(b) | Classes IX, X and XI NCN |
On June 21, 2012 Cresud issued three new parts for an amount of Ps. 383.5 million.
Class IX NCN, for a nominal value of Ps. 161.0 million due 18 months after the issue date, accrued interest at a variable rate (Badlar plus 300 basis points). These were paid on a quarterly basis in arrears while amortization was made in three consecutive payments, the first two payments in an amount equal to 33.33% each of the face value, and the last one in an amount equal to 33.34% of the face value, all of which amount to 100% of the face value of Class IX Non-Convertible notes on the 12th, 15th and 18th month as from the issue date.
F-209
Cresud Sociedad Anónima,
Comercial, Inmobiliaria, Financiera y Agropecuaria
Notes to Consolidated Financial Statements (Continued)
(All amounts in thousands of Argentine Pesos, except shares and per share data and as otherwise indicated)
25.Borrowings (Continued)
Class X NCN, for a nominal value of US$ 31.5 million (equivalent to Ps. 142 million at issue date), due 24 months after the issue date shall be payable in pesos at the exchange rate prevailing on the payment date. Interest accrued a fixed annual rate of 7.75% annually, and were paid quarterly in arrears, while amortization was made in three consecutive payments, the first two in an amount equal to 33.33% each of the face value, and the last payment in an amount equal to 33.34% of the face value, all of which amount to 100% of the face value of Class X Non-Convertible notes on the 18th, 21th and 24th months as from the issue date.
Class XI NCN, for a nominal value of Ps. 80.5 million due 36 months after the issue date, accrues interest at a variable rate (Badlar plus 375 basis points). These are paid on a quarterly basis in arrears while amortization is made in three consecutive payments, the first two payments in an amount equal to 33.33% each of the face value, and the last one in an amount equal to 33.34% of the face value, all of which amount to 100% of the face value of Class XI Non-Convertible notes on the 24th, 30th and 36th months as from the issue date.
As of June 30, 2015 these classes have been fully paid.
(c) | Class X Tranche 2 NCN |
On September 19, 2013, the Company issued Series Five of the Second Tranche of Class X Corporate Notes for a nominal value of US$ 30 million. As a consequence, the aggregate principal amount of Class X Corporate Notes was US$ 61.5 million, taking into consideration the US$ 31.5 million issued on June 21, 2012. The Second Tranche of Class X Corporate Notes is fully exchangeable for Class X Corporate Notes.
As of June 30, 2015 this class has been fully paid.
(d) | Class XII and XIII NCN |
On February 22, 2013, the Sixth Series of simple corporate notes was issued in the amount of Ps. 500 million and in two classes.
Class XII Non-Convertible Notes, for a face value of Ps. 102.1 million and falling due 21 months after the issuance date, accrue interest at a variable rate (Badlar plus 410 basis points). Interest are payable quarterly in arrears whereas the principal is amortized in three consecutive equal payments on the 15th, 18th and 21th months following the issue date.
Corporate Notes Class XIII, for a nominal value of US$ 79.4 million (equal to Ps. 397.9 million at issue date) due 27 months following the issue date, accrue interest at an annual fixed rate of 1.90% payable quarterly in arrears, while the amortization is paid in two consecutive installments on the 24th and 27th monthly anniversary of the issue date.
As of June 30, 2015 these classes have been fully paid.
Cresud Sociedad Anónima,
Comercial, Inmobiliaria, Financiera y Agropecuaria
Notes to Consolidated Financial Statements (Continued)
(All amounts in thousands of Argentine Pesos, except shares and per share data and as otherwise indicated)
25. | Borrowings (Continued)
|
Class XIV NCN
On May 22, 2013, the Company issued Series 7 of Non-Convertible Corporate Notes for a nominal value of US$ 32 million (equivalent to Ps. 167.5 million at issue date), in a single class.
Class XIV Corporate Notes are due 60 months after the date of issuance and accrue interest on a quarterly basis at a 1.5% fixed rate. Interest is payable quarterly in arrears whereas the principal is amortized in two consecutive payments on the 54 and 60 months following the issue date.
On November 18, 2013, the eighth Series of simple corporate notes was issued in the amount equivalent to Ps. 828 million, in two classes.
Class XV Non-Convertible Notes, for a face value of 176.37 million and falling due 24 months after the issuance date, accrue interest at a variable rate (Badlar plus 399 basis points). Interest is payable quarterly in arrears whereas the principal will be amortized in three consecutive payments on the 18, 21 and 24 months following the issue date.
Class XVI Non-Convertible Notes, for a face value of US$ 109.11 million, with an issuance price of 102.3% (equivalent to Ps. 661.18 million at issue date) and falling due 60 months after the issuance date, accrue interest at fixed annual rate of 1.50%. Interest is payable quarterly in arrears whereas the principal will be amortized in two consecutive equal payments on the 54 and 60 months following the issue date.
(f) | Classes XVII and XVIII NCN |
On September 12, 2014, the Ninth Series of simple corporate notes was issued in the equivalent amount of Ps. 455.3 million, in two classes.
Class XVII Non-Convertible Notes, for a face value of 171.8 million and falling due 18 months after the issuance date, will accrue interest at a variable rate (Badlar plus 250 basis points). Interest will be payable quarterly in arrears whereas the principal will be amortized in one payment 18 months following the issuance date. The issuance price was 100.0% of the nominal value.
Class XVIII Non-Convertible Notes, for a face value of US$ 33.7 million, with an issuance price of 102.179% of the nominal value resulting US$ 34.4 equivalent to Ps. 289.7 million at issue date and falling due 60 months after the issuance date, will accrue interest at fixed annual rate of 4%. Interest will be payable quarterly in arrears whereas the principal will be amortized in two consecutive payments on the 54 and 60 months following the issuance date.
Cresud Sociedad Anónima,
Comercial, Inmobiliaria, Financiera y Agropecuaria
Notes to Consolidated Financial Statements (Continued)
(All amounts in thousands of Argentine Pesos, except shares and per share data and as otherwise indicated)
25. | Borrowings (Continued)
|
(g) | Classes XIX and XX NCN |
On March 13, 2015, the tenth Series of simple corporate notes was issued in the amount equivalent to Ps. 352.8 million nominal value, in two classes.
Class XIX Non-Convertible Notes, for a face value of Ps. 187.0 million and falling due 18 months after the issuance date, will accrue interest at fixed rate of 27.5% during the first twelve months and will accrue interest at floating rate the remaining six months (Badlar plus 350 basis points). The issuance price was 100% of the nominal value. Interest will be payable quarterly in arrears whereas the principal will be amortized in one payment 18 months following the issuance date.
Class XX Non-Convertible Notes, for a face value of US$ 18.2 million, with an issuance price of 104% of the nominal value resulting US$ 18.9 equivalent to Ps. 165.8 million and falling due 24 months after the issuance date, will accrue interest at fixed annual rate of 2.5%. Interest will be payable quarterly in arrears whereas the principal will be amortized in one payment 24 months following the issuance date.
Classes VIII, IX, X, XI, XII, XIII, XIV, XV, XVI, XVII, XVIII, XIX and XX NCN contain certain customary covenants, events of default and restrictions, as well as limitations on transactions with affiliates, among other compliance requirements. The Company is also required to comply with a financial ratio in connection with incurrence of additional indebtedness: the ratio of short-term borrowings over total assets should be lower than 0.35. Currently, this financial covenant is measured on a quarterly basis as of the end of each period based on the unconsolidated accounts of Cresud. As of the date of issuance of these Financial Statements, there is no evidence of not compliance with ratios above-mentioned.
Repurchase of Non-convertible Notes Class XIII
On November 17, 2014, the Company repurchased 10,000,000 bond of NCN Class XIII, due on May 22, 2015 in the amount of Ps. 85.5 million.
On May 20, 2015, the Company purchased 44,905,380 Class XIII Notes in the amount of Ps. 201.9 million through certain stock transactions carried out in the local market.
As of June 30, 2015 this class has been fully paid.
Repurchase of Non-convertible Notes Class XII
On June 15, 2015, the Company repurchased 50,000,000 bond of NCN Class XIII, in the amount of Ps. 17.65 million.
As of June 30, 2015 this class has been fully paid.
Cresud Sociedad Anónima,
Comercial, Inmobiliaria, Financiera y Agropecuaria
Notes to Consolidated Financial Statements (Continued)
(All amounts in thousands of Argentine Pesos, except shares and per share data and as otherwise indicated)
25. | Borrowings (Continued)
|
Notes issued by subsidiary undertakings
(a) | IRSA NCN due 2017 and 2020 |
On February 2, 2007, IRSA issued US$ 150 million at a nominal fixed rate 8.5% NCN. The notes are due February 2017 and principal is paid at maturity. Interest is payable on February and August of each year as from August 2007.
This issue was in the framework of the global issuance program of notes for a nominal value of up to US$ 200 million authorized by Resolution N° 15,529 and 15,537 of the CNV dated December 7 and December 21, 2007. On February 25, 2010, the Board of Directors of IRSA expanded the amount to up to US$ 400 million as mandated by the Ordinary and Extraordinary Meeting of Shareholders held on October 29, 2009.
As part of the expanded program, on July 20, 2010 IRSA issued NCN for an amount of US$ 150 million at a nominal fixed rate of 11.5%. The notes are due July 2020 and principal is paid at maturity. Interest is payable on January 20 and June 20 of each year as from January 20, 2011.
IRSA NCN due 2017 and 2020 contain certain customary covenants and restrictions, including among others, limitations for the incurrence of additional indebtedness, restricted payments, disposal of assets, and entering into certain transactions with related companies.
Under the NCN indentures, IRSA is permitted to incur additional indebtedness provided its coverage of consolidated interest ratio is higher than 1.75. The coverage of consolidated interest ratio is defined as consolidated EBITDA divided by consolidated interest expense, subject to certain adjustments. EBITDA is defined as operating income plus, depreciation and amortization and other consolidated non-cash charges.
Restricted payments include restrictions for payment of dividends and other outflows relating to prepayments of indebtedness or to acquisition of certain investments. These restricted payments could not be made in excess of the sum of:
(i) | 50% of IRSA’s cumulative consolidated net income; or 75% of IRSA’s cumulative consolidated net income if the coverage of consolidated interest ratio is at least 3.0 to 1; or 100% of IRSA’s cumulative consolidated net income if the coverage of consolidated interest ratio is at least 4.0 to 1; |
(ii) | net cash proceeds from new capital contributions; |
(iii) | reduction of the indebtedness of IRSA or its restricted subsidiaries; |
(iv) | reduction in investments in debt certificates (other than permitted investments); |
(v) | distributions received from unrestricted subsidiaries. |
Cresud Sociedad Anónima,
Comercial, Inmobiliaria, Financiera y Agropecuaria
Notes to Consolidated Financial Statements (Continued)
(All amounts in thousands of Argentine Pesos, except shares and per share data and as otherwise indicated)
25. | Borrowings (Continued)
|
(b) | IRSA CP NCN Class I due 2017 |
On May 11, 2007, IRSA CP issued two parts of notes for a total amount of US$ 170 million. One of the series (Series I) consists of US$ 120 million notes at a nominal fixed rate of 7.87% due May 2017 while the other (Series II) comprises Ps. 154.0 million (equivalent to US$ 50 million) notes at a nominal fixed rate of 11.0% due in June 2012. Interest on the Series I is payable on May 11 and November 11 of each year as from November 11, 2007; principal due in May 11, 2017. Interest on the Series II was paid on June 11 and December 11 of each year as from December 11, 2007; principal was due in seven equal and consecutive semi-annual installments as from June 11, 2009. As of June 30, 2012, Series II is completely canceled.
These issuances were part of a global issuance program of notes for a nominal value of up to US$ 200 million authorized by Resolution N° 15,614 of the CNV dated April 19, 2007. On October 29, 2009, the Ordinary and IRSA CP's Extraordinary Meeting of Shareholders expanded the amount to up to US$ 400 million.
NCN Series I due 2017 contain certain covenants, events of default and restrictions, as well as limitations on additional indebtedness, transactions with affiliates, mergers and disposal of substantially all assets of the Company. For additional indebtedness IRSA CP is required to comply with the financial ratio “coverage of consolidated interest”, which should be higher than 1.75. The coverage of consolidated interest ratio is defined as consolidated EBITDA divided by consolidated interest expense, subject to certain adjustments. EBITDA is defined as operating income plus, depreciation and amortization and certain other consolidated non-cash charges.
(c) | IRSA NCN due 2013 and 2014 |
On February 10, 2012, IRSA placed, through public offer, NCN for a total amount of Ps. 300 million. These issuances were part of a global issuance program of notes approved by the Ordinary Meeting of Shareholders on October 31, 2011, and two Series due 2013 (Series III) and 2014 (Series IV) were issued, as described:
· | Class III Corporate Notes at Badlar rate plus 249 basis points for a face value of Ps. 153.2 million, to be matured 18 months after the issuing date and to be amortized in 3 consecutive payments within 12, 15 and 18 months, and interests to be paid in 6 installments, on a quarterly basis, from May 14, 2012. Class III is fully canceled. |
· | Class IV Corporate Notes at a fixed rate of 7.45% for a face value of US$ 33.8 million (equal to Ps. 146.9 million), to be matured 24 months after the issuing date, to be subscribed and paid in Argentine Pesos at the applicable exchange rate, to be amortized in 4 equal and consecutive payments within 15, 18, 21 and 24 months, to be paid in 8 installments, on a quarterly basis, from May 14, 2012. Class IV is fully canceled. |
Cresud Sociedad Anónima,
Comercial, Inmobiliaria, Financiera y Agropecuaria
Notes to Consolidated Financial Statements (Continued)
(All amounts in thousands of Argentine Pesos, except shares and per share data and as otherwise indicated)
25. | Borrowings (Continued)
|
(d) | IRSA NCN due 2015 and 2017 |
On February 26, 2014, Class V and VI were issued for an amount of Ps. 220.2 million. Company's NCN due 2015 and Company's NCN due 2017 both contain certain customary covenants and restrictions, including among others, limitations for the incurrence of additional indebtedness, restricted payments, disposal of assets, and entering into certain transactions with related companies.
Class V Non-Convertible Notes ("Class V"), were issued for an amount of Ps. 209,397,900. The securities were issued at par value and priced at a floating interest rate equal to Badlar rate plus 395 basis points. The principal of Class V will be repaid through a single payment on the maturity date. Class V matures within 18 months from the date of issue. Interest will be paid quarterly. Class V is fully canceled.
Class VI Non-Convertible Notes ("Class VI"), were issued for an amount of Ps. 10,790,322. The securities were issued at par value and priced at a floating interest rate equal to Badlar rate plus 450 basis points. The principal of Class VI will be repaid through a single payment on the maturity date. Class VI matures within 36 months from the date of issue. Interest will be paid quarterly on May 26, 2014, August 26, 2014, November 26, 2014, February 26, 2015, May 26, 2015 and August 26, 2015, November 26, 2015, February 26, 2016, May 26, 2016, August 26, 2016, November 28, 2016 and February 27, 2017.
As of the date of issuance of these Financial Statements, there is no evidence of not compliance with all ratios above-mentioned.
Cresud Sociedad Anónima,
Comercial, Inmobiliaria, Financiera y Agropecuaria
Notes to Consolidated Financial Statements (Continued)
(All amounts in thousands of Argentine Pesos, except shares and per share data and as otherwise indicated)
25. | Borrowings (Continued)
|
Seller financing
The Group maintains seller financing borrowings relating to the acquisition of certain investment properties, property, plant and equipment, trading properties and subsidiaries. Seller financing of the Group are as follows:
| | | | Book value | | | Acquisition | Detail | | June 30, 2015 | | | June 30, 2014 | | | Soleil Factory (investment property) | Mortgage financing of US$ 20.7 million with a fixed 5% interest rate due in June 2017. | | | - | | | | 85,254 | | | Zetol S.A. (trading property) | Mortgage financing of US$ 7 million with a fixed 3.5% interest rate. | | | 49,688 | | | | 43,265 | | | Vista al Muelle S.A. (trading properties) | Mortgage financing with a fixed 3.5% interest rate. | | | 21,271 | | | | 21,407 | | | Alto Tacuarí (property, plant and equipment) | Unsecured financing of Rs 34 million with variable interest rate at 100% of the Interbank Deposit Certificate rate (“CDI”), due in June 2012. | | | 85,037 | | | | 96,240 | | | Nova Buriti (property, plant and equipment) | Unsecured financing of Rs 21.7 million adjusted based on the General Price Index (“IGP-M”), due in June 2012. | | | 58,064 | | | | 69,281 | | | | | | | 214,060 | | | | 315,447 | |
Loans and bank overdrafts
As of June 30, 2015 and 2014, short-term and long-term loans were granted by several domestic financial institutions. They are repayable at various dates between July 2013 and July 2020, and bear either fixed interest rates ranging from 1.5% to 15.01% per annum, or variable interest rates mainly based on Badlar plus spreads ranging from 249 to 410 basis points.
As of June 30, 2015 and 2014, bank overdrafts were drawn on several domestic financial institutions. The Group has bank overdrafts of less than three months bearing fixed interest rates ranging from 15% to 55% per annum.
IRSA CP
On November 14, 2012,20, 2006, the Group, through IRSA CP’s BoardCP, acquired through a public bidding the building known as Exedificio-escuela Gobernador Vicente de Olmos located in the city of Directors approved the subscription of a syndicated loan contract entered into by different banking institutionsCórdoba for the amount of Ps. 118 million. Principal shall32. This property is affected to a concession contract. After the title deed was made, the government of the province of Córdoba declared the property to be payableof public use and subject to partial expropriation in nine quarterly and consecutive installments and shall accrue interest at a fixed annual nominal rate of 15.01%. Interests shallorder to be payable on a monthly basis.used exclusively for the Libertador San Martin Theatre. Cresud Sociedad Anónima, Comercial, Inmobiliaria, Financiera y Agropecuaria
Notes to the Consolidated Financial Statements(Continued) (All amounts in thousandsmillions of Argentine Pesos, except shares and per share data and as otherwise indicated)
25. | Borrowings (Continued)
|
22.
Provisions (Continued)
Brasilagro
IRSA CP has answered a complaint in an action and to challenge the law that declared such public interest on unconstitutional grounds. In the alternative, it has challenged the appraisal made by the plaintiff and, additionally, it has claimed damages not included in the appraisal and resulting immediately and directly from expropriation.
Our subsidiary Brasilagro raised short
At June 30, 2016, the property is recorded under Investment Properties. Claims against Cellcom and long term financing grantedits subsidiaries In the normal course of business, claims have been filed against Cellcom by Banco Itaúits customers. These are mostly motions for approval of class actions, primarily concerning allegations of illegal collection of funds, unlawful conduct or Breach of license, or a Breach of agreements with customers, causing monetary and Banco do Nordestenon-monetary damage to fund sewing expenses,them. The amounts claimed from Cellcom in consumer claims, amounted to NIS 26,183 million. Claims against Shufersal and its subsidiaries In the developmentnormal course of business, legal claims were filed against Shufersal by its customers. These are mostly motions for certification of class actions, which mainly concern claims of changing money unlawfully, acting contrary to the law or a license, or a Breach of the Cremaq projectagreements with customers, causing financial and non-financial loss to them. The amounts of the claims amounted to NIS 809 million. There are also other claims by employees, subcontractors, suppliers which relate mainly to claims of Breach of the provisions of the law in relation to the termination of workers' employment and claims of Breaches of contract and compulsory payments to authorities. The total amount which Shufersal was being sued for these claims was NIS 26 million. 23. Borrowings Group’s borrowings as of June 30, 2016 and 2015 are as follows: | | June 30, 2016 | | June 30, 2015 | | Non-current | | | | | Non-convertible notes | 69,997 | | 5,427 | | Bank loans and others | 6,836 | | 406 | | Non-recourse loan | 16,975 | | - | | Non-current borrowings | 93,808 | | 5,833 |
| Current | | | | | Non-convertible notes | 15,595 | | 636 | | Bank loans and others | 4,662 | | 524 | | Bank overdrafts | 1,397 | | 1,291 | | Other borrowings | 1,834 | | 15 | | Current borrowings | 23,488 | | 2,466 | | Total borrowings | 117,296 | | 8,299 |
Cresud Sociedad Anónima, Comercial, Inmobiliaria, Financiera y Agropecuaria Notes to the Consolidated Financial Statements(Continued) (All amounts in millions of Argentine Pesos, except otherwise indicated) 23. Borrowings (Continued) Urban properties and investment business of the operations center in Argentina On March 3, 2016, IRSA and IRSA CP announced that they would launch offers to buy in cash: (i) 11.50% Class 2 NCN outstanding due in 2020 and issued by IRSA for a total nominal value of up to US$ 76.5 million, subject to a potential extension of the Offer Limit of NCN due in 2020 for a nominal value of up to US$ 73.5 million, at IRSA’s exclusive decision, (ii) each and every 8.50% Class 1 NCN outstanding due in 2017 and issued by IRSA, and (iii) each and every 7.875% Class 1 NCN outstanding due in 2017 and issued by IRSA CP. On March 23, 2016, IRSA CP issued NCN for a nominal amount of US$ 360 million under its Global NCN Program. Class II NCN accrue interest semi-annually, at an annual fixed rate of 8.75% and are repayable at maturity on March 23, 2023. The issue price was 98.722% of nominal value. IRSA CP’s NCN maturing in 2023 are subject to certain Commitments, Events of Breach and Limitations, including Limitations on Additional Indebtedness, Limitations on Restricted Payments, Limitations on Transactions with Affiliates, Limitations on the Merger, Take-over Merger and Limitations on the Sale of all or a substantial portion of the company’s Assets. On April 7, 2016, the Meeting of IRSA's NCN holders approved the proposed amendments to the IRSA 2017 Trust Indenture, which included basically the elimination of all financial restrictive covenants on such class. Approximately 50.30% of holders of NCN due 2017 approved the amendments to the Trust Indenture for IRSA NCN 2017. As a consequence, a Supplementary Trust Agreement with the Bank of New York Mellon was signed, all amendments approved the Meeting, which came into force on April 8, 2016. During March, April and May the Group acquired all IRSA CP's NCN Class I at 7.875% maturing in 2017 for a total amount US$ 120 million and US$ 75.4 million of IRSA’S NCN. On October 11, 2016 IRSA, acquired the remaining US$ 74.6 million of IRSA’S NCN at 8.5% maturing in 2017, so the following notes remains outstanding: ● IRSA's NCN Class II at 11.50% maturing in 2020 US$ 71.4 million. Such payments were accounted for as a cancellation of debt. In relation to financial covenants under 11.50% NCN due in 2020 issued by IRSA, the Meeting of Noteholders held on March 23, 2016 approved: i. to modify the covenant on Limitation on Restricted Payments, so that the original covenant was replaced so as to take into consideration IRSA’s capability to make any restricted payment provided that (a) no Event of Default has occurred and persisted, and (b) IRSA may incur at least US$ 1 of additional debt pursuant to the Limitation on Additional Indebtedness; and Cresud Sociedad Anónima, Comercial, Inmobiliaria, Financiera y Agropecuaria Notes to the Consolidated Financial Statements(Continued) (All amounts in millions of Argentine Pesos, except otherwise indicated) 23. Borrowings (Continued) ii. the exclusion of IDBD or any of its subsidiaries for purposes of the definition of “Subsidiary” or any of the definitions or commitments under the Trust Indenture of Corporate Notes due in 2020 and issued by IRSA (regardless of whether the financial statements of any of these companies has any time been consolidated into IRSA’s financial statements). iii. a Supplementary Trust Indenture reflecting all the amendments approved, entered into with the Bank of New York Mellon on March 28, 2016. Urban properties and investment business of the operations center in Israel IDBD has certain restrictions and financial covenants in connection with its financial debt, included in its debentures, loans from banks and financial institutions. As of June 30, 2016 IDBD reported that the application of the “Liquidity Covenant” and the acquisition“Economic Equity Covenant” (as described below) is currently suspended. It was agreed between IDBD and the relevant lending coporations that the parties would work to formulate an arrangement, to replace or amend the current financial covenants by December 31, 2016. If such arrangement is not reached, the previous financial covenants will re-apply then with respect to the results for IDBD´s first quarter of Jaborandi.2017 and thereafter. In the event that these covenants will re-apply, IDBD estimates that it will not be able to meet the thresholds that were determined in the past with respect to the Liquidity Covenant and the Economic Equity Covenant with respect to IDBD´s results for the first quarter of 2017 and thereafter. Particularly, if the previous financial covenants will re-apply, IDBD estimates it will not be able to fulfill the covenant, which stipulates that the balance of cash and marketable securities will not fall below the scope of forecasted current maturities for the two quarters subsequent to the reporting quarter (the “Liquidity Covenant”). Regarding the Economic Equity Covenant, the economic equity as of June 30, 2016, amounted to a positive balance of NIS 247 million, significantly lower than the thresholds determined in the past, as part of to the Economic Equity Covenant. In view of and due to the decrease of Mr. Ben Moshe’s holding rate in IDBD, beginning from February 2015 and thereafter, in March 2016 IDBD reached understandings with its lending corporations with regard to an amendment of the control and additional amendments relating to restrictions on the sale of main holdings. Cresud Sociedad Anónima, Comercial, Inmobiliaria, Financiera y Agropecuaria Notes to the Consolidated Financial Statements(Continued) (All amounts in millions of Argentine Pesos, except otherwise indicated) 23. Borrowings (Continued) As per IDBD´s position, as of June 30, 2016, there were no conditions that established grounds for calling IDBD´s obligations to its financial creditors for immediate payment. Without derogating from the IDBD´s position, it is noted that the decision of the bondholders (Series I) dated April 21,2016 to call the full balance of IDBD´s debt to the bondholders for immediate repayment and the decision to take steps for dissolution are liable to raise grounds for the financial creditors, for calling for immediate repayment. According to IDBD’s legal advisor opinion, the conditions giving rise to a ground for demanding immediate repayment of the liabilities for the (Series I) bonds were not fulfilled. On July 18, 2016, the Court handed down its judgment, in which the Court accepted the consensus motion filed by the trustee to strike the motion for dissolution. As of June 30, 2016, IDBD´s loans which are subject to the aforementioned financial covenants, at a scope of NIS 264 million, were classified under current liabilities, in consideration of the fact that IDBD has reached understandings with those relevant lending entities, which extended the arrangements specified in the financial covenants of the loan agreements until first quarter calendar year 2017 only, in other words, for a period shorter than twelve months. . On August 2, 2016 IDBD issued a new Series of Debentures in the Israeli market for an amount of NIS 325 million due November 2019 at an annual interest rate adjustable by CPI plus 4.25%. The Banco do Nordestenotes are pledged by shares of Clal Insurance Enterprise Holdings Ltd (“Clal”), subject to the approval of the Commissioner of Capital Markets, Insurance and Banco Itaú require that borrower hold deposits in investment mutualSavings. IDBD is working to get the authorization to constitute the guarantee and it filed an application to the Supreme Court asking for such approval. In case IDBD does not get the required approval, funds bearingmust be repaid with interest plus a penalty. On September 15, 2016, the High Court of Justice gave a partial judgment and decision, according to which it was decided, to reject the petition for the most part and to grant an order which instructs the Commissioner to appear and show a reason for her opposition to the request of IDBD to pledge up to 5% of the shares of Clal Holdings, subject to an outline agreed to at the interbank certificatetime by the IDBD. Furthermore, IDBD maintains the right to accede to a proposal for compromise which was raised in the context of depositthe discussion. A hearing date was set for January 2017. Cresud Sociedad Anónima, Comercial, Inmobiliaria, Financiera y Agropecuaria Notes to the Consolidated Financial Statements(Continued) (All amounts in millions of Argentine Pesos, except otherwise indicated) 23. Borrowings (Continued) Pursuant to the decision of the Supreme Court sitting as the High Court of Justice in connection with the petition submitted by IDBD in connection with the pledge of the shares of Clal Holdings in September 2016, on October 13, 2016, the Board of Directors of the IDBD decided to execute a partial early redemption of the debentures, that is to be carried out on November 1, 2016, as follows: ● IDBD will carry out a partial early redemption of the debentures in an amount of approximately NIS 239 million of par value (“the redeemed portion”) and in a total of approximately NIS 244 million with respect to principal, interest and compensation for the redeemed portion. ● The determining date for the eligibility to receive the early redemption of the principal of the debentures is 10.25.2016. ● The early redemption represents 73.7% of the unpaid balance of the principal of the debentures, which is also the original balance of the series of the debentures. ● The rate (publishedof interest (including the compensation for carrying out the early redemption as an increment of 3% with respect to the period from August 3, 2016 through October 21 2016) that will be paid upon the partial early redemption of the redeemed portion of the principal is approximately 1.8%. ● The rate of interest (including the compensation for carrying out the early redemption as an increment of 3% with respect to the period from August 3, 2016 through October 31 2016) that will be paid in the context of the early redemption, which is calculated out of the balance of the unpaid balance of the principal on the date of the early redemption (NIS 325 million linked to the CPI) is approximately 1.3%. ● Pursuant to the “known” CPI (index with respect to the month of September 2016, which was published on 10.14.2016) as compared with the base index published with respect to the month of June 2016, no linkage increments will apply with respect to the redeemed portion upon early redemption. ● The unpaid balance of the principal of the debentures after executing the early redemption (without linkage) will stand at an amount of approximately NIS 86 million par value, which represents approximately 26.3%, of the original balance of the principal of the debentures. IDBD will act to pledge the shares of Clal Holdings against the balance of the unpaid principal of the debentures after carrying out the early redemption ( as is required according to the trust indenture). ● Pursuant to what is stated in the trust indenture, the redeemed portion will be paid in relation to all of the holders of the debentures, pro- rata according to the par value of the held debentures. IDBD is continuing to act in order to reach consents with the relevant financing corporations in order to arrange over time the calculated financial covenants that were determined in the provisions of its loan agreements, and additional contractual issues that exist in the loan agreements. Cresud Sociedad Anónima, Comercial, Inmobiliaria, Financiera y Agropecuaria Notes to the Consolidated Financial Statements(Continued) (All amounts in millions of Argentine Pesos, except otherwise indicated) 23. Borrowings (Continued) The breakdown of the borrowings of Operations Centers by CETIP, who provides custodianCompany as of June 30, 2016 was as follows: | | | | Agricultural business | | Urban properties and investments business | | | | | | | | | Operations Center in Argentina | | Operations Center in Israel | | | | | | Debt | | Cresud | BrasilAgro | Others | Subtotal | | IRSA | IRSA CP | Others | Subtotal Operations Center in Argentina | | IDBD | DIC | Shufersal | Cellcom | PBC | Others | Subtotal Operations Center in Israel | | Subtotal | | Total | | Non-convertible notes | | 3,283 | - | - | 3,283 | | 2,287 | 5,799 | - | 8,086 | | 7,807 | 12,436 | 10,037 | 15,277 | 28,666 | - | 74,223 | | 82,309 | | 85,592 | | Bank loans and others | | 452 | 452 | 15 | 919 | | 16 | 55 | 130 | 201 | | 2,214 | 1,171 | 16 | 779 | 2,003 | 4,195 | 10,378 | | 10,579 | | 11,498 | | Non-recourse loan | | - | - | - | - | | - | - | - | - | | - | (i) 10,999 | - | - | 5,976 | - | 16,975 | | 16,975 | | 16,975 | | Bank overdrafts | | 114 | - | 47 | 161 | | 859 | 40 | 45 | 944 | | - | - | - | - | - | 292 | 292 | | 1,236 | | 1,397 | | Other borrowings | | - | - | - | - | | - | - | - | - | | - | - | - | - | - | 1,834 | 1,834 | | 1,834 | | 1,834 | | Total debt | | 3,849 | 452 | 62 | 4,363 | | 3,162 | 5,894 | 175 | 9,231 | | 10,021 | 24,606 | 10,053 | 16,056 | 36,645 | 6,321 | 103,702 | | 112,933 | | 117,296 |
(i) IDBD has a non-recourse loan, which was split into two components on the basis of an independent appraiser’s report. The commitment to transfer shares represents the main contract and depository services)was initially recognized at fair value and, later, at its depreciated cost. The derivative embedded represents a call option and is computed taking into account future payments of interest on the loan. The main contract and the embedded derivative ("non-recourse loan ") are disclosed net in borrowings. Cresud Sociedad Anónima, Comercial, Inmobiliaria, Financiera y Agropecuaria Notes to the Consolidated Financial Statements(Continued) (All amounts in millions of Argentine Pesos, except otherwise indicated) 23. Borrowings (Continued) | | Agricultural business | | | Company | | Secure / Unsecure | | Series | | Currency | | Rate | | Adjustment factor | | Payment date of principal | | Interest rate % | | Capital nominal value in million Issue currency | | Value as of June 30, 2016 | | Value as of June 30, 2015 | | Non-convertible notes | Cresud | | Unsecured | | XIV | | US$ | | Fixed | | N/A | | 2018 | | 1.50% | | 64 | | 482 | | 290 | | | Cresud | | Unsecured | | XV | | Ps. | | Floating | | N/A | | 2015 | | 23.63% | | 176 | | - | | 121 | | | Cresud | | Unsecured | | XVI | | US$ | | Fixed | | N/A | | 2018 | | 1.50% | | 218 | | 1,446 | | 1,004 | | | Cresud | | Unsecured | | XVII | | Ps. | | Floating | | N/A | | 2016 | | Badlar + 375 bp. | | 171 | | - | | 172 | | | Cresud | | Unsecured | | XVIII | | US$ | | Fixed | | N/A | | 2019 | | 4.00% | | 68 | | 512 | | 309 | | | Cresud | | Unsecured | | XIX | | Ps. | | Fixed | | N/A | | 2016 | | 27.50% | | 187 | | 189 | | 187 | | | Cresud | | Unsecured | | XX | | US$ | | Fixed | | N/A | | 2019 | | 2.50% | | 36 | | 123 | | 56 | | | Cresud | | Unsecured | | XXI | | Ps. | | Floating | | N/A | | 2017 | | Badlar + 375 bp. | | 384 | | 197 | | - | | | Cresud | | Unsecured | | XXII | | US$ | | Fixed | | N/A | | 2019 | | 4.00% | | 44 | | 334 | | - | | Subtotal Non-convertible notes | | | | | | | | | | | | | | | | | | | 3,283 | | 2,139 | | | | | | | | | | | | | | | | | | | | | | | | | Bank loans and others | Cresud | | Unsecured | | - | | US$ | | Floating | | N/A | | 2022 | | Libor + 300 BP or 6% (the higher) | | 30 | | 200 | | 128 | | | Cresud | | Unsecured | | - | | Ps. | | Fixed | | N/A | | 2016 | | 15.01% | | 31 | | 17 | | 7 | | | Cresud | | Unsecured | | - | | Ps. | | Floating | | TEPF | | 2017 | | Rate Survey PF 30-59 days | | 40 | | 11 | | 19 | | | Cresud | | Unsecured | | - | | US$ | | Fixed | | N/A | | - | | 3.50% | | 15 | | 225 | | - | | | Cresud | | Secured | | - | | US$ | | Fixed | | N/A | | 2020 | | 10.75% - 7.14% to 14.5% | | 6 | | 1 | | 1 | | | BrasilAgro | | Secured | | - | | Rs. | | Floating | | TJLP | | - | | TJLP + 3 to 4.40 | | - | | 7 | | 10 | | | BrasilAgro | | Secured | | - | | Rs. | | Floating | | TJLP | | - | | TJLP + 3.45 to 4.45 SELIC + 3.45 | | - | | 211 | | 184 | | | BrasilAgro | | Secured | | - | | Rs. | | Floating | | N/A | | - | | 7.51 to 15.12 | | - | | 130 | | 75 | | | BrasilAgro | | Secured | | - | | Rs. | | Floating | | TJLP | | - | | TJLP + 5.50 to 8.70 | | - | | - | | 3 | | | BrasilAgro | | Unsecured | | - | | Rs. | | Fixed | | N/A | | - | | 6.92% | | - | | 21 | | 22 | | | BrasilAgro | | Secured | | - | | Rs. | | Floating | | N/A | | - | | 100% CDI | | - | | 82 | | 86 | | | BrasilAgro | | Secured | | - | | Rs. | | Floating | | N/A | | - | | 1.6905 + Exchange rate variation | | - | | - | | 29 | | | BrasilAgro | | Secured | | - | | Rs. | | Floating | | N/A | | - | | IGP-M | | - | | - | | 58 | | | Doneldon | | Secured | | - | | Bol. | | Fixed | | N/A | | - | | 6% annual | | - | | 11 | | - | | | Doneldon | | Secured | | - | | Bol. | | Fixed | | N/A | | - | | 7% - 10.19% | | 14 | | - | | 3 | | | Carnes Pampeanas | | Secured | | - | | Ps. | | Floating | | N/A | | - | | 6% annual | | - | | 3 | | - | | Subtotal bank loans and others | | | | | | | | | | | | | | | | | | | 919 | | 625 | | Bank overdrafts | | | | | | | | | | | | | | | | | | | 161 | | 609 | | Total | | | | | | | | | | | | | | | | | | | 4,363 | | 3,373 |
Cresud Sociedad Anónima, Comercial, Inmobiliaria, Financiera y Agropecuaria Notes to the Consolidated Financial Statements(Continued) (All amounts in millions of Argentine Pesos, except otherwise indicated) 23. Borrowings (Continued) | | Operations Center in Argentina | | | Company | | Secure / Unsecure | | Series / Class | | Currency | | Rate | | Payment date of principal | | Interest rate % | | Capital nominal value in million Issue currency | | Value as of June 30, 2016 | Value as of June 30, 2015 | | Non-convertible notes | IRSA CP | | Unsecured | | Class I | | Ps. | | Fixed / Floating | | 2017 | | Badlar + 4 bp. | | 407 | | 409 | - | | | IRSA CP | | Unsecured | | Class II | | US$ | | Fixed | | 2023 | | 8.75% | | 360 | | 5,273 | - | | | IRSA CP | | Unsecured | | Series I | | US$ | | Fixed | | 2017 | | 7.88% | | - | | - | 1,034 | | | IRSA | | Unsecured | | Class I | | US$ | | Fixed | | 2017 | | 8.50% | | 75 | | 1,159 | 1,401 | | | IRSA | | Unsecured | | Class VI | | Ps. | | Floating | | 2017 | | Badlar + 450bps | | 11 | | 127 | 11 | | | IRSA | | Unsecured | | Class V | | Ps. | | Floating | | 2015 | | Badlar + 395ps | | - | | - | 214 | | | IRSA | | Unsecured | | Class II | | US$ | | Fixed | | 2020 | | 11.50% | | 75 | | 1,118 | 1,265 | | Total Non-convertible notes | | | | | | | | | | | | | | | | | 8,086 | 3,925 | | | | | | | | | | | | | | | | | | | | | | Bank loans | IRSA | | Secured | | - | | US$ | | Fixed | | 2020 | | 3.2% to 14.3% | | 1 | | 1 | - | | and others | IRSA | | Unsecured | | - | | Ps. | | Floating | | 2017 | | Badlar | | 15 | | 14 | 14 | | | IRSA CP | | Secured | | - | | US$ | | Fixed | | 2020 | | 3.2% to 14.3% | | - | | 5 | 3 | | | IRSA CP | | Unsecured | | - | | Ps. | | Fixed | | 2016 | | 15.25% | | 1 | | 1 | 4 | | | IRSA CP | | Unsecured | | - | | Ps. | | Fixed | | 2017 | | 26.50% | | 7 | | 7 | 10 | | | IRSA CP | | Unsecured | | - | | Ps. | | Fixed | | 2016 | | 23% | | 36 | | 36 | 106 | | | IRSA CP | | Unsecured | | - | | Ps. | | Fixed | | 2015 / 2016 | | 15.25% / 15.01% | | - | | - | 75 | | | IRSA CP | | Unsecured | | - | | Ps. | | Fixed / Floating | | 2016 | | Badlar / 8.50% | | 6 | | 6 | 8 | | | HASA | | Unsecured | | - | | Ps. | | Fixed | | 2016 | | 15.25% | | 6 | | 6 | 4 | | | LLAO LLAO | | Unsecured | | - | | Ps. | | Fixed | | 2016 | | 15.25% | | 1 | | 1 | 3 | | | NFSA | | Unsecured | | - | | Ps. | | Fixed | | 2016 | | 24% | | 6 | | 6 | 7 | | | LIVECK | | Secured | | - | | US$ | | Fixed | | 2017 | | n/a | | 2 | | 35 | 21 | | | LIVECK | | Secured | | - | | US$ | | Fixed | | n/a | | 3.50% | | 5 | | 83 | 50 | | Total bank loans and others | | | | | | | | | | | | | | | | | 201 | 305 | | Other borrowings | | | | | | | | | | | | | | | | | - | 15 | | Bank overdrafts | | | | | | | | | | | | | | | | | 944 | 682 | | Subtotal Operations Center in Argentina | | | | | | | | | | | | | | | | | 9,231 | 4,927 |
Cresud Sociedad Anónima, Comercial, Inmobiliaria, Financiera y Agropecuaria Notes to the Consolidated Financial Statements(Continued) (All amounts in millions of Argentine Pesos, except otherwise indicated) 23. Borrowings (Continued) | | Operations Center in Israel | | | Company | | Secure / Unsecure | | Series | | Currency | | Rate | | Adjustment factor | | Payment date of principal | | Interest rate % | | Capital nominal value in million Issue currency | | Value as of June 30, 2016 | | | IDBD | | Unsecured | | G | | NIS | | Fixed | | CPI | | 2016 – 2018 | | 4.50% | | 802 | | 3,534 | | Non-convertible notes | IDBD | | Unsecured | | I | | NIS | | Fixed | | CPI | | 2020 – 2025 | | 4.95% | | 1,013 | | 3,164 | | | IDBD | | Unsecured | | J | | NIS | | Fixed | | N/A | | 2015 – 2018 | | 6.60% | | 309 | | 1,109 | | | | | | | | | | | | | | | | | | | | | | | | DIC | | Unsecured | | D | | NIS | | Fixed | | CPI | | 2012 – 2016 | | 5.00% | | 103 | | 510 | | | DIC | | Unsecured | | F | | NIS | | Fixed | | CPI | | 2017 – 2025 | | 4.95% | | 2,719 | | 9,427 | | | DIC | | Unsecured | | G | | NIS | | Fixed | | N/A | | 2012 – 2016 | | 6.35% | | 8 | | 31 | | | DIC | | Unsecured | | H | | NIS | | Fixed | | CPI | | 2014 – 2019 | | 4.45% | | 124 | | 541 | | | DIC | | Unsecured | | I | | NIS | | Fixed | | N/A | | 2010 – 2018 | | 6.70% | | 513 | | 1,927 | | | | | | | | | | | | | | | | | | | | | | | | Shufersal | | Unsecured | | B | | NIS | | Fixed | | CPI | | 2015 – 2019 | | 5.20% | | 1,024 | | 5,161 | | | Shufersal | | Unsecured | | C | | NIS | | Fixed | | N/A | | 2010 – 2017 | | 5.45% | | 114 | | 459 | | | Shufersal | | Unsecured | | D | | NIS | | Fixed | | CPI | | 2014 – 2029 | | 2.99% | | 413 | | 1,584 | | | Shufersal | | Unsecured | | G | | NIS | | Fixed | | N/A | | 2014 – 2029 | | 5.09% | | 392 | | 1,580 | | | Shufersal | | Unsecured | | F | | NIS | | Fixed | | CPI | | 2020 – 2028 | | 4.30% | | 317 | | 1,253 | | | | | | | | | | | | | | | | | | | | | | | | Cellcom | | Unsecured | | B | | NIS | | Fixed | | CPI | | 2013 – 2017 | | 5.30% | | 185 | | 880 | | | Cellcom | | Unsecured | | D | | NIS | | Fixed | | CPI | | 2013 – 2017 | | 5.19% | | 599 | | 2,865 | | | Cellcom | | Unsecured | | E | | NIS | | Fixed | | N/A | | 2012 – 2017 | | 6.25% | | 164 | | 673 | | | Cellcom | | Unsecured | | F | | NIS | | Fixed | | CPI | | 2017 – 2020 | | 4.60% | | 715 | | 3,032 | | | Cellcom | | Unsecured | | G | | NIS | | Fixed | | N/A | | 2017 – 2019 | | 6.99% | | 285 | | 1,230 | | | Cellcom | | Unsecured | | H | | NIS | | Fixed | | CPI | | 2018 – 2024 | | 1.98% | | 950 | | 3,483 | | | Cellcom | | Unsecured | | I | | NIS | | Fixed | | N/A | | 2018 – 2025 | | 4.14% | | 804 | | 3,114 | | | | | | | | | | | | | | | | | | | | | | | | PBC | | Unsecured | | C | | NIS | | Fixed | | CPI | | 2009 – 2017 | | 5% | | 550 | | 2,666 | | | PBC | | Unsecured | | D | | NIS | | Fixed | | CPI | | 2020 – 2025 | | 4.95% | | 1,317 | | 6,641 | | | PBC | | Unsecured | | F | | NIS | | Fixed | | CPI | | 2015 – 2023 | | 4.95% | | 974 | | 4,195 | | | PBC | | Unsecured | | G | | NIS | | Fixed | | N/A | | 2015 – 2025 | | 7.05% | | 669 | | 3,054 | | | PBC | | Unsecured | | Gav-Yam Series E | | NIS | | Fixed | | CPI | | 2014 – 2018 | | 4.55% | | 283 | | 1,375 | | | PBC | | Unsecured | | Gav-Yam Series F | | NIS | | Fixed | | CPI | | 2021 – 2026 | | 4.75% | | 1,226 | | 8,535 | | | PBC | | Unsecured | | Gav-Yam Series G | | NIS | | Fixed | | N/A | | 2013 – 2017 | | 6.41% | | 215 | | 907 | | | PBC | | Unsecured | | Ispro Series B | | NIS | | Fixed | | CPI | | 2007 – 2021 | | 5.40% | | 255 | | 1,293 | | Total Non-convertible notes | | | | | | | | | | | | | | | | | | | 74,223 | | | | | | | | | | | | | | | | | | | | | | | Bank loans | IDBD | | Unsecured (1) | | - | | NIS | | Floating | | Prime interest rate | | 2015 – 2018 | | Prime + 1.3% | | 333 | | 1,117 | | and others | IDBD | | Unsecured (1) | | - | | NIS | | Floating | | Prime interest rate | | 2015 – 2019 | | Prime + 1% | | 80 | | 265 | | | IDBD | | Unsecured | | - | | NIS | | Floating | | Prime interest rate | | 2015 – 2020 | | Prime + 0.65% | | 63 | | 198 | | | IDBD | | Secured (2) | | - | | NIS | | Fixed | | CPI | | 2015 – 2018 | | 6.90% | | 150 | | 634 | | | | | | | | | | | | | | | | | | | | | | | | DIC | | Unsecured | | - | | NIS | | Fixed | | N/A | | 2015 – 2017 | | 5.39% | | 45 | | 167 | | | DIC | | Unsecured | | - | | NIS | | Floating | | Prime interest rate | | 2015 – 2018 | | 2.12% | | 111 | | 397 | | | DIC | | Unsecured | | - | | NIS | | Fixed | | N/A | | 2015 – 2018 | | 5.90% | | 86 | | 311 | | | DIC | | Unsecured | | - | | NIS | | Fixed | | Prime interest rate | | 2015 – 2018 | | 2.20% | | 86 | | 296 | | | | | | | | | | | | | | | | | | | | | | | | Shufersal | | Secured | | - | | NIS | | Fixed | | CPI | | 2015 – 2017 | | 4.95% | | 1 | | 4 | | | Shufersal | | Secured | | - | | NIS | | Fixed | | CPI | | 2015 – 2017 | | 4.95% | | 1 | | 3 | | | Shufersal | | Secured | | | | NIS | | Fixed | | CPI | | 2015 – 2017 | | 4.75% | | - | | 2 | | | Shufersal | | Secured | | - | | NIS | | Fixed | | CPI | | 2015 – 2017 | | 4.40% | | - | | 2 | | | Shufersal | | Secured | | - | | NIS | | Fixed | | CPI | | 2015 – 2017 | | 3.25% | | 1 | | 5 |
Cresud Sociedad Anónima, Comercial, Inmobiliaria, Financiera y Agropecuaria Notes to the Consolidated Financial Statements(Continued) (All amounts in millions of Argentine Pesos, except otherwise indicated) 23. Borrowings (Continued) | | Company | | Secure / Unsecure | | Series | | Currency | | Rate | | Adjustment factor | | Payment date of principal | | Interest rate % | | Capital nominal value in million Issue currency | | Value as of June 30, 2016 | | | | | | | | | | | | | | | | | | | | | | | | PBC | | Unsecured | | - | | NIS | | Floating | | CPI | | 2015 – 2020 | | 1.97% | | 40 | | 154 | | | PBC | | Unsecured | | - | | NIS | | Floating | | CPI | | 2020 | | 2.65% | | 83 | | 311 | | | PBC | | Unsecured | | - | | NIS | | Fixed | | N/A | | 2015 – 2020 | | 3.07% | | 19 | | 76 | | | PBC | | Unsecured | | - | | NIS | | Fixed | | N/A | | 2016 | | 1.70% | | 301 | | 1,176 | | | PBC | | Secured | | - | | NIS | | Floating | | CPI | | 2011 – 2018 | | 1.55% | | 69 | | 286 | | | PBC | | Unsecured | | - | | NIS | | Floating | | CPI | | 2002 – 2019 | | 1.73% | | 62 | | 327 | | | PBC | | Secured | | - | | NIS | | Floating | | CPI | | 2008 – 2016 | | 1.95% | | 7 | | 32 | | | PBC | | Secured | | - | | NIS | | Floating | | CPI | | 2015 – 2023 | | 1.87% | | 106 | | 409 | | | PBC | | Secured | | - | | NIS | | Floating | | CPI | | 2014 – 2022 | | 1.77% | | 83 | | 323 | | | PBC | | Secured | | - | | NIS | | Floating | | CPI | | 2013 – 2021 | | 1.87% | | 55 | | 219 | | | PBC | | Secured | | - | | NIS | | Floating | | CPI | | 2015 – 2022 | | 1.86% | | 42 | | 165 | | | PBC | | Secured | | - | | NIS | | Floating | | CPI | | 2011 – 2019 | | 1.26% | | 36 | | 149 | | | PBC | | Secured | | - | | NIS | | Floating | | CPI | | 2009 – 2017 | | 1.80% | | 8 | | 36 | | | PBC | | Secured | | - | | NIS | | Floating | | CPI | | 2022 | | 1.88% | | 93 | | 366 | | | PBC | | Secured | | - | | NIS | | Fixed | | N/A | | 2016 – 2016 | | 1.26% | | 40 | | 156 | | | PBC | | Secured | | - | | NIS | | Floating | | CPI | | 2015 – 2020 | | 1.57% | | 22 | | 85 | | | PBC | | Secured | | - | | NIS | | Floating | | CPI | | 2020 | | 2.14% | | 50 | | 188 | | | PBC | | Unsecured | | - | | NIS | | Floating | | CPI | | 2009 – 2016 | | 12.16% | | 3 | | 11 | | | | | | | | | | | | | | | | | | | | | | | | Bartan | | Unsecured | | - | | NIS | | Floating | | Prime interest rate | | 2015 – 2022 | | 2.35% | | 2 | | 8 | | | Bartan | | Secured | | | | NIS | | Floating | | Prime interest rate | | 2022 | | 2.89% | | 5 | | 19 | | | Bartan | | Secured | | - | | NIS | | Floating | | Prime interest rate | | 2022 | | 2.95% | | 4 | | 16 | | | | | | | | | | | | | | | | | | | | | | | | IDB Tourism | | Unsecured | | - | | US$ | | Floating | | Libor interest rate | | 2020 | | 5.66% | | 13 | | 51 | | | IDB Tourism | | Unsecured | | - | | US$ | | Floating | | Libor interest rate | | 2015 – 2018 | | 5.21% | | 197 | | 767 | | | | | | | | | | | | | | | | | | | | | | | | IDBG | | Unsecured | | - | | US$ | | Floating | | Libor interest rate | | 2015 - 2015 | | Libor + 5% | | 223 | | 869 | | | | | | | | | | | | | | | | | | | | | | | | Cellcom | | Unsecured | | - | | NIS | | Fixed | | - | | 2016 – 2021 | | 4.60% | | 200 | | 778 | | Total bank loans and others | | | | | | | | | | | | | | | | | | | 10,378 | | Bank overdrafts | | | | | | | | | | | | | | | | | | | 292 | | Non-recourse loans | | | | | | | | | | | | | | | | | | | 16,975 | | Others | | | | | | | | | | | | | | | | | | | 1,834 | | Subtotal Operations Center in Israel | | | | | | | | | | | | | | | | | | | 103,702 |
(1) Corresponds to a bank loan for NIS 750 million, where repayment of principal had been deferred for three years starting March 2014 until October 2021March 2018. (2) In May 2012, IDBD was granted a secured loan for NIS 150 by the financial institutions of Menorah Group. Principal is repayable in two installments of NIS 50 million and FebruaryNIS 100 million in 2017 and 2018, respectively. As part of the loan, IDBD granted the lender any stock call option on the shares it held in DIC, representing approximately 1.7% of the share capital issued by this company. Cresud Sociedad Anónima, Comercial, Inmobiliaria, Financiera y Agropecuaria Notes to the Consolidated Financial Statements(Continued) (All amounts in millions of Argentine Pesos, except otherwise indicated) 23. Borrowings (Continued) As of June 30, 2016 and 2015, total borrowings include collateralized liabilities (seller financing, leases and bank loans) of Ps. 73,694 and Ps. 156,428, respectively. These borrowings are mainly collateralized by investment properties and properties, plant and equipment of the Group (Notes 10 and 11).
Borrowings also include liabilities under finance leases where the Group is the lessee and which therefore have to be measured in accordance with IAS 17 “Leases”. Information related to liabilities under finance leases is disclosed in Note 33.
The maturity of the Group's borrowings (excluding obligations under finance leases) and the Group's exposure to fixed and variable interest rates is as follows: | | June 30, 2016 | | June 30, 2015 | | | Agricultural business | | Urban properties and investments | | Total | | Agricultural business | | Urban properties and investments | | Total | | | | | Operations Center in Argentina | Operations Center in Israel | Subtotal | | | | | | Operations Center in Argentina | | | | Do accrue interest: | | | | | | | | | | | | | | | Less than one year | 1,195 | | 2,573 | 18,172 | 20,745 | | 21,940 | | 1,202 | | 1,051 | | 2,253 | | Between 1 and 2 years | 1,205 | | 16 | 16,826 | 16,842 | | 18,047 | | 417 | | 2,415 | | 2,832 | | Between 2 and 3 years | 500 | | 1 | 19,535 | 19,536 | | 20,036 | | 848 | | (113) | | 735 | | Between 3 and 4 years | 1,332 | | 14 | 4,643 | 4,657 | | 5,989 | | 710 | | - | | 710 | | Between 4 and 5 years | 40 | | 1,063 | 7,092 | 8,155 | | 8,195 | | 218 | | - | | 218 | | More than 5 years | 34 | | 5,303 | 36,169 | 41,472 | | 41,506 | | 40 | | 1,274 | | 1,314 | | | 4,306 | | 8,970 | 102,437 | 111,407 | | 115,713 | | 3,435 | | 4,627 | | 8,062 | | Do not accrue interest: | | | | | | | | | | | | | | | Less than one year | 31 | | 240 | 1,265 | 1,505 | | 1,536 | | 21 | | 180 | | 201 | | Between 1 and 2 years | 5 | | 3 | - | 3 | | 8 | | 4 | | 1 | | 5 | | Between 2 and 3 years | - | | - | - | - | | - | | 4 | | - | | 4 | | Between 3 and 4 years | - | | 3 | - | 3 | | 3 | | 1 | | - | | 1 | | Between 4 and 5 years | - | | 10 | - | 10 | | 10 | | - | | - | | - | | | 36 | | 256 | 1,265 | 1,521 | | 1,557 | | 30 | | 181 | | 211 | | | 4,342 | | 9,226 | 103,702 | 112,928 | | 117,270 | | 3,465 | | 4,808 | | 8,273 |
Cresud Sociedad Anónima, Comercial, Inmobiliaria, Financiera y Agropecuaria Notes to the Consolidated Financial Statements(Continued) (All amounts in millions of Argentine Pesos, except otherwise indicated) 23. Borrowings (Continued) The fair value of current and non-current borrowings for the years ended June 30, 2016 and 2015 is as follows: | | | | | | | | | | | | | | | June 30, 2016 | | June 30, 2015 | | | | Urban properties | | | | Urban properties | | | | Agricultural Business | Operation Center in Argentina | Operation Center in Israel | Subtotal | Total | | Agricultural Business | Operation Center in Argentina | Subtotal | Total | | NCN | 3,247 | 8,764 | 75,804 | 84,568 | 87,815 | | | 4,369 | 4,369 | 6,606 | | Bank loans and others | 997 | 269 | 13,597 | 13,866 | 14,863 | | 2,237 | 340 | 340 | 943 | | Bank overdrafts | 161 | 944 | 292 | 1,236 | 1,397 | | 603 | 682 | 682 | 1,291 | | Non-recourse loan | - | - | 16,976 | 16,976 | 16,976 | | 609 | - | - | - | | Other borrowings | - | - | 1,834 | 1,834 | 1,834 | | - | 15
| 15 | 15 | | Total borrowings | 4,405 | 9,977 | 108,503 | 118,480 | 122,885 | | 3,449 | 5,406 | 5,406 | 8,855 |
Equity Incentive Plan The Group has an equity incentive plan, created in September 30, 2011, which aims at certain selected employees, directors and top management of the Company, IRSA and IRSA CP (the “Participants”). Participation in the plan is voluntary and employees are invited to participate by the Board. Under the Incentive Plan, entitle the Participants to receive shares ("Contributions") of the Company and IRSA, based on a percentage of their annual bonus for the years 2011, 2012 and 2013, providing they remain as employee of the Company for at least five years, among other conditions, required to qualify such Contributions. These contributions shall be held by the Company and IRSA, and as the conditions established by the Plan are verified, such contributions shall be transferred to the Participants. As of June 30, 2016 and 2015, the Company set up a reserve for the Incentive Plan under Shareholder’s Equity in the amount of Ps. 35 and Ps. 32, respectively. The reserve was based on the fair value of the shares to be granted under the Group’s contribution, on a proportional basis to the employee’s permanence in the Incentive Plan and adjusted for the probability that these beneficiaries may leave the Group before the required term has elapsed and/or the conditions to be entitled to the mentioned plan benefits are met as of each period end. As of June 30, 2016 and 2015, the Group recognized a charge in connection with the Incentive Plan of Ps. 32.9 and Ps. 30.8, respectively. The total cost of the plan that has not yet been recognized because the term for the full granting of the benefit is still effective amounts to Ps. 27.3 and Ps. 56.4, respectively. This cost is expected to be recognized over an approximately two-year period. During the fiscal years ended June 30, 2016 and 2015, the Group granted 1 and 1.8 million shares, respectively, corresponding to the Participants’ Contributions. Cresud Sociedad Anónima, Comercial, Inmobiliaria, Financiera y Agropecuaria Notes to the Consolidated Financial Statements(Continued) (All amounts in millions of Argentine Pesos, except otherwise indicated) 24. Employee benefits (Continued) Movements in the number of matching shares outstanding under the incentive plan corresponding to the Company´s contributions are as follows: | | June 30, 2016 | | June 30, 2015 | | At the beginning | 7,613,638 | | 10,033,785 | | Additions | - | | 308,426 | | Granted | (1,028,766) | | (1,883,077) | | Disposals | (260,135) | | (845,496) | | At the end | 6,324,737 | | 7,613,638 |
Defined contribution plan The Group has a defined contribution plan (the “Plan”) covering certain selected managers in Argentina. The Plan was effective as from January 1, 2006. Employees may begin participation voluntarily on monthly enrolment dates. Participants may make pre-tax contributions to the Plan of up to 2.5% of their monthly salary (“Base Contributions”) and of up to 15% of their annual bonus (“Extraordinary Contributions”). Under the Plan, the Group matches employee contributions to the plan at a rate of 200% for Base Contributions and 300% for Extraordinary Contributions.
All contributions are invested in funds administered outside of the Group. Participants or their assignees, as the case may be, will have access to the 100% of the Company contributions under the following circumstances:
| ordinary retirement in accordance with applicable labor regulations; |
(ii) | total or permanent incapacity or disability; |
ordinary retirement in accordance with applicable labor regulations;(ii)
total or permanent incapacity or disability;
In case of resignation or termination without good cause, the manager will receives the Group’s contribution only if he or she has participated in the Plan for at least 5 years.
Contribution expense wasContributions made by the Group under the Plan amount to Ps. 2.9 million,10, Ps. 10.2 million5 and Ps. 6.4 million3 for the fiscal years ended June 30, 2016, 2015 and 2014, and 2013, respectively and was recognized in the income statements.
Cresud Sociedad Anónima,
Comercial, Inmobiliaria, Financiera y Agropecuaria
Notes to Consolidated Financial Statements (Continued)
(All amounts in thousands of Argentine Pesos, except shares and per share data and as otherwise indicated)
Established by the Company and subsidiaries
Equity Incentive Plan
The Group has an equity incentive plan, which aims at certain selected employees, directors and top management of the Company, IRSA and IRSA CP (the “Participants”). Participation in the plan is voluntary and employees are invited to participate by the Board.
This Plan was effectively established on September 30, 2011 and is administered by the Board of Directors of the Company, IRSA and IRSA CP, as the case may be, or a committee appointed by the Board of Directors of the respective companies.
Under the Incentive Plan, over the last three years, entitle the Participants to receive shares ("Contributions") of the Company and IRSA, based on a percentage of their annual bonus, providing they remain as employee of the Company for at least five years, among other conditions, required to qualify such Contributions.
Contributions shall be held by the Company and IRSA, and as the conditions established by the Plan are verified, such contributions shall be transferred to the Participants.
On the other hand, the Plan provides an extraordinary bonus in the medium term. Shares granted as part of the bonus shall be transferred to the participants, there being no restriction whatsoever established by the Plan. As of the date of these financial statements, the Group transferred 685,568 shares related to this special bonus.
As of June 30, 2015, 2014 and 2013, the Company set up a reserve for the incentive plan under Shareholder’s Equity in the amount of Ps. 35.5 million, Ps. 79.2 million and Ps. 10.6 million, respectively. The reserve was based on the fair value of the shares to be granted under the Company’s contribution, on a proportional basis to the employee’s permanence in the plan and adjusted for the probability that these beneficiaries may leave the Company before the required term has elapsed and/or the conditions to be entitled to the Plan benefits are met as of each period end.
As of June 30, 2015, 2014 and 2013, the Group recognized a charge in connection with the Incentive Plan and special bonus of Ps. 30.8 million, Ps. 92.2 million and Ps. 9.7 million, respectively. The total cost of the plan that has not yet been recognized because the term for the full granting of the benefit is still effective amounts to Ps. 56.4 million, Ps. 64.6 million and Ps. 22.3 million, respectively. This cost is expected to be recognized over an approximately two-year period.
Cresud Sociedad Anónima,
Comercial, Inmobiliaria, Financiera y Agropecuaria
Notes to Consolidated Financial Statements (Continued)
(All amounts in thousands of Argentine Pesos, except shares and per share data and as otherwise indicated)
27. | Share-based payments (Continued)
|
As of June 30, 2015, the Company granted 1.2 million shares, whereas no shares were granted as of June 30, 2014.
Movements in the number of matching shares outstanding under the incentive plan corresponding to the Company´s contributions are as follows:
| | | June 30, 2015 | | | June 30, 2014 | | | At the beginning | | | 10,033,785 | | | | 3,232,474 | | | Additions | | | 308,426 | | | | 6,922,479 | | | Granted | | | (1,883,077 | ) | | | - | | | Disposals | | | (845,497 | ) | | | (121,168 | ) | | At the end | | | 7,613,637 | | | | 10,033,785 | |
Established only by subsidiary undertakings
Brasilagro Stock Option Plan
The Group’s subsidiary, Brasilagro, has a stock option plan (the “Brasilagro Stock Option Plan”), under which Brasilagro grants equity-settled options to certain directors and top management (the “Participants” or "Beneficiaries").
Cresud Sociedad Anónima, Comercial, Inmobiliaria, Financiera y Agropecuaria Notes to the Consolidated Financial Statements(Continued) (All amounts in millions of Argentine Pesos, except otherwise indicated) 24. Employee benefits (Continued) The Board of Directors approved the three tranches of Brasilagro’s Stock Option Plan on August 11, 2010, July 3, 2012 and September 4, 2012, respectively, and Brasilagro’s Board of Directors was authorized to grant stock options to selected employees. Brasilagro’s Stock Option Plan document defined who may participate in the plan, the number of shares that each participant may purchase in exercising the stock options granted, the exercise price per share to be paid in cash by each participant and other conditions under which the options were granted. Upon exercise of each option, its beneficiary becomes entitled to purchase one share of Brasilagro’s capital stock at the exercise price set forth under the Plan.
Brasilagro’s Stock Option Plan has five beneficiaries and grants 233,689, 206,425 and 206,425 stock options at an exercise price of Rs. 8.97 (Ps. 33.2), Rs. 8.25 (Ps. 30.5), and Rs. 8.52 (Ps. 31.5) per share, respectively. The options may be exercised in full as from August 12, 2012, July 3, 2014 and September 4, 2014, respectively, and are exercisable during three years as from the time they become exercisable. As of June 30, 2015, none of the stock options was exercised or cancelled and 177,213 expired. As of June 30, 2014, none of the stock options was exercised, 109,054 were canceled and 68,159 expired. Cresud Sociedad Anónima,
Comercial, Inmobiliaria, Financiera y Agropecuaria
Notes to Consolidated Financial Statements (Continued)
(All amounts in thousands of Argentine Pesos, except shares and per share data and as otherwise indicated)
27. | Share-based payments (Continued)
|
The Group did not recognize any charge for the fiscal year ended June 30, 20152016 related to Brasilagro Stock Option Plan. During the fiscal years ended June 30, 20142015 and 2013,2014, the Group had recognized a charge of Ps. 2.5 million0.2 and Ps. 0.8 million,2.5, respectively.
The fair value of the Brasilagro’s awards was measured at the date of grant using the Black-Scholes valuation technique. This valuation model takes into account factors such as non-transferability, expected volatility, exercise restrictions and behavioral considerations.
Key grant-date fair value and other assumptions under the Brasilagro Stock Option Plan are detailed below.below:
| Grant date | | First tranche | | Second tranche | | Third tranche | | Second tranche | | Third tranche | | Expected Volatility | | 67.48% | | 41.62% | | 40.50% | | | Expected volatility | | | 41.62% | | 40.50% | | Expected life | | 5 years | | 5 years | | 5 years | | 5 years | | 5 years | | Risk free rate | | 11.36% | | 9.37% | | 9.12% | | 9.37% | | 9.12% | | Expected dividend yield | | 1.00% | | 0.50% | | 0.50% | | 0.50% | | 0.50% | | Fair value per option | | Rs 6.16 | | Rs 3.60 | | Rs 4.08 | | | Exercise Price | | Rs 8.97 | | Rs 8.25 | | Rs 8.52 | | | Option’s fair value | | | Rs. 3.6 (Ps. 13.32) | | Rs. 4.08 (Ps. 15.10) | | Exercise price | | | Rs. 8.25 (Ps. 30.53) | | Rs. 8.52 (Ps. 31.52) | | Due date | | 08/12/2015 | | 07/03/2017 | | 09/04/2017 | | 07/03/2017 | | 09/04/2017 |
Movements in the number of equity-settled options outstanding and their related weighted average exercise prices under the Brasilagro Stock Option Plan are as follows:
| | | June 30, 2015 | | June 30, 2016 | | | | First tranche | | | Second tranche | | | Third tranche | | First tranche | Second tranche | Third tranche | | | | Exercise price | | | Options | | | Exercise price | | | Options | | | Exercise price | | | Options | | Exercise price Options | | Options | Exercise price Options | | Options | Exercise price Options | | Options | | At the beginning | | Ps. 8.97 | | | | 301,848 | | | Ps. 8.25 | | | | 260,952 | | | Ps. 8.52 | | | | 260,952 | | Ps. 8.97 | | 233,689 | Ps. 8.25 | | 206,425 | Ps. 8.52 | | 206,425 | | Granted | | | - | | | | - | | | | - | | | | - | | | | - | | | | - | | - | | - | - | | - | - | | - | | Canceled | | | - | | | | - | | | | - | | | | - | | | | - | | | | - | | | | Cancelled | | - | | - | - | | - | - | | - | | Exercised | | | - | | | | - | | | | - | | | | - | | | | - | | | | - | | - | | (233,689) | - | | - | - | | - | | Expired | | | - | | | | (68,159 | ) | | | - | | | | (54,527 | ) | | | - | | | | (54,527 | ) | - | | - | - | | - | - | | - | | At the end | | Ps. 8.97 | | | | 233,689 | | | Ps. 8.25 | | | | 206,425 | | | Ps. 8.52 | | | | 206,425 | | - | | - | Ps. 8.25 | | 206,425 | Ps. 8.52 | | 206,425 |
Cresud Sociedad Anónima, Comercial, Inmobiliaria, Financiera y Agropecuaria
Notes to the Consolidated Financial Statements(Continued) (All amounts in thousandsmillions of Argentine Pesos, except shares and per share data and as otherwise indicated)
27. | Share-based payments (Continued)
|
24.
Employee benefits (Continued)
| | | June 30, 2014 | | June 30, 2015 | | | | First tranche | | | Second tranche | | | Third tranche | | First tranche | Second tranche | Third tranche | | | | Exercise price | | | Options | | | Exercise price | | | Options | | | Exercise price | | | Options | | Exercise price Options | | Options | Exercise price Options | | Options | Exercise price Options | | Options | | At the beginning | | Ps. 8.97 | | | | 370,007 | | | Ps. 8.25 | | | | 315,479 | | | Ps. 8.52 | | | | 315,479 | | Ps. 8.97 | | 301,848 | Ps. 8.25 | | 260,952 | Ps. 8.52 | | 260,952 | | Granted | | | - | | | | - | | | | - | | | | - | | | | - | | | | - | | - | | - | - | | - | - | | - | | Cancelled | | | - | | | | - | | | | - | | | | (54,527 | ) | | | - | | | | (54,527 | ) | - | | - | - | | - | - | | - | | Exercised | | | - | | | | - | | | | - | | | | - | | | | - | | | | - | | - | | - | - | | - | - | | - | | Expired | | | - | | | | (68,159 | ) | | | - | | | | - | | | | - | | | | - | | - | | (68,159) | - | | (54,527) | - | | (54,527) | | At the end | | Ps. 8.97 | | | | 301,848 | | | Ps. 8.25 | | | | 260,952 | | | Ps. 8.52 | | | | 260,952 | | Ps. 8.97 | | 233,689 | Ps. 8.25 | | 206,425 | Ps. 8.52 | | 206,425 |
Brasilagro Warrants
On March 15, 2006, the Board of Directors of Brasilagro approved the issuance of 512,000 share warrants (the "Brasilagro Warrants"), 256,000 of which correspond to the first tranche, and 256,000 of which correspond to the second tranche.
The first tranche of Brasilagro Warrants were delivered to its founding shareholders in March, 2006 before Brasilagro’s IPO. As reported by Brasilagro in its IPO Prospectus, said warrants were granted to its founding shareholders in recognition of their founding efforts, their entrepreneurial spirit in preparing Brasilagro for its IPO, the work done in developing the business plan, and their commitment to the Company’s growth. The warrants were distributed among the founding shareholders for no consideration.
As Brasilagro received services from its founding shareholders in exchange for share-based payments, the first issuance of Brasilagro Warrants are within the scope of IFRS 2. However, due to the fact that these warrants could have been fully exercised since March 15, 2009, that is, before the transition date to the IFRS (July 1, 2009), and that the fair value of the warrants had not been published, the Group applied the exemption available under IFRS 1 for these equity instruments.
Each lot of 1,000 Warrants grants the right to subscribe 100 shares of Brasilagro. Brasilagro Warrants vest over a three-year period from the date of grant at 33% every year, and are exercisable by their holders over a fifteen-year period. The number of shares to be subscribed upon exercise of the warrants shall be adjusted in the event of split or reverse split of shares.
Out of theThe 256,000 outstanding Brasilagro Warrantswarrants under the first tranche, 256,000 Warrants were exercisable as of June 30, 20152016 and 2014.2015.
Cresud Sociedad Anónima, Comercial, Inmobiliaria, Financiera y Agropecuaria
Notes to the Consolidated Financial Statements(Continued) (All amounts in thousandsmillions of Argentine Pesos, except shares and per share data and as otherwise indicated)
27. | Share-based payments 24. Employee benefits (Continued)(Continued)
|
Brasilagro Warrants of the first issuance outstanding at each period end under have the following expiry date and exercise prices:
| | | | Shares (i) | | | Exercise price per share | | Shares (i) | | Expiry: | Exercise price per share | | June 30, 2015 | | | June 30, 2014 | | | | June 30, 2016 | | June 30, 2015 | | April 27, 2021 | Rs 16.72 | | | 256,000 | | | | 256,000 | | | Rs 18.20 | | 256,000 | | 256,000 |
| From the Brasilagro Warrants under the first tranche 177,004 and 175,223 were owned by the Company as of June 30, 2015 and 2014, respectively. |
From the Brasilagro Warrants under the first tranche 177,004 were owned by the Company as of June 30, 2016 and 2015, respectively.
Group’s management believes that Brasilagro Warrants under the second tranche (which are only exercisable if and when a transfer of control or acquisition of a significant interest occurs) has a fair value of zero as of any of the periods presented because the exercise price will be equal to the price per share to be paid by the party that obtains control or that acquires a significant interest in Brasilagro. As a result, no liability has been recorded with respect to the Brasilagro Warrants of the second issuance.
Each lot of 1,000 warrants grants the right to subscribe 100 shares of Brasilagro. Brasilagro Warrants of the second issuance are exercisable by their holders during a fifteen-year period but only in the event of change in control and/or acquisition of a material interest in Brasilagro. The number of shares to be subscribed upon exercise of the warrants shall be adjusted in the event of split or reverse split of shares.
As Brasilagro Warrants under the second issuance were delivered to provide Brasilagro’s founding shareholders with a mechanism to leverage their interest in Brasilagro, and not in exchange for goods and/or services, they are not within the scope of IFRS 2. Rather, they are accounted for as a derivative financial liability in accordance with IAS 32 and IFRS 9.
Out of the warrants under the second issuance 168,902 were held by the Company as of June 30, 20152016 and 2014.2015.
Cresud Sociedad Anónima, Comercial, Inmobiliaria, Financiera y Agropecuaria Notes to the Consolidated Financial Statements(Continued) (All amounts in millions of Argentine Pesos, except otherwise indicated) 24. Employee benefits (Continued) IDBD Defined benefits Defined benefits to hired employees include post-employment benefits, retirement benefits, share-based plans and other short and long term benefits. The Group’s liabilities in relation to severance pay and/or retirement benefits of Israeli employees are calculated in accordance with Israeli laws. 28. | TaxesJune 30, 2016 | | Present value of unfunded obligations | 572 | | Present value of funded obligations | 1,070 | | Total Present value of defined benefits obligations | 1,642 | | Fair value of plan assets | (1,101) | | Recognized liability for defined benefits obligations | 541 | | Liability for other long-term benefits | 148 | | Total recognized liabilities | 689 | | Assets designed for payment of benefits for employees | (4) | | Net position from employee benefits | 685 |
Plans associated to certain key members of management IDBD, through its subsidiaries, has granted share incentive plans to key members of management. In April 2016, some modifications have been introduced to the plans as regards exercise prices for each of the five tranches of options, thus establishing a range of NIS 9.5 million to NIS 12.5 million. The share price at the time of approval was NIS 7.73 million. The Group’s income tax has been calculated on the estimated taxable profit for the years ended June 30, 2016, 2015 2014 and 2013,2014, at the rates prevailing in the respective tax jurisdictions. The subsidiaries of the Group in the jurisdictions where the Group operates are required to calculate their income taxes on a separate basis; thus, they are not permitted to compensate subsidiaries’ losses against subsidiaries income.
Cresud Sociedad Anónima,
Comercial, Inmobiliaria, Financiera y Agropecuaria
Notes to Consolidated Financial Statements (Continued)
(All amounts in thousands of Argentine Pesos, except shares and per share data and as otherwise indicated)
The detaildetails of the provision for the Group’s income tax is as follows:
| | | June 30, 2015 | | | June 30, 2014 | | | June 30, 2013 | | June 30, 2016 | | June 30,2015 | | June 30, 2014 | | Current income tax | | | (687,214 | ) | | | (267,805 | ) | | | (251,342 | ) | (673) | | (687) | | (268) | | Deferred income tax | | | 390,921 | | | | 676,136 | | | | 218,440 | | 853 | | 391 | | 676 | | Minimum Presumed Income Tax | | | (7,057 | ) | | | (18,916 | ) | | | (617 | ) | | | Income tax | | | (303,350 | ) | | | 389,415 | | | | (33,519 | ) | | | MPIT | | 17 | | (7) | | (19) | | Income tax expense | | 197 | | (303) | | 389 |
Cresud Sociedad Anónima, Comercial, Inmobiliaria, Financiera y Agropecuaria Notes to the Consolidated Financial Statements(Continued) (All amounts in millions of Argentine Pesos, except otherwise indicated) 25. Taxation (Continued) The statutory tax rate in the countries where the Group operates for all of the years presented are:
| Tax jurisdiction | | Income tax rate | | | Argentina | | | 35 | %35% | | Brazil | | between 25% - 34 | %34% | | Uruguay | | between 0% - 25 | % 25% | | Bolivia | | | 25 | %25% | | United States | | between 0% - 45 | % 45% | | Bermudas | | 0% | | Israel | 0 | %26.5% |
Below is a reconciliation between the income tax recognized and that which would result from applying the prevailing tax rate, applicable in the respective countries, on the profit / (loss) before income tax for the years ended June 30, 2016, 2015 and 2014: | | June 30, 2016 | | June 30, 2015 | | June 30, 2014 | | Gain / (loss) for the year calculated at the tax rate prevailing in the respective countries | 90 | | (858) | | 550 | | Permanent differences: | | | | | | | Share of profit / (loss) of joint ventures and associates | 475 | | 543 | | (154) | | Gain from disposal of joint ventures and associates | - | | - | | 9 | | Capital indexation of foreign companies | - | | - | | 1 | | Unrecognized tax losses | (158) | | (21) | | (43) | | Non-deductible items | (253) | | (8) | | 3 | | Adjustment of share capital | - | | 4 | | - | | Tax on personal assets | (2) | | - | | - | | Change in tax rate | (357) | | - | | - | | Unrecognized tax losses carryforwards | (4) | | - | | - | | Non-taxable income | 109 | | 57 | | - | | Others | 297 | | (20) | | 23 | | Income tax expense | 197 | | (303) | | 389 |
Deferred tax assets and liabilities of the Group as of June 30, 20152016 and 20142015 will be recovered as follows:
| | | June 30, 2015 | | | June 30, 2014 | | | Deferred income tax asset to be recovered after more than 12 months | | | 1,199,230 | | | | 1,211,186 | | | Deferred income tax asset to be recovered within 12 months | | | 407,254 | | | | 90,414 | | | Deferred income tax assets | | | 1,606,484 | | | | 1,301,600 | |
| | June 30, 2016 | | June 30, 2015 | | Deferred income tax assets to be recovered after more than 12 months | 5,138 | | 1,101 | | Deferred income tax assets to be recovered within 12 months | 1,969 | | 374 | | Deferred income tax assets | 7,107 | | 1,475 |
| | | June 30, 2015 | | | June 30, 2014 | | June 30, 2016
| | June 30, 2015 | | Deferred income tax liabilities to be recovered after more than 12 months | | | (905,779 | ) | | | (903,373 | ) | (12,705) | | (798) | | Deferred income tax liabilities to be recovered within 12 months | | | (199,210 | ) | | | (15,630 | ) | (406) | | (175) | | Deferred income tax liabilities | | | (1,104,989 | ) | | | (919,003 | ) | (13,111) | | (973) |
Cresud Sociedad Anónima, Comercial, Inmobiliaria, Financiera y Agropecuaria
Notes to the Consolidated Financial Statements(Continued) (All amounts in thousandsmillions of Argentine Pesos, except shares and per share data and as otherwise indicated)
28. | Taxes 25. Taxation (Continued)(Continued)
|
The movement in the deferred income tax (opened by assets and liabilities) during the years ended June 30, 20152016 and 2014,2015, without taking into consideration the offsetting of balances within the same tax jurisdiction, is as follows:
| Deferred income tax assets | | Tax loss carry-forwards | | | Advanced payments from customers | | | Investments | | | Investment properties and property, plant and equipment | | | Trading properties | | | Others | | | Total | | | As of June 30, 2013 | | | 334,469 | | | | 96,520 | | | | 68,994 | | | | - | | | | 17,890 | | | | 77,933 | | | | 595,806 | | | Charged / (Credited) to the income statements | | | 625,081 | | | | 4,778 | | | | - | | | | - | | | | - | | | | (2,732 | ) | | | 627,127 | | | Currency translation adjustment | | | 60,145 | | | | 1,990 | | | | - | | | | - | | | | - | | | | 16,532 | | | | 78,667 | | | As of June 30, 2014 | | | 1,019,695 | | | | 103,288 | | | | 68,994 | | | | - | | | | 17,890 | | | | 91,733 | | | | 1,301,600 | | | Charged to the income statements | | | 162,266 | | | | 222,353 | | | | 71,555 | | | | 68,790 | | | | 6,932 | | | | 27,236 | | | | 559,132 | | | Reserve for changes in investment in subsidiaries | | | (50,359 | ) | | | - | | | | - | | | | - | | | | - | | | | - | | | | (50,359 | ) | | Use of tax loss carryforwards | | | (157,367 | ) | | | - | | | | - | | | | - | | | | - | | | | - | | | | (157,367 | ) | | Currency translation adjustment | | | (41,331 | ) | | | 401 | | | | - | | | | - | | | | - | | | | (5,592 | ) | | | (46,522 | ) | | As of June 30, 2015 | | | 932,904 | | | | 326,042 | | | | 140,549 | | | | 68,790 | | | | 24,822 | | | | 113,377 | | | | 1,606,484 | |
| Deferred income tax assets | | Tax loss carry-forwards | | Advanced payments from customers | | Investments | | Trade and otherr receivables | | Investment properties and property, plant and equipment | | Provisions | | Inventories | | Trading properties | | Others | | Total | | June 30, 2014 | | 1,019 | | 103 | | 6 | | - | | - | | 2 | | - | | 18 | | 91 | | 1,239 | | Charged/ (Credited) to the statement of income | | 162 | | 220 | | 72 | | 1 | | - | | (1) | | 1 | | 7 | | 25 | | 487 | | Changes of non-controlling interest | | (50) | | - | | - | | - | | - | | - | | - | | - | | - | | (50) | | Use of tax loss carryforwards | | (157) | | - | | - | | - | | - | | - | | - | | - | | - | | (157) | | Cumulative translation adjustment | | (41) | | 2 | | - | | - | | - | | - | | - | | - | | (5) | | (44) | | June 30, 2015 | | 933 | | 325 | | 78 | | 1 | | - | | 1 | | 1 | | 25 | | 111 | | 1,475 | | (Credited)/ Charged to the statement of income | | (16) | | (161) | | - | | 1 | | (4) | | - | | 1 | | (8) | | 3 | | (184) | | Changes of non-controlling interest | | (88) | | - | | - | | - | | - | | - | | - | | - | | - | | (88) | | Use of tax loss carryforwards | | (366) | | - | | - | | - | | - | | - | | - | | - | | - | | (366) | | Business combinations | | 2,261 | | 1,025 | | - | | - | | - | | - | | - | | - | | 442 | | 3,728 | | Cumulative translation adjustment | | 1,661 | | 598 | | - | | - | | 6 | | 1 | | - | | - | | 276 | | 2,542 | | June 30, 2016 | | 4,385 | | 1,787 | | 78 | | 2 | | 2 | | 2 | | 2 | | 17 | | 832 | | 7,107 |
| Deferred income tax liabilities | | Investment properties | | | Property, plant and equipment | | | Biological assets | | | Investments | | | Trade and other receivables | | | Others | | | Total | | | As of June 30, 2013 | | | (577,883 | ) | | | (163,143 | ) | | | (68,146 | ) | | | (50,803 | ) | | | (65,166 | ) | | | (19,953 | ) | | | (945,094 | ) | | Charged / (Credited) to the income statements | | | 49,362 | | | | 7,420 | | | | (41,260 | ) | | | (2,608 | ) | | | (5,358 | ) | | | 32,567 | | | | 40,123 | | | Additions for business combination | | | 33,346 | | | | - | | | | - | | | | - | | | | - | | | | - | | | | 33,346 | | | Currency translation adjustment | | | (17,948 | ) | | | (23,717 | ) | | | (1,870 | ) | | | - | | | | (3,439 | ) | | | (404 | ) | | | (47,378 | ) | | As of June 30, 2014 | | | (513,123 | ) | | | (179,440 | ) | | | (111,276 | ) | | | (53,411 | ) | | | (73,963 | ) | | | 12,210 | | | | (919,003 | ) | | Charged / (Credited) to the income statements | | | 495,031 | | | | 33,722 | | | | 26,227 | | | | (19,197 | ) | | | (680,162 | ) | | | (23,832 | ) | | | (168,211 | ) | | Reclassifications from trading properties | | | (33,346 | ) | | | - | | | | - | | | | - | | | | - | | | | - | | | | (33,346 | ) | | Currency translation adjustment | | | (1,233 | ) | | | 11,879 | | | | 1,859 | | | | - | | | | 2,280 | | | | 786 | | | | 15,571 | | | As of June 30, 2015 | | | (52,671 | ) | | | (133,839 | ) | | | (83,190 | ) | | | (72,608 | ) | | | (751,845 | ) | | | (10,836 | ) | | | (1,104,989 | ) |
Cresud Sociedad Anónima, Comercial, Inmobiliaria, Financiera y Agropecuaria Notes to the Consolidated Financial Statements(Continued) (All amounts in millions of Argentine Pesos, except otherwise indicated) 25. Taxation (Continued) | Deferred income tax liabilities | | Investment properties | | Properties, plant and equipment | | Biological assets | | Intangible assets | | Investments | | Inventories | | Trade and other receivables | | Others | | Total | | June 30, 2014 | | (514) | | (121) | | (157) | | - | | 7 | | - | | (73) | | 24 | | (834) | | Charged/ (Credited) to the statement of income | | 495 | | 20 | | 27 | | - | | (20) | | (2) | | (611) | | (30) | | (121) | Reclassifications from trading properties
| | (33) | | - | | - | | - | | - | | - | | - | | - | | (33) | | Cumulative translation adjustment | | (1) | | 12 | | 2 | | - | | - | | - | | 2 | | - | | 15 | | Junio 30, 2015 | | (53) | | (89) | | (128) | | - | | (13) | | (2) | | (682) | | (6) | | (973) | | Charged/ (Credited) to the statement of income | | 938 | | 23 | | (117) | | 247 | | (837) | | (17) | | 572 | | 227 | | 1,036 | | Business combinations | | (5,630) | | - | | - | | (2,031) | | - | | - | | (20) | | (728) | | (8,409) | | Cumulative translation adjustment | | (3,205) | | 7 | | (1) | | (1,076) | | - | | (35) | | (13) | | (442) | | (4,765) | | June 30, 2016 | | (7,950) | | (59) | | (246) | | (2,860) | | (850) | | (54) | | (143) | | (949) | | (13,111) |
Cresud Sociedad Anónima, Comercial, Inmobiliaria, Financiera y Agropecuaria Notes to the Consolidated Financial Statements(Continued) (All amounts in millions of Argentine Pesos, except otherwise indicated) 25. Taxation (Continued) Deferred income tax assets are recognized for tax loss carry-forwards to the extent that the realization of the related tax benefits through future taxable profits is probable. Tax loss carry-forwards may have expiration dates or may be permanently available for use by the Group depending on the tax jurisdiction where the tax loss carry-forwardcarry forward is generated. Tax loss carry forwards in Argentina and Uruguay generally expire within 5 years. Tax loss carry-forwardcarry forward in Bolivia expire within 3 years. Tax loss carry-forwardscarry forwards in Brazil do not expire. However, in Brazil, the taxable profit for each year can only be reduced by tax losses up to a maximum of 30%.
As of June 30, 2016, the Group’s tax loss carry-forwards expiration dates are as follows: | Jurisdiction | | Tax loss carry-forward | | Due date | | Argentina | | 117 | | 2017 | | Argentina | | 250 | | 2018 | | Argentina | | 914 | | 2019 | | Argentina | | 173 | | 2020 | | Argentina | | 1,263 | | 2021 | | Uruguay | | 16 | | 2017 | | Uruguay | | 10 | | 2018 | | Uruguay | | 18 | | 2019 | | Uruguay | | 7 | | 2020 | | Uruguay | | 5 | | 2021 | | Bolivia | | 15 | | 2017 | | Bolivia | | 9 | | 2018 | | Bolivia | | 13 | | 2019 | | Israel | | 68,049 | | Do not expires | | | | 70,859 | | |
Cresud Sociedad Anónima,
Comercial, Inmobiliaria, Financiera y Agropecuaria
Notes to Consolidated Financial Statements (Continued)
(All amounts in thousands of Argentine Pesos, except shares and per share data and as otherwise indicated)
In order to fully realize the deferred tax asset, the Group will need to generate future taxable income. To this aim the Group made a projection for future years when deferred assets will be deductible. Such projection is based on aspects such as the expected performance of the main macroeconomic variables affecting the business, production issues, pricing, yields and costs that make up the operational flows derived from the regular exploitation of fields and other assets of the group, the flows derived from the performance of financial assets and liabilities and the income generated by the Group’s strategy of crop rotation. Such strategy implies the purchase and/or development of fields in marginal areas or areas with a high upside potential and periodical sale of such properties that are deemed to have reached their maximum appreciation potential.
Based on the estimated and aggregate effect of all these aspects on the Group’s performance, Management estimates that as at June 30, 2015,2016, it is probable that the Company will realize all of the deferred tax assets.
AsCresud Sociedad Anónima, Comercial, Inmobiliaria, Financiera y Agropecuaria Notes to the Consolidated Financial Statements(Continued) (All amounts in millions of June 30, 2015, the tax loss carry-forwards of the Group and the jurisdictions which generated them are as follows:Argentine Pesos, except otherwise indicated)
| Jurisdiction | | Tax loss carry-forward | | | Date of generation | | | Due date | | | Argentina | | | 32,694 | | | | 2011 | | | | 2016 | | | Argentina | | | 123,003 | | | | 2012 | | | | 2017 | | | Argentina | | | 254,814 | | | | 2013 | | | | 2018 | | | Argentina | | | 1,774,300 | | | | 2014 | | | | 2019 | | | Argentina | | | 162,902 | | | | 2015 | | | | 2020 | | | Uruguay | | | 903 | | | | 2011 | | | | 2016 | | | Uruguay | | | 9,777 | | | | 2012 | | | | 2017 | | | Uruguay | | | 1,093 | | | | 2013 | | | | 2018 | | | Uruguay | | | 16,057 | | | | 2014 | | | | 2019 | | | Uruguay | | | 4,336 | | | | 2015 | | | | 2020 | | | Bolivia | | | 149 | | | | 2012 | | | | 2015 | | | Bolivia | | | 9,064 | | | | 2014 | | | | 2017 | | | Bolivia | | | 6,803 | | | | 2015 | | | | 2018 | | | | | | 2,395,895 | | | | | | | | | |
25. Taxation (Continued)
The Group did not recognize deferred income tax assets of Ps. 43.3 million74,266.4 and Ps. 57.1 million43.33 as of June 30, 2016 and 2015, and 2014, respectively the main deferred income tax asset not recognized is related to certain businesses which are still in development stage or that have a history of recurring losses.our subsidiary IDBD. Although management estimates that the business will generate sufficient income, pursuant to IAS 12, management has determined that, as a result of the recent loss history and the lack of verifiable and objective evidence due to the subsidiary’s results of operations history, there is sufficient uncertainty as to the generation of sufficient income to be able to offset the losses within a reasonable timeframe, therefore, no deferred tax asset is recognized in relation to these losses. Cresud Sociedad Anónima,
Comercial, Inmobiliaria, Financiera y Agropecuaria
Notes to Consolidated Financial Statements (Continued)
(All amounts in thousands of Argentine Pesos, except shares and per share data and as otherwise indicated)
The Group did not recognize deferred income tax liabilities of Ps. 71.83 million825.18 and Ps. 46.4 million71.83 as of June 30, 20152016 and 2014,2015, respectively, related to the potential dividends distribution of itstheir investments in foreign subsidiaries, associates and joint ventures. In addition, the withholdings and/or similar taxes paid at source may be creditable against the Group’s potential final tax liability. The Group hasCompany does not set up an allowance for MPIT and is considering filing a declaratory action under the intentionterms of section 322 of the Civil and abilityCommercial Procedural Code against the AFIP seeking certainty as to indefinitely reinvest these results.
Below is a reconciliation between the income tax recognized and that which would result from applyingapplication of the prevailing tax rate on the Income/loss before income taxMPIT for the years ended June 30,fiscal year 2014, 2015 and advance payments from 7 through 11 corresponding to fiscal year 2014, in relation to the decision by the Argentine Supreme Court in the case “Hermitage” on September 15, 2010 and 2013:“Perfil” on February 11, 2014. In such judicial precedents, the Court had declared such tax to be unconstitutional given that, under certain circumstances, it proves to be unreasonable and inconsistent with the ability-to-pay principle.
| | | June 30, 2015 | | | June 30, 2014 | | | June 30, 2013 | | | Tax calculated at the tax rates applicable to profits in the respective countries | | | 858,031 | | | | (550,285 | ) | | | 61,284 | | | Permanent differences: | | | | | | | | | | | | | | Share of (loss) / profit of associates and joint ventures | | | (543,178 | ) | | | 153,919 | | | | (24,715 | ) | | Capital indexation of foreign companies | | | (3,971 | ) | | | (1,591 | ) | | | - | | | Loss from disposal of associates and joint ventures | | | - | | | | (8,668 | ) | | | - | | | Unrecognized tax losses | | | 21,591 | | | | 43,398 | | | | 16,008 | | | Non-taxable income | | | (57,050 | ) | | | (31,454 | ) | | | (9,603 | ) | | Non-deductible expenses | | | 7,882 | | | | 3,700 | | | | 8,937 | | | Others | | | 20,045 | | | | 1,566 | | | | (18,392 | ) | | Income tax expense | | | 303,350 | | | | (389,415 | ) | | | 33,519 | |
The Group as lessee
Operating leases:
In the ordinary course of business, the Group enters into several operating lease agreements. The Group conducts a portion of its agricultural activities on land rented from third parties under operating lease contracts averaging a harvest year. The Group uses rented land for cultivation or cattle rising. Lease contracts are generally renewable for additional harvest periods. Rent is generally payable at intervals during the harvest year. Lease contracts vary but generally payments are generally based on the market price of a particular crop multiplied by a fixed amount of tons per hectare leased. Other contracts are based on a fixed amount of US dollars per hectare. Rent expense for the years ended as of June 30, 2016, 2015 2014 and 20132014 amounted to Ps. 79.7, Ps. 98.8 million,and Ps. 78.6, million and Ps. 56.4 million, respectively and is included in the line item "Cost" in the income statements. Cresud Sociedad Anónima,
Comercial, Inmobiliaria, Financiera y Agropecuaria
Notes to Consolidated Financial Statements (Continued)
(All amounts in thousands of Argentine Pesos, except shares and per share data and as otherwise indicated)
As discussed in Note 2.9, the Group is also using land in the Province of Salta under rights of use agreement (the "Anta Agreement") for which the Group is currently paying a rent fee of 10% of the production. Rent expense for the years ended June 30, 2016, 2015 2014 and 20132014 amounted to Ps. 4.5, Ps. 4.7 million,and Ps. 2.6, million and Ps. 1.4 million, respectively, and is included in the line item "Costs" in the income statements.
Cresud Sociedad Anónima, Comercial, Inmobiliaria, Financiera y Agropecuaria Notes to the Consolidated Financial Statements(Continued) (All amounts in millions of Argentine Pesos, except otherwise indicated) 26. Leases (Continued) The Group leases two properties which uses as shopping centers. These contracts provideproperty or spaces for administrative or commercial use both in Argentina and Israel under operating lease arrangements. The agreements entered into include several clauses, including but not limited, to fixed, monthly payments, adjusted pursuant to a rent escalation clause. Rent expensevariable or adjustable payments. Some leases were agreed upon with related parties (Note 35). The amounts involved have not been material for any of the years ended June 30, 2015, 2014 and 2013 amounted to Ps. 3.0 million, Ps. 2.9 million and Ps. 2.9 million, respectively, and is included in the line item "Costs" in the income statements.filed periods.
The Group also rents office spaces under an operating lease with companies related to the Chairman and Director of the Group. (See Note 38)(Note 35).
The future aggregate minimum lease payments the Group will have to cancel under non-cancellable operating leases are as follows:
| | | June 30, 2015 | | | June 30, 2014 | | | June 30, 2013 | | | No later than 1 year | | | 37,662 | | | | 44,181 | | | | 22,852 | | | Later than one year and not later than five years | | | 47,858 | | | | 83,598 | | | | 16,908 | | | More than 5 years | | | 83,995 | | | | 102,315 | | | | 39,884 | | | | | | 169,515 | | | | 230,094 | | | | 79,644 | |
| | June 30, 2016 | | June 30, 2015 | | June 30, 2014 | | No later than one year | 3,907 | | 38 | | 44 | | Later than one year not later than five years | 6,859 | | 48 | | 84 | | More than five years | 2,254 | | 84 | | 102 | | | 13,020 | | 170 | | 230 |
Finance leases:leases
The Group rents certain computer equipment under various finance leases for an average term of three years. Book value of these assets under finance leases is disclosed in Note 11.12.
At the commencement of the lease term, the Group recognizes a lease liability equal to the carrying amount of the leased asset. In subsequent periods, the liability decreases by the amount of lease payments made to the lessors using the effective interest method. The interest component of the lease payments is recognized in the income statements. Book value of liabilities under finance leases is disclosed in Note 25.26. Lease liabilities are effectively secured as the rights to the leased asset revert to the lessor in the event of default. Cresud Sociedad Anónima,
Comercial, Inmobiliaria, Financiera y Agropecuaria
Notes to Consolidated Financial Statements (Continued)
(All amounts in thousands of Argentine Pesos, except shares and per share data and as otherwise indicated)
The future aggregate minimum lease payments under cancellable operating leases are as follows:
| | | June 30, 2015 | | | June 30, 2014 | | | June 30, 2013 | | June 30, 2016 | | June 30, 2015 | | June 30, 2014 | | No later than 1 year | | | 12,172 | | | | 2,291 | | | | 1,612 | | | | Later than 1 year and not later than 5 years | | | 15,650 | | | | 1,348 | | | | 1,790 | | | | No later than one year | | 11 | | 12 | | 2 | | Later than one year not later than five years | | 17 | | 15 | | 1 | | | | | 27,822 | | | | 3,639 | | | | 3,402 | | 28 | | 27 | | 3 | | Future finance charges | | | (2,356 | ) | | | (350 | ) | | | (354 | ) | (2) | | (2) | | - | | Present value of finance lease liabilities | | | 25,466 | | | | 3,289 | | | | 3,048 | | 26 | | 25 | | 3 |
Cresud Sociedad Anónima, Comercial, Inmobiliaria, Financiera y Agropecuaria Notes to the Consolidated Financial Statements(Continued) (All amounts in millions of Argentine Pesos, except otherwise indicated) 26. Leases (Continued) The fair value of finance lease liabilities is as follows:
| | | June 30, 2015 | | | June 30, 2014 | | | June 30, 2013 | | | No later than 1 year | | | 11,768 | | | | 2,102 | | | | 1,460 | | | Later than 1 year and not later than 5 years | | | 13,698 | | | | 1,187 | | | | 1,588 | | | Present value of finance lease liabilities | | | 25,466 | | | | 3,289 | | | | 3,048 | |
| | June 30, 2016 | | June 30, 2015 | | June 30, 2014 | | No later than one year | 12 | | 12 | | 2 | | Later than one year and not later than five years | 14 | | 13 | | 1 | | Present value of finance lease liabilities | 26 | | 25 | | 3 |
Under the terms of these agreements, no contingent rents are payable. The interest rate inherent is fixed at the contract date for all of the lease term. The average interest raterates on finance lease payables at June 30, 2016, 2015 and 2014 were 11.1%, 9.2% and 2013 were 9.2%, 11.20% and 10.75%, respectively.
The Group as lessor
Operating leases (Shopping centers, offices and other buildings):leases: TheIn the segment Shopping Centers and Offices and others in the Operations Center Argentina and in the segment Real Estate in the Operations Center Israel, the Group enters into cancellable operating lease agreements typical in the business. Given the diversity of properties and lessees, and the various economic and regulatory jurisdictions where the Group operates, the agreements may adopt different forms, such as fixed, variable, adjustable leases, etc. For example, in the Operations Center Argentina, operating lease agreements relatingwith lessees of shopping centers generally include step-up clauses and contingent payments. In Israel, agreements tend to shopping centers. The agreements have an average term ragingbe agreed upon for fixed amounts, although in some cases they may include adjustment clauses. Income from three to five years. Some leases relating to anchor stores having termsare recorded in the statement of ten years, which are usually extendable. Tenants are charged a rent which is the higher between (i) the base rent;income under rental and (ii) the percentage rent (which is generally established as a percentage over sales that ranges between 4% and 10%). Furthermore, pursuant to the rent escalation clause establishedservice income in most lease arrangements, the tenants’ base rent generally increases between 18% and 24% each year during the agreement term. Regarding the percentage rent, since the rent is not known until the endall of the period, such percentage rent meets the definition of contingent rent under IAS 17 "Leases". Accordingly, rental income will be recognized once the contingent rent is known.
Cresud Sociedad Anónima,
Comercial, Inmobiliaria, Financiera y Agropecuaria
Notes to Consolidated Financial Statements (Continued)
(All amounts in thousands of Argentine Pesos, except shares and per share data and as otherwise indicated)
For the fiscal years ended June 30, 2015, 2014 and 2013, the average (basic rental) and contingent (supplementary rental) rental income of the Group’s shopping centers amounted to Ps. 929,063, Ps. 746,666 and Ps. 588,121, and to Ps. 461,394, Ps. 329,258 and Ps. 254,429, respectively, and are included under “Revenue” in the income statements.filed periods.
Additionally, the Group owns a shopping centerRental properties are considered to be investment property known as "Patio Olmos" in the Province of Córdoba, Argentina.(Note 10). The Group rents this property to a third party shopping center operator under an operating lease agreement expiring in 2032. The lease provides for fixed monthly payments, adjusted pursuant to a rent escalation clause. Rental income for the years ended June 30, 2015, 2014book value, depreciation charge, and 2013 amounted to Ps. 181, Ps. 151 and Ps. 343 and isaccumulated depreciation are included in the line item "Revenue" in the income statements.Note 10.
The Group enters into cancellable operating leasing agreements relating to offices and other buildings. The agreements have an average term raging from three to five years. The tenants are charged a base rent payable on a monthly basis.
Rental income of the Group’s offices and other buildings amounted to Ps. 305,882,321, Ps. 255,788306 and Ps. 204,329256 for the fiscal years ended June 30, 2016, 2015 2014 and 2013,2014, respectively and is included into “Revenue” in the income statements.
The future minimum proceeds under non-cancellable operating leases from Group’s offices and other buildings are as follows:
| | | June 30, 2015 | | | June 30, 2014 | | June 30, 2016 | | June 30, 2015 | | June 30, 2014 | | 2015 | | | - | | | | 731,570 | | - | | - | | 732 | | 2016 | | | 982,335 | | | | 522,764 | | - | | 982 | | 523 | | 2017 | | | 690,358 | | | | 220,605 | | 3,137 | | 690 | | 221 | | 2018 | | | 322,625 | | | | 58,600 | | 3,237 | | 323 | | 59 | | 2019 | | | 83,321 | | | | 18,291 | | 2,564 | | 83 | | 18 | | Later than 2019 | | | 23,989 | | | | 14,420 | | | | 2020 | | 1,988 | | 24 | | 14 | | Later than 2020 | | 5,577 | | - | | - | | | | | 2,102,628 | | | | 1,566,250 | | 16,503 | | 2,102 | | 1,567 |
Cresud Sociedad Anónima, Comercial, Inmobiliaria, Financiera y Agropecuaria Notes to the Consolidated Financial Statements(Continued) (All amounts in millions of Argentine Pesos, except otherwise indicated) 26. Leases (Continued) Farmland leases
From time to time, the Group leases certain farmlands. The leases have an average term of one crop year. Rental income is generally based on the market price of a particular crop multiplied by a fixed amount of tons per hectare leased.
Cresud Sociedad Anónima,
Comercial, Inmobiliaria, Financiera y Agropecuaria
Notes to Consolidated Financial Statements (Continued)
(All amounts in thousands of Argentine Pesos, except shares and per share data and as otherwise indicated)
Rental income was Ps. 22, Ps. 15.1 million,and Ps. 13.8 million and Ps. 23.8 million for the years ended June 30, 2016, 2015 2014 and 20132014 and is included within “Revenue” in the income statements.
Even though all leases described above are cancellable by law, the Group considered them to be non-cancellable (see Note 2.28 for further details).
The future aggregate minimum lease proceeds under non-cancellable operating leases from the Group are as follows:
| | | June 30, 2015 | | | June 30, 2014 | | | June 30, 2013 | | | No later than 1 year | | | 5,092 | | | | 8,501 | | | | 6,898 | | | Later than one year and not later than five years | | | 614 | | | | 643 | | | | 6,916 | | | More than 5 years | | | - | | | | 1,928 | | | | 1,379 | | | | | | 5,706 | | | | 11,072 | | | | 15,193 | |
| | June 30, 2016 | | June 30, 2015 | | June 30, 2014 | | No later than one year | 14 | | 5 | | 9 | | Later than one year and not later than five years | - | | 1 | | 1 | | More than five years | - | | - | | 2 | | | 14 | | 6 | | 12 |
Finance leases:
The Group does not act as a lessor in connection with finance leases.
Cresud Sociedad Anónima,27. Comercial, Inmobiliaria, Financiera y Agropecuaria
Notes to Consolidated Financial Statements (Continued)
(All amounts in thousands of Argentine Pesos, except shares and per share data and as otherwise indicated)Shareholders' equity
Share capital and premium
The share capital of the Group is represented by common shares with a nominal value of Ps. 1 per share and one vote each. The movementsNo other activity has been recorded for the fiscal years ended June 30, 2016, 2015 and 2014 in the capital accounts, other than those related to the acquisition of treasury shares. Inflation adjustment of share capital The Group’s financial statements were previously prepared on the basis of general price-level accounting which reflected changes in the purchase price of the Argentine Peso in the historical financial statements through February 28, 2003. The inflation adjustment related to share capital was appropriated to an inflation adjustment reserve that formed part of shareholders' equity. The balance of this reserve could be applied only towards the issuance of common stock to shareholders of the Company. Resolution 592/11 of the CNV requires that at the transition date to IFRS certain equity accounts, such as the inflation adjustment reserve, are not adjusted and are considered an integral part of June 30, 2015share capital. Cresud Sociedad Anónima, Comercial, Inmobiliaria, Financiera y Agropecuaria Notes to the Consolidated Financial Statements(Continued) (All amounts in millions of Argentine Pesos, except otherwise indicated) 27. Shareholders' equity (Continued) Legal reserve According to Law No. 19,550, 5% of the profit of the year is separated to constitute a legal reserve until they reach legal capped amounts (20% of total capital). This legal reserve is not available for dividend distribution and 2014 are as follows:can only be released to absorb losses. The Group has not reached the legal limit of this reserve.
| | | Number of shares | | | Capital | | | Share premium | | | Share premium of treasury stock | | | As of June 30, 2013 | | | 496,561,976 | | | | 496,562 | | | | 773,079 | | | | - | | | Purchase of treasury stock | | | (5,565,479 | ) | | | (5,565 | ) | | | - | | | | - | | | As of June 30, 2014 | | | 490,996,497 | | | | 490,997 | | | | 773,079 | | | | - | | | Shares distribution resolved by Shareholders' meeting held on November 14, 2014 | | | 5,565,479 | | | | 5,565 | | | | - | | | | - | | | Share premium resolved by Shareholders' meeting held on November 14, 2014 | | | - | | | | - | | | | (220,881 | ) | | | - | | | Purchase of treasury stock | | | (3,067,837 | ) | | | (3,068 | ) | | | - | | | | - | | | Exercise of warrants | | | 80,074 | | | | 80 | | | | 1,132 | | | | - | | | Awards granted under equity incentive plan | | | 1,203,030 | | | | 1,203 | | | | - | | | | 12,678 | | | Maturity share warrants | | | - | | | | - | | | | 106,134 | | | | - | | | As of June 30, 2015 | | | 494,777,243 | | | | 494,777 | | | | 659,464 | | | | 12,678 | |
Special reserve
Pursuant to CNV General Ruling N°No. 609/12, the Company set up a special reserve, to reflect the positive difference between the balance at the beginning of retained earnings disclosed in the first financial statements prepared according to IFRS and the balance at closing of retained earnings disclosed in the last financial statements prepared in accordance with previously effective accounting standards. This reserve cannotmay not be used to make distributions in kind or in cash, and canmay only be reversed to be capitalized, or otherwise to absorb potential negative balances in Retained Earnings. The Company reversed the above mentioned Reserve was reversed underreserve to absorb the appropriationaccumulated deficit as of Retained Earnings resolved by Shareholders’ meeting held on November 14,the fiscal year ended June 30, 2014. Dividends During the year ended June 30, 2016, there were no distributions of dividends. Dividends distributed during fiscal year ended June 30, 2015 amounted to Ps. 6. Dividends distributed during fiscal year ended June 30, 2014 amounted to Ps. 120. Additional paid-in capital from treasury shares Upon sale of the treasury shares, the difference between the net realizable value of the treasury shares sold and their acquisition cost shall be recorded, whether it is a gain or a loss, as part of owners’ contributions not yet capitalized to be called “Additional Paid-in Capital from Treasury Shares”. Cresud Sociedad Anónima, Comercial, Inmobiliaria, Financiera y Agropecuaria
Notes to the Consolidated Financial Statements(Continued) (All amounts in thousandsmillions of Argentine Pesos, except shares and per share data and as otherwise indicated)
30. | Shareholders’ Equity 27. Shareholders’ Equity (Continued)(Continued)
|
Treasury stock
During 2009, the Company acquired 30 million shares of own stock for Ps. 1.7 million in cash following a Board of Directors' resolution dated October of 2008. As per Argentine Corporations Law, an entity has a period of one year from acquisition to sell or otherwise dispose of treasury stock unless an extension is provided for in a shareholders meeting. In November 2009, the Board of Directors assigned 25 million shares of treasury stock to the shareholders on a pro rata basis. After this assignment, the Group held 5 million shares of treasury stock. In October 2011, the General Ordinary and Extraordinary Shareholders’ Meeting approved the allocation of treasury stock to the “Equity Incentive Plan”.
On April 11, 2014, the Company reported a potential repurchase of shares intended to curb the drop in prices and reduce fluctuations on the Company’s shares and ADS and strengthen its position in the market, thus minimizing potential temporary imbalances that may arise between supply and demand. On that same date, the Shareholders’ Meeting approved a partial release of the account “Reserve for new projects” in an amount of up to Ps. 200 million, in order to appropriate such amount of money to set up a reserve entitled “Reserve for the repurchase of securities”. In view of this measure, the Shareholders’ Meeting approved the repurchase of securities issued by the Company in an amount of Ps. 200 million, to be carried out before December 31, 2014, which period may be extended for an identical term. Cresud’s Board of Directors set forth the terms and conditions governing the purchase of the Company's own stock pursuant to Section 64 of Law N° 26,831 and the CNV’s regulations, for up to an aggregate amount of Ps. 200 million and up to 5% of the capital stock, in the form of common shares or American Depositary Shares (ADS) representing 10 shares each, and up to a daily limit of 25% of the average daily transaction volume experienced by the Company’s shares, along with the markets where they are listed, during the prior 90 business days, andGroup’s other reserves at a price ranging from a minimum of Ps. 1 up to Ps. 13.5 per share and ranging from a minimum of US$ 1 per ADS up to US$ 14 per ADS.
During the year ended June 30, 2016, 2015 and 2014 the Company purchased 128,749 common shares (N.V. Ps. 1 per share) for a total amount of Ps. 0.2 million and 543,673 ADRs (representing 5,436,730 common shares) for a total amount of US$ 6.6 million, completing the terms and conditions of the share repurchase plan.were as follows:
During the fiscal year ended June 30, 2015 Cresud repurchased 37,657 common, registered shares of own stock of Ps. 1 nominal value and 1 vote per share, in exchange for Ps. 0.5 million and 303,018 American Depositary Shares or ADRs representing 10 shares each for a total amount of US$ 3.9 million, thus completing the terms and conditions of the share repurchase plan.| | Cost of treasury shares | Transactions with non-controlling interest | Reserve for cumulative translation adjustment | Reserve for share based compensation | Reserve for future dividends | Hedging instruments | Reserve for new developments | Reserve for defined benefit plans | Reserve for the acquisition of securities issued by the Company | Other subsidiaries reserves | Total other reserves | | Balance as of June 30, 2013 | - | (22) | 3 | 8 | - | - | 337 | - | - | - | 326 | | Other comprehensive income for the year | - | | 631 | - | - | - | - | - | - | - | 631 | | Total comprehensive income for the year | - | - | 631 | - | - | - | - | - | - | - | 631 | | Cash dividends | - | - | - | - | - | - | (120) | - | - | - | (120) | | Equity settled compensation | - | - | - | 63 | - | - | - | - | - | - | 63 | | Cancellation of BrasilAgro warrants | - | - | - | (1) | - | - | - | - | - | - | (1) | | Acquisition of treasury shares | (55) | - | - | - | - | - | - | - | - | - | (55) | | Release of reserve for new developments resolved by Shareholders’ Meeting held on April 11, 2014 | - | - | - | - | - | - | (200) | - | 200 | - | - | | Transaction with non-controlling interest | - | 7 | - | - | - | - | - | - | - | - | 7 | | Balance as of June 30, 2014 | (55) | (15) | 634 | 70 | - | - | 17 | - | 200 | - | 851 | | Other comprehensive loss for the year | - | - | (191) | - | - | - | - | - | - | - | (191) | | Total comprehensive loss for the year | - | - | (191) | - | - | - | - | - | - | - | (191) | | Appropriation of retained earnings resolved by Shareholders’ Meeting held on November 14, 2014: | | | | | | | | | | | | | - Share distribution | 55 | - | - | - | - | - | - | - | (55) | - | - | | - Reserve for new developments | - | - | - | - | - | - | (17) | - | | - | (17) | | - Reserve for repurchase of share | - | - | - | - | - | - | - | - | (113) | - | (113) | | Equity settled compensation | - | - | - | 28 | - | - | - | - | - | - | 28 | | Acquisition of treasury shares | (32) | - | - | - | - | - | - | - | - | - | (32) | | Awards granted under equity incentive plan | - | - | - | (16) | - | - | - | - | - | - | (16) | | Transaction with non-controlling interest | - | 69 | - | - | - | - | - | - | - | - | 69 | | Balance as of June 30, 2015 | (32) | 54 | 443 | 82 | - | - | - | - | 32 | - | 579 | | Other comprehensive income / (loss) for the year | - | - | 422 | - | - | (24) | - | (6) | - | - | 392 | | Total comprehensive income / (loss) for the year | - | - | 422 | - | - | (24) | - | (6) | - | - | 392 | | Appropriation of retained earnings resolved by Shareholders’ Meeting held on October 30 and November 26, 2015: | | | | | | | | | | | | | - Reserve for future dividends | - | - | - | - | 31 | - | - | - | - | - | 31 | | Equity settled compensation | - | - | - | 17 | - | - | - | - | - | - | 17 | | Equity incentive plan granted | - | - | - | (4) | - | - | - | - | - | - | (4) | | Transaction with non-controlling interest | - | 106 | - | - | - | - | - | - | - | - | 106 | | Cumulative translation adjustment before business combination | - | - | (58) | - | - | - | - | - | - | - | (58) | | Share of changes in subsidiaries’ equity | - | - | - | - | - | - | - | - | - | 23 | 23 | | Balance as of June 30, 2016 | (32) | 160 | 807 | 95 | 31 | (24) | - | (6) | 32 | 23 | 1,086 |
Cresud Sociedad Anónima, Comercial, Inmobiliaria, Financiera y Agropecuaria
Notes to the Consolidated Financial Statements(Continued) (All amounts in thousandsmillions of Argentine Pesos, except shares and per share data and as otherwise indicated)
28. 30. | Shareholders’ Equity (Continued)Revenues
|
On November 14, 2014, the Shareholders’ Meeting decided to conclude the shares and ADRs repurchase plan.| | June 30, 2016 | | June 30, 2015 | | June 30, 2014 | | Sale of trading properties | 191 | | 10 | | 63 | | Crops | 1,015 | | 950 | | 818 | | Cattle | 80 | | 57 | | 62 | | Dairy | 65 | | 72 | | 54 | | Sugarcane | 294 | | 198 | | 124 | | Supplies | 63 | | 55 | | 70 | | Beef | 966 | | 806 | | 549 | | Sale of communication equipment | 1,844 | | - | | - | | Revenue from supermarkets | 18,536 | | - | | - | | Revenues from sales | 23,054 | | 2,148 | | 1,740 | | Consignment revenues | 119 | | 32 | | | | Rental and services | 5,264 | | 2,995 | | 2,449 | | Hotel services | 557 | | 396 | | 332 | | Communication services | 4,956 | | - | | - | | Tourism services | 1,152 | | - | | - | | Leases and agricultural services | 40 | | 37 | | 29 | | Commissions | 66 | | 38 | | 47 | | Consumer financing | 171 | | - | | - | | Others | 5 | | 6 | | 7 | | Revenue from services | 12,330 | | 3,504 | | 2,864 | | Total revenues | 35,384 | | 5,652 | | 4,604 |
On December 12, 2014, as per the powers delegated by the Regular General Shareholders’ meeting on October 31, 2014, the Board decided to distribute pro rata among shareholders 5,565,479 treasury shares, which represent 0.0114% per share or 1.1406% on the outstanding capital of 487,928,660.Share warrants
| | June 30, 2016 | | June 30, 2015 | | June 30, 2014 | | Cost of leases and services | 13 | | 12 | | 9 | | Other operative costs | 10 | | 9 | | 8 | | Cost of property operations | 23 | | 21 | | 17 | | Crops | 1,707 | | 1,753 | | 1,508 | | Cattle | 254 | | 220 | | 151 | | Dairy | 135 | | 133 | | 104 | | Sugarcane | 494 | | 368 | | 207 | | Supplies | 49 | | 43 | | 56 | | Beef | 837 | | 655 | | 446 | | Leases and agricultural services | 7 | | 7 | | 15 | | Consignment costs | 6 | | 3 | | - | | Commissions | 11 | | 12 | | 8 | | Brokerage operations | 55 | | 32 | | 29 | | Others | 9 | | 7 | | 8 | | Costs of agricultural sales and services | 3,564 | | 3,233 | | 2,532 | | Costs of leases and services | 2,432 | | 1,224 | | 1,129 | | Costs of trading properties and developments | 15 | | 14 | | 19 | | Costs from hotel operations | 381 | | 278 | | 216 | | Costs of sale of communication equipment | 1,304 | | - | | - | | Costs of communication services | 3,304 | | - | | - | | Costs of tourism services | 1,049 | | - | | - | | Costs of supermarkets | 13,867 | | - | | - | | Costs of sale and developments | 151 | | - | | - | | Total costs | 26,090 | | 4,770 | | 3,913 |
In May 2015, certain option holders exercised their right to purchase additional shares, with the resulting addition of 80,074 common shares with a nominal value of Ps. 1 each. The exercise of such options resulted in an inflow of Ps. 1.2 million. All of Cresud’s existing options expired on May 22, 2015, after the end of the exercise period.
Restrictions on distribution of dividends
According to Argentine law, 5% of the profit of the year is separated to constitute a legal reserve until they reach legal capped amounts (20% of total capital). This legal reserve is not available for dividend distribution and can only be released to absorb losses. Shareholders’ Meeting held on November 14, 2014 resolved the use of the statutory reserve in the amount of Ps. 81,616 to absorb accumulated losses. The Company shall have to fully replenish such reserve before any distribution of accumulated earnings.
Given that the repurchase of shares for subsequent sale is to be funded out of net cash income or free reserves, pursuant to section 220.2. of Act 19,550, insofar as the Company maintains Treasury shares there is a restriction on the distribution of retained earnings or free reserves, equal to the acquisition cost.
Dividends
The dividends paid in the years ended June 30, 2014 and 2013 were Ps.120 million (Ps. 0.244 per share) and Ps. 120 million (Ps. 0.242 per share), respectively. No dividends were distributed as of June 30, 2015.
Cresud Sociedad Anónima, Comercial, Inmobiliaria, Financiera y Agropecuaria
Notes to the Consolidated Financial Statements(Continued) (All amounts in thousandsmillions of Argentine Pesos, except shares and per share data and as otherwise indicated)
30. | Shareholders’ Equity (Continued)
|
Expired dividends
During the years ended 2015, 2014 and 2013, Ps. 811, Ps. 1,690 and Ps. 629, respectively, expired, corresponding to dividends no yet paid from prior years.
| | | June 30, 2015 | | | | | Urban properties and investments | | | Agricultural | | | Agroindustrial | | | Total | | | Trading properties | | | 9,860 | | | | - | | | | - | | | | 9,860 | | | Crops | | | - | | | | 950,251 | | | | - | | | | 950,251 | | | Cattle | | | - | | | | 56,650 | | | | - | | | | 56,650 | | | Dairy | | | - | | | | 71,940 | | | | - | | | | 71,940 | | | Sugarcane | | | - | | | | 197,828 | | | | - | | | | 197,828 | | | Beef | | | - | | | | - | | | | 806,018 | | | | 806,018 | | | Supplies | | | - | | | | 55,034 | | | | - | | | | 55,034 | | | Sales revenues | | | 9,860 | | | | 1,331,703 | | | | 806,018 | | | | 2,147,581 | | | Base rent | | | 1,251,812 | | | | - | | | | - | | | | 1,251,812 | | | Contingent rent | | | 461,583 | | | | - | | | | - | | | | 461,583 | | | Admission rights | | | 156,438 | | | | - | | | | - | | | | 156,438 | | | Parking fees | | | 112,120 | | | | - | | | | - | | | | 112,120 | | | Commissions | | | 51,333 | | | | 1,774 | | | | - | | | | 53,107 | | | Consignment revenues | | | - | | | | 32,356 | | | | - | | | | 32,356 | | | Property management fee | | | 33,784 | | | | - | | | | - | | | | 33,784 | | | Expenses and Collective Promotion Funds (“CPF”) | | | 884,684 | | | | - | | | | - | | | | 884,684 | | | Flattening of tiered lease payments | | | 31,293 | | | | - | | | | - | | | | 31,293 | | | Leases and agricultural services | | | - | | | | 37,048 | | | | - | | | | 37,048 | | | Advertising and brokerage fees | | | - | | | | 35,877 | | | | - | | | | 35,877 | | | Others | | | 11,900 | | | | 5,778 | | | | - | | | | 17,678 | | | Service income | | | 2,994,947 | | | | 112,833 | | | | - | | | | 3,107,780 | | | Consumer financing | | | 147 | | | | - | | | | - | | | | 147 | | | Hotel operations | | | 396,297 | | | | - | | | | - | | | | 396,297 | | | Other revenues: | | | 396,444 | | | | - | | | | - | | | | 396,444 | | | Total Group revenue | | | 3,401,251 | | | | 1,444,536 | | | | 806,018 | | | | 5,651,805 | |
Cresud Sociedad Anónima,30. Comercial, Inmobiliaria, Financiera y AgropecuariaExpenses by nature
Notes to Consolidated Financial Statements (Continued)
(All amounts in thousands of Argentine Pesos, except shares and per share data and as otherwise indicated)
| | | June 30, 2014 | | | | | Urban properties and investments | | | Agricultural | | | Agroindustrial | | | Total | | | Trading properties | | | 62,641 | | | | - | | | | - | | | | 62,641 | | | Crops | | | - | | | | 817,702 | | | | - | | | | 817,702 | | | Cattle | | | - | | | | 61,691 | | | | - | | | | 61,691 | | | Dairy | | | - | | | | 53,935 | | | | - | | | | 53,935 | | | Sugarcane | | | - | | | | 123,851 | | | | - | | | | 123,851 | | | Beef | | | - | | | | | | | | 548,740 | | | | 548,740 | | | Supplies | | | - | | | | 70,388 | | | | - | | | | 70,388 | | | Sales revenues | | | 62,641 | | | | 1,127,567 | | | | 548,740 | | | | 1,738,948 | | | Base rent | | | 1,079,779 | | | | - | | | | - | | | | 1,079,779 | | | Contingent rent | | | 329,889 | | | | - | | | | - | | | | 329,889 | | | Admission rights | | | 126,495 | | | | - | | | | - | | | | 126,495 | | | Parking fees | | | 81,382 | | | | - | | | | - | | | | 81,382 | | | Commissions | | | 42,458 | | | | 2,042 | | | | - | | | | 44,500 | | | Property management fee | | | 27,121 | | | | - | | | | - | | | | 27,121 | | | Expenses and Collective Promotion Funds (“CPF”) | | | 736,302 | | | | - | | | | - | | | | 736,302 | | | Flattening of tiered lease payments | | | 14,771 | | | | - | | | | - | | | | 14,771 | | | Leases and agricultural services | | | - | | | | 29,044 | | | | - | | | | 29,044 | | | Brokerage fees | | | - | | | | 44,834 | | | | - | | | | 44,834 | | | Others | | | 12,202 | | | | 6,608 | | | | - | | | | 18,810 | | | Service income | | | 2,450,399 | | | | 82,528 | | | | - | | | | 2,532,927 | | | Consumer financing | | | 574 | | | | - | | | | - | | | | 574 | | | Hotel operations | | | 331,562 | | | | - | | | | - | | | | 331,562 | | | Other revenues | | | 332,136 | | | | - | | | | - | | | | 332,136 | | | Total Group revenue | | | 2,845,176 | | | | 1,210,095 | | | | 548,740 | | | | 4,604,011 | |
| | | June 30, 2013 | | | | | Urban properties and investments | | | Agricultural | | | Agroindustrial | | | Total | | | Trading properties | | | 24,867 | | | | - | | | | - | | | | 24,867 | | | Crops | | | - | | | | 745,932 | | | | - | | | | 745,932 | | | Cattle | | | - | | | | 74,534 | | | | - | | | | 74,534 | | | Dairy | | | - | | | | 38,818 | | | | - | | | | 38,818 | | | Sugarcane | | | - | | | | 160,259 | | | | - | | | | 160,259 | | | Beef | | | - | | | | - | | | | 206,121 | | | | 206,121 | | | Supplies | | | - | | | | 47,990 | | | | - | | | | 47,990 | | | Sales revenues | | | 24,867 | | | | 1,067,533 | | | | 206,121 | | | | 1,298,521 | | | Base rent | | | 828,923 | | | | - | | | | - | | | | 828,923 | | | Contingent rent | | | 254,854 | | | | - | | | | - | | | | 254,854 | | | Admission rights | | | 107,608 | | | | - | | | | - | | | | 107,608 | | | Parking fees | | | 62,484 | | | | - | | | | - | | | | 62,484 | | | Commissions | | | 33,620 | | | | 1,347 | | | | - | | | | 34,967 | | | Property management fee | | | 21,803 | | | | - | | | | - | | | | 21,803 | | | Expenses and Collective Promotion Funds (“CPF”) | | | 594,290 | | | | - | | | | - | | | | 594,290 | | | Flattening of tiered lease payments | | | 22,641 | | | | - | | | | - | | | | 22,641 | | | Leases and agricultural services | | | - | | | | 30,815 | | | | 1,634 | | | | 32,449 | | | Brokerage fees | | | - | | | | 29,883 | | | | - | | | | 29,883 | | | Others | | | 9,052 | | | | 4,038 | | | | - | | | | 13,090 | | | Service income | | | 1,935,275 | | | | 66,083 | | | | 1,634 | | | | 2,002,992 | | | Consumer financing | | | 1,203 | | | | - | | | | - | | | | 1,203 | | | Hotel operations | | | 225,835 | | | | - | | | | - | | | | 225,835 | | | Other revenues | | | 227,038 | | | | - | | | | - | | | | 227,038 | | | Total Group revenue | | | 2,187,180 | | | | 1,133,616 | | | | 207,755 | | | | 3,528,551 | |
Cresud Sociedad Anónima,
Comercial, Inmobiliaria, Financiera y Agropecuaria
Notes to Consolidated Financial Statements (Continued)
(All amounts in thousands of Argentine Pesos, except shares and per share data and as otherwise indicated)
| | | June 30, 2015 | | | | | Urban properties and investments | | | Agricultural | | | Agroindustrial | | | Total | | | Cost of leases and services | | | - | | | | 11,983 | | | | - | | | | 11,983 | | | Other operative costs | | | - | | | | 9,002 | | | | - | | | | 9,002 | | | Cost of property operations | | | - | | | | 20,985 | | | | - | | | | 20,985 | | | Crops | | | - | | | | 1,752,577 | | | | - | | | | 1,752,577 | | | Cattle | | | - | | | | 219,713 | | | | - | | | | 219,713 | | | Dairy | | | - | | | | 133,259 | | | | - | | | | 133,259 | | | Sugarcane | | | - | | | | 368,172 | | | | - | | | | 368,172 | | | Beef | | | - | | | | - | | | | 654,813 | | | | 654,813 | | | Supplies | | | - | | | | 42,814 | | | | - | | | | 42,814 | | | Leases and agricultural services | | | - | | | | 7,217 | | | | - | | | | 7,217 | | | Brokerage fees | | | - | | | | 32,372 | | | | - | | | | 32,372 | | | Commissions | | | - | | | | 11,969 | | | | - | | | | 11,969 | | | Consignment costs | | | - | | | | 3,069 | | | | - | | | | 3,069 | | | Others | | | - | | | | 6,617 | | | | - | | | | 6,617 | | | Cost of agricultural sales and services | | | - | | | | 2,577,779 | | | | 654,813 | | | | 3,232,592 | | | Cost of sale of trading properties | | | 13,934 | | | | - | | | | - | | | | 13,934 | | | Cost from hotel operations | | | 277,884 | | | | - | | | | - | | | | 277,884 | | | Cost of leases and services | | | 1,224,264 | | | | - | | | | - | | | | 1,224,264 | | | Other costs | | | 56 | | | | - | | | | - | | | | 56 | | | Total Group costs | | | 1,516,138 | | | | 2,598,764 | | | | 654,813 | | | | 4,769,715 | |
| | | June 30, 2014 | | | | | Urban properties and investments | | | Agricultural | | | Agroindustrial | | | Total | | | Cost of leases and services | | | - | | | | 17,374 | | | | - | | | | 17,374 | | | Other operative costs | | | - | | | | 8,228 | | | | - | | | | 8,228 | | | Cost of property operations | | | - | | | | 25,602 | | | | - | | | | 25,602 | | | Crops | | | - | | | | 1,509,500 | | | | - | | | | 1,509,500 | | | Cattle | | | - | | | | 150,810 | | | | - | | | | 150,810 | | | Dairy | | | - | | | | 104,334 | | | | - | | | | 104,334 | | | Sugarcane | | | - | | | | 206,751 | | | | - | | | | 206,751 | | | Beef | | | - | | | | - | | | | 446,094 | | | | 446,094 | | | Supplies | | | - | | | | 55,362 | | | | - | | | | 55,362 | | | Leases and agricultural services | | | - | | | | - | | | | 7,213 | | | | 7,213 | | | Commissions | | | - | | | | 7,663 | | | | - | | | | 7,663 | | | Brokerage fees | | | - | | | | 29,044 | | | | | | | | 29,044 | | | Others | | | - | | | | 8,101 | | | | - | | | | 8,101 | | | Cost of agricultural sales and services | | | - | | | | 2,071,565 | | | | 453,307 | | | | 2,524,872 | | | Cost of sale of trading properties | | | 18,971 | | | | - | | | | - | | | | 18,971 | | | Cost from hotel operations | | | 215,980 | | | | - | | | | - | | | | 215,980 | | | Cost of leases and services | | | 1,128,794 | | | | - | | | | - | | | | 1,128,794 | | | Other costs | | | 373 | | | | - | | | | - | | | | 373 | | | Total Group costs | | | 1,364,118 | | | | 2,097,167 | | | | 453,307 | | | | 3,914,592 | |
Cresud Sociedad Anónima,
Comercial, Inmobiliaria, Financiera y Agropecuaria
Notes to Consolidated Financial Statements (Continued)
(All amounts in thousands of Argentine Pesos, except shares and per share data and as otherwise indicated)
| | | June 30, 2013 | | | | | Urban properties and investments | | | Agricultural | | | Agroindustrial | | | Total | | | Cost of leases and services | | | - | | | | 12,052 | | | | - | | | | 12,052 | | | Other operative costs | | | - | | | | 5,675 | | | | - | | | | 5,675 | | | Cost of property operations | | | - | | | | 17,727 | | | | - | | | | 17,727 | | | Crops | | | - | | | | 1,216,190 | | | | - | | | | 1,216,190 | | | Cattle | | | - | | | | 142,621 | | | | - | | | | 142,621 | | | Dairy | | | - | | | | 74,826 | | | | - | | | | 74,826 | | | Sugarcane | | | - | | | | 302,206 | | | | - | | | | 302,206 | | | Beef | | | - | | | | - | | | | 194,270 | | | | 194,270 | | | Supplies | | | - | | | | 42,162 | | | | - | | | | 42,162 | | | Leases and agricultural services | | | - | | | | - | | | | 4,132 | | | | 4,132 | | | Commissions | | | - | | | | 3,224 | | | | - | | | | 3,224 | | | Brokerage fees | | | - | | | | 20,601 | | | | - | | | | 20,601 | | | Others | | | - | | | | 5,299 | | | | - | | | | 5,299 | | | Cost of agricultural sales and services | | | - | | | | 1,807,129 | | | | 198,402 | | | | 2,005,531 | | | Cost of sale of trading properties | | | 12,347 | | | | - | | | | - | | | | 12,347 | | | Cost from hotel operations | | | 168,282 | | | | - | | | | - | | | | 168,282 | | | Cost of leases and services | | | 915,701 | | | | - | | | | - | | | | 915,701 | | | Other costs | | | 907 | | | | - | | | | - | | | | 907 | | | Total Group costs | | | 1,097,237 | | | | 1,824,856 | | | | 198,402 | | | | 3,120,495 | |
Cresud Sociedad Anónima,
Comercial, Inmobiliaria, Financiera y Agropecuaria
Notes to Consolidated Financial Statements (Continued)
(All amounts in thousands of Argentine Pesos, except shares and per share data and as otherwise indicated)
The Group discloses expenses in the statement of income statements by function of as part of the line items “Costs”, “General and administrative expenses” and “Selling expenses”. The following tables provide the additional required disclosure of expenses by nature and their relationship to the function within the Group.
For the year ended June 30, 2015:| | June 30, 2016 | | June 30, 2015 | | June 30, 2014 | | Leases, services charges and vacant property costs | 142 | | 45 | | 54 | | Depreciation and amortization | 2,769 | | 259 | | 297 | | Doubtful accounts | 71 | | 30 | | 10 | | Advertising, publicity and other selling expenses | 964 | | 238 | | 184 | | Taxes, rates and contributions | 723 | | 304 | | 243 | | Maintenance and repairs | 1,135 | | 436 | | 336 | | Fees and payments for services | 2,092 | | 286 | | 252 | | Director´s fees | 207 | | 134 | | 124 | | Payroll and social security liabilities | 5,057 | | 1,041 | | 890 | | Cost of sale of goods and services | 14,861 | | 63 | | 61 | | Changes in biological assets and agricultural produce | 1,810 | | 1,609 | | 1,241 | | Supplies and labor | 1,135 | | 1,113 | | 886 | | Freights | 159 | | 138 | | 90 | | Commissions and expenses | 21 | | 28 | | 19 | | Conditioning and clearance | 30 | | 20 | | 15 | | Travel expenses and stationery | 36 | | 55 | | 25 | | Management fees | - | | 11 | | - | | Export expenses | 25 | | - | | - | | Others | 3,376 | | 52 | | 73 | | Total | 34,613 | | 5,862 | | 4,800 |
| | | Group costs | | | | | | | | | | | | | | Costs of property operations | | | Cost of agricultural sales and services | | | Cost of agriculture production | | | Cost of sale of trading properties | | | Cost from Consumer Financing | | | Cost from hotel operations | | | Other operative costs | | | General and administrative expenses | | | Selling expenses | | | Total | | | Leases, services charges and vacant property costs | | | 17,364 | | | | 14,380 | | | | - | | | | 1,167 | | | | - | | | | 284 | | | | 86 | | | | 9,693 | | | | 2,216 | | | | 45,190 | | | Depreciation and amortization | | | 162,175 | | | | 56,055 | | | | 11,120 | | | | - | | | | - | | | | 11,578 | | | | 3,007 | | | | 12,658 | | | | 1,229 | | | | 257,822 | | | Doubtful accounts | | | - | | | | - | | | | - | | | | - | | | | - | | | | - | | | | - | | | | - | | | | 29,168 | | | | 29,168 | | | Advertising, publicity and other selling expenses | | | 173,274 | | | | - | | | | - | | | | - | | | | - | | | | 6,556 | | | | - | | | | - | | | | 58,290 | | | | 238,120 | | | Taxes, rates and contributions | | | 108,332 | | | | 2,865 | | | | 11,306 | | | | 3,272 | | | | - | | | | 335 | | | | 59 | | | | 15,640 | | | | 161,849 | | | | 303,658 | | | Maintenance and repairs | | | 325,651 | | | | 12,816 | | | | 21,007 | | | | 6,560 | | | | 9 | | | | 33,984 | | | | 1,285 | | | | 31,556 | | | | 2,751 | | | | 435,619 | | | Fees and payments for services | | | 8,573 | | | | 150,738 | | | | 5,686 | | | | 512 | | | | 47 | | | | 1,334 | | | | 795 | | | | 109,930 | | | | 8,073 | | | | 285,688 | | | Director´s fees | | | - | | | | - | | | | - | | | | - | | | | - | | | | - | | | | - | | | | 133,967 | | | | - | | | | 133,967 | | | Payroll and social security liabilities | | | 404,076 | | | | 119,100 | | | | 65,384 | | | | 154 | | | | - | | | | 162,423 | | | | 2,887 | | | | 239,270 | | | | 46,976 | | | | 1,040,270 | | | Cost of sale of properties | | | - | | | | - | | | | - | | | | 2,246 | | | | - | | | | - | | | | - | | | | - | | | | - | | | | 2,246 | | | Food, beverage and other lodging expenses | | | - | | | | - | | | | - | | | | - | | | | - | | | | 60,852 | | | | - | | | | 8,264 | | | | 4,361 | | | | 73,477 | | | Changes in biological assets and agricultural produce | | | - | | | | 1,608,966 | | | | - | | | | - | | | | - | | | | - | | | | - | | | | - | | | | - | | | | 1,608,966 | | | Supplies and labor | | | - | | | | 13,649 | | | | 1,094,456 | | | | - | | | | - | | | | - | | | | 9 | | | | 12 | | | | 4,392 | | | | 1,112,518 | | | Freights | | | 373 | | | | 1,897 | | | | 11,811 | | | | - | | | | - | | | | - | | | | 19 | | | | 44 | | | | 123,872 | | | | 138,016 | | | Bank commissions and expenses | | | - | | | | 8,959 | | | | 358 | | | | - | | | | - | | | | - | | | | - | | | | 14,628 | | | | 3,735 | | | | 27,680 | | | Conditioning and clearance | | | - | | | | - | | | | - | | | | - | | | | - | | | | - | | | | - | | | | - | | | | 20,141 | | | | 20,141 | | | Travel and library expenses | | | 11,887 | | | | 14,936 | | | | 10,883 | | | | 23 | | | | - | | | | 530 | | | | 856 | | | | 14,736 | | | | 2,626 | | | | 56,477 | | | Management fee | | | - | | | | - | | | | - | | | | - | | | | - | | | | - | | | | - | | | | 11,401 | | | | - | | | | 11,401 | | | Others | | | 12,559 | | | | 8,202 | | | | - | | | | - | | | | - | | | | 8 | | | | - | | | | 16,021 | | | | 4,479 | | | | 41,269 | | | Total expenses by nature | | | 1,224,264 | | | | 2,012,563 | | | | 1,232,011 | | | | 13,934 | | | | 56 | | | | 277,884 | | | | 9,003 | | | | 617,820 | | | | 474,158 | | | | 5,861,693 | |
Cresud Sociedad Anónima, Comercial, Inmobiliaria, Financiera y Agropecuaria
Notes to the Consolidated Financial Statements(Continued) (All amounts in thousandsmillions of Argentine Pesos, except shares and per share data and as otherwise indicated)
33. | Expenses by nature 30. Expenses by nature (Continued)(Continued)
|
For the year ended June 30, 2014:2016:
| | | Group costs | | | | | | | | | | | Group costs | | | | | | Costs of property operations | | | Cost of agricultural sales and services | | | Cost of agriculture production | | | Cost of sale of trading properties | | | Cost from Consumer Financing | | | Cost from hotel operations | | | Other operative costs | | | General and administrative expenses | | | Selling expenses | | | Total | | Cost of agricultural sales and services | Cost of agriculture production | Other agricultural operative costs | Cost of leases and services | Cost of trading properties and developments | Cost of hotel operations | Cost of sale of communication equipment | Cost of communication services | Cost of tourism services | Cost of supermarkets | Total costs | General and administrative expenses | Selling expenses | Total | | Leases, services charges and vacant property costs | | | 16,700 | | | | 15,282 | | | | 1,080 | | | | 1,404 | | | | - | | | | 280 | | | | 172 | | | | 14,601 | | | | 4,939 | | | | 54,458 | | 33 | 1 | - | 47 | 1 | 2 | - | - | 45 | - | 129 | 9 | 4 | 142 | | Depreciation and amortization | | | 217,462 | | | | 45,925 | | | | 7,559 | | | | 707 | | | | - | | | | 10,819 | | | | 2,666 | | | | 9,973 | | | | 1,808 | | | | 296,919 | | 49 | 13 | 3 | 578 | - | 11 | - | 683 | 68 | 45 | 1,450 | 291 | 1,028 | 2,769 | | Doubtful accounts | | | - | | | | - | | | | - | | | | - | | | | - | | | | - | | | | - | | | | - | | | | 10,461 | | | | 10,461 | | - | - | - | - | - | - | - | - | 61 | 10 | 71 | | Advertising, publicity and other selling expenses | | | 145,331 | | | | - | | | | - | | | | 1 | | | | - | | | | 4,701 | | | | - | | | | - | | | | 34,478 | | | | 184,511 | | - | - | - | 282 | - | - | - | - | - | - | 282 | - | 682 | 964 | | Taxes, rates and contributions | | | 86,996 | | | | 2,110 | | | | 9,033 | | | | 2,299 | | | | - | | | | - | | | | 179 | | | | 14,289 | | | | 128,536 | | | | 243,442 | | 3 | 13 | - | 219 | 4 | 1 | - | - | - | - | 240 | 20 | 463 | 723 | | Maintenance and repairs | | | 255,053 | | | | 10,641 | | | | 14,841 | | | | 3,551 | | | | 3 | | | | 26,321 | | | | 490 | | | | 23,861 | | | | 1,071 | | | | 335,832 | | 17 | 24 | 1 | 611 | 8 | 57 | - | - | 61 | - | 779 | 79 | 277 | 1,135 | | Fees and payments for services | | | 28,762 | | | | 120,369 | | | | 4,551 | | | | 66 | | | | 368 | | | | 2,347 | | | | 103 | | | | 83,373 | | | | 11,103 | | | | 251,042 | | 173 | 5 | 1 | 17 | - | 15 | - | 675 | - | - | 886 | 456 | 750 | 2,092 | | Director´s fees | | | - | | | | - | | | | - | | | | - | | | | - | | | | - | | | | - | | | | 124,207 | | | | - | | | | 124,207 | | - | - | - | - | - | - | - | - | 207 | - | 207 | | Payroll and social security expenses | | | 362,055 | | | | 94,032 | | | | 56,326 | | | | 168 | | | | - | | | | 121,332 | | | | 4,085 | | | | 213,139 | | | | 38,365 | | | | 889,502 | | | | Cost of sale of properties | | | - | | | | - | | | | - | | | | 10,740 | | | | - | | | | - | | | | - | | | | - | | | | - | | | | 10,740 | | | | Food, beverage and other lodging expenses | | | - | | | | - | | | | - | | | | - | | | | - | | | | 49,792 | | | | - | | | | 6,726 | | | | 3,753 | | | | 60,271 | | | | Payroll and social security liabilities | | 149 | 90 | 4 | 560 | 1 | 220 | - | 405 | 90 | 518 | 2,037 | 831 | 2,189 | 5,057 | | Cost of sale of goods and services | | - | - | - | 40 | 152 | 48 | 1,304 | 13 | - | 13,304 | 14,861 | - | 14,861 | | Changes in biological assets and agricultural produce | | | - | | | | 1,239,869 | | | | - | | | | - | | | | - | | | | - | | | | - | | | | - | | | | 755 | | | | 1,240,624 | | 1,808 | - | - | - | - | - | - | - | 1,808 | - | 2 | 1,810 | | Supplies and labor | | | - | | | | 24,485 | | | | 859,688 | | | | - | | | | - | | | | - | | | | - | | | | - | | | | 1,761 | | | | 885,934 | | 78 | 1,056 | - | - | - | - | - | - | 1,134 | - | 1 | 1,135 | | Freights | | | - | | | | 1,267 | | | | 7,240 | | | | - | | | | - | | | | - | | | | 6 | | | | 12 | | | | 81,003 | | | | 89,528 | | 1 | 13 | - | - | - | - | - | - | 14 | - | 145 | 159 | | Bank commissions and expenses | | | - | | | | 5,788 | | | | 199 | | | | - | | | | - | | | | - | | | | - | | | | 6,413 | | | | 6,167 | | | | 18,567 | | 10 | - | - | - | - | - | - | - | 10 | 7 | 4 | 21 | | Conditioning and clearance | | | - | | | | - | | | | 12 | | | | - | | | | - | | | | - | | | | - | | | | - | | | | 15,002 | | | | 15,014 | | - | - | - | - | - | - | - | - | - | 30 | 30 | | Travel and library expenses | | | - | | | | 12,525 | | | | 7,007 | | | | - | | | | - | | | | - | | | | 527 | | | | 3,719 | | | | 974 | | | | 24,752 | | 14 | 14 | 1 | - | - | - | - | - | - | 29 | 6 | 1 | 36 | | Export expenses | | - | - | - | - | - | - | - | - | - | 25 | 25 | | Others | | | 16,435 | | | | 2,332 | | | | 85 | | | | 35 | | | | 2 | | | | 388 | | | | - | | | | 33,626 | | | | 12,550 | | | | 65,453 | | 13 | - | - | 79 | - | 26 | - | 1,528 | 785 | - | 2,431 | 277 | 668 | 3,376 | | Total expenses by nature | | | 1,128,794 | | | | 1,574,625 | | | | 967,621 | | | | 18,971 | | | | 373 | | | | 215,980 | | | | 8,228 | | | | 533,939 | | | | 352,726 | | | | 4,801,257 | | 2,348 | 1,229 | 10 | 2,433 | 166 | 380 | 1,304 | 3,304 | 1,049 | 13,867 | 26,090 | 2,244 | 6,279 | 34,613 |
Cresud Sociedad Anónima, Comercial, Inmobiliaria, Financiera y Agropecuaria
Notes to the Consolidated Financial Statements(Continued) (All amounts in thousandsmillions of Argentine Pesos, except shares and per share data and as otherwise indicated)
30. Expenses by nature (Continued)
33. | Expenses by nature (Continued)
|
For the year ended June 30, 2013:2015:
| | | Group costs | | | | | | | | | | | Group costs | | | | | | | | | | Costs of property operations | | | Cost of agricultural sales and services | | | Cost of agriculture production | | | Cost of sale of trading properties | | | Cost from Consumer Financing | | | Cost from hotel operations | | | Other operative costs | | | General and administrative expenses | | | Selling expenses | | | Total | | Cost of agricultural sales and services | | Cost of agriculture production | | Other agricultural operative costs | | Cost of property operations | | Cost of trading properties and developments | | Cost of hotel operations | | Total costs | | General and administrative expenses | | Selling expenses | | Total | | Leases, services charges and vacant property costs | | | 11,505 | | | | 1,300 | | | | 964 | | | | 1,774 | | | | - | | | | 136 | | | | 119 | | | | 5,442 | | | | 926 | | | | 22,166 | | 14 | | - | | - | | 17 | | 1 | | - | | 32 | | 10 | | 3 | | 45 | | Depreciation and amortization | | | 209,164 | | | | 37,513 | | | | 5,600 | | | | 529 | | | | - | | | | 13,591 | | | | 2,373 | | | | 10,689 | | | | 279 | | | | 279,738 | | 56 | | 11 | | 3 | | 163 | | - | | 12 | | 245 | | 13 | | 1 | | 259 | | Doubtful accounts | | | - | | | | - | | | | - | | | | - | | | | - | | | | - | | | | - | | | | - | | | | 16,114 | | | | 16,114 | | 1 | | - | | - | | - | | - | | - | | 1 | | - | | 29 | | 30 | | Advertising, publicity and other selling expenses | | | 115,013 | | | | - | | | | 1 | | | | - | | | | - | | | | - | | | | 13 | | | | 12 | | | | 16,542 | | | | 131,581 | | - | | - | | - | | 173 | | - | | 7 | | 180 | | - | | 58 | | 238 | | Taxes, rates and contributions | | | 68,982 | | | | 1,670 | | | | 6,494 | | | | 1,500 | | | | - | | | | 263 | | | | 21 | | | | 12,936 | | | | 83,204 | | | | 175,070 | | 3 | | 11 | | - | | 109 | | 3 | | - | | 126 | | 16 | | 162 | | 304 | | Maintenance and repairs | | | 226,164 | | | | 5,925 | | | | 13,072 | | | | 2,741 | | | | 38 | | | | 21,603 | | | | 55 | | | | 19,236 | | | | 978 | | | | 289,812 | | 13 | | 21 | | - | | 326 | | 7 | | 34 | | 401 | | 32 | | 3 | | 436 | | Fees and payments for services | | | 29,390 | | | | 123,222 | | | | 2,639 | | | | 237 | | | | 858 | | | | 1,301 | | | | 19 | | | | 51,206 | | | | 4,401 | | | | 213,273 | | 151 | | 6 | | - | | 9 | | 1 | | 1 | | 168 | | 110 | | 8 | | 286 | | Director´s fees | | | - | | | | - | | | | - | | | | - | | | | - | | | | - | | | | - | | | | 82,060 | | | | - | | | | 82,060 | | - | | - | | - | | - | | - | | - | | - | | 134 | | - | | 134 | | Payroll and social security expenses | | | 244,311 | | | | 67,784 | | | | 35,467 | | | | 155 | | | | 3 | | | | 96,096 | | | | 2,610 | | | | 141,550 | | | | 25,561 | | | | 613,537 | | | | Cost of sale of properties | | | - | | | | - | | | | - | | | | 5,373 | | | | - | | | | - | | | | - | | | | - | | | | - | | | | 5,373 | | | | Food, beverage and other lodging expenses | | | - | | | | - | | | | - | | | | - | | | | - | | | | 29,643 | | | | - | | | | 2,900 | | | | 680 | | | | 33,223 | | | | Payroll and social security liabilities | | 119 | | 65 | | 5 | | 404 | | - | | 162 | | 755 | | 239 | | 47 | | 1,041 | | Cost of sale of goods and services | | - | | - | | - | | - | | 2 | | 61 | | 63 | | - | | - | | 63 | | Changes in biological assets and agricultural produce | | | - | | | | 877,118 | | | | - | | | | - | | | | - | | | | - | | | | - | | | | - | | | | - | | | | 877,118 | | 1,609 | | - | | - | | - | | - | | - | | 1,609 | | - | | - | | 1,609 | | Supplies and labor | | | - | | | | 3,575 | | | | 767,384 | | | | - | | | | - | | | | - | | | | - | | | | - | | | | - | | | | 770,959 | | 14 | | 1,094 | | 1 | | - | | - | | - | | 1,109 | | - | | 4 | | 1,113 | | Freights | | | 44 | | | | 462 | | | | 10,360 | | | | 6 | | | | - | | | | 151 | | | | 23 | | | | 327 | | | | 84,987 | | | | 96,360 | | 2 | | 12 | | - | | - | | - | | - | | 14 | | - | | 124 | | 138 | | Bank commissions and expenses | | | 1 | | | | 2,621 | | | | 229 | | | | - | | | | - | | | | 4,869 | | | | - | | | | 5,278 | | | | 16,446 | | | | 29,444 | | | | Commissions and expenses | | 9 | | - | | - | | - | | - | | - | | 9 | | 15 | | 4 | | 28 | | Conditioning and clearance | | | - | | | | - | | | | 18 | | | | - | | | | - | | | | - | | | | - | | | | - | | | | 17,766 | | | | 17,784 | | - | | - | | - | | - | | - | | - | | - | | - | | 20 | | 20 | | Travel and library expenses | | | 374 | | | | 1,092 | | | | 4,212 | | | | 29 | | | | - | | | | 575 | | | | 445 | | | | 7,785 | | | | 1,558 | | | | 16,070 | | 15 | | 11 | | - | | 12 | | - | | - | | 38 | | 14 | | 3 | | 55 | | Management fees | | - | | - | | - | | - | | - | | - | | - | | 11 | | - | | 11 | | Others | | | 10,753 | | | | 48,763 | | | | 95 | | | | 3 | | | | 8 | | | | 54 | | | | - | | | | 6,962 | | | | 10,021 | | | | 76,659 | | 7 | | - | | - | | 12 | | - | | 1 | | 20 | | 24 | | 8 | | 52 | | Total expenses by nature | | | 915,701 | | | | 1,171,045 | | | | 846,535 | | | | 12,347 | | | | 907 | | | | 168,282 | | | | 5,678 | | | | 346,383 | | | | 279,463 | | | | 3,746,341 | | 2,013 | | 1,231 | | 9 | | 1,225 | | 14 | | 278 | | 4,770 | | 618 | | 474 | | 5,862 |
Cresud Sociedad Anónima, Comercial, Inmobiliaria, Financiera y Agropecuaria
Notes to the Consolidated Financial Statements(Continued) (All amounts in thousandsmillions of Argentine Pesos, except shares and per share data and as otherwise indicated)
| | | June 30, 2015 | | | June 30, 2014 | | | June 30, 2013 | | | Salaries, bonuses and social security costs | | | 998,906 | | | | 784,655 | | | | 596,678 | | | Share-based payments | | | 30,823 | | | | 94,682 | | | | 10,497 | | | Pension costs – defined contribution plan | | | 10,541 | | | | 10,165 | | | | 6,362 | | | | | | 1,040,270 | | | | 889,502 | | | | 613,537 | |
35. | Other operating results, net |
| | | June 30, 2015 | | | June 30, 2014 | | | June 30, 2013 | | | Gain from purchase of subsidiaries | | | - | | | | - | | | | 136,724 | | | Gain from disposal of equity interest in subsidiaries, associates and joint ventures | | | 22,075 | | | | - | | | | 15,433 | | | Gain (loss) from commodity derivative financial instruments | | | 8,128 | | | | (14,859 | ) | | | 5,104 | | | (Loss) gain from disposal of other property items | | | (893 | ) | | | (366 | ) | | | 1,379 | | | Expenses related to transfers of real properties (1) | | | (119,429 | ) | | | - | | | | - | | | Reversal of currency translation adjustment (2) | | | 188,323 | | | | - | | | | - | | | Recovery of allowances | | | - | | | | 239 | | | | 2,698 | | | Tax on personal assets | | | (14,929 | ) | | | (13,705 | ) | | | (17,649 | ) | | Administration fee | | | 418 | | | | - | | | | 4,681 | | | Management fee | | | 3,666 | | | | 46 | | | | 1,108 | | | Contingencies (3) | | | (28,806 | ) | | | (18,473 | ) | | | (28,645 | ) | | Donations | | | (40,558 | ) | | | (33,283 | ) | | | (31,053 | ) | | Project Analysis and Assessment | | | | | | | (3,124 | ) | | | (1,182 | ) | | Unrecoverable VAT | | | (576 | ) | | | (446 | ) | | | (146 | ) | | Others | | | (5,210 | ) | | | 8,963 | | | | 9,616 | | | Total other operating results, net | | | 12,209 | | | | (75,008 | ) | | | 98,068 | |
(1)30. Expenses by nature (Continued)
For the year ended June 30, 2014: | | Group costs | | | | | | | | | Cost of agricultural sales and services | | Cost of agriculture production | | Other agricultural operative costs | | Cost of property operations | | Cost of trading properties and developments | | Cost of hotel operations | | Total costs | | General and administrative expenses | | Selling expenses | | Total | | Leases, services charges and vacant property costs | 15 | | 1 | | - | | 17 | | 1 | | - | | 34 | | 15 | | 5 | | 54 | | Depreciation and amortization | 46 | | 8 | | 3 | | 217 | | 1 | | 11 | | 286 | | 9 | | 2 | | 297 | | Doubtful accounts | - | | - | | - | | - | | - | | - | | - | | - | | 10 | | 10 | | Advertising, publicity and other selling expenses | - | | - | | - | | 145 | | - | | 5 | | 150 | | - | | 34 | | 184 | | Taxes, rates and contributions | 2 | | 9 | | - | | 87 | | 2 | | - | | 100 | | 14 | | 129 | | 243 | | Maintenance and repairs | 11 | | 15 | | - | | 255 | | 4 | | 26 | | 311 | | 24 | | 1 | | 336 | | Fees and payments for services | 120 | | 5 | | - | | 29 | | - | | 2 | | 156 | | 86 | | 10 | | 252 | | Director´s fees | - | | - | | - | | - | | - | | - | | - | | 124 | | - | | 124 | | Payroll and social security liabilities | 93 | | 56 | | 6 | | 362 | | - | | 121 | | 638 | | 213 | | 39 | | 890 | | Cost of sale of goods and services | - | | - | | - | | - | | 11 | | 50 | | 61 | | - | | - | | 61 | | Changes in biological assets and agricultural produce | 1,240 | | - | | - | | - | | - | | - | | 1,240 | | - | | 1 | | 1,241 | | Supplies and labor | 24 | | 860 | | - | | - | | - | | - | | 884 | | - | | 2 | | 886 | | Freights | 1 | | 7 | | 1 | | - | | - | | - | | 9 | | - | | 81 | | 90 | | Commissions and expenses | 6 | | - | | 1 | | - | | - | | - | | 7 | | 6 | | 6 | | 19 | | Conditioning and clearance | - | | - | | - | | - | | - | | - | | - | | - | | 15 | | 15 | | Travel and library expenses | 13 | | 7 | | - | | - | | - | | - | | 20 | | 4 | | 1 | | 25 | | Others | 2 | | - | | 1 | | 14 | | - | | - | | 17 | | 38 | | 18 | | 73 | | Total expenses by nature | 1,573 | | 968 | | 12 | | 1,126 | | 19 | | 215 | | 3,913 | | 533 | | 354 | | 4,800 |
Cresud Sociedad Anónima, Comercial, Inmobiliaria, Financiera y Agropecuaria Notes to the Consolidated Financial Statements On July 31, 2014 Cresud transferred(Continued) (All amounts in millions of Argentine Pesos, except otherwise indicated) | | June 30, 2016 | | June 30, 2015 | | June 30, 2014 | | Salaries, bonuses and social security costs | 4,880 | | 999 | | 785 | | Share-based payments | 48 | | 31 | | 95 | | Defined contribution plan costs | 17 | | 11 | | 10 | | Other costs and employee benefits | 112 | | - | | - | | Total employee costs | 5,057 | | 1,041 | | 890 |
32. Other operating results, net | | June 30, 2016 | | June 30, 2015 | | June 30, 2014 | | (Loss) / Gain from commodity derivative financial instruments | (77) | | 8 | | (15) | | Tax on personal assets | (6) | | (15) | | (14) | | Gain from disposal of interest in associates | 4 | | 22 | | - | | Reversal of currency translation adjustment (i) | 97 | | 188 | | - | | Consulting fees | 1 | | 4 | | - | | Contingencies (ii) | (5) | | (29) | | (18) | | Donations | (58) | | (40) | | (34) | | Project analysis and assessment | - | | - | | (3) | | Unrecoverable VAT | - | | (1) | | | | Expenses related to transfers of investment properties to subsidiaries (iii) | - | | (119) | | - | | Remediation income at fair value from the interest held in an associate before takeover | 26 | | - | | - | | Others | (26) | | (6) | | 9 | | Total other operating results, net | (44) | | 12 | | (75) |
(i) As of June 30, 2016, Ps. 144 correspond to IRSA an areathe reversal of 1,058 hectares locatedcurrency translation adjustment before business combination with IDBD and Ps. 4 to the reversal of the translation reserve generated in Luján,Rigby, following the partial repayment of principal of the company. As of June 30, 2015 pertains to the reversal of the translation reserve generated in Buenos Aires Province. Rigby following the partial repayment of principal of the company. (ii) Including costs and legal expenses. (iii) On December 22, 2014, IRSA conveyed title on the properties located in Bouchard 710, Suipacha 652, Torre BankBoston EdificioTower, República EdificiosBuilding, Intercontinental Plaza Building and the plot of land next to the latter, onto its subsidiary IRSA CP, which as from such date continues to operate such properties. These transfers have had no effects whatsoever in the consolidated financial statements of the Group other than the expenses and taxes associated to the transfer. (2)Pertains to the reversal of the translation reserve generated in Rigby following the partial repayment of principal of the company (see Note 3).
(3)Including costs and legal expenses.
Cresud Sociedad Anónima, Comercial, Inmobiliaria, Financiera y Agropecuaria
Notes to the Consolidated Financial Statements(Continued) (All amounts in thousandsmillions of Argentine Pesos, except shares and per share data and as otherwise indicated)
36. | Financial results, net |
33. | | | June 30, 2015 | | | June 30, 2014 | | | June 30, 2013 | | | Financial income: | | | | | | | | | | | - Interest income | | | 100,094 | | | | 119,291 | | | | 72,813 | | | - Foreign exchange gains | | | 124,393 | | | | 153,856 | | | | 104,686 | | | - Dividends income | | | 16,622 | | | | 15,041 | | | | 23,249 | | | - Other financial income | | | - | | | | - | | | | 109 | | | Financial income | | | 241,109 | | | | 288,188 | | | | 200,857 | | | | | | | | | | | | | | | | | Financial costs: | | | | | | | | | | | | | | - Interest expense | | | (886,710 | ) | | | (737,913 | ) | | | (483,772 | ) | | - Foreign exchange losses | | | (686,435 | ) | | | (2,053,377 | ) | | | (586,382 | ) | | - Other financial costs | | | (124,140 | ) | | | (83,086 | ) | | | (64,899 | ) | | Financial costs | | | (1,697,285 | ) | | | (2,874,376 | ) | | | (1,135,053 | ) | | Less financial costs capitalized | | | 12,957 | | | | 22,376 | | | | 10,307 | | | Total financial costs | | | (1,684,328 | ) | | | (2,852,000 | ) | | | (1,124,746 | ) | | Other financial results: | | | | | | | | | | | | | | - Fair value gains of financial assets at fair value through profit or loss | | | 187,529 | | | | 379,091 | | | | 23,739 | | | - Gain / (Loss) on the revaluation of receivables arising from the sale of farmland | | | 52,984 | | | | 20,751 | | | | (3,165 | ) | | - (Loss) / Gain from repurchase of Non-convertible Notes | | | (1,945 | ) | | | (44,688 | ) | | | 2,057 | | | - Fair value gain on embedded derivatives | | | - | | | | - | | | | 64 | | | - Loss derivative financial instruments (except commodities) | | | (83,510 | ) | | | (365,740 | ) | | | (7,567 | ) | | Total other financial results | | | 155,058 | | | | (10,586 | ) | | | 15,128 | | | Total financial results, net | | | (1,288,161 | ) | | | (2,574,398 | ) | | | (908,761 | ) |
| | June 30, 2016 | | June 30, 2015 | | June 30, 2014 | | Financial income | | | | | | | Interest income | 805 | | 100 | | 119 | | Foreign exchange gains | 1,097 | | 124 | | 154 | | Dividends income | 72 | | 17 | | 15 | | Financial income | 1,974 | | 241 | | 288 | | Financial costs | | | | | | | Interest expense | (2,739) | | (874) | | (715) | | Foreign exchange losses | (3,999) | | (686) | | (2,054) | | Other financial costs | (981) | | (125) | | (83) | | Total financial costs | (7,719) | | (1,685) | | (2,852) | | Other financial results: | | | | | | | Fair value (loss) / gain on financial assets and liabilities at fair value through profit or loss | (1,241) | | 188 | | 379 | | Loss from repurchase of Non-convertible Notes | (39) | | (2) | | (45) | | Gain / (Loss) on derivative financial instruments (except commodities) | 1,089 | | (83) | | (365) | | Gain on the revaluation of receivables arising from the sale of farmland | 33 | | 53 | | 21 | | Impairment of investment properties and property, plant and equipment | (352) | | - | | - | | Total other financial results | (510) | | 156 | | (10) | | Total financial results, net | (6,255) | | (1,288) | | (2,574) |
Basic earnings per share amounts are calculated in accordance with IAS 33 by dividing the profit attributable to equity holders of the Group by the weighted average number of ordinary shares outstanding during the year, excluding ordinary shares purchased by the Group and held as treasury shares.
| | | June 30, 2015 | | | June 30, 2014 | | | June 30, 2013 | | | Loss attributable to equity holders of the parent | | | (249,619) | | | | (1,067,880 | ) | | | (26,907 | ) | | Weighted average number of ordinary shares in issue (thousands) | | | 492,020 | | | | 496,132 | | | | 496,562 | | | Basic loss per share | | | 0.51 | | | | (2.15 | ) | | | (0.05 | ) |
| | June 30, 2016 | June 30, 2015 | June 30, 2014 | | (Loss) / Gain attributable to equity holders of the parent | (1,892) | (176) | (1,068) | | Weighted average number of ordinary shares in issue (in million) | 495 | 492 | 496 | | Basic earnings per share | (3.82) | 0.36 | (2.15) |
Cresud Sociedad Anónima, Comercial, Inmobiliaria, Financiera y Agropecuaria
Notes to the Consolidated Financial Statements(Continued) (All amounts in thousandsmillions of Argentine Pesos, except shares and per share data and as otherwise indicated)
37. | Earnings per share 34. Earnings per share (Continued)(Continued)
|
Diluted
Diluted earnings per share amounts are calculated by adjusting the weighted average number of ordinary shares outstanding to assume conversion of all dilutive potential shares. Ordinary shares purchased by the Group and held as treasury shares are excluded from the calculation of diluted earnings per share. As of June 30, 2016, 2015 and 2014 the Group does not haveholds treasury shares with potentially dilutive securities.effect. The diluted earnings per share is as follows: | June 30, 2015 | | Gain attributable to equity holders of the parent | 176 | | Weighted average number of ordinary shares in issue (in million) | 554 | | Diluted earnings per share | 0.32 |
Since the Company posted a loss for the years ended June 30, 2015,2016 and 2014, and 2013, there is no diluted effect whatsoever.
38. | Related party transactions |
35.
Related party transactions
During the normal course of business, the Group conducts transactions with different entities or parties related to it. An individual As mentioned in Note 3, on October 11, 2015, the Group took over IDBD. Before takeover, the Group had entered into certain transactions with IDBD as associate, mainly related to the subscription of warrants and/or legal entity is considered acapital contributions, but had not conducted commercial transactions. See Note 3 for further information related party where:to investment in IDBD.
· | An entity, individual or close relative of such individual or legal entity exercises control, or joint control, or significant influence over the reporting entity, or is a memberRemunerations of the Board of Directors or the Senior Management of the entity or its controlling company. |
· | An entity is a subsidiary, associate or joint venture of the entity or its controlling or controlled company. |
The following section provides a brief description of the main transactions conducted with related parties which are not described in other notes of these consolidated financial statements:
1. | Remunerations of the Board of Directors |
The Business Company Act No. 19,550 provides that the remuneration of the Board of Directors, where it is not set forth in the Company’s by-laws, shall be fixed by the Shareholders' Meetings. The maximum amount of remuneration that the members of the Board are allowed to receive, including salary and other performance-based remuneration of permanent technical-administrative functions, may not exceed 25% of the profits.
Cresud Sociedad Anónima,
Comercial, Inmobiliaria, Financiera y Agropecuaria
Notes to Consolidated Financial Statements (Continued)
(All amounts in thousands of Argentine Pesos, except shares and per share data and as otherwise indicated)
38. Related party transactions (Continued)
Such maximum amount will be limited to 5% where no dividends are distributed to the Shareholders, and will be increased proportionately to the distribution, until reaching such cap where the total of profits is distributed.
Cresud Sociedad Anónima, Comercial, Inmobiliaria, Financiera y Agropecuaria Notes to the Consolidated Financial Statements(Continued) (All amounts in millions of Argentine Pesos, except otherwise indicated) 35. Related party transactions (Continued) Some of our Directors are hired under the Employment Contract Act N°No. 20,744. This Act rules on certain conditions of the work relationship, including remuneration, salary protection, working hours, vacations, paid leaves, minimum age requirements, workmen protection and forms of suspension and contract termination.
The remuneration of directors for each fiscal year is based on the provisions established by the Business Company Act No. 19,550, taking into consideration whether such directors perform technical-administrative functions and depending upon the results recorded by the Company during the fiscal year. Once such amounts are determined, they should be approved by the Shareholders’ Meeting.
2. | Senior Management remuneration |
The members of the Senior or Top Management are appointed and removed by the Board of Directors, and perform functions in accordance with the instructions delivered by the Board itself.
The Society’s Senior Management is composed of as follows: | Name | Date of birth | Position | In theActual position since | | Alejandro G. Elsztain | 03/31/1966 | General Manager | 1994 | Matias Iván Gaivironsky | 02/23/1976 | Financial Manager | 2011 | David A. Perednik | 11/15/1957 | Administrative Manager | 1997 | | Carlos Blousson | 09/21/1963 | General Manager of operationsOperations in Argentina Bolivia and ParaguayBolivia | 2008 | | Matías I. Gaivironsky | 02/23/1976 | Administrative and Financial Manager | 2011 | | Alejandro Casaretto | 10/15/1952 | Regional Agricultural Manager | 2008 |
The remuneration earned by Senior Management for their functions consists of an amount that is fixed taking into account the manager's backgrounds, capacity and experience, plus an annual bonus based on their individual performance and the Group's results. Members of the senior management participate in defined contribution and share-based incentive plans that are described in Notes 2624 and 27,25, respectively. The Senior Management of the Operations Center in Israel is composed as follows:
Cresud Sociedad Anónima,
Comercial, Inmobiliaria, Financiera y Agropecuaria
Notes to Consolidated Financial Statements (Continued)
(All amounts in thousands of Argentine Pesos, except shares and per share data and as otherwise indicated)
38. Related party transactions (Continued)
3. Name | Corporate Service Agreement:Date of birth | Position | Current position held since | Sholem Lapidot | 10/22/1979 | Chief Executive Officer | 2016 | Gil Kotler | 04/10/1966 | Chief Financial Officer | 2016 | Aaron Kaufman | 03/03/1970 | VP & General Counsel | 2015 |
In due course,Corporate Service Agreement with IRSA and IRSA CP
Given that the operating areas of our Company, IRSA and IRSA CP share certain characteristics of affinity, the Board considered it was convenient to implement alternatives that should allowallows to reduce certain fixed costs, in view that the operating areas of IRSA and Cresud share certain characteristics of affinity, with the aim of reducing their incidence on the operating results, building on and enhancing the individual efficiencies of each of the companies in the different areas that form part of operating management.
Cresud Sociedad Anónima, Comercial, Inmobiliaria, Financiera y Agropecuaria Notes to the Consolidated Financial Statements(Continued) (All amounts in millions of Argentine Pesos, except otherwise indicated) 35. Related party transactions (Continued) To such end, on June 30, 2004, a Master Agreement for the Exchange of Corporate Services (“Frame Agreement") was entered into between ourthe Company, IRSA and IRSA CP.CP, which was amended on August 23, 2007, August 14, 2008, November 27, 2009, March 12, 2010, July 11, 2011, October 15, 2012, November 12, 2013, February 24, 2014, February 18, 2015 and November 12, 2015.
TheUnder the current Master Agreement corporate services are provided in the following areas: Human Resources, Finance, Institutional Relations, Administration and Control, Insurance, Security, Agreements, Technical Tasks, Infrastructure and Services, Architecture and Design, Development and Works, Real Estate, Hotels, Board of Directors, Board of directors of Real Estate Business, General Manager Office, Board Safety, Audit Committee, Real Estate Business Management, Human Resources of Real Estate Business, Fraud Prevention, Internal Audit, Planning, Shared Services Center, Procurement and Environment and Quality.
Pursuant to this agreement, had a term of 24 months, is renewable automatically for equal periods, unless it is terminated by any of the parties upon prior notice.
It is also worth noting that the parties havecompanies hired an external consulting firm to review and evaluate half-yearly the criteria used in the process of determining the amount of corporate services, as well as the basis for distribution and documentation. Notably,source documentation used in the parties retain absolute freedomprocess indicated above, by means of a half-yearly report.
It should be noted that the operations indicated above allows our Company, IRSA and confidentiality regarding theirIRSA CP to keep our strategic and business decisions.commercial decisions fully independent and confidential, with cost and profit apportionment being made on the basis of operating efficiency and equity, without pursuing individual economic benefits for any of the companies.
Offices and Shopping centers spaces leases The offices of our president are located at 108 Bolivar, in the Autonomous City of Buenos Aires. The property has been rented to Isaac Elsztain e Hijos S.A., a company controlled by some family members of Eduardo Sergio Elsztain, our president, and to Hamonet S.A., a company controlled by Fernando A. Elsztain, one of our directors, and some of its family members. In the futureaddition, Tarshop, BACS, BHN Sociedad de Inversión S.A., BHN Seguros Generales S.A. and BHN Visa S.A. rent offices owned by IRSA CP in orderdifferent buildings. Furthermore, we also let various spaces in our Shopping Centers (stores, stands, storage space or advertising space) to continuethird parties and related parties such us Tarshop S.A. and BHSA. Lease agreements entered into with the policyassociates included similar provisions and amounts to those included in place which primarily seeks to allocate corporate resources among the several areas as efficiently as possible and continue cutting certain fixed costs relatedagreements with third parties. Cresud Sociedad Anónima, Comercial, Inmobiliaria, Financiera y Agropecuaria Notes to the parties’ activities. The Master Agreement may be extended and/or amendedConsolidated Financial Statements(Continued) (All amounts in connection with other areas shared by the parties. The last amendment was made on February 18, 2015.millions of Argentine Pesos, except otherwise indicated)
4. | Donations granted to Fundación IRSA: |
35. Related party transactions (Continued)
Donations granted to Fundación IRSA and Fundación Museo de los Niños Fundación IRSA is a non-profit charity institution that seeks to support and generate initiatives concerning education, the promotion of corporate social responsibility and the entrepreneurial spirit of the youth. It carries out corporate volunteering programs and fosters donations by the Group’s employees. The main members of Fundación IRSA's Board of Directors are: Eduardo S. Elsztain (Chairman)(President); Saul Zang (Vice ChairmanPresident I), Alejandro Elsztain (Vice ChairmanPresident II) and Mariana C. de Elsztain (secretary). It funds its activities with the donations made by IRSA CP,us, IRSA and Cresud. Cresud Sociedad Anónima,
Comercial, Inmobiliaria, Financiera y Agropecuaria
Notes to Consolidated Financial Statements (Continued)
(All amounts in thousandsIRSA CP. Fundación Museo de los Niños is a non-profit association, created by the same founders of Argentine Pesos, except sharesFundación IRSA and per share data andits Management Board is formed by the same members as otherwise indicated)
38. Related party transactions (Continued)
5. | Rentals and/or rights of use: |
In the course of its normal operations, the Group enters into different kinds of agreementsFundación IRSA’s. Fundación Museo de los Niños acts as special vehicle for the rentaldevelopments of real property"Museo de los Niños, Abasto" and spaces in shopping centers related to its activities, namely:
(a) | Lease agreements, gratuitous bailment agreements or agreements for the use of space in shopping centers: |
The Group normally leases diverse spaces in its Shopping Centers (stores, stands, storage rooms or advertising spaces) to related parties, such as Tarshop S.A. (Group’s associate) and Banco Hipotecario S.A. (IRSA’s associate).
Store lease agreements are usually for three years and provide for monthly rental payments, proportional payment of common expenses and contributions to the Fondo"Museo de Promociones Colectivas (FPC) (Collective Promotion Fund), as well as payment of all direct expenses and taxes resulting fromlos Niños, Rosario". On October 29, 1999, our shareholders approved the execution of the agreements. The monthly rental is increased annually by a certain percentage as from the second contract year, on an annual and cumulative basis. The agreements further provide the payment of a right of admission and a special installment corresponding to the FPC, payable at the startaward of the agreement (called FPC Lanzamiento).
The right“Museo de los Niños, Abasto” to use the stands located in the shopping centers is usually granted by way of use permit agreements or, in specific cases, under gratuitous bailment agreements. In the former case, the agreements have a term of one or two years, provide for the payment of a monthly rental and a single percent contribution for the payment of common expenses and the FPC, as well as the payment of all the direct expenses and taxes associated to the execution of agreements. Where the term is in excess of one year, the agreement provides for a percentage increase after the first year. Under the gratuitous bailment agreement, the lessee does not make the monthly payment or the contribution to the above cited fund, but pays for the stand’s specific direct expenses.
As for the rental of storage space, these agreements are accessory to the rental of a store or the right to use a stand, so in general their term coincides with that of the primary agreement. These agreements provide only for the payment of a monthly rental, which is increased annually by a given percentage as from the second year, and while they do not include payments of any common fund or direct expenses, they do provide for the payment of taxes associated with the execution of the agreement.
Furthermore, the Group offers different spaces located in the shopping centers for the advertising of different companies, brands and/or products (non-traditional advertising or NTA). These are generally short-term agreements and provide for the placement of advertising in a specific number of locations at the shopping centers in exchange for a global consideration. The taxes that levy the execution of these agreements are usually paid by the counterparties.
Fundación Museo de los Niños.
Cresud Sociedad Anónima,
Comercial, Inmobiliaria, Financiera y Agropecuaria
Notes to Consolidated Financial Statements (Continued)
(All amounts in thousands of Argentine Pesos, except shares and per share data and as otherwise indicated)
38. Related party transactions (Continued)
(b) | Rights of use granted to Fundación Museo de los Niños: |
InOn October 31, 1997, IRSA CP entered into an agreement with Fundación IRSA whereby a store atit loaned 3,800 square meters of the area built in the Abasto shopping mall was granted underShopping Center for a gratuitous bailment agreement for atotal term of 30 years. Subsequently, in September 1999, Fundación IRSA assigned freeyears, and on November 29, 2005, shareholders of cost all of the rights of use over such store and its respective obligations to Fundación Museo de los Niños.
Fundación Museo de los Niños is a charitable non-profit organization created by the same founders of Fundación IRSA and has the same members of the administration committee.
In November 2005, IRSA CP signedapproved another agreement entered into with Fundación Museo de los Niños granting under gratuitous bailment a store atwhereby 2,670.11 square meters built in the Shopping Center Alto Rosario shopping mallwere loaned for a term of 30 years.
Fundación Museo de los NiñosIRSA has used these spacesthe available area to set up "Museohouse the museum called “Museo de los Niños, Abasto” and “Museo de los Niños, Rosario", twoan interactive learning centers intendedcenter for childrenkids and adults. Both agreements provide that the payment of common expenses and direct expenses relatedadults, which was opened to the services performed by these stores should be borne by Fundación Museo de los Niños.
Cresud, together with IRSA and IRSA CP rent the offices of our president located at 108 Bolivar,public in the City of Buenos Aires, property of Isaac Elsztain e Hijos S.C.A. (a company controlled by certain relatives of Eduardo S. Elsztain, our president) and Hamonet S.A. (a company controlled by Fernando A. Elsztain, one of our directors, and some of its family members). Both contracts were renewed for 36 month period and are effective from March 1, 2014 through February 28, 2017 and April 1, 2014 through March 31, 2017, respectively; they establish a monthly rental payment of US$ 15 per month, which is spread and assumed in equal shares by the three companies.1999.
On the other hand, Cresud leases certain floors and parking space at the Intercontinental Plaza tower, located in Moreno 877, in the Autonomous City of Buenos Aires. These properties were leased from IRSA’s main office and are owned by IRSA CP, under agreements which expire in 2017. The monthly rental payment agreed amounts to US$ 24 plus the obligation to pay common expenses and taxes levied on the real property, proportionately to the total area rented.
Cresud Sociedad Anónima,
Comercial, Inmobiliaria, Financiera y Agropecuaria
Notes to Consolidated Financial Statements (Continued)
(All amounts in thousands of Argentine Pesos, except shares and per share data and as otherwise indicated)
38. Related party transactions (Continued)
Additionally, Tarshop S.A. rents three floors and parking space, of our building in Suipacha 652, under agreements which expire in 2017. The monthly rental payment agreed amounts to US$ 52 plus the obligation to pay common expenses and taxes levied on the real property, proportionately to the total area rented.
6. | Service provider or recipient: |
In the normal course of business operations conducted by the Group, the Group renders and receives different types of services, the most significant being:
The Group usually enters into certain administration and/or management agreements involving the group’s companies and other related parties based upon such parties’ backgrounds, knowledge, experience and expertise in managing this type of business, as well as the existence of qualified staff and a proper structure to render the relevant type of services. These agreements usually designate one of the Group’s companies as exclusively responsible for the management of the complexes and/or companies in exchange of a money consideration, calculated on a base that may be fixed or variable.
In addition, there is a management agreement in place with CAMSA, a consulting company retained by the Group to provide advisory services. The shareholders of CAMSA are Eduardo S. Elsztain, Group’s shareholder and Chairman of the Board, and Saúl Zang, Vice-Chairman of the Board. Under the agreement dated November 1994, CAMSA provides the Group with services such as (i) advisory with respect to capital investments in all aspects of agricultural operations, including, among others, sales, marketing, distribution, financing, investments, technology and business proposals; (ii) acts on the Group’s behalf in such transactions, negotiating the prices, conditions, and other terms of each operation; and (iii) advisory regarding securities investments with respect to such operations. The agreement expressly provides that CAMSA may not provide advisory services with respect to transactions that are entirely related to real estate. The Group pays CAMSA an annual fee equal to 10% of the Group’s annual net income after taxes. Under the agreement, the Group is required to reimburse CAMSA normal expenses incurred in performing the services. The agreement is subject to termination by either party upon not less than 60 days prior written notice. If the Group terminates the agreement without cause, the Group must pay CAMSA twice the average of the amounts of the management fee paid for the two preceding fiscal years.
Cresud Sociedad Anónima,
Comercial, Inmobiliaria, Financiera y Agropecuaria
Notes to Consolidated Financial Statements (Continued)
(All amounts in thousands of Argentine Pesos, except shares and per share data and as otherwise indicated)
38. Related party transactions (Continued)
Furthermore, Brasilagro provides agricultural advisory services to Cresca S.A. ("Cresca"), joint venture between Brasilagro and Carlos Casado S.A. ("Casado"), with agricultural activities in Paraguay, under a 10-year agreement, automatically renewal for two additional 10-year periods, and receives management fees as follows by way of consideration, Cresca must paid to the Group: (a) (i) an amount equal to 12% per annum on the total amount to be paid annually by Cresca for preparing the lands (from natural to productive state) in purpose of agricultural and cattle farming development for the first 41,930 has. and (ii) an amount equal to 10% on the concepts mentioned above from the ha. 41,931 on; and (b) an amount equal to 10% per annum on the gross margin from sales revenue less (i) direct selling expenses (including but not limited to commissions, withholding taxes, freight and any other expense arising for or from sales), (ii) direct production costs, (iii) structure costs and (iv) tax costs.
(b) | Special reimbursement programs with several means of payment |
The Group carries out diverse business actions and promotions intended to promote larger number of visitors and consumption inside its shopping centers.
Some promotions offer different types of discounts to clients and/or interest-free financing plans on specific dates or periods. To this end, the Group enters into agreements with various third party financial entities and/or related parties, such as Banco Hipotecario S.A. and Tarshop S.A..
Overall, these agreements establish different refund percentages, on specific dates or periods, for clients making purchases at all the participating stores using the means of payment specific of each financial entity and, on occasions, additional financing plans with interest-free installments. The cost of the refunds granted to the clients is generally distributed as a percentage among the lessors of the shopping centers and the financial entities, while the cost of interest-free financing is borne, in general, by the latter. The Group acts as an intermediary and is in charge of the lessors’ engagement and the advertising of these promotions. This activity results in no money flows or transfer of revenues or costs between the Group and its related parties.
The Group hires legal services from Estudio Zang, Bergel & Viñes. Our Vice-president,es, from which Saúl Zang is a partner and our alternate directors, Juan M. Quintana, Salvador D. Bergel, and D. Pablo Vergara del Carril are memberssits at the Board of that law firm. Cresud Sociedad Anónima,Purchase-Sale of goods and/or services hiring
Comercial, Inmobiliaria, Financiera y Agropecuaria
Notes to Consolidated Financial Statements (Continued)
(All amounts in thousands of Argentine Pesos, except shares and per share data and as otherwise indicated)
38. Related party transactions (Continued)
7. | Sale of goods and/or services |
In the normal course of its business and with the aim of building on and enhancingmake resources more efficient, the individual efficiencies of each of the Group’s companiesGroup, or its related parties, including its parent company, in the different areas comprising the operating management, and with a view to obtaining the best prices and rates, supplies and materials are purchased,certain occasions purchase and/or hire services are hired on behalf of a company which later sells and/or recoversrecover for companies of the Group or other related parties, based upon their actual utilization.
The category manly comprises:
(a) | Sale of radio or TV advertising seconds and/or spaces in newspapers and magazines |
The Group usually enters into agreements with third parties whereby it acquires, for future use, rights to use different means (pages in newspapers and magazines, radio or TV seconds, etc.), which it subsequently uses in its advertising campaigns. Such means may be used by the acquiring company or by other related parties, in which case the former sells such spaces to the latter.
(b) | Sale of materials and supplies |
Usually, each of the Group companies buys from third parties different types of supplies and materials required to carry out its activities, which it then uses directly or sells to one or more Group companies or related parties, based upon utilization needs.
(c) | Reimbursement of expenses |
These operations do not entail additional profits to the company recovering expenses, for the same are carried out as per the cost value of the goods or services acquired.
Cresud Sociedad Anónima, Comercial, Inmobiliaria, Financiera y Agropecuaria
Notes to the Consolidated Financial Statements(Continued) (All amounts in thousandsmillions of Argentine Pesos, except shares and per share data and as otherwise indicated)
38.35. Related party transactions(Continued)
In the normal course of its activities, the Group enters into diverse loan agreements or credit facilities between the group’s companies and/or other related parties. These loans generallyborrowings accrue interestinterests at market rates from the date of each disbursement until the date of effective repayment,rates. Financial and may be paid off wholly or partially prior to the due date, either in cash and/or through capitalization (conversion into shares), and/or by way of offsetting arrangements involving debit and credit balances existing between the companies.service operations with BHSA
(b) | Master agreement for US dollar-denominated forward transactions with Banco Hipotecario S.A. |
IRSA CP and Banco Hipotecario S.A. entered into a master agreement for the performance of dollar-denominated forward transactions. This master agreement provides that the parties may carry out this type of transactions by fixing a certain forward price (“the Agreed Price”). Such transactions are settled in cash by paying the difference between the Agreed Price and the quoted price of the US dollar on the settlement date.
(c) | Securities loan agreement with IFISA |
The Company works with several financial entities in the Argentine market for operations including, but not limited to, credit, investment, purchase and sale of securities and financial derivatives. Such entities include BHSA and its subsidiaries. Furthermore, BHSA and BACS usually act as underwriters in Capital Market transactions for the Company and its subsidiaries. In addition, we have entered into a securities loan agreementagreements with BHSA, who provides collection services for our Shopping Centers. Transactions with IFISA On February 10, 2015, Dolphin, sold 71,388,470 IDBD shares to IFISA, for an amount of US$ 25.6 million, US$ 4 million of which were paid upon execution and the remaining balance of US$ 21.6 million were financed for a company incorporated under the lawsterm of República Oriental del Uruguay, which granted 4,053,942 Global Depositary Shares, representing 10 ordinary shares with a face value of Ps. 1 per share of IRSA. This loan does not imply the transfer of any politic nor economic right correspondingup to the values, which are held by Cresud. Regarding voting rights,360 days and priced at Libor 1M (one month) + 3%. On May 9, 2016, the parties agreed thatto extend the Company will grantexpiration date for 30 days as from execution of the addenda, to be automatically renewable every 30 days for a powermaximum term of attorney180 days, and increasing the rate to 9% since February 10, 2016. On May 31, 2015, IRSA, through Dolphin, sold to IFISA with46 million of warrants Series 4 for a total amount of NIS 0.46 million (equivalent to US$ 0.12 million at the respective voting instructions. In respecttime of the transaction), provided IFISA agreed to dividends,exercise them fully when Dolphin were so required by IDBD. On July 28, 2015, the Group, through Dolphin granted a loan to IFISA will transfer the funds to Cresud. The loanfor an amount of US$ 7.2 million, due in July 2016, which accrues interest at an annualLibor 1M (one month) + 3%. On May 9, the parties agreed to extend the expiration date to June 8, 2016, to be automatically renewable every 30 days for a maximum term of 180 days, and increased the rate equivalent to 3 month LIBOR, plus 50 basis points,9%. On October 9, 2015, the Group, through REIG V granted a loan in the amount of US$ 40 million to IFISA. The term of the loan is one year calculated from the disbursement and is due on June 25, 2016.bore interest at a rate of 3% + Libor 1M, determined monthly. On October 7, 2016, the Group extended the deadline for repayment within 30 days from October 8, 2016, automatically renewable for periods of 30 days to a maximum of 180 days and settled interest at a rate of 9% per annum.
Cresud Sociedad Anónima, Comercial, Inmobiliaria, Financiera y Agropecuaria
Notes to the Consolidated Financial Statements(Continued) (All amounts in thousandsmillions of Argentine Pesos, except shares and per share data and as otherwise indicated)
38.35. Related party transactions(Continued)
In February 2016, DN B.V., a subsidiary of Dolphin, entered into an option contract with IFISA whereby Dolphin is granted the right, but not the obligation to acquire 92,665,925 shares of IDBD held by IFISA at a share price of NIS 1.64 plus an annual interest of 8.5%. The exercise date for the option extends for two years. In June 2014, the Group – through Real Estate Investment Group IV LP – renewed a credit facility granted by IFISA, a company indirectly controlled by Eduardo Sergio Elsztain, for a total amount of 1.4 million shares of Hersha Hospitality Trust. The transaction was agreed upon for a term of 30 days, which could be renewed for up to 360 days; the facility was priced at LIBOR (3 months) + 50 bp. This credit facility was cancelled after the end of fiscal year 2014 in order to sell the remaining amount of Hersha. On June 30, 2016, the Company had a credit facility with IFISA involving shares and/or GDRs of IRSA for up to 3,500,000 GDRs. This credit facility will expire in June 2017 and accrues interest at an annual fixed rate of 6%.
On June 18, 2012, Cresud signed a credit facility with IFISA for a maximum amount of US$ 6, which expired on November 24, 2012, extended until November 24, 2015, at a rate of LIBOR (12 MONTH) + 300 bp.; the credit facility was terminated on the expiration date. Investment in investment funds managed by BACS The Group invests its liquid funds in mutual funds managed by BACS among other entities. San Bernardo lease We lease a rural establishment in the Province of Córdoba, which is owned by San Bernardo de Córdoba S.A. (previously denominated Isaac Elsztain e hijos S.C.A.) pursuant to a lease agreement entered into in August 2015, for a fraction of 12,600 hectares. The consideration for the lease was agreed at an amount equal to 3.5 kg of beef per hectare. For computation purposes the price per kilo of beef reported in the webpage of the Mercado de Hacienda de Liniers (Cattle Market) is considered. In addition, a productivity premium was agreed equal to 15% of the excess over 240,000 kilograms of cattle in the establishment; this will be a one-off payment to be effected in September 2016. The lease contract may be extended for up to two annual periods. Currently, the parties are negotiating the conditions for its extension. Cresud Sociedad Anónima, Comercial, Inmobiliaria, Financiera y Agropecuaria Notes to the Consolidated Financial Statements(Continued) (All amounts in millions of Argentine Pesos, except otherwise indicated) 35. Related party transactions (Continued) Consulting Agreement
In accordance with the terms of the Consulting Agreement, in force as from November 7, 1994, CAMSA provides us with advisory services on matters related to capital expenditure in all areas of the agricultural business. An 85% of the capital stock of CAMSA is held by one of our shareholders and President of our Board of Directors, while the remaining 15% of the capital stock is owned by our First Vice President. Based on the terms and conditions of the Consulting Agreement, CAMSA provides us with the following services: ● advise in relation to investing in all aspects of the agricultural business, including sales, marketing, distribution, financing, investment, technology and business proposals, among others; ● acts on behalf of our company in such transactions, negotiating prices, terms and conditions and other terms of each transaction; and ● provides advisory services on investments in securities related to such transactions. The Consulting Agreement expressly provides that CAMSA cannot provide advice on transactions exclusively related to real property. As regards the Consulting Agreement, in consideration for its services we pay CAMSA an annual fee equal to 10% of our annual net income after tax. During fiscal years ended June 30, 2016 and 2014, no expense was recorded in relation to this item, while in fiscal year 2015 we paid Ps. 11,4. The Consulting Agreement can be revoked by any of the parties upon prior written notice that should not exceed 60 days. If we revoke the Consulting Agreement without cause, we will be liable to pay CAMSA twice the average fee amounts paid for management services during the two fiscal years preceding such revocation. Sale of advertising space in media The Group frequently enter into agreements with third parties whereby we sell/acquire rights of use to advertise in media (TV, radio stations, newspapers, etc.) that will later be used in advertising campaigns. Normally, these spaces are sold and/or recovered to/from other companies or other related parties, based on their actual use. Cresud Sociedad Anónima, Comercial, Inmobiliaria, Financiera y Agropecuaria Notes to the Consolidated Financial Statements(Continued) (All amounts in millions of Argentine Pesos, except otherwise indicated) 35. Related party transactions (Continued) The following is a summary of the balances with related parties as of June 30, 2016: | Related party | | Description of transaction | | Investment in financial assets Non-current | | Investment in financial assets Current | | Trade and other receivables Non-current | | Trade and other receivables Current | | Trade and other payables Current | | Borrowings Non-current | | Borrowings Current | | Associates | | | | | | | | | | | | | | | | | | Tarshop | | Reimbursement of expenses | | - | | - | | - | | 1 | | - | | - | | - | | | | Leases and/or rights of use | | - | | - | | - | | - | | (1) | | - | | - | | New Lipstick | | Reimbursement of expenses | | - | | - | | - | | 4 | | - | | - | | - | | Lipstick | | Reimbursement of expenses | | - | | - | | - | | 1 | | - | | - | | - | | Metropolitan | | Reimbursement of expenses | | - | | - | | - | | - | | - | | - | | - | | Agro-Uranga S.A | | Dividends receivables | | - | | - | | - | | 1 | | - | | - | | - | | | Brokerage | | - | | - | | - | | - | | (1) | | - | | - | | Agrofy S.A. | | Other receivables | | - | | - | | - | | 17 | | - | | - | | - | | BHSA | | Reimbursement of expenses | | - | | - | | - | | 1 | | (1) | | - | | - | | | Borrowings | | - | | - | | - | | - | | - | | (2) | | (10) | | BACS | | Reimbursement of expenses | | - | | - | | - | | 1 | | - | | - | | - | | | | Non-convertible notes | | 100 | | 21 | | - | | - | | - | | - | | - | | Total Associates | | | | 100 | | 21 | | - | | 26 | | (3) | | (2) | | (10) |
Cresud Sociedad Anónima, Comercial, Inmobiliaria, Financiera y Agropecuaria Notes to the Consolidated Financial Statements(Continued) (All amounts in millions of Argentine Pesos, except otherwise indicated) 35. Related party transactions (Continued) | Related party | | Description of transaction | | Investment in financial assets Non-current | | Investment in financial assets Current | | Trade and other receivables Non-current | | Trade and other receivables Current | | Trade and other payables Current | | Borrowings Non-current | | Borrowings Current | | Joint Ventures | | | | | | | | | | | | | | | | | | Cresca S.A. | | Loans granted | | - | | - | | 162 | | - | | - | | - | | - | | Puerto Retiro | | Borrowings | | - | | - | | - | | 3 | | - | | - | | - | | NPSF | | Reimbursement of expenses | | - | | - | | - | | 2 | | - | | - | | - | | | Borrowings | | - | | - | | - | | - | | - | | - | | (6) | | | Share-based payments | | - | | - | | - | | 1 | | - | | - | | - | | | Management fees | | - | | - | | - | | 4 | | - | | - | | - | | Quality | | Reimbursement of expenses | | - | | - | | - | | 1 | | - | | - | | - | | Cyrsa | | Credit due to capital reduction | | - | | - | | - | | 3 | | - | | - | | - | | Total Joint Ventures | | | | - | | - | | 162 | | 14 | | - | | - | | (6) | | Other related parties | | | | | | | | | | | | | | | | | | CAMSA | | Reimbursement of expenses | | - | | - | | - | | 9 | | - | | - | | - | | Estudio Zang, Bergel & Viñes | | Legal services | | - | | - | | - | | - | | (1) | | - | | - | | IFISA | | Reimbursement of expenses | | - | | - | | - | | 1,074 | | - | | - | | - | | | | Financial operations | | - | | - | | - | | 12 | | - | | - | | - | | Museo de los Niños | | Leases and/or rights of use | | - | | - | | - | | 2 | | - | | - | | - | | Boulevard Norte S.A. | | Reimbursement of expenses | | - | | - | | - | | 1 | | - | | - | | - | | Ogden Argentina S.A. | | Borrowings | | - | | - | | - | | 1 | | - | | - | | - | | Consultores Venture Capital Uruguay | | Management fees | | - | | - | | - | | 2 | | - | | - | | - | | Total Other related parties | | | | - | | - | | - | | 1,101 | | (1) | | - | | - | | Directors and Senior Management | | | | | | | | | | | | | | | | | | Directors and Senior Management | | Fees | | - | | - | | - | | - | | (29) | | - | | - | | | Advances | | - | | - | | - | | 4 | | - | | - | | - | | Total Directors and Senior Management | | | | - | | - | | - | | 4 | | (29) | | - | | - | | Total | | | | 100 | | 21 | | 162 | | 1,145 | | (33) | | (2) | | (16) |
Cresud Sociedad Anónima, Comercial, Inmobiliaria, Financiera y Agropecuaria Notes to the Consolidated Financial Statements(Continued) (All amounts in millions of Argentine Pesos, except otherwise indicated) 35. Related party transactions (Continued) The following is a summary of the balances with related parties as of June 30, 2015: | Related party | Description of transaction | | Investment in financial assetsNon-current | | | Investment in financial assetsCurrent | | | Trade and other receivables Non-current | | | Trade and other receivables Current | | | Trade and other payables Non-current | | | Trade and other payables Current | | | Borrowings Non-current | | | Borrowings Current | | | Derivative financial instruments | | | Associates | | | | | | | | | | | | | | | | | | | | | | | | | | | | | | Tarshop S.A. | Reimbursement of expenses | | | - | | | | - | | | | - | | | | 1,792 | | | | - | | | | - | | | | - | | | | - | | | | - | | | | Leases and/or rights of use | | | - | | | | - | | | | - | | | | - | | | | (25 | ) | | | (722 | ) | | | - | | | | - | | | | - | | | New Lipstick LLC | Reimbursement of expenses | | | - | | | | - | | | | - | | | | 2,567 | | | | - | | | | - | | | | - | | | | - | | | | - | | | Condor | Financial operations | | | - | | | | - | | | | - | | | | 29,492 | | | | - | | | | - | | | | - | | | | - | | | | - | | | Lipstick Management LLC | Reimbursement of expenses | | | | | | | | | | | | | | | 854 | | | | | | | | | | | | | | | | | | | | | | | Metropolitan | Reimbursement of expenses | | | - | | | | - | | | | - | | | | - | | | | - | | | | (10 | ) | | | - | | | | - | | | | - | | | Agro-Uranga S.A | Receivables on futures and options | | | - | | | | - | | | | - | | | | 184 | | | | - | | | | - | | | | - | | | | - | | | | - | | | | Purchase of goods and/or services | | | - | | | | - | | | | - | | | | - | | | | - | | | | (807 | ) | | | - | | | | - | | | | - | | | | Commissions receivable | | | - | | | | - | | | | - | | | | 12 | | | | - | | | | - | | | | - | | | | - | | | | - | | | | Brokerage | | | - | | | | - | | | | - | | | | - | | | | - | | | | (40 | ) | | | - | | | | - | | | | - | | | | Sale of inputs | | | - | | | | - | | | | - | | | | 595 | | | | - | | | | - | | | | - | | | | - | | | | - | | | Agro Managers S.A. | Reimbursement of expenses | | | - | | | | - | | | | - | | | | 297 | | | | - | | | | - | | | | - | | | | - | | | | - | | | Banco Hipotecario S.A. | Reimbursement of expenses | | | - | | | | - | | | | - | | | | - | | | | - | | | | (117 | ) | | | - | | | | - | | | | - | | | | Advances | | | - | | | | - | | | | - | | | | - | | | | - | | | | (1,428 | ) | | | - | | | | - | | | | - | | | | Commissions per supermarket aisle | | | - | | | | - | | | | - | | | | 68 | | | | - | | | | - | | | | - | | | | - | | | | - | | | | Borrowings | | | - | | | | - | | | | - | | | | - | | | | - | | | | - | | | | (7,674 | ) | | | (22,155 | ) | | | - | | | | Leases and/or rights of use | | | - | | | | - | | | | - | | | | 762 | | | | - | | | | - | | | | - | | | | - | | | | - | | | Banco de Crédito y | Reimbursement of expenses | | | - | | | | - | | | | - | | | | 1,766 | | | | - | | | | - | | | | - | | | | - | | | | - | | | Securitización | Leases and/or rights of use | | | - | | | | - | | | | - | | | | 42 | | | | - | | | | - | | | | - | | | | - | | | | - | | | | Non-convertible notes | | | 100 | | | | 452 | | | | - | | | | - | | | | - | | | | - | | | | - | | | | - | | | | - | | | Total Associates | | | | 100 | | | | 452 | | | | - | | | | 38,431 | | | | (25 | ) | | | (3,124 | ) | | | (7,674 | ) | | | (22,155 | ) | | | - | |
| Related party | | Description of transaction | | Investment in financial assets Non-current | | Trade and other receivables Non-current | | Trade and other receivables Current | | Trade and other payables Current | | Borrowings Non-current | | Borrowings Current | | Associates | | | | | | | | | | | | | | | | Tarshop | | Reimbursement of expenses | | - | | - | | 2 | | - | | - | | - | | | | Leases and/or rights of use | | - | | - | | - | | (1) | | - | | - | | New Lipstick | | Reimbursement of expenses | | - | | - | | 3 | | - | | - | | - | | Condor | | Financial operations | | - | | - | | 29 | | - | | - | | - | | Lipstick | | Reimbursement of expenses | | | | | | 1 | | | | | | | | Agro-Uranga S.A | | Purchase of goods and/or services | | - | | - | | - | | (1) | | - | | - | | | Sale of inputs | | - | | - | | 1 | | - | | - | | - | | BHSA | | Advances | | - | | - | | - | | (1) | | - | | - | | | Borrowings | | - | | - | | - | | - | | (8) | | (22) | | | Leases and/or rights of use | | - | | - | | 1 | | - | | - | | - | | BACS | | Reimbursement of expenses | | - | | - | | 2 | | - | | - | | - | | | | Non-convertible notes | | 100 | | - | | - | | - | | - | | - | | Total Associates | | | | 100 | | - | | 39 | | (3) | | (8) | | (22) |
Cresud Sociedad Anónima, Comercial, Inmobiliaria, Financiera y Agropecuaria
Notes to the Consolidated Financial Statements(Continued) (All amounts in thousandsmillions of Argentine Pesos, except shares and per share data and as otherwise indicated)
35. 38. Related party transactions(Continued)
| Related party | | Description of transaction | | Investment in financial assetsNon-current | | | Investment in financial assets Current | | | Trade and other receivables Non-current | | | Trade and other receivables Current | | | Trade and other payables Non-current | | | Trade and other payables Current | | | Borrowings Non-current | | | Borrowings Current | | | Derivative financial instruments | | | Joint Ventures | | | | | | | | | | | | | | | | | | | | | | | | | | | | | | | Cresca S.A. | | Management fees | | | - | | | | - | | | | - | | | | 29 | | | | - | | | | - | | | | - | | | | - | | | | - | | | | | Loans granted | | | - | | | | - | | | | 114,446 | | | | - | | | | - | | | | - | | | | - | | | | - | | | | - | | | Puerto Retiro S.A. | | Borrowings | | | - | | | | - | | | | - | | | | 2,148 | | | | - | | | | - | | | | - | | | | - | | | | - | | | | | Reimbursement of expenses | | | - | | | | - | | | | - | | | | 257 | | | | - | | | | - | | | | - | | | | - | | | | - | | | Nuevo Puerto Santa Fe S.A. | | Reimbursement of expenses | | | - | | | | - | | | | - | | | | 543 | | | | - | | | | (5 | ) | | | - | | | | - | | | | - | | | | | Borrowings | | | - | | | | - | | | | - | | | | - | | | | - | | | | - | | | | - | | | | (7,826 | ) | | | - | | | | | Share-based payments | | | - | | | | - | | | | - | | | | 467 | | | | - | | | | - | | | | - | | | | - | | | | - | | | | | Leases’ collections | | | - | | | | - | | | | - | | | | - | | | | - | | | | (4 | ) | | | - | | | | - | | | | - | | | | | Leases and/or rights of use | | | - | | | | - | | | | - | | | | - | | | | - | | | | (594 | ) | | | - | | | | - | | | | - | | | | | Management fees | | | - | | | | - | | | | - | | | | 2,644 | | | | - | | | | - | | | | - | | | | - | | | | - | | | Quality Invest S.A. | | Management fee | | | - | | | | - | | | | - | | | | 22 | | | | - | | | | - | | | | - | | | | - | | | | - | | | | | Reimbursement of expenses | | | - | | | | - | | | | - | | | | 233 | | | | - | | | | - | | | | - | | | | - | | | | - | | | Baicom Networks S.A. | | Management fee | | | - | | | | - | | | | - | | | | 16 | | | | - | | | | - | | | | - | | | | - | | | | - | | | | | Borrowings | | | - | | | | - | | | | 1,275 | | | | 222 | | | | - | | | | - | | | | - | | | | - | | | | - | | | | | Contributions to be paid in | | | - | | | | - | | | | - | | | | 10 | | | | - | | | | - | | | | - | | | | - | | | | - | | | | | Reimbursement of expenses | | | - | | | | - | | | | - | | | | 924 | | | | - | | | | - | | | | - | | | | - | | | | - | | | Cyrsa S.A | | Credit due to capital reduction | | | - | | | | - | | | | - | | | | 8,847 | | | | - | | | | - | | | | - | | | | - | | | | - | | | | . | | Borrowings | | | - | | | | - | | | | - | | | | - | | | | - | | | | - | | | | (14,438 | ) | | | - | | | | - | | | | | | Reimbursement of expenses | | | - | | | | - | | | | - | | | | 11 | | | | - | | | | (23 | ) | | | - | | | | - | | | | - | | | Entretenimiento | | Reimbursement of expenses | | | - | | | | - | | | | - | | | | 115 | | | | - | | | | - | | | | - | | | | - | | | | - | | | Universal S.A. | | Borrowings | | | - | | | | - | | | | - | | | | 80 | | | | - | | | | - | | | | - | | | | - | | | | - | | | Entertainment Holding S.A. | | Reimbursement of expenses | | | - | | | | - | | | | - | | | | 211 | | | | - | | | | - | | | | - | | | | - | | | | - | | | | | | Borrowings | | | - | | | | - | | | | - | | | | 72 | | | | - | | | | - | | | | - | | | | - | | | | - | | | Total Joint Ventures | | | | | - | | | | - | | | | 115,721 | | | | 16,851 | | | | - | | | | (626 | ) | | | (14,438 | ) | | | (7,826 | ) | | | - | |
| Related party | | Description of transaction | | Investment in financial assets Non-current | | Trade and other receivables Non-current | | Trade and other receivables Current | | Trade and other payables Current | | Borrowings Non-current | | Borrowings Current | | Joint Ventures | | | | | | | | | | | | | | | | Cresca S.A. | | Loans granted | | - | | 114 | | - | | - | | - | | - | | Puerto Retiro | | Borrowings | | - | | - | | 2 | | - | | - | | - | | NPSA | | Reimbursement of expenses | | - | | - | | 1 | | - | | - | | - | | | Borrowings | | - | | - | | - | | - | | - | | (8) | | | Leases and/or rights of use | | - | | - | | - | | (1) | | - | | - | | | Management fees | | - | | - | | 3 | | - | | - | | - | | Baicom | | Borrowings | | - | | 1 | | - | | - | | - | | - | | | | Reimbursement of expenses | | - | | - | | 1 | | - | | - | | - | | Cyrsa | | Credit due to capital reduction | | - | | - | | 9 | | - | | - | | - | | | | Borrowings | | - | | - | | - | | - | | (14) | | - | | Total Joint Ventures | | | | - | | 115 | | 16 | | (1) | | (14) | | (8) | | Other related parties | | | | | | | | | | | | | | | | CAMSA | | Management fees | | - | | - | | - | | (7) | | - | | - | | | | Reimbursement of expenses | | - | | - | | 7 | | - | | - | | - | | Estudio Zang, Bergel & Viñes | | Legal services | | - | | - | | - | | (1) | | - | | - | | IFISA | | Financial operations | | - | | - | | 323 | | - | | - | | - | | Museo de los Niños | | Leases and/or rights of use | | - | | - | | 1 | | - | | - | | - | | Boulevard Norte S.A. | | Reimbursement of expenses | | - | | - | | 1 | | - | | - | | - | | Ogden Argentina S.A. | | Borrowings | | - | | - | | 1 | | - | | - | | - | | Consultores Venture Capital Uruguay | | Management fees | | - | | - | | 2 | | - | | - | | - | | Total Other related parties | | | | - | | - | | 335 | | (8) | | - | | - | | Directors and Senior Management | | | | | | | | | | | | | | | | Directors and Senior Management | | Fees | | | | | | | | (42) | | - | | - | | Total Directors and Senior Management | | | | - | | - | | - | | (42) | | - | | - | | Total | | | | 100 | | 115 | | 390 | | (54) | | (22) | | (30) |
Cresud Sociedad Anónima, Comercial, Inmobiliaria, Financiera y Agropecuaria
Notes to the Consolidated Financial Statements(Continued) (All amounts in thousandsmillions of Argentine Pesos, except shares and per share data and as otherwise indicated)
38.35. Related party transactions(Continued)
| Related party | Description of transaction | | Investment in financial assets Non-current | | | Investment in financial assets Current | | | Trade and other receivables Non-current | | | Trade and other receivables Current | | | Trade and other payables Non-current | | | Trade and other payables Current | | | Borrowings Non-current | | | Borrowings Current | | | Derivative financial instruments | | | Other related parties | | | | | | | | | | | | | | | | | | | | | | | | | | | | | | CAMSA | Management fees | | | - | | | | - | | | | - | | | | - | | | | - | | | | (6,743 | ) | | | - | | | | - | | | | - | | | | Reimbursement of expenses | | | - | | | | - | | | | - | | | | 7,292 | | | | - | | | | - | | | | - | | | | - | | | | - | | | Estudio Zang, Bergel & Viñes | Advances | | | - | | | | - | | | | - | | | | 33 | | | | - | | | | - | | | | - | | | | - | | | | - | | | | Legal services | | | - | | | | - | | | | - | | | | 377 | | | | - | | | | (1,185 | ) | | | - | | | | - | | | | - | | | Estudio Managing Partners | Management fees | | | - | | | | - | | | | - | | | | - | | | | - | | | | (34 | ) | | | - | | | | - | | | | - | | | Fundación IRSA | Reimbursement of expenses | | | - | | | | - | | | | - | | | | 102 | | | | - | | | | - | | | | - | | | | - | | | | - | | | Inversiones Financieras del Sur S.A. | Financial operations | | | - | | | | - | | | | - | | | | 323,018 | | | | - | | | | - | | | | - | | | | - | | | | - | | | | Dividends receivable | | | - | | | | - | | | | - | | | | 359 | | | | - | | | | - | | | | - | | | | - | | | | - | | | Museo de los Niños | Reimbursement of expenses | | | - | | | | - | | | | - | | | | 94 | | | | - | | | | - | | | | - | | | | - | | | | - | | | | Leases and/or rights of use | | | - | | | | - | | | | - | | | | 750 | | | | - | | | | - | | | | - | | | | - | | | | - | | | Austral Gold | Reimbursement of expenses | | | - | | | | - | | | | - | | | | 331 | | | | - | | | | (1 | ) | | | - | | | | - | | | | - | | | | Borrowings | | | - | | | | - | | | | - | | | | 5 | | | | - | | | | - | | | | - | | | | - | | | | - | | | Boulevard Norte S.A. | Reimbursement of expenses | | | - | | | | - | | | | - | | | | 881 | | | | - | | | | - | | | | - | | | | - | | | | - | | | Ogden Argentina S.A. | Reimbursement of expenses | | | - | | | | - | | | | - | | | | 250 | | | | - | | | | - | | | | - | | | | - | | | | - | | | | Borrowings | | | - | | | | - | | | | - | | | | 724 | | | | - | | | | - | | | | - | | | | - | | | | - | | | La Rural S.A. | Reimbursement of expenses | | | - | | | | - | | | | - | | | | - | | | | - | | | | (39 | ) | | | - | | | | - | | | | - | | | Consultores Venture Capital Uruguay | Management fees | | | - | | | | - | | | | - | | | | 1,125 | | | | - | | | | - | | | | - | | | | - | | | | - | | | Total Other related parties | | | | - | | | | - | | | | - | | | | 335,341 | | | | - | | | | (8,002 | ) | | | - | | | | - | | | | - | | | Directors and Senior Management | | | | | | | | | | | | | | | | | | | | | | | | | | | | | | | | | | | | | | | Directors and Senior Management | Fees | | | | | | | | | | | | | | | | | | | - | | | | (41,634 | ) | | | - | | | | - | | | | - | | | | Advances | | | - | | | | - | | | | - | | | | 317 | | | | - | | | | - | | | | - | | | | - | | | | - | | | | Guarantee deposits | | | | | | | | | | | | | | | | | | | (21 | ) | | | - | | | | - | | | | - | | | | - | | | | Reimbursement of expenses | | | - | | | | - | | | | - | | | | 40 | | | | - | | | | (15 | ) | | | - | | | | - | | | | - | | | Total Directors and Senior Management | | | | - | | | | - | | | | - | | | | 357 | | | | (21 | ) | | | (41,649 | ) | | | - | | | | - | | | | - | | | Total | | | | 100 | | | | 452 | | | | 115,721 | | | | 390,980 | | | | (46 | ) | | | (53,401 | ) | | | (22,112 | ) | | | (29,981 | ) | | | - | |
The following is a summary of the transactions with related parties for the year ended as of June 30, 2016: | Related party | | Leases and/or rights to use | | Administration and management fees | | Sale of goods and/or services | | Compensation of Directors and senior management | | Legal services | | Financial operations | | Commissions | | Donations | | Associates | | | | | | | | | | | | | | | | | | Agro-Uranga S.A. | | - | | - | | 3 | | - | | - | | - | | - | | - | | Tarshop | | 12 | | - | | - | | - | | - | | - | | - | | - | | BACS | | 6 | | - | | - | | - | | - | | 21 | | - | | - | | BHSA | | 3 | | - | | - | | - | | - | | (5) | | - | | - | | Total Associates | | 21 | | - | | 3 | | - | | - | | 16 | | - | | - | | Joint Ventures | | | | | | | | | | | | | | | | | | Cyrsa | | - | | - | | - | | - | | - | | (3) | | - | | - | | NPSA | | - | | 3 | | - | | - | | - | | (2) | | - | | - | | Puerto Retiro | | - | | - | | - | | - | | - | | 1 | | - | | - | | Adama | | - | | - | | 16 | | | | | | | | | | | | ISPRO | | - | | - | | 9 | | | | | | | | | | | | Mehadrin | | - | | - | | 48 | | | | | | | | | | | | Total Joint Ventures | | - | | 3 | | 73 | | - | | - | | (4) | | - | | - | | Other related parties | | | | | | | | | | | | | | | | | | San Bernardo de Córdoba S.A. | | (1) | | - | | - | | - | | - | | - | | - | | - | | Fundación IRSA | | - | | - | | - | | - | | - | | - | | - | | (8) | | Hamonet S.A. | | (1) | | - | | - | | - | | - | | - | | - | | - | | Estudio Zang, Bergel & Viñes | | - | | - | | - | | - | | (6) | | - | | - | | - | | Isaac Elsztain e Hijos S.C.A. | | (1) | | - | | - | | - | | - | | - | | - | | - | | Condor | | - | | - | | - | | - | | - | | 122 | | - | | - | | IFISA | | - | | - | | - | | - | | - | | 39 | | - | | - | | Total Other related parties | | (3) | | - | | - | | - | | (6) | | 161 | | - | | (8) | | Directors and Senior Management | | | | | | | | | | | | | | | | | | Directors | | - | | - | | - | | (156) | | - | | - | | - | | - | | Senior Management | | - | | - | | - | | (16) | | - | | - | | - | | - | | Total Directors and Senior Management | | - | | - | | - | | (172) | | - | | - | | - | | - | | Total | | 18 | | 3 | | 76 | | (172) | | (6) | | 173 | | - | | (8) |
Cresud Sociedad Anónima, Comercial, Inmobiliaria, Financiera y Agropecuaria
Notes to the Consolidated Financial Statements(Continued) (All amounts in thousandsmillions of Argentine Pesos, except shares and per share data and as otherwise indicated)
38.35. Related party transactions(Continued)
The following is a summary of the balances with related parties as of June 30, 2014:
| Related party | Description of transaction | | Trade and other receivables Non-current | | | Trade and other receivables Current | | | Trade and other payables Non-current | | | Trade and other payables Current | | | Borrowings Non-current | | | Borrowings Current | | | Derivative financial instruments | | | Associates | | | | | | | | | | | | | | | | | | | | | | | | Tarshop S.A. | Reimbursement of expenses | | | - | | | | 689 | | | | - | | | | - | | | | - | | | | - | | | | - | | | | Commissions per supermarket aisle | | | - | | | | 19 | | | | - | | | | - | | | | - | | | | - | | | | - | | | | Leases and/or rights of use | | | - | | | | - | | | | (175 | ) | | | (677 | ) | | | - | | | | - | | | | - | | | New Lipstick LLC | Reimbursement of expenses | | | - | | | | 2,297 | | | | - | | | | - | | | | - | | | | - | | | | - | | | Lipstick Management LLC | Reimbursement of expenses | | | - | | | | 765 | | | | - | | | | - | | | | - | | | | - | | | | - | | | Agro-Uranga S.A | Dividends receivable | | | - | | | | 39 | | | | - | | | | - | | | | - | | | | - | | | | - | | | | Purchase of goods and/or services | | | - | | | | - | | | | - | | | | (112 | ) | | | - | | | | - | | | | - | | | | Brokerage | | | - | | | | 29 | | | | - | | | | (70 | ) | | | - | | | | - | | | | - | | | | Sale of inputs | | | - | | | | 425 | | | | - | | | | - | | | | - | | | | - | | | | - | | | Agro Managers S.A. | Reimbursement of expenses | | | - | | | | 303 | | | | - | | | | - | | | | - | | | | - | | | | - | | | Banco Hipotecario S.A. | Reimbursement of expenses | | | - | | | | 12 | | | | - | | | | (1,547 | ) | | | - | | | | - | | | | - | | | | Commissions per supermarket aisle | | | - | | | | 59 | | | | - | | | | - | | | | - | | | | - | | | | - | | | | Borrowings | | | - | | | | - | | | | - | | | | - | | | | (18,376 | ) | | | (23,530 | ) | | | - | | | | Derivatives | | | - | | | | - | | | | - | | | | - | | | | - | | | | - | | | | (5,225 | ) | | | Leases and/or rights of use | | | - | | | | 200 | | | | - | | | | - | | | | - | | | | - | | | | - | | | Banco de Crédito y Securitización | Leases and/or rights of use | | | - | | | | 19 | | | | - | | | | (80 | ) | | | - | | | | - | | | | - | | | Total Associates | | | | - | | | | 4,856 | | | | (175 | ) | | | (2,486 | ) | | | (18,376 | ) | | | (23,530 | ) | | | (5,225 | ) |
Cresud Sociedad Anónima,
Comercial, Inmobiliaria, Financiera y Agropecuaria
Notes to Consolidated Financial Statements (Continued)
(All amounts in thousands of Argentine Pesos, except shares and per share data and as otherwise indicated)
38. Related party transactions (Continued)
| Related party | Description of transaction | | Trade and other receivables Non-current | | | Trade and other receivables Current | | | Trade and other payables Non-current | | | Trade and other payables Current | | | Borrowings Non-current | | | Borrowings Current | | | Derivative financial instruments | | | Joint Ventures | | | | | | | | | | | | | | | | | | | | | | | | Cresca S.A. | Management fees | | | - | | | | 38 | | | | - | | | | - | | | | - | | | | - | | | | - | | | | Loans granted | | | 96,269 | | | | - | | | | - | | | | - | | | | - | | | | - | | | | - | | | Puerto Retiro S.A. | Contributions to be paid in | | | - | | | | 160 | | | | - | | | | - | | | | - | | | | - | | | | - | | | | Reimbursement of expenses | | | - | | | | 213 | | | | - | | | | - | | | | - | | | | - | | | | - | | | | Financial operations | | | - | | | | 3,23 | | | | - | | | | - | | | | - | | | | - | | | | - | | | Nuevo Puerto Santa Fe S.A. | Reimbursement of expenses | | | - | | | | 223 | | | | - | | | | (72 | ) | | | - | | | | - | | | | - | | | | Borrowings | | | - | | | | - | | | | - | | | | - | | | | - | | | | (71 | ) | | | - | | | | Share-based payments | | | - | | | | 304 | | | | - | | | | - | | | | - | | | | - | | | | - | | | | Leases’ collections | | | - | | | | - | | | | - | | | | (18 | ) | | | - | | | | - | | | | - | | | | Leases and/or rights of use | | | - | | | | - | | | | - | | | | (630 | ) | | | - | | | | - | | | | - | | | | Management fees | | | - | | | | 1,338 | | | | - | | | | - | | | | - | | | | - | | | | - | | | Quality Invest S.A. | Management fees | | | - | | | | 22 | | | | - | | | | (45 | ) | | | - | | | | - | | | | - | | | | Reimbursement of expenses | | | - | | | | 64 | | | | - | | | | - | | | | - | | | | - | | | | - | | | Baicom Networks S.A. | Management fees | | | - | | | | 2 | | | | - | | | | - | | | | - | | | | - | | | | - | | | | Borrowings | | | 1,143 | | | | - | | | | - | | | | - | | | | - | | | | - | | | | - | | | | Contributions to be paid in | | | - | | | | 10 | | | | - | | | | - | | | | - | | | | - | | | | - | | | | Reimbursement of expenses | | | - | | | | 193 | | | | - | | | | - | | | | - | | | | - | | | | - | | | Cyrsa S.A. | Borrowings | | | - | | | | - | | | | - | | | | - | | | | (133,314 | ) | | | - | | | | - | | | | Reimbursement of expenses | | | - | | | | 140 | | | | - | | | | (9 | ) | | | - | | | | - | | | | - | | | Boulevard Norte S.A. | Reimbursement of expenses | | | - | | | | 864 | | | | - | | | | - | | | | - | | | | - | | | | - | | | | Borrowings | | | - | | | | 4 | | | | - | | | | - | | | | - | | | | - | | | | - | | | Entertainment Holding S.A. | Reimbursement of expenses | | | - | | | | 165 | | | | - | | | | - | | | | - | | | | - | | | | - | | | | Borrowings | | | - | | | | 20 | | | | - | | | | - | | | | - | | | | - | | | | - | | | Total Joint Ventures | | | | 97,412 | | | | 6,990 | | | | - | | | | (774 | ) | | | (133,314 | ) | | | (71 | ) | | | - | |
Cresud Sociedad Anónima,
Comercial, Inmobiliaria, Financiera y Agropecuaria
Notes to Consolidated Financial Statements (Continued)
(All amounts in thousands of Argentine Pesos, except shares and per share data and as otherwise indicated)
38. Related party transactions (Continued)
| Related party | Description of transaction | | Trade and other receivables Non-current | | | Trade and other receivables Current | | | Trade and other payables Non-current | | | Trade and other payables Current | | | Borrowings Non-current | | | Borrowings Current | | | Derivative financial instruments | | | Other related parties | | | | | | | | | | | | | | | | | | | | | | | | CAMSA | Advances to be recovered | | | - | | | | 1,468 | | | | - | | | | - | | | | - | | | | - | | | | - | | | | Management fees | | | - | | | | 11,595 | | | | - | | | | (11,098 | ) | | | - | | | | - | | | | - | | | | Reimbursement of expenses | | | - | | | | 4,713 | | | | - | | | | (1 | ) | | | - | | | | - | | | | - | | | Estudio Zang, Bergel & Viñes | Advances | | | - | | | | 4 | | | | - | | | | - | | | | - | | | | - | | | | - | | | | Legal services | | | - | | | | - | | | | - | | | | (739 | ) | | | - | | | | - | | | | - | | | Fundación IRSA | Reimbursement of expenses | | | - | | | | 75 | | | | - | | | | - | | | | - | | | | - | | | | - | | | Inversiones Financieras del Sur S.A. | Financial operations | | | - | | | | 54,724 | | | | | | | | (5 | ) | | | | | | | | | | | | | | Museo de los Niños | Reimbursement of expenses | | | - | | | | 767 | | | | | | | | (9 | ) | | | | | | | | | | | | | | Austral Gold | Reimbursement of expenses | | | - | | | | 8 | | | | - | | | | (1 | ) | | | - | | | | - | | | | - | | | Entretenimiento Universal S.A. | Reimbursement of expenses | | | - | | | | 103 | | | | - | | | | - | | | | - | | | | - | | | | - | | | | Borrowings | | | - | | | | 68 | | | | - | | | | - | | | | - | | | | - | | | | - | | | Ogden Argentina S.A. | Reimbursement of expenses | | | - | | | | 228 | | | | - | | | | - | | | | - | | | | - | | | | - | | | | Borrowings | | | - | | | | 4 | | | | - | | | | - | | | | - | | | | - | | | | - | | | IRSA Real Estate Strategies LP | Capital contribution | | | - | | | | - | | | | - | | | | (8 | ) | | | - | | | | - | | | | - | | | IRSA Developments LP | Capital contribution | | | - | | | | - | | | | - | | | | (13 | ) | | | - | | | | - | | | | - | | | EMP | Management fees | | | - | | | | - | | | | - | | | | (31 | ) | | | - | | | | - | | | | - | | | Total Other related parties | | | | - | | | | 73,757 | | | | - | | | | (11,905 | ) | | | - | | | | - | | | | - | | | Directors and Senior Management | | | | | | | | | | | | | | | | | | | | | | | | | | | | | | | Directors and Senior Management | Fees | | | - | | | | 301 | | | | - | | | | (23,830 | ) | | | - | | | | - | | | | - | | | | Guarantee deposits | | | - | | | | - | | | | (20 | ) | | | - | | | | - | | | | - | | | | - | | | | Reimbursement of expenses | | | - | | | | 96 | | | | - | | | | (10 | ) | | | - | | | | - | | | | - | | | Total Directors and Senior Management | | | | - | | | | 397 | | | | (20 | ) | | | (23,84 | ) | | | - | | | | - | | | | - | | | Total | | | | 97,412 | | | | 86,000 | | | | (195 | ) | | | (39,005 | ) | | | (151,690 | ) | | | (23,601 | ) | | | (5,225 | ) |
Cresud Sociedad Anónima,
Comercial, Inmobiliaria, Financiera y Agropecuaria
Notes to Consolidated Financial Statements (Continued)
(All amounts in thousands of Argentine Pesos, except shares and per share data and as otherwise indicated)
38. Related party transactions (Continued)
The following is a summary of the transactions with related parties for the year ended as of June 30, 2015:
| Related party | | Leases and/or rights to use | | | Administration and management fees | | | Sale of goods and/or services | | | Compensation of Directors and senior management | | | Legal services | | | Financial operations | | | Commissions | | | Donations | | | Associates | | | | | | | | | | | | | | | | | | | | | | | | | | Agro-Uranga S.A. | | | - | | | | - | | | | 7,950 | | | | - | | | | - | | | | - | | | | - | | | | - | | | Tarshop S.A. | | | 9,120 | | | | - | | | | - | | | | - | | | | - | | | | - | | | | 72 | | | | - | | | Banco Crédito y Securitización S.A. | | | 4,459 | | | | - | | | | - | | | | - | | | | - | | | | - | | | | - | | | | - | | | Banco Hipotecario S.A. | | | 2,105 | | | | - | | | | (2 | ) | | | - | | | | - | | | | (15,212 | ) | | | 5 | | | | - | | | Total Associates | | | 15,684 | | | | - | | | | 7,948 | | | | - | | | | - | | | | (15,212 | ) | | | 77 | | | | - | | | Joint Ventures | | | | | | | | | | | | | | | | | | | | | | | | | | | | | | | | | | Cyrsa S.A. | | | - | | | | - | | | | - | | | | - | | | | - | | | | (9,176 | ) | | | - | | | | - | | | Cresca S.A. | | | - | | | | - | | | | 20 | | | | - | | | | - | | | | | | | | - | | | | - | | | Baicom Networks S.A. | | | - | | | | 12 | | | | - | | | | - | | | | - | | | | 150 | | | | - | | | | - | | | Nuevo Puerto Santa Fe S.A. | | | (712 | ) | | | 2,164 | | | | - | | | | - | | | | - | | | | (1,400 | ) | | | - | | | | - | | | Puerto Retiro S.A. | | | - | | | | - | | | | - | | | | - | | | | - | | | | 563 | | | | - | | | | - | | | Quality Invest S.A. | | | - | | | | 216 | | | | - | | | | - | | | | - | | | | - | | | | - | | | | - | | | Entretenimiento Universal S.A. | | | - | | | | - | | | | - | | | | - | | | | - | | | | 13 | | | | - | | | | - | | | Entertainment Holding S.A. | | | - | | | | - | | | | - | | | | - | | | | - | | | | 12 | | | | - | | | | - | | | Total Joint Ventures | | | (712 | ) | | | 2,392 | | | | 20 | | | | - | | | | - | | | | (9,838 | ) | | | - | | | | - | | | Other related parties | | | | | | | | | | | | | | | | | | | | | | | | | | | | | | | | | | CAMSA | | | 342 | | | | (11,401 | ) | | | - | | | | - | | | | - | | | | - | | | | - | | | | | | | Fundación IRSA | | | - | | | | - | | | | - | | | | - | | | | - | | | | - | | | | - | | | | (4,731 | ) | | Estudio Zang, Bergel & Viñes | | | - | | | | - | | | | - | | | | - | | | | (4,663 | ) | | | - | | | | - | | | | - | | | Hamonet S.A. | | | (425 | ) | | | - | | | | - | | | | - | | | | - | | | | - | | | | - | | | | - | | | Austral Gold Argentina S.A. | | | - | | | | 418 | | | | - | | | | - | | | | - | | | | - | | | | - | | | | - | | | Fibesa S.A. | | | - | | | | - | | | | - | | | | - | | | | - | | | | - | | | | - | | | | - | | | Isaac Elsztain e Hijos S.C.A. | | | (813 | ) | | | - | | | | - | | | | - | | | | - | | | | - | | | | - | | | | - | | | Boulevard Norte S.A. | | | - | | | | - | | | | - | | | | - | | | | - | | | | 1 | | | | - | | | | - | | | Ogden Argentina S.A. | | | - | | | | - | | | | - | | | | - | | | | - | | | | 20 | | | | - | | | | - | | | Condor Hospitality Trust Inc. (formerly Supertel Hospitality Inc. due to change of corporate name) | | | - | | | | - | | | | - | | | | - | | | | - | | | | 161,002 | | | | - | | | | - | | | Inversiones Financieras del Sur S.A. | | | - | | | | - | | | | - | | | | - | | | | - | | | | 227,467 | | | | - | | | | - | | | Total Other related parties | | | (896 | ) | | | (10,983 | ) | | | - | | | | - | | | | (4,663 | ) | | | 388,490 | | | | - | | | | (4,731 | ) | | Directors and Senior Management | | | | | | | | | | | | | | | | | | | | | | | | | | | | | | | | | | Directors | | | - | | | | - | | | | - | | | | (133,967 | ) | | | - | | | | - | | | | - | | | | - | | | Senior Management | | | - | | | | - | | | | - | | | | (11,389 | ) | | | - | | | | - | | | | - | | | | - | | | Total Directors and Senior Management | | | - | | | | - | | | | - | | | | (145,356 | ) | | | - | | | | - | | | | - | | | | - | | | Total | | | 14,076 | | | | (8,591 | ) | | | 7,968 | | | | (145,356 | ) | | | (4,663 | ) | | | 363,440 | | | | 77 | | | | (4,731 | ) |
| Related party | | Leases and/or rights to use | | Administration and management fees | | Sale of goods and/or services | | Compensation of Directors and senior management | | Legal services | | Financial operations | | Commissions | | Donations | | Associates | | | | | | | | | | | | | | | | | | Agro-Uranga S.A. | | - | | - | | 8 | | - | | - | | - | | - | | - | | Tarshop | | 9 | | - | | - | | - | | - | | - | | - | | - | | BACS | | 4 | | - | | - | | - | | - | | - | | - | | - | | BHSA | | 2 | | - | | - | | - | | - | | (15) | | - | | - | | Total Associates | | 15 | | - | | 8 | | - | | - | | (15) | | - | | - | | Joint Ventures | | | | | | | | | | | | | | | | | | Cyrsa | | - | | - | | - | | - | | - | | (9) | | - | | - | | NPSF | | (1) | | 2 | | - | | - | | - | | (1) | | - | | - | | Puerto Retiro | | - | | - | | - | | - | | - | | 1 | | - | | - | | Total Joint Ventures | | (1) | | 2 | | - | | - | | - | | (9) | | - | | - | | Other related parties | | | | | | | | | | | | | | | | | | CAMSA | | - | | (11) | | - | | - | | - | | - | | - | | | | Fundación IRSA | | - | | - | | - | | - | | - | | - | | - | | (5) | | Estudio Zang, Bergel & Viñes | | - | | - | | - | | - | | (5) | | - | | - | | - | | Isaac Elsztain e Hijos S.C.A. | | (1) | | - | | - | | - | | - | | - | | - | | - | | Condor | | - | | - | | - | | - | | - | | 161 | | - | | - | | IFISA | | - | | - | | - | | - | | - | | 227 | | - | | - | | Total Other related parties | | (1) | | (11) | | - | | - | | (5) | | 388 | | - | | (5) | | Directors and Senior Management | | | | | | | | | | | | | | | | | | Directors | | - | | - | | - | | (134) | | - | | - | | - | | - | | Senior Management | | - | | - | | - | | (11) | | - | | - | | - | | - | | Total Directors and Senior Management | | - | | - | | - | | (145) | | - | | - | | - | | - | | Total | | 13 | | (9) | | 8 | | (145) | | (5) | | 364 | | - | | (5) |
Cresud Sociedad Anónima, Comercial, Inmobiliaria, Financiera y Agropecuaria
Notes to the Consolidated Financial Statements(Continued) (All amounts in thousandsmillions of Argentine Pesos, except shares and per share data and as otherwise indicated)
38.35. Related party transactions(Continued)
The following is a summary of the transactions with related parties for the year ended as of June 30, 2014:
| Related party | | Leases and/or rights to use | | | Administration and management fees | | | Sale of goods and/or services | | | Compensation of Directors and senior management | | | Legal services | | | Financial operations | | | Donations | | | Leases and/or rights to use | | Administration and management fees | | Sale of goods and/or services | | Compensation of Directors and senior management | | Legal services | | Financial operations | | Donations | | Associates | | | | | | | | | | | | | | | | | | | | | | | | | | | | | | | | | | | | | Agro-Uranga S.A. | | | - | | | | - | | | | 8,365 | | | | - | | | | - | | | | - | | | | - | | | - | | - | | 8 | | - | | - | | - | | - | | Tarshop S.A. | | | 8,172 | | | | (239 | ) | | | - | | | | - | | | | - | | | | - | | | | - | | | | Banco Crédito y Securitización S.A. | | | 1,544 | | | | - | | | | - | | | | - | | | | - | | | | - | | | | - | | | | Banco Hipotecario S.A. | | | 560 | | | | - | | | | - | | | | - | | | | - | | | | 25,966 | | | | - | | | | Tarshop | | | 8 | | - | | - | | - | | - | | - | | - | | BACS | | | 2 | | - | | - | | - | | - | | - | | - | | BHSA | | | 1 | | - | | - | | - | | - | | 26 | | - | | Total Associates | | | 10,276 | | | | (239 | ) | | | 8,365 | | | | - | | | | - | | | | 25,966 | | | | - | | | 11 | | - | | 8 | | - | | - | | 26 | | - | | Joint Ventures | | | | | | | | | | | | | | | | | | | | | | | | | | | | | | | | | | | | | | | | | | | | Cyrsa S.A. | | | - | | | | - | | | | - | | | | - | | | | - | | | | (20,897 | ) | | | - | | | | Cyrsa | | | - | | - | | - | | - | | - | | (21) | | - | | Cresca S.A. | | | - | | | | 46 | | | | 77 | | | | - | | | | - | | | | 2,216 | | | | - | | | - | | - | | - | | - | | - | | 2 | | - | | Baicom Networks S.A. | | | - | | | | 12 | | | | - | | | | - | | | | - | | | | 136 | | | | - | | | | Nuevo Puerto Santa Fe S.A. | | | (632 | ) | | | 1,124 | | | | - | | | | - | | | | - | | | | - | | | | - | | | | Puerto Retiro S.A. | | | - | | | | - | | | | - | | | | - | | | | - | | | | 917 | | | | - | | | | Quality Invest S.A. | | | - | | | | 216 | | | | - | | | | - | | | | - | | | | - | | | | - | | | | Canteras Natal Crespo S.A. | | | - | | | | - | | | | - | | | | - | | | | - | | | | - | | | | - | | | | NPSF | | | (1) | | 1 | | - | | - | | - | | - | | - | | Puerto Retiro | | | - | | - | | - | | - | | - | | 1 | | - | | Total Joint Ventures | | | (632 | ) | | | 1,398 | | | | 77 | | | | - | | | | - | | | | (17,628 | ) | | | - | | | (1) | | 1 | | - | | - | | - | | (18) | | - | | Other related parties | | | | | | | | | | | | | | | | | | | | | | | | | | | | | | | | | | | | | | | | | | | | CAMSA | | | - | | | | 230 | | | | 2 | | | | - | | | | - | | | | - | | | | - | | | | Fundación IRSA | | | - | | | | - | | | | 1 | | | | - | | | | - | | | | - | | | | (3,325 | ) | | - | | - | | - | | - | | - | | - | | (3) | | Estudio Zang, Bergel & Viñes | | | - | | | | - | | | | - | | | | - | | | | (4,193 | ) | | | - | | | | - | | | - | | - | | - | | - | | (4) | | - | | - | | Hamonet S.A. | | | (400 | ) | | | - | | | | - | | | | - | | | | - | | | | - | | | | - | | | | Austral Gold Argentina S.A. | | | - | | | | - | | | | 1 | | | | - | | | | - | | | | - | | | | - | | | | Fibesa S.A. | | | - | | | | - | | | | 2 | | | | - | | | | - | | | | - | | | | - | | | | Isaac Elsztain e Hijos S.C.A. | | | (769 | ) | | | - | | | | - | | | | - | | | | - | | | | - | | | | - | | | (1) | | - | | - | | - | | - | | - | | - | | Consorcio de Propietarios Edificios Avda.. del Libertador 498 | | | - | | | | - | | | | 1 | | | | - | | | | - | | | | - | | | | - | | | | Inversiones Financieras del Sur S.A. | | | - | | | | - | | | | - | | | | - | | | | - | | | | 21,911 | | | | - | | | | IFISA | | | - | | - | | - | | - | | - | | 22 | | - | | Total Other related parties | | | (1,169 | ) | | | 230 | | | | 7 | | | | - | | | | (4,193 | ) | | | 21,911 | | | | (3,325 | ) | | (1) | | - | | - | | - | | (4) | | 22 | | (3) | | Directors and Senior Management | | | | | | | | | | | | | | | | | | | | | | | | | | | | | | | | | | | | | | | | | | | | Directors | | | - | | | | - | | | | - | | | | (124,207 | ) | | | - | | | | - | | | | - | | | - | | - | | - | | (124) | | - | | - | | - | | Senior Management | | | - | | | | - | | | | - | | | | (30,143 | ) | | | - | | | | - | | | | - | | | - | | - | | - | | (30) | | - | | - | | - | | Total Directors and Senior Management | | | - | | | | - | | | | - | | | | (154,350 | ) | | | - | | | | - | | | | - | | | - | | - | | - | | (154) | | - | | - | | - | | Total | | | 8,475 | | | | 1,389 | | | | 8,449 | | | | (154,350 | ) | | | (4,193 | ) | | | 30,249 | | | | (3,325 | ) | | 9 | | 1 | | 8 | | (154) | | (4) | | 30 | | (3) |
Cresud Sociedad Anónima, Comercial, Inmobiliaria, Financiera y Agropecuaria
Notes to the Consolidated Financial Statements(Continued) (All amounts in thousandsmillions of Argentine Pesos, except shares and per share data and as otherwise indicated)
38. Related party transactions (Continued)
The following is a summary of the transactions with related parties for the year ended as of June 30, 2013:
| Related party | | Leases and/or rights to use | | | Administration and management fees | | | Sale of goods and/or services | | | Corporate services | | | Compensation of Directors and senior management | | | Legal services | | | Financial operations | | | Donations | | | Associates | | | | | | | | | | | | | | | | | | | | | | | | | | Agro-Uranga S.A. | | | - | | | | - | | | | 6,154 | | | | - | | | | - | | | | - | | | | - | | | | - | | | Tarshop S.A. | | | 5,991 | | | | - | | | | - | | | | 301 | | | | - | | | | - | | | | - | | | | - | | | Banco Hipotecario S.A. | | | 453 | | | | - | | | | - | | | | - | | | | - | | | | - | | | | (1,378 | ) | | | - | | | Total Associates | | | 6,444 | | | | - | | | | 6,154 | | | | 301 | | | | - | | | | - | | | | (1,378 | ) | | | - | | | Joint Ventures | | | | | | | | | | | | | | | | | | | | | | | | | | | | | | | | | | Cyrsa S.A. | | | - | | | | 4,681 | | | | - | | | | - | | | | - | | | | - | | | | (8,724 | ) | | | - | | | Cresca S.A. | | | - | | | | 1,108 | | | | - | | | | - | | | | - | | | | - | | | | 510 | | | | - | | | Baicom Networks S.A. | | | - | | | | - | | | | - | | | | - | | | | - | | | | - | | | | 96 | | | | - | | | Nuevo Puerto Santa Fe S.A. | | | (111 | ) | | | 888 | | | | - | | | | - | | | | - | | | | - | | | | - | | | | - | | | Puerto Retiro S.A. | | | - | | | | - | | | | - | | | | - | | | | - | | | | - | | | | 481 | | | | - | | | Quality Invest S.A. | | | - | | | | 216 | | | | - | | | | - | | | | - | | | | - | | | | 28 | | | | - | | | Canteras Natal Crespo S.A. | | | - | | | | 96 | | | | - | | | | - | | | | - | | | | - | | | | 11 | | | | - | | | Total Joint Ventures | | | (111 | ) | | | 6,989 | | | | - | | | | - | | | | - | | | | - | | | | (7,598 | ) | | | - | | | Other related parties | | | | | | | | | | | | | | | | | | | | | | | | | | | | | | | | | | Inversiones Financieras del Sur S.A. | | | - | | | | - | | | | - | | | | - | | | | - | | | | - | | | | 8,758 | | | | - | | | Fundación IRSA | | | - | | | | - | | | | - | | | | - | | | | - | | | | - | | | | - | | | | (1,420 | ) | | Estudio Zang, Bergel & Viñes | | | - | | | | - | | | | - | | | | - | | | | - | | | | (3,285 | ) | | | - | | | | - | | | CAMSA | | | - | | | | (5,736 | ) | | | - | | | | - | | | | - | | | | - | | | | - | | | | - | | | Dolphin Fund PLC (i) | | | - | | | | - | | | | - | | | | - | | | | - | | | | - | | | | (117,576 | ) | | | - | | | Hamonet S.A. | | | (365 | ) | | | - | | | | - | | | | - | | | | - | | | | - | | | | - | | | | - | | | Isaac Elsztain e Hijos S.C.A. | | | (468 | ) | | | - | | | | - | | | | - | | | | - | | | | - | | | | - | | | | - | | | Total Other related parties | | | (833 | ) | | | (5,736 | ) | | | - | | | | - | | | | - | | | | (3,285 | ) | | | (108,818 | ) | | | (1,420 | ) | | Directors and Senior Management | | | | | | | | | | | | | | | | | | | | | | | | | | | | | | | | | | Directors | | | - | | | | - | | | | - | | | | - | | | | (82,060 | ) | | | - | | | | - | | | | - | | | Senior Management | | | - | | | | - | | | | - | | | | - | | | | (12,288 | ) | | | - | | | | - | | | | - | | | Total Directors and Senior Management | | | - | | | | - | | | | - | | | | - | | | | (94,348 | ) | | | - | | | | - | | | | - | | | Total | | | 5,500 | | | | 1,253 | | | | 6,154 | | | | 301 | | | | (94,348 | ) | | | (3,285 | ) | | | (117,794 | ) | | | (1,420 | ) |
36. Cost of sales and services provided Cresud Sociedad Anónima,
Comercial, Inmobiliaria, Financiera y Agropecuaria
Notes to Consolidated Financial Statements (Continued)
(All amounts in thousands of Argentine Pesos, except shares and per share data and as otherwise indicated)
39. CNV General Resolution N° 622
As required by Section 1°, Chapter III, Title IV of CNV General Resolution N° 622, below there is a detail of the notes to the Separate Financial Statements that disclosure the information required by the Resolution in Exhibits.| Description | Biological assets | Inventories | Agricultural services | Services and other operating costs | Trading properties | Hotels | Mobile phones | Supermarkets | Properties | Others | Total as of 06.30.16 | Total as of 06.30.15 | Total as of 06.30.14 | | Inventories as of 06.30.15 | 407 | 485 | - | - | 133 | 7 | - | - | - | - | 1,032 | (i) 909 | (ii) 583 | | | | | | | | | | | | | | | | | Acquisition for business combination | - | - | - | - | - | - | 220 | 1,675 | 2,680 | - | 4,575 | - | - | | Initial recognition and changes in the fair value of biological assets and agricultural produce at the point of harvest | 267 | (95) | - | - | - | - | - | - | - | - | 172 | 182 | 140 | | | | | | | | | | | | | | | | | Changes in the net realizable value of agricultural produce after harvest | - | 208 | - | - | - | - | - | - | - | - | 208 | (34) | (17) | | | | | | | | | | | | | | | | | Decrease due to harvest | - | 1,247 | - | - | - | - | - | - | - | - | 1,247 | 1,228 | 1,029 | | Acquisitions and classifications | 32 | 1,501 | - | - | - | - | 1,233 | 13,304 | 191 | - | 16,261 | 1,255 | 1,144 | | Consume | (1) | (617) | - | - | - | - | - | - | - | - | (618) | (605) | (517) | | Additions | - | - | - | - | 71 | - | - | - | 354 | - | 425 | 1 | 13 | | Impairments | - | - | - | - | - | - | - | - | (158) | - | (158) | - | - | | Disposals | - | - | - | - | (2) | 1 | - | - | - | - | (1) | (1) | (12) | | Transfers | | | | | | | | | | | | 3 | - | | Expenses incurred | - | 118 | 81 | 1,645 | 15 | 361 | 3,292 | 621 | 644 | 1,224 | 8,001 | 1,666 | 1,495 | | Exchange difference | - | (68) | - | - | 49 | - | 107 | 1,214 | 1,580 | 4 | 2,886 | (46) | (11) | | Inventories as of 06.30.16 | (567) | (650) | - | - | (251) | (8) | (327) | (2,888) | (4,462) | (27) | (9,180) | (iv) (1,030) | (907) | | Costs as of 06.30.16 | 138 | 2,129 | 81 | 1,645 | 15 | 361 | 4,525 | 13,926 | 829 | 1,201 | 24,850 | - | - | | Costs as of 06.30.15 | 128 | 1,825 | 59 | 1,224 | 14 | 278 | | | | - | - | 3,528 | - | | Costs as of 06.30.14 | 76 | 1,444 | 54 | 1,130 | 19 | 216 | | | | 1 | - | | 2,940 |
Exhibit A - Property, plant and equipment | | Note 10 - Investment properties | | | Note 11 - Property, plant and equipment | Exhibit B - Intangible assets | | Note 13 - Intangible assets | Exhibit C - Equity investments | | Note 8 and 9 - Investments in associates and joint ventures | Exhibit D - Other investments | | Note 16 - Financial instruments by category | | | Note 17 - Restricted assets | Exhibit E - Provisions | | Note 18 - Trade and other receivables | | | Note 24 – Provisions | Exhibit F - Cost of sale and services | | Note 40 - Cost of sales and services provided | Exhibit G - Foreign currency assets and liabilities | | Note 41 - Foreign currency assets and liabilities | | | |
Cresud Sociedad Anónima,
Comercial, Inmobiliaria, Financiera y Agropecuaria
Notes to Consolidated Financial Statements (Continued)
(All amounts in thousands of Argentine Pesos, except shares and per share data and as otherwise indicated)
40. | Cost of sales and services provided |
| | | Agricultural business | | | Urban properties and investments business | | | | | | | | | | | | Description | | Biological assets | | | Inventories | | | Agricultural services | | | Subtotal Agricultural business | | | Services and other operating costs | | | Trading properties | | | Hotels | | | Others | | | Subtotal Urban properties and investments business | | | Total as of 06.30.15 | | | Total as of 06.30.14 | | | Total as of 06.30.13 | | | Inventories as of 06.30.14 | | | 345,771 | | | | 420,387 | | | | - | | | | 766,158 | | | | - | | | | 137,151 | | | | 6,011 | | | | - | | | | 143,162 | | | (i) 909,320 | | | (ii) 582,555 | | | (iii) 555,022 | | | | | | | | | | | | | | | | | | | | | | | | | | | | | | | | | | | | | | | | | | | | | | | | | | Initial recognition and changes in the fair value of biological assets and agricultural produce at the point of harvest | | | 174,787 | | | | 7,388 | | | | - | | | | 182,175 | | | | - | | | | - | | | | - | | | | - | | | | - | | | | 182,175 | | | | 140,014 | | | | 62,992 | | | | | | | | | | | | | | | | | | | | | | | | | | | | | | | | | | | | | | | | | | | | | | | | | | | | | Changes in the net realizable value of agricultural produce after harvest | | | - | | | | (34,471 | ) | | | - | | | | (34,471 | ) | | | - | | | | - | | | | - | | | | - | | | | - | | | | (34,471 | ) | | | (17,447 | ) | | | 11,756 | | | | | | | | | | | | | | | | | | | | | | | | | | | | | | | | | | | | | | | | | | | | | | | | | | | | | Decrease due to harvest | | | - | | | | 1,227,881 | | | | - | | | | 1,227,881 | | | | - | | | | - | | | | - | | | | - | | | | - | | | | 1,227,881 | | | | 1,028,868 | | | | 752,820 | | | Acquisitions and classifications | | | 14,203 | | | | 1,240,496 | | | | - | | | | 1,254,699 | | | | - | | | | - | | | | - | | | | - | | | | - | | | | 1,254,699 | | | | 1,144,268 | | | | 658,392 | | | Consume | | | (753 | ) | | | (604,107 | ) | | | - | | | | (604,860 | ) | | | - | | | | - | | | | - | | | | - | | | | - | | | | (604,860 | ) | | | (517,144 | ) | | | (387,332 | ) | | Additions | | | - | | | | - | | | | - | | | | - | | | | - | | | | 1,067 | | | | - | | | | - | | | | 1,067 | | | | 1,067 | | | | 13,252 | | | | 3,091 | | | Disposals | | | - | | | | - | | | | - | | | | - | | | | - | | | | (1,898 | ) | | | 1,328 | | | | - | | | | (570 | ) | | | (570 | ) | | | (12,146 | ) | | | (5,948 | ) | | Transfers | | | - | | | | - | | | | - | | | | - | | | | - | | | | 3,107 | | | | - | | | | - | | | | 3,107 | | | | 3,107 | | | | - | | | | - | | | Expenses incurred | | | - | | | | 91,208 | | | | 59,235 | | | | 150,443 | | | | 1,224,264 | | | | 13,587 | | | | 277,471 | | | | 56 | | | | 1,515,378 | | | | 1,665,821 | | | | 1,494,730 | | | | 1,166,340 | | | Exchange difference | | | - | | | | (39,698 | ) | | | - | | | | (39,698 | ) | | | - | | | | (6,126 | ) | | | - | | | | - | | | | (6,126 | ) | | | (45,824 | ) | | | (11,245 | ) | | | 33,704 | | | Inventories as of 06.30.15 | | | (405,842 | ) | | | (483,922 | ) | | | - | | | | (889,764 | ) | | | - | | | | (132,954 | ) | | | (6,926 | ) | | | - | | | | (139,880 | ) | | (iv) (1,029,644) | | | | (906,962 | ) | | | (582,555 | ) | | Costs as of 06.30.15 | | | 128,166 | | | | 1,825,162 | | | | 59,235 | | | | 2,012,563 | | | | 1,224,264 | | | | 13,934 | | | | 277,884 | | | | 56 | | | | 1,516,138 | | | | 3,528,701 | | | | - | | | | - | | | Costs as of 06.30.14 | | | 75,900 | | | | 1,444,441 | | | | 54,284 | | | | 1,574,625 | | | | 1,128,794 | | | | 18,971 | | | | 215,980 | | | | 373 | | | | 1,364,118 | | | | - | | | | 2,938,743 | | | | - | | | Costs as of 06.30.13 | | | 73,387 | | | | 1,062,644 | | | | 35,014 | | | | 1,171,045 | | | | 915,701 | | | | 12,347 | | | | 168,282 | | | | 907 | | | | 1,097,237 | | | | - | | | | | | | | 2,268,282 | |
(i) Includes Ps. (13,373)(13) corresponding to materials of IRSA and FYO and Ps. (2,358)(2) of meet due for slaughtering of Cactus as of June 30, 2014. (ii) Includes Ps. (10,358)(10) corresponding to materials and inputs of IRSA as of June 30, 2013. (iii) Includes Ps. (10,867)(11) corresponding to materials and inputs of IRSA as of June 30, 2012. (iv) Includes Ps. (18,056)(18) corresponding to materials and inputs of IRSA and FYO and Ps. (2,446)(2) of meet due for slaughtering of SACPSA as of June 30, 2015. Does not include Ps. 6900.7 corresponding to fattening.
Cresud Sociedad Anónima, Comercial, Inmobiliaria, Financiera y Agropecuaria
Notes to the Consolidated Financial Statements(Continued) (All amounts in thousandsmillions of Argentine Pesos, except shares and per share data and as otherwise indicated)
41. | Foreign currency assets and liabilities |
37.
Foreign currency assets and liabilities
Book amounts of foreign currency assets and liabilities are as follows:
| Items (3) | | Amount of foreign currency (2) | | | Prevailing exchange rate (1) | | | Total as of 06.30.15 | | | Amount of foreign currency (2) | | | Prevailing exchange rate (1) | | | Total as of 06.30.14 | | | Amount of foreign currency (2) | | Prevailing exchange rate (1) | | Total as of 06.30.16 | | Amount of foreign currency (2) | | Prevailing exchange rate (1) | | Total as of 06.30.15 | | Assets | | | | | | | | | | | | | | | | | | | | | | | | | | | | | | | | Restricted assets | | | | | | | | | | | | | | | | | | | | | US Dollar | | | - | | | | - | | | | - | | | | 6,372 | | | | 8.033 | | | | 51,189 | | | | Total restricted assets | | | | | | | | | | | - | | | | | | | | | | | | 51,189 | | | | Trade and other receivables | | | | | | | | | | | | | | | | | | | | | | | | | | | | | | | | | | | | | | Uruguayan Peso | | | 1,193 | | | | 0.335 | | | | 400 | | | | 1,162 | | | | 0.356 | | | | 414 | | | 3 | | 0.334 | | 1 | | - | | 0.335 | | - | | US Dollar | | | 29,288 | | | | 8.988 | | | | 263,241 | | | | 29,646 | | | | 8.033 | | | | 238,144 | | | 43 | | 14.940 | | 637 | | 29 | | 8.988 | | 263 | | Euros | | | 0.2998 | | | | 10.005 | | | | 3 | | | | 2 | | | | 10.991 | | | | 26 | | | 12 | | 16.492 | | 195 | | - | | 10.005 | | - | | Swiss francs | | | - | | | | - | | | | - | | | | 27 | | | | 9.051 | | | | 242 | | | | Trade and other receivables related parties | | | | | | | | | | | | | | | | | | | | | | | | | | | | | | | | | | | | | | US Dollar | | | 10,284 | | | | 9.088 | | | | 93,463 | | | | - | | | | - | | | | - | | | 42 | | 15.040 | | 635 | | 10 | | 9.088 | | 93 | | Total trade and other receivables | | | | | | | | | | | 357,107 | | | | | | | | | | | | 238,826 | | | | | | | 1,468 | | | | | | 356 | | Investment in financial assets | | | | | | | | | | | | | | | | | | | | | | | | | | | | | | | | | | | | | | US Dollar | | | 26,618 | | | | 8.988 | | | | 239,246 | | | | 67,062 | | | | 8.033 | | | | 538,710 | | | 166 | | 14.940 | | 2,477 | | 27 | | 8.988 | | 240 | | New Israel Shekel | | | 2,642 | | | | 2.407 | | | | 6,361 | | | | 5 | | | | 2.377 | | | | 13 | | | - | | - | | - | | 3 | | 2.407 | | 6 | | Uruguayan Peso | | | 721 | | | | 14.134 | | | | 10,196 | | | | 39,905 | | | | 0.356 | | | | 14,206 | | | | Pounds | | | 1 | | 19.763 | | 19 | | 1 | | 14.134 | | 10 | | Investment in financial assets | | | | | | | | | | | | | | | US Dollar | | | 33 | | 14.940 | | 499 | | | | | | - | | Total Investment in financial assets | | | | | | | | | | | 255,803 | | | | | | | | | | | | 552,929 | | | | | | | 2,995 | | | | | | 256 | | Derivative financial instruments | | | | | | | | | | | | | | | | | | | | | | | | | | | | | | | | | | | | | | US Dollar | | | 1,145 | | | | 8.988 | | | | 10,294 | | | | 3,839 | | | | 8.033 | | | | 30,841 | | | 1 | | 14.940 | | 15 | | 1 | | 8.988 | | 10 | | New Israel Shekel | | | 94,880 | | | | 2.407 | | | | 228,415 | | | | | | | | | | | | | | | - | | - | | - | | 95 | | 2.407 | | 228 | | Financial instruments related parties | | | | | | | | | | | | | | | | | | | | | | | | | | | | | | | | | | | | | | US Dollar | | | 3,169 | | | | 9.088 | | | | 28,798 | | | | | | | | | | | | | | | - | | - | | - | | 3 | | 9.088 | | 29 | | Total Derivative financial instruments | | | | | | | | | | | 267,507 | | | | | | | | | | | | 30,841 | | | | Total derivative financial instruments | | | | | | | 15 | | | | | | 267 | | Cash and cash equivalents | | | | | | | | | | | | | | | | | | | | | | | | | | | | | | | | | | | | | | Uruguayan Peso | | | 54 | | | | 0.335 | | | | 18 | | | | 101 | | | | 0.356 | | | | 36 | | | - | | - | | - | | - | | 0.335 | | - | | US Dollar | | | 38,775 | | | | 8.988 | | | | 348,509 | | | | 19,605 | | | | 8.033 | | | | 157,484 | | | 84 | | 14.940 | | 1,260 | | 39 | | 8.988 | | 349 | | Euros | | | 114 | | | | 10.005 | | | | 1,140 | | | | 121 | | | | 10.991 | | | | 1,329 | | | 4 | | 16.492 | | 60 | | - | | 10.005 | | 1 | | Swiss francs | | | - | | | | 9.728 | | | | 1 | | | | 1 | | | | 9.051 | | | | 1 | | | | New Israel Shekel | | | 957 | | | | 2.407 | | | | 2,304 | | | | 116,210 | | | | 2.377 | | | | 276,235 | | | - | | - | | - | | 1 | | 2.407 | | 2 | | Pounds | | | 2 | | | | 14.134 | | | | 32 | | | | 2 | | | | 13.913 | | | | 32 | | | | Yenes | | | 41 | | | | - | | | | 3 | | | | 2 | | | | 2.377 | | | | 4 | | | | Brazilian Reais | | | 12 | | | | 3.000 | | | | 35 | | | | 3 | | | | 3.550 | | | | 9 | | | | Total Cash and cash equivalents | | | | | | | | | | | 352,042 | | | | | | | | | | | | 435,130 | | | | | | | 1,320 | | | | | | 352 |
Cresud Sociedad Anónima, Comercial, Inmobiliaria, Financiera y Agropecuaria
Notes to the Consolidated Financial Statements(Continued) (All amounts in thousandsmillions of Argentine Pesos, except shares and per share data and as otherwise indicated)
41. | Foreign currency assets and liabilities 37. Foreign currency assets and liabilities (Continued)(Continued)
|
| Items (3) | | Amount of foreign currency (2) | | | Prevailing exchange rate (1) | | | Total as of 06.30.15 | | | Amount of foreign currency (2) | | | Prevailing exchange rate (1) | | | Total as of 06.30.14 | | | Amount of foreign currency (2) | | Prevailing exchange rate (1) | | Total as of 06.30.16 | | Total as of 06.30.15 | | Prevailing exchange rate (1) | | Amount of foreign currency (2) | | Liabilities | | | | | | | | | | | | | | | | | | | | | | | | | | | | | | | | Trade and other payables | | | | | | | | | | | | | | | | | | | | | | | | | | | | | | | | Uruguayan Peso | | | 99 | | | | 0.334 | | | | 33 | | | | 1,520 | | | | 0.382 | | | | 580 | | | | New Israel Shekel | | | 2 | | 3.892 | | 7 | | - | | - | | - | | US Dollar | | | 13,007 | | | | 9.088 | | | | 118,212 | | | | 18,030 | | | | 8.133 | | | | 146,635 | | | 100 | | 15.040 | | 1,502 | | 13 | | 9.088 | | 118 | | Euros | | | 0.39 | | | | 10.140 | | | | 4 | | | | 1 | | | | 11.148 | | | | 3 | | | 3 | | 16.640 | | 54 | | - | | - | | - | | Trade and other payables related parties | | | | | | | | | | | | | | | | | | | | | | | | | | | | | | | | | | | | | | US Dollar | | | 4 | | | | 9.088 | | | | 34 | | | | | | | | | | | | | | | 2 | | 15.040 | | 31 | | - | | - | | - | | Total trade and other payables | | | | | | | | | | | 118,283 | | | | | | | | | | | | 147,218 | | | | | | | 1,594 | | | | | | 118 | | Borrowings | | | | | | | | | | | | | | | | | | | | | | | | | | | | | | | | | | | | | | US Dollar | | | 616,036 | | | | 9.088 | | | | 5,598,537 | | | | 712,773 | | | | 8.133 | | | | 5,796,986 | | | 1,945 | | 15.040 | | 29,246 | | 616 | | 9.088 | | 5,598 | | Total borrowings | | | | | | | | | | | 5,598,537 | | | | | | | | | | | | 5,796,986 | | | | | | | 29,246 | | | | | | 5,598 | | Derivative financial instruments | | | | | | | | | | | | | | | | | | | | | | | | | | | | | | | | | | | | | | US Dollar | | | 944 | | | | 9.088 | | | | 8,580 | | | | - | | | | - | | | | - | | | 1 | | 15.040 | | 19 | | 1 | | 9.088 | | 9 | | Brazilian Reais | | | - | | | | - | | | | - | | | | 204 | | | | 3.69 | | | | 753 | | | | New Israel Shekel | | | 208,825 | | | | 2.407 | | | | 502,641 | | | | 134,984 | | | | 2.377 | | | | 320,847 | | | - | | - | | - | | 210 | | 2.3809 | | 500 | | Total Derivative financial instruments | | | | | | | | | | | 511,221 | | | | | | | | | | | | 321,600 | | | | Provisions | | | | | | | | | | | | | | | | | | | | | | | | | | | US Dollar | | | 10 | | | | 9.088 | | | | 91 | | | | 200 | | | | 8.133 | | | | 1,627 | | | | Total provisions | | | | | | | | | | | 91 | | | | | | | | | | | | 1,627 | | | | Total derivative financial instruments | | | | | | | 19 | | | | | | 509 |
| Exchange rate as of June 30, 2015 and 2014 according to Banco Nación Argentina records. |
(2) | Considering foreign currencies those that differ from each Company’s functional currency at each year-end. |
Exchange rate as of June 30, 2016 and 2015 according to Banco Nación Argentina records.(3) | The Company uses derivative instruments as complement in order to reduce its exposure to exchange rate movements. See Note 20. |
(2)
Considering foreign currencies those that differ from each Group’s functional currency at each year-end.
(3) The Group uses derivative instruments as complement in order to reduce its exposure to exchange rate movements. See Note 19. 38. Negative working capital At the end of the year, the Group carried a working capital deficit of Ps. 478 whose treatment is being considered by the Board of Directors and the respective Management. ●Sale of farmlands On July 5, 2016, Cresud has sold the field “El Invierno” and “La Esperanza” of 2,615 hectares of agricultural activity located in “Rancul”, province of La Pampa. The total amount of the transaction was fixed at US$ 6 million (equivalents to Ps. 90.1), US$ 5 million (equivalents to Ps. 75.1) of which have been paid while the remaining balance of US$ 1 million (equivalents to Ps. 15) – secured by a mortgage on the property – will be paid in five equal, consecutive, annual installments, with the last being due in August 2021. The estimated gain is Ps. 78.5 and has been recorded in the first quarter of the fiscal year 2017. Cresud Sociedad Anónima, Comercial, Inmobiliaria, Financiera y Agropecuaria
Notes to the Consolidated Financial Statements(Continued) (All amounts in thousandsmillions of Argentine Pesos, except shares and per share data and as otherwise indicated)
39.
Subsequent events (Continued)
●Acquisition of equity interest in EHSA On July 6, 2016, the Group through IRSA CP acquired from FEG Entretenimientos S.A. a 25% shareholding in EHSA. The transaction amount for the acquisition was set at Ps. 66.5, 50% of the amount has already been paid while the remaining balance will be paid down in two equal installments payable within 60 and 90 days. Later, the Group generally enters into barter transactions with third party developerssold a 5% of the shares in the ordinary coursesum of business. By virtuePs. 13.45. A 50% of these transactions, the Group generally exchanges undeveloped plots of land for properties tothat amount has already been received. The remaining balance will be developed and received in two equal installments within 60 and 90 days. As a result, IRSA CP holds 70% of the future. Following is a descriptionvoting stock of pending transactions that have not yet been perfected by the third parties asEHSA, company whose main asset consists of June 30, 2015:an indirect interest of 25% in LRSA.
Caballito plot●Sale of landunits in Intercontinental Building
On JuneJuly 29, 2011, the Group2016, IRSA Propiedades Comerciales executed a bill of sale for 1,702 square meters corresponding to two office floors and TGLT, entered into an agreement to barter a plot of land located in Méndez de Andes street16 parking units in the neighborhood of Caballito in the city of Buenos Aires for cash and future residential apartmentsIntercontinental Plaza building to be constructed by TGLT on the mentioned land.an unrelated party. The transaction amount was agreed upon at US$ 12.86.01 million: the sum of US$ 1.60 million has already been paid, while the remaining balance will be paid upon execution of the deed of conveyance and delivery of possession. ●IRSA Non-convertible notes Classes VII and VIII On September 1, 2016, Non-Convertible Notes Class VII and VIII were tendered under the Program approved by the Shareholders’ Meeting for up to US$ 300 million. TGLT plans to constructThe settlement took place on September 8, 2016. The results of the offer are shown below: Non-convertible notes Class VII for an apartment building with residential offices and parking space. In consideration, TGLT paid US$ 0.2 million in cash and will transfer to IRSA: (i) a numberamount of apartmentsPs. 384.2 to be determined representing 23.10%matured 36 months after the issuing date, which accrue interest at an annual floating interest rate, Badlar plus 299 basis points, interest payable on a quarterly basis. Principal will be amortized in only one installment due on September 9, 2019. Non-convertible notes Class VIII for a nominal value of total square meters of residential space; (ii) a numberUS$ 184.5 million to be determinedmatured 36 months after the issuing date, paid in and payable in US Dollars, which will accrue interest at an annual fixed interest rate of parking space representing 21.10%7.0%, interest payable on a quarterly basis. Principal will be amortized in only one installment due on September 9, 2019. ●Non-convertible notes in IDBD and subsidiaries In July 2016, Shufersal acquired Non-Convertible Notes Series B for a nominal value of total square meters of parking space; and (iii) in case TGLT builds complementary storage rooms, a number to be determined, representing 21.10% of square meters of storage space. TGLT is committed to build, finish and obtain authorization for the three buildings making up the project within 36 to 48 months from that date and TGLT mortgaged the land in favor of IRSA as guarantee. A neighborhood association named Asociación Civil y Vecinal SOS Caballito Por Una Mejor Calidad de Vida secured a preliminary injunction which suspended the works to be carried out by TGLT in the abovementioned property. Once said preliminary injunction was deemed final, the GovernmentNIS 511 million with an increase of the Cityissue of Buenos Aires and TGLT were served noticeNon-Convertible Notes Series F by a ratio of 1.175 for each NIS 1 of the complaint. IRSA is not involved in these proceedingsSeries B. The Non-Convertible Notes Series B acquired by Shufersal were cancelled and has not been sued or summoned as a third party by any of the parties involved in the legal action.delisted.
Beruti plot of land
On October 13, 2010, the Group and TGLT entered into an agreement to barter a plot of land located at Beruti Street 3351/59 in the Autonomous City of Buenos Aires for cash and future residential apartments to be constructed by TGLT on the mentioned land. The transaction, which was subject to certain precedent conditions including the completion by TGLT of its initial public offering, was agreed at US$ 18.8 million. TGLT plans to construct an apartment building with residential and commercial parking space. In consideration, TLGT will transfer IRSA CP (i) a number of apartments to be determined representing 17.33% of total square meters of residential space; (ii) a number of parking spaces to be determined representing 15.82% of total square meters of parking space; (iii) all spaces reserved for commercial parking in the future building and (iv) the amount of US$ 10.7 million payable upon delivering the deeds of title on the land. TGLT perfected its initial public offering on the Stock Exchange of Buenos Aires on October 29, 2010 and therefore, the precedent condition to the transaction was completed on that date. TGLT paid US$ 10.7 million on November 5, 2010. On December 16, 2010, the title deed to the Beruti plot of land was executed.
Cresud Sociedad Anónima, Comercial, Inmobiliaria, Financiera y Agropecuaria
Notes to the Consolidated Financial Statements(Continued) (All amounts in thousandsmillions of Argentine Pesos, except shares and per share data and as otherwise indicated)
42. | Barter transactions (Continued)
|
40.
Subsequent events (Continued)
To secure performance
●Increase stake in Shufersal DIC acquired, on September 12, 2016, 9,097,127 shares of obligations assumed by TGLT under the deed of sale, a mortgage was granted in favor of IRSA CP.
An association named Asociación Amigos Alto Palermo presented an injunction requestingShufersal, such that the construction is prohibited and obtained a suspension interim measure for this purpose. Later, the Court of Appeals from the Autonomous City of Buenos Aires ordered the lifting of such interim measure. Currently, the “amparo” (judicial action for the protection of constitutional rights) is going through the trial stage, and no decision has been made on the meritsamount of the case.
Rosario plot of land
The Group, through IRSA CP, subscribed with Condominios del Alto S.A. a barter contract in connection with an own plot of land (plot 2 H), locatedcompany’s holdings in the Cityissued capital of Rosario, Province of Santa FeShufersal rose from approximately 53.89% to approximately 58.17% (and approximately 56.61% in full dilution), for a total amountconsideration of US$ 2.3 million. On November 27, 2008,NIS 133 million from the title deed was recorded.
As partial considerationBronfman-Fisher Group. It also received an option (‘the option’) for the above mentioned barter, Condominios del Alto S.A. agreedacquisition of up to transfer9,097,127 additional shares of Shufersal that the full property, possession and ownershipBronfman-Fisher Group owns, at a strike price of NIS 14.62 for each share of Shufersal (subject to accepted adjustments). The option will be valid until December 12, 2016. In addition, when the parties signed the agreement, it was determined that the directors of Shufersal that were appointed by the Bronfman-Fisher Group would give it notices of resignation from Shufersal’s Board of Directors, with immediate effect.
●Open Sky Ltd. (IDB Tourism) IDB Tourism is involved in favor of IRSA CP of the following future real estate: (i) 42 functional housing units (apartments), which represent and will further represent jointly 22% of the own covered square meters of housing (apartments) of the building that Condominios del Alto S.A. will construct in the plot; and (ii) 47 parking spaces, which represent and will further represent jointly 22% of the own covered square meters of parking space units in the same building.
On April 14, 2011 IRSA CP and Condominios del Alto S.A. subscribed a supplementary deed which specifies the Functional Housing Units (apartments) in the barter transaction agreement that should be transferred to the Company and the ownership title of the 45 parking spaces and 5 storage rooms.
As a consequence of the co-bartering parties having fulfilled with obligations assumed with ADIF, the Argentine National State has determined, through Resolution No, 31-ADIF-P-2013, the compliance with the charge regarding the lot 2 H, has been verified upon reaching the minimum investment fixednegotiations for the cited lot,sale of its holdings in conformity with ONABE Provision No, 07/2009 and Resolution N° 65-ADIF-P-2010, and has proceeded to release IRSA Propiedades Comerciales S.A. and Condominios del Alto SA from any obligation as to ADIF with respect the lot 2 H.Open Sky Ltd., under terms which have not yet been fully formulated.
Cresud Sociedad Anónima, Comercial, Inmobiliaria, Financiera y Agropecuaria
Notes to the Consolidated Financial Statements(Continued) (All amounts in thousandsmillions of Argentine Pesos, except shares and per share data and as otherwise indicated) Schedule I
42. | Barter transactions (Continued)
|
Furthermore, on May 17, 2013, the property was reportedThe following is a summary of The Group´s investments in real state as condominium property, and on November 14, 2013, the title deed was executed in favor of IRSA CP.
As of June 30, 2015 works have been concluded, and all of the units involved2016 prepared in the swap have been received.accordance with SEC Regulation S-X 12-28
Conil
On November 5, 2014, the Group executed a conveyance deed evidencing a barter and mortgage transaction in favor of Darío Palombo (acting as Trustee of “Fideicomiso Esquina Guemes”) to convey title on four plots of land located in Avellaneda district. The agreement provides for the development by the Trust of two building construction undertakings. In consideration for such work, the compensation agreed included the amount of US$ 0.01 million and delivery, within 24 months as from such agreement execution, of two functional units for commercial purposes and one functional unit for office purposes (the non-monetary compensation was valued at US$ 0.7 million).
43. | CNV General Ruling N° 629/14 – Storage of documentation |
On August 14, 2014, the CNV issued General Resolution N° 629 whereby it introduced amendments to rules related to storage and conservation of corporate books, accounting books and commercial documentation. In this sense, it should be noted that the Group has entrusted the storage of certain non-sensitive and old information to the following providers:
Documentation storage provider | Location | Bank S.A. | Gral. Rivas 401, Avellaneda, Province of Buenos Aires | | Ruta Panamericana Km 37.5, Garín, Province of Buenos Aires | | Av. Fleming 2190, Munro, Province of Buenos Aires | | | Iron Mountain Argentina S.A. | Av. Amancio Alcorta 2482, Autonomous City of Buenos Aires | Pedro de Mendoza 2143, Autonomous City of Buenos Aires | Saraza 6135, Autonomous City of Buenos Aires | Azara 1245, Autonomous City of Buenos Aires | Polígono industrial Spegazzini, Autopista Ezeiza Km 45, Cañuelas, Province of Buenos Aires |
It is further noted that a detailed list of all documentation held in custody by providers, as well as documentation required in section 5 a.3) of section I, Chapter V, Title II of the RULES (2013 as amended) are available at the registered office.
| | | | | Initial Costs | | Subsequent Costs | | Costs at year - end | | | | | | | | | | | | Name | | Encumbrances | | Plot of land | | Buildings, facilities and improvements (i) | | Improvements / Additions / Disposals / Transfers Plot | | Plot of land | | Buildings, facilities and improvements (i) | | Total | | Accumulated depreciation | | Net book value | | Date of construction | | Date of acquisition | | Useful life as of 06.30.016 | | Shopping Center Properties: | | | | | | | | | | | | | | | | | | | | | | | | | | Centro operaciones Argentina | | | | | | | | | | | | | | | | | | | | | | | | | | Abasto de Buenos Aires | | - | | 10 | | 455 | | 16 | | 10 | | 471 | | 481 | | (222) | | 259 | | nov-1998 | | Jul-1994 | | 16 | | Alto Palermo Shopping | | - | | 9 | | 583 | | 14 | | 9 | | 597 | | 606 | | (397) | | 209 | | oct-1990 | | Nov-1997 | | 14 | | Alto Avellaneda | | - | | 18 | | 312 | | 31 | | 18 | | 343 | | 361 | | (233) | | 128 | | oct-1995 | | Dec-1997 | | 11 | | Alcorta Shopping | | - | | 11 | | 213 | | 16 | | 11 | | 229 | | 240 | | (117) | | 123 | | jun-1992 | | Jun-1997 | | 15 | | Alto Noa | | - | | - | | 71 | | 8 | | - | | 79 | | 79 | | (46) | | 33 | | sep-1994 | | Mar-1995 | | 13 | | Buenos Aires Design | | - | | - | | 74 | | 9 | | - | | 83 | | 83 | | (77) | | 6 | | nov-1993 | | Nov-1997 | | 2 | | Patio Bullrich | | - | | 10 | | 206 | | 11 | | 10 | | 217 | | 227 | | (124) | | 103 | | sep-1988 | | Oct-1998 | | 16 | | Alto Rosario | | - | | 26 | | 140 | | 21 | | 26 | | 161 | | 187 | | (58) | | 129 | | nov-2004 | | Nov-2004 | | 18 | | Mendoza Plaza | | - | | 11 | | 174 | | 12 | | 11 | | 186 | | 197 | | (104) | | 93 | | jun-1994 | | Dec-1994 | | 15 | | Dot Baires Shopping | | - | | 85 | | 331 | | 96 | | 85 | | 427 | | 512 | | (138) | | 374 | | may-2009 | | Nov-2006 | | 24 | | Córdoba Shopping | | Antichresis | | 1 | | 104 | | 1 | | 1 | | 105 | | 106 | | (57) | | 49 | | mar-1990 | | Dec-2006 | | 14 | | Distrito Arcos | | - | | - | | - | | 305 | | - | | 305 | | 305 | | (26) | | 279 | | - | | Nov-2009 | | 15 | | Alto Comahue | | - | | 1 | | 12 | | 328 | | 1 | | 340 | | 341 | | (22) | | 319 | | - | | May-2006 | | 30 | | Patio Olmos | | - | | 12 | | 22 | | 1 | | 12 | | 23 | | 35 | | (9) | | 26 | | may-1995 | | Sep-2007 | | 17 | | Soleil Premium Outlet | | - | | 23 | | 56 | | 38 | | 23 | | 94 | | 117 | | (37) | | 80 | | - | | Jul-2010 | | 14 | | Total Shopping Center Properties | | - | | 217 | | 2,753 | | 907 | | 217 | | 3,660 | | 3,877 | | (1,667) | | 2,210 | | | | | | | | Office buildings and Other Rental Properties Portfolio: | | | | | | | | | | | | | | | | | | | | | | | | | | Centro operaciones Argentina | | | | | | | | | | | | | | | | | | | | | | | | | | Alto Palermo Shopping Annex | | - | | - | | 38 | | - | | - | | 38 | | 38 | | (8) | | 30 | | - | | | | | | Dot Building | | - | | 13 | | 75 | | 56 | | 13 | | 131 | | 144 | | (23) | | 121 | | sep-2010 | | Nov-2006 | | 28 | | Anchorena 559 | | - | | 1 | | 6 | | - | | 1 | | 6 | | 7 | | (4) | | 3 | | n/a | | n/a | | n/a | | Anchorena 665 | | - | | 2 | | 9 | | - | | 2 | | 9 | | 11 | | (1) | | 10 | | n/a | | n/a | | n/a | | Zelaya 3102 | | - | | 1 | | - | | - | | 1 | | - | | 1 | | - | | 1 | | n/a | | n/a | | n/a | | Bouchard 710 | | - | | 40 | | 49 | | 2 | | 40 | | 51 | | 91 | | (12) | | 79 | | - | | Jun-2005 | | 24 | | Bouchard 551 | | - | | 5 | | 6 | | 1 | | 5 | | 7 | | 12 | | (3) | | 9 | | - | | Mar-2007 | | 28 | | Dique IV | | - | | - | | 6 | | (6) | | - | | - | | - | | - | | - | | n/a | | n/a | | n/a | | Intercontinental Plaza (i) | | - | | 2 | | 120 | | (82) | | 2 | | 38 | | 40 | | (28) | | 12 | | jun-1996 | | Nov-1997 | | 23 | | Libertador 498 | | - | | 1 | | 6 | | 1 | | 1 | | 7 | | 8 | | (4) | | 4 | | n/a | | n/a | | n/a |
Cresud Sociedad Anónima, Comercial, Inmobiliaria, Financiera y Agropecuaria
Notes to the Consolidated Financial Statements(Continued) (All amounts in thousandsmillions of Argentine Pesos, except shares and per share data and as otherwise indicated)
43. CNV General Resolution N° 629/14 – Storage of documentation (Continued)
On February 5, 2014 there was a widely known fire in Iron Mountain’s warehouse. To the date of these financial statements, the Group is waiting for the company that experienced the fire to report whether the documentation submitted has been actually affected by the fire and its condition after the accident. Nevertheless, based on the internal review carried out by the Group, duly reported to the CNV on February 12, 2014, the information kept at the Iron Mountain premises that were on fire do not appear to be sensitive or capable of affecting normal operations.
44. | Groups of assets and liabilities held for sale |
Assets and liabilities related to the operation of the building located in 183 Madison Av., NY, United States, owned by the subsidiary of the Group, Rigby 183 LLC, and that form part of the international business segment, have been reported in the consolidated financial statements as of June 30, 2014 as available for sale as per the contract for the sale of the building entered into with Tishman Speyer Development Corporation on May 16, 2014. The transaction is subject to compliance with certain conditions which are expected to be complied with in September 2014.
Pursuant to IFRS 5, assets and liabilities available for sale have been valued at the lower of their book value or fair value less selling cost. Since fair value is higher than book value of the pool of assets available for sale including some goodwill related to the acquisition, no impairment has been recorded.
The following table shows the main assets and liabilities held for sale:
Group’s assets held for sale
Investment properties | | | 1,098,990 | | Intangible assets - Goodwill | | | 77,086 | | Restricted assets | | | 163,501 | | Trade and other receivables | | | 17,990 | | Derivative financial instruments | | | 299 | | Total | | | 1,357,866 | |
Group’s liabilities directly associated to assets classified as held for sale
Trade and other payables | | �� | 170,245 | | Deferred income tax liabilities | | | 33,346 | | Borrowings | | | 603,021 | | Total | | | 806,612 | |
| | | | | Initial Costs | | Subsequent Costs | | Costs at year - end | | | | | | | | | | | | Name | | Encumbrances | | Plot of land | | Buildings, facilities and improvements (i) | | Improvements / Additions / Disposals / Transfers Plot | | Plot of land | | Buildings, facilities and improvements (i) | | Total | | Accumulated depreciation | | Net book value | | Date of construction | | Date of acquisition | | Useful life as of 06.30.016 | Office buildings and Other Rental Properties Portfolio: | | | | | | | | | | | | | | | | | | | | | | | | | | Maipú 1300 | | - | | 2 | | 15 | | (5) | | 2 | | 10 | | 12 | | (6) | | 6 | | n/a | | n/a | | n/a | | Suipacha 664 | | - | | 3 | | 12 | | 2 | | 3 | | 14 | | 17 | | (5) | | 12 | | n/a | | n/a | | n/a | | Bank Boston Tower | | - | | 78 | | 56 | | - | | 78 | | 56 | | 134 | | (4) | | 130 | | - | | Aug-2007 | | 25 | | República Building | | - | | 111 | | 87 | | 1 | | 111 | | 89 | | 200 | | (9) | | 191 | | - | | Apr-2008 | | 24 | | Constitución 1111 | | - | | - | | 1 | | - | | - | | 1 | | 1 | | (1) | | - | | n/a | | n/a | | n/a | | Santa María del Plata | | - | | 13 | | - | | - | | 13 | | - | | 13 | | - | | 13 | | n/a | | n/a | | n/a | | Paseo del Sol | | - | | - | | 7 | | - | | - | | 7 | | 7 | | - | | 7 | | n/a | | n/a | | n/a | | Centro operaciones Israel: | | | | | | | | | | | | | | | | | | | | | | | | | | Tivoli | | - | | 171 | | 1,241 | | - | | 124 | | 1,969 | | 2,093 | | (46) | | 2,047 | | apr-2011 | | Oct-2015 | | 35 | | Kiryat Ono Mall | | - | | 316 | | 696 | | 8 | | 502 | | 1,115 | | 1,617 | | (19) | | 1,598 | | nov-2007 | | Oct-2015 | | 72 | | Shopping Center Modi’in A | | - | | 223 | | 289 | | - | | 354 | | 459 | | 813 | | (8) | | 805 | | aug-2005 | | Oct-2015 | | 81 | | HSBC | | - | | 5,471 | | 2,148 | | (370) | | 8,337 | | 2,962 | | 11,299 | | (74) | | 11,225 | | 1927-1984 | | Oct-2015 | | 35 | | Matam park - Haifa | | - | | 544 | | 2,685 | | 480 | | 910 | | 4,842 | | 5,752 | | (90) | | 5,662 | | 1979-2015 | | Oct-2015 | | 63 | | Caesarea - Maichaley Carmel | | - | | 142 | | 230 | | - | | 226 | | 365 | | 591 | | (8) | | 583 | | jun-1905 | | Oct-2015 | | 76 | | Herzeliya North | | - | | 777 | | 1,025 | | 856 | | 1,498 | | 2,662 | | 4,160 | | (35) | | 4,125 | | 1996-2015 | | Oct-2015 | | 89 | | Gav-Yam Center - Herzeliya | | - | | 748 | | 817 | | - | | 1,187 | | 1,297 | | 2,484 | | (35) | | 2,449 | | 1997-2006 | | Oct-2015 | | 64 | | Neyar Hadera Modi’in | | - | | 186 | | 248 | | - | | 295 | | 393 | | 688 | | (8) | | 680 | | jun-1905 | | Oct-2015 | | 84 | | Gav yam park - Beer Sheva | | - | | 34 | | 402 | | 16 | | 54 | | 658 | | 712 | | (12) | | 700 | | jul-1905 | | Oct-2015 | | 97 | | Hazomet Kfar Saba | | - | | - | | 74 | | - | | - | | 117 | | 117 | | - | | 117 | | jun-1905 | | Oct-2015 | | 50 | | Bilu | | - | | - | | 54 | | - | | - | | 86 | | 86 | | - | | 86 | | jun-1905 | | Oct-2015 | | 35 | | Mazkeret Batia | | - | | - | | 69 | | - | | - | | 109 | | 109 | | - | | 109 | | jul-1905 | | Oct-2015 | | 50 | | Netania | | - | | - | | 525 | | 23 | | - | | 861 | | 861 | | (12) | | 849 | | jun-1905 | | Oct-2015 | | 31 | | Rishon Le Zion | | - | | - | | 44 | | - | | - | | 70 | | 70 | | - | | 70 | | may-1905 | | Oct-2015 | | 35 | | Rehovot | | - | | - | | 69 | | 13 | | - | | 125 | | 125 | | - | | 125 | | jun-1905 | | Oct-2015 | | 35 | | Mizpe Sapir | | - | | - | | 88 | | (10) | | - | | 128 | | 128 | | (4) | | 124 | | jun-1905 | | Oct-2015 | | 35 | | Holon | | - | | 191 | | 15 | | - | | 303 | | 24 | | 327 | | - | | 327 | | jan-1969 | | Oct-2015 | | 25 | | Haifa | | - | | 15 | | - | | - | | 24 | | - | | 24 | | - | | 24 | | jan-1970 | | Oct-2015 | | 25 | | Others | | - | | 1,781 | | 3,938 | | 195 | | 3,018 | | 5,830 | | 8,848 | | (89) | | 8,759 | | n/a | | Oct-2015 | | n/a | | Total Office buildings and Other Rental Properties Portfolio: | | | | 10,871 | | 15,150 | | 1,181 | | 17,104 | | 24,536 | | 41,640 | | (548) | | 41,092 | | | | | | |
Cresud Sociedad Anónima, Comercial, Inmobiliaria, Financiera y Agropecuaria
Notes to the Consolidated Financial Statements(Continued) (All amounts in thousandsmillions of Argentine Pesos, except shares and per share data and as otherwise indicated)
·Schedule I On July 13, 2015, Cresud took a loan granted by Banco Provincia in(Continued)
| | | | | Initial Costs | | Subsequent Costs | | Costs at year - end | | | | | | | | | | | | Name | | Encumbrances | | Plot of land | | Buildings, facilities and improvements (i) | | Improvements / Additions / Disposals / Transfers Plot | | Plot of land | | Buildings, facilities and improvements (i) | | Total | | Accumulated depreciation | | Net book value | | Date of construction | | Date of acquisition | | Useful life as of 06.30.016 | | Undeveloped parcels of lands: | | | | | | | | | | | | | | | | | | | | | | | | | | Centro operaciones Argentina: | | | | | | | | | | | | | | | | | | | | | | | | | | Building Annexed to Dot | | - | | 25 | | - | | - | | 25 | | - | | 25 | | - | | 25 | | - | | Nov-2006 | | - | | Lujan plot of land | | - | | 42 | | (18) | | - | | 42 | | (18) | | 24 | | - | | 24 | | - | | May-2012 | | - | | Caballito - Ferro | | - | | 46 | | 4 | | - | | 46 | | 4 | | 50 | | - | | 50 | | - | | Nov-1997 | | - | | Intercontinental plot of land Tower B | | - | | 2 | | - | | - | | 2 | | - | | 2 | | - | | 2 | | - | | - | | - | | Santa María del Plata | | - | | 159 | | 64 | | - | | 159 | | 64 | | 223 | | - | | 223 | | - | | Jul-1997 | | - | | Pilar | | - | | 2 | | 1 | | - | | 2 | | 1 | | 3 | | - | | 3 | | - | | - | | - | | Otros | | - | | 3 | | 2 | | - | | 3 | | 2 | | 5 | | - | | 5 | | - | | - | | - | | Centro operaciones Israel: | | | | | | | | | | | | | | | | | | | | | | | | | | Tivoli | | - | | 15 | | - | | - | | 24 | | - | | 24 | | - | | 24 | | apr-2011 | | Oct-2015 | | - | | Queensridge Towers | | - | | 294 | | - | | (71) | | 467 | | (201) | | 266 | | - | | 266 | | apr-2011 | | Oct-2015 | | - | | Zarchini Raanana | | - | | - | | 49 | | - | | - | | 78 | | 78 | | - | | 78 | | - | | Oct-2015 | | - | | Kurdani | | - | | - | | - | | - | | - | | - | | - | | - | | - | | - | | Oct-2015 | | - | | Others | | - | | 1,076 | | 5 | | (20) | | 1,801 | | (16) | | 1,785 | | (8) | | 1,777 | | n/a | | Oct-2015 | | n/a | | Total Undeveloped parcels of lands: | | - | | 1,664 | | 107 | | (91) | | 2,571 | | (86) | | 2,485 | | (8) | | 2,477 | | | | | | | | | | | | | | | | | | | | | | | | | | | | | | | | | | Properties under development | | | | | | | | | | | | | | | | | | | | | | | | | | Centro operaciones Argentina: | | | | | | | | | | | | | | | | | | | | | | | | | | PH Office Park | | - | | - | | - | | 7 | | - | | 7 | | 7 | | - | | 7 | | in progress | | - | | - | | Catalinas Norte | | - | | 42 | | - | | 6 | | 42 | | 6 | | 48 | | - | | 48 | | in progress | | Dec-1999 | | - | | Centro operaciones Israel: | | | | | | | | | | | | | | | | | | | | | | | | | | Tivoli | | - | | - | | 1,170 | | 103 | | - | | 1,981 | | 1,981 | | - | | 1,981 | | in progress | | Oct-2015 | | - | | Ispro Planet – Beer Sheva – Phase 1 | | - | | 154 | | 294 | | 296 | | 245 | | 817 | | 1,062 | | - | | 1,062 | | in progress | | Oct-2015 | | - | | Others | | - | | 149 | | 1,124 | | (879) | | 191 | | 689 | | 880 | | - | | 880 | | in progress | | Oct-2015 | | n/a | | Total Properties under development | | - | | 345 | | 2,588 | | (467) | | 478 | | 3,500 | | 3,978 | | - | | 3,978 | | | | | | | | Total | | - | | 13,097 | | 20,598 | | 1,530 | | 20,370 | | 31,610 | | 51,980 | | (2,223) | | 49,757 | | | | | | |
(i) The breakdown of investment properties as of June 30, 2016, not includes leased farmlands for the amount of Ps. 839 million. Principal shall accrue interest at a fixed rate of 23%. The interests will be paid monthly. Principal will be settled within 6 months.
·On August 12, 2015, Cresud issued Class XI Non-Convertible Notes for an aggregate principal amount of up to Ps. 150 million, which may be extended for up to Ps. 700 million in two classes:
-Class XXI Non-Convertible Notes, for a face value of Ps. 192.2 million and falling due 18 months after the issuance date, will accrue interest at mixed rate. Fixed rate of 27.5% during the first 9 months and floating rate (Badlar plus 375 basis points). Interest will be payable quarterly in arrears whereas the principal will be amortized in one payment at due date. The issuance price was 100.0% of the nominal value.
-Class XXII Non-Convertible Notes, for a face value of US$ 22.7 million, with an issuance price of 97.65% of the nominal value resulting US$ 22.2 equivalent to Ps. 204.3 million and falling due 48 months after the issuance date, will accrue interest at fixed annual rate of 4%. Interest will be payable quarterly in arrears whereas the principal will be amortized in two payments.
·Regarding the allocation of the Hilton quota for fiscal year 2015 - 2016 Carnes Pampeanas S.A. has made the presentation of all documentation required by the Assessment and Coordination Unit of subsidies for domestic consumption (UCESI, as per its spanich acronym), under the Ministry of Economy and Public Finance. Although we do not have information about the allocation of that quota for the period before mentioned as of the date of these financial statements.
·As described in Note 7, on August 28, 2015, Carnes Pampeanas S.A.’s shareholders decided to increase the Company’s capital stock by swapping a receivable from Cresud in the amount of Ps. 36,308,250 for equity in order to offset its negative shareholder’s equity as of June 30, 2015.
·On July 10, 2015, the Group through IRSA signed the transfer deed for the sale of the 16th floor of the building Maipú 1300. The transaction Price was set at Ps. 13.9 million, which will result in an approximately Ps. 12.0 million gain before tax.
·On July 24, 2015, the Group through IRSA signed the transfer deed for the sale of the 4th floor of the building Maipú 1300. The transaction Price was set at Ps. 21.7 million, which will result in an approximately Ps. 19.7 million gain before tax.
Cresud Sociedad Anónima, Comercial, Inmobiliaria, Financiera y Agropecuaria
Notes to the Consolidated Financial Statements(Continued) (All amounts in thousandsmillions of Argentine Pesos, except shares and per share data and as otherwise indicated) 45. | Subsequent events (Continued)
|
·On JulyAs at June 30, 2015 ourand 2014, IDBD was considered a significant associate Tarshop S.A. issued non-convertible notes Class XXII for a nominal valuepursuant to SEC rule 3-09, set out below is summarized financial information of Ps. 126,666. On July 21, 2015, this issuance was authorized by the Issue Activity DepartmentIDBD as of the CNV, for a total nominal value of Ps. 20,000 that can be extended up to the total authorized amount of Ps. 300,000. CN Class XXII will accrue interest from the date of issue at a nominal fixed annual rate of 29%, until the end of the sixth month, and at a nominal floating annual rate equal to BADLAR Private rate plus 500 basis points, beginning on the seventh month until its maturity date. Payment dates of mentioned interests will be: October 30, 2015, January 30, 2016, April 30, 2016, July 30, 2016, October 30, 2016 and January 30, 2017. The payment date of the principal will be: January 30, 2017.
·On July 31, 2015, the Group through IRSA signed the transfer deed for the sale of the 18th floor of the building Maipú 1300. The price of the transaction was Ps. 14.9 million. Such transaction will generate a gain before tax of approximately Ps. 12.6 million.
·On July 31, 2015, the Group through Dolphin, granted a loan to IFISA in the amount of US$7.2 million, with maturity one year after beginning date. The loan accrues interest at 1-month Libor plus a 3% margin.
·On August 24, 2015, the Group through IRSA signed the transfer deed for the sale of the 3rd floor of the building Maipú 1300. The price of the transaction was Ps. 13.4 million. Such transaction will generate a gain before tax of approximately Ps. 11.6 million.
·On August 25, 2015, the Group, through IRSA, acquired Class V Non-convertible Notes nominal value 113,762,000 for an amount of Ps. 120.5 million.
·On September 3, 2015, the Group through IRSA signed the transfer deed for the sale of the "Isla Sirgadero" plot of land. The price of the transaction was Ps. 10.7 million. Such transaction will generate a gain before tax of approximately Ps. 6.0 million.
·On September 10, 2015 the Group signed the transfer deed for the sale of 5,963 square meters corresponding to seven offices floors, 53 parking units and 3 storage rooms of Intercontinental Plaza building, remaining 7,159 sqm of the building under the society ownership. The amount of the transaction was Ps. 324.5 million, which has already been paid in full by the purchaser. Such transaction will generate a gain before tax of approximately Ps. 297.7 million to be recognized in our financial statements during the first quarter of 2016.
·On September 18, 2015, the Group through IRSA CP issued Series I Notes under our Global Note Program for up to the sum of USD 500,000 for an amount of Ps.407,260 (equivalent to USD 43,441). Series I Notes have a maturity of 18 months from its issue date, and will bear a mixed interest rate of 26,5% per year during the first three months, and Private Badlar Rate (Tasa Badlar Privada) plus 400 bps per year during the remaining period, playable on a quarterly basis.
those dates:
Summarized statements of financial position | | | IDBD (in millions of pesos) | | | | June 30, 2015 | June 30, 2014 | | Assets | | | | | Non- Current Assets | | | | | Investment in associates | | 8,866 | 9,118 | | Other investments and derivative financial instruments | | 833 | 5,856 | | Property, plant and equipment | | 13,450 | 12,791 | | Investment properties | | 27,299 | 24,317 | | Intangible assets | | 11,419 | 12,580 | | Other non-current assets | | 3,068 | 3,375 | | Total non-current assets | | 64,935 | 68,037 | | Current Assets | | | | | Other investments and derivative financial instruments | | 5,251 | 8,354 | | Trade and other receivables | | 6,101 | 6,878 | | Cash and cash equivalents | | 8,375 | 10,829 | | Other current assets | | 10,617 | 5,762 | | Total current assets | | 30,344 | 31,823 | | Total assets | | 95,279 | 99,860 | | Liabilities | | | | | Non-Current Liabilities | | | | | Obligations | | 41,961 | 45,756 | | Bank loan and other financial liabilities | | 7,553 | 6,747 | | Financial instruments | | 7,274 | 8,072 | | Other non-current liabilities | | 4,896 | 4,767 | | Total non-current liabilities | | 61,684 | 65,342 | | Current Liabilities | | | | | Obligations | | 7,002 | 7,899 | | Bank loan and other financial liabilities | | 5,338 | 6,340 | | Trade payables | | 6,053 | 5,923 | | Other current liabilities | | 5,816 | 6,502 | | Total current liabilities | | 24,209 | 26,664 | | Total liabilities | | 85,893 | 92,006 | | Net assets | | 9,386 | 7,854 | | Non-controlling interest | | 8,526 | 8,643 | | Net assets of the Parent company | | 860 | (789) |
Cresud Sociedad Anónima, Comercial, Inmobiliaria, Financiera y Agropecuaria
Notes to the Consolidated Financial Statements(Continued) (All amounts in thousandsmillions of Argentine Pesos, except shares and per share data and as otherwise indicated)
45. | Subsequent events (Continued)
|
·Schedule IIOn October 9, 2015, the Group through IRSA, granted a loan to IFISA in the amount of US$ 40 million, with maturity one year after beginning date. The loan accrues interest at 1-month Libor plus a 3% margin. As a guaranty of the loan, 73.169.991 common shares of IDBD owned by IFISA were pledged.(Continued)
·During October 2015, the escrow deposit related to the sale of the Madison Building was released and delivered to the parties: the Group, though Rigby, received US$ 0.91 millon, the buyer received US$ 0.06 million, and the remaining balance was used for some costs related to the transaction.
·On October 30, 2015, the Company’s Annual Shareholders’ Meeting corresponding to fiscal year ended June 30, 2015, appointed the new members of the Supervisory Committee and Boards of Directors; approved the Board´s compensation, decided not to pay compensation to the Supervisory Committee; approved the amount to pay related to the Shareholder´s property tax, delegated to the Board of Directors the implementation of a new Shared Service Agreement, approved the Board of Directors capacity related to the Global Program for issuing Non Convertible Notes, with ot without guaranty or guaranted by third parties; and for a maximum amount of up to US$ 300 million. It was decided to put on hold until November 26th 2015 to consider the following: (i) consideration of the year’s results, (ii) consideration of the Especial Financial Statements of merger / merger-demerger.
·On October 30, 2015, our subsidiary IRSA CP in the Annual Shareholder´s Meeting corresponding to the fiscal year ended June 30, 2015, decided, among others, the following issues: (i) destinate Ps 283.580 to pay cash dividends; (ii) approved the advance dividend approved by the June 13, 2015 Shareholders´ Meeting in the amountSummarized statements of Ps 298.500; (iii) approved the Board of Directors compensation in the amount of Ps 76.440 and (iv) approved the increase of the amount of the Global Program for issuing Non Convertible Notes for a maximum amount of up to US$ 500 million, for an additional amount of up to US$ 100 million.
·On November 5, 2015, the Group through IRSA signed the transfer deed for the sale of the 7th and 8th floor of the building Maipú 1300. The price of the transaction was US$ 3.0 million. Such transaction will generate a gain before tax of approximately Ps. 25.9 million.
· As of the date of issuance of these financial statements, Cresud have sold, through various market transactions, 410,181 ADR´s of IRSA, representing 10 common shares of IRSA (N.V. Ps. 1 per share) for the amount of US$ 7.1 million. Thus, the Group’s investment in IRSA would decrease by 1.1%.comprehensive income
| | IDBD (in millions of pesos) | | | June 30, 2015 (period of twelve months) | June 30, 2014 (period of six months) | | Gross profit | 7,316 | 9,564 | | Profit before Income Tax | 945 | 1,013 | | Income tax | (232) | (592) | | Profit from continuing operations | 713 | 421 | | Profit from discontinued operations | - | 144 | | Net Profit for the period | 713 | 565 | | Other comprehensive income | (562) | 221 | | Total comprehensive income for the period | 151 | 786 | | Profit attributable to non-controlling interest | 140 | 833 |
Summarized statements of cash flows | | IDBD (in millions of pesos) | | | June 30, 2015 (period of twelve months) | June 30, 2014 (period of six months) | | Net cash generated by operating activities | 2,909 | 3,346 | | Net cash generated by investing activities | 1,389 | 4,228 | | Net cash used in financing activities | (4,505) | (11,805) | | Net decrease in cash and cash equivalents | (207) | (4,231) | | | | | | Net decrease in cash and cash equivalents from continuing operations | (207) | (6,935) | | Net increase in cash and cash equivalents from discontinued operations | - | 2,704 | | Net decrease in cash and cash equivalents | (207) | (4,231) | | | | | | Cash and cash equivalents at beginning of period | 8,480 | 11,870 | | Foreign exchange gain on cash and cash equivalents | 107 | 2,846 | | Changes in cash included in assets classified as held for sale | (5) | 344 | | Cash and cash equivalents at end of year | 8,375 | 10,829 |
Cresud Sociedad Anónima, Comercial, Inmobiliaria, Financiera y Agropecuaria
Notes to the Consolidated Financial Statements(Continued) (All amounts in thousandsmillions of Argentine Pesos, except shares and per share data and as otherwise indicated)
45. | Subsequent events (Continued)
|
IDBD
On July 9 and 16, 2015, as mentioned in Note 9 to these Financial Statements, Dolphin submitted clarifications on the Proposal to IDBD and DIC dated June 29, 2015.
On July 9, 2015,Schedule III
The following is condensed financial information of Cresud Sociedad Anónima, Comercial, Inmobiliaria, Financiera y Agropecuaria (“CRESUD” or the main clarifications were as follows:Company), the parent Company, prepared in accordance with SEC Regulation S-X 12-04: -The termination or expirationStatements of the Proposal to IDBDFinancial Position
as of June 30, 2016 and DIC would not repeal the commitments undertaken by Dolphin under the proposal submitted by Dolphin to IDBD on May 6, 2015 (described in Note 9 to these Financial Statements) always provided that such commitments continued in full force and effect subject to the proposed terms, or Dolphin’s remaining commitment to inject NIS 8.5 million in IDBD pursuant to its irrevocable proposal dated December 29, 2014. -A further condition would be added to the Proposal to IDBD and DIC whereby if Dolphin’s interest in the rights public offering were lower than NIS 8.5 million, Dolphin would remain obliged vis-à-vis IDBD to inject the remaining amount arising from subtracting NIS 8.5 million and the amount effectively injected at this instance by Dolphin.
| | 06.30.16 | | 06.30.15 | | ASSETS | | | | | Non-current assets | | | | | Investment properties | 9 | | 11 | | Property, plant and equipment | 488 | | 471 | | Intangible assets | 17 | | 18 | | Biological assets | 477 | | 346 | | Investments in subsidiaries, associates and joint ventures | 2,560 | | 2,501 | | Deferred income tax assets | 757 | | 447 | | Income tax credit | 50 | | 52 | | Total Non-current assets | 4,358 | | 3,846 | | Current assets | | | | | Biological assets | 442 | | 113 | | Inventories | 491 | | 337 | | Income tax credit | 34 | | 8 | | Trade and other receivables | 388 | | 410 | | Derivative financial instruments | 15 | | - | | Investment in financial assets | 22 | | 53 | | Cash and cash equivalents | 11 | | 18 | | Total Current assets | 1,403 | | 939 | | TOTAL ASSETS | 5,761 | | 4,785 | | SHAREHOLDERS’ EQUITY | | | | | Share capital | 495 | | 495 | | Treasury stock | 7 | | 7 | | Inflation adjustment of share capital and treasury stock | 65 | | 65 | | Share premium | 659 | | 659 | | Additional paid-in capital from treasury stock | 16 | | 13 | | Legal reserve | 83 | | - | | Other reserves | 1,086 | | 579 | | Accumulated deficit | (1,390) | | (245) | | TOTAL SHAREHOLDERS’ EQUITY | 1,021 | | 1,573 | | LIABILITIES | | | | | Non-current liabilities | | | | | Trade and other payables | 1 | | 1 | | Borrowings | 3,150 | | 2,078 | | Provisions | 10 | | 10 | | Total Non-current liabilities | 3,161 | | 2,089 | | Current liabilities | | | | | Trade and other payables | 305 | | 149 | | Payroll and social security liabilities | 85 | | 58 | | Borrowings | 1,166 | | 911 | | Derivative financial instruments | 23 | | 3 | | Provisions | - | | 2 | | Total Current liabilities | 1,579 | | 1,123 | | TOTAL LIABILITIES | 4,740 | | 3,212 | | TOTAL SHAREHOLDERS’ EQUITY AND LIABILITIES | 5,761 | | 4,785 |
-IDBD would replace its commitment to exercise DIC’s Series 1 warrants for NIS 92.5 million with the commitment to exercise the Series 1 warrants for at least the amount that results from subtracting (a) the Capital Contribution Amount (as defined in Note 9 toThe accompanying notes are an integral part of these Financial Statements); minus (b) NIS 100 million, always provided that such amount does not exceed NIS 92.5 million.condensed financial information.
On July 13, 2015, Dolphin extended the maturity of the Proposal to IDBD and DIC until July 16, 2015.
In addition, on July 16, 2015, Dolphin submitted additional clarifications on the Proposal to IDBD and DIC dated June 29, 2015 and July 9, 2015, which provided as follows:
- | Dolphin agrees that the new shares to be acquired by Dolphin or any entity controlled by Eduardo Sergio Elsztain under the public offering of shares to be made by IDBD during October 2015 (as disclosed in note 3 to these Financial Statements) would not grant to it the right to participate in the Tender Offer (as such term is defined in note 3 to these Financial Statements) always provided that such new shares are still held by Dolphin or an entity controlled by Eduardo Sergio Elsztain. Notwithstanding, nothing will prevent Dolphin and/or the entity controlled by Eduardo Sergio Elsztain that holds such new shares to be acquired under the public offering to be made in October 2015 by IDBD from freely disposing of them. |
45. | Subsequent events (Continued)
|
On July 16, 2015, IDBD’s Board of Directors approved a capital increase by means of a public offering pursuant to the terms proposed by Dolphin in the Proposal to IDBD and DIC, and to exercise DIC’s warrants, all based on Dolphin’s irrevocable commitment to participate in the referred capital increase. IDBD plans to carry out the public offering between October 1 and November 15 2015, subject to the company’s corporate approvals, other statutory consents required and the fact that the exercise of DIC’s warrants can be made pursuant to the terms and conditions set forth in Dolphin’s proposal.
On July 16, 2015, DIC’s Board of Directors accepted the Proposal to IDBD and DIC and instructed its management to take such steps as necessary in order to make a rights offering pursuant to Dolphin’s proposal. On August 27, 2015, DIC published a shelf offering report for the issuance of rights to its shareholders. On September 6, 2015, DIC completed the rights offering process, issuing four series of warrants to its shareholders, which are exercisable into DIC shares. As of the date of these financial statements, IDBD has not completed the capital injection in DIC.
On August 16, 2015, the Arrangement Trustees submitted a petition to the Tel Aviv Jaffo Court for it to determine that: (a) IFISA would be subject to the commitments in the Arrangement jointly and severally with Dolphin; (b) the shares held by any other company controlled by Eduardo Sergio Elsztain (including Dolphin) would not be eligible to take part in the Tender Offer; and (c) the shares held by any company controlled by any of the controlling shareholders of IDBD, including any corporations controlled by Eduardo Sergio Elsztain (including Dolphin) and transferred to other entities would not be eligible to take part in the Tender Offer.
On August 31, 2015, the competent court asked the Arrangement Trustees to make a supplementary filing to the one dated August 16, 2015, identifying the parties to whom such request was addressed, which filing was made on the above mentioned date. On September 7, 2015 the court dismissed the Arrangement Trustees' filing for failure to submit the supplementary filing requested by the competent court on August 31, 2015.
On August 17, 2015, the Arrangement Trustees submitted to IDBD, its Board of Directors, Dolphin and ETH (among others) and alternative scheme to the one proposed by Dolphin on May 27,2015 as part of Dolphin’s and ETH’s obligations under the Tender Offer (the “Trustees' Proposal”) which was filed with the competent court. The Trustees’ Proposal provided as follows:
- Replacement of the obligation to carry out Tender Offers for a total of NIS 512 million with the obligation by Dolphin and ETH (and/or their related parties) to inject NIS 512 million in IDBD against the issuance of bonds. The NIS 512 million would be injected in two tranches of NIS 256 million each (the “First Tranche” and the “Second Tranche”, respectively).
Cresud Sociedad Anónima, Comercial, Inmobiliaria, Financiera y Agropecuaria
Notes to the Consolidated Financial Statements(Continued) (All amounts in thousandsmillions of Argentine Pesos, except shares and per share data and as otherwise indicated)
45. | Subsequent eventsSchedule III (Continued) (Continued)
|
Statements of Operations The First Tranche would be completed by December 31,for the fiscal years ended June 30, 2016, 2015 and against its injection IDBD would issue in favor of such investors other than Dolphin, ETH and/or any of their related parties (the “Minority Investors”) bonds for a principal amount of NIS 256 million, by reopening Series 9 (“Series 9”), or by issuing a new series of bonds under terms and conditions replicating those of Series 9 (“IDBD’s New Bonds”).2014
| | 06.30.16 | | 06.30.15 | | 06.30.14 | | | Revenues | 1,079 | | 754 | | 609 | | | Costs | (1,543) | | (1,282) | | (985) | | | Initial recognition and changes in the fair value of biological assets and agricultural produce at the point of harvest | 1,164 | | 697 | | 662 | | | Changes in net realizable value of agricultural produce after harvest | 207 | | (29) | | (5) | | | Gross profit | 907 | | 140 | | 281 | | | General and administrative expenses | (151) | | (109) | | (116) | | | Selling expenses | (214) | | (149) | | (93) | | | Other operating results, net | (53) | | (3) | | (6) | | | Profit / (Loss) from operations | 489 | | (121) | | 66 | | | Share of (loss) / profit of subsidiaries, associates and joint ventures | (429) | | 121 | | (528) | | | Profit / (Loss) before financing and taxation | 60 | | - | | (462) | | | Finance income | 102 | | 31 | | 132 | | | Finance costs | (1,766) | | (490) | | (1,109) | | | Other financial results | 237 | | 14 | | 101 | | | Financial results, net | (1,427) | | (445) | | (876) | | | Loss before Income tax | (1,367) | | (445) | | (1,338) | | | Income tax gain | 329 | | 195 | | 270 | | | Loss for the year | (1,038) | | (250) | | (1,068) | | | | | | | | | | | | | | | | | | | (Loss) / Profit per share for the year: | | | | | | | | Basic | (3.82) | | 0.36 | | (2.15) | | | Diluted | (3.82) | (i) | 0.32 | | (2.15) | (i) |
The Second Tranche would be completed by January 31, 2016 and against its injection the Minority Investors would receive IDBD’s New Bonds for a principal amount of NIS 256 million.
(i) Following the exercise of the First Tranche and Second Tranche, Minority Investors would deliver 64 million sharesDue to the obligors underloss for the Tender Offer.year, there is no diluted effect on this result.
In addition, on January 31, 2016, Dolphin and ETH (or anyThe accompanying notes are an integral part of their related parties) would purchase the remaining shares held by the Minority Investors for a total of NIS 90 million, payable on that same date.
- | If the sale of Clal is consummated, IDBD will carry out a partial bond repurchase offering at par value among all series of bonds. |
these condensed financial information. - | The Trustees’ Proposal would be carried out before IDBD launches a new issuance of shares or rights or, alternatively, each new share or right issued would not be part of the proposal as submitted. |
- | The Trustees’ Proposal hasn´t been already approved by the Minority Investors; and such approval would be sought after the proposal is accepted by IDBD, Dolphin and ETH. |
On August 30, 2015, IDBD sent a request on Dolphin and ETH for them to express their position on the Trustees’ Proposal, without setting a specific date for their response.
On September 3, 2015 Dolphin rejected the Trustees' Proposal and, therefore, it is not valid as of the date of issuance of these Financial Statements.
On August 19, 2015, the Arrangement Trustees filed with the competent court an application for it to order an attachment or lien on any funds receivable by ETH from Dolphin by operation of the BMBY clause, and for it to order the transfer of such funds to the Arrangement Trustees as security for the performance of ETH’s joint and several obligations under the Tender Offers.
On August 26, 2015, the Arrangement Trustees and ETH executed an agreement in connection with the item mentioned in the previous paragraph whereby it was agreed that the Arrangement Trustees would suspend the above mentioned application until the arbitration decision concerning the BMBY; to such end, ETH promised to give notice to the Arrangement Trustees as soon as the arbitrator rules on the subject. Notice has been given to the competent court of the referred agreement between ETH and the Arrangement Trustees.
F- 200 Cresud Sociedad Anónima, Comercial, Inmobiliaria, Financiera y Agropecuaria
Notes to the Consolidated Financial Statements(Continued) (All amounts in thousandsmillions of Argentine Pesos, except shares and per share data and as otherwise indicated)
45. | Subsequent events (Continued)
|
On September 9, 2015, The Arrangement Trustees filed to the Tel Aviv District Court an amended application for instructions (the “Application of the Arrangement Trustees”), to which Dolphin, IFISA, ETH and others were added as parties, requesting the Court to instruct that: (i) IFISA is obligated to all the Investors' obligations under the Arrangement; (ii) the IDBD shares held by any entity controlled by Mr. Elsztain (including Dolphin) are not entitled to participate in the Tender Offers; and (iii) IDBD shares held by Mr. Elsztain and Mr Ben Moshe and/or by any other entity controlled by them, and were transferred or will be transferred to others, are also not entitled to participate in the Tender Offers.
On September 24, 2015, the arbitrator rendered an arbitration award concerning the BMBY process according to which Dolphin and IFISA are the buyers in the BMBY process, and ETH is the seller. ETH is committed to sell all the shares of the Company that it holds at the price proposed in the BMBY proposal (NIS 1.64 per share). Dolphin will pledge in favor of the Arrangement Trustees all the shares used as collateral for the performance of the Tender Offers, and Dolphin has to perform ETH’s obligations included in the Arrangement, including the commitment to carry out Tender Offers and the obligation to participate in rights offerings.
On October 11, 2015, the BMBY process concluded and IFISA purchased all ETH’s shares in IDBD (92,665,925 shares), at a price per share of NIS 1.64, for a total consideration of approximately NIS 152 million (equivalent to US$ 39.7 million as of the date of the transaction). Upon the closing of the transaction, all ETH’s directors in IDBD presented their irrevocable resignation to IDBD’s Board of Directors and the Shareholders Agreement automatically terminated in accordance with its terms. Furthermore, on the same date, Dolphin pledged additional shares as security of the performance of the Tender Offers, rising the number to 64,067,710 pledged shares.Schedule III (Continued)
On October 19,Statements of Comprehensive Income
for the fiscal years ended June 30, 2016, 2015 Dolphin and IFISA submitted their response to Court regarding the Application of the Arrangement Trustees in which, among other things, Dolphin clarified that as the offeror in the Tender Offers, it does not intent and will not participate as an offeree in the Tender Offers. Notwithstanding, according to Dolphin’s position, it has the right to offer to any other shareholder of IDBD, including entities controlled by Eduardo S. Elsztain, to purchase shares within the Tender Offers and also to sell shares to third parties (including those controlled by Eduardo S. Elsztain), and the shares being sold are able to participate as offerees in the Tender Offers, without derogating from Dolphin’s undertakings according to which 106.6 million shares held by it will not participate in the Tender Offers, as long as they are held by entities controlled by Eduardo S. Elsztain).2014 | | 06.30.16 | | 06.30.15 | | 06.30.14 | | Loss for the year | (1,038) | | (250) | | (1,068) | | Other comprehensive income: | | | | | | | Items that may be reclassified subsequently to profit or loss: | | | | | | | Currency translation adjustment from subsidiaries, associates and joint ventures… | 422 | | (191) | | 631 | | Other comprehensive loss from share of changes in subsidiaries’ equity | (30) | | - | | - | | Other comprehensive income for the year (i) | 392 | | (191) | | 631 | | Total comprehensive income for the year | (646) | | (441) | | (437) |
(i) Components of other comprehensive income do not generate any impact on the income tax. F-275
The accompanying notes are an integral part of these condensed financial information. Cresud Sociedad Anónima, Comercial, Inmobiliaria, Financiera y Agropecuaria
Notes to the Consolidated Financial Statements(Continued) (All amounts in thousandsmillions of Argentine Pesos, except shares and per share data and as otherwise indicated) 45. | Subsequent eventsSchedule III (Continued) (Continued)
|
Statements of Changes in Shareholders’ Equity On October 20,for the fiscal years ended June 30, 2016, 2015 the Court decided to grant declaratory remedies requested in the Application of the Arrangement Trustees, according to which:and 2014
- | The shares held by Dolphin and any other company controlled by Eduardo S. Elsztain are not entitled to participate as offerees in the Tender Offers |
| | Share capital | Treasury shares | Inflation adjustment of share capital and treasury shares (i) | Share premium | Additional paid-in capital from Treasury Shares | Legal reserve | Other reserves | Accumulated deficit | Total Shareholders’ equity |
|
| | Balance as of June 30, 2015 | 495 | 7 | 65 | 659 | 13 | - | 579 | (245) | 1,573 | | Loss for the year | - | - | - | - | - | - | - | (1,038) | (1,038) | | Other comprehensive income for the year | - | - | - | - | - | - | 392 | - | 392 | | Total comprehensive income for the year | - | - | - | - | - | - | 392 | (1,038) | (646) | | As provided by Ordinary and Extraordinary Shareholders’ Meeting held on October 30, 2015 and on November 26, 2015: | | | | | | | | | | | - Reserve for future dividends | - | - | - | - | - | - | 31 | (31) | - | | - Legal reserve | - | - | - | - | - | 83 | - | (83) | - | | Equity-settled compensation | - | - | - | - | - | - | 17 | - | 17 | | Equity incentive plan granted | - | - | - | - | 3 | - | (4) | 1 | - | | Changes in interest in subsidiaries | - | - | - | - | - | - | 106 | - | 106 | | Cumulative translation adjustment for interest held before business combination | - | - | - | - | - | - | (58) | - | (58) | | Share of changes in subsidiaries’ equity | - | - | - | - | - | - | 23 | - | 23 | | Reimbursement of expired dividends | - | - | - | - | - | - | - | 6 | 6 | | Balance as of June 30, 2016 | 495 | 7 | 65 | 659 | 16 | 83 | 1,086 | (1,390) | 1,021 |
- | the shares held or that were held by Dolphin and/or by companies controlled by Mr. Elsztain and which were transferred or will be transferred by them to other parties, will not be entitled to participate in the Tender Offers |
(i) Includes Ps. 1 and Ps. 1 of inflation adjustment of Treasury Shares as of June 30, 2016 and 2015, respectively. - | These remedies will not apply to shares which were acquired from the minority shareholders within the framework of the trade in the stock exchange and which came into the possession of IFISA. |
On October 26, 2015, and following the court decision dated on October 20.1015 and the declaratory remedies submitted Dolphin and IFISA have sent a letter that, according to their position, and as detailed in the letter: (a) The reservation prescribed by the court vis-à-vis the shares which were acquired from the minority shareholders in trading on the stock exchange and which came into the possessionaccompanying notes are an integral part of IFISA, applies to the 127,441,396 shares of the Company held by IFISA and 131,600 shares of the Company held by Dolphin, which should be entitled to participate as offerees in the Tender Offers; and (b) with respect of the 51,760,322 additional shares of IDBD presently held by Dolphin, originating in acquisitions from minority shareholders in IDBD, DN and IFISA believe that, according to that state in the Court decision, these shares cannot participate as an offeree in the tender offers, so long as they are held by Dolphin, however Dolphin is not estopped from selling these shares to any third parties, and that in such a case, that third party shall have the right to participate in the Tender Offers for these shares.condensed financial information.
On October 29, 2015, the Arrangement Trustees filed an urgent application for a contempt of court order against Dolphin and IFISA and to enforce them to follow the court's instructions of October 20, 2015, alleging that the letter of Dolphin and IFISA, published by IDBD on October 27, 2015, which informed of the quantity of shares purchased from the minority shareholders within the framework of the trade in the stock exchange is contrary to the court's decision and thus Dolphin and IFISA are acting in contempt of court. The Arrangement Trustees further argued that since Dolphin and IFISA are ignoring the court's decision and since the damage to the public, including to the Arrangement creditors, accumulating daily, the court is requested to impose a fine, in a material amount set by the court, for each day that they ignore the court decision and as long as they do not take action that the Company will amend its reports so that they reflect the court decision. According the court's decision dated October 30, 2015, Dolphin and IFISA are requested to submit their response within three days.
On October 29, 2015, Dolphin and IFISA filed an appeal to the Supreme Court, with respect to the court decision of October 20, 2015, also requesting to hold an urgent hearing on the appeal. The hearing on the appeal was scheduled for December 16, 2015.
On November 2, 2015, Dolphin and IFISA submitted their response to the Application for Contempt, requesting court to dismiss the application as the Contempt of Court Ordinance does not apply to declaratory remedies and as Dolphin and IFISA did not violate any court order.
On November 4, 2015, the Arrangement Trustees filed a rejoinder to Dolphin´s and IFISA's response to the Application for Contempt, requesting the Court to clarify that the Reservation (as defined below) determined in the Court's decision dated October 20, 2015 shall apply exclusively in the case the following
Cresud Sociedad Anónima, Comercial, Inmobiliaria, Financiera y Agropecuaria
Notes to the Consolidated Financial Statements(Continued) (All amounts in thousandsmillions of Argentine Pesos, except shares and per share data and as otherwise indicated) 45. | Schedule III (Continued) Statements of Changes in Shareholders’ Equity for the fiscal years ended June 30, 2016, 2015 and 2014 | | Share capital | Treasury shares | Inflation adjustment of share capital and treasury shares (i) | Share premium | Additional paid-in capital from Treasury Shares | Share warrants | Legal reserve | Special reserve | Other reserves | Accumulated deficit | Total Shareholders’ equity | | Balance as of June 30, 2014 | 491 | 11 | 65 | 773 | - | 106 | 82 | 634 | 851 | (1,066) | 1,947 | | Profit for the year | - | - | - | - | - | - | - | - | - | (250) | (250) | | Other comprehensive loss for the year | - | - | - | - | - | - | - | - | (191) | - | (191) | | Total comprehensive income for the year | - | - | - | - | - | - | - | - | (191) | (250) | (441) | | As provided by Shareholders’ Meeting held on November 14, 2014: | | | | | | | | | | | | | - Share Distribution | 6 | (6) | - | - | - | - | - | - | - | - | - | | - Share premium | | | | (221) | - | - | - | - | - | 221 | - | | - Legal reserve | - | - | - | - | - | - | (82) | - | - | 82 | - | | - Reserve for new developments | - | - | - | - | - | - | - | - | (17) | 17 | - | | - Other reserves | - | - | - | - | - | - | - | (634) | - | 634 | - | | - Reserve for repurchase of shares | - | - | - | - | - | - | - | - | (113) | 113 | - | | - Exercise of warrants | - | - | - | 1 | - | - | - | - | - | - | 1 | | Equity-settled compensation | - | - | - | - | - | - | - | - | 28 | - | 28 | | Purchase of treasury shares | (3) | 3 | - | - | - | - | - | - | (32) | - | (32) | | Maturity of share warrants | - | - | - | 106 | - | (106) | - | - | - | - | - | | Equity incentive plan granted | 1 | (1) | - | - | 13 | - | - | - | (16) | 3 | - | | Changes in interest in subsidiaries | - | - | - | - | - | - | - | - | 69 | - | 69 | | Reimbursement of expired dividends | - | - | - | - | - | - | - | - | - | 1 | 1 | | Balance as of June 30, 2015 | 495 | 7 | 65 | 659 | 13 | - | - | - | 579 | (245) | 1,573 |
(i)Includes Ps. 1 and Ps. 1 of inflation adjustment of Treasury hares as of June 30, 2015 and 2014, respectively. The accompanying notes are an integral part of these condensed financial information. Subsequent events (Continued)
|
conditions apply: (1) that the shares were acquired in the market from the public; (2) the acquisition was made within the framework of trading on the TASE; and (3): that the shares are currently held by IFISA; accordingly, the Court was requested to clarify that the Dolphin´s and IFISA's position as filed in the letter dated October 26, 2015 is not and cannot be the correct interpretation of the Judgment.
Cresud Sociedad Anónima,Comercial, Inmobiliaria, Financiera y Agropecuaria On November 4, 2015, Dolphin and IFISA filed their responseNotes to the rejoinderConsolidated Financial Statements(Continued)
(All amounts in millions of the Arrangement Trustees, requesting the Court to dismiss the Arrangement Trustees' request to clarify the judgment.Argentine Pesos, except otherwise indicated) On November 5, Schedule III (Continued) Statements of Changes in Shareholders’ Equity for the fiscal years ended June 30, 2016, 2015 the Court decided to deny the Application for Contempt filed by Arrangement Trustees. However, the Court stated that Dolphin and IFISA's interpretation of the Reservation in the Decision dated October 20, 2015, within Dolphin and IFISA's letter, stand in contradiction insofar as with regard to the scope of the Reservation. On November 5, 2015, the Arrangement Trustees sent a letter to Dolphin and IFISA, demanding them, in light of the Court's decision of the same day, to amend Dolphin and IFISA's letter and to inform the Securities Authority and IDBD that all the tender offers will be addressed to the minority shareholders of IDBD and that Dolphin and/or IFISA and any corporation under the control of Mr. Elsztain, will not be offerees in the tender offers and that every share which will be transferred by them to third party, if transferred, will also not be entitled to be an offeree in the tender offer.
On November 5, 2015, the Arrangement Trustees sent a letter to IDBD, demanding it, in light of the Court's decision of the same day, to amend Dolphin and IFISA's letter and to inform the public and the Securities Authority immediately that Dolphin and IFISA's Letter as published by IDBD, is inconsistent with the court's decision and that all the shares held by Dolphin and IFISA or any corporation within the Elsztain Group or which shall be purchased from those corporations, shall not carry a right to participate in the tender offers as an offeree.
On November 10, 2015, following the request of the ISA to IDBD, IDBD approached Dolphin and IFISA in order to obtain their position with regard to the amount of shares held by corporations controlled by Mr. Eduardo Sergio Elsztain and which are entitled to participate in the Tender Offers according to the Reservation in the Court's decision dated October 20, 2015 (the "First Decision"; the "Reservation") and following the Court's decision dated November 5, 2015 (the "Second Decision"). In response to this request, Dolphin and IFISA notified IDBD that their position, as expressed in Dolphin and IFISA's letter, remains unchanged.
On November 10, 2015, Dolphin and IFISA filed an application to the Supreme Court to schedule the hearing on the appeal, which was scheduled for December 16, 2015, to an earlier date, due to the fact that Dolphin has to publish a Tender Offer by December 31, 2015, in order to have a high level of certainty regarding the legal situation as soon as possible.2014
On November 12, | | Share capital | Treasury shares | Inflation adjustment of share capital and treasury shares (i) | Share premium | Share warrants | Legal reserve | Special reserve | Other reserves | Accumulated deficit | Total Shareholders’ equity | | Balance as of June 30, 2013 | 497 | 5 | 65 | 773 | 106 | 47 | 696 | 326 | (27) | 2,488 | | Loss for the year | - | - | - | - | - | - | - | - | (1,068) | (1,068) | | Other comprehensive income for the year | - | - | - | - | - | - | - | 631 | - | 631 | | Total comprehensive income for the year | - | - | - | - | - | - | - | 631 | (1,068) | (437) | | As provided by Shareholders’ Meeting held on October 31, 2013: | | | | | | | | | | | | - Legal reserve | - | - | - | - | - | 35 | (35) | - | - | - | | - Other reserves | - | - | - | - | - | - | (27) | - | 27 | - | | - Cash dividends | - | - | - | - | - | - | - | (120) | - | (120) | | Equity-settled compensation | - | - | - | - | - | - | - | 63 | - | 63 | | Changes in interest in subsidiaries | - | - | - | - | - | - | - | 7 | - | 7 | | Purchase of treasury shares | (6) | 6 | - | - | - | - | - | (55) | - | (55) | | Cancellation of BrasilAgro warrants | - | - | - | - | - | - | - | (1) | - | (1) | | Reimbursement of expired dividends | - | - | - | - | - | - | - | - | 2 | 2 | | Balance as of June 30, 2014 | 491 | 11 | 65 | 773 | 106 | 82 | 634 | 851 | (1,066) | 1,947 |
(i) Includes Ps. 1 and Ps. 1 of inflation adjustment of Treasury Shares as of June 30, 2014 and 2013, respectively. The accompanying notes are an integral part of these condensed financial information. Cresud Sociedad Anónima, Comercial, Inmobiliaria, Financiera y Agropecuaria Notes to the Consolidated Financial Statements(Continued) (All amounts in millions of Argentine Pesos, except otherwise indicated) Schedule III (Continued) Statements of Cash Flows for the fiscal years ended June 30, 2016, 2015 IDBD reported that,and 2014 | | 06.30.16 | | 06.30.15 | | 06.30.14 | | Operating activities: | | | | | | | Cash used in operations | (97) | | (232) | | (158) | | Net cash used in operating activities | (97) | | (232) | | (158) | | Investing activities: | | | | | | | Acquisition of subsidiaries, associates and joint ventures | - | | (20) | | - | | Capital contribution to subsidiaries, associates and joint ventures | (20) | | (1) | | (7) | | Proceeds from sale of interest in companies | 86 | | 183 | | - | | Purchases of investment properties | (1) | | (4) | | (2) | | Purchases of property, plant and equipment | (33) | | (60) | | (38) | | Proceeds from sale of investment properties | 1 | | - | | - | | Proceeds from sale of property, plant and equipment | 1 | | 2 | | 1 | | Proceeds from sale of farmlands | - | | 162 | | - | | Purchase of investment in financial assets | (1,227) | | (1,778) | | (2,200) | | Proceeds from disposals of Investment in financial assets | 1,340 | | 2,145 | | 2,238 | | Loans granted to subsidiaries, associates and joint ventures | (3) | | (8) | | (52) | | Proceeds from loans granted to subsidiaries, associates and joint ventures | 80 | | 55 | | 243 | | Cash incorporated by merger net of cash paid | - | | 1 | | - | | Dividends received | 85 | | 43 | | 15 | | Net cash generated from investing activities | 309 | | 720 | | 198 | | Financing activities: | | | | | | | Repurchase of equity interest | - | | (32) | | (55) | | Proceeds from issuance of non-convertible notes | 390 | | 803 | | 834 | | Payment of non-convertible notes | (186) | | (1,079) | | (603) | | Repurchase of non-convertible notes | (88) | | (305) | | (24) | | Dividend payments | - | | - | | (120) | | Borrowings | 852 | | 523 | | 118 | | Proceeds from derivative financial instruments | 142 | | (122) | | - | | Borrowings from subsidiaries, associates and joint ventures | 102 | | - | | 23 | | Payments of borrowings | (1,114) | | (102) | | (12) | | Payments of borrowings from subsidiaries, associates and joint ventures | (8) | | - | | - | | Payment of seller financing | (1) | | - | | - | | Payments of warrants | - | | - | | (1) | | Proceeds from warrants | - | | 1 | | - | | Interest paid | (310) | | (210) | | (185) | | Net Cash flows used in financing activities | (221) | | (523) | | (25) | | Net (decrease) / increase in cash and cash equivalents | (9) | | (35) | | 15 | | Cash and cash equivalents at beginning of the year | 18 | | 53 | | 37 | | Currency translation adjustment on cash and cash equivalents | 2 | | - | | 1 | | Cash and cash equivalents at end of the year | 11 | | 18 | | 53 |
The accompanying notes are an integral part of these condensed financial information. Cresud Sociedad Anónima, Comercial, Inmobiliaria, Financiera y Agropecuaria Notes to the Consolidated Financial Statements(Continued) (All amounts in millions of Argentine Pesos, except otherwise indicated) Schedule III (Continued) 1. Basis of preparation and summering of the significant accounting policies The Financial Statements of the Company for the years ended June 30, 2016 and 2015 have been prepared in accordance with the Technical Resolution N° 26 of the Argentine Federation of Professional Councils in Economic Sciences ("FACPCE", as per its Spanish acronym), adopted by the National Securities Commission ("CNV", as per its Spanish acronym). This Technical Resolution differs from International Accounting Standard ("IAS") 1 “Presentation of Financial Statements” issued by the International Accounting Standards Board ("IASB"), in reference to the accounting measurement criteria of the investments in subsidiaries, joint ventures and associates, which are accounted for under the equity method described by IAS 28 “Investments in Associates”. This criterion differs from the provisions of paragraph 38 of IAS 27 “Separate Financial Statements”, whereby such investments are measured at cost or fair value. The Company adopted IFRS in the fiscal year beginning on July 1st, 2012, being its request, Dolphin extendedtransition date July 1st, 2011. The CNV, through General Resolutions N° 562/09 and 576/10, has provided for the validityapplication of Technical Resolution N° 26 and its commitment with regardamendment Technical Resolution N° 29 of the FACPCE, which adopt the International Financial Reporting Standards (“IFRS”), issued by the International Accounting Standards Board (“IASB”), for companies subject to the public offering soregime ruled by Law 17,811, due to the listing of their shares or corporate notes, and for entities that it willhave applied for authorization to be performed no later than November 17, 2015listed under the mentioned regime.
The principal accounting policies adopted of these Financial Statements are included in Note 2 to the Audited Consolidated Financial Statements except for the accounting measurement criteria of the investments in subsidiaries, joint ventures and associates explained in the paragraph above.
Cresud Sociedad Anónima, Comercial, Inmobiliaria, Financiera y Agropecuaria Notes to the Consolidated Financial Statements(Continued) (All amounts in millions of Argentine Pesos, except otherwise indicated) Schedule III (Continued) 2. Investment in subsidiaries, associates and joint ventures Set out below are the changes in Company’s investment in subsidiaries, associates and joint ventures for the fiscal years ended June 30, 2016 and 2015: | | June 30, 2016 | | June 30, 2015 | | | Beginning of the year | 2,493 | | 2,901 | | | Balance incorporated by merger with Cactus | - | | (63) | | | Acquisition of subsidiaries (i) | 66 | | (5) | | | Capital contribution | 127 | | 1 | | | Disposal of interest in subsidiaries | (22) | | (34) | | | Share of (loss) / profit | (429) | | 121 | | | Other comprehensive loss from share of changes in subsidiaries’ equity | (30) | | - | | | Currency translation adjustment | 364 | | (191) | | | Equity-settled compensation | 10 | | 14 | | | Dividends distributed | (55) | | (53) | | | Reimbursement of expired dividends | 6 | | 1 | | | Intergroup transactions | 3 | | (199) | | | Share of changes in subsidiaries’ equity | 24 | | - | | | End of the year | 2,557 | (ii) | 2,493 | (ii) |
(i) Includes the effect of changes in subsidiaries as consequence of repurchase of equity interest. (ii) Includes a balance of Ps. (3) and Ps. (8) reflecting interests in companies with negative equity as of June 30, 2016 and 2015, which is reclassified to “Provisions” Cresud Sociedad Anónima, Comercial, Inmobiliaria, Financiera y Agropecuaria Notes to the Consolidated Financial Statements(Continued) (All amounts in millions of Argentine Pesos, except otherwise indicated) Schedule III (Continued) Company´s borrowings as of June 30, 2016 and 2015 are as follows: | | | | | | | | | | | | Value as of | | | Secured / unsecured | | Currency | | Fixed / Floating | | Effective interest rate % | | Nominal value (in millions) | | June 30, 2016 | | June 30, 2015 | | Non-current | | | | | | | | | | | | | | | CRESUD NCN Class XIV due 2018 (i) | Unsecured | | US$ | | Fixed | | 1.50 % | | 32 | | 481 | | 290 | | CRESUD NCN Class XVI due 2018 (ii) | Unsecured | | US$ | | Fixed | | 1.50 % | | 109 | | 1,649 | | 999 | | CRESUD NCN Class XVIII due 2019 (iii) | Unsecured | | US$ | | Fixed | | 4.00% | | 34 | | 510 | | 308 | | CRESUD NCN Class XIX due 2016 | Unsecured | | Ps. | | Floating | | Badlar + % + 350 bps | | 187 | | - | | 186 | | CRESUD NCN Class XX due 2017 (iv) | Unsecured | | US$ | | Fixed | | 2.5 % | | 18.2 | | - | | 168 | | CRESUD NCN Class XXII due 2019 (v) | Unsecured | | US$ | | Fixed | | 4.00% | | 22 | | 335 | | - | | Loan from Banco Ciudad | Unsecured | | US$ | | Floating | | Libor + 300 bps or 6% (the higher) | | 15 | | 172 | | 117 | | Loan from Banco de La Pampa | Unsecured | | Ps. | | Floating | | Rate Survey PF 30-59 days | | 20 | | 3 | | 10 | | Non-current borrowings | | | | | | | | | | | 3,150 | | 2,078 |
| | | | | | | | | | | | Value as of | | | Secured / unsecured | | Currency | | Fixed / Floating | | Effective interest rate % | | Nominal value (in millions) | | June 30, 2016 | | June 30, 2015 | | Current | | | | | | | | | | | | | | | CRESUD NCN Class XV due 2015 | Unsecured | | Ps. | | Floating | | 23.67 % | | 176 | | - | | 121 | | CRESUD NCN Class XVI due 2018 (ii) | Unsecured | | US$ | | Fixed | | 1.50 % | | 109 | | 10 | | 5 | | CRESUD NCN Class XVII due 2016 | Unsecured | | Ps. | | Floating | | Badlar + 250 bps | | 176 | | - | | 173 | | CRESUD NCN Class XVIII due 2019 (iii) | Unsecured | | US$ | | Fixed | | 4.00% | | 34 | | 2 | | 1 | | CRESUD NCN Class XIX due 2016 | Unsecured | | Ps. | | Floating | | Badlar + 250 bps | | 187 | | 189 | | 1 | | CRESUD NCN Class XX due 2017 (iv) | Unsecured | | US$ | | Fixed | | 2.50% | | 18 | | 278 | | 3 | | CRESUD NCN Class XXI due 2017 | Unsecured | | Ps. | | Floating | | Badlar + 375 bps | | 192 | | 197 | | - | | Loan from Banco Ciudad | Unsecured | | US$ | | Floating | | Libor + 300 bps or 6% (the higher) | | 15 | | 28 | | 10 | | Loan from Banco de La Pampa | Unsecured | | Ps. | | Floating | | Rate Survey PF 30-59 days | | 20 | | 7 | | 7 | | Loan from Banco de la Provincia de Buenos Aires | Unsecured | | Ps. | | Fixed | | 15.01% | | 24 | | 17 | | 7 | | Loan from Banco de la Provincia de Buenos Aires | Unsecured | | US$ | | Fixed | | 3.50% | | 15 | | 225 | | - | | Related parties borrowings (Note 32) | Unsecured | | US$ | | Fixed | | 4.21% | | 5 | | 99 | | - | | Bank overdrafts | Unsecured | | Ps. | | Fixed | | 29.17% | | - | | 114 | | 583 | | Current borrowings | | | | | | | | | | | 1,166 | | 911 | | Total borrowings | | | | | | | | | | | 4,316 | | 2,989 |
(i) Includes an outstanding balance of Ps. 28 with ERSA as of 06.30.2016. (ii) Includes an outstanding balance of Ps. 12, Ps. 133 and Ps. 16 with ERSA, IRSA CP and PAMSA, respectively, as of 06.30.16. (iii) Includes an outstanding balance of Ps. 8 with IRSA CP as of June 30, 2016. (iv) Includes an outstanding balance of Ps. 35, Ps. 21 and Ps. 99 with ERSA, IRSA CP and PAMSA, respectively as of 06.30.16 and include Ps. 22 and Ps. 92 with ERSA and PAMSA, respectively, as of 06.30.15. (v) Includes an outstanding balance of Ps. 15 with IRSA CP as of June 30, 2016. Cresud Sociedad Anónima, Comercial, Inmobiliaria, Financiera y Agropecuaria Notes to the Consolidated Financial Statements(Continued) (All amounts in millions of Argentine Pesos, except otherwise indicated) Schedule III (Continued) Borrowings also include liabilities under finance leases where the Company is the lessee and which therefore have to be measured in accordance with IAS 17 “Leases”. The maturity of the Company’s borrowings (excluding finance leases) and the Company's exposure to fixed and variable interest rates was as follows: | | June 30, 2016 | | June 30, 2015 | | Do accrue interest: | | | | | Less than one year | 1,135 | | 890 | | Between 1 and 2 years | 1,339 | | 373 | | Between 2 and 3 years | 458 | | 810 | | Between 3 and 4 years | 1,291 | | 670 | | Between 4 and 5 years | 23 | | 181 | | More than 5 years | 34 | | 35 | | | 4,280 | | 2,959 | | Do not accrued interest | | | | | Less than one year | 31 | | 21 | | Between 1 and 2 years | 5 | | 4 | | Between 2 and 3 years | - | | 4 | | Between 3 and 4 years | - | | 1 | | | 36 | | 30 | | | 4,316 | | 2,989 |
The fair value of current borrowings at fixed-rate and current and non-current borrowings at floating-rate equals their carrying amount, as the impact of discounting is not significant. The fair value of all debts that are not quoted in the market are valued at their technical value that is nominal value plus accrued interest. Cresud Sociedad Anónima, Comercial, Inmobiliaria, Financiera y Agropecuaria Notes to the Consolidated Financial Statements(Continued) (All amounts in millions of Argentine Pesos, except otherwise indicated) Schedule III (Continued) The fair value of current and non-current borrowings for the years ended June 30, 2016 and 2015 is as follows: | | June 30, 2016 | | June 30, 2015 | | CRESUD Class XIV NCN due 2018 | 481 | | 261 | | CRESUD Class XV NCN due 2015 | - | | 121 | | CRESUD Class XVI NCN due 2018 | 1,649 | | 889 | | CRESUD Class XVII NCN due 2016 | - | | 173 | | CRESUD Class XVIII NCN due 2019 | 510 | | - | | CRESUD Class XIX NCN due 2016 | 189 | | 189 | | CRESUD Class XX NCN due 2017 | 278 | | 166 | | CRESUD Class XXI NCN due 2017 | 197 | | - | | CRESUD Class XXII NCN due 2019 | 335 | | - | | Bank loans | 452 | | 151 | | Bank overdrafts | 114 | | 583 | | Related parties | 99 | | - | | Total | 4,304 | | 2,533 |
45. | Subsequent events (Continued)
|
(instead of the original date of November 15, 2015), which was further extended until December 1, 2015. There is no certainty at this time for the execution of the offering or to its terms. In addition, IDBD was notified by Dolphin, that discussions are being held between Dolphin and the Arrangement Trustees for a potential amendment to the Arrangement with regard to the Tender Offers. IDBD further reported that the Arrangement Trustees sent a letter stating that the amendments to the Arrangement regarding the Tender Offers are not acceptable for the bondholders, and that the bondholders may convoke a bondholders´ meeting to discuss such issues if IDBD´s Board of Directors do not disapprove such proposal. The Company is assessing its defense strategy, as well as the impact of the closing of the BMBY process with IFISA as the purchaser of the shares of IDBD by Extra.
On November 11, the lock-up under the TASE regulations expired, and therefore there are no shares restricted under this item as of the date of issuance of these financial statements.
Condor
On July 23, 2015, RES, IRSA and Condor entered into an agreement in relation to a potential exchange of preferred shares Series A, Series B and Series C for ordinary shares.
RES has accepted that, if Condor gets acceptance of at least 80% of the preferred shares Series A and B, then RES will convert pro rata its convertible preferred shares Series C.
The agreement specifies that the conversion price for preferred shares A and B into ordinary shares is US$ 2.3254 per share, while the price for Series C is US$ 1.60 per share. Furthermore, in consideration for cumulative unpaid dividends, holders of such shares will receive an amount of additional ordinary shares at a share price of US$ 2.3254.
45. | Subsequent events (Continued)
|
The agreement further provides that, if the exchange is carried out, Condor’s bylaws will be amended upon prior approval of shareholders in order to:
• eliminate the limitation that bans RES from holding more than 34% of issued and outstanding ordinary shares;
• eliminate the obligation to exchange preferred shares Series B if a person or group holds more than 35% of voting shares of Condor; and
• Authorize the issuance of non-voting ordinary shares.
As regards warrants previously issued to RES, 50% would be extended till January 31, 2018, and the other 50% until January 31, 2019.
RES would receive a combination of voting and non-voting shares so that its voting power in no event exceeds 49%.
On August 31, the exchange process was extended until October 12, 2015.
On September 2015, Condor terminated its offer to exchange preferred shares to common and cancelled its special meeting of shareholders scheduled for October 8, 2015 to obtain shareholder approvals to the conditions of the exchange offer.
·On July 20, 2015 Brazil Federal Revenue Office approved and refunded Brasilagro for the amount included in the petition in relation to CSLL accumulated receivables with negative balance for calendar year 2012 and the income tax negative balance for fiscal year 2013 in the amount of Rs. 239 (Ps. 700) and Rs. 1,600 (Ps. 4,688), respectively, and the value of Rs. 165 (Ps. 483) regarding the request made by its controlled company Jaborandi Agrícola. In addition, on July 20, 2015 Brazil Federal Revenue Office approved and refunded the value included in the petition related to cumulative receivables related to PIS and COFINS (Social Integration Program and Social Security Financing Lev in November 2014. Total sum of money refunded by the Federal Revenue Office amounted to Rs. 39 (Ps. 114) and is available in the current account of Brasilagro.
·Pursuant to share repurchase program, Brasilagro may repurchase up to 698,310 shares or 2% of the ordinary shares issued and outstanding. In July 2015, total shares repurchased by Brasilagro was 209,200 shares for a total amount of Rs. 2,334 (Ps. 6,839).
45. | Subsequent events (Continued)
|
·Brasilagro and Jaborandi Ltda. will pay the rural harvest financing agreements entered into with Banco do Nordeste – BNB, after the balance sheet date (June 30, 2015). On July 31 2015, principal was repaid in the amount of Rs. 23,733 (Ps. 69,538) and on August 1, 2015 interest was paid in an amount of Rs. 2,022 (Ps. 5,924).
·On August 7, 2015, the directors of Brasilagro exercised their call options for 233,689 shares at an exercise price of Rs. 2,006 (Ps. 5,878) referring to the First Share Option Program.
REPORT OF INDEPENDENT REGISTERED PUBLIC ACCOUNTING FIRM
To the Board of Directors and Shareholders of BancoHipotecarioBanco Hipotecario S.A.
We have audited the accompanying consolidated balance sheets of BancoHipotecarioBanco Hipotecario S.A. and its subsidiaries (collectively referred to as the “Bank”) as of June 30, 20152016 and 20142015 and the related consolidated statements of income, of changes in shareholders' equity and of cash flows for each of the three twelve-month periods in the period ended June 30, 2015.2016. These financial statements are the responsibility of the Bank's management. Our responsibility is to express an opinion on these consolidated financial statements based on our audits.
We conducted our audits in accordance with the standards of the Public Company Accounting Oversight Board (United States). Those standards require that we plan and perform an audit to obtain reasonable assurance about whether the financial statements are free of material misstatement. An audit includes examining, on a test basis, evidence supporting the amounts and disclosures in the financial statements. An audit also includes assessing the accounting principles used and significant estimates made by management, as well as evaluating the overall financial statement presentation. We believe that our audits provide a reasonable basis for our opinion.
In our opinion, the consolidated financial statements referred to above present fairly, in all material respects, the financial position of BancoHipotecarioBanco Hipotecario S.A. and its subsidiaries atas of June 30, 20152016 and 2014,2015, and the results of their operations and their cash flows for each of the three twelve-month periods in the period ended June 30, 20152016 in conformity with accounting rules prescribed by the Banco Central de la República Argentina (the “BCRA”).
The Bank’s consolidated financial statements have been prepared in accordance with Argentine Banking GAAP, which differs in certain significant respects from U.S. GAAP. Such differences involve methods of measuring the amounts shown in the consolidated financial statements, as well as additional disclosures required by U.S. GAAP and regulations of the SEC. These consolidated financial statements include solely a reconciliation of net income and shareholders’ equity to U.S. GAAP. Pursuant to Item 17 of Form 20-F, this reconciliation does not include disclosure of all information that would be required by U.S. GAAP and regulations of the SEC. Information relating to the nature and effect of the differences between accounting rules prescribed by the BCRA and U.S. GAAP is presented in Note 34 to the consolidated financial statements. Buenos Aires, Argentina
August 7, 2015, except for notes 34 and 36 as to which the date is November 17, 2015
| | Price Waterhouse & Co. S.R.L. | | | | Buenos Aires, Argentina | | | | | August 10, 2016, except for notes 37 and 39 as to which the date is October 31, 2016 | | | | | | | | | | | | | | | | | | | | Price Waterhouse & Co S.R.L. | By: | /s/ Marcelo Trama | | | | | | | | Name Marcelo Trama | | | | | By:/s/ Diego Sisto
| | Title Partner | | | | Diego Sisto |
| | | | | | Partner |
| | | | | |
BANCO HIPOTECARIO SA AND SUBSIDIARIES CONSOLIDATED BALANCE SHEET As of June 30, 20152016 and 20142015 (Expressed in thousands of Argentine pesos, except share data and as otherwise indicated)
| | June 30, | | | | 2015 | | 2014 | | | ASSETS | | | | | | | | | | | | | | | Cash and due from banks | | Ps. | 492,233 | | | Ps. | 610,106 | | | Banks and correspondents | | | 2,709,342 | | | | 2,398,062 | | | | | | 3,201,575 | | | | 3,008,168 | | | | | | | | | | | | | Government and corporate securities (Note 4) | | | 5,271,583 | | | | 3,395,192 | | | | | | | | | | | | | Loans (Note 5) | | | | | | | | | | Mortgage loans | | | 2,413,401 | | | | 2,197,336 | | | Credit card loans | | | 8,500,601 | | | | 5,950,266 | | | Other loans | | | 8,334,879 | | | | 7,277,967 | | | | | | 19,248,881 | | | | 15,425,569 | | | Plus: Accrued interest receivable | | | 218,089 | | | | 150,676 | | | Less: Allowance for loan losses (Note 6) | | | (433,825 | ) | | | (356,267 | ) | | | | | 19,033,145 | | | | 15,219,978 | | | | | | | | | | | | | Other receivables from financial transactions (Note 7) | | | | | | | | | | Collateral receivable under repurchase agreements | | | 35,621 | | | | 60,196 | | | Amounts receivable under derivative financial instruments | | | 4,785 | | | | 45,817 | | | Loans in trust pending securitization | | | 10,301 | | | | 10,776 | | | Amounts receivable under reverse repurchase agreements of government and corporate securities | | | 94,597 | | | | 498,000 | | | Other (Note 7) | | | 3,247,013 | | | | 1,961,678 | | | | | | 3,392,317 | | | | 2,576,467 | | | Plus: Accrued interest receivable | | | 8,440 | | | | 8,165 | | | Less: Allowance for Other receivables from financial transactions | | | (22,611 | ) | | | (11,189 | ) | | | | | 3,378,146 | | | | 2,573,443 | | | | | | | | | | | | | Assets under financial leases | | | 125,461 | | | | 71,907 | | | | | | | | | | | | | Investments in other companies | | | 70,806 | | | | 19,241 | | | | | | | | | | | | | Miscellaneous receivables (Note 8) | | | 1,559,217 | | | | 1,117,890 | | | | | | | | | | | | | Bank premises and equipment (Note 9) | | | 186,320 | | | | 150,489 | | | | | | | | | | | | | Miscellaneous assets (Note 10) | | | 60,413 | | | | 50,483 | | | | | | | | | | | | | Intangible assets (Note 11) | | | 426,148 | | | | 244,540 | | | | | | | | | | | | | Items pending allocation | | | 8,542 | | | | 4,254 | | | | | | | | | | | | | Total Assets | | Ps. | 33,321,356 | | | Ps. | 25,855,585 | |
| | June 30, | | | 2016 | | 2015 | | ASSETS | | | | | | | | | | | | | Cash and due from banks…………………………………………... | Ps. | 607,656 | | Ps. | 492,233 | | Banks and correspondents………………………………………….. | | 2,694,184 | | | 2,709,342 | | | | 3,301,840 | | | 3,201,575 | | | | | | | | | Government and corporate securities (Note 4)…………………….. | | 5,269,499 | | | 5,271,583 | | | | | | | | | Loans (Note 5) | | | | | | | Mortgage loans…………………………………………………... | | 2,429,322 | | | 2,413,401 | | Credit card loans…………………………………………………. | | 10,573,083 | | | 8,500,601 | | Other loans……………………………………………………….. | | 9,203,915 | | | 8,334,879 | | | | 22,206,320 | | | 19,248,881 | | Plus: Accrued interest receivable………………………………… | | 240,885 | | | 218,089 | | Less: Allowance for loan losses (Note 6)……………………..…. | | (493,536) | | | (433,825) | | | | 21,953,669 | | | 19,033,145 | | | | | | | | | Other receivables from financial transactions (Note 7) | | | | | | | Collateral receivable under repurchase agreements……………… | | 75,695 | | | 35,621 | | Amounts receivable under derivative financial instruments..…… | | 54,281 | | | 4,785 | | Loans in trust pending securitization ……………………………. | | 8,390 | | | 10,301 | | Amounts receivable under reverse repurchase agreements of government and corporate securities …………..……...……….. | | 541,283 | | | 94,597 | | Other (Note 7)..……………….………………………….………. | | 6,177,987 | | | 3,247,013 | | | | 6,857,636 | | | 3,392,317 | | Plus: Accrued interest receivable………………………………... | | 7,577 | | | 8,440 | | Less: Allowance for Other receivables from financial transactions…………………………………………….………. | | (23,624) | | | (22,611) | | | | 6,841,589 | | | 3,378,146 | | | | | | | | | Assets under financial leases……………………………………….. | | 135,302 | | | 125,461 | | | | | | | | | Investments in other companies……………………………………. | | 129,698 | | | 70,806 | | | | | | | | | Miscellaneous receivables (Note 8)..………..…….……………….. | | 1,748,707 | | | 1,559,217 | | | | | | | | | Bank premises and equipment (Note 9)..……..….………………… | | 317,098 | | | 186,320 | | | | | | | | | Miscellaneous assets (Note 10)……..…………….………………... | | 253,467 | | | 60,413 | | | | | | | | | Intangible assets (Note 11)…….…………………..……………….. | | 552,755 | | | 426,148 | | | | | | | | | Items pending allocation……………………………………...……. | | 23,705 | | | 8,542 | | | | | | | | Total Assets…………………...……..…………………………. | Ps. | 40,527,329 | | Ps. | 33,321,356 |
The accompanying notes are an integral part of these consolidated financial statements. BANCO HIPOTECARIO SA AND SUBSIDIARIES CONSOLIDATED BALANCE SHEET – (Continued) As of June 30, 20152016 and 20142015 (Expressed in thousands of Argentine pesos, except share data and as otherwise indicated)
| | | June 30 | | | | | 2015 | | | 2014 | | | | | | | | | | | LIABILITIES AND SHAREHOLDERS' EQUITY | | | | | | | | LIABILITIES | | | | | | | | Deposits | | | | | | | | Checking accounts | | Ps. 3,151,296 | | | Ps. 2,800,899 | | | Saving accounts | | | 2,953,065 | | | | 1,662,444 | | | Time deposits | | | 11,898,186 | | | | 9,049,574 | | | Other deposit accounts | | | 188,604 | | | | 178,426 | | | | | | 18,191,151 | | | | 13,691,343 | | | Plus: Accrued interest payable | | | 237,680 | | | | 215,811 | | | | | | 18,428,831 | | | | 13,907,154 | | | Other liabilities from financial transactions | | | | | | | | | | Other banks and international entities (Note 14) | | | 297,357 | | | | 558,449 | | | Bonds (Note 15) | | | 4,926,694 | | | | 3,501,712 | | | Argentine Central Bank | | | 115 | | | | 81 | | | Amounts payable under derivative financial instruments | | | 334,874 | | | | 300,099 | | | Borrowings under repurchase agreements collateralized by government securities | | | 93,660 | | | | 384,117 | | | Obligation to return securities acquired under reverse repurchase agreements of government and corporate securities (Note 13) | | | 34,481 | | | | 140,804 | | | Other | | | 1,867,191 | | | | 1,083,892 | | | | | | 7,554,372 | | | | 5,969,154 | | | Plus: Accrued interest payable | | | 135,471 | | | | 97,156 | | | | | | 7,689,843 | | | | 6,066,310 | | | | | | | | | | | | | Miscellaneous liabilities | | | | | | | | | | Taxes | | | 326,154 | | | | 352,988 | | | Sundry creditors (Note 20) | | | 1,468,191 | | | | 724,210 | | | Other (Note 20) | | | 272,415 | | | | 178,649 | | | | | | 2,066,760 | | | | 1,255,847 | | | | | | | | | | | | | Reserve for contingencies (Note 12) | | | 221,950 | | | | 152,789 | | | | | | | | | | | | | Subordinated bonds (Note 16) | | | 100,452 | | | | - | | | | | | | | | | | | | Items pending allocation | | | 44,847 | | | | 208,293 | | | | | | | | | | | | | Non-controlling interest | | | 67,957 | | | | 59,849 | | | | | | | | | | | | | Total Liabilities | | | 28,620,640 | | | | 21,650,242 | | | | | | | | | | | | | SHAREHOLDERS' EQUITY | | | | | | | | | | | | | | | | | | | | Common stock | | | 1,463,365 | | | | 1,463,365 | | | Treasury stock | | | 54,149 | | | | 54,149 | | | Paid in capital | | | 834 | | | | 834 | | | Inflation adjustment on common stock | | | 699,601 | | | | 699,601 | | | Reserves | | | 1,842,198 | | | | 1,292,226 | | | Retained earnings | | | 640,569 | | | | 695,168 | | | Total Shareholders' Equity | | | 4,700,716 | | | | 4,205,343 | | | Total Liabilities and Shareholders' Equity | | Ps. 33,321,356 | | | Ps. 25,855,585 | |
| | June 30 | | | 2016 | | 2015 | | | | | | | | LIABILITIES AND SHAREHOLDERS' EQUITY | | | | | | | LIABILITIES | | | | | | | Deposits | | | | | | | Checking accounts………………………………………………… | Ps. | 1,564,438 | | Ps. | 3,151,296 | | Saving accounts…………………………………………………… | | 2,848,403 | | | 2,953,065 | | Time deposits……………………………………………………… | | 12,908,292 | | | 11,898,186 | | Other deposit accounts…………………………………………….. | | 178,137 | | | 188,604 | | | | 17,499,270 | | | 18,191,151 | | Plus: Accrued interest payable……………………………………. | | 294,263 | | | 237,680 | | | | 17,793,533 | | | 18,428,831 | | Other liabilities from financial transactions | | | | | | | Other banks and international entities (Note 14)………………….. | | 276,006 | | | 297,357 | | Bonds (Note 15)…………………………………………………… | | 9,270,847 | | | 4,926,694 | | Argentine Central Bank…………………………………………… | | 113 | | | 115 | | Amounts payable under derivative financial instruments.……..… | | 669,472 | | | 334,874 | | Borrowings under repurchase agreements collateralized by government securities……...……………………………………. | | 66,973 | | | 93,660 | | Obligation to return securities acquired under reverse repurchase agreements of government and corporate securities (Note 13)…. | | 590,154 | | | 34,481 | | Other……….………………………………………………….…... | | 3,216,262 | | | 1,867,191 | | | | 14,089,827 | | | 7,554,372 | | Plus: Accrued interest payable……………………………………. | | 358,364 | | | 135,471 | | | | 14,448,191 | | | 7,689,843 | | | | | | | | | Miscellaneous liabilities | | | | | | | Taxes……………………………………………………………… | | 511,106 | | | 326,154 | | Sundry creditors (Note 20)………………………………………... | | 945,888 | | | 1,468,191 | | Other (Note 20)……………………………………………………. | | 384,410 | | | 272,415 | | | | 1,841,404 | | | 2,066,760 | | | | | | | | | Reserve for contingencies (Note 12)………………………………... | | 300,059 | | | 221,950 | | | | | | | | | Subordinated bonds (Note 16)……………………..………………. | | 121,245 | | | 100,452 | | | | | | | | | Items pending allocation………………………………………..…... | | 76,448 | | | 44,847 | | | | | | | | Non-controlling interest ……………………………………………. | | 130,207 | | | 67,957 | | | | | | | | Total Liabilities………………..………………………………. | | 34,711,087 | | | 28,620,640 | | | | | | | | | SHAREHOLDERS' EQUITY | | | | | | | | | | | | | | Common stock………………………………………………………. | | 1,463,365 | | | 1,463,365 | | Treasury stock……………………………………………………….. | | 54,149 | | | 54,149 | | Paid in capital……………………………………………………….. | | 834 | | | 834 | | Inflation adjustment on common stock……………………………... | | 699,601 | | | 699,601 | | Reserves……………………………………………………………... | | 2,059,361 | | | 1,842,198 | | Retained earnings…………………….....………………...…………. | | 1,538,932 | | | 640,569 | Total Shareholders' Equity…………….……………………... | | 5,816,242 | | | 4,700,716 | Total Liabilities and Shareholders' Equity………………..… | Ps. | 40,527,329 | | Ps. | 33,321,356 |
The accompanying notes are an integral part of these consolidated financial statements. BANCO HIPOTECARIO SA AND SUBSIDIARIES CONSOLIDATED STATEMENT OF INCOME For the twelve-month periods ended June 30, 2016, 2015 2014 and 20132014 (Expressed in thousands of Argentine pesos, except share data and as otherwise indicated)
| | | June 30, | | | | | 2015 | | | 2014 | | | 2013 | | | Financial income | | | | | | | | | | | Interest on loans and other receivables from financial transactions | | Ps. | 4,326,324 | | | Ps. | 3,779,073 | | | Ps. | 1,961,272 | | | Income from government and corporate securities. | | | 1,191,396 | | | | 904,985 | | | | 456,004 | | | Other | | | 6,250 | | | | 12,186 | | | | 6,906 | | | | | | 5,523,970 | | | | 4,696,244 | | | | 2,424,182 | | | Financial expenses | | | | | | | | | | | | | | Interest on deposits and other liabilities from financial transactions | | | 2,801,201 | | | | 2,063,512 | | | | 1,120,480 | | | Contributions and taxes on financial income | | | 442,814 | | | | 339,676 | | | | 163,794 | | | | | | 3,244,015 | | | | 2,403,188 | | | | 1,284,274 | | | | | | | | | | | | | | | | | Gross brokerage margin | | Ps. | 2,279,955 | | | Ps. | 2,293,056 | | | Ps. | 1,139,908 | | | | | | | | | | | | | | | | | Provision for loan losses (Note 6) | | | 375,270 | | | | 303,348 | | | | 233,376 | | | Income from services | | | | | | | | | | | | | | Insurance premiums | | | 1,255,436 | | | | 895,129 | | | | 417,368 | | | Commissions (Note 21) | | | 1,295,325 | | | | 866,616 | | | | 670,213 | | | Other (Note 21) | | | 733,262 | | | | 356,153 | | | | 307,398 | | | | | | 3,284,023 | | | | 2,117,898 | | | | 1,394,979 | | | Expenses for services | | | | | | | | | | | | | | Insurance claims | | | 149,871 | | | | 174,715 | | | | 57,583 | | | Commissions (Note 21) | | | 540,542 | | | | 446,257 | | | | 194,064 | | | Contributions and taxes on income from services | | | 78,457 | | | | 61,666 | | | | 39,261 | | | | | | 768,870 | | | | 682,638 | | | | 290,908 | | | Administrative expenses | | | | | | | | | | | | | | Salaries and social security contributions | | | 1,775,548 | | | | 1,284,840 | | | | 844,965 | | | Advertising expenses | | | 179,542 | | | | 118,277 | | | | 88,538 | | | Value added tax and other taxes | | | 167,249 | | | | 113,917 | | | | 115,353 | | | Directors’ and Syndics’ fees | | | 65,788 | | | | 71,027 | | | | 31,774 | | | Fees for administrative services | | | 406,690 | | | | 258,668 | | | | 189,428 | | | Maintenance and repairs | | | 96,821 | | | | 53,981 | | | | 37,186 | | | Electricity and communications | | | 116,907 | | | | 71,942 | | | | 56,515 | | | Depreciation of bank premises and equipment | | | 35,267 | | | | 20,992 | | | | 15,830 | | | Rent | | | 97,482 | | | | 69,774 | | | | 49,895 | | | Other | | | 425,595 | | | | 277,361 | | | | 182,718 | | | | | | 3,366,889 | | | | 2,340,779 | | | | 1,612,202 | | | | | | | | | | | | | | | | | Net income from financial transactions | | Ps. | 1,052,949 | | | Ps. | 1,084,189 | | | Ps. | 398,401 | |
| | | June 30, | | | | 2016 | | 2015 | | 2014 | | Financial income | | | | | | | | Interest on loans and other receivables from financial transactions…………………………. | Ps. | 6,520,816 | Ps. | 4,326,324 | Ps. | 3,779,073 | | Income from government and corporate securities. | | 2,584,524 | | 1,191,396 | | 904,985 | | Other……………………………………….…….. | | 13,177 | | 6,250 | | 12,186 | | | | 9,118,517 | | 5,523,970 | | 4,696,244 | | Financial expenses | | | | | | | | Interest on deposits and other liabilities from financial transactions.………………………… | | 5,008,083 | | 2,801,201 | | 2,063,512 | | Contributions and taxes on financial income….…. | | 682,258 | | 442,814 | | 339,676 | | | | 5,690,341 | | 3,244,015 | | 2,403,188 | | | | | | | | | Gross brokerage margin……..................................... | Ps. | 3,428,176 | Ps. | 2,279,955 | Ps. | 2,293,056 | | | | | | | | | | Provision for loan losses (Note 6)……..…..….……. | | 356,492 | | 375,270 | | 303,348 | | Income from services | | | | | | | | Insurance premiums………………..…………….. | | 1,831,371 | | 1,255,436 | | 895,129 | | Commissions (Note 21)……………..…………… | | 1,783,121 | | 1,295,325 | | 866,616 | | Other (Note 21)……………………..……………. | | 824,753 | | 733,262 | | 356,153 | | | | 4,439,245 | | 3,284,023 | | 2,117,898 | | Expenses for services | | | | | | | | Insurance claims…………………………………. | | 59,077 | | 149,871 | | 174,715 | | Commissions (Note 21)………………………….. | | 917,622 | | 540,542 | | 446,257 | | Contributions and taxes on income from services……………………………………….. | | 112,991 | | 78,457 | | 61,666 | | | | 1,089,690 | | 768,870 | | 682,638 | | Administrative expenses | | | | | | | | Salaries and social security contributions….…..…. | | 2,337,388 | | 1,775,548 | | 1,284,840 | | Advertising expenses……………………….…..… | | 167,040 | | 179,542 | | 118,277 | | Value added tax and other taxes………………….. | | 242,738 | | 167,249 | | 113,917 | | Directors’ and Syndics’ fees……………….…..…. | | 102,926 | | 65,788 | | 71,027 | | Fees for administrative services………………….. | | 622,664 | | 406,690 | | 258,668 | | Maintenance and repairs..………………….……... | | 135,876 | | 96,821 | | 53,981 | | Electricity and communications...………………... | | 177,198 | | 116,907 | | 71,942 | | Depreciation of bank premises and equipment…... | | 59,031 | | 35,267 | | 20,992 | | Rent……………………..………………….……... | | 132,311 | | 97,482 | | 69,774 | | Other……………………………………….…..…. | | 514,293 | | 425,595 | | 277,361 | | | | 4,491,465 | | 3,366,889 | | 2,340,779 | | | | | | | | | | Net income from financial transactions……............. | Ps. | 1,929,774 | Ps. | 1,052,949 | Ps. | 1,084,189 |
The accompanying notes are an integral part of these consolidated financial statements. BANCO HIPOTECARIO SA AND SUBSIDIARIES CONSOLIDATED STATEMENT OF INCOME – (Continued) For the twelve-month periods ended June 30, 2016, 2015 2014 and 20132014 (Expressed in thousands of Argentine pesos, except share data and as otherwise indicated)
| | | June 30, | | | | | 2015 | | | 2014 | | | 2013 | | | | | | | | | | | | | | Miscellaneous income | | | | | | | | | | | Penalty interest | | | 86,874 | | | | 59,281 | | | | 54,833 | | | Loans recoveries | | | 171,781 | | | | 82,104 | | | | 100,834 | | | Other (Note 22) | | | 58,875 | | | | 47,543 | | | | 37,755 | | | | | | 317,530 | | | | 188,928 | | | | 193,422 | | | Miscellaneous expenses | | | | | | | | | | | | | | Provision for other contingencies and miscellaneous receivables | | | 132,614 | | | | 67,564 | | | | 31,058 | | | Other (Note 22) | | | 336,720 | | | | 220,430 | | | | 130,966 | | | | | | 469,334 | | | | 287,994 | | | | 162,024 | | | | | | | | | | | | | | | | | Income before income taxes and Non-controlling interest | | Ps. | 901,145 | | | Ps. | 985,123 | | | Ps. | 429,799 | | | | | | | | | | | | | | | | | Income taxes (Note 24) | | | 377,613 | | | | 369,127 | | | | 76,529 | | | Non-controlling interest | | | 13,658 | | | | 11,031 | | | | (14,148 | ) | | Net income for the period | | Ps. | 537,190 | | | Ps. | 627,027 | | | Ps. | 339,122 | |
| | | June 30, | | | | 2016 | | 2015 | | 2014 | | | | | | | | | | Miscellaneous income | | | | | | | | Penalty interest….…………………………………… | | 96,964 | | 86,874 | | 59,281 | | Loans recoveries.…….……………………………… | | 320,934 | | 171,781 | | 82,104 | | Other (Note 22)……………….……………………... | | 128,645 | | 58,875 | | 47,543 | | | | 546,543 | | 317,530 | | 188,928 | | Miscellaneous expenses | | | | | | | | Provision for other contingencies and miscellaneous receivables………………………………………... | | 290,563 | | 132,614 | | 67,564 | | Other (Note 22)……………………………………..... | | 377,835 | | 336,720 | | 220,430 | | | | 668,398 | | 469,334 | | 287,994 | | | | | | | | | | Income before income taxes and Non-controlling interest..…………………………………………...... | Ps. | 1,807,919 | Ps. | 901,145 | Ps. | 985,123 | | | | | | | | | | Income taxes (Note 24)……………………………..…. | | 698,387 | | 377,613 | | 369,127 | | Non-controlling interest………………………..……..... | | 5,998 | | 13,658 | | 11,031 | | Net income for the period……..…………………. | Ps. | 1,115,530 | Ps. | 537,190 | Ps. | 627,027 |
The accompanying notes are an integral part of these consolidated financial statements.
BANCO HIPOTECARIO SA AND SUBSIDIARIES CONSOLIDATED STATEMENT OF CHANGES IN SHAREHOLDERS' EQUITY For the twelve-month periods ended June 30, 2016, 2015 2014 and 20132014 (Expressed in thousands of Argentine pesos, except share data and as otherwise indicated)
| | | Common stock (Note 26) | | Paid in capital (Note 26) | | Treasury stock (Note 26) | | Inflation adjustment of common stock (Note 26) | Reserves | | Retained earnings | | Total shareholders’ equity | | | Legal (Note 26) | | Voluntary (Note 26) | | | | | | | | | | | | | | | | | | | | Balance as of June 30, 2013……………... | Ps. | 1,463,365 | Ps. | 834 | Ps. | 54,149 | Ps. | 699,601 | Ps. | 526,828 | Ps. | 367,601 | Ps. | 495,938 | Ps. | 3,608,316 | | | | | | | | | | | | | | | | | | | Distribution of retained earnings approved by the General Shareholders’ Meeting held on 08/23/13 | | - | | - | | - | | - | | 68,721 | | 244,886 | | (343,607) | | (30,000) | | | | | | | | | | | | | | | | | | | Distribution of retained earnings approved by the General Shareholders’ Meeting held on 04/24/14 | | - | | - | | - | | - | | 84,190 | | - | | (84,190) | | - | | | | | | | | | | | | | | | | | | | | Net income for the period | | - | | - | | - | | - | | - | | - | | 627,027 | | 627,027 | | | | | | | | | | | | | | | | | | | | Balance as of June 30, 2014……………... | Ps. | 1,463,365 | Ps. | 834 | Ps. | 54,149 | Ps. | 699,601 | Ps. | 679,739 | Ps. | 612,487 | Ps. | 695,168 | Ps. | 4,205,343 | | | | | | | | | | | | | | | | | | | Distribution of retained earnings approved by the General Shareholders’ Meeting held on 04/24/14. Approval of BCRA on 12/23/14 | | - | | - | | - | | - | | - | | - | | (41,817) | | (41,817) | | | | | | | | | | | | | | | | | | | Distribution of retained earnings approved by the General Shareholders’ Meeting held on 03/21/15. | | - | | - | | - | | - | | 109,994 | | 439,978 | | (549,972) | | - | | | | | | | | | | | | | | | | | | | | Net income for the period | | - | | - | | - | | - | | - | | - | | 537,190 | | 537,190 | | | | | | | | | | | | | | | | | | | | Balance as of June 30, 2015……………... | Ps. | 1,463,365 | Ps. | 834 | Ps. | 54,149 | Ps. | 699,601 | Ps. | 789,733 | Ps. | 1,052,465 | Ps. | 640,569 | Ps. | 4,700,716 | | | | | | | | | | | | | | | | | | | Distribution of retained earnings approved by the General Shareholders’ Meeting held on 04/13/16 | | - | | - | | - | | - | | 217,163 | | - | | (217,163) | | - | | | | | | | | | | | | | | | | | | | | Net income for the period | | - | | - | | - | | - | | - | | - | | 1,115,530 | | 1,115,530 | | | | | | | | | | | | | | | | | | | | Balance as of June 30, 2016……………... | Ps. | 1,463,365 | Ps. | 834 | Ps. | 54,149 | Ps. | 699,601 | Ps. | 1,006,896 | Ps. | 1,052,465 | Ps. | 1,538,936 | Ps. | 5,816,242 |
| | | | | | | | | | | Reserves | | | | | | | | | | Common stock (Note 26) | | Paid in capital (Note 26) | | Treasury stock (Note 26) | | Inflation adjustment of common stock (Note 26) | | Legal (Note 26) | | Voluntary (Note 26) | | Retained earnings | | | Total shareholders' equity | | | Balance as of June 30, 2012 | | Ps. | 1,463,365 | | Ps. | 834 | | Ps. | 54,149 | | Ps. | 699,601 | | Ps. | 526,828 | | Ps. | 367,601 | | Ps. | 256,816 | | | Ps. | 3,369,194 | | | | | | | | | | | | | | | | | | | | | | | | | | | | | | Distribution of retained earnings approved by the General Shareholders’ Meeting held on 04/13/11. Approval of BCRA on 09/20/12 | | | - | | | - | | | - | | | - | | | - | | | - | | | (100,000 | ) | | | (100,000 | ) | | | | | | | | | | | | | | | | | | | | | | | | | | | | | | Net income for the period | | | - | | | - | | | - | | | - | | | - | | | - | | | 339,122 | | | | 339,122 | | | | | | | | | | | | | | | | | | | | | | | | | | | | | | | Balance as of June 30, 2013 | | Ps. | 1,463,365 | | Ps. | 834 | | Ps. | 54,149 | | Ps. | 699,601 | | Ps. | 526,828 | | Ps. | 367,601 | | Ps. | 495,938 | | | Ps. | 3,608,316 | | | | | | | | | | | | | | | | | | | | | | | | | | | | | | Distribution of retained earnings approved by the General Shareholders’ Meeting held on 08/23/13 | | | - | | | - | | | - | | | - | | | 68,721 | | | 244,886 | | | (343,607 | ) | | | (30,000 | ) | | | | | | | | | | | | | | | | | | | | | | | | | | | | | Distribution of retained earnings approved by the General Shareholders’ Meeting held on 04/24/14 | | | - | | | - | | | - | | | - | | | 84,190 | | | - | | | (84,190 | ) | | | - | | | | | | | | | | | | | | | | | | | | | | | | | | | | | | | Net income for the period | | | - | | | - | | | - | | | - | | | - | | | - | | | 627,027 | | | | 627,027 | | | | | | | | | | | | | | | | | | | | | | | | | | | | | | | Balance as of June 30, 2014 | | Ps. | 1,463,365 | | Ps. | 834 | | Ps. | 54,149 | | Ps. | 699,601 | | Ps. | 679,739 | | Ps. | 612,487 | | Ps. | 695,168 | | | Ps. | 4,205,343 | | | | | | | | | | | | | | | | | | | | | | | | | | | | | | Distribution of retained earnings approved by the General Shareholders’ Meeting held on 04/24/14. Approval of BCRA on 12/23/14 | | | - | | | - | | | - | | | - | | | - | | | - | | | (41,817 | ) | | | (41,817 | ) | | | | | | | | | | | | | | | | | | | | | | | | | | | | | Distribution of retained earnings approved by the General Shareholders’ Meeting held on 03/21/15. | | | - | | | - | | | - | | | - | | | 109,994 | | | 439,978 | | | (549,972 | ) | | | - | | | | | | | | | | | | | | | | | | | | | | | | | | | | | | | Net income for the period | | | - | | | - | | | - | | | - | | | - | | | - | | | 537,190 | | | | 537,190 | | | | | | | | | | | | | | | | | | | | | | | | | | | | | | | Balance as of June 30, 2015 | | Ps. | 1,463,365 | | Ps. | 834 | | Ps. | 54,149 | | Ps. | 699,601 | | Ps. | 789,733 | | Ps. | 1,052,465 | | Ps. | 640,569 | | | Ps. | 4,700,716 | |
The accompanying notes are an integral part of these consolidated financial statements BANCO HIPOTECARIO SA AND SUBSIDIARIES CONSOLIDATED STATEMENT OF CASH FLOWS For the twelve-month periods ended June 30, 2016, 2015 2014 and 20132014 (Expressed in thousands of Argentine pesos, except share data and as otherwise indicated)
| | | 2015 | | | 2014 | | | 2013 | | | Cash flows from operating activities: | | | | | | | | | | | Net income | | Ps. | 537,190 | | | Ps. | 627,027 | | | Ps. | 339,122 | | Adjustments to reconcile net income to net cash provided by Cash Flows from operating activities: | | | | | | | | | | | | | | Provision for loan losses and for contingencies and miscellaneous receivables, net of reversals | | | 258,567 | | | | 273,423 | | | | 163,600 | | | Net gain on investment government securities | | | (179,430 | ) | | | (89,484 | ) | | | (8,802 | ) | | Gain / (loss) on derivative financial instruments | | | (63 | ) | | | - | | | | (46 | ) | | Depreciation and amortization | | | 114,799 | | | | 66,103 | | | | 39,152 | | | Net gain on sale of premises and equipment and miscellaneous assets | | | (578 | ) | | | (2,944 | ) | | | (1,160 | ) | | Net Indexing (CER and CVS) and interest of loans and deposits incurred but not paid | | | (177,558 | ) | | | (19,112 | ) | | | (127,277 | ) | | Non-controlling interest | | | (13,658 | ) | | | (11,031 | ) | | | 14,148 | | | Net change in trading securities | | | 1,269,136 | | | | (858,189 | ) | | | 907,867 | | | Net change in other assets | | | (2,850,499 | ) | | | (661,376 | ) | | | (136,396 | ) | | Net change in other liabilities | | | 1,179,439 | | | | 1,391,036 | | | | (482,324 | ) | | Net cash (used in) operating activities | | | 137,345 | | | | 715,453 | | | | 707,884 | | | | | | | | | | | | | | | | | Cash flows from investing activities: | | | | | | | | | | | | | | (Increase)/Decrease in loans, net | | | (4,502,150 | ) | | | (5,780,425 | ) | | | (2,692,773 | ) | | Proceeds from securitization of consumer loans | | | 401,331 | | | | 749,589 | | | | 380,415 | | | Proceeds from maturities of available for sale securities | | | 808,876 | | | | 81,100 | | | | 345,961 | | | Purchases of investments in other companies | | | (45,000 | ) | | | (10,013 | ) | | | (5,012 | ) | | Proceeds from sales, net of payments for purchases, of available for sale securities | | | (2,082,693 | ) | | | (1,166,729 | ) | | | 25,697 | | | Proceeds from sale of premises and equipment | | | 8,491 | | | | 1,874 | | | | 1,029 | | | Purchases of premises and equipment, miscellaneous and intangible assets | | | (350,659 | ) | | | (212,026 | ) | | | (117,240 | ) | | Net cash provided by investing activities | | | (5,761,804 | ) | | | (6,336,630 | ) | | | (2,061,923 | ) | | | | | | | | | | | | | | | | Cash flows from financing activities: | | | | | | | | | | | | | | Increase in deposits, net | | | 4,499,808 | | | | 4,792,123 | | | | 2,093,107 | | | Principal payments on bonds, notes, and other debts | | | (626,754 | ) | | | (853,108 | ) | | | (584,601 | ) | | Proceeds from issuance of bonds, notes and other debts | | | 1,934,019 | | | | 1,435,183 | | | | 653,781 | | | Payments of debt issuance cost | | | (19,406 | ) | | | (12,855 | ) | | | (8,425 | ) | | Distribution of dividends | | | (41,817 | ) | | | (29,968 | ) | | | (99,895 | ) | | (Decrease)/Increase in borrowings, net | | | (23,518 | ) | | | 806,185 | | | | 89,175 | | | Net cash provided by financing activities | | | 5,722,332 | | | | 6,137,560 | | | | 2,143,142 | | | | | | | | | | | | | | | | | Net increase/(decrease) in cash and cash equivalents | | | 97,873 | | | | 516,383 | | | | 789,103 | | | Cash and cash equivalents at the beginning of the period | | | 3,008,168 | | | | 2,217,327 | | | | 1,352,474 | | | Effect of foreign exchange changes on cash and cash equivalents | | | 95,534 | | | | 274,458 | | | | 75,750 | | | Cash and cash equivalents at the end of the period | | Ps. | 3,201,575 | | | Ps. | 3,008,168 | | | Ps. | 2,217,327 | | | | | | | | | | | | | | | | | Supplemental disclosure of cash flow information: | | | | | | | | | | | | | | Cash paid for interest | | Ps. | 2,525,829 | | | Ps. | 1,555,976 | | | Ps. | 939,573 | | | Cash paid for presumptive minimum income tax and income tax. | | | 343,504 | | | | 113,576 | | | | 71,481 | | | Non-cash transactions involving securitizations | | | 151,576 | | | | 165,249 | | | | 87,925 | |
| | | 2016 | | 2015 | | 2014 | | Cash flows from operating activities: | | | | | | | | Net income..……...………………………….……………………… | Ps. | 1,115,530 | Ps. | 537,190 | Ps. | 627,027 | Adjustments to reconcile net income to net cash provided by Cash Flows from operating activities: | | | | | | | | Provision for loan losses and for contingencies and miscellaneous receivables, net of reversals………………………………...…….. | | 326,121 | | 258,567 | | 273,423 | | Net gain on investment government securities………………...….... | | (642,081) | | (179,430) | | (89,484) | | Gain / (loss) on derivative financial instruments……..……..……… | | - | | (63) | | - | | (Gain) / loss on equity investments………........................................ | | (34,644) | | (6,641) | | - | | Depreciation and amortization……………………………………... | | 191,298 | | 114,799 | | 66,103 | | Net gain on sale of premises and equipment and miscellaneous assets………………………………….…………………………... | | (3,562) | | (578) | | (2,944) | | Net Indexing (CER and CVS) and interest of loans and deposits incurred but not paid…………………………………..……..……... | | (318,632) | | (177,558) | | (19,112) | | Non-controlling interest…………………………………………...... | | (5,998) | | (13,658) | | (11,031) | | Net change in trading securities…………………………………..... | | (756,478) | | 1,269,136 | | (858,189) | | Net change in other assets……………..…………………………… | | (2,981,939) | | (2,843,858) | | (661,376) | | Net change in other liabilities………….…………………………… | | 1,939,825 | | 1,179,439 | | 1,391,036 | Net cash (used in) operating activities………………………….... | | (1,170,560) | | 137,345 | | 715,453 | | | | | | | | | | Cash flows from investing activities: | | | | | | | | (Increase)/Decrease in loans, net………………….………………... | | (4,403,465) | | (4,502,150) | | (5,780,425) | | Proceeds from securitization of consumer loans………………….... | | 894,363 | | 401,331 | | 749,589 | | Proceeds from maturities of available for sale securities.…...…....... | | 417,797 | | 808,876 | | 81,100 | | Purchases of investments in other companies, net of sales………… | | (19,500) | | (45,000) | | (10,013) | | Proceeds from sales, net of payments for purchases, of available for sale securities…………………………………………………… | | 657,857 | | (2,082,693) | | (1,166,729) | | Proceeds from sale of premises and equipment……………………. | | (3,890) | | 8,491 | | 1,874 | | Purchases of premises and equipment, miscellaneous and intangible assets………………………………………………....... | | (637,847) | | (350,659) | | (212,026) | Net cash provided by investing activities……………………........ | | (3,094,685) | | (5,761,804) | | (6,336,630) | | | | | | | | | | Cash flows from financing activities: | | | | | | | | Increase in deposits, net…………………...………………………... | | (691,881) | | 4,499,808 | | 4,792,123 | | Principal payments on bonds, notes, and other debts………………. | | (3,737,599) | | (626,754) | | (853,108) | | Proceeds from issuance of bonds, notes and other debts…………… | | 8,103,404 | | 1,934,019 | | 1,435,183 | | Payments of debt issuance cost…………………………………….. | | (90,494) | | (19,406) | | (12,855) | | Distribution of dividends……………………………………...……. | | - | | (41,817) | | (29,968) | | (Decrease)/Increase in borrowings, net…………………………….. | | 68,283 | | (23,518) | | 806,185 | Net cash provided by financing activities………………………... | | 3,651,713 | | 5,722,332 | | 6,137,560 | | | | | | | | | | Net increase/(decrease) in cash and cash equivalents……………… | | (613,532) | | 97,873 | | 516,383 | | Cash and cash equivalents at the beginning of the period………….. | | 3,201,575 | | 3,008,168 | | 2,217,327 | | Effect of foreign exchange changes on cash and cash equivalents.... | | 713,797 | | 95,534 | | 274,458 | Cash and cash equivalents at the end of the period…………… | Ps. | 3,301,840 | Ps. | 3,201,575 | Ps. | 3,008,168 | | | | | | | | | | Supplemental disclosure of cash flow information: | | | | | | | | Cash paid for interest…………………………………………..… | Ps. | 4,078,196 | Ps. | 2,525,829 | Ps. | 1,555,976 | | Cash paid for presumptive minimum income tax and income tax. | | 523,373 | | 343,504 | | 113,576 | | Non-cash transactions involving securitizations……………….... | | 372,198 | | 151,576 | | 165,249 |
The accompanying notes are an integral part of these consolidated financial statements. BANCO HIPOTECARIO SA AND SUBSIDIARIES NOTES TO THE CONSOLIDATED FINANCIAL STATEMENTS As of and for the twelve-month periods ended June 30, 2016, 2015 2014 and 20132014 (Expressed in thousands of Argentine pesos, except share data and as otherwise indicated)
General
a. Description of business
Banco HipotecarioSA (herein after referred to as the “Bank” or “BHSA”), is a commercial bank, organized under the laws of Argentina.
The Bank historically has provided general banking services, focused on individual residential mortgage loans and construction-project loans directly to customers as well as indirectly through selected banks and other financial intermediaries throughout Argentina. In 2004, as part of its business diversification strategy, the Bank resumed the mortgage lending and expanded its product offerings, beginning to offer personal loans, credit card loans and also engaging in mortgage loan securitizations, mortgage loan servicing, other corporate loans and mortgage-related insurance in connection with its lending activities.
b. Basis of presentation
The consolidated financial statements of the Bank have been prepared in accordance with the rules of Banco Central de la República Argentina (“Argentine Central Bank” or “BCRA”) which prescribe the accounting reporting and disclosure requirements for banks and financial institutions in Argentina (“Argentine Banking GAAP”). Argentine Banking GAAP differ in certain significant respects from generally accepted accounting principles in the United States of America (“U.S. GAAP”). Such differences involve methods of measuring the amounts shown in the consolidated financial statements, as well as additional disclosures required by U.S. GAAP and regulations of the Securities and Exchange Commission (“SEC”). These consolidated financial statements include solely a reconciliation of net income and shareholders’ equity to U.S. GAAP. Pursuant to Item 17 of Form 20-F, this reconciliation does not include disclosure of all information that would be required by U.S. GAAP and Regulation S-X of the SEC. See note 34 for details.
Certain disclosures required by the Argentine Banking GAAP have not been presented herein since they are not required under U.S. GAAP or the SEC and are not considered to be relevant to the accompanying consolidated financial statements taken as a whole.
Certain reclassifications of prior year’s information have been made to conform to current year presentation. Such reclassifications do not have a significant impact on the Bank financial statements.
c. Principles of consolidation
The consolidated financial statements include the accounts of the Bank and its subsidiaries over which the Bank has effective control. The percentages directly or indirectly held in those companies’ capital stock as of June 30, 20152016 and 20142015 are as follows: | Issuing Company | June 30, | | 2016 | 2015 | | BHN Sociedad de Inversión Sociedad Anónima | 99.99% | 99.99% | | BHN Seguros Generales Sociedad Anónima (a) | 99.99% | 99.99% | | BHN Vida Sociedad Anónima (a) | 99.99% | 99.99% | | BACS Banco de Crédito y Securitización Sociedad Anónima | 87.50% | 87.50% | | BACS Administradora de activos S.A. S.G.F.C.I. | 85.00% | 85.00% | | Tarshop S.A. (b) | 80.00% | 80.00% | | BH Valores SA | 100.00% | 100.00% |
| | | June 30, | | | Issuing Company | | 2015 | | | 2014 | | | BHN Sociedad de Inversión Sociedad Anónima | | | 99.99 | % | | | 99.99 | % | | BHN Seguros Generales Sociedad Anónima | | | 99.99 | % | | | 99.99 | % | | BHN Vida Sociedad Anónima | | | 99.99 | % | | | 99.99 | % | | BACS Banco de Crédito y Securitización Sociedad Anónima | | | 87.50 | % | | | 87.50 | % | | BACS Administradora de activos S.A. S.G.F.C.I. | | | 85.00 | % | | | 85.00 | % | | Tarshop S.A. (*) | | | 80.00 | % | | | 80.00 | % | | BH Valores SA | | | 100.00 | % | | | 100.00 | % |
BANCO HIPOTECARIO SA AND SUBSIDIARIES NOTES TO THE CONSOLIDATED FINANCIAL STATEMENTS As of and for the twelve-month periods ended June 30, 2016, 2015 2014 and 20132014 (Expressed in thousands of Argentine pesos, except share data and as otherwise indicated)
(*)
(a) On October 22, 2014,December 2, 2015, the Bank took notice of an observation raised by the Superintendent of Financial Institutions reporting to the Argentine Central Bank with regard to the insurance business developed by Banco Hipotecario S.A. through BHN Vida S.A. and BHN Seguros Generales S.A. The observation requires the enforcement of the credit scoring regulations, which impose a 12.5% limit on interests in the capital stock and voting rights of other companies. In reply, the Bank has claimed that such observation should be revised, in that the Bank is allowed to conduct the business in question pursuant to the Privatization Law No. 24,855 and its regulations, in particular Decree No. 1394/98, as continuing company of Banco Hipotecario Nacional. (b) On September 11, 2015, November 4, 2015 and June 23,2016, the Board of Directors of Banco Hipotecario S.A. unanimously approved an irrevocable capital contribution to Tarshop S.A. in the amount of Ps. 110,000Ps.52,500, Ps.52,500 and Ps.250,000, respectively, to be made by shareholders Banco Hipotecario S.A. and IRSA Propiedades Comerciales S.A. (continuing company after Alto Palermo S.A.’s change of corporate name) pro rata of their shareholdings so that Tarshop S.A. should have sufficient resources for its operationaloperating activities, and to be able to execute its 2015 Business Plan. On December 15, 2014,in line with the General and Extraordinary Shareholder's Meeting unanimously approved such capitalization program previously approved.
All significant intercompany accounts and transactions have been eliminated in consolidation.
d. Presentation of financial statements in constant argentine pesos
The financial statements have been adjusted for inflation in conformity with the guidelines set in Communication “A” 551 of the Argentine Central Bank up to the financial year ended December 31, 1994, and prepared in accordance with the standards laid down by CONAU 1 Circular. As from January 1, 1995, and according to the authorization accorded by Resolution N° 388 of the Argentine Central Bank's Superintendency of Financial and Exchange Institutions, the Bank discontinued the adjustment for inflation of its financial statements until December 31, 2001. As from January 1, 2002, as a result of the application of Communication “A” 3702 which established the repeal of any legal and regulatory rule that did not allow companies to restate their accounting balances at period-end currency values, the Bank resumed the application of the adjustment for inflation in accordance with the rules issued in due time by the Argentine Central Bank using the adjustment coefficient derived from the domestic wholesale price index published by the National Statistics and Census Institute (INDEC). Furthermore, it has been considered that the accounting measurements derived from the changes in the purchasing power of the currency between December 31, 1994 and 2001 are stated in the currency value as of the latter date.
On March 25, 2003, the Executive Branch issued Decree 664 establishing that the financial statements for years ending as from that date are to be stated in nominal currency. Consequently, in accordance with Communication “A” 3921 of the BCRA, the restatement of the financial statements was discontinued as from March 1, 2003. Pursuant to the Argentine professional accounting standards in effect in the City of Buenos Aires, the financial statements must be stated in constant currency. The restatement method and the need to apply it arise from requirements contained in Technical Pronouncements No. 6 and No. 17 of the Argentine Federation of Professional Councils in Economic Sciences (FACPCE), as amended by Technical Pronouncement No. 39 issued by the referred entity on October 4, 2013 and approved by the Professional Council in Economic Sciences of the City of Buenos Aires on April 16, 2014. These standards provide that the effects of inflation should be recognized in the financial statements in the event that certain conditions in the Argentine economy are met
BANCO HIPOTECARIO SA AND SUBSIDIARIES NOTES TO THE CONSOLIDATED FINANCIAL STATEMENTS As of and for the twelve-month periods ended June 30, 2016, 2015 and 2014 (Expressed in thousands of Argentine pesos, except share data and as otherwise indicated) As of June 30, 2016, the cumulative inflation rate for three consecutive years endede on such dates could not be calculated on the basis of official data provided by the Argentine Institute of Statistics and Census since, in October 2015, the referred entity discontinued the calculation of the Wholesale Domestic Price Index (IPIM), and resumed it in January 2016. This circumstance should be taken into account when analyzing and interpreting these financial statements, which have been prepared in line with the accounting standards issued by the Argentine Central Bank for application by financial institutions. 2. Significant Accounting Policies The following is a summary of significant accounting policies used in the preparation of the consolidated financial statements.
2.1. Foreign Currency Assets and Liabilities
US dollar assets and liabilities have been valued at the rate of exchange between the peso and the US dollar published by the Argentine Central Bank. Assets and liabilities valued in foreign currencies other than the US dollar were converted into the latter currency using the swap rates communicated by the Argentine Central Bank’s operations desk, in force at the close of operations on the last business day of the fiscal period end.
Foreign currency transactions net gains or losses are recorded within “Financial income” or “Financial expenses” in the accompanying unaudited consolidated statements of income.
2.2. Interest accruals and adjustments of principal amounts (CER and CVS)
Interest accruals were determined using the exponential method for all lending and certain borrowing transactions in local and foreign currency, and interest accruals for loans overdue more than ninety days were discontinued. BANCO HIPOTECARIO SA AND SUBSIDIARIES
NOTES TO THE CONSOLIDATED FINANCIAL STATEMENTS
As of and for the twelve-month periods ended June 30, 2015, 2014 and 2013
(Expressed in thousands of Argentine pesos, except share data and as otherwise indicated)
Adjustments of principal amounts from application of the CER (Reference Stabilization Index), and CVS were accrued as established by Argentine Central Bank regulations, and interest accruals on loans overdue more than ninety days were discontinued.
2.3. Government and Corporate Securities
Securities classified as "Holdings booked at fair market value", "Investment in listed corporate securities" and "Securities issued by the BCRA" with volatility published by the BCRA, have been valued at period-end or year-end market quotation.
As of June 30, 2016 and 2015, the Bank maintains in its portfolio overdue income coupons from the DICY and PARY bonds to be collected.
Securities classified as “Holdings booked at cost plus return” and “Securities issued by the BCRA” with no volatility published by the BCRA or with volatility but which the Entity decides to book under the first category, have been valued at their acquisition cost subject to an exponential increase based on the internal rate of return, net of contra accounts, if applicable.
2.4. Loans
The portfolio of performing loans and loans due ninety days or less has been valued in terms of the principal amounts actually lent, plus capitalized interest, net of principal amortization collected and BANCO HIPOTECARIO SA AND SUBSIDIARIES NOTES TO THE CONSOLIDATED FINANCIAL STATEMENTS As of and for the twelve-month periods ended June 30, 2016, 2015 and 2014 (Expressed in thousands of Argentine pesos, except share data and as otherwise indicated) debt balance refinancing, plus adjustments (from the application of the CER, and CVS where applicable) and accrued interest receivable and less the estimated reserve for loan losses.
Other loans to the public sector:
i)i. those loans were valued at cost plus return, taking as cost their book value as of December 31, 2010.
ii)ii. those originally granted in foreign currency have been converted into Ps. at the exchange rate of $1.40 per US dollar, as established by Law 25561, Decree 214 and complementary rules and amendments. Since February 3, 2002, the CER has been applied to the amount of those loans and maximum rates have been established, in accordance with Decree 1579/02, if those assets were subjected to the Exchange of Provincial Public Debt.
Loans to the non-financial private sector originally granted in foreign currency have been converted into pesos at the exchange rate of $1.00 per US dollar, as established by Law 25561, Decree 214 and complementary rules and amendments. Since February 3, 2002, the CER and CVS have been applied to the amount of those loans and maximum rates have been established, depending on the borrower.
2.5. Other receivables for financial transactions
The individual mortgage loans the trustee ownership of which was transferred by the Bank and recorded in this caption have been valued and converted into pesos following the criterion described in points 2.2. and 2.4.
The rights arising from currency swap transactions have been valued at the quotation of that currency following the criterion described in point 2.1.
The financial trust participation certificates have been valued according to the equity method of accounting. Financial trust debt securities have been stated at cost plus return, index-adjusted by applying the CER to the appropriate instruments. BANCO HIPOTECARIO SA AND SUBSIDIARIES
NOTES TO THE CONSOLIDATED FINANCIAL STATEMENTS
As of and for the twelve-month periods ended June 30, 2015, 2014 and 2013
(Expressed in thousands of Argentine pesos, except share data and as otherwise indicated)
The interest rate swap transactions carried out for the purposes of hedging assets and liabilities with fixed and floating rates have been valued in accordance with the unsettled balances of agreed upon lending and borrowing interests rates.
Interest rate swaps for agreed-upon fixed rate have been valued in accordance with the balances pending settlement. Futures transactions agreed upon that are mainly closed as hedging for the position in foreign currency have been valued in accordance with the balances pending settlement. Changes in these values, for all derivative instruments, are recognized as a gain or loss under the caption “Financial Income – Interest on loans and other receivables from financial transactions” or “Financial Expenses – Interest on deposits and other liabilities from financial transactions”, respectively.
Unlisted negotiable obligations have been valued at acquisition cost exponentially increased according to the internal rate of return.
The Bank holds Negotiable Obligations in its own portfolio, measured at their residual value plus interest accrued. Securities issued by the BCRA and government securities held as collateral for OTC transactions are valued as explained in item 2.3 of this note.
Repo transactions are carried at the value originally agreed upon, plus accrued premiums.
2.6. Receivables for financial leases
Receivables for financial leases are carried at the current value of the periodic installments and the residual value previously agreed upon, calculated as per the conditions set forth in the respective lease agreements, applying the internal rate of return and net of allowances for loan losses.
2.7. Investments in Other Companies
BANCO HIPOTECARIO SA AND SUBSIDIARIES NOTES TO THE CONSOLIDATED FINANCIAL STATEMENTS As of and for the twelve-month periods ended June 30, 2016, 2015 and 2014 (Expressed in thousands of Argentine pesos, except share data and as otherwise indicated) Permanent equity investments in companies where corporate decision are not influenced, are accounted for the lower of cost and the equity method. As of June 30, 20152016 and December 31, 20142015 these investments were recorded at cost.
This caption mainly includes the equity investments held in: Mercado Abierto Electrónico Sociedad Anónima, ACH Sociedad Anónima, Mercado de Valores de Buenos Aires Sociedad Anónima, and SUPER–CARD S.A..
Additionally the Bank has participations as protecting partner in mutual guarantee companies and has made contributions to the companies’ risk fund. These companies are: Confederar NEA S.G.R., Don Mario S.G.R., Los Grobos S.G.R. and Intergarantías S.G.R.
2.8. Miscellaneous receivables
Miscellaneous receivables have been valued at the amounts actually transacted, plus interest accrued and net of allowances for loan losses or impairment, if applicable.
2.9. Bank Premises and Equipment and Miscellaneous Assets
Bank premises and equipment are recorded at cost, adjusted for inflation (as described in note 1.d), less accumulated depreciation.
Depreciation is computed under the straight-line method over the estimated useful lives of the related assets. The estimated useful lives for bank premises and equipment are as follows: | Buildings | 50 years | | Furniture and fixtures | 10 years | | Machinery and equipment | 5 years | | Other | 5 years |
The cost of maintenance and repairsof these properties is charged to expense as incurred. The cost of significant renewals and improvements is added to the carrying amount of the respective assets. When assets are retired or otherwise disposed of, the cost and related accumulated depreciation are removed from the accounts, and any resulting gain or loss is reflected in the consolidated statement of income.
The Bank has recorded under “Miscellaneous assets” - properties received in lieu of payment of loans. These assets are initially recognized at the lower of market value or the value of the loan, net of allowances and subsequently, adjusted for inflation (as described in note 1.d), and depreciation. Depreciation of Miscellaneous assets is also computed under the straight-line method over the estimated useful of the related assets.
2.10. Intangible Assets, Net
Software expenses as well as start-up costs are carried at cost, adjusted for inflation (as described in note 1.d), less accumulated amortization. These intangible assets are amortized under the straight-line method over their estimated useful life.
Goodwill is recorded by the difference between the purchase price and the book value of the net assets acquired in accordance with Argentine Central Bank rules, and subsequently amortized in a straight line basis over the estimated useful life of 60 months.
Given BHSA’s role as Trustee of the PROCREAR Administrative and Financial Trust, the Bank has capitalized increased direct expenses incurred in the mortgage loan origination process, which BANCO HIPOTECARIO SA AND SUBSIDIARIES NOTES TO THE CONSOLIDATED FINANCIAL STATEMENTS As of and for the twelve-month periods ended June 30, 2016, 2015 and 2014 (Expressed in thousands of Argentine pesos, except share data and as otherwise indicated) disbursements would not have been incurred by it had it not been for the grant of the related loans in accordance with the provisions of Communication “A” 5392. Such origination expenses are amortized in 60 monthly installments.
2.11 Housing, life and unemployment insurance premiums in lending transactions and other transactions originated in its capacity of insurer, in accordance with the franchise granted by the privatization law
The Bank's policy is to recognize the premium income when the corresponding loan installment accrues, except for those loans that are more than ninety days in arrears, and allocate the expenditures for claims to the net income/(loss) for the year in which they occur.
The Bank has set up an insurance claim reserve for Ps.1,181 as of June 30, 2015 and 2014, which is shown in the "Provisions" caption under Liabilities.
2.12. Deposits
Deposits have been valued at their placement value, plus adjustments from application of the CER and accrued interest, where applicable. The fixed return on each transaction is accrued on an exponential basis, while the variable return on time deposits adjusted by applying the CER and included in "Investment Accounts" is accrued at the pro rata agreed upon rate of return based on the improvement in the price of the financial asset or financial asset indicator, between the time the transaction is arranged and the end of the month.
2.13. Other liabilities from financial transactions BANCO HIPOTECARIO SA AND SUBSIDIARIES
NOTES TO THE CONSOLIDATED FINANCIAL STATEMENTS
As of and for the twelve-month periods ended June 30, 2015, 2014 and 2013
(Expressed in thousands of Argentine pesos, except share data and as otherwise indicated)
Unsubordinated negotiable obligations have been valued at their residual value plus accrued interest.
Foreign currency-denominated obligations under swapFutures transactions carried outagreed upon that are mainly closed as a hedge have been converted into Argentine pesos according to the criterion described in note 2.1.
The interest rate swap transactions carried outhedging for the purposes of hedging assets and liabilities with fixed and floating rates have been valuedposition in accordance with the unsettled balances of agreed upon lending and borrowing interests rates. In addition, following a prudent criterion, the Bank creates provisions for these transactions when the value stated above exceeds its fair value.
Interest rate swaps for agreed-upon fixed rateforeign currency have been valued in accordance with the balances pending settlementsettlement. Changes in these values, for all derivative instruments, are recognized as a gain or loss under the caption “Financial Income – Interest on loans and other receivables from financial transactions” or “Financial Expenses – Interest on deposits and other liabilities from financial transactions”, respectively.
Repo transactions are carried at the value originally agreed upon plus any accrued premium amounts. Reverse repo transactions are carried at the book value of the agreed-upon lending and borrowing interest rates.underlying securities in the manner discussed in note 2.3.
2.14. Miscellaneous liabilities
They are valued at the amounts actually transacted, plus accrued interest as of fiscal period or year end.
2.15. Provisions
The Bank estimates contingencies and records them in Provisions, under Liabilities, if applicable according to the estimated likelihood of occurrence. These provisions cover various items, such as insurance risk, provisions for lawsuits, provisions for taxes, other contingencies, etc..
In addition, the Bank has created the allowance required under Communication “A” 5689 issued by the Argentine Central Bank in order to provide for the total amount of administrative and/or
BANCO HIPOTECARIO SA AND SUBSIDIARIES NOTES TO THE CONSOLIDATED FINANCIAL STATEMENTS As of and for the twelve-month periods ended June 30, 2016, 2015 and 2014 (Expressed in thousands of Argentine pesos, except share data and as otherwise indicated) disciplinary sanctions and criminal penalties supported by first instance rulings, applied or pursued by the Argentine Central Bank, the Financial Information Unit, the Argentine Securities Commission and the Argentine Superintendence of Insurance.
2.16. Dismissal indemnities
The Bank does not set up any provisions to cover the risk of dismissal indemnities involving the staff. The disbursements in respect thereof are charged to the results for the period or year in which they occur.
2.17. Personnel benefits
The Bank has set up provisions for its employees' retirement plans.
2.18. Subordinated Bonds
Subordinated negotiable obligations have been recorded at their residual value plus interests accrued.
2.19. Non-controlling interest
The breakdown of supplementary equity interests recorded in “Non-controlling interest” in the accompanying consolidated balance sheets is as follows: | | June 30, | | | 2016 | | 2015 | | | | | | | | | BACS Banco de Crédito y Securitización SA…………………. | Ps. | 42,228 | | Ps. | 32,610 | | Tarshop S.A………………………….……..…………………. | | 87,979 | | | 35,347 | | Total | Ps. | 130,207 | | Ps. | 67,957 |
| | June 30, | | | | 2015 | | 2014 | | | | | | | | | | | BACS Banco de Crédito y Securitización S.A. | | Ps. | 32,536 | | | Ps. | 28,383 | | | BHN Sociedad de Inversión S.A. | | | 74 | | | | 63 | | | Tarshop S.A. | | | 35,347 | | | | 31,403 | | | Total | | Ps. | 67,957 | | | Ps. | 59,849 | |
2.20. Income Tax
Pursuant to Article 28 of Law 24855, Banco Hipotecario Sociedad Anónima is subject to income tax, except for all the housing loan transactions carried out prior to October 23, 1997, date of registration of its by-laws with the Superintendence of Corporations.
The Bank charges to income and sets up a provision under Liabilities for the income tax determined on its taxable transactions in the fiscal year in which those transactions are carried out.
The Bank recognizes income tax charges and liabilities on the basis of the tax returns corresponding to each fiscal year at the statutory tax rates. For all the periods contemplated in these financial statements, the corporate tax rate was 35%. Under Argentine Banking GAAP the Bank does not recognize deferred income taxes.
2.21. Minimum notional income tax
In view of the option granted by the BCRA by means of Communication "A" 4295, as of June 30, 2015 the Bank capitalized as a minimum notional income tax credit the tax amount paid in fiscal year 2012, on2012. Such credit was recovered upon filing the basis of projections prepared andincome tax return for the possibility of recovering it and raising allowances when appropriate.fiscal year 2015.
2.22. Shareholders' Equity
a. | Capital stock, treasury shares, non-capitalized contributions, reserves, and capital adjustment: |
BANCO HIPOTECARIO SA AND SUBSIDIARIES NOTES TO THE CONSOLIDATED FINANCIAL STATEMENTS As of and for the twelve-month periods ended June 30, 2016, 2015 and 2014 (Expressed in thousands of Argentine pesos, except share data and as otherwise indicated) Capital stock, treasury shares, non-capitalized contributions, reserves, and capital adjustment: The Shareholders' Equity account activity and balances prior to December 31, 1994 have been stated in the currency values prevailing at that date, following the method mentioned in this Note. The transactions carried out subsequent to that date have been recorded in currency values of the period or year to which they correspond. The balances of the Shareholders’ Equity accounts as of June 30, 20152016 have been restated up to February 28, 2003 as explained in the third paragraph. The adjustment derived from the restatement of the balance of "Capital Stock" was allocated to "Equity Adjustments". The issued treasury shares added due to the termination of Total Return Swap transaction are carried at nominal value.
Income and expenses have been recognized against the results for the fiscal year, regardless of whether they have been collected or paid.
The preparation of the financial statements requires that the Bank’s Board of Directors perform estimates affecting assets and liabilities, the net income/ (loss) for the fiscal period or year and the determination of contingent assets and liabilities at the date thereof, such as allowances for loan losses and impairment, the recoverable value of assets and provisions. Since these estimates involve value judgments regarding the probability of occurrence of future events, the actual net income/ (loss) may differ from the estimated amount and thus generate losses or profits affecting subsequent periods or years. All legal and regulatory rules in force at the date of presentation of these financial statements have been considered. BANCO HIPOTECARIO SA AND SUBSIDIARIES
NOTES TO THE CONSOLIDATED FINANCIAL STATEMENTS
As of and for the twelve-month periods ended June 30, 2015, 2014 and 2013
(Expressed in thousands of Argentine pesos, except share data and as otherwise indicated)
The financial statement figures for the previous fiscal period or year, presented for comparative purposes, include certain reclassifications and adjustments that contemplate specific disclosure criteria so as to present them on a consistent basis with those of the current fiscal period or year.
2.23. Statements of Cash Flows
The consolidated statements of cash flows were prepared using the measurement methods prescribed by the BCRA, but in accordance with the presentation requirements of ASC 230.
For purposes of reporting cash flows, “Cash and cash equivalents” include “Cash and due from banks”.
2.24. Use of Estimates
The preparation of the consolidated financial statements requires management to make estimates and assumptions that affect the reported amounts of assets and liabilities and disclosures of contingent assets and liabilities as of the financial statement dates and the reported amounts of revenues and expenses during the reporting periods. Significant estimates include those required in the accounting of allowances for loan losses and the reserve for contingencies. Since management’s judgment involves making estimates concerning the likelihood of future events, the actual results could differ from those estimates which would have a positive or negative effect on future period results.
3. Restricted Assets
Certain of the Bank's assets are pledged or restricted from use under various agreements. The following assets were restricted at each balance sheet date: BANCO HIPOTECARIO SA AND SUBSIDIARIES NOTES TO THE CONSOLIDATED FINANCIAL STATEMENTS As of and for the twelve-month periods ended June 30, 2016, 2015 2014 and 20132014 (Expressed in thousands of Argentine pesos, except share data and as otherwise indicated)
| | June 30, | | | | 2015 | | 2014 | | | Banco Hipotecario S.A. | | | | | | | | Securities issued by the BCRA as collateral for OCT transactions | | Ps. | 70,464 | | | Ps. | - | | | Government securities as collateral for OCT transactions | | | 40,200 | | | | 275,370 | | | Deposits in pesos as collateral for visa credit card transactions | | | 117,723 | | | | 59,610 | | | Securities issued by the BCRA as collateral for the custody of securities | | | 162,759 | | | | - | | | Government securities as collateral for the custody of securities. | | | - | | | | 173,600 | | | Deposits in pesos and in U$S as collateral for leases | | | 754 | | | | 1,028 | | | | | Ps. | 391,900 | | | Ps. | 509,608 | | | | | | | | | | | | | Tarshop S.A. | | | | | | | | | | Deposits in pesos and in U$S as collateral for leases | | Ps. | 505 | | | Ps. | 497 | | | Certificates of participation in Financial Trusts granted as commercial pledge for a loan received | | | 32,203 | | | | 32,202 | | | Time deposits pledged for tax obligations arising from Financial Trusts | | | 4,891 | | | | 3,736 | | | Deposits in pesos related to Financial Trusts transactions | | | 16,182 | | | | 24,542 | | | Receivable in trust to secure a syndicated loan received | | | - | | | | 83,229 | | | Deposits in pesos as collateral for visa credit card transactions | | | 512 | | | | - | | | Government securities as collateral for visa credit card transactions | | | 1,038 | | | | - | | | | | Ps. | 55,331 | | | Ps. | 144,206 | | | | | | | | | | | | | BACS Banco de Crédito y Securitización S.A. | | | | | | | | | | Deposits in pesos as collateral for repurchase agreements | | Ps. | - | | | Ps. | 4,170 | | | | | Ps. | - | | | Ps. | 4,170 | | | | | | | | | | | | | BH Valores S.A. | | | | | | | | | | Mercado de Valores de Buenos Aires SA’s share pledged on behalf of Chubb Argentina de Seguros SA. | | Ps. | 4,000 | | | Ps. | 4,000 | | | | | | | | | | | | | | | | | | | | | | | Total | | Ps. | 451,231 | | | Ps. | 661,984 | |
| | | | | | | | Banco Hipotecario S.A. | | | | | | Securities issued by the BCRA as collateral for OCT transactions………………….………………………………….. | Ps. | 138,376 | Ps. | 70,464 | | Government securities as collateral for OCT transactions……… | | 335,135 | | 40,200 | | Deposits in pesos as collateral for visa credit card transactions... | | 289,199 | | 117,723 | | Securities issued by the BCRA as collateral for the custody of securities………………………………………………………. | | - | | 162,759 | | Government securities as collateral for the custody of securities. | | 14,350 | | - | | Deposits in pesos and in U$S as collateral for leases…………... | | 1,316 | | 754 | | Other collaterals………………………………………………... | | 810 | | 2 | | Ps. | 779,186 | Ps. | 391,902 | | | | | | | Tarshop S.A. | | | | | | Deposits in pesos and in U$S as collateral for leases…………... | Ps. | 686 | Ps. | 505 | | Certificates of participation in Financial Trusts granted as commercial pledge for a loan received…………………………. | | 32,202 | | 32,203 | | Time deposits pledged for tax obligations arising from Financial Trusts……………………………………………………………. | | 6,531 | | 4,891 | | Deposits in pesos related to Financial Trusts transactions……… | | 149,578 | | 16,182 | | Receivables in trust to secure an overdraft facility received……. | | 79,069 | | | | Loans to secure the future issuance of Financial Trust….....……. | | 70,747 | | | | Deposits in pesos as collateral for visa credit card transactions... | | 9,679 | | 512 | | Government securities as collateral for visa credit card transactions……………………………………………………... | | 9,930 | | 1,038 | | Ps. | 358,422 | Ps. | 55,331 | | | | | | | BACS Banco de Crédito y Securitización S.A. | | | | | | Receivables in pledge loans to secure a loan received……….….. | Ps. | 39,889 | Ps. | - | | Securities and pesos as collateral for OTC transactions………… | | 15,713 | | - | | Ps. | 55,602 | Ps. | - | | | | | | | BH Valores S.A. | | | | | | Mercado de Valores de Buenos Aires SA’s share pledged on behalf of Chubb Argentina de Seguros SA…………………… | Ps. | 20,900 | Ps. | 4,000 | | | | | | | | | | | | Total | Ps. | 1,214,110 | Ps. | 451,233 |
4. Government and Corporate securities
Government and Corporate Securities held by the Bank consist of the following balances:
| | June 30, | | | | 2015 | | 2014 | | | Holding booked at fair value | | | | | | | | Government securities in pesos | | Ps. | 1,581,383 | | | Ps. | 439,798 | | | Government securities in US$ | | | 340,053 | | | | 844,014 | | | Bills issued by Provincial Governments in US$ | | | 297,137 | | | | - | | | Bills issued by Provincial Governments in pesos | | | 7,133 | | | | - | | | | | Ps. | 2,225,706 | | | Ps. | 1,283,812 | | | | | | | | | | | |
| | | | | | | | | Holding booked at fair value | | | | | Governmentsecurities inpesos…………………….Ps. | 666,815 | Ps. | 1,581,383 | | Government securities in US$.............................. | 1,835,746 | | 340,053 | | Government securities in Euros.............................. | 292,729 | | - | | Bills issued by Provincial Governments in US$..... | 263,586 | | 297,137 | | Bills issued by Provincial Governments in pesos..... | 25,890 | | 7,133 |
BANCO HIPOTECARIO SA AND SUBSIDIARIES NOTES TO THE CONSOLIDATED FINANCIAL STATEMENTS As of and for the twelve-month periods ended June 30, 2016, 2015 2014 and 20132014 (Expressed in thousands of Argentine pesos, except share data and as otherwise indicated)
| Holding booked at cost plus return | | | | | | | | Government securities in pesos | | Ps. | - | | | Ps. | 29,275 | | | Bills issued by Provincial Governments in pesos | | | 66,916 | | | | - | | | Bills issued by Provincial Governments in US$ | | | 125,862 | | | | 39,573 | | | | | Ps. | 192,778 | | | Ps. | 68,848 | | | | | | | | | | | | | Investment in listed corporate securities | | | | | | | | | | Corporate securities denominated in pesos | | Ps. | 430,855 | | | Ps. | 345,565 | | | | | Ps. | 430,855 | | | Ps. | 345,565 | | | | | | | | | | | | | Securities issued by the BCRA | | | | | | | | | | Quoted bills and notes issued by the BCRA | | Ps. | 672,239 | | | Ps. | 354,542 | | | Unquoted bills and notes issued by the BCRA | | | 1,750,005 | | | | 1,342,425 | | | | | Ps. | 2,422,244 | | | Ps. | 1,696,967 | | | | | | | | | | | | | Total | | Ps. | 5,271,583 | | | Ps. | 3,395,192 | |
| | Ps. | 3,084,766 | | Ps. | 2,225,706 | | | | | | | | | Holding booked at cost plus return | | | | | | | Bills issued by Provincial Governments in pesos... | Ps. | 166,342 | | Ps. | 66,916 | | Bills issued by Provincial Governments in US$.…... | | 240,995 | | | 125,862 | | | Ps. | 407,337 | | Ps. | 192,778 | | | | | | | | | Investment in listed corporate securities | | | | | | | Corporate securities denominated in pesos….......… | Ps. | 490,538 | | Ps. | 430,855 | | | Ps. | 490,538 | | Ps. | 430,855 | | | | | | | | | Securities issued by the BCRA | | | | | | | Quoted bills and notes issued by the BCRA……….. | Ps. | 278,519 | | Ps. | 672,239 | | Unquoted bills and notes issued by the BCRA…….. | | 1,017,050 | | | 1,750,005 | | | Ps. | 1,295,569 | | Ps. | 2,422,244 | | | | | | | | | Allowances | Ps. | (8,711) | | Ps. | - | | | | | | | | | Total | Ps. | 5,269,499 | | Ps. | 5,271,583 |
As of June 30, 2015,2016, several bonds sold under repurchase agreements amounted to Ps. 9,624Ps.75,695 and were recorded under the caption “Other Receivables from Financial Transactions”.
The bank recorded in their financial statements income from government and corporate securities for an amount of Ps. 1,191,3962,584,524 and Ps. 904,9851,191,396 as of June 30, 20152016 and 2014,2015, respectively.
5. Loans
Descriptions of the categories of loans in the accompanying balance sheets include:
· | ●Construction project loans - loans made to various entities for the construction of housing units ●Individual residential mortgage loans - mortgage loans made to individuals to finance the acquisition, construction, completion, enlargement, and/or remodeling of their homes ● Certain financial and non-financial sector loans including loans to credit card holders and to individuals ● Public Loans – loans to National Government and Provinces Construction project loans - loans made to various entities for the construction of housing units
|
· | Individual residential mortgage loans - mortgage loans made to individuals to finance the acquisition, construction, completion, enlargement, and/or remodeling of their homes
|
· | Certain financial and non-financial sector loans including loans to credit card holders and to individuals |
· | Public Loans – loans to National Government and Provinces |
Under Argentine Central Bank regulations, the Bank must disclose the composition of its loan portfolio by non-financial public, financial and non-financial private sector. Additionally, the Bank must disclose the type of collateral pledged on non-financial private sector loans. The breakdown of the Bank’s loan portfolio in this regard is as follows: BANCO HIPOTECARIO SA AND SUBSIDIARIES NOTES TO THE CONSOLIDATED FINANCIAL STATEMENTS As of and for the twelve-month periods ended June 30, 2016, 2015 2014 and 20132014 (Expressed in thousands of Argentine pesos, except share data and as otherwise indicated)
| | June, | | | | 2015 | | 2014 | | | | | | | | | | Non-financial public sector | | Ps. | 89,132 | | | Ps. | 129,023 | | | Financial sector | | | 348,549 | | | | 373,078 | | | Non-financial private sector | | | | | | | | | | With preferred guarantees (a) | | | 2,413,401 | | | | 2,197,328 | | | Without preferred guarantees | | | | | | | | | | Personal loans | | | 2,650,127 | | | | 2,040,282 | | | Credit Card Loans | | | 8,500,601 | | | | 5,950,266 | | | Overdraft facilities | | | 685,978 | | | | 1,139,629 | | | Other loans (b) | | | 4,561,093 | | | | 3,595,963 | | | Accrued interest receivable | | | 218,089 | | | | 150,676 | | | Reserve for loan losses (see note 6) | | | (433,825 | ) | | | (356,267 | ) | | Total | | Ps. | 19,033,145 | | | Ps. | 15,219,978 | |
| | June 30, | | | 2016 | | 2015 | | | | | | | | Non-financial public sector……………………………………… | Ps. | 160,847 | | Ps. | 89,132 | | Financial sector………………………………………………….. | | 462,776 | | | 348,549 | | Non-financial private sector | | | | | | | With preferred guarantees (a)…………………………………. | | 2,429,322 | | | 2,413,401 | | Without preferred guarantees ....……………………………… | | | | | | | Personal loans……………………………………………… | | 3,149,503 | | | 2,650,127 | | Credit Card Loans …..……………………………………… | | 10,573,083 | | | 8,500,601 | | Overdraft facilities…………………………………………. | | 890,819 | | | 685,978 | | Other loans (b)……………………………………………… | | 4,539,970 | | | 4,561,093 | | Accrued interest receivable……………………………………… | | 240,885 | | | 218,089 | | Reserve for loan losses (see note 6)..…………………………… | | (493,536) | | | (433,825) | | Total | Ps. | 21,953,669 | | Ps. | 19,033,145 |
______________ | Preferred guarantees include first priority mortgages or pledges, cash, gold or public sector bond collateral, certain collateral held in trust, or certain guarantees by the Argentine government. |
Preferred guarantees include first priority mortgages or pledges, cash, gold or public sector bond collateral, certain collateral held in trust, or certain guarantees by the Argentine government. | | June 30, | | | 2016 | | 2015 | | | | | | | | | Short term loans in pesos …..………………………….... | Ps. | 2,464,250 | | Ps. | 2,729,892 | | Short term loans in US dollars………………………… | | 646,036 | | | 692,190 | | Loans for the financing of manufacturers……………….. | | 89,944 | | | 61,234 | | Export prefinancing …………………….………………. | | 581,880 | | | 406,621 | | Other loans….…………………...……………………… | | 757,860 | | | 671,156 | | Total | Ps. | 4,539,970 | | Ps. | 4,561,093 |
| | June 30, | | | | 2015 | | 2014 | | | | | | | | | | | Short term loans in pesos | | Ps. | 2,729,892 | | | Ps. | 2,256,595 | | | Short term loans in US dollars | | | 692,190 | | | | 693,809 | | | Loans for the financing of manufacturers | | | 61,234 | | | | 24,805 | | | Export prefinancing | | | 406,621 | | | | 278,720 | | | Other loans | | | 671,156 | | | | 342,034 | | | Total | | Ps. | 4,561,093 | | | Ps. | 3,595,963 | |
6. Allowance for loan losses
The activity in the allowance for loan losses for the periods presented is as follows:
| | June 30, | | | | 2015 | | 2014 | | | | | | | | | | | Balance at beginning of period | | Ps. | 356,267 | | | Ps. | 296,633 | | | Provision charged to income | | | 375,270 | | | | 303,348 | | | Loans charged off | | | (297,712 | ) | | | (243,714 | ) | | Balance at end of period | | Ps. | 433,825 | | | Ps. | 356,267 | |
| | June 30, | | | 2016 | | 2015 | | | | | | | | | Balance at beginning of period………………………………….. | Ps. | 433,825 | | Ps. | 356,267 | | Provision charged to income …………………………………… | | 356,492 | | | 375,270 | | Loans charged off………………………………………………... | | (296,781) | | | (297,712) | | Balance at end of period…………………………………………. | Ps. | 493,536 | | Ps. | 433,825 |
7. Other receivables from financial transactions
The breakdown of other receivables from financial transactions, by type of guarantee for the periods indicated, is as follows: BANCO HIPOTECARIO SA AND SUBSIDIARIES NOTES TO THE CONSOLIDATED FINANCIAL STATEMENTS As of and for the twelve-month periods ended June 30, 2016, 2015 2014 and 20132014 (Expressed in thousands of Argentine pesos, except share data and as otherwise indicated)
| | June 30, | | June 30, | | | 2015 | | 2014 | | 2016 | | 2015 | | Preferred guarantees, including deposits with the | | | | | | | | | | | | | Argentine Central Bank | | Ps. | 434,689 | | | Ps. | 507,836 | | | | Unsecured guarantees (a) | | | 2,966,068 | | | | 2,076,796 | | | | Argentine Central Bank……….…………………………….. | | Ps. | 766,485 | | Ps. | 434,689 | | Unsecured guarantees (a)……………………………………… | | | 6,098,728 | | | 2,966,068 | | Subtotal | | | 3,400,757 | | | | 2,584,632 | | | 6,865,213 | | | 3,400,757 | | Less: Allowance for losses | | | (22,611 | ) | | | (11,189 | ) | | | Less: Allowance for losses……....……………………………… | | | (23,624) | | | (22,611) | | Total | | Ps. | 3,378,146 | | | Ps. | 2,573,443 | | Ps. | 6,841,589 | | Ps. | 3,378,146 |
(a) Includes Ps. 4,78554,281 and Ps. 45,8174,785 of Amounts receivable under derivative financial instruments, as of June 30, 20152016 and 2014,2015, respectively, and Ps. 35,62175,695 and Ps. 60,19635,621 of Amounts receivable under repurchase agreements, as of June 30, 20152016 and 2014,2015, respectively.
The breakdown of the caption “Other” included in the balance sheet is as follows:
| | June 30, | | | | 2015 | | 2014 | | | | | | | | | | | Subordinated bonds (a) | | Ps. | 1,452,436 | | | Ps. | 424,548 | | | Certificates of participation (see note 19) | | | 388,250 | | | | 330,855 | | | Bonds held in the Bank’s portfolio (b) | | | - | | | | 46,036 | | | Bonds unquoted | | | 192,621 | | | | 333,330 | | | Collateral for OTC transactions | | | 114,034 | | | | 275,370 | | | Amounts receivable from spot and forward sales pending settlement | | | 524,785 | | | | 202,617 | | | Other | | | 574,887 | | | | 348,922 | | | Total | | Ps. | 3,247,013 | | | Ps. | 1,961,678 | |
| | June 30, | | | 2016 | | 2015 | | | | | | | | | Subordinated bonds (a)…….……………….…………………. | Ps. | 2,651,744 | | Ps. | 1,452,436 | | Certificates of participation (see note 19)……………………… | | 946,515 | | | 388,250 | | Bonds held in the Bank’s portfolio (b).……..…………………. | | 42,384 | | | - | | Bonds unquoted……………………………………………….... | | 215,149 | | | 192,621 | | Collateral for OTC transactions………………………………… | | 488,237 | | | 114,034 | | Amounts receivable from spot and forward sales pending settlement……………………………………………………….. | | 780,400 | | | 524,785 | | Other……………………………………………………………. | | 1,053,558 | | | 574,887 | | Total | Ps. | 6,177,987 | | Ps. | 3,247,013 |
(a) Includes Ps. 269,2432,158,130 and Ps. 268,111269,243 of debt securities related to securitizations made by the bank and described in note 19, as of June 30, 20152016 and 2014,2015, respectively. (b) The Bank carries some of its negotiable obligations as of June 30, 2014.2016.
8. Miscellaneous receivables
Miscellaneous receivables are comprised of the following for the periods indicated: | | June 30, | | | 2016 | | 2015 | | | | | | | | | Withholdings, credits and prepaid income tax………………… | Ps. | 45,503 | | Ps. | 33,812 | | Recoverable expenses, taxes, and advances to third parties…… | | 62,291 | | | 60,935 | | Attachments for non-restructured ON…………………………. | | 23,484 | | | 7,526 | | Guarantee deposit (*)………………………………………….. | | 32,293 | | | 171,891 | | Guarantee deposit for credit card transactions………………….. | | 289,199 | | | 117,723 | | Presumptive minimum income – Credit tax (see note 25)……... | | 77,041 | | | 61,561 | | Receivables from master servicing activities………………….. | | 838 | | | 787 | | Other Directors fees……………………………………………. | | 36,379 | | | 13,749 | | Loans to Bank staff…………………………………………….. | | 188,177 | | | 179,588 | | Other…………………………………………………………… | | 1,004,313 | | | 925,623 | | Subtotal | | 1,759,518 | | | 1,573,195 | | Less: Allowance for collection risks…………………………… | | (10,811) | | | (13,978) | | Total | Ps. | 1,748,707 | | Ps. | 1,559,217 |
| | June 30, | | | | 2015 | | 2014 | | | | | | | | | | | Withholdings, credits and prepaid income tax | | Ps. | 33,812 | | | Ps. | 21,569 | | | Recoverable expenses, taxes, and advances to third parties | | | 60,935 | | | | 58,414 | | | Attachments for non-restructured ON | | | 7,526 | | | | 8,703 | | | Guarantee deposit (*) | | | 171,891 | | | | 179,296 | | | Guarantee deposit for credit card transactions | | | 117,723 | | | | 59,610 | | | Presumptive minimum income – Credit tax (see note 25) | | | 61,561 | | | | 183,668 | | | Receivables from master servicing activities | | | 787 | | | | 899 | | | Other Directors fees | | | 13,749 | | | | 11,323 | | | Loans to Bank staff | | | 179,588 | | | | 178,260 | | | Other | | | 925,623 | | | | 430,126 | | | Subtotal | | | 1,573,195 | | | | 1,131,868 | | | Less: Allowance for collection risks | | | (13,978 | ) | | | (13,978 | ) | | Total | | Ps. | 1,559,217 | | | Ps. | 1,117,890 | |
BANCO HIPOTECARIO SA AND SUBSIDIARIES NOTES TO THE CONSOLIDATED FINANCIAL STATEMENTS As of and for the twelve-month periods ended June 30, 2016, 2015 2014 and 20132014 (Expressed in thousands of Argentine pesos, except share data and as otherwise indicated)
(*) As of June 30, 20152016 and 20142015 includes Ps. 162,75914,350 and Ps. 173,600162,759 as collateral for the custody of securities.
9. Bank Premises and Equipment
The book values of major categories of bank premises and equipment and total accumulated depreciation as of the periods indicated are as follows:
| | June 30, | | | | 2015 | | 2014 | | | | | | | | | | | Land and buildings | | Ps. | 117,090 | | | Ps. | 117,090 | | | Furniture and fixtures | | | 63,915 | | | | 49,421 | | | Machinery and equipment | | | 185,369 | | | | 145,416 | | | Other | | | 40,106 | | | | 25,007 | | | Accumulated depreciation | | | (220,160 | ) | | | (186,445 | ) | | Total | | Ps. | 186,320 | | | Ps. | 150,489 | |
| | June 30, | | | 2016 | | 2015 | | | | | | | | | Land and buildings………………………………………………. | Ps. | 186,599 | | Ps. | 117,090 | | Furniture and fixtures……………………………………………. | | 79,259 | | | 63,915 | | Machinery and equipment……………………………………….. | | 278,772 | | | 185,369 | | Other……………………………………………………………... | | 50,059 | | | 40,106 | | Accumulated depreciation……………………………………….. | | (277,591) | | | (220,160) | | Total | Ps. | 317,098 | | Ps. | 186,320 |
10. Miscellaneous assets
Miscellaneous assets consist of the following as of the end of each period:
| | June 30, | | | | 2015 | | 2014 | | | | | | | | | | | Properties held for sale | | Ps. | 33,587 | | | Ps. | 30,297 | | | Assets leased to others | | | 22,656 | | | | 19,947 | | | Stationery and supplies | | | 23,349 | | | | 18,244 | | | Other | | | 1,688 | | | | 2,164 | | | Accumulated depreciation | | | (20,867 | ) | | | (20,169 | ) | | Total | | Ps. | 60,413 | | | Ps. | 50,483 | |
| | June 30, | | | 2016 | | 2015 | | | | | | | | | Properties held for sale…………………………………………... | Ps. | 40,884 | | Ps. | 33,587 | | Assets leased to others…………………………………………... | | 26,339 | | | 22,656 | | Stationery and supplies………………………………………….. | | 30,848 | | | 23,349 | | Advances for purchase of goods (*)…………………………… | | 176,551 | | | | | Other……………………………………………………………... | | 1,949 | | | 1,688 | | Accumulated depreciation……………………………………….. | | (23,104) | | | (20,867) | | Total | Ps. | 253,467 | | Ps. | 60,413 |
(*) On April 20, 2016, by means of a public auction conducted by the government of the City of Buenos Aires, we acquired the building known as “Edificio del Plata” to be our corporate headquarters and a branch, for approximately US$68 million. As of June 30, 2016, we have paid 15% of the acquisition price and according to Article 3 of Decree 208/16, we are required to pay the remaining 85% when executing the public deed and entering into possession of the building, which should occur within 365 days of the public auction. 11. Intangible Assets
Intangible assets, net of accumulated amortization, as of the end of periods indicated are as follows:
| | June 30, | | | | 2015 | | 2014 | | | | | | | | | | | Third parties fees, re-engineering, restructuring and capitalized software costs | | Ps. | 131,714 | | | Ps. | 79,064 | | | Goodwill (*) | | | 18,508 | | | | 21,938 | | | Mortgage loan origination expenses related to Pro.Cre.Ar (see note 31) | | | 275,926 | | | | 143,538 | | | Total | | Ps. | 426,148 | | | Ps. | 244,540 | |
| | June 30, | | | 2016 | | 2015 | | | | | | | | | Third parties fees, re-engineering, restructuring and capitalized software costs................................................................................. | Ps. | 187,204 | | Ps. | 131,714 | | Goodwill (*)………………......…………………………………. | | 15,078 | | | 18,508 | | Mortgage loan origination expenses related to Pro.Cre.Ar (see note 31)………………………………………………………… | | 350,473 | | | 275,926 | | Total | Ps. | 552,755 | | Ps. | 426,148 |
(*) Goodwill is mainly related to the acquisition of Tarshop, which has been allocated to the Credit card segment - Tarshop.
BANCO HIPOTECARIO SA AND SUBSIDIARIES NOTES TO THE CONSOLIDATED FINANCIAL STATEMENTS As of and for the twelve-month periods ended June 30, 2016, 2015 2014 and 20132014 (Expressed in thousands of Argentine pesos, except share data and as otherwise indicated)
12. | Reserve for contingencies |
12. Reserve for contingencies The reserve for contingencies as of the end of each period is as follows:
| | June 30, | | | | 2015 | | 2014 | | | | | | | | | | | Legal Contingencies (a) | | Ps. | 78,863 | | | Ps. | 79,559 | | | Incurred but not reported and pending insurance claims (b) | | | 1,181 | | | | 1,181 | | | Contingency risks | | | 112,043 | | | | 47,292 | | | Tax Provision | | | 11,401 | | | | 11,912 | | | Bonds subject to lawsuits (c) | | | 14,290 | | | | 12,845 | | | Allowance for administrative-disciplinary-criminal penalties (d). | | | 4,172 | | | | - | | | Total | | Ps. | 221,950 | | | Ps. | 152,789 | |
| | June 30, | | | 2016 | | 2015 | | | | | | | | | Legal Contingencies (a)………………………………………… | Ps. | 172,264 | | Ps. | 78,863 | | Incurred but not reported and pending insurance claims (b)..…... | | - | | | 1,181 | | Contingency risks …..…………………………………………… | | 93,494 | | | 112,043 | | Tax Provision…………………………………………….……... | | 9,238 | | | 11,401 | | Bonds subject to lawsuits (c)…..………..……………….……. | | 24,463 | | | 14,290 | | Allowance for administrative-disciplinary-criminal penalties ...... | | 600 | | | 4,172 | | Total | Ps. | 300,059 | | Ps. | 221,950 |
| (a) Includes legal contingencies and expected legal fees. |
| (b) As of June 30, 2015 and 2014, it is composed of: Debts(b) As of June 30, 2015 it is composed of debts to insured for Ps. 1,181 (outstanding claims for Ps. 559 and IBNR for Ps. 622). |
| (c) Includes negotiable obligations past due whose holders did not enter to the comprehensive financial debt restructuring which ended on January, 2004. (c) Includes negotiable obligations past due whose holders did not enter to the comprehensive financial debt restructuring which ended on January, 2004. |
| (d) Includes a charge relating to a sanction for Ps. 4,040 imposed on BHSA by the Superintendent of Financial and Foreign Exchange Institutions through Resolution No. 685 in connection with the Financial Summary Proceedings No. 1320 (Note 30). At the close of these Financial Statements, this amount was deposited as resolved by the Executive Committee and the Bank’s Board of Directors. |
13. Other Liabilities from Financial Transactions - Obligation to return securities acquired under reverse repurchase agreements of government and corporate securities
The amounts outstanding corresponding to the Obligation to return securities acquired under reverse repurchase agreements of government and corporate securities, as of the end of the twelve-month periods are as follows:
| | June 30, | | | | 2015 | | 2014 | | | | | | | | | | | Reverse repurchase agreements collateralized by securities issued by the BCRA (*) | | Ps. | 11,114 | | | Ps. | 13,078 | | | Reverse repurchase agreements collateralized by other government securities (*) | | | 23,367 | | | | 127,726 | | | Total | | Ps. | 34,481 | | | Ps. | 140,804 | |
| | June 30, | | | 2016 | | 2015 | | | | | | | | | Reverse repurchase agreements collateralized by securities issued by the BCRA (*)……………………………………………………………….. | Ps. | 126,200 | | Ps. | 11,114 | | Reverse repurchase agreements collateralized by other government securities (*)………………………….………….……………………… | | 463,954 | | | 23,367 | | Total | Ps. | 590,154 | | Ps. | 34,481 |
(*) The transactions’ maturity date is July, 2015.2016.
| 14. | Other Liabilities from Financial Transactions - Other Banks and International Entities |
The breakdown of the bank debt is as follows:
Description | | Average Annual interest rate | | Average Maturity date | | 2015 | | | 2014 | | Average Annual interest rate | Average Maturity date | | 2016 | | | 2015 | | | | | | | | | | | | | | | | | | | | Interbank loans in pesos | | | 23.02 | % | August, 2015 | | Ps. | 297,357 | | | Ps. | 558,449 | | | | Interbank loans in pesos…...….……... | | 38.11% | August, 2016 | Ps. | 276,006 | | Ps. | 297,357 | | Total | | | | | | | Ps. | 297,357 | | | Ps. | 558,449 | | | | Ps | 276,006 | | Ps. | 297,357 |
15. Other Liabilities from Financial Transactions – Negotiable obligations
BANCO HIPOTECARIO SA AND SUBSIDIARIES NOTES TO THE CONSOLIDATED FINANCIAL STATEMENTS As of and for the twelve-month periods ended June 30, 2016, 2015 2014 and 20132014 (Expressed in thousands of Argentine pesos, except share data and as otherwise indicated)
15. Other Liabilities from Financial Transactions – Negotiable obligations
The balance of the negotiable obligations has been included in the “Other liabilities for financial transactions” caption. The residual face values of the different negotiable obligation series issued are as follows:
| | | | | | June 30, | |
| | | | | Issue date | Maturity date | | 2015 | | Annual interest rate | | 2014 | | Issue date | Maturity date | | | | | Banco Hipotecario S.A. | | | | | | | | | | | | | Series 5 (US$ 250,000 thousand) | 04/27/06 | 04/27/16 | | | a | | 9.750% | | | 1,914,484 | | | | 1,709,848 | | 04/27/06 | 04/27/16 | 9.750% | - | 1,914,484 | | Series IX (Ps. 258,997) | 04/25/13 | 01/25/15 | | | b/c | | Badlar +280bp | | | - | | | | 202,413 | | | | Series X (Ps. 34,523) | 08/14/13 | 08/09/14 | | | a | | 22.0% | | | - | | | | 32,465 | | | | Series XI (Ps. 146,137) | 08/14/13 | 05/14/15 | | | b/c | | Badlar +375bp | | | - | | | | 130,998 | | | | Series XII (US$. 44,508 thousand) | 08/14/13 | 08/14/17 | | | a | | 3.95% | | | 358,989 | | | | 361,970 | | 08/14/13 | 08/14/17 | 3.95% | 439,845 | 358,989 | | Series XIII (Ps. 55,510) | 11/11/13 | 11/06/14 | | | a | | 23.50% | | | - | | | | 55,510 | | | | Series XIV (Ps. 115,400) | 11/11/13 | 11/11/15 | | | b/c | | Badlar +375bp | | | 115,400 | | | | 115,400 | | 11/11/13 | 11/11/15 | | - | 115,400 | | Series XV (Ps. 12,340) | 01/31/14 | 01/26/15 | | | a | | 27.00% | | | - | | | | 12,340 | | | | Series XVI (Ps. 89,683) | 01/31/14 | 01/31/16 | | | b/c | | Badlar +425bp | | | 89,683 | | | | 89,683 | | 01/31/14 | 01/31/16 | | - | 89,683 | | Series XVIII (Ps. 20,046) | 05/16/14 | 02/16/15 | | | a | | 27.0% | | | - | | | | 20,046 | | | | Series XIX (Ps. 275,830) | 05/16/14 | 11/16/15 | | | b/c | | Badlar +375bp | | | 275,830 | | | | 270,001 | | 05/16/14 | 11/16/15 | | - | 275,830 | | Series XXI (Ps. 222,345) | 07/30/14 | 01/30/16 | | | b/c | | Badlar +275bp | | | 222,345 | | | | - | | 07/30/14 | 01/30/16 | | - | 222,345 | | Series XXII (Ps. 253,152) | 11/05/14 | 08/05/15 | | | b/d | | LEBACx0.95 | | | 253,152 | | | | - | | 11/05/14 | 08/05/15 | | - | 253,152 | | Series XXIII (Ps. 119,386) | 11/05/14 | 05/08/16 | | | b/c | | Badlar +325bp | | | 119,386 | | | | - | | 11/05/14 | 05/08/16 | | - | 119,386 | | Series XXIV (Ps. 27,505) | 02/05/15 | 01/31/16 | | | b | | LEBACx0.95 | | | 27,505 | | | | - | | 02/05/15 | 01/31/16 | | - | 27,505 | | Series XXV (Ps. 308,300) | 02/05/15 | 08/05/16 | | | a/b | | Mixed (e) | | | 298,496 | | | | - | | 02/05/15 | 08/05/16 | 9 months 27.5% and then Badlar +450bp | 298,413 | 298,496 | | Series XXVII (Ps. 281,740) | 05/22/15 | 11/22/16 | | | a/b | | Mixed (e) | | | 260,096 | | | | - | | 05/22/15 | 11/22/16 | 9 months 28.0% and then Badlar +450bp | 260,111 | 260,096 | | Series XXIX (US$ 200,000 thousand) | | 11/30/15 | 11/30/20 | 9.75% | 2,984,000 | - | | Series XXIX -Tranche II (US$ 150,000 thousand) | | 05/23/16 | 11/30/20 | 9.75% | 2,228,480 | - | | Series XXX (Ps. 314,611) | | 09/04/15 | 03/04/17 | 9 months 28.25% and then Badlar +450bp | 314,611 | - | | Series XXXI (US$ 14,730 thousand) | | 09/04/15 | 09/04/18 | 2.00% | 219,772 | - | | Series XXXII (Ps. 265,770) | | 11/30/15 | 05/30/17 | 3 months 27.0% and then Badlar +475bp | 265,770 | - | | Series XXXIV (Ps. 264,030) | | 02/10/16 | 08/10/17 | | 264,030 | - | | Series XXXV (Ps. 235,970) | | 02/10/16 | 02/10/19 | | 235,970 | - | | Series XXXVI (Ps. 469,750) | | 05/18/16 | 11/18/17 | | 469,750 | - | | | | | | | | | | | | | | | | | | | | | Tarshop S.A. | | | | | | | | | | | | | | | | | | | Series VIII (Ps. 79,589) | 01/28/13 | 07/30/14 | | | b/c | | Badlar+445bp | | | - | | | | 74,007 | | | | Series X (Ps. 72,592) | 05/23/13 | 11/23/14 | | | b/c | | Badlar+475bp | | | - | | | | 70,532 | | | | Series XI (Ps. 10,837) | 05/23/13 | 05/23/16 | | | b/c | | Badlar+580bp | | | 10,775 | | | | 9,729 | | 05/23/13 | 05/23/16 | | - | 10,775 | | Series XII (Ps. 83,588) | 08/09/13 | 08/09/15 | | | a | | 15.0% | | | 83,112 | | | | 74,822 | | 08/09/13 | 08/09/15 | 15.0% | - | 83,112 | | Series XIV (Ps. 30,245) | 04/21/14 | 01/21/15 | | | a | | 30.0% | | | - | | | | 28,442 | | | | Series XV (Ps. 119,755) | 04/21/14 | 10/21/15 | | | b/c | | Badlar+490bp | | | 113,967 | | | | 117,203 | | 04/21/14 | 10/21/15 | | - | 113,967 | | Series XVII (Ps. 41,066) | 11/26/14 | 08/26/15 | | | b/d | | LEBACx0.95 | | | 40,832 | | | | - | | 11/26/14 | 08/26/15 | | - | 40,832 | | Series XVIII (Ps. 69,291) | 11/26/14 | 05/26/16 | | | b/c | | Badlar+425bp | | | 68,896 | | | | - | | 11/26/14 | 05/26/16 | | - | 68,896 | | Series XIX (Ps. 6,314) | 11/26/14 | 11/26/17 | | | b/c | | Badlar+525bp | | | 6,280 | | | | - | | 11/26/14 | 11/26/17 | | 3,950 | 6,280 | | Series XX (Ps. 69,100) | 04/24/15 | 01/24/16 | | | a | | 27.5% | | | 68,707 | | | | - | | 04/24/15 | 01/24/16 | 27.5% | - | 68,707 | Series XXI (Ps. 80,500)v | 04/24/14 | 10/24/16 | | | a | | 28.5% | | | 80,043 | | | | - | | 04/24/14 | 10/24/16 | 28.5% | 79,932 | 80,043 | Series XXII (Ps. 126,667)v | | 07/30/15 | 01/30/17 | 29.0% | 125,772 | - | Series XXIII (Ps. 160,000)v | | 11/16/15 | 05/16/17 | | 158,870 | - | Series XXVI (Ps. 156,972)v | | 01/26/16 | 07/26/17 | | 155,863 | - | | Series XXVII (Ps. 147,288) | | 05/04/16 | 11/04/17 | | 146,248 | - | | | | | | | | | | | | | | | | | | | | | BACS Banco de Crédito y Securitización S.A. | BACS Banco de Crédito y Securitización S.A. | | | | | | | | | | | | | | | BACS Banco de Crédito y Securitización S.A. | | | | Series I (Ps. 130,435) | 02/19/14 | 08/19/15 | | | b/c | | Badlar+450bp | | | 130,435 | | | | 126,303 | | 02/19/14 | 08/19/15 | | - | 130,435 | | Series III (Ps. 132,726) | 08/19/14 | 05/19/16 | | | b/c | | Badlar +275bp | | | 132,726 | | | | - | | 08/19/14 | 05/19/16 | | - | 132,726 | | Series IV (Ps. 105,555) | 11/21/14 | 08/21/16 | | | b/c | | Badlar +350bp | | | 105,555 | | | | - | | 11/21/14 | 08/21/16 | | 35,192 | 105,555 | | Series V (Ps. 150,000) | 04/17/15 | 01/17/17 | | | a/b | | Mixed (d) | | | 150,000 | | | | - | | 04/17/15 | 01/17/17 | 9 months 27.48% and then Badlar +450bp | 150,000 | 150,000 | | | | | | | | | | | | | | | | | | | | | | | | | | | | | | 4,926,694 | | | | 3,501,712 | | | | Series VI (Ps. 141,666) | | 07/23/15 | 04/24/17 | 9 months 27.5% and then Badlar +450bp | 141,666 | - | | Series VII (Ps. 142,602) | | 02/18/16 | 11/18/17 | | 142,602 | - |
| Series VIII (Ps. 150,000) | 05/24/16 | 11/24/17 | Badlar +439bp | 150,000 | | - |
(a)Fixed interest rate
(b)Variable interest rate.
(c)As of June 30, 2015 Badlar rate was 20.81%
(d)As of June 30, 2015 LEBAC rate was 26.04%
(e)Fixed rate on the first nine months (between 27.48% and 28.0%) and variable interest rate of Badlar+450bps from that moment on.
BANCO HIPOTECARIO SA AND SUBSIDIARIES NOTES TO THE CONSOLIDATED FINANCIAL STATEMENTS As of and for the twelve-month periods ended June 30, 2016, 2015 2014 and 20132014 (Expressed in thousands of Argentine pesos, except share data and as otherwise indicated)
(a)As of June 30, 2016 Badlar rate was 21.87% The contractual maturities of the negotiable obligations are as follows as of June 30, 2015:2016:
June 30, 2016 | 2017…………………………….. | Ps. | 3,667,236 | 1,830,337 | June 30, 20172018…………………………….. | | | 900,469 | 1,772,288 | June 30, 20182019…………………………….. | | | 358,989 | 455,742 | ThereafterThereafter………………………………... | | | - | 5,212,480 | | Total | | Ps. | 4,926,694 | 9,270,847 |
The General Shareholders' Meeting held on May 23, 2008, approved the creation of a new Global Program for issuing Negotiable Obligations, not convertible into shares, with or without collateral, for an amount of up to two billion US dollars (US$ 2,000,000,000) or the equivalent thereof in pesos.
On March 27, 2012, the General Ordinary Shareholders’ Meeting approved the extension of the Global Program for the issuance of notes referred above. In addition, the meeting resolved to delegate on the Board of Directors the broadest powers to determine the time, amount, as well as the other terms and conditions of each Series to be issued. Additionally, on April 24, 2014, the General Ordinary Shareholders’ Meeting renewed such delegation of powers.
On February 11, 2015 the Bank’s Board of Directors approved the increase in the Program amount for up to US Dollars seven hundred million (US$ 700,000,000) or its equivalent in pesos.
On May 6, 2015, the Bank’s Board of Directors approved the increase in the Program amount for up to US dollars eight hundred million (US$ 800,000,000) or its equivalent in pesos.
On November 30, 2015, the Bank issued Notes in the international capital markets for US Dollars two hundred million (US$ 200,000,000) at an interest rate of 9.75% per annum, due in 2020. On December 1, 2015 and December 2, 2015, the Bank repurchased and retired Series 5 Notes for US Dollars one hundred and twenty two million four hundred ninety-seven thousand (US$ 122,497,000) and US Dollars one hundred and fifty-five thousand (US$ 155,000), respectively, for which it paid US Dollars one hundred two with fifty cents (US$ 102.50) for each US$ 100 in face value. The General Ordinary Shareholders held on April 13, 2016, approved the extension of the Bank’s Global Program for the issuance of notes for up to US dollars eight hundred million (US$ 800,000,000) or its equivalent in pesos currently in force for a term of up to 5 years , or the longer period permitted by applicable law. On June 15, 2016 the Bank’s Board of Directors approved the increase in the Program amount for up to US Dollars one billion (US$ 1,000,000,000) or its equivalent in pesos. 16. Subordinated Negotiable obligationsBonds
At the Extraordinary General Shareholders’ Meeting of BACS Banco de Crédito y Securitización S.A., dated December 12, 2013, the issuance of Convertible Subordinated Negotiable Obligations through private offering was approved for an amount of up to Ps.100,000.
On June 22, 2015, BACS issued negotiable obligations that are convertible into the Company’s ordinary and book-entry shares for a principal amount of Ps.100,000.
BANCO HIPOTECARIO SA AND SUBSIDIARIES NOTES TO THE CONSOLIDATED FINANCIAL STATEMENTS As of and for the twelve-month periods ended June 30, 2016, 2015 and 2014 (Expressed in thousands of Argentine pesos, except share data and as otherwise indicated) The private offering of the convertible negotiable obligations was solely addressed to the Company’s shareholders. As of June 30, 2015, IRSA Inversiones y Representaciones Sociedad Anónima subscribed all the convertible negotiable obligations.
On June 21, 2016, BACS Banco de Crédito y Securitización S.A. took notice of IRSA Inversiones y Representaciones SA’s decision to exercise its conversion rights over the subordinated bonds convertible into common shares and the filings made before the Argentine Central Bank and the Argentine Securities Commission. 17. Level I American Depositary Receipts Program
On March 27, 2006 the US Securities and Exchange Commission (SEC) has made effective the Level I American Depositary Receipts, “ADR” program.
This program allows foreign investors to buy the Bank’s stock through the secondary market where ADRs are traded freely within the United States. The Bank of New York has been appointed as depositary institution.
18. Derivative Financial Instruments
The Bank has carried out its financial risk management through the subscription of several derivative financial instruments. Derivative instruments are recorded under the captions “Other receivable from financial transactions – Amounts receivable under derivative financial instruments” or Liabilities: “Other liabilities from financial transactions – Amounts payable under derivative financial instruments” in the Consolidated Balance Sheet, and the related gain or loss BANCO HIPOTECARIO SA AND SUBSIDIARIES
NOTES TO THE CONSOLIDATED FINANCIAL STATEMENTS
As of and for the twelve-month periods ended June 30, 2015, 2014 and 2013
(Expressed in thousands of Argentine pesos, except share data and as otherwise indicated)
under the captions “Financial Income – Interest on loans and other receivables from financial transactions” or: “Financial Expenses – Interest on deposits and other liabilities from financial transactions”, respectively, in the Consolidated Statement of Income.
The following are the derivative financial instruments outstanding as of June 30, 20152016 and 2014:
Type of Contract | | Notional amount | | | Net Book Value Asset/(Liabilities) | | | Fair Value | | | | | 2015 | | | 2014 | | | 2015 | | | 2014 | | | 2015 | | | 2014 | | | | | | | | | | | | | | | | | | | | | | | Forwards (1)(a) | | | - | | | | 427,849 | | | | - | | | | 34,670 | | | | - | | | | 33,794 | | | Futures (2) | | | | | | | | | | | | | | | | | | | | | | | | | | Purchases (a) | | | 2,405,951 | | | | 3,540,782 | | | | (505 | ) | | | (1,145 | ) | | | (505 | ) | | | (1,145 | ) | | Sales (a) | | | (1,519,307 | ) | | | 2,456,907 | | | Interest rate swaps (3)(b) | | | 30,000 | | | | - | | | | 63 | | | | - | | | | 63 | | | | - | | | | | | | | | | | | | | (442 | ) | | | 33,525 | | | | (442 | ) | | | 32,649 | |
(a) | Underlying: Foreign currency. |
Type of Contract | | Notional amount | | Net Book Value Asset/(Liabilities) | | Fair Value | | | | 2016 | 2015 | | 2016 | 2015 | | 2016 | 2015 | | | | | | | | | | | | | Forwards (1)(a) | | - | - | | - | - | | - | - | | Futures (2) | | | | | | | | | | | Purchases (a) | | 9,671,321 | 2,405,951 | | 12,773 | (505) | | 12,773 | (505) | | Sales (a) | | (7,020,174) | (1,519,307) | | | | Interest rate swaps (3)(b) | | - | 30,000 | | - | 63 | | - | 63 | | | | | | | 12,773 | (442) | | 12,773 | (442) |
(b) | Underlying: Interest rate. |
(a)Underlying: Foreign currency.
(b)Underlying: Interest rate.
1. | Forwards: US dollar forward transactions have been carried out, the settlement of which, in general, is made without delivery of the underlying asset but by means of the payment in Pesos of currency differences. These transactions were performed mainly as hedge for foreign currency positions. Transactions with settlement in Pesos were made upon maturity. |
1. Forwards: US dollar forward transactions have been carried out, the settlement of which, in general, is made without delivery of the underlying asset but by means of the payment in Pesos of currency differences. These transactions were performed mainly as hedge for foreign currency positions. Transactions with settlement in Pesos were made upon maturity. For these transactions, as of June 30, 2016 and 2015 the Bank has recognized losses for Ps.179,085 and Ps. 34,646, respectively. 2. Futures: Future currency transactions have been carried out through which the forward purchase and sale of foreign currencies (US dollar) was agreed upon. These transactions were BANCO HIPOTECARIO SA AND SUBSIDIARIES NOTES TO THE CONSOLIDATED FINANCIAL STATEMENTS As of and for the twelve-month periods ended June 30, 2016, 2015 and 2014 (Expressed in thousands of Argentine pesos, except share data and as otherwise indicated) performed as hedge for foreign currency position. Settlement is carried on a daily basis for the difference. For these transactions, as of June 30, 2016 and 2015, the Bank has recognized gains for Ps.753,373 and losses for Ps. 51,899, respectively. 3. On February 18, 2015, OTC Transactions – Badlar rate swaps for agreed upon fixed interest rate were conducted. These are settled by paying the difference in Pesos. For these transactions, as of June 30, 2015, and 2014 the Bank has recognized losses for Ps. 34,646 and Ps. 12,593, respectively.
2. | Futures: Future currency transactions have been carried out through which the forward purchase and sale of foreign currencies (US dollar) was agreed upon. These transactions were performed as hedge for foreign currency position. Settlement is carried on a daily basis for the difference. |
For these transactions, as of June 30, 2015 and 2014, the Bank has recognized losses for Ps.51,899 and gains for Ps. 657,996,391, respectively.
3. | On February 18, 2015, OTC Transactions – Badlar rate swaps for agreed upon fixed interest rate were conducted. These are settled by paying the difference in Pesos. Income has been accounted for in the amount of Ps. 391 as of June 30, 2015. |
19. Securitization of mortgage loans, consumer loans and credit card loans
The Bank created separate trusts under its US securitization program and “Cédulas Hipotecarias Argentina – program”; and a consumer trust under BACS’s Global Trust Securities Program. For each mortgage or consumer trust, the Bank transfers a portfolio of mortgages or consumer loans originated by banks and other financial institutions in trust to the relevant trustee. The trustee then issues Class A senior Bonds, Class B subordinated bonds and certificates of participation. The trust’s payment obligations in respect of these instruments are collateralized by, and recourse is limited to, the trust’s assets consisting of the portfolio of mortgage or consumer loans and any reserve fund established by the Bank for such purpose. The securitizations were recorded as sales, and accordingly, the mortgage and consumer loans conveyed to the trusts are no longer recorded as assets of the Bank.
At the date of these financial statements the following trust funds are outstanding:
| | Debt Securities Class A1/AV | Debt Securities Class A2/AF | Debt Securities Class B | Certificates of Participation | Total | | | | | | | | | BACS III – Issued on 12.23.2005 | | | | | | | Face value in Ps. | 77,600 | | 1,200 | 1,200 | 80,000 | | Declared Maturity Date | 03.20.2013 | | 09.20.2013 | 08.20.2015 | | | | | | | | | | BACS Funding I Issued on 11.15.2001 (*) | | | | | | | Face value in Ps. | - | - | - | 29,907 | 29,907 | | Declared Maturity Date | | | | 11.15.2031 | | | | | | | | | | BACS Funding II Issued on 11.23.2001 (*) | | | | | | | Face value in Ps. | - | - | - | 12,104 | 12,104 | | Declared Maturity Date | | | | 11.23.2031 | | | | | | | | | | BHSA I Issued on 02.01.2002 | | | | | | | Face value in Ps. | - | - | - | 43,412 | 43,412 | | Declared Maturity Date | | | | 02.01.2021 | | | | | | | | | | CHA VI Issued on 04.07.2006 | | | | | | | Face value in Ps. | 56,702 | - | - | 12,447 | 69,149 | | Declared Maturity Date | 12.31.2016 | | | 12.31.2026 | | | | | | | | | | CHA VII Issued on 09.27.2006 | | | | | | | Face value in Ps. | 58,527 | - | - | 12,848 | 71,375 | | Declared Maturity Date | 08.31.2017 | | | 02.28.2028 | | | | | | | | | | CHA VIII Issued on 03.26.2007 | | | | | | | Face value in Ps. | 61.088 | - | - | 13,409 | 74.497 | | Declared Maturity Date | 08.31.2024 | | | 08.31.2028 | | | | | | | | | | CHA IX Issued on 08.28.2009 | | | | | | | Face value in Ps. | 192,509 | - | - | 10,132 | 202,641 | | Declared Maturity Date | 02.07.2027 | | | 07.07.2027 | | | | | | | | | | CHA X Issued on 08.28.2009 | | | | | | | Face value in Ps. | - | - | - | 17,224 | 17,224 | | Face value en US$ | 85,001 | - | - | - | 85,001 | | Declared Maturity Date | 01.07.2027 | | | 06.07.2028 | | | | | | | | | | CHA XI Issued on 12.21.2009 | | | | | | | Face value in Ps. | 204,250 | - | - | 10,750 | 215,000 | | Declared Maturity Date | 03.10.2024 | | | 10.10.2024 | | | | | | | | | | CHA XII Issued on 07.21.2010 | | | | | | | Face value in Ps. | 259,932 | - | - | 13,680 | 273,612 | | Declared Maturity Date | 11.10.2028 | | | 02.10.2029 | | | | | | | | | | CHA XIII Issued on 12.02.2010 | | | | | | | Face value in Ps. | 110,299 | - | - | 5,805 | 116,104 | | Declared Maturity Date | 12.10.2029 | | | 04.10.2030 | | | | | | | | | | CHA XIV Issued on 03.18.2011 | | | | | | | Face value in Ps. | 119,876 | - | - | 6,309 | 126,185 | | Declared Maturity Date | 05.10.2030 | | | 08.10.2030 | | | | | | | | |
(*)Trusts subject to the pesification of foreign currency assets and liabilities at the $1.00=US$1 rate established by Law 25561 and Decree 214, as they were created under Argentine legislation. Certain holders of Class A debt securities have started declarative actions against the trustee pursuant to the application of the pesification measures set forth in Law 25561 and Decree 214, in order to maintain the currency of origin of said securities. In these declarative actions, the Bank acted together with BACS as third party. The trustee has duly answered to this claim, being the final resolution to this situation is still pending. BANCO HIPOTECARIO SA AND SUBSIDIARIES NOTES TO THE CONSOLIDATED FINANCIAL STATEMENTS As of and for the twelve-month periods ended June 30, 2016, 2015 2014 and 20132014 (Expressed in thousands of Argentine pesos, except share data and as otherwise indicated)
| | | Debt Securities Class A1/AV | | | Debt Securities Class A2/AF | | | Debt Securities Class B | | | Certificates of Participation | | | Total | | | | | | | | | | | | | | | | | | | | BHN II – Issued on 05.09.97 (*) | | | | | | | | | | | | | | | | | Face value in Ps. | | | 44,554 | | | | 51,363 | | | | 3,730 | | | | 6,927 | | | | 106,574 | | | Declared Maturity Date | | | 03.25.2001 | | | | 07.25.2009 | | | | 03.25.2012 | | | | 05.25.2013 | | | | | | | | | | | | | | | | | | | | | | | | | | | | | BHN III – Issued on 10.29.97 (*) | | | | | | | | | | | | | | | | | | | | | | Face value in Ps. | | | 14,896 | | | | 82,090 | | | | 5,060 | | | | 3,374 | | | | 105,420 | | | Declared Maturity Date | | | 05.31.2017 | | | | 05.31.2017 | | | | 05.31.2018 | | | | 05.31.2018 | | | | | | | | | | | | | | | | | | | | | | | | | | | | | BHN IV – Issued on 03.15.00 (*) | | | | | | | | | | | | | | | | | | | | | | Face value in Ps. | | | 36,500 | | | | 119,500 | | | | 24,375 | | | | 14,625 | | | | 195,000 | | | Declared Maturity Date | | | 03.31.2011 | | | | 03.31.2011 | | | | 01.31.2020 | | | | 01.31.2020 | | | | | | | | | | | | | | | | | | | | | | | | | | | | | BACS I – Issued on 02.15.2001 (*) | | | | | | | | | | | | | | | | | | | | | | Face value in Ps. | | | 30,000 | | | | 65,000 | | | | 12,164 | | | | 8,690 | | | | 115,854 | | | Declared Maturity Date | | | 05.31.2010 | | | | 05.31.2010 | | | | 06.30.2020 | | | | 06.30.2020 | | | | | | | | | | | | | | | | | | | | | | | | | | | | | BACS III – Issued on 12.23.2005 | | | | | | | | | | | | | | | | | | | | | | Face value in Ps. | | | 77,600 | | | | | | | | 1,200 | | | | 1,200 | | | | 80,000 | | | Declared Maturity Date | | | 03.20.2013 | | | | | | | | 09.20.2013 | | | | 08.20.2015 | | | | | | | | | | | | | | | | | | | | | | | | | | | | | BACS Funding I Issued on 11.15.2001 (*) | | | | | | | | | | | | | | | | | | | | | | Face value in Ps. | | | - | | | | - | | | | - | | | | 29,907 | | | | 29,907 | | | Declared Maturity Date | | | | | | | | | | | | | | | 11.15.2031 | | | | | | | | | | | | | | | | | | | | | | | | | | | | | BACS Funding II Issued on 11.23.2001 (*) | | | | | | | | | | | | | | | | | | | | | | Face value in Ps. | | | - | | | | - | | | | - | | | | 12,104 | | | | 12,104 | | | Declared Maturity Date | | | | | | | | | | | | | | | 11.23.2031 | | | | | | | | | | | | | | | | | | | | | | | | | | | | | BHSA I Issued on 02.01.2002 | | | | | | | | | | | | | | | | | | | | | | Face value in Ps. | | | - | | | | - | | | | - | | | | 43,412 | | | | 43,412 | | | Declared Maturity Date | | | | | | | | | | | | | | | 02.01.2021 | | | | | | | | | | | | | | | | | | | | | | | | | | | | | CHA VI Issued on 04.07.2006 | | | | | | | | | | | | | | | | | | | | | | Face value in Ps. | | | 56,702 | | | | - | | | | - | | | | 12,447 | | | | 69,149 | | | Declared Maturity Date | | | 12.31.2016 | | | | | | | | | | | | 12.31.2026 | | | | | | | | | | | | | | | | | | | | | | | | | | | | | CHA VII Issued on 09.27.2006 | | | | | | | | | | | | | | | | | | | | | | Face value in Ps. | | | 58,527 | | | | - | | | | - | | | | 12,848 | | | | 71,375 | | | Declared Maturity Date | | | 08.31.2017 | | | | | | | | | | | | 02.28.2028 | | | | | | | | | | | | | | | | | | | | | | | | | | | | | CHA VIII Issued on 03.26.2007 | | | | | | | | | | | | | | | | | | | | | | Face value in Ps. | | | 61.088 | | | | - | | | | - | | | | 13,409 | | | | 74.497 | | | Declared Maturity Date | | | 08.31.2024 | | | | | | | | | | | | 08.31.2028 | | | | | | | | | | | | | | | | | | | | | | | | | | | | | CHA IX Issued on 08.28.2009 | | | | | | | | | | | | | | | | | | | | | | Face value in Ps. | | | 192,509 | | | | - | | | | - | | | | 10,132 | | | | 202,641 | | | Declared Maturity Date | | | 02.07.2027 | | | | | | | | | | | | 07.07.2027 | | | | | | | | | | | | | | | | | | | | | | | | | | | | | CHA X Issued on 08.28.2009 | | | | | | | | | | | | | | | | | | | | | | Face value in Ps. | | | - | | | | - | | | | - | | | | 17,224 | | | | 17,224 | | | Face value en US$ | | | 85,001 | | | | - | | | | - | | | | - | | | | 85,001 | | | Declared Maturity Date | | | 01.07.2027 | | | | | | | | | | | | 06.07.2028 | | | | | | | | | | | | | | | | | | | | | | | | | | | | | CHA XI Issued on 12.21.2009 | | | | | | | | | | | | | | | | | | | | | | Face value in Ps. | | | 204,250 | | | | - | | | | - | | | | 10,750 | | | | 215,000 | | | Declared Maturity Date | | | 03.10.2024 | | | | | | | | | | | | 10.10.2024 | | | | | | | | | | | | | | | | | | | | | | | | | | | | | CHA XII Issued on 07.21.2010 | | | | | | | | | | | | | | | | | | | | | | Face value in Ps. | | | 259,932 | | | | - | | | | - | | | | 13,680 | | | | 273,612 | | | Declared Maturity Date | | | 11.10.2028 | | | | | | | | | | | | 02.10.2029 | | | | | | | | | | | | | | | | | | | | | | | | | | | | | CHA XIII Issued on 12.02.2010 | | | | | | | | | | | | | | | | | | | | | | Face value in Ps. | | | 110,299 | | | | - | | | | - | | | | 5,805 | | | | 116,104 | | | Declared Maturity Date | | | 12.10.2029 | | | | | | | | | | | | 04.10.2030 | | | | | | | | | | | | | | | | | | | | | | | | | | | | | CHA XIV Issued on 03.18.2011 | | | | | | | | | | | | | | | | | | | | | | Face value in Ps. | | | 119,876 | | | | - | | | | - | | | | 6,309 | | | | 126,185 | | | Declared Maturity Date | | | 05.10.2030 | | | | | | | | | | | | 08.10.2030 | | | | | | | | | | | | | | | | | | | | | | | | | | | |
BANCO HIPOTECARIO SA AND SUBSIDIARIES
NOTES TO THE CONSOLIDATED FINANCIAL STATEMENTS
As of and for the twelve-month periods ended June 30, 2015, 2014 and 2013
(Expressed in thousands of Argentine pesos, except share data and as otherwise indicated)
(*) | Trusts subject to the pesification of foreign currency assets and liabilities at the $1.00=US$1 rate established by Law 25561 and Decree 214, as they were created under Argentine legislation. Certain holders of Class A debt securities have started declarative actions against the trustee pursuant to the application of the pesification measures set forth in Law 25561 and Decree 214, in order to maintain the currency of origin of said securities. In these declarative actions, the Bank acted together with BACS as third party. The trustee has duly answered to this claim, being the final resolution to this situation is still pending. |
Tarshop SA has created several financial trusts under its securitization program (“Valores Fiduciarios Tarjeta Shopping – Global program”) destined to assure its long-term financing accessing directly to the capital market. The assets included in the trusts relate to credit card coupons and advances in cash. The table below presents the trusts issued and outstanding as of June 30, 2015:2016: | | Debt Securities | Certificates of Participation | Total | | | | | | | Series LXXXIII– Issued on 05.27.15 | I | | | | Face value in Ps. | 111,222 | 42,591 | 153,813 | | | | | | | Series LXXXIV– Issued on 03.12.15 | | | | | Face value in Ps. | 104,865 | 39,019 | 143,884 | | | | | | | Series LXXXV– Issued on 05.20.15 | | | | | Face value in Ps. | 128,500 | 47,800 | 176,300 | | | | | | | Series LXXXVI– Issued on 06.29.15 | | | | | Face value in Ps. | 126,050 | 48,168 | 174,218 | | | | | | | Series LXXXVII– Issued on 10.01.15 | | | | | Face value in Ps. | 141,066 | 57,091 | 198,157 | | | | | | | Series LXXXVIII– Issued on 04.01.16 | | | | | Face value in Ps. | 148,489 | 65,472 | 213,961 | | | | | | | Series LXXXIX–Issued on 05.17.16 | | | | | Face value in Ps. | 143,530 | 63,282 | 206,812 | | | | | | | Series XC– Issued on 06.28.16 | | | | | Face value in Ps. | 150,025 | 66,162 | 216,187 | | | | | | | Series XCI– Privately issued on 05.15.16 | | | | | Face value in Ps. | 102,581 | 39,893 | 142,474 | | | | | | | Series XCII– Privately issued on 06.15.16 | | | | | Face value in Ps. | 82,622 | 32,131 | 114,753 | | | | | | | Tarshop Privado Series 1 - Privately issued on 08.21.15 | | | | | Face value in Ps. | 1,162,400 | 329,362 | 1,491,762 | | | | | | | Tarshop Privado Series 1I - Privately issued on 12.23.15 | | | |
| | | Debt Securities | | | Certificates of Participation | | | Total | | | | | | | | | | | | | | Series LXXVIII– Issued on 01.22.14 | | | | | | | | | | | Face value in Ps. | | | 153,087 | | | | 49,100 | | | | 202,187 | | | Estimated Maturity Date | | | 06.05.2015 | | | | 06.05.2015 | | | | | | | | | | | | | | | | | | | | | Series LXXIX– Issued on 03.18.14 | | | | | | | | | | | | | | Face value in Ps. | | | 151,750 | | | | 49,659 | | | | 201,409 | | | Estimated Maturity Date | | | 08.05.2015 | | | | 08.05.2015 | | | | | | | | | | | | | | | | | | | | | Series LXXXI– Issued on 10.17.14 | | | | | | | | | | | | | | Face value in Ps. | | | 81,450 | | | | 28,231 | | | | 109,681 | | | Estimated Maturity Date | | | 09.10.2015 | | | | 09.10.2015 | | | | | | | | | | | | | | | | | | | | | Series LXXXII– Issued on 01.19.15 | | | | | | | | | | | | | | Face value in Ps. | | | 87,450 | | | | 33,489 | | | | 120,939 | | | Estimated Maturity Date | | | 03.07.2016 | | | | 03.07.2016 | | | | | | | | | | | | | | | | | | | | | Series LXXXIII– Issued on 05.27.15 | | | | I | | | | | | | | | | Face value in Ps. | | | 111,222 | | | | 42,591 | | | | 153,813 | | | Estimated Maturity Date | | | 08.05.2016 | | | | 08.05.2016 | | | | | | | | | | | | | | | | | | | | | Series LXXXIV– Privately issued on 03.15.15 | | | | | | | | | | | | | | Face value in Ps. | | | 61,273 | | | | 23,829 | | | | 85,102 | | | Estimated Maturity Date | | | 09.15.2016 | | | | 09.15.2016 | | | | | | | | | | | | | | | | | | | | | Series LXXXV– Privately issued on 06.15.15 | | | | | | | | | | | | | | Face value in Ps. | | | 60,265 | | | | 23,436 | | | | 83,701 | | | Estimated Maturity Date | | | 12.15.2016 | | | | 12.15.2016 | | | | | | | | | | | | | | | | | | | | | | | | | | | | | | | | | |
BANCO HIPOTECARIO SA AND SUBSIDIARIES NOTES TO THE CONSOLIDATED FINANCIAL STATEMENTS As of and for the twelve-month periods ended June 30, 2016, 2015 and 2014 (Expressed in thousands of Argentine pesos, except share data and as otherwise indicated) | Face value in Ps. | 1,396,300 | 535,571 | 1,931,871 | | | | | | | Tarshop Series 1 - Privately issued on 09.15.15 | | | | | Face value in Ps. | 77,799 | 27,201 | 105,000 | | | | | |
BACS Banco de Crédito y Securitización S.A. (BACS) has created separate trusts which have personal loans, primary originated by cooperatives and later acquired by BACS, as assets. The mentioned trusts have been issued under the “Fideicomisos Financieros BACS – Global program" for the securitization for a face value up to Ps. 300,000. As of June 30, 20152016 and 20142015 there are no trusts outstanding. As of June 30, 20152016 and 2014,2015, the Bank held in its portfolio the following securities corresponding to the abovementioned trusts: BANCO HIPOTECARIO SA AND SUBSIDIARIES NOTES TO THE CONSOLIDATED FINANCIAL STATEMENTS As of and for the twelve-month periods ended June 30, 2016, 2015 2014 and 20132014 (Expressed in thousands of Argentine pesos, except share data and as otherwise indicated)
| | June 30, | | | 2016 | | 2015 | | | | | | | | | Class B debt securities – BHN II | Ps. | - | | Ps. | 7,000 | | Class B debt securities – BHN III | | - | | | 7,203 | | Class B debt securities – BHN IV | | - | | | 79,351 | | Class A debt securities – BHN IV | | - | | | 44 | | Class A debt securities – CHA VI to CHA XIV | | 103,829 | | | 75,417 | | Class A debt securities – BACS I | | - | | | 20,234 | | Class B debt securities – BACS I | | - | | | 1,081 | | Debt securities – BACS III | | 14,411 | | | 15,768 | | Debt securities – Tarshop Series LXXIX | | - | | | 2,042 | | Debt securities – Tarshop Series LXXXII | | - | | | 7,198 | | Debt securities – Tarshop Series LXXXIII | | 998 | | | 13,530 | | Debt securities – Tarshop Series LXXXIV | | - | | | 20,927 | | Debt securities – Tarshop Series LXXXV | | - | | | 19,448 | | Debt securities – Tarshop Series LXXXVII | | 27,260 | | | - | | Debt securities – Tarshop Series XC | | 14,796 | | | - | | Debt securities – Tarshop Series XCI | | 19,525 | | | - | | Debt securities – Tarshop Privado Series I | | 98,453 | | | - | | Debt securities – Tarshop Privado Series II | | 656,071 | | | - | | Debt securities – Tarshop Series I | | 1,222,787 | | | - | | Subtotal | Ps. | 2,158,130 | | Ps. | 269,243 |
| | June 30, | | | | 2015 | | 2014 | | | | | | | | | | | Class B debt securities – BHN II | | Ps. | 7,000 | | | Ps. | - | | | Class B debt securities – BHN III | | | 7,203 | | | | 7,203 | | | Class B debt securities – BHN IV | | | 79,351 | | | | 79,351 | | | Class A debt securities – BHN IV | | | 44 | | | | 45 | | | Class A debt securities – CHA VI to CHA XIV | | | 75,417 | | | | 53,549 | | | Class A debt securities – BACS I | | | 20,234 | | | | 20,234 | | | Class B debt securities – BACS I | | | 1,081 | | | | 1,081 | | | Debt securities – BACS III | | | 15,768 | | | | 18,107 | | | Debt securities – Tarshop Series LXXV | | | - | | | | 88,541 | | | Debt securities – Tarshop Series LXXIX | | | 2,042 | | | | - | | | Debt securities – Tarshop Series LXXXII | | | 7,198 | | | | - | | | Debt securities – Tarshop Series LXXXIII | | | 13,530 | | | | - | | | Debt securities – Tarshop Series LXXXIV | | | 20,927 | | | | - | | | Debt securities – Tarshop Series LXXXV | | | 19,448 | | | | - | | | Subtotal | | Ps. | 269,243 | | | Ps. | 268,111 | |
| | June 30, | | | 2016 | | 2015 | | | | | | | | | Certificates of participation – BHN II | Ps. | - | | Ps. | 41,722 | | Certificates of participation – BHN III | | - | | | 14,970 | | Certificates of participation – CHA VI | | 13,737 | | | 13,592 | | Certificates of participation – CHA VII | | - | | | 953 | | Certificates of participation – CHA IX | | 10,181 | | | 10,677 | | Certificates of participation – CHA X | | 26,578 | | | 26,085 | | Certificates of participation – CHA XI | | 11,935 | | | 14,488 | | Certificates of participation – CHA XII | | 14,440 | | | 18,298 | | Certificates of participation – CHA XIII | | 4,277 | | | 5,330 | | Certificates of participation – CHA XIV | | 4,173 | | | 5,401 | | Certificates of participation – BHSA I | | 8,949 | | | 9,192 | | Certificates of participation – BACS III | | 1,003 | | | 1,003 | | Certificates of Participation – Tarshop Series LXXIX | | - | | | 48,523 | | Certificates of Participation – Tarshop Series LXXX | | - | | | 47,053 | | Certificates of Participation – Tarshop Series LXXXI | | - | | | 23,782 | | Certificates of Participation – Tarshop Series LXXXII | | - | | | 24,551 | | Certificates of Participation – Tarshop Series LXXXIII | | 22,045 | | | 34,032 | | Certificates of Participation – Tarshop Series LXXXIV | | 19,797 | | | 23,486 | | Certificates of Participation – Tarshop Series LXXXV | | 23,094 | | | 25,112 | | Certificates of Participation – Tarshop Series LXXXVI | | 24,817 | | | - | | Certificates of Participation – Tarshop Series LXXXVII | | 32,074 | | | - | | Certificates of Participation – Tarshop Series LXXXVIII | | 42,178 | | | - | | Certificates of Participation – Tarshop Series LXXXIX | | 41,048 | | | - | | Certificates of Participation – Tarshop Series XC | | 48,088 | | | - | | Certificates of Participation – Tarshop Series XCI | | 33,284 | | | - | | Certificates of Participation – Tarshop Series XCII | | (920) | | | - |
| | June 30, | | | | 2015 | | 2014 | | | | | | | | | | | Certificates of participation – BHN II | | Ps. | 41,722 | | | Ps. | 41,722 | | | Certificates of participation – BHN III | | | 14,970 | | | | 14,970 | | | Certificates of participation – CHA VI | | | 13,592 | | | | 13,708 | | | Certificates of participation – CHA VII | | | 953 | | | | 4,427 | | | Certificates of participation – CHA VIII | | | - | | | | 2,769 | | | Certificates of participation – CHA IX | | | 10,677 | | | | 11,493 | | | Certificates of participation – CHA X | | | 26,085 | | | | 24,908 | | | Certificates of participation – CHA XI | | | 14,488 | | | | 14,613 | | | Certificates of participation – CHA XII | | | 18,298 | | | | 19,198 | | | Certificates of participation – CHA XIII | | | 5,330 | | | | 5,985 | | | Certificates of participation – CHA XIV | | | 5,401 | | | | 6,404 | | | Certificates of participation – BHSA I | | | 9,192 | | | | 7,013 | | | Certificates of participation – BACS III | | | 1,003 | | | | 1,003 | | | Certificates of Participation – Tarshop Series LXXIV | | | - | | | | 15,844 | | | Certificates of Participation – Tarshop Series LXXV | | | - | | | | 25,282 | | | Certificates of Participation – Tarshop Series LXXVI | | | - | | | | 21,779 | | | Certificates of Participation – Tarshop Series LXXVII | | | - | | | | 30,996 | | | Certificates of Participation – Tarshop Series LXXVIII | | | - | | | | 39,885 | | | Certificates of Participation – Tarshop Series LXXIX | | | 48,523 | | | | 12,065 | | | Certificates of Participation – Tarshop Series LXXX | | | 47,053 | | | | 16,791 | | | Certificates of Participation – Tarshop Series LXXXI | | | 23,782 | | | | - | | | Certificates of Participation – Tarshop Series LXXXII | | | 24,551 | | | | - | | | Certificates of Participation – Tarshop Series LXXXIII | | | 34,032 | | | | - | | | Certificates of Participation – Tarshop Series LXXXIV | | | 23,486 | | | | - | | | Certificates of Participation – Tarshop Series LXXXV | | | 25,112 | | | | - | | | Subtotal | | Ps. | 388,250 | | | Ps. | 330,855 | | | Total | | Ps. | 657,493 | | | Ps. | 598,966 | |
BANCO HIPOTECARIO SA AND SUBSIDIARIES NOTES TO THE CONSOLIDATED FINANCIAL STATEMENTS As of and for the twelve-month periods ended June 30, 2016, 2015 2014 and 20132014 (Expressed in thousands of Argentine pesos, except share data and as otherwise indicated)
| Certificates of Participation – Tarshop Privado Series I | | 8,288 | | | - | | Certificates of Participation – Tarshop Privado Series II | | 175,214 | | | - | | Certificates of Participation – Tarshop Series I | | 382,235 | | | - | | Subtotal | Ps. | 946,515 | | Ps. | 388,250 | | Total | Ps. | 3,105,151 | | Ps. | 657,493 |
20. Miscellaneous Liabilities
Sundry creditors and other miscellaneous liabilities consist of the following as of the end of each period:
| | June 30, | | | | 2015 | | 2014 | | | Sundry creditors: | | | | | | | | Accrued fees and expenses payable | | Ps. | 1,291,772 | | | Ps. | 655,475 | | | Summary proceedings in financial matters N° 1320 (*) | | | 53,632 | | | | - | | | Unallocated collections | | | 9,464 | | | | 14,845 | | | Withholdings and taxes payable | | | 96,350 | | | | 39,347 | | | Other | | | 16,973 | | | | 14,543 | | | Total | | Ps. | 1,468,191 | | | Ps. | 724,210 | |
| | June 30, | | | 2016 | | 2015 | | Sundry creditors: | | | | | | | Accrued fees and expenses payable …….…………….……... | Ps. | 857,251 | | Ps. | 1,291,772 | | Summary proceedings in financial matters N° 1320 (*)…… | | - | | | 53,632 | | Unallocated collections………………………………………. | | 12,116 | | | 9,464 | | Withholdings and taxes payable……………………………... | | 57,288 | | | 96,350 | | Other…………………………………………………………. | | 19,233 | | | 16,973 | | Total | Ps. | 945,888 | | Ps. | 1,468,191 |
(*) At the close of these Financial Statements, theThe Bank’s Board of Directors granted its approval to the actions undertaken by the Executive Committee concerning the deposit of the penalties imposed on directors, former directors, managers, former managers and statutory auditors and the fact that such amounts were charged against the statement of income in the framework ofFinancial Summary Proceedings No. 1320 (Note 30).
| | June 30, | | | | 2015 | | 2014 | | | Other: | | | | | | | | Directors and Syndics accrued fees payable | | Ps. | 47,829 | | | Ps. | 38,145 | | | Payroll withholdings and contributions | | | 91,217 | | | | 51,898 | | | Gratifications | | | 68,810 | | | | 39,166 | | | Salaries and social securities | | | 64,559 | | | | 49,440 | | | Total | | Ps. | 272,415 | | | Ps. | 178,649 | |
| | June 30, | | | 2016 | | 2015 | | Other: | | | | | | | Directors and Syndics accrued fees payable…………………. | Ps. | 57,109 | | Ps. | 47,829 | | Payroll withholdings and contributions…………………….... | | 99,962 | | | 91,217 | | Gratifications……………………………………………….... | | 180,553 | | | 68,810 | | Salaries and social securities…………………………………. | | 46,786 | | | 64,559 | | Total | Ps. | 384,410 | | Ps. | 272,415 |
21. Income from Services and Expenses on Services
Income from Services
Commissions earned consist of the following for each period:
| | June 30, | | | | 2015 | | 2014 | | 2013 | | | | | | | | | | | | | | Loan servicing fees from third parties | | Ps. | 37,240 | | | Ps. | 30,854 | | | Ps. | 26,548 | | | Commissions from FONAVI | | | - | | | | - | | | | 11,361 | | | Commissions for credit cards | | | 1,048,855 | | | | 705,143 | | | | 555,128 | | | Other | | | 209,230 | | | | 130,619 | | | | 77,176 | | | Total | | Ps. | 1,295,325 | | | Ps. | 866,616 | | | Ps. | 670,213 | |
| | June 30, | | | 2016 | | 2015 | | 2014 | | | | | | | | | | | | Loan servicing fees from third parties…..…………. | Ps. | 50,844 | | Ps. | 37,240 | | Ps. | 30,854 | | Commissions for credit cards……...………………… | | 1,573,624 | | | 1,048,855 | | | 705,143 | | Other …..…………………………………………… | | 158,653 | | | 209,230 | | | 130,619 | | Total | Ps. | 1,783,121 | | Ps. | 1,295,325 | | Ps. | 866,616 |
Other income from services is comprised of the following for each period: BANCO HIPOTECARIO SA AND SUBSIDIARIES NOTES TO THE CONSOLIDATED FINANCIAL STATEMENTS As of and for the twelve-month periods ended June 30, 2016, 2015 2014 and 20132014 (Expressed in thousands of Argentine pesos, except share data and as otherwise indicated)
Other income from services is comprised of the following for each period:
| | 2016 | | 2015 | | 2014 | | | | | | | | | | | | Reimbursement of loan expenses paid by third parties………………………………………..……… | Ps. | 26,088 | | Ps. | 19,547 | | Ps. | 37,289 | | Income from services from PROCREAR (note 31)… | | 244,130 | | | 106,619 | | | 30,947 | | Other (*)….………………………………………… | | 554,535 | | | 607,096 | | | 287,917 | | Total | Ps. | 824,753 | | Ps. | 733,262 | | Ps. | 356,153 |
| | June 30, | | | | 2015 | | 2014 | | 2013 | | | | | | | | | | | | | | Reimbursement of loan expenses paid by third parties | | Ps. | 19,547 | | | Ps. | 37,289 | | | Ps. | 68,731 | | | Income from services from PROCREAR (note 31) | | | 106,619 | | | | 30,947 | | | | 9,863 | | | Other (*) | | | 607,096 | | | | 287,917 | | | | 228,804 | | | Total | | Ps. | 733,262 | | | Ps. | 356,153 | | | Ps. | 307,398 | |
(*)For the twelve-month periods ended June 30, 2016, 2015 2014 and 2013,2014, includes Ps. 426,829, Ps. 525,516 and Ps. 235,379, and Ps. 191,680, respectively, related to other income services granted by Tarshop.
Expenses on Services
Commissions expensed consist of the following for each period: | | June 30, | | | 2016 | | 2015 | | 2014 | | | | | | | | | | | | Structuring and underwriting fees………………….. | Ps. | 54,879 | | Ps. | 16,466 | | Ps. | 14,254 | | Retail bank originations……………………………... | | 12,073 | | | 7,690 | | | 6,327 | | Collections…………………………………………... | | 303 | | | 181 | | | 159 | | Aerolíneas Argentinas co-branding………………… | | 50,952 | | | 27,329 | | | 11,398 | | Services on loans…………………………………….. | | 754,359 | | | 452,188 | | | 373,412 | | Commissions paid to real estate agents……………. | | 45,056 | | | 36,688 | | | 40,707 | | Total | Ps. | 917,622 | | Ps. | 540,542 | | Ps. | 446,257 |
| | | | June 30, | | | | | | 2015 | | | | 2014 | | | | 2013 | | | Structuring and underwriting fees | | Ps. | 16,466 | | | Ps. | 14,254 | | | Ps. | 8,200 | | | Retail bank originations | | | 7,690 | | | | 6,327 | | | | 1,958 | | | Collections | | | 181 | | | | 159 | | | | 158 | | | Aerolíneas Argentinas co-branding | | | 27,329 | | | | 11,398 | | | | 469 | | | Services on loans | | | 452,188 | | | | 373,412 | | | | 154,930 | | | Commissions paid to real estate agents | | | 36,688 | | | | 40,707 | | | | 28,349 | | | Total | | Ps. | 540,542 | | | Ps. | 446,257 | | | Ps. | 194,064 | |
22. Other Miscellaneous Income and Miscellaneous Expenses
Other miscellaneous income is comprised of the following for each period:
| | June 30, | | | | 2015 | | 2014 | | 2013 | | | | | | | | | | | | | | Income on operations with premises and equipment and miscellaneous assets | | Ps. | 578 | | | Ps. | 2,944 | | | Ps. | 1,158 | | | Rental income | | | 2,267 | | | | 2,290 | | | | 1,603 | | | Interest on loans to bank staff | | | 31,447 | | | | 26,601 | | | | 20,668 | | | Income from equity investments | | | 6,641 | | | | - | | | | - | | | Other | | | 17,942 | | | | 15,708 | | | | 14,326 | | | Total | | Ps. | 58,875 | | | Ps. | 47,543 | | | Ps. | 37,755 | |
| | June 30, | | | 2016 | | 2015 | | 2014 | | | | | | | | | | | | Income on operations with premises and equipment and miscellaneous assets…………...................... | Ps. | 3,592 | | Ps. | 578 | | Ps. | 2,944 | | Rental income…………….……………………….. | | 2,976 | | | 2,267 | | | 2,290 | | Interest on loans to bank staff..……………………. | | 35,581 | | | 31,447 | | | 26,601 | | Income from equity investments.……………………. | | 34,644 | | | 6,641 | | | - | | Other…..………��…………………………………. | | 51,852 | | | 17,942 | | | 15,708 | | Total | Ps. | 128,645 | | Ps. | 58,875 | | Ps. | 47,543 |
Other miscellaneous expenses are comprised of the following for each period: | | June 30, | | | 2016 | | 2015 | | 2014 | | | | | | | | | | | | Depreciation of miscellaneous assets……………….. | Ps. | 310 | | Ps. | 340 | | Ps. | 388 | | Gross revenue tax…………………………………… | | 9,206 | | | 7,126 | | | 4,395 | | Other taxes…………………………………………... | | 178,828 | | | 117,464 | | | 78,784 | | Debit card discounts………………………………… | | 24,718 | | | 20,624 | | | 14,285 | | Credit card and others discounts……………………. | | 59,807 | | | 40,577 | | | 43,422 | | Benefits prepayments……………………………….. | | 2,856 | | | 9,268 | | | 6,008 | | Donations…………………………………………… | | 51,026 | | | 39,842 | | | 24,325 |
BANCO HIPOTECARIO SA AND SUBSIDIARIES NOTES TO THE CONSOLIDATED FINANCIAL STATEMENTS As of and for the twelve-month periods ended June 30, 2016, 2015 2014 and 20132014 (Expressed in thousands of Argentine pesos, except share data and as otherwise indicated)
Other miscellaneous expenses are comprised of the following for each period:
| Amortization of goodwill…………………………… | | 3,430 | | | 3,430 | | | 3,430 | | | Payment Summary proceedings in financial matters N° 1320 (*)…………………………………………. | | - | | | 53,632 | | | - | | | Other …..…………………………………………… | | 47,654 | | | 44,417 | | | 45,393 | | | Total | Ps. | 377,835 | | Ps. | 336,720 | | Ps. | 220,430 | |
| | June 30, | | | | 2015 | | 2014 | | 2013 | | | | | | | | | | | | | | Depreciation of miscellaneous assets | | Ps. | 340 | | | Ps. | 388 | | | Ps. | 350 | | | Gross revenue tax | | | 7,126 | | | | 4,395 | | | | 2,445 | | | Other taxes | | | 117,464 | | | | 78,784 | | | | 23,835 | | | Debit card discounts | | | 20,624 | | | | 14,285 | | | | 12,052 | | | Credit card and others discounts | | | 40,577 | | | | 43,422 | | | | 55,130 | | | Benefits prepayments | | | 9,268 | | | | 6,008 | | | | 4,166 | | | Donations | | | 39,842 | | | | 24,325 | | | | 18,048 | | | Amortization of goodwill | | | 3,430 | | | | 3,430 | | | | 3,429 | | | Payment Summary proceedings in financial matters N° 1320 (*) | | | 53,632 | | | | - | | | | - | | | Other | | | 44,417 | | | | 45,393 | | | | 11,511 | | | Total | | Ps. | 336,720 | | | Ps. | 220,430 | | | Ps. | 130,966 | |
(*)At the close of these Financial Statements, During The fiscal year 2015, the Bank’s Board of Directors granted its approval to the actions undertaken by the Executive Committee concerning the deposit of the penalties imposed on directors, former directors, managers, former managers and statutory auditors and the fact that such amounts were charged against the statement of income in the framework of the Financial Summary Proceedings No. 1320 (Note 30).
23. Balances in Foreign Currency
The balances of assets and liabilities denominated in foreign currency (principally in US dollars and Euros) are as follows:
| | US$ | Euro | Yen | Total | | | (in Pesos) | | Assets: | | | | | | Cash and due from banks…..………..……….. | 1,222,421 | 28,210 | 10 | 1,250,641 | | Government and corporate securities..……….. | 2,351,646 | 292,729 | - | 2,644,375 | | Loans………………..………………………... | 1,435,021 | - | - | 1,435,021 | | Other receivables from financial transactions... | 1,011,013 | - | - | 1,011,013 | | Miscellaneous receivables………………….… | 136,909 | 65 | - | 136,974 | | Items pending allocation………………..….… | 541 | - | - | 541 | | Total as of June 30, 2016 | 6,157,550 | 321,004 | 10 | 6,478,565 | | Total as of June 30, 2015 | 3,253,549 | 18,591 | 5 | 3,272,145 | | | | | | | | Liabilities: | | | | | | Deposits……………………………………… | 2,458,279 | - | - | 2,458,279 | | Other liabilities from financial transactions…. | 6,585,111 | 49 | - | 6,585,160 | | Miscellaneous liabilities……………………… | 12,667 | 20 | - | 12,687 | | Items pending allocation…………………….. | 496 | 31 | - | 527 | | Total as of June 30, 2016 | 9,056,553 | 100 | - | 9,056,653 | | Total as of June 30, 2015 | 3,082,324 | 101,490 | - | 3,183,814 |
| | | US$ | | | Euro | | | Yen | | | Total | | | | | (in Pesos) | | | Assets: | | | | | | | | | | | | | | Cash and due from banks | | | 732,799 | | | | 18,561 | | | | 5 | | | | 751,365 | | | Government and corporate securities | | | 797,684 | | | | - | | | | - | | | | 797,684 | | | Loans | | | 1,223,758 | | | | - | | | | - | | | | 1,223,758 | | | Other receivables from financial transactions | | | 471,249 | | | | - | | | | - | | | | 471,249 | | | Miscellaneous receivables | | | 28,059 | | | | 30 | | | | - | | | | 28,089 | | | Total as of June 30, 2015 | | | 3,253,549 | | | | 18,591 | | | | 5 | | | | 3,272,145 | | | Total as of June 30, 2014 | | | 3,888,459 | | | | 19,472 | | | | 5 | | | | 3,907,936 | | | | | | | | | | | | | | | | | | | | | Liabilities: | | | | | | | | | | | | | | | | | | Deposits | | | 609,328 | | | | - | | | | - | | | | 609,328 | | | Other liabilities from financial transactions | | | 2,470,533 | | | | 101,460 | | | | - | | | | 2,571,993 | | | Miscellaneous liabilities | | | 2,286 | | | | 12 | | | | - | | | | 2,298 | | | Items pending allocation | | | 177 | | | | 18 | | | | - | | | | 195 | | | Total as of June 30, 2015 | | | 3,082,324 | | | | 101,490 | | | | - | | | | 3,183,814 | | | Total as of June 30, 2014 | | | 3,448,283 | | | | 55,890 | | | | - | | | | 3,504,173 | |
24. Income Tax
In accordance with Section 28 of Law 24,855, Banco Hipotecario Sociedad Anónima is subject to income tax, except with respect to housing loan transactions made before October 23, 1997, the date of registration of its bylaws with the Superintendency of Corporations. BANCO HIPOTECARIO SA AND SUBSIDIARIES
NOTES TO THE CONSOLIDATED FINANCIAL STATEMENTS
As of and for the twelve-month periods ended June 30, 2015, 2014 and 2013
(Expressed in thousands of Argentine pesos, except share data and as otherwise indicated)
The Bank records the charges to income, when applicable, and a provision in its liabilities for the tax applicable to its taxable transactions in the fiscal year to which they refer.
As of December 31, 20142015 and 2013,2014, the Bank estimated income tax by applying the 35% tax rate to its taxable income. The amount determined as income tax was charged against income for the fiscal period under “Income Tax”. The provision for income tax is recorded under “Miscellaneous Liabilities – Other”.
The Bank has a tax net operating loss carry forward of Ps. 56,690143,435 and Ps. 87,69259,690 at June 30, 20152016 and 2014,2015, respectively.
25. Presumptive Minimum Income Tax
BANCO HIPOTECARIO SA AND SUBSIDIARIES NOTES TO THE CONSOLIDATED FINANCIAL STATEMENTS As of and for the twelve-month periods ended June 30, 2016, 2015 and 2014 (Expressed in thousands of Argentine pesos, except share data and as otherwise indicated) The Bank is subject to presumptive minimum income tax. Pursuant to this tax regime, the Bank is required to pay the greater of the income tax or the presumptive minimum income tax. Any excess of the presumptive minimum income tax over the income tax may be carried forward and recognized as a tax credit against future income taxes payable over a 10-year period. The presumptive minimum income tax provision is calculated on an individual entity basis at the statutory asset tax rate of 1% and is based upon the taxable assets of each company as of the end of the year, as defined by Argentine law. For financial entities, the taxable basis is 20% of their computable assets.
| As of June 30, 2015 the Bank recorded the Ps. 61,561As of June 30, 2016 Tarshop recorded the Ps.76,144 tax credit. |
26. Shareholders' Equity
The following information relates to the statements of changes in the Bank’sshareholders' equity.
Prior to June 30, 1997, the Bank's capital stock consisted of assigned capital with no par value owned 100% by the Argentine government. In accordance with the by-laws approved as a result of the conversion of the Bank to a sociedad anónima, the Bank's capital stock was established at Ps.1,500,000 and divided into four classes of ordinary common shares.
As of June 30, 2015,2016, the Bank's capital stock consists of:
Shareholder | | Class of Shares | | | Number of Shares | | | Total % Ownership | | Voting Rights | Class of Shares | Number of Shares | | Total % Ownership | Voting Rights | | Argentine government (through FFFRI) (b) | | | A | | | | 668,711,843 | | | | 44.6 | % | 1 vote | A | 665,499,426 | | 44.4% | 1 vote | Banco Nación, as trustee for the Bank's Programa de Propiedad Participada (a) | | | B | | | | 57,009,279 | | | | 3.8 | % | 1 vote | B | 57,009,279 | | 3.8% | 1 vote | | Argentine government (through FFFRI) | | | C | | | | 75,000,000 | | | | 5.0 | % | 1 vote | C | 75,000,000 | | 5.0% | 1 vote | | Public investors (c) (d) | | | D | | | | 699,278,878 | | | | 46.6 | % | 3 votes | D | 702,491,295 | | 46.8% | 3 votes | | | | | | | | | 1,500,000,000 | | | | 100.0 | % | | | 1,500,000,000 | | 100.0% | |
_______________ (a) | (a) The Bank's Programa de Propiedad Participada (“PPP”) is the Bank's employee stock ownership plan. Under Decree 2127/2012 and Resolution 264/2013 issued by the Ministry of Economy and Public Finance, the PPP was implemented. Under this plan, in a first stage, out of a total of 75,000,000, 17,990,721 Class B shares were converted into Class A shares, to be allocated among the employees that have withdrawn from the Bank in accordance with the implementation guidelines. Upon delivery to the former employees, the 17,990,721 shares will become Class D shares. The shares allocated to the Bank’s current employees are designated as Class B shares, representing the PPP. On December 2, 2015, the Bank took notice of an observation raised by the Superintendent of Financial Institutions reporting to the Argentine Central Bank with regard to the insurance business developed by Banco Hipotecario S.A. through BHN Vida S.A. and BHN Seguros Generales S.A. The observation requires the enforcement of the credit scoring regulations, which impose a 12.5% limit on interests in the capital stock and voting rights of other companies. In reply, the Bank has claimed that such observation should be revised, in that the Bank is allowed to conduct the business in question pursuant to the Privatization Law No. 24,855 and |
BANCO HIPOTECARIO SA AND SUBSIDIARIES NOTES TO THE CONSOLIDATED FINANCIAL STATEMENTS As of and for the twelve-month periods ended June 30, 2016, 2015 2014 and 20132014 (Expressed in thousands of Argentine pesos, except share data and as otherwise indicated)
(b) | become Class D shares. The shares allocated to the Bank’s current employees are designated as Class B shares, representing the PPP. |
its regulations, in particular Decree No. 1394/98, as continuing company of Banco Hipotecario Nacional, as set forth in the first paragraph of this Note.
(c) | Under the Bylaws, the affirmative vote of the holders of Class A Shares is required in order to effectuate: (i) mergers or spin-offs; (ii) an acquisition of shares (constituting a Control Acquisition or resulting in the Bank being subject to a control situation); (iii) the transfer to third parties of a substantial part of the loan portfolio of the Bank, (iv) a change in the Bank’s corporate purpose; (v) the transfer of the Bank’s corporate domicile outside of Argentina, and (vi) the voluntary dissolution of the Bank. |
(b)
Under the Bylaws, the affirmative vote of the holders of Class A Shares is required in order to effectuate: (i) mergers or spin-offs; (ii) an acquisition of shares (constituting a Control Acquisition or resulting in the Bank being subject to a control situation); (iii) the transfer to third parties of a substantial part of the loan portfolio of the Bank, (iv) a change in the Bank’s corporate purpose; (v) the transfer of the Bank’s corporate domicile outside of Argentina, and (vi) the voluntary dissolution of the Bank.
(d) | For so long as Class A Shares represent more than 42% of the Bank’s capital, the Class D Shares shall be entitled to three votes per share, except that holders of Class D Shares will be entitled to one vote per share in the case of a vote on: (i) a fundamental change in the Bank’s corporate purpose; (ii) a change of the Bank’s domicile to be outside of Argentina; (iii) dissolution prior to the expiration of the Bank’s corporate existence; (iv) a merger or spin-off in which the Bank is not the surviving corporation; and (v) a total or partial recapitalization following a mandatory reduction of capital. |
(c) (e) | By reason of the expiration on January 29, 2009 of the Total Return Swap that had been executed and delivered on January 29, 2004, Deutsche Bank AG transferred to the Bank 71,100,000 ordinary Class “D” shares in Banco Hipotecario Sociedad Anónima with face value $ 1 each, which are available for the term and in the conditions prescribed by the Argentine Companies Law, in its Section 221. The General Ordinary Shareholders’ Meeting held on April 30, 2010 resolved to extend for a year, counted as from January 31, 2010, the term for realizing the treasury shares held by the Bank. |
For so long as Class A Shares represent more than 42% of the Bank’s capital, the Class D Shares shall be entitled to three votes per share, except that holders of Class D Shares will be entitled to one vote per share in the case of a vote on: (i) a fundamental change in the Bank’s corporate purpose; (ii) a change of the Bank’s domicile to be outside of Argentina; (iii) dissolution prior to the expiration of the Bank’s corporate existence; (iv) a merger or spin-off in which the Bank is not the surviving corporation; and (v) a total or partial recapitalization following a mandatory reduction of capital.
(d) By reason of the expiration on January 29, 2009 of the Total Return Swap that had been executed and delivered on January 29, 2004, Deutsche Bank AG transferred to the Bank 71,100,000 ordinary Class “D” shares in Banco Hipotecario Sociedad Anónima with face value $ 1 each, which are available for the term and in the conditions prescribed by the Argentine Companies Law, in its Section 221. The General Ordinary Shareholders’ Meeting held on April 30, 2010 resolved to extend for a year, counted as from January 31, 2010, the term for realizing the treasury shares held by the Bank. On April 30, 2010, the General Extraordinary Shareholders’ Meeting resolved to delegate upon the Board of Directors the decision to pay with the treasury shares in portfolio the Stock Appreciation Rights (StAR) coupons resulting from the debt restructuring as advisable based on the contractually agreed valuation methods and their actual market value after allowing the shareholders to exercise their preemptive rights on an equal footing.
On June 16, 2010, the Board of Directors resolved to launch a preemptive offer to sell a portion of the Bank’s treasury shares, for a total of 36.0 million class D shares. The remaining shares would be delivered in payment to the holders of Stock Appreciation Rights (StAR) coupons arising from the debt restructuring, which fell due on August 3, 2010. On July 26, 2010, within the framework of the referred offer, the Bank sold approximately 26.9 million of the shares mentioned above.
On August 3, 2010 the proceeds of the offer and the balance of the shares referred in the preceding paragraph were made available to the holders of the Stock Appreciation Rights (StAR) coupons. With the above-mentioned offering, 999,312 Class D shares were sold in excess of those required to pay off the obligation previously mentioned. In connection with such excess sale, Ps. 554 thousand were recorded as retained earnings to reflect the addition of the shares to the entity’s equity, which took place on January 29, 2009 as detailed in this note, and a further Ps. 834 thousand were booked as Additional paid-in capital for the difference between the value as added to the entity’s equity and the sales value.
The General Ordinary Shareholders’ Meeting held on April 24, 2013 resolved to allocate 35,100,000 Class D shares held by the Bank to a compensation program for the personnel under the terms of Section 67 of Law 26831. This decision is pending approval of CNV.
On April 24, 2014 the General Ordinary Shareholders’ Meeting acknowledged the incentive or compensation program described in the preceding paragraph and its extension to the personnel BANCO HIPOTECARIO SA AND SUBSIDIARIES
NOTES TO THE CONSOLIDATED FINANCIAL STATEMENTS
As of and for the twelve-month periods ended June 30, 2015, 2014 and 2013
(Expressed in thousands of Argentine pesos, except share data and as otherwise indicated)
employed by the subsidiaries BACS Banco de Crédito y Securitización S.A., BH Valores S.A., BHN Sociedad de Inversión S.A., BHN Vida S.A. and BHN Seguros Generales S.A.
BANCO HIPOTECARIO SA AND SUBSIDIARIES NOTES TO THE CONSOLIDATED FINANCIAL STATEMENTS As of and for the twelve-month periods ended June 30, 2016, 2015 and 2014 (Expressed in thousands of Argentine pesos, except share data and as otherwise indicated) The Class B shares have been set aside for sale to the Bank's employees in the future pursuant to the PPP on terms and conditions to be established by the Argentine government. Any Class B shares not acquired by the Bank's employees at the time the Bank implements the PPP will automatically convert into Class A shares. The Class C shares are eligible for sale only to companies engaging in housing construction or real estate activities. Any Class B shares transferred by an employee outside the PPP will automatically convert to Class D shares or Class C shares transferred to persons not engaged in construction or real estate activities will automatically convert into Class D shares.
(b) Distribution of profits
No profits may be distributed when any financial year does not produce profits.
Argentine Central Bank Communication “A” 4152 dated June 2, 2004 left without effect the suspension of the distribution of profits established by Communication “A” 3574. However, those banks that proceed to such distribution must be previously authorized by the Financial and Exchange Institutions Superintendency.
Through Communiqué “A” 4526 dated April 24, 2006, the BCRA established that when the Legal Reserve is used to absorb losses, earnings shall not be distributed until the reimbursement thereof. Should the balance prior to the absorption exceed 20% of the Capital Stock plus the Capital Adjustment, profits may be distributed once the latest value is reached.
For purposes of determining distributable balances, the net difference arising from the book value and the market quotation shall be deducted from retained earnings, in the event the Entity records government debt securities and/or debt securities issued by the BCRA not recorded at market prices, with volatility published by such entity.
Pursuant to its Communication “A” 5072, BCRA established that no dividend distribution shall be admitted in so far as: a) the amounts deposited as minimum cash requirements on average – in Pesos, foreign currency or in Government securities – were less than the requirements pertaining to the most recently closed position or the position as projected taking into account the effect of the distribution of dividends, and/or b) the amounts deposited as minimum capital requirements were less than the requirements recalculated as previously mentioned plus a 30% increase, and/or c) the Entity has received financial aid from the BCRA on grounds of illiquidity as set forth in Section 17 of BCRA’s Charter.
On January 27, 2012, the BCRA issued Communication “A” 5272 whereby it established that for the calculation of the minimum capital requirement, the minimum capital for operational risk shall be included. On the same date, Communication “A” 5273 was also issued, whereby the BCRA resolved to increase the percentage referred to in the preceding paragraph, subsection b), from 30% to 75%.
Communication “A” 5369 provided that as from January 1, 2013, for the purposes of calculating the position of minimum capitals, the capital requirement for credit risk due to securitizations must be computed over all the transactions outstanding as of the computation date.
On September 23, 2013 the Argentine Congress enacted Law N° 26,983 which amends the Income Tax Law and sets forth that dividends or earnings in money or in kind shall be levied with Income Tax at a 10% tax rate payable in a final and lump sum. BANCO HIPOTECARIO SA AND SUBSIDIARIES
NOTES TO THE CONSOLIDATED FINANCIAL STATEMENTS
As of and for the twelve-month periods ended June 30, 2015, 2014 and 2013
(Expressed in thousands of Argentine pesos, except share data and as otherwise indicated)
The Ordinary General Shareholders’ Meeting, held on April 13, 2011, resolved to distribute the income for the year ended on December 31, 2010 as follows: Ps. 39,063 (20%), to be applied to the
BANCO HIPOTECARIO SA AND SUBSIDIARIES NOTES TO THE CONSOLIDATED FINANCIAL STATEMENTS As of and for the twelve-month periods ended June 30, 2016, 2015 and 2014 (Expressed in thousands of Argentine pesos, except share data and as otherwise indicated) legal reserve Ps. 100,000 (61.59%), to be paid out as cash dividends on ordinary shares, and the balance, after the Board’s remuneration, to be maintained as retained earnings. On September 20, 2012, the BCRA reported that there were no objections against the Bank’s distribution of cash dividends for Ps. 100,000, thousand, as requested. For such reason, on October 10, 2012 such cash funds were made available to the shareholders.
The Ordinary General Shareholders’ Meeting, held on August 23, 2013, resolved to distribute the income for the year ended on December 31, 2012 as follows: Ps. 68,721, to be applied to the legal reserve; Ps. 30,000, to be paid out as cash dividends on ordinary shares; and Ps. 244,886 to be maintained as retained earnings. This decision has been approved by BCRA.
On April 24, 2014, the Ordinary General Shareholders’ Meeting resolved to distribute the income for the year ended on December 31, 2013 as follows: Ps. 84,190, to be applied to the legal reserve; Ps. 42,000, to be paid out as cash dividends on ordinary shares; and Ps. 294,760 to be maintained as retained earnings. Through Note 314/43/14 dated December 23, 2014, the Argentine Central Bank authorized the Bank to distribute cash dividends for Ps. 42,000. At its meeting dated January 7, 2015, the Board of Directors of Banco Hipotecario S.A. resolved that these dividends should be made available to the shareholders as of January 16, 2015.
On July 12, 2016 by means of Communication "A" 6013 the Argentine Central Bank published the updated text on “Distribution of profits” effective as from January 1, 2016 by means of Communication “A” 5827 and supplementary rules. The provisions of this communication aim at converging towards international principles and standards, among other changes, they stablish additional capital margins. 27. Employee Benefit Plan
The Bank is obligated to make employer contributions to the National Pension Plan System determined on the basis of the total monthly payroll. These expenses are recorded in “Salaries and social security contributions” under the “Administrative expenses” caption in the accompanying consolidated statements of income.
28. Financial Instruments with Off-Balance Sheet Risk
In the normal course of its business the Bank is party to financial instruments with off-balance sheet risk in order to meet the financing needs of its customers. These instruments expose the Bank to credit risk in addition to amounts recognized in the balance sheets. These financial instruments include commitments to extend credit.
| | June 30, | | | | 2015 | | 2014 | | | Commitments to extend credit | | | | | | | | Mortgage loans and other loans (a) | | Ps. | 291,342 | | | Ps. | 132,180 | | | Credit card loans (b) | | | 14,049,429 | | | | 11,913,152 | | | Clearing items in process (c) | | | 137,944 | | | | 163,304 | | | Other guarantees (d) | | | 57,739 | | | | 46,646 | |
| | June 30, | | | 2016 | | 2015 | | Commitments to extend credit | | | | | | | Mortgage loans and other loans (a)….……………... | Ps. | 165,636 | | Ps. | 291,342 | | Credit card loans (b)…..……………………..……. | | 22,947,873 | | | 14,049,429 | | Clearing items in process (c)..………………………… | | 234,515 | | | 137,944 | | Other guarantees (d)…………………………………. | | 483,644 | | | 57,739 |
| Commitments to extend credit are agreements to lend to a customer at a future date, subject to such customers meeting of pre-defined contractual milestones. Typically, the Bank will commit to extend financing for construction project lending on the basis of the certified progress of the work under construction. Most arrangements require the borrower to pledge the land or buildings under construction as collateral. In the opinion of management, the Bank’s outstanding commitments do not represent unusual credit risk. The Bank’s exposure to credit loss in the event of nonperformance by the other party is represented by the contractual notional amount of those commitments. |
Commitments to extend credit are agreements to lend to a customer at a future date, subject to such customers meeting of pre-defined contractual milestones. Typically, the Bank will commit to extend financing for construction project lending on the basis of the certified progress of the work under construction. Most arrangements require the borrower to pledge the land or buildings under construction as collateral. In the opinion of management, the
(b) | The Bank has a unilateral and irrevocable right to reduce or change the credit card limit, thus it considered there is no off-balance sheet risk. In the opinion of management, the |
BANCO HIPOTECARIO SA AND SUBSIDIARIES NOTES TO THE CONSOLIDATED FINANCIAL STATEMENTS As of and for the twelve-month periods ended June 30, 2016, 2015 2014 and 20132014 (Expressed in thousands of Argentine pesos, except share data and as otherwise indicated)
| Bank’s outstanding commitments do not represent unusual credit risk. The Bank’s exposure to credit loss in the event of nonperformance by the other party is represented by the contractual notional amount of those commitments. |
(b)
Bank’s outstanding commitments do not represent unusual credit risk. The Bank’s exposure to credit loss in the event of nonperformance by the other party is represented by the contractual notional amount of those commitments.
(c) | The Bank accounts for items drawn on other banks in memorandum accounts until such time as the related item clears or is accepted. In the opinion of management, the Bank’s risk of loss on these clearing transactions is not significant as the transactions primarily relate to collections on behalf of third parties. |
(c) (d) | Mainly includes the amounts given as collateral for transactions held by customers. |
The Bank has a unilateral and irrevocable right to reduce or change the credit card limit, thus it considered there is no off-balance sheet risk. In the opinion of management, the Bank’s outstanding commitments do not represent unusual credit risk. The Bank’s exposure to credit loss in the event of nonperformance by the other party is represented by the contractual notional amount of those commitments.
(d) The Bank accounts for items drawn on other banks in memorandum accounts until such time as the related item clears or is accepted. In the opinion of management, the Bank’s risk of loss on these clearing transactions is not significant as the transactions primarily relate to collections on behalf of third parties. (e) Mainly includes the amounts given as collateral for transactions held by customers. 29. Adoption of International Financial Reporting Standards
By virtue of its General Resolution No. 562, the Argentine Securities Commission (CNV) has decided to enforce the provisions under the Technical Pronouncement No. 26 of the Argentine Federation of Professional Councils in Economic Sciences (FACPCE) that adopts the International Financial Reporting Standards (IFRS) for all the companies overseen by CNV as from the fiscal years beginning on January 1, 2012.
The Bank is not obligated to apply these standards insofar as the CNV has excluded all the entities for which CNV is empowered to accept the accounting criteria laid down by other regulatory and/or oversight authorities (financial institutions, insurance companies, etc.) from using the IFRS.
On February 12, 2014, BCRA issued its Communication “A” 5541 whereby it provides a roadmap to convergence between the informational and accounting regime and IFRS. Pursuant to this Communication, the entities and institutions must start to account for their financial transactions and changes in accordance with the rules issued by BCRA following the above-mentioned convergence regime as from the fiscal years beginning on January 1, 2018. This roadmap includes the following steps:
·● First half of 2015
Financial institutions must prepare and file their own convergence plan and provide the name of the compliance officer appointed to such end.
Disclosure of guidelines to be observed by institutions regarding reconciliations are to be filed with the BCRA.
·● Second half of 2015
The institutions shall file with the BCRA, together with the financial statements as of the fiscal year’s closing date, a reconciliation of the main asset, liability and shareholders’ equity captions with the amounts that would result from applying the rules issued by the BCRA under the scope of the IFRS convergence process. This information shall include a special report by the independent auditor and will be used exclusively by the BCRA for supervision and regulation purposes, and will qualify as non-public. Institutions shall report on the degree of progress made in the IFRS Convergence Plan.
·● Year 2016
According to the method and frequency established in due course, institutions shall continue to report to the BCRA the degree of progress made by them in the IFRS convergence process. In
BANCO HIPOTECARIO SA AND SUBSIDIARIES NOTES TO THE CONSOLIDATED FINANCIAL STATEMENTS As of and for the twelve-month periods ended June 30, 2016, 2015 and 2014 (Expressed in thousands of Argentine pesos, except share data and as otherwise indicated) addition, they shall continue to disclose in their published financial statements that they are progressing in the IFRS Convergence Plan. There will be an issuance of a CONAU Circular to communicate the new Minimum Accounts Plan and Form of Financial Statements (New Informational and Accounting Regime for Quarterly / Annual Publication). BANCO HIPOTECARIO SA AND SUBSIDIARIES
NOTES TO THE CONSOLIDATED FINANCIAL STATEMENTS
As of and for the twelve-month periods ended June 30, 2015, 2014 and 2013
(Expressed in thousands of Argentine pesos, except share data and as otherwise indicated)
·● Year 2017
As of January 1, 2017, institutions shall prepare the opening financial statements that will serve as basis for preparing their comparative financial statements. In each quarterly statement, they shall include a reconciliation of the main asset, liability and shareholders’ equity captions and results with the amounts that would result from applying the rules issued by the BCRA under the scope of the IFRS convergence process. Such reconciliations shall be supported by a special report by the independent auditor. The quantitative information and the degree of progress of the IFRS Convergence Plan will be disclosed in a note to the published financial statements.
·● Year 2018
As from the financial statements starting on January 1, 2018, financial institutions shall be required to record their transactions and equity changes in accordance with the rules issued by the BCRA under the IFRS convergence process. Therefore, as from the closing of the first quarter, they shall prepare and submit their published financial statements according to the above mentioned rules; the independent auditor shall issue an opinion thereon and such financial statements will be the ones used by the institutions for all legal and corporate purposes.
On March 31, 2015 the Bank’s Board of Directors has approved (i) the Implementation Plan for Convergence towards the International Financial Reporting Standards dictated by the Communication “A” 5541 for Financial Entities subject to supervision of the BCRA; and (ii) the designation of the coordinators which will have the obligation to inform the Board of Directors the status and degree of progress of the project.
The plan contains the creation of a work team; coordination with the management of the related companies in which permanent investments are held, controlled companies or companies in which significant influence is exercised; design and communication of a training plan; identifying impacts on operations and the information to be submitted that requires the implementation of specific actions (adapting information systems, internal control, etc.).
Half-yearly reports must be made to the BCRA, showing the progress made in the Implementation Plan. The first due date of this presentation operatedoperates on September 30, 2015. Each half-yearly report shall include a report issued by the Internal Audit Department.
As of June 30, 2016, there have been two presentations relating to the progress of the plan on September 30, 2015 and March 31, 2016. Both presentations were approved by the Board of the entity and were accompanied by an audit report approved by the internal Audit Committee. On March 31, 2016, was sent to BCRA the reconciliation of assets and liabilities captions applying IFRS as of December 31, 2015, following the guidelines established by Communication " A" 5844, together with the special report the External Auditor. Subsequently, reconciliations of the balances as of June 30 and December 31 must be sent, operating its due date on September 30 and March 31 respectively, until the B.C.R.A. arrange for its discontinuity. The information must be accompanied by a special report of the External Auditor. 30. Commencement of summary proceedings I –Summary Proceedings before administrative authorities:
I – Pending Summary Proceedings:
1. | On September 13, 2013, the Bank was notified of Resolution No. 611 handed down by the Superintendent of Financial and Foreign Exchange Institutions, whereby it ordered to commence summary proceedings against the Bank and the manager Christian Giummarra and the former manager Aixa Manelli (Summary Proceedings No. 5469 on Foreign Exchange Matters) charging them with alleged violation of the foreign exchange laws in selling foreign currency to persons prohibited from trading foreign currency by the Argentine Central Bank. The cumulative amount derived from the alleged violation in the sale of foreign currency is around US$ 39.9 thousand and Euro 1.1 thousand. The relevant defenses and arguments have been filed and evidence has been offered in support of all the defendants subject to the summary proceedings. Due to its related subject matter, the record of this case was joined with Summary Proceedings No. 5529 on Foreign Exchange Matters (File 101,327/10). Therefore, its procedural status is described together with the latter. |
2. | On October 8, 2013, the Bank was notified of Resolution No. 720 handed down by the Superintendent of Financial and Foreign Exchange Institutions, ordering to commence summary proceedings against the Bank and its Organization and Procedures Manager, Mr. Christian Giummarra, and the former Systems Manager, Ms. Aixa Manelli (Summary |
BANCO HIPOTECARIO SA AND SUBSIDIARIES NOTES TO THE CONSOLIDATED FINANCIAL STATEMENTS As of and for the twelve-month periods ended June 30, 2016, 2015 2014 and 20132014 (Expressed in thousands of Argentine pesos, except share data and as otherwise indicated)
| Proceedings No. 5529 on Foreign Exchange Matters) in accordance with Section 8 of the Criminal Foreign Exchange Regime Law (Ley de Régimen Penal Cambiario) –as amended by Decree 480/95- charging them with alleged violation of the foreign exchange laws in selling foreign currency to persons prohibited from trading foreign currency by the Argentine Central Bank. The cumulative amount derived from the alleged violation in the sale of foreign currency is around US$ 86.4 thousand. The relevant defenses and arguments were filed and evidence was offered in support of all the defendants subject to the summary proceedings. The BCRA opened the discovery stage, and evidence was produced in due time. Once the discovery stage came to a conclusion, the attorneys submitted their closing arguments. The Argentine Central Bank now is expected to send the case file to the competent courts.
|
In
1. On February 19, 2014, the legal counsel’s opinion, atBank was notified of Resolution No. 209/13 handed down by the current statusChairman of the Financial Information Unit (UIF), whereby it ordered to commence summary proceedings there are legal and factual arguments that generate reasonable expectations that the physical persons named defendants and Banco Hipotecario S.A. will be acquitted and that therefore, there are low chances thatagainst the Bank, will beits directors (Messrs. Eduardo S. Elsztain; Mario Blejer; Ernesto M. Viñes; Jacobo J. Dreizzen; Edgardo L. Fornero; Carlos B. Písula; Gabriel G. Reznik; Pablo D. Vergara del Carril; Mauricio E. Wior; Saul Zang); the Risk and Controlling Manager, Mr. Gustavo D. Efkhanian and the Manager of the Money Laundering Prevention and Control Unit Manager, Mr. Jorge Gimeno. In these proceedings, an investigation is made into the defendants’ liability for alleged violation of the provisions of Section 21 of Law 25,246, as amended, and Resolution UIF No. 228/2007 due to certain defaults detected by the BCRA in the inspection of the organization and in internal controls implemented for the prevention of money-laundering derived from illegal activities. On March 25, 2014, the relevant defenses and arguments were filed in support of the Bank and the individuals subject to the economic sanctions set forth by the Criminal Foreign Exchange Regime Law (Ley de Régimen Penal Cambiario). For such reason, no allowances have been created in this regard.summary proceedings.
3. | On February 19, 2014, the Bank was notified of Resolution No. 209/13 handed down by the Chairman of the Financial Information Unit (UIF), whereby it ordered to commence summary proceedings against the Bank, its directors (Messrs. Eduardo S. Elsztain; Mario Blejer; Ernesto M. Viñes; Jacobo J. Dreizzen; Edgardo L. Fornero; Carlos B. Písula; Gabriel G. Reznik; Pablo D. Vergara del Carril; Mauricio E. Wior; Saul Zang); the Risk and Controlling Manager, Mr. Gustavo D. Efkhanian and the Manager of the Money Laundering Prevention and Control Unit Manager, Mr. Jorge Gimeno. In these proceedings, an investigation is made into the defendants’ liability for alleged violation of the provisions of Section 21 of Law 25,246, as amended, and Resolution UIF No. 228/2007 due to certain defaults detected by the BCRA in the inspection of the organization and in internal controls implemented for the prevention of money-laundering derived from illegal activities. On March 25, 2014, the relevant defenses and arguments were filed in support of the Bank and the individuals subject to the summary proceedings. |
In the legal counsel’s opinion, at the current stage of the proceedings and based on the precedents existing at the UIF in connection with similar cases, it is estimated that there are chances of imposing an administrative penalty. For such reason, the bank hasThe estimated allowancesand provisioned as of December 31, 2015 amounts to Ps. 20.
4. | On August 26,2. On December 29, 2014, the Bank was notified of the Resolution passed by the Superintendent of Financial and Foreign Exchange Institutions No. 416 dated August 7, 2014 ordering the start of Summary Proceedings No. 5843 in the terms of Section 8 of the Foreign Exchange Criminal Regime Law No. 19,359 (as signed into law pursuant to Decree No. 480/95). In the above-mentioned summary proceedings, Banco Hipotecario, its directors (Messrs. Eduardo S. Elsztain; Jacobo J. Dreizzen; Edgardo L. Fornero; Carlos B. Písula; Gabriel G. Reznik; Pablo D. Vergara del Carril; Ernesto M. Viñes; Saul Zang; and Mauricio E. Wior) and former directors (Ms. Clarisa D. Lifsic de Estol and Mr. Federico L. Bensadón), and two former managers (Messrs. Gabriel G. Saidón and Enrique L. Benitez), are charged with failure to comply with the rules disclosed by Communication “A” 3471 (paragraphs 2 and 3) and by Communication “A” 4805 (Paragraph 2.2.) due to certain transfers of currency made abroad between August and October 2008 to guarantee the “CER Swap Linked to PG08 and External Debt” swap transaction for a total of US$ 45,968 thousand, without the authorization of the Argentine Central Bank. BHSA has been allowed to review the proceedings (case file No. 100.308/10) which are being handled by the Argentine Central Bank’s Department of Foreign Exchange Contentious Matters. The relevant defenses and |
BANCO HIPOTECARIO SA AND SUBSIDIARIES
NOTES TO THE CONSOLIDATED FINANCIAL STATEMENTS
As of and for the twelve-month periods ended June 30, 2015, 2014 and 2013
(Expressed in thousands of Argentine pesos, except share data and as otherwise indicated)
| arguments were filed in support of the subjects to the summary proceedings. The BCRA opened the discovery stage on March 16, 2015. |
In the legal counsel’s opinion, at the current stage of the proceedings there are legalResolution passed by the Superintendent of Financial and factual arguments that generate reasonable expectations thatForeign Exchange Institutions No. 824 dated December 1, 2014 ordering the physical persons named defendants andstart of Summary Proceedings No. 6086 on Foreign Exchange Matters (File 101.534/11) against Banco Hipotecario S.A. will be acquitted and that therefore, there are low chances thata former Manager (Mr. Gabriel Cambiasso) and five assistants (Claudio H. Martin; Daniel J. Sagray; Rubén E. Perón; Marcelo D. Buzetti and Pablo E. Pizarro) at the Cordoba Branch, in the terms of Section 8 of the Foreign Exchange Criminal Regime Law (as signed into law pursuant to Decree No. 480/95). In the above-mentioned summary proceedings, an investigation is made in connection with excesses in the limits for selling foreign currency to two entities in the City of Cordoba (for a combined amount of US$ 701,270), which allegedly violate the provisions of Communication “A” 5085, paragraph 4.2.1.
On July 3, 2015 the writ containing the defenses and arguments was filed with the Central Bank will be subject toand the economic sanctions set forthrelevant evidence was offered. On April 12, 2016 the Argentine Central Bank ordered the production of evidence by the Criminal Foreign Exchange Regime Law (Ley de Régimen Penal Cambiario). For such reason, no allowances have been created in this regard.parties, and all evidence previously offered was produced.
5. | On December 29, 2014, the Bank was notified of the Resolution passed by the Superintendent of Financial and Foreign Exchange Institutions No. 824 dated December 1, 2014 ordering the start of Summary Proceedings No. 6086 on Foreign Exchange Matters (File 101.534/11) against Banco Hipotecario S.A. and a former Manager (Mr. Gabriel Cambiasso) and five assistants (Claudio H. Martin; Daniel J. Sagray; Rubén E. Perón; Marcelo D. Buzetti and Pablo E. Pizarro) at the Cordoba Branch, in the terms of Section 8 of the Foreign Exchange Criminal Regime Law (as signed into law pursuant to Decree No. 480/95). In the above-mentioned summary proceedings, an investigation is made in connection with excesses in the limits for selling foreign currency to two entities in the City of Cordoba (for a combined amount of US$ 701,270), which allegedly violate the provisions of Communication “A” 5085, paragraph 4.2.1. |
In the legal counsel’s opinion, at the current stage of the proceedings there are legal and factual arguments that generate reasonable expectations that the physical persons named defendants will be acquitted. For such reason, no allowances have been created in this regard.
6. | Banco de Crédito y Securitización S.A. has been notified of Resolution No. 738 dated October 22, 2013 (Summary Proceedings No. 1406/201 on Financial Matters, File 100,553/12) handed down by the BCRA’s Superintendent of Financial and Exchange Institutions, ordering to start summary proceedings against this Bank, its Chairman, Mr. Eduardo S. Elsztain, and the Vice-Chairman, Mr. Ernesto M. Viñes, due to the late filing of documentation related to the appointment of the Bank’s authorities. On November 8, 2013, the defenses3. On August 11, 2015, we were notified of Resolution No. 76/15 adopted by the chairman of the Unidad de Información Financiera, which initiated a summary proceeding (sumario) against us, our Board of Directors (Eduardo Sergio Elsztain, Mario Blejer, Diego Luis Bossio, Mariana González, Edgardo Luis José Fornero, Ada Mercedes Maza, Mauricio Elías Wior, Saúl Zang, Ernesto Manuel Viñes, Gabriel Adolfo Gregorio Reznik, Jacobo Julio Dreizzen, Pablo Daniel Vergara del Carril and Carlos Bernardo Pisula) and our compliance officer for an alleged violation to section 21 a) of Law No.25,246 and to Resolution No.121/11. The UIF initiated the proceeding after an audit by the Central Bank in 2013 detected certain weaknesses in our internal anti-money laundering controls. As of the date of this offering memorandum, we have not established any provisions in support of the Bank’s rights were filed, and the proceedings are pending an administrative decision by the BCRA. |
In connection with these proceedings, the Company has deemedthis proceeding. According to that there are low chances thatresolution, the Bank be imposed anyand its directors would have incurred - "prima facie" - in certain defaults related to the way customers are identified, monitoring parameters , the definition of the monetary sanctions contemplated byrisk matrix and the Financial Institutions Lawupdating procedures of background and applicable regulations issued by the BCRA. For such reason, no allowances have been recorded in the financial statements in this regard.profiles of customer, among others.
7. | On November 25, 2014, Tarshop S.A. was notified by the Financial Information Unit that summary proceedings had been filed, identified under Resolution No. 234/14, for potential formal violations derived from the alleged non-compliance with Section 21, paragraph a) of Law 25,246 and UIF Resolutions No. 27/11 and 2/12. Summonses were sent to the Company (Tarshop S.A.), its Compliance Officer (Mauricio Elías Wior) and the Directors then in office (Messrs. Eduardo Sergio Elsztain, Saúl Zang, Marcelo Gustavo Cufré and Fernando Sergio Rubín) for them to file their defenses. In the legal counsel’s opinion, at the current stage of the proceedings and based on the precedents existing at the UIF in similar cases, it is likely that a penalty be imposed under the scope of the administrative proceedings. For such reason, allowances have been recorded in this regard. In the framework of the summary proceedings described above, the evidence offered by the defendants in the summary proceedings was produced and the next stage is the submission of closing arguments. |
BANCO HIPOTECARIO SA AND SUBSIDIARIES NOTES TO THE CONSOLIDATED FINANCIAL STATEMENTS As of and for the twelve-month periods ended June 30, 2016, 2015 2014 and 20132014 (Expressed in thousands of Argentine pesos, except share data and as otherwise indicated)
II –Summary Proceedings pending Court Decision
On September 23, 2015, the Bank raised depositions and defenses with the UIF along with documentary evidence and produced informative evidence, IT expert opinions and oral evidence. On April 13, 2016, the production of evidence was ordered and all evidence was duly produced.
1. | On May 4, 2012 the Bank was notified of Resolution No. 186, dated April 25, 2012 issued by the Superintendent of Financial and Foreign Exchange Institutions whereby Summary Proceedings No. 4976 on Foreign Exchange Matters were commenced against the Bank, its directors (Messrs. Eduardo S. Elsztain; Gabriel G. Reznik; Pablo D. Vergara del Carril; Ernesto M. Viñes; Saul Zang; Carlos B. Písula; Edgardo L. Fornero; Jacobo J. Dreizzen); former directors (Ms. Clarisa D. Lifsic de Estol; Messrs. Julio A. Macchi; Federico L. Bensadón; and Jorge M. Grouman) and the former Finance Manager Gabriel G. Saidón, under section 8 of the Foreign Exchange Criminal Regime Law (as signed into law by Decree No. 480/95). |
In such proceedings, charges were pressed for alleged violations ofBased on the provisions of Communications “A” 3640, 3645, 4347 and supplementary rules, due to the acquisition of good delivery silver bars during the 2003-2006 period with funds arising from its General Exchange Position.
The defenses to whichUIF’s backround on similar cases, the Bank is entitled were raised in due time. Within the period grantedlikely to such end,be imposed an administrative fine. Therefore, it was deemed reasonable to create an allowance for this contingency amounting to Ps. 20, which was booked on October 22, 2015.
4. On February 15, 2016 the Bank was notified of Resolution No. 1014 issued by the Superintendent of Financial and Exchange Institutions by which it was decided to conduct summary (Summary No. 1486) under the other defendants producedterms of Article 41 of the Financial Institutions Law to Banco Hipotecario SA and its president Mr. Eduardo S. Elsztain for alleged violation of the rules of Communication "A" 4490 because of his failure to report -within the deadline set by the legislation applicable-, the appointment of new directors by the shareholders’ meetings held on 27 March and 24 April 2013, and having belatedly submitted documentation related to these directors. It is worth mentioning that in all cases tried to regular and alternate directors designated by the National State. On 29 February 2016 the defenses and rebuttals were presented and accompanied the documentary evidence, previously offered. As soon as that stagewhich examined by the Management Contentious Financial Affairs in the procedure came to a conclusion, the counsel for the defense presented their closing arguments and Central Bank. in August 2014, the Argentine Central Bank sent the case file to the competent court (therefore, at present the case is being heard by the Court with Jurisdiction over Criminal Economic Matters No. 7 presided by Judge Juan Galvan Greenway).
In the legal counsel’s opinion, at the current statuslight of the proceedings, there are legal and factual arguments that generate reasonable expectations that the physical persons named defendants and Banco Hipotecario S.A. will be acquitted and that therefore, there are low chanceslikelihood that the Bank willcould be subjectimposed an administrative fine, it was deemed reasonable to create an allowance for this contingency amounting Ps.560, which was booked as of the economic sanctions set forthclosing date of these financial statements
5. On May 10, 2016 the Bank was notified of Resolution No 219 dated April 22, 2016 handed down by the Superintendent of Financial and Foreign Exchange Institutions in order to commence summary proceedings (Summary Proceedings file No. 6845) in the terms of Section 8 of the Foreign Exchange Criminal Regime Law (Ley de Régimen Penal Cambiario). For such reason, no allowances have been created in this regard.
2. | On October 7, 2014, BHSA was notified of Resolution No. 513 dated August 16, 2014 handed down by the Superintendent of Financial and Foreign Exchange Institutions in the summary proceedings in financial matters No. 1365 (on grounds of alleged failure to comply with the minimum requirements in terms of internal controls under Communication “A” 2525) whereby Banco Hipotecario S.A. was imposed a fine for Ps. 112 and its directors (Messrs. Pablo D. Vergara del Carril; Carlos B. Písula, Eduardo S. Elsztain, Jacobo J. Dreizzen, Gabriel G. Reznik; Edgardo L. Fornero; Ernesto M. Viñes; and Saul Zang) and former directors (Ms. Clarisa D. Lifsic de Estol and Messrs. Jorge L. March; and Federico L. Bensadón) were fined for different amounts. |
As required by Section 42No. 19,359 (as signed into law pursuant to Decree No. 480/95) against Banco Hipotecario S.A. its former Manager Mr. Ricardo José González and Mrs. Luciana Sabrina Fusco and Liliana Elisabeth Sabella, on grounds of alleged breach of the Lawrules contained in Communication “A” 5318 and “5322”, as supplemented, consisting in allegedly selling foreign currency for US$ 69,620 under residential mortgage transaction, without fulfilling the requirements set forth in the above mentioned communications.
Notice was taken of the proceedings and a request was filed for extending the deadline for filing the relevant defenses and arguments. 6. Banco de Crédito y Securitización S.A. has been notified of Resolution No. 401 dated September 7, 2012 handed down by the BCRA’s Superintendent of Financial and Exchange Institutions, ordering to start summary proceedings against this Bank and its Chairman, Mr. Eduardo S. Elsztain, due to the fineslate filing of documentation related to the appointment of the Bank’s authorities. On October 9, 2012, the defenses and arguments of the Bank’s rights were paid and the relevant appeal was lodged with the National Appellate Court with Federal Jurisdiction over Contentious and Administrative Matters against the above-mentioned resolution. The fine for Ps. 112 paid byfiled. Subsequently, the Bank was booked in an allowance.notified of Resolution No. 729 dated October 23,
3. | On October 31, 2014, BHSA was notified of Resolution No. 685 dated October 29, 2014 handed down by the Superintendent of Financial and Foreign Exchange Institutions in the summary proceedings in financial matters No. 1320 whereby the Bank and its authorities had been charged, on one hand, with the violation of the rules governing financial aid to the Non-Financial Public Sector, with excess over the limits of fractioned exposure to credit risk from the non-financial public sector, with excess in the allocation of assets to guarantee, with failure to satisfy minimum capital requirements and with objections against the accounting |
BANCO HIPOTECARIO SA AND SUBSIDIARIES NOTES TO THE CONSOLIDATED FINANCIAL STATEMENTS As of and for the twelve-month periods ended June 30, 2016, 2015 2014 and 20132014 (Expressed in thousands of Argentine pesos, except share data and as otherwise indicated)
| treatment afforded to the “Cer Swap Linked to PG08 and External Debt” transaction and on the other hand, with delays in communicating the appointment of new directors and tardiness in the provision of documentation associated to the directors recently elected by the shareholders’ meetings. |
2013 which imposed on the Bank and its president Punishment of Call of Care by Article 41 paragraph 1 of the Law of Financial Institutions.
Through such resolution determined fines of Ps. 320 and Ps. 393 to the bank and its directors (Eduardo S. Elsztain and Ernesto M. Viñes ), respectively. Such amounts were charged as a loss as of December 31, 2015. BACS and the Directors filed an appeal against Resolution No. 690 in due course. The appeals are pending resolution by Panel IV of the National Court of Appeals in Federal Administrative Contentious Matters in the action styled “BACS BANCO DE CRÉDITO Y SECURITIZACIÓN S.A. ET AL V. BANCO CENTRAL DE LA REPÚBLICA ARGENTINA, in re. Financial Institutions Law No. 21,526, Section 42, Direct Appeal” (Case File No. 51,471/2015). 7. On November 25, 2014, Tarshop S.A. was notified by the Financial Information Unit that summary proceedings had been filed, identified under Resolution No. 234/14, for potential formal violations derived from the alleged non-compliance with Section 21, paragraph a) of Law 25,246 and UIF Resolutions No. 27/11 and 2/12. Summonses were sent to the Company (Tarshop S.A.), its Compliance Officer (Mauricio Elías Wior) and the Directors then in office (Messrs. Eduardo Sergio Elsztain, Saúl Zang, Marcelo Gustavo Cufré and Fernando Sergio Rubín) for them to file their defenses. In the legal counsel’s opinion, at the current stage of the proceedings and based on the precedents existing at the UIF in similar cases, it is likely that a penalty be imposed under the scope of the administrative proceedings. For such reason, allowances for Ps. 360 have been recorded in this regard. II –Summary Proceedings pending Court Decision 1. On October 31, 2014, BHSA was notified of Resolution No. 685 dated October 29, 2014 handed down by the Superintendent of Financial and Foreign Exchange Institutions in the summary proceedings in financial matters No. 1320 whereby the Bank and its authorities had been charged, on one hand, with the violation of the rules governing financial aid to the Non-Financial Public Sector, with excess over the limits of fractioned exposure to credit risk from the non-financial public sector, with excess in the allocation of assets to guarantee, with failure to satisfy minimum capital requirements and with objections against the accounting treatment afforded to the “Cer Swap Linked to PG08 and External Debt” transaction and on the other hand, with delays in communicating the appointment of new directors and tardiness in the provision of documentation associated to the directors recently elected by the shareholders’ meetings. Resolution No. 685 then fined Banco Hipotecario S.A. with Ps. 4,040Ps,4,040 and also fined BHSA’s directors (Eduardo S. Elsztain; Jacobo J. Dreizzen; Carlos B. Písula; Edgardo L. Fornero; Gabriel G. Reznik; Pablo D. Vergara del Carril; Ernesto M. Viñes; Saul Zang; Mauricio E. Wior), former directors (Clarisa D. Lifsic de Estol; Federico L. Bensadón; Jorge L. March and Jaime A. Grinberg), statutory auditors (Messrs. Ricardo Flammini; José D. Abelovich; Marcelo H. Fuxman; Alfredo H. Groppo; and Martín E. Scotto), the Area Manager Gustavo D. Efkhanian and former managers (Gabriel G. Saidón and Enrique L. Benitez) for an aggregate amount of Ps.51,581.8. Under this decision, former Statutory Auditor Ms. Silvana M. Gentile was acquitted.
On November 25, 2014, Banco Hipotecario and the other individuals affected by the adverse decision lodged an appeal under Section 42 of the Financial Institutions Law, that was sent by the BCRA to the National Appellate Court with Federal Jurisdiction over Contentious and Administrative Matters. Therefore, at present the case is being heard by Panel I of such Appellate Court. Moreover, on December 30, 2014, the Bank and the individuals against whom sanctions were imposed requested the levying of separate injunctions by such court against the enforcements pursued by the BCRA for collection of the fines.
BANCO HIPOTECARIO SA AND SUBSIDIARIES NOTES TO THE CONSOLIDATED FINANCIAL STATEMENTS As of and for the twelve-month periods ended June 30, 2016, 2015 and 2014 (Expressed in thousands of Argentine pesos, except share data and as otherwise indicated) Upon being notified of the resolution handed down on June 30 by the Appellate Court that denied the motion for injunction filed by the Bank and by the directors, managers and some of the statutory auditors and in order to prevent further conflicts and financial damage that could result from the actions to compel payment of fines, the Bank’s Executive Committee decided to apply the indemnity rules regarding directors, high ranking officers and statutory auditors, as an alternative for the amounts not covered by the D&O insurance policy approved by the Bank’s Board of Directors at its meetings held on August 2, 2002 and May 8, 2013, and resolved to deposit the amounts of the fines.
Such deposit, including the amount corresponding to the fine imposed on the Bank and the respective legal costs, totaled Ps. 57,671.9. Out this amount, Ps. 53,631.9 thousand were computed as losses for this period in the manner described in the Minutes of the Meeting held by Banco Hipotecario S.A.’s Executive Committee on July 2, 2015 and in the Minutes of the Board Meeting held on July 15, 2015, and Ps. 4,040 were covered by a provision made in the previous fiscal year.year 2014.
This notwithstanding, in the brief filed with the court that is hearing the proceedings to compel payment it was sustained that the amounts deposited in the judicial accounts opened to such end were subject to attachment, and a petition was filed for the respective amounts to be invested in automatically renewable term deposits for 180 days in order to ensure the integrity of the funds until the Appellate Court with Federal Jurisdiction over Contentious and Administrative Matters hands down a decision on the appeal lodged against Resolution No. 685/14 of the Argentine Central Bank.
III – Summary ProceedingsThe request for injunction were rejected and the Court made progress in whichthe proceedings for enforcing the fines against each of the defendants. For such reason, a Court Decision has been Renderedrequest was made for applying the amounts subject to attachments to the payment of the relevant fines.
Under2. On September 13, 2013, the Bank was notified of Resolution No. 286 dated July 2, 2010, issued611 handed down by the Superintendent of Financial and Foreign Exchange Institutions, whereby it ordered to commence summary proceedings were commencedagainst the Bank and the manager Christian Giummarra and the former manager Aixa Manelli (Summary Proceedings No. 5469 on Foreign Exchange Matters) charging them with alleged violation of the foreign exchange laws in selling foreign currency to persons prohibited from trading foreign currency by the Argentine Central Bank. The cumulative amount derived from the alleged violation in the sale of foreign currency is around US$ 39.9 thousand and Euro 1.1 thousand. The relevant defenses and arguments have been filed and evidence has been offered in support of all the defendants subject to the summary proceedings. Due to its related subject matter, the record of this case was joined with Summary Proceedings No. 5529 on Foreign Exchange Matters (File 101,327/10). Therefore, its procedural status is described together with the latter. Moreover, on October 8, 2013, the Bank was notified of Resolution No. 720 handed down by the Superintendent of Financial and Foreign Exchange Institutions, ordering to commence summary proceedings against the Bank and its directorsOrganization and Procedures Manager, Mr. Christian Giummarra, and the former Systems Manager, Ms. Aixa Manelli (Summary Proceedings No. 43645529 on Foreign Exchange Matters) under sectionin accordance with Section 8 of the Criminal Foreign Exchange Criminal Regime Law (as signed into law(Ley de Régimen Penal Cambiario) –as amended by Decree No. 480/95).95- charging them with alleged violation of the foreign exchange laws in selling foreign currency to persons prohibited from trading foreign currency by the Argentine Central Bank. The cumulative amount derived from the alleged violation in the sale of foreign currency is around US$ 86.4 thousand. The relevant defenses and arguments were filed and evidence was offered in support of all the defendants subject to the summary proceedings. The BCRA opened the discovery stage, and evidence was produced in due
BANCO HIPOTECARIO SA AND SUBSIDIARIES NOTES TO THE CONSOLIDATED FINANCIAL STATEMENTS As of and for the twelve-month periods ended June 30, 2016, 2015 2014 and 20132014 (Expressed in thousands of Argentine pesos, except share data and as otherwise indicated)
Undertime. Once the discovery stage came to a conclusion, the attorneys submitted their closing arguments. In mid- September 2015 the summary in which both actions were accumulated) was sent by the Central Bank to Economic Criminal Justice for sentencing. Involving the Court with jurisdiction over Criminal Economic Matters No.2 (Dr. Pablo Yadarola) - Secretary No. 3 (Dr. Fernando Stockfisz) .
In the legal counsel’s opinion, at the current status of the proceedings, there are legal and factual arguments that generate reasonable expectations that the physical persons named defendants and Banco Hipotecario S.A. will be acquitted and that therefore, there are low chances that the Bank will be subject to the economic sanctions set forth by the Criminal Foreign Exchange Regime Law (Ley de Régimen Penal Cambiario). For such reason, no allowances have been created in this regard. 3. On August 26, 2014, the Bank was notified of the Resolution passed by the Superintendent of Financial and Foreign Exchange Institutions No. 416 dated August 7, 2014 ordering the start of Summary Proceedings No. 5843 in the terms of Section 8 of the Foreign Exchange Criminal Regime Law No. 19,359 (as signed into law pursuant to Decree No. 480/95). In the above-mentioned summary proceedings, Banco Hipotecario, its directors (Messrs. Eduardo S. Elsztain; Jacobo J. Dreizzen; Edgardo L. Fornero; Carlos B. Písula; Gabriel G. Reznik; Pablo D. Vergara del Carril; Ernesto M. Viñes; Saul Zang; and Mauricio E. Wior) and former directors (Ms. Clarisa D. Lifsic de Estol and Mr. Federico L. Bensadón), and two former managers (Messrs. Gabriel G. Saidón and Enrique L. Benitez), are charged with failure to comply with the rules disclosed by Communication “A” 3471 (paragraphs 2 and 3) and by Communication “A” 4805 (Paragraph 2.2.) due to certain transfers of currency made abroad between August and October 2008 to guarantee the “CER Swap Linked to PG08 and External Debt” swap transaction for a total of US$ 45,968 thousand, without the authorization of the Argentine Central Bank. BHSA has been allowed to review the proceedings (case file No. 100.308/10) which are being handled by the Argentine Central Bank’s Department of Foreign Exchange Contentious Matters. The relevant defenses and arguments were filed in support of the subjects to the summary proceedings. The BCRA opened the discovery stage on March 16, 2015. Evidence was produced and the counsels for the defense’s allegations were raised in due time. Upon conclusion of the administrative stage of the proceedings, the case file was sent to the Courts with Jurisdiction over Criminal Economic Matters. On November 18, 2015, the Court with Jurisdiction over Criminal Economic Matters No. 3, presided by Dr. Rafael E. Caputo, Clerk’s Office No. 5, determined that it lacked jurisdiction to hear the case; therefore, the proceedings were forwarded to the Court with Jurisdiction over Criminal Economic Matters No. 2, which has still not determined whether it has competent jurisdiction In the legal counsel’s opinion, at the current stage of the proceedings there are legal and factual arguments that generate reasonable expectations that the physical persons named defendants and Banco Hipotecario S.A. will be acquitted and that therefore, there are low chances that the Bank will be subject to the economic sanctions set forth by the Criminal Foreign Exchange Regime Law (Ley de Régimen Penal Cambiario). For such reason, no allowances have been created in this regard. III –Concluded Summary Proceedings 1. On May 4, 2012 the Bank was notified of Resolution No. 186, dated April 25, 2012 issued by the Superintendent of Financial and Foreign Exchange Institutions whereby Summary Proceedings No. 4976 on Foreign Exchange Matters were commenced against the Bank, its directors (Messrs. Eduardo S. Elsztain; Gabriel G. Reznik; Pablo D. Vergara del Carril; Ernesto M. Viñes; Saul Zang; Carlos B. Písula; Edgardo L. Fornero; Jacobo J. Dreizzen); former directors (Ms. Clarisa D. Lifsic de Estol; Messrs. Julio A. Macchi; Federico L. BANCO HIPOTECARIO SA AND SUBSIDIARIES NOTES TO THE CONSOLIDATED FINANCIAL STATEMENTS As of and for the twelve-month periods ended June 30, 2016, 2015 and 2014 (Expressed in thousands of Argentine pesos, except share data and as otherwise indicated) 2. Bensadón; and Jorge M. Grouman) and the former Finance Manager Gabriel G. Saidón, under section 8 of the Foreign Exchange Criminal Regime Law (as signed into law by Decree No. 480/95). In such proceedings, charges were pressed for violationalleged violations of certainthe provisions underof Communications “A” 40873640, 3645, 4347 and 4177 concerning early repaymentssupplementary rules, due to the acquisition of restructured external debt for US$ 91,420,135 and Euros 2,803,965 ingood delivery silver bars during the 2003-2006 period February 2004 through June 2005. with funds arising from its General Exchange Position. The relevant defenses and arguments in support ofto which the Bank’s positionBank is entitled were filedraised in due course.time. Within the period granted for the production of evidence,to such end, the Bank and the other defendants produced the evidence previously offered. As soon as that stage in the procedure came to a conclusion, the counsel for the defense presented their closing arguments and in August 2014, the Argentine Central Bank sent the case file to the competent court (Court(therefore, at present the case is being heard by the Court with Jurisdiction over Criminal Economic Matters No. 57 presided by Judge Juan Galvan Greenway), Clerk’s office No. 13, presided by Ms. Mariana Zavala Duffau. . III – BANCO HIPOTECARIO S.A., Clarisa Diana LIFSIC, Eduardo Sergio Elsztain, Gabriel Adolfo Gregorio REZNIK, Pablo Daniel VERGARA DEL CARRIL, Ernesto Manuel VIÑES, Saúl ZANG, Edgardo Luis José FORNERO, Federico León BENSADON, Jacobo Julio DREIZZEN, Jorge Brugo)Miguel GROUMAN, Gabriel Gustavo SAIDON, Julio Augusto MACCHI and Carlos Bernardo PISULA WERE FULLY RELEASED OF LIABILITY for the other charges pressed against them in this action in connection with violation of the Criminal Foreign Exchange Regime Law under these summary proceedings filed by the Argentine Central Bank regarding the transactions recorded under slips Nos. 40729 and 41288 (according to the charges pressed in each case) as the alleged conducts did not match with any of the offenses set forth by law. IV – NO COURT COSTS WERE AWARDED (pursuant to Sections 143 and 144 Code of Criminal Procedure).
Through his judgment dated December 12, 2014,On April 29, 2016, final judgement was passed, whereby: I- The criminal charges files against Banco Hipotecario S.A., Clarisa Diana Lifsic, Eduardo Sergio Elsztain, Gabriel Adolfo Gregorio Reznik, Pablo Daniel Vergara Del Carril, Ernesto Manuel Viñes, Saul Zang, Julio Augusto Macchi, Carlos Bernardo Pisula, Edgardo Luis José Fornero, Federico León Bensadón and Gabriel Gustavo Saidón in connection with the transactions recorded under slips No. 21683, 21749, 22065, 22136, WERE DECLARED PARTIALLY STATUTE BARRED and the above mentioned Judge decided thatpersons WERE PARTIALLY ACQUITTED as concerns the above mentioned deeds (Section 19 of Law 19,359 and Section 434 and 443, subsection 3 and 454 of the Code of Criminal Procedure). II The criminal charges filed against Jacobo Julio Dreizzen and Jorge Miguel Grouman, in connection with the transactions recorded under slips No. 31034, 31042, 37270, 37973, 38476, 38511, 38651, 38693, 40005, 40066, 40190, 40304, 40687 and 40688 WERE DECLARED PARTIALLY STATUTE-BARRED and the above mentioned persons WERE PARTIALLY ACQUITTED as concerns the above mentioned deeds (Section 19 of Law 19,359 and Section 434 and 443, subsection 3, and 454 of the Code of Criminal Procedure). III –Banco Hipotecario S.A., Clarisa Diana Lifsic, Eduardo Sergio Elsztain, Gabriel Adolfo Gregorio Reznik, Pablo Daniel Vergara del Carril, Ernesto Manuel Viñes, Saúl Zang, Edgardo Luis José Fornero, Federico León Bensadón, Jacobo Julio Dreizzen, Jorge Miguel Grouman, Gabriel Gustavo Saidón, Julio Augusto Macchi and Carlos Bernardo Pisula WERE FULLY RELEASED OF LIABILITY for the other charges pressed against them in this action in connection with violation of the Criminal Foreign Exchange Regime Law under these summary proceedings filed by the Argentine Central Bank regarding the transactions recorded under slips Nos. 40729 and 41288 (according to the charges pressed in each case) as the alleged conducts did not match with any of the offenses set forth by law. IV – IV – NO COURT COSTS WERE AWARDED (pursuant to Sections 143 and 144 Code of Criminal Procedure).
As no appeal was lodged against it, the judgment became firm and conclusive.
BANCO HIPOTECARIO SA AND SUBSIDIARIES NOTES TO THE CONSOLIDATED FINANCIAL STATEMENTS As of and for the twelve-month periods ended June 30, 2016, 2015 and 2014 (Expressed in thousands of Argentine pesos, except share data and as otherwise indicated) On October 7, 2014, BHSA had been notified of Resolution No. 513 dated August 16, 2014 handed down by the Superintendent of Financial and Foreign Exchange Institutions in the summary proceedings in financial matters No. 1365 (on grounds of alleged failure to comply with the minimum requirements in terms of internal controls under Communication “A” 2525) whereby Banco Hipotecario S.A. was exempt from liabilityimposed a fine for Ps. 112 and acquitted directors: Messrs.its directors (Messrs. Pablo D. Vergara del Carril; Carlos B. Písula, Eduardo S. Elsztain;Elsztain, Jacobo J. Dreizzen, Gabriel G. Reznik; Pablo Vergara del Carril;Edgardo L. Fornero; Ernesto M. Viñes; Carlos B. Písula; Edgardo L. Fornero; Saúl Zang; Jacobo J. Dreizzen;and Saul Zang) and former directors: Ms.directors (Ms. Clarisa D. Lifsic de Estol;Estol and Messrs. Miguel A. Kiguel; Julio A. Macchi;Jorge L. March; and Federico L. Bensadón; Guillermo H. Sorondo and Jorge Miguel Grouman;n). As required by Section 42 of the Law of Financial Institutions, the fines were paid and the Area Manager Gustavo D. Efkhanian; Manager Daniel H. Fittipaldi; former general sub-manager Gustavo D. Chiera; former managers Gabriel G. Saidón; Carlos Gonzalez Pagano and Marcelo C. Icikson; and Mr. Miguel J. Diaz, named defendants to those proceedings.
In response torelevant appeal was lodged with the appeal filed by the State Attorney against the judgment, Panel “A” of theNational Appellate Court with Federal Jurisdiction over Criminal EconomicContentious and Administrative Matters handed down a decision on July 17, 2015 confirmingagainst the appealed resolution toabove-mentioned resolution. The fine of 112 thousand pesos was timely provisioned and paid by the extent that it acquitsBank.
Under judgment dated June 21, 2016, the National Appellate Court with Federal Jurisdiction over Contentious and Administrative Matters – Panel IV, dismissedthe appeals lodged by Banco Hipotecario S.A., Clarisa Lifsic de Estol, Eduardo S. Elsztain; Gabriel G. Reznik; Pablo Vergara del Carril; Ernesto M. Viñes; Carlos B. Písula; Edgardo L. Fornero; Saúl Zang; Jacobo J. Dreizzen; Miguel A. Kiguel; Julio A. Macchi; Federico L. Bensadón; Guillermo H. Sorondo and Jorge Miguel Grouman; Gustavo D. Efkhanian; Daniel H. Fittipaldi; Gustavo D. Chiera; Gabriel G. Saidón; Carlos Gonzalez Pagano; Marcelo C. Icikson;the defendant directors, and Miguel J. Diaz without any award of costs.awarded court costs against the losing appellants. The judgement became final and conclusive.
31. Programa Crédito Argentino del Bicentenario para la Vivienda Única y Familiar (PROCREAR)
On June 12, 2012, the Argentine Executive Branch issued Decree No. 902 whereby it ordered the creation of a Public Fiduciary Fund referred to as Programa Crédito Argentino del Bicentenario para la Vivienda Única Familiar (Argentine Single Family Housing Program for the Bicentennial) (PROCREAR).
On that same date, the Bank’s Board of Directors approved the Bank’s role as trustee of the referred fund.
On July 18, 2012, the Argentine State, as Trustor, and Banco Hipotecario S.A. as Trustee, created the PROCREAR Administrative and Financial Trust, and its underlying assets were transferred to it as trust property.
The Trust’s sole and irrevocable purpose is as follows: (i) to manage the trust assets with the aim of facilitating the population’s access to housing and the generation of job opportunities as economic and social development policies, in compliance with the principles and objectives set forth in Decree No. 902; (ii) the use by the Trustee of the net proceeds of the placement of the Trust Bonds (Valores Representativos de Deuda or VRDs) and cash contributions by the Argentine State to originate loans for the construction of houses in accordance with the provisions of Decree No. 902 and the credit lines; and (iii) the repayment of the VRDs in accordance with the terms of the agreement that creates the Trust and the provisions of the Trust Law.
BANCO HIPOTECARIO SA AND SUBSIDIARIES
NOTES TO THE CONSOLIDATED FINANCIAL STATEMENTS
As of and for the twelve-month periods ended June 30, 2015, 2014 and 2013
(Expressed in thousands of Argentine pesos, except share data and as otherwise indicated)
The Trust shall be in effect for a term of thirty (30) years as from the date of execution of the agreement (July 18, 2012).
In addition to the obligations imposed on it under the Trust Law and the Commercial Code, the Trustee is required to: •● perform the obligations set forth in the Trust Agreement and follow the instructions imparted on it by the Executive Committee;
•● carry out its duties as Trustee with the loyalty, diligence and prudence of a good businessman acting on the basis of the trust placed on him;
•● exercise the powers granted to it under the Agreement, and preserve the Trust Assets;
•
BANCO HIPOTECARIO SA AND SUBSIDIARIES NOTES TO THE CONSOLIDATED FINANCIAL STATEMENTS As of and for the twelve-month periods ended June 30, 2016, 2015 and 2014 (Expressed in thousands of Argentine pesos, except share data and as otherwise indicated)
● use the Trust Assets for lawful purposes, in accordance with the provisions of the Agreement and following the Executive Committee’s instructions; •● identify the Trust Property and record it in a separate accounting system, segregated from its own assets or the assets of other trusts held by it at present or in the future in the course of its business;
•● prepare the Trust’s financial statements, hire the relevant audit firms and comply with the applicable disclosure regulations;
•● insure the Trust Assets against risks that could affect their integrity;
•● invest or reinvest the Trust’s funds in accordance with the provisions of the Agreement and following the instructions imparted by the Executive Committee.
In compliance with Communication “A” 5392, the Bank has capitalized mortgage loan origination expenses under this program (see note 2.13.).
32. Capital Market Law
On December 27, 2012, the Capital Market Law No. 26,831 was promulgated, considering a comprehensive amendment to the public offering regime set forth by Law No. 17,811.
Insofar as concerns the matters related to the Company’s business, this law broadens the regulatory powers of the Argentine Government in connection with the public offering of securities, through the Argentine Securities Commission (CNV), and concentrates in this agency the powers of authorization, supervision and oversight, disciplinary authority and regulation of all capital market players; further, it establishes that intermediary agents willing to deal in a securities market are no longer required to be members thereof, thus allowing the entry of other participants, and delegates to the CNV the power to authorize, register and regulate the various categories of agents.
On August 1, 2013, Decree 1023/2013, partially regulating the Capital Markets Law, was published in the Official Gazette, and on September 9, 2013, General Resolution No. 622 of the CNV, approving the related regulations, was published in the Official Gazette.
These regulations implement a register of agents that participate in the capital market. To take part in each of the activities regulated by this resolution, agents had to be entered in that register in such capacity by March 1, 2014.
For those agents who have applied for registration with the final registry before March 1, 2014 to comply with all the requirements, on February 7, 2014, the Argentine Securities Commission (CNV) extended the term until December 31, 2014. On June 23, 2014 we were notified by Mercado Abierto Electrónico S.A. that CNV mandated that the Agents registered with MAE S.A. who have proceedings underway before CNV for registration as Agent in any of the categories authorized by currently applicable rules and regulations may continue to do business normally up and until they start operating in the new Agent category as per the CNV rules (N.T.2013)
BANCO HIPOTECARIO SA AND SUBSIDIARIES
NOTES TO THE CONSOLIDATED FINANCIAL STATEMENTS
As of and for the twelve-month periods ended June 30, 2015, 2014 and 2013
(Expressed in thousands of Argentine pesos, except share data and as otherwise indicated)
In turn, pursuant to CNV Resolution No. 17,392 dated June 26, 2014, the Bank was registered with the Registry of Financial Trustees prescribed by Sections 6 and 7 of Chapter IV, Title V of the Rules, under No. 57. And, on September 19, 2014, pursuant to CNV Resolution No. 2122, the Bank has been registered as Settlement and Clearing Agent and Comprehensive Trading Agent No. 40.
Pursuant to the provisions of Section 45 of Law 26,831 and paragraph a), Section 20, Article VI, Chapter II, Title VII, and subsection j) of Section 7, Article IV, Chapter IV, Title V of Resolution No.622 of the CNV, it is made known that Banco Hipotecario’s minimum capital composed as required by the rules issued by the Argentine Central Bank exceeds the minimum amount required under such resolution. On the other hand, the Bank’s capital was duly paid in as of the closing of BANCO HIPOTECARIO SA AND SUBSIDIARIES NOTES TO THE CONSOLIDATED FINANCIAL STATEMENTS As of and for the twelve-month periods ended June 30, 2016, 2015 and 2014 (Expressed in thousands of Argentine pesos, except share data and as otherwise indicated) the period and the liquid balancing account is identified as BONAR 17 (Government security carried at fair market value).
On October 22, 2014, the Board of Directors of Mercado de Valores de Buenos Aires S.A. approved the registration of Banco Hipotecario S.A. in Mercado de Valores de Buenos Aires S.A.’s Registry of Agents as Settlement and Clearing Agent and Trading Agent – Comprehensive (ALyC and AN as per the Spanish acronyms).
On December 23, 2014, BHSA was authorized to operate under the provisions of Merval Communication No. 15594.
Pursuant to CNV’s Resolution No. 17.338 dated April 24, 2014, BACS Banco de Crédito y Securitización S.A., was registered with the Registry of Financial Trustees prescribed by Sections 6 and 7 of Chapter IV, Title V of the Rules, under No. 55. And, on September 19, 2014, CNV communicated to BACS that in its capacity as Settlement and Clearing Agent - Comprehensive and Trading Agent the Bank has been assigned License No. 25. It must be noted that the composition of BACS’ equity as of the end of the period was correct and that the liquidity requirement takes the form of Peso-denominated Lebacs.
As of the date of these financial statements, BH Valores SA has been approved by CNV as a Settlement and Clearing Agent in its own name under Registration Number 189 in the terms of CNV’s General Resolution No. 622.
According to the minimum requirements laid down, BH Valores S.A.’s minimum shareholders’ equity exceeds the amount prescribed by CNV’s General Resolution No. 622 and its composition is correct. As to the liquidity requirements, they have been satisfied in the form of a deposit of the Government security called Bono de la Nación Argentina $ Badlar Privada + 200 bps. Vto. 2017, as discussed in Exhibit II to the Company’s financial statements.
In view of the latest tax, regulatory and operational developments that have modified BH Valores S.A.’s commercial strategy and decreased the competitive advantages of running such a business, the Board of Directors of BH Valores S.A. has, as of the date of these financial statements, decided to substantially diminish the volume of operations with an eye towards suspending the operations of BH Valores S.A. in the future to prevent two structures that are presently highly similar in terms of their functions and have been rendered redundant within the same conglomerate from overlapping.
33. Resolutions issued by the Argentine Central Bank
Credit LineFinancing line for Productive Investmentsproduction and financial inclusion
Under Communication “A” 53195874 dated July 5, 2012,December 31, 2015, the BCRA approvedArgentine Central Bank revised the implementationname of a newthe credit line in effect since 2012 and started to be extended bypublish the “Credit line for production and financial inclusion purposes”. The new line will become effective on the first half of 2016. The financial institutions intendedsubject to promotethe provisions of this circular must record a lending balance under this credit line amounting to at least 14% of the deposits from the non-financial private sector in pesos, calculated taking into account the monthly average daily balances of November 2015, being able to attribute all the balances of loans disbursed through the "Line of credit for productive investmentsinvestment " in so far as the case of destinations also supported by this line.
At least 75% of the quota must be granted to SMEs. In calculating the quota, the average daily balances of outstanding loans during the first half of 2016 will be considered. The highest rate applicable under this line should be a fixed nominal rate of 22% per annum for the first 36 months, except for the purchase of portfolio and mortgage loans and loans for the acquisition of rights over trusts for the construction of real property to individuals, which will be a mixed interest rate. For clients who do not qualify as SMEs, the rate will be freely agreed upon. BANCO HIPOTECARIO SA AND SUBSIDIARIES NOTES TO THE CONSOLIDATED FINANCIAL STATEMENTS As of and for the twelve-month periods ended June 30, 2016, 2015 2014 and 20132014 (Expressed in thousands of Argentine pesos, except share data and as otherwise indicated)
consisting
Finally, under Communication "A" 5975 dated May 17, 2016 the Argentine Central Bank established the 2016 second quota under the "Fianncing line of the purchase of capital goodsproduction and the construction of the facilities necessary for producing goods and services. Generally, financial institutions accounting for more than 1% of the total deposits in the financial system and institutions operating as financial agents of the provinces are requiredinclusion", whereby a lending balance equal to allocate to this new credit line 5% of the total amount of deposits from the private sector held as of June 2012. In all cases, 50% of the loan amounts must be granted to companies qualifying as SMEs.
Under successive BCRA communications, the quotas allocable by financial institutions under this line were expanded and supplemented semi-annually under similar conditions as those set forth in the previous paragraph, i.e., a minimum allocation of 5%/5.5% of the amount of deposits from the non-financial private sector, terms and conditions including interest rates ranging from 15/19% per annum and maturities of up to 36 months.
Under Communication “A” 5771, the BCRA resolved to extend the Credit Line for Productive Investments over the second half of 2015. Therefore, the financial institutions subject to the provisions of this circular must allocate to this credit line an amount of at least 7.50%15.5 % of the non-financial private sector deposits in pesos, calculated taking into account the monthly average daily balances of May 2015. 100% of the quota2016, must be granted to SMEs, excluding those engaged in financial intermediation and insurance services, or services related to gambling and betting activities. The loans must be fully agreed as of September 30, 2015, and may be disbursed in a single drawing until that date or on a staggered basis until June 30, 2016, in the latter case only when warranted due to the features of the project subject to financing. Moreover, as of September 30, 2015, the loans agreed should amount to at least 30% of the total amount of the second tranche of the 2015 Quota. The highest interest rate applicable inrecorded under this tranche is a fixed nominal annual rate of 18% per annum for the first 36 months.line.
At the closing of these financial statements BHSA had recorded in average Ps. 870,7181,401,724 as principal and interest under BHSA’s assets in connection with this credit line.
Compliance with rules on term deposits and investments. Conditions governing interest rates on term deposits
Pursuant to its Communication “A” 5781, the Argentine Central Bank raised the floor of the interest rates payable on term deposits and the maximum amount of the placements that may obtain such benefit. The rest of the transactions shall be agreed upon freely, that is, without the involvement of the Argentine Central Bank.
It has been determined that starting on July 27, 2015 the minimum rates on deposits shallcan’t be less than the product arising from the last reference interest rate and a coefficient according to the original term of the imposition, as follows:
- from 30 to 44 days: 23.58%0.91 - from 45 to 59 days: 24.10%0.93 - from 60 to 89 days: 25.13%0.97 - from 90 to 119 days: 25.61%0.97 - from 120 to 179 days: 25.87%0.98 - from 180 days or more: 0.99 These minimum rates apply to all Peso-denominated term deposits of up to Ps.1,000.Ps.1,000 on behalf of holders who are human and / or legal persons.
Finally, the Argentine Central Bank provides that failure to comply with the minimum rate level shall result in an increase in minimum cash requirements in Pesos for an amount equivalent to all relevant term deposits for the month following that when the failure to comply takes place. No offsets among term deposits are allowed. In addition to the foregoing, summary proceedings shall
BANCO HIPOTECARIO SA AND SUBSIDIARIES
NOTES TO THE CONSOLIDATED FINANCIAL STATEMENTS
As of and for the twelve-month periods ended June 30, 2015, 2014 and 2013
(Expressed in thousands of Argentine pesos, except share data and as otherwise indicated)
be commenced in accordance with the guidelines laid down by the Superintendent of Financial and Foreign Exchange Institutions.
Conditions applicableThis regulation was repealed by the Argentine Central Bank through Communication “A” 5853, as described in the following item.
Interest rates on lending transactions. Financing subject to benchmark interest rates for personal and pledge loansrate regulation by the Central Bank.
Under Communication “A” 5590 dated June 10, 2014, the BCRA adopted a system of benchmark interest rates for personal and pledge loans to individuals not qualifying as SMEs and established a ceiling for these kinds of loans that may not exceed the product arising from multiplying the 90-day LEBACs’ cut-off interest rate by a multiplier ranging from 1.25 to 2.0, depending on the kind of loan and Bank Group. To this end, banks are divided into:
BANCO HIPOTECARIO SA AND SUBSIDIARIES NOTES TO THE CONSOLIDATED FINANCIAL STATEMENTS As of and for the twelve-month periods ended June 30, 2016, 2015 and 2014 (Expressed in thousands of Argentine pesos, except share data and as otherwise indicated)
- Group I: financial institutions operating as financial agents of the national, provincial and/or municipal governments and/or other institutions accounting for at least 1% of the total deposits from the non-financial private sector; and - Group II; the remaining institutions.
The BCRA publishes the “benchmark interest rate” to be applied by the financial institutions in each of these groups to each type of loans (personal loans, pledge loans and portfolio purchases). The rates applied by each institution to each loan within the lines mentioned above may not exceed the “benchmark interest rate” reported by the BCRA.
On December 17, 2015, under Communication "A" 5853 the BCRA repealed the above mentioned Communications and thus eliminated any regulation on rates, for both lending transactions and term deposits. This new rule will became applicable to any loans agreed upon from December 17, 2015 onwards. However, the BCRA provides that financial institutions shall disclose the total financial cost of lending transactions (by displaying it at their offices and in press ads) subject to specific typeface size requirements. Moreover, it establishes a timetable for violations detected until June 30, 2016 for transactions subject to regulated interest rates, i.e., those outstanding as of December 16, 2015; and for violations detected from January 1, 2016 onwards, the provisions set forth in Communication “A” 5849 shall apply. The mechanism provided in such rule imposed the obligation to reimburse the excess amount collected and any expenses incurred by clients in filing their claims. Protection granted to users of financial services
UnderOn March 23, 2016 following Communication “A” 5685"A" 5928 the Argentine Central Bank decided that all savings accounts shall be free of charge, including the use of debit cards and that the fees charged by the bank can be raised by up to twenty percent (20 %), insofar as the customer is informed of these increases at least 60 days before their effective application in the case of products sold for a price. Bank shall be free to determine the fees to be charged by them starting September 1, 2016.
Financial institutions shall be under duty to inform their competitors’s prices when they decide to change a price and to insert a highlighted hyperlink on their website with the name "Price Comparison " leading to BCRA’sweb page which will show the charges applied by peer banks on their different products. Finally, under Communication "A" 5993 dated December 23, 2014,June 22, 2016 the BCRA ordered that anyArgentine Central Bank put an end to the "Financial service fees and/or charges " reporting scheme and establishes a new commissions (commissions for newtransparency reporting scheme, whereby financial institutions are required to disclose on a monthly basis the fees and charges of the products and/or services intendedoffered to be marketed)users of financial services. Assignment of financial and increases in commissions must obtainforeign exchange institutions’ foreign currency position On December 17, 2015 under Communication "A " 5828, the BCRA’s previous authorization. Changes in charges shall be reported as well. In the case of basic financial products and/or services, theBCRA provided that financial institutions authorized to carry out foreign exchange transactions, should sell to the BCRA their positive foreign currency position as of the closing of business on December 16, 2015 valued at reference exchange rate prevailing on such date, and non-financial companies issuerscould then repurchase it in full, on December 17, 18 or 21, 2015 at the reference exchange rate prevailing on the repurchase date.
BANCO HIPOTECARIO SA AND SUBSIDIARIES NOTES TO THE CONSOLIDATED FINANCIAL STATEMENTS As of credit cards shall meet several requirements and proceduresfor the twelve-month periods ended June 30, 2016, 2015 and submit various explanations upon applying for such authorization.2014 (Expressed in thousands of Argentine pesos, except share data and as otherwise indicated)
In addition, Communication “A” 5715 dated February 13, 2015 imposesorden to exercise this option, the institutions filed a new monthly reporting duty that requires disclosingnotice signed by their highest local authority by 10 a.m. on the amountsselected repurchase date, sent to the General Transactions Sub-Management Department, giving express notice of commissions and/or charges collected for each product or service offeredtheir decision to individuals in their capacities as final users and the number of transactions, movements or services rendered during the month.effect such repurchase.
Lastly, the Argentine Central Bank approved a new methodology to find a solution for the requests of increases in the commissions for financial services and products by the entities that provide them. This methodology includes both basic and non-basic services, except for high-end products, whose increases shall be vetoed if considered abusive. Increases in commissions shall be subject to a maximum 20 per cent limit for all types of services and products.
34. Summary of Significant Differences between Argentine Banking GAAP and U.S. GAAP
The Bank’s consolidated financial statements have been prepared in accordance with Argentine Banking GAAP, which differs in certain significant respects from U.S. GAAP. Such differences involve methods of measuring the amounts shown in the consolidated financial statements, as well as additional disclosures required by U.S. GAAP and regulations of the SEC. These consolidated financial statements include solely a reconciliation of net income and shareholders’ equity to U.S. GAAP. Pursuant to Item 17 of Form 20-F, this reconciliation does not include disclosure of all information that would be required by U.S. GAAP and regulations of the SEC.
BANCO HIPOTECARIO SA AND SUBSIDIARIES NOTES TO THE CONSOLIDATED FINANCIAL STATEMENTS As of and for the twelve-month periods ended June 30, 2016, 2015 2014 and 20132014 (Expressed in thousands of Argentine pesos, except share data and as otherwise indicated)
| Differences in measurement methods |
Differences in measurement methods
As from March 1, 2003, inflation accounting was discontinued. The following reconciliation does not include the reversal of the adjustments to the consolidated financial statements for the effects of inflation, because, as permitted by the Securities and Exchange Commission (“SEC”), it represents a comprehensive measure of the effects of price-level changes in the Argentine economy, and as such, is considered a more meaningful presentation than historical cost-based financial reporting for both Argentine GAAP and U.S. GAAP.
The main differences between Argentine GAAP and U.S. GAAP as they relate to the Bank are described below, together with an explanation, where appropriate, of the method used in the determination of the necessary adjustments. References below to “ASC” are to Accounting Standard Codification issued by the Financial Accounting Standards Board in the United States of America.
The following tables summarize the main reconciling items between Argentine GAAP and U.S. GAAP:
Reconciliation of net income: | | | June 30, | | 2016 | 2015 | 2014 | | Net income as reported under Argentine Banking GAAP | Ps. | 1,115,530 | 537,190 | 627,027 | | U.S. GAAP adjustments: | | | | | | - Loan origination fees and costs…………………. | (a) | (131,794) | (19,325) | 27,525 | | - Loan loss reserve ....……………………………… | (b) | (30,165) | (30,703) | (29,677) | | - Derivative financial instruments...………………. | (c) | - | 876 | (941) | | - Government securities …………………………... | (d) | (12,429) | 18,230 | (17,669) | | - Financial liabilities……….……………………… | (e) | 77,581 | 2,709 | 4,136 | | - Securitizations…………………..……………….. | (f) | (41,251) | 16,434 | (10,725) | | - Intangible assets…………………………………. | | | | | | Software costs……………………………..… | (g) | 1,522 | (26,525) | (18,396) | | Other intangible assets………………………. | (g) | 59 | (3,156) | (4,793) | | Business combinations………...………...….. | (g) | 990 | 991 | 989 | | - Impairment of fixed and foreclosed assets.……... | (h) | 1,116 | 944 | 983 | | - Miscellaneous assets.………………………..…... | (n) | (30,848) | - | - | | - Vacation provision..…………………………….. | (j) | (17,010) | (17,302) | (18,955) | | - Insurance technical reserve..……………………. | (k) | (960) | 2,780 | 1,398 | | - Capitalization of interest cost…….……………… | (l) | (4,001) | 775 | 301 | | - Financial guarantees issued...…….……………… | (m) | (1,209) | - | - | | - Deferred income tax…………………………….. | (o) | 94,028 | 44,673 | 55,122 | | - Non-Controlling interest..……………………….. | (i) | (5,998) | (13,658) | (11,031) | | Net income in accordance with U.S. GAAP | Ps. | 1,015,161 | 514,933 | 605,294 | | - Less Net (Gain) / Loss attributable to the Non-Controlling interest……………………………..…. | (i) | 18,311 | 4,369 | 10,284 | | Net income attributable to Controlling interest in accordance with U.S. GAAP | Ps. | 1,033,472 | 519,302 | 615,578 | | Basic and diluted net income per share in accordance with U.S. GAAP | | 6.937 | 3.519 | 4.136 | | Average number of shares outstanding (in thousands)…………………………………………. | | 1,463,365 | 1,463,365 | 1,463,365 |
| | | | June 30, | | | | | | 2015 | | | 2014 | | | 2013 | | | Net income as reported under Argentine Banking GAAP | | | Ps. | 537,190 | | | | 627,027 | | | | 339,122 | | | U.S. GAAP adjustments: | | | | | | | | | | | | | | | - Loan origination fees and costs | (a) | | | (19,325 | ) | | | 27,525 | | | | (29,863 | ) | | - Loan loss reserve | (b) | | | (30,703 | ) | | | (29,677 | ) | | | (25,253 | ) | | - Derivative financial instruments | (c) | | | 876 | | | | (941 | ) | | | (1,223 | ) | | - Government securities | (d) | | | 18,230 | | | | (17,669 | ) | | | 12,727 | | | - Provincial public debt | (e) | | | - | | | | - | | | | 331 | | | - Financial liabilities | (f) | | | 2,709 | | | | 4,136 | | | | 3,154 | | | - Securitizations | (g) | | | 16,434 | | | | (10,725 | ) | | | (17,512 | ) | | - Intangible assets | | | | | | | | | | | | | | | Software costs | (h) | | | (26,525 | ) | | | (18,396 | ) | | | (8,639 | ) | | Other intangible assets | (h) | | | (3,156 | ) | | | (4,793 | ) | | | (3,157 | ) | | Business combinations | (h) | | | 991 | | | | 989 | | | | 991 | | | - Impairment of fixed and foreclosed assets | (i) | | | 944 | | | | 983 | | | | 932 | | | - Vacation provision | (k) | | | (17,302 | ) | | | (18,955 | ) | | | (7,714 | ) | | - Insurance technical reserve | (l) | | | 2,780 | | | | 1,398 | | | | 1,003 | | | - Capitalization of interest cost | (m) | | | 775 | | | | 301 | | | | 553 | | | - Deferred income tax | (n) | | | 44,673 | | | | 55,122 | | | | (20,057 | ) | | - Non-Controlling interest | (j) | | | (13,658 | ) | | | (11,031 | ) | | | 14,148 | | | Net income in accordance with U.S. GAAP | | | Ps. | 514,933 | | | | 605,294 | | | | 259,543 | | | - Less Net (Gain) / Loss attributable to the Non-Controlling interest | (j) | | | 4,369 | | | | 10,284 | | | | (8,834 | ) | | Net income attributable to Controlling interest in accordance with U.S. GAAP | | | Ps. | 519,302 | | | | 615,578 | | | | 250,709 | | | Basic and diluted net income per share in accordance with U.S. GAAP | | | | 3.519 | | | | 4.136 | | | | 1.774 | | | Average number of shares outstanding (in thousands) | | | | 1,463,365 | | | | 1,463,365 | | | | 1,463,365 | |
BANCO HIPOTECARIO SA AND SUBSIDIARIES NOTES TO THE CONSOLIDATED FINANCIAL STATEMENTS As of and for the twelve-month periods ended June 30, 2016, 2015 2014 and 20132014 (Expressed in thousands of Argentine pesos, except share data and as otherwise indicated)
Reconciliation of shareholders’ equity
| | | | June 30, | | | | | | 2015 | | | 2014 | | | Total shareholders' equity under Argentine Banking GAAP | | | Ps. | 4,700,716 | | | | 4,205,343 | | | U.S. GAAP adjustments: | | | | | | | | | | | - Loan origination fees and costs | (a) | | | (90,893 | ) | | | (71,568 | ) | | - Loan loss reserve | (b) | | | (220,541 | ) | | | (189,838 | ) | | - Derivative financial Instruments | (c) | | | - | | | | (876 | ) | | - Government securities | (d) | | | 37,759 | | | | 3,871 | | | - Financial liabilities | (f) | | | 10,282 | | | | 7,573 | | | - Securitizations | (g) | | | (15,442 | ) | | | (31,876 | ) | | - Intangible assets | | | | | | | | | | | Software costs | (h) | | | (63,888 | ) | | | (37,363 | ) | | Other intangible assets | (h) | | | (59 | ) | | | 3,097 | | | Business combinations | (h) | | | (1,176 | ) | | | (2,167 | ) | | - Impairment of fixed and foreclosed assets | (i) | | | (37,379 | ) | | | (38,323 | ) | | - Vacation provision | (k) | | | (57,634 | ) | | | (40,332 | ) | | - Insurance technical reserve | (l) | | | (339 | ) | | | (3,119 | ) | | - Capitalization of interest cost | (m) | | | 4,001 | | | | 3,226 | | | - Deferred income Tax | (n) | | | 258,903 | | | | 214,230 | | | - Non-Controlling interest | (j) | | | 67,957 | | | | 59,849 | | | Total Shareholders’ Equity under U.S. GAAP | | | Ps. | 4,592,267 | | | | 4,081,727 | | | - Non-Controlling Interest under U.S. GAAP | (j) | | | (68,126 | ) | | | (50,662 | ) | | Consolidated Parent Company Shareholders’ Equity under U.S. GAAP | | | Ps. | 4,524,141 | | | | 4,031,065 | |
| | | June 30, | | | | 2016 | 2015 | | Total shareholders' equity under Argentine Banking GAAP | Ps. | 5,816,242 | 4,700,716 | | U.S. GAAP adjustments: | | | | | - Loan origination fees and costs..…………………... | (a) | (222,687) | (90,893) | | - Loan loss reserve ………………………………….. | (b) | (250,706) | (220,541) | | - Government securities…..………….……………… | (d) | (4,697) | 37,759 | | - Financial liabilities…...……………………………. | (e) | 87,863 | 10,282 | | - Securitizations…………………...………………… | (f) | (56,693) | (15,442) | | - Intangible assets………………………………….… | | | | | Software costs………………………….……… | (g) | (62,366) | (63,888) | | Other intangible assets……………………...…. | (g) | - | (59) | | Business combinations….………...………..….. | (g) | (186) | (1,176) | | - Impairment of fixed and foreclosed assets………… | (h) | (36,263) | (37,379) | | - Miscellaneous assets ……………………….……… | (n) | (30,848) | - | | - Vacation provision………………………………… | (j) | (74,644) | (57,634) | | - Insurance technical reserve………………………… | (k) | (1,299) | (339) | | - Capitalization of interest cost……………………… | (l) | - | 4,001 | | - Financial guarantees issued...…….……………… | (m) | (1,209) | - | | - Deferred income Tax……………………….……… | (o) | 352,931 | 258,903 | | - Non-Controlling interest..………………………….. | (i) | 130,207 | 67,957 | | Total Shareholders’ Equity under U.S. GAAP | Ps. | 5,645,645 | 4,592,267 | | - Non-Controlling Interest under U.S. GAAP…..….. | (i) | (118,063) | (68,126) | | Consolidated Parent Company Shareholders’ Equity under U.S. GAAP | Ps. | 5,527,582 | 4,524,141 |
Description of changes in shareholders’ equity under U.S. GAAP:
| | Total Shareholders’ Equity | | Balance as of June 30, 2013 | 2014 | Ps. | 3,423,204 | 4,031,065 | | Cash dividends | | | (30,000 | )(41,817) | | Other Comprehensive Income | | | 22,283 | 15,591 | | Net income for the twelve-month period in accordance with U.S. GAAP | | | 615,578 | 519,302 | Balance as of June 30, 2014 | 2015 | Ps. | 4,031,065 | | Cash dividends | | | (41,817 | )4,524,141 | | Other Comprehensive Income | | | 15,591 | (30,031) | | Net income for the twelve-month period in accordance with U.S. GAAP | | | 519,302 | 1,033,472 | Balance as of June 30, 2015 | 2016 | Ps. | 4,524,141 | 5,527,582 |
a. Loan origination fees and costs
Under Argentine Banking GAAP, the Bank does not defer loan origination fees and costs on mortgage, personal and credit card loans, different from those originated under the Pro.Cre.Ar program.
BANCO HIPOTECARIO SA AND SUBSIDIARIES NOTES TO THE CONSOLIDATED FINANCIAL STATEMENTS As of and for the twelve-month periods ended June 30, 2016, 2015 and 2014 (Expressed in thousands of Argentine pesos, except share data and as otherwise indicated)
Given the bank’s role as Trustee of the PROCREAR Administrative and Financial Trust, (see note 30), it has capitalized direct expenses incurred in the mortgage loan origination process, which
BANCO HIPOTECARIO SA AND SUBSIDIARIES
NOTES TO THE CONSOLIDATED FINANCIAL STATEMENTS
As of and for the twelve-month periods ended June 30, 2015, 2014 and 2013
(Expressed in thousands of Argentine pesos, except share data and as otherwise indicated)
disbursements would not have been incurred by it had it not been for the grant of the related loans, in accordance with the provisions of Communication “A” 5392. Such origination expenses are amortized in 60 monthly installments.
In accordance with U.S. GAAP, under ASC 310 loan origination fees and certain direct loan origination costs should be recognized over the life of the related loan as an adjustment of yield.
Therefore the shareholders’ equity adjustment between Argentine Banking GAAP and U.S. GAAP for Banco Hipotecario S.A. as of June 30, 20152016 and 20142015 amounted to Ps. (90,893)(222,687) and (71,568)(90,893), respectively.
b. Loan loss reserve
The Bank’s accounting for its allowance for loan losses differs in some significant respects with practices of U.S.-based banks.
Under Argentine Banking GAAP, the allowance for loan losses is calculated according to specific criteria. This criterion is different for commercial loans (those in excess of Ps. 2,500) and consumer loans. Loan loss reserves for commercial loans are principally based on the debtors’ payment capacity and cash-flows analysis. Loan loss reserves for consumer loans are based on the client’s aging. Argentine banks may maintain other reserves to cover potential loan losses which management believes to be inherent in the loan portfolio, and other Argentine Central Bank required reserves.
Under U.S. GAAP, the allowance for loan losses should be in amounts adequate to cover inherent losses in the loan portfolio, incurred at the respective balance sheet dates. Specifically:
| Loans considered impaired, in accordance with ASC 310-10 “Accounting for Creditors for Impairment of a Loan”, are recorded at the present value of the expected future cash flows discounted at the loan’s effective contractual interest rate or at the fair value of the collateral if the loan is collateral dependent. Under ASC 310-10, a loan is considered impaired when, based on current information, it is probable that the borrower will be unable to pay contractual interest or principal payments as scheduled in the loan agreement. ASC 310-10 applies to all loans except smaller-balance homogeneous consumer loans, loans carried at the lower of cost or fair value, debt securities, and leases. |
Loans considered impaired, in accordance with ASC 310-10 “Accounting for Creditors for Impairment of a Loan”, are recorded at the present value of the expected future cash flows discounted at the loan’s effective contractual interest rate or at the fair value of the collateral if the loan is collateral dependent. Under ASC 310-10, a loan is considered impaired when, based on current information, it is probable that the borrower will be unable to pay contractual interest or principal payments as scheduled in the loan agreement. ASC 310-10 applies to all loans except smaller-balance homogeneous consumer loans, loans carried at the lower of cost or fair value, debt securities, and leases.
The Bank applies ASC 310-10 to all commercial loans classified as “With problems”, “Insolvency Risks” and “Uncollectible” or commercial loans more than 90 days past due. The Bank specifically calculates the present value of estimated cash flows for commercial loans in excess of Ps.2,500 and more than 90 days past due. For commercial and other loans in legal proceedings, loans in excess of Ps.2,500 are specifically reviewed either on a cash-flow or collateral-value basis, both considering the estimated time to settle the proceedings.
As of June 30, 20152016 and 2014,2015, the result of applying ASC 310-10, shows that the Bank recorded an adjustment to shareholders’ equity for U.S. GAAP purposes of Ps.60,574 and Ps. 39,753, and Ps. 54,052, respectively.
| In addition, the Bank has performed a migration analysis for mortgage, credit cards and consumer loans following the ASC 450-20 and historical loss ratios were determined by analyzing historical losses, in order to calculate the allowance required for smaller-balance impaired loans and unimpaired loans for U.S. GAAP purposes. Loss estimates are analyzed by loan type and thus for homogeneous groups of clients. Such historical ratios were updated to incorporate the most recent data reflecting current economic conditions, industry performance |
In addition, the Bank has performed a migration analysis for mortgage, credit cards and consumer loans following the ASC 450-20 and historical loss ratios were determined by analyzing historical losses, in order to calculate the allowance required for smaller-balance impaired loans and unimpaired loans for U.S. GAAP purposes. Loss estimates are analyzed by loan type and thus for homogeneous groups of clients. Such historical ratios were updated to BANCO HIPOTECARIO SA AND SUBSIDIARIES NOTES TO THE CONSOLIDATED FINANCIAL STATEMENTS As of and for the twelve-month periods ended June 30, 2016, 2015 2014 and 20132014 (Expressed in thousands of Argentine pesos, except share data and as otherwise indicated)
| trends, geographic or obligor concentrations within each portfolio segment, and any other pertinent information that may affect the estimation of the allowance for loan losses. |
c)
incorporate the most recent data reflecting current economic conditions, industry performance trends, geographic or obligor concentrations within each portfolio segment, and any other pertinent information that may affect the estimation of the allowance for loan losses.
As a result of the analysis mentioned before, the Bank recorded an adjustment to shareholders’ equity for U.S. GAAP purposes of Ps. (129,868)(193,715) and Ps. (162,828)(129,868), for 20152016 and 2014,2015, respectively.
c) | Under Argentine Banking GAAP, loans that were previously charged-off, which are subsequently restructured and become performing loans, are included again in the Bank’s assets, according to the policies adopted by the bank. Under U.S. GAAP recoveries of loans previously charged off should be recorded when received. As of June 2015 and 2014, the Bank recorded an adjustment to shareholders’ equity related to reinstated loans of Ps. (62,502) and Ps. (79,889), respectively. |
d)
Under Argentine Banking GAAP, loans that were previously charged-off, which are subsequently restructured and become performing loans, are included again in the Bank’s assets, according to the policies adopted by the bank. Under U.S. GAAP recoveries of loans previously charged off should be recorded when received. As of June 2016 and 2015, the Bank recorded an adjustment to shareholders’ equity related to reinstated loans of Ps. (48,146) and Ps. (62,502), respectively.
d) | Effective July 1, 2010, the Bank implemented new accounting guidance provided by SFAS 166 and 167 (ASU 2009-16 and ASU 2009-17, respectively, under the new codification), which amend the accounting for transfers of financial assets and consolidation of variable interest entities (VIEs). As a result of applying such guidance, the Bank, or its subsidiaries, were deemed to be the primary beneficiary of the securitization trusts because the Bank, or its subsidiaries, have the power to direct the activities of these VIEs through its servicing responsibilities and duties. Additionally, the Bank, or its subsidiaries, through its retained interests held in these securitizations have the obligation to absorb losses or the right to receive benefits from the VIEs. As a result of the analysis performed, the Bank should consolidate assets and liabilities of those securitization trusts, elimininating the investment in the retained interests and recording and adjustment in the allowance for loan losses of such securitization trusts. |
e) Effective July 1, 2010, the Bank implemented new accounting guidance provided by SFAS 166 and 167 (ASU 2009-16 and ASU 2009-17, respectively, under the new codification), which amend the accounting for transfers of financial assets and consolidation of variable interest entities (VIEs). As a result of applying such guidance, the Bank, or its subsidiaries, were deemed to be the primary beneficiary of the securitization trusts because the Bank, or its subsidiaries, have the power to direct the activities of these VIEs through its servicing responsibilities and duties. Additionally, the Bank, or its subsidiaries, through its retained interests held in these securitizations have the obligation to absorb losses or the right to receive benefits from the VIEs. As a result of the analysis performed, the Bank should consolidate assets and liabilities of those securitization trusts, elimininating the investment in the retained interests and recording and adjustment in the allowance for loan losses of such securitization trusts. As a result of the analysis mentioned before, the Bank recorded an adjustment to shareholders’ equity for U.S. GAAP purposes of Ps. (67,924)(69,419) and Ps. (1,173)(67,924), for 20152016 and 2014,2015, respectively.
As a result of analysis performed the breakdown of the shareholders’ equity adjustment between Argentine Banking GAAP and U.S. GAAP between the Bank’s adjustment and the reconsolidated securitization trusts as of June 30, 20152016 and 20142015 is as follows: | | | 2016 | 2015 | | | | | 2015 | | | | 2014 | | Allowances under Arg. Banking GAAP | Allowances under U.S. GAAP | Adjustment to shareholders’ equity | Allowances under Arg. Banking GAAP | Allowances under U.S. GAAP | Adjustment to shareholders’ equity | | | | | Allowances under Arg. Banking GAAP | | | | Allowances under U.S. GAAP | | | | Adjustment to shareholders’ equity | | | | Allowances under Arg. Banking GAAP | | | | Allowances under U.S. GAAP | | | | Adjustment to shareholders’ equity | | | | | | | | Migration analysis (*) | | | 346,797 | | | | 476,665 | | | | (129,868 | ) | | | 292,526 | | | | 455,354 | | | | (162,828 | ) | 412,693 | 606,408 | (193,715) | 346,797 | 476,665 | (129,868) | | ASC 310-10 | | | 91,365 | | | | 51,612 | | | | 39,753 | | | | 68,788 | | | | 14,736 | | | | 54,052 | | 84,157 | 23,583 | 60,574 | 91,365 | 51,612 | 39,753 | | Reinstated loans | | | - | | | | 62,502 | | | | (62,502 | ) | | | - | | | | 79,889 | | | | (79,889 | ) | - | 48,146 | (48,146) | - | 62,502 | (62,502) | | Subtotal | | | 438,162 | | | | 590,779 | | | | (152,617 | ) | | | 361,314 | | | | 549,979 | | | | (188,665 | ) | 496,850 | 678,137 | (181,287) | 438,162 | 590,779 | (152,617) |
| (*) Migration analysis of Banco Hipotecario and its subsidiaries. |
BANCO HIPOTECARIO SA AND SUBSIDIARIES NOTES TO THE CONSOLIDATED FINANCIAL STATEMENTS As of and for the twelve-month periods ended June 30, 2016, 2015 2014 and 20132014 (Expressed in thousands of Argentine pesos, except share data and as otherwise indicated)
| | | 2015 | | | 2014 | | | | | Allowances under Arg. Banking GAAP | | | Allowances under U.S. GAAP | | | Adjustment to shareholders’ equity | | | Allowances under Arg. Banking GAAP | | | Allowances under U.S. GAAP | | | Adjustment to shareholders’ equity | | | | | | | | | | | | | | | | | | | | | | | Reconsolidated trusts | | | 76,232 | | | | 144,156 | | | | (67,924 | ) | | | 45,504 | | | | 46,677 | | | | (1,173 | ) | | Subtotal | | | 76,232 | | | | 144,156 | | | | (67,924 | ) | | | 45,504 | | | | 46,677 | | | | (1,173 | ) | | | | | | | | | | | | | | | | | | | | | | | | | | | | Total | | | 514,394 | | | | 734,935 | | | | (220,541 | ) | | | 406,818 | | | | 596,656 | | | | (189,838 | ) |
| | 2016 | 2015 | | | Allowances under Arg. Banking GAAP | Allowances under U.S. GAAP | Adjustment to shareholders’ equity | Allowances under Arg. Banking GAAP | Allowances under U.S. GAAP | Adjustment to shareholders’ equity | | | | | | | | | | Reconsolidated trusts | 196,202 | 265,621 | (69,419) | 76,232 | 144,156 | (67,924) | | Subtotal | 196,202 | 265,621 | (69,419) | 76,232 | 144,156 | (67,924) | | | | | | | | Total | 693,052 | 943,758 | (250,706) | 514,394 | 734,935 | (220,541) |
c. Derivative Financial Instruments
As mentioned in notes 18 and 2.9. the Bank entered in several derivative transactions, mainly, to hedge: i) the exchange rate risk attached to liabilities denominated in foreign currency, and ii) interest rate swaps to manage its interest rate risk.
Gains and losses are recorded in earnings in each period.
Under U.S. GAAP, the Bank accounts for derivative financial instruments in accordance with ASC 815 which establishes the standards of accounting and reporting derivative instruments, including certain derivative instruments embedded within contracts (collectively referred to as derivatives) and hedging activities. This statement requires institutions to recognize all derivatives in the balance sheet, whether as assets or liabilities, and to measure those instruments at their fair value. If certain conditions are met, a derivative may be specifically designated as (a) a hedge for the exposure to changes in the fair value of a recorded asset or liability or unrecorded firm commitment, (b) a hedge for the exposure of future cash flows and (c) a hedge for the exposure of foreign currency. If such a hedge designation is achieved then special hedge accounting can be applied for the hedged transactions that will reduce the volatility in the income statement to the extent that the hedge is effective. In order for hedge accounting to be applied the derivative and the hedged item must meet strict designation and effectiveness tests.
The Bank’s derivatives do not qualify for hedge accounting treatment under U.S. GAAP. Therefore gains and losses are recorded in earnings in each period.
Under U.S. GAAP, the Bank’s estimates the fair value of the receivable and payable on the derivative instrument using valuation techniques with observable market parameters. As of June 30, 2014 the shareholder’s equity adjustment amounts to Ps. (876).
d. Government securities
The following table summarizes the U.S. GAAP shareholders’ equity adjustment related to other government securities, as of June 30, 20152016 and 2014:2015: | | June 30, | | | 2016 | | 2015 | | | | | | | | | Discount Bonds | Ps. | - | | Ps. | (534) | | Unquoted Securities issued by the BCRA | | 1,525 | | | 1,352 | | Bills issued by Provincial Governments | | (10,167) | | | 8,472 | | Other National Government Bonds | | 3,945 | | | 28,469 | | Total | Ps. | (4,697) | | Ps. | 37,759 |
| | June 30, | | | | 2015 | | 2014 | | | | | | | | | | | Discount Bonds | | Ps. | (534 | ) | | Ps. | (4,126 | ) | | Unquoted Securities issued by the BCRA | | | 1,352 | | | | 7,387 | | | Bills issued by Provincial Governments | | | 8,472 | | | | 4,234 | | | Other National Government Bonds | | | 28,469 | | | | (3,624 | ) | | Total | | Ps. | 37,759 | | | Ps. | 3,871 | |
BANCO HIPOTECARIO SA AND SUBSIDIARIES NOTES TO THE CONSOLIDATED FINANCIAL STATEMENTS As of and for the twelve-month periods ended June 30, 2016, 2015 2014 and 20132014 (Expressed in thousands of Argentine pesos, except share data and as otherwise indicated)
As of June 30, 2004 the Bank held certain defaulted Argentine government bonds. Such bonds were not quoted in the public market. On January 2005, the Bank accepted the offer to exchange its defaulted government securities for “Discount Bonds in pesos” issued under the Argentine debt restructuring. On April 1, 2005 the government securities were exchange.
For U.S. GAAP purposes and in accordance with ASC 310 satisfaction of one monetary asset (in this case a defaulted government securities) by the receipt of another monetary asset (in this case Discount Bonds) from the creditor is generally based on the market value of the asset received in satisfaction of the debt. In this particular case, the Bonds being received are significantly different in structure and in interest rates than the securities swapped. Therefore, the fair value of the Bonds was determined on the balance sheet date based on their market value and will constitute the cost basis of the asset. Any difference between the old asset and the fair value of the new asset is recognized as a gain or loss. The bonds arisen from the exchange have been sold.
During the twelve-month periods ended June 30, 2014 and 2015, there have been purchases of Discount Bonds.
As of June 30, 2015 and 20142015 the Discount Bonds were considered available for sale securities for U.S. GAAP purposes according with ASC 320-10 and recorded at fair value with the unrealized gains and losses recognized as a charge or credit to equity through other comprehensive income. As of June 30, 2015 and 2014 the following table shows the amortized cost, book value and fair value of the mentioned bond.
| | | 2015 | | | 2014 | | | | | Amortized Cost U.S. GAAP | | | Book Value Argentine Banking GAAP | | | Fair Value – Book value under U.S. GAAP | | | Unrealized (Loss)/Gain | | | Shareholders’ equity Adjustment | | | Amortized Cost U.S. GAAP | | | Book Value Argentine Banking GAAP | | | Fair Value – Book value under U.S. GAAP | | | Unrealized (Loss)/Gain | | | Shareholders’ equity Adjustment | | | | | (In thousands of $) | | | | | | | | | | | | | | | | | | | | | | | | | | | | | | | | | | | Discount Bonds | | | 9,624 | | | | 9,624 | | | | 9,090 | | | | (11,013 | ) | | | (534 | ) | | | 77,177 | | | | 91,782 | | | | 87,656 | | | | 10,479 | | | | (4,126 | ) |
| | 2015 | | | Amortized Cost U.S. GAAP | Book Value Argentine Banking GAAP | Fair Value – Book value under U.S. GAAP | Unrealized (Loss)/Gain | Shareholders’ equity Adjustment | | | (In thousands of $) | | | | | | | | | Discount Bonds | 9,624 | 9,624 | 9,090 | (11,013) | (534) |
The Bank has evaluated whether there was a decline in the value of the security that is other-than temporary as defined by ASC 320.
A number of factors are considered in performing an impairment analysis of securities. Those factors include, among others:
a. | Intent and ability of the Bank to retain its investment for a period of time that allows for any anticipated recovery in market value; |
b. | Expectation to recover the entire amortized cost of the security; |
c. | Recoveries in fair value after the balance sheet date; |
d. | The financial condition and near-term prospects of the issuer, including any specific events which may influence the operations of the issuer (such as changes in technology that may impair the earnings potential of the investment or the discontinuance of a segment of a business that may affect the future earnings potential). |
e. | Likelihood that it will be required to sell debt investments before recovery of amortized cost. |
BANCO HIPOTECARIO SA AND SUBSIDIARIES
NOTES TO THE CONSOLIDATED FINANCIAL STATEMENTS
As of and forDuring the twelve-month periodsperiod ended June 30, 2015, 2014 and 2013
(Expressed in thousands of Argentine pesos, except share data and as otherwise indicated)
The Bank also takes into account2016, all Discount Bonds were sold. Therefore, the length of time and2016 U.S. GAAP net income reconciliation includes the extent to which the market valuereversal of the security has been less than cost2015 shareholders’ equity adjustment of Ps. (534) plus Ps. 534 of gains previously recorded through other comprehensive income, which that are being realized and changes in global and regional economic conditions and changes related to specific issuers or industries that could adversely affect these values.
As ofreversed through the income statement during the period ended June 30, 2014 the fair value of the investment is greater than its amortized cost. The Bank as a result of its analysis has determined that, as of June 30, 2015, unrealized losses on Discount2016.
● Other Bonds are temporary in nature based on its ability and intent to hold the investment for a period of time sufficient to allow for any anticipated recovery, the financial condition of the issuer and the recoveries in fair values after the balance sheet date.
Under Argentine Banking GAAP, as of June 30, 20152016 and 2014,2015, some National Government Bonds, unquoted securities issued by the BCRA and bills issued by Provincial Governments have been recorded at cost. This value increases monthly on the basis of the internal rate of return resulting from the interest rate which, used as discount, matches the cash flow’s present value with the initial value.
Under U.S. GAAP these securities were considered available for sale securities according with ASC 320 and recorded at fair value with the unrealized gains and losses recognized as a charge or credit to equity through other comprehensive income. As of June 30, 20152016 and 20142015 the following table shows the amortized cost, book value and fair value of the mentioned bonds:
| | | 2015 | | | 2014 | | | | | Amortized Cost U.S. GAAP | | | Book Value Argentine Banking GAAP | | | Fair Value – Book value under U.S. GAAP | | | Unrealized (Loss)/Gain | | | Shareholders’ equity Adjustment | | | Amortized Cost U.S. GAAP | | | Book Value Argentine Banking GAAP | | | Fair Value – Book value under U.S. GAAP | | | Unrealized (Loss)/Gain | | | Shareholders’ equity Adjustment | | | | | (In thousands of $) | | | | | | | | | | | | | | | | | | | | | | | | | | | | | | | | | | | Unquoted securities issued by the BCRA | | | 1,719,856 | | | | 1,719,856 | | | | 1,721,208 | | | | 1,352 | | | | 1,352 | | | | 1,342,425 | | | | 1,342,425 | | | | 1,349,812 | | | | 7,387 | | | | 7,387 | | | Bills issued by Provincial Governments | | | 539,172 | | | | 539,172 | | | | 547,644 | | | | 8,472 | | | | 8,472 | | | | 423,275 | | | | 423,275 | | | | 427,509 | | | | 4,234 | | | | 4,234 | | | | | | | | | | | | | | | | | | | | | | | | | | | | | | | | | | | | | | | | | | | | | Other National Government Bonds | | | 648,921 | | | | 648,921 | | | | 677,390 | | | | 28,469 | | | | 28,465 | | | | 33,136 | | | | 32,796 | | | | 29,172 | | | | - | | | | (3,624 | ) |
BANCO HIPOTECARIO SA AND SUBSIDIARIES NOTES TO THE CONSOLIDATED FINANCIAL STATEMENTS As of and for the twelve-month periods ended June 30, 2016, 2015 and 2014 (Expressed in thousands of Argentine pesos, except share data and as otherwise indicated)
| | 2016 | 2015 | | | Amortized Cost U.S. GAAP | Book Value Argentine Banking GAAP | Fair Value – Book value under U.S. GAAP | Unrealized (Loss)/Gain | Shareholders’ equity Adjustment | Amortized Cost U.S. GAAP | Book Value Argentine Banking GAAP | Fair Value – Book value under U.S. GAAP | Unrealized (Loss)/Gain | Shareholders’ equity Adjustment | | | (In thousands of $) | | | | | | | | | | | | | Unquoted securities issued by the BCRA | 1,251,461 | 1,251,461 | 1,252,986 | 1,525 | 1,525 | 1,719,856 | 1,719,856 | 1,721,208 | 1,352 | 1,352 | | Bills issued by Provincial Governments | 503,200 | 503,200 | 493,033 | 2,259 | (10,167) | 539,172 | 539,172 | 547,644 | 8,472 | 8,472 | | | | | | | | | | | | | | Other National Government Bonds | 377,990 | 377,990 | 381,935 | 3,945 | 3,945 | 648,921 | 648,921 | 677,390 | 28,469 | 28,465 |
The Bank has evaluated whether there was a decline in the value of the security that is other-than temporary as defined by ASC 320-10.320.
A number of factors are considered in performing an impairment analysis of securities. Those factors include, among others: a. Intent and ability of the Bank to retain its investment for a period of time that allows for any anticipated recovery in market value; b. Expectation to recover the entire amortized cost of the security; c. Recoveries in fair value after the balance sheet date; d. The financial condition and near-term prospects of the issuer, including any specific events which may influence the operations of the issuer (such as changes in technology that may impair the earnings potential of the investment or the discontinuance of a segment of a business that may affect the future earnings potential). e. Likelihood that it will be required to sell debt investments before recovery of amortized cost. The Bank also takes into account the length of time and the extent to which the market value of the security has been less than cost and changes in global and regional economic conditions and changes related to specific issuers or industries that could adversely affect these values. As of June 30, 2014,2016 the fair value of the Bills issued by Provincial Governments is less than its amortized cost. The Bank as a result of its analysis has determined that, as of June 30, 2016, unrealized losses on PRO XIII Bondssome Bills, are not temporary, consequently the Bank has recorded an other-than temporary impairment for U.S. GAAP purposes. Therefore the fair value of the security was determined on the balance sheet date based on their market value and will constitute the new cost basis for the asset. In addition, the bank has performed an impairment analysis for the rest of their portfolio and no other than temporary impairment were detected. As of June 30, 2015 the fair value of the investment is greater than its amortized cost. BANCO HIPOTECARIO SA AND SUBSIDIARIES
NOTES TO THE CONSOLIDATED FINANCIAL STATEMENTS
As of and for the twelve-month periods ended June 30, 2015, 2014 and 2013
(Expressed in thousands of Argentine pesos, except share data and as otherwise indicated)
e. Provincial Public Debt
As of June 2002, the Bank offered to exchange certain loans to Argentine provincial governments for loans or securities of the Argentine National Government; however the exchange had not been finalized until 2003. As these loans were performing no provision was recorded under U.S. GAAP in accordance with ASC 310-10.
In 2003, the Bank tendered in the exchange under Decree N°1579/02 almost all its portfolio of loans to provincial governments and received securities of the Argentine National Government (“BOGAR”).
For U.S. GAAP purposes and in accordance with ASC 310-20 satisfaction of one monetary asset (in this case a loan) by the receipt of another monetary asset (in this case BOGAR) from the creditor is generally based on the market value of the asset received in satisfaction of the debt. In this particular case, the BOGAR being received is significantly different in structure and in interest rates than the loans swapped. Therefore, such amounts should initially be recognized at their market value. The estimated fair value of the securities received will constitute the cost basis of the asset. Any difference between the old asset and the fair value of the new asset is recognized as a gain or loss. The difference between the cost basis and the amount expected to be collected will be amortized on an effective yield basis over the life of the bond.
For U.S. GAAP purposes, these BOGAR Bonds were classified by the Bank, as available for sale securities and recorded at fair value with the unrealized gains or losses recognized as a charge or credit to equity through other comprehensive income.
During the period ended June 30, 2013, all BOGAR Bonds were sold. Therefore, the 2013 U.S. GAAP net income reconciliation includes the reversal of the 2012 shareholders’ equity adjustment of Ps. 363 plus Ps. 694 of gains previously recorded through other comprehensive income, which that are being realized and reversed through the income statement during the period ended June 30, 2013.
f. Financial liabilities
Bonds As described in note 15, the bank has issued several series of negotiable obligations in different terms and conditions. Under Argentine Banking GAAP, the costs of originating such instruments have been charged to the Income Statement at the issuance date.
Under U.S.GAAP, and according to ASC 835-30-45-3, issuance costs should be reported in the balance sheet as deferred charges. In addition, ASC 470-10-35-2 states that debt issuance costs should be amortized over the same period used in the interest cost determination.
BANCO HIPOTECARIO SA AND SUBSIDIARIES NOTES TO THE CONSOLIDATED FINANCIAL STATEMENTS As of and for the twelve-month periods ended June 30, 2016, 2015 and 2014 (Expressed in thousands of Argentine pesos, except share data and as otherwise indicated)
Subordinated bonds On June 22, 2015 BACS Banco de Crédito y Securitización S.A., issued negotiable obligations that are convertible into the Company’s ordinary and book-entry shares for a principal amount of Ps.100,000. The private offering of the convertible negotiable obligations was solely addressed to the Company’s shareholders. IRSA Inversiones y Representaciones Sociedad Anónima subscribed all the convertible negotiable obligations. Under Argentine Banking GAAP the subordinated negotiable obligations have been recorded at their residual value plus interests accrued. According to ASC 470-20-25-5, an embedded beneficial conversion feature present in a convertible instrument shall be recognized separately at issuance by allocating a portion of the proceeds equal to the intrinsic value of that feature to additional paid in capital. As of June 30, 20152016 and 20142015 the shareholder’s equity adjustment, for both concepts, amounts to Ps. 10,28287,863 and Ps. 7,573,10,282, respectively.
g.f. Securitizations
For Argentine Banking GAAP purposes, the debt securities and certificates retained by the Bank are accounted for at cost plus accrued interest for the debt securities, and the equity method is used to account for the residual interest in the trust.
Under U.S. GAAP the primary beneficiary of a variable interest entity (VIE) is required to consolidate its assets and liabilities. An entity is considered a VIE if it possesses one of the following characteristics: BANCO HIPOTECARIO SA AND SUBSIDIARIES
NOTES TO THE CONSOLIDATED FINANCIAL STATEMENTS
As of and for the twelve-month periods ended June 30, 2015, 2014 and 2013●
(Expressed in thousands of Argentine pesos, except share data and as otherwise indicated)
Insufficient Equity Investment at Risk
● · | Insufficient Equity Investment at Risk |
Equity lacks decision-making rights· | Equity lacks decision-making rights |
● · | Equity with non-substantive voting rights |
Equity with non-substantive voting rights· | Lacking the obligation to Absorb an Entity´s Expected Losses |
● · | Lacking the right to receive an Entity´s expected residual returns |
Lacking the obligation to Absorb an Entity´s Expected Losses● Lacking the right to receive an Entity´s expected residual returns The primary beneficiary is the party that has both (1) the power to direct the activities of an entity that most significantly impact the VIE’s economic performance; and (2) through its interests in the VIE, the obligation to absorb losses or the right to receive benefits from the VIE that could potentially be significant to the VIE.
To assess whether the Bank has the power to direct the activities of a VIE that most significantly impact the VIE’s economic performance, the Bank considers all facts and circumstances, including its role in establishing the VIE and its ongoing rights and responsibilities. This assessment includes, first, identifying the activities that most significantly impact the VIE’s economic performance; and second, identifying which party, if any, has power over those activities.
As a consequence of this assessment, the Bank was deemed to be the primary beneficiary of certain securitization trusts because the Bank has the power to direct the activities of these VIEs through its servicing responsibilities and duties. Additionally, the Bank through its retained interests held in these securitizations has the obligation to absorb losses or the right to receive benefits from the VIEs.
For U.S. GAAP purposes, as of June 30, 2015, 20142016 and 2013,2015, the Bank consolidated certain VIE’s in which the Bank had a controlling financial interest and for which it is the primary beneficiary. Therefore, the Bank reconsolidated their net assets, eliminated the gain or loss recognized on the sale of receivables when the carrying value of transferred credit card receivables differs from the amount of cash and certificates of participation received, eliminated the servicing liabilities and re-established its loan loss reserves under ASC 450-20. See note 33.b. for allowance for loan losses.
BANCO HIPOTECARIO SA AND SUBSIDIARIES NOTES TO THE CONSOLIDATED FINANCIAL STATEMENTS As of and for the twelve-month periods ended June 30, 2016, 2015 and 2014 (Expressed in thousands of Argentine pesos, except share data and as otherwise indicated)
No servicing assets or liabilities have been recognized.
The total shareholders’ equity adjustment between Argentine Banking GAAP and U.S. GAAP as of June 30, 20152016 and 20142015 amounted to Ps. (15,442)(56,693) and Ps. (31,876)(15,442), respectively.
Additional information required by U.S. GAAP
The Bank adopted ASC 860-10 and ASC 810-10 which require additional disclosures about its involvement with consolidated VIE’s and expanded the population of VIE’s to be disclosed. The table below presents the assets and liabilities of the financial trusts which have been consolidated for U.S. GAAP purposes:
| | June 30, | | | 2016 | | 2015 | | | | | | | | | Cash and due from banks | Ps. | 224, 065 | | Ps. | 88,236 | | Loans (net of allowances) | | 4,425,255 | | | 2,235,655 | | Other assets | | 1,181,403 | | | 1,149,023 | | Total Assets | Ps. | 5,830,723 | | Ps. | 3,472,914 | | | | | | | | | Debt Securities | Ps. | 4,575,569 | | Ps. | 2,868,064 | | Certificates of Participation | | 1,062,201 | | | 451,365 | | Other liabilities | | 192,953 | | | 153,485 | | Total Liabilities | Ps. | 5,830,723 | | Ps. | 3,472,914 |
BANCO HIPOTECARIO SA AND SUBSIDIARIES
NOTES TO THE CONSOLIDATED FINANCIAL STATEMENTS
As of and for the twelve-month periods ended June 30, 2015, 2014 and 2013
(Expressed in thousands of Argentine pesos, except share data and as otherwise indicated)
| | June 30, | | | | 2015 | | 2014 | | | | | | | | | | | Cash and due from banks | | Ps. | 88,236 | | | Ps. | 103,693 | | | Loans (net of allowances) | | | 2,235,655 | | | | 1,771,175 | | | Other assets | | | 1,149,023 | | | | 826,795 | | | Total Assets | | Ps. | 3,472,914 | | | Ps. | 2,701,663 | | | | | | | | | | | | | Debt Securities | | Ps. | 2,868,064 | | | Ps. | 2,214,488 | | | Certificates of Participation | | | 451,365 | | | | 427,246 | | | Other liabilities | | | 153,485 | | | | 59,929 | | | Total Liabilities | | Ps. | 3,472,914 | | | Ps. | 2,701,663 | |
As of June 30, 2015,2016, the Bank’s maximum loss exposure, which amounted to Ps. 3,472,914,5,830,723, is based on the unlikely event that all of the assets in the VIE’s become worthless and incorporates potential losses associated with assets recorded on the Bank’s Balance Sheet. Nevertheless, under Argentine Law the Debt securities will be paid exclusively with the securitized assets.
h.g. Intangible Assets
Software costs
Under Argentine Banking GAAP fees paid for a re-engineering project and for restructuring expenses incurred in relation to certain equity transactions are recognized as an intangible asset and amortized in a maximum of five years. Such cost should be expensed as incurred under U.S. GAAP.
Under Argentine Banking GAAP, the Bank capitalizes costs relating to all three of the stages of software development. Under ASC 350-40 defines three stages for the costs of computer software developed or obtained for internal use: the preliminary project stage, the application development stage and the post-implementation operation stage. Only the second stage costs should be capitalized.
Shareholders’ equity adjustment between Argentine Banking GAAP and U.S. GAAP as of June 30, 20152016 and 20142015 amounted to Ps. (63,888)(62,366) and Ps. (37,363)(63,888), respectively.
Other intangible assets
BANCO HIPOTECARIO SA AND SUBSIDIARIES NOTES TO THE CONSOLIDATED FINANCIAL STATEMENTS As of and for the twelve-month periods ended June 30, 2016, 2015 and 2014 (Expressed in thousands of Argentine pesos, except share data and as otherwise indicated)
On January 13, 2011, Tarshop S.A. acquired from APSA Media S.A., previously Metroshop S.A., a portfolio of credit cards delinquent by less than 60 days; a contractual position in contracts for the issuance of credit cards; the accounts of customers, the lease agreements and movable property at certain branches and the contracts of employment with personnel under a labor relationship.
Under Argentine Banking GAAP, no intangible assets should be recognized in accordance with these transactions.
Under U.S. GAAP, ASC 350-30 defines that an intangible asset which is acquired either individually or with a group of other assets shall be recognized. Assets are recognized based on their cost to the acquiring entity, which generally includes the transaction costs of the assets acquisition, and no gain or loss is recognized unless the fair value of noncash assets given as consideration differs the assets’ carrying amount on the acquiring entity’s books. The cost of a BANCO HIPOTECARIO SA AND SUBSIDIARIES
NOTES TO THE CONSOLIDATED FINANCIAL STATEMENTS
As of and for the twelve-month periods ended June 30, 2015, 2014 and 2013
(Expressed in thousands of Argentine pesos, except share data and as otherwise indicated)
group of assets acquired shall be allocated to the individual assets acquired or liabilities assumed based on their relative fair values and shall not give rise to goodwill.
Shareholders’ equity adjustment between Argentine Banking GAAP and U.S. GAAP as of June 30, 2015 and 2014 amounted to Ps. (59) and Ps. 3,097,, respectively, related to the contractual position in contracts for the issuance of credit cards and the accounts of customers recorded as intangibles assets for U.S. GAAP purposes.
Business combination
i) Acquisition of Tarshop S.A.
On August 30, 2010, the Financial and Exchange Institutions Superintendency of the Argentine Central Bank gave its consent to the purchase of 80% of the share capital of Tarshop SA. Such shareholding consists of 107,037,152 non-endorsable, registered ordinary shares, par value 1 Peso per share, and entitled to one vote per share, in turn equivalent to 107,037,152 votes.
The sales price amounted to US$ 26.8 million, of which 20% (US$ 5.4 million) was paid on December 29, 2009 and the remaining balance of the price was cancelled on September 13, 2010.
Pursuant to Argentine Central Bank rules, and due to the difference between the acquisition cost and the estimated fair value of assets and liabilities acquired, a goodwill amounting to Ps. 29,568 was recorded under Intangible Assets – Goodwill. This goodwill is subsequently charged to Income on a straight-line basis during 60 months. As of June 30, 20152016 and 20142015 the Bank has a balance of Ps. 15,27712,320 and Ps. 18,234,15,277, respectively, related to the goodwill.
Under U.S. GAAP, ASC 805 requires the acquisition of controlling interest of Tarshop S.A. to be accounted for as a business combination applying the purchase method, recognizing all net assets acquired at their fair value.
| The intangible assets identified as part of the acquisition where customer relationships, trademark and workforce amounted to Ps. 24,394 as of August 31, 2010 subject to amortization. |
ii) Acquisition of BACS Administradora de activos S.A. S.G.F.C.I.
On April 26, 2012 BACS Banco de Crédito y Securitización S.A. acquired 85% of the shares belonging to BACS Administradora de activos S.A. S.G.F.C.I. (former FCMI Argentina Financial Corporation S.A. S.G.F.C.I.). The purchase price was Ps. 6 million.
Pursuant to Argentine Central Bank rules, and due to the difference between the acquisition cost and the estimated fair value of assets and liabilities acquired as of April 30, 2012, a goodwill amounting to Ps. 4,728 was recorded under Intangible Assets – Goodwill. This goodwill is subsequently charged to income on a straight-line basis during 120 months. As of June 30, 20152016 and 20142015 the Bank recorded such balance which amounted to Ps. 3,2312,758 and Ps. 3,704,3,231, respectively.
BANCO HIPOTECARIO SA AND SUBSIDIARIES NOTES TO THE CONSOLIDATED FINANCIAL STATEMENTS As of and for the twelve-month periods ended June 30, 2016, 2015 and 2014 (Expressed in thousands of Argentine pesos, except share data and as otherwise indicated)
Under U.S. GAAP, ASC 805 requires the acquisition of controlling interest of BACS Administradora de activos S.A. S.G.F.C.I. (former FCMI Argentina Financial Corporation S.A. S.G.F.C.I.) to be accounted for as a business combination applying the purchase method, recognizing all net assets acquired at their fair value.
Goodwill amortization, under Argentine Banking GAAP has been reversed for U.S. GAAP purposes. BANCO HIPOTECARIO SA AND SUBSIDIARIES
NOTES TO THE CONSOLIDATED FINANCIAL STATEMENTS
As of and for the twelve-month periods ended June 30, 2015, 2014 and 2013
(Expressed in thousands of Argentine pesos, except share data and as otherwise indicated)
i. h.Impairment of fixed assets and foreclosed assets
Under Argentine Banking GAAP, fixed assets and foreclosed assets are restated for inflation using the WPI index at February 28, 2003. As such, the balances of fixed assets and foreclosed assets were increased approximately 120%.
In accordance with ASC 360-10 such assets are subject to impairment tests in certain circumstances. Because projected cash flows associated with fixed assets and foreclosed assets are insufficient to recover the restated carrying amounts of the assets, those assets should be tested for impairment. During 2002, in the absence of credible market values for our fixed and foreclosed assets, the Bank under U.S. GAAP reversed the restatement of fixed and foreclosed assets.
Long-lived assets are reviewed for impairment whenever events or changes in circumstances indicate that the carrying amount may not be recoverable.
As of June 20152016 and 2014,2015, no additional impairment was recorded in fixed and foreclosed assets.
Shareholders’ equity adjustment between Argentine Banking GAAP and U.S. GAAP as of June 30, 20152016 and 20142015 amounted to Ps. (37,379)(36,263) and Ps. (38,323)(37,379), respectively. The differences between periods are due to depreciation recorded under Argentine Banking GAAP.
j.i. Non-controlling interest
Argentine Banking GAAP rules require recording non-controlling interests as a component of the liabilities. ASC 810 requires recording such interests as shareholders’ equity. In addition, the U.S. GAAP adjustment represents the allocation to the non-controlling interest of non-wholly owned subsidiaries of certain U.S. GAAP adjustments related to such subsidiaries.
k.j. Vacation Provision
The Bank’s policy for vacation benefits is to expense such benefits as taken. For U.S. GAAP purposes, the vacation accrual is based on an accrual basis, where earned but untaken vacation is recognized as a liability.
Shareholders’ equity adjustment between Argentine Banking GAAP and U.S. GAAP as of June 30, 20152016 and 20142015 amounted to Ps. (57,634)(74,644) and Ps. (40,332)(57,634), respectively.
l.k. Insurance Technical reserve
BANCO HIPOTECARIO SA AND SUBSIDIARIES NOTES TO THE CONSOLIDATED FINANCIAL STATEMENTS As of and for the twelve-month periods ended June 30, 2016, 2015 and 2014 (Expressed in thousands of Argentine pesos, except share data and as otherwise indicated)
Until September 2003, the calculation of the local technical reserves performed by the Bank was the same as that used under U.S. GAAP.
On September 2003, the National Insurance Superintendency issued certain regulations on the calculation of reserves introducing changes to the local regulations. ForFor U.S. GAAP purposes the Bank has accounted these insurance technical reserves under ASC 944.
Therefore, the technical reserves for the twelve-month periods ended June 30, 20152016 and 20142015 were adjusted for U.S. GAAP purposes. Shareholders’ equity adjustment as of June 30, 20152016 and 20142015 amounted to Ps. (339)(1,299) and Ps. (3,119)(339), respectively.respectively.
m.l. Capitalization of interest cost
Under Argentine Banking GAAP, during the process of construction of an asset the capitalization of interest is not recognized. BANCO HIPOTECARIO SA AND SUBSIDIARIES
NOTES TO THE CONSOLIDATED FINANCIAL STATEMENTS
As of and for the twelve-month periods ended June 30, 2015, 2014 and 2013
(Expressed in thousands of Argentine pesos, except share data and as otherwise indicated)
For U.S. GAAP purposes, as stated in ASC 835-20 the amount of interest cost to be capitalized for qualifying assets is intended to be that portion of the interest cost incurred during the assets’ acquisition periods that theoretically could have been avoided (for example, by avoiding additional borrowings or by using the funds expended for the assets to repay existing borrowings) if expenditures for the assets had not been made.
The amount capitalized in an accounting period shall be determined by applying an interest rate to the average amount of accumulated expenditures for the asset during the period. The capitalization rates used in an accounting period shall be based on the rates applicable to borrowings outstanding during the period. The total amount of interest cost capitalized in an accounting period shall not exceed the total amount of interest cost incurred by the enterprise in that period. Shareholders’ Equity adjustment between Argentine Banking GAAP and U.S. GAAP as of June 30, 2015 and 2014 amounted to Ps. 4,001, and Ps. 3,226, respectively. m. Financial guarantees issued During the twelve-month period ended June 30, 2016, the Bank entered into different agreements to guarantee lines of credit of selected customers. As of June 30, 2016, guarantees granted by the Bank amounted to Ps. 463,107. Under Argentine Banking GAAP the guarantees are recorded in memorandum accounts. As of June 30, 2016, for U.S. GAAP purposes the Bank recognized a liability for the fair value of the obligations assumed at its inception in accordance with the requirements of ASC 460. Such liabilities are being amortized over the expected term of the guarantee. As of June 30, 2016, the fair value of the guarantees less the estimated proceeds from collateral amounted to Ps. (1,209). As of June 30, 2016, the Bank maintained the following guarantees: | | As of June 30, 2016 | | | Maximum Potential Payments (*) | | Estimated Proceeds from collateral resource | | U.S. GAAP adjustment | | Financial guarantees | Ps. | 463,107 | | Ps. | 4,398 | | Ps. | (1,209) | | | Ps. | 463,107 | | Ps. | 4,398 | | Ps. | (1,209) |
(*) The maximum potential payments represent a “worse-case scenario”, and do not necessarily reflect expected results. Estimated proceeds from collateral and recourse represent the anticipated value of assets that could be liquidated or received from other parties to offset the Company’s payments under guarantees.
BANCO HIPOTECARIO SA AND SUBSIDIARIES NOTES TO THE CONSOLIDATED FINANCIAL STATEMENTS As of and for the twelve-month periods ended June 30, 2016, 2015 and 2014 (Expressed in thousands of Argentine pesos, except share data and as otherwise indicated)
n. Miscellaneous assets Under Argentine Banking GAAP, the stock of forms, books, prints, stationery and other assets of a similar nature the entity has to be used in the future, are booked under the caption “Miscellaneous assets”. For U.S. GAAP purposes, the amounts expensed in these items should be recognized as a cost incurred during the period. Shareholders’ equity adjustment between Argentine Banking GAAP and U.S. GAAP as of June 30, 2016 amounted to Ps. (30,848). o. Deferred Income Tax
Argentine Banking GAAP requires income taxes to be recognized on the basis of amounts due in accordance with Argentine tax regulations. Temporary differences between the financial reporting and income tax bases of accounting are therefore not considered in recognizing income taxes. In accordance with ASC 740-10 under U.S. GAAP income taxes are recognized on the liability method whereby deferred tax assets and liabilities are established for temporary differences between the financial reporting and tax bases of our assets and liabilities. Deferred tax assets are also recognized for tax loss carryforwards. Deferred tax assets and liabilities are measured using enacted tax rates expected to apply to taxable income in the years in which those temporary differences are expected to be recorded or settled. The effect on deferred tax assets and liabilities of a change in tax rates is recognized in income in the period that includes the enactment date. A valuation allowance is recognized for that component of net deferred tax assets which is “more likely than not” that it will not be recoverable.
As of June 30, 20152016 and 2014,2015, and based on the tax projections performed, the Bank believes that is more likely than not that it will recover the net operating tax loss carry forward and all the temporary differences, with future taxable income.
In a consolidated basis, the Bank has recognized a shareholders’ equity adjustment between Argentine Banking GAAP and U.S. GAAP that amounted to Ps. 258,903352,931 and Ps. 214,230,258,903, as of June 30, 20152016 and 2014,2015, respectively.
ASC 740 prescribes a comprehensive model for the recognition, measurement, financial statement presentation and disclosure of uncertain tax positions taken or expected to be taken in a tax return. Additionally, it provides guidance on derecognition, classification, interest and penalties, accounting in interim periods, disclosure and transition. As of June 30, 2015,2016, there were no uncertain tax positions.
The Bank classifies income tax-related interest and penalties as income taxes in the financial statements. The adoption of this pronouncement had no effect on the Bank’s overall financial position or results of operations.
The following table shows the tax years open for examination as of June 30, 2015,2016, by major tax jurisdictions in which the Bank operates: F-338BANCO HIPOTECARIO SA AND SUBSIDIARIES
NOTES TO THE CONSOLIDATED FINANCIAL STATEMENTSAs of and for the twelve-month periods ended June 30, 2016, 2015 and 2014 (Expressed in thousands of Argentine pesos, except share data and as otherwise indicated)
Jurisdiction | | Tax year | | | Argentina | | | 20102011 – 2014 | 2015 |
o.
p. Items in process of collection
The Bank does not give accounting recognition to checks drawn on the Bank or other banks, or other items to be collected until such time as the related item clears or is accepted. Such items are recorded by the Bank in memorandum accounts. U.S. banks, however, account for such items through balance sheet clearing accounts at the time the items are presented to the Bank.
The Bank’s assets and liabilities would be increased by approximately Ps. 137,944234,515 and Ps. 163,304,137,944, had U.S. GAAP been applied at June 30, 20152016 and 2014,2015, respectively.
| Additional disclosure requirements: |
Additional disclosure requirements:
p.
q. Fair Value Measurements Disclosures
ASC 820-10 defines fair value as the price that would be received to sell an asset or paid to transfer a liability in an orderly transaction between market participants at the measurement date. Effective January 2010, the Bank adopted new accounting guidance under ASC 820 that requires additional disclosures including, among other things, (i) the amounts and reasons for certain significant transfers among the three hierarchy levels of inputs, (ii) the gross, rather than net, basis for certain level 3 roll forward information, (iii) use of a “class” rather than a “major category” basis for assets and liabilities, and (iv) valuation techniques and inputs used to estimate level 2 and level 3 fair value measurements. In addition, ASC 820-10 establishes a three-level valuation hierarchy for disclosure of fair value measurements. The valuation hierarchy is based upon the transparency of inputs to the valuation of an asset or liability as of the measurement date. The three levels are defined as follows.
· | Level 1 – inputs to the valuation methodology are quoted prices (unadjusted) for identical assets or liabilities in active markets. |
●
Level 1 – inputs to the valuation methodology are quoted prices (unadjusted) for identical assets or liabilities in active markets.
· | Level 2 – inputs to the valuation methodology include quoted prices for similar assets and liabilities in active markets, and inputs that are observable for the asset or liability, either directly or indirectly, for substantially the full term of the financial instrument. |
● · | Level 3 – inputs to the valuation methodology are unobservable and significant to the fair value measurement. |
Level 2 – inputs to the valuation methodology include quoted prices for similar assets and liabilities in active markets, and inputs that are observable for the asset or liability, either directly or indirectly, for substantially the full term of the financial instrument.
● Level 3 – inputs to the valuation methodology are unobservable and significant to the fair value measurement. A financial instrument’s categorization within the valuation hierarchy is based upon the lowest level of input that is significant to the fair value measurement.
Determination of fair value
Fair value is based upon quoted market prices, where available. If listed prices or quotes are not available, fair value is based upon internally developed models that use primarily market-based or independently-sourced market parameters, including interest rate yield curves, option volatilities and currency rates. Valuation adjustments may be made to ensure that financial instruments are recorded at fair value. These adjustments include amounts to reflect counterparty credit quality, the Bank’s creditworthiness, liquidity and unobservable parameters that are applied consistently over time.
BANCO HIPOTECARIO SA AND SUBSIDIARIES NOTES TO THE CONSOLIDATED FINANCIAL STATEMENTS As of and for the twelve-month periods ended June 30, 2016, 2015 2014 and 20132014 (Expressed in thousands of Argentine pesos, except share data and as otherwise indicated)
The Bank believes its valuation methods are appropriate and consistent with other market participants, the use of different methodologies, or assumptions, to determine the fair value of certain financial instruments could result in a different estimate of fair value at the reporting date.
The following section describes the valuation methodologies used by the Bank to measure various financial instruments at fair value, including an indication of the level in the fair-value hierarchy in which each instrument is generally classified. Where appropriate, the description includes details of the valuation models, the key inputs to those models as well as any significant assumptions.
Assets (by Class of asset)
Securities
As of June 30, 20152016 and 20142015 the Bank’s securities are classified within level 1of the valuation hierarchy using quoted prices available in the active market. Level 1 securities includes government bonds and instruments issued by BCRA and corporate securities. Furthermore the Bank´s instruments issued by BCRA with no volatility published by the BCRA and bills issued by Provincial Governments are classified within Level 2 using quoted prices available of similar assets.
| Securities receivable under repurchase agreements |
Securities receivable under repurchase agreements
The Bank’s securities receivable under repurchase agreements which do not qualify for sale accounting for U.S. GAAP purposes, are classified within level 1 of the valuation hierarchy. To estimate the fair value of these securities, quoted prices are available in an active market.
Derivatives
The fair value of level 1 derivative positions are determined using quoted market prices. The fair value of level 2 derivative positions are determined using internally developed models that utilize market observable parameters.
Liabilities (by Class of liability)
Derivatives
The fair value of level 1 derivative positions are determined using quoted market prices.
The following table presents the financial instruments, by class of asset and liabilities, carried at fair value as of June 30, 20152016 and 2014,2015, by ASC 820-10 valuation hierarchy (as described above).
BANCO HIPOTECARIO SA AND SUBSIDIARIES NOTES TO THE CONSOLIDATED FINANCIAL STATEMENTS As of and for the twelve-month periods ended June 30, 2016, 2015 2014 and 20132014 (Expressed in thousands of Argentine pesos, except share data and as otherwise indicated)
| | | Balances as of June 30, 2015 | | Balances as of June 30, 2016 | | | | Total carrying value | | | Quoted market prices in active markets (Level 1) | | | Internal models with significant observable market parameters (Level 2) | | | Internal models with significant unobservable market parameters (Level 3) | | Total carrying value | Quoted market prices in active markets (Level 1) | Internal models with significant observable market parameters (Level 2) | Internal models with significant unobservable market parameters (Level 3) | | ASSETS | | | | | | | | | | | | | | | | | | | | | | | | | | | | | | | | | | Government and corporate securities | | | | | | | | | | | | | | | | | Trading securities | | | 1,244,278 | | | | 1,244,278 | | | | - | | | | - | | 2,592,155 | 2,592,155 | - | - | | Available for sale securities | | | 1,210,421 | | | | 729,986 | | | | 480,435 | | | | - | | 894,122 | 727,009 | 167,113 | - | | Instruments issued by the BCRA | | | 2,422,813 | | | | 672,239 | | | | 1,750,574 | | | | - | | 1,296,723 | 1,263,657 | 33,066 | - | | Corporate securities | | | 430,855 | | | | 430,855 | | | | - | | | | - | | 490,538 | 490,538 | - | - | | | | | | | | | | | | | | | | | | | | | | | Other receivables from financial transactions | | | | | | | | | | | | | | | | | | | | | Trading securities | | | 231,366 | | | | 231,366 | | | | - | | | | - | | 903,031 | 903,031 | - | - | | Available for sale securities | | | 231,400 | | | | 231,117 | | | | 283 | | | | - | | 260,298 | 260,298 | - | - | | Futures | | | 182 | | | | 182 | | | | - | | | | - | | 50,637 | 50,637 | - | - | | Interest rate swaps | | | 575 | | | | 575 | | | | - | | | | - | | | | | | | | | | | | | | | | | | | | | | | | | Miscellaneous assets | | | | | | | | | | | | | | | | | | | | | Trading securities | | | 162,759 | | | | 162,759 | | | | - | | | | - | | 14,350 | 14,350 | - | - | | | | | | | | | | | | | | | | | | | | | | | TOTAL ASSETS AT FAIR VALUE | | | 5,934,649 | | | | 3,703,357 | | | | 2,231,292 | | | | - | | 6,501,854 | 6,301,675 | 200,179 | - | | | | | | | | | | | | | | | | | | | | | | | LIABILITIES | | | | | | | | | | | | | | | | | | | | | | | | | | | | | | | | | | | | | | | | | | | | | | | | | | | | | | | | | | | | | Other obligations from financial transactions | | | | | | | | | | | | | | | | | | | | | Trading securities | | | (105,684 | ) | | | (105,684 | ) | | | - | | | | - | | (792,149) | (792,149) | - | - | | Available for sale securities | | | (247,143 | ) | | | (247,143 | ) | | | - | | | | - | | (71,880) | (53,307) | (18,573) | - | | Futures | | | (687 | ) | | | (687 | ) | | | - | | | | - | | (37,864) | (37,864) | - | - | | Interest rate swaps | | | (512 | ) | | | (512 | ) | | | - | | | | - | | | | | | | | | | | | | | | | | | | | | | | | | Deposits | | | | | | | | | | | | | | | | | | | | | Trading securities | | | (99,515 | ) | | | (99,515 | ) | | | - | | | | - | | (776,687) | (776,687) | - | - | | Available for sale securities | | | (16,288 | ) | | | (16,288 | ) | | | - | | | | - | | | | | | | | | | | | | | | | | | | | | | | | | TOTAL LIABILITIES AT FAIR VALUE | | | (469,829 | ) | | | (469,829 | ) | | | - | | | | - | | (1,678,580) | (1,660,007) | (18,573) | - |
BANCO HIPOTECARIO SA AND SUBSIDIARIES NOTES TO THE CONSOLIDATED FINANCIAL STATEMENTS As of and for the twelve-month periods ended June 30, 2016, 2015 2014 and 20132014 (Expressed in thousands of Argentine pesos, except share data and as otherwise indicated)
| | | Balances as of June 30, 2014 | | Balances as of June 30, 2015 | | | | Total carrying value | | | Quoted market prices in active markets (Level 1) | | | Internal models with significant observable market parameters (Level 2) | | | Internal models with significant unobservable market parameters (Level 3) | | Total carrying value | Quoted market prices in active markets (Level 1) | Internal models with significant observable market parameters (Level 2) | Internal models with significant unobservable market parameters (Level 3) | | ASSETS | | | | | | | | | | | | | | | | | | | | | | | | | | | | | | | | | | Government and corporate securities | | | | | | | | | | | | | | | | | Trading securities | | | 1,316,864 | | | | 1,316,864 | | | | - | | | | - | | 1,244,278 | 1,244,278 | - | - | | Available for sale securities | | | 486,322 | | | | 437,566 | | | | 48,756 | | | | - | | 1,210,421 | 729,986 | 480,435 | - | | Instruments issued by the BCRA | | | 1,704,354 | | | | 354,542 | | | | 1,349,812 | | | | - | | 2,422,813 | 672,239 | 1,750,574 | - | | Corporate securities | | | 345,565 | | | | 345,565 | | | | - | | | | - | | 430,855 | 430,855 | - | - | | | | | | | | | | | | | | | | | | | | | | | Other receivables from financial transactions | | | | | | | | | | | | | | | | | | | | | Trading securities | | | 1,279 | | | | 1,279 | | | | - | | | | - | | 231,366 | 231,366 | - | - | | Available for sale securities | | | 58,015 | | | | 58,015 | | | | - | | | | - | | 231,400 | 231,117 | 283 | - | | Forwards | | | 33,794 | | | | - | | | | 33,794 | | | | - | | | | Futures | | | 6,766 | | | | 6,766 | | | | - | | | | - | | 182 | 182 | - | - | | Interest rate swaps | | 575 | 575 | - | - | | | | | | | | Miscellaneous assets | | | | | | Trading securities | | 162,759 | 162,759 | - | - | | | | | | | | | | | | | | | | | | | | | | | TOTAL ASSETS AT FAIR VALUE | | | 3,952,959 | | | | 2,520,597 | | | | 1,432,362 | | | | - | | 5,934,649 | 3,703,357 | 2,231,292 | - | | | | | | | | | | | | | | | | | | | | | | | LIABILITIES | | | | | | | | | | | | | | | | | | | | | | | | | | | | | | | | | | | | | | | | | | Other obligations from financial transactions | | | | | | | | | | | | | | | | | | | | | Trading securities | | (105,684) | (105,684) | - | - | | Available for sale securities | | (247,143) | (247,143) | - | - | | Futures | | | (7,911 | ) | | | (7,911 | ) | | | - | | | | - | | (687) | (687) | - | - | | Interest rate swaps | | (512) | (512) | - | - | | | | | | | | Deposits | | | | | | Trading securities | | (99,515) | (99,515) | - | - | | Available for sale securities | | (16,288) | (16,288) | - | - | | | | | | | | | | | | | | | | | | | | | | | TOTAL LIABILITIES AT FAIR VALUE | | | (7,911 | ) | | | (7,911 | ) | | | - | | | | - | | (469,829) | (469,829) | - | - |
q. Credit Risk disclosures
Allowance for credit losses and recorded investments in financial receivables
The following table presents the allowance for account receivables losses and the related carrying amount of Financing Receivables for the periods ended June 30, 20152016 and 20142015 respectively: | | As of June 30, 2016 | | | Consumer Loan Portfolio | | Commercial Loan Portfolio | | Total | | Allowance for credit losses: | | | | | | | | | | Ending balance: individually evaluated for impairment | Ps. | - | | Ps. | 19,621 | | Ps. | 19,621 | | Ending balance: collectively evaluated for impairment | | 920,175 | | | 3,962 | | | 924,137 | | Ending Balance | Ps. | 920,175 | | Ps. | 23,583 | | Ps. | 943,758 | | Financing receivables: | | | | | | | | | | Ending balance: individually evaluated for impairment | Ps. | - | | Ps. | 21,635 | | Ps. | 21,635 | | Ending balance: collectively evaluated for impairment | | 19,821,668 | | | 7,646,522 | | | 27,468,190 | | Ending Balance | Ps. | 19,821,668 | | Ps. | 7,668,157 | | Ps. | 27,489,825 |
| | As of June 30, 2015 | | | | Consumer Loan Portfolio | | Commercial Loan Portfolio | | Total | | | Allowance for credit losses: | | | | | | | | | | | Ending balance: individually evaluated for impairment | | Ps. | - | | | Ps. | 26,410 | | | Ps. | 26,410 | | | Ending balance: collectively evaluated for impairment | | | 683,323 | | | | 25,202 | | | | 708,525 | | | Ending Balance | | Ps. | 683,323 | | | Ps. | 51,612 | | | Ps. | 734,935 | | | Financing receivables: | | | | | | | | | | | | | | Ending balance: individually evaluated for impairment | | | - | | | Ps. | 44,496 | | | Ps. | 44,496 | | | Ending balance: collectively evaluated for impairment | | | 15,266,470 | | | | 6,853,897 | | | | 22,120,367 | | | Ending Balance | | Ps. | 15,266,470 | | | Ps. | 6,898,393 | | | Ps. | 22,164,863 | |
BANCO HIPOTECARIO SA AND SUBSIDIARIES NOTES TO THE CONSOLIDATED FINANCIAL STATEMENTS As of and for the twelve-month periods ended June 30, 2016, 2015 2014 and 20132014 (Expressed in thousands of Argentine pesos, except share data and as otherwise indicated)
| | As of June 30, 2014 | | As of June 30, 2015 | | | Consumer Loan Portfolio | | Commercial Loan Portfolio | | Total | | Consumer Loan Portfolio | | Commercial Loan Portfolio | | Total | | Allowance for credit losses: | | | | | | | | | | | | | | | | | | | Ending balance: individually evaluated for impairment | | Ps. | - | | | Ps. | 11,296 | | | Ps. | 11,296 | | Ps. | - | | Ps. | 26,410 | | Ps. | 26,410 | | Ending balance: collectively evaluated for impairment | | | 581,920 | | | | 3,440 | | | | 585,360 | | | 683,323 | | | 25,202 | | | 708,525 | | Ending Balance | | Ps. | 581,920 | | | Ps. | 14,736 | | | Ps. | 596,656 | | Ps. | 683,323 | | Ps. | 51,612 | | Ps. | 734,935 | | Financing receivables: | | | | | | | | | | | | | | | | | | | | | | Ending balance: individually evaluated for impairment | | Ps. | - | | | Ps. | 24,323 | | | Ps. | 24,323 | | Ps. | - | | Ps. | 44,496 | | Ps. | 44,496 | | Ending balance: collectively evaluated for impairment | | | 11,592,745 | | | | 6,182,266 | | | | 17,775,011 | | | 15,266,470 | | | 6,853,897 | | | 22,120,367 | | Ending Balance | | Ps. | 11,592,745 | | | Ps. | 6,206,589 | | | Ps. | 17,799,334 | | Ps. | 15,266,470 | | Ps. | 6,898,393 | | Ps. | 22,164,863 |
The activity in the allowance for loan losses for period is as follows:
| | As of June 30, | | As of June 30, | | | 2015 | | 2014 | | 2016 | | 2015 | | Allowance for credit losses: | | | | | | | | | | | | | Beginning Balance | | Ps. | 596,656 | | | Ps. | 508,654 | | Ps. | 734,935 | | Ps. | 596,656 | | Charge-offs | | | (267,694 | ) | | | (245,023 | ) | | (177,834) | | | (267,694) | | Provision for loan losses | | | 405,973 | | | | 333,025 | | | 386,657 | | | 405,973 | | Ending Balance | | Ps. | 734,935 | | | Ps. | 596,656 | | Ps. | 943,758 | | Ps. | 734,935 |
Account receivable charge-off and recoveries
Under Argentine GAAP, recoveries on previously charge-off account receivable are recorded directly to income and the amount of charge-off account receivable in excess of amounts specifically allocated is recorded as a direct charge to the income statement. The Bank does not partially charge off troubled account receivable until final disposition of the credit, rather, the allowance is maintained on a credit-by –credit basis for its estimated settlement value. Under U.S. GAAP, all charge off and recovery activity is recorded through the allowance for account receivable losses account. Further, account receivables are generally charged to the allowance account when all or part of the credit is considered uncollectible.
Impaired loans
ASC 310, requires a creditor to measure impairment of a loan based on the present value of expected future cash flows discounted at the loan’s effective interest rate, or at the loan’s observable market price or the fair value of the collateral if the loan is collateral dependent. This Statement is applicable to all loans (including those restructured in a troubled debt restructuring involving amendment of terms), except large groups of smaller-balance homogenous loans that are collectively evaluated for impairment. Loans are considered impaired when, based on Management’s evaluation, a borrower will not be able to fulfill its obligation under the original loan terms.
BANCO HIPOTECARIO SA AND SUBSIDIARIES NOTES TO THE CONSOLIDATED FINANCIAL STATEMENTS As of and for the twelve-month periods ended June 30, 2016, 2015 and 2014 (Expressed in thousands of Argentine pesos, except share data and as otherwise indicated)
The following table discloses the amounts of loans considered impaired in accordance with ASC 310 updated by ASU 2010 - 20, as of June 30, 20152016 and 2014:
2015:
| | As of June 30, 2016 | | | Recorded Investment | | Unpaid Principal Balance | | Related Allowance | | With no related allowance recorded: | | | | | | | | | | Commercial | | | | | | | | | | Impaired Loans | Ps. | - | | Ps. | - | | Ps. | - | | | | | | | | | | | | With an allowance recorded: | | | | | | | | | | Commercial | | | | | | | | | | Impaired Loans | Ps. | 21,635 | | Ps. | 18,389 | | Ps. | 19,621 | | Total | Ps. | 21,635 | | Ps. | 18,389 | | Ps. | 19,621 |
BANCO HIPOTECARIO SA AND SUBSIDIARIES
NOTES TO THE CONSOLIDATED FINANCIAL STATEMENTS
As of and for the twelve-month periods ended June 30, 2015, 2014 and 2013
(Expressed in thousands of Argentine pesos, except share data and as otherwise indicated)
| | As of June 30, 2015 | | | Recorded Investment | | Unpaid Principal Balance | | Related Allowance | | With no related allowance recorded: | | | | | | | | | | Commercial | | | | | | | | | | Impaired Loans | Ps. | - | | Ps. | - | | Ps. | - | | | | | | | | | | | | With an allowance recorded: | | | | | | | | | | Commercial | | | | | | | | | | Impaired Loans | Ps. | 44,496 | | Ps. | 37,658 | | Ps. | 26,410 | | Total | Ps. | 44,496 | | Ps. | 37,658 | | Ps. | 26,410 |
| | As of June 30, 2014 | | | | Recorded Investment | | Unpaid Principal Balance | | Related Allowance | | | With no related allowance recorded: | | | | | | | | | | | Commercial | | | | | | | | | | | Impaired Loans | | Ps. | - | | | Ps. | - | | | Ps. | - | | | | | | | | | | | | | | | | | With an allowance recorded: | | | | | | | | | | | | | | Commercial | | | | | | | | | | | | | | Impaired Loans | | Ps. | 24,323 | | | Ps. | 21,441 | | | Ps. | 11,296 | | | Total | | Ps. | 24,323 | | | Ps. | 21,441 | | | Ps. | 11,296 | |
The average recorded investment in impaired loans amounted Ps. 42,3491,983 and Ps. 23,971,42,349, as of June 30, 20152016 and 2014,2015, respectively. There is no amount of interest income recognized during the time within the period that the loans were impaired.
Non-accrual accounts receivables and Past due
Non-Accrual loans are defined as those loans in the categories of: (a) Consumer portfolio: “Medium Risk”, “High Risk” and “Uncollectible”, and (b) Commercial portfolio: “With problems”, “High Risk of Insolvency” and “Uncollectible”.
The following table represents the amounts of nonaccruals, as of June 30, 2016 and 2015, and 2014, respectively: BANCO HIPOTECARIO SA AND SUBSIDIARIES NOTES TO THE CONSOLIDATED FINANCIAL STATEMENTS As of and for the twelve-month periods ended June 30, 2016, 2015 2014 and 20132014 (Expressed in thousands of Argentine pesos, except share data and as otherwise indicated)
| | As of June 30, | | As of June 30, | | | 2015 | | 2014 | | 2016 | | 2015 | | Consumer | | | | | | | | | | | | | Advances | | Ps. | 187 | | | Ps. | 566 | | Ps. | 342 | | Ps. | 187 | | Mortgage Loans | | | 30,739 | | | | 37,955 | | | 26,996 | | | 30,739 | | Personal Loans – BHSA | | | 88,514 | | | | 74,950 | | | 100,484 | | | 88,514 | | Personal Loans – Financial trusts | | | 52,827 | | | | - | | | 92,396 | | | 52,827 | | Personal Loans – Tarshop | | | - | | | - | | Credit Card Loans – BHSA | | | 115,792 | | | | 104,200 | | | 152,892 | | | 115,792 | | Credit card Loans – Tarshop | | | 109,319 | | | | 117,809 | | | 316,083 | | | 109,319 | Total Consumer | | Ps. | 397,378 | | | Ps. | 335,480 | | Ps. | 689,193 | | Ps. | 397,378 | | Commercial | | | | | | | | | | | | | | | Performing Loans | | Ps. | | | | Ps. | - | | Ps. | | | Ps. | | | Impaired Loans | | | 44,496 | | | | 24,323 | | | 21,635 | | | 44,496 | Total Commercial | | Ps. | 44,496 | | | Ps. | 24,323 | | Ps. | 21,635 | | Ps. | 44,496 | | | | | | | | | | | | | | | | Total Non accrual loans | | Ps. | 441,874 | | | Ps. | 359,803 | | Ps. | 710,828 | | Ps. | 441,874 |
An aging analysis of past due account receivables, segregated by class of account receivables, as of June 30, 20152016 and 20142015 was as follows:
| | | As of June 30, 2016 | | | | As of June 30, 2015 | | 30-90 | 91-180 | 181-360 | | | | | | 30-90 Days | | | 91-180 Days | | | 181-360 Days | | | Greater | | | Total | | | Current | | | Total | | Days Past | Greater | Total Past | Current | Total | | | | Past Due | | | Past Due | | | Past Due | | | than 360 | | | Past Due | | | | | | Financing | | Due | than 360 | Due | | Financing | | Consumer | | | | | | | | | | | | | | | | | | | | | | | | | | | | Advances | | | 904 | | | | 119 | | | | 62 | | | | 6 | | | | 1,091 | | | | 17,846 | | | | 18,937 | | 266 | 107 | 218 | 17 | 608 | 12,701 | 13,309 | | Mortgage Loans | | | 24,196 | | | | 6,707 | | | | 4,350 | | | | 19,682 | | | | 54,935 | | | | 2,662,466 | | | | 2,717,401 | | 25,838 | 5,163 | 4,409 | 17,424 | 52,834 | 2,536,670 | 2,589,504 | | Personal Loans – BHSA | | | 74,437 | | | | 40,349 | | | | 47,916 | | | | 249 | | | | 162,951 | | | | 2,449,316 | | | | 2,612,267 | | 111,179 | 46,890 | 53,051 | 543 | 211,663 | 2,916,970 | 3,128,633 | | Personal Loans – Financial trusts | | | 94,144 | | | | 31,334 | | | | 21,030 | | | | 463 | | | | 146,971 | | | | 727,455 | | | | 874,426 | | 8,648 | 9,994 | 33,458 | 48,944 | 101,044 | 131,044 | 232,088 | | Personal Loans – Tarshop | | 3,787 | - | 3,787 | 92,804 | 96,591 | | Credit Card Loans – BHSA | | | 58,835 | | | | 53,133 | | | | 62,318 | | | | 341 | | | | 174,627 | | | | 7,349,464 | | | | 7,524,091 | | 111,061 | 78,226 | 74,571 | 95 | 263,953 | 9,627,352 | 9,891,305 | | Credit card Loans – Tarshop | | | 112,302 | | | | 49,500 | | | | 53,187 | | | | 6,632 | | | | 221,621 | | | | 1,297,727 | | | | 1,519,348 | | 139,332 | 162,809 | 148,651 | 4,623 | 455,415 | 3,414,823 | 3,870,238 | | Total Consumer Loans | | | 364,818 | | | | 181,142 | | | | 188,863 | | | | 27,373 | | | | 762,196 | | | | 14,504,274 | | | | 15,266,470 | | 400,111 | 303,189 | 314,358 | 71,646 | 1,089,304 | 18,732,364 | 19,821,668 | | | | | | | | | | | | | | | | | | | | | | | | | | | | | | | | | | Commercial: | | | | | | | | | | | | | | | | | | | | | | | | | | | | | | | | Performing Loans | | | 1,568 | | | | - | | | | - | | | | - | | | | 1,568 | | | | 6,852,329 | | | | 6,853,897 | | 1,763 | - | 1,763 | 7,644,759 | 7,646,522 | | Impaired loans | | | - | | | | 173 | | | | 11,402 | | | | 32,921 | | | | 44,496 | | | | - | | | | 44,496 | | - | 6 | 3,673 | 17,956 | 21,635 | - | 21,635 | | Total Commercial Loans | | | 1,568 | | | | 173 | | | | 11,402 | | | | 32,921 | | | | 46,064 | | | | 6,852,329 | | | | 6,898,393 | | 1,763 | 6 | 3,673 | 17,956 | 23,398 | 7,644,759 | 7,668,157 | | Total | | | 366,386 | | | | 181,315 | | | | 200,265 | | | | 60,294 | | | | 808,260 | | | | 21,356,603 | | | | 22,164,863 | | 401,874 | 303,195 | 318,031 | 89,602 | 1,112,702 | 26,377,123 | 27,489,825 |
BANCO HIPOTECARIO SA AND SUBSIDIARIES NOTES TO THE CONSOLIDATED FINANCIAL STATEMENTS As of and for the twelve-month periods ended June 30, 2016, 2015 2014 and 20132014 (Expressed in thousands of Argentine pesos, except share data and as otherwise indicated)
| | | As of June 30, 2015 | | | | As of June 30, 2014 | | 30-90 | 91-180 | 181-360 | | | | | | 30-90 Days | | | 91-180 Days | | | 181-360 Days | | | Greater | | | Total | | | Current | | | Total | | Days Past | Days Past | Greater | Total Past | Current | Total | | | | Past Due | | | Past Due | | | Past Due | | | than 360 | | | Past Due | | | | | | Financing | | Due | Due | than 360 | Due | | Financing | | Consumer | | | | | | | | | | | | | | | | | | | | | | | | | | | | | | Advances | | | 837 | | | | 111 | | | | 131 | | | | 324 | | | | 1,403 | | | | 24,648 | | | | 26,051 | | 904 | 119 | 62 | 6 | 1,091 | 17,846 | 18,937 | | Mortgage Loans | | | 27,812 | | | | 7,235 | | | | 5,403 | | | | 25,317 | | | | 65,767 | | | | 2,801,484 | | | | 2,867,251 | | 24,196 | 6,707 | 4,350 | 19,682 | 54,935 | 2,662,466 | 2,717,401 | | Personal Loans | | | 78,819 | | | | 36,785 | | | | 37,735 | | | | 430 | | | | 153,769 | | | | 1,937,243 | | | | 2,091,012 | | | Personal Loans – BHSA | | 74,437 | 40,349 | 47,916 | 249 | 162,951 | 2,449,316 | 2,612,267 | | Personal Loans – Financial trusts | | 94,144 | 31,334 | 21,030 | 463 | 146,971 | 727,455 | 874,426 | | Credit Card Loans – BHSA | | | 71,613 | | | | 54,950 | | | | 49,225 | | | | 25 | | | | 175,813 | | | | 5,009,921 | | | | 5,185,734 | | 58,835 | 53,133 | 62,318 | 341 | 174,627 | 7,349,464 | 7,524,091 | | Credit card Loans – Tarshop | | | 156,447 | | | | 57,833 | | | | 55,617 | | | | 4,359 | | | | 274,256 | | | | 1,148,441 | | | | 1,422,697 | | 112,302 | 49,500 | 53,187 | 6,632 | 221,621 | 1,297,727 | 1,519,348 | | Total Consumer Loans | | | 335,528 | | | | 156,914 | | | | 148,111 | | | | 30,455 | | | | 671,008 | | | | 10,921,737 | | | | 11,592,745 | | 364,818 | 181,142 | 188,863 | 27,373 | 762,196 | 14,504,274 | 15,266,470 | | | | | | | | | | | | | | | | | | | | | | | | | | | | | | | | | | | | Commercial: | | | | | | | | | | | | | | | | | | | | | | | | | | | | | | | | | | Performing Loans | | | 164 | | | | - | | | | - | | | | - | | | | 164 | | | | 6,182,102 | | | | 6,182,266 | | 1,568 | - | - | - | 1,568 | 6,852,329 | 6,853,897 | | Impaired loans | | | - | | | | 1,777 | | | | 5,550 | | | | 16,996 | | | | 24,323 | | | | - | | | | 24,323 | | - | 173 | 11,402 | 32,921 | 44,496 | - | 44,496 | | Total Commercial Loans | | | 164 | | | | 1,777 | | | | 5,550 | | | | 16,996 | | | | 24,487 | | | | 6,182,102 | | | | 6,206,589 | | 1,568 | 173 | 11,402 | 32,921 | 46,064 | 6,852,329 | 6,898,393 | | Total | | | 335,692 | | | | 158,691 | | | | 153,661 | | | | 47,451 | | | | 695,495 | | | | 17,103,839 | | | | 17,799,334 | | 366,386 | 181,315 | 200,265 | 60,294 | 808,260 | 21,356,603 | 22,164,863 |
Financial receivables that are past due 90 days or more do not accrue interests.
Credit Quality
The following tables contain the loan portfolio classification by credit quality indicator set forth by the Argentine Central Bank.
Commercial Portfolio:
| Loan Classification | Description |
Loan Classification | 1. Normal Situation | | The debtor is widely able to meet its financial obligations, demonstrating significant cash flows, a liquid financial situation, an adequate financial structure, a timely payment record, competent management, available information in a timely, accurate manner and satisfactory internal controls. The debtor is in a sector of activity that is operating properly and has good prospects. |
Description | 2. With Special Follow-up | | Cash flow analysis reflects that the debt may be repaid even though it is possible that the customer’s future payment ability may deteriorate without a proper follow-up. |
1. Normal Situation The debtor is widely able to meet its financial obligations, demonstrating significant cash flows, a liquid financial situation, an adequate financial structure, a timely payment record, competent management, available information in a timely, accurate manner and satisfactory internal controls. The debtor is in a sector of activity that is operating properly and has good prospects. 2. With Special Follow-up Cash flow analysis reflects that the debt may be repaid even though it is possible that the customer’s future payment ability may deteriorate without a proper follow-up. This category is divided into two subcategories: (2.a). Under Observation; (2.b). Under Negotiation or Refinancing Agreements. | 3. With Problems | | Cash flow analysis evidences problems to repay the debt, and therefore, if these problems are not solved, there may be some losses. |
3. With Problems | 4. High Risk of Insolvency | | Cash flow analysis evidences that repayment of the full debt is highly unlikely. |
Cash flow analysis evidences problems to repay the debt, and therefore, if these problems are not solved, there may be some losses. | 5. Uncollectible | | The amounts in this category are deemed total |
4. High Risk of Insolvency Cash flow analysis evidences that repayment of the full debt is highly unlikely. 5. Uncollectible The amounts in this category are deemed total losses. Even though these assets may be recovered under certain future circumstances, inability to make payments is evident at the date of the analysis. It includes loans to insolvent or bankrupt borrowers.
BANCO HIPOTECARIO SA AND SUBSIDIARIES NOTES TO THE CONSOLIDATED FINANCIAL STATEMENTS As of and for the twelve-month periods ended June 30, 2016, 2015 2014 and 20132014 (Expressed in thousands of Argentine pesos, except share data and as otherwise indicated)
| losses. Even though these assets may be recovered under certain future circumstances, inability to make payments is evident at the date of the analysis. It includes loans to insolvent or bankrupt borrowers. |
Credit quality indicators for the commercial portfolio are reviewed, at a minimum, on an annual basis.
| Loan Classification | Description |
Loan Classification | 1. Normal Situation | | Loans with timely repayment or arrears not exceeding 31 days, both of principal and interest. |
Description | 2. Low Risk | | Occasional late payments, with a payment in arrears of more than 32 days and up to 90 days. A customer classified as “Medium Risk” having been refinanced may be recategorized within this category, as long as he amortizes one principal installment (whether monthly or bimonthly) or repays 5% of principal. |
1. Normal Situation | 3. Medium Risk | | Some inability to make payments, with arrears of more than 91 days and up to 180 days. A customer classified as “High Risk” having been refinanced may be recategorized within this category, as long as he amortizes two principal installments (whether monthly or bimonthly) or repays 5% of principal. |
Loans with timely repayment or arrears not exceeding 31 days, both of principal and interest. | 4. High Risk | | Judicial proceedings demanding payment have been initiated or arrears of more than 180 days and up to one year. A customer classified as “Uncollectible” having been refinanced may be recategorized within this category, as long as he amortizes three principal installments (whether monthly or bimonthly) or repays 10% of principal. |
2. Low Risk | 5. Uncollectible | | Loans to insolvent or bankrupt borrowers, or subject to judicial proceedings, with little or no possibility of collection, or with arrears in excess of one year. |
Occasional late payments, with a payment in arrears of more than 32 days and up to 90 days. A customer classified as “Medium Risk” having been refinanced may be recategorized within this category, as long as he amortizes one principal installment (whether monthly or bimonthly) or repays 5% of principal.3. Medium Risk Some inability to make payments, with arrears of more than 91 days and up to 180 days. A customer classified as “High Risk” having been refinanced may be recategorized within this category, as long as he amortizes two principal installments (whether monthly or bimonthly) or repays 5% of principal. 4. High Risk Judicial proceedings demanding payment have been initiated or arrears of more than 180 days and up to one year. A customer classified as “Uncollectible” having been refinanced may be recategorized within this category, as long as he amortizes three principal installments (whether monthly or bimonthly) or repays 10% of principal. 5. Uncollectible Loans to insolvent or bankrupt borrowers, or subject to judicial proceedings, with little or no possibility of collection, or with arrears in excess of one year. Credit quality indicators for the consumer portfolio are reviewed on a monthly basis.
The following table shows the account receivable balances categorized by credit quality indicators for the periods ended June 30, 20152016 and 2014:2015:
BANCO HIPOTECARIO SA AND SUBSIDIARIES NOTES TO THE CONSOLIDATED FINANCIAL STATEMENTS As of and for the twelve-month periods ended June 30, 2016, 2015 2014 and 20132014 (Expressed in thousands of Argentine pesos, except share data and as otherwise indicated)
| | | As of June 30, 2015 | | | | | "1" | | | "2" | | | "3" | | | "4" | | | "5" | | | | | | | | Normal Situation | | | With special follow-up or Low Risk | | | With problems or Medium Risk | | | High risk of insolvency or High risk | | | Uncollectible | | | Total | | | Consumer | | | | | | | | | | | | | | | | | | | | Advances | | | 17,846 | | | | 904 | | | | 119 | | | | 62 | | | | 6 | | | | 18,937 | | | Mortgage Loans | | | 2,662,466 | | | | 24,196 | | | | 6,707 | | | | 4,350 | | | | 19,682 | | | | 2,717,401 | | | Personal Loans – BHSA | | | 2,449,316 | | | | 74,437 | | | | 40,349 | | | | 47,916 | | | | 249 | | | | 2,612,267 | | | Personal Loans – Financial trusts | | | 796,527 | | | | 24,931 | | | | 31,418 | | | | 21,550 | | | | - | | | | 874,426 | | | Credit Card Loans – BHSA | | | 7,349,464 | | | | 58,835 | | | | 53,133 | | | | 62,318 | | | | 341 | | | | 7,524,091 | | | Credit card Loans – Tarshop | | | 1,297,727 | | | | 112,302 | | | | 49,500 | | | | 53,187 | | | | 6,632 | | | | 1,519,348 | | | Total Consumer Loans | | | 14,573,346 | | | | 295,605 | | | | 181,226 | | | | 189,383 | | | | 26,910 | | | | 15,266,470 | | | | | | | | | | | | | | | | | | | | | | | | | | | | | Commercial: | | | | | | | | | | | | | | | | | | | | | | | | | | Performing loans | | | 6,852,329 | | | | 1,568 | | | | - | | | | - | | | | - | | | | 6,853,897 | | | Impaired loans | | | - | | | | - | | | | 173 | | | | 11,402 | | | | 32,921 | | | | 44,496 | | | Total Commercial Loans | | | 6,852,329 | | | | 1,568 | | | | 173 | | | | 11,402 | | | | 32,921 | | | | 6,898,393 | | | Total Financing Receivables | | | 21,425,675 | | | | 297,173 | | | | 181,399 | | | | 200,785 | | | | 59,831 | | | | 22,164,863 | |
| | | As of June 30, 2014 | | As of June 30, 2016 | | | | "1" | | | "2" | | | "3" | | | "4" | | | "5" | | | | | | "1" | "2" | "3" | "4" | "5" | | | | | Normal Situation | | | With special follow-up or Low Risk | | | With problems or Medium Risk | | | High risk of insolvency or High risk | | | Uncollectible | | | Total | | Normal Situation | With special follow-up or Low Risk | With problems or Medium Risk | High risk of insolvency or High risk | Uncollectible | Total | | Consumer | | | | | | | | | | | | | | | | | | | | | | | | | | | | | Advances | | | 24,648 | | | | 837 | | | | 111 | | | | 131 | | | | 324 | | | | 26,051 | | 12,701 | 266 | 107 | 218 | 17 | 13,309 | | Mortgage Loans | | | 2,801,484 | | | | 27,812 | | | | 7,235 | | | | 5,403 | | | | 25,317 | | | | 2,867,251 | | 2,536,670 | 25,838 | 5,163 | 4,409 | 17,424 | 2,589,504 | | Personal Loans | | | 1,937,243 | | | | 78,819 | | | | 36,785 | | | | 37,735 | | | | 430 | | | | 2,091,012 | | | | Personal Loans – BHSA | | 2,916,970 | 111,179 | 46,890 | 53,051 | 543 | 3,128,633 | | Personal Loans – Financial trusts | | 131,044 | 8,648 | 3,542 | 88,854 | - | 232,088 | | Personal Loans – Tarshop | | 92,804 | 3,787 | - | 96,591 | | Credit Card Loans – BHSA | | | 5,009,921 | | | | 71,613 | | | | 54,950 | | | | 49,225 | | | | 25 | | | | 5,185,734 | | 9,627,352 | 111,061 | 78,226 | 74,571 | 95 | 9,891,305 | | Credit card Loans – Tarshop | | | 1,148,441 | | | | 156,447 | | | | 57,833 | | | | 55,617 | | | | 4,359 | | | | 1,422,697 | | 3,414,823 | 139,332 | 162,809 | 148,651 | 4,623 | 3,870,238 | | Total Consumer Loans | | | 10,921,737 | | | | 335,528 | | | | 156,914 | | | | 148,111 | | | | 30,455 | | | | 11,592,745 | | 18,732,364 | 400,111 | 296,737 | 369,754 | 22,702 | 19,821,668 | | | | | | | | | | | | | | | | | | | | | | | | | | | | | | | Commercial: | | | | | | | | | | | | | | | | | | | | | | | | | | | | | Performing loans | | | 6,182,102 | | | | 164 | | | | - | | | | - | | | | - | | | | 6,182,266 | | 7,644,759 | 1,763 | - | 7,646,522 | | Impaired loans | | | - | | | | - | | | | 1,777 | | | | 5,550 | | | | 16,996 | | | | 24,323 | | - | - | 6 | 3,673 | 17,956 | 21,635 | | Total Commercial Loans | | | 6,182,102 | | | | 164 | | | | 1,777 | | | | 5,550 | | | | 16,996 | | | | 6,206,589 | | 7,644,759 | 1,763 | 6 | 3,673 | 17,956 | 7,668,157 | | Total Financing Receivables | | | 17,103,839 | | | | 335,692 | | | | 158,691 | | | | 153,661 | | | | 47,451 | | | | 17,799,334 | | 26,377,123 | 401,874 | 296,743 | 373,427 | 40,658 | 27,489,825 | | | | As of June 30, 2015 | | | | "1" | "2" | "3" | "4" | "5" | | | | | Normal Situation | With special follow-up or Low Risk | With problems or Medium Risk | High risk of insolvency or High risk | Uncollectible | Total | | Consumer | | | | | | Advances | | 17,846 | 904 | 119 | 62 | 6 | 18,937 | | Mortgage Loans | | 2,662,466 | 24,196 | 6,707 | 4,350 | 19,682 | 2,717,401 | Personal Loans – BHSA | | 2,449,316 | 74,437 | 40,349 | 47,916 | 249 | 2,612,267 | | Personal Loans – Financial trusts | | 796,527 | 24,931 | 31,418 | 21,550 | - | 874,426 | | Credit Card Loans – BHSA | | 7,349,464 | 58,835 | 53,133 | 62,318 | 341 | 7,524,091 | | Credit card Loans – Tarshop | | 1,297,727 | 112,302 | 49,500 | 53,187 | 6,632 | 1,519,348 | | Total Consumer Loans | | 14,573,346 | 295,605 | 181,226 | 189,383 | 26,910 | 15,266,470 | | | | | | | | Commercial: | | | | | | Performing loans | | 6,852,329 | 1,568 | - | 6,853,897 | | Impaired loans | | - | - | 173 | 11,402 | 32,921 | 44,496 | | Total Commercial Loans | | 6,852,329 | 1,568 | 173 | 11,402 | 32,921 | 6,898,393 | | Total Financing Receivables | | 21,425,675 | 297,173 | 181,399 | 200,785 | 59,831 | 22,164,863 |
Troubled debt restructuring
According to BCRA regulations, a refinancing is considered to exist whenever any of the original contractually agreed conditions for a financing transaction (term, capital, interest or rate) are modified.
BANCO HIPOTECARIO SA AND SUBSIDIARIES NOTES TO THE CONSOLIDATED FINANCIAL STATEMENTS As of and for the twelve-month periods ended June 30, 2016, 2015 and 2014 (Expressed in thousands of Argentine pesos, except share data and as otherwise indicated) We concluded that all our refinanced loans comply with the conditions for considering them as troubled debt restructuring (“TDR”) as defined under U.S. GAAP. In accordance with ASC 310-40 a restructured loan is considered a TDR if the debtor is experiencing financial difficulties and the
BANCO HIPOTECARIO SA AND SUBSIDIARIES
NOTES TO THE CONSOLIDATED FINANCIAL STATEMENTS
As of and for the twelve-month periods ended June 30, 2015, 2014 and 2013
(Expressed in thousands of Argentine pesos, except share data and as otherwise indicated)
Bank grants a concession to the debtor that would not otherwise be considered. Concessions granted could include: reduction in interest rate to rates that are considered below market, extension of repayment schedules and maturity dates beyond original contractual terms.
The following table presents for the financing receivables modified as troubled debt restructurings within during the last two periods:
| | As of June 30, 2016 | | | Number of contracts | | Post-modification Outstanding recorded investment | | Consumer | | | | | | Advances | 35 | | Ps. | 950 | | Mortgage Loans | 109 | | | 2,826 | | Personal Loans | 5,260 | | | 141,884 | | Credit Card Loans – BHSA | 12,038 | | | 195,570 | | Credit card Loans – Tarshop | 17,275 | | | 167,361 | | Total Consumer | 34,717 | | Ps. | 508,591 | | | | | | | | Commercial | | | | | | Performing Loans | - | | Ps. | - | | Impaired Loans | - | | | - | | Total Commercial | - | | Ps. | - | | | | | | | | Total TDRs | 34,717 | | Ps. | 508,591 |
| | | | | | | | As of June 30, 2015 | | | Number of contracts | | Post-modification Outstanding recorded investment | | Consumer | | | | | | Advances | 63 | | Ps. | 1,463 | | Mortgage Loans | 174 | | | 4,490 | | Personal Loans | 6,921 | | | 160,312 | | Credit Card Loans – BHSA | 21,472 | | | 245,522 | | Credit card Loans – Tarshop | 15,512 | | | 92,758 | | Total Consumer | 44,142 | | Ps. | 504,545 | | | | | | | | Commercial | | | | | | Performing Loans | - | | Ps. | - | | Impaired Loans | - | | | - | | Total Commercial | - | | Ps. | - | | | | | | | | Total TDRs | 44,142 | | Ps. | 504,545 |
| | | | | | | | | | | | | As of June 30, 2014 | | | | | Number of contracts | | Post-modification Outstanding recorded investment | | | Consumer | | | | | | | | Advances | | | 52 | | | Ps. | 987 | | | Mortgage Loans | | | 110 | | | | 3,602 | | | Personal Loans | | | 4,140 | | | | 79,250 | | | Credit Card Loans – BHSA | | | 1,209 | | | | 14,749 | | | Credit card Loans – Tarshop | | | 18,553 | | | | 89,655 | | Total Consumer | | | 24,064 | | | Ps. | 188,243 | | | | | | | | | | | | | Commercial | | | | | | | | | | Performing Loans | | | - | | | Ps. | - | | | Impaired Loans | | | - | | | | - | | Total Commercial | | | - | | | Ps. | - | | | | | | | | | | | | Total TDRs | | | 24,064 | | | Ps. | 188,243 | |
The following table presents for, the financing receivables modified as troubled debt restructurings within the previous 12 months and for which there was a payment default during that period. We consider a TDR that have subsequently defaulted if the borrower has failed to make payments of either principal, interest or both for a period of 90 days or more from contractual due date.
BANCO HIPOTECARIO SA AND SUBSIDIARIES NOTES TO THE CONSOLIDATED FINANCIAL STATEMENTS As of and for the twelve-month periods ended June 30, 2016, 2015 2014 and 20132014 (Expressed in thousands of Argentine pesos, except share data and as otherwise indicated)
| | | As of June 30, | | As of June 30, | | | | 2015 | | | 2014 | | 2016 | | 2015 | | | | Number of contracts | | Recorded investment | | | Number of contracts | | Recorded investment | | Number of contracts | | Recorded investment | | Number of contracts | | Recorded investment | | Consumer | | | | | | | | | | | | | | | | | | | | | | | Advances | | | 10 | | | Ps. | 197 | | | | 6 | | | Ps. | 85 | | 8 | | Ps. | 180 | | 10 | | Ps. | 197 | | Mortgage Loans | | | 25 | | | | 783 | | | | 22 | | | | 490 | | 100 | | | 2,203 | | 25 | | | 783 | | Personal Loans | | | 1,116 | | | | 21,602 | | | | 469 | | | | 6,816 | | 1,176 | | | 26,913 | | 1,116 | | | 21,602 | | Credit Card Loans – BHSA | | | 672 | | | | 7,923 | | | | 590 | | | | 6,262 | | 3,176 | | | 35,285 | | 672 | | | 7,923 | | Credit card Loans – Tarshop | | | 5,146 | | | | 26,253 | | | | 8,571 | | | | 41,835 | | 5,574 | | | 36,315 | | 5,146 | | | 26,253 | Total Consumer | | | 6,969 | | | Ps. | 56,758 | | | | 9,658 | | | Ps. | 55,488 | | 10,034 | | Ps. | 100,896 | | 6,969 | | Ps. | 56,758 | | | | | | | | | | | | | | | | | | | | | | | | | | | | | Commercial | | | | | | | | | | | | | | | | | | | | | | | | | | | Performing Loans | | | - | | | Ps. | - | | | | - | | | Ps. | - | | - | | Ps. | - | | - | | Ps. | - | | Impaired Loans | | | - | | | | - | | | | - | | | | - | | - | | | - | | - | | | - | Total Commercial | | | - | | | Ps. | - | | | | - | | | Ps. | - | | - | | Ps. | - | | - | | Ps. | - | | | | | | | | | | | | | | | | | | | | | | | | | | | | | Total TDRs that subsequently defaulted | | | 6,969 | | | Ps. | 56,758 | | | | 9,658 | | | Ps. | 55,488 | | 10,034 | | Ps. | 100,896 | | 6,969 | | Ps. | 56,758 |
Allowance for Credit Losses
Accounts receivable balances are classified as uncollectible and written off from the Consolidated Balance Sheet when 365 days past due and subsequently recorded in memorandum accounts.
The activity in the allowance for accounts receivables losses under U.S. GAAP for the fiscal periods ended June 30, 20152016 and 20142015 was as follows:
| | | | | | | Argentine Banking GAAP | | U.S. GAAP | | Adjustment | | Argentine Banking GAAP | | U.S. GAAP | | Adjustment | | June 30, 2014 | | Ps. | 406,818 | | | Ps. | 596,656 | | | Ps. | (189,838 | ) | | | June 30, 2015 | | Ps. | 514,394 | | Ps. | 734,935 | | Ps. | (220,541) | | | | | | | | | | | | | | | | | | | | | | | | Variances | | | 107,576 | | | | 138,279 | | | | (30,703 | ) | | 178,658 | | | 208,823 | | | (30,165) | | | | | | | | | | | | | | | | | | | | | | | | June 30, 2015 | | Ps. | 514,394 | | | Ps. | 734,935 | | | Ps. | (220,541 | ) | | | June 30, 2016 | | Ps. | 693,052 | | Ps. | 943,758 | | Ps. | (250,706) |
r.s. Comprehensive income
ASC 220 establishes standards for reporting and disclosure of comprehensive income and its components (revenues, expenses, gains and losses) in the financial statements. Comprehensive income is the total of net income and other charges or credits to equity that are not the result of transactions with owners.
The following disclosure presented for the twelve-month periods ended June 30, 2016, 2015 2014 and 2013,2014, shows all periods in Argentine Banking GAAP format reflecting U.S. GAAP income and comprehensive statement adjustments.
BANCO HIPOTECARIO SA AND SUBSIDIARIES NOTES TO THE CONSOLIDATED FINANCIAL STATEMENTS As of and for the twelve-month periods ended June 30, 2016, 2015 2014 and 20132014 (Expressed in thousands of Argentine pesos, except share data and as otherwise indicated)
| | June 30, | | June 30, | | | 2015 | | 2014 | | 2013 | | 2016 | | 2015 | | 2014 | | Income Statement | | | | | | | | | | | | | | | | | | | | | | | | | | | | | | | | | | | | | | Financial income | | Ps. | 5,559,510 | | | Ps. | 4,666,910 | | | Ps. | 2,418,505 | | Ps. | 9,063,628 | | Ps. | 5,559,510 | | Ps. | 4,666,910 | | Financial expenses | | | (3,241,306 | ) | | | (2,399,052 | ) | | | (1,281,120 | ) | | (5,612,760) | | | (3,241,306) | | | (2,399,052) | | Net financial income | | Ps. | 2,318,204 | | | Ps. | 2,267,858 | | | Ps. | 1,137,385 | | Ps. | 3,450,868 | | Ps. | 2,318,204 | | Ps. | 2,267,858 | | Provision for loan losses | | | (405,973 | ) | | | (333,025 | ) | | | (258,629 | ) | | (386,657) | | | (405,973) | | | (333,025) | | Income from services | | | 3,264,698 | | | | 2,145,423 | | | | 1,365,116 | | | 4,307,451 | | | 3,264,698 | | | 2,145,423 | | Expenses for services | | | (768,870 | ) | | | (682,638 | ) | | | (290,908 | ) | | (1,089,690) | | | (768,870) | | | (682,638) | | Administrative expenses | | | (3,411,162 | ) | | | (2,380,651 | ) | | | (1,621,522 | ) | | (4,539,637) | | | (3,411,162) | | | (2,380,651) | | Net income from financial transactions | | Ps. | 996,897 | | | Ps. | 1,016,967 | | | Ps. | 331,442 | | Ps. | 1,742,335 | | Ps. | 996,897 | | Ps. | 1,016,967 | | Miscellaneous income | | | 317,530 | | | | 188,928 | | | | 193,422 | | | 546,543 | | | 317,530 | | | 188,928 | | Miscellaneous expenses | | | (466,554 | ) | | | (286,596 | ) | | | (168,735 | ) | | (669,358) | | | (466,554) | | | (286,596) | | Income before income taxes and Non-controlling interest | | Ps. | 847,873 | | | Ps. | 919,299 | | | Ps. | 356,129 | | | | Income before income taxes and Non-controlling interest....……………… | | Ps. | 1,619,520 | | Ps. | 847,873 | | Ps. | 919,299 | | Income taxes | | | (332,940 | ) | | | (314,005 | ) | | | (96,586 | ) | | (604,359) | | | (332,940) | | | (314,005) | | Net income under U.S. GAAP | | Ps. | 514,933 | | | Ps. | 605,294 | | | Ps. | 259,543 | | Ps. | 1,015,161 | | Ps. | 514,933 | | Ps. | 605,294 | | Less Net (Loss) attributable to the Non-controlling interest | | | 4,369 | | | | 10,284 | | | | (8,834 | ) | | | Net income attributable Controlling interest in accordance with U.S. GAAP | | Ps. | 519,302 | | | Ps. | 615,578 | | | Ps. | 250,709 | | | | Less Net (Loss) attributable to the Non-controlling interest…………... | | | 18,311 | | | 4,369 | | | 10,284 | | Net income attributable Controlling interest in accordance with U.S. GAAP……………………………..… | | Ps | 1,033,472 | | Ps | 519,302 | | Ps | 615,578 | | | | | | | | | | | | | | | | | | | | | | | | Other comprehensive income (loss): | | | | | | | | | | | | | | | | | | | | | | | | | | | | | | | | | | | | | | | | | | | | Unrealized gains (loss) on securities | | | 15,591 | | | | 22,283 | | | | (7,377 | ) | | (30,031) | | | 15,591 | | | 22,283 | | Other comprehensive income (loss) | | Ps. | 15,591 | | | Ps. | 22,283 | | | Ps. | (7,377 | ) | | | Comprehensive income | | Ps. | 534,893 | | | Ps. | 637,861 | | | Ps. | 243,332 | | | Other comprehensive income (loss)………………………………… | | Ps | (30,031) | | Ps | 15,591 | | Ps | 22,283 | Comprehensive income …..……….. | | Ps. | 1,003,441 | | Ps. | 534,893 | | Ps. | 637,861 |
s.t. Risks and Uncertainties
All transactions involving the purchase of foreign currency must be settled through the single free exchange market (Mercado Único Libre de Cambios, or “MULC”) where the Central Bank supervises the purchase and sale of foreign currency. Under Executive Branch Decree No. 260/2002, the Argentine government set up an exchange market through which all foreign currency exchange transactions are made. Such transactions are subject to the regulations and requirements imposed by the Central Bank. Under Communication “A” 3471, as amended, the Central Bank established certain restrictions and requirements applicable to foreign currency exchange transactions. If such restrictions and requirements are not met, criminal penalties shall be applied.
On October 28, 2011, the Federal Administration of Public Revenues (Administración Federal de Ingresos Públicos, “AFIP”) established an Exchange Transactions Inquiry Program (“Inquiry Program”) through which the entities authorized by the Central Bank to deal in foreign exchange must inquire and register through an IT system the total peso amount of each exchange transaction at the moment it is closed. All foreign exchange sale transactions, whether involving foreign currency or banknotes, irrespective of their purpose or allocation, are subject to this inquiry and registration system, which determines whether Transactions are “Validated” or “Inconsistent”.
Pursuant to Communication “A” 5239, afterward replaced by Communication “A” 5245, in the case of sales of foreign exchange (foreign currency or banknotes) for the formation of off-shore
BANCO HIPOTECARIO SA AND SUBSIDIARIES
NOTES TO THE CONSOLIDATED FINANCIAL STATEMENTS
As of and for the twelve-month periods ended June 30, 2015, 2014 and 2013
(Expressed in thousands of Argentine pesos, except share data and as otherwise indicated)
assets by residents without the obligation of subsequently allocating it to specific purpose, entities authorized to deal in foreign exchange may only allow transactions through the MULC by those clients who have obtained the validation and who comply with the rest of the requirements set forth in the applicable foreign exchange regulations. Sales of foreign exchange other than for the formation of off-shore assets by residents without a specific purpose are also exempted from the Inquiry Program, although, the financial entities must verify that the other requirements established by the MULC are accomplished.
BANCO HIPOTECARIO SA AND SUBSIDIARIES NOTES TO THE CONSOLIDATED FINANCIAL STATEMENTS As of and for the twelve-month periods ended June 30, 2016, 2015 and 2014 (Expressed in thousands of Argentine pesos, except share data and as otherwise indicated) According to Communication “A” 5264, as amended, in general terms the access to the foreign exchange market for resident in order to pay services, debts and profits to non-residents has no limits or restrictions. The access to the MULC requires the filing of certain documentation by residents evidencing the validity of transactions for which the funds are purchase for its remittance abroad. Communication “A” 5236, item 4.2. which regulated the outflow of fund allowing residents to access to the MULC for the formation of off-shore assets without a specific allocation by residents has been suspended and, up to now, the Central Bank has not issued any other measure or provisions in this regard.
On August 6, 2012, Resolution #3210 was replaced by Resolution #3356 enacted by AFIP. This resolution sets forth more restrictions for the access to the foreign exchange market, in particular for the outflow of funds made by residents. Both resolutions (3210 and 3356) are related with Communications “A” 5239 (currently abrogated) and 5245.
The Argentine government may, in the future, impose additional controls on the foreign exchange market and on capital flows from and into Argentina, in response to capital flight or depreciation of the Peso. These restrictions may have a negative effect on the economy and on our business if imposed in an economic environment where access to local capital is constrained.
t.u. U.S. GAAP estimates
Valuation reserves, impairment charges and estimates of market values on assets and step up bonds discounting, as established by the Bank for U.S. GAAP purposes are subject to significant assumptions of future cash flows and interest rates for discounting such cash flows. Losses on the exchange of government and provincial bonds were significantly affected by higher discount rates. Should the discount rates change in future years, the carrying amounts and charges to income and shareholders’ equity deficit will also change. In addition, as estimates of future cash flows change, so too will the carrying amounts which are dependent on such cash flows. It is possible that changes to the carrying amounts of loans, investments and other assets will be adjusted in the near term in amounts that are material to the Bank’s financial position and results of income.
u.v. Allowance for loan losses
Management believes that the current level of allowance for loan losses recorded for U.S. GAAP purposes are sufficient to cover incurred losses of the Bank’s loan portfolio as of June 30, 20152016 and 2014.2015. Many factors can affect the Bank’s estimates of allowance for loan losses, including expected cash flows, volatility of default probability, migrations and estimated loss severity. The process of determining the level of the allowance for credit losses requires a high degree of judgment. It is possible that others, given the same information, may at any point in time reach different reasonable conclusions. If market conditions and economic uncertainties exist, it might result in higher credit losses and provision for credit losses in future periods.
BANCO HIPOTECARIO SA AND SUBSIDIARIES NOTES TO THE CONSOLIDATED FINANCIAL STATEMENTS As of and for the twelve-month periods ended June 30, 2016, 2015 2014 and 20132014 (Expressed in thousands of Argentine pesos, except share data and as otherwise indicated)
35. New authoritative pronouncements
During the twelve-months ended June 30, 2015,2016, the FASB has issued Accounting Standards Updates. Those updates applicable for the Bank are mentioned below:
ASU No. 2014-132015-03 In August 2014, theThe FASB issued dein April 2015 the Accounting Standards Update No. 2014-13 “Consolidation” (ASC 810)2015-03 “Interest—Imputation of Interest (Subtopic 835-30) — Simplifying the Presentation of Debt Issuance Costs”. After transition,The Board is issuing this Update as part of its initiative to reduce complexity in accounting standards (the Simplification Initiative). The objective of the Simplification Initiative is to identify, evaluate, and improve areas of U.S. GAAP for which cost and complexity can be reduced while maintaining or improving the usefulness of the information provided to users of financial statements.
The Board received feedback that having different balance sheet presentation requirements for debt issuance costs and debt discount and premium creates unnecessary complexity. Recognizing debt issuance costs as a deferred charge (that is, an asset) also is different from the guidance in IFRS, which requires that transaction costs be deducted from the carrying value of the financial liability and not recorded as separate assets. Additionally, the requirement to recognize debt issuance costs as deferred charges conflicts with the guidance in FASB Concepts Statement No. 6, Elements of Financial Statements, which states that debt issuance costs are similar to debt discounts and in effect reduce the proceeds of borrowing, thereby increasing the effective interest rate. Concepts Statement 6 further states that debt issuance costs cannot be an asset because they provide no future economic benefit. To simplify presentation of debt issuance costs, the amendments in this Update applyrequire that debt issuance costs related to a reporting entity that is required to consolidaterecognized debt liability be presented in the balance sheet as a collateralized financing entity underdirect deduction from the Variable Interest Entities Subsections of Subtopic 810-10 when (1) the reporting entity measures all of the financial assets and the financial liabilitiescarrying amount of that consolidated collateralized financing entity at fair value indebt liability, consistent with debt discounts. The recognition and measurement guidance for debt issuance costs are not affected by the consolidated financial statements based on other Topics and (2) the changes in the fair values of those financial assets and financial liabilities are reflected in earnings.
The amendments in this Update are effective for public business entities for annual periods, and interim periods within those annual periods, beginning after December 15, 2015. Update.
For entities other than public business entities, the amendments in this Update are effective for annual periods ending after December 15, 2016, and interim periodsfinancial statements issued for fiscal years beginning after December 15, 2016. Early adoption is permitted as of the beginning of an annual period.2015, and interim periods within those fiscal years.
The Bank considers this ASU has not any significant effect in the US GAAP disclosures and financial information.
ASU No. 2014-142015-15 TheIn August 2015, the FASB issued the Accounting Standards Update No. 2014-14 “Receivables – Troubled2015-15 “Presentation and Subsequent Measurement of Debt Restructuring by Creditors (ASC 310-40)” was issued by the FASB in August 2014. The amendments in this Update affect creditors that hold government-guaranteed mortgage loans and require that a mortgage loan be derecognized and that a separate other receivable be recognized upon foreclosure if some conditions are met. Upon foreclosure, the separate other receivable should be measured based on the amount of the loan balance (principal and interest) expected to be recovered from the guarantor.
The objective of this Update is to reduce diversity in practice by addressing the classification of foreclosed mortgage loans that are fully or partially guaranteed under government programs. Currently, some creditors reclassify those loans to real estate asIssuance Costs Associated with other foreclosed loans that do not have guarantees; others reclassify the loans to other receivables. periods, beginning after December 15, 2014.
In conclusion, the impact of adoption this ASU has not any significant effect in the present US GAAP financial information and disclosures. However, the Bank is in the process of evaluating the impact deriving from the current update for future periods.
ASU No. 2014-16
In November 2014, the FASB issued ASU No. 2014-16 “Derivatives and Hedging (Topic 815)”Line-of-Credit Arrangements”. The amendments in this Update applyprovide guidance on accounting for the costs on line-of-credit arrangements.
Given the absence of authoritative guidance within Update 2015-03 for debt issuance costs related to all entities that are issuers of, or investors in, hybrid financial instruments that are issued inline-of-credit arrangements, the form of a share.
The amendments in this Update doSEC staff would not change the current criteria in GAAP for determining when separation of certain embedded derivative features in a hybrid financial instrument is required. That is,object to an entity will continue to evaluate whetherdeferring and presenting debt issuance costs as an asset and subsequently amortizing the economic characteristics and risksdeferred debt issuance costs ratably over the term of the embedded derivative featureline-of-credit arrangement, regardless of whether there are clearly and closely related to those ofany outstanding borrowings on the host contract, among other relevant criteria. The amendments clarify how current GAAP should be interpreted in evaluating the economic characteristics and risks of a host contract in a hybrid financial instrument that is issued in the form of a share. Specifically, the amendments clarify that an entity shouldline-of-credit arrangement.
consider all relevant terms and features’ including the embedded derivative feature being evaluated for bifurcations in evaluating the nature of the host contract. Furthermore, the amendments clarify that no single term or feature would necessarily determine the economic characteristics and risks of the host contract. Rather, the nature of the host contract depends upon the economic characteristics and risks of the entire hybrid financial instrument.
The impact of this ASU has not any significant effect in the USU.S. GAAP disclosures and financial information for the Bank. The amendments in this Update do not change the current criteria in GAAP for determining when separation of certain embedded derivative features in a hybrid financial instrument is required.
ASU No. 2014-172015-16 TheIn September 2015, FASB issued in November 2014ASU 16 “Simplifying the Accounting Standard Update No. 2014-17 “Business Combinations (Topic 805)”. The objective of this Update is to provide guidance for determining whether and at what threshold an acquiree (acquired entity) that is a business or nonprofit activity can reflect the acquirer’s accounting and reporting basis (pushdown accounting) in its separate financial statements.Measurement-Period Adjustment”
This Update provides an acquired entity with an option to apply pushdown accounting in its separate financial statements upon occurrence of an event in which an acquirer obtains control of the acquired entity. An acquired entity may elect the option to apply pushdown accounting in the reporting period in which the change-in-control event occurs. If an acquired entity elects the option to apply pushdown accounting in its separate financial statements, it should disclose information in the current reporting period that enables users of financial statements to evaluate the effect of pushdown accounting.
Current GAAP offers limited guidance for determining whether and at what threshold pushdown accounting should be established in an acquired entity’s separate financial statements.
The Bank considers this ASU has not any significant effect in the US GAAP disclosures and financial information.
ASU No. 2014-18
During December 2014, the FASB issued the Accounting Standards Update No. 2014-18 “Business Combinations (Topic 805)”. The objective of the amendments in this Update is to address the concerns of private company stakeholders that the benefits of the current accounting for identifiable intangible assets acquired in a business combination do not justify the related costs. The amendments provide guidance about an accounting alternative for recognizing or otherwise considering the fair value of identifiable intangible assets acquired as a result of certain specified transactions, including business combinations.
The impact of this Update has not any significant effect in the present US GAAP financial statements.
36. Subsequent events
Negotiable obligations
The following table shows the amount, interest rate and maturity date of each series issued after June 30, 2015:
BANCO HIPOTECARIO SA AND SUBSIDIARIES NOTES TO THE CONSOLIDATED FINANCIAL STATEMENTS As of and for the twelve-month periods ended June 30, 2016, 2015 2014 and 20132014 (Expressed in thousands of Argentine pesos, except share data and as otherwise indicated)
ASU 2016-01 In January 2016, the FASB issued the Accounting Standards Update No. 2016-01 “Recognition and Measurement of Financial Assetsand Financial Liabilities”. The amendments in this Update: i) Require equity investments (except those accounted for under the equity method of accounting or those thatresult in consolidation of the investee) to be measured at fair value with changes in fair value recognized in net income; ii) simplify theimpairment assessment of equity investments without readily determinable fair values by requiring a qualitative assessment to identifyimpairment; iii) eliminate the requirement for public business entities to disclose the method(s) and significant assumptions used toestimate the fair value that is required to be disclosed for financial instruments measured at amortized cost on the balance sheet; andiv) require public business entities to use the exit price notion when measuring the fair value of financial instruments for disclosurepurposes; among other changes. For public business entities, the amendments in this Update are effective for financial statements issued for fiscal years beginningafter December 15, 2017, and interim periods within those fiscal years. The impact of this Update has not any significant effect in the present U.S. GAAP financial statements. ASU 2016-02 Accounting Standard Update 2016-02 “Leases (Topic 842)” was issued in February 2016. The FASB is issuing this Update to increase transparency and comparability among organizations by recognizing lease assets and lease liabilities on the balance sheet and disclosing key information about leasing arrangements. To meet that objective, the FASB is amending the ASC and creating Topic 842, Leases. The accounting applied by a lessor is largely unchanged from that applied under previous GAAP. For public business entities, the amendments in this Update are effective for financial statements issued for fiscal years beginning after December 15, 2018, and interim periods within those fiscal years. The impact of this Update has not any significant effect in the present U.S. GAAP financial statements. 36. BHN Inversión S.A.’s dividend distribution On March 9, 2016 the Ordinary Shareholders' Meeting of BHN Sociedad de Inversión S.A. approved the payment of cash dividends and / or government securities for Ps 650,000 authorizing the Board to make the distribution in the form and opportunity in the year 2016 sees fit. On March 30, 2016 BHN Sociedad de Inversión S.A. made a first payment of dividends in government securities for Ps 330,000. 37. BACS Banco de Crédito y Securitización S.A. - Representations before the Central Bank to perform the activities planned for a commercial bank of first grade On October 20, 2015 the Extraordinary General Shareholders’ unanimously approved to: ● Delegate in the Board of Directors the broadest powers to take all steps, events and presentations necessary for the purposes of processing the license to operate as a commercial bank of first grade to the Central Bank and also prepare, approve , manage and execute all documentation -whether public or private instrument- that is required by the institution for the purpose of the authorization, and ● Authorize the Board of Directors to delegate the powers mentioned in the preceding point in one or more of its members or one or more of the managers of the company
BANCO HIPOTECARIO SA AND SUBSIDIARIES NOTES TO THE CONSOLIDATED FINANCIAL STATEMENTS As of and for the twelve-month periods ended June 30, 2016, 2015 and 2014 (Expressed in thousands of Argentine pesos, except share data and as otherwise indicated) 38. Supplementary services to the financial business Pursuant to Communication “A” 5700, the Argentine Central Bank included changes in the rules on “Supplementary services to the financial business and permitted activities”, “Consolidated supervision” and “Minimum capitals of financial institutions”. As concerns the scope of the supplementary services, it is allowed to hold interests in the stock capital of companies engaged in the development of two of the subject activities to the extent that, in the opinion of the SEFyC, both activities are economically related to each other and there are no legal inconsistencies that would prevent them from being developed jointly. The subject activities include the issuance of credit, debit and similar cards. This notwithstanding, provided that 25% of the total financing amount as of the closing date of each month is not exceeded, loans not subject to the credit card law may be extended to financial services users, in which cases the provisions on “Interest rates applicable to lending transactions” shall be complied with. On the other hand, changes are introduced in the calculation of the regulatory capital (responsabilidad patrimonial computable) to reflect the impact of these amendments. As a result of such Communication, on March 16, 2015, Tarshop SA’s General Extraordinary Shareholders’ Meeting approved an amendment to its corporate purpose. According to such amendment, the company may grant and market consumer loans and consumer credits and financing for users of financial services pursuant to the Argentine Central Bank’s rules and regulations, handle the collection of utility bills, credits and similar items, render payroll and supplier payment and revenue collection services. In such regard, on June 3, 2016, the Argentine Central Bank awarded the Company a Provisional Authorization Code in the Register of Other Non-Financial Credit Providers, and thus allowed it to start granting consumer loans, in line with the amendment to the corporate purpose recorded with the General Superintendency of Corporations on January 8, 2016 under number 437, book 77 of Corporations, and authorized by the Argentine Securities Commission under Resolution No. 17,930 dated December 21, 2015. 39. Subsequent events Negotiable obligations The following table shows the amount, interest rate and maturity date of each series issued after June 30, 2016: BANCO HIPOTECARIO SA AND SUBSIDIARIES NOTES TO THE CONSOLIDATED FINANCIAL STATEMENTS As of and for the twelve-month periods ended June 30, 2016, 2015 and 2014 (Expressed in thousands of Argentine pesos, except share data and as otherwise indicated) | | | | | | | Issue date | Maturity date | | Annual interest rate | | Banco Hipotecario S.A. | | | | | Series XXXVIII (Ps. 145,200) | 08/18/16 | 02/18/18 | Badlar+300bp | Series XXXXXXIX (Ps. 314,611)343,241) | 09/04/1508/18/16 | 03/04/1708/18/19 | a/b | Mixed (c) | Series XXXI (US$. 14,730 thousand) | 09/04/15 | 09/04/18 | a | 2.0%Badlar+349bp | | Series XL (Ps. 6,078,320) | 10/12/16 | 01/12/20 | Badlar + 250bp
| | BACS Banco de Crédito y Securitización S.A. | | | | Series VIIX (Ps. 141,666)249,500) | 07/23/1527/16 | 04/24/1707/27/18 | a/b | Mixed (d)Badlar +345bp | | | | | | | Tarshop S.A. | | | | Class I (Ps. 204,033) | 09/07/16 | 03/07/18 | Badlar +448bp | | Class II (Ps. 67,360) | 09/07/16 | 03/07/19 | Badlar +499bp | | | | | Series XXII (Ps. 126,667)v
| 07/30/15 | 01/30/17 | a | 29.0% | | | | | |
(a)Fixed interest rate
(b)Variable interest rate
(c)Fixed rate of 28.25% on the first nine months and variable interest rate of Badlar+450bps from that moment on.
(d)Fixed rate of 27.5% on the first nine months and variable interest rate of Badlar+450bps from that moment on.
Tarshop’s irrevocable capital contribution
On September 11, 2015, the Board of Directors of Banco Hipotecario S.A. approved an irrevocable capital contribution to Tarshop S.A. in the amount of Ps. 52,500 to be made by shareholders Banco Hipotecario S.A. and IRSA Propiedades Comerciales S.A. pro rata of their shareholdings.
NEW LIPSTICK LLC AND SUBSIDIARY (A Limited Liability Company)
Table of Contents | | Page | | | | | Consolidated Financial Statements: | | | | | | Independent Auditors Report | F-357F-292 | | | | Consolidated Balance SheetSheets As of June 30, 2015 and 2014 | F-358F-293
| | | | Consolidated Statements of Operations For the Years Ended June 30, 2015, 2014, and 2013 | F-359
F-294 | | | | Consolidated Statements of Changes in Members’ Deficit For the Years Ended June 30, 2015, 2014, and 2013 | F-295 | | | Consolidated Statements of Cash Flows For the Years Ended June 30, 2015, 2014, and 2013 | F-360
| | | Consolidated Statements of Cash Flows
For the Years Ended June 30, 2015, 2014, and 2013
| F-361F-296
| | | | Consolidated Notes to Financial Statements June 30, 2015, 2014, and 2013 | F-362F-297
| | | | | | | | | | | | | | | | | | | | | |
INDEPENDENT AUDITORS REPORT
New Lipstick LLC and Subsidiary
We have audited the accompanying consolidated financial statements of New Lipstick LLC and Subsidiary, which comprise the balance sheets as of June 30, 2015 and 2014 the related statements of operations, changes in members’ deficit and cash flows for the years ended June 30, 2015, 2014 and 2013, and the related notes to the consolidated financial statements. Management’s Responsibility for the Consolidated Financial Statements Management is responsible for the preparation and fair presentation of these consolidated financial statements in accordance with accounting principles generally accepted in the United States of America; this includes the design, implementation, and maintenance of internal control relevant to the preparation and fair presentation of financial statements that are free from material misstatement, whether due to fraud or error. Auditors’ Responsibility Our responsibility is to express an opinion on these consolidated financial statements based on our audits. We conducted our audits in accordance with auditing standards generally accepted in the United States of America. Those standards require that we plan and perform the audit to obtain reasonable assurance about whether the financial statements are free from material misstatement. An audit involves performing procedures to obtain audit evidence about the amounts and disclosures in the consolidated financial statements. The procedures selected depend on the auditors’ judgment, including the assessment of the risks of material misstatement of the financial statements, whether due to fraud or error. In making those risk assessments, the auditor considers internal control relevant to the entity’s preparation and fair presentation of the consolidated financial statements in order to design audit procedures that are appropriate in the circumstances, but not for the purpose of expressing an opinion on the effectiveness of the entity’s internal control. Accordingly, we express no such opinion. An audit also includes evaluating the appropriateness of accounting policies used and the reasonableness of significant accounting estimates made by management, as well as evaluating the overall presentation of the consolidated financial statements. We believe that the audit evidence we have obtained is sufficient and appropriate to provide a basis for our audit opinion. Opinion In our opinion, the consolidated financial statements referred to above present fairly, in all material respects, the financial position of New Lipstick LLC and Subsidiary, as of June 30, 2015 and 2014, and the results of its operations and its cash flows for the years ended June 30, 2015, 2014, and 2013, in accordance with accounting principles generally accepted in the United States of America. By:
/s/Marks Paneth LLP
New York, NY November 13, 2015
October 31, 2016 | NEW LIPSTICK LLC AND SUBSIDIARY | | (A LIMITED LIABILITY COMPANY) | | | | | | | CONSOLIDATED BALANCE SHEETS | | AS OF JUNE 30, | | (Amounts in US dollars) | | | | | | | | | ASSETS | | | | | | | | | | | | | 2015 | | 2014 | | | | | | | Real estate, net | $ 140,469,010 | | $ 142,358,747 | | Cash and cash equivalents | 1,075,395 | | 851,726 | | Tenant receivables, net of allowance for doubtful accounts of | | | | | $132,141 and $7,264 respectively | 344,104 | | 422,944 | | Prepaid expenses and other assets | 5,809,307 | | 5,476,492 | | Due from related party | 125,029 | | 120,274 | | Restricted cash | 3,477,967 | | 6,155,597 | | Deferred rent receivable | 8,856,399 | | 6,938,578 | | Lease intangibles, net | 26,533,839 | | 30,012,973 | | Goodwill | 5,422,615 | | 5,422,615 | | | | | | | Total | $ 192,113,665 | | $ 197,759,946 | | | | | | | | | | | | LIABILITIES AND MEMBERS' DEFICIT | | | | | | | Liabilities: | | | | | Note payable | $ 113,201,357 | | $ 113,201,357 | | Accrued interest payable | 316,216 | | 313,950 | | Accounts payable and accrued expenses | 3,031,831 | | 1,584,699 | | Due to related parties | 319,133 | | 553,616 | | Deferred revenue | 918,800 | | 619,885 | | Tenants’ security deposits | 682,727 | | 657,978 | | Deferred ground rent payable | 136,727,666 | | 108,312,912 | | Lease intangibles, net | 42,365,499 | | 45,279,291 | | | | | | | Total liabilities | 297,563,229 | | 270,523,688 | | | | | | | Members' deficit | (105,449,564) | | (72,763,742) | | | | | | | Total | $ 192,113,665 | | $ 197,759,946 | | | | | | See Notes to Consolidated Financial Statements | | | |
NEW LIPSTICK LLC AND SUBSIDIARY | (A LIMITED LIABILITY COMPANY) | | | CONSOLIDATED BALANCE SHEETS | AS OF JUNE 30, | (Amounts in US dollars) | | |
ASSETS
| | | 2015 | | | 2014 | | | | | | | | | | | Real estate, net | | $ | 140,469,010 | | | $ | 142,358,747 | | | Cash and cash equivalents | | | 1,075,395 | | | | 851,726 | | | Tenant receivables, net of allowance for doubtful accounts of | | | | | | | | | | $132,141 and $7,264 respectively | | | 344,104 | | | | 422,944 | | | Prepaid expenses and other assets | | | 5,809,307 | | | | 5,476,492 | | | Due from related party | | | 125,029 | | | | 120,274 | | | Restricted cash | | | 3,477,967 | | | | 6,155,597 | | | Deferred rent receivable | | | 8,856,399 | | | | 6,938,578 | | | Lease intangibles, net | | | 26,533,839 | | | | 30,012,973 | | | Goodwill | | | 5,422,615 | | | | 5,422,615 | | | | | | | | | | | | | Total | | $ | 192,113,665 | | | $ | 197,759,946 | | | | | | | | | | | | | | | | | | | | | |
NEW LIPSTICK LLC AND SUBSIDIARY | | (A LIMITED LIABILITY COMPANY) | | | | | | | | CONSOLIDATED STATEMENTS OF OPERATIONS | | FOR THE YEARS ENDED JUNE 30, | | (Amounts in US dollars) | | | | | | | | | | | | | | | | | | | 2015 | | 2014 | | 2013 | | Revenues | | | | | | | Base rents | $ 40,597,526 | | $ 38,375,303 | | $ 38,146,887 | | Tenant reimbursements and escalations | 6,903,479 | | 5,427,358 | | 5,354,160 | | Other rental revenue | 40,779 | | 45,292 | | 73,833 | | Other revenue | 1,622 | | - | | - | | Interest income | - | | - | | 625 | | | | | | | | | Total | 47,543,406 | | 43,847,953 | | 43,575,505 | | | | | | | | | Expenses | | | | | | | Real estate taxes | 10,716,257 | | 9,919,196 | | 9,442,029 | | Utilities | 2,927,214 | | 2,598,340 | | 2,511,198 | | Janitorial | 2,056,750 | | 2,157,449 | | 2,054,086 | | Insurance | 318,027 | | 315,545 | | 296,897 | | Repairs and maintenance | 2,262,799 | | 1,445,342 | | 1,332,208 | | Bad debt expense | 124,877 | | - | | 433,551 | | Security | 1,047,372 | | 912,362 | | 846,602 | | General and administrative | 835,373 | | 829,010 | | 875,597 | | Management fees | 988,189 | | 948,084 | | 877,898 | | Elevator | 311,875 | | 286,013 | | 174,475 | | HVAC | 62,442 | | 107,515 | | 48,947 | | Tenant reimbursable costs | 154,557 | | 122,139 | | 159,564 | | Ground rent | 45,457,736 | | 45,457,735 | | 45,457,737 | | Interest expense | 4,786,205 | | 4,789,913 | | 4,843,275 | | Amortization | 3,005,570 | | 3,087,330 | | 2,947,812 | | Depreciation | 5,599,278 | | 4,886,008 | | 4,428,733 | | | | | | | | | Total | 80,654,521 | | 77,861,981 | | 76,730,609 | | | | | | | | | Net loss | $ (33,111,115) | | $ (34,014,028) | | $ (33,155,104) | | | | | | | |
LIABILITIES AND MEMBERS' DEFICIT
| Liabilities: | | | | | | | | Note payable | | $ | 113,201,357 | | | $ | 113,201,357 | | | Accrued interest payable | | | 316,216 | | | | 313,950 | | | Accounts payable and accrued expenses | | | 3,031,831 | | | | 1,584,699 | | | Due to related parties | | | 319,133 | | | | 553,616 | | | Deferred revenue | | | 918,800 | | | | 619,885 | | | Tenants’ security deposits | | | 682,727 | | | | 657,978 | | | Deferred ground rent payable | | | 136,727,666 | | | | 108,312,912 | | | Lease intangibles, net | | | 42,365,499 | | | | 45,279,291 | | | | | | | | | | | | | Total liabilities | | | 297,563,229 | | | | 270,523,688 | | | | | | | | | | | | | Members' deficit | | | (105,449,564 | ) | | | (72,763,742 | ) | | | | | | | | | | | | Total | | $ | 192,113,665 | | | $ | 197,759,946 | | | | | | | | | | | |
See Notes to Consolidated Financial Statements
NEW LIPSTICK LLC AND SUBSIDIARY | (A LIMITED LIABILITY COMPANY) | | CONSOLIDATED STATEMENTS OF OPERATIONS | FOR THE YEARS ENDED JUNE 30, | (Amounts in US dollars) |
| NEW LIPSTICK LLC AND SUBSIDIARY | | (A LIMITED LIABILITY COMPANY) | | | | | | | CONSOLIDATED STATEMENTS OF CHANGES IN MEMBERS' DEFICIT | | FOR THE YEARS ENDED JUNE 30, | | (Amounts in US dollars) | | | | | | | | | | | | 2015 | | 2014 | | 2013 | | | | | | | | | Balance, beginning of years | $ (72,763,742) | | $ (43,679,661) | | $ (20,096,088) | | | | | | | | | Contributions from members | 425,293 | | 4,952,500 | | 9,571,531 | | | | | | | | | Distribution to member | - | | (22,553) | | - | | | | | | | | | Net loss | (33,111,115) | | (34,014,028) | | (33,155,104) | | | | | | | | | Balance, end of years | $ (105,449,564) | | $ (72,763,742) | | $ (43,679,661) | | | | | | | | | | | | | | |
| | | | | | | | | | | | | | 2015 | | | 2014 | | | 2013 | | | Revenues | | | | | | | | | | | Base rents | | $ | 40,597,526 | | | $ | 38,375,303 | | | $ | 38,146,887 | | | Tenant reimbursements and escalations | | | 6,903,479 | | | | 5,427,358 | | | | 5,354,160 | | | Other rental revenue | | | 40,779 | | | | 45,292 | | | | 73,833 | | | Other revenue | | | 1,622 | | | | - | | | | - | | | Interest income | | | - | | | | - | | | | 625 | | | | | | | | | | | | | | | | | Total | | | 47,543,406 | | | | 43,847,953 | | | | 43,575,505 | | | | | | | | | | | | | | | | | Expenses | | | | | | | | | | | | | | Real estate taxes | | | 10,716,257 | | | | 9,919,196 | | | | 9,442,029 | | | Utilities | | | 2,927,214 | | | | 2,598,340 | | | | 2,511,198 | | | Janitorial | | | 2,056,750 | | | | 2,157,449 | | | | 2,054,086 | | | Insurance | | | 318,027 | | | | 315,545 | | | | 296,897 | | | Repairs and maintenance | | | 2,262,799 | | | | 1,445,342 | | | | 1,332,208 | | | Bad debt expense | | | 124,877 | | | | - | | | | 433,551 | | | Security | | | 1,047,372 | | | | 912,362 | | | | 846,602 | | | General and administrative | | | 835,373 | | | | 829,010 | | | | 875,597 | | | Management fees | | | 988,189 | | | | 948,084 | | | | 877,898 | | | Elevator | | | 311,875 | | | | 286,013 | | | | 174,475 | | | HVAC | | | 62,442 | | | | 107,515 | | | | 48,947 | | | Tenant reimbursable costs | | | 154,557 | | | | 122,139 | | | | 159,564 | | | Ground rent | | | 45,457,736 | | | | 45,457,735 | | | | 45,457,737 | | | Interest expense | | | 4,786,205 | | | | 4,789,913 | | | | 4,843,275 | | | Amortization | | | 3,005,570 | | | | 3,087,330 | | | | 2,947,812 | | | Depreciation | | | 5,599,278 | | | | 4,886,008 | | | | 4,428,733 | | | | | | | | | | | | | | | | | Total | | | 80,654,521 | | | | 77,861,981 | | | | 76,730,609 | | | | | | | | | | | | | | | | | Net loss | | $ | (33,111,115 | ) | | $ | (34,014,028 | ) | | $ | (33,155,104 | ) |
See Notes to Consolidated Financial Statements
NEW LIPSTICK LLC AND SUBSIDIARY | (A LIMITED LIABILITY COMPANY) | | | | CONSOLIDATED STATEMENTS OF CHANGES IN MEMBERS' DEFICIT | FOR THE YEARS ENDED JUNE 30, | (Amounts in US dollars) |
| | | 2015 | | | 2014 | | | 2013 | | | | | | | | | | | | | | Balance, beginning of years | | $ | (72,763,742 | ) | | $ | (43,679,661 | ) | | $ | (20,096,088 | ) | | | | | | | | | | | | | | | | Contributions from members | | | 425,293 | | | | 4,952,500 | | | | 9,571,531 | | | | | | | | | | | | | | | | | Distribution to member | | | - | | | | (22,553 | ) | | | - | | | | | | | | | | | | | | | | | Net loss | | | (33,111,115 | ) | | | (34,014,028 | ) | | | (33,155,104 | ) | | | | | | | | | | | | | | | | Balance, end of years | | $ | (105,449,564 | ) | | $ | (72,763,742 | ) | | $ | (43,679,661 | ) | | | | | | | | | | | | | | | | | | | | | | | | | | | | |
See Notes to Consolidated Financial Statements
| NEW LIPSTICK LLC AND SUBSIDIARY | | (A LIMITED LIABILITY COMPANY) | | CONSOLIDATED STATEMENTS OF CASH FLOWS |
| | FOR THE YEARS ENDED JUNE 30, | | (Amounts in US dollars) | | | | | | | | | | | | | | 2015 | | 2014 | | 2013 | | | | | | | | | | Operating activities | | | | | | | | Net loss | | $ (33,111,115) | | $ (34,014,028) | | $ (33,155,104) | | Adjustments to reconcile net loss to net cash | | | | | | | | used in operating activities: | | | | | | | | Amortization | | 3,005,570 | | 3,087,330 | | 2,947,812 | | Depreciation | | 5,599,278 | | 4,886,008 | | 4,428,733 | | Bad debt (recovery) expense | | 124,877 | | (3,827) | | 433,551 | | Deferred rent | | (1,917,821) | | (1,929,668) | | (1,972,066) | | Below market lease amortization | | (2,475,983) | | (2,821,032) | | (3,287,160) | | Above market lease amortization | | 1,442,682 | | 1,544,576 | | 1,548,129 | | Above market ground lease amortization | | (437,809) | | (437,809) | | (437,808) | | Deferred ground rent | | 28,414,754 | | 28,822,593 | | 29,220,501 | | Changes in operating assets and liabilities: | | | | | | | | Restricted cash | | 2,702,379 | | 525,764 | | (2,616,256) | | Due from related party | | (4,755) | | - | | 4,000 | | Tenant receivables | | (46,037) | | (86,094) | | (78,989) | | Prepaid expenses and other assets | | (332,815) | | (340,620) | | (233,930) | | Accrued interest payable | | 2,273 | | (3,019) | | (3,332) | | Accounts payable and accrued expenses | | 349,380 | | 33,811 | | (569,720) | | Due to related parties | | (234,483) | | 208,304 | | 34,445 | | Deferred leasing costs | | (994,677) | | (1,526,938) | | (795,940) | | Unearned revenue | | 298,915 | | 310,488 | | 51,876 | | Net cash (used in) provided by operating activities | | 2,384,613 | | (1,744,161) | | (4,481,258) | | | | | | | | | | Investing activities | | | | | | | | Additions to real estate | | (2,586,237) | | (3,700,979) | | (4,934,785) | | Net cash used in investing activities | | (2,586,237) | | (3,700,979) | | (4,934,785) | | | | | | | | | | Financing activities | | | | | | | | Note principal payments | | - | | (1,912) | | (110,817) | | Contributions from members | | 425,293 | | 4,952,500 | | 9,571,531 | | Net cash provided by financing activities | | 425,293 | | 4,950,588 | | 9,460,714 | | | | | | | | | | Net (decrease) increase in cash and cash equivalents | | 223,669 | | (494,552) | | 44,671 | | | | | | | | | | Cash and cash equivalents, beginning of years | | 851,726 | | 1,346,278 | | 1,301,607 | | | | | | | | | | Cash and cash equivalents, end of years | | $ 1,075,395 | | $ 851,726 | | $ 1,346,278 | | | | | | | | | | Supplemental disclosure of cash flow information: | | | | | | | | Interest paid | | $ 4,783,939 | | $ 4,792,932 | | $ 4,846,607 | | | | | | | | | | Schedule of Noncash Investing Activities | | | | | | | | Real estate additions were financed through accounts payable | | $ 1,691,693 | | $ 568,390 | | $ 507,133 | | | | | | | | | | Deferred leasing costs additions were financed through accounts payable | | $ 90,308 | | $ 115,867 | | $ - | | | | | | | | | | Schedule of Noncash Financing Activities | | | | | | | | Lobby exhibit acquired in the year ended June 30, 2013, included in real | | | | | | | | estate, and transferred to a 49% member of the Company as a distribution. | | $ - | | $ 22,553 | | $ - | See Notes to Consolidated Financial Statements | | | | | | |
NEW LIPSTICK LLC AND SUBSIDIARY
(A LIMITED LIABILITY COMPANY)
CONSOLIDATED STATEMENTS OF CASH FLOWS
FOR THE YEAR ENDED JUNE 30,
(Amounts in US dollars)
| | | 2015 | | | 2014 | | | 2013 | | | | | | | | | | | | | | Operating activities | | | | | | | | | | | Net loss | | $ | (33,111,115 | ) | | $ | (34,014,028 | ) | | $ | (33,155,104 | ) | | Adjustments to reconcile net loss to net cash | | | | | | | | | | | | | | used in operating activities: | | | | | | | | | | | | | | Amortization | | | 3,005,570 | | | | 3,087,330 | | | | 2,947,812 | | | Depreciation | | | 5,599,278 | | | | 4,886,008 | | | | 4,428,733 | | | Bad debt (recovery) expense | | | 124,877 | | | | (3,827 | ) | | | 433,551 | | | Deferred rent | | | (1,917,821 | ) | | | (1,929,668 | ) | | | (1,972,066 | ) | | Below market lease amortization | | | (2,475,983 | ) | | | (2,821,032 | ) | | | (3,287,160 | ) | | Above market lease amortization | | | 1,442,682 | | | | 1,544,576 | | | | 1,548,129 | | | Above market ground lease amortization | | | (437,809 | ) | | | (437,809 | ) | | | (437,808 | ) | | Deferred ground rent | | | 28,414,754 | | | | 28,822,593 | | | | 29,220,501 | | | Changes in operating assets and liabilities: | | | | | | | | | | | | | | Restricted cash | | | 2,702,379 | | | | 525,764 | | | | (2,616,256 | ) | | Due from related party | | | (4,755 | ) | | | - | | | | 4,000 | | | Tenant receivables | | | (46,037 | ) | | | (86,094 | ) | | | (78,989 | ) | | Prepaid expenses and other assets | | | (332,815 | ) | | | (340,620 | ) | | | (233,930 | ) | | Accrued interest payable | | | 2,273 | | | | (3,019 | ) | | | (3,332 | ) | | Accounts payable and accrued expenses | | | 349,380 | | | | 33,811 | | | | (569,720 | ) | | Due to related parties | | | (234,483 | ) | | | 208,304 | | | | 34,445 | | | Deferred leasing costs | | | (994,677 | ) | | | (1,526,938 | ) | | | (795,940 | ) | | Unearned revenue | | | 298,915 | | | | 310,488 | | | | 51,876 | | | Net cash (used in) provided by operating activities | | | 2,384,613 | | | | (1,744,161 | ) | | | (4,481,258 | ) | | | | | | | | | | | | | | | | Investing activities | | | | | | | | | | | | | | Additions to real estate | | | (2,586,237 | ) | | | (3,700,979 | ) | | | (4,934,785 | ) | | Net cash used in investing activities | | | (2,586,237 | ) | | | (3,700,979 | ) | | | (4,934,785 | ) | | | | | | | | | | | | | | | | Financing activities | | | | | | | | | | | | | | Note principal payments | | | - | | | | (1,912 | ) | | | (110,817 | ) | | Contributions from members | | | 425,293 | | | | 4,952,500 | | | | 9,571,531 | | | Net cash provided by financing activities | | | 425,293 | | | | 4,950,588 | | | | 9,460,714 | | | | | | | | | | | | | | | | | Net (decrease) increase in cash and cash equivalents | | | 223,669 | | | | (494,552 | ) | | | 44,671 | | | | | | | | | | | | | | | | | Cash and cash equivalents, beginning of years | | | 851,726 | | | | 1,346,278 | | | | 1,301,607 | | | | | | | | | | | | | | | | | Cash and cash equivalents, end of years | | $ | 1,075,395 | | | $ | 851,726 | | | $ | 1,346,278 | | | | | | | | | | | | | | | | | Supplemental disclosure of cash flow information: | | | | | | | | | | | | | | Interest paid | | $ | 4,783,939 | | | $ | 4,792,932 | | | $ | 4,846,607 | | | | | | | | | | | | | | | | | Schedule of Noncash Investing Activities | | | | | | | | | | | | | | Real estate additions were financed through accounts payable | | $ | 1,691,693 | | | $ | 568,390 | | | $ | 507,133 | | | | | | | | | | | | | | | | | Deferred leasing costs additions were financed through accounts payable | | $ | 90,308 | | | $ | 115,867 | | | $ | - | | | | | | | | | | | | | | | | | Schedule of Noncash Financing Activities | | | | | | | | | | | | | | Lobby exhibit acquired in the year ended June 30, 2013, included in real | | | | | | | | | | | | | | estate, and transferred to a 49% member of the Company as a distribution. | | $ | - | | | $ | 22,553 | | | $ | - | |
See Notes to Consolidated Financial Statements
New Lipstick LLC and Subsidiary (A Limited Liability Company)
Notes to Consolidated Financial Statements June 30, 2015, 2014 and 2013 (Amounts in US dollars)
Formation and Property Description New Lipstick LLC (the "Company"), was organized as a Delaware limited liability company and commenced operations on November 3, 2010. The Company was formed among IRSA International, LLC ("IRSA"), Marciano Investment Group, LLC ("Marciano"), Avi Chicouri ("AVI"), Par Holdings, LLC ("PAR"), and Armenonville S.A. ("Armenonville"), collectively (the "Members"). On December 15, 2010, Armenonville assigned 100 percent of itsmembershipits membership interest to Lomas Urbanas S.A. IRSA is a wholly-owned subsidiary of TYRUS S.A. ("TYRUS"), a wholly-owned subsidiary of IRSA Inversiones y Representaciones Sociedad Anonima, a company whose shares are listed on the Buenos Aires and New York Stock Exchanges. The Company was formed in order to acquire 100% interest in Metropolitan 885 Third Avenue Leasehold LLC ("Metropolitan"), its wholly-owned subsidiary, and to provide management services to Metropolitan. Metropolitan was organized for the purpose of acquiring and operating a 34 story Class A office tower commonly known as the Lipstick Building located at 885 Third Avenue in New York (the "Property"). Metropolitan leased the land which contains approximately 26,135 square feet. The Property was acquired on July 9, 2007 and contains approximately 635,800 square feet of rentable space, consisting of retail and office spaces. On November 16, 2010 (the "Petition Date"), Metropolitan filed a voluntary pre-packaged plan of reorganization under Chapter 11 of Title 11 of the United States Bankruptcy Code (the "Chapter 11") in the Southern District of New York (the "Bankruptcy Court") including a disclosure statement and plan of reorganization (the "Plan"). The Plan provided for, among other things, the extinguishment of 100% of the shares of Metropolitan and the issuance of the membership interest to the Company. The Plan was approved by Metropolitan's members and the Bankruptcy Court approved the Plan on December 22, 2010 with an effective date of December 30, 2010 (the "Effective Date"). Metropolitan accounted for the reorganization using "fresh start accounting" effective December 30, 2010. Accordingly, the forgiveness of debt was reflected in the predecessor entity's final statement of operations and all assets and liabilities were restated to reflect their reorganization value. The Company operates under the guidelines of an Operating Agreement (the "Agreement") entered into by the Members on November 15, 2010. The manager of the Company is Lipstick Management, LLC (“LM”), a company affiliated to IRSA. The Agreement calls for Class A and Class B Members. Class A Members are IRSA, Marciano, and Armenonville and Class B Members are AVI and PAR. Class B Membership interests of any Class B Member shall be automatically converted, in whole and not in part, into an equal number of Class A Membership interests on the earlier to occur of the date on which LM certifies that all unreturned additional Class A capital contributions and all unreturned Class A capital contributions have been reduced to zero.
New Lipstick LLC and Subsidiary (A Limited Liability Company)
Notes to Consolidated Financial Statements June 30, 2015, 2014 and 2013 (Amounts in US dollars)
NOTE 1: BUSINESS (CONTINUED)
Formation and Property Description (continued) Any Class A Member, as defined in the Agreement, may transfer, directly or indirectly, any or all of its percentage interest as a Member in the Company to an unaffiliated third party, but the offering Member must first offer the Right of First Offer ("ROFO") to each of the Class A Members by written notice specifying the cash price and the other terms and conditions of the offer. Upon receipt of the ROFO notice, each of the offeree members has the right, exercisable in ten (10) days, to accept or decline the offer. The Company shall continue perpetually until dissolution, liquidation or termination. The liability of the members of the Company is limited to the members´ total contribution, plus any amounts guaranteed by the members. The Company has adopted a fiscal year end of June 30. The terms of the Agreement provide for initial capital contributions and percentage interests as follows:
| | | Percentage of Ownership | | | Initial Capital Contributions | | Percentage of Ownership | | Initial Capital Contributions | | IRSA International, LLC | | | 49.00 | | | $ | 15,417,925 | | 49.00 | | $15,417,925 | | Marciano Investment Group, LLC | | | 42.00 | | | | 13,215,365 | | 42.00 | | 13,215,365 | | Lomas Urbanas S.A. | | | 2.27 | | | | 714,259 | | 2.27 | | 714,259 | | Avi Chicouri | | | 3.07 | | | | - | | 3.07 | | - | | Par Holdings, LLC | | | 3.66 | | | | - | | 3.66 | | - | | Total | | | 100.00 | | | $ | 29,347,549 | | 100.00 | | $29,347,549 |
In accordance with the Agreement, the Members may be required to make additional capital contributions which are reasonably related to the operations and/or leasing of the Property and its activities. The Members contributed $ 425,293, $4,952,500, and $9,571,531 for the years ended June 30, 2015, 2014, and 2013, respectively. Distributions Distribution of capital will be made to the Member at the times, and in aggregate amounts determined by the Board of Directors of the Company. Distributions amounted to $22,553 for the year ended June 30, 2014. There were no distributions for the years ended June 30, 2015 and 2013. Allocation of Profit and Losses The Company´s profits and losses are allocated to the Members.
New Lipstick LLC and Subsidiary (A Limited Liability Company)
Notes to Consolidated Financial Statements June 30, 2015, 2014 and 2013 (Amounts in US dollars)
NOTE 2: SUMMARY OF SIGNIFICANT ACCOUNTING POLICIES Principles of Consolidation The accompanying consolidated financial statements of the Company include the accounts of New Lipstick LLC and its wholly-owned subsidiary Metropolitan. All significant intercompany accounts and transactions have been eliminated. Basis of Accounting The consolidated financial statements have been prepared in accordance with accounting principles generally accepted in the United States of America ("GAAP"). Use of Estimates Management is required to use estimates and assumptions in preparing financial statements in conformity with GAAP. Those estimates and assumptions affect the reported amounts of assets and liabilities, the disclosure of contingent assets and liabilities, and the reported revenues and expenses. Accordingly, actual results could differ from those estimates. Real Estate Real estate consists of building, building improvements and tenant improvements and is stated at cost. Building and improvements are depreciated over 39 years. Tenant improvements are depreciated over the shorter of the estimated useful life of the asset or the terms of the respective leases. Ordinary repairs and maintenance are expensed as incurred; major replacements and betterments are capitalized to building improvements and depreciated over their estimated useful lives. The Company reviews its long-lived assets and certain identifiable intangibles for impairment whenever events or changes in circumstances indicate that the carrying amount of an asset may not be recoverable. Recoverability of assets to be held and used is determined by a comparison of the carrying amount of an asset to future net undiscounted cash flows expected to be generated by the assets. If the carrying value of the assets exceeds such cash flows, the assets are considered impaired. The impairment charge to be recognized is measured by the amount by which the carrying amount of the assets exceeds their estimated fair value. No impairment was recorded for the years ended June 30, 2015 and 2014. Cash and Cash Equivalents The Company considers all highly liquid investments with maturities of three months or less upon acquisition to be cash equivalents. Concentration of Credit Risk Financial instruments that potentially subject the Company to concentration of credit risk consist of cash and cash equivalent accounts in financial institutions. The Company maintains its cash balances at two financial institutions. At times, such balances may be in excess of the Federal Deposit Insurance Company (FDIC) insurance limit. According to the FDIC insurance limit, deposits held in noninterest-bearing transaction accounts are aggregated with any interest-bearing deposits the Company may hold in the same ownership category, and the combined total insured is up to at least $250,000. As of June 30, 2015 and 2014, these balances at one of the institutions, including tenant security and escrow amounts, were in excess of federally insurable limits by approximately $3,985,000 and $6,521,000, respectively. New Lipstick LLC and Subsidiary (A Limited Liability Company)
Notes to Consolidated Financial Statements June 30, 2015, 2014 and 2013 (Amounts in US dollars)
NOTE 2: SUMMARY OF SIGNIFICANT ACCOUNTING POLICIES (CONTINUED) Restricted Cash Restricted cash represents amounts held in escrow, as required by the lender, to be used for real estate taxes, insurance and other qualified expenditures, as well as tenant security deposits. Tenant Receivables The Company carries its tenant receivables at the amount due pursuant to lease agreements but uncollected at period end, less an allowance for doubtful accounts. The Company evaluates its receivables and establishes an allowance for doubtful accounts, based on a history of past write-offs, collections and current conditions. Revenue Recognition The Company recognizes base rent on a straight-line basis over the terms of the respective leases. Deferred rent receivable represents the amount by which straight-line rental revenue exceeded rents currently billed in accordance with the lease agreements. Capitalized below market lease values are amortized as an increase to base rents (see Note 4). Capitalized above market lease values are amortized as a decrease to base rents (see Note 4). The Company also receives reimbursements from tenants for certain costs as provided for in the lease agreements. These costs include real estate taxes, utilities, insurance, common area maintenance and other recoverable costs in excess of a base year amount. The reimbursements are recognized when the tenants are billed. Deferred income represents rent collected in advance of being due. Deferred Ground Rents Ground rent expense is accounted for on a straight-line basis over the non-cancelable terms of the ground leases. All future minimum increases in the non-cancelable ground rents consist of either 2.5% or 3% annual increases through May 1, 2068. This has resulted in deferred ground rent payable in the amount of $136,727,666 and $108,312,912 as of June 30, 2015 and 2014, respectively (see Note 6). Lease Intangibles Leasing costs and commissions incurred in connection with leasing activities are capitalized and amortized on a straight-line basis over the lives of the respective leases. Unamortized deferred leasing costs are charged to amortization expense upon early termination of the lease. Above and below market leases and above market ground lease values were recorded on the Property's reorganization date based on the present value (using an interest rate which reflected the risk associated with the leases acquired) of the difference between (i) the contractual amounts to be paid pursuant to the in-place leases and ground lease, and (ii) management's estimate of fair market lease rates for the corresponding in-place leases and ground lease, measured over a period equal to the remaining non-cancelable term of the leases.
New Lipstick LLC and Subsidiary (A Limited Liability Company)
Notes to Consolidated Financial Statements June 30, 2015, 2014 and 2013 (Amounts in US dollars)
NOTE 2: SUMMARY OF SIGNIFICANT ACCOUNTING POLICIES (CONTINUED) Lease Intangibles (continued) Above market lease values are capitalized as an asset and amortized as a decrease to rental income over the remaining terms of the respective leases. The above market ground lease value is capitalized as a liability and amortized to ground rent expense over the remaining term of the ground lease. Below market lease values are capitalized as a liability and amortized as an increase to rental income over the remaining terms of the respective leases. The aggregate value of in-place leases were measured based on the difference between (i) the Property valued with existing in-place leases adjusted to market rental rates, and (ii) the Property valued as if vacant, based upon management's estimates. Factors considered by management in their analysis included an estimate of carrying costs during the expected lease-up periods considering current market conditions and costs to execute similar leases. In estimating carrying costs, management included real estate taxes, insurance and other operating expenses and estimates of lost rentals at market rates during the expected lease-up periods, which primarily were a year. Management also estimated costs to execute similar leases including leasing commissions, legal and other related expenses. The value of in-place leases are amortized to expense over the initial term of the respective leases. As of June 30, 2015, the remaining terms were ranging from three months to ten years. Income Taxes No provision for income taxes is necessary in the accompanying consolidated financial statements because the Company is a disregarded entity for federal and state income tax purposes. Income or loss of the Company is includible in the separate income tax returns of the Members. Prior to the effective date of reorganization on December 30, 2010, the Company was treated as a partnership for federal and state income tax purposes. The Company performed a review for uncertainty in income tax positions in accordance with authoritative guidance. As of June 30, 2015, the Company does not believe it has any uncertain tax positions that would qualify for either recognition or disclosure in the consolidated financial statements. The Company is no longer subject to federal or state and local income tax examinations by tax authorities for tax years ending before December 31, 2011. Management continually evaluates expiring statutes of limitations, audits, proposed settlements, changes in tax laws and new authoritative rulings. The Company´s income tax returns for its tax years commencing January 1, 2009, through December 30, 2010, have been selected by the New York State Department of Taxation and Finance for audit. Such audit is in its preliminary stage. At this time, the Company has not been advised of any proposed changes to its New York State income tax returns filed for the tax years January 1, 2009 through December 30, 2010.
New Lipstick LLC and Subsidiary (A Limited Liability Company)
Notes to Consolidated Financial Statements June 30, 2015, 2014 and 2013 (Amounts in US dollars)
NOTE 2: SUMMARY OF SIGNIFICANT ACCOUNTING POLICIES (CONTINUED) Goodwill
Goodwill Goodwill represents the excess of the cost of the December 30, 2010 acquisition of Metropolitan over the net of the amounts assigned to assets acquired, including identifiable intangible assets, and liabilities assumed. In accordance with GAAP goodwill is not amortized but is subject to annual impairment tests. Annual impairment tests are performed by either comparing a “reporting units” (in the Company’s case, the Company as a whole) estimated fair value to its carrying amount or by doing a qualitative assessment of a reporting units fair value from the last quantitative assessment to determine if there is a potential impairment. A qualitative assessment may be done when the results of the previous quantitative test indicated the reporting unit’s estimated fair value was significantly in excess of the carrying value of its net assets and we do not believe there have been significant changes in the reporting unit’s operations that would significantly decrease its estimated fair value or significantly increase its net assets. Management has selected the end of the Company’s fiscal year as the date on which to either perform its annual impairment tests for goodwill or make the determination as to whether qualitative factors render it unnecessary. As of June 30, 2015 and 2014, the date of the impairment tests, no impairment of goodwill was identified. Reclassifications Certain prior year balances have been reclassified to conform to the current year consolidated financial statement presentation. | Certain prior year balances have been reclassified to conform to the current year consolidated financial statement presentation. |
Subsequent Events The Company has evaluated for potential recognition and disclosure, events subsequent to the date of the balance sheet through October 26, 2015, the date the consolidated financial statements were available to be issued.
NOTE 3: REAL ESTATE
At June 30, real estate consists of the following:
| | | 2015 | | | 2014 | | 2015 | 2014 | | Building and improvements | | $ | 144,892,369 | | | $ | 144,879,174 | | $144,892,369 | $144,879,174 | | Tenant improvements | | | 16,334,789 | | | | 12,638,444 | | 16,334,789 | 12,638,444 | | | | | 161,227,158 | | | | 157,517,618 | | 161,227,158 | 157,517,618 | | Less: accumulated depreciation | | | (20,758,148 | ) | | | (15,158,871 | ) | (20,758,148) | (15,158,871) | | Total | | $ | 140,469,010 | | | $ | 142,358,747 | | $140,469,010 | $142,358,747 |
| Depreciation expense amounted to $5,599,278 and $4,886,008, and $4,428,733 for the years ended June 30, 2015, 2014, and 2013, respectively. |
.
New Lipstick LLC and Subsidiary (A Limited Liability Company)
Notes to Consolidated Financial Statements June 30, 2015, 2014 and 2013 (Amounts in US dollars)
NOTE 4: LEASE INTANGIBLES
NOTE 4: LEASE INTANGIBLES Lease intangibles and the value of assumed lease obligations at June 30, 2015, were as follows: | | | Leases In-place | | | Leasing Costs | | | Above Market Leases | | | Total | | | Below Market Leases | | | Above Market Ground Leases | | | Total | | Leases In-place | Leasing Costs | Above Market Leases | Total | Below Market Leases | Above Market Ground Leases | Total | | Cost | | $ | 27,149,892 | | | $ | 4,111,694 | | | $ | 15,316,749 | | | $ | 46,578,335 | | | $ | 30,470,806 | | | $ | 29,041,332 | | | $ | 59,512,138 | | $27,149,892 | $4,111,694 | $15,316,749 | $46,578,335 | $30,470,806 | $29,041,332 | $59,512,138 | Less: accumulated Amortization | | | (12,088,790 | ) | | | (1,083,075 | ) | | | (6,872,631 | ) | | | (20,044,496 | ) | | | (15,176,499 | ) | | | (1,970,140 | ) | | | (17,146,639 | ) | (12,088,790) | (1,083,075) | (6,872,631) | (20,044,496) | (15,176,499) | (1,970,140) | (17,146,639) | | Totals | | $ | 15,061,102 | | | $ | 3,028,619 | | | $ | 8,444,118 | | | $ | 26,533,839 | | | $ | 15,294,307 | | | $ | 27,071,192 | | | $ | 42,365,499 | | $15,061,102 | $3,028,619 | $8,444,118 | $26,533,839 | $ 15,294,307 | $27,071,192 | $42,365,499 |
Lease intangibles and the value of assumed lease obligations at June 30, 2014 were as follows:
| | | Leases In-place | | | Leasing Costs | | | Above Market Leases | | | Total | | | Below Market Leases | | | Above Market Ground Leases | | | Total | | Leases In-place | Leasing Costs | Above Market Leases | Total | Below Market Leases | Above Market Ground Leases | Total | | Cost | | $ | 27,149,892 | | | $ | 3,142,576 | | | $ | 15,316,749 | | | $ | 45,609,217 | | | $ | 30,470,806 | | | $ | 29,041,332 | | | $ | 59,512,138 | | $27,149,892 | $ 3,142,576 | $15,316,749 | $45,609,217 | $30,470,806 | $29,041,332 | $59,512,138 | Less: accumulated Amortization | | | (9,520,879 | ) | | | (645,416 | ) | | | (5,429,949 | ) | | | (15,596,244 | ) | | | (12,700,516 | ) | | | (1,532,331 | ) | | | (14,232,847 | ) | (9,520,879) | (645,416) | (5,429,949) | (15,596,244) | (12,700,516) | (1,532,331) | (14,232,847) | | Totals | | $ | 17,629,013 | | | $ | 2,497,160 | | | $ | 9,886,800 | | | $ | 30,012,973 | | | $ | 17,770,290 | | | $ | 27,509,001 | | | $ | 45,279,291 | | $17,629,013 | $2,497,160 | $9,886,800 | $30,012,973 | $17,770,290 | $27,509,001 | $45,279,291 |
The aggregate amortization of leases in-place and leasing costs included in amortization expense for the years ended June 30, 2015, 2014, and 2013 were $3,005,570, $3,087,330, and $2,947,812, respectively. The aggregate amortization of above market ground leases included as a reduction of ground rent expense for the years ended June 30, 2015, 2014, and 2013 were $437,809, $437,809, and $437,808, respectively. The aggregate amortization of above market leases included as a reduction of base rental income for the years ended June 30, 2015, 2014, and 2013 were $1,442,682, $1,544,576, and $1,548,129, respectively. The aggregate amortization of below market leases included in base rental income for the years ended June 30, 2015, 2014, and 2013 were $2,475,983, $2,821,032, and $3,287,160, respectively. The estimated amortization of lease intangibles for each of the five years subsequent to June 30, 2015 and thereafter is as follows:
New Lipstick LLC and Subsidiary (A Limited Liability Company)
Notes to Consolidated Financial Statements June 30, 2015, 2014 and 2013 (Amounts in US dollars)
NOTE 4: LEASE INTANGIBLES (CONTINUED)
| | | Leases In-place | | | Leasing Costs | | | Above Market Leases | | | Total | | | Below Market Leases | | | Above Market Ground Leases | | | Total | | | | | | | | | | | | | | | | | | | | | | | | | | 2016 | | $ | 2,541,147 | | | $ | 448,938 | | | $ | 1,407,364 | | | $ | 4,397,449 | | | $ | 2,463,176 | | | $ | 437,809 | | | $ | 2,900,985 | | | 2017 | | | 2,540,843 | | | | 380,183 | | | | 1,407,364 | | | | 4,328,390 | | | | 2,459,981 | | | | 437,809 | | | | 2,897,790 | | | 2018 | | | 2,483,557 | | | | 278,611 | | | | 1,407,364 | | | | 4,169,532 | | | | 2,387,551 | | | | 437,809 | | | | 2,825,360 | | | 2019 | | | 2,464,461 | | | | 260,308 | | | | 1,407,364 | | | | 4,132,133 | | | | 2,363,408 | | | | 437,809 | | | | 2,801,217 | | | 2020 | | | 2,462,742 | | | | 213,759 | | | | 1,407,364 | | | | 4,083,865 | | | | 2,356,387 | | | | 437,809 | | | | 2,794,196 | | | Thereafter | | | 2,568,352 | | | | 1,446,820 | | | | 1,407,298 | | | | 5,422,470 | | | | 3,263,804 | | | | 24,882,147 | | | | 28,145,951 | | | Totals | | $ | 15,061,102 | | | $ | 3,028,619 | | | $ | 8,444,118 | | | $ | 26,533,839 | | | $ | 15,294,307 | | | $ | 27,071,192 | | | $ | 42,365,499 | |
NOTE 5: NOTE PAYABLE | | Leases In-place | Leasing Costs | Above Market Leases | Total | Below Market Leases | Above Market Ground Leases | Total | | | | | | | | | | | 2016 | $ 2,541,147 | $448,938 | $ 1,407,364 | $ 4,397,449 | $ 2,463,176 | $437,809 | $2,900,985 | | 2017 | 2,540,843 | 380,183 | 1,407,364 | 4,328,390 | 2,459,981 | 437,809 | 2,897,790 | | 2018 | 2,483,557 | 278,611 | 1,407,364 | 4,169,532 | 2,387,551 | 437,809 | 2,825,360 | | 2019 | 2,464,461 | 260,308 | 1,407,364 | 4,132,133 | 2,363,408 | 437,809 | 2,801,217 | | 2020 | 2,462,742 | 213,759 | 1,407,364 | 4,083,865 | 2,356,387 | 437,809 | 2,794,196 | | Thereafter | 2,568,352 | 1,446,820 | 1,407,298 | 5,422,470 | 3,263,804 | 24,882,147 | 28,145,951 | | Totals | $ 15,061,102 | $3,028,619 | $ 8,444,118 | $26,533,839 | $ 15,294,307 | $27,071,192 | $42,365,499 |
On December 30, 2010, Metropolitan’s existing note agreements with Royal Bank of Canada (the “Lender”) were amended and restated. The outstanding balance of the Amended Note was $115,000,000. The Amended Note bears interest at (i) the London InterBank Offered Rate ("LIBOR") plus 400 basis points, or (ii) Prime Rate plus Prime Rate Margin, if converted into a Prime Rate Loan. The Amended Note provides for a maximum interest rate of 5.25% through February 29, 2012 and 6.25% from March 1, 2012 through August 31, 2015 and matures on August 1, 2017. The interest rate was 4.18% at June 30, 2015. Interest expense amounted to $4,786,205, $4,789,913, and $4,843,275 for the years ended June 30, 2015, 2014, and 2013, respectively. Pursuant to a cash management agreement with the Lender, all rents collected are required to be deposited in a clearing account and all funds are disbursed in accordance with the Loan agreement, including the funding of all reserve accounts. In addition, after payment of debt service, operating expenses and other expenses, as defined, forty percent (40%) of all the remaining cash flow in the cash management account is applied to the outstanding principal balance of the loan on a monthly basis. As of June 30, 2015 and 2014, the outstanding principal balance of the Amended Note is $113,201,357 and $113,201,357, respectively. The Amended Note is collateralized by the Property including all related facilities, amenities, fixtures and personal property owned by the borrower. The Company pledged a first priority security interest in the Company’s membership interest in Metropolitan to the Lender as collateral security for the Amended Note.
NOTE 6: GROUND LEASES The Property was erected on a 26,135 square foot parcel of land (the "Site Area") of which 20,635 square feet is subject to a ground lease (the "Ground Lease") and an adjacent lot containing approximately 5,500 square feet ("Lot A") subject to a ground sub-sublease (the "Ground Sub-sublease"). New Lipstick LLC and Subsidiary (A Limited Liability Company)
Notes to Consolidated Financial Statements June 30, 2015, 2014 and 2013 (Amounts in US dollars)
NOTE 6: GROUND LEASE (CONTINUED) The Ground Lease matures on the earlier of (i) April 30, 2077, (ii) the date of termination of the Ground Sub-sublease term or (iii) a date if sooner terminated. The Ground Lease provides for monthly ground rent of approximately $925,000 through April 30, 2012, $1,321,000 through April 30, 2013, and provides for annual increases of 2.5% beginning on May 1, 2013 through April 30, 2020. On May 1, 2020, May 1, 2038 and every ten years thereafter through May 1, 2068, (“Adjustment Years”) ground rent shall be adjusted to be the greater of (a) 1.03 times the base rent payable during the lease year immediately preceding the said Adjustment Year or (b) 7% of the fair market value of the land. Monthly ground rent shall increase 3% annually for each lease year subsequent to the Adjustment Year. The Ground Sub-sublease is subject to a ground sublease and a prime lease. The ground sublease expires on April 29, 2080 (the "Ground Sublease"), and the prime lease matures on April 30, 2080 (the "Prime Lease"). The Ground Sub-sublease matures on the earlier of (i) April 30, 2077, (ii) the expiration or earlier termination of the Prime Lease or (iii) the expiration or earlier termination date of the Ground Sublease, except for reason of default by the sublandlord as subtenant under the Ground Sublease or the sublandlord as subtenant under the Prime Lease provided that the lessees are not in default under the Ground Sub-sublease or the Ground Sublease. The Ground Sub-sublease provides for monthly ground rent of $58,000 through April 30, 2010, and approximately $63,000 beginning on May 1, 2010 through April 30, 2020. On May 1, 2020, May 1, 2040 and May 1, 2060, ground rent shall be adjusted to 8% of the fair market value of Lot A, as defined. For the year ended June 30, 2015, Ground Lease and Ground Sub-sublease expense amounted to $45,136,545 and $759,000, respectively, after giving effect to straight-line rent adjustments of $28,414,754 and $0, respectively. For the year ended June 30, 2014, Ground Lease and Ground Sub-sublease expense amounted to $45,136,544 and $759,000, respectively, after giving effect to straight-line rent adjustments of $28,822,593 and $0, respectively. For the year ended June 30, 2013, Ground Lease and Ground Sub-sublease expenses amounted to $45,136,545 and $759,000, respectively, after giving effect to straight-line rent adjustments of $29,220,501 and $0, respectively. The Ground Lease also provides the Company with an option to purchase the land (the "Purchase Option"). The Purchase Option is exercisable on April 30, 2020, April 30, 2037 and on the last day of every tenth year thereafter (the "Purchase Date"). The Purchase Price, as defined in the Ground Lease, shall be the amount which together with all ground rent paid by the Company on or before the applicable Purchase Date yields an internal rate of return ("IRR") that equals the Target IRR in respect to the applicable Purchase Date as follows:
New Lipstick LLC and Subsidiary (A Limited Liability Company)
Notes to Consolidated Financial Statements June 30, 2015, 2014 and 2013 (Amounts in US dollars)
NOTE 6: GROUND LEASE (CONTINUED)
| Purchase Date | | Target IRR | | | | | | | April 30, 2020 | | | 7.47 | %7.47% | | April 30, 2037 | | | 7.67 | %7.67% | | April 30, 2047 | | | 7.92 | %7.92% | | April 30, 2057 | | | 8.17 | %8.17% | | April 30, 2067 | | | 8.42 | %8.42% | | April 30, 2077 | | | 8.67 | %8.67% |
In the event the Purchase Option is exercised on April 30, 2020, the Company shall pay a purchase price of approximately $521 million which is based upon an agreed land value of $317 million in July 2007, according to a Target IRR of 7.47%. The Ground Lease also provides for an option to demolish the Property ("Demolition Option") during the period beginning on May 1, 2055, and ending on April 30, 2072 (the "Demolition Period"). The Ground Lease lessor has the option to cause the Company to purchase the Property ("Put Option") at a then Put Price, as defined. The Put Option is exercisable during the period subsequent to the Demolition Option and prior to April 30, 2072. Future minimum annual ground rents due before giving effect to the fair market value adjustments which are not determinable at the present time are as follows for the five years subsequent to June 30, 2015, and thereafter:
| | | Ground Lease | | | Ground Sub-Sublease | | | Total | | Ground Lease | | Ground Sub-Sublease | | Total | | | | | | | | | | | | | | | | | | 2016 | | $ | 17,139,836 | | | $ | 759,000 | | | $ | 17,898,836 | | $ 17,139,836 | | $ 759,000 | | $ 17,898,836 | | 2017 | | | 17,568,332 | | | | 759,000 | | | | 18,327,332 | | 17,568,332 | | 759,000 | | 18,327,332 | | 2018 | | | 18,007,540 | | | | 759,000 | | | | 18,766,540 | | 18,007,540 | | 759,000 | | 18,766,540 | | 2019 | | | 18,457,729 | | | | 759,000 | | | | 19,216,729 | | 18,457,729 | | 759,000 | | 19,216,729 | | 2020 | | | 18,934,872 | | | | 632,500 | | | | 19,567,372 | | 18,934,872 | | 632,500 | | 19,567,372 | | Thereafter | | | 2,837,562,375 | | | | - | | | | 2,837,562,375 | | 2,837,562,375 | | - | | 2,837,562,375 | | Total | | $ | 2,927,670,684 | | | $ | 3,668,500 | | | $ | 2,931,339,184 | | $ 2,927,670,684 | | $ 3,668,500 | | $ 2,931,339,184 |
New Lipstick LLC and Subsidiary (A Limited Liability Company)
Notes to Consolidated Financial Statements June 30, 2015, 2014 and 2013 (Amounts in US dollars)
NOTE 7: TENANT LEASES
The Company leases space in the Property to tenants under long-term noncancelable operating leases. Future minimum annual base rents due from noncancelable operating leases in each of the five years subsequent to June 30, 2015 and thereafter are as follows:
| 2016 | | $ | 39,207,929 | | $ 39,207,929 | | 2017 | | | 40,626,201 | | 40,626,201 | | 2018 | | | 38,220,542 | | 38,220,542 | | 2019 | | | 37,075,235 | | 37,075,235 | | 2020 | | | 36,531,739 | | 36,531,739 | | Thereafter | | | 59,314,354 | | 59,314,354 | | Total | | $ | 250,976,000 | | $ 250,976,000 |
For the year ended June 30, 2015, 2014, and 2013, approximately 71%, 75%, and 77%, respectively, of the Company's base rent before amortization of above and below market bases was from one law firm tenant. For the year ended June 30, 2015, the approximate rental revenue from the one law firm tenant amounted to $27,675,000 of which $0 amounts remain outstanding. For the year ended June 30, 2014, the approximate rental revenue from the one law firm tenant amounted to $27,200,000 of which $0 amounts remain outstanding. For the year ended June 30, 2013, the approximate rental revenue from the one law firm tenant amounted to $26,900,000 of which $0 amounts remained outstanding. Law firms accounted for approximately 79%, 83%, and 82% of the Property’s total base rent for the years ended June 30, 2015, 2014, and 2013, respectively. At June 30, 2015, 2014, and 2013, the Property was approximately 92%, 89%, and 86% leased, respectively.
NOTE 8: RELATED PARTY TRANSACTIONS On April 20, 2011, Lipstick Management LLC (“LM”), an affiliate of the Company, entered into an agreement with the Company’s lender which provides that the Company would be directly responsible for certain fees that are payable to Herald Square Properties LLC (“HSP”). HSP is a 49% owner in LM. LM and the Company are affiliated by common ownership. These fees are based on a consulting agreement between LM and HSP which provides a monthly fee of $12,000. As of January 1, 2013, the Company renewed the contract with HSP which provides a monthly fee of $22,000. As of January 1, 2014, the parties agreed to extend the agreement for one year. The parties have the right to terminate this agreement at any time upon thirty (30) days written notice served to the other party. The total management consulting fee for the year ended June 30, 2015, 2014, and 2013, included in management fees in the accompanying statement of operations, amounted to $264,000, $264,000, and $204,000, respectively.
New Lipstick LLC and Subsidiary (A Limited Liability Company)
Notes to Consolidated Financial Statements June 30, 2015, 2014 and 2013 (Amounts in US dollars)
NOTE 8: RELATED PARTY TRANSACTIONS (CONTINUED) On May 3, 2011, the Company entered into an asset management agreement with LM. The Company is charged an asset management fee of 1% of its consolidated gross revenues. Asset management fees incurred to LM amounted to $449,189 for the year ended June 30, 2015, $409,084 for the year ended June 30, 2014, and $398,898 for the year ended June 30, 2013, of which $38,280, $272,763, and $63,826 were unpaid at June 30, 2015, 2014, and 2013, respectively, and is included in due to related party in the accompanying balance sheet. Asset management fees are included in management fees in the accompanying statement of operations. Effective August 1, 2011, LM leased office space from the Company. The term of the agreement is for five years expiring July 31, 2016. The total amount of rental income earned for the years ended June 30, 2015, 2014, and 2013 amounted to $203,916 for all three years. Balances with related companies are as follows:
| | | 2015 | | | 2014 | | 2015 | | 2014 | | Due from related party: | | | | | | | | | | | Lipstick Management LLC | | $ | 123,959 | | | $ | 120,274 | | $123,959 | | $120,274 | | Rigby 183 LLC | | | 405 | | | | - | | 405 | | | | I Madison LLC | | | 310 | | | | - | | 310 | | | | IRSA International LLC | | | 355 | | | | - | | 355 | | | | | | $ | 125,029 | | | $ | 120,274 | | $ 125,029 | | $120,274 |
The above amount represents expenses paid by the Company on behalf of related companies, which will be reimbursed by related companies.
| | | 2015 | | | 2014 | | 2015 | | 2014 | | Due to related party: | | | | | | | | | | | IRSA International, LLC | | $ | (39,979 | ) | | $ | (39,979 | ) | $ (39,979) | | $ (39,979) | | Lipstick Management LLC | | | (38,280 | ) | | | (272,763 | ) | (38,280) | | (272,763) | | IRSA Inversiones y Representaciones | | | | | | | | | | | | | Sociedad Anonima | | | (240,874 | ) | | | (240,874 | ) | (240,874) | | (240,874) | | | | $ | (319,133 | ) | | $ | (553,616 | ) | $ (319,133) | | $ (553,616) |
New Lipstick LLC and Subsidiary (A Limited Liability Company)
Notes to Consolidated Financial Statements June 30, 2015, 2014 and 2013 (Amounts in US dollars)
NOTE 9: PROPERTY MANAGEMENT On December 30, 2010, a property management agreement was entered into with a third party. The term of the property management agreement will continue on a month-to-month basis. The Company is charged a monthly property management fee of approximately $22,917. The total property management fee for the years ended June 30, 2015, 2014, and 2013, included in management fees in the accompanying statement of operations, amounted to $275,000 of which $0 is unpaid as of June 30, 2014 and 2013, and $22,917 was unpaid as of June 30, 2015.
|