As filed with the Securities and Exchange Commission on April 29, 2009
UNITED STATES
SECURITIES AND EXCHANGE COMMISSION
Washington, D.C. 20549
FORM 20-F
(Mark One) | | |
| o | | REGISTRATION STATEMENT PURSUANT TO SECTION 12(b) OR (g) OF THE SECURITIES EXCHANGE ACT OF 1934 |
| OR |
| x | | ANNUAL REPORT PURSUANT TO SECTION 13 OR 15(d) OF THE SECURITIES EXCHANGE ACT OF 1934 |
| | | For the fiscal year ended December 31, 20082010 |
| OR |
| o | | TRANSITION REPORT PURSUANT TO SECTION 13 OR 15(d) OF THE SECURITIES EXCHANGE ACT OF 1934 |
| OR |
| o | | SHELL COMPANY REPORT PURSUANT TO SECTION 13 OR 15(d) OF THE SECURITIES EXCHANGE ACT OF 1934 |
| |
Date of event requiring this shell company report ___________
For the transition period from ___________ to ___________
Commission file numbernumber: 001-10306
THE ROYAL BANK OF SCOTLAND GROUP plc
(Exact (Exact name of Registrant as specified in its charter)
United Kingdom
(Jurisdiction of incorporation or organization)
RBS Gogarburn, PO Box 1000, Edinburgh EH12 1HQ, United Kingdom
(Address of principal executive offices)
Miller McLean, Group General Counsel andAileen Taylor, Group Secretary, Tel: +44 (0) 131 523 2333,626 4099, Fax: +44 (0) 131 626 3081
PO Box 1000, Gogarburn, Edinburgh EH12 1HQ
(Name, Telephone, E-mail and/or Facsimile number and Address of Company Contact Person)
Securities registered or to be registered pursuant to Section 12(b) of the Act:
| | Name of each exchange on which registered |
| American Depositary Shares, each representing 20 ordinary shares, nominal value £0.25 per share | | New York Stock Exchange |
| Ordinary shares, nominal value £0.25 per share | | New York Stock Exchange* |
| American Depositary Shares Series F, H, L, M, N, P, Q, R, S, T and U each representing one Non-Cumulative Dollar Preference Share, Series F, H, L, M, N, P, Q, R, S, T and U respectively | | New York Stock ExchangeExchange |
| Dollar Perpetual Regulatory tier one securities, Series 1 | New York Stock Exchange |
| Senior Floating Rate Notes due 2013 | New York Stock Exchange |
| 3.400% Senior Notes due 2013 | New York Stock Exchange |
| 3.250% Senior Notes due 2014 | New York Stock Exchange |
| 3.950% Senior Notes due 2015 | New York Stock Exchange |
| 4.875% Senior Notes due 2015 | New York Stock Exchange |
| 4.375% Senior Notes due 2016 | New York Stock Exchange |
| 5.625% Senior Notes due 2020 | New York Stock Exchange |
| 6.125% Senior Notes due 2021 | New York Stock Exchange |
| ______________________________________ |
| * Not for trading, but only in connection with the registration of American Depositary Shares representing such ordinary shares pursuant to the requirements of the Securities and Exchange Commission. |
Securities registered or to be registered pursuant to Section 12(g) of the Act:
None
_______________
Securities for which there is a reporting obligation pursuant to Section 15(d) of the Act:
None
Indicate the number of outstanding shares of each of the issuer’s classes of capital or common stock as of December 31, 2008,2010, the close of the period covered by the annual report:
| Ordinary shares of 25 pence each | 39,456,004,899 | | Non-cumulative dollar preference shares, Series F, H and L to U | | 308,015,000 | 58,458,130,868 | Non-cumulative dollar preference shares, Series F, H and L to U | 209,609,154 |
| Non-voting Deferred Shares | 2,660,556,304 | | Non-cumulative convertible dollar preference shares, Series 1 | | 1,000,000 | |
| B Shares | | 51,000,000,000 | Non-cumulative convertible dollar preference shares, Series 1 | 64,772 |
| Dividend Access Share | | 1 | Non-cumulative euro preference shares, Series 1 to 3 | 2,044,418 |
| 11% cumulative preference shares | 500,000 | | Non-cumulative euro preference shares, Series 1 to 3 | | 2,526,000 | 500,000 | Non-cumulative convertible sterling preference shares, Series 1 | 14,866 |
| 5½% cumulative preference shares | 400,000 | | Non-cumulative convertible sterling preference shares, Series 1 | | 200,000 | 400,000 | Non-cumulative sterling preference shares, Series 1 | 54,442 |
| | | | Non-cumulative sterling preference shares, Series 1 and 2 | | 5,750,000 | |
Indicate by check mark if the registrant is a well-known seasoned issuer, as defined in Rule 405 of the Securities ActAct.
Yes x NoYes o No
If this report is an annual or transition report, indicate by check mark if the registrant is not required to file reports pursuant to Section 13 or 15(d) of the Securities Exchange Act of 1934.
Yes o NoYes x No
Note — checking– Checking the box above will not relieve any registrant required to file reports pursuant to Section 13 or 15(d) of the Securities Exchange Act of 1934 from their obligations under those Sections.
Indicate by check mark whether the registrant (1) has filed all reports required to be filed by Section 13 or 15(d) of the Securities Exchange Act of 1934 during the preceding 12 months (or for such shorter period that the registrant was required to file such reports), and (2) has been subject to such filing requirements for the past 90 days.
xYes x oNoo
Indicate by check mark whether the registrant has submitted electronically and posted on its corporate Web site, if any, every Interactive Data File required to be submitted and posted pursuant to Rule 405 of Regulation S-T (§232.405 of this chapter) during the preceding 12 months (or for such shorter period that the registrant was required to submit and post such files).
oYes oNoo
Indicate by check mark whether the registrant is a large accelerated filer, an accelerated filer, or a non-accelerated filer. filer. See definition of “accelerated filer and large accelerated filer” in Rule 12b-2 of the Exchange Act. (Check one):
Large accelerated filer x
| Large accelerated filer xAccelerated filer o Non-Accelerated filer o | Non-accelerated filer o
|
Indicate by check mark which basis of accounting the registrant has used to prepare the financial statements included in this filing:
oU.S. GAAP
ox International Financial Reporting Standards as issued by the International Accounting Standards Board
xo Othero
If “Other” has been checked in response to the previous question, indicate by check mark which financial statement item the registrant has elected to follow.
oItem 17 o Item 18o
If this is an annual report, indicate by check mark whether the registrant is a shell company (as defined in Rule 12b-2 of the Exchange Act).
Yes o NoYes x
(APPLICABLE ONLY TO ISSUERS INVOLVED IN BANKRUPTCY PROCEEDINGS DURING THE PAST FIVE YEARS)
Indicate by check mark whether the registrant has filed all documents and reports required to be filed by Sections 12, 13 or 15(d) of the Securities Exchange Act of 1934 subsequent to the distribution of securities under a plan confirmed by a court.
Yes o Noo
SEC Form 20-F cross reference guide
| Item | Item Caption | Pages |
| | | |
| PART I | | | |
| 1 | Identity of Directors, Senior Management and Advisers | Not applicable |
| | |
| 2 | Offer Statistics and Expected Timetable | Not applicable applicable |
| | |
| 3 | Key Information | |
| | | | 8-9, 299-302, 333-334, 341, 375-376 |
| | Capitalisation and indebtedness | Not applicable |
| | Reasons for the offer and use of proceeds | Not applicable |
| | | | |
4 | | 7, 352-369 |
| | | |
| 4 | Information on the Company | |
| History and development of the Company | 5-6, 170-171, 281-282, 380-381, 399 |
| Business overview | 5-6, 170-171, 318-323, 342-345 |
| Organisational structure | 5-6, 275 |
| Property, plant and equipment | 279-280, 345 |
| | | |
| Unresolved Staff Comments | Not applicable |
| | | | |
| | | |
4A | Unresolved Staff Comments | |
| 5 | Operating and Financial Review and Prospects | |
| | | | 6, 8-58, 270-272, 342-345 |
| | | | 55-56, 63-81, 82-86, 87-123, 129, 181-196, 199-203, 208-209, 217, 233-235, 240-244, 262-26357-58, 66-84, 241-268, 270-274, 279-280, 301-302, 308, 315-317, 340-341 |
| | Research and development, patents, licences etc | Not applicable |
| | | | 5-7, 352-369 |
| Off balance sheet arrangements | 157-160, 307-308 |
| Contractual obligations | 74-80, 303-305 |
| | | | |
| | | |
| 6 | Directors, Senior Management and Employees | |
| | | | 166-169 |
| Compensation | 187-204, 230-237, 324 |
| Board practices | 173, 175-182, 189-190,197-203 |
| Employees | 27, 171, 230-231 |
| Share ownership | 200-202, 205 |
| | | | |
| | | |
| | | |
| | | |
| 7 | Major Shareholders and Related Party Transactions | |
| | | | 173, 345 |
| | | | 324-326 |
| | Interests of experts and counsel | Not applicable |
| | |
| 8 | Financial Information | |
| | | | 170, 207-331, 376 |
| Significant changes | 6, 326 |
| | | | |
| Item | Item Caption | Pages |
| | | |
| 9 | The Offer and Listing | |
| | Offer and listing details | 374-375 |
| | Plan of distribution | Not applicable |
| | Markets | 373 |
| | Selling shareholders | Not applicable |
| | Dilution | Not applicable |
| | Expenses of the issue | Not applicable |
| | | |
| 10 | Additional Information | |
| | Share capital | Not applicable |
| | Memorandum and articles of association | 380-389 |
| | Material contracts | 345-350 |
| | Exchange controls | 380 |
| | Taxation | 377-380 |
| | Dividends and paying agents | Not applicable |
| | Statement of experts | Not applicable |
| | Documents on display | 389 |
| | Subsidiary information | Not applicable |
| | | |
| 11 | Quantitative and Qualitative Disclosure about Market Risk | 59-164, 241-265, 270-274 |
| | | |
| 12 | Description of Securities other than Equity Securities | 351 |
| | | |
| | | |
| PART II | | |
| 13 | Defaults, Dividend Arrearages and Delinquencies | Not applicable |
| | | |
| 14 | Material Modifications to the Rights of Security Holders and Use of Proceeds | Not applicable |
| | | |
| 15 | Controls and Procedures | 183, 184, 208 |
| | | |
| 16 | [Reserved] | |
| | A Audit Committee Financial Expert | 179-182 |
| | B Code of Ethics | 171, 389 |
| | C Principal Accountant Fees and Services | 179-182, 237 |
| | D Exemptions from the Listing Standards for Audit Committees | Not applicable |
| | E Purchases of Equity Securities by the Issuer and Affiliated Purchasers | Not applicable |
| | F Change in Registrant’s Certifying Accountant | Not applicable |
| | G Corporate Governance | 175-178 |
| | | |
| PART III | | |
| 17 | Financial Statements | Not applicable |
| | | |
| 18 | Financial Statements | 207-331 |
| | | |
| 19 | Exhibits | 400-402 |
| | | |
| | Signature | 403 |
Item | Item Caption | Pages |
| | | |
9 | The Offer and Listing | |
| | | |
| | Plan of distribution | Not applicable |
| | | |
| | Selling shareholders | Not applicable |
| | Dilution | Not applicable |
| | Expenses of the issue | Not applicable |
10 | Additional Information | |
| | Share capital | Not applicable |
| | | |
| | | |
| | | |
| | | |
| | Dividends and paying agents | Not applicable |
| | Statement of experts | Not applicable |
| | | |
| | Subsidiary information | Not applicable |
11 | | |
12 | Description of Securities other than Equity Securities | Not applicable |
PART II | | |
13 | Defaults, Dividend Arrearages and Delinquencies | Not applicable |
14 | Material Modifications to the Rights of Security Holders and Use of Proceeds | Not applicable |
15 | | |
16 | [Reserved] | |
16 | A | | |
| B | | |
| C | | |
| D | Exemptions from the Listing Standards for Audit Committees | Not applicable |
| E | Purchases of Equity Securities by the Issuer and Affiliated Purchasers | |
| F | Change in Registrant’s Certifying Accountant | Not applicable |
| G | Corporate Governance | |
PART III | | |
17 | Financial Statements | Not applicable |
18 | | |
19 | | |
| | |
Business Review| Form 20-F | Business review |
| Contents |
| 2 | |
3 | |
| 4 | |
| 5 | Description of business |
6 | Recent developments |
136 | Competition |
217 | Risk factors |
218 | |
| 9 | Summary consolidated income statement |
2412 | |
3425 | |
5354 | |
55 | |
56 | |
| 57 | |
| 58 | Capital resources |
| 59 | Risk capitaland balance sheet management |
| 59 | Introduction |
| 66 | Balance sheet management |
| 66 | - Capital |
| 74 | - Funding and liquidity managementrisk |
| 83 | - Interest rate risk |
| 84 | - Structural foreign currency exposures |
| 85 | - Equity risk |
| 86 | Risk management |
| 86 | - Credit risk |
| 133 | - Market risk |
| 139 | - Insurance risk |
| 139 | - Operational risk |
| 142 | - Regulatory risk |
| 143 | - Reputation risk |
| 143 | - Pension risk |
| 144 | - Other risk exposures |
| 161 | Asset Protection Scheme |
| Presentation of information | Business review |
In this document, and unless specified otherwise, the term ‘company’ or ‘RBSG’ means The Royal Bank of Scotland Group plc, ‘RBS’, 'RBS Group',‘RBS Group’ or the ‘Group’ means the company and its subsidiaries, ‘the Royal Bank’ means The Royal Bank of Scotland plc and ‘NatWest’ means National Westminster Bank Plc.
The company publishes its financial statements in pounds sterling (‘£’ or ‘sterling’). The abbreviations ‘£m’ and ‘£bn’ represent millions and thousands of millions of pounds sterling, respectively, and references to ‘pence’ represent pence in the United Kingdom (‘UK’). Reference to ‘dollars’ or ‘$’ are to United States of America (‘US’) dollars. The abbreviations ‘$m’ and ‘$bn’ represent millions and thousands of millions of dollars, respectively, and references to ‘cents’ represent cents in the US. The abbreviation ‘€’ represents the ‘euro’, the European single currency, and the abbreviations ‘€m’ and ‘€bn’ represent millions and thousands of millions of euros, respectively.
Certain information in this report is presented separately for domestic and foreign activities. Domestic activities primarily consist of the UK domestic transactions of the Group. Foreign activities comprise the Group’sGroup's transactions conducted through those offices in the UK specifically organised to service international banking transactions and transactions conducted through offices outside the UK.
The geographic analysis in the Business Review, including the average balance sheet and interest rates, changes in net interest income and average interest rates, yields, spreads and margins in this report have been compiled on the basis of location of office –- UK and overseas. Management believes that this presentation provides more useful information on the Group’sGroup's yields, spreads and margins of the Group’sGroup's activities than would be provided by presentation on the basis of the domestic and foreign activities analysis used elsewhere in this report as it more closely reflects the basis on which the Group is managed. ‘UK’ in this context includes domestic transactions and transactions conducted through the offices in the UK which service international banking transactions.
The results, assets and liabilities of individual business units are classified as trading or non-trading based on their predominant activity. Although this method may result in some non-trading activity being classified as trading, and vice versa, the Group believes that any resulting misclassification is not material.
International Financial Reporting Standards
As required by the Companies Act 19852006 and Article 4 of the European Union IAS Regulation, the consolidated financial statements of the Group are prepared in accordance with International Financial Reporting Standards issued by the International Accounting Standards Board (IASB) and interpretations issued by the International Financial Reporting Interpretations Committee of the IASB (together ‘IFRS’) as adopted by the European Union. ItThey also compliescomply with IFRS as issued by the IASB. On implementation of IFRS on 1 January 2005, the Group took advantage of the option in IFRS 1 ‘First-time Adoption of International Financial Reporting Standards’ to implement IAS 39 ‘Financial Instruments: Recognition and Measurement’, IAS 32 ‘Financial Instruments: Disclosure and Presentation’ and IFRS 4 ‘Insurance Contracts’ from 1 January 2005 without restating its 2004 income statement and balance sheet. The date of transition to IFRS for the Group and the company and the date of their opening IFRS balance sheets was 1 January 2004.
Acquisition ofRBS Holdings N.V. (formerly ABN AMRO Holding N.V.)
On 17 OctoberIn 2007, RFS Holdings B.V. (‘RFS Holdings’), a companywhich was jointly owned by RBS, Fortis Bank Nederland (Holding) N.V. (‘Fortis’)RBSG, the Dutch State (successor to Fortis) and Banco Santander S.A. (‘Santander’(the “Consortium Members”) (together the ‘consortium members’) and controlled by RBS, completed the acquisition of ABN AMRO Holding N.V. (‘ABN AMRO’).
On 3 October 2008, the State of the Netherlands acquired Fortis Bank Nederland (Holding) N.V. including the Fortis participation in RFS Holdings that representsB.V. has now substantially completed the acquired activities of ABN AMRO and their participation in Dutch insurance activities.
RFS Holdings is implementing an orderly separation of the business units of ABN AMRO with RBS retainingHolding N.V.. As part of this reorganisation, on 6 February 2010, the followingbusinesses of ABN AMRO business units:Holding N.V. acquired by the Dutch State were legally demerged from those acquired by the Group and were transferred into a newly established company, ABN AMRO Bank N.V. (save for certain assets and liabilities acquired by the Dutch State that were not part of the legal separation and which will be transferred to the Dutch State as soon as possible).
· | Continuing businesses of Business Unit North America; |
Legal separation of ABN AMRO Bank N.V. occurred on 1 April 2010, with the shares in that entity being transferred by ABN AMRO Holding N.V (renamed RBS Holdings N.V. at legal separation) to a holding company called ABN AMRO Group N.V., which is owned by the Dutch State.
· | Business Unit Global Clients and wholesale clients in the Netherlands (including former Dutch wholesale clients) and Latin America (excluding Brazil); |
· | Business Unit Asia (excluding Saudi Hollandi); and |
· | Business Unit Europe (excluding Antonveneta). |
Following legal separation, RBS Holdings N.V. has one direct subsidiary, The Royal Bank of Scotland N.V. (RBS N.V.), a fully operational bank within the Group. RBS N.V. is independently rated and regulated by the Dutch Central Bank. Certain other assets willwithin RBS N.V. continue to be shared by the consortium members.Consortium Members.
Presentation of information continued | Business review |
Statutory results
RFS Holdings is jointly owned by the consortium members. It is controlled by the company and is therefore fully consolidated in its financial statements. Consequently, theThe statutory results of the Group for the year ended 31 December 2007 and 2008 include the results and financial position of RFS Holdings, the entity that acquired ABN AMRO for 76 days and the full year respectively.(see page 2). The interests of Fortis, and its successor the State of the Netherlands and Santander in RFS Holdings are included in minoritynon-controlling interests.
Glossary
A glossary of terms is detailed on pages 390 to 395.
2| Forward-looking statements | Business review |
Business review continued
Certain sections in this document contain ‘forward-looking statements’ as that term is defined in the United States Private Securities Litigation Reform Act of 1995, such as statements that include the words ‘expect’, ‘estimate’, ‘project’, ‘anticipate’, ‘believes’, ‘should’, ‘intend’, ‘plan’, ‘could’, ‘probability’, ‘risk’, ‘Value-at-Risk (VaR)’, ‘target’, ‘goal’, ‘objective’, ‘will’, ‘endeavour’, ‘outlook’, ‘optimistic’, ‘prospects’ and similar expressions or variations on such expressions.
In particular, this document includes forward-looking statements relating, but not limited toto: the Group’s restructuring plans, capitalisation, portfolios, net interest margin, capital ratios, liquidity, risk-weighted assets, return on equity (ROE), cost:income ratios, leverage and loan:deposit ratios, funding and risk profile; the Group’s future financial performance; the level and extent of future impairments and write-downs; the protection provided by the Asset Protection Scheme (APS); and the Group’s potential exposures to various types of market risks, such as interest rate risk, foreign exchange rate risk and commodity and equity price risk. SuchThese statements are based on current plans, estimates and projections, and are subject to inherent risks, uncertainties and uncertainties.other factors which could cause actual results to differ materially from the future results expressed or implied by such forward-looking statements. For example, certain of the market risk disclosures are dependent on choices about key model characteristics and assumptions and are subject to various limitations. By their nature, certain of the market risk disclosures are only estimates and, as a result, actual future gains and losses could differ materially from those that have been estimated.
Other factors that could cause actual results to differ materially from those estimated by the forward-looking statements contained in this document include, but are not limited to: general economic conditionsthe full nationalisation of the Group or other resolution procedures under the Banking Act 2009; the global economy and instability in the UKglobal financial markets, and their impact on the financial industry in general and on the Group in particular; the financial stability of other financial institutions, and the Group’s counterparties and borrowers; the ability to complete restructurings on a timely basis, or at all, including the disposal of certain Non-Core assets and assets and businesses required as part of the EC State Aid restructuring plan; organisational restructuring; the ability to access sufficient funding to meet liquidity needs; the extent of future write-downs and impairment charges caused by depressed asset valuations; the inability to hedge certain risks economically; costs or exposures borne by the Group arising out of the origination or sale of mortgages or mortgage-backed securities in the United States; the value and effectiveness of any credit protection purchased by the Group; unanticipated turbulence in interest rates, yield curves, foreign currency exchange rates, credit spreads, bond prices, commodity prices, equity prices and basis, volatility and correlation risks; changes in the credit ratings of the Group; ineffective management of capital or changes to capital adequacy or liquidity requirements; changes to the valuation of financial instruments recorded at fair value; competition and consolidation in the banking sector; HM Treasury exercising influence over the operations of the Group; the ability of the Group to attract or retain senior management or other key employees; regulatory or legal changes (including those requiring any restructuring of the Group’s operations) in the United Kingdom, the United States and other countries in which the Group has significant business activitiesoperates or investments, including thea change in United States;Kingdom Government policy; changes to regulatory requirements relating to capital and liquidity; changes to the monetary and interest rate policies of the Bank of England, the Board of Governors of the Federal Reserve System and other G7 central banks; inflation; deflation; unanticipated turbulenceimpairments of goodwill; pension fund shortfalls; litigation and regulatory investigations; general operational risks; insurance claims; reputational risk; general geopolitical and economic conditions in interest rates, foreign currency exchange rates, commodity pricesthe UK and equity prices;in other countries in which the Group has significant business activities or investments, including the United States; the ability to achieve revenue benefits and cost savings from the integration of certain of RBS Holdings N.V.’s (formerly ABN AMRO Holding N.V.) businesses and assets; changes in UK and foreign laws, regulations, accounting standards and taxes;taxes, including changes in competitionregulatory capital regulations and pricing environments; naturalliquidity requirements; the participation of the Group in the APS and other disasters; the inabilityeffect of the APS on the Group’s financial and capital position; the ability to hedge certain risks economically;access the adequacycontingent capital arrangements with HM Treasury; the conversion of loss reserves; acquisitionsthe B shares in accordance with their terms; limitations on, or restructurings; technological changes; changesadditional requirements imposed on, the Group’s activities as a result of HM Treasury’s investment in consumer spending and saving habits;the Group; and the success of the Group in managing the risks involved in the foregoing.
The forward-looking statements contained in this document speak only as of the date of this report,announcement, and the Group does not undertake to update any forward-looking statement to reflect events or circumstances after the date hereof or to reflect the occurrence of unanticipated events.
ForThe information, statements and opinions contained in this document do not constitute a further discussionpublic offer under any applicable legislation or an offer to sell or solicitation of certain risks faced by the Group, see Risk factors on pages 13any offer to 20.buy any securities or financial instruments or any advice or recommendation with respect to such securities or other financial instruments.
| Business review | Business review |
Business review
Introduction
The Royal Bank of Scotland Group plc is the holding company of a large global banking and financial services group. Headquartered in Edinburgh, the Group operates in the United Kingdom, the United States and internationally through its two principal subsidiaries, the Royal Bank and NatWest. Both the Royal Bank and NatWest are major UK clearing banks whose origins go back over 275 years. In the United States, the Group’sGroup's subsidiary Citizens is a large commercial banking organisation. TheGlobally, the Group has a large and diversified customer base and provides a wide range of products and services to personal, commercial and large corporate and institutional customers.customers in over 50 countries.
Following a placing and open offeroffers in December 2008 referred to herein as the First Placing and Open Offer, Her Majesty'sin April 2009, HM Treasury in the United Kingdom (HM Treasury) owned approximately 58%70.3% of the enlarged ordinary share capital of the company and £5 billion of non-cumulative sterling preference shares.company. In AprilDecember 2009, the company issued a further £25.5 billion of new capital to HM Treasury. This new capital took the form of B shares, which do not generally carry voting rights at general meetings of ordinary shareholders but are convertible into ordinary shares by way of a second placing and open offer, referred to hereinqualify as core tier one capital. Following the Second Placing and Open Offer, the proceeds from which were used in full to fund the redemptionissuance of the B shares, HM Treasury's holding of ordinary shares of the company remained at 70.3% although its economic interest rose to 84.4%.
During the year, the company converted non-cumulative convertible preference shares held by HM Treasury at 101% of their issue price together withinto ordinary shares in the accrued dividend and the commissions payable to HM Treasury under the Second Placing and Open Offer Agreement. The Second Placing and Open Offer was underwritten by HM Treasury and ascompany. As a result, HM Treasury currently owns approximately 70% ofTreasury’s holding in the enlargedcompany’s ordinary share capital of the company.shares reduced to 67.8% and its economic interest reduced to 82.8%.
The Group had total assets of £2,401.7£1,453.6 billion and owners’owners' equity of £58.9£75.1 billion at 31 December 2008.2010. The Group’sGroup's capital ratios, which include the equity minority interest of The State of the Netherlands and Santander in ABN AMRO, were a totalTotal capital ratio of 14.114.0 per cent.,cent, a coreCore Tier 1 capital ratio of 6.810.7 per cent.cent and a Tier 1 capital ratio of 10.012.9 per cent., ascent, at 31 December 2008.2010.
Organisational structure and business overview
The Group’s activities are organised in the following business divisions: Global Markets (comprising Global Banking & Markets and Global Transaction Services), Regional Markets (comprising UK Retail & Commercial Banking, US Retail & Commercial Banking, Europe & Middle East Retail & Commercial Banking and Asia Retail & Commercial Banking), RBS Insurance and Group Manufacturing. A description of each of the divisions is given below.on a divisional basis as follows:
Global Banking & Markets(GBM) is a leading banking partner to major corporations and financial institutions around the world, providing an extensive range of debt and equity financing, risk management and investment services to its customers. In 2008 the division was organised along four principal business lines: rates, currencies, and commodities, including RBS Sempra Commodities LLP (the commodities-marketing joint venture between RBS and Sempra Energy which was formed on 1 April 2008); equities; credit markets; and asset and portfolio management.
Following RBS’s strategic review, GBM is planning to re-focus its business around its core corporate and institutional clients, concentrating its activities in major financial centres and scaling back its presence elsewhere. It will exit illiquid proprietary trading and balance sheet-heavy niche products segments.
Globally, the intention is for GBM to move increasingly towards a “hub-and- spoke” model. Risk will be managed from regional hubs. It is intended that distribution and coverage will be delivered from a mix of hub countries and a scaled-back presence in some local offices. The aim, over time, will be to reduce much of the on-shore trading activity outside the key financial centres.
Assets, products and geographies that fit GBM’s new client-focused proposition will be defined as “core” and will remain within the division. Assets, business lines and some geographies that are non-core will be transferred to the new Non-Core Bank. These non-core activities accounted for approximately £205 billion of third party assets at end 2008.
Global Transaction Services ranks among the top five global transaction services providers, offering global payments, cash and liquidity management, as well as trade finance, United Kingdom and international merchant acquiring and commercial card products and services. It includes the Group’s corporate money transmission activities in the United Kingdom and the United States.
Following RBS’s strategic review, Global Transaction Services intends to reduce its international network while retaining the capability to serve multinational clients globally.
The business also plans to increase efficiency through development of a lower cost front and back-office operating model and explore joint ventures for growth and selective disposals.
UK Retail & Commercial Banking (RBS UK) comprises retail, corporate and commercial banking and wealth management services. It supplies financial services through both the RBS and NatWest brands.
UK Retail Banking offers a fullcomprehensive range of banking products and related financial services to the personal market. It serves customers through two of the largestRBS and NatWest networks of branches and ATMs in the United Kingdom, and also through telephone and internet channelschannels. UK Retail launched the Retail Customer Charter in June 2010 and according to Gfk NOP,progress against the commitments made will be formally reported every six months.
UK Corporate is the second largest provider of personal current accounts. The division also issues credit and charge cards, including through other brands such as MINT.
UK Business & Commercial Banking is the largesta leading provider of banking, finance, and risk management services to the corporate and SME sector in the United Kingdom. It offers a full range of banking products and related financial services through a nationwide network of relationship managers, and also through telephone and internet channels. The product range includes asset finance in which, according to the Finance Lease Association, it has a strong market presence through the Lombard brand.
According to Ph. Group, UK Corporate Banking holds the largest market share in the United Kingdom of relationships with larger companies, offering a full range of banking, finance, and risk management services.
UK Wealth Management provides private banking and investment services in the UK through Coutts & Co and Adam & Co., Company, offshore banking through
RBS International, NatWest Offshore and NatWest Offshore.Isle of Man Bank, and international private banking through RBS Coutts.
Global Transaction Services (GTS) ranks among the top five global transaction services providers, offering global payments, cash and liquidity management, and trade finance and commercial card products and services. It includes the Group's corporate money transmission activities in the United Kingdom and the United States.
Ulster Bank is the leading retail and business bank in Northern Ireland and the third largest banking group on the island of Ireland. It provides a comprehensive range of financial services. The Retail Markets division which has a network of 236 branches, operates in the personal and financial planning sectors. The Corporate Markets division provides services to SME business customers, corporates and institutional markets.
US Retail & Commercial Banking provides financial services primarily through the Citizens and Charter One brands.
Citizens US Retail & Commercial is engaged in retail and corporate banking activities through its branch network in 12 states in the United States and through non-branch offices in other states. Citizens
The divisions discussed above are collectively referred to as Retail & Commercial.
Global Banking & Markets (GBM) is a large commercialleading banking organization.
Following RBS’s strategic review, Citizens intendspartner to invest in its core business through increased marketing activitymajor corporations and targeted technology investments while reducing activity in its out-of-footprint national businesses in consumer and commercial finance.
This strategy will allow Citizens to become fully funded from its own customer deposits over time, and will support a low risk profile.
Europe & Middle East Retail & Commercial Banking comprises Ulster Bank andfinancial institutions around the Group’s combined retail and commercial businesses in Europe and the Middle East.
Ulster Bank provides a comprehensiveworld, providing an extensive range of financial services across the island of Ireland. Its retail banking arm has a network of branchesdebt and operates in the personal, commercial and wealthequity financing, risk management sectors, while its corporate markets operations provides services in the corporate and institutional markets.
The retail and commercial businesses in Europe and the Middle East have smaller activities in Romania, Kazakhstan and the United Arab Emirates. Following RBS’s strategic review, RBS has decided to exit sub-scale retail and commercial activities outside its core markets in the United Kingdom, Europe and the United States.
Business review continued
Asia Retail & Commercial Banking is present in markets including India, Pakistan, China, Taiwan, Hong Kong, Indonesia, Malaysia and Singapore. It provides financial services across four segments: affluent banking, cards and consumer finance, business banking and international wealth management, which offers private banking and investment services to clients in selectedits customers. The division is organised along six principal business lines: money markets; rates flow trading; currencies and commodities; equities; credit and mortgage markets through the RBS Coutts brand.and portfolio management & origination.
Following RBS’s strategic review, RBS has decided to exit sub-scale retail and commercial activities outside its core markets in the United Kingdom, Europe and the United States.
RBS Insurance sells and underwrites retail and SMEprovides a wide range of general insurance over the telephone and internet, asproducts to consumers through a number of well as through brokers and partnerships. Itsknown brands includeincluding; Direct Line, Churchill and Privilege, which sell generalPrivilege. It also provides insurance services for third party brands through its UKI Partnerships division. In the commercial sector, its NIG and Direct Line for Business operations provide insurance products for businesses via brokers or direct to the customer, as well as Green Flag and NIG.respectively. Through its international division, RBS Insurance sells general insurance, mainly motor, in Spain, Germany and Italy. In addition to insurance services, RBS Insurance continues to provide support and reassurance to millions of UK motorists through its Green Flag breakdown recovery service and Tracker stolen vehicle recovery and telematics business.
Central Functions comprises Group and corporate functions, such as treasury, funding and finance, risk management, legal, communications and human resources. The IntermediaryCentre manages the Group's capital resources and Broker division sells general insurance products through independent brokers.Group-wide regulatory projects and provides services to the operating divisions.
Following RBS’s strategic review, RBS
Business reviewcontinued | Business review |
Non-Core Division manages separately assets that the Group intends to run off or dispose of. The division contains a range of businesses and asset portfolios primarily from the GBM division, linked to proprietary trading, higher risk profile asset portfolios including excess risk concentrations, and other illiquid portfolios. It also includes a number of other portfolios and businesses including regional markets businesses that the Group has decided to retain RBS Insurance.concluded are no longer strategic.
Group ManufacturingBusiness Services comprises the Group’s worldwide manufacturing operations. It supports the customer-facing businesses and provides operational technology, customer support in telephony, account management, lending and money transmission, global purchasing, property and other services. Group ManufacturingBusiness Services drives efficiencies and supports income growth across multiple brands and channels by using a single, scalable platform and common processes wherever possible. It also leverages the Group’sGroup's purchasing power and has becomeis the Group's centre of excellence for managing large-scale and complex change.
The Centre comprises group and corporate functions, such as capital raising, finance, risk management, legal, communications and human resources. The Centre manages the Group’s capital resources and Group-wide regulatory projects and provides services For reporting purposes, Business Services costs are allocated to the operating divisions.divisions above. It is not deemed a reportable segment.
RFS Holdings minority interest comprises those activitiesBusiness divestments
To comply with EC State Aid requirements the Group has agreed a series of ABN AMRO that are attributablerestructuring measures to be implemented over a four year period from December 2009. This will supplement the other consortium members.
Sharemeasures in the strategic plan previously announced by the Group. These include divesting RBS Insurance, 80.01% of shared assets comprises the Group's shareGlobal Merchant Services and substantially all of the unallocated assets of ABN AMRO.
Non-core division
RBS intends to create during the second quarter of 2009 a non-core division to manage separately approximately £240 billion of third party assets, £145 billion of derivative balances and £155 billion of risk weighted assets that it intends to run off or dispose of over the next three to five years. The division will contain primarily assets from the GBM division linked to proprietary trading portfolios, excess risk concentrations and other illiquid portfolios. It will also include excess risk concentrations from other divisionsSempra Commodities JV business, as well as divesting the RBS branch-based business in England and Wales and the NatWest branches in Scotland, along with the Direct SME customers across the UK.
Recent developments
Gender equality in insurance contracts
On 1 March 2011, the European Court of Justice (ECJ) upheld a number of small Regional Markets businessesruling that RBS has concludedinsurers are no longer strategic.
allowed to use gender as a rating factor across the Insurance industry. This will have a significant impact on the insurance industry in calculating premiums and determining benefits. The Group is currently working through the findings, and any consequences arising will be rectified by December 2012 in line with the ruling from the ECJ. At this stage, it is not possible to estimate the impact which the ECJ's ruling may have on the Group's businesses, financial position or profitability.
Budget update
HM Treasury Asset Protection Scheme and additional capital raising
Personal current accounts
On 26 February 2009, RBS confirmed29 March 2011, the OFT published its intended participationupdate report in relation to personal current accounts. This noted further progress in improving consumer control over the Asset Protection Scheme (“APS”). The arrangements between RBSuse of unarranged overdrafts. In particular, the Lending Standards Board has led on producing standards and HM Treasury will, if completed, allow RBS to secure asset protection in respect of some of its riskiest assets that enhances its financial strength and provides improved stability for customers and depositors, and also enhances RBS’s ability to lend into the UK market.
Issuance of capital
On or after the proposed implementation of the APS, HM Treasury will subscribe for £13 billion of B Shares. The arrangements for the subscription of these B Shares are to be determined and the proceeds of such issue will, if such B Shares are issued, be used to increase further the Group’s Core Tier 1 capital. A summary of the expected terms of the B Shares is set out below. HM Treasury will also commit to subscribe for an additional £6 billion of B Shares at RBS’s option. The detailed terms of such option remain to be agreed between RBS and HM Treasury.
Scheme amount
RBS intends to participate in the APS in respect of assets with a par value of approximately £325 billion and a carrying value net of impairments and write downs of approximately £302 billion as at 1 January 2009.
First loss
The agreement would see RBS bear the first loss amount relating to the assets in the APS up to £19.5 billion (after taking into account historic impairments and write downs). Losses arising in respect of the assets after the first loss amount would be borne 90 per cent. by HM Treasury and 10 per cent. by RBS. The APS will, if entered into, apply to losses incurred on the protected assets on or after 1 January 2009.
Fee and issuance of capital
If it enters into the APS, RBS will pay a participation fee of £6.5 billion to HM Treasury. On 26 February 2009, RBS announced that it would issue £6.5 billion of B Shares, and the participation fee may be funded through the proceeds of such issuance. The £6.5 billion of B Shares, which will be issued if RBS enters into the APS, will be in addition to, and on the same terms as, the B Shares referred to above and will constitute Core Tier 1 capital. In addition, RBS has agreed in principle that, if it enters into the APS, it would not claim certain UK tax losses and allowances.
Assets
Specific assetsguidance to be included in the APS will be subject to the approval of HM Treasury. The assets would be drawn from RBS’s and certain of its affiliates’ portfolios of corporate and leveraged loans, commercial and residential property loans, structured credit assets and such other assets as HM Treasury and RBS agree are to be included in the APS. It is also envisaged that the APS may include structured synthetic assets and counterparty risk exposures associated with certain derivatives transactions with monoline insurers and credit derivative product companies. RBS expects that the APS will protect: £225 billion of third party assets, £44 billion of undrawn commitments, and £33 billion in other counterparty risk exposures.
Capital ratios
The APS and proceeds of the issue of B Shares are expected to improve the consolidated capital ratios of RBS by (i) substituting risk weight applicable to the UK Government for that of the protected assets; and (ii) the subscription for the B Shares by HM Treasury (being both the £6.5 billion of B Shares, the proceeds of which may be used to fund the fee for the APS and the additional £13 billion of B Shares to be issued on or after the implementation of the APS). Based on total covered assets of approximately £325 billion, risk weighted assets would reduce by approximately £144 billion. As an illustration, if the Company had issued £19.5 billion of B Sharesa revised Lending Code published on 31 December 2008 offset by the expected £6 billion reduction of first loss exposure under the APS from Core Tier 1 capital in accordance with the FSA Handbook, and with the redemption of the preference shares issued to HM Treasury (“Preference Share Redemption”), RBS expects there would have been a significant increase to the Core Tier 1 ratio.
In addition, RBSMarch 2011. The OFT will continue to look at variousmonitor the market based and/or internal capital management opportunitiesand will consider the need for, and appropriate timing of, further update reports in light of other developments, in particular the work of the Independent Commission on Banking. The OFT intends to generate and further strengthen Core Tier 1 capital.
conduct a more comprehensive review of the market in 2012.
US dollar clearing activities
Business review continued
Term
WhileJustice and RBS N.V. filed a joint status report with the U.S. District Court notifying it is intended that the APSparties would apply toseek an extension of the protected assets until their maturity, RBS’s participation in the APS would be capable of termination in whole or in part by mutual agreementduration of RBS N.V.’s deferred prosecution agreement until 31 December 2011. The request states that RBS N.V. and HM Treasury.
Managementthe Department of Justice have agreed to seek the assets
extension to allow RBS would be requiredN.V. sufficient time to fulfil its obligations under the APS to manage the assets in accordance with certain asset management requirements as referred to in the APS. These would include, amongst others, (i) reporting requirements to provide financial, risk and performance data in respect of the protected assets and to monitor compliance with the APS, (ii) the adoption of oversight and control procedures with respect to the management of the protected assets, (iii) requirements in relation to organisational structure, staffing, resourcing, systems and controls required for implementation, administration and monitoring compliance with the APS and (iv) the monitoring and management of conflicts of interest and potential conflicts of interest. As the APS is intended to apply to losses on protected assets arising from 1 January 2009, RBS has agreed with HM Treasury certain interim arrangements (in force with immediate effect) relating to the management of those assets likely to be part of the APS.
Impact on the capital structure of the Company
If the additional £6 billion of B Shares are subscribed for by HM Treasury and £25.5 billion of B Shares convert mandatorily, or are converted by HM Treasury, into ordinary shares in the hands of HM Treasury, the percentage of HM Treasury’s ownership of RBS’s ordinary shares will be 84.4 per cent., with shareholders experiencing a corresponding dilution to their interests in the company. However, without prejudice to rights arising on the mandatory conversion into ordinary shares, HM Treasury shall not be entitled to exercise its option to convert B Shares into ordinary shares for as long as it holds 75 per cent. or more of the ordinary shares or if the exercise of such option would result in it holding 75 per cent. or more of the ordinary shares. Further details regarding the effect of the B Shares on the dividends payable are set out below.
Conditions to accession to the Scheme
Implementation of the APS for RBS will be subject to further due diligence by HM Treasury and its advisers, documentation and satisfaction of applicable conditions (including the application criteria and asset eligibility criteria of the APS), adoption of a prescribed remuneration policy in respect of assets managed under the APS and conditions precedent to accession in the APS, including state aid, regulatory and shareholder approvals. RBS has agreed to provide certain information to HM Treasury in the period prior to RBS’s proposed accession, including
(i) an indicative list of the Proposed Assets, with a view to agreeing such list by 30 April 2009;
(ii) information and data relating to the Proposed Assets for the purposes of HM Treasury’s due diligence; and
(iii) access to RBS’s premises, books, records, senior executives, relevant personnel and professional advisers.
As at the date of this document, the timing for the implementation of the APS is still to be determined. The proposed entry by the Company into the APS and any associated capitalisation would constitute a related party transaction for the purposes of the Listing Rules requiring the approval of Independent Shareholders. Therefore if the Company is to participate in the APS, it will convene a further general meeting to seek Independent shareholder approval and a circular explaining the proposals and containing the relevant general meeting notice will be sent to Shareholders in due course, although no prospectus will be required.
Terms and conditions of the B Shares
At the same time as it announced RBS plc’s intended participation in the APS, RBS announced that it expected to issue to HM Treasury (i) £6.5 billion of B Shares at the time of entering into the APS and (ii) a further £13 billion of B Shares on or after implementation of the APS. RBS also announced that it had been agreed with HM Treasury that, at RBS’s option, a further £6 billion of B Shares could be issued to HM Treasury. The detailed terms of this option remain to be agreed between RBS and HM Treasury. All of these B Shares are expected to constitute Core Tier 1 capital and will be issued on the same terms. Key terms of the B Shares are expected to include the following:
• Nominal value and issue price: £0.50 per B Share.
• Ranking: on a winding-up, holders of the B Shares will rank pari passu with the holders of any other classes of Ordinary Shares and junior to preference shareholders. For these purposes, on a winding-up each holder of a B Share will be deemed to hold one Ordinary Share of RBS for every B Share held at the date of the commencement of such winding-up (the “Winding Up Ratio”).
• Dividend entitlement: non-cumulative dividends will be declared at the discretion of RBS, which dividends shall be paid in priority to any dividend on any other class of ordinary share capital. If declared, dividends on the B Shares will be paid semi-annually in arrear. The first such semi-annual dividend in respect of any financial year shall be payable on the date that is three business days after the record date in respect of the interim dividend payable on the Ordinary Shares in respect of such financial year, if such interim dividend on the Ordinary Shares is to be paid. The second such semi-annual dividend in respect of any financial year shall be payable on the date that is three business days after the record date in respect of the final dividend payable on the Ordinary Shares in respect of such financial year, if such final dividend on the Ordinary Shares is to be paid. If no interim dividend on the Ordinary Shares is to be paid in respect of any financial year, the first semi-annual dividend on the B Shares in respect of such financial year, if to be paid, shall be payable on 31 October in such financial year, and if no final dividend on the Ordinary Shares is to be paid in respect of any financial year the second semi-annual dividend on the B Shares in respect of such financial year, if to be paid, shall be payable on 31 May in the immediately following financial year.
• If to be paid, the dividend per B Share will be equivalent to (i) 7 per cent. of the issue price of each B Share multiplied by the number of days in the period from (and including) the immediately preceding Relevant Date (as defined below) or, in the case of the first semi annual dividend in 2009, the date of issue to (but excluding) the current Relevant Date divided by 365 (or 366 in a leap year) or (ii) in the case of any second semi-annual dividend in respect of any financial year, if greater and if a dividend or dividends or other distribution(s) is/are paid or made (whether interim or final) on the Ordinary Shares in respect of the period from (but excluding) the Relevant Date falling on (or nearest to) one year prior to the current Relevant
Business review continued
Date to (and including) the current Relevant Date, 250 per cent. (the “Participation Rate”) of the aggregate amount of such dividend(s) or distribution(s) per Ordinary Share less the amount of the first semi-annual dividend (if any) paid in respect of such financial year. “Relevant Date” means each date on which RBS pays a semi-annual dividend or, if no such payment has been made, 31 October in respect of the first semi-annual dividend in respect of any financial year and 31 May in the immediately following financial year in respect of the second semi-annual dividend in respect of any financial year.
• Scrip dividends: if RBS decides to pay a dividend on the B Shares in respect of a semi-annual period and either (i) no dividend has been paid on the Ordinary Shares and/or distribution made thereon in respect of the same period or (ii) a dividend has been paid and/or a distribution has been made thereon otherwise than in cash in respect of the same period, RBS may in its discretion determine that the dividend on the B Shares in respect of the corresponding period shall be paid in whole or in part by RBS issuing further B Shares to the holders of B Shares. The number of further B Shares to be issued to each holder shall be such number of B Shares as shall be certified by an independent investment bank (acting as expert) to equal the value in cash of the dividend otherwise payable on the B Shares in respect of the relevant period.
• Restrictions following non-payment of dividend: if RBS decides not to pay any semi-annual dividend on the B Shares in cash or otherwise, then until such time as semi-annual dividends on the B Shares have been resumed in full RBS will be prohibited from paying dividends or other distributions (whether in cash or otherwise) on, or redeeming, purchasing or otherwise acquiring, (i) its Ordinary Shares or (ii) any other securities of RBS or any other member of the Group ranking or expressed to rank pari passu with the Ordinary Shares and the B Shares on a winding-up, either issued by RBS or, where issued by another member of the Group, where the terms of the securities benefit from a guarantee or support agreement entered into by RBS which ranks or is expressed to rank pari passu with the Ordinary Shares and the B Shares on a winding-up.
• Redemption rights: none, but RBS may purchase the B Shares subject to applicable laws and FSA consent.
• Conversion rights: at any time a holder of a B Share may deliver a notice to RBS requesting conversion of B Shares into Ordinary Shares of RBS. All B Shares shall automatically and mandatorily convert into Ordinary Shares if the volume weighted average trading price of the Ordinary Shares for 20 complete trading days in any 30 trading day period equals or exceeds £0.65 per Ordinary Share. The number of Ordinary Shares to be issued upon conversion will be determined by dividing the aggregate issue price (£0.50 per B Share) of the B Shares being converted by the Conversion Price. The conversion price of the B Shares will be £0.50 (the “Conversion Price”).
• Limitations on optional conversion: without prejudice to the provisions above concerning the mandatory conversion of the B Shares, HM Treasury shall not be entitled to exercise its option to convert B Shares into Ordinary Shares to the extent that it holds 75 per cent. or more of the Ordinary Shares or to the extent that the exercise of such option would result in it holding 75 per cent. or more of the Ordinary Shares.
• Voting rights before conversion: holders of the B Shares will only have voting rights in limited circumstances (resolutions varying/abrogating class rights and resolutions to wind up, or in relation to the winding-up of, RBS). If entitled to vote, on a poll holders of B Shares will have two votes for each B Share held. HM Treasury shall not be so entitled to vote the B Shares to the extent the votes cast on such B Shares, together with any other votes which HM Treasury is entitled to cast in respect of any Ordinary Shares held by or on behalf of HM Treasury, would exceed 75 per cent. of the total votes eligible to be cast on a resolution proposed at a general meeting of RBS.
• Voting rights after conversion: HM Treasury shall not be entitled to vote in respect of Ordinary Shares acquired by it as a result of the conversion of B Shares into Ordinary Shares to the extent that votes cast on such Ordinary Shares, together with any other votes which HM Treasury is entitled to cast in respect of any other Ordinary Shares held by or on behalf of HM Treasury, would exceed 75 per cent. of the total votes eligible to be cast on a resolution proposed at a general meeting of RBS.
• Pre-emption rights: HM Treasury shall agree that it shall not exercise any pre-emption rights it may be entitled to as a holder of B Shares in respect of future issues of Ordinary Shares.
• Ordinary Share buy-back: for as long as any B Shares remain outstanding, RBS may not purchase any of its Ordinary Shares.
• Listing: the B Shares will not initially be listed. HM Treasury is entitled to require RBS to seek a listing of the B Shares.
• Adjustment events: the Winding Up Ratio and Participation Rate shall be subject to anti-dilution adjustments. The Conversion Price shall be adjusted in accordance with standard Euro-market anti-dilution adjustments other than customary change of control adjustments or extraordinary dividend adjustments (to the extent compensated by dividends paid at the Participation Rate).
Second Placing and Open Offer
Background to the Second Placing and Open Offer
In 2008 the Board concluded that the Group needed to strengthen its capital base and to accomplish this two capital raisings were carried out. A £12 billion rights issue was completed in June 2008. Then, due to a severe deterioration in financial markets and economic conditions, a further capital raising totalling £20 billion was completed in December 2008. Of the £20 billion raised in December, £15 billion was in the form of Ordinary Shares, and £5 billion was in the form of Preference Shares purchased entirely by HM Treasury. As a result of this capital raising, HM Treasury acquired approximately 57.9 per cent. of the issued ordinary share capital of the Company. The intention of the Board was that HM Treasury’s holding of Preference Shares would be redeemed as soon as practicable.
In the last few weeks of 2008 the continuing dislocation in financial markets and significant uncertainties in credit conditions, together with the sharp deterioration in economic conditions, negatively impacted the trading performance of many financial institutions globally, including RBS. As a result, RBS incurred significant credit impairment losses and credit market write downs.
In view of the above, the Board, in conjunction with HM Treasury, decided to take steps to improve the quality of the Group’s capital base by carrying out the Second Placing and Open Offer, and using the proceeds to redeem the Preference Shares held by HM Treasury. Shareholders were able to apply to subscribe for £5.37 billion of new ordinary shares pro rata to their existing shareholdings at a fixed price of 31.75 pence per share by way of the open offer.
The capital restructuring resulting from the Second Placing and Open Offer removed the £0.6 billion annual cost of the preference share dividend and created £5 billion of additional Core Tier 1 capital, which provides a higher quality level of capital support against the impact on the Group’s business of any further deterioration in economic and financial market conditions. Following the Second Placing and Open Offer, HM Treasury currently own approximately 70.3 per cent. of the issued ordinary share capital of the company.
Various initiatives, such as the Asset Protection Scheme (“APS”) and the Credit Guarantee Scheme, are being progressed by the UK Government to stabilise the UK banking system further and enhance support for the economy. The stated aims of the APS and the Credit Guarantee Scheme are to reinforce the stability of the financial system, to increase confidence and capacity to lend, and in turn to support the recovery of the UK economy. The other initiatives are expected to focus on asset and funding risks which are central to freeing up additional lending capacity whilst augmenting the impact of the capital measures described above.
By participating in the APS, the Group will be able to free up its lending capacity. Consequently, the Group announced on 26 February 2009 that it would increase its lending to UK homeowners and businesses subject to the Group’s ordinary course credit and pricing criteria on the Group’s normal contractual terms by £25 billion over the next 12 months. The increased lending will be split £9 billion to mortgage lending and the remaining £16 billion to business lending. Similar levels of lending have been committed to in 2010. This latest commitment supersedes the lending commitments the Group announced in October 2008 and in January 2009 and builds on NatWest’s and RBS plc’s recently announced pledge to continue to provide committed overdrafts and no increased pricing for small business customers until at least the end of 2009. These lending commitments will cease if RBS does not participate in the APS and Credit Guarantee Scheme by 1 June 2009 or will reduce if it participates in only one of the APS or Credit Guarantee Scheme prior to 1 June 2009.
While redemption of the Preference Shares allows the resumption of a sustainable and progressive dividend policy for the Ordinary Shares (it was a term of the Preference Shares that no such dividends may be paid while the Preference Shares were in issue), it is not the Board’s intention to pay a dividend on the Ordinary Shares in 2009. If the B Shares are issued as announced on 26 February 2009, no cash dividend may be paid on the Ordinary Shares unless the cash dividend payable in respect of the same period on the B Shares is paid in full, and no scrip dividend may be paid on the Ordinary Shares unless the cash or scrip dividend payable in respect of the same period on the B Shares is paid in full.
Impact of the Second Placing and Open Offer and the Preference Share Redemption on RBS
The effect of the Second Placing and Open Offer and the Preference Share Redemption was to improve the quality of RBS’s regulatory capital by increasing RBS’s Core Tier 1 ratio; the Tier 1 ratio was not affected. The Second Placing and Open Offer and the Preference Share Redemption had no other impact on RBS’s balance sheet. The Preference Shares carried a coupon of 12 per cent. at the discretion of the Board while the new shares issued in connection with the Second Placing and Open Offer rank pari passu with the existing shares of the company for any dividend payments. Accordingly, other than the elimination of the annual distribution at the discretion of the Board in respect of the preference share coupon, and the inclusion of the new shares in the payment of any future dividends on RBS’s ordinary shares, the Placing and Open Offer and Preference Share Redemption had no impact on the Group’s income statement.
Sale of Bank of China Investment
On 14 January 2009, the Group (through RBS China Investment Sarl.) sold its entire 4.26 per cent stake in Bank of China for HKD18.4 billion.
Debt Tender and Exchange Offer
On 26 March 2009, RBS Financing Limited ("RBSF"), a subsidiary of the Group, launched a cash tender offer in the United States (the “RBSF US Tender Offer”) for any and all of the outstanding securities of ten different series previously issued by the Group and certain of its affiliates. Concurrently therewith, RBSF also launched a cash tender offer outside of the United States (the “RBSF Non-US Tender Offer”) for five different series of securities previously issued by The Royal Bank and certain of its affiliates and an offer outside of the United States to exchange (the “RBSF Exchange Offer”) any or all of the outstanding securities of fourteen different series previously issued by The Royal Bank and certain of its affiliates for new senior unsecured notes of The Royal Bank.
The RBSF Tender Offers and the RBSF Exchange Offer expired on 22 April 2009. In the RBSF US Tender Offer, an aggregate of approximately US $4.1 billion principal amount of securities were validly tendered, resulting in an aggregate purchase consideration paid for the tendered securities of approximately US $1.7 billion.
In the RBSF Non-US Tender Offer, an aggregate of approximately €2.3 billion principal amount of Euro-denominated securities and approximately US $264 million principal amount of Dollar-denominated securities were validly tendered, resulting in aggregate purchase consideration paid for the tendered securities of approximately €1.1 billion and US $100 million, respectively.
In the RBSF Exchange Offer, an aggregate of approximately £3.5 billion principal amount of securities were validly offered for exchange and exchanged for new senior unsecured notes of The Royal Bank in an aggregate principal amount of approximately £1.8 billion.
Litigation Update
Note 32 of the Notes on the Accounts provides disclosure regarding, among other things, litigation claims in the United Kingdom. With respect to the claims regarding unarranged overdraft charges, the Group and other banks appealed against the orders of the High Court. On 26 February 2009, the Court of Appeal delivered its judgment and rejected the appeals. The House of Lords has granted the Group and other banks leave to appeal the Court of Appeal’s decision. That further appeal is scheduled to take place on 23 June 2009. With respect to class action complaints filed in the United States District Court for the Southern District of New York, complaints relating to public filings in connection with the broad class of RBS publicly traded securities between 26 June 2007 and 19 January 2009 are included in the description of class action complaints in Note 32.
Strategic review
RBS has embarked on a sweeping restructuring of the Group that will fit its activities to the goals outlined above. While the details of the strategic plan will be refined over the coming weeks to take account of the final agreements reached with HM Treasury in respect of RBS’s participation in the APS, the plan is expected to include the following:
• RBS will create a “Non-Core” division of RBS during the second quarter of 2009, separately managed, but within the existing legal structures of the Group and matrix managed to donating divisions where necessary. RBS currently intends that this division will have approximately £240 billion of third party assets, £145 billion of derivative balances and £155 billion of risk-weighted assets, comprising individual assets, portfolios and businesses of the Group that RBS intends to run off or dispose of during the next three to five years. The specific timetable will vary in each case but will be as fast as RBS judges consistent with optimising shareholder value and risk. Approximately 90 per cent. of the Non-Core division will consist of GBM assets, primarily linked to proprietary portfolios, excess risk concentrations and illiquid ‘originate and hold’ asset portfolios. The rest of the Non-Core division will be risk concentrations, ‘out of footprint’ assets and smaller, less advantaged businesses within our Regional Markets activities across the world. As part of this effort it is intended that RBS’s representation in approximately 36 of the 54 countries it operates in around the world will be significantly
Business review continued
reduced or sold. RBS will remain strong in all its major existing global hubs, however. Given the commercial and human sensitivity of these issues, detail on this will not be given until the interim results. The income, expenses, impairments and credit market and other trading asset write downs associated with the Non-Core Division in 2008 were approximately £3.9 billion, £1.1 billion, £3.2 billion and £9.2 billion respectively.
• In addition to eliminating expenses associated with the Non-Core division, RBS has launched a restructuring plan to make efficiency savings across the Group, aimed at achieving run-rate reductions by 2011 of greater than £2.5 billion (16 per cent. of 2008 cost base) at constant exchange rates. This will involve a wide range of re-engineering and other measures and, regrettably, reductions in employment. This target excludes any impact of inflation, incentive pay movements or cost reductions arising from business exits or the impact of new projects (if any). It includes the £0.5 billion of ABN AMRO integration benefits previously announced but not reflected in 2008 expenses. We will book one-off charges against these actions over the next three years, with run-rate cost savings expected to provide ‘payback’ in 1.5 to 1.75 years.
• RBS plans to retain each of its major business divisions since it believes, with intensive restructuring, they can meet the attractive business characteristics outlined as targets above. In many cases the restructuring of these businesses to achieve RBS’s goals will be far-reaching, nevertheless. The greatest element of restructuring will be in GBM as signalled above. A substantial shrinkage of size, product and geographic scope will take place. This should leave GBM positioned profitably around those of its existing core strengths that rest on profitable customer franchise business with significantly less illiquid risk overall.
• At all times RBS will responsibly compare the value to RBS of each of its businesses with realistic alternatives and take different action if they prove compelling. However, the distressed and pessimistic state of markets for financial assets and businesses offers little immediate encouragement in that regard.
• Alongside our business restructuring activities will be substantive changes to management and internal processes. There will continue to be changes of personnel as RBS promotes and reassigns internal talent and add to its ranks externally. The Manufacturing division will re-align with the customer facing businesses. Businesses will have clear bottom-line returns, allocated equity and balance sheet and funding goals. While RBS drives for profit, there will be a concentration on earnings quality and sustainability, driven by strategic plans, to ensure alignment of our businesses to their markets and their risk targets. People evaluation and incentivisation will meet best practice levels to support the revised mission of the Company. This will be underpinned by a full suite of risk and funding constraints, including concentration limits.
RBS has already begun this major change programme. To carry it through in parallel with running its continuing business in difficult markets will test management capacity. RBS expects to be successful overall, though it will inevitably have setbacks and make mistakes along the way. But there is no alternative. RBS must change in a far-reaching way. If it does that, the strength, quality and power that are already present in RBS business across the world will have the chance to shine through once again.
Relationship with major shareholder
The UK Government currently owns 70.3 per cent. of the issued ordinary share capital of RBS. The UK Government’s shareholding in RBS is currently held by the Solicitor for the Affairs of HM Treasury as nominee for HM Treasury and managed by UK Financial Investments Limited (“UKFI”), a company wholly owned by HM Treasury. No formal relationship agreement has been concluded between RBS and the UK Government, although the relationship falls within the scope of the framework document between HM Treasury and UKFI published on 2 March 2009. This document states that UKFI will manage the UK financial institutions in which HM Treasury holds an interest “on a commercial basis and will not intervene in day-to-day management decisions of the Investee Companies (including with respect to individual lending or remuneration decisions)”, which is designed to ensure that control of the relationship is not abused. This document also makes it clear that such UK financial institutions will continue to be separate economic units with independent powers of decision and “will continue to have their own independent boards and management teams, determining their own strategies and commercial policies (including business plans and budgets).”
These goals are consistent with the stated public policy aims of the UK Government, as articulated in a variety of public announcements.
In the framework document between UKFI and HM Treasury, UKFI stated that its goal was to “develop and execute an investment strategy for disposing of the investments [in the banks] in an orderly and active way through sale, redemption, buy-back or other means within the context of an overarching objective of protecting and creating value for the taxpayer as shareholder, paying due regard to the maintenance of financial stability and to acting in a way that promotes competition.”
It was also stated that UKFI intended to “engage robustly with banks’ boards and management, holding both strategy and financial performance to account, and taking a strong interest in getting the incentives structures right on the board and beyond—accounting properly for risk and avoiding inefficient rewards for failure.”
In this connection, RBS announced on 17 February 2009 that it had reached an agreement with UKFI in respect of certain changes to its remuneration policy. RBS has also undertaken to conduct a review of its strategy and UKFI has been actively engaged in reviewing the output of this review.
In connection with its proposed access to the APS (further details of which are set out above), RBS has undertaken to provide lending to creditworthy UK homeowners and businesses in a commercial manner. RBS’s compliance with this commitment will be subject to a monthly reporting process to the UK Government. The lending commitment does not require RBS to lend in excess of its single name or sectoral risk concentration limits or otherwise to engage in uncommercial practices.
RBS, in common with other financial institutions, also works closely with a number of UK Government departments and agencies on various industry-wide initiatives that are intended to support the UK Government’s objective of supporting stability in the wider financial system.
Other than in relation to these areas, however, the UK Government has confirmed publicly that its intention is to allow the financial institutions in which it holds an interest to operate their business independently.
Following consultation with UKFI and other major institutional shareholders the Nominations Committee recommended the appointment of Philip Hampton to the Board of Directors, which approved the appointment.
As a result of the UK Government’s holding, the UK Government and UK Government controlled bodies became related parties of the Group. The Group enters into transactions with many of these bodies on an arms' length basis.
The Group is not a party to any transaction with the UK Government or any UK Government controlled body involving goods or services which is material to the Group, or any such transaction that is unusual in its nature or conditions. To the Group's knowledge, the Group does not believe it is a party to any transaction with the UK Government or any UK Government controlled body involving goods or services which is material to the UK Government or any UK Government controlled body, however, given the nature and extent of the UK Government controlled bodies, the Group may not know whether a transaction is material for such a party.
Any outstanding loans made by the Group to or for the benefit of the UK Government or any UK Government controlled body, were made on an arm's length basis and (A) such loans were made in the ordinary course of business, (B) were made on substantially the same terms, including interest rates and collateral, as those prevailing at the time for comparable transactions with other persons, and (C) did not involve more than the normal risk of collectibility or present other unfavorable features. The Group notes, however, that with respect to outstanding loans made by the Group to or for the benefit of the UK Government or any UK Government controlled body, there may not exist any comparable transactions with other persons.
Trading and outlook
On 26 February 2009, RBS announced its results for the year ended 31 December 2008. In that announcement, RBS made the following statement about current trading and outlook for 2009.
‘‘To make any forecast is hazardous beyond the expectation that 2009 will be a very tough year for the world economy. RBS, in common with all banks, will see some erosion of underlying income levels as a result of weaker business activity and low interest rates squeezing savings margins whilst credit costs rise, probably sharply. We hope that markets will be less disrupted than in 2008, with lower associated write-downs, but time will tell. 2009 has, in fact, started positively for our businesses. At the time of writing, RBS is in discussions with the UK Government concerning participation in the proposed Asset Protection Scheme (‘‘APS’’). This would be subject to shareholder vote in due course. The result of the APS discussions will have a material impact on RBS’s outlook, positive or negative depending on outcome. More information will be made available as soon as practicable.
Notwithstanding the challenging outlook, our businesses all around the world are inherently good and fully engaged in sustaining as robust a performance as the environment permits. And the strategic restructuring we have embarked on will see high levels of activity designed to reposition RBS successfully.’’
Annual General Meeting held on 3 April 2009
On 3 April 2009, the Group held its Annual General Meeting. At the meeting, shareholders voted to (i) elect Philip Hampton, Stephen Hester, John McFarlane and Arthur 'Art' Ryan as directors of the Group, (ii) re-appoint Deloitte LLP as the company’s auditor and (iii) authorise the Audit Committee to fix the remuneration of the auditors. All other resolutions presented to shareholders at the Annual General Meeting were also approved by shareholders.
General Meeting held on 3 April 2009
On 3 April 2009, the Group held a General Meeting in connection with the Second Placing and Open Offer. At the meeting, all resolutions presented to shareholders were approved by shareholders.
The Group faces strong competition in all the markets it serves. However,Banks’ balance sheets have strengthened whilst loan demand has been subdued as many customers have sought to de-lever and the global banking crisisUK economy has reduced the capacity of many institutionsproved slow to lend and has resulted in the withdrawal or disappearance of a number of market participants and significant consolidation of competitors, particularly in the US and UK.recover. Competition for retail deposits has intensified significantly reflecting the difficulties in the wholesale money markets.remains intense as institutions continue to target strong and diverse funding platforms for their balance sheets.
Competition for corporate and institutional customers in the UK is from UK banks and from large foreign financial institutions who are also active and offer combined investment and commercial banking capabilities.
In asset finance, the Group competes with banks and specialised asset finance providers, both captive and non-captive. In European and Asian corporate and institutional banking markets the Group competes with the large domestic banks active in these markets and with the major international banks.
In the small business banking market, the Group competes with other UK clearing banks, specialist finance providers and building societies.
In the personal banking segment, the Group competes with UK clearing banks and building societies, major retailers and life assurance companies. In the mortgage market, the Group competes with UK clearing banks and building societies. A numberThe ambitions of competitors have either left or scaled back their lendingnon-traditional players in the mortgageUK market remain strong with retailers and unsecured markets.new entrants forming aggressive expansion plans. The Group’sGroup's life assurance businesses compete with Independent Financial Advisers and life assurance companies.
In the UK credit card market large retailers and specialist card issuers, including major US operators are active in addition to the UK banks. In addition to physical distribution channels, providers compete through direct marketing activity and the internet.
In Europe, Asia and the Middle East, the enlarged Group now competes in retail banking with local and international banks. In a number of these markets there are regulatory barriers to entry or expansion, and the state ownership of banks. Competition is generally intensifying as more players enter markets that are perceived to be de-regulating and offer significant growth potential.
In Wealth Management, The Royal Bank of Scotland International competes with other UK and international banks to offer offshore banking services. Coutts and Adam & Company compete as private banks with UK clearing and private banks, and with international private banks. Competition in wealth management remains strong as banks maintain their focus on competing for affluent and high net worth customers.
RBS Insurance competes in personal lines insurance and, to a more limited extent, in commercial insurance. There is strong competition from a range of insurance companies which now operate telephone and internet direct sales businesses. Competition in the UK motor market remains particularly intense, and price comparison internet sites now play a major role in the marketplace. These sites are now extending their scope to home insurance and other lines. RBS Insurance also competes with local insurance companies in the direct motor insurance markets in Spain, Italy and Germany.
In Ireland, Ulster Bank and First Active competecompetes in retail and commercial banking with the major Irish banks and building societies, and with other UK and international banks and building societies active in the market. The challenging conditions in the Irish economy persist and many of the domestic Irish banks have required State support and are engaged in significant restructuring actions.
In the United States, Citizens competes in the New England, Mid-Atlantic and Mid-West retail and mid-corporate banking markets with local and regional banks and other financial institutions. The Group also competes in the US in large corporate lending and specialised finance markets, and in fixed-income trading and sales. Competition is principally with the large US commercial and investment banks and international banks active in the US.
The economic recovery in the US is proving weaker than expected and loan demand is weak in Citizens’ markets which in turn has dampened the level of competitive pressure in the deposit markets as funding pressures have eased.
Business reviewcontinued | Business review |
Risk factors
Set out below areis a summary of certain risk factorsrisks which could adversely affect the Group’s future results and cause them to be materially different from expected results. The Group’s results are also affected by competition and other factors. The factors discussed in this reportGroup. These should not be regarded as a complete and comprehensive statement of all potential risks and uncertainties. The company may face the risk A fuller description of full nationalisation and under such circumstances shareholders may lose the full value of their shares.
Under the provisions of the Banking Act, substantial powers have been granted to HM Treasury, the Bank of England and the Financial Services Authority (FSA) as part of the Special Resolution Regime to stabilise banks that are in financial difficulties. The Special Resolution Regime gives the authorities three stabilisation options: private sector transfer, of all or part of the business of a UK-incorporated institution with permission to accept deposits (a “relevant entity”); transfer of all or part of the business of the relevant entity to a “bridge bank” established by the Bank of England; and temporary public ownership (nationalisation) of the relevant entity or its UK-incorporated holding company.
The purpose of the stabilising options is to address the situation where all or part of the business of the relevant entity has encountered, or is likely to encounter, financial difficulties. Accordingly, the stabilisation options may only be exercised if the FSA is satisfied that a relevant entity such as the Group’s banking subsidiaries, including the Royal Bank and NatWest, (i) is failing, or is likely to fail, to satisfy the threshold conditions set out in Schedule 6 to the Financial Services and Markets Act 2000 (the “FSMA”) and (ii) having regard to timingthese and other relevant circumstances itrisk factors is not reasonably likely that action will be taken that will enable the relevant entityincluded on pages 352 to satisfy those threshold conditions. The threshold conditions are conditions which an FSA-authorised institution must satisfy in order to retain its FSA authorisation. They are relatively wide-ranging and deal with most aspects of a relevant entity’s business, including, but not limited to, minimum capital resource requirements. It is therefore possible that the FSA may exercise one of the stabilisation options before a relevant entity is in severe difficulties and before an application for insolvency or an administration order could be made.369.
The stabilisation options may be exercised by means of powers to transfer property, rights or liabilities of a relevant entity and shares and other securities issued by a relevant entity. HM Treasury may also take the parent company of a relevant entity (such as the Company) into temporary public ownership provided that certain conditions set out in Section 82 of the Banking Act are met. Temporary public ownership is effected by way of a share transfer order.
If HM Treasury makes the decision to take the holding company of a relevant entity into temporary public ownership, it may take various actions in relation to securities issued by the holding company, including:
| RBSG or any of its UK bank subsidiaries may face the risk of full nationalisation or other resolution procedures and various actions could be taken by or on behalf of the UK Government, including actions in relation to transferany securities free from anyissued, new or existing contractual arrangements and transfers of part or legislativeall of RBSG’s businesses. |
| The Group’s ability to implement its strategic plan depends on the success of its efforts to refocus on its core strengths and its balance sheet reduction programme. As part of the Group’s strategic plan and implementation of the State Aid restructuring plan agreed with the EC and HM Treasury, the Group is undertaking an extensive restructuring which may adversely affect the Group’s business, results of operations and financial condition and give rise to increased operational risk and may impair the Group’s ability to raise new Tier 1 capital due to restrictions on transfer;its ability to make discretionary dividend or coupon payments on certain securities. |
| The Group’s businesses, earnings and financial condition have been and will continue to transfer securities free from any trust, liability, or encumbrance;be affected by geopolitical conditions, the global economy, the instability in the global financial markets and increased competition. These have resulted in significant changes in market conditions including interest rates, foreign exchange rates, credit spreads, and other market factors and consequent changes in asset valuations. |
| The Group requires access to extinguish rightssources of liquidity, which have been constrained in recent years, and a failure to acquire securities;access liquidity due to market conditions or otherwise could adversely affect the Group’s financial condition. In addition, the Group’s borrowing costs and its access to the debt capital markets and other sources of liquidity depend significantly on its and the UK Government’s credit ratings. |
| The actual or perceived failure or worsening credit of the Group’s counterparties (including monolines or other credit insurers) or borrowers and depressed asset valuations resulting from poor market conditions have adversely affected and could continue to delist securities; oradversely affect the Group. |
| The value of certain financial instruments recorded at fair value is determined using financial models incorporating assumptions, judgements and estimates that may change over time or may ultimately not turn out to convert securities into another form or class.be accurate. |
Where HM Treasury has made a share transfer order in respect of securities issued by the holding company of a relevant entity, HM Treasury may make an order providing for the property, rights or liabilities of the holding company or of any relevant entity in the holding company group to be transferred. | The Group’s insurance businesses are subject to inherent risks involving claims on insured events. |
Shareholders may have a claim for compensation under one of the compensation schemes provided for in the Banking Act. For the purposes of determining an amount of compensation, an independent valuer must disregard actual or potential financial assistance provided by the Bank of England or HM Treasury. | The Group’s business performance, financial condition and capital and liquidity ratios could be adversely affected if its capital is not managed effectively or as a result of changes to capital adequacy and liquidity requirements, including those arising out of Basel III implementation (globally or by UK authorities), or if the Group is unable to issue Contingent B Shares to HM Treasury under certain circumstances. |
| The Group could fail to attract or retain senior management, which may include members of the Board, or other key employees, and it may suffer if it does not maintain good employee relations. |
| Any significant developments in regulatory or tax legislation could have an effect on how the Group conducts its business and on its results of operations and financial condition, and the recoverability of certain deferred tax assets recognised by the Group is subject to uncertainty. |
| The Group is subject to substantial regulation and oversight, and any significant regulatory or legal developments could have an adverse effect on how the Group conducts its business and on its results of operations and financial condition. In addition, the Group is and may be subject to litigation and regulatory investigations that may impact its business, results of operations and financial condition. |
| Operational and reputational risks are inherent in the Group’s operations. |
| The Group may be required to make contributions to its pension schemes and government compensation schemes, either of which may have an adverse impact on the Group’s results of operations, cash flow and financial condition. |
| As a result of the UK Government’s majority shareholding in the Group they can, and in the future may decide, to exercise a significant degree of influence over the Group including suspending dividends and certain coupon payments, modifying or cancelling contracts or limiting the Group’s operations. The offer or sale by the UK Government of all or a portion of its shareholding in the company could affect the market price of the equity shares and other securities and acquisitions of ordinary shares by the UK Government (including through conversions of other securities or further purchases of shares) may result in the delisting of the Group from the Official List. |
| The Group’s participation in the APS is costly and complex and may not produce the benefits expected and the occurrence of associated risks may have a material adverse impact on the Group’s business, capital or tax position, financial condition and results of operations. Any changes to the regulatory treatment of the APS may negatively impact the Group’s capital position and any withdrawal from, or termination of, the APS will be costly. |
There can be no assurance that Shareholders would thereby recover compensation promptly and/or equal to any loss actually incurred.
If the Group were made subject to the Special Resolution Regime and a partial transfer of the Group’s business was effected, the nature and mix of the assets and liabilities not transferred may adversely affect its financial condition and increase the risk that the Group may eventually become subject to administration or insolvency proceedings.
Over the last six months, the UK Government has taken action under the Banking (Special Provisions) Act 2008 in respect of a number of UK financial institutions, including in extreme circumstances, full and part nationalisation. There have been concerns in the market in recent months regarding the risks of such nationalisation in relation to RBS and other UK banks. If economic conditions in the UK or globally continue to deteriorate, or the events described in the following risk factors occur to such an extent that they have a materially adverse impact on the financial condition, perceived or actual credit quality, results of operations or business of any of the relevant entities in the Group, the UK Government may decide to take similar action in relation to RBS. Given the extent of HM Treasury’s and the Bank of England’s powers under the Banking Act, it is difficult to predict what effect such actions might have on RBS and any securities issued by it. However, potential impacts may include full nationalisation of RBS and the total loss of value in RBS shares.
If RBS is unable to participate in the APS, or the operation of the APS fails to have the desired effect on RBS’s financial and capital position, the Company may face the increased risk of full nationalisation. If the costs of participation outweigh the benefits, this could have a negative impact on RBS’s business, earnings and financial prospects and its Share price may suffer.
On 26 February 2009, RBS announced its intention to participate in the APS. However, its ability to participate in the APS is subject to the satisfaction of a number of conditions which may not be satisfied, including, among others, the completion of due diligence by (and to the satisfaction of) HM Treasury, the receipt of certain regulatory approvals (including European Commission State Aid clearance), the approval of a majority of RBS’s Independent Shareholders, finalisation of the terms of the APS and RBS’s participation therein and the satisfaction by RBS of certain specified application criteria. The failure to satisfy these conditions could result in RBS being unable to participate in the APS and therefore failing to obtain protection against stressed losses through the economic cycle as well as failing to improve its capital ratios at the RBS consolidated Group level. The result of this may mean intervention by the UK Government, which could include full nationalisation, under which circumstances any compensation payable to Shareholders would be subject to the provisions of the Banking Act, and Shareholders may lose the full value of their Shares.
Furthermore, even if RBS is able to participate in the APS, there can be no assurance that such participation will enable RBS to achieve all of the stated goals of the APS. While the APS is expected to limit losses associated with assets to be covered by the APS, RBS would remain fully exposed in respect of a specified “first loss” amount and exposed to 10 per cent. of losses exceeding that “first loss” amount. In addition, RBS would continue to be exposed to the risk of losses, impairments and write-downs with respect to assets not covered by the APS. Although RBS would have the option to obtain an additional £6 billion in capital from HM Treasury (in the form of a subscription for further B Shares) there can be no assurance that such additional capital, together with RBS’s strengthened capital position as a result of the Placing and Open Offer, and the capital resulting from the proposed issue of the £6.5 billion and £13 billion of B Shares, will be sufficient to maintain the Group’s capital ratios in the event of further losses, which could cause RBS’s business, results of operation and financial condition to suffer, its credit rating to drop, its ability to lend and access funding to be further limited, its cost of funding to increase and its Share price to decline, any of which would increase the risk of the full nationalisation of RBS.
In addition, there can be no assurance that the costs to RBS of its participation in the APS will not outweigh any benefits received. For example, RBS has agreed in principle that if it accedes to the APS, it will give up the right to certain tax losses and allowances which may affect the after-tax returns of the Group in future years. As a result of RBS’s agreement to give up such UK tax losses and allowances it is likely that RBS will pay UK corporation tax in earlier accounting periods than it would otherwise have done.
The Group’s businesses, earnings and financial condition have been and will continue to be affected by the continued deterioration in the global economy, as well as ongoing instability in the global financial markets.
The performance of the Group has been and will continue to be influenced by the economic conditions of the countries in which it operates, particularly the United Kingdom, the United States and other countries throughout Europe and Asia. Recessionary conditions are present in many of these countries, including the United Kingdom and the United States, and such conditions are expected to continue or worsen over the near to medium term. In addition, the global financial system is continuing to experience the difficulties which first manifested themselves in August 2007, and the financial markets have deteriorated significantly since the bankruptcy filing by Lehman Brothers in September 2008. These conditions have led to severe and continuing dislocation of financial markets around the world and unprecedented levels of illiquidity, resulting in the development of significant problems at a number of the world’s largest corporate institutions operating across a wide range of industry sectors, many of whom are the Group’s customers and counterparties in the ordinary course of its business. In response to this economic instability and illiquidity in the market, a number of governments, including the UK Government, the governments of the other EU member states and the US Government, have intervened in order to inject liquidity and capital into the financial system, and, in some cases, to prevent the failure of these institutions.
Business review continued
Despite such measures, the volatility and disruption of the capital and credit markets have continued at unprecedented levels, and global recessionary conditions are expected to continue. These conditions have produced and will continue to produce downward pressure on stock prices and on availability and cost of credit for financial institutions, including the Group, and will continue to impact on the credit quality of the Group’s customers and counterparties. Such conditions, alone or in combination with regulatory changes or actions of other market participants, may cause the Group to experience further reductions in business activity, increased funding costs and funding pressures, lower share prices, decreased asset values, additional write downs and impairment charges and lower profitability or to incur losses.
In addition, the Group will continue to be exposed to the risk of loss if major corporate borrowers or counterparty financial institutions fail or are otherwise unable to meet their obligations. The Group’s performance may also be affected by future recovery rates on assets and the historical assumptions underlying asset recovery rates, which may no longer be accurate given the unprecedented market disruption and general economic instability. The precise nature of all the risks and uncertainties the Group faces as a result of current economic conditions cannot be predicted and many of these risks are outside the Group’s control.
Any conversion of the B Shares would significantly increase HM Treasury’s ownership interest in RBS, have a corresponding dilutive effect on other RBS Shareholders and could result in the delisting of RBS’s securities.
At the same time as RBS announced its proposed participation in the APS, RBS announced that, if it participated in the APS, it would issue £6.5 billion of B Shares to HM Treasury. RBS also announced that it would issue a further £13 billion of B Shares to HM Treasury on or after implementation of the APS, and HM Treasury would grant RBS the option to require HM Treasury to purchase a further £6 billion of B Shares from it. The B Shares, if issued, will rank pari passu with the Ordinary Shares on a winding-up. The B Shares would be convertible, at the option of the holder at any time, into Ordinary Shares at an initial conversion price of £0.50 per Ordinary Share. HM Treasury would agree not to convert any B Shares it holds if, as a result of such conversion, it would hold 75 per cent. or more of the Ordinary Shares, unless the price of the Ordinary Shares is equal to or exceeds £0.65 for a specified period in which case conversion is mandatory in any event. If all £25.5 billion of B Shares are issued, such conversion of the B Shares would significantly increase HM Treasury’s ownership interest in RBS up to approximately 84.4 per cent. of the Company’s issued share capital, and have a corresponding dilutive effect on other RBS Shareholders (as would the issue of the B Shares themselves in the event of a winding-up) although any such conversion would have no impact on the Group’s Tier 1 capital position. Furthermore, a mandatory conversion of the B Shares by HM Treasury would put RBS in breach of the Listing Rules requirement that 25 per cent. of its issued share capital must be in public hands. Although RBS may apply to the UKLA for a waiver in such circumstances, there is no guarantee that such a waiver would be granted, the result of which could be the delisting of RBS from the Official List and potentially other exchanges where its securities are currently listed and traded. In addition, HM Treasury will not be entitled to vote in respect of Ordinary Shares acquired by it as a result of the conversion of B Shares into Ordinary Shares to the extent, but only to the extent, that votes cast on such Ordinary Shares, together with any other votes which HM Treasury is entitled to cast in respect of any other Ordinary Shares held by or on behalf of HM Treasury would exceed 75 per cent. of the total votes eligible to be cast on a resolution presented at a general meeting of the Company.
Lack of liquidity is a risk to the Group’s business and its ability to access sources of liquidity has been, and will continue to be, constrained.
Liquidity risk is the risk that a bank will be unable to meet its obligations, including funding commitments, as they fall due. This risk is inherent in banking operations and can be heightened by a number of enterprise specific factors, including an over-reliance on a particular source of funding (including, for example, short term and overnight funding), changes in credit ratings or market-wide phenomena such as market dislocation and major disasters. Credit markets worldwide have experienced and continue to experience a severe reduction in liquidity and term-funding in the aftermath of events in the US sub-prime residential mortgage market and the current severe market dislocation. Perception of counterparty risk between banks has also increased significantly following the bankruptcy filing by Lehman Brothers. This increase in perceived counterparty risk has led to further reductions in inter-bank lending, and hence, in common with many other banks, the Group’s access to traditional sources of liquidity has been, and may continue to be, restricted.
The Group’s liquidity management focuses on maintaining a diverse and appropriate funding strategy for its operations, controlling the mismatch of maturities and carefully monitoring its undrawn commitments and contingent liabilities. However, the Group’s ability to access sources of liquidity (for example, through the issue or sale of financial and other instruments or through the use of term loans) during the recent period of liquidity stress has been constrained to the point where it, like other banks, has had to rely on shorter term and overnight funding with a consequent reduction in overall liquidity, and to increase its recourse to liquidity schemes provided by central banks.
In addition, there is also a risk that corporate and institutional counterparties with credit exposures may look to reduce all credit exposures to banks, given current risk aversion trends. It is possible that credit market dislocation becomes so severe that overnight funding from non-government sources ceases to be available.
Furthermore, like many banks, the Group relies on customer deposits to meet a considerable portion of its funding requirements and such deposits are subject to fluctuation due to certain factors outside the Group’s control, such as a loss of confidence, competitive pressures or the encouraged or mandated repatriation of deposits by foreign wholesale or central bank depositors which could result in a significant outflow of deposits within a short period of time. Any material decrease in the Group’s deposits could, particularly if accompanied by one of the other factors described above, have a negative impact on the Group’s liquidity unless corresponding actions were taken to improve the liquidity profile of other deposits or to reduce assets.
The governments of some of the countries in which the Group operates have taken steps to guarantee the liabilities of the banks and branches operating in their respective jurisdiction. Whilst in some instances the operations of the Group are covered by government guarantees alongside other local banks, in other countries this may not necessarily always be the case. This may place subsidiaries operating in those countries, such as Ulster Bank Ireland Ltd, which did not participate in such government guarantee schemes, at a competitive disadvantage to the other local banks and therefore may require the Group to provide additional funding and liquidity support to these operations.
There can be no assurance that these measures, alongside other available measures, will succeed in improving the funding and liquidity in the markets in which the Group operates, or that these measures, combined with any increased cost of any funding currently available in the market, will not lead to a further increase in the Group’s overall cost of funding, which could have an adverse impact on the Group’s financial condition and results of operations or result in a loss of value in RBS shares.
Business review continued
Governmental support schemes are subject to cancellation, change or withdrawal (on a general or individual basis), which may have a negative impact on the availability of funding in the markets in which the Group operates.
Governmental support schemes are subject to cancellation, change or withdrawal (on a general or individual basis), based on changing economic and political conditions in the jurisdiction of the relevant scheme. Furthermore, certain schemes which have been recently announced have in fact not been fully implemented, or their terms have not yet been finalised. To the extent government support schemes are cancelled, changed or withdrawn in a manner which diminishes their effectiveness, or to the extent such schemes fail to generate additional liquidity or other support in the relevant markets in which such schemes operate, the Group, in common with other banks, may continue to face limited access to, have insufficient access to, or incur higher costs associated with, funding alternatives, which could have a material adverse impact on the Group’s business, financial condition, results of operations and prospects and result in a loss of value in RBS shares.
The financial performance of the Group has been and will be affected by borrower credit quality.
Risks arising from changes in credit quality and the recoverability of loans and amounts due from counterparties are inherent in a wide range of the Group’s businesses. The outlook for the global economy over the near to medium term has continued to deteriorate, particularly in the UK, the United States and other European economies. For example, there is an expectation of further reductions in residential and commercial property prices, higher unemployment rates and reduced profitability of corporate borrowers. As a result, the Group has seen and expects to continue to see adverse changes in the credit quality of its
Business reviewcontinued | Business review |
Business review continued
borrowers and counterparties, with increasing delinquencies, defaults and insolvencies across a range of sectors. This trend has led and may lead to further impairment charges, higher costs, additional write downs and losses for the Group or result in a loss of value in RBS shares.
The actual or perceived failure or worsening credit of the Group’s counterparties has adversely affected and could continue to adversely affect the Group.
The Group’s ability to engage in routine funding transactions has been and will continue to be adversely affected by the actual or perceived failure or worsening credit of its counterparties, including other financial institutions and corporate borrowers. The Group has exposure to many different industries and counterparties and routinely executes transactions with counterparties in the financial industry, including brokers and dealers, commercial banks, investment banks, mutual and hedge funds and other institutional clients. As a result, defaults by, or even the perceived creditworthiness of or concerns about, one or more corporate borrowers, financial services institutions, or the financial services industry generally, have led to market-wide liquidity problems and could lead to losses or defaults by the Group or by other institutions. Many of these transactions expose the Group to credit risk in the event of default of the Group’s counterparty or client. In addition, the Group’s credit risk is exacerbated when the collateral it holds cannot be realised or is liquidated at prices not sufficient to recover the full amount of the loan or derivative exposure that is due to the Group, which is most likely to occur during periods of illiquidity and depressed asset valuations, such as those currently experienced. Any such losses could have a material adverse effect on the Group’s results of operations and financial condition or result in a loss of value in RBS shares.
The Group’s earnings and financial condition have been, and its future earnings and financial condition are likely to continue to be, affected by depressed asset valuations resulting from poor market conditions.
Financial markets are currently subject to significant stress conditions, where steep falls in perceived or actual asset values have been accompanied by a severe reduction in market liquidity, as exemplified by recent events affecting asset backed collateralised debt obligations (CDOs), the US sub-prime residential mortgage market and the leveraged loan market. In dislocated markets, hedging and other risk management strategies have proven not to be as effective as they are in normal market conditions due in part to the decreasing credit quality of hedge counterparties, including monoline and other insurance companies and credit derivative product companies. Severe market events have resulted in the Group recording large write-downs on its credit market exposures in 2007 and 2008. The Group expects that the deterioration in economic and financial market conditions will lead to further impairment charges and write-downs during the current financial year. Moreover, recent market volatility and illiquidity has made it difficult to value certain of the Group’s exposures. Valuations in future periods, reflecting, among other things, then-prevailing market conditions and changes in the credit ratings of certain of the Group’s assets, may result in significant changes in the fair values of the Group’s exposures, even in respect of exposures, such as credit market exposures, for which the Group has previously recorded write-downs. In addition, the value ultimately realised by the Group may be materially different from the current or estimated fair value. Any of these factors could require the Group to recognise further significant write-downs or realise increased impairment charges, any of which may adversely affect its capital position, its financial condition and its results of operations or result in a loss of value in RBS shares.
The value or effectiveness of any credit protection that the Group has purchased from monoline and other insurers and other market counterparties (including credit derivative product companies) depends on the value of the underlying assets and the financial condition of the insurers and such counterparties.
The Group has credit exposure arising from over-the-counter derivative contracts, mainly credit default swaps (CDSs), which are carried at fair value. The fair value of these CDSs, as well as the Group’s exposure to the risk of default by the underlying counterparties, depends on the valuation and the perceived credit risk of the instrument against which protection has been bought. Since 2007, monoline and other insurers and other market counterparties (including credit derivative product companies) have been adversely affected by their exposure to residential mortgage linked and corporate credit products. As a result, their actual and perceived credit worthiness deteriorated significantly in 2008 and may continue to be so impacted in 2009. If the financial condition of these counterparties or their actual and perceived credit worthiness deteriorates further, the Group may record further credit valuation adjustments on the CDSs bought from these counterparties in addition to those already recorded.
Changes in interest rates, foreign exchange rates, bond, equity and commodity prices, and other market factors have significantly affected and will continue to affect the Group’s business.
Some of the most significant market risks the Group faces are interest rate, foreign exchange, bond, equity and commodity price risks. Changes in interest rate levels, yield curves and spreads may affect the interest rate margin realised between lending and borrowing costs, the effect of which may be heightened during periods of liquidity stress, such as those experienced in recent months. Changes in currency rates, particularly in the sterling-US dollar and sterling-euro exchange rates, affect the value of assets, liabilities, income and expenses denominated in foreign currencies and the reported earnings of the Group’s non-UK subsidiaries (principally ABN AMRO, Citizens and RBS Greenwich Capital) and may affect income from foreign exchange dealing. The performance of financial markets may affect bond, equity and commodity prices and, therefore, cause changes in the value of the Group’s investment and trading portfolios. This has been the case during the period since August 2007, with market disruptions and volatility resulting in significant reductions in the value of such portfolios. While the Group has implemented risk management methods to mitigate and control these and other market risks to which it is exposed, it is difficult, particularly in the current environment, to predict with accuracy changes in economic or market conditions and to anticipate the effects that such changes could have on the Group’s financial performance and business operations or result in a loss of value in RBS shares.
The Group’s borrowing costs and its access to the debt capital markets depend significantly on its credit ratings.
On 19 January 2009, S&P affirmed the long-term and short-term counterparty credit ratings for the Royal Bank at A+ and A-1 respectively. The outlook for all entities of the Group was confirmed as stable, reflecting S&P’s view that the Group is of systemic importance to the UK banking system and that S&P now explicitly factor four notches of uplift into their long-term counterparty credit rating on the Group. At the same time S&P lowered its ratings on the Group’s hybrid capital issues to BB from BBB, additionally the BB rating was placed under CreditWatch with negative implications. On the same date, Fitch affirmed the Group and the Royal Bank’s Long-term and Short-term Issuer Default Ratings at AA- and F1+ respectively and downgraded the Group and the Royal Bank’s individual ratings to E from B/C. The outlook for the Issuer Default Ratings remains stable reflecting Fitch’s expectation of continued strong government support for the Group. The Group’s support rating was upgraded from 1 to 5 and its support floor revised to AA- from No Floor. Fitch also downgraded the Group and the Royal Bank’s Tier 1 preference shares to BB- from A+, and upper tier 2 hybrid capital instruments issued by Group companies to BB from A+ and placed all of these securities on Rating Watch Negative. Moody’s on 20 January 2009 downgraded the senior unsecured rating of the Royal Bank to Aa3 from Aa1 with a negative outlook. The Group’s senior debt rating was downgraded to A1 from Aa2 again with a negative outlook. The Bank Financial Strength Rating was lowered to C- from B and remains under review for further possible downgrade. The short term P-1 ratings of both the Group and the Royal Bank were affirmed. The outlook for all Group entities incorporates Moody’s view on the long-term credit profile of the Group beyond the current government support-phase as well as their view of the very high probability of on-going support from the Aaa-rated UK Government. Any future reductions in the long-term credit ratings of the Group or one of its principal subsidiaries (particularly the Royal Bank) could further increase its borrowing costs. Any further reductions may also limit the Group’s access to the capital markets and trigger additional collateral requirements in derivative contracts and other secured funding arrangements. Credit ratings of the Group and the Royal Bank are also important to the Group when competing in certain markets, such as over-the-counter derivatives. As a result, any further reductions in the Group’s or the Royal Bank’s credit ratings could adversely affect its access to liquidity and competitive position, increase its funding costs and have a negative impact on the Group’s earnings and financial condition or result in a loss of value in RBS shares.
The Group’s business performance could be adversely affected if its capital is not managed effectively.
Effective management of the Group’s capital is critical to its ability to operate its businesses, to grow organically and to pursue its strategy. The Group is required by regulators in the United Kingdom, the United States, the Netherlands and in other jurisdictions in which it undertakes regulated activities, to maintain adequate capital. The maintenance of adequate capital is also necessary to enhance the Group’s financial flexibility in the face of continuing turbulence and uncertainty in the global economy. Accordingly, the purpose of the First Placing and Open Offer and the issue of the Preference Shares was to allow the company to strengthen its capital position. As at 31 December 2008 the Group’s Tier 1 and Core Tier 1 capital ratios were 10.0 per cent. and 6.8 per cent. respectively, using the Basel II methodology. Although the net proceeds of the First Placing and Open Offer and the Preference Share Issue strengthened the Group’s capital base significantly, and the net proceeds of the Second Placing and Open Offer were used to redeem the existing £5 billion of Preference Shares and which thereby improved the quality of the Group’s capital by increasing the Group’s Core Tier 1 capital ratio, any change that limits the Group’s ability effectively to manage its balance sheet and capital resources going forward (including, for example, reductions in profits and retained earnings as a result of write-downs or otherwise,
Business review continued
increases in risk-weighted assets, delays in the disposal of certain assets or the inability to syndicate loans as a result of market conditions or otherwise) or to access funding sources, could have a material adverse impact on its financial condition and regulatory capital position or result in a loss of value in RBS shares.
The value of certain financial instruments recorded at fair value is determined using financial models incorporating assumptions, judgements and estimates that may change over time or may ultimately not turn out to be accurate.
Under IFRS, the Group recognises at fair value: (i) financial instruments classified as ‘held-for-trading’ or ‘designated as at fair value through profit or loss’; (ii) financial assets classified as ‘available-for-sale’; and (iii) derivatives, each as further described in ‘Accounting Policies’ on page 166 of the financial statements. Generally, to establish the fair value of these instruments, the Group relies on quoted market prices or, where the market for a financial instrument is not sufficiently active, internal valuation models that utilise observable market data. In certain circumstances, the data for individual financial instruments or classes of financial instruments utilised by such valuation models may not be available or may become unavailable due to changes in market conditions, as has been the case during the current financial crisis. In such circumstances, the Group’s internal valuation models require the Group to make assumptions, judgements and estimates to establish fair value. In common with other financial institutions, these internal valuation models are complex, and the assumptions, judgements and estimates the Group is required to make often relate to matters that are inherently uncertain, such as expected cash flows, the ability of borrowers to service debt, residential and commercial property price appreciation and depreciation, and relative levels of defaults and deficiencies. Such assumptions, judgements and estimates may need to be updated to reflect changing facts, trends and market conditions. The resulting change in the fair values of the financial instruments has had and could continue to have a material adverse effect on the Group’s earnings and financial condition. Also, recent market volatility and illiquidity has challenged the factual bases of certain underlying assumptions and has made it difficult to value certain of the Group’s financial instruments. Valuations in future periods, reflecting prevailing market conditions, may result in further significant changes in the fair values of these instruments, which could have a negative effect on the Group’s results of operations and financial condition or result in a loss of value in RBS shares.
The Group’s future earnings and financial condition in part depend on the success of the Group’s strategic refocus on core strengths and its disposal programme.
In light of the recently changed global economic outlook, the Group has embarked on a restructuring which focused on achieving appropriate risk-adjusted returns under these changed circumstances, reducing reliance on wholesale funding and lowering exposure to capital intensive businesses. The Group will also continue with its disposal programme and continue to review its portfolio to identify further disposals of certain non-core assets. For further details of these re-structuring plans, please read “Business Review – Strategic Review” on page 9 of this document.
Although the proceeds of the Second Placing and Open Offer improved the quality of the Group's capital by replacing the existing £5 billion of Preference Shares with £5 billion of Core Tier 1 capital, the global credit markets remain challenging and the Group’s execution of its current and future strategic plans may not be successful. In connection with the implementation of these plans, the Group may incur restructuring charges, which may be material. Furthermore, if the Group’s plans, including any planned disposals, are not successful or fail to achieve the results expected, the Group’s business, capital position financial condition, results of operations and future prospects may be negatively impacted or this could result in a loss of value in RBS shares.
The Group operates in markets that are highly competitive and consolidating. If the Group is unable to perform effectively, its business and results of operations will be adversely affected.
Recent consolidation among banking institutions in the United Kingdom, the United States and throughout Europe is changing the competitive landscape for banks and other financial institutions. This consolidation, in combination with the introduction of new entrants into the US and UK markets from other European and Asian countries, could increase competitive pressures on the Group. Moreover, if financial markets continue to be volatile, more banks may be forced to consolidate.
In addition to the effects of consolidation, increased government ownership of, and involvement in, banks generally may have an impact on the competitive landscape in the major markets in which the Group operates. Although, at present, it is difficult to predict what the effects of this increased government ownership and involvement will be or how it will differ from jurisdiction to jurisdiction, such involvement may cause the Group to experience stronger competition for corporate, institutional and retail clients and greater pressure on profit margins. Since the markets in which the Group operates are expected to remain highly competitive in all areas, these and other changes to the competitive landscape could adversely affect the Group’s business, margins, profitability and financial condition or result in a loss of value in RBS shares.
The Group has agreed to certain undertakings in relation to the operation of its business in the First Placing and Open Offer Agreement, the Second Placing and Open Offer Agreement and in connection with the proposed APS, which may serve to limit the Group’s operations.
Under the terms of the First Placing and Open Offer Agreement, the Group provided certain undertakings aimed at ensuring that the subscription by HM Treasury for the relevant Ordinary Shares and the Preference Shares and the Group’s potential participation in the guarantee scheme promoted by HM Treasury as part of its support for the UK banking industry are compatible with the common market under EU law. These undertakings include (i) supporting certain initiatives in relation to mortgage lending and lending to SMEs until 2011, (ii) regulating management remuneration and (iii) regulating the rate of growth of the Group’s balance sheet. Under the terms of the Second Placing and Open Offer Agreement, the Group’s undertakings in relation to mortgage lending and lending to SMEs were extended to larger commercial and industrial companies in the United Kingdom. These undertakings may serve to limit the Group’s operations. In addition, pursuant to the Lending Commitments Letter, the Group is subject to further undertakings, which supersede the lending commitments made to HM Treasury in October 2008 and January 2009 by agreeing to lend £16 billion above the amount the Group had budgeted to lend to UK businesses and £9 billion above the amount the Group had budgeted to lend to UK homeowners in the year commencing 1 March 2009, with a commitment to lend at similar levels in the year commencing 1 March 2010. For a description of these undertakings, please read “Material Contracts” on page 267 of this document.
The Group could fail to attract or retain senior management or other key employees.
The Group’s ability to implement its strategy depends on the ability and experience of its senior management and other key employees. The loss of the services of certain key employees, particularly to competitors, could have a negative impact on the Group’s business. The Group’s future success will also depend on its ability to attract, retain and remunerate highly skilled and qualified personnel competitively with its peers. This cannot be guaranteed, particularly in light of heightened regulatory oversight of banks and heightened scrutiny of, and (in some cases) restrictions placed upon, management compensation arrangements, in particular those in receipt of Government funding (such as the Group). The Group recently announced changes to its compensation structure which included significant reductions in bonuses to be paid in respect of 2008, and limitations on pay rises in 2009. Details of these changes are outlined in the letter from the Chairman of the Remuneration Committee on page 140. In addition to the effects of such measures on the Group’s ability to retain senior management and other key employees, the marketplace for skilled personnel is becoming more competitive, which means the cost of hiring, training and retaining skilled personnel may continue to increase. The failure to attract or retain a sufficient number of appropriately skilled personnel could prevent the Group from successfully implementing its strategy, which could have a material adverse effect on the Group’s financial condition and results of, operations or result in a loss of value in RBS shares.
Each of the Group’s businesses is subject to substantial regulation and oversight. Any significant regulatory developments could have an effect on how the Group conducts its business and on its results of operations and financial condition.
The Group is subject to financial services laws, regulations, administrative actions and policies in each location in which it operates. All of these are subject to change, particularly in the current market environment, where there have been unprecedented levels of government intervention and changes to the regulations governing financial institutions, including recent nationalisations in the United Kingdom, the United States and other European countries. As a result of these and other ongoing and possible future changes in the financial services regulatory landscape (including requirements imposed by virtue of the Group’s participation in any government or regulator-led initiatives), the Group expects to face greater regulation in the United Kingdom, the United States, the Netherlands and other countries in which it operates, including throughout the rest of Europe.
Business review continued
Compliance with such regulations may increase the Group’s capital requirements and costs and have an adverse impact on its business, the products and services it offers and the value of its assets or result in a loss of value in RBS shares.
Other areas where governmental policies and regulatory changes could have an adverse impact include, but are not limited to:
· | the monetary, interest rate, capital adequacy and other policies of central banks and regulatory authorities; |
· | general changes in government or regulatory policy or changes in regulatory regimes that may significantly influence investor decisions in particular markets in which the Group operates or may increase the costs of doing business in those markets; |
· | changes to financial reporting standards; |
· | other general changes in the regulatory requirements, such as prudential rules relating to the capital adequacy framework and the imposition of onerous compliance obligations, restrictions on business growth or pricing and requirements to operate in a way that prioritises objectives other than shareholder value creation; |
· | changes in competition and pricing environments; |
· | further developments in the financial reporting environment; |
· | differentiation amongst financial institutions by governments with respect to the extension of guarantees to bank customer deposits and the terms attaching to such guarantees, including requirements for the entire Group to accept exposure to the risk of any individual member of the Group, or even third party participants in guarantee schemes, failing; |
· | implementation of, or costs related to, local customer or depositor compensation or reimbursement schemes; |
· | transferability and convertibility of currency risk; |
· | expropriation, nationalisation and confiscation of assets; |
· | changes in legislation relating to foreign ownership; and |
Business review continued
· | other unfavourable political, military or diplomatic developments producing social instability or legal uncertainty which, in turn, may affect demand for the Group’s products and services. |
The Group’s results have been and could be further adversely affected in the event of goodwill impairment.
The Group capitalises goodwill, which is calculated as the excess of the cost of an acquisition over the net fair value of the identifiable assets, liabilities and contingent liabilities acquired. Acquired goodwill is recognised initially at cost and subsequently at cost less any accumulated impairment losses. As required by IFRS, the Group tests goodwill for impairment annually or more frequently, at external reporting dates, when events or circumstances indicate that it might be impaired. An impairment test involves comparing the recoverable amount (the higher of value in use and fair value less cost to sell) of an individual cash generating unit with its carrying value. The value in use and fair value of the Group’s cash generating units are affected by market conditions and the performance of the economies in which the Group operates. Where the Group is required to recognise a goodwill impairment, it is recorded in the Group’s income statement, although it has no effect on the Group’s regulatory capital position. For the year ended 31 December 2008, the Group recorded a £32.6 billion accounting write-down of goodwill and other intangibles relating to prior year acquisitions.
The Group may be required to make further contributions to its pension schemes if the value of pension fund assets is not sufficient to cover potential obligations.
The Group maintains a number of defined benefit pension schemes for past and current employees. Pensions risk is the risk that the liabilities of the Group’s various defined benefit pension schemes which are long term in nature will exceed the schemes’ assets, as a result of which the Group is required or chooses to make additional contributions to the schemes. The schemes’ assets comprise investment portfolios that are held to meet projected liabilities to the scheme members. Risk arises from the schemes because the value of these asset portfolios and returns from them may be less than expected and because there may be greater than expected increases in the estimated value of the schemes’ liabilities. In these circumstances, the Group could be obliged, or may choose, to make additional contributions to the schemes, and during recent periods, the Group has voluntarily made such contributions. Given the current economic and financial market difficulties and the prospects for them to continue over the near and medium term, the Group may be required or elect to make further contributions to the pension schemes and such contributions could be significant and have a negative impact on the Group’s capital position results of operations or financial condition or result in a loss of value in RBS shares.
The Group is and may be subject to litigation and regulatory investigations that may impact its business.
The Group’s operations are diverse and complex and it operates in legal and regulatory environments that expose it to potentially significant litigation, regulatory investigation and other regulatory risk. As a result, the Group is, and may in the future be, involved in various disputes, legal proceedings and regulatory investigations in the United Kingdom, the United States and other jurisdictions, including class-action litigation. Furthermore, the Group, like many other financial institutions, has come under greater regulatory scrutiny over the last year and expects that environment to continue for the foreseeable future, particularly as it relates to compliance with new and existing corporate governance, employee compensation, conduct of business, anti-money laundering and anti-terrorism laws and regulations, as well as the provisions of applicable sanctions programmes. Disputes, legal proceedings and regulatory investigations are subject to many uncertainties, and their outcomes are often difficult to predict, particularly in the earlier stages of a case or investigation. Adverse regulatory action or adverse judgements in litigation could result in restrictions or limitations on the Group’s operations or result in a material adverse effect on the Group’s reputation or results of operations or result in a loss of value in RBS shares. For details about certain litigation and regulatory investigations in which the Group is involved, see Note 32 on the financial statements.
Operational risks are inherent in the Group’s operations.
The Group’s operations are dependent on the ability to process a very large number of transactions efficiently and accurately while complying with applicable laws and regulations where it does business. The Group has complex and geographically diverse operations and operational risk and losses can result from internal or external fraud, errors by employees or third-parties, failure to document transactions properly or to obtain proper authorisation, failure to comply with applicable regulatory requirements and conduct of business rules (including those arising out of anti-money laundering and anti-terrorism legislation, as well as the provisions of applicable sanctions programmes), equipment failures, natural disasters or the inadequacy or failure of systems and controls, including those of the Group’s suppliers or counterparties. Although the Group has implemented risk controls and loss mitigation actions, and substantial resources are devoted to developing efficient procedures, to identifying and rectifying weaknesses in existing procedures and to training staff, it is not possible to be certain that such actions have been or will be effective in controlling each of the operational risks faced by the Group. Any weakness in these systems or controls, or any breaches or alleged breaches of applicable laws or regulations could have a materially negative impact on the Group’s business, reputation, results of operations and share price. Notwithstanding anything contained in this risk factor, it should not be taken as implying that either the company or the Group will be unable to comply with its obligations as a company with securities admitted to the Official List or as a supervised firm regulated by the FSA.
The Group is exposed to the risk of changes in tax legislation and its interpretation and to increases in the rate of corporate and other taxes in the jurisdictions in which it operates.
The Group’s activities are subject to tax at various rates around the world computed in accordance with local legislation and practice. Action by governments to increase tax rates or to impose additional taxes would reduce the Group’s profitability. Revisions to tax legislation or to its interpretation might also affect the Group’s results in the future.
The acquisition of a majority shareholding in the Group by HM Treasury in December 2008 could lead to certain adverse tax consequences for the Group.
The acquisition by HM Treasury of a majority shareholding in the Group in consequence of the First Placing and Open Offer could, in certain circumstances, have adverse tax consequences which could affect the post-tax profitability of the Group. However, if the Group enters into the APS it has agreed, in principle, to give up the right to certain UK tax losses and allowances and this may limit the adverse tax consequences of the acquisition by HM Treasury of a majority shareholding in the Group.
Business review continued
The Group’s insurance businesses are subject to inherent risks involving claims.
Future claims in the Group’s general and life assurance business may be higher than expected as a result of changing trends in claims experience resulting from catastrophic weather conditions, demographic developments, changes in mortality and other causes outside the Group’s control. These trends could affect the profitability of current and future insurance products and services. The Group reinsures some of the risks it has assumed and is accordingly exposed to the risk of loss should its reinsurers become unable or unwilling to pay claims made by the Group against them.
The Group’s operations have inherent reputational risk.
Reputational risk, meaning the risk to earnings and capital from negative public opinion, is inherent in the Group’s business. Negative public opinion can result from the actual or perceived manner in which the Group conducts its business activities or from actual or perceived practices in the banking and financial industry. Negative public opinion may adversely affect the Group’s ability to keep and attract customers and, in particular, corporate and retail depositors. The Group cannot ensure that it will be successful in avoiding damage to its business from reputational risk.
In the United Kingdom and in other jurisdictions, the Group is responsible for contributing to compensation schemes in respect of banks and other authorised financial services firms that are unable to meet their obligations to customers.
In the United Kingdom, the Financial Services Compensation Scheme (the “Scheme”) was established under the FSMA and is the UK’s statutory fund of last resort for customers of authorised financial services firms. The Scheme can pay compensation to customers if a firm is unable, or likely to be unable, to pay claims against it and, if the Banking Bill is enacted in its current form, may be required to make payments either in connection with the exercise of a stabilisation power or in exercise of the bank insolvency procedures under that Bill. The Scheme is funded by levies on firms authorised by the FSA, including the Group. In the event that the Scheme raises funds from the authorised firms, raises those funds more frequently or significantly increases the levies to be paid by such firms, the associated costs to the Group may have a material impact on its results of operations and financial condition. During the financial year ended 31 December 2008, the Group made a provision of £150 million related to a levy by the Scheme.
In addition, to the extent that other jurisdictions where the Group operates have introduced or plan to introduce similar compensation, contributory or reimbursement schemes (such as in the United States with the Federal Deposit Insurance Corporation), the Group may make further provisions and may incur additional costs and liabilities, which may negatively impact its financial condition and results of operations or result in a loss of value in RBS shares.
The Group’s business and earnings may be affected by geopolitical conditions.
The performance of the Group is significantly influenced by the geopolitical and economic conditions prevailing at any given time in the countries in which it operates, particularly the United Kingdom, the United States and other countries in Europe and Asia. For example, the Group has a presence in countries where businesses could be exposed to the risk of business interruption and economic slowdown following the outbreak of a pandemic, or the risk of sovereign default following the assumption by governments of the obligations of private sector institutions. Similarly the Group faces the heightened risk of trade barriers, exchange controls and other measures taken by sovereign governments which may impact a borrower’s ability to repay. Terrorist acts and threats and the response to them of governments in any of these countries could also adversely affect levels of economic activity and have an adverse effect upon the Group's business.
The restructuring proposals for ABN AMRO are complex and may not realise the anticipated benefits for the Group.
The restructuring plan in place for the integration and separation of ABN AMRO into and among the businesses and operations of the consortium members is complex, involving substantial reorganisation of ABN AMRO’s operations and legal structure. In addition, the plan contemplates activities taking place simultaneously in a number of businesses and jurisdictions. Although integration efforts are well underway and are being advanced on a number of fronts, the implementation of the reorganisation and the realisation of the forecast benefits within the planned timescales, particularly given current market and economic conditions, remains challenging, although the Group remains confident that such goals will be achieved. Execution of the restructuring requires management resources previously devoted to the Group businesses and the retention of appropriately skilled ABN AMRO staff. The Group may not realise the benefits of the acquisition or the restructuring when expected or to the extent projected. The occurrence of any of these events, including as a result of staff losses or performance issues, may have a negative impact on the Group’s financial condition and results of operations. It is not expected that the Dutch State’s acquisition of Fortis Bank Nederland’s shares in RFS Holdings, which was effected in December 2008, will materially affect the integration benefits envisaged by the Group.
The recoverability of certain deferred tax assets recognised by the Group depend on the Group's ability to generate sufficient future taxable profits and there being no adverse changes to tax legislation.
In accordance with IFRS, the Group has recognised deferred tax assets on losses available to relieve future profits from tax only to the extent that it is probable that they will be recovered. The losses are quantified on the basis of current tax legislation and are subject to change in respect of the rate of tax or the rules for computing taxable profits and allowable losses. Failure to generate sufficient future taxable profits or changes in tax legislation may reduce the recoverable amount of the recognised deferred tax assets.
RBS’s ability to pay dividends on or make other distributions in respect of the Ordinary Shares will depend on the availability of distributable reserves and may be limited by the terms of the B Shares.
RBS’s ability to pay dividends is limited under UK company law, which limits a company to only paying cash dividends to the extent that it has distributable reserves and cash available for this purpose. As a holding company, RBS’s ability to pay dividends in the future is affected by a number of factors, principally its ability to receive sufficient dividends from subsidiaries. The payment of dividends to RBS by its subsidiaries is, in turn, subject to restrictions, including certain regulatory requirements and the existence of sufficient distributable reserves and cash in RBS’s subsidiaries. The ability of these subsidiaries to pay dividends and RBS’s ability to receive distributions from its investments in other entities are subject to applicable local laws and regulatory requirements and other restrictions, including, but not limited to, applicable tax laws and covenants in some of RBS’s debt facilities. These laws and restrictions could limit the payment of future dividends and distributions to RBS by its subsidiaries, which could restrict RBS’s ability to fund other operations or to pay, in due course, a dividend to holders of the Existing Shares or the New Shares.
In addition, if the B Shares are issued, no cash dividend may be paid on the Ordinary Shares unless the cash dividend payable in respect of the same period on the B Shares is paid in full, and no scrip dividend may be paid on the Ordinary Shares unless the cash or scrip dividend payable in respect of the same period on the B Shares is paid in full.
| | | 2008 | | | 2007 | | | 2006 | |
| for the year ended 31 December | | | £m | | | | £m | | | | £m | |
| Total income | | | 25,868 | | | | 30,366 | | | | 28,002 | |
| Operating (loss)/profit before tax | | | (40,667 | ) | | | 9,832 | | | | 9,186 | |
| (Loss)/profit attributable to ordinary shareholders | | | (24,137 | ) | | | 7,303 | | | | 6,202 | |
| Cost: income ratio | | | 208.9% | | | | 45.9% | | | | 44.6% | |
| Basic (loss)/earnings per share (pence) (1) | | | (145.7p | ) | | | 64.0p | | | | 54.4p | |
| | 2010 £m | 2009 £m | 2008 £m |
| for the year ended 31 December |
| Total income | 31,868 | 33,026 | 20,730 |
| Operating loss before tax | (399) | (2,647) | (25,691) |
| Loss attributable to ordinary and B shareholders | (1,125) | (3,607) | (24,306) |
| Cost:income ratio | 57% | 53% | 169% |
| Basic loss per ordinary and B share from continuing operations (pence) | (0.5p) | (6.3p) | (146.2p) |
| | | 2008 | | | 2007 | | | 2006 | | | 2010 £m | 2009 £m | 2008 £m |
| at 31 December | | | £m | | | | £m | | | | £m | | at 31 December |
| Total assets | | 2,401,652 | | | 1,840,829 | | | 856,832 | | Total assets | 1,453,576 | 1,696,486 | 2,401,652 |
Funded balance sheet (1) | | Funded balance sheet (1) | 1,026,499 | 1,255,032 | 1,409,093 |
| Loans and advances to customers | | 874,722 | | | 828,538 | | | 466,893 | | Loans and advances to customers | 555,260 | 728,393 | 874,722 |
| Deposits | | 897,556 | | | 994,657 | | | 516,365 | | Deposits | 609,483 | 756,346 | 897,556 |
| Owners’ equity | | 58,879 | | | 53,038 | | | 40,227 | | |
| Risk asset ratio – Tier 1 (2) | | 10.0% | | | 7.3% | | | 7.5% | | |
| – total | | 14.1% | | | 11.2% | | | 11.7% | | |
| Owners' equity | | Owners' equity | 75,132 | 77,736 | 58,879 |
| Risk asset ratio | | | | |
| | | - Core Tier 1 | 10.7% | 11.0% | 6.6% |
| | | - Tier 1 | 12.9% | 14.1% | 10.0% |
| | | - Total | 14.0% | 16.1% | 14.1% |
| (1) | Prior year per share data have been restated to reflect the rights issue in June 2008 and the capitalisation issue in September 2008.Funded balance sheet represents total assets less derivatives. |
(2) | 2008 data are on a Basel II basis; data for 2007 and 2006 are on a Basel I basis. |
Overview of results
As discussed on page 2,The results of RFS Holdings B.V., the results ofentity that acquired ABN AMRO, are fully consolidated in the Group’s financial statements. Consequently, the statutory results of RBS for the year ended 31 December 2007 and 2008 include the results of ABN AMRO for 76 days and the full year respectively. The interests of the State of the Netherlands and Santander in RFS Holdings are included in minoritynon-controlling interests.
| | | 2008 | | | 2007 | | | 2006 | |
| | | | £m | | | | £m | | | | £m | |
| Net interest income | | | 18,675 | | | | 12,069 | | | | 10,596 | |
| Fees and commissions receivable | | | 9,831 | | | | 8,278 | | | | 7,116 | |
| Fees and commissions payable | | | (2,386 | ) | | | (2,193 | ) | | | (1,922 | ) |
| Other non-interest income | | | (6,578 | ) | | | 6,125 | | | | 6,239 | |
| Insurance net premium income | | | 6,326 | | | | 6,087 | | | | 5,973 | |
| Non-interest income | | | 7,193 | | | | 18,297 | | | | 17,406 | |
| Total income | | | 25,868 | | | | 30,366 | | | | 28,002 | |
| Operating expenses | | | 54,033 | | | | 13,942 | | | | 12,480 | |
| (Loss)/profit before other operating charges and impairment | | | (28,165 | ) | | | 16,424 | | | | 15,522 | |
| Insurance net claims | | | 4,430 | | | | 4,624 | | | | 4,458 | |
| Impairment losses | | | 8,072 | | | | 1,968 | | | | 1,878 | |
| Operating (loss)/profit before tax | | | (40,667 | ) | | | 9,832 | | | | 9,186 | |
| Tax | | | (2,323 | ) | | | 2,044 | | | | 2,689 | |
| (Loss)/profit after tax from continuing operations | | | (38,344 | ) | | | 7,788 | | | | 6,497 | |
| Profit/(loss) from discontinued operations, net of tax | | | 3,971 | | | | (76 | ) | | | - | |
| (Loss)/profit for the year | | | (34,373 | ) | | | 7,712 | | | | 6,497 | |
| Minority interests | | | (10,832 | ) | | | 163 | | | | 104 | |
| Other owners | | | 596 | | | | 246 | | | | 191 | |
| (Loss)/profit attributable to ordinary shareholders | | | (24,137 | ) | | | 7,303 | | | | 6,202 | |
| | | | | | | | | | | | | |
Basic earnings per ordinary share (1) | | | (145.7p | ) | | | 64.0 | p | | | 54.4 | p |
| | | | | | | | | | | | | |
| Diluted earnings per ordinary share | | | (145.7p | ) | | | 63.4 | p | | | 53.9 | p |
Legal separation of ABN AMRO Bank N.V. took place on 1 April 2010.
8
(1) | Prior year data have been restated to reflect the rights issue in June 2008 and the capitalisation issue in September 2008. |
Business reviewcontinued | Business review |
Summary consolidated income statement
| | 2010 | 2009 | 2008 |
| | £m | £m | £m |
| Net interest income | 14,209 | 13,388 | 15,482 |
| Fees and commissions receivable | 8,193 | 8,738 | 8,855 |
| Fees and commissions payable | (2,211) | (2,790) | (2,444) |
| Other non-interest income | 6,549 | 8,424 | (6,872) |
| Insurance net premium income | 5,128 | 5,266 | 5,709 |
| Non-interest income | 17,659 | 19,638 | 5,248 |
| Total income | 31,868 | 33,026 | 20,730 |
| Operating expenses | (18,228) | (17,417) | (35,065) |
| Profit/(loss) before other operating charges and impairment losses | 13,640 | 15,609 | (14,335) |
| Insurance net claims | (4,783) | (4,357) | (3,917) |
| Impairment losses | (9,256) | (13,899) | (7,439) |
| Operating loss before tax | (399) | (2,647) | (25,691) |
| Tax (charge)/credit | (634) | 429 | 2,167 |
| Loss from continuing operations | (1,033) | (2,218) | (23,524) |
| Loss from discontinued operations, net of tax | (633) | (105) | (11,018) |
| Loss for the year | (1,666) | (2,323) | (34,542) |
| Non-controlling interests | 665 | (349) | 10,832 |
| Other owners’ dividends | (124) | (935) | (596) |
| Loss attributable to ordinary and B shareholders | (1,125) | (3,607) | (24,306) |
| | | | |
| Basic loss per ordinary and B share from continuing operations | (0.5p) | (6.3p) | (146.2p) |
Business review continued
Business reviewcontinued | Business review |
20082010 compared with 20072009
Operating loss
Operating loss before tax for the year was £40,667£399 million compared with an operating profita loss of £9,832£2,647 million in 2007.2009. The improvement in performance is primarily driven by stronger Core Retail & Commercial operating profits offsetting more normal results have been adversely affected byfrom Global Banking & Markets, coupled with lower impairments in the write-down of goodwillNon-Core division.
After tax, non-controlling interests and preference share and other assets, a substantial decline in non-interest income, a number of specific losses such as counterparty failures, and a marked increase individends, the credit impairment charge, reflecting weakness in financial markets and a deteriorating global economy.
Losses from credit market exposures increased to £7,781 million, compared with £1,410 million in 2007, with the great majority incurred in the first half of the year. Write-down of goodwill and other assets was £32,581 million. Other one-off items amounted to a credit of £1,674 million, 25% higher than in 2007, principally as a result of a £1,232 million increase in the carrying value of own debt carried at fair value.
Lossloss attributable to ordinary and B shareholders was £24,137£1,125 million, compared with an attributable profitloss of £7,303£3,607 million in 2007.2009.
Total income
Total income declined by 15%decreased 4% to £25,868£31,868 million with a significant deterioration experienced duringreflecting the second half of the year principally as a result of £5.8 billion of trading asset write-downs, counterparty failure and incremental reserving within GBM. While income increased in 2008 in Global Transaction Services and Regional Markets, and held steady in Insurance, a significant reduction occurredreturn to more normal levels in Global Banking & Markets, where a strong performancecompared with the favourable market conditions seen in rates, currencies and commodities2009. This was offset by marked deteriorationgood growth in Core Retail & Commercial and lower Non-Core trading losses as underlying asset prices recovered and credit markets and equities.spreads tightened.
Net interest income
Net interest income increased by 55%6% to £18,675£14,209 million with average loansreflecting improvements in net interest margin which more than offset lower interest-earning assets and advances to customers up 61% and average customer deposits up 53%.interest-bearing liabilities. Group net interest margin fellincreased from 2.32%1.83% to 2.12%2.06% largely reflecting tightenedexpanding asset margins within Regional Marketsin UK Retail and UK Corporate divisions as marketwell as in US Retail & Commercial. The run-off of low-yielding Non-Core assets also contributed to this increase. The Group net interest rates fell, with deposit markets remaining competitive and price adjustments on lending taking some time to feed through to the back book.margin was also affected by increased funding costs.
Non-interest income
Non-interest income was severely affected by the weakness in financial markets experienced over the course of the year, particularly in the fourth quarter. Non-interest income decreased to £7,193£17,659 million principally due to the credit market write-downs of £7,781from £19,638 million offset by a movementin 2009. This included movements in the fair value of the Asset Protection Scheme - credit default swap resulting in a £1,550 million charge and gain on redemption of own debt of £1,232 million. While the decline was particularly marked in GBM’s credit markets and equities businesses, with reduced business volumes and mounting mark-to-market trading losses, Regional Markets also saw£553 million (2009 - £3,790 million). Excluding these items, non-interest income fallwas up 18% primarily reflecting an increase in the latter part of the year as declining consumer confidence led to lower demand for credit and other financial products.income from trading activities.
Operating expenses
Total operatingOperating expenses roseincreased to £54,033£18,228 million with cost growth(2009 - £17,417 million). The main driver of this 5% increase was the impact of a £2,148 million gains on pension curtailment in the Group’s core retail and commercial banking franchises 2009. This was partially offset by gains on the recognition of benefits from the Group-wide efficiency programmesprogramme. The programme continues to deliver material savings which have been funding investments to strengthen our Core franchises. Annualised savings are now just ahead of the £2.5 billion target for 2011 and a significant reduction in Global Banking & Markets staff costs.are forecast to exceed £3 billion by 2013. Integration and restructuring costs were £1,357£1,032 million compared with £108£1,286 million in 2007. Write-down of goodwill and other assets was £32,581 million.
Net insurance claims
Bancassurance and general insurance claims, after reinsurance, decreased by 4% to £4,430 million, reflecting improved risk selection, better claims management and the non-recurrence of the severe floods experienced in 2007 and as a result of movements in financial market values.
Impairment losses
Impairment losses increased to £8,072 million in 2008, compared with £1,968 million in 2007. The Group experienced a pronounced deterioration in impairments in the second half of the year, as financial stress spread to a broad range of customers. The greatest increase in impairments occurred in GBM, where fourth quarter impairments totalled £2,938 million, including a loss of approximately £900 million on the Group’s exposure to LyondellBasell. However, the Regional Markets businesses in all geographies also experienced a noticeable increase in impairments in the second half, particularly in the UK and Irish corporate and US personal segments.
Impairments represented 0.44% of gross loans and advances, excluding reverse repos, in the first half but reached 1.27% in the second half. For 2008 as a whole, impairments amounted to 0.82% of loans and advances, excluding reverse repos, compared with 0.28% in 2007. Risk elements in lending and potential problem loans at 31 December 2008 represented 2.52% of gross loans and advances to customers, excluding reverse repos, compared with 1.64% a year earlier. Provision coverage was 51%, compared with 57% at 31 December 2007 reflecting the higher proportion of secured loans included in risk elements in lending and potential problem loans.
Credit market losses
Losses for 2008 relating to the Group’s previously identified credit market exposures totalled £7,781 million, net of hedging gains of £1,642 million. This includes impairment losses of £466 million incurred on credit market assets reclassified out of the ‘held-for-trading’ category in line with the amendments to IAS 39 ‘Financial Instruments: Recognition and Measurement’ issued in October. While the majority of these write-downs were incurred in the first half of 2008, the severity of the financial market dislocation intensified in the fourth quarter, resulting
in further losses in particular on the Group’s structured credit portfolios.
Write-down2009. Write-down of goodwill and other intangible assets
After reviewing the carrying value of goodwill and other purchased intangible assets, the Group has recorded an impairment charge of £32,581 million. Of this charge, £23,348 million relates to part of the goodwill in respect of the acquisition of ABN AMRO, while other significant impairments have been recorded on part of the Citizens/Charter One goodwill of £4,382 million, part of the NatWest goodwill (principally allocated to Global Banking & Markets) of £2,742 million and other goodwill of £720 million. Other intangible asset impairments of £1,389 million principally relate to the write-down in the value of customer relationships recognised on the acquisition of ABN AMRO.
These impairments have no cash impact, and minimal impact on the Group’s capital ratios.
Other non-operating items
Integration and restructuring costs totalled £1,357 million, primarily reflecting the integration of ABN AMRO into the Group, while the amortisation of purchased intangibles increased to £582 million from £124 million.
Taxation
The Group recorded a tax credit of £2,323 million in 2008, compared with a tax charge of £2,044 million in 2007. The effective tax rate for 2008 was 5.7% compared with 20.8% in 2007.
Earnings
Basic earnings per ordinary share decreased from 64.0p to (145.7p).
The number of shares in issue increased to 39,456 million at 31 December 2008, compared with 10,006 million in issue at 31 December 2007, reflecting the Group’s capital raisings in June and December and the capitalisation issue in lieu of the interim dividend for 2008.
Business review continued
2007 compared with 2006
Profit
Profit before tax was up 7%, from £9,186 million to £9,832 million. The results of ABN AMRO are included from the date of acquisition, 17 October 2007.
Total income
The Group achieved strong growth in income during 2007. Total income was up 8% or £2,364 million to £30,366 million, notwithstanding the significant impact of the developments in global credit markets in the second half of 2007.
Net interest income increased by 14% to £12,069 million and represents 40% of total income (2006 – 38%). Average loans and advances to customers grew by 23% and average customer deposits grew by 25%.
Non-interest income increased by £891 million to £18,297 million and represents 60% of total income (2006 – 62%).
Net interest margin
The Group’s net interest margin at 2.32% was down from 2.53% in 2006.
Operating expenses
Operating expenses increased by 12% to £13,942 million. Integration costs were £108£10 million compared with £134£363 million in 2006.
Cost:income ratio
The Group’s cost:income ratio was 45.9% compared with 44.6%2009. Premises and equipment costs fell by 7% in 2006.the year largely driven by efficiency cost savings, significant one-off property impairments recognised in 2009 and country exits following Non-Core disposals.
Net insurance claims
Bancassurance and general insurance claims, after reinsurance, increased by 4%10% to £4,624 million reflecting adverse weather conditions in the summer of 2007.£4,783 million.
Impairment losses
Impairment losses rose 5% to £1,968were £9,256 million, compared with £1,878£13,899 million in 2006.2009 with Core impairments falling by £898 million and Non-Core by £3,745 million. The decrease reflects an overall improvement in the economic environment. Impairments fell in all businesses, except Ulster Bank, which has faced an economic environment that remains challenging.
Risk elements in lending and potential problem loans represented 1.64%7.4% of gross loans and advances to customers excluding reverse repos at 31 December 2007 (2006 – 1.57%2010 (2009 - 5.5%).
Provision coverage of risk elements in lending and potential problem loans was 57% (2006 – 62%46% (2009 - 45%).
TaxationTax
The tax charge for 2010 was £634 million compared with a tax credit of £429 million in 2009.
Earnings
Basic earnings per ordinary share, including discontinued operations, was a loss of 0.5p per share compared with a loss of 6.4p for 2009.
Business reviewcontinued | Business review |
2009 compared with 2008
Operating loss
Operating loss before tax for the year was £2,647 million compared with a loss of £25,691 million in 2008. The reduction in the loss is primarily a result of a substantial increase in non-interest income and a substantial fall in the write-down of goodwill and other intangible assets partially offset by a significant increase in impairment losses and lower net interest income.
After tax, non-controlling interests and preference share and other dividends, the loss attributable to ordinary and B shareholders was £3,607 million, compared with an attributable loss of £24,306 million in 2008.
Total income
Total income increased 59% to £33,026 million in 2009 primarily reflecting a significant reduction in credit and other market losses and a gain on redemption of own debt. Increased market volatility and strong customer demand in a positive trading environment also contributed to this improvement. While income was down marginally in UK Corporate and held steady in Retail & Commercial Banking and RBS Insurance, a significant improvement occurred in Global Banking & Markets, reflecting the reduced credit and other market losses and a more buoyant trading market during the year compared to 2008.
Net interest income
Net interest income fell by 14% to £13,388 million, with average loans and advances to customers stable and average customer deposits down 1%. Group net interest margin fell from 2.12% to 1.83% largely reflecting the pressure on liability margins, given rates on many deposit products already at floors in the low interest rate environment, and strong competition, particularly for longer-term deposits and the build up of the Group’s liquidity portfolio.
Non-interest income
Non-interest income increased to £19,638 million from £5,248 million in 2008, largely reflecting the sharp improvement in income from trading activities, as improved asset valuations led to lower credit market losses and GBM benefited from the restructuring of its business to focus on core customer franchises. The Group also recorded a gain of £3,790 million on a liability management exercise to redeem a number of Tier 1 and upper Tier 2 securities. However, fees and commissions fell as a result of the withdrawal of the single premium payment protection insurance product and the restructuring of UK current account overdraft fees, offset by higher fees in businesses attributable to RFS Holdings minority interest.
Operating expenses
Total operating expenses decreased from £35,065 million in 2008 to £17,417 million, largely resulting from the substantial decrease in the write-down of goodwill and other intangible assets, down to £363 million compared with £16,911 million in 2008. Staff costs, excluding curtailment gains, were up 12% with most of the movement relating to adverse movements in foreign exchange rates and some salary inflation. Changes in incentive compensation, primarily in Global Banking & Markets, represented most of the remaining change. This was offset by a gain of £2,148 million arising from the curtailment of prospective pension benefits in the defined benefit scheme and certain other subsidiary schemes. The Group cost:income ratio improved to 53%, compared with 169% in 2008.
Net insurance claims
Bancassurance and general insurance claims, after reinsurance, increased by 11% to £4,357 million.
Impairment losses
Impairment losses increased to £13,899 million from £7,439 million in 2008, with Core bank impairments rising by £2,182 million, Non-Core by £4,285 million off set by a decrease in RFS Holdings minority interest of £7 million. Signs that impairments might be plateauing appear to have been borne out in the latter part of the year, and there are indications that the pace of downwards credit rating migration for corporates is slowing. Nonetheless, the financial circumstances of many consumers and businesses remain fragile, and rising refinancing costs, whether as a result of monetary tightening or of increased regulatory capital requirements, could expose some customers to further difficulty.
Impairments represented 1.9% of gross loans and advances, excluding reverse repos, in 2009 compared with 0.8% in 2008.
Risk elements in lending and potential problem loans at 31 December 2009 represented 5.4% of loans and advances, excluding reverse repos, compared with 2.5% a year earlier. Provision coverage was 45%, compared with 51% at 31 December 2008 as a consequence of the growth in risk elements in lending being concentrated in secured, property-related loans. These loans require relatively lower provisions in view of their collateralised nature.
Tax
The effective tax rate for 20072009 was 20.8% (2006 – 29.3%). The headline rate is lower than the standard rate of UK corporation tax of 30% principally due to certain non-taxable capital gains and changes to deferred tax balances following the change16.2% compared with 8.4% in rate of corporation tax.2008.
Earnings and dividends
Basic earnings per ordinary and B share, increased by 18%,including discontinued operations, improved from 54.4pa loss of 146.7p to 64.0p.
A final dividenda loss of 19.3p per ordinary share was recommended and paid, giving a total dividend for the year of 27.8p, an increase of 10%.
Balance sheet
Total assets were £1,840.8 billion at 31 December 2007. The acquisition of ABN AMRO in October 2007 increased assets by £774.5 billion, with the balance accounted for largely by growth in our lending to customers and in trading assets.
Lending to customers, excluding repurchase agreements and stock borrowing (“reverse repos”), increased in 2007 by 70% or £282.2 billion to £686.2 billion. Customer deposits, excluding repurchase agreements and stock lending (“repos”), grew by 71% or £227.2 billion to £547.5 billion.
Capital ratios at 31 December 2007 were 7.3% (Tier 1) and 11.2% (Total).
Bonus issue
In May 2007, the Group capitalised £1,576 million of its share premium account by way of a bonus issue of two new ordinary shares of 25p each for every one held.
Profitability
The after-tax return on ordinary shareholders’ equity, which is based on profit attributable to ordinary shareholders and average ordinary shareholders’ equity, was 18.8% compared with 18.5% in 2006.6.4p.
Business reviewcontinued | Business review |
Net interest income
| | | 2008 | | | 2007 | | | 2006 | | 2010 | 2009 | 2008 |
| | | | £m | | | | £m | | | | £m | | £m | £m | £m |
| Interest receivable | | 49,522 | | | 32,252 | | | 24,688 | | 22,776 | 33,836 | 49,522 |
| Interest payable | | (30,847 | ) | | (20,183 | ) | | (14,092 | ) | (8,567) | (17,332) | (30,847) |
| Net interest income | | | 18,675 | | | 12,069 | | | 10,596 | | 14,209 | 16,504 | 18,675 |
| | | % | | | % | | | % | | | | |
| Gross yield on interest-earning assets of the banking business | | 5.61 | | | 6.19 | | | 5.90 | | |
| | | % | % | % |
Gross yield on interest-earning assets of the banking business (1) | | 3.30 | 3.76 | 5.61 |
| Cost of interest-bearing liabilities of the banking business | | (3.79 | ) | | (4.36 | ) | | (3.85 | ) | (1.47) | (2.18) | (3.79) |
| Interest spread of the banking business | | 1.82 | | | 1.83 | | | 2.05 | | |
Interest spread of the banking business (2) | | 1.83 | 1.58 | 1.82 |
| Benefit from interest-free funds | | 0.30 | | | 0.49 | | | 0.48 | | 0.23 | 0.25 | 0.30 |
| Net interest margin of the banking business | | | 2.12 | | | 2.32 | | | 2.53 | | |
Net interest margin of the banking business (3) | | 2.06 | 1.83 | 2.12 |
| | | | | |
| Yields, spreads and margins of the banking business | | % | % | % |
Gross yield (1) | | | | |
| - Group | | 3.30 | 3.76 | 5.61 |
| - UK | | 3.42 | 3.35 | 5.72 |
| - Overseas | | 3.15 | 4.09 | 5.54 |
Interest spread (2) | | |
| - Group | | 1.83 | 1.58 | 1.82 |
| - UK | | 2.01 | 1.50 | 1.92 |
| - Overseas | | 1.59 | 1.67 | 1.76 |
Net interest margin (3) | | |
| - Group | | 2.06 | 1.83 | 2.12 |
| - UK | | 2.22 | 1.81 | 2.39 |
| - Overseas | | 1.84 | 1.85 | 1.91 |
| | | |
| The Royal Bank of Scotland plc base rate (average) | | 0.50 | 0.64 | 4.67 |
| London inter-bank three month offered rates (average) | | |
| - Sterling | | 0.70 | 1.21 | 5.51 |
| - Eurodollar | | 0.34 | 0.69 | 2.92 |
| - Euro | | 0.75 | 1.21 | 4.63 |
| Yields, spreads and margins of the banking business | | % | | | % | | | % | |
Gross yield (1) | | | | | | | | | |
| Group | | | 5.61 | | | | 6.19 | | | | 5.90 | |
| UK | | | 5.72 | | | | 6.69 | | | | 6.13 | |
| Overseas | | | 5.54 | | | | 5.52 | | | | 5.50 | |
Interest spread (2) | | | | | | | | | | | | |
| Group | | | 1.82 | | | | 1.83 | | | | 2.05 | |
| UK | | | 1.92 | | | | 2.30 | | | | 2.37 | |
| Overseas | | | 1.76 | | | | 1.20 | | | | 1.47 | |
Net interest margin (3) | | | | | | | | | | | | |
| Group | | | 2.12 | | | | 2.32 | | | | 2.53 | |
| UK | | | 2.39 | | | | 2.55 | | | | 2.68 | |
| Overseas | | | 1.91 | | | | 1.99 | | | | 2.26 | |
| The Royal Bank of Scotland plc base rate (average) | | | 4.67 | | | | 5.51 | | | | 4.64 | |
| London inter-bank three month offered rates (average): | | | | | | | | | | | | |
| Sterling | | | 5.51 | | | | 6.00 | | | | 4.85 | |
| Eurodollar | | | 2.92 | | | | 5.29 | | | | 5.20 | |
| Euro | | | 4.63 | | | | 4.28 | | | | 3.08 | |
| (1) | Gross yield is the interest rate earned on average interest-earning assets of the banking business. |
| (2) | Interest spread is the difference between the gross yield and the interest rate paid on average interest-bearing liabilities of the banking business. |
| (3) | Net interest margin is net interest income of the banking business as a percentage of average interest-earning assets of the banking business. |
Business review continued
Business reviewcontinued | Business review |
Average balance sheet and related interest
| | | 2010 | | 2009 |
| | | Average balance | Interest | Rate | | Average balance | Interest | Rate |
| | | £m | £m | % | | £m | £m | % |
| Assets | | | | | | | | |
| Loans and advances to banks | - UK | 22,714 | 222 | 0.98 | | 21,616 | 310 | 1.43 |
| | - Overseas | 30,148 | 369 | 1.22 | | 32,367 | 613 | 1.89 |
| Loans and advances to customers | - UK | 310,712 | 11,989 | 3.86 | | 333,230 | 11,940 | 3.58 |
| | - Overseas | 195,858 | 6,900 | 3.52 | | 376,382 | 16,339 | 4.34 |
| Debt securities | - UK | 66,765 | 1,459 | 2.19 | | 52,470 | 1,414 | 2.69 |
| | - Overseas | 63,334 | 1,837 | 2.90 | | 84,822 | 3,220 | 3.80 |
| Interest-earning assets | - UK | 400,191 | 13,670 | 3.42 | | 407,316 | 13,664 | 3.35 |
| | - Overseas | 289,340 | 9,106 | 3.15 | | 493,571 | 20,172 | 4.09 |
| Total interest-earning assets | - banking business (2,3) | 689,531 | 22,776 | 3.30 | | 900,887 | 33,836 | 3.76 |
| | - trading business (4) | 276,330 | | | | 291,092 | | |
| Interest-earning assets | | 965,861 | | | | 1,191,979 | | |
Non-interest-earning assets (2,3) | | 706,343 | | | | 831,501 | | |
| Total assets | | 1,672,204 | | | | 2,023,480 | | |
| | | | | | | | | |
| Percentage of assets applicable to overseas operations | 44.0% | | | | 47.4% | | |
| | | | | | | | | |
| Liabilities | | | | | | | | |
| Deposits by banks | - UK | 21,816 | 334 | 1.53 | | 24,837 | 679 | 2.73 |
| | - Overseas | 59,799 | 999 | 1.67 | | 104,396 | 2,362 | 2.26 |
| Customer accounts: demand deposits | - UK | 120,796 | 621 | 0.51 | | 110,294 | 569 | 0.52 |
| | - Overseas | 39,127 | 607 | 1.55 | | 82,177 | 1,330 | 1.62 |
| Customer accounts: savings deposits | - UK | 68,142 | 935 | 1.37 | | 54,270 | 780 | 1.44 |
| | - Overseas | 25,587 | 213 | 0.83 | | 83,388 | 2,114 | 2.54 |
| Customer accounts: other time deposits | - UK | 39,934 | 431 | 1.08 | | 68,625 | 932 | 1.36 |
| | - Overseas | 43,996 | 914 | 2.08 | | 71,315 | 2,255 | 3.16 |
| Debt securities in issue | - UK | 111,277 | 2,212 | 1.99 | | 116,536 | 2,830 | 2.43 |
| | - Overseas | 72,175 | 1,065 | 1.48 | | 117,428 | 2,500 | 2.13 |
| Subordinated liabilities | - UK | 19,442 | 398 | 2.05 | | 26,053 | 834 | 3.20 |
| | - Overseas | 8,714 | 19 | 0.22 | | 12,468 | 656 | 5.26 |
| Internal funding of trading business | - UK | (41,451) | (140) | 0.34 | | (60,284) | (317) | 0.53 |
| | - Overseas | (6,864) | (41) | 0.60 | | (14,845) | (192) | 1.29 |
| Interest-bearing liabilities | - UK | 339,956 | 4,791 | 1.41 | | 340,331 | 6,307 | 1.85 |
| | - Overseas | 242,534 | 3,776 | 1.56 | | 456,327 | 11,025 | 2.42 |
| Total interest-bearing liabilities | - banking business (2,3) | 582,490 | 8,567 | 1.47 | | 796,658 | 17,332 | 2.18 |
| | - trading business (4) | 293,993 | | | | 331,380 | | |
| Interest-bearing liabilities | | 876,483 | | | | 1,128,038 | | |
| Non-interest-bearing liabilities: | | | | | | | | |
| Demand deposits | - UK | 46,692 | | | | 38,220 | | |
| | - Overseas | 23,994 | | | | 27,149 | | |
Other liabilities (3,4) | | 648,129 | | | | 772,770 | | |
| Owners' equity | | 76,906 | | | | 57,303 | | |
| Total liabilities and owners' equity | | 1,672,204 | | | | 2,023,480 | | |
| | | | | | | | | |
| Percentage of liabilities applicable to overseas operations | 41.7% | | | | 45.8% | | |
| | | | | | | |
| | | Average balance | | | Interest | | | Rate | | | Average balance | | | Interest | | | Rate | |
| | | | £m | | | | £m | | | % | | | | £m | | | | £m | | | % | |
| Assets | | | | | | | | | | | | | | | | | | | | | | |
| Loans and advances to banks | | | | | | | | | | | | | | | | | | | | | | |
| – UK | | | 19,039 | | | | 939 | | | | 4.93 | | | | 21,133 | | | | 1,024 | | | | 4.85 | |
| – Overseas | | | 31,388 | | | | 1,417 | | | | 4.51 | | | | 12,654 | | | | 546 | | | | 4.31 | |
| Loans and advances to customers | | | | | | | | | | | | | | | | | | | | | | | | |
| – UK | | | 319,696 | | | | 19,046 | | | | 5.96 | | | | 268,911 | | | | 18,506 | | | | 6.88 | |
| – Overseas | | | 393,405 | | | | 22,766 | | | | 5.79 | | | | 175,301 | | | | 10,062 | | | | 5.74 | |
| Debt securities | | | | | | | | | | | | | | | | | | | | | | | | |
| – UK | | | 33,206 | | | | 1,276 | | | | 3.84 | | | | 10,883 | | | | 600 | | | | 5.51 | |
| – Overseas | | | 85,625 | | | | 4,078 | | | | 4.76 | | | | 31,792 | | | | 1,514 | | | | 4.76 | |
| Total interest-earning assets | | | | | | | | | | | | | | | | | | | | | | | | |
– banking business (2, 3) | | | 882,359 | | | | 49,522 | | | | 5.61 | | | | 520,674 | | | | 32,252 | | | | 6.19 | |
– trading business (4) | | | 425,454 | | | | | | | | | | | | 313,110 | | | | | | | | | |
| Total interest-earning assets | | | 1,307,813 | | | | | | | | | | | | 833,784 | | | | | | | | | |
Non-interest-earning assets (2, 3) | | | 732,872 | | | | | | | | | | | | 289,188 | | | | | | | | | |
| Total assets | | | 2,040,685 | | | | | | | | | | | | 1,122,972 | | | | | | | | | |
| Percentage of assets applicable to overseas operations | | | 48.6% | | | | | | | | | | | | 38.0% | | | | | | | | | |
| Liabilities and owners’ equity | | | | | | | | | | | | | | | | | | | | | | | | |
| Deposits by banks | | | | | | | | | | | | | | | | | | | | | | | | |
| – UK | | | 46,217 | | | | 1,804 | | | | 3.90 | | | | 52,951 | | | | 2,234 | | | | 4.22 | |
| – Overseas | | | 113,592 | | | | 4,772 | | | | 4.20 | | | | 31,073 | | | | 1,172 | | | | 3.77 | |
| Customer accounts: demand deposits | | | | | | | | | | | | | | | | | | | | | | | | |
| – UK | | | 99,852 | | | | 2,829 | | | | 2.83 | | | | 93,764 | | | | 3,296 | | | | 3.52 | |
| – Overseas | | | 70,399 | | | | 1,512 | | | | 2.15 | | | | 30,739 | | | | 1,031 | | | | 3.35 | |
| Customer accounts: savings deposits | | | | | | | | | | | | | | | | | | | | | | | | |
| – UK | | | 42,870 | | | | 1,708 | | | | 3.98 | | | | 36,334 | | | | 1,658 | | | | 4.56 | |
| – Overseas | | | 72,473 | | | | 2,203 | | | | 3.04 | | | | 27,645 | | | | 902 | | | | 3.26 | |
| Customer accounts: other time deposits | | | | | | | | | | | | | | | | | | | | | | | | |
| – UK | | | 94,365 | | | | 4,011 | | | | 4.25 | | | | 88,089 | | | | 4,201 | | | | 4.77 | |
| – Overseas | | | 105,660 | | | | 4,097 | | | | 3.88 | | | | 43,141 | | | | 2,100 | | | | 4.87 | |
| Debt securities in issue | | | | | | | | | | | | | | | | | | | | | | | | |
| – UK | | | 101,520 | | | | 4,095 | | | | 4.03 | | | | 57,140 | | | | 3,060 | | | | 5.36 | |
| – Overseas | | | 132,699 | | | | 5,846 | | | | 4.41 | | | | 49,848 | | | | 2,627 | | | | 5.27 | |
| Subordinated liabilities | | | | | | | | | | | | | | | | | | | | | | | | |
| – UK | | | 26,300 | | | | 1,356 | | | | 5.16 | | | | 23,502 | | | | 1,300 | | | | 5.53 | |
| – Overseas | | | 12,385 | | | | 788 | | | | 6.36 | | | | 4,509 | | | | 230 | | | | 5.10 | |
| Internal funding of trading business | | | | | | | | | | | | | | | | | | | | | | | | |
| – UK | | | (85,664 | ) | | | (3,445 | ) | | | 4.02 | | | | (68,395 | ) | | | (3,307 | ) | | | 4.84 | |
| – Overseas | | | (18,090 | ) | | | (729 | ) | | | 4.03 | | | | (7,454 | ) | | | (321 | ) | | | 4.31 | |
| Total interest-bearing liabilities | | | | | | | | | | | | | | | | | | | | | | | | |
– banking business (2, 3) | | | 814,578 | | | | 30,847 | | | | 3.79 | | | | 462,886 | | | | 20,183 | | | | 4.36 | |
– trading business (4) | | | 466,610 | | | | | | | | | | | | 316,453 | | | | | | | | | |
| Total interest-bearing liabilities | | | 1,281,188 | | | | | | | | | | | | 779,339 | | | | | | | | | |
| Non-interest-bearing liabilities: | | | | | | | | | | | | | | | | | | | | | | | | |
| Demand deposits | | | | | | | | | | | | | | | | | | | | | | | | |
| – UK | | | 45,472 | | | | | | | | | | | | 18,416 | | | | | | | | | |
| – Overseas | | | 9,721 | | | | | | | | | | | | 14,455 | | | | | | | | | |
Other liabilities (3, 4) | | | 645,760 | | | | | | | | | | | | 267,403 | | | | | | | | | |
| Owners’ equity | | | 58,544 | | | | | | | | | | | | 43,359 | | | | | | | | | |
| Total liabilities and owners’ equity | | | 2,040,685 | | | | | | | | | | | | 1,122,972 | | | | | | | | | |
| Percentage of liabilities applicable to overseas operations | | | 46.8% | | | | | | | | | | | | 35.9% | | | | | | | | | |
| (1) | The analysis into UK and Overseas has been compiled on the basis of location of office. |
| (2) | Interest-earning assets and interest-bearing liabilities include the Retail bancassurance assets and liabilities attributable to policyholders. |
| (3) | Interest income and interest expense do not include interest on financial assets and liabilities designated as at fair value through profit or loss. |
| (4) | Interest receivable and interest payable on trading assets and liabilities are included in income from trading activities. |
The 2007 comparative amounts have been restated for the netting of certain derivative asset and derivative liability balances with the London Clearing House, the finalisation of the ABN AMRO acquisition accounting and for the classification of Banco Real as a discontinued operation.
Business review continued
Business reviewcontinued | Business review |
Average balance sheet and related interest continued
| | | | |
| | | Average balance | | | Interest | | | Rate | |
| | | | £m | | | | £m | | | % | |
| Assets | | | | | | | | | | | |
| Loans and advances to banks | | | | | | | | | | | |
| – UK | | | 15,934 | | | | 681 | | | | 4.27 | |
| – Overseas | | | 7,237 | | | | 237 | | | | 3.27 | |
| Loans and advances to customers | | | | | | | | | | | | |
| – UK | | | 239,086 | | | | 15,141 | | | | 6.33 | |
| – Overseas | | | 121,092 | | | | 6,977 | | | | 5.76 | |
| Debt securities | | | | | | | | | | | | |
| – UK | | | 12,816 | | | | 598 | | | | 4.67 | |
| – Overseas | | | 22,032 | | | | 1,054 | | | | 4.78 | |
| Total interest-earning assets | | | | | | | | | | | | |
– banking business (2, 3) | | | 418,197 | | | | 24,688 | | | | 5.90 | |
– trading business (4) | | | 202,408 | | | | | | | | | |
| Total interest-earning assets | | | 620,605 | | | | | | | | | |
Non-interest-earning assets (2, 3) | | | 199,898 | | | | | | | | | |
| Total assets | | | 820,503 | | | | | | | | | |
| Percentage of assets applicable to overseas operations | | | 35.2% | | | | | | | | | |
| Liabilities and owners’ equity | | | | | | | | | | | | |
| Deposits by banks | | | | | | | | | | | | |
| – UK | | | 35,985 | | | | 1,393 | | | | 3.87 | |
| – Overseas | | | 28,772 | | | | 1,228 | | | | 4.27 | |
| Customer accounts: demand deposits | | | | | | | | | | | | |
| – UK | | | 86,207 | | | | 2,428 | | | | 2.82 | |
| – Overseas | | | 13,113 | | | | 441 | | | | 3.36 | |
| Customer accounts: savings deposits | | | | | | | | | | | | |
| – UK | | | 30,933 | | | | 1,058 | | | | 3.42 | |
| – Overseas | | | 19,766 | | | | 529 | | | | 2.68 | |
| Customer accounts: other time deposits | | | | | | | | | | | | |
| – UK | | | 67,126 | | | | 2,807 | | | | 4.18 | |
| – Overseas | | | 36,177 | | | | 1,636 | | | | 4.52 | |
| Debt securities in issue | | | | | | | | | | | | |
| – UK | | | 45,829 | | | | 2,210 | | | | 4.82 | |
| – Overseas | | | 25,249 | | | | 1,076 | | | | 4.26 | |
| Subordinated liabilities | | | | | | | | | | | | |
| – UK | | | 23,873 | | | | 1,226 | | | | 5.14 | |
| – Overseas | | | 2,639 | | | | 160 | | | | 6.06 | |
| Internal funding of trading business | | | | | | | | | | | | |
| – UK | | | (44,475 | ) | | | (1,893 | ) | | | 4.26 | |
| – Overseas | | | (4,930 | ) | | | (207 | ) | | | 4.20 | |
| Total interest-bearing liabilities | | | | | | | | | | | | |
– banking business (2, 3) | | | 366,264 | | | | 14,092 | | | | 3.85 | |
– trading business (4) | | | 204,810 | | | | | | | | | |
| Total interest-bearing liabilities | | | 571,074 | | | | | | | | | |
| Non-interest-bearing liabilities: | | | | | | | | | | | | |
| Demand deposits | | | | | | | | | | | | |
| – UK | | | 17,909 | | | | | | | | | |
| – Overseas | | | 11,668 | | | | | | | | | |
Other liabilities (3, 4) | | | 182,976 | | | | | | | | | |
| Owners’ equity | | | 36,876 | | | | | | | | | |
| Total liabilities and owners’ equity | | | 820,503 | | | | | | | | | |
| Percentage of liabilities applicable to overseas operations | | | 32.3% | | | | | | | | | |
| | | 2008 |
| | | Average balance | Interest | Rate |
| | | £m | £m | % |
| Assets | | | | |
| Loans and advances to banks | - UK | 19,039 | 939 | 4.93 |
| | - Overseas | 31,388 | 1,417 | 4.51 |
| Loans and advances to customers | - UK | 319,696 | 19,046 | 5.96 |
| | - Overseas | 393,405 | 22,766 | 5.79 |
| Debt securities | - UK | 33,206 | 1,276 | 3.84 |
| | - Overseas | 85,625 | 4,078 | 4.76 |
| Interest-earning assets | - UK | 371,941 | 21,261 | 5.72 |
| | - Overseas | 510,418 | 28,261 | 5.54 |
| Total interest-earning assets | - banking business (2,3) | 882,359 | 49,522 | 5.61 |
| | - trading business (4) | 425,454 | | |
| Interest-earning assets | | 1,307,813 | | |
Non-interest-earning assets (2,3) | | 732,872 | | |
| Total assets | | 2,040,685 | | |
| | | | | |
| Percentage of assets applicable to overseas operations | | 48.6% | | |
| | | | | |
| Liabilities | | | | |
| Deposits by banks | - UK | 46,217 | 1,804 | 3.90 |
| | - Overseas | 113,592 | 4,772 | 4.20 |
| Customer accounts: demand deposits | - UK | 99,852 | 2,829 | 2.83 |
| | - Overseas | 70,399 | 1,512 | 2.15 |
| Customer accounts: savings deposits | - UK | 42,870 | 1,708 | 3.98 |
| | - Overseas | 72,473 | 2,203 | 3.04 |
| Customer accounts: other time deposits | - UK | 94,365 | 4,011 | 4.25 |
| | - Overseas | 105,660 | 4,097 | 3.88 |
| Debt securities in issue | - UK | 101,520 | 4,095 | 4.03 |
| | - Overseas | 132,699 | 5,846 | 4.41 |
| Subordinated liabilities | - UK | 26,300 | 1,356 | 5.16 |
| | - Overseas | 12,385 | 788 | 6.36 |
| Internal funding of trading business | - UK | (85,664) | (3,445) | 4.02 |
| | - Overseas | (18,090) | (729) | 4.03 |
| Interest-bearing liabilities | - UK | 325,460 | 12,358 | 3.80 |
| | - Overseas | 489,118 | 18,489 | 3.78 |
| Total interest-bearing liabilities | - banking business (2,3) | 814,578 | 30,847 | 3.79 |
| | - trading business (4) | 466,610 | | |
| Interest-bearing liabilities | | 1,281,188 | | |
| Non-interest-bearing liabilities: | | | | |
| Demand deposits | - UK | 37,568 | | |
| | - Overseas | 17,625 | | |
Other liabilities (3,4) | | 645,760 | | |
| Owners' equity | | 58,544 | | |
| Total liabilities and owners' equity | | 2,040,685 | | |
| | | | | |
| Percentage of liabilities applicable to overseas operations | | 47.2% | | |
| (1) | The analysis into UK and Overseas has been compiled on the basis of location of office. |
| (2) | Interest-earning assets and interest-bearing liabilities include the Retail bancassurance assets and liabilities attributable to policyholders. |
| (3) | Interest income and interest expense do not include interest on financial assets and liabilities designated as at fair value through profit or loss. |
| (4) | Interest receivable and interest payable on trading assets and liabilities are included in income from trading activities. |
The 2006 comparative amounts have been restated for the netting of certain derivative asset and derivative liability balances with the London Clearing House.
Business reviewcontinued | Business review |
Business review continued
Analysis of change in net interest income –- volume and rate analysis
Volume and rate variances have been calculated based on movements in average balances over the period and changes in interest rates on average interest-earning assets and average interest-bearing liabilities. Changes due to a combination of volume and rate are allocated pro rata to volume and rate movements.
| | | 2008 over 2007 (restated) | | | 2007 (restated) over 2006 (restated) | | 2010 over 2009 |
| | | Increase/(decrease) due to changes in: | | | Increase/(decrease) due to changes in: | | Increase/(decrease) due to changes in: |
| | | Average volume | | | Average rate | | | Net change | | | Average volume | | | Average rate | | | Net change | | Average volume | Average rate | Net change |
| | | | £m | | | | £m | | | | £m | | | | £m | | | | £m | | | | £m | | £m |
| Interest-earning assets | | | | | | | | | | | | | | | | | | | | | | | | | |
| Loans and advances to banks | | | | | | | | | | | | | | | | | | | | | | | | | |
| UK | | (103 | ) | | 18 | | | (85 | ) | | 243 | | | 100 | | | 343 | | 15 | (103) | (88) |
| Overseas | | 845 | | | 26 | | | 871 | | | 217 | | | 92 | | | 309 | | (40) | (204) | (244) |
| Loans and advances to customers | | | | | | | | | | | | | | | | | | | | | | | | | |
| UK | | 3,221 | | | (2,681 | ) | | 540 | | | 1,985 | | | 1,380 | | | 3,365 | | (836) | 885 | 49 |
| Overseas | | 12,621 | | | 83 | | | 12,704 | | | 3,112 | | | (27 | ) | | 3,085 | | (6,776) | (2,663) | (9,439) |
| Debt securities | | | | | | | | | | | | | | | | | | | | | | | | | |
| UK | | 906 | | | (230 | ) | | 676 | | | (98 | ) | | 100 | | | 2 | | 342 | (297) | 45 |
| Overseas | | 2,564 | | | - | | | 2,564 | | | 465 | | | (5 | ) | | 460 | | (716) | (667) | (1,383) |
| Total interest receivable of the banking business | | | | | | | | | | | | | | | | | | | | | | | | | |
| UK | | 4,024 | | | (2,893 | ) | | 1,131 | | | 2,130 | | | 1,580 | | | 3,710 | | (479) | 485 | 6 |
| Overseas | | 16,030 | | | 109 | | | 16,139 | | | 3,794 | | | 60 | | | 3,854 | | (7,532) | (3,534) | (11,066) |
| | | | 20,054 | | | (2,784 | ) | | 17,270 | | | 5,924 | | | 1,640 | | | 7,564 | | (8,011) | (3,049) | (11,060) |
| Interest-bearing liabilities | | | | | | | | | | | | | | | | | | | | | | | | | |
| Deposits by banks | | | | | | | | | | | | | | | | | | | | | | | | | |
| UK | | 271 | | | 159 | | | 430 | | | (706 | ) | | (135 | ) | | (841 | ) | 75 | 270 | 345 |
| Overseas | | (3,452 | ) | | (148 | ) | | (3,600 | ) | | (94 | ) | | 150 | | | 56 | | 845 | 518 | 1,363 |
| Customer accounts: demand deposits | | | | | | | | | | | | | | | | | | | | | | | | | |
| UK | | (204 | ) | | 671 | | | 467 | | | (227 | ) | | (641 | ) | | (868 | ) | (54) | 2 | (52) |
| Overseas | | (956 | ) | | 475 | | | (481 | ) | | (591 | ) | | 1 | | | (590 | ) | 670 | 53 | 723 |
| Customer accounts: savings deposits | | | | | | | | | | | | | | | | | | | | | | | | | |
| UK | | (276 | ) | | 226 | | | (50 | ) | | (206 | ) | | (394 | ) | | (600 | ) | (192) | 37 | (155) |
| Overseas | | (1,367 | ) | | 66 | | | (1,301 | ) | | (241 | ) | | (132 | ) | | (373 | ) | 965 | 936 | 1,901 |
| Customer accounts: other time deposits | | | | | | | | | | | | | | | | | | | | | | | | | |
| UK | | (286 | ) | | 476 | | | 190 | | | (962 | ) | | (432 | ) | | (1,394 | ) | 336 | 165 | 501 |
| Overseas | | (2,500 | ) | | 503 | | | (1,997 | ) | | (332 | ) | | (132 | ) | | (464 | ) | 708 | 633 | 1,341 |
| Debt securities in issue | | | | | | | | | | | | | | | | | | | | | | | | | |
| UK | | (1,932 | ) | | 897 | | | (1,035 | ) | | (587 | ) | | (263 | ) | | (850 | ) | 123 | 495 | 618 |
| Overseas | | (3,714 | ) | | 495 | | | (3,219 | ) | | (1,248 | ) | | (303 | ) | | (1,551 | ) | 799 | 636 | 1,435 |
| Subordinated liabilities | | | | | | | | | | | | | | | | | | | | | | | | | |
| UK | | (148 | ) | | 92 | | | (56 | ) | | 19 | | | (93 | ) | | (74 | ) | 180 | 256 | 436 |
| Overseas | | (489 | ) | | (69 | ) | | (558 | ) | | (99 | ) | | 29 | | | (70 | ) | 152 | 485 | 637 |
| Internal funding of trading business | | | | | | | | | | | | | | | | | | | | | | | | | |
| UK | | 751 | | | (613 | ) | | 138 | | | 1,129 | | | 285 | | | 1,414 | | (83) | (94) | (177) |
| Overseas | | 430 | | | (22 | ) | | 408 | | | 109 | | | 5 | | | 114 | | (75) | (76) | (151) |
| Total interest payable of the banking business | | | | | | | | | | | | | | | | | | | | | | | | | |
| UK | | (1,824 | ) | | 1,908 | | | 84 | | | (1,540 | ) | | (1,673 | ) | | (3,213 | ) | 385 | 1,131 | 1,516 |
| Overseas | | (12,048 | ) | | 1,300 | | | (10,748 | ) | | (2,496 | ) | | (382 | ) | | (2,878 | ) | 4,064 | 3,185 | 7,249 |
| | | | (13,872 | ) | | 3,208 | | | (10,664 | ) | | (4,036 | ) | | (2,055 | ) | | (6,091 | ) | 4,449 | 4,316 | 8,765 |
| Movement in net interest income | | | | | | | | | | | | | | | | | | | | | | | | | |
| UK | | 2,200 | | | (985 | ) | | 1,215 | | | 590 | | | (93 | ) | | 497 | | (94) | 1,616 | 1,522 |
| Overseas | | 3,982 | | | 1,409 | | | 5,391 | | | 1,298 | | | (322 | ) | | 976 | | (3,468) | (349) | (3,817) |
| | | | 6,182 | | | 424 | | | 6,606 | | | 1,888 | | | (415 | ) | | 1,473 | | (3,562) | 1,267 | (2,295) |
Note:
| (1) | The analysis into UK and Overseas has been compiled on the basis of location of office. |
Business reviewcontinued | Business review |
Analysis of change in net interest income - volume and rate analysis continued
| | 2009 over 2008 |
| | Increase/(decrease) due to changes in: |
| | Average volume | Average rate | Net change |
| | £m | £m | £m |
| Interest-earning assets | | | |
| Loans and advances to banks | | | |
| UK | 113 | (742) | (629) |
| Overseas | 43 | (847) | (804) |
| Loans and advances to customers | | | |
| UK | 775 | (7,881) | (7,106) |
| Overseas | (949) | (5,478) | (6,427) |
| Debt securities | | | |
| UK | 594 | (456) | 138 |
| Overseas | (38) | (820) | (858) |
| Total interest receivable of the banking business | | | |
| UK | 1,482 | (9,079) | (7,597) |
| Overseas | (944) | (7,145) | (8,089) |
| | 538 | (16,224) | (15,686) |
| Interest-bearing liabilities | | | |
| Deposits by banks | | | |
| UK | 683 | 442 | 1,125 |
| Overseas | 360 | 2,050 | 2,410 |
| Customer accounts: demand deposits | | | |
| UK | (268) | 2,528 | 2,260 |
| Overseas | (228) | 410 | 182 |
| Customer accounts: savings deposits | | | |
| UK | (369) | 1,297 | 928 |
| Overseas | (306) | 395 | 89 |
| Customer accounts: other time deposits | | | |
| UK | 881 | 2,198 | 3,079 |
| Overseas | 1,175 | 667 | 1,842 |
| Debt securities in issue | | | |
| UK | (540) | 1,805 | 1,265 |
| Overseas | 609 | 2,737 | 3,346 |
| Subordinated liabilities | | | |
| UK | 13 | 509 | 522 |
| Overseas | (5) | 137 | 132 |
| Internal funding of trading business | | | |
| UK | (795) | (2,333) | (3,128) |
| Overseas | (112) | (425) | (537) |
| Total interest payable of the banking business | | | |
| UK | (395) | 6,446 | 6,051 |
| Overseas | 1,493 | 5,971 | 7,464 |
| | 1,098 | 12,417 | 13,515 |
| Movement in net interest income | | | |
| UK | 1,087 | (2,633) | (1,546) |
| Overseas | 549 | (1,174) | (625) |
| | 1,636 | (3,807) | (2,171) |
Note:
| (1) | The analysis into UK and Overseas has been compiled on the basis of location of office. |
Business review continued
Business reviewcontinued | Business review |
Non-interest income
| | | 2008 | | | 2007 | | | 2006 | |
| | | | £m | | | | £m | | | | £m | |
| Fees and commissions receivable | | | 9,831 | | | | 8,278 | | | | 7,116 | |
| Fees and commissions payable | | | (2,386 | ) | | | (2,193 | ) | | | (1,922 | ) |
| (Loss)/income from trading activities | | | (8,477 | ) | | | 1,292 | | | | 2,675 | |
| Other operating income (excluding insurance net premium income) | | | 1,899 | | | | 4,833 | | | | 3,564 | |
| | | | 867 | | | | 12,210 | | | | 11,433 | |
| Insurance premium income | | | 6,626 | | | | 6,376 | | | | 6,243 | |
| Reinsurers’ share | | | (300 | ) | | | (289 | ) | | | (270 | ) |
| | | | 6,326 | | | | 6,087 | | | | 5,973 | |
| | | | 7,193 | | | | 18,297 | | | | 17,406 | |
| | 2010 | 2009 | 2008 |
| | £m | £m | £m |
| Fees and commissions receivable | 8,193 | 8,738 | 8,855 |
| Fees and commissions payable | (2,211) | (2,790) | (2,444) |
| Income/(loss) from trading activities | | | |
- excluding Asset Protection Scheme credit default swap - fair value changes | 6,067 | 3,761 | (9,025) |
| - Asset Protection Scheme credit default swap - fair value changes | (1,550) | — | — |
| Gain on redemption of own debt | 553 | 3,790 | — |
| Other operating income | 1,479 | 873 | 2,153 |
| Non-interest income (excluding insurance net premium income) | 12,531 | 14,372 | (461) |
| Insurance net premium income | 5,128 | 5,266 | 5,709 |
| Total non-interest income | 17,659 | 19,638 | 5,248 |
20082010 compared with 20072009
Non-interest income, decreased by 61%, £11,104 million to £7,193 million. Non-interest income was severely affected by the weakness in financial markets experienced over the course of the year. While the decline was particularly marked in Global Banking & Market's credit markets and equities businesses, with reduced business volumes and mounting mark-to-market trading losses, Regional Markets also saw non-interest income fall in the latter part of the year as declining consumer confidence led to lower demand for credit and other financial products.
Excluding general insurance premium income, non-interest income fell by £11,343 million to £867 million.
Within non-interest income,Net fees and commissions receivable increased by 19% or £1,553£34 million to £9,831£5,982 million whileprimarily due to improved performance in GBM (£139 million), driven by higher portfolio management and origination income, and UK Corporate (£94 million), principally reflecting strong refinancing levels and increased operating lease activity This increase was partially offset by reduced fees in UK Retail (£160 million) and commissions payable increased by 9%, £193 million to £2,386 million.Ulster Bank (£72 million) principally reflecting the restructuring of current account overdraft fees.
Income from trading activities, was down from £1,292excluding fair value movements in the Asset Protection Scheme credit default swap, rose substantially during the year by £2,306 million to a loss of £8,477£6,067 million. Currency trading activities benefited from increased volatilityTrading revenues in the markets. However, this improvementGBM were lower than 2009, which saw unusually buoyant market conditions as rapidly falling interest rates generated significant revenue opportunities. This was more than offset by substantialthe improvement in Non-Core trading losses from £5,123 million for 2009 to £16 million for 2010 as underlying asset prices recovered and monoline spreads tightened. The unwinding of some banking book hedges also helped reduce trading losses.
The Asset Protection Scheme is accounted for as a credit market write downs duringderivative, and movements in the year.fair value of the contract are recorded as income from trading activities. The charge of £1,550 million in 2010 reflects improving credit spreads on the portfolio of covered assets.
A gain of £553 million was booked associated with the liability management exercise undertaken in May 2010, through which the Group strengthened its Core Tier 1 capital base by repurchasing existing Tier 1 securities and exchanging selected existing Upper Tier 2 securities for new senior debt securities. A similar series of exchange and tender offers concluded in April 2009 resulted in a gain of £3,790 million.
Other operating income also decreased, fallingincreased by 61%, £2,934£606 million to £1,899£1,479 million. This wasimprovement principally duereflected a profit on sale of securities of £496 million compared with £162 million in 2009, higher profits from associated entities and an increased credit of £249 million compared with £51 million in 2009 relating to a fallmovements in fair value of own debt. These were partially offset by losses in the fair value of securities and other financial assetsinvestment properties.
Insurance net premium income fell by £138 million to £5,128 million principally reflecting lower general insurance premiums, driven by a managed reduction in the risk of the UK motor book, largely offset by price increases.
Business reviewcontinued | Business review |
Non-interest income continued
2009 compared with 2008
Net fees and liabilitiescommissions fell by £463 million primarily due to the withdrawal of the single premium payment protection insurance product and the restructuring of current account overdraft fees within UK Retail during the year, as well as to reduced fees received in Non-Core. This was partially offset by profits from the sale of subsidiariesimproved performance in GBM (£171 million) and associates.
Insurance premium income, after reinsurance, increased by 4% to £6,326 million primarily reflecting a full year of ABN AMRO businesses in comparison with 76 days in 2007. This was partly offset by the discontinuation of less profitable partnership contracts.
2007 compared with 2006
Non-interest income increased by 5%, £891 million to £18,297 million, including £810 million from the acquisition of ABN AMRO. Good organic growth was offset by write-downs in Global BankingUS Retail & Markets in respect of US mortgage-related and leveraged finance exposures. Non-interest income represents 60% of total income (2006 – 62%)Commercial (£50 million). Excluding general insurance premium income, non-interest income rose by 7%, £777 million to £12,210 million.
Within non-interest income, fees and commissions receivable increased by 16% or £1,162 million, to £8,278 million, while fees and commissions payable increased by 14%, £271 million to £2,193 million.
Income from trading activities was down from £2,675rose substantially during the year by £12,786 million, principally due to £1,292 million. Interest rate and currency trading activities benefited from increasedlower credit market losses reflecting improved underlying asset prices compared with 2009. Increased market volatility and there was good growth fromstrong customer demand in a broadening product range. These improvements were, however, more than offset by credit markets write downs.positive trading environment also contributed to this improvement.
In the second quarter of 2009 the Group recorded a gain of £3,790 million on a liability management exercise to redeem a number of Tier 1 and upper Tier 2 securities.
Other operating income increaseddecreased by 36%, £1,269 million to £4,833£1,280 million. This was principally due to growthreflected changes in income from rentalthe fair value of own debt of £926 million together with lower profits on sales of securities and asset-backed activitiesproperties and principal investmentsreduced dividend income. Included in Global Markets.2008 is a gain of £600 million on the sale of Angel Trains.
General insuranceInsurance net premium income after reinsurance, increasedfell by 2% to £6,087£443 million with good growth in policies in the core businesses, particularly in Continental Europe.reflecting lower bancassurance fees, and lower general insurance premiums.
Business reviewcontinued | Business review |
Operating expenses
| | 2010 | 2009 | 2008 |
| | £m | £m | £m |
| Staff costs | | | |
| - excluding gains on pensions curtailment | 9,671 | 9,993 | 8,898 |
| - gains on pensions curtailment | — | (2,148) | — |
| Premises and equipment | 2,402 | 2,594 | 2,163 |
| Other | 3,995 | 4,449 | 4,716 |
| Administrative expenses | 16,068 | 14,888 | 15,777 |
| Depreciation and amortisation | 2,150 | 2,166 | 2,377 |
| Write-down of goodwill and other intangible assets | 10 | 363 | 16,911 |
| Operating expenses | 18,228 | 17,417 | 35,065 |
| | | | |
| General insurance | 4,698 | 4,223 | 3,733 |
| Bancassurance | 85 | 134 | 184 |
| Insurance net claims | 4,783 | 4,357 | 3,917 |
| | | | |
| Staff costs as a percentage of total income | 30% | 30% | 43% |
2010 compared with 2009
The main driver of a 7% decrease in operating expenses, excluding gains on pensions curtailment, is the recognition of benefits from the Group-wide efficiency programme. The programme continues to deliver material savings which have been funding investments to strengthen our Core franchises. Annualised savings are now just ahead of the £2.5 billion target for 2011 and are forecast to exceed £3 billion by 2013.
Staff costs, excluding pension schemes curtailment gains, fell by £322 million to £9,671 million, driven by savings in Global Banking & Markets, UK Retail and Non-Core partially offset by higher costs in Group Centre.
Premises and equipment costs fell by 7% in the year to £2,402 million largely driven by efficiency cost savings, significant one-off property impairments recognised in 2009 and country exits following Non-Core disposals.
Other expenses fell by £454 million to £3,995 million principally reflecting continued savings from the Group’s efficiency programme.
Insurance net claims increased 10% to £4,783 million, driven by an overall increase in bodily injury reserves, reflecting prior year claims and more claims being settled as periodic payment orders. Severe weather experienced during Q1 and Q4 2010 also drove up claims in the year.
2009 compared with 2008
Staff costs, excluding pension schemes curtailment gains, were up £1,095 million with most of the movement relating to adverse movements in foreign exchange rates and some salary inflation. Changes in incentive compensation, primarily in Global Banking & Markets, represented most of the remaining change.
Pension curtailment gains of £2,148 million were recognised in 2009 arising from changes to prospective pension benefits in the defined benefit scheme and certain other subsidiary schemes.
Premises and equipment costs rose by £431 million primarily due to the impact of expanded Group premises in London and the US.
Other expenses fell by £267 million due to integration benefits in GBM partially offset by increased deposit insurance levies in the US.
Business reviewcontinued | Business review |
Integration costs
| | 2010 | 2009 | 2008 |
| | £m | £m | £m |
| Staff costs | 210 | 365 | 503 |
| Premises and equipment | 3 | 78 | 25 |
| Other administrative expenses | 143 | 398 | 486 |
| Depreciation and amortisation | 20 | 18 | 36 |
| | 376 | 859 | 1,050 |
2010 compared with 2009
Integration costs were £376 million compared with £859 million in 2009. The fall in integration costs primarily relates to RBS N.V. (formerly ABN AMRO), as they migrate onto RBS systems.
Business2009 compared with 2008
Integration costs in 2009 were £859 million compared with £1,050 million in 2008. Integration costs decreased primarily due to lower RBS N.V. (formerly ABN AMRO) integration activity during the year.
Accruals in relation to integration costs are set out below.
| | At 31 December | Charge to income | Utilised during | At 31 December |
| | 2009 | statement | the year | 2010 |
| | £m | £m | £m | £m |
Staff costs - redundancy | — | 55 | (55) | — |
Staff costs - other | — | 155 | (155) | — |
| Premises and equipment | 40 | 3 | (19) | 24 |
| Other | 1 | 163 | (164) | — |
| | 41 | 376 | (393) | 24 |
Restructuring costs
| | 2010 | 2009 | 2008 |
| | £m | £m | £m |
| Staff costs | 353 | 328 | 251 |
| Premises and equipment | 117 | 48 | 15 |
| Other administrative expenses | 104 | 51 | 41 |
| | 574 | 427 | 307 |
2010 compared with 2009
Restructuring costs were £574 million compared with £427 million in 2009. The increase is a result of the number of restructuring projects being undertaken.
2009 compared with 2008
Restructuring costs were £427 million compared with £307 million in 2008. The number of restructuring projects increased during the year, as a result of ongoing strategic review continuedbeing undertaken by the Group.
Accruals in relation to restructuring costs are set out below.
| | At | Charge | Utilised | At |
| | 31 December | to income | during | 31 December |
| | 2009 | statement | the year | 2010 |
| | £m | £m | £m | £m |
| Staff costs - redundancy | 255 | 255 | (309) | 201 |
| Staff costs - other | 4 | 98 | (85) | 17 |
| Premises and equipment | 37 | 117 | (37) | 117 |
| Other | 35 | 104 | (93) | 46 |
| | 331 | 574 | (524) | 381 |
Business reviewcontinued | Business review |
Divestment costs
| | 2010 | 2009 | 2008 |
| | £m | £m | £m |
| Staff costs | 51 | — | — |
| Premises and equipment | 6 | — | — |
| Other administrative expenses | 25 | — | — |
| | 82 | — | — |
2010 compared with 2009
Divestment costs of £82 million in the year relate to the European Commission mandated divestments.
Accruals in relation to divestment costs are set out below.
| | At | Charge | Utilised | At |
| | 31 December | to income | during | 31 December |
| | 2009 | statement | the year | 2010 |
| | £m | £m | £m | £m |
| Staff costs - redundancy | — | 28 | (6) | 22 |
| Staff costs - other | — | 23 | (15) | 8 |
| Premises and equipment | — | 6 | (6) | — |
| Other | — | 25 | (23) | 2 |
| | — | 82 | (50) | 32 |
Business reviewcontinued | Business review |
Impairment losses
| | 2010 | 2009 | 2008 |
| | £m | £m | £m |
| New impairment losses | 9,667 | 14,224 | 7,700 |
| Less: recoveries of amounts previously written-off | (411) | (325) | (261) |
| Charge to income statement | 9,256 | 13,899 | 7,439 |
| | | | |
| Comprising: | | | |
| Loans and advances | 9,144 | 13,090 | 6,478 |
| Securities | 112 | 809 | 961 |
| Charge to income statement | 9,256 | 13,899 | 7,439 |
2010 compared with 2009
Impairment losses were £9,256 million, compared with £13,899 million in 2009. The 33% decrease reflects an overall improvement in the economic environments in which the Group operates.
Impairments fell in all Core businesses, except Ulster Bank Group, which faced an economic environment that remains challenging, with rising default levels across both personal and corporate portfolios.
Impairments for Ulster Bank Group (Core and Non-Core) increased to £3,843 million compared with £1,927 million in 2009.
A significant proportion of the reduction in Core impairments relates to lower specific and latent provisions in UK Corporate, US Retail & Commercial and GBM.
Non-Core impairments fell by 41% in 2010 reflecting the gradual improvement in the economic environment through 2010 and lower specific provisions, alongside a non-repeat of the large single name losses seen in 2009.
2009 compared with 2008
Impairment losses were £13,899 million compared with £7,439 million. Impairment losses in the Core divisions increased by £2,182 million, Non-Core losses increased by £4,285 million off-set by a decrease in RFS Holdings minority interest of £7 million.
In the Core business, the biggest increases were in UK Retail, UK Corporate and Ulster Bank, reflecting the difficult economic environment.
Non-Core losses also increased substantially, particularly across the corporate and property sectors.
Business reviewcontinued | Business review |
Credit market exposures
| | | | | | | |
| | | Net exposure (1) | | | Write-downs before tax | | | Average price | | | Net exposure(1) | | | Average price | |
| | | | £m | | | | £m | | | % | | | | £m | | | % | |
| Asset-backed CDOs | | | | | | | | | | | | | | | | | | |
| High grade | | | 1,231 | | | | 1,836 | | | | 29 | | | | 2,581 | | | | 84 | |
| Mezzanine | | | 144 | | | | 1,140 | | | | 6 | | | | 1,253 | | | | 70 | |
| | | | 1,375 | | | | 2,976 | | | | | | | | 3,834 | | | | 79 | |
| Monolines | | | 4,804 | | | | 3,557 | | | | n/a | | | | 2,547 | | | | n/a | |
| | | | | | | | | | | | | | | | | | | | | |
US residential mortgages (2) | | | | | | | | | | | | | | | | | | | | |
| Sub-prime | | | — | | | | 353 | | | | n/a | | | | 1,292 | | | | 72 | |
| Alt-A | | | — | | | | 1,071 | | | | n/a | | | | 2,233 | | | | 83 | |
| Other non-agency | | | — | | | | 43 | | | | n/a | | | | 794 | | | | 94 | |
| | | | — | | | | 1,467 | | | | | | | | 4,319 | | | | 81 | |
US commercial mortgages (2) | | | 437 | | | | 95 | | | | 87 | | | | 1,809 | | | | 97 | |
Leveraged finance (2) | | | | | | | | | | | | | | | | | | | | |
| Held-for-trading | | | 103 | | | | 1,088 | | | | 64 | | | | 11,992 | | | | 96 | |
| Loans and receivables | | | 5,920 | | | | — | | | | n/a | | | | 2,514 | | | | n/a | |
| | | | 6,023 | | | | 1,088 | | | | | | | | 14,506 | | | | | |
| CLOs | | | 520 | | | | 240 | | | | 81 | | | | 1,386 | | | | 93 | |
| | | | | | | | 9,423 | | �� | | | | | | | | | | | |
| CDS hedging | | | | | | | (1,642 | ) | | | | | | | | | | | | |
| Total net of CDS hedging | | | | | | | 7,781 | | | | | | | | | | | | | |
| | 2010 £m | 2009 £m | 2008 £m |
Credit and other market (losses)/gains (1) |
| Monoline exposures | (5) | (2,387) | (3,093) |
CDPCs (2) | (141) | (957) | (615) |
Asset-backed products | 235 | (288) | (4,778) |
| Other credit exotics | 77 | (558) | (947) |
| Equities | (17) | (47) | (948) |
| Leveraged finance | — | — | (1,088) |
| Banking book hedges | (82) | (1,727) | 1,642 |
| Other | (455) | (188) | (268) |
| Net credit and other market losses | (388) | (6,152) | (10,095) |
| (1) | Net of hedges and write-downs.Included in 'Income from trading activities', significantly all in Non-Core. |
| (2) | Figures representCredit derivative product companies. |
2010 compared with 2009
Tightening credit spreads, a recovery in underlying asset prices and gains on sales of asset-backed products during 2010 contributed to significantly lower losses in 2010. Unwinding of some banking book hedges in 2010 also resulted in lower losses. Monoline losses of £2,387 million in 2009 reflected the widening credit spreads and lower recovery rates. CDPC losses were higher in 2009 due to losses on market risk hedges.
Other losses include credit valuation and other reserves against derivative counterparties other than monolines and CDPCs. Losses increased due to rating downgrades as well as other losses on specific deals.
2009 compared with 2008
Losses relating to monoline exposures were £2,387 million in 2009 compared with £3,093 million in 2008.
| The credit quality of the Group’s remaining netmonolines has continued to deteriorate and the level of CVA held against exposures to monoline counterparties has increased from 52% to 62% during the year. This was driven by a combination of wider credit spreads and lower recovery rates. |
| The gross exposure to its previously reported credit marketmonoline counterparties has decreased primarily due to a combination of higher prices of underlying reference instruments and restructuring certain exposures. |
(3) | Includes commitmentsThe increase in CVA resulting from the credit quality deterioration was partially offset by the decrease in CVA requirement following the reduction in gross exposure due to lend.higher prices of underlying reference instruments. Consequently the net losses incurred in this regard were lower than in 2008 when there was both an increase in gross exposure and deterioration in credit quality. |
Losses relating to CDPC exposures were £957 million in 2009 compared with £615 million in 2008.
| The credit quality of the CDPCs has continued to deteriorate and the level of CVA held against exposures to CDPC counterparties has increased from 27% to 39% during the year. |
| The gross exposure to CDPC counterparties has reduced primarily due to a combination of tighter credit spreads of the underlying reference loans and bonds, and a decrease in the relative value of senior tranches compared with the underlying reference portfolios. |
| The decrease in CVA requirement following the reduction in gross exposure was partially offset by the increase in CVA requirement resulting from the credit quality deterioration. Consequently there were net gains in this regard in 2009 compared with losses in 2008 when there was both an increase in gross exposure and deterioration in credit quality. |
| Net losses were incurred in 2009 due to hedges put in place at the end of 2008 and during 2009 which effectively cap the exposure to certain CDPCs. As the exposure to these CDPCs has reduced, losses have been incurred on the hedges. |
Losses relating to asset-backed products were £288 million in 2009 compared with £4,778 million in 2008.
| Losses reported in 2009 primarily relate to super senior CDOs. The significant price declines of the underlying predominantly mortgage-backed securities seen in 2008 were not repeated in 2009. |
| Losses on other mortgage backed securities were greatly reduced in 2009 as many of these positions were sold or substantially written down in 2008 resulting in reduced net exposure in 2009. |
Losses relating to other credit exotics were £558 million in 2009 compared with £947 million in 2008. These losses were reduced in 2009 as hedges were put in place to mitigate the risk.
Leveraged finance assets were reclassified on 1 July 2009. Changes in the fair value of these assets are only recognised in the income statement to the extent that they are considered impairments.
Losses relating to banking book hedges were £1,727 million in 2009 compared with profits of £1,642 million in 2008. These trades hedge counterparty risk that arises from loans and bonds on the regulatory banking book. As credit spreads have generally tightened in 2009 the value of these hedges has decreased resulting in losses. These hedges gave rise to gains in 2008 due to credit spreads generally widening.
Business reviewcontinued | Business review |
Credit market exposures continued
Additional disclosures on these and other related exposures can be found in the rest of this document as follows:following sections:
| Section | Sub-section | | | | |
Further analysis (1) | of credit market exposures | Risk and balance sheet management | Other risk exposures | Credit market and related disclosures | | 101 – 123144 |
Valuation aspects(1) | Financial statements | Note 12 Financial instruments - valuation | 251 |
| | Financial statements | | Note 11 Financial instruments | | 186 – 191 |
Valuation of financial instruments (1)
| | Financial statements | | Critical accounting policies | | 170 – 171 |
(general and level 3) | | | | Note 11 Financial instruments | | 184 – 191225 |
| Reclassification of financial instruments | | Financial statements | | Note 11 Financial instruments - classification | | 193 |
Asset-backed CDOs | | Risk management | | Market risk | | 88247 |
(1) | In preparing these disclosures, the Group took into consideration the leading practice recommendations of the Financial Stability Forum issued in April 2008 and the report of the IASB Advisory Panel ‘measuring and disclosing fair value of financial instruments in markets that are no longer active’ issued in October 2008. |
Business review continued
Operating expenses
| | | 2008 | | | 2007 | | | 2006 | |
| | | | £m | | | | £m | | | | £m | |
| Administrative expenses: | | | | | | | | | | | | |
| Staff costs | | | 10,241 | | | | 7,338 | | | | 6,723 | |
| Premises and equipment | | | 2,593 | | | | 1,703 | | | | 1,421 | |
| Other administrative expenses | | | 5,464 | | | | 2,969 | | | | 2,658 | |
| Total administrative expenses | | | 18,298 | | | | 12,010 | | | | 10,802 | |
| Depreciation and amortisation | | | 3,154 | | | | 1,932 | | | | 1,678 | |
| Write-down of goodwill and other assets | | | 32,581 | | | | — | | | | — | |
| | | | 54,033 | | | | 13,942 | | | | 12,480 | |
2008 compared with 2007Tax
Operating expenses increased by £40,091 million to £54,033 million, primarily reflecting the write-down of goodwill and other assets of £32,581 million following a review of the carrying value of goodwill and other assets. Cost growth in the Group’s core retail and commercial banking franchises was offset by efficiency programmes and a significant reduction in Global Banking & Markets staff costs. The 2008 costs reflect a full year of the retained ABN AMRO businesses in comparison with 76 days in 2007.
The Group’s ratio of operating expenses to total income was 208.9% compared with 45.9% in 2007, largely reflecting the impact on income of the year’s difficult market conditions and the write-down of goodwill and other assets.
2007 compared with 2006
Operating expenses increased by 12%, £1,462 million to £13,942 million including £1,387 million relating to ABN AMRO. Adjusting for this, operating expenses increased by just £75 million, 1%, reflecting tight cost management and the benefits of the Group’s manufacturing platform. Further improvements in productivity have supported growth in business volumes, and allowed the Group to maintain high levels of customer satisfaction.| | 2010 | 2009 | 2008 |
| | £m | £m | £m |
| Tax (charge)/credit | (634) | 429 | 2,167 |
| | | | |
| | % | % | % |
| UK corporation tax rate | 28.0 | 28.0 | 28.5 |
| Effective tax rate | nm | 16.2 | 8.4 |
The Group’s ratio of operating expenses to total income was 45.9% compared with 44.6% in 2006.
Business review continued
Integration costs
| | | 2008 | | | 2007 | | | 2006 | |
| | | | £m | | | | £m | | | | £m | |
| Staff costs | | | 503 | | | | 18 | | | | 76 | |
| Premises and equipment | | | 25 | | | | 4 | | | | 10 | |
| Other administrative expenses | | | 486 | | | | 26 | | | | 32 | |
| Depreciation and amortisation | | | 36 | | | | 60 | | | | 16 | |
| | | | 1,050 | | | | 108 | | | | 134 | |
2008 compared with 2007
Integration costs in 2008 were £1,050 million compared with £108 million in 2007. The significant increase reflects a full year of integration costs being incurred in respect of the ABN AMRO acquisition, compared to 76 days in 2007.
Accruals in relation to integration costs are set out below.
| | | At 31 December 2007 | | | Currency translation adjustments | | | Charge to income statement | | | Utilised during the year | | | At 31 December 2008 | |
| | | | £m | | | | £m | | | | £m | | | | £m | | | | £m | |
| Staff costs | | | 4 | | | | — | | | | 503 | | | | (502 | ) | | | 5 | |
| Premises and equipment | | | 2 | | | | — | | | | 25 | | | | (26 | ) | | | 1 | |
| Other | | | 1 | | | | 1 | | | | 522 | | | | (521 | ) | | | 3 | |
| | | | 7 | | | | 1 | | | | 1,050 | | | | (1,049 | ) | | | 9 | |
2007 compared with 2006
Integration costs in 2007 were £108 million compared with £134 million in 2006 comprising amortisation of internally developed software and other expenditure. Software costs were previously written-off as incurred under UK GAAP but under IFRS are now amortised over the expected useful lives of up to five years. Software amortisation included in integration costs principally relates to the integration of Churchill, First Active and Citizens’ acquisitions, including Charter One which was acquired in August 2004.
Restructuring costs
| | | 2008 | | | 2007 | | | 2006 | |
| | | | £m | | | | £m | | | | £m | |
| Staff costs | | | 251 | | | | — | | | | — | |
| Premises and equipment | | | 15 | | | | — | | | | — | |
| Other administrative expenses | | | 41 | | | | — | | | | — | |
| | | | 307 | | | | — | | | | — | |
Accruals in relation to restructuring costs are set out below.
| | | At 31 December 2007 | | | Currency translation adjustments | | | Charge to income statement | | | Utilised during the year | | | At 31 December 2008 | |
| | | | £m | | | | £m | | | | £m | | | | £m | | | | £m | |
| Staff costs | | | — | | | | 33 | | | | 251 | | | | — | | | | 284 | |
| Premises and equipment | | | — | | | | — | | | | 15 | | | | — | | | | 15 | |
| Other | | | — | | | | 10 | | | | 41 | | | | — | | | | 51 | |
| | | | — | | | | 43 | | | | 307 | | | | — | | | | 350 | |
Business review continued
Impairment
| | | 2008 | | | 2007 | | | 2006 | |
| | | | £m | | | | £m | | | | £m | |
| New impairment | | | 8,391 | | | | 2,310 | | | | 2,093 | |
| less: recoveries of amounts previously written-off | | | (319 | ) | | | (342 | ) | | | (215 | ) |
| Charge to income statement | | | 8,072 | | | | 1,968 | | | | 1,878 | |
| Comprising: | | | | | | | | | | | | |
| Loan impairment | | | 7,091 | | | | 1,946 | | | | 1,877 | |
| Impairment of available-for-sale securities | | | 981 | | | | 22 | | | | 1 | |
| Charge to income statement | | | 8,072 | | | | 1,968 | | | | 1,878 | |
2008 compared with 2007
Credit impairment losses increased to £8,072 million in 2008, compared with £1,968 million in 2007. The Group experienced a pronounced deterioration in impairments during the year, as financial stress spread to a broad range of customers. The greatest increase in impairments occurred in Global Banking & Markets. However, the Regional Markets businesses in all geographies also experienced a noticeable increase in impairments during the year, particularly in the UK SME and US personal segments.
Total balance sheet provisions for impairment amounted to £11,016 million compared with £6,452 million in 2007.
Total provision coverage (the ratio of total balance sheet provisions for impairment to total risk elements in lending) decreased from 60% to 52%. The ratio of total balance sheet provisions for impairment to total risk elements in lending and potential problem loans also decreased to 51% compared with 57% in 2007.
2007 compared with 2006
Impairment losses were £1,968 million compared with £1,878 million. Impairment losses in ABN AMRO in the period since acquisition were £103 million. Adjusting for this, impairment losses fell by £13 million, 1%. This reflected improvement in Global Markets and UK Retail & Commercial Banking partially offset by higher impairment in US Retail & Commercial Banking. New impairment losses were up 10%, £217 million to £2,310 million. Recoveries of amounts previously written-off were up £127 million, 59% to £342 million. Consequently the net charge to the income statement was up £90 million, 5% to £1,968 million.
Total balance sheet provisions for impairment, including ABN AMRO, amounted to £6,452 million compared with £3,935 million in 2006.
Total provision coverage (the ratio of total balance sheet provisions for impairment to total risk elements in lending) decreased from 62% to 60%. The ratio of total balance sheet provisions for impairment to total risk elements in lending and potential problem loans decreased to 57% compared with 62% in 2006. This reflects amounts written-off and the slightly lower risk profile of the portfolio.
Business review continued
| | | 2008 | | | 2007 | | | 2006 | |
| | | | £m | | | | £m | | | | £m | |
| Tax | | | (2,323 | ) | | | 2,044 | | | | 2,689 | |
| | | | | | | | | | |
| | | % | | | % | | | % | |
| UK corporation tax rate | | | 28.5 | | | | 30.0 | | | | 30.0 | |
| Effective tax rate | | | 5.7 | | | | 20.8 | | | | 29.3 | |
The actual tax charge(charge)/credit differs from the expected tax chargecredit computed by applying the standard rate of UK corporation tax as follows:
| | | 2008 | | | 2007 | | | 2006 | | 2010 | 2009 | 2008 |
| | | | £m | | | | £m | | | | £m | | £m | £m | £m |
| Expected tax (credit)/charge | | �� | (11,590 | ) | | | 2,950 | | | | 2,756 | | |
| Expected tax credit | | 112 | 741 | 7,322 |
| Non-deductible goodwill impairment | | | 8,292 | | | | 12 | | | | — | | (3) | (102) | (3,826) |
| Unrecognised timing differences | | | 274 | | | | 29 | | | | — | | 11 | 274 | (274) |
| Other non-deductible items | | | 330 | | | | 222 | | | | 288 | | |
| Items not allowed for tax | | |
| - losses on strategic disposals and write downs | | (311) | (152) | (108) |
| - other | | (328) | (356) | (270) |
| Non-taxable items | | | (491 | ) | | | (595 | ) | | | (251 | ) | |
| - gain on sale of Global Merchant Services | | 221 | — |
- gain on redemption of own debt | | 11 | 693 | — |
- other | | 341 | 410 | 491 |
| Taxable foreign exchange movements | | | 80 | | | | 16 | | | | 5 | | 4 | 1 | (80) |
| Reduction in deferred tax liability following change in the rate of UK corporation tax | | | — | | | | (189 | ) | | | — | | |
| Foreign profits taxed at other rates | | | 203 | | | | (25 | ) | | | 63 | | (517) | (276) | (509) |
| Losses in year not recognised | | | 942 | | | | 2 | | | | — | | |
| UK tax rate change - deferred tax impact | | (82) | — |
| Losses in year where no deferred tax asset recognised | | (450) | (780) | (942) |
| Losses brought forward and utilised | | | (11 | ) | | | (11 | ) | | | 14 | | 2 | 94 | 11 |
| Adjustments in respect of prior periods | | | (352 | ) | | | (367 | ) | | | (186 | ) | |
| Actual tax (credit)/charge | | | (2,323 | ) | | | 2,044 | | | | 2,689 | | |
| Adjustments in respect of prior years | | 355 | (118) | 352 |
| Actual tax (charge)/credit | | (634) | 429 | 2,167 |
2010 compared with 2009
The effectivehigh tax ratecharge in 2010 reflects profits in high tax regimes and losses in low tax regimes, together with £450 million relating to losses in overseas subsidiaries for the year was 5.7% (2007 – 20.8%; 2006 – 29.3%). Thewhich a deferred tax credit is lower than that arising from applying the standard rateasset has not been recognised, and £311 million mainly in respect of UK corporation taxlosses on disposal of 28.5% to the lossbusinesses for the period, principally due to non-deductible goodwill impairment and certain carried forward losses on which no tax relief is available. This was offset in part by the non-taxable gain arising on the disposal of 80.01% of the GMS business.
2009 compared with 2008
The low tax credit in 2009 reflects profits in high tax regimes and losses in low tax regimes, together with £780 million relating to losses in overseas subsidiaries for which a deferred tax asset has not been recognised.recognised, and £152 million mainly in respect of losses on disposal of business for which no tax relief is available.
Business reviewcontinued | Business review |
Business review continuedDivisional performance
The divisionalresults of each division are set out below. The results are stated before fair value of own debt, amortisation of purchased intangible assets, integration and restructuring costs, gain on redemption of own debt, strategic disposals, bonus tax, Asset Protection Scheme credit default swap - fair value changes, gains on pensions curtailment, write-down of goodwill and other intangible assets and integrationRFS Holdings minority interest.
Business Services directly attributable costs have been allocated to the operating divisions, based on their service usage. Where services span more than one division an appropriate measure is used to allocate the costs on a basis which management considers reasonable. Business Services costs are fully allocated and restructuringthere are no residual unallocated costs.
Group Centre directly attributable costs (‘Contribution’).have been allocated to the operating divisions, based on their service usage. Where services span more than one division, the costs are allocated on a basis management considers reasonable. The Group managesresidual unallocated costs where they arise. Customer-facing divisions control their direct expenses whilst Manufacturing is responsible for shared costs. In 2008,remaining in the Group didCentre relate to volatile corporate items that do not allocate these sharednaturally reside within a division.
Treasury costs betweenare allocated to operating divisions in the day-to-day managementas follows: term funding costs are allocated or rewarded based on long term funding gap or surplus; liquidity buffer funding costs are allocated based on share of its businesses,overall liquidity buffer derived from divisional stresses; and the way in whichcapital cost or benefit is allocated based on share of divisional results are presented reflects this.risk-adjusted risk-weighted assets (RWAs).
| | 2010 | 2009 | 2008 |
| | £m | £m | £m |
| UK Retail | 1,372 | 229 | 723 |
| UK Corporate | 1,463 | 1,125 | 1,781 |
| Wealth | 304 | 420 | 348 |
| Global Transaction Services | 1,088 | 973 | 1,002 |
| Ulster Bank | (761) | (368) | 218 |
| US Retail & Commercial | 306 | (113) | 528 |
| Retail & Commercial | 3,772 | 2,266 | 4,600 |
| Global Banking & Markets | 3,364 | 5,758 | (2,153) |
| RBS Insurance | (295) | 58 | 584 |
| Central items | 577 | 385 | 150 |
| Core | 7,418 | 8,467 | 3,181 |
| Non-Core | (5,505) | (14,557) | (11,351) |
| | 1,913 | (6,090) | (8,170) |
| | | | |
| Reconciling items: | | | |
| Fair value of own debt | 174 | (142) | 1,232 |
| RFS Holdings minority interest | (150) | (356) | (484) |
| Amortisation of purchased intangible assets | (369) | (272) | (443) |
| Integration and restructuring costs | (1,032) | (1,286) | (1,357) |
| Gain on redemption of own debt | 553 | 3,790 | — |
| Strategic disposals | 171 | 132 | 442 |
| Gains on pensions curtailment | — | 2,148 | — |
| Bonus tax | (99) | (208) | — |
| Asset Protection Scheme credit default swap - fair value changes | (1,550) | — | — |
| Write-down of goodwill and other intangible assets | (10) | (363) | (16,911) |
| Group operating loss before tax | (399) | (2,647) | (25,691) |
| | | 2008 | | | 2007 | | | 2006 | |
| | | | £m | | | | £m | | | | £m | |
| Global Markets | | | | | | | | | | | | |
| Global Banking & Markets | | | (10,515 | ) | | | 3,653 | | | | 3,811 | |
| Global Transaction Services | | | 1,818 | | | | 1,315 | | | | 1,186 | |
| Total Global Markets | | | (8,697 | ) | | | 4,968 | | | | 4,997 | |
| Regional Markets | | | | | | | | | | | | |
| UK Retail & Commercial Banking | | | 5,679 | | | | 6,225 | | | | 5,718 | |
| US Retail & Commercial Banking | | | 883 | | | | 1,479 | | | | 1,744 | |
| Europe & Middle East Retail & Commercial Banking | | | 429 | | | | 769 | | | | 675 | |
| Asia Retail & Commercial Banking | | | 127 | | | | 91 | | | | 67 | |
| Total Regional Markets | | | 7,118 | | | | 8,564 | | | | 8,204 | |
| RBS Insurance | | | 1,020 | | | | 905 | | | | 967 | |
| Group Manufacturing | | | (4,793 | ) | | | (3,773 | ) | | | (3,523 | ) |
| Central items | | | (675 | ) | | | (552 | ) | | | (1,231 | ) |
| Share of shared assets | | | (300 | ) | | | (73 | ) | | | — | |
| RFS Holdings minority interest | | | 41 | | | | 163 | | | | — | |
| Contribution | | | (6,286 | ) | | | 10,202 | | | | 9,414 | |
| Amortisation of purchased intangibles | | | (443 | ) | | | (262 | ) | | | (94 | ) |
| Integration and restructuring costs | | | (1,357 | ) | | | (108 | ) | | | (134 | ) |
| Write-down of goodwill and other intangible assets | | | (32,581 | ) | | | — | | | | — | |
| Operating (loss)/profit before tax | | | (40,667 | ) | | | 9,832 | | | | 9,186 | |
The performance of each of the divisions is reviewed on pages 35 to 52.
Risk-weighted assets of each division were as follows:
| | | Basel II | | | Basel II | | | Basel I | |
| | | 31 December 2008 | | | 1 January 2008 | | | 31 December 2007 | |
| | | £bn | | | £bn | | | £bn | |
| Global Markets | | | | | | | | | |
| Global Banking & Markets | | | 278.5 | | | | 211.9 | | | | 188.7 | |
| Global Transaction Services | | | 19.6 | | | | 16.8 | | | | 15.4 | |
| Total Global Markets | | | 298.1 | | | | 228.7 | | | | 204.1 | |
| Regional Markets | | | | | | | | | | | | |
| UK Retail & Commercial Banking | | | 152.5 | | | | 153.1 | | | | 179.0 | |
| US Retail & Commercial Banking | | | 78.0 | | | | 53.8 | | | | 57.1 | |
| Europe & Middle East Retail & Commercial Banking | | | 30.9 | | | | 30.3 | | | | 36.7 | |
| Asia Retail & Commercial Banking | | | 6.4 | | | | 4.9 | | | | 3.3 | |
| Total Regional Markets | | | 267.8 | | | | 242.1 | | | | 276.1 | |
| RFS Holdings minority interest | | | 118.0 | | | | 147.4 | | | | 119.0 | |
| Other | | | 11.9 | | | | 15.3 | | | | 9.8 | |
| | | | 695.8 | | | | 633.5 | | | | 609.0 | |
Business reviewcontinued | Business review |
| | 2010 £m | 2009 £m | 2008 £m |
| Impairment losses by division |
| UK Retail | 1,160 | 1,679 | 1,019 |
| UK Corporate | 761 | 927 | 319 |
| Wealth | 18 | 33 | 16 |
| Global Transaction Services | 9 | 39 | 54 |
| Ulster Bank | 1,161 | 649 | 106 |
| US Retail & Commercial | 517 | 702 | 437 |
| Retail & Commercial | 3,626 | 4,029 | 1,951 |
| Global Banking & Markets | 151 | 640 | 522 |
| RBS Insurance | — | 8 | 42 |
| Central items | 3 | 1 | (19) |
| Core | 3,780 | 4,678 | 2,496 |
| Non-Core | 5,476 | 9,221 | 4,936 |
| | 9,256 | 13,899 | 7,432 |
| Reconciling item: | | | |
| RFS Holdings minority interest | — | — | 7 |
| Group | 9,256 | 13,899 | 7,439 |
| | 2010 % | 2009 % | 2008 % |
| Net interest margin by division |
| UK Retail | 3.91 | 3.59 | 3.58 |
| UK Corporate | 2.51 | 2.22 | 2.40 |
| Wealth | 3.37 | 4.38 | 4.51 |
| Global Transaction Services | 6.73 | 9.22 | 8.25 |
| Ulster Bank | 1.84 | 1.87 | 1.89 |
| US Retail & Commercial | 2.85 | 2.37 | 2.68 |
| Retail & Commercial | 3.14 | 2.89 | 3.00 |
| Global Banking & Markets | 1.05 | 1.38 | 1.34 |
| Non-Core | 1.16 | 0.69 | 0.87 |
| | | | |
| Group | 2.06 | 1.83 | 2.12 |
| | 2010 | 2009 | 2008 |
| Risk-weighted assets by division | £bn | £bn | £bn |
| UK Retail | 48.8 | 51.3 | 45.7 |
| UK Corporate | 81.4 | 90.2 | 85.7 |
| Wealth | 12.5 | 11.2 | 10.8 |
| Global Transaction Services | 18.3 | 19.1 | 17.4 |
| Ulster Bank | 31.6 | 29.9 | 24.5 |
| US Retail & Commercial | 57.0 | 59.7 | 63.9 |
| Retail & Commercial | 249.6 | 261.4 | 248.0 |
| Global Banking & Markets | 146.9 | 123.7 | 151.8 |
| Other | 18.0 | 9.4 | 7.1 |
| Core | 414.5 | 394.5 | 406.9 |
| Non-Core | 153.7 | 171.3 | 170.9 |
| Group before benefit of Asset Protection Scheme | 568.2 | 565.8 | 577.8 |
| Benefit of Asset Protection Scheme | (105.6) | (127.6) | — |
| Group before RFS Holdings minority interest | 462.6 | 438.2 | 577.8 |
| RFS Holdings minority interest | 2.9 | 102.8 | 118.0 |
| Group | 465.5 | 541.0 | 695.8 |
Business reviewcontinued | Business review |
Employee numbers at 31 December
(full time equivalents in continuing operations rounded to the nearest hundred)
| | 2010 | 2009 | 2008 |
| UK Retail | 23,800 | 25,500 | 28,400 |
| UK Corporate | 13,100 | 12,300 | 13,400 |
| Wealth | 5,200 | 4,600 | 5,200 |
| Global Transaction Services | 2,600 | 3,500 | 3,900 |
| Ulster Bank | 4,200 | 4,500 | 5,400 |
| US Retail & Commercial | 15,700 | 15,500 | 16,200 |
| Retail & Commercial | 64,600 | 65,900 | 72,500 |
| Global Banking & Markets | 18,700 | 17,900 | 17,500 |
| RBS Insurance | 14,500 | 13,900 | 14,500 |
| Central items | 4,700 | 4,200 | 4,300 |
| Core | 102,500 | 101,900 | 108,800 |
| Non-Core | 6,900 | 15,100 | 19,000 |
| | 109,400 | 117,000 | 127,800 |
| Business services | 38,800 | 43,100 | 46,600 |
| Integration | 300 | 500 | 900 |
| RFS Holdings minority interest | — | 300 | 200 |
| Group | 148,500 | 160,900 | 175,500 |
Business reviewcontinued | Business review |
UK Retail
| | 2010 | 2009 | 2008 |
| | £m | £m | £m |
| Net interest income | 4,078 | 3,452 | 3,187 |
| Net fees and commissions | 1,160 | 1,320 | 1,577 |
| Other non-interest income | 252 | 309 | 358 |
| Non-interest income | 1,412 | 1,629 | 1,935 |
| Total income | 5,490 | 5,081 | 5,122 |
| Direct expenses | | | |
| - staff | (778) | (845) | (924) |
| - other | (474) | (453) | (548) |
| Indirect expenses | (1,621) | (1,741) | (1,724) |
| | (2,873) | (3,039) | (3,196) |
| Insurance net claims | (85) | (134) | (184) |
| Impairment losses | (1,160) | (1,679) | (1,019) |
| Operating profit | 1,372 | 229 | 723 |
| | | | |
| Analysis of income by product | | | |
| Personal advances | 993 | 1,192 | 1,244 |
| Personal deposits | 1,102 | 1,349 | 2,037 |
| Mortgages | 1,984 | 1,214 | 500 |
| Bancassurance | 314 | 380 | 401 |
| Cards | 962 | 869 | 831 |
| Other | 135 | 77 | 109 |
| Total income | 5,490 | 5,081 | 5,122 |
| | | | |
| Analysis of impairment by sector | | | |
| Mortgages | 177 | 124 | 31 |
| Personal | 682 | 1,023 | 568 |
| Cards | 301 | 532 | 420 |
| Total impairment losses | 1,160 | 1,679 | 1,019 |
| | | | |
Loan impairment charge as % of gross customer loans and advances (excluding reverse repurchase agreements) by sector | | | |
| Mortgages | 0.2% | 0.1% | — |
| Personal | 5.8% | 7.5% | 3.7% |
| Cards | 4.9% | 8.6% | 6.7% |
| | 1.1% | 1.6% | 1.1% |
| | | | |
| Performance ratios | | | |
Return on equity (1) | 18.0% | 3.0% | 11.1% |
| Net interest margin | 3.91% | 3.59% | 3.58% |
| Cost:income ratio | 52% | 60% | 62% |
Adjusted cost:income ratio (2) | 53% | 61% | 65% |
| | | | |
| | £bn | £bn | £bn |
| Capital and balance sheet | | | |
| Loans and advances to customers (gross) | | | |
| - mortgages | 90.6 | 83.2 | 72.2 |
| - personal | 11.7 | 13.6 | 15.3 |
| - cards | 6.1 | 6.2 | 6.3 |
| | 108.4 | 103.0 | 93.8 |
| Customer deposits (excluding bancassurance) | 96.1 | 87.2 | 78.9 |
| Assets under management (excluding deposits) | 5.7 | 5.3 | 5.7 |
| Risk elements in lending | 4.6 | 4.6 | 3.8 |
| Loan:deposit ratio (excluding repos) | 110% | 115% | 116% |
| Risk-weighted assets | 48.8 | 51.3 | 45.7 |
Notes:
| (1) | Divisional return on equity is based on divisional operating profit after tax divided by average notional equity (based on 9% of the monthly average of divisional RWAs, adjusted for capital deductions). |
| (2) | Adjusted cost:income ratio is based on total income after netting insurance claims, and operating expenses. |
Business reviewcontinued | Business review |
Business reviewUK Retail continued
Global Markets – Global Banking & Markets
| | | 2008 | | | 2007 | | | 2006 | |
| | | | £m | | | | £m | | | | £m | |
| Net interest income from banking activities | | | 3,894 | | | | 1,303 | | | | 1,547 | |
| Funding costs of rental assets | | | (404 | ) | | | (495 | ) | | | (519 | ) |
| Net interest income | | | 3,490 | | | | 808 | | | | 1,028 | |
| Net fees and commissions receivable | | | 1,288 | | | | 1,198 | | | | 859 | |
| Income from trading activities | | | (8,098 | ) | | | 1,789 | | | | 2,341 | |
| Other operating income | | | 800 | | | | 3,024 | | | | 2,476 | |
| Non-interest income | | | (6,010 | ) | | | 6,011 | | | | 5,676 | |
| Total income | | | (2,520 | ) | | | 6,819 | | | | 6,704 | |
| Direct expenses | | | | | | | | | | | | |
| – staff costs | | | 2,687 | | | | 2,134 | | | | 2,000 | |
| – other | | | 1,441 | | | | 561 | | | | 402 | |
| – operating lease depreciation | | | 224 | | | | 404 | | | | 406 | |
| | | | 4,352 | | | | 3,099 | | | | 2,808 | |
| Impairment | | | 3,643 | | | | 67 | | | | 85 | |
| Contribution | | | (10,515 | ) | | | 3,653 | | | | 3,811 | |
| | | £bn | | | £bn | | | £bn | |
| Loans and advances | | | 354.3 | | | | 254.1 | | | | 125.7 | |
| Reverse repos | | | 96.1 | | | | 308.9 | | | | 114.5 | |
| Securities | | | 163.2 | | | | 239.5 | | | | 109.1 | |
| Cash and eligible bills | | | 26.1 | | | | 26.9 | | | | 7.5 | |
| Other assets | | | 52.2 | | | | 44.5 | | | | 24.8 | |
| Total third party assets (excluding derivatives mark to market) | | | 691.9 | | | | 873.9 | | | | 381.6 | |
| Net derivative assets (after netting) | | | 146.0 | | | | 64.1 | | | | 17.9 | |
| Customer deposits (excluding repos) | | | 105.0 | | | | 106.7 | | | | 44.6 | |
| Non-performing loans | | | 6.2 | | | | 1.0 | | | | 0.5 | |
20082010 compared with 2007
2009Global Banking & Markets (GBM) contribution fellOperating profit recovered strongly from £3,653 million in 2007 to a loss of £10,515 million. This sharp decline reflected the effect of the market turmoil on the enlarged business which severely affected the division’s resultslow levels recorded in 2008 with a particularly adverse impact in the fourth quarter. GBM incurred £5,776and 2009 to £1,372 million. Profit before impairments was up £624 million of losses, write-downs or reserves largely on credit trading, counterparty risk (including CDPCs), counterparty failure (notably Lehman33% and Madoff) and sovereign eventsimpairments fell by £519 million as the effects of the down-turn widened. In addition, losses on previously identified credit market exposures totalled £7,781 million, including impairments of £466 million on reclassified assets. These were only partly offset by gains on the fair value of own debt.economic environment continued to recover.
After credit market write-downsThe division has continued to focus in 2010 on growing secured lending while at the same time building customer deposits, thereby reducing the Group’s reliance on wholesale funding. Loans and one-off items and trading asset write-down, GBM recorded negative income of £2,520 million. Total income before credit market write-downs and one-off items (£6,958 million) and trading asset write-downs (£5,776 millions) was £10,214 million, up 19% from 2007. The increase reflects good performances in a number of businesses, most notably in rates and currencies and the inclusion of the ABN AMRO businesses for a full twelve months. Direct costs were up by 40%advances to customers grew 5%, with a change in mix from unsecured to secured as the inclusion of the acquired businesses of ABN AMRO for a full year outweighing reduced bonus payments. Credit impairments rose sharply from a very low level, £67 million,Group actively sought to £3,643 million, resulting in a 2008 operating loss of £10,515 million.improve its risk profile. Mortgage balances grew by 9% while unsecured lending contracted by 10%.
| · | Mortgage growth was due to good retention of existing customers and new business, the majority of which comes from the existing customer base. Gross mortgage lending market share remained broadly in line with 2009 at 12%, with the Group on track to meet its Government target on net mortgage lending. |
| · | Customer deposits grew 10% on 2009, reflecting the strength of the UK Retail customer franchise, which outperformed the market in an increasingly competitive environment. Savings balances grew by £8 billion or 13% with 1.8 million accounts opened, outperforming the market total deposit growth of 3%. Personal current account balances increased by 3% on 2009. |
Net interest income grewincreased significantly by £2,68218% to £4,078 million, driven by strong balance sheet growth and repricing. Net interest margin improved by 32 basis points to £3,490 million,3.91%, with the rates business benefiting from the declining interest rate environment. Non-interest income reduced by £12,021 million to negative income of £6,010 million. Fees and commissions increased mainly as a result of the inclusion of the ABN AMRO businesses for a full twelve monthswidening asset margins partially offset by contracting liability margins in the face of a declinecompetitive deposit market.
Non-interest income declined 13% to £1,412 million, principally reflecting the restructuring of current account overdraft fees in origination volumes. Incomethe final quarter of 2009.
Expenses decreased by 5%, with the cost:income ratio (net of insurance claims) improving from trading activities fell from £1,789 million61% to negative income of £8,09853%.
| · | Direct staff costs declined by 8%, largely driven by a clear management focus on process re-engineering enabling a 7% reduction in headcount. |
| · | RBS continues to progress towards a more convenient, lower cost operating model, with over 4.8 million active users of online banking and a record share of new sales achieved through direct channels. More than 7.8 million accounts have switched to paperless statements and 276 branches now utilise automated cash deposit machines. |
Impairment losses decreased 31% to £1,160 million primarily as a result of trading asset write-downs and credit market exposures. Other operating income fell sharply from £3,024 million to £800 million, reflecting losses incurred on European loan sales and much reduced gains on other portfolio assets, partially offset by the gain on sale of Angel Trains of £570 million.recovery in the economic environment.
By business line, the| · | The mortgage impairment charge was £177 million (2009 - £124 million) on a total book of £91 billion. Mortgage arrears rates marginally increased in 2010 but remain below the industry average, as reported by the Council of Mortgage Lenders. Repossessions showed only a small increase on 2009, as the Group continues to support customers facing financial difficulties. |
| · | The unsecured lending impairment charge was £983 million (2009 - £1,555 million) on a total book of £18 billion. |
Risk-weighted assets decreased by 5% to £48.8 billion, with lower unsecured lending, improving portfolio credit metrics and currencies business achieved a particularly strong performance in 2008, with high volumes of customer activity and flow trading resulting in an increase in income from rates trading to £3,543 million andsmall procyclicality benefits more than offsetting growth in currencies income to £1,697 million. The Sempra Commodities joint venture performed ahead of expectations in the nine months since its formation, with GBM’s commodities income reaching £778 million for the year.mortgages.
Business reviewcontinued | Business review |
UK Retail continued
Equities improved slightly primarily2009 compared with 2008
Operating profit of £229 million was £494 million lower than in 2008. Profit before impairments was up £166 million or 10%, but impairments rose by £660 million as a resultthe economic environment deteriorated, albeit with signs of the inclusion of a full year of ABN AMRO related businesses. However, reduced customer flow and also experienced losses on illiquid trading positions as markets deteriorated rapidly partially offset this increase.
In a reduced market for debt origination, credit markets improved its market positions in a number of key areas such as international bond issuance. Results, however, were severely affected by the continuing market weakness, particularlyconditions stabilising in the second half of the year.
Asset and portfolio management income remained resilient, but some losses were incurred, includingThe division has focused in 2009 on capital and credit exposure management.
Credit impairments increased sharplygrowing secured lending to £3,643 million, including £466 millionmeet its Government targets while at the same time building customer deposits, thereby reducing the Group's reliance on assets reclassified out of the held for trading category following the amendments to IAS 39 issued in October. Of the total impairment charge, £2,938 million was incurred in the fourth quarter of 2008, including £918 million relating to the Group’s exposure to Lyondell Basell.
GBM’s total third party assets were reduced by £182 billion to £692 billion at 31 December 2008, a reduction of 21% from a year earlier, or 31% at constant exchange rates. Within this total, loanswholesale funding. Loans and advances to customers grew 10%, with a change in mix from unsecured to secured as the Group sought actively to reduce its risk profile, with 15% growth in mortgage lending and an 8% reduction in unsecured lending.
| · | Mortgage growth was due to good retention of existing customers and new business sourced predominantly from the existing customer base. Gross mortgage lending market share increased to 12% from 7% in 2008, with the Group on track to exceed its Government targets on net lending by £3 billion. |
| · | Customer deposits grew 11% on 2008 reflecting the strength of the UK Retail customer franchise, which outperformed the market in an increasingly competitive environment. Savings balances grew by £6 billion or 11% and account acquisition saw a 20% increase, with 2.2 million accounts opened. Personal current account balances increased by 12% on 2008 with a 3% growth in accounts to 12.8 million. |
Net interest income increased significantly by 8% to £3,452 million, driven by strong balance sheet growth. Net interest margin was flat at 3.59%, with decreasing liability margins in the face of stiff competition for deposits offsetting wider asset margins. The growth in mortgages and the reduction in higher margin unsecured balances also had a negative impact on the blended net interest margin.
Non-interest income declined 16% to £1,629 million, principally reflecting the withdrawal of the single premium payment protection insurance product and the restructuring of current account overdraft fees in the final quarter of 2009, with the annualised impact of the overdraft fee restructuring further affecting income in 2010. The weak economic environment presented little opportunity in 2009 to grow credit card, private banking and bancassurance fees.
Expenses decreased by 5%, with the cost:income ratio improving from 62% to 60%.
| · | Direct staff costs declined by 9%, as the division benefited from strong cost control, a focus on process re-engineering and a 10% reduction in headcount. |
| · | RBS continues to progress towards a more convenient, lower cost operating model, with over 4 million active users of online banking and a record share of new sales achieved through direct channels. More than 5.5 million accounts have switched to paperless statements and 254 branches now utilise automated cash deposit machines. |
Impairment losses increased 65% to £1,679 million reflecting the deterioration in the economic environment, and its impact on customer finances.
| · | The mortgage impairment charge was £124 million (2008 - £31 million) on a total book of £83.2 billion. Mortgage arrears rates stabilised in the second half of 2009 and remain well below the industry average, as reported by the Council of Mortgage Lenders. Repossessions show only a small increase on 2008, as the Group continues to support customers facing financial difficulties. |
| · | The unsecured lending impairment charge was £1,555 million (2008 - £988 million) on a book of £19.8 billion. Industry benchmarks for cards arrears showed a slightly improving trend in the final quarter of 2009, which is consistent with the Group's experience. RBS continues to perform better than the market on arrears. |
Risk-weighted assets increased by 12% to £51.3 billion due to higher lending and the upward pressure from procyclicality, more than offsetting the adoption of a through-the-cycle loss given default approach for mortgages.
Business reviewcontinued | Business review |
UK Corporate
| | 2010 | 2009 | 2008 |
| | £m | £m | £m |
| Net interest income | 2,572 | 2,292 | 2,448 |
| Net fees and commissions | 952 | 858 | 829 |
| Other non-interest income | 371 | 432 | 460 |
| Non-interest income | 1,323 | 1,290 | 1,289 |
| Total income | 3,895 | 3,582 | 3,737 |
| Direct expenses | | | |
| - staff | (778) | (753) | (801) |
| - other | (359) | (260) | (318) |
| Indirect expenses | (534) | (517) | (518) |
| | (1,671) | (1,530) | (1,637) |
| Impairment losses | (761) | (927) | (319) |
| Operating profit | 1,463 | 1,125 | 1,781 |
| | | | |
| Analysis of income by business | | | |
| Corporate and commercial lending | 2,598 | 2,131 | 2,094 |
| Asset and invoice finance | 617 | 501 | 312 |
| Corporate deposits | 728 | 986 | 1,266 |
| Other | (48) | (36) | 65 |
| Total income | 3,895 | 3,582 | 3,737 |
| | | | |
| Analysis of impairment by sector | | | |
| Banks and financial institutions | 20 | 15 | 9 |
| Hotels and restaurants | 52 | 98 | 25 |
| House building and construction | 131 | 106 | 42 |
| Manufacturing | 1 | 51 | 14 |
| Other | 127 | 150 | 53 |
| Private sector education, health, social work, recreational and community services | 30 | 59 | 15 |
| Property | 245 | 259 | 24 |
| Wholesale and retail trade, repairs | 91 | 76 | 37 |
| Asset and invoice finance | 64 | 113 | 100 |
| Total impairment losses | 761 | 927 | 319 |
| | | | |
Loan impairment charge as % of gross customer loans and advances (excluding reverse repurchase agreements) by sector | | | |
| Banks and financial institutions | 0.3% | 0.2% | 0.2% |
| Hotels and restaurants | 0.8% | 1.5% | 0.4% |
| House building and construction | 2.9% | 2.5% | 0.8% |
| Manufacturing | — | 0.9% | 0.3% |
| Other | 0.4% | 0.5% | 0.1% |
| Private sector education, health, social work, recreational and community services | 0.3% | 0.9% | 0.2% |
| Property | 0.8% | 0.8% | 0.1% |
| Wholesale and retail trade, repairs | 0.9% | 0.7% | 0.4% |
| Asset and invoice finance | 0.6% | 1.3% | 1.2% |
| | 0.7% | 0.8% | 0.3% |
| | | | |
| Performance ratios | | | |
Return on equity (1) | 12.1% | 9.4% | 15.9% |
| Net interest margin | 2.51% | 2.22% | 2.40% |
| Cost:income ratio | 43% | 43% | 44% |
Note:
| (1) | Divisional return on equity is based on divisional operating profit after tax divided by average notional equity (based on 9% of the monthly average of divisional RWAs, adjusted for capital deductions). |
Business reviewcontinued | Business review |
UK Corporate continued
| | 2010 | 2009 | 2008 |
| | £bn | £bn | £bn |
| Capital and balance sheet | | | |
| Total third party assets | 114.6 | 114.9 | 121.0 |
| Loans and advances to customers (gross) | | | |
| - banks and financial institutions | 6.1 | 6.3 | 5.4 |
| - hotels and restaurants | 6.8 | 6.7 | 6.1 |
| - housebuilding and construction | 4.5 | 4.3 | 5.2 |
| - manufacturing | 5.3 | 5.9 | 5.3 |
| - other | 31.0 | 29.9 | 38.1 |
| - private sector education, health, social work, recreational and community services | 9.0 | 6.5 | 7.4 |
| - property | 29.5 | 33.0 | 31.8 |
| - wholesale and retail trade, repairs | 9.6 | 10.2 | 9.1 |
| - asset and invoice finance | 9.9 | 8.8 | 8.5 |
| | 111.7 | 111.6 | 116.9 |
| Customer deposits | 100.0 | 87.8 | 82.0 |
| Risk elements in lending | 4.0 | 2.3 | 1.3 |
| Loan:deposit ratio (excluding repos) | 110% | 126% | 142% |
| Risk-weighted assets | 81.4 | 90.2 | 85.7 |
2010 compared with 2009
Operating profit grew by £338 million, 30%, compared with 2009, driven by strong income growth and significantly lower impairments, partially offset by higher costs.
UK Corporate performed strongly in the deposit market, with customer deposit balance growth of £12 billion contributing to a 16 percentage point improvement in the loan to deposit ratio in 2010. While customer lending increased only marginally (with gross lending largely offset by customer deleveraging) net interest income rose by £280 million, 12%, and net interest margin rose by 29 basis points driven primarily by the good progress made on loan repricing.
Non-interest income increased 3% reflecting strong refinancing levels and increased operating lease activity, partially offset by lower sales of financial market products.
Total costs increased 9% (£141 million) or 5% excluding the OFT penalty in 2010, legal recovery in 2009 and the normalisation of staff compensation phasing.
Impairments were £354 billion,18% lower, primarily as a result of higher charges taken during the first half of 2009 to reflect potential losses in the portfolio not yet specifically identified.
Return on equity increased from 9.4% to 12.1%, reflecting higher operating profit and lower RWAs as a result of improved risk metrics.
2009 compared with 2008
Operating profit of £1,125 million was £656 million lower than in 2008, largely due to an increase of 14% at constant exchange rates. This increase was more than offset by significant reductions£608 million in reverse repos and securities holdings, both of which have been managed down over the course of the year. Net derivative assets totalled £146 billion, compared with £64 billion at the end of 2007.impairments.
Business reviewNet interest margin levels were rebuilt during the second half as asset pricing was amended to reflect increased funding and credit costs. For the year as a whole net interest margin was 18 basis points lower than in 2008, reflecting higher funding costs and continued
competitive pricing for deposits.
Although GBM took stepsGross new lending to reduce underlying risk-weighted assets, these measures were masked by the impactcustomers remained resilient in 2009, with a noticeable acceleration of foreign exchange movements and of Basel II pro-cyclicality, with the result that RWAs at 31 December 2008 totalled £279 billion, up 31% from a year earlier, or 14% at constant exchange rates.
GBM achieved strong performances in many of its businesses in 2007, with particularly strong growth in interest rate and currency trading activities, but financial results were held back by challenging credit market conditionslending activity in the second half of the year. Contribution was £3,653 million, 4% lower than 2006’s record result.However, as customers have deleveraged and turned increasingly to capital markets, repayments have accelerated even more sharply. Loans and advances to customers, therefore, declined by 5% to £111.6 billion.
TotalInitiatives aimed at increasing customer deposits have been successful, with balance growth of 7%, although margins declined as a result of increased competition for balances.
Non-interest income was flat, with stable fee income from refinancing and structuring activity.
A reduction in costs of £6,819 million7% was 2% higher than in 2006, with £394 milliondriven by lower staff expenses as a result of the inclusionGroup's restructuring programme, together with restraint on discretionary spending levels.
Impairment losses increased substantially reflecting both a rise in the number of 76 dayscorporate delinquencies requiring a specific impairment and a higher charge to recognise losses not yet specifically identified.
Risk-weighted assets grew 5% despite the fall in customer lending, reflecting the impact of GBM related ABN AMRO businesses. Whilst many partsprocyclicality, which was most pronounced in the first half of GBM grew strongly, there were write-downs of our subprime related2009.
Business reviewcontinued | Business review |
Wealth
| | 2010 | 2009 | 2008 |
| | £m | £m | £m |
| Net interest income | 609 | 663 | 578 |
| Net fees and commissions | 376 | 363 | 405 |
| Other non-interest income | 71 | 83 | 76 |
| Non-interest income | 447 | 446 | 481 |
| Total income | 1,056 | 1,109 | 1,059 |
| Direct expenses | | | |
| - staff | (382) | (357) | (377) |
| - other | (142) | (144) | (178) |
| Indirect expenses | (210) | (155) | (140) |
| | (734) | (656) | (695) |
| Impairment losses | (18) | (33) | (16) |
| Operating profit | 304 | 420 | 348 |
| | | | |
| Analysis of income | | | |
| Private banking | 857 | 916 | 819 |
| Investments | 199 | 193 | 240 |
| Total income | 1,056 | 1,109 | 1,059 |
| | | | |
| Performance ratios | | | |
Return on equity (1) | 18.9% | 30.3% | 27.3% |
| Net interest margin | 3.37% | 4.38% | 4.51% |
| Cost:income ratio | 70% | 59% | 66% |
| | | | |
| | £bn | £bn | £bn |
| Capital and balance sheet | | | |
| Loans and advances to customers (gross) | | | |
| - mortgages | 7.8 | 6.5 | 5.3 |
| - personal | 6.7 | 4.9 | 5.0 |
| - other | 1.6 | 2.3 | 2.1 |
| | 16.1 | 13.7 | 12.4 |
| Customer deposits | 36.4 | 35.7 | 34.1 |
| Assets under management (excluding deposits) | 32.1 | 30.7 | 34.7 |
| Risk elements in lending | 0.2 | 0.2 | 0.1 |
| Loan:deposit ratio (excluding repos) | 44% | 38% | 36% |
| Risk-weighted assets | 12.5 | 11.2 | 10.8 |
| (1) | Divisional return on equity is based on divisional operating profit after tax divided by average notional equity (based on 9% of the monthly average of divisional RWAs, adjusted for capital deductions). |
Business reviewcontinued | Business review |
2010 compared with 2009
2010 operating profit fell by 28% driven by lower net interest income and leveraged finance positions and additional provisions in response to the weakening credit profile of certain financial guarantors. These losses were partiallyhigher expenses, partly offset by a reduction45% decline in impairments in the carryingyear.
Income declined by 5% primarily due to lower net interest income. Strong lending and investment income was offset by the impact of a competitive deposit market.
Expenses grew by 12% to £734 million. Direct expenses were up 5%, £23 million reflecting additional strategic investment. Indirect expenses increased by £55 million reflecting a change in allocation of Business Services costs.
Assets under management grew by 5% largely through improving market conditions. On a constant currency basis, assets fell 2% with valuation gains being offset by client losses in the international businesses, resulting from the private banker attrition previously experienced.
2009 compared with 2008
Wealth produced strong growth in operating profit, up 21% to £420 million, reflecting the increased value of our own debt andthe division's healthy deposit base in an increasingly competitive market for funding. Deposit balances increased by a gain of £712 million realised on5% from 2008, though the sale of Southern Water.deposit market remains highly competitive.
The strength of GBM and the successful diversification of its product capabilities resultedTotal income was up 5% (1% in a continuation of theconstant currency terms), with strong growth we have achieved in Asianet interest income, up 15% (12% in constant currency terms) reflecting the increased internal pricing applied to Wealth's deposit base. This was offset by a marked decrease in investment income year on year as assets under management decreased by 12% (8% at constant exchange rates) during 2009, with investors turning to more liquid assets and continental Europe in recent years. In Asia we have now established a solid platform, with good product capabilitiesaway from longer term investments.
Loans and client relationships. In 2007 this resulted in strong Asian income growth, with outstanding growth in our activities in China and Japan. In Europe, income grew considerably, with particularly good resultsadvances increased by 10% over 2008, primarily in the Nordic regionUK. Lending margins improved, particularly for mortgages, and in the Iberian Peninsula, where GBM further expanded its strong position in the provision of financing and riskcredit metrics for new business remain satisfactory.
Expenses were down 6% (10% lower on a constant currency basis), reflecting a rigorous focus on cost management, services to corporates and financial institutions. Income in the UK grew strongly, while results in North America declinedwith staff costs decreasing by 5% as a result of credit market conditions affecting GBM’s asset-backed and structured credit businesses.planned headcount reduction. The cost:income ratio improved from 66% to 59%.
Net interestImpairments increased by £17 million over 2008 reflecting some isolated difficulties in the UK and offshore mortgage books (representing mortgages for second properties for expatriates). Provisions as a percentage of lending to customers increased slightly to 0.25%.
Business reviewcontinued | Business review |
Global Transaction Services
| | 2010 | 2009 | 2008 |
| | £m | £m | £m |
| Net interest income | 974 | 912 | 937 |
| Non-interest income | 1,587 | 1,575 | 1,494 |
| Total income | 2,561 | 2,487 | 2,431 |
| Direct expenses | | | |
| - staff | (411) | (371) | (362) |
| - other | (159) | (161) | (149) |
| Indirect expenses | (894) | (943) | (864) |
| | (1,464) | (1,475) | (1,375) |
| Impairment losses | (9) | (39) | (54) |
| Operating profit | 1,088 | 973 | 1,002 |
| | | | |
| Analysis of income by product | | | |
| Domestic cash management | 818 | 805 | 795 |
| International cash management | 801 | 734 | 722 |
| Trade finance | 309 | 290 | 241 |
| Merchant acquiring | 451 | 505 | 527 |
| Commercial cards | 182 | 153 | 146 |
| Total income | 2,561 | 2,487 | 2,431 |
| | | | |
| Performance ratios | | | |
Return on equity (1) | 42.8% | 42.2% | 44.6% |
| Net interest margin | 6.73% | 9.22% | 8.25% |
| Cost:income ratio | 57% | 59% | 57% |
| | | | |
| | £bn | £bn | £bn |
| Capital and balance sheet | | | |
| Total third party assets | 25.2 | 18.4 | 22.2 |
| Loans and advances | 14.4 | 12.7 | 14.8 |
| Customer deposits | 69.9 | 61.8 | 61.8 |
| Risk elements in lending | 0.1 | 0.2 | 0.1 |
| Loan:deposit ratio (excluding repos) | 21% | 21% | 25% |
| Risk-weighted assets | 18.3 | 19.1 | 17.4 |
| (1) | Divisional return on equity is based on divisional operating profit after tax divided by average notional equity (based on 9% of the monthly average of divisional RWAs, adjusted for capital deductions). |
Business reviewcontinued | Business review |
2010 compared with 2009
Operating profit increased 12%, or 10% on a constant foreign exchange basis, driven by a robust income fellperformance (which has more than compensated for the loss of Global Merchant Services (GMS) income), good cost control and lower impairments. Adjusting for the disposal operating profit increased 21%.
For the eleven months before disposal, GTS booked income of £451 million and total expenses of £244 million for GMS, generating an operating profit of £207 million.
Income was up 3%, or 6% excluding GMS, reflecting higher deposit volumes in the International Cash Management business, growth in the Trade Finance business and improved Commercial Card transaction volumes.
Expenses were broadly in line with 2009, at £1,464 million, as increased investment in front office and support infrastructure was mitigated by 21%tight management of business costs.
Third party assets increased by £6.8 billion, or £7.6 billion excluding GMS, as Yen clearing activities were brought in-house and loans and advances increased.
2009 compared with 2008
Operating profit declined by 3%, or 6% at constant foreign exchange rates, largely reflecting pressure on deposit income. The attrition of deposit balances experienced in the first half was reversed in the second, but margins remain compressed due to £808 million.both a very competitive deposit market as well as the low rate environment.
Customer deposit balances at £61.8 billion were flat on the previous year, with growth in the UK and international business offset by weaker US domestic balances. At constant exchange rates balances were up 3%. Loans and advances were down 14% (11% in constant currency terms) due to customers, excluding reverse repos,reduced overdraft utilisation and lower trade volumes.
International payment fees increased by £128.4 billion as a result of the continued expansion of our customer base outside the UK and the inclusion of GBM related ABN AMRO businesses (£102.7 billion). Customer deposits increased by £62.1 billion, with £48.3 billion from GBM related ABN AMRO businesses.
Net fee income rose by 39% to £1,198 million, reflecting our top tier position in arranging, structuring and distributing large scale financings and the inclusion of GBM related ABN AMRO businesses (£151 million). We achieved particularly strong growth in non-US loan markets.
Income from trading activities declined by £552 million, 24% to £1,789 million, with GBM related ABN AMRO businesses contributing income of £285 million. Strong performances in interest rate and currency trading activities were supplemented by good growth in our broadening product range, including equity derivatives and retail investor products. However, in credit markets, write-downs reflecting the weakening of the US housing market led to a sharp fall in income.
Other operating2%, or 11% at constant exchange rates, while trade finance income increased by £548 million, 22%20%, or 8% at constant exchange rates, with improved penetration in the Asia-Pacific region. Merchant acquiring income, however, declined by 4%, or 9% at constant exchange rates, as consumers continued to £3,024 million, including the successful sale of Southern Water which concluded during the second half. The majority of our remaining private equity portfolio has been sold into a fund, managed by RBS, thereby improving capital efficiency while offering more predictable and stable returns.switch to lower margin debit card transactions in preference to using credit cards.
DirectExpenses were up 7% in headline terms but flat in constant currency terms, as cost savings and efficiencies helped to mitigate the impact of investment in infrastructure. Staff expenses increased by 10% to £3,099 million. We continued to investwere up 2%, but 2% lower in expanding our geographical footprint, our infrastructure and our product range.constant currency terms, with headcount down 5%. The cost:income ratio was 59%, a deterioration of 2.7 percentage points or 1.9 percentage points in constant currency terms.
Portfolio credit risk remained stableImpairment losses were £39 million, down £15 million versus 2008. Overall defaults remain modest at 0.3% of loans and impairment losses declined to £67 million in 2007, with no deterioration in overall corporate credit quality. The liquidity and profitability of our corporate customers remains generally strong.advances.
Total assets increased to £873.9 billion, reflecting the inclusion of GBM related ABN AMRO businesses (£400.9 billion) and growth in derivative assets (mostly rates and currencies) accompanied by a corresponding increase in derivative liabilities. The derivatives increase was a result of the strong growth in client-driven interest rate and currency trading activities in a more volatile market environment. Risk-weighted assets increased by 39%, driven by the inclusion of £39.0 billion of risk-weighted assets from GBM related ABN AMRO businesses and careful risk and capital management.
Business review continued
Business reviewcontinued | Business review |
Global Markets – Global Transaction Services
| | | 2008 | | | 2007 | | | 2006 | |
| | | | £m | | | | £m | | | | £m | |
| Net interest income | | | 909 | | | | 595 | | | | 449 | |
| Non-interest income | | | 1,563 | | | | 1,183 | | | | 1,081 | |
| Total income | | | 2,472 | | | | 1,778 | | | | 1,530 | |
| Direct expenses | | | | | | | | | | | | |
| – staff costs | | | 392 | | | | 271 | | | | 231 | |
| – other | | | 202 | | | | 178 | | | | 109 | |
| | | | 594 | | | | 449 | | | | 340 | |
| Impairment | | | 60 | | | | 14 | | | | 4 | |
| Contribution | | | 1,818 | | | | 1,315 | | | | 1,186 | |
Ulster Bank
| | 2010 | 2009 | 2008 |
| | £m | £m | £m |
| Net interest income | 761 | 780 | 708 |
| Net fees and commissions | 156 | 228 | 238 |
| Other non-interest income | 58 | 26 | 93 |
| Non-interest income | 214 | 254 | 331 |
| Total income | 975 | 1,034 | 1,039 |
| Direct expenses | | | |
| - staff | (237) | (325) | (330) |
| - other | (74) | (86) | (100) |
| Indirect expenses | (264) | (342) | (285) |
| | (575) | (753) | (715) |
| Impairment losses | (1,161) | (649) | (106) |
| Operating (loss)/profit | (761) | (368) | 218 |
| | | | |
| Analysis of income by business | | | |
| Corporate | 521 | 580 | 618 |
| Retail | 465 | 412 | 396 |
| Other | (11) | 42 | 25 |
| Total income | 975 | 1,034 | 1,039 |
| | | | |
| Analysis of impairment by sector | | | |
| Mortgages | 294 | 74 | 17 |
| Corporate | | | |
| - property | 375 | 306 | 37 |
| - other corporate | 444 | 203 | 7 |
| Other lending | 48 | 66 | 45 |
| Total impairment losses | 1,161 | 649 | 106 |
| | | | |
| Loan impairment charge as % of gross customer loans and advances (excluding reverse repurchase agreements) by sector | | | |
| Mortgages | 1.4% | 0.5% | 0.1% |
| Corporate | | | |
| - property | 6.9% | 3.0% | 0.3% |
| - other corporate | 4.9% | 1.8% | 0.1% |
| Other lending | 3.7% | 2.7% | 2.1% |
| | 3.1% | 1.6% | 0.2% |
| Performance ratios | | | |
Return on equity (1) | (21.0%) | (11.7%) | 8.9% |
| Net interest margin | 1.84% | 1.87% | 1.89% |
| Cost:income ratio | 59% | 73% | 69% |
| | | | |
| | | £bn | | | £bn | | | £bn | |
| Total third party assets | | | 24.0 | | | | 22.5 | | | | 7.4 | |
| Loans and advances | | | 18.6 | | | | 18.7 | | | | 6.6 | |
| Customer deposits | | | 60.9 | | | | 56.8 | | | | 34.2 | |
2008 compared with 2007
Global Transaction Services (GTS) grew income by 39% to £2,472 million and contribution by 38% to £1,818 million for the full year 2008, reflecting the strength and enhanced international capability of its cash management, trade finance and merchant acquiring platforms. The income growth rate was maintained in the second half of the year, despite difficult market conditions. The key driver of this growth has been the acquisition of the ABN AMRO business with the historic RBS business contributing year on year income growth of 5%.
Growth was driven by a strong performance in cash management, in particular international cash management in ABN AMRO. Steady growth was achieved in the RBS UK and US domestic markets. Average customer deposits were higher mitigating the impact of lower interest rates. International overdrafts have been re-priced, reflecting the increased cost of funds and higher risk premia during the second half of the year. Fee income from payment transactions increased strongly, particularly in the US and internationally. The division was successful throughout the year in winning new international cash management mandates from existing RBS Group clients due to the strength of the international payments platform and network.
Trade finance made good progress, with income continuing to grow strongly as the ABN AMRO platform enabled GTS to substantially improve its penetration into the Asia-Pacific market, and has expanded its supply chain finance activities with an enhanced product suite. Margins improved throughout the year reflecting the additional risk premium in the market conditions.
Merchant services and commercial cards delivered growth despite the worsening economic climate. Acquiring transaction volumes were up in the year driven by good growth in online volumes, but weaker consumer confidence in the latter part of the year meant that average transaction values decreased, slowing income growth. Commercial cards income saw strong growth for the full year, driven by higher interchange income particularly in the small and middle markets.
Direct expenses rose by 32% to £594 million, reflecting the full year costs of the ABN AMRO business, historic RBS business costs increased by 10%. The full year cost growth reflected investment in staffing and infrastructure to support GTS’s development.
Impairment losses were £60 million, up from £14 million in 2007, reflecting in particular the downturn in the global economy and some growth in defaults amongst mid-corporates and SMEs.
2007 compared with 2006
Global Transaction Services grew income by 16% to £1,778 million and contribution by 11% to £1,315 million, driven by growth in the Merchant Services business, combined with the enhanced international cash management and trade platforms introduced through the ABN AMRO acquisition.
Revenue growth was evident across all product lines. Cash management growth was the result of increased deposit balances combined with payment fee growth initiatives. Merchant services and commercial cards delivered a 6% increase in income with particularly good growth in the international businesses. This growth has been driven by increased volumes across both debit and credit card transactions.
The Trade finance business benefits materially from the product suite introduced through the ABN AMRO acquisition through improved international capabilities and a global reach. Margins in this business have also begun to see the benefit of improved pricing reflecting country risk premiums.
Direct expenses rose by 32% to £449 million in comparison with 2006, primarily reflecting investment to expand the business. This includes the acquisition of ABN AMRO which incorporates costs directly related to the GTS business.
Impairment losses were £14 million compared with £4 million in 2006.| (1) | Divisional return on equity is based on divisional operating (loss)/profit after tax divided by average notional equity (based on 9% of the monthly average of divisional RWAs, adjusted for capital deductions). |
Business review continued
Regional Markets – UK Retail & Commercial Banking
| | | 2008 | | | 2007 | | | 2006 | |
| | | | £m | | | | £m | | | | £m | |
| Net interest income | | | 6,999 | | | | 6,602 | | | | 6,350 | |
| Net fees and commissions – banking | | | 2,919 | | | | 3,054 | | | | 2,896 | |
| Other non-interest income | | | 1,080 | | | | 1,450 | | | | 1,327 | |
| Non-interest income | | | 3,999 | | | | 4,504 | | | | 4,223 | |
| Total income | | | 10,998 | | | | 11,106 | | | | 10,573 | |
| Direct expenses | | | | | | | | | | | | |
| – staff costs | | | 1,978 | | | | 1,919 | | | | 1,788 | |
| – other | | | 1,193 | | | | 1,076 | | | | 1,082 | |
| | | | 3,171 | | | | 2,995 | | | | 2,870 | |
| Insurance net claims | | | 184 | | | | 518 | | | | 488 | |
| Impairment | | | 1,964 | | | | 1,368 | | | | 1,497 | |
| Contribution | | | 5,679 | | | | 6,225 | | | | 5,718 | |
| | | £bn | | | £bn | | | £bn | |
| Total banking assets | | | 249.4 | | | | 232.8 | | | | 202.4 | |
| Loans and advances to customers – gross | | | | | | | | | | | | |
| – UK Retail Banking | | | 117.5 | | | | 111.0 | | | | 107.4 | |
| – UK Corporate & Commercial Banking | | | 110.4 | | | | 99.3 | | | | 86.1 | |
| – UK Wealth | | | 10.1 | | | | 8.4 | | | | 7.2 | |
| Customer deposits* | | | 186.1 | | | | 189.4 | | | | 179.7 | |
| Investment management assets – excluding deposits | | | 22.5 | | | | 25.8 | | | | 34.5 | |
| Non-performing loans | | | 7.9 | | | | 5.5 | | | | 5.1 | |
*Business reviewcontinued | excluding bancassuranceBusiness review |
Ulster Bank continued| | 2010 | 2009 | 2008 |
| | £bn | £bn | £bn |
| Capital and balance sheet | | | |
| Loans and advances to customers (gross) | | | |
| - mortgages | 21.2 | 16.2 | 18.1 |
| - corporate | | | |
| - property | 5.4 | 10.1 | 10.9 |
| - other corporate | 9.0 | 11.0 | 12.9 |
| - other lending | 1.3 | 2.4 | 2.1 |
| | 36.9 | 39.7 | 44.0 |
| Customer deposits | 23.1 | 21.9 | 24.3 |
| Risk elements in lending | | | |
| - mortgages | 1.5 | 0.6 | 0.3 |
| - corporate | | | |
| - property | 0.7 | 0.7 | 0.5 |
| - other corporate | 1.2 | 0.8 | 0.3 |
| - other lending | 0.2 | 0.2 | 0.1 |
| | 3.6 | 2.3 | 1.2 |
| Loan:deposit ratio (excluding repos) | 152% | 177% | 179% |
| Risk-weighted assets | 31.6 | 29.9 | 24.5 |
UK Retail and Commercial Banking retains an extremely strong franchise and represents the core of the RBS Group. However, the external environment over the next few years will present significant challenges2010 compared with pressure on income2009
Overall performance deteriorated in 2010, largely as a result of very lowan increase in impairment losses of £512 million. Operating profit before impairment increased to £400 million, up 42%, or 50% in constant currency terms, driven by the culmination of a bank-wide cost saving programme during 2010.
Net interest rates, lower fee income and impairment costs likelydecreased by 2%, but increased by 1% on a constant currency basis as actions to increase further.asset margins were largely eroded by tightening deposit margins due to intensive market competition.
Non-interest income was 16% lower, or 14% on a constant currency basis reflecting a non-recurring gain in 2009.
Loans to customers fell by 7%, or 5% in constant currency terms. On 1 July 2010 the division transferred a portfolio of development property assets to the Non-Core division, partially offset by a simultaneous transfer of a portfolio of retail mortgage assets to the core business.
Despite intense competition, customer deposit balances increased by 5%, or 8% in constant currency terms over the year with strong growth across all deposit categories, driven by a focus on improving the bank’s funding profile.
Expenses were 24% lower, 22% lower at constant exchange rates. The business plans to respond to this environment through reducing costs and increasing productivitystrong year-on-year performance in expenses was primarily driven by investing in online service channels, automationan increased focus on active management of activities and re-design of end-to-end processes. The business will tailor the cost of service for different client segments more closely to their value generation.
Wealth management remains a strong growth opportunitybase, and the benefits derived from the business plans to pursue a more consolidated approach to the market through more co-ordination across the multiple brands withrestructuring and cost-saving programme which it currently faces the market, whilst investingcommenced in additional Relationship Managers and platform functionality.
The division will pursue above market growth in customer deposits to improve its funding contribution to the Group, and will diversify its customer lending, reducing its exposure to commercial property.
Business review continued
Regional Markets – UK Retail & Commercial Banking
UK Retail Banking
| | | 2008 | | | 2007 | | | 2006 | |
| | | | £m | | | | £m | | | | £m | |
| Net interest income | | | 4,390 | | | | 4,172 | | | | 4,099 | |
| Net fees and commissions – banking | | | 2,219 | | | | 2,375 | | | | 2,297 | |
| Other non-interest income | | | 369 | | | | 765 | | | | 731 | |
| Non-interest income | | | 2,588 | | | | 3,140 | | | | 3,028 | |
| Total income | | | 6,978 | | | | 7,312 | | | | 7,127 | |
| Direct expenses | | | | | | | | | | | | |
| – staff costs | | | 1,258 | | | | 1,266 | | | | 1,203 | |
| – other | | | 574 | | | | 545 | | | | 552 | |
| | | | 1,832 | | | | 1,811 | | | | 1,755 | |
| Insurance net claims | | | 184 | | | | 518 | | | | 488 | |
| Impairment | | | 1,281 | | | | 1,184 | | | | 1,307 | |
| Contribution | | | 3,681 | | | | 3,799 | | | | 3,577 | |
2009.
| | | £bn | | | £bn | | | £bn | |
| Loans and advances to customers – gross | | | | | | | | | |
| – mortgages | | | 74.9 | | | | 67.4 | | | | 65.3 | |
| – personal | | | 16.2 | | | | 17.1 | | | | 17.1 | |
| – cards | | | 6.4 | | | | 7.8 | | | | 8.1 | |
| – business | | | 20.0 | | | | 18.7 | | | | 16.9 | |
| Customer deposits* | | | 95.9 | | | | 96.1 | | | | 86.8 | |
| Investment management assets – excluding deposits | | | 5.7 | | | | 7.0 | | | | 6.7 | |
| Non-performing loans | | | 4.8 | | | | 4.3 | | | | 4.4 | |
* | customer deposits exclude bancassurance |
2008 compared with 2007
Despite anImpairment losses increased by £512 million to £1,161 million reflecting the deteriorating economic environment which became markedly weaker in the second half of the year, UK Retail Banking, which includesIreland and rising default levels across both personal and small business banking, held direct costscorporate portfolios. Lower asset values, particularly in property-related lending together with pressure on borrowers with a dependence on consumer spending have resulted in higher corporate loan losses, while higher unemployment, lower incomes and increased taxation have driven mortgage impairment increases.
Risk-weighted assets have increased due to deteriorating credit risk metrics.
Customer numbers increased by 3% during 2010, with a strong performance in current and savings accounts switchers.
2009 compared with 2008
Operating results were in line with 2007 while total income decreased 5% to £6,978expectations but deteriorated during 2009 as economic conditions across the island of Ireland worsened, with an operating loss for the year of £368 million. However the deterioration in the macroeconomic environment resulted in an 8% increase in impairment losses. Consequently, contribution decreased 3%, £118 million, to £3,681 million. In the personal segment, RBS retained top position and NatWest was again joint second for customer satisfaction amongst main high street banks. The business segment has continued to grow, maintaining market leadership with a share of 26%, alongside 23% of the start-up market. UK Retail continues to maintain availability of lending while managing risk exposure and focusing on supporting customers through a difficult economic environment.
Net interest income increased 5% to £4,390 million as a resultby 10% reflecting movements in foreign exchange rates and asset repricing initiatives, largely offset by the tightening of strong balance sheet growth. Net interest income performancedeposit margins in the personal segment was strong, up 7%, as a result of good volume growth coupled with improving new lending margins. The small business sector has seen more pressure on asset margins, from increased funding costs, which has restricted net interest income growth to 4%. Average loans and advances to customers increased 7% and average deposits were up 6% with personal savings growing 9% and small business deposits growing 3%. At year end deposit balances were in line with 2007 levels, reflecting increasingan increasingly competitive pressure in a slowing market. Net interest margin reduced from 3.92% to 3.85%, reflecting increased funding and liquidity costs.for the year at 1.87% remained broadly stable despite the challenging market conditions.
UK Retail mortgage balances grew 11% despite more mutedLoans to customers decreased by 10% from the prior year as new business demand weakened. Customer deposits reduced by 10% in 2009, reflecting an increasingly competitive Irish deposit market and reductions in wholesale funding during the second half, and net mortgage lending market share increased to 19% (2007 – 2%). Small business lending grew 7% despite a significant contraction in demand. Personal unsecured lending slowed, however, particularly infirst quarter. During the second half of the year. Further,year the sale of Tesco Personal Finance (TPF) reduced personal unsecuredmarket stabilised and the division recorded strong growth in customer balances at 31 December 2008 by £1.9 billion, though income of £285 million from TPF was included up to the date of the sale completion on 19 December.resulting in an improved funding profile.
Business reviewcontinued | Business review |
Non-interest income declined 18%by 23% due to £2,588 million. Bancassurance sales grewlower fee income driven by reduced activity levels across all business lines.
Total costs for the year increased by 5%. Direct expenses were down 3% during 2009, driven by the bank’s restructuring programme, which
incorporates the merger of the First Active and Ulster Bank businesses. The rollout of the programme has resulted in a downward trend in direct
expenses throughout 2009. The reduction in direct expenses has been offset by a 17% increase in indirect expenses primarily reflecting provisions relating to £353 million annual premium equivalentthe bank’s own property recognised in the year, however the negative performance of debt and equity markets reduced investment income by £48 million. Excluding this, underlying non-interest income declined 6% reflecting reduced demand for unsecured lending and lower sales of payment protection insurance.
Direct expenses increased 1% to £1,832 million. Direct staff costs reduced 1% reflecting increased efficiency. Other direct costs rose by 5% as a result of increased investment in selected business lines.
During 2008 the division almost doubled the number of branches open on a Saturday and introduced 1,000 MoneySense advisers into branches to provide impartial advice to customers on managing their money.fourth quarter.
Impairment losses increased 8% to £1,281£649 million with an increasefrom £106 million driven by the continued deterioration in small business delinquenciesthe Irish economic environment and personalresultant impact on loan performance across the retail and wholesale portfolios.
Necessary fiscal budgetary action allied to the well-entrenched downturn in property markets in Ireland has fed through to higher loan losses. Mortgage impairments have been driven by rising unemployment and lower incomes. Loans to the property sector experienced a substantial rise in defaults as the Irish property market declined, reflecting the changeddifficult economic environment, particularly inbackdrop and the second half. Inuncertainty surrounding the small business segment impairments increased to £158 million (2007 – £80 million). Inpossible effect of the personal segment the increase in impairments has been more modest, with mortgage impairment charges at £33 million (2007 – £21 million)Irish Government's National Asset Management Agency on a total book of £74.9 billion, while unsecured personal lending impairments remained level with 2007 at £1,091 million (2007 – £1,084 million). Higher Loan-to-Value ratio mortgagesasset values. Sectors driven by consumer spending have been restricted and affordability criteria tightened. The average LTV for new business was 67% (2007 – 62%). Repossessions represented 0.06% of outstanding mortgage balances at 31 December 2008, comparedaffected by the double digit decline in 2009 with a Council of Mortgage Lenders’ average at December 2008 of 0.21%.rising default rates evident.
Risk weighted assets totalled £63.8 billion at year end, a fall of 3% from 1 January 2008. The upward pressure from procyclicality, especially on the mortgage book, and book growth was offset by the disposal of TPF and improvements in Basel II methodologies.
2007 compared with 2006
UK Retail achieved strong results in 2007, increasing contribution by 6% to £3,799 million as a result of good income growth in both consumer and business banking combined with tight cost control and a reduction in impairment losses. Total income grewCustomer account numbers increased by 3% to £7,312 million, while income net of insurance claims grewduring 2009, with growth fuelled by 2% to £6,794 million.strong current account activity and new-to-bank savings customers.
We have accelerated the expansion of our consumer banking franchise, opening more than 975,000 new personal current accounts in 2007 and maintaining the Group’s joint number one position in the current account market. RBS and NatWest continue to lead the other major high street banks
Business reviewcontinued | Business review |
US Retail & Commercial
| | 2010 | 2009 | 2008 | | 2010 | 2009 | 2008 |
| | US$m | US$m | US$m | | £m | £m | £m |
| Net interest income | 2,962 | 2,777 | 3,200 | | 1,917 | 1,775 | 1,726 |
| Net fees and commissions | 1,126 | 1,119 | 1,231 | | 729 | 714 | 664 |
| Other non-interest income | 465 | 368 | 362 | | 300 | 235 | 197 |
| Non-interest income | 1,591 | 1,487 | 1,593 | | 1,029 | 949 | 861 |
| Total income | 4,553 | 4,264 | 4,793 | | 2,946 | 2,724 | 2,587 |
| Direct expenses | | | | | | | |
| - staff | (1,212) | (1,214) | (1,194) | | (784) | (776) | (645) |
| - other | (880) | (929) | (654) | | (569) | (593) | (354) |
| Indirect expenses | (1,189) | (1,196) | (1,157) | | (770) | (766) | (623) |
| | (3,281) | (3,339) | (3,005) | | (2,123) | (2,135) | (1,622) |
| Impairment losses | (799) | (1,099) | (811) | | (517) | (702) | (437) |
| Operating profit/(loss) | 473 | (174) | 977 | | 306 | (113) | 528 |
| | | | | | | | |
| Average exchange rate - US$/£ | | | | | 1.546 | 1.566 | 1.853 |
| | | | | | | | |
| Analysis of income by product | | | | | | | |
| Mortgages and home equity | 786 | 781 | 695 | | 509 | 499 | 375 |
| Personal lending and cards | 735 | 706 | 617 | | 476 | 451 | 333 |
| Retail deposits | 1,397 | 1,296 | 1,853 | | 903 | 828 | 1,000 |
| Commercial lending | 896 | 848 | 751 | | 580 | 542 | 405 |
| Commercial deposits | 495 | 624 | 698 | | 320 | 398 | 377 |
| Other | 244 | 9 | 179 | | 158 | 6 | 97 |
| Total income | 4,553 | 4,264 | 4,793 | | 2,946 | 2,724 | 2,587 |
| | | | | | | | |
| Analysis of impairment by sector | | | | | | | |
| Residential mortgages | 90 | 113 | 76 | | 58 | 72 | 41 |
| Home equity | 194 | 261 | 125 | | 126 | 167 | 67 |
| Corporate and commercial | 312 | 510 | 335 | | 202 | 326 | 181 |
| Other consumer | 150 | 215 | 275 | | 97 | 137 | 148 |
| Securities | 53 | — | — | | 34 | — | — |
| Total impairment losses | 799 | 1,099 | 811 | | 517 | 702 | 437 |
| | | | | | | | |
Loan impairment charge as % of gross customer loans and advances (excluding reverse repurchase agreements) by sector | | | | | | | |
| Residential mortgages | 1.0% | 1.1% | 0.5% | | 1.0% | 1.1% | 0.4% |
| Home equity | 0.8% | 1.0% | 0.5% | | 0.8% | 1.1% | 0.4% |
| Corporate and commercial | 1.0% | 1.6% | 1.0% | | 1.0% | 1.7% | 0.8% |
| Other consumer | 1.4% | 1.8% | 1.9% | | 1.4% | 1.8% | 1.5% |
| | 1.0% | 1.4% | 0.9% | | 1.0% | 1.4% | 0.7% |
| | | | | | | | |
| Performance ratios | | | | | | | |
Return on equity (1) | 3.6% | (1.3%) | 7.9% | | 3.6% | (1.3%) | 7.8% |
| Net interest margin | 2.85% | 2.37% | 2.68% | | 2.85% | 2.37% | 2.68% |
| Cost:income ratio | 72% | 78% | 63% | | 72% | 78% | 63% |
| (1) | Divisional return on equity is based on divisional operating profit/(loss) after tax divided by average notional equity (based on 9% of the monthly average of divisional RWAs, adjusted for capital deductions). |
Business review continued
Business reviewcontinued | Business review |
| | 2010 | 2009 | 2008 | | 2010 | 2009 | 2008 |
| | US$bn | US$bn | US$bn | | £bn | £bn | £bn |
| Capital and balance sheet | | | | | | | |
| Total third party assets | 110.5 | 122.3 | 129.5 | | 71.2 | 75.4 | 88.7 |
| Loans and advances to customers (gross) | | | | | | | |
| - residential mortgages | 9.4 | 10.6 | 13.9 | | 6.1 | 6.5 | 9.5 |
| - home equity | 23.6 | 25.0 | 27.2 | | 15.2 | 15.4 | 18.7 |
| - corporate and commercial | 31.7 | 31.6 | 34.7 | | 20.4 | 19.5 | 23.8 |
| - other consumer | 10.6 | 12.1 | 14.3 | | 6.9 | 7.5 | 9.8 |
| | 75.3 | 79.3 | 90.1 | | 48.6 | 48.9 | 61.8 |
| Customer deposits (excluding repos) | 91.2 | 97.4 | 93.4 | | 58.7 | 60.1 | 63.9 |
| Risk elements in lending | | | | | | | |
| - retail | 0.7 | 0.6 | 0.3 | | 0.4 | 0.4 | 0.2 |
| - commercial | 0.7 | 0.4 | 0.2 | | 0.5 | 0.2 | 0.2 |
| | 1.4 | 1.0 | 0.5 | | 0.9 | 0.6 | 0.4 |
| Loan:deposit ratio (excluding repos) | 81% | 80% | 96% | | 81% | 80% | 96% |
| Risk-weighted assets | 88.4 | 96.9 | 93.2 | | 57.0 | 59.7 | 63.9 |
| | | | | | | | |
| Spot exchange rate - US$/£ | | | | | 1.552 | 1.622 | 1.460 |
2010 compared with 2009
Operating profit of £306 million ($473 million) represented a marked improvement from an operating loss of £113 million ($174 million) with income up 8%, expenses down 1% and impairment losses down 26%.
Net interest income was up 7%, despite a smaller balance sheet, with net interest margin improving by 48 basis points to 2.85%.
Non-interest income was up 8% reflecting higher mortgage banking and debit card income, commercial banking fees and higher gains on securities realisations. This was partially offset by lower deposit fees which were impacted by Regulation E legislative changes in Great Britain for2010. In addition, gains of £213 million ($330 million) were recognised on the sale of available-for-sale securities as part of the balance sheet restructuring exercise, but these were almost wholly offset by losses crystallised on the termination of swaps hedging fixed-rate funding.
Total expenses were down 1%, reflecting a £74 million ($113 million) credit related to changes to the defined benefit pension plan, and lower Federal Deposit Insurance Corporation (FDIC) deposit insurance levies, partially offset by the impact of changing rates on the valuation of mortgage servicing rights and litigation costs.
Impairment losses declined 26%, following significant loan reserve building in 2009 and a gradual improvement in the underlying credit environment, offset by higher impairments related to securities. Loan impairments as a percentage of loans and advances decreased from 1.4% to 1.0%.
2009 compared with 2008
The recessionary economic environment, historically low interest rates and deteriorating credit conditions resulted in an operating loss before tax of £113 million. However, the business has now successfully refocused on its core customer satisfaction. We continue to focus on salesfranchises in New England, the Mid-Atlantic region and the Midwest. In dollar terms, an operating loss before tax of $174 million was recorded.
The division achieved very strong growth in mortgage origination volumes, with significantly higher penetration through the branch channel,network and improved profitability, particularly on recent origination vintages. Cross-selling of card, deposit and checking account products has increased substantially, with over 65% of new mortgage customers also taking out a checking account. The division has also increased commercial banking market penetration, with lead bank share within its footprint increasing, in dollar terms, from 6% to 7% in the $5 million to $25 million segment and from 6% to 8% in the $25 million to $500 million segment.
Net interest income was up 3%, principally as a result of movements in exchange rates. However, net interest margin was down 31bps for the full year, reflecting the decline in deposit margins resulting from the low interest rate environment, though margins have been partially rebuilt in the second half from the lows experienced in the first half, as the business repriced lending rates and aggressively reduced pricing on term and time deposits.
Expenses increased by adding32%, reflecting increased FDIC deposit insurance levies, higher employee benefit costs as well as increased costs relating to loan workout and collection activity. In dollar terms, expenses increased by 11%. Successful execution of restructuring activities resulted in approximately $75 million of cost savings.
Impairment losses increased to £702 million ($1,099 million) as charge-offs climbed to 0.90% of loans, an increase of 34bps compared with 2008.
Loans and advances were down 21%, reflecting subdued customer demand.
Customer deposits decreased 6% from the prior year. In dollar terms, customer deposits increased 4% as the deposit mix improved significantly, with strong growth in checking balances combined with migration away from higher priced term and time deposits as the division adjusted its pricing strategies. Over 58,000 consumer checking accounts were added over the course of the year, and more customer advisersthan 13,000 small business checking accounts. Consumer checking balances grew by 8% and small business balances by 12%.
Business reviewcontinued | Business review |
Global Banking & Markets
| | 2010 | 2009 | 2008 |
| | £m | £m | £m |
| Net interest income from banking activities | 1,252 | 2,424 | 2,390 |
| Funding costs of rental assets | (37) | (49) | (64) |
| Net interest income | 1,215 | 2,375 | 2,326 |
| Net fees and commissions receivable | 1,283 | 1,144 | 973 |
| Income from trading activities | 5,432 | 8,147 | (748) |
| Other operating income | (18) | (608) | (194) |
| Non-interest income | 6,697 | 8,683 | 31 |
| Total income | 7,912 | 11,058 | 2,357 |
| Direct expenses | | | |
| - staff | (2,693) | (2,904) | (2,034) |
| - other | (842) | (777) | (1,017) |
| Indirect expenses | (862) | (979) | (937) |
| | (4,397) | (4,660) | (3,988) |
| Impairment losses | (151) | (640) | (522) |
| Operating profit/(loss) | 3,364 | 5,758 | (2,153) |
| | | | |
| Analysis of income by product | | | |
| Rates - money markets | 65 | 1,714 | 1,641 |
| Rates - flow | 1,985 | 3,142 | 1,386 |
| Currencies & commodities | 870 | 1,277 | 1,539 |
| Credit and mortgage markets | 2,215 | 2,255 | (3,435) |
| Portfolio management and origination | 1,844 | 1,196 | 858 |
| Equities | 933 | 1,474 | 368 |
| Total income | 7,912 | 11,058 | 2,357 |
| | | | |
| Analysis of impairment by sector | | | |
| Manufacturing and infrastructure | (51) | 91 | 39 |
| Property and construction | 74 | 49 | 12 |
| Banks and financial institutions | 177 | 348 | 186 |
| Other | (49) | 152 | 285 |
| Total impairment losses | 151 | 640 | 522 |
Loan impairment charge as % of gross customer loans and advances (excluding reverse repurchase agreements) | 0.2% | 0.6% | 0.3% |
| | | | |
| Performance ratios | | | |
Return on equity (1) | 16.6% | 29.8% | (9.1%) |
| Net interest margin | 1.05% | 1.38% | 1.34% |
| Cost:income ratio | 56% | 42% | 169% |
Compensation ratio (2) | 34% | 26% | 86% |
| (1) | Divisional return on equity is based on divisional operating profit/(loss) after tax divided by average notional equity (based on 10% of the monthly average of divisional RWAs, adjusted for capital deductions). |
| (2) | Compensation ratio is based on staff costs as a percentage of total income, excluding the fair value of own debt. |
Business reviewcontinued | Business review |
| | 2010 | 2009 | 2008 |
| | £bn | £bn | £bn |
| Capital and balance sheet | | | |
| Loans and advances to customers | 75.1 | 90.9 | 168.7 |
| Loans and advances to banks | 44.5 | 36.9 | 55.5 |
| Reverse repos | 94.8 | 73.3 | 88.8 |
| Securities | 119.2 | 106.0 | 127.5 |
| Cash and eligible bills | 38.8 | 74.0 | 20.2 |
| Other | 24.3 | 31.1 | 38.0 |
Total third party assets (excluding derivatives mark-to-market) | 396.7 | 412.2 | 498.7 |
| Net derivative assets (after netting) | 37.4 | 68.0 | 121.0 |
| Customer deposits (excluding repos) | 38.9 | 46.9 | 87.8 |
| Risk elements in lending | 1.7 | 1.8 | 0.9 |
| Loan:deposit ratio (excluding repos) | 193% | 194% | 192% |
| Risk-weighted assets | 146.9 | 123.7 | 151.8 |
2010 compared with 2009
A fall in our branches have achievedoperating profit of 42% year on year reflects sharply reduced revenue partially offset by lower costs and a significant upliftimprovement in volumes.impairments.
Bancassurance continuedTotal income was £3,146 million lower in 2010 driven by increased risk aversion in the market during Q3 and Q4 2010, combined with the non-repeat of favourable market conditions seen in the first half of 2009.
| · | Higher revenue across the Rates and Currencies businesses during 2009 was driven by rapidly falling interest rates and wide bid-offer spreads generating exceptional revenue opportunities, which have not been repeated in 2010. |
| · | The Credit Markets business remained broadly flat, supported by strong Mortgage Trading income where customer demand remained buoyant during 2010. |
| · | Increased revenue from Portfolio Management was driven by disciplined lending alongside a reduction in balance sheet management activities and associated costs. |
Expenses fell by 6% to £4,397 million. This was largely driven by a decrease in staff costs, including on-going benefits from cost synergies.
The low level of impairments in 2010 reflected a small number of specific cases partially offset by an improved picture on latent loss provisions. This contrasted with 2009, which witnessed a significantly higher level of specific impairments.
At 16.6%, return on equity remained consistent with the 15% targeted over the business cycle in GBM’s strategic plan. The compensation ratio of 34% was below that of peers.
2009 compared with 2008
Operating profit improved to £5,758 million in 2009, compared with an operating loss of £2,153 million in 2008. Although the buoyant market conditions experienced in the first quarter levelled off over the course of the year, the refocusing of the business on its excellent progress with sales growthcore franchises was successful. GBM has tightened its balance sheet management over the course of 28% to £342 million annual premium equivalent, representing a doubling of 2005 sales. We invested further in our sales force, ending the year, with more than 1,000 financial planning managers.disciplined deployment of capital to support its targeted client base.
In business banking we strengthened our management teaman often volatile market environment, GBM responded quickly to its clients' needs to strengthen their balance sheets and improved operational processes, producing good results. During 2007 we placed an additional 500 business managers backto take advantage of the attractive environment for debt and equity issues. RBS participated in branches, launched additional products to support the start-up market,five largest equity issues worldwide in 2009, and added new roles supporting ethnic minorities, women in business and community banking.six out of the ten largest debt capital markets transactions.
In our cardsIncome grew significantly, reflecting a very strong first quarter benefiting from market volatility, client activity and directa marked improvement from credit and mortgage markets. Rates flow business, up 127%, benefited from good client activity, while strong equity capital markets drove a fourfold increase in Equities.
Portfolio management and origination grew 39% as financial institutions and corporate clients refinanced through the debt capital markets. The refocused credit and mortgage markets delivered a much improved result from greater liquidity and a more positive trading environment.
Despite quarterly movement in the Group's credit spreads, overall spreads remained broadly flat over the year resulting in a small loss from movements in the fair value of own debt compared with a £357 million gain in 2008.
Expenses increased 17%, reflecting higher performance-related costs and the impact of adverse exchange rate movements, partly offset by restructuring and efficiency benefits. Less than half of the change in staff costs related to increases in 2009 bonus awards.
Business reviewcontinued | Business review |
Global Banking & Markets continued
2009 compared with 2008 continued
Staff costs represented 26% of income. The Group introduced new deferral policies in 2009, which have led to changes in accrual patterns. Adjusting for both 2008 and 2009 deferrals, GBM's compensation ratio in 2009 would have been 28%.
Higher impairments principally reflected a large individual failure recognised in the third quarter. Impairments represented 0.6% of loans and advances to customers compared with 0.3% in the prior year, reflecting the marked reduction in loans and advances.
Total third party assets, excluding derivatives, were down 17%, or 13% at constant exchange rates, compared with 31 December 2008, driven by a 43% reduction in loans and advances as customers took advantage of favourable capital market conditions to raise alternative forms of finance business, we have maintained ourto bank debt. This reduction was partially offset by an increase in liquid assets.
Risk-weighted assets decreased 19%, or 15% at constant exchange rates, reflecting the fall in third party assets and the Group's continued focus on credit card salesreducing its risk profile and balance sheet usage.
Business reviewcontinued | Business review |
RBS Insurance
| | 2010 | 2009 | 2008 |
| | £m | £m | £m |
| Earned premiums | 4,459 | 4,519 | 4,512 |
| Reinsurers' share | (148) | (165) | (206) |
| Net premium income | 4,311 | 4,354 | 4,306 |
| Fees and commissions | (409) | (366) | (396) |
| Other income | 467 | 472 | 520 |
| Total income | 4,369 | 4,460 | 4,430 |
| Direct expenses: | | | |
| - staff | (266) | (267) | (286) |
| - other | (170) | (222) | (225) |
| Indirect expenses | (267) | (270) | (261) |
| | (703) | (759) | (772) |
| Net claims | (3,961) | (3,635) | (3,032) |
| Impairment losses | — | (8) | (42) |
| Operating (loss)/profit | (295) | 58 | 584 |
| | | | |
| Analysis of income by product | | | |
| Personal lines motor excluding broker | | | |
| - own brands | 1,924 | 1,865 | 1,799 |
| - partnerships | 301 | 328 | 369 |
| Personal lines home excluding broker | | | |
| - own brands | 487 | 455 | 434 |
| - partnerships | 399 | 401 | 421 |
| Personal lines other excluding broker | | | |
| - own brands | 197 | 196 | 193 |
| - partnerships | 157 | 227 | 202 |
| Other | | | |
| - commercial | 318 | 329 | 294 |
| - international | 341 | 313 | 367 |
- other (1) | 245 | 346 | 351 |
| Total income | 4,369 | 4,460 | 4,430 |
| | | | |
| In-force policies (000's) | | | |
| Personal lines motor excluding broker | | | |
| - own brands | 4,162 | 4,762 | 4,396 |
| - partnerships | 645 | 844 | 951 |
| Personal lines home excluding broker | | | |
| - own brands | 1,758 | 1,717 | 1,516 |
| - partnerships | 1,850 | 1,918 | 1,993 |
| Personal lines other excluding broker | | | |
| - own brands | 2,005 | 2,319 | 1,938 |
| - partnerships | 8,177 | 7,335 | 7,814 |
| Other | | | |
| - commercial | 284 | 273 | 266 |
| - international | 1,082 | 944 | 949 |
- other (1) | 644 | 1,123 | 1,246 |
Total in-force policies (2) | 20,607 | 21,235 | 21,069 |
Gross written premiums (£m) | 4,298 | 4,480 | 4,384 |
| | | | |
For notes relating to this table refer to page 46.
Business reviewcontinued | Business review |
RBS Insurance continued
| | 2010 | 2009 | 2008 |
| Performance ratios | | | |
Return on equity (3) | (7.9%) | 1.7% | 18.3% |
Loss ratio (4) | 92% | 84% | 70% |
Commission ratio (5) | 10% | 9% | 10% |
Expense ratio (6) | 13% | 14% | 14% |
Combined operating ratio (7) | 115% | 106% | 94% |
| Balance sheet | | | |
General insurance reserves - total (£m) | 7,559 | 7,030 | 6,673 |
| (1) | Other is predominantly made up of the discontinued personal lines broker business. |
| (2) | Total in-force policies include travel and creditor policies sold through RBS Group. These comprise travel policies included in bank accounts e.g. Royalties Gold Account, and creditor policies sold with bank products including mortgage, loan and card repayment payment protection. |
| (3) | Divisional return on equity is based on divisional operating (loss)/profit after tax, divided by divisional average notional equity (based on regulatory capital). |
| (4) | Loss ratio is based on net claims divided by net premium income for the UK businesses. |
| (5) | Commission ratio is based on fees and commissions divided by gross written premium income for the UK businesses. |
| (6) | Expense ratio is based on expenses (excluding fees and commissions) divided by gross written premium income for the UK businesses. |
| (7) | Combined operating ratio is expenses (including fees and commissions) divided by gross written premium income, added to the loss ratio, for the UK businesses. |
2010 compared with 2009
RBS Insurance has embarked on a significant programme of investment designed to achieve a substantial lift in operational and financial performance, ahead of the branch channel, whereplanned divestment of the business, with a current target date of 2012. This programme encompasses the enhancement of pricing capability, transformation of claims operations and expense reduction, together with a range of other improvements across the business, including a greater focus on capital management.
2010 as a whole was a disappointing profit year, impacted by significant reserve strengthening for bodily injury claims and severe weather, resulting in a loss of £295 million.
Income was down 2% (£91 million) against 2009, driven by a managed reduction in the risk of the UK motor book, largely offset by significant price increases:
| · | This de-risking was achieved by a combination of rating action to reduce the mix of higher-risk drivers, and the partial or total exit of higher risk business lines (significantly scaling back the fleet and taxi business and the exit of personal lines business sold through insurance brokers). As a result in-force motor policies fell 14% compared with 2009. |
| · | Even with the significant reduction in the risk mix of the book, average motor premiums were up 7% in the year, due to significant price increases. The prices of like-for-like policies have increased by 35-40% over the last year. These increases were in addition to the significant increases achieved in 2009. |
Initiatives to grow ancillary income were also implemented during the year resulting in revenues of £46 million in 2010 (£25 million in 2009).
Away from UK motor, overall home gross written premiums grew by 2%. This included the exit from less profitable business in line with overall strategy. Our underlying own brands business continues to grow successfully, with gross written premiums increasing 4%.
The International business continued to invest in growth in 2010 with gross written premiums of £425 million up 20% on 2009. The Italian business successfully grew to a market share approaching 30% of the direct insurer market. The German business grew 7% and is well positioned to take advantage of the emerging shift to direct/internet distribution in that market.
Several programmes to further improve the overall efficiency of the business took effect during the year, including a reduction of six sites and operational process improvements, which will continue to improve efficiency.
Total in-force policies declined by 3%, driven by a fall of 14% in motor policies. This was partly offset by higher travel policies, up 64% with new business sales were up 47% on 2006, while continuing to takefrom a cautious view on direct sales.partnership with Nationwide Building Society commencing in Q4 2010. The personal lines broker segment overall declined by 43%, in line with business strategy.
Savings balance growthUnderwriting income declined by £63 million, with lower motor premium income, driven by rating action. Increased fees and commissions reflected profit sharing arrangements with UK Retail in relation to insurance distribution to bank customers. Investment income was helped by good sales£28 million lower, reflecting the impact of new accounts to branch customers, with NatWest opening more than 1 million new savings accounts.low interest rates on returns on the investment portfolio as well as lower gains realised on the sale of investments.
Mortgage activity focused on branch channels, where net lending was 14%Net claims were £326 million higher than in 2009, driven by increases to bodily injury reserves relating to prior years, including allowance for higher claims costs in respect of Periodic Payment Orders due to an increased settlement rate of such claims. Although bodily injury frequency has stabilised, severity has continued to deteriorate. Claims were also impacted by the previous year. We also took advantage of improved marginsadverse weather experienced in the intermediary segmentfirst and fourth quarters.
Expenses were down 7%, driven by lower industry levies and marketing costs.
Business reviewcontinued | Business review |
2009 compared with 2008
Operating profit was severely affected by the rising costs of bodily injury claims, declining to £58 million. Significant price increases were implemented in the latter part of the year to improve volumes.mitigate the industry trend of rising claims costs.
Income grew by 1%, with premium income stable but lower reinsurance costs. Investment income was 20% lower, reflecting the impact of low interest rates and returns on the investment portfolio partially offset by gains realised on the sale of equity investments.
In-force policies grew by 1%, driven by the success of own brands, up 12%. Churchill and Privilege have benefited from deployment on selected price comparison websites, with motor policy numbers up 19% and 3% respectively, and home policies up 32% and 109% respectively, compared with prior year. Direct loan balancesLine motor and home policies grew by 4% and 2% respectively. The partnerships and broker segment declined over the year as we maintained our strategy of focussing unsecured personal lending on profitability rather than volume, although we continued to grow lending through the branch channel. After a declineby 10% in credit card balancesline with business strategy.
Expenses fell by 2% in the first half of the year we improved recruitment2009, with wage inflation, higher industry levies and retentionprofessional fees offset by cost efficiencies, reduction in the second half.headcount and lower marketing expenditure.
Net interest income increased by 2% to £4,172 million, with strong growthclaims were 20% higher than in deposits helping to mitigate the impact of lower unsecured lending volumes and lower average card balances. Net interest margin declined modestly, in line with previous guidance, with savings margins consistent with 2006, despite increased competition for deposits.
Non-interest income was £3,140 million, 4% ahead of 2006, with strong growth in investment income offset by lower levels of direct lending and reduced instances of current account fees.
Direct expenses rose by 3% to £1,811 million,2008 driven by increased investmenta £448 million increase in customer-facing staff in branches and in our bancassurance and investment businesses. Other costs reduced by 1% to £545 million.
Impairment losses decreased by 9% to £1,184 million, reflecting the improvement in arrears trends on both credit cards and unsecured personal loans. Mortgage arrears remained very low, and we have maintained conservative lending criteria – the average loan-to-value ratio of UK Retail’s mortgages was 46% overall and 63% on new mortgages written in 2007, and this improved as the year progressed. Small business credit quality remained good.
Business review continued
Regional Markets – UK Retail & Commercial Banking
UK Corporate & Commercial Banking
| | | 2008 | | | 2007 | | | 2006 | |
| | | | £m | | | | £m | | | | £m | |
| Net interest income | | | 2,039 | | | | 1,924 | | | | 1,807 | |
| Net fees and commissions | | | 450 | | | | 425 | | | | 385 | |
| Other non-interest income | | | 672 | | | | 658 | | | | 569 | |
| Non-interest income | | | 1,122 | | | | 1,083 | | | | 954 | |
| Total income | | | 3,161 | | | | 3,007 | | | | 2,761 | |
| Direct expenses | | | | | | | | | | | | |
| – staff costs | | | 486 | | | | 431 | | | | 381 | |
| – other | | | 529 | | | | 467 | | | | 457 | |
| | | | 1,015 | | | | 898 | | | | 838 | |
| Impairment | | | 671 | | | | 180 | | | | 188 | |
| Contribution | | | 1,475 | | | | 1,929 | | | | 1,735 | |
| | | £bn | | | £bn | | | £bn | |
| Loans and advances to customers – gross | | | 110.4 | | | | 99.3 | | | | 86.1 | |
| Customer deposits | | | 64.3 | | | | 66.2 | | | | 71.0 | |
| Non-performing loans | | | 3.0 | | | | 1.2 | | | | 0.7 | |
2008 compared with 2007
UK Corporate & Commercial Banking experienced a solid performance in the first half of 2008, with the second half of 2008 being impacted by the marked deterioration in economic conditions. Total income increased 5% to £3,161 million. However, growth in impairments, especially in the second half of the year, resulted in a 24% fall in contribution to £1,475 million.
Net interest income increased 6% to £2,039 million. Average loans and advances were 18% higher than 2007, reflecting the Group’s continuing support for the UK economy. New business margins widened in the second half to reflect increasing risk premia, however, higher funding costs on the back book suppressed growth in net interest income.
Non interest income increased 4% to £1,122 million. 2007 benefited from the profit on disposal of the Securities Services Group business. This strong performance reflects increased sales of interest rate and currency risk management products.
Direct expenses increased 13% to £1,015 million, reflecting a 26% rise in operating lease depreciation to £401 million, due to higher volumesbodily injury claims as well as additional provisions of £54 million for lower residual valuesby adverse weather experienced in the Lombard vehicle leasing business. Direct expenses, excluding operating lease depreciation, increased by 6% to £614 million with cost growth reflecting the recruitment of additional relationship managers in 2007.
Impairment losses totalled £671 million, a sharp increase from the historically low levels seen in 2007. 48% of the charge related to house builder and property development companies. Lossesfourth quarter. Significant price increases were concentrated in the smaller end of the corporate sector, although a number of specific exposures in the larger corporate sector have also impacted the charge. The commercial businesses charge was £368 million (2007 – £100 million) and the corporate business charge was £303 million (2007 – £80 million).
The performance of our commercial property book remains under close watch. Average LTVs in the UK portfolio is 68% and less than 5% of the portfolio has LTVs greater than 85%.
RWA growth has been constrained by improvements in Basel II methodologies and active risk management, which have offset growth in the underlying balance sheet and the impacts of procyclicality.
2007 compared with 2006
UK Corporate & Commercial Banking had another successful year of profitable growth, building further on our market-leading position and achieving significant improvements in customer satisfaction. Total income rose by 9% to £3,007 million and contribution by 11% to £1,929 million.
There has been good growth in customer volumes, with average loans and advances up 15% and average deposits up 12%. Net interest income increased by 6% to £1,924 million as net interest margin narrowed slightly from the prior year. In recent months we have seen firmer margins in some areas.
Non-interest income rose by 14% to £1,083 million, as a result of growth in fees and continued progress in the distribution of trade and invoice finance products as well as of interest rate and foreign exchange products.
Direct expenses increased by 7% at £898 million due to investment targeted towards improving customer service. Around 600 new front line roles were created and major new functionality was added to the Bankline electronic banking platform. These initiatives have contributed to strongly favourable customer satisfaction scores in 2007.
Impairment losses totalled £180 million, 4% lower than in 2006, reflecting the strong quality of the portfolio. Corporate credit metrics remained stable.
Business review continued
Regional Markets – UK Retail & Commercial Banking
UK Wealth
| | | 2008 | | | 2007 | | | 2006 | |
| | | | £m | | | | £m | | | | £m | |
| Net interest income | | | 570 | | | | 506 | | | | 444 | |
| Net fees and commissions | | | 250 | | | | 254 | | | | 214 | |
| Other non-interest income | | | 39 | | | | 27 | | | | 27 | |
| Non-interest income | | | 289 | | | | 281 | | | | 241 | |
| Total income | | | 859 | | | | 787 | | | | 685 | |
| Direct expenses | | | | | | | | | | | | |
| – staff costs | | | 234 | | | | 222 | | | | 204 | |
| – other | | | 90 | | | | 64 | | | | 73 | |
| | | | 324 | | | | 286 | | | | 277 | |
| Impairment | | | 12 | | | | 4 | | | | 2 | |
| Contribution | | | 523 | | | | 497 | | | | 406 | |
| | | £bn | | | £bn | | | £bn | |
| Loans and advances to customers – gross | | | | | | | | | |
| – mortgages | | | 5.2 | | | | 4.2 | | | | 3.8 | |
| – personal | | | 3.7 | | | | 3.0 | | | | 2.5 | |
| – other | | | 1.2 | | | | 1.2 | | | | 0.9 | |
| Customer deposits | | | 25.9 | | | | 27.1 | | | | 21.9 | |
| Investment management assets – excluding deposits | | | 16.8 | | | | 18.8 | | | | 15.3 | |
| Non-performing loans | | | 0.1 | | | | — | | | | — | |
2008 compared with 2007
UK Wealth delivered robust growth, with total income increasing by 9% to £859 million and contribution increasing by 5% to £523 million.
UK Wealth generates earnings from both private banking and investment services, and this has enabled the division to maintain strong organic growth, despite the deterioration in global market conditions. Coutts & Co. performed particularly well, with contribution up by 15%.
Average loans and advances to customers rose by 17% and average customer deposits by 11%, underpinning a 13% rise in net interest income to £570 million.
Non interest income grew by 3% to £289 million as higher fee income was offset by lower investment income. Although average assets under management were 4% higher than in 2007, lower stock market levelsimplemented in the latter part of the year reduced assets under management by 11% to £16.8 billion.mitigate the industry trend of rising claims costs, and additional significant initiatives have also been undertaken to adapt pricing models and enhance claims management.
Direct expenses roseThe UK combined operating ratio, including business services costs, was 106% compared with 94% in the previous year, with the impact of the increase in reserves for bodily injury claims and the bad weather experience only partially mitigated by 13% to £324 million partly due to increased headcountcommission and higher deposit protection scheme contributions.expense ratio improvement.
Impairments rose from £4 million in 2007 to £12 million and represented approximately 0.1% of the total UK lending book.
2007 compared with 2006
Wealth Management’s offering of private banking and investment services continued to deliver very strong growth in income, up 15% in 2007 to £787 million. Contribution grew by 22% to £497 million.
We have continued Coutts & Co’s UK regional expansion programme, and this has helped us to grow customer numbers by 7% and income by 22%.
Growth in banking volumes contributed to a 14% rise in net interest income to £506 million. Average loans and advances to customers rose by 16% and average deposits by 22%.
Non-interest income grew by 17% to £281 million, reflecting higher investment management fees and new product sales, including new investment vehicles specialising in private equity and natural resources, as well as continued growth in underlying new business volumes. Assets under management rose to £18.8 billion at 31 December 2007, up 23% from a year earlier.
Direct expenses increased by 3% to £286 million, reflecting continued investment in the UK.
Business reviewcontinued | Business review |
Business review continued
| | 2010 | 2009 | 2008 |
| | £m | £m | £m |
| Central items not allocated | 577 | 385 | 150 |
Regional Markets – US Retail & Commercial BankingFunding and operating costs have been allocated to operating divisions, based on direct service usage, requirement for market funding and other appropriate drivers where services span more than one division.
| | | 2008 | | | 2007 | | | 2006 | | | 2008 | | | 2007 | | | 2006 | |
| | | | £m | | | | £m | | | | £m | | | | $m | | | | $m | | | | $m | |
| Net interest income | | | 2,106 | | | | 1,935 | | | | 2,041 | | | | 3,902 | | | | 3,872 | | | | 3,764 | |
| Non-interest income | | | 904 | | | | 846 | | | | 949 | | | | 1,676 | | | | 1,692 | | | | 1,747 | |
| Total income | | | 3,010 | | | | 2,781 | | | | 2,990 | | | | 5,578 | | | | 5,564 | | | | 5,511 | |
| Direct expenses | | | | | | | | | | | | | | | | | | | | | | | | |
| – staff costs | | | 675 | | | | 598 | | | | 664 | | | | 1,250 | | | | 1,197 | | | | 1,225 | |
| – other | | | 411 | | | | 364 | | | | 402 | | | | 762 | | | | 728 | | | | 743 | |
| | | | 1,086 | | | | 962 | | | | 1,066 | | | | 2,012 | | | | 1,925 | | | | 1,968 | |
| Impairment – core | | | 722 | | | | 177 | | | | 180 | | | | 1,337 | | | | 351 | | | | 332 | |
| Impairment – SBO | | | 319 | | | | 163 | | | | - | | | | 592 | | | | 329 | | | | - | |
| Contribution | | | 883 | | | | 1,479 | | | | 1,744 | | | | 1,637 | | | | 2,959 | | | | 3,211 | |
Residual unallocated items relate to volatile corporate items that do not naturally reside within a division.
| | | £bn | | | £bn | | | £bn | | | US$bn | | | US$bn | | | US$bn | |
| Total assets | | | 103.9 | | | | 79.6 | | | | 82.1 | | | | 151.8 | | | | 159.2 | | | | 161.3 | |
| Loans and advances to customers – gross | | | | | | | | | | | | | | | | | | | | | | | | |
| – mortgages | | | 10.7 | | | | 9.5 | | | | 9.5 | | | | 15.7 | | | | 19.1 | | | | 18.6 | |
| – home equity | | | 23.8 | | | | 17.9 | | | | 17.6 | | | | 34.8 | | | | 35.9 | | | | 34.5 | |
| – other consumer | | | 14.6 | | | | 10.8 | | | | 11.7 | | | | 21.3 | | | | 21.6 | | | | 23.1 | |
| – corporate and commercial | | | 28.2 | | | | 18.8 | | | | 16.7 | | | | 41.2 | | | | 37.6 | | | | 32.7 | |
| Customer deposits | | | 64.6 | | | | 52.8 | | | | 51.5 | | | | 94.3 | | | | 105.8 | | | | 101.1 | |
| Non-performing loans | | | 0.8 | | | | 0.3 | | | | 0.2 | | | | 1.1 | | | | 0.6 | | | | 0.3 | |
| Average exchange rate – US$/£ | | | | | | | | | | | | | | | 1.853 | | | | 2.001 | | | | 1.844 | |
| Spot exchange rate – US$/£ | | | | | | | | | | | | | | | 1.460 | | | | 2.004 | | | | 1.965 | |
20082010 compared with 2007
US Retail & Commercial Banking increased income by 8% to £3,010 million, primarily as a result of movements in exchange rates, but experienced a sharp increase in impairment losses as economic conditions progressively worsened over the course of the year. As a result, contribution declined to £883 million, down 40%. In dollar terms, total income was held steady at $5,578 million while contribution declined by 45% to $1,637 million.
2009
Total incomeCentral items not allocated including available-for-sale (AFS) gains of £3,010 million increased by 8%, with 20% growth in commercial banking to £664£237 million and one-off VAT recovery in 2010 of £170 million, amounted to a 5% growth in retail banking income to £2,346 million. In dollar terms, total incomenet credit of $5,578£577 million, was essentially unchanged, with 11% growth in commercial banking to $1,231an increase of £192 million offsetting a 2% decline in retail banking income to $4,347 million. Both segments were affected by the deterioration in credit conditions, with retail contribution down 54% to £499 million and commercial contribution flat at £384 million. In dollar terms, retail contribution was was down 58% to $926 million and commercial contribution was down 7% to $711 million.on 2009.
Overall, net interest income grew modestly, offset by a small decline in non-interest income. Average loans and advances to retail customers decreased as a result of the slowing economy and tighter underwriting standards, but this decline was offset by continued strong growth in corporate and commercial lending. Core customer deposits declined by 5% and the division further reduced its reliance on brokered deposits by 80%, leading to an overall decline of 11% in total customer deposits. Net interest margin was held steady at 2.73%, reflecting widening asset margins and management of savings rates in a competitive deposit market.
Direct expenses increased by 13% to £1,086 million, reflecting increased costs from the expansion of the commercial banking relationship management teams, write-downs on mortgage servicing rights, and higher costs related to loan work-out and collection activity together with movements in exchange rates. In dollar terms, direct expenses increased by 5% to $2,012 million.
Credit conditions worsened significantlyThe Group’s credit spreads have fluctuated over the course of the year, asbut ended the housing market continued to deteriorate and unemployment rose, exacerbating already challenging conditions. Impairment losses totalled £1,041 million, up from £340 millionyear slightly wider, resulting in 2007 reflecting the deterioration in economic conditions. In dollar terms, impairment losses totalled $1,929 million, up 184% from 2007.
In the core US Retail & Commercial portfolio, 2008 impairment losses totalled £722 million ($1,337 million), with a marked increasean overall annual decrease in the second half. Consumer non-performing loans represented 0.37%carrying value of core home equity balances and 1.20% of residential mortgage balances. While there has been a decline in some customers’ credit scores in lineown debt.
2009 compared with weakening economic conditions, refreshed weighted average FICO scores for consumer real estate-secured lending at 31 December 2008 was approximately 740 with a weighted average LTV of 63%. Stress has emerged in all consumer segments
Items not allocated during the second half of the year with increased delinquency in core home equity (up 10bps to 0.86%), and auto (up 94bps to 2.78%). US Retail & Commercial does not originate negative amortization mortgages or option adjustable rate mortgages. Closing provision balances for the core portfolio were £892 million ($1,303 million) compared with £388 million ($777 million) at the end of 2007.
Business review continued
Credit quality has continued to deteriorate sharply in the externally sourced home equity portfolio (the Serviced By Others (SBO) portfolio). On a constant currency basis this portfolio, now managed by a separate work-out group and in run-off, has been reduced by £1.0 billion over the last year to £4.9 billion and $1.5 billion in dollar terms to $7.1 billion at 31 December 2008. Non-performing SBO loans represent 2.66% of SBO balances. Impairment losses in relation to the SBO portfolio totalled £319 million ($592 million) for 2008, with £155 million ($268 million) incurred in the second half of 2008 compared with £164 million ($324 million) in the first half. Closing SBO provision balances amounted to £325 million ($474 million) at 31 December 2008, up from £208 million ($413 million) at 30 June 2008, providing a coverage rationet credit of 2.5 times non-performing loans.
£385 million. The overall commercial loan portfolio has begun to show signs of stress, with a marked deterioration in the commercial real estate book. Impairments in the commercial and industrial portfolio, including lease financing, totalled $212 million, or 0.74% of balances. Total impairments within the commercial real estate portfolio were $177 million, or 1.63% of balances.
The US business has continued to evaluate opportunities to optimise capital allocation by exiting or reducing exposure to lower growth or sub-scale segments. In the fourth quarter, 18 rural branches in the Adirondacks region were sold to Community Bank System. An agreement has also been announced to sell the Indiana retail branch banking network, consisting of 65 branches, and the business banking and regional banking activities, to Old National Bank.
2007 compared with 2006
Against the background of weaker housing andGroup's credit market conditions, the US Retail & Commercial Banking division demonstrated resilience in 2007, with a particularly good performance in corporate and commercial banking. Despite modest growth in net interest margins and strong fee growth in several products, total income fell by 7% to £2,781 million due mainly to the weak dollar exchange rate but, in dollar terms, total income was flat at $5,564 million. Tight cost control helped limit the fall in contribution. However, impairment losses increased from 0.31% of loans and advances to 0.60%, resulting in a decrease in contribution of 15% to £1,479 million, or 8% to $2,959 million in dollar terms.
Net interest income fell by 5% to £1,935 million due mainly to the unfavourable dollar exchange rate. In dollar terms, net interest income rose by 3% to $3,872 million. Average loans and advances to customers increased by 4%, with strong growth in corporate and commercial lending, up 13%, with close attention being paid to our risk appetite in light of prevailing market conditions. Average customer deposits were flat and deposit margins narrowed as a result of deposit pricing competition and continued migration from low-cost checking accounts and liquid savings to higher-cost products. Notwithstanding this migration, US Retail & Commercial Banking net interest margin increased slightly to 2.74% in 2007, compared with 2.66% in 2006, thanks in part to improved lending spreads in the latter part of the year.
Non-interest income fell by 11% to £846 million. In dollar terms, non-interest income fell by 3% to $1,692 million. Business and corporate fees rose strongly, with good results especially in foreign exchange and interest rate derivatives, driven by increasing cooperation with RBS Global Markets. Good progress was also made in credit card issuing, where we increased our customer base by 20%.
In response to more difficult market conditions the division intensified cost discipline, with a reduction in headcount helping to reduce direct expenses by 10%. In dollar terms, the fall in direct expenses was just 2%, despite enhancements to infrastructure and processes as well as continued investment in growth opportunities including mid-corporate banking, and contactless debit cards.
Rising losses and increased provisions lifted impairment costs from £180 million in 2006 to £340 million in 2007. In dollar terms, impairment losses rose from $332 million in 2006 to $680 million in 2007. Against a background of weaker economic activity the US Retail & Commercial Banking division portfolio is performing well, although we have experienced a reversion from the very low levels of impairment seen in recent years, reflecting both the planned expansion of our commercial loan book and the impact of a softer housing market. There has also been an increase in reserving. The average FICO scores on our consumer portfolios, including home equity lines of credit, remain in excess of 700, with 97% of lending secured. Average loan-to-value ratios at the end of 2007 were 58% on our residential mortgage book and 74% on our home equity book.
Business review continued
Regional Markets – Europe & Middle East Retail & Commercial Banking| | | 2008 | | | 2007 | | | 2006 | |
| | | | £m | | | | £m | | | | £m | |
| Net interest income | | | 1,087 | | | | 958 | | | | 824 | |
| Net fees and commissions | | | 320 | | | | 219 | | | | 201 | |
| Other non-interest income | | | 111 | | | | 169 | | | | 119 | |
| Non-interest income | | | 431 | | | | 388 | | | | 320 | |
| Total income | | | 1,518 | | | | 1,346 | | | | 1,144 | |
| Direct expenses | | | | | | | | | | | | |
| – staff costs | | | 404 | | | | 307 | | | | 251 | |
| – other | | | 159 | | | | 152 | | | | 114 | |
| | | | 563 | | | | 459 | | | | 365 | |
| Impairment | | | 526 | | | | 118 | | | | 104 | |
| Contribution | | | 429 | | | | 769 | | | | 675 | |
| | | £bn | | | £bn | | | £bn | |
| Total assets | | | 66.4 | | | | 56.1 | | | | 44.5 | |
| Loans and advances to customers – gross | | | | | | | | | | | | |
| – mortgages | | | 24.6 | | | | 18.3 | | | | 14.9 | |
| – corporate | | | 33.4 | | | | 25.3 | | | | 19.6 | |
| – other | | | 3.7 | | | | 4.2 | | | | 3.6 | |
| Customer deposits | | | 25.0 | | | | 22.3 | | | | 18.1 | |
| Non-performing loans | | | 3.3 | | | | 0.7 | | | | 0.5 | |
2008 compared with 2007
The significant deterioration in global and local market conditions has impacted the main Europe & Middle East markets, with contribution falling to £429 million, 44% lower than in 2007. The main driver of this reduction has been an increase of £408 million in impairments, albeit from a low base, reflecting deterioration in credit quality particularly in the property and construction sectors, as economic conditions have slowed.
Total income was up £172 million, 13% at £1,518 million benefitting from the full year of the ABN AMRO businesses and movements in exchange rates. Direct expenses were up 23% to £563 million. Impairment losses rose sharply to £526 million from £118 million reflecting the economic environment.
In sterling terms the results have been materially affected by the movement in the euro exchange rate and references to percentage movement in the following analysis are in constant currency terms.
Within the core business of the region, Ulster Bank, contribution fell to £117 million. Total income decreased by 2% to £1,269 million; net interest income increased by 1%, with average loans and advances to customers up 12% in the year. The benefit from growth in lending, particularly in the first half of the year has been offset by increased funding costs associated with the wholesale funding market dislocation. Other income was 12% lower than in 2007, reflecting a slowdown in particular in the bancassurance and wealth businesses.
Average mortgage balances in Ulster Bank were 11% higher than 2007. New mortgage volumes in the second half of the year were significantly lower than in the first six months, although levels of redemptions have also fallen.
Average deposit balances in Ulster Bank were largely flat year-on-year reflecting the highly competitive market for resources in Ireland in 2008. Deposit flows were strong in the latter part of the year and into the early months of 2009. During 2008, we opened 119,000 new current accounts driven by particularly successful current account switcher and student campaigns.
Direct expenses rose by 8% to £432 million, reflecting the full year impact of the now completed investment programme in Ulster Bank’s footprint and operations. Cost growth in the second half of 2008 was significantly lower, reflecting disciplined management of the cost base.
Impairment losses in Ulster Bank rose to £394 million, reflecting the impact on credit quality of the slowdown in the Irish economy, with the final quarter showing the most notable decline in both activity and sentiment. This was reflected in a significantly increased flow of cases into the problem debt management process.
In January 2009, Ulster Bank announced its intention to adopt a single brand strategy under the Ulster Bank brand. This will see the merger of the operations of Ulster Bank and First Active in the Republic of Ireland (“RI”) by the end of 2009. This action is being taken to strengthen the Ulster Bank Group franchise by positioning it to deal with the prevailing local and global market conditions. A number of cost management initiatives have also commenced across the business.
Ulster Bank has launched a series of initiatives to support its customers in this difficult economic period. We announced in February 2009 that we will be making significant funds available to the Northern Ireland (“NI”) SME market. A similar announcement will be made in the coming weeks regarding the RI SME market. Ulster Bank has also indicated that it is adopting the RBS Group pledge regarding certainty of overdraft limits for this sector.
The Momentum and Secure Step mortgages have been launched in NI and RI respectively to support First Time Buyers and the Bank has confirmed its pledge of a six-month moratorium to mortgage customers facing potential repossession. In support of our retail customers across the island of Ireland the Group’s MoneySense programme is being rolled out, with trained advisers being introduced to all Ulster Bank branches.
Outside Ireland, Europe & Middle East Retail & Commercial Banking continued to trade satisfactorily, although our markets in the United Arab Emirates, Romania and Kazakhstan have also experienced a marked slowdown in the past year. In UAE, we are a market leader in credit cards with over 430,000 cards in issue.
Business review continued
The sale of the European Consumer Finance business to Santander was completed on 1 July 2008, while the Imagine business in Spain was sold to Bank of America in the second half of 2008. The former ABN AMRO retail business in Russia was also closed during the year.
2007 compared with 2006
Europe and Middle East Retail & Commercial Banking maintained its success in building its personal and corporate banking business, particularly in the island of Ireland, with total income rising by 18% to £1,346 million and contribution by 14% to £769 million. These results reflect solid sales growth across all activities, driven by an enhanced range of innovative products and an expanded distribution network.
Net interest income increased by 16% to £958 million, reflecting good growth in both loans and deposits. Average loans and advances to customers increased by 24%, with particular strength in business lending, with a 29% increase spread across a variety of industrial sectors. Our mortgage book also saw very good growth in 2007, in spite of the slowdown in the housing market, with average balances up 17%. We achieved particular success in attracting remortgagers with our Switcher package. We were also successful in the current account switching market, winning 100,000 new current account customers during the year. This, together with new product launches such as the eSavings Account and Reward Reserve savings accounts, contributed to a 18% increase in average customer deposits. Net interest margin tightened, reflecting more competitive market conditions and increased funding costs.
Non-interest income rose by 21% to £388 million, driven by strong performances in Global Markets and credit cards. We successfully launched our new wealth business in the course of the year.
Direct expenses increased by 26% to £459 million, as we continued our investment programme to support the future growth of the business. We continued to expand our branch and business centre footprint and recruited additional customer-facing staff, particularly in our Global Markets business.
Impairment losses have risen to £118 million, reflecting growth in lending as well as a slowdown in economic conditions which has affected commercial credit metrics.
Business review continued
Regional Markets – Asia Retail & Commercial Banking
| | | 2008 | | | 2007 | | | 2006 | |
| | | | £m | | | | £m | | | | £m | |
| Net interest income | | | 379 | | | | 123 | | | | 52 | |
| Net fees and commissions | | | 309 | | | | 161 | | | | 136 | |
| Other non-interest income | | | 93 | | | | 71 | | | | 23 | |
| Non-interest income | | | 402 | | | | 232 | | | | 159 | |
| Total income | | | 781 | | | | 355 | | | | 211 | |
| Direct expenses | | | | | | | | | | | | |
| – staff costs | | | 284 | | | | 150 | | | | 95 | |
| – other | | | 199 | | | | 90 | | | | 50 | |
| | | | 483 | | | | 240 | | | | 145 | |
| Impairment | | | 171 | | | | 24 | | | | (1 | ) |
| Contribution | | | 127 | | | | 91 | | | | 67 | |
| | | £bn | | | £bn | | | £bn | |
| Total assets | | | 8.3 | | | | 7.6 | | | | 3.1 | |
| Loans and advances to customers – gross | | | 5.8 | | | | 4.5 | | | | 1.6 | |
| Investment management assets – excluding deposits | | | 21.2 | | | | 19.9 | | | | 0.3 | |
| Customer deposits | | | 15.1 | | | | 10.8 | | | | 6.5 | |
| Non-performing loans | | | 0.3 | | | | 0.5 | | | | — | |
2008 compared with 2007
Total income rose by £426 million to £781 million largely reflecting the full year contribution from the acquired ABN AMRO businesses. Retail & Commercial Banking income was up £380 million reflecting the full year contribution of the ABN AMRO business with the Affluent banking income slowing markedly in the second half due to reduced structured product and equity fund sales, as investors stayed out of volatile markets. Income was particularly strong from RBS Coutts, increasing £46 million or 19%. Comparisons with the previous year are affected by the marked weakening of sterlingfluctuated over the course of the year.
Credit cards and consumer finance credit metrics have continually been reviewed overyear, but ended the periodyear slightly tighter, resulting in further tightening of consumer lending policies. This has led to lower levels of card and loan acquisition. There has also been a slowdown in the number of card transactions. Despite this, the cards and consumer finance business reported income growth together with an increase in consumer net receivables.
Business banking has seen strong growth across most regions, having performed particularly well in the Indian, Pakistani and Chinese markets.
RBS Coutts’ offeringcarrying value of private banking and investment services continued to deliver good income growth of 19% and strong levels of client acquisition, up 5% in the year. Net interest income grew 56% on the back of strong banking volumes, though thisown debt. This was offset in part by weaker sales of equity-related investment products and lower assets under management. Despite adverse financial markets and significant levels of client deleveraging, assets under management in the international wealth business grew by 8%.
Direct expenses rose by £243 million to £483 million, reflecting the full year impact of the acquired ABN AMRO businesses, legal costs and continued investment in the Group’s infrastructure in the region, including the recruitment of additional experienced private bankers in RBS Coutts Asia.
Impairments increased from £24 million to £171 million, relecting the full year impact of the acquired ABN AMRO businesses which are predominately consumer focused, and an increase in provisioning levels across a number of consumer finance markets in the region.
Total assets under management for the division at 31 December 2008 were 7% higher than a year earlier at £21.2 billion, while customer deposits were 40% higher at £15.1 billion, partly reflecting exchange rate movements.
2007 compared with 2006
2007 results reflect the introduction of ABN AMRO businesses in the Asia region. Asia Retail & Commercial’s 2007 results include the accounting for 76 days of the Asia Retail arm of ABN AMRO (total income £101 million, total direct expenses £57 million, total contribution £21 million including £23 million of impairment losses). Asia Retail & Commercial Banking reported strong growth, with total income rising 68% to £355 million. Contribution grew by 36% to £91 million.
The division operates in 8 countries in Asia: China, Hong Kong, India, Indonesia, Malaysia, Pakistan, Singapore and Taiwan, across 4 core business segments: affluent banking, cards & consumer finance, business banking and private banking.
RBS Coutts, which excludes the ABN AMRO businesses, offering of private banking and investment services delivered good organic income growth in 2007. The division has seen healthy levels of client acquisition with growth in banking volumes leading to a rise of 21% in net interest income. Non-interest income grew by 18%, largely driven by a rise in transactional, market-driven income and volumes as a result of consistent global equity market growth and positive client sentiment.
Direct expenses rose by 66% to £240 million, reflecting the part-year inclusion of ABN AMRO’s Asia Retail division and underlying investment in the existing wealth management businesses in the region. Despite the highly competitive market, RBS Coutts successfully recruited additional, experienced private bankers.
Impairment losses, at £24 million, have increased from negligible levels in 2006 reflecting the introduction of the ABN AMRO businesses in the Asia region.
Business review continuedRBS Insurance
| | | 2008 | | | 2007 | | | 2006 | |
| | | | £m | | | | £m | | | | £m | |
| Earned premiums | | | 5,520 | | | | 5,607 | | | | 5,713 | |
| Reinsurers’ share | | | (227 | ) | | | (220 | ) | | | (212 | ) |
| Insurance premium income | | | 5,293 | | | | 5,387 | | | | 5,501 | |
| Net fees and commissions | | | (401 | ) | | | (465 | ) | | | (486 | ) |
| Other income | | | 674 | | | | 734 | | | | 664 | |
| Total income | | | 5,566 | | | | 5,656 | | | | 5,679 | |
| Direct expenses | | | | | | | | | | | | |
| – staff costs | | | 309 | | | | 297 | | | | 319 | |
| – other | | | 462 | | | | 444 | | | | 423 | |
| | | | 771 | | | | 741 | | | | 742 | |
| Gross claims | | | 3,857 | | | | 4,091 | | | | 4,030 | |
| Reinsurers’ share | | | (124 | ) | | | (81 | ) | | | (60 | ) |
| Net claims | | | 3,733 | | | | 4,010 | | | | 3,970 | |
| Impairment | | | 42 | | | | — | | | | — | |
| Contribution | | | 1,020 | | | | 905 | | | | 967 | |
| In-force policies (000’s) | | | | | | | | | |
| – Own-brand motor | | | 6,964 | | | | 6,713 | | | | 6,790 | |
| – Own-brand non-motor (home, rescue, pet, HR24) | | | 5,642 | | | | 3,752 | | | | 3,759 | |
| – Partnerships and broker (motor, home, rescue, SMEs, pet, HR24) | | | 8,450 | | | | 9,302 | | | | 11,242 | |
| General insurance reserves – total (£m) | | | 8,159 | | | | 8,192 | | | | 8,068 | |
2008 compared with 2007
RBS Insurance made good progress in 2008, with contribution rising by £115 million to a record £1,020 million, an increase of 13%. Total income was £90 million lower at £5,566 million, reflecting a fall in insurance premium income following the continuation of the strategic decision to exit less profitable partnership contracts and the effect of financial market conditions on investment income.
Own-brand businesses increased income by 4% and contribution before impairments by 13%. In the UK motor market the Group increased premium rates to offset claims inflation and continued to target lower risk drivers, with price increases concentrated in higher risk categories in order to improve profitability. During 2008 selected brands were successfully deployed on a limited number of aggregator web sites. Our international businesses in Spain, Italy and Germany performed well, with income up 24% and contribution up 37%. Over the last year own-brand motor policy numbers have again begun to increase, and rose by 4% to 7.0 million.
In own-brand non-motor insurance we have continued to achieve good sales through the RBS Group, where home insurance policies in force have increased by 33%. In addition, Privilege and Churchill have grown home policies by 90% and 13% respectively compared with 2007, mainly due to an increase in online sales as a result of successful marketing campaigns. A new commercial insurance offering, Direct Line for Business, was launched, and has grown rapidly over the year with particularly strong performances in Residential Property and Tradesman policies. Overall own-brand non-motor policies in force have grown by 50% to 5.6 million, benefiting from the addition of rescue cover to RBS and NatWest current account package customers.
Results from partnerships and broker business confirmed the Group’s strategy of refocusing on the more profitable opportunities in this segment, where we provide underwriting and processing services to third parties. The Group did not renew a number of rescue contracts and pulled back from some less profitable segments of the broker market. As a result partnership and broker in-force policies have fallen by 9% over the last year with a corresponding 9% reduction in income, yet contribution grew by 27%.
For RBS Insurance as a whole, insurance premium income, net of fees and commissions, was broadly maintained at £4,892 million, reflecting 7% growth in the Group’s own brands offset by a 10% decline in the partnerships and broker segment. Other income declined by 8% to £674 million, reflecting the effect of depressed financial marketsnet credit on investment income.
Direct expenses grew by 4% to £771 million, in part as a result of accelerated marketing development in own brands,unallocated Group Treasury items, including the launchimpact of Direct Lineeconomic hedges that do not qualify for Business.
Net claims fell by 7% to £3,733 million, benefiting from ongoing claims containment and more benign weather conditions. Impairments of £42 million reflect impairments recognised in corporate bond and equities investment portfolios.
2007 compared with 2006
RBS Insurance has made good progress in 2007 in competitive markets. Total income was maintained at £5,656 million, in line with 2006 levels, with growth in our own-brand businesses offset by a decline in partnerships.
IFRS hedge accounting. 2008 results included some significant disposal gains.
Business reviewcontinued | Business review |
Non-Core
| | 2010 | 2009 | 2008 |
| | £m | £m | £m |
| Net interest income from banking activities | 1,966 | 1,504 | 2,028 |
| Funding costs of rental assets | (283) | (256) | (380) |
| Net interest income | 1,683 | 1,248 | 1,648 |
| Net fees and commissions | 449 | 472 | 889 |
| Loss from trading activities | (16) | (5,123) | (7,716) |
| Insurance net premium income | 702 | 784 | 986 |
| Other operating income | | | |
| - rental income | 1,035 | 976 | 1,190 |
- other (1) | (820) | (658) | (29) |
| Non-interest income | 1,350 | (3,549) | (4,680) |
| Total income | 3,033 | (2,301) | (3,032) |
| Direct expenses | | | |
| - staff | (731) | (851) | (988) |
| - operating lease depreciation | (452) | (402) | (475) |
| - other | (642) | (642) | (681) |
| Indirect expenses | (500) | (552) | (539) |
| | (2,325) | (2,447) | (2,683) |
| Insurance net claims | (737) | (588) | (700) |
| Impairment losses | (5,476) | (9,221) | (4,936) |
| Operating loss | (5,505) | (14,557) | (11,351) |
| | | | |
| Analysis of income by business | | | |
| Banking & portfolios | 550 | (1,338) | 2,324 |
| International businesses & portfolios | 1,922 | 2,262 | 2,980 |
| Markets | 561 | (3,225) | (8,336) |
| Total income | 3,033 | (2,301) | (3,032) |
| | | | |
| Performance ratios | | | |
| Net interest margin | 1.16% | 0.69% | 0.87% |
| Cost:income ratio | 77% | (106%) | (88%) |
| Adjusted cost:income ratio | 101% | (85%) | (72%) |
| | | | |
| | £bn | £bn | £bn |
Capital and balance sheet (2,3) | | | |
| Total third party assets (excluding derivatives) | 137.9 | 201.0 | 257.9 |
| Total third party assets (including derivatives) | 153.9 | 220.9 | 342.9 |
| Loans and advances to customers (gross) | 108.4 | 149.5 | 191.4 |
| Customer deposits | 6.7 | 12.6 | 27.4 |
| Risk elements in lending | 23.4 | 22.9 | 11.1 |
| Risk-weighted assets | 153.7 | 171.3 | 170.9 |
| (1) | Includes losses on disposals of £504 million for the year ended 31 December 2010. |
| (2) | Includes disposal groups. |
| (3) | Includes RBS Sempra Commodities JV: 2010 third party assets (TPAs) £6.7 billion; RWAs £4.3 billion (2009 TPAs £14.2 billion; RWAs £10.2 billion). |
Business review continued
Contribution fell by 6% to £905 million, reflecting the impact of the severe flooding experienced in June and July. Excluding the £274 million impact of the floods, contribution grew by 22%, supported by strong claims management and the benefits of improved risk selection in this and prior years. We have continued to focus on selective underwriting of more profitable business.
Our own-brand businesses have performed well, with income rising by 1% and contribution growing by 4%. Excluding the impact of the floods, own-brand contribution grew by 24%. In the UK motor market we have pursued a strategy of targeting lower risk drivers and have increased premium rates to offset claims inflation, improving profitability by implementing heavier price increases in higher risk categories. Our international businesses performed well, with Spain delivering strong profit growth while, in line with plan, our German and Italian businesses also achieved profitability in 2007. Home insurance grew across all of our own brands in the second half, and we achieved particular success in the distribution of home policies through our bank branches, with sales up 40%.
In our partnerships and broker business, providing underwriting and processing services to third parties, we have concentrated on more profitable opportunities and have consequently not renewed a number of large rescue contracts. We also pulled back from some less profitable segments of the broker market. This resulted in a 17% reduction in in-force policies, but income fell by only 2%. Contribution from partnerships and brokers fell by 22% as a result of flood-related claims. Excluding the impact of the floods, contribution from partnerships and brokers increased by 18%.
For RBS Insurance as a whole, insurance premium income, net of fees and commissions, was 2% lower at £4,922 million, reflecting modest growth in our own brands offset by a 5% decline in the partnerships and broker segment. Other income rose by 11% to £734 million, reflecting increased investment income.
Direct expenses were flat at £741 million. Within this, staff costs reduced by 7%, reflecting our continued focus on improving efficiency whilst maintaining service standards. A 5% rise in non-staff costs reflects increased marketing investment in our own brands.
Net claims rose by 1% to £4,010 million. Gross claims relating to the floods in June and July cost more than £330 million, with a net impact, after allowing for profit sharing and reinsurance, of £274 million. Excluding the impact of the floods, net claims costs were reduced by 6%. In the motor book, while average claims costs have continued to rise, this has been mitigated by improvements in risk selection and management and by continuing efficiencies in claims handling.
Business review continued
Business reviewcontinued | Business review |
Group ManufacturingNon-Core continued
| | | 2008 | | | 2007 | | | 2006 | |
| | | | £m | | | | £m | | | | £m | |
| Staff costs | | | 1,197 | | | | 998 | | | | 934 | |
| Other costs | | | 3,596 | | | | 2,775 | | | | 2,589 | |
| Total manufacturing costs | | | 4,793 | | | | 3,773 | | | | 3,523 | |
| | | | | | | | | | | | | |
| Analysis of manufacturing costs: | | | | | | | | | | | | |
| Technology Services and support functions | | | 1,757 | | | | 1,336 | | | | 1,222 | |
| Group Property | | | 1,690 | | | | 1,262 | | | | 1,167 | |
| Global Operations | | | 1,346 | | | | 1,175 | | | | 1,134 | |
| Total manufacturing costs | | | 4,793 | | | | 3,773 | | | | 3,523 | |
| | 2010 | 2009 | 2008 |
| | £m | £m | £m |
| (Loss)/income from trading activities | | | |
| Monoline exposures | (5) | (2,387) | (3,121) |
| Credit derivative product companies | (139) | (947) | (615) |
Asset-backed products (1) | 235 | (288) | (3,220) |
| Other credit exotics | 77 | (558) | (935) |
| Equities | (17) | (47) | (947) |
| Leveraged finance | — | — | (1,088) |
| Banking book hedges | (82) | (1,613) | 1,690 |
Other (2) | (85) | 717 | 520 |
| | (16) | (5,123) | (7,716) |
| | | | |
| Impairment losses | | | |
| Banking & portfolios | 1,311 | 4,215 | 938 |
| International businesses & portfolios | 4,217 | 4,494 | 1,832 |
| Markets | (52) | 512 | 2,166 |
| Total impairment losses | 5,476 | 9,221 | 4,936 |
| | | | |
Loan impairment charge as % of gross customer loans and advances (excluding reverse repurchase agreements) (3) | | | |
| Banking & portfolios | 2.2% | 4.9% | 0.9% |
| International businesses & portfolios | 7.9% | 6.6% | 2.3% |
| Markets | 0.1% | 5.2% | 9.4% |
| | 4.9% | 5.7% | 2.2% |
| | | | |
| | £bn | £bn | £bn |
| Gross customer loans and advances | | | |
| Banking & portfolios | 55.6 | 82.0 | 97.0 |
| International businesses & portfolios | 52.5 | 65.6 | 79.9 |
| Markets | 0.3 | 1.9 | 14.5 |
| | 108.4 | 149.5 | 191.4 |
| | | | |
| Risk-weighted assets | | | |
| Banking & portfolios | 51.2 | 58.2 | 63.1 |
| International businesses & portfolios | 37.5 | 43.8 | 50.1 |
| Markets | 65.0 | 69.3 | 57.7 |
| | 153.7 | 171.3 | 170.9 |
2008 compared with 2007
Group Manufacturing costs increased by 27% to £4,793 million in 2008. This growth reflects movements in exchange rates and the inclusion of a full year of ABN AMRO related costs (£937 million) in 2008 whereas 2007 reflects the costs incurred from the date of acquisition (£193 million).
Increasing business volumes have been absorbed through improvements in productivity. Group Manufacturing has maintained high levels of customer satisfaction while continuing to invest in the further development of the business.| | 31 December 2009 £bn | Run-off £bn | Disposals/ restructuring £bn | Drawings/ roll overs £bn | Impairments £bn | FX £bn | 31 December 2010 £bn |
| Third party assets (excluding derivatives) |
| Commercial real estate | 51.3 | (6.2) | (1.4) | 3.2 | (4.6) | 0.3 | 42.6 |
| Corporate | 82.6 | (12.0) | (13.0) | 2.0 | (0.2) | 0.4 | 59.8 |
| SME | 3.9 | (0.2) | — | 0.1 | (0.1) | — | 3.7 |
| Retail | 19.9 | (7.7) | (2.6) | 0.1 | (0.6) | (0.1) | 9.0 |
| Other | 4.7 | (2.1) | (0.4) | 0.3 | — | — | 2.5 |
| Markets | 24.4 | (3.0) | (9.8) | 1.3 | — | 0.7 | 13.6 |
| Total (excluding derivatives) | 186.8 | (31.2) | (27.2) | 7.0 | (5.5) | 1.3 | 131.2 |
Markets - RBS Sempra Commodities JV | 14.2 | (1.7) | (6.3) | — | — | 0.5 | 6.7 |
Total (4) | 201.0 | (32.9) | (33.5) | 7.0 | (5.5) | 1.8 | 137.9 |
Technology Services and support functions costs increased by 32% to £1,757 million. This growth reflects the inclusion of a full year of ABN AMRO related costs (£453 million) in 2008 whereas 2007 includes only the post acquisition element of costs (£104 million). In addition, increases in business demand have been balanced by savings delivered across the business.Notes:
| (1) | Asset-backed products include super senior asset-backed structures and other asset-backed products. |
Group Property costs increased by 34% to £1,690 million. This growth reflects the inclusion of a full year of ABN AMRO related costs (£309 million) in 2008 whereas 2007 includes only the post acquisition element of costs (£61 million) together with further development of the Group’s Corporate Banking branch network and investment in Manufacturing infrastructure.| (2) | Includes profits in RBS Sempra Commodities JV of £19 million (2009 - £770 million; 2008 - £764 million). |
| (3) | Includes disposal groups. |
Global Operations cost increased by 15% to £1,346 million. This growth reflects the inclusion of a full year of ABN AMRO costs (£174 million) in 2008 whereas 2007 includes only the post acquisition element of 2007 costs (£28 million). Further improvements in productivity enabled us to continue to absorb increases in volumes and global inflationary pressure. Ongoing investment in process re-engineering across our operational centres under the 'Work-Out' banner continues to deliver efficiency gains.
2007 compared with 2006
Manufacturing costs increased by 7% to £3,773 million reflecting the inclusion of £193 million related to the ABN AMRO business which was acquired in October 2007. Excluding ABN AMRO, costs have increased by 2%. Further improvements in productivity have enabled us to support growth in business volumes and to maintain high levels of customer satisfaction while continuing to invest in the further development of our business.
Technology Services and Support Functions costs increased by 9% to £1,336 million. Excluding ABN AMRO (£104 million) costs from 2007, costs grew by only 1% as a result of continued tight cost control and investment in software development being balanced by significant improvements in productivity.
Group Property costs rose by 8% to £1,262 million. Excluding ABN AMRO costs (£61 million) from 2007, costs rose by 3% reflecting refurbishment and expansion of the Ulster Bank network and continuing investment to support the strong growth of our business in Europe and Asia, including the opening of a new Global Markets office in Paris and further development of our office portfolio in India and Singapore.
Global Operations costs rose by 4% to £1,175 million. Excluding ABN AMRO costs (£28 million) from 2007, costs rose by 1% with further significant improvements in productivity enabling us to continue to absorb significant increases in service volumes. At the same time we maintained our focus on service quality, and our UK-based telephony centres continued to record market-leading customer satisfaction scores. Our investment in process re-engineering across our operational centres under the ‘Work-Out’ banner is expected to deliver further improvements in efficiency.| (4) | £12 billion of disposals have been signed as of 31 December 2010 but are pending closing (2009 - £3 billion; 2008 - nil). |
Business reviewcontinued | Business review |
| | 2010 £m | 2009 £m | 2008 £m |
| Loan impairment losses by donating division and sector |
| UK Retail | | | |
| Mortgages | 5 | 6 | 1 |
| Personal | 8 | 47 | 42 |
| Other | — | — | 62 |
| Total UK Retail | 13 | 53 | 105 |
| | | | |
| UK Corporate | | | |
| Manufacturing and infrastructure | 26 | 87 | 42 |
| Property and construction | 437 | 651 | 281 |
| Transport | 3 | 10 | (3) |
| Banks and financials | 69 | 102 | 4 |
| Lombard | 129 | 95 | 61 |
| Invoice finance | (3) | 3 | — |
| Other | 169 | 729 | 142 |
| Total UK Corporate | 830 | 1,677 | 527 |
| | | | |
| Ulster Bank | | | |
| Mortgages | 42 | 42 | 6 |
| Commercial investment and development | 699 | 303 | 9 |
| Residential investment and development | 1,690 | 716 | 229 |
| Other | 251 | 217 | 60 |
| Other EMEA | 52 | 106 | 116 |
| Total Ulster Bank | 2,734 | 1,384 | 420 |
| | | | |
| US Retail & Commercial | | | |
| Auto and consumer | 82 | 136 | 140 |
| Cards | 23 | 130 | 63 |
| SBO/home equity | 277 | 452 | 321 |
| Residential mortgages | 4 | 54 | 6 |
| Commercial real estate | 185 | 224 | 54 |
| Commercial and other | 17 | 83 | 20 |
| Total US Retail & Commercial | 588 | 1,079 | 604 |
| | | | |
| Global Banking & Markets | | | |
| Manufacturing and infrastructure | (290) | 1,404 | 1,280 |
| Property and construction | 1,296 | 1,413 | 710 |
| Transport | 33 | 178 | 12 |
| Telecoms, media & technology | 9 | 545 | 55 |
| Banks and financials | 196 | 620 | 870 |
| Other | 14 | 567 | 177 |
| Total Global Banking & Markets | 1,258 | 4,727 | 3,104 |
| | | | |
| Other | | | |
| Wealth | 51 | 251 | 174 |
| Global Transaction Services | — | 49 | (2) |
| Central items | 2 | 1 | 4 |
| Total Other | 53 | 301 | 176 |
| | | | |
| Total impairment losses | 5,476 | 9,221 | 4,936 |
Business review continuedCentral items
| | | 2008 | | | 2007 | | | 2006 | |
| | | | £m | | | | £m | | | | £m | |
| Funding costs | | | 1,330 | | | | 623 | | | | 566 | |
| Departmental costs | | | 665 | | | | 438 | | | | 425 | |
| Other corporate costs | | | (1,320 | ) | | | (509 | ) | | | 240 | |
| Total central Items | | | 675 | | | | 552 | | | | 1,231 | |
2008 compared with 2007
Central costs increased by £123 million to £675 million.
Funding costs rose by £707 million to £1,330 million, reflecting higher funding costs for the full year related to the acquisition of ABN AMRO in October 2007. Funding costs also rose due to higher cost of funds including those relating to the Bank of England Special Liquidity Scheme. The Group seeks to hedge its interest rate risk economically, and it is not always possible to achieve hedge accounting in accordance with IFRS. The movements in interest rates, currencies and inflation indices, particularly in the latter part of 2008, resulted in volatility for accounting purposes, leading to a charge of £204 million in 2008. These costs were largely offset by increased dividends from Bank of China and benefits from the additional capital raised during the year.
Departmental costs rose by £227 million to £665 million, including the full year impact of the acquisition of ABN AMRO. This also reflects an increase in central function headcount as well as higher Basel II costs.
Other corporate costs amounted to a net credit of £1,320 million, compared with a net credit of £509 million in 2007. The increase reflects higher gains in the fair value of own debt and the profit on sale of Tesco Personal Finance in 2008.
2007 compared with 2006
Central Costs reduced by £679 million to £552 million.
Funding costs rose by £57 million reflecting an increase in funding costs of £144 million relating to ABN AMRO partially offset by a reduction in the carrying value of our own debt accounted for at fair value and the receipt of a dividend on our investment in Bank of China.
Departmental and other costs increased by 3% to £438 million. This largely reflects the centralisation of certain functions and increased regulatory requirements.
Other Corporate costs were substantially lower amounting to a net credit of £509 million, reflecting the gains realised on a number of planned disposals that formed part of the Group’s funding arrangements for the acquisition of ABN AMRO.
Business reviewcontinued | Business review |
| Gross loans and advances to customers (excluding reverse repurchase agreements) by donating division and sector | 2010 £bn | 2009 £bn | 2008 £bn |
| UK Retail | | | |
| Mortgages | 1.6 | 1.9 | 2.2 |
| Personal | 0.4 | 0.7 | 1.1 |
| Total UK Retail | 2.0 | 2.6 | 3.3 |
| | | | |
| UK Corporate | | | |
| Manufacturing and infrastructure | 0.3 | 0.3 | 0.3 |
| Property and construction | 11.4 | 14.1 | 11.3 |
| Lombard | 1.7 | 2.9 | 3.7 |
| Invoice finance | — | 0.4 | 0.7 |
| Other | 13.6 | 17.2 | 22.1 |
| Total UK Corporate | 27.0 | 34.9 | 38.1 |
| | | | |
| Ulster Bank | | | |
| Mortgages | — | 6.0 | 6.5 |
| Commercial investment and development | 5.6 | 3.0 | 2.9 |
| Residential investment and development | 7.1 | 5.6 | 5.9 |
| Other | 1.9 | 1.1 | 1.1 |
| Other EMEA | 0.4 | 1.0 | 1.3 |
| Total Ulster Bank | 15.0 | 16.7 | 17.7 |
| | | | |
| US Retail & Commercial | | | |
| Auto and consumer | 2.6 | 3.2 | 4.2 |
| Cards | 0.1 | 0.5 | 0.7 |
| SBO/home equity | 3.2 | 3.7 | 5.2 |
| Residential mortgages | 0.7 | 0.8 | 1.1 |
| Commercial real estate | 1.5 | 1.9 | 3.0 |
| Commercial and other | 0.5 | 0.9 | 1.4 |
| Total US Retail & Commercial | 8.6 | 11.0 | 15.6 |
| | | | |
| Global Banking & Markets | | | |
| Manufacturing and infrastructure | 8.7 | 17.5 | |
| Property and construction | 19.6 | 25.7 | |
| Transport | 5.5 | 5.8 | |
| Telecoms, media and technology | 0.9 | 3.2 | |
| Banks and financials | 12.0 | 16.0 | |
| Other | 9.0 | 13.5 | |
| Total Global Banking & Markets | 55.7 | 81.7 | 104.8 |
| | | | |
| Other | | | |
| Wealth | 0.4 | 2.6 | 3.6 |
| Global Transaction Services | 0.3 | 0.8 | 1.4 |
| RBS Insurance | 0.2 | 0.2 | 0.2 |
| Central items | (1.0) | (3.2) | — |
| Total Other | (0.1) | 0.4 | 5.2 |
| | | | |
| Gross loans and advances to customers (excluding reverse repurchase agreements) | 108.2 | 147.3 | 184.7 |
| | | 2008 | | | 2007 | | | 2006 | |
| | | | £m | | | | £m | | | | £m | |
| Net interest income | | | (175 | ) | | | 15 | | | | - | |
| Non-interest income | | | (18 | ) | | | (54 | ) | | | - | |
| Total income | | | (193 | ) | | | (39 | ) | | | - | |
| Operating expenses | | | 62 | | | | 37 | | | | - | |
| Depreciation and amortisation | | | 41 | | | | - | | | | - | |
| | | | 103 | | | | 37 | | | | - | |
| Impairment | | | 4 | | | | (3 | ) | | | - | |
| Contribution | | | (300 | ) | | | (73 | ) | | | - | |
| | | | | | | | | | | | | |
| | | | | | | | | | | | | |
| | | | £bn | | | | £bn | | | | £bn | |
| Total assets | | | 2.0 | | | | 27.2 | | | | - | |
Share of shared assets recorded a loss of £300 million in 2008 compared with a loss of £73 million in 2007. This reflected the inclusion of a full year compared with 76 days in 2007.
RFS Holdings minority interest
| | | 2008 | | | 2007 | | | 2006 | |
| | | | £m | | | | £m | | | | £m | |
| Net interest income | | | 2,911 | | | | 545 | | | | - | |
| Non-interest income | | | 1,916 | | | | 287 | | | | - | |
| Total income | | | 4,827 | | | | 832 | | | | - | |
| Operating expenses | | | 3,303 | | | | 573 | | | | - | |
| Depreciation and amortisation | | | 843 | | | | 58 | | | | - | |
| | | | 4,146 | | | | 631 | | | | - | |
| Impairment | | | 640 | | | | 38 | | | | - | |
| Contribution | | | 41 | | | | 163 | | | | - | |
| | | | | | | | | | | | | |
| | | | | | | | | | | | | |
| | | | £bn | | | | £bn | | | | £bn | |
| Total assets | | | 183.0 | | | | 245.8 | | | | - | |
RFS Holdings minority interest recorded a contribution of £41 million (2007 - £163 million). This reflected the full year contribution in 2008 compared with 76 days in 2007, offset by increased impairment.
Employee numbers at 31 December (full time equivalents rounded to the nearest hundred)
| | | 2008 | | | 2007 | | | 2006 | |
| Global Banking & Markets | | | 20,200 | | | | 24,100 | | | | 8,500 | |
| Global Transaction Services | | | 4,500 | | | | 3,700 | | | | 2,600 | |
| UK Retail & Commercial Banking | | | 46,500 | | | | 46,200 | | | | 42,900 | |
| US Retail & Commercial Banking | | | 17,600 | | | | 17,800 | | | | 18,300 | |
| Europe & Middle East Retail & Commercial Banking | | | 7,900 | | | | 7,900 | | | | 5,600 | |
| Asia Retail & Commercial Banking | | | 11,500 | | | | 8,900 | | | | 4,500 | |
| RBS Insurance | | | 16,600 | | | | 17,300 | | | | 17,600 | |
| Group Manufacturing | | | 44,900 | | | | 42,500 | | | | 32,200 | |
| Centre | | | 4,300 | | | | 4,200 | | | | 2,800 | |
| | | | 174,000 | | | | 172,600 | | | | 135,000 | |
| Integration | | | 900 | | | | — | | | | — | |
| Share of shared assets | | | 400 | | | | 1,200 | | | | — | |
| RFS minority interest | | | 24,500 | | | | 21,600 | | | | — | |
| Group total | | | 199,800 | | | | 195,400 | | | | 135,000 | |
Business reviewcontinued | Business review |
2010 compared with 2009
By the end of 2010 third party assets (excluding derivatives) had decreased to £138 billion, £5 billion lower than the end of year target, as a result of a successful disposal strategy, managed portfolio run-off and impairments.
2010 operating losses in Non-Core were 62% lower than those recorded in 2009. The improvement in performance was driven by significantly lower trading losses, reduced expenses and a marked decline in impairments.
Losses from trading activities declined from £5,123 million for 2009 to £16 million for 2010 as underlying asset prices recovered, offset by continuing weakness in credit spreads. The division has recorded profits on the disposal of many asset-backed securities positions. In addition, a significantly smaller loss of £161 million was recorded on banking book hedges as spreads tightened, compared with £1,728 million in 2009.
Staff expenses fell by 14% over the year, largely driven by the impact of business divestments, including a number of country exits and the disposal of substantially all of the Group’s interest in the RBS Sempra Commodities JV.
Impairments were £3,745 million lower than 2009. The decline reflects the overall improvement in the economic environment, although still high loss rates reflect the difficult conditions experienced in specific sectors, including both UK and Irish commercial property sectors.
Wholesale country exits completed during 2010 were Chile, Colombia, Pakistan and Taiwan.
Risk-weighted assets decreased by £18 billion (10%), reflecting active management to reduce trading book risk and disposals, partially offset by the impact of regulatory changes (£30 billion) and more conservative weightings applied to large corporate exposures.
2009 compared with 2008
Losses from trading activities have declined significantly as underlying asset prices rallied. Mark-to-market values for exposures such as monolines, super senior high grade collateralised debt obligations, and many negative basis trade asset classes have risen over the course of 2009. However, the £1.6 billion gain recorded on banking book hedging in 2008 unwound over the course of the year to a loss of £1.6 billion in 2009, as spreads continued to tighten throughout the year, ending almost in line with origination levels.
Impairment losses increased to £9.2 billion, reflecting continued weakness in the economic environment, particularly across the corporate and property sectors. There were signs of a slowdown in the rate of provisioning towards the end of the year.
Staff costs decreased by 14% over the year, or by 20% at constant exchange rates, due to headcount reductions and business divestments, notably Linea Directa and Tesco Personal Finance. Lower depreciation charges followed the 2008 sale of the Angel Trains business.
Third party assets, excluding derivatives, decreased by £56.9 billion in the year as the division has run down exposures and pursued opportunities to dispose of loan portfolios. Sales of equity stakes, including Bank of China, were concluded while further disposals announced in 2009, including Asian retail and commercial operations, are moving towards completion in 2010.
Risk-weighted assets increased by 0.2% in 2009, and at constant exchange rates increased by 3%. The reduction of 15% since 30 September 2009, reflects active management to reduce trading book exposures, largely offset by the impact of procyclicality, monoline downgrades and adverse market risk.
Business review continuedBusiness reviewcontinued | Business review |
Consolidated balance sheet at 31 December 20082010
| | | 2008 | | | 2007 | | 2010 | 2009 | 2008 |
| | | | £m | | | | £m | | £m | £m | £m |
| Assets | | | | | | | | | |
| Cash and balances at central banks | | | 12,400 | | | | 17,866 | | 57,014 | 52,261 | 12,400 |
| Net loans and advances to banks | | 57,911 | 56,656 | 79,426 |
| Reverse repurchase agreements and stock borrowing | | 42,607 | 35,097 | 58,771 |
| Loans and advances to banks | | | 138,197 | | | | 219,460 | | 100,518 | 91,753 | 138,197 |
| Net loans and advances to customers | | 502,748 | 687,353 | 835,409 |
| Reverse repurchase agreements and stock borrowing | | 52,512 | 41,040 | 39,313 |
| Loans and advances to customers | | | 874,722 | | | | 828,538 | | 555,260 | 728,393 | 874,722 |
| Debt securities | | | 267,549 | | | | 294,656 | | 217,480 | 267,254 | 267,549 |
| Equity shares | | | 26,330 | | | | 53,026 | | 22,198 | 19,528 | 26,330 |
| Settlement balances | | | 17,832 | | | | 16,589 | | 11,605 | 12,033 | 17,832 |
| Derivatives | | | 992,559 | | | | 277,402 | | 427,077 | 441,454 | 992,559 |
| Intangible assets | | | 20,049 | | | | 49,916 | | 14,448 | 17,847 | 20,049 |
| Property, plant and equipment | | | 18,949 | | | | 18,745 | | 16,543 | 19,397 | 18,949 |
| Deferred tax | | | 7,082 | | | | 3,119 | | 6,373 | 7,039 | 7,082 |
| Prepayments, accrued income and other assets | | | 24,402 | | | | 15,662 | | 12,576 | 20,985 | 24,402 |
| Assets of disposal groups | | | 1,581 | | | | 45,850 | | 12,484 | 18,542 | 1,581 |
| Total assets | | | 2,401,652 | | | | 1,840,829 | | 1,453,576 | 1,696,486 | 2,401,652 |
| | | | | |
| Liabilities | | | | | | | | | | | |
| Bank deposits | | 66,051 | 104,138 | 174,378 |
| Repurchase agreements and stock lending | | 32,739 | 38,006 | 83,666 |
| Deposits by banks | | | 258,044 | | | | 312,294 | | 98,790 | 142,144 | 258,044 |
| Customers deposits | | 428,599 | 545,849 | 581,369 |
| Repurchase agreements and stock lending | | 82,094 | 68,353 | 58,143 |
| Customer accounts | | | 639,512 | | | | 682,363 | | 510,693 | 614,202 | 639,512 |
| Debt securities in issue | | | 300,289 | | | | 274,172 | | 218,372 | 267,568 | 300,289 |
| Settlement balances and short positions | | | 54,277 | | | | 91,021 | | |
| Settlement balances | | 10,991 | 10,413 | 11,741 |
| Short positions | | 43,118 | 40,463 | 42,536 |
| Derivatives | | | 971,364 | | | | 272,052 | | 423,967 | 424,141 | 971,364 |
| Accruals, deferred income and other liabilities | | | 31,482 | | | | 34,208 | | 23,089 | 30,327 | 31,482 |
| Retirement benefit liabilities | | | 2,032 | | | | 460 | | 2,288 | 2,963 | 2,032 |
| Deferred tax | | | 4,165 | | | | 5,400 | | 2,142 | 2,811 | 4,165 |
| Insurance liabilities | | | 9,976 | | | | 10,162 | | 6,794 | 10,281 | 9,976 |
| Subordinated liabilities | | | 49,154 | | | | 38,043 | | 27,053 | 37,652 | 49,154 |
| Liabilities of disposal groups | | | 859 | | | | 29,228 | | 9,428 | 18,890 | 859 |
| Total liabilities | | | 2,321,154 | | | | 1,749,403 | | 1,376,725 | 1,601,855 | 2,321,154 |
| | | | | | | | | | | | |
| Minority interests | | | 21,619 | | | | 38,388 | | |
| Equity owners | | | 58,879 | | | | 53,038 | | |
| Non-controlling interests | | 1,719 | 16,895 | 21,619 |
| Owners’ equity | | 75,132 | 77,736 | 58,879 |
| Total equity | | | 80,498 | | | | 91,426 | | 76,851 | 94,631 | 80,498 |
| | | | | | | | | | | | |
| Total liabilities and equity | | | 2,401,652 | | | | 1,840,829 | | 1,453,576 | 1,696,486 | 2,401,652 |
| | | | | | | | | | |
| Analysis of repurchase agreements included above | | | | | | | | | |
| Reverse repurchase agreements and stock borrowing | | | | | | | | | |
| Loans and advances to banks | | | 58,771 | | | | 175,941 | | |
| Loans and advances to customers | | | 39,313 | | | | 142,357 | | |
| | | | 98,084 | | | | 318,298 | | |
| Repurchase agreements and stock lending | | | | | | | | | |
| Deposits by banks | | | 83,666 | | | | 163,038 | | |
| Customer accounts | | | 58,143 | | | | 134,916 | | |
| | | | 141,809 | | | | 297,954 | | |
Business reviewcontinued | Business review |
Commentary on consolidated balance sheet
2010 compared with 2009
Total assets of £2,401.7£1,453.6 billion at 31 December 20082010 were up £560.8down £242.9 billion, 30%14%, compared with 31 December 2007.2009. This principally reflects the disposal of the RFS minority interest, the continuing planned disposal of Non-Core assets, together with a reduction in the level of debt securities and the mark-to-market value of derivatives.
Cash and balances at central banks were up £4.8 billion, 9%, to £57.0 billion principally due to an improvement in the Group's structural liquidity position during 2010.
Loans and advances to banks decreasedincreased by £81.3£8.8 billion, 37%10%, to £138.2£100.5 billion. Adjusting for the disposal of the RFS minority interest, the increase was £16.6 billion, 20%. Reverse repurchase agreements and stock borrowing (‘reverse repos’) were down by £117.2up £7.5 billion, 67%21% to £58.8 billion. Excluding reverse repos,£42.6 billion and bank placings increased by £35.9rose £9.1 billion, 83%19%, to £79.4 billion.£57.9 billion, primarily as a result of the investment of surplus liquidity in short-term assets.
Loans and advances to customers decreased £173.1 billion, 24%, to £555.3 billion. Excluding the disposal of the RFS minority interest, lending to customers was down £40.4 billion, 7%. Within this, reverse repurchase agreements were up £46.2£11.5 billion, 6%28%, at £874.7to £52.5 billion. Customer lending decreased by £51.9 billion to £502.7 billion or £68.0£48.9 billion 8%before impairment provisions. This reflected planned reductions in Non-Core of £39.7 billion along with declines in Global Banking & Markets, £16.7 billion, US Retail & Commercial, £2.6 billion and Ulster Bank, £2.0 billion. These were partially offset by growth in UK Retail, £5.4 billion, Wealth, £2.4 billion and Global Transaction Services, £1.7 billion, together with the effect of exchange rate and other movements, £2.6 billion.
Debt securities were down £49.8 billion, 19%, to £217.5 billion, or £31.6 billion, 13%, adjusting for the disposal of the RFS minority interest, driven mainly by reductions in Global Banking & Markets.
The value of derivative assets were down £14.4 billion, 3%, to £427.1 billion, primarily reflecting a decrease in interest contracts, movements in five to ten year interest yields, and the combined effect of currency movements, with Sterling weakening against the dollar but strengthening against the Euro.
The reduction in assets and liabilities of disposal groups resulted from the completion of disposals of certain of the Group’s Asian and Latin American businesses, and substantially all of the RBS Sempra Commodities JV business.
Deposits by banks declined £43.4 billion, 31%, to £98.8 billion or £55.0 billion, 36% following the disposal of the Banco Real and other businesses to Santander and Tesco Personal Finance. Within this, reverse repos decreased by 72%, £103.0RFS minority interest, with reduced inter-bank deposits, down £49.7 billion, to £39.3 billion. Excluding reverse repos, lending rose by £149.2 billion, 22% to £835.4 billion reflecting both organic growth and the effect of exchange rate movements following the weakening of sterling during the second half of 2008.
Debt securities decreased by £27.1 billion, 9%43%, to £267.5£65.9 billion and equity shares decreased by £26.7 billion, 50%, to £26.3 billion principally due to lower holdings in Global Banking & Markets.
Business review continuedMovements in the value of derivatives, assets and liabilities, primarily reflect changes in interest and exchange rates, together with growth in trading volumes.
Intangible assets declined by £29.9 billion, 60% to £20.0 billion, reflecting impairment of £32.6 billion and the disposals of the Asset Management business of ABN AMRO, Banca Antonveneta and the Banco Real and other businesses of ABN AMRO acquired by Santander, £7.2 billion. This was offset by exchange rate movements of £11.8 billion, goodwill of £0.2 billion arising on the Sempra joint venture and £0.3 billion on the buyout of the outstanding ABN AMRO shareholdings not previously owned by the Group.
Deferred tax assets increased £4.0 billion to £7.1 billion principally due to carried forward trading losses.
Prepayments, accrued income and other assets were up £8.7 billion, 56% to £24.4 billion.
Assets and liabilities of disposal groups decreased following completion of the sales of the Asset Management business of ABN AMRO to Fortis, Banca Antonveneta to Monte dei Paschi di Sienna and the majority of ABN AMRO’s Private Equity business to third parties.
Deposits by banks declined by £54.3 billion, 17% to £258.0 billion. This reflected decreased repurchase agreements and stock lending (‘repos’), down £79.4£5.3 billion, 49%14%, to £83.7 billion partly offset by increased inter-bank deposits, up £25.1 billion, 17% to £174.4£32.7 billion.
Customer accounts decreased £103.5 billion, 17%, to £510.7 billion but were down £42.9up £28.1 billion, 6% to £639.5 billion or £21.6 billion, 3%, excluding disposalsthe disposal of subsidiaries.the RFS minority interest. Within this, repos decreased £76.8increased £13.7 billion, 57%20%, to £58.1£82.1 billion. Excluding repos, customer deposits rose by £33.9were up £14.3 billion, 6%3%, to £581.4£428.6 billion, reflecting growth in UK Corporate, £12.2 billion, Global Transaction Services, £7.8 billion, UK Retail, £7.0 billion, Ulster Bank, £1.7 billion and Wealth, £0.8 billion, together with exchange rate and other movements of £3.0 billion. This was partially offset by decreases in Global Banking & Markets, £8.3 billion, US Retail & Commercial, £4.0 billion and Non-Core, £5.9 billion.
Debt securities in issue were up £26.1down £49.2 billion, 10%18%, to £300.3£218.4 billion. Excluding the RFS minority interest disposal, they declined £28.0 billion, mainly resulting from11%, to £218.4 billion. Reductions in the level of certificates of deposit and commercial paper in Global Banking & Markets were partially offset by a programme of new term issuances totalling £38.4 billion.
Subordinated liabilities decreased by £10.6 billion, 28% to £27.1 billion or £4.5 billion, 14% excluding the disposal of the RFS minority interest. This reflected the redemption of £2.6 billion undated loan capital, debt preference shares and trust preferred securities under the liability management exercise completed in May, together with the conversion of £0.8 billion US dollar and Sterling preference shares and the redemption of £1.6 billion of other dated and undated loan capital, which were partially offset by the effect of exchange rate movements.movements and other adjustments of £0.5 billion.
The Group’s non-controlling interests decreased by £15.2 billion, primarily reflecting the disposal of the RFS minority interest, £14.4 billion, the majority of the RBS Sempra Commodities JV business, £0.6 billion, and the life assurance business, £0.2 billion.
Owner’s equity decreased by £2.6 billion, 3%, to £75.1 billion. This was driven by the partial redemption of preference shares and paid-in equity, £3.1 billion less related gains of £0.6 billion, the attributable loss for the period, £1.1 billion, together with an increase in own shares held of £0.7 billion and higher losses in available-for-sale reserves, £0.3 billion. Offsetting these reductions were the issue of £0.8 billion ordinary shares on conversion of US dollar and Sterling non-cumulative preference shares classified as debt and exchange rate and other movements, £1.2 billion.
Business reviewcontinued | Business review |
Settlement balances and short positionsCommentary on consolidated balance sheet
2009 compared with 2008
Total assets of £1,696.5 billion at 31 December 2009 were down £36.7£705.2 billion, 40%29%, compared with 31 December 2008, principally reflecting substantial repayments of customer loans and advances as corporate customer demand fell and corporates looked to deleverage their balance sheets. Lending to banks also fell in line with significantly reduced wholesale funding activity. There were also significant falls in the value of derivative assets, with a corresponding fall in derivative liabilities.
Cash and balances at central banks were up £39.9 billion to £52.3 billion due to the placing of short-term cash surpluses, including the proceeds from the issue of B shares in December, with central banks.
Loans and advances to banks decreased by £46.4 billion, 34%, to £54.3£91.8 billion reflecting reduced customer activity.
Accruals, deferred incomewith reverse repurchase agreements and other liabilities decreased £2.7stock borrowing (‘reverse repos’) down by £23.7 billion, 8%40% to £35.1 billion and lower bank placings, down £22.7 billion, 29%, to £31.5£56.7 billion primarilylargely as a result of disposals.reduced wholesale funding activity in Global Banking & Markets.
Loans and advances to customers were down £146.3 billion, 17%, at £728.4 billion. Within this, reverse repos increased by 4%, £1.7 billion to £41.0 billion. Excluding reverse repos, lending decreased by £148.0 billion, 18%, to £687.4 billion or by £141.8 billion, 17%, before impairment provisions. This reflected reductions in Global Banking & Markets of £71.4 billion, and planned reductions in Non-Core of £30.1 billion, including a £3.2 billion transfer to disposal groups in respect of RBS Sempra Commodities JV and the Asian and Latin American businesses. Reductions were also experienced in US Retail & Commercial, £7.4 billion; UK Corporate, £5.4 billion; Ulster Bank, £1.8 billion; and the effect of exchange rate movements, £33.1 billion, following the strengthening of sterling during the year, partially offset by growth in UK Retail of £9.2 billion, and in Wealth of £1.4 billion.
Debt securities were flat at £267.3 billion and equity shares decreased by £6.8 billion, 26%, to £19.5 billion, principally due to the sale of the Bank of China investment and lower holdings in Global Banking & Markets and Non-Core, largely offset by growth in Group Treasury, in part reflecting an £18.0 billion increase in the gilt liquidity portfolio, and in the RFS Holdings minority interest.
Settlement balances were down £5.8 billion, 33%, at £12.0 billion as a result of lower customer activity.
Movements in the value of derivative assets, down £551.1 billion, 56%, to £441.5 billion, and liabilities, down £547.2 billion, 56%, to £424.1 billion, reflect the easing of market volatility, the strengthening of sterling and significant tightening in credit spreads in the continuing low interest rate environment.
Increases in assets and liabilities of disposal groups reflect the inclusion of the RBS Sempra Commodities JV business and the planned sale of a number of the Group's retail and commercial activities in Asia and Latin America.
Deposits by banks declined by £115.9 billion, 45%, to £142.1 billion due to a decrease in repurchase agreements and stock lending (‘repos’), down £45.7 billion, 55%, to £38.0 billion and reduced inter-bank deposits, down £70.2 billion, 40% to £104.1 billion principally in Global Banking & Markets, reflecting reduced reliance on wholesale funding, and in the RFS Holdings minority interest.
Customer accounts were down £25.3 billion, 4%, to £614.2 billion. Within this, repos increased £10.2 billion, 18%, to £68.4 billion. Excluding repos, deposits were down £35.5 billion, 6%, to £545.8 billion, primarily due to; reductions in Global Banking & Markets, down £43.6 billion; Non-Core, £13.0 billion; including the transfer of £8.9 billion to disposal groups; and Ulster Bank, £1.2 billion; together with exchange rate movements, £21.3 billion, offset in part by growth across all other divisions, up £23.0 billion, and in the RFS Holdings minority interest, up £20.6 billion.
Debt securities in issue were down £32.7 billion, 11% to £267.6 billion mainly as a result of movements in exchange rates, together with reductions in Global Banking & Markets, Non-Core and the RFS Holdings minority interest.
Retirement benefit liabilities increased by £1.6£0.9 billion, 46%, to £2.0£3.0 billion, with net actuarial losses of £3.7 billion, arising from lower discount rates and higher assumed inflation, partially offset by curtailment gains of £2.1 billion due to reduced asset values only partly offset by the effect of increased discount rates.changes in prospective pension benefits.
Deferred taxation liabilities decreased by £1.2 billion, 23% to £4.2 billion due in part to the sale of Angel Trains.
Subordinated liabilities were up £11.1down £11.5 billion, 29%23% to £49.2 billion. The issue£37.7 billion, reflecting the redemption of £2.4£5.0 billion undated loan capital, £1.5 billion trust preferred securities and £2.7 billion dated loan capital, andtogether with the effect of exchange rate movements and other adjustments, £11.3£2.9 billion, were partiallypartly offset by the redemptionissue of £1.6 billion of dated loan capital, £0.1£2.3 billion undated loan capital and £0.9within the RFS Holdings minority interest.
Equity non-controlling interests decreased by £4.7 billion, in respect22%, to £16.9 billion. Equity withdrawals of £3.1 billion, due to the disposal of the Banco Real and other businesses of ABN AMRO to Santander.
Equity minority interests decreased by £16.8 billion, 44% to £21.6 billion. Attributable losses of £ 10.8 billion, including £15.7 billion of write downs of goodwill and other intangible assets in respect of the State of the Netherlands investment in RFS Holdings, equity withdrawals of £13.6 billion, including £12.3 billion by Santander following the disposals of Banca Antonveneta and Banco Real, reductions in the market value of available-for-sale securities of £1.4 billion, mainly the investment in Bank of China attributable to minority shareholders and the redemption, in part, of certain trust preferred securities, exchange rate movements in cash flow hedgingof £1.4 billion, the recycling of related available-for-sale reserves £0.8 billion, actuarial losses on defined benefit pension schemes net of tax ofto income, £0.5 billion, and dividends paid of £0.3 billion, were partially offset by effectattributable profits of exchange rate movements£0.3 billion.
Owners' equity increased by £18.9 billion, 32% to £77.7 billion. The issue of £9.1B shares to HM Treasury in December 2009 raised £25.1 billion, net of which £8.0expenses, and was offset in part by the creation of a £1.2 billion related to the State of the Netherlands and Santander investments in RFS Holdings, the £0.8 billion equity raised as part of the Sempra joint venture and £0.4 billion additional equityreserve in respect of the buy-out of the ABN AMRO minority shareholders.
Owners’ equity increased by £5.8 billion, 11% to £58.9 billion. Proceeds of £12.0 billion from the rights issue, net of £246 million expenses, and £19.7 billion from thecontingent capital B shares. The placing and open offer in April 2009 raised £5.3 billion to fund the redemption of the £5.0 billion preference shares issued to HM Treasury in December 2008. Actuarial losses, net of expensestax, of £265 million, together with exchange rate movements of £6.8 billion were partially offset by£2.7 billion; the attributable loss for the period, £2.7 billion; exchange rate movements of £23.5£1.9 billion; the payment of other owners dividends of £0.9 billion a £4.6including £0.3 billion decreaseto HM Treasury on the redemption of preference shares, and partial redemption of paid-in equity £0.3 billion were partly offset by increases in available-for-sale reserves, net£1.8 billion; cash flow hedging reserves, £0.6 billion; and the equity owners gain on withdrawal of tax, reflecting £1.0 billion in the Group’s share in the investment in Bank of China and £3.6 billion in other securities, the majority of which related to Global Banking & Markets, actuarial lossesnon-controlling interests, net of tax, of £1.3£0.5 billion arising from the paymentredemption of the 2007 final ordinary dividend of £2.3 billion and other dividends of £0.6 billion, and a reduction in the cash flow hedging reserve of £0.3 billion.trust preferred securities.
Business reviewcontinued | Business review |
| | 2010 | 2009 | 2008 |
| | £m | £m | £m |
| Net cash flows from operating activities | 19,291 | (992) | (75,338) |
| Net cash flows from investing activities | 3,351 | 54 | 16,997 |
| Net cash flows from financing activities | (14,380) | 18,791 | 15,102 |
| Effects of exchange rate changes on cash and cash equivalents | 82 | (8,592) | 29,209 |
| Net increase/(decrease) in cash and cash equivalents | 8,344 | 9,261 | (14,030) |
2010
Cash flowThe major factors contributing to the net cash inflow from operating activities of £19,291 million were the increase of £17,095 million in operating assets less operating liabilities, depreciation and amortisation of £2,220 million and income taxes received of £565 million, partly offset by the net operating loss before tax of £940 million from continuing and discontinued operations.| | | 2008 | | | 2007 | | | 2006 | |
| | | | £m | | | | £m | | | | £m | |
| Net cash flows from operating activities | | | (75,338 | ) | | | 25,604 | | | | 17,441 | |
| Net cash flows from investing activities | | | 16,997 | | | | 15,999 | | | | 6,645 | |
| Net cash flows from financing activities | | | 15,102 | | | | 29,691 | | | | (1,516 | ) |
| Effects of exchange rate changes on cash and cash equivalents | | | 29,209 | | | | 6,010 | | | | (3,468 | ) |
| Net (decrease)/increase in cash and cash equivalents | | | (14,030 | ) | | | 77,304 | | | | 19,102 | |
Net cash flows from investing activities of £3,351 million relate to the net inflows from sales of securities of £4,119 million and investments in business interests and intangibles of £3,446 million. This was partially offset by the outflow of £4,112 million from investing activities of discontinued operations.
Net cash outflow from financing activities of £14,380 million primarily arose from the redemption of non-controlling interests of £5,282 million, dividends paid of £4,240 million, repayment of subordinated liabilities of £1,588 million and the redemption of preference shares of £2,359 million.
2009
The major factors contributing to the net cash outflow from operating activities of £992 million were the net operating loss before tax of £2,696 million from continuing and discontinued operations, the decrease of £15,964 million in operating liabilities less operating assets, partly offset by the elimination of foreign exchange differences of £12,217 million and other items of £5,451 million.
Net cash flows from investing activities of £54 million relate to the net sales and maturities of securities of £2,899 million and a net cash inflow of £105 million in respect of other acquisitions and disposals less the net cash outflow on disposals of property, plant and equipment of £2,950 million.
Net cash flows from financing activities of £18,791 million primarily arose from the capital raised from the issue of B shares of £25,101 million, the placing and open offer of £5,274 million and the issue of subordinated liabilities of £2,309 million. This was offset in part by the cash outflow on repayment of subordinated liabilities of £5,145 million, redemption of preference shares of £5,000 million, interest paid on subordinated liabilities of £1,746 million and dividends paid of £1,248 million.
2008
The major factors contributing to the net cash outflow from operating activities of £75,338 million were the net operating loss before tax of £36,459£36,628 million from continuing and discontinued operations, the decrease of £42,219 million in operating liabilities less operating assets, and the elimination of foreign exchange differences of £41,874 million, partly offset by the write down of goodwill and other intangible assets, £32,581 million and other non-cash items, £8,603£8,772 million.
Proceeds on disposal of discontinued activities of £20,113 million was the largest element giving rise to net cash flows of investing activities of £16,997 million. Outflow from net purchases of securities of £1,839 million and net disposals of property, plant and equipment, £3,529 million less the net cash inflow of £2,252 million in respect of other acquisitions and disposals represented the other principleprincipal factors.
Net cash flows from financing activities of £15,102 million primarily arose from the capital raised from the placing and open offer of £19,741 million and the rights issue of £12,000 million, the issue of subordinated liabilities of £2,413 million and proceeds of minoritynon-controlling interests, £1,427 million. This was offset in part by the cash outflow on redemption of minoritynon-controlling interests of £13,579 million, repayment of subordinated liabilities of £1,727 million, dividends paid of £3,193 million and interest paid on subordinated liabilities of £1,967 million.
2007
The major factors contributing to the net cash inflow from operating activities of £25,604 million were the increase of £28,261 million in operating liabilities less operating assets and the profit before tax of £9,900 million, partly offset by the elimination of foreign exchange differences of £10,282 million and income taxes paid of £2,442 million.
The acquisition of ABN AMRO, included within net investment in business interests and intangible assets of £13,640 million, was the largest element giving rise to net cash flows from investing activities of £15,999 million, with cash and cash equivalents acquired of £60,093 million more than offsetting the cash consideration paid of £45,856 million. Net sales and maturities of securities of £1,987 million and net disposals of property, plant and equipment, £706 million less the net cash outflow of £597 million in respect of other acquisitions and disposals represented the other principle factors.
Net cash flows from financing activities of £29,691 million primarily relate to the cash injection of £31,019 million from the consortium partners in relation to the acquisition of ABN AMRO, together with the issue of £4,829 million of equity securities and £1,018 million of subordinated liabilities, offset in part by dividend payments of £3,411 million, the repayment of £1,708 million subordinated liabilities, interest on subordinated liabilities of £1,522 million and the redemption of £545 million of minority interests.
2006
The major factors contributing to the net cash inflow from operating activities of £17,441 million were the profit before tax of £9,186 million adjusted for the elimination of foreign exchange differences of £4,516 million and depreciation and amortisation of £1,678 million, together with an increase of £3,980 million in operating liabilities less operating assets.
Net sales and maturities of securities of £8,000 million was partially offset by net purchases of property, plant and equipment of £1,292 million, resulting in the net cash inflow from investing activities of £6,645 million.
The issue of £671 million of equity preference shares, £3,027 million of subordinated liabilities and proceeds of £1,354 million from minority interests issued were more than offset by dividend payments of £2,727 million, purchase of ordinary shares amounting to £991 million, repayment of £1,318 million of subordinated liabilities and interest on subordinated liabilities of £1,409 million, resulting in a net cash outflow from financing activities of £1,516 million.
Business reviewcontinued | Business review |
The following table analyses the Group’sGroup's regulatory capital resources on a fully consolidated basis at 31 December:December as monitored by the FSA for regulatory purposes.
| | | 2008 | | | 2007 | | | 2006 | | | 2005 | | | 2004 | | 2010 | 2009 | 2008 | 2007 | 2006 |
| | | | £m | | | | £m | | | | £m | | | | £m | | | | £m | | £m | £m |
| Capital base | | | | | | | | | | | | | | | | | | | | | |
| Tier 1 capital | | 69,847 | | | 44,364 | | | 30,041 | | | 28,218 | | | 22,694 | | 60,124 | 76,421 | 69,847 | 44,364 | 30,041 |
| Tier 2 capital | | 32,223 | | | 33,693 | | | 27,491 | | | 22,437 | | | 20,229 | | 9,897 | 15,389 | 32,223 | 33,693 | 27,491 |
| Tier 3 capital | | 260 | | | 200 | | | — | | | — | | | — | | — | — | 260 | 200 | — |
| | | 102,330 | | | 78,257 | | | 57,532 | | | 50,655 | | | 42,923 | | 70,021 | 91,810 | 102,330 | 78,257 | 57,532 |
| Less: investments in insurance subsidiaries, associated undertakings and other supervisory deductions | | (4,155 | ) | | (10,283 | ) | | (10,583 | ) | | (7,282 | ) | | (5,165 | ) | |
| Total capital | | 98,175 | | | 67,974 | | | 46,949 | | | 43,373 | | | 37,758 | | |
| Less: Supervisory deductions | | (4,732) | (4,565) | (4,155) | (10,283) | (10,583) |
| Total regulatory capital | | 65,289 | 87,245 | 98,175 | 67,974 | 46,949 |
| | | | | | | | | | | | | | | | | | | | | | | | | |
Risk-weighted assets | | | | | | | | | | | | | | | | | | | | | |
| Credit risk | | 551,400 | | | | | | | | | | | | | | | | | | 385,900 | 513,200 | 551,300 | |
| Counterparty risk | | 61,100 | | | | | | | | | | | | | | | | | | 68,100 | 56,500 | 61,100 | |
| Market risk | | 46,500 | | | | | | | | | | | | | | | | | | 80,000 | 65,000 | 46,500 | |
| Operational risk | | 36,800 | | | | | | | | | | | | | | | | | | 37,100 | 33,900 | 36,900 | |
| | | | 695,800 | | | | | | | | | | | | | | | | | | 571,100 | 668,600 | 695,800 | |
| Banking book: | | | | | | | | | | | | | | | | | | | | | |
| On-balance sheet | | | | | | 480,200 | | | 318,600 | | | 303,300 | | | 261,800 | | |
| Off-balance sheet | | | | | | 84,600 | | | 59,400 | | | 51,500 | | | 44,900 | | |
| Trading book | | | | | | 44,200 | | | 22,300 | | | 16,200 | | | 17,100 | | |
| Asset Protection Scheme relief | | (105,600) | (127,600) | n/a | |
| | | | | | | | 609,000 | | | 400,300 | | | 371,000 | | | 323,800 | | 465,500 | 541,000 | 695,800 | |
| | | | | | | | | | | | | | | | | |
| Risk asset ratios | | % | | | % | | | % | | | % | | | % | | |
| Tier 1 | | 10.0 | | | 7.3 | | | 7.5 | | | 7.6 | | | 7.0 | | |
| Total | | 14.1 | | | 11.2 | | | 11.7 | | | 11.7 | | | 11.7 | | |
Notes:
| Banking book: | | | |
| On-balance sheet | | 480,200 | 318,600 |
| Off-balance sheet | | 84,600 | 59,400 |
| Trading book | | 44,200 | 22,300 |
| | | 609,000 | 400,300 |
| Risk asset ratios | % | % | % | % | % |
| Core Tier 1 | 10.7 | 11.0 | 6.6 | 4.5 | n/a |
| Tier 1 | 12.9 | 14.1 | 10.0 | 7.3 | 7.5 |
| Total | 14.0 | 16.1 | 14.1 | 11.2 | 11.7 |
Note:
| (1) | The data for 2010, 2009 and 2008 are on a Basel II basis; prior periods are on a Basel I basis. |
(2) | The data for 2004 are based on UK GAAP as previously published and regulated. As from 1 January 2005, the Group is regulated on an IFRS basis. |
It is the Group’sGroup's policy to maintain a strong capital base, to expand it as appropriate and to utilise it efficiently throughout its activities to optimise the return to shareholders while maintaining a prudent relationship between the capital base and the underlying risks of the business. In carrying out this policy, the Group has regard to the supervisory requirements of the Financial Services Authority (FSA). The FSA uses Risk Asset Ratio (RAR) as a measure of capital adequacy in the UK banking sector, comparing a bank’sbank's capital resources with its risk-weighted assets (the assets and off-balance sheet exposures are ‘weighted’'weighted' to reflect the inherent credit and other risks); by international agreement, the RAR should be not less than 8% with a Tier 1 component of not less than 4%. At 31 December 2008,2010, the Group’sGroup's total RAR was 14.1% (2007 – 11.2%14.0% (2009 - 16.1%) and the Tier 1 RAR was 10.0% (2007 – 7.3%12.9% (2009 - 14.1%).
Table of ContentsBusiness reviewcontinued | Business review |
| Risk and balance sheet management |
On pages 57In this section (pages 59 to 123164) of the Business review certain information has been audited and is part of the Group’s financial statements as permitted by IFRS 7. Other disclosures are unaudited and labelled with an asterisk (*). Key points within this section relate to the Group before RFS Holdings minority interest (RFS MI) for 2009 and 2008 data.
Introduction*
All the disclosures in this section (pages 59 to 65) are unaudited as such.indicated by an asterisk (*). Risk Management has an integral role to play in the delivery of the strategic plan through the creation and management of appropriate frameworks as illustrated below:
2008 has been one the Group Board agreed in 2009 the key strategic risk objectives which are aligned to all other elements of the most challenging years for banks. The financial markets turmoil,plan. These are:
| · | maintain capital adequacy; |
| · | maintain market confidence; |
| · | deliver stable earnings growth; and |
| · | stable and efficient access to funding and liquidity. |
These strategic risk objectives are the bridge between the Group level business strategy and the frameworks, measures and metrics which startedare used to set appetite and manage risk in the second halfbusiness divisions. The risk appetite framework is aligned with business objectives, with underlying and cascading frameworks and limits, which are described in this section. Enhancements have been made through the year and are ongoing.
Risk appetite
Risk appetite is an expression of 2007 following concerns over the US sub-prime mortgage market, resulted in a global reduction in liquidity and the availability of term-funding. Confidence in financial institutions was eroded through 2008 as a result of an increased perception of counterparty risk following notable banking and insurance failures.
During the recent market turbulence, in common with other banks, the Group saw the availability of long term funding from both the capital markets and money markets decline significantly during the second half of 2008. As a result, reliance on shorter term funding increased with a consequent deterioration in the Group’s liquidity profile. In response to the market stress, central banks increased liquidity through a number of facilities and schemes available to support their respective banking systems. In addition, governments around the world have provided capital to financial institutions and moved to offer guarantees and increase deposit insurance to reassure investors and depositors. As a global bank, the Group has access to a number of those facilities and schemes which, in common with many other banks, it has used to support funding.
Whilst the international stabilisation efforts led by various governments since September 2008 have helped, the knock-on economic impacts are now evident in markets globally. 2009 will see further strains for financial institutions. Whilst the liquidity crisis is likely to stabilise, the level of impairmentsrisk that the Group is prepared to accept to deliver its business objectives. Risk and balance sheet management across the Group is based on the risk appetite approved by the Board, who will increaseagree targets for each division and regularly review and monitor the Group's performance in relation to risk.
Risk appetite is defined in both quantitative and qualitative terms and serves as recession spreads worldwide.a way of tracking risk management performance in implementing the agreed strategy.
| · | quantitative: encompassing scenario stress testing, risk concentrations, VaR, liquidity and credit related metrics, operational, business risk and regulatory measures. |
| · | qualitative: ensuring that the Group applies the correct principles, policies and procedures, manages reputational risk and develops risk control and culture. |
A key part of the Group’s risk appetite is the macro reshaping of the balance sheet through the downsizing of Non-Core. The Group will manage down previous concentrations in line with the strategic objectives for 2013. This will be discharged by Non-Core but with Risk Management playing an integral role in executing the plan. Non-Core assets and their movements are shown separately in the pages which follow.
* unaudited
The Board, in the light of the severe and increasing deterioration in market conditions, the worsening economic outlook and difficulties in the credit markets, concluded that it was appropriate for the Group to strengthen its capital position.
The Group has responded to the changing business and economic conditions by reducing leverage, building and improving liquidity, raising additional capital and through augmenting its risk management resources to drive forward a number of strategic initiatives. The overall risk operating model has been strengthened to ensure its adequacy for changing market conditions and additional capital management disciplines are being embedded across the Group. There is an increased emphasis on the independence of the control functions, capital allocation, stress testing and risk return throughout the Group.Business reviewcontinued | Business review |
| Risk and balance sheet management |
Risk governance (unaudited)
Introduction*continued
Governance
Risk and capitalbalance sheet management strategy isstrategies are owned and set by the Group’sGroup's Board of Directors,directors, and implemented by executive management led by the Group Chief Executive. There are a number of committees and executives that support the execution of the business plan and strategy.strategy, as set out below. Representation by, and interaction between, the individual risk disciplines is a key feature of the governance structure, with the aim of promoting cross-risk linkages. The roles and responsibilities fulfilled by the key risk committees have been reviewed and more clearly defined during the course of 2010.
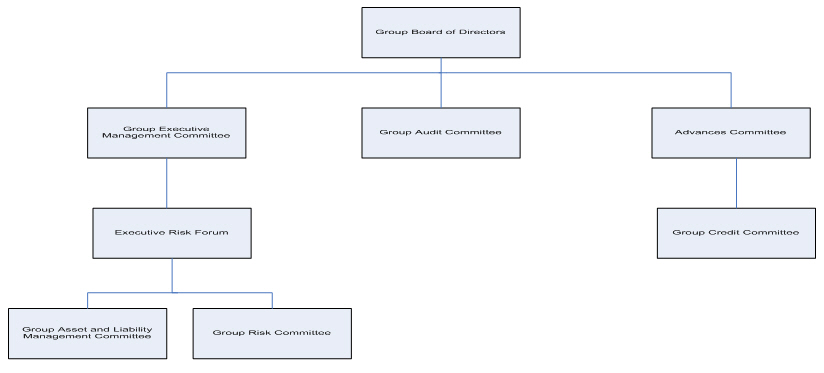
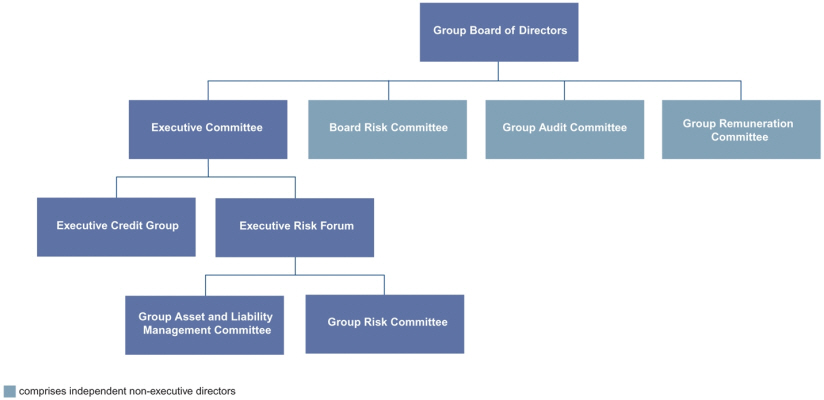

Business review continued
Business reviewcontinued | Business review |
| Risk and balance sheet management |
Introduction*continued
Governance continued
The role and remit of these committees is as follows:set out below. These committees are supported at a divisional level by a risk governance structure embedded in the businesses. During 2010, Risk Management has been enhanced by the appointment of a Deputy Chief Risk Officer to whom the Divisional CROs and the functional risk heads now report.
| Committee | | Focus | Membership |
| Group Board | MembershipThe Group Board is the main decision making forum at Group level. It ensures that the Group manages risk effectively through approving and monitoring the Group’s risk appetite, considering Group stress scenarios and agreed mitigants and identifying longer term strategic threats to the Group’s business operations. | The Board of directors |
| Executive Committee (ExCo) | This committee is responsible for managing Group-wide issues and those operational issues material to the broader Group. | Group Chief Executive Group Finance Director Chief Administrative Officer Chief Executive Officers: US Retail & Commercial and Head of Americas; RBS Insurance; Global Banking & Markets; UK Corporate; and UK Retail, Wealth and Ulster Head of Restructuring and Risk |
| Board Risk Committee (BRC) | The Board Risk Committee provides oversight and advice to the Group Board in relation to current and potential future risk exposures of the Group and risk strategy, including determination of risk appetite and tolerance. It reviews the performance of the Group relative to risk appetite and provides oversight of the effectiveness of key Group policies, referred to as the Group Policy Framework. | At least three independent non-executive directors, one of whom is the chairman of the Group Audit Committee |
| Group Audit Committee (GAC) | | Financial reporting andThe Group Audit Committee is responsible for assisting the application ofGroup Board in carrying out its responsibilities relating to accounting policies, as part of the internal control and risk assessment process. GAC monitorsfinancial reporting functions. It assists on such other matters as may be referred to it by the identification, evaluationGroup Board and managementacts as the Audit Committee of all significant risks throughout the Group.Group Board. The Group Audit Committee also identifies any matters within its remit which it considers that action or improvement is needed and makes recommendations as to the steps to be taken. | | IndependentAt least three independent non-executive directors, at least one of whom is a financial expert as defined in the SEC Rules under the US Exchange Act |
AdvancesGroup Remuneration Committee (AC) | The Remuneration Committee is responsible for the overview of the Group’s remuneration policy and remuneration governance framework, ensuring that remuneration arrangements are consistent with and promote effective risk management. The committee also makes recommendations to the Board on the remuneration arrangements for executive directors. | Deals with transactions that exceedAt least three independent non-executive directors |
| Executive Credit Group (ECG) | The ECG decides on requests for the extension of existing or new credit limits on behalf of the Board of directors where the proposed aggregate facility limits are in excess of the credit approval authorities granted to individuals in divisions or in RBS Risk Management, or where an appeal against the decline decision of the Group Chief Credit Committee’s delegated authority and large exposures. | Officer (or delegates) or Group Chief Risk Officer is referred for final decision. | MembersGroup A members
Head of GEMCRestructuring and Risk Deputy Chief Risk Officer Group Chief Credit Officer/Chief Credit Officer RBS N.V. Head of Global Restructuring Group Chief Risk Officer, Non-Core division/APS (alternate) Group B members Group Chief Executive Chief Executive Officers: UK Retail, Wealth and Ulster; US Retail & Commercial and Head of Americas; Global Banking & Markets; RBS Insurance; UK Corporate President, Global Banking & Markets Group Finance Director |
* unaudited
Business reviewcontinued | Business review |
Group Executive Management Committee (GEMC) | Risk and balance sheet management |
Introduction* continued
Governance continued
| Committee | Ensures implementation of strategy consistent with risk appetite.Focus | | Business and function heads, as determined by the Group Chief Executive/BoardMembership |
| Executive Risk Forum (ERF) | | Acts on all strategic risk and control matters across the Group including, but not limited to, credit risk, market risk, operational risk, compliance and regulatory risk, enterprise risk, treasury and liquidity risk, reputational risk, insurance risk and country risk. | | Group Chief Executive Head of Restructuring and Risk Deputy Group Chief Risk Officer Group Finance Director Chief Executive from each division |
Group ChiefAsset and Liability Committee (GALCO) | Identifies, manages and controls Group balance sheet risks. | Group Finance Director Director, Group Finance Head of Restructuring and Risk Officer Chairman, Regional Markets
Chief Executive RBS UKOfficer from each division Group Chief Executive, Accountant Group Treasurer Group Head of Capital Management Global Banking &Head of Balance Sheet Management, Group Treasury Global Head of Markets Head of Non-Core division |
| Group Risk Committee (GRC) | | Recommends limits and approves limits, policies, processes and policiesprocedures to ensureenable the effective management of all material risksrisk across the Group. | | GroupHead of Restructuring and Risk
Deputy Chief Risk Officer Group head of each risk typeChief Credit Officer Global Head of: Market and Insurance Risk; Operational Risk; Country Risk and Firm Wide Risk Director, Group TreasurerFinance Chief Operating Officer, RBS Risk Management Director Group Compliance Director Group Regulatory Affairs Divisional Chief Executive andOfficers’ nominees Chief Administrative Officer’s nominee for Business Services Divisional Chief Risk Officers Chief Operating Officer from each division Global Restructuring Group General Counsel and Group Secretary Group Chief Economist
|
Group Credit Committee (GCC) | | Approves credit proposals under the authority delegated to the committee by the Board and/or the Advances Committee. | | Members as determined by GEMC |
Group Asset and Liability Management Committee (GALCO) | | Identifies, manages and controls the Group balance sheet risks. | | Group Finance Director
Chairman/Chief Executive from each division
Group Treasurer
Group Chief Risk Officer
Heads of Group functions
|
Group Chief Executive’s Advisory Group (GCEAG) | | Acts as a forum for the provision of information and advice to the Group Chief Executive. Forms part of the control process of the Group. | | Group Chief Executive
Group Finance Director
Chairman and Chief Executives from each division
Group Chief Risk Officer
Group General Counsel and Group Secretary
Group Directors, Strategy, Communications and Human Resources
|
Business review continuedManagement responsibilities (unaudited)
All staff haveThese committees play a key role to play in the day to day management of risk, in line with Group policy, which is set and managed by specialist staff in:
● | Risk Management: credit, market, operational, regulatory, enterprise and insurance risk, together with risk analytics. |
● | Group Treasury: balance sheet, capital management, intra-group exposure, funding, liquidity and hedging policies. |
Independence underpins the approach to risk management, which is reinforced throughout the Group by appropriate reporting lines. Risk Management and Group Treasury functions are independent of the revenue generating business. As part of the move toward greater functional independence, the divisional Chief Risk Officers now have a direct reporting line to the Group Chief Risk Officer.
Group Internal Audit (GIA) supports the GAC in providing an independent assessment of the design, adequacy and effectiveness of internal controls.
Risk appetite (unaudited)
Risk and capital management across the Group is based on the risk appetite set by the Board, which is established through setting strategic direction, contributing to, and ultimately approving annual plans for each division and regularly reviewing and monitoring the Group’s performance in relation to risk through monthly Board reports.
Risk appetite is defined in both quantitative and qualitative terms as follows:
● | Quantitative: encompassing stress testing, risk concentration, value- at-risk, liquidity and credit related metrics.
|
● | Qualitative: focusing on ensuring that the Group applies the correct principles, policies and procedures.
|
Different techniques are used to ensure that the Group’sGroup's risk appetite is achieved.supported by effective risk management through limit approval and setting, monitoring and maintenance, reporting and escalation.
The GEMCBoard Risk Committee considers and recommends for approval by the Group Board, the Group's risk appetite framework and tolerance for current and future strategy, taking into account the Group's capital adequacy and the external risk environment.
The Executive Risk Forum is responsible for ensuring that the implementation of strategy and operations are in line with the risk appetite determined by the Board.Board with a particular focus on identifying and debating macro risks that could, if not managed effectively, impact adherence to the Group’s strategic plan. This is reinforced through a policy frameworkand limit frameworks ensuring that all staff within the Group make appropriate risk and reward trade-offs within pre-agreed boundaries.
How we do business | Policy |
Customers | Identifying our customers.
Treating our customers fairly.
Delivering customer value.
Respecting customer confidentiality.
|
Risks | Identifying and managing our risks.
Understanding our markets.
|
Security | Protecting our assets, premises, systems and data.
Operating our processes, systems and controls.
Dealing with external suppliers.
|
People | Working in the Group.
Promoting diversity and inclusion.
|
Reputation | Working within laws and regulation.
Investing in the community.
Conducting sustainable business.
Maintaining key services and processes.
|
Finances | Managing our capital and resources.
Accounting and financial reporting.
|
The annual business planning and performance management processprocesses and associated activities together ensure that the expression of risk appetite remains appropriate. Both GRC and GALCO support this work.
* unaudited
Business reviewcontinued | Business review |
| Risk and balance sheet management |
Introduction* continued
Risk coverage
The main risk types facing the Group which are covered by the risk appetite framework and managed by the above committees are shown below:
| Risk type | Definition | Features | Key developments in 2010 | Risk mitigation |
| Funding and liquidity risk | The risk that the Group does not have sufficient financial resources to meet its commitments when they fall due, or can secure them only at excessive cost. | Potential to disrupt the business model and stop normal functions of the Group. Potential to fail to meet the supervisory requirements of regulators. Significantly correlates with credit risk losses. | Against a backdrop of further market instability, progress was made in meeting the Group’s strategic objectives: reduced reliance on short-term wholesale funding; expanded customer deposit franchise; and increased maturity of term debt issuance. | The Group strengthened the structural integrity of the balance sheet through active management of both asset and liability portfolios including a centrally-managed liquidity portfolio of £155 billion. |
Credit risk (including counterparty, country and political risks) | The risk that the Group will incur losses owing to the failure of customers to meet their financial obligations to the Group. | Loss characteristics vary materially across portfolios. Significant correlation between losses and the macroeconomic environment. Concentration risk - potential for large material losses. | Asset quality has broadly stabilised, resulting in total loan impairments 33% lower than in 2009. However, weakness in the Irish economy and falling property values have resulted in the doubling of Ulster Bank Group impairments (Core and Non-Core) in 2010. | Further enhancements were made to the Group’s credit risk frameworks as well as the systems and tools that support credit risk management processes. The Group continues to reduce the risk associated with legacy exposures through further reductions in Non-Core assets. |
| Market risk | The risk that the value of an asset or liability may change as a result of a change in market factors. | Potential for large material losses. Potential for losses due to stress events. | Markets have remained both volatile and uncertain since 2007 resulting in a higher level of market risk, despite a reduction in trading book exposure. | The Group has continued to enhance its market risk management framework and reduced trading and banking book exposures, with asset sales and write-downs within Non-Core and banking book available-for-sale assets in Core. |
| Insurance risk | The risk of financial loss through fluctuations in the timing, frequency and/or severity of insured events, relative to the expectations at the time of underwriting. | Frequent small losses which are material in aggregate. Infrequent large material losses. | There have been significant losses as a result of bodily injury claims across the UK motor insurance industry, including RBS Insurance. | In response to this, the industry has increased pricing on motor insurance business and the Group has made significant progress in removing higher-risk business through targeted rating actions. |
| Operational risk | The risk of loss resulting from inadequate or failed processes, people, systems or from external events. | Frequent small losses. Infrequent material losses. | The level of operational risk remains high due to the scale of structural change occurring across the Group; increased government and regulatory scrutiny; and external threats (e.g. e-crime). | The Group Policy Framework (GPF) supports the risk appetite setting process and underpins the control environment. The three lines of defence model gives assurance that the standards in GPF are being adhered to. |
* unaudited
Business review continued
Business reviewcontinued | Business review |
| Risk and balance sheet management |
Introduction* continued
Risk coverage continued
| Risk type | Definition | Features | Key developments in 2010 | Risk mitigation |
| Regulatory risk | The risks arising from regulatory changes and enforcement. | Adverse impacts on business/operating models, including increased complexity. Financial costs adapting to changes or from penalties. Reputational damage from enforcement action. | The scale and scope of regulatory change remains at unprecedented levels, particularly in the area of prudential regulation (capital, liquidity, governance and risk management). Increased attention was paid to the treatment of systemically important areas such as recovery and resolution plans, remuneration and capital. | The Group manages regulatory change through active engagement with the FSA, other regulators and governments. The most material risks from new regulations, or changes to existing legislation, are assigned an executive sponsor. |
| Compliance risk | Risks arising from non-compliance with laws, rules, regulations or other standards applicable to the Group. | Breach or alleged breach could result in public or private censure or fine, could have an adverse impact on the Group’s business model (including applicable authorisations and licenses), reputation, results of operations and/or financial condition. | The Group, other global financial institutions and the banking industry have faced increased legal, regulatory and public scrutiny. The Group has continued to engage in discussions with relevant stakeholders, regulators and other governmental and non-governmental bodies, including those in the UK and US, regarding the Group’s efforts to satisfy all relevant standards and ensure compliance with applicable existing and prospective laws, rules and regulations. | The Group has continued to review and enhance its regulatory policies, procedures and operations. During 2010, there has been specific, targeted focus on enhancing arrangements for handling customer complaints and managing the risks associated with money laundering, and sanctions and terrorism financing. |
| Reputational risk | The risks arising from the failure to meet stakeholders’ perceptions and expectations. | Failure of the business to provide an experience which meets customers, regulators and other stakeholders’ expectations. | Government support brings heightened public scrutiny of the way the Group manages its business including: staff remuneration; how customers are managed; and the levels of lending in the UK and environmental impact. | In 2010, the Group established the Group Corporate Sustainability Committee, and also developed a framework for managing environmental, social and ethical risks to support its lending decisions. Businesses consider potential reputational risks and appropriate mitigants. |
| Pension risk | The risk that the Group may have to make additional contributions to its defined benefit pension schemes. | Volatile funding position caused by the uncertainty of future investment returns and the projected value of schemes’ liabilities. | The triennial funding valuation for the Main scheme was undertaken in 2010 with a schedule of contributions to be agreed with the Trustees. | During 2010, the Group implemented an enhanced reporting and modelling framework to improve the identification and management of key pension risks. In early 2010 the Main scheme increased its bond allocation to better match liabilities. |
Each of these risk types map into our risk appetite framework and contribute to the overall achievement of our strategic objectives with underlying frameworks and limits. The key frameworks and developments this year are described in the relevant section of the following pages.
* unaudited
Business reviewcontinued | Business review |
| Risk and balance sheet management |
Introduction* continued
Stress testing
Stress testing commonly describes the evaluation of a bank’s financial position under severe but plausible stress scenarios. The Group aimsterm stress testing is used to maintain appropriate levelsrefer not only to the application of individual stress tests but also to the wider economic environment within which these tests are developed, evaluated and used within the decision making process.
Since the financial crisis of 2008/2009 there has been an increased focus, both amongst regulators and senior management, on stress testing as a means of identifying vulnerabilities within a financial institution and within the financial system as a whole.
Many regulatory documents and initiatives have emerged which require strong involvement of senior management in the design and evaluation of scenarios, an emphasis on plausible events and a shift from the assessment of instant shocks to multi-period analysis of capital in excessadequacy over a prolonged period of regulatory requirements, to ensure its capital position remains appropriate given the economic and competitive environment. Capital adequacy and risk management are closely aligned. The Group undertakes a regular assessment of its internal capital requirement based on a quantification of the material risks to which it is exposed.stress.
Composition of capital
The Group’s regulatorystress testing framework is designed to embed stress testing as a key risk management technique into mainstream risk reporting, capital resourcesplanning and business processes at 31 December 2008 onboth the Group and divisional level.
The Executive Risk Forum is the main body overseeing the stress testing approach, processes and results. The forum is primarily responsible for reviewing and challenging the results of any Group-wide stress tests and ensuring, where necessary, appropriate management actions are initiated.
Industry wide scenarios
RBS has taken part in a fully consolidated basis,number of industry wide stress tests such as an EU-wide stress testing exercise, the results of which were published in July 2010.
It is important to note that the tests are theoretical in nature and none of the data published represent a forecast or prediction by RBS of what would actually happen in accordance with Financial Services Authority (FSA) definitions were as follows:
| | | Basel II 31 December 2008 £m | | | Basel II 1 January 2008 £m | | | Basel I 31 December 2007 £m | |
| Capital base: | | | | | | | | | |
| Core Tier 1 capital: ordinary shareholders’ funds and minority interests less intangibles | | | 47,623 | | | | 27,324 | | | | 27,324 | |
| Preference shares and tax deductible securities | | | 24,038 | | | | 17,040 | | | | 17,040 | |
| Less deductions from Tier 1 capital | | | (1,814 | ) | | | (1,457 | ) | | | n/a | |
| Tier 1 capital | | | 69,847 | | | | 42,907 | | | | 44,364 | |
| Tier 2 capital | | | 32,223 | | | | 28,767 | | | | 33,693 | |
| Tier 3 capital | | | 260 | | | | 200 | | | | 200 | |
| | | | 102,330 | | | | 71,874 | | | | 78,257 | |
| Less: supervisory deductions | | | (4,155 | ) | | | (5,078 | ) | | | (10,283 | ) |
| Total regulatory capital | | | 98,175 | | | | 66,796 | | | | 67,974 | |
| Risk-weighted assets: | | | | | | | | | | | | |
| Credit risk | | | 551,400 | | | | 542,100 | | | | | |
| Counterparty risk | | | 61,100 | | | | 37,500 | | | | | |
| Market risk | | | 46,500 | | | | 17,900 | | | | | |
| Operational risk | | | 36,800 | | | | 36,000 | | | | | |
| | | | 695,800 | | | | 633,500 | | | | | |
| Banking book | | | | | | | | | | | 564,800 | |
| Trading book | | | | | | | | | | | 44,200 | |
| | | | | | | | | | | | 609,000 | |
| Risk asset ratio: | | | | | | | | | | | | |
| Core Tier 1 | | | 6.8% | | | | 4.3% | | | | 4.5% | |
| Tier 1 | | | 10.0% | | | | 6.8% | | | | 7.3% | |
| Total | | | 14.1% | | | | 10.5% | | | | 11.2% | |
The test confirms RBS remains well capitalised with a strong Tier 1 capital ratio under both the benchmark and adverse scenarios.
In addition to the EU stress test, during the second half of 2010 RBS has undertaken the FSA anchor scenario test.
During 2011, RBS is planning to take part in forthcoming International Monetary Fund, European Banking Federation and FSA stress testing exercises.
Other stress testing
In addition to industry wide stress tests, Group standards for stress testing allow for a combination of various stress testing methods in order to provide a comprehensive view of the Group’s risk profile. Depending on the complexity and materiality of the portfolio, techniques may range from sensitivity analyses performed on an individual product or an individual portfolio to the evaluation of complex stress scenarios performed at Group-wide level.
Stress testing techniques applied within the Group are:
The stress testing programme implemented aims to provide a comprehensive view of the Group’s risk profile. Stress tests are performed at the following levels of aggregation:
| · | transactional or sub-portfolio level. |
More details on stress and scenario testing are set out in various sub sections in the following pages.
Business reviewcontinued | Business review |
| Risk and balance sheet management |
Balance sheet management
All the disclosures in this section (pages 66 to 85) are audited unless otherwise indicated by an asterisk (*).
Capital*
It is the Group’s policy to maintain a strong capital base and to utilise it efficiently throughout its activities to optimise the return to shareholders, while maintaining a prudent relationship between the capital base and the underlying risks of the business. In carrying out this policy, the Group has regard to the supervisory requirements of the FSA.
Group Treasury in conjunction with the divisions and Risk Management, in respect of risk-weighted assets (RWAs), manage and control the Group’s balance sheet risks and consequent impact on the Group’s capital, funding, liquidity, interest rate and currency risks.
The FSA uses Risk Asset Ratiorisk asset ratio (RAR) as a measure of capital adequacy in the UK banking sector, comparing a bank’s capital resources with its risk-weighted assetsRWAs (the assets and off-balance sheet exposures are ‘weighted’weighted to reflect the inherent credit and other risks); by international agreement the RAR should be not less than 8% with a Tier 1 component of not less than 4%. The Group has complied with the FSA’s capital requirements throughout the year. A number of subsidiaries and sub-groups within the Group, principally banking and insurance entities are subject to additional individual regulatory capital requirements in the UK and overseas.
Capital allocation| | Proportional | | Statutory |
| Risk-weighted assets | 2010 £bn | 2009 £bn | 2008 £bn | | 2010 £bn | 2009 £bn | 2008 £bn |
| Credit risk | 383.0 | 410.4 | 433.4 | | 385.9 | 513.2 | 551.3 |
| Counterparty risk | 68.1 | 56.5 | 61.1 | | 68.1 | 56.5 | 61.1 |
| Market risk | 80.0 | 65.0 | 46.5 | | 80.0 | 65.0 | 46.5 |
| Operational risk | 37.1 | 33.9 | 36.8 | | 37.1 | 33.9 | 36.9 |
| | 568.2 | 565.8 | 577.8 | | 571.1 | 668.6 | 695.8 |
| Asset Protection Scheme relief | (105.6) | (127.6) | n/a | | (105.6) | (127.6) | n/a |
| | 462.6 | 438.2 | 577.8 | | 465.5 | 541.0 | 695.8 |
| Risk asset ratio | % | % | % | | % | % | % |
| Core Tier 1 | 10.7 | 11.0 | 5.9 | | 10.7 | 11.0 | 6.6 |
| Tier 1 | 12.9 | 14.4 | 9.9 | | 12.9 | 14.1 | 10.0 |
| Total | 14.0 | 16.3 | 14.2 | | 14.0 | 16.1 | 14.1 |
Key points
| Credit and counterparty RWAs fell by £15.8 billion principally due to Non-Core disposals partially offset by regulatory and modelling changes. |
| Market risk increased by £15.0 billion during the year principally due to an event risk. |
| The reduction in APS RWA relief relates to the run-off of covered assets. |
| The benefit of the APS to the Core Tier 1 ratio is 1.2% at 31 December 2010 (2009 - 1.6%). |
| In May 2010, the Group concluded a series of exchange and tender offers with the holders of a number of Tier 1 and upper Tier 2 securities. As a result of the exchange and tender offers, the Group realised an aggregate post-tax gain of £1.2 billion, which increased the Group’s Core Tier 1 capital ratio by approximately 0.3% and resulted in a reduction in the Group’s Total Tier 1 capital ratio of approximately 0.5%. |
| During the year the Group increased Core Tier 1 capital by £0.8 billion through the issue of ordinary shares on the conversion of sterling and US dollar non-cumulative convertible preference shares. |
As part of the annual planning and budgeting cycle, each division is allocated capital based upon risk-weighted assets (RWAs)RWAs and their associated regulatory deductions. The budgeting process considers risk appetite, available capital resources, stress testing results and business strategy. The budget is agreed by the Board and allocated to the divisions to manage their allocated RWAs.
Group Treasury and GALCO monitor actualavailable capital and its utilisation by tracking capital available and the utilisation of capital byacross divisions. GALCO makes the necessary decisions around re-allocationreallocation of budget and changes in RWA allocations. 60Individual Capital Adequacy Assessment Process (ICAAP)
Business review continuedBasel II
The Group adopted Basel II on 1 January 2008. Pillar 1 focuses onIn addition to the calculation of minimum capital required to support the credit, market and operational risks in the business. For credit risk, the majority of the Group uses the Advanced Internal Ratings Based Approach (AIRB) for calculating RWAs, making the Group one of a small number of banks whose risk systems and approaches have reached the regulatory standards.
For operational risk, the Group uses The Standardised Approach (TSA), which calculates operational risk-weighted assets based on gross income. In line with other banks, the Group is considering adopting the Advanced Measurement Approach (AMA) for all or part of the business.
Using these approaches, the RWA requirements by division, are as follows:
| | | Basel II 31 December 2008 £bn | | | Basel II 1 January 2008 £bn | | | Basel I 31 December 2007 £bn | |
| Global Markets | | | | | | | | | |
| – Global Banking & Markets | | | 278.5 | | | | 211.9 | | | | 188.7 | |
| – Global Transaction Services | | | 19.6 | | | | 16.8 | | | | 15.4 | |
| Regional Markets | | | | | | | | | | | | |
| – UK Retail & Commercial Banking | | | 152.5 | | | | 153.1 | | | | 179.0 | |
| – US Retail & Commercial Banking | | | 78.0 | | | | 53.8 | | | | 57.1 | |
| – Europe & Middle East Retail & Commercial Banking | | | 30.9 | | | | 30.3 | | | | 36.7 | |
| – Asia Retail & Commercial Banking | | | 6.4 | | | | 4.9 | | | | 3.3 | |
| Other | | | 11.9 | | | | 15.3 | | | | 9.8 | |
| RFS Holdings minority interest | | | 118.0 | | | | 147.4 | | | | 119.0 | |
| Group | | | 695.8 | | | | 633.5 | | | | 609.0 | |
Basel II is cyclical, unlike Basel I where RWAs are stable through the cycle. Changes in RWA totals are driven by external economic factors and their impact on the risk profile of the underlying portfolio of assets, rather than changes in the asset mix. Whilst Basel II tries to reduce this variation by incorporating measures correlated to downturn conditions, it remains sensitive to cyclical variations.
The AIRB approach to Basel II is based on the following metrics.
● | Probability of default (PD) models estimate the likelihood that a customer will fail to make full and timely repayment of credit obligations over a one year time horizon. Customers are assigned an internal credit grade which corresponds to PD. Every customer credit grade across all grading scales in the Group can be mapped to a Group level credit grade.
|
| Exposure at default (EAD) models estimate the expected level of utilisation of a credit facility at the time of a borrower’s default. The EAD may be assumed to be higher than the current utilisation (e.g. in the case where further drawings may be made on a revolving credit facility prior to default) but will not typically exceed the total facility limit.
|
| Loss given default (LGD) models estimate the economic loss that may occur in the event of default and represent the debt that cannot be recovered. The Group’s LGD models take into account the type of borrower, facility and any risk mitigation such as security or collateral held.
|
In addition to minimum capital calculated, for credit, market and operational risk, banks are required to undertake an Individual Capital Adequacy Assessment Process (ICAAP)ICAAP for other risks. The Group’s ICAAP, in particular, focuses on pension fund risk, interest rate risk in the banking book together with stress tests to assess the adequacy of capital over one year and the economic cycle.
Pillar 3
The Group will publishpublishes its Pillar 3 (Market disclosures) on the externalits website, providing a range of additional information relating to Basel II and risk and capital management across the Group. The disclosures focus on Group level capital resources and adequacy, discuss a range of credit risk approaches and their associated risk weighted assets (underRWAs under various Basel II approaches)approaches such as credit risk mitigation, counterparty credit risk and provisions. Detailed disclosures are also made on equity, securitisation, operational and market risk, and interest rate risk in the banking book.
* unaudited
Business reviewcontinued | Business review |
| Risk and balance sheet management |
Balance sheet management: Capital* continued
Capital resources - proportional
In addition to the fully consolidated basis monitored by the FSA for regulatory purposes, the Group also monitors its regulatory capital resources on a proportional consolidation basis reflecting only those businesses of RBS N.V that are retained by RBS. The Group’s regulatory capital resources on a proportional consolidation basis, in accordance with the FSA definitions, were as follows:
Composition of regulatory capital - proportional* | 2010 £m | 2009 £m | 2008 £m |
| Tier 1 | | | |
| Ordinary and B shareholders' equity | 70,388 | 69,890 | 45,525 |
| Non-controlling interests | 1,424 | 2,227 | 5,436 |
| Adjustments for: | | | |
| - goodwill and other intangible assets - continuing businesses | (14,448) | (14,786) | (16,386) |
| - goodwill and other intangible assets - discontinued businesses | — | (238) | — |
| - unrealised losses on available-for-sale (AFS) debt securities | 2,061 | 1,888 | 3,687 |
| - reserves arising on revaluation of property and unrealised gains on AFS equities | (25) | (207) | (984) |
| - reallocation of preference shares and innovative securities | (548) | (656) | (1,813) |
- other regulatory adjustments (1) | (1,097) | (950) | 9 |
| Less excess of expected losses over provisions net of tax | (1,900) | (2,558) | (770) |
| Less securitisation positions | (2,321) | (1,353) | (663) |
| Less APS first loss | (4,225) | (5,106) | — |
| Core Tier 1 capital | 49,309 | 48,151 | 34,041 |
| Preference shares | 5,410 | 11,265 | 16,655 |
| Innovative Tier 1 securities | 4,662 | 2,772 | 6,436 |
| Tax on the excess of expected losses over provisions | 758 | 1,020 | 308 |
| Less material holdings | (310) | (310) | (316) |
| Total Tier 1 capital | 59,829 | 62,898 | 57,124 |
| | | | |
| Tier 2 | | | |
| Reserves arising on revaluation of property and unrealised gains on AFS equities | 25 | 207 | 984 |
| Collective impairment provisions | 764 | 796 | 666 |
| Perpetual subordinated debt | 1,852 | 4,200 | 9,079 |
| Term subordinated debt | 16,681 | 18,120 | 20,282 |
| Non-controlling and other interests in Tier 2 capital | 11 | 11 | 11 |
| Less excess of expected losses over provisions | (2,658) | (3,578) | (1,076) |
| Less securitisation positions | (2,321) | (1,353) | (663) |
| Less material holdings | (310) | (310) | (316) |
| Less APS first loss | (4,225) | (5,106) | — |
| Total Tier 2 capital | 9,819 | 12,987 | 28,967 |
| | | | |
| Tier 3 | — | — | 260 |
| | | | |
| Supervisory deductions | | | |
| Unconsolidated investments | | | |
| - RBS Insurance | (3,962) | (4,068) | (3,628) |
| - other investments | (318) | (404) | (416) |
| Other deductions | (452) | (93) | (111) |
| Deductions from total capital | (4,732) | (4,565) | (4,155) |
| | | | |
| Total regulatory capital | 64,916 | 71,320 | 82,196 |
| | | | |
| Note: | | | |
| (1) Includes reduction for own liabilities carried at fair value | (1,182) | (1,057) | (1,159) |
* unaudited
Business reviewcontinued | Business review |
| Risk and balance sheet management |
Balance sheet management: Capital* continued
Capital resources - statutory
The Group's regulatory capital resources on a full consolidation basis, in accordance with the FSA definitions, were as follows:
| | 2010 £m | 2009 £m | 2008 £m |
| Composition of regulatory capital - statutory |
| Tier 1 | | | |
| Ordinary and B shareholders' equity | 70,388 | 69,890 | 45,525 |
| Non-controlling interests | 1,719 | 16,895 | 21,619 |
| Adjustments for: | | | |
| - goodwill and other intangible assets - continuing businesses | (14,448) | (17,847) | (20,049) |
| - goodwill and other intangible assets - discontinued businesses | — | (238) | — |
| - unrealised losses on available-for-sale (AFS) debt securities | 2,061 | 1,888 | 3,687 |
| - reserves arising on revaluation of property and unrealised gains on AFS equities | (25) | (207) | (984) |
| - reallocation of preference shares and innovative securities | (548) | (656) | (1,813) |
- other regulatory adjustments (1) | (1,097) | (1,184) | (362) |
| Less excess of expected losses over provisions net of tax | (1,900) | (2,558) | (770) |
| Less securitisation positions | (2,321) | (1,353) | (663) |
| Less APS first loss | (4,225) | (5,106) | — |
| Core Tier 1 capital | 49,604 | 59,524 | 46,190 |
| Preference shares | 5,410 | 11,265 | 16,655 |
| Innovative Tier 1 securities | 4,662 | 5,213 | 7,383 |
| Tax on the excess of expected losses over provisions | 758 | 1,020 | 308 |
| Less material holdings | (310) | (601) | (689) |
| Total Tier 1 capital | 60,124 | 76,421 | 69,847 |
| | | | |
| Tier 2 | | | |
| Reserves arising on revaluation of property and unrealised gains on AFS equities | 25 | 207 | 984 |
| Collective impairment provisions | 778 | 796 | 666 |
| Perpetual subordinated debt | 1,852 | 4,950 | 9,829 |
| Term subordinated debt | 16,745 | 20,063 | 23,162 |
| Non-controlling and other interests in Tier 2 capital | 11 | 11 | 11 |
| Less excess of expected losses over provisions | (2,658) | (3,578) | (1,078) |
| Less securitisation positions | (2,321) | (1,353) | (662) |
| Less material holdings | (310) | (601) | (689) |
| Less APS first loss | (4,225) | (5,106) | — |
| Total Tier 2 capital | 9,897 | 15,389 | 32,223 |
| | | | |
| Tier 3 | — | — | 260 |
| | | | |
| Supervisory deductions | | | |
| Unconsolidated investments | | | |
| - RBS Insurance | (3,962) | (4,068) | (3,628) |
| - other investments | (318) | (404) | (416) |
| Other deductions | (452) | (93) | (111) |
| Deductions from total capital | (4,732) | (4,565) | (4,155) |
| | | | |
| Total regulatory capital | 65,289 | 87,245 | 98,175 |
| | | | |
| Note: | | | |
| (1) Includes reduction for own liabilities carried at fair value | (1,182) | (1,057) | (1,159) |
* unaudited
Business reviewcontinued | Business review |
| Risk and balance sheet management |
Balance sheet management: Capital* continued
The tables below analyse the movement in the year of Core Tier 1 capital on a proportional and statutory basis.
Movement in Core Tier 1 capital - proportional | 2010 £m |
| At beginning of the year | 48,151 |
| Attributable loss net of movements in fair value of own debt | (1,250) |
| Gain on redemption of equity preference shares recorded in equity | 651 |
| Foreign currency reserves | 610 |
| Issue of ordinary shares | 804 |
| Impact of disposals | |
| - reduction in non-controlling interests | (729) |
| - reduction in intangibles | 754 |
| Decrease in capital deductions including APS first loss | 571 |
| Other movements | (253) |
| At end of the year | 49,309 |
| Movement in Core Tier 1 capital - statutory | 2010 £m |
| At beginning of the year | 59,524 |
| Attributable loss net of movements in fair value of own debt | (1,250) |
| Gain on redemption of equity preference shares recorded in equity | 651 |
| Foreign currency reserves | 610 |
| Issue of ordinary shares | 804 |
| Impact of disposals | |
| - reduction in non-controlling interests | (15,107) |
| - reduction in intangibles | 3,732 |
| Decrease in capital deductions including APS first loss | 571 |
| Other movements | 69 |
| At end of the year | 49,604 |
Risk-weighted assets by division
Risk-weighted assets by risk category and division on a proportional basis are set out below:
| | Credit risk | Counterparty risk | Market risk | Operational risk | Total | APS | Total |
| 2010 | £bn | £bn | £bn | £bn | £bn | £bn | £bn |
| UK Retail | 41.7 | — | — | 7.1 | 48.8 | (12.4) | 36.4 |
| UK Corporate | 74.8 | — | — | 6.6 | 81.4 | (22.9) | 58.5 |
| Wealth | 10.4 | — | 0.1 | 2.0 | 12.5 | — | 12.5 |
| Global Transaction Services | 13.7 | — | — | 4.6 | 18.3 | — | 18.3 |
| Ulster Bank | 29.2 | 0.5 | 0.1 | 1.8 | 31.6 | (7.9) | 23.7 |
| US Retail & Commercial | 52.0 | 0.9 | — | 4.1 | 57.0 | — | 57.0 |
| Retail & Commercial | 221.8 | 1.4 | 0.2 | 26.2 | 249.6 | (43.2) | 206.4 |
| Global Banking & Markets | 53.5 | 34.5 | 44.7 | 14.2 | 146.9 | (11.5) | 135.4 |
| Other | 16.4 | 0.4 | 0.2 | 1.0 | 18.0 | — | 18.0 |
| Core | 291.7 | 36.3 | 45.1 | 41.4 | 414.5 | (54.7) | 359.8 |
| Non-Core | 91.3 | 31.8 | 34.9 | (4.3) | 153.7 | (50.9) | 102.8 |
| Group | 383.0 | 68.1 | 80.0 | 37.1 | 568.2 | (105.6) | 462.6 |
* unaudited
Business reviewcontinued | Business review |
| Risk and balance sheet management |
Balance sheet management: Capital*continued
Asset Protection Scheme
The Group acceded to the Asset Protection Scheme (‘APS’ or ‘the Scheme’) in December 2009.
Following the accession to the APS, HM Treasury provides loss protection against potential losses arising in a pool of assets. HM Treasury also subscribed to £25.5 billion of capital in the form of B shares and a Dividend Access Share, with a further £8 billion of capital in the form of B shares potentially available as contingent capital. The Group pays annual fees in respect of the protection and contingent capital. The Group has the option, subject to HM Treasury consent, to pay the annual premium, contingent capital and the exit fee payable in connection with any termination of the Group’s participation in the APS in whole or in part, by waiving the entitlements of members of the Group to certain UK tax reliefs.
Following accession to the APS, arrangements were put in place within the Group that extended effective APS protection to all other regulated entities holding assets covered by the APS.
Regulatory capital impact of the APS
Methodology
The regulatory capital requirements for assets covered by the Scheme are calculated using the securitisation framework under the FSA prudential rules. The calculation is as follows (known as ‘the uncapped amount’):
| First loss - the residual first loss, after impairments and write-downs, to date, is deducted from available capital split equally between Core Tier 1 and Tier 2 capital; |
| HM Treasury share of covered losses - after the first loss has been deducted, 90% of assets covered by HM Treasury are risk-weighted at 0%; and |
| RBS share of covered losses - the remaining 10% share of loss is borne by RBS and is risk-weighted in the normal way. |
Should the uncapped amount be higher than the capital requirements for the underlying assets calculated as normal, ignoring the Scheme, the capital requirements for the Scheme are capped at the level of the requirements for the underlying assets (‘capped amount’). Where capped, the Group apportions the capped amount up to the level of the first loss as calculated above; any unused capped amount after the first loss capital deduction will be taken as RWAs for the Group’s share of covered losses.
Adjustments to the regulatory capital calculation can be made for either currency or maturity mismatches. These occur where there is a difference between the currency or maturity of the protection and that of the underlying asset. These mismatches will have an impact upon the timing of the removal of the cap and level of regulatory capital benefit on the uncapped amount, but this effect is not material.
Impact
The Group calculates its capital requirements in accordance with the capped basis. Accordingly, the APS has no impact on the Pillar 1 regulatory capital requirement in respect of the assets covered by the APS. It does, however, improve the Core Tier 1 total capital ratio, of the Group as a whole. The protection afforded by the APS assists the Group in satisfying the forward looking stress testing framework applied by the FSA.
Future regulatory capital effects
As impairments or write-downs on the pool of assets are recognised, they reduce Core Tier 1 capital in the normal way. This will reduce the first loss deduction for the Scheme, potentially leading to a position where the capital requirement on the uncapped basis would no longer, for the assets covered by the APS, exceed the Non-APS requirement and as a result, the Group would expect to start reporting the regulatory capital treatment on the uncapped basis.
For further information on the APS see page 161.
Business reviewcontinued | Business review |
| Risk and balance sheet management |
Balance sheet management: Capital* continued
Regulatory developments
Basel III and CRD IV
The Basel Committee released the final text on the new Basel III Capital and Liquidity Frameworks in December 2010, the contents of which were broadly as expected. Whilst most of the new rules are ‘final’ there are lengthy observation periods for the more novel elements (the liquidity coverage ratio, the net stable funding ratio and the leverage ratio) designed to identify any unintended consequences prior to full implementation and it is possible that some of the detail may be amended. The capital requirements for credit valuation adjustments (CVAs) with respect to counterparty risk are subject to a final impact assessment which is being carried out in the first quarter of 2011. The Committee’s guidance on the countercyclical capital buffers allows for significant judgement which will need to be clarified by national regulators. The potential impacts for RBSG are set out below.
| national implementation of increased capital requirements will begin on 1 January 2013; |
| there will be a phased five year implementation of new deductions and regulatory adjustments to Core Tier 1 capital commencing 1 January 2014; |
| the de-recognition of non-qualifying non common Tier 1 and Tier 2 capital instruments will be phased in over 10 years from 1 January 2013; and |
| · | requirements for changes to minimum capital ratios, including conservation and countercyclical buffers, as well as additional requirements for Systemically Important Financial Institutions, will be phased in from 2013 to 2019. |
The focus will now be on the EU’s implementation of the Basel framework. The Commission’s legislative proposal - the Capital Requirements Directive (CRD) IV - is expected to appear in summer 2011.
Contingent capital and loss absorbency
The Basel Committee issued its final rules on the requirements to ensure all classes of capital instruments fully absorb losses at the point of non-viability, before tax payers are exposed to loss. These are designed to combat the experience during the crisis where holders of Tier 2 capital instruments did not suffer any losses when banks were bailed out by the public sector. Debate continues, meanwhile, over possible requirements for bailing-in senior debt holders, as a further means of protecting the taxpayer.
Implementation by the Group
RBS is advanced in its planning to implement these new measures and is appropriately well-capitalised with tangible equity of £56 billion, Core Tier 1 capital of £49 billion and a Core Tier 1 ratio of 10.7% at 31 December 2010.
Set out below are indicative impacts and timings of the major Basel 2.5 and Basel III proposals on the Group’s Core Tier 1 ratio. The estimates are still subject to change; a high degree of uncertainty still remains around implementation details as the guidelines are not fully finalised and must still be converted into rules by the FSA.
A substantial part of the mitigating impacts mentioned in the following paragraphs relate to run-off in the normal course of business and de-leveraging of legacy positions and securitisations, including Non-Core. The Group is also devoting considerable resource to enhancing its models to improve management of market and counterparty exposures. A key mitigating action related to counterparty risk involves enhancement to internal models, which is a significant undertaking. There could be various hedging strategies and business decisions taken as part of mitigation which may have an adverse, but manageable, impact on revenues.
CRD3 (Basel 2.5): Published rules for market risk and re-securitisations. Proposed implementation date 31 December 2011
The estimated impact at the end of 2011 on RWAs post mitigation is an increase of £25 billion to £30 billion, split equally between GBM and Non-Core.
Basel III Counterparty risk: Proposed implementation date 1 January 2013
The impact on RWAs on implementation in 2013 is currently estimated at £45 to £50 billion post mitigation and deleveraging, although there may still be movement in the final framework around this risk.
Basel III Securitisations: Proposed implementation date 1 January 2013
Under the proposals, current deductions under Basel II (50% Core Tier 1, 50% Tier 2) for securitisation positions are switched to RWAs weighted at 1,250%. Post the run-off of securitisation positions and mitigating actions, the impact on implementation in 2013, on RWAs is estimated to be an increase of £30 billion to £35 billion with a corresponding reduction in deductions from Core Tier 1 and Tier 2 capital of £1.2 billion to £1.5 billion each. The impact net RWA equivalent of this change assuming a 10% Core Tier 1 ratio would be an increase in net RWA equivalents of £18 billion to £20 billion.
Summary impacts
The extent of the individual areas of impact, as set out above, may continue to change over time. As previously indicated, however, the overall impact on RWAs of CRD III and CRD IV after mitigation and deleveraging is estimated to be £100 billion to £115 billion, before allowing for the offsetting reduction in deductions.
The impact referenced above would lower the Core Tier 1 ratio by approximately 1.3%, assuming RWAs of £600 billion and a Core Tier 1 ratio of 10%.
* unaudited
Business reviewcontinued | Business review |
| Risk and balance sheet management |
Balance sheet management: Capital*continued
Regulatory developments continued
Basel III capital deductions and regulatory adjustments
In addition to the changes outlined above, Basel III will also result in revisions to regulatory adjustments and capital deductions. These will be phased in over a five year period from 1 January 2014. The initial deduction is expected to be 20%, rising 20 percentage points each year until full deduction by 1 January 2018. However, this is subject to final implementation rules determined by the FSA. The proportion not deducted in the transition years will continue to be subject to existing national treatments.
The major categories of deductions include:
| · | expected loss net of provisions; |
| deferred tax assets not relating to timing differences; |
| unrealised losses on available-for-sale securities; and |
| significant investments in non-consolidated financial institutions. |
The net impact of these adjustments is expected to be manageable as most of these drivers reduce or are eliminated by 2014.
Other regulatory developments
Treatment of Systemically Important Financial Institutions (SIFIs)
Policy development around contingent capital and loss absorbency forms part of a wider policy initiative on addressing systemic institutions. A Financial Stability Board outline framework and plan of action was endorsed by G20 leaders at the November 2010 Seoul Summit. This now forms the main focus of global policy making following the finalisation of the Basel III framework. Policy initiatives in this area may include proposals for greater loss absorbency for systemic firms, the development of enhanced supervision and resolution frameworks, as well as providing Interest Rate Riskrecovery and resolution plans.
The EU Commission Consultation
Crisis management proposals
The EU Commission issued a consultation paper on crisis management measures in January 2011. It covers prevention tools (such as recovery planning requirements, supervisory powers and new ideas on intra-group financial support mechanisms), as well as resolution tools (including partial transfer powers and possible approaches to debt write-down. The consultation will inform draft implementing legislation expected this summer, and is intended to help shape the global framework for SIFIs.
Markets in Financial Instruments Directive Review
The EU Commission published a consultation on revising the Directive on Markets in Financial Instruments (MiFID2). The main proposals in the Banking Book disclosures.consultation are the extension of the transparency rules to include bonds and over the counter derivatives, measures to reinforce regulation of commodity derivatives and high frequency trading, strengthening investor protection and detailing the role of the new European Securities and Markets Authority.
Financial activities tax
In a recent speech, the EU Tax Commissioner talked about the introduction of a potential Financial Activities Tax at a European level. There will be an impact assessment in 2011 to review the cumulative impact on financial institutions of new regulation, bank levy and taxes, as part of the Commission's on-going examination of possible tax measures.
Dodd-Frank
In the United States the Dodd-Frank Wall Street Reform and Consumer Reform Act (Dodd-Frank) contains very significant reforms the full effect of which can only be assessed when the implementation rules are finalised. There have also been numerous derivative proposals from the Commodity Futures Exchange Commission (CFTC) and the Securities and Exchange Commission (SEC) plus joint agency proposals to implement minimum capital standards (Collins Amendment) and market risk capital guidelines.
Project Merlin
On 9 February 2011, the UK Government and the major British banks including the Group, announced the creation of an accord, known as Project Merlin, aimed at demonstrating the clear and shared intent to work together to help the UK economy recover and grow. The banks:
| will work to foster credit demand, particularly among small and medium-sized businesses, and will make available additional lending capacity if demand should materialise above their current expectations; |
| expect to contribute more in UK tax as their performance strengthens and their profits grow and will jointly contribute an additional £1 billion to the Business Growth Fund; |
| confirm that the aggregate 2010 bonus pool including deferrals for their UK-based staff will be lower than that of 2009 and will reflect the engagement each bank has had with the Financial Services Authority, the UK Government and its shareholders, as well as their duty to manage pay policy to protect and enhance the long-term interests of shareholders; and |
| will extend disclosure of remuneration details of their most senior executives beyond international norms. |
The Government has in the light of the banks’ statements affirmed its commitment to maintaining a strong, resilient, stable and globally competitive UK financial services sector, and to implementing and applying European and international regulation to create a level playing field in both policy and practice.
* unaudited
Business reviewcontinued | Business review |
| Risk and balance sheet management |
Balance sheet management:Capital* continued
Other regulatory developments continued
Structure of prudential regulation in the UK
Following the consultation by HM Treasury on ‘A new approach to financial regulation’ in 2010, the government subsequently published further detailed proposals to give the Bank of England responsibility for prudential regulation, and to create a new Consumer Protection and Markets Authority to protect the interests of bank customers.
Increase in the level of customer protection under Financial Services Compensation Scheme
The European Commission has introduced a uniform compensation level of €100,000 across Member States from 1 January 2011. The sterling equivalent was confirmed by HM Treasury as £85,000.
Independent Commission on Banking
The Independent Commission on Banking has published responses from banks, academics and other interested parties to its initial consultation. In its summary of the evidence received the Commission noted that there was considerable interest, both positive and negative, in the question of splitting retail and investment banks. The Commission plans to publish its interim report in April.
FSA Code on remuneration
In July 2009 the European Commission adopted a proposal to further amend the Capital Requirements Directive (CRD) which included proposals on remuneration policies. This was subsequently voted for and approved (CRD III).
CRD III required the Commission of European Banking Supervisors (CEBS) to issue guidelines on sound remuneration policies which comply with its principles and these were issued on 10 December 2010 (the “Guidelines”).
The FSA amended its Remuneration Code to take into account the Guidelines and published its policy statement on remuneration on 17 December 2010.
The Group is required to be compliant with the FSA Remuneration Code with effect from 1 January 2011:
| as a “Tier 1” organisation, the Code applies to all employees on a global basis; |
| there are specific remuneration and governance requirements in relation to “Code Staff”; and |
| following an ongoing review of our remuneration arrangements and discussions with the FSA, 2011 RBS remuneration arrangements are fully compliant with the FSA Remuneration Code. |
Bank levy
In his 22 June 2010 budget statement, the Chancellor announced that the UK Government will introduce an annual bank levy. The Finance Bill 2011 contains details of how the levy will be calculated and collected. The levy will be collected through the existing quarterly corporation tax collection mechanism starting with payment dates on or after the date the Finance Bill 2011 receives Royal Assent. Further information is included on page 309.
Stress and scenario testing
Stress testing is central toforms part of the Group’s risk and capital framework and is an integral tocomponent of Basel II. As a key risk management tool, stress testing highlights to senior management potential adverse unexpected outcomes related to a mixture of risks and provides an indication of how much capital might be required to absorb losses, should adverse scenarios occur. Stress testing is used at both a divisional and Group level to assess risk concentrations, estimate the impact of stressed earnings, impairments and write-downs on capital, determinecapital. It determines the overall capital adequacy under stress conditions and identify mitigating actions.a variety of adverse scenarios. The principal business benefits of the stress testing framework are:include: understanding the impact of recessionary scenarios; assessing material risk concentrations; and forecasting the impact of market stress and scenarios on the Group’s balance sheet liquidity.
Business review continuedAt Group level, aA series of stress events are monitored on a regular basis to assess the potential impact of an extreme yet plausible event on the Group. There are twofour core elements of scenario stress testing:
● | Recessionarymacroeconomic stress testing considers the impact on both earnings and capital offor a range of recessionary scenarios. These areThey entail multi-year systemic shocks to assess the Group’s ability to meet its capital requirements and liabilities as they fall due underin a significant but plausible downturn in the business cycle and/or macroeconomic environment. The summary results are included within the monthly risk report to the Board and discussed in separate papers on a half-yearly basis.
environment; |
● | Integratedenterprise-wide stress testing considers firm wide stress testsscenarios that are not macroeconomic in nature but are sufficiently broad to measure the Group’s exposureimpact across multiple risks or divisions and are likely to exceptional but plausible economicaffect earnings, capital and geopolitical events. Stress testing supports the identification and quantification of material risks that may arise under stress scenarios, and provides information to support management decision-making around risk appetite and control.
funding; |
Cross divisional stress testing, undertaken to support the Group’s framework for managing industry and geographical sector concentrations, is performed through the identification of scenarios which are likely to affect groups of inter-related (correlated) sectors. These stress tests are discussed with senior divisional management and are reported to GRC, GEMC, GALCO and GAC. The Group manages to a trigger limit on the stressed impairment charge for an individual scenario. | cross-divisional stress testing includes scenarios which have impacts across divisions relating to sensitivity to a common risk factor(s). This would include, for example, sector based stress testing across corporate portfolios and sensitivity analysis to stress in market factors. These stress tests are discussed with senior divisional management and are reported to senior committees across the Group; and |
| divisional and risk specific stress testing is undertaken to support risk identification and management. Examples include the daily product based stress testing using a hybrid of hypothetical and historical scenarios within market risk. |
Portfolio analysis, using historic performance and forward looking indicators of change, uses stress testing to facilitate the measurement of potential exposure to events and seeks to quantify the impact of an adverse change in factors which drive the performance and profitability of a portfolio.
Risk coverage* unaudited
The main risks facing the Group are shown below.
Risk type | Definition | Features |
Credit risk (including country and political risks) | The risk arising from the possibility that the Group will incur losses from the failure of customers to meet their financial obligations to the Group. | Loss characteristics vary materially across portfolios.
Significant correlation between losses and the macroeconomic environment.
Concentration risk.
|
Funding and liquidity risk | The risk of losses through being unable to meet obligations as they fall due. | Potential to disrupt the business model and stop normal functions of the Group.
Significantly correlated with credit risk losses.
|
Market risk | The risk that the value of an asset or liability may change as a result of a change in market rates. | Potential for large material losses.
Significantly correlated with equity risk and the macroeconomic environment.
|
Insurance risk | The risk of financial loss through fluctuations in the timing, frequency and/or severity of insured events, relative to the expectations at the time of underwriting. | Frequent small losses.
Infrequent material losses.
|
Operational risk | The risk of financial loss or reputational impact resulting from fraud; human error; ineffective or inadequately designed processes or systems; improper behaviour; legal events; or from external events. | Generally immaterial losses. |
Regulatory risk | The risks arising from regulatory changes/enforcement. | Risk of regulatory changes.
Compliance with regulations.
Potential for fines and/or restrictions in business activities.
|
Other risk | The risks arising from reputation and pension fund risk. | Additional regulation can be introduced as a result of other risk losses. |
Business reviewcontinued | Business review |
| Risk and balance sheet management |
62
Balance sheet management: Funding and liquidity risk
All disclosures in this section (pages 74 to 85) are audited unless indicated otherwise with an asterisk (*).
Introduction
The Group’s balance sheet composition is a function of the broad array of product offerings and diverse markets served by its Core divisions. The structural integrity of the balance sheet is augmented as needed through active management of both asset and liability portfolios. The objective of these activities is to optimise liquidity transformation in normal business environments while ensuring adequate coverage of all cash requirements under extreme stress conditions.
Diversification of the Group’s funding base is central to the liquidity management strategy. The Group’s businesses have developed large customer franchises, the largest being in the UK, US and Ireland but extend into Europe, Asia and Latin America. Customer deposits provide large pools of stable funding to support the majority of the Group’s lending. It is a strategic objective to improve the Group’s loan to deposit ratio to 100%, or better, by 2013.
The Group also accesses professional markets funding by way of public and private debt issuances on an unsecured and secured basis. These debt issuance programmes are spread across multiple currencies, and maturities to appeal to a broad range of investor types, and preferences around the world. This market based funding supplements the Group’s structural liquidity needs and in some cases achieves certain capital objectives.
Stress testing
Simulated liquidity stress testing is periodically performed for each business and applied to the major operating subsidiary balance sheets. A variety of firm-specific and market related scenarios are used at the consolidated level and in individual countries. These scenarios include assumptions about significant changes in key funding sources, credit ratings, contingent uses of funding, and political and economic conditions in certain countries. Stress tests are regularly updated based on changing market conditions.
Contingency planning
The Group has a Contingency Funding Plan (CFP) which is maintained and updated as the balance sheet evolves. The CFP is linked to stress test results and forms the foundation for liquidity risk limits. Limits in the business-as-usual environment are bounded by capacity to satisfy the Group’s liquidity needs in the stress environments. The CFP provides a detailed description of the availability, size and timing of all sources of contingent liquidity available to the Group in a stress event. These are ranked in order of economic impact and effectiveness to meet the anticipated stress requirement. The CFP includes documented procedures and sign-offs for actions that may require businesses to provide access to customer assets for collateralized borrowing, securitisation or sale. Roles and responsibilities for the effective implementation of the CFP are also documented.
Liquidity reserves
The Group maintains liquidity reserves sufficient to satisfy cash requirements in the event of a severe disruption in its access to either wholesale or retail funding sources. The reserves consist of high quality unencumbered government securities and cash held on deposit at central banks. Government securities vary by type and jurisdiction based on local regulatory considerations. The currency mix of the reserves reflects the underlying balance sheet composition.
Regulatory oversight
The Group operates in multiple jurisdictions and is subject to a number of regulatory regimes.
The Group's lead regulator is the Financial Services Authority (FSA). The FSA implemented a new liquidity regime on 1 June 2010. The new rules provide a standardised approach applied to all UK banks. At RBS, the rules focus on the RBS UK Defined Liquidity Group (a subset comprising the Group’s five main UK banks, The Royal Bank of Scotland plc, National Westminster Bank Plc, Ulster Bank Limited, Coutts & Company and Adam & Company) and cover adequacy of liquidity resources, controls, stress testing and the Individual Liquidity Adequacy Assessment (ILAA) process. The ILAA informs the Board and FSA of the assessment and quantification of the Group’s liquidity risks and their mitigation, and how much current and future liquidity is required. The ILAA was approved by the Board in November 2010. The FSA is expected to issue ‘Individual Liquidity Guidance’ to the Group in 2011.
In the US, the Group’s operations are required to meet liquidity requirements set out by the US Federal Reserve Bank, Office of the Comptroller of the Currency, Federal Deposit Insurance Corporation and Financial Industry Regulatory Authority. In the Netherlands, the Group is subject to the De Nederlandsche Bank liquidity oversight regime.
Regulatory developments*
There have been a number of significant developments in the regulation of liquidity risk.
In December 2010, the BCBS issued the ‘International framework for liquidity risk measurement, standards and monitoring’ which confirmed the introduction of two liquidity ratios, the liquidity coverage ratio (LCR) and the net stable funding ratio (NSFR). The introduction of both of these will be subject to an observation period, which includes review clauses to address and identify any unintended consequences.
After an observation period beginning in 2011, the LCR, including any revisions, will be introduced on 1 January 2015. The NSFR, including any revisions, will move to a minimum standard by 1 January 2018.
* unaudited
Balance sheet management: Funding and liquidity risk continued
Credit risk
Principles for credit risk management (audited)
Funding sources
The key principles for credit risk management intable below shows the Group are as follows:composition of the Group’s primary funding sources, excluding repurchase agreements.
| | 2010 | | 2009 | | 2008 |
| | £m | % | | £m | % | | £m | % |
| Deposits by banks | | | | | | | | |
| - cash collateral | 28,074 | 3.8 | | 32,552 | 4.0 | | 45,783 | 4.8 |
| - other | 37,864 | 5.1 | | 83,090 | 10.3 | | 133,160 | 14.0 |
| | 65,938 | 8.9 | | 115,642 | 14.3 | | 178,943 | 18.8 |
| Debt securities in issue | | | | | | | | |
| - commercial paper | 26,235 | 3.5 | | 44,307 | 5.5 | | 69,891 | 7.3 |
| - certificates of deposits | 37,855 | 5.1 | | 58,195 | 7.2 | | 73,925 | 7.8 |
| - medium-term notes and other bonds | 131,026 | 17.7 | | 125,800 | 15.6 | | 108,529 | 11.4 |
| - covered bonds | 4,100 | 0.6 | | — | — | | — | — |
| - other securitisations | 19,156 | 2.6 | | 18,027 | 2.2 | | 17,113 | 1.8 |
| | 218,372 | 29.5 | | 246,329 | 30.5 | | 269,458 | 28.3 |
| | | | | | | | | |
| Subordinated liabilities | 27,053 | 3.7 | | 31,538 | 3.9 | | 43,678 | 4.6 |
| Total wholesale funding | 311,363 | 42.1 | | 393,509 | 48.7 | | 492,079 | 51.7 |
| | | | | | | | | |
| Customer deposits | | | | | | | | |
| - cash collateral | 10,433 | 1.4 | | 9,934 | 1.2 | | 18,344 | 1.9 |
| - other | 418,166 | 56.5 | | 404,317 | 50.1 | | 441,974 | 46.4 |
| Total customer deposits | 428,599 | 57.9 | | 414,251 | 51.3 | | 460,318 | 48.3 |
| | | | | | | | | |
| Total funding | 739,962 | 100.0 | | 807,760 | 100.0 | | 952,397 | 100.0 |
Key points
● | A credit risk assessmentThe Group has continued to reduce reliance on wholesale funding and diversify funding sources. Deposits by banks were reduced by 43% since 31 December 2009. |
| The Group has increased the proportion of theits funding from customer and credit facilities is undertaken priordeposits during 2010, from 51% at 31 December 2009 to approval of credit exposure. Typically, this includes both quantitative and qualitative elements including, the purpose of the credit and sources of repayment; compliance with affordability tests; repayment history; ability to repay; sensitivity to economic and market developments; and risk-adjusted return based on credit risk measures appropriate to the customer and facility type.58% at 31 December 2010. |
● | Credit risk authority is specifically grantedThe Group was able to reduce short-term wholesale borrowing by £93 billion to £157 billion (including £63 billion of deposits from banks) during the year. Short-term wholesale funding excluding derivative collateral decreased from £216 billion at 31 December 2009 to £129 billion at 31 December 2010. |
Business reviewcontinued | Business review |
| Risk and balance sheet management |
Balance sheet management: Funding and liquidity riskcontinued
The tables below show the Group’s debt securities in issue and subordinated liabilities by maturity.
| 2010 | Debt securities in issue | Subordinated liabilities | Total | |
| £m | £m | £m | % |
| Less than one year | 94,048 | 964 | 95,012 | 38.7 |
| 1-5 years | 71,955 | 9,230 | 81,185 | 33.1 |
| More than 5 years | 52,369 | 16,859 | 69,228 | 28.2 |
| | 218,372 | 27,053 | 245,425 | 100.0 |
| 2009 | | | | |
| | | | |
| Less than one year | 136,901 | 2,144 | 139,045 | 50.0 |
| 1-5 years | 70,437 | 4,235 | 74,672 | 26.9 |
| More than 5 years | 38,991 | 25,159 | 64,150 | 23.1 |
| | 246,329 | 31,538 | 277,867 | 100.0 |
| 2008 | | | | |
| | | | |
| Less than one year | 170,240 | 1,994 | 172,234 | 55.0 |
| 1-5 years | 56,109 | 5,733 | 61,842 | 19.8 |
| More than 5 years | 43,109 | 35,951 | 79,060 | 25.2 |
| | 269,458 | 43,678 | 313,136 | 100.0 |
Key points
| The Group has improved its funding and liquidity position by extending the average maturity of debt securities in writingissue. |
| The proportion of debt instruments with a remaining maturity of greater than one year has increased in 2010 from 50% at 31 December 2009 to individuals involved61% at 31 December 2010. |
Short-term borrowings*
The table below shows details of the Group’s short-term borrowings.
Short-term borrowings comprise repurchase agreements, borrowings from financial institutions, commercial paper and certification of deposit. Derivative collateral received from financial institutions is excluded from the table below as are long-term borrowings by US Retail & Commercial from Federal Home Loan Banks.
| | Repos | Financial institutions (1, 2) | Commercial paper | Certificates of deposits | Total 2010 | Total 2009 | Total 2008 |
| At year end | | | | | | | |
- balance (£bn) | 115 | 42 | 26 | 38 | 221 | 242 | 347 |
| - weighted average interest rate | 0.5% | 0.6% | 0.7% | 0.6% | 0.6% | 0.8% | 3.8% |
| | | | | | | | |
| During the year | | | | | | | |
- maximum balance (£bn) | 157 | 78 | 37 | 57 | 329 | 357 | 594 |
- average balance (£bn) | 137 | 62 | 34 | 50 | 283 | 292 | 486 |
| - weighted average interest rate | 0.6% | 0.8 % | 0.9% | 1.0% | 0.7% | 1.9% | 4.2% |
| (1) | Excludes derivative cash collateral of £28 billion at 31 December 2010 (2009 - £33 billion; 2008 - £46 billion), 2010 average of £34 billion (2009 - £40 billion; 2008 - £20 billion). |
| (2) | Excludes Federal Home Loans Banks long-term borrowings of £1.5 billion at 31 December 2010 (2009 - £2.7 billion; 2008 - £3.9 billion), 2010 average of £2.3 billion (2009 - £3.1 billion; 2008 - £3.0 billion). |
Balances are generally based on monthly data. Average interest rates during the year are computed by dividing total interest expense by the average amount borrowed. Average interest rates at year end are average rates for a single day and as such may reflect one-day market distortions which may not be indicative of generally prevailing rates.
* unaudited
Business reviewcontinued | Business review |
| Risk and balance sheet management |
Balance sheet management: Funding and liquidity risk continued
Balance sheet management: Interest rate risk
The table below shows debt securities issued by the Group with an original maturity of one year or more. The Group also executes other long-term funding arrangements (predominately term repurchase agreements) not reflected in the tables below.
| | 2010 | 2009 | 2008 |
| | £m | £m | £m |
| Public | | | |
| - unsecured | 12,887 | 8,386 | 5,166 |
| - unsecured: guaranteed | — | 19,663 | 6,334 |
| - secured | 8,041 | — | — |
| | | | |
| Private | | | |
| - unsecured | 17,450 | 14,895 | 24,172 |
| - unsecured: guaranteed | — | 15,459 | 8,151 |
| Gross issuance | 38,378 | 58,403 | 43,823 |
The table below shows the original maturity and currency breakdown of long-term debt securities issued in 2010.
| Original maturity | £m | % |
| 1-2 years | 1,698 | 4.4 |
| 2-3 years | 3,772 | 9.8 |
| 3-4 years | 5,910 | 15.4 |
| 4-5 years | 559 | 1.5 |
| 5-10 years | 14,187 | 37.0 |
| > 10 years | 12,252 | 31.9 |
| | 38,378 | 100.0 |
| Currency | £m | % |
| GBP | 4,107 | 10.7 |
| EUR | 19,638 | 51.2 |
| USD | 9,760 | 25.4 |
| Other | 4,873 | 12.7 |
| | 38,378 | 100.0 |
Key points
| Term debt issuances exceeded the grantingGroup’s original plans of credit approval, whether this is individually or collectively£20 - £25 billion as partinvestor appetite for both secured and unsecured funding allowed the Group to accelerate plans to extend the maturity profile of a credit committee. In exercising credit authority, individuals are required to act independently of business considerations and must declare any conflicts of interest.its wholesale funding. |
● | Credit exposures, once approved, are monitored, managedExecution was strong across G10 currencies and reviewed periodically against approved limits. Lower quality exposures are subject to more frequent analysisdiversified across the yield curve. |
| There were term issuances of £4.5 billion in January and assessment.February 2011. |
Business reviewcontinued | Business review |
| Risk and balance sheet management |
Balance sheet management: Funding and liquidity risk continued
Credit Guarantee Scheme
The table below shows the residual maturity of the Group’s outstanding term funding issued under the UK Government’s Credit Guarantee Scheme at 31 December 2010.
| Residual maturity | £m | % |
| Q1 2011 | 196 | 0.5 |
| Q2 2011 | 1,224 | 2.9 |
| Q4 2011 | 18,728 | 45.2 |
| Q1 2012 | 15,593 | 37.6 |
| Q2 2012 | 5,714 | 13.8 |
| | 41,455 | 100.0 |
Key points
| The Group had £41.5 billion outstanding at 31 December 2010 (2009 - £45.2 billion) of which £20.1 billion matures in 2011. |
● | Credit risk management worksThe Group’s funding plan for 2011 incorporates these maturities along with business functions onother structural balance sheet changes. |
Special Liquidity Scheme*
The Group does not use the Special Liquidity Scheme (SLS) to fund its business activities. The Group’s outstanding liabilities under the SLS are used to fund elements of its liquidity portfolio. Balances under the SLS continued to reduce in 2010.
Liquidity portfolio
The table below shows the composition of the Group’s liquidity portfolio. The Group has refined the presentation of this portfolio. Treasury bills and other government bonds which were previously reported under the central Group Treasury portfolio, as well as unencumbered collateral and other liquid assets are now included in their respective asset classes.
| Liquidity portfolio | 2010 £m | 2009 £m |
| Cash and balances at central banks | 53,661 | 51,500 |
| Treasury bills | 14,529 | 30,010 |
Central and local government bonds (1) | | |
- AAA rated governments (2) | 41,435 | 30,140 |
| - AA- to AA+ rated governments | 3,744 | 2,011 |
| - governments rated below AA | 1,029 | 1,630 |
| - local government | 5,672 | 5,706 |
| | 51,880 | 39,487 |
Unencumbered collateral (3) | | |
| - AAA rated | 17,836 | 20,246 |
| - below AAA rated and other high quality assets | 16,693 | 29,418 |
| | 34,529 | 49,664 |
| Total liquidity portfolio | 154,599 | 170,661 |
| (1) | Includes FSA eligible government bonds of £34.7 billion at 31 December 2010. |
| (2) | Includes AAA rated US government guaranteed agencies. |
| (3) | Includes secured assets which are eligible for discounting at central banks, comprising loans and advances and debt securities. |
Key points
| The liquidity portfolio at the ongoing managementend of 2009 reflects the build up of liquid assets ahead of the credit portfolio, including decisions on mitigating actions taken against individual exposures or broader portfolios.legal separation of RBS N.V. and ABN AMRO in April 2010. Following the separation, the liquid assets and associated short-term wholesale funding were managed down to business as usual levels. |
● | Customers with emerging credit problems are identified earlyThe Group has maintained its liquidity portfolio at or near its strategic target of £150 billion. The final level of the reserves will be influenced by balance sheet size, maturity profile and classified accordingly. Remedial actions are implemented promptly and are intended to restore the customer to a satisfactory status and minimise any potential loss to the Group.regulatory requirements. |
● | Stress testingThe Group anticipates that the composition of portfolios is undertaken to assess the potential credit impactliquidity portfolio will vary over time based on changing regulatory requirements and internal evaluation of non-systemic scenarios and wider macroeconomic events on the Group’s income and capital.liquidity needs under stress. |
Specialist credit risk teams oversee the credit process independently, making credit decisions within their discretion, or recommending decisions to the appropriate credit committee.* unaudited
Assessments of corporate borrower and transaction risk are undertaken using fundamental credit analysis and the application of general corporate and certain specialist counterparty credit risk models. Financial markets counterparties are approved by a dedicated credit function which specialises in traded market product risk. Specialist credit grading models exist for certain bank and non-bank financial institutions.
Different approaches are used for the management of wholesale and retail businesses:
● | Wholesale businesses: exposures are aggregated to determine the appropriate level of credit approval required and to facilitate consolidated credit risk management. Credit applications for corporate customers are prepared by relationship managers (RMs) in the units originating the credit exposures, or by the RM team with lead responsibility for a counterparty where a customer has relationships with different divisions and business units across the Group. This includes the assignment of counterparty credit grades and LGD estimates using approved models, which are also independently checked by the credit team. |
● | Retail businesses: the retail business makes a large volume of small value credit decisions. Credit decisions will typically involve an application for a new or additional product or a change in facilities on an existing product. The majority of these decisions are based upon automated strategies utilising industry standard credit and behaviour scoring techniques. |
Model validation (audited)
The performance and accuracy of credit models is critical, both in terms of effective risk management and also the calculation of risk parameters (PD, LGD and EAD) used by the Group to calculate RWAs. The models are subject to frequent validation internally and, if used as part of the AIRB Basel II framework (see page 61), have been reviewed and approved for use by the FSA.
Independent model validation is performed by the Group. This includes an evaluation of the model development and validation for the data set used, logic and assumptions, and performance of the model analysis. Where required, the Group has engaged external risk management consultants to undertake independent reviews and report their findings to the Wholesale or Retail Credit Model Committee. This provides a benchmark against industry practices.
The validation results are a key factor in deciding whether a model is recommended for ongoing use. The frequency, depth and extent of the validation are consistent with the materiality and complexity of the risk being managed. The Group’s validation processes include:
● | Developmental evidence: to ensure that the credit risk model adequately discriminates between different levels of risk and delivers accurate risk estimates.
|
● | Process verification: whether the methods used in the credit risk models are being used, monitored and updated in the way intended in the design of the model. Initial testing and validation is performed when the model is developed with the performance of models being assessed on an ongoing basis.
|
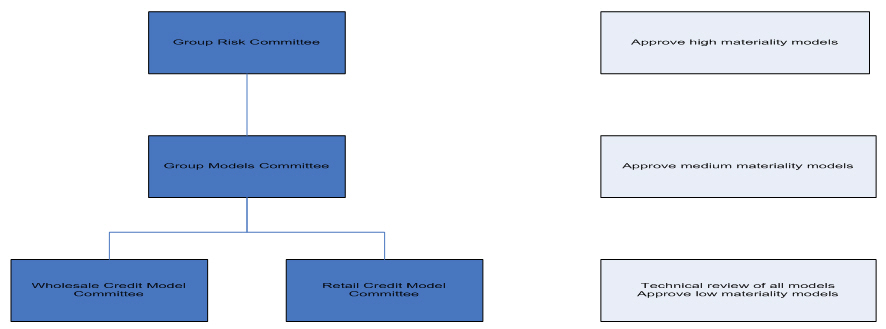
Business review continued
CreditBusiness reviewcontinued | Business review |
| Risk and balance sheet management |
Balance sheet management: Funding and liquidity risk mitigation (audited)continued
Funding and liquidity metrics
The Group takes a numbercontinues to improve and augment funding and liquidity risk management practices in light of steps to mitigate credit risk. The key risk mitigants are as follows:
● | Real estate: the most common form of security held is real estate within the consumer and wholesale businesses.
|
● | Financial collateral: is taken to support credit exposures in the non-trading book. Financial collateral is also taken in Global Markets and Regional Markets to support trading book exposures and is incorporated in E* (adjustment to the exposure value) calculations.
|
● | Other physical collateral: the Group takes a wide range of other physical collateral including business assets (stock and inventory, plant and machinery, equipment), project assets, intangible assets which provide a future cashflow and real value, commodities, vehicles, rail stock, aircraft, ships and receivables (not purchased).
|
● | Guarantees: third party guarantees are taken from banks, government entities, export credit agencies, and corporate entities. The Group’s recovery value estimation methodology is sensitive to the variations in the credit quality of guarantors. Standby letters of credit are also given value in LGD models. Conditional guarantees are accepted, in accordance with internal requirements, and are included as appropriate in PD and LGD estimates (e.g. small firms loan guarantee schemes, completion guarantees). Personal guarantees are considered in the normal credit process where there is a charge over specific assets. While personal guarantees may be called for and are always accepted, no value is given to unsupported personal guarantees in any credit models.
|
● | Credit derivatives: credit derivative activity is conducted through designated units within GBM to ensure consistency and appropriate control. Group policies are designed to ensure that the credit protection is appropriate to support offset for an underlying trading book asset or improvement to the LGD of a banking book asset. Within the banking book, credit derivatives are used as risk and capital management tools. The principal counterparties are banks, investment firms and other market participants, with the majority subject to collateralisation under a credit support annex. In accordance with internal policy, stress testing is conducted on the counterparty credit risk created by the purchase of credit protection.
|
● | Minimum standards (for example loan to value, legal certainty) are ensured through the policy framework.
|
Credit risk assets (audited)
Credit risk assets consist of loansmarket experience and advances (including overdraft facilities), instalment credit, finance lease receivablesemerging regulatory and other traded instruments across all customer types.industry standards. The Group usesmonitors a seriesrange of models to measurefunding and liquidity indicators for the size ofconsolidated Group as well as its exposure to credit riskprincipal subsidiaries. These metrics encompass short and to calculate expected EAD in both its tradinglong-term liquidity requirements under stress and banking books. In so doing, the Group recognises the effects of credit risk mitigation that reduces potential loss.
| Credit risk assets (unaudited) | | 2008 £bn | | | 2007 £bn | |
| Global Markets | | | 469.8 | | | | 307.4 | |
| Regional Markets | | | | | | | | |
| – UK Retail & Commercial Banking | | | 223.5 | | | | 202.1 | |
| – US Retail & Commercial Banking | | | 82.9 | | | | 58.1 | |
| – Europe & Middle East Retail & Commercial Banking | | | 64.7 | | | | 47.1 | |
| – Asia Retail & Commercial Banking | | | 7.5 | | | | 6.8 | |
| RBS Insurance | | | 4.6 | | | | 5.1 | |
| Other | | | 2.0 | | | | — | |
| RFS Holdings minority interest | | | 176.8 | | | | 206.0 | |
| Group | | | 1,031.8 | | | | 832.6 | |
Net stable funding ratio*
The table below shows the Group’s net stable funding ratio (NSFR) estimated by applying the Basel III guidance issued in December 2010. This measure seeks to show the proportion of structural term assets which are funded by stable funding including customer deposits, long-term wholesale funding, and equity.
| | 2010 | | 2009 | | 2008 | | |
| | | ASF(1) | | | ASF(1) | | | ASF(1) | | Weighting |
| | £bn | £bn | | £bn | £bn | | £bn | £bn | | % |
| Equity | 76 | 76 | | 80 | 80 | | 64 | 64 | | 100 |
| Wholesale funding > 1 year | 154 | 154 | | 144 | 144 | | 149 | 149 | | 100 |
| Wholesale funding < 1 year | 157 | — | | 250 | — | | 343 | — | | — |
| Derivatives | 424 | — | | 422 | — | | 969 | — | | — |
| Repurchase agreements | 115 | — | | 106 | — | | 142 | — | | — |
| Deposits | | | | | | | | | | |
| - Retail and SME - more stable | 172 | 155 | | 166 | 149 | | 184 | 166 | | 90 |
| - Retail and SME - less stable | 51 | 41 | | 50 | 40 | | 55 | 44 | | 80 |
| - Other | 206 | 103 | | 199 | 99 | | 221 | 110 | | 50 |
Other (2) | 98 | — | | 105 | — | | 92 | — | | — |
| Total liabilities and equity | 1,453 | 529 | | 1,522 | 512 | | 2,219 | 533 | | |
| | | | | | | | | | | |
| Cash | 57 | — | | 52 | — | | 12 | — | | — |
Inter-bank lending | 58 | — | | 49 | — | | 71 | — | | — |
| Debt securities: | | | | | | | | | | |
| - < 1year | 43 | — | | 69 | — | | 69 | — | | — |
- central and local governments AAA to AA- > 1 year | 89 | 4 | | 84 | 4 | | 68 | 3 | | 5 |
| - other eligible bonds > 1 year | 75 | 15 | | 87 | 17 | | 101 | 20 | | 20 |
| - other bonds > 1 year | 10 | 10 | | 9 | 9 | | 15 | 15 | | 100 |
| Derivatives | 427 | — | | 438 | — | | 991 | — | | — |
| Reverse repurchase agreements | 95 | — | | 76 | — | | 98 | — | | — |
| Customer loans and advances | | | | | | | | | | |
| - < 1 year | 125 | 63 | | 153 | 77 | | 190 | 95 | | 50 |
| - residential mortgages > 1 year | 145 | 94 | | 137 | 89 | | 170 | 111 | | 65 |
| - retail loans < 1year | 22 | 19 | | 24 | 20 | | 30 | 25 | | 85 |
| - other > 1year | 211 | 211 | | 241 | 241 | | 298 | 298 | | 100 |
Other (3) | 96 | 96 | | 103 | 103 | | 106 | 107 | | 100 |
| Total assets | 1,453 | 512 | | 1,522 | 560 | | 2,219 | 674 | | |
| | | | | | | | | | | |
| Undrawn commitments | 267 | 13 | | 289 | 14 | | 347 | 17 | | 5 |
| Total assets and undrawn commitments | 1,720 | 525 | | 1,811 | 574 | | 2,566 | 691 | | |
| | | | | | | | | | | |
| Net stable funding ratio | | 101% | | | 89% | | | 77% | | |
| (1) | Excluding reverse repurchase agreementsAvailable stable funding. |
| (2) | Deferred tax, insurance liabilities and issuer risk.other liabilities. |
| (3) | Prepayments, accrued income, deferred tax and other assets. |
| (4) | Prior periods have been revised to reflect the Basel III guidance. |
Key points*
| The Group’s estimated NSFR improved to 101% at 31 December 2010 from 89% at 31 December 2009, primarily due to a decrease in wholesale funding with maturity of less than one year and a reduction in customer loans. |
| The Group’s NSFR calculation will continue to be refined over time in line with regulatory developments. |
* unaudited
Business reviewcontinued | Business review |
| Risk and balance sheet management |
Credit risk assets as at 31 December 2008 were £1,031.8 billion (2007 – £832.6 billion), an increase of £199.2 billion during the year.
Balance sheet management: Funding and liquidity risk continued
Funding and liquidity metrics continued
The discussion and disclosures on pages 65 to 72 relate only to the Group before RFS Holdings minority interest.
Facilities included within RFS Holdings minority interests have not been migrated to RBS risk systems, as they will not be part of the Group following separation of the ABN AMRO business.
Business review continuedCredit concentration risk (including country risk) (audited)
The Group defines three key areas of concentration in credit risk that are monitored, reported and managed at Group and divisional levels. These are single name concentration, industry/sector and country risk. The Group has a series of quantitative and qualitative controls in place to limit the amount of concentration risk in credit portfolios.
A threshold is set on the aggregate LGD to a single customer group above which approval is required from the Group’s most senior credit committee, the Advances Committee.
During the year work progressed on an enhancement of the frameworks for managing single name and sector concentrations. These enhancements are planned to be fully implemented in 2009 to improve the identification and management of concentrations in the portfolio through the introduction of additional parameters and increased scrutiny of concentration limit excesses.
A stress testing framework, Correlated Exposure Loss Testing, assesses the impact on the Group’s impairment charge of non-systemic events that affect groups of inter-related sectors in order to limit the impact of these scenarios to within defined tolerances.
Country risk arises from sovereign events (e.g. default or restructuring); economic events (e.g. contagion of sovereign default to other parts of the economy, cyclical economic shock); political events (e.g. convertibility restrictions and expropriation or nationalisation) and natural disaster or conflict. Losses are broadly defined and include credit, market, liquidity, operational and franchise risk related losses. The acquisition of ABN AMRO materially increased the Group's country risk profile, therefore significant enhancements to the Group’s country risk framework have been implemented and continue to be developed.
It is the Group’s policy to monitor and control country risk exposures and to avoid excessive concentrations. The Group’s appetite is expressed by a matrix of limits by country risk grade and is approved by GEMC. The Group’s exposure is managed and measured within this appetite by the Group Country Risk Management Committee (GCRMC), that has delegated authority from the GRC to manage country risk and agree related policy. Membership of GCRMC comprises the Group Chief Credit Officer, Heads of Credit and business representatives from those divisions with material country risk exposures. GCRMC sets limits for each country based on a risk assessment taking into account the Group’s franchise and business mix in that country. Additional limitations – on product types with higher loss potential and longer tenor transactions, for example – may be established depending on the country outlook and business strategy. A country watch list framework is in place to proactively monitor emerging issues and facilitates the development of mitigation strategies.
The country risk table below shows credit risk assets exceeding £1 billion by borrower domicilethe Group’s loan to deposit ratio and is stated gross of mitigating action which may have been taken to reduce or eliminate exposure to country risk events.customer funding gap.
| Risk countries (unaudited) | | Consumer £m | | | Sovereign £m | | | Banks and financial institutions £m | | | Corporate £m | | | Total £m | |
| Russia | | | 51.0 | | | | — | | | | 362.0 | | | | 5,361.0 | | | | 5,774.0 | |
| United Arab Emirates | | | 756.8 | | | | 91.5 | | | | 1,721.9 | | | | 2,988.6 | | | | 5,558.8 | |
| India | | | 1,020.0 | | | | 5.7 | | | | 737.9 | | | | 3,800.6 | | | | 5,564.2 | |
| Turkey | | | 24.8 | | | | 363.6 | | | | 603.2 | | | | 3,035.5 | | | | 4,027.1 | |
| China | | | 24.6 | | | | 61.1 | | | | 1,146.3 | | | | 2,027.2 | | | | 3,259.2 | |
| South Korea | | | 1.5 | | | | — | | | | 1,743.0 | | | | 1,104.1 | | | | 2,848.6 | |
| Taiwan | | | 1,019.3 | | | | — | | | | 1,393.2 | | | | 825.0 | | | | 3,237.5 | |
| Mexico | | | 4.2 | | | | 57.1 | | | | 210.9 | | | | 1,999.9 | | | | 2,272.1 | |
| Czech Republic | | | 2.1 | | | | 593.5 | | | | 175.5 | | | | 1,057.9 | | | | 1,829.0 | |
| Kazakhstan | | | 69.5 | | | | 17.0 | | | | 900.8 | | | | 858.9 | | | | 1,846.2 | |
| Poland | | | 6.8 | | | | 38.5 | | | | 309.1 | | | | 1,308.6 | | | | 1,663.0 | |
| Chile | | | 0.3 | | | | 26.1 | | | | 383.7 | | | | 1,250.5 | | | | 1,660.6 | |
| Brazil | | | 3.6 | | | | — | | | | 1,012.3 | | | | 641.7 | | | | 1,657.6 | |
| Saudi Arabia | | | 23.2 | | | | — | | | | 534.9 | | | | 679.4 | | | | 1,237.5 | |
| Romania | | | 583.6 | | | | 145.3 | | | | 160.4 | | | | 916.8 | | | | 1,806.1 | |
| Greece | | | 15.1 | | | | 135.3 | | | | 210.3 | | | | 702.7 | | | | 1,063.4 | |
| Hungary | | | 5.1 | | | | 73.9 | | | | 101.3 | | | | 831.4 | | | | 1,011.7 | |
| | | | Customer funding gap (1) Group £bn |
| | Loan to deposit ratio (1) | |
| | Group % | Core % | |
| 2010 | 117 | 96 | | 74 |
| 2009 | 135 | 104 | | 142 |
| 2008 | 151 | 118 | | 233 |
(1) | Risk countries are defined as those with an internal rating of A+ and below. In addition, United Arab Emirates is included which has a rating of AA. |
(unaudited)
The outlook for developing markets in 2009 is very challenging, as developed economy demand is weak, liquidity conditions are tight and risk appetite is yet to return. Asian growth is slowing sharply as trade contracts, but generally, both sovereign and private sector leverage is lower than during the 1998 crisis, providing scope for recovery. The Middle East is more insulated from the effects of economic disruption but certain high growth countries, such as UAE, will face challenges. Eastern Europe faces a deep correction as large economic imbalances unwind. Falling commodity prices and US weakness will also affect Latin America, but the region is more resilient than during previous downturns due to reform progress and policy orthodoxy in its largest economies.
Business review continuedAsset quality by industry and geography (unaudited)
Industry analysis plays an important part in assessing potential concentration risk in the loan portfolio. Particular attention is given to industry sectors where the Group believes there is a high degree of risk or potential for volatility in the future.
Credit risk assets by industry sector (Group before RFS Holdings minority interest)
Note:
(1) Graph data are shown net of provisions, reverse repurchase agreements and issuer risk for 2008 and 2007.
As at 31 December 2008, 26% of credit risk assets (2007 – 27%) related to personal and includes mortgage lending and other smaller loans that are intrinsically well-diversified. Corporate industry exposure comprised 48% of credit risk assets (2007 – 50%), which are well diversified across a range of sectors. Banks and financial services account for 21% of credit risk assets (2007 – 19%) and public sector and quasi government credit risk assets make up the remaining 5% (2007 – 4%).
Credit risk assets by geography (Group before RFS Holdings minority interest)
Note:
(1) Graph data are shown net of provisions, reverse repurchase agreements and issuer risk for 2008 and 2007.
As at 31 December 2008, 38% of credit risk assets (2007 – 46%) related to the United Kingdom. Western Europe comprised 27% of credit risk assets (2007 – 23%). North America comprised 21% of credit risk assets (2007 – 19%).
Business review continuedCredit risk asset quality (audited)
Internal reporting and oversight of risk assets is principally differentiated by credit grades. Customers are assigned credit grades, based on various credit grading models that reflect the key drivers of default for the customer type. All credit grades across the Group map to both a Group level asset quality scale, used for external financial reporting, and a master grading scale for wholesale exposures used for internal management reporting across disparate portfolios. Accordingly, measurement of risk is easily aggregated and can be reported at increasing levels of granularity depending on audience and business need.
The Group has adopted, as part of the move to Basel II, a new master grading scale for wholesale exposures which comprises 27 grades. These in turn map to ten asset quality (AQ) bands used for both wholesale and retail exposures. This replaced the less granular AQ1-5 bands used prior to 2008.
The relationship between these measures is shown below. (unaudited)
| | | PD Range | | | | |
| Master grading scale | | Lower | | Upper | | New AQ1- 10 bands | | Old AQ1-5 bands |
| 1 | | 0% | | 0.006% | | | | |
| 2 | | 0.006% | | 0.012% | | | | |
| 3 | | 0.012% | | 0.017% | | AQ1 | | |
| 4 | | 0.017% | | 0.024% | | | | |
| 5 | | 0.024% | | 0.034% | | | | AQ1 |
| 6 | | 0.034% | | 0.048% | | AQ2 | | |
| 7 | | 0.048% | | 0.067% | | AQ3 | | |
| 8 | | 0.067% | | 0.095% | | | | |
| 9 | | 0.095% | | 0.135% | | | | |
| 10 | | 0.135% | | 0.190% | | | | |
| 11 | | 0.190% | | 0.269% | | AQ4 | | |
| 12 | | 0.269% | | 0.381% | | | | AQ2 |
| 13 | | 0.381% | | 0.538% | | | | |
| 14 | | 0.538% | | 0.761% | | AQ5 | | |
| 15 | | 0.761% | | 1.076% | | | | AQ3 |
| 16 | | 1.076% | | 1.522% | | AQ6 | | |
| 17 | | 1.522% | | 2.153% | | | | AQ4 |
| 18 | | 2.153% | | 3.044% | | | | |
| 19 | | 3.044% | | 4.305% | | AQ7 | | |
| 20 | | 4.305% | | 6.089% | | | | |
| 21 | | 6.089% | | 8.611% | | | | |
| 22 | | 8.611% | | 12.177% | | AQ8 | | |
| 23 | | 12.177% | | 17.222% | | | | AQ5 |
| 24 | | 17.222% | | 24.355% | | | | |
| 25 | | 24.355% | | 34.443% | | AQ9 | | |
| 26 | | 34.443% | | 100% | | | | |
| 27 | | 100% | | 100% | | AQ10 | | |
Credit risk assets by new AQ1-10 bands (Group before RFS Holdings minority interest) (unaudited)
TCRE (%)
| (1) | Graph dataExcludes repurchase agreements, bancassurance deposits to 31 March 2010 and loans are shown net of provisions, reverse repurchase agreements and issuer risk for 2008.provisions. For Group before RFS MI only. |
The following table shows the movement between 2007 and 2008 based on the old AQ1-5 bands for the Group before RFS minority interest. (unaudited)
Note:
(1) Graph data are shown net of provisions, reverse repurchase agreements and issuer risk for 2008 and 2007.
(unaudited)
As at 31 December 2008, including ABN AMRO net of minority interest, exposure to investment grade counterparties (AQ1) accounted for 47% (2007 – 37%) of credit risk assets and 46% (2007 – 59%) of exposures were to counterparties between AQ2 and AQ4. The exposure to the lowest asset quality (AQ5) is 7% (2007 – 4%).
Business review continuedExpressed as an annual PD, the upper and lower boundaries and the midpoint for each of these Group level asset quality grades are as follows:
| | | Annual probability of default | | | |
| Asset quality grade | | Minimum % | | | Midpoint % | | | Maximum % | | | S&P equivalent |
| AQ1 | | | 0.00 | | | | 0.10 | | | | 0.20 | | | AAA to BBB- |
| AQ2 | | | 0.21 | | | | 0.40 | | | | 0.60 | | | BB+ to BB |
| AQ3 | | | 0.61 | | | | 1.05 | | | | 1.50 | | | BB- to B+ |
| AQ4 | | | 1.51 | | | | 3.25 | | | | 5.00 | | | B+ to B |
| AQ5 | | | 5.01 | | | | 52.50 | | | | 100.00 | | | B and below |
Key credit portfolios (unaudited)
The following discussion relates only to the Group before RFS Holdings minority interest. All exposures are monitored closely, but in the current environment the following are under specific scrutiny:
Property lending (unaudited)
Commercial property
The commercial property portfolio totals £97 billion. The bulk of this is concentrated in GBM (£31 billion) and RBS UK (£42 billion) with the remainder in Ulster Bank (£17 billion) and CFG (£6 billion).
Lending falls into different categories and is spread across Investment (72.6%), Development (24.1%) and Other (3.3%). Speculative lending represents 1.6% of this portfolio. 58% of the lending is in the UK, 30% Western Europe, 8% North America and 4% RoW but with the extent of the current global downturn all markets are coming under considerable pressure.
Whilst the Group expects to see an overall deterioration in LTV ratios, 72% of the portfolio within GBM and UKCB continue to have an LTV less than 75% and an average interest coverage ratio (ICR) for GBM of 164% and 151 % for RBS UK. The Group’s lending approach has always been predominantly cash flow driven and areas of stress in the portfolio will primarily be impacted by the wider corporate and economic environment affecting tenant quality with the retail sector being an area of focus at the present time.
The Group has experienced a number of defaults in its Spanish portfolio with current limits of £2 billion managed via the Global Restructuring Group. Total impaired limits across the portfolio are £3.9 billion. Limits currently subject to a higher level of monitoring (watch) total £18.9 billion and are actively risk managed.
The outlook for commercial property will remain challenging during 2009 with further falls in capital values expected due to a lack of liquidity and weak demand for assets. There is emerging evidence of falling rents and increasing vacancy rates although downward pressure on rents and longer void periods can be expected due to the weakening economic climate. The Group’s strategy throughout 2008 has been to reduce its exposures wherever prudent, continuing the process of tightening lending parameters begun in the second half of 2007.
Residential mortgages
The Group originates residential mortgages through retail channels in all four divisions within Regional Markets however activity is primarily in the UK, the US and Ireland.
Business review continuedUK residential mortgages
The UK mortgage portfolio totalled £74.4 billion (as at 31 December 2008) an increase of 11% during the year due to strong sales growth and lower redemption rates. The main brands are the Royal Bank, NatWest, the One Account, First Active and Direct Line. The assets comprise prime mortgage lending and include 7.0% (£5.2 billion) of exposure to residential buy-to-let. There is a very small legacy self-certification book (0.5% of total assets) which was withdrawn from sale in 2004.
The Group exited the 100% LTV market in the first quarter of 2008, further restricted the proportion of highest LTV loans and reviewed affordability criteria during the year. The average LTV for new business increased from 62% to 67% in 2008 mainly due to a reduction in the proportion of business within the lowest LTV bands.The arrears rate (three or more payments missed) on the combined Royal Bank and NatWest brands was 1.5% (31 December 2008) up from 1.0% (31 December 2007). The mortgage impairment charge was £33 million for 2008 (2007 – £19 million) and in current economic conditions is expected to increase further. Anticipated losses from impaired mortgages are covered by a combination of impairment provisions and post default suspended interest. The combined provision cover is currently 0.18% of balances.
Repossessions totalled 1,141 in 2008 (compared with 758 in 2007) with similar volumes in each half of the year.
US real estate
Citizens Financial Group’s (CFG) residential real estate portfolio totalled $50.1 billion at 31 December 2008 (2007 – $53.1 billion) comprising $13.8 billion of first mortgages and $36.3 billion of Home Equity loans and lines. This reduction includes the sale of $1.4 billion of real estate assets to the Federal National Mortgage Association in December 2008.
CFG has historically adopted conservative risk policies in comparison to the general market. Small exposures to sub-prime (FICO <=620, approximately 0.6%) and Alt-A / other non-conforming (4.5%) from past bank acquisitions are in run-off. The average indexed LTV was 69% as at 31 December 2008 (2007 – 62%). Loan acceptance criteria were further tightened during 2008 to address deteriorating economic conditions.
The Serviced By Others (SBO) portfolio consists of purchased pools of home equity loans and lines whose LTV and geographic profiles have in the current economic conditions resulted in a higher write-off rate of 4.8% in 2008 than core portfolios. SBO was closed to new purchases in the third quarter of 2007 and is in run-off with exposure down from $8.3 billion (31 December 2007) to $7.0 billion (31 December 2008).
Ireland residential mortgages
The residential mortgage portfolio in Ireland across the Ulster Bank and First Active brands totalled £24.6 billion (as at 31 December 2008) with 92.8% in the Republic of Ireland and 7.2% in Northern Ireland. This represents growth of 6% in the Republic of Ireland (ignoring exchange rate movements) and 6% in Northern Ireland. During the course of 2008, Ulster Bank exited the 100% LTV market and tightened LTV and affordability criteria in other segments. The arrears rate (three or more payments missed) increased to 1.6% at 31 December 2008 from 0.8% at end 2007 driven by deteriorating economic conditions. Repossession remained low and totalled 37 for 2008.
Financial institutions
The confidence and liquidity crisis affecting the banking sector saw the near collapse of some major banks in Western countries along with the fall of Lehman Brothers and the Icelandic banking system, which in turn threatened the stability of national and global banking systems. Government actions to restore stability by providing guarantees, liquidity facilities, capital injections and facilitating the consolidation of weaker banks with stronger ones met with some success. There remains a high level of risk in the banking sector in 2009, particularly due to the deepening recession that many countries face and increasing corporate defaults.
Financial Institutions constitute the largest segment of the Group’s wholesale credit portfolio with exposure of £181 billion. Due to difficulties faced by the sector, the portfolio quality has weakened during 2008. 92% of exposure is to counterparties in developed OECD countries while 90% of exposure is to investment grade counterparties.
The Banks portfolio is the biggest sub-sector with exposure of £86 billion. At the time of default, the Group’s exposures to Lehman Brothers and the Icelandic banks totalled £802 million and £494 million respectively and represented less than 1% of the total Banks portfolio.
2008 was a difficult year for the hedge funds sector. More hedge funds collapsed during 2008 than in the previous ten years and the values of many declined significantly. The spate of redemptions from investors forced major hedge fund groups to halt withdrawals. The trends are set to continue in 2009 and the contraction of this sector is expected.
The Group’s exposure to leveraged funds (including hedge funds) totalled £10.3 billion. The majority of hedge funds are domiciled in the UK and US but the portfolio is diversified by fund strategy. The Group’s activities with hedge funds are primarily collateralised derivatives trading. Exposures to funds encountering problems were reduced, collateral margining was reviewed upwards to further mitigate risk and the appropriateness of limits is regularly reviewed.
During 2009, the Group will continue to place emphasis on the pro-active management of financial institutions at counterparty and portfolio levels, recognising that liquidity is likely to remain tight and credit quality is likely to deteriorate further across a range of portfolios.
Business review continuedCorporate sectors (unaudited)
This section discusses the automotive, shipping, oil and gas sectors, given their significance in the current market environment.
Automotive
The automotive sector exposure totals £14.5 billion, the majority falling within GBM (£9.1 billion), RBS UK (£3.3 billion) and CFG (£1.3 billion). The exposure is spread across the following segments and geographies:
| | | Credit book | | | | |
| Segment | | £bn | | | % | |
| Original equipment manufacturer/commercial vehicles | | | 3.3 | | | | 23 | |
| Captive finance companies | | | 1.1 | | | | 8 | |
| Component suppliers | | | 2.4 | | | | 16 | |
| Retailers/services | | | 5.1 | | | | 35 | |
| Rental | | | 2.6 | | | | 18 | |
| Total | | | 14.5 | | | | 100 | |
| | | Credit book | | | | |
| Domicile | | £bn | | | % | |
| Americas | | | 4.0 | | | | 28 | |
| Central Eastern Europe Middle East and Africa | | | 1.1 | | | | 7 | |
| UK | | | 4.2 | | | | 29 | |
| Western Europe | | | 4.3 | | | | 30 | |
| Asia | | | 0.9 | | | | 6 | |
| Total | | | 14.5 | | | | 100 | |
The automotive sector faces numerous challenges with a heavy reliance on discretionary consumer spending, high leverage, volatile input prices and an ongoing pressure to reduce fuel emissions resulting in a shift to smaller cars and overseas production. The Group has maintained a cautious approach to this sector and focus on the largest, most diversified and financially strong counterparties with a wide product offering. Notwithstanding this approach, due to the scale of the downturn in this sector the Group can expect further pressure to be seen across the portfolio. Of particular concern are exposures to the captive finance companies where credit impaired limits total £1.4 billion. The Group continues to seek ongoing limit reductions and improved security.
Shipping
The shipping exposure is £16.6 billion and is almost entirely within GBM. The portfolio is divided across the following sectors:
| | | Credit book | | | | |
| Sector | | £bn | | | % | |
| Dry bulk | | | 4.8 | | | | 29 | |
| Tankers | | | 6.3 | | | | 38 | |
| Container | | | 1.6 | | | | 10 | |
| Gas/offshore | | | 2.3 | | | | 14 | |
| Other | | | 1.6 | | | | 9 | |
| Total | | | 16.6 | | | | 100 | |
The majority of the exposures are strong relationships with loans structured to capture direct vessel cash flows, secured on the vessels themselves with the benefit of full security over the asset and all related cash flows. The Group’s approach to the sector recognises the cyclical nature of shipping with a focus on experienced independent owners with strong liquidity; customer deposits across the portfolio total £5 billion. Assets financed are non-specialist dry bulk, double hulled tankers and containers.
Following an unprecedented rise in ship values over recent years there has been a material correction since mid 2008 with the dry bulk index falling by c.90% which may affect owners’ ability to meet collateral calls. Combined with record ship deliveries for 2009-10 the Group has seen a significant decline in asset values. The Group’s exposure to new build assets is significant with commitments relating to 236 vessels in the dry bulk and tanker segment.
The Group currently has £0.5 billion of limits to clients on watch list, but the portfolio comprises modern assets (86% of exposures are secured on vessels built since 2000), which exhibit, for the most part, good cash flow and liquidity.
Oil and gas
The Group’s exposure to this sector totals £24.0 billion across the following sectors and geographies:
| | | Credit book | | | | |
| Sector | | £bn | | | % | |
| Vertically integrate/exploration and production | | | 9.5 | | | | 40 | |
| Midstream | | | 5.0 | | | | 21 | |
| Refining and marketing | | | 4.6 | | | | 19 | |
| Oilfield services | | | 4.9 | | | | 20 | |
| Total | | | 24.0 | | | | 100 | |
| | | Credit book | | | | |
| Domicile | | £bn | | | % | |
| Americas | | | 10.6 | | | | 44 | |
| Western Europe | | | 7.6 | | | | 32 | |
| CEEMEA | | | 4.6 | | | | 19 | |
| Asia Pacific | | | 1.2 | | | | 5 | |
| Total | | | 24.0 | | | | 100 | |
Business review continuedABN AMRO and RBS have a number of common clients in this sector, and the Group is working to reduce exposures back within Group concentration limits, primarily in relation to investment grade, vertically integrated counterparties and several of the larger, global exploration and production companies. The Group’s exposures to exploration and production companies are principally secured borrowing base facilities referenced to conservative forward looking oil price assumptions that are adjusted on a regular basis. Unsecured exposures are primarily to oil majors and state owned entities.
Business review continuedGlobal Restructuring Group (GRG) (audited)
GRG was formed in 2008, tasked with managing the Group’s problem and potential problem exposures to help rejuvenate and restore customers to profitable business. This may include assisting with the restructuring of their businesses and/or renegotiation.
GRG brings together previously disparate functions across the Group. Its primary function is to work closely with the Group’s customer facing businesses to support the proactive management of any problem lending. This is based on a clear process (watch listing) which requires the transfer of problem credits to GRG. GRG reports to the Group Chief Risk Officer.
Given the current economic outlook, it is particularly important that potential problems are identified early and referred to GRG as the Group’s past experience has shown that the sooner specialists in restructuring are engaged, the greater the likelihood of a successful outcome. Early identification of potential problems therefore has a benefit to the borrower as well as to the Group.
GRG is structured with specialist teams focused on: large corporate cases (higher value, multiple lenders); small/mid size business cases (lower value, bilateral relationships); and recovery/litigations. Given the negative trends in the portfolio in 2008, the size of GRG has grown substantially and further investment in staffing is expected in 2009.
Originating business units liaise with GRG upon the emergence of a potentially negative event or trend that may impact a borrowers’ ability to service its debt. This may be a significant deterioration in some aspect of the borrowers’ activity, such as trading, where a breach of covenant is likely or where a borrower has missed or is expected to miss a material contractual payment to the Group or another creditor.
On transfer of a relationship to GRG a strategy is devised to:
points
● | Work withThe Group’s loan to deposit ratio improved significantly by 1800 basis points to 117% at 31 December 2010 and the borrowerfunding gap narrowed by £68 billion over the year to facilitate changes that will maximise the potential for turnaround of their situation£74 billion at 31 December 2010, due primarily to a reduction in Non-Core customer loans and return them to profitability.increased customer deposits. |
● | Define the Group’s role in the turnaround situation and assess the risk/return dimension of the Group’s participation. |
● | Return customers to the originating business unit in a sound and stable condition or, if such recovery cannot be achieved, avoid additional losses and maximise recoveries. |
● | Ensure key lessons learned are fed back into origination policies and procedures. |
At the start of 2008, the volume and value of cases managed by GRG was low relative to historic levels. During the year, the rate of transfer of cases to GRG accelerated sharply. Cases originated from all divisions and across most sectors although the rate of value growth was sharply higher due to the transfer of a number of high value cases from GBM. Commercial property cases made up a significant proportion of transfers from all divisions.
Retail collections and recoveries (audited)
There are collections and recoveries functions in each of the four regional markets. Their role is to provide support and assistance to customers who are currently experiencing difficulties meeting their financial obligations.
Where possible, the aim of collections and recoveries teams is to return the customer to a satisfactory position, by working with them to restructure their finances and/or business. If this is not possible, the team has the objective of reducing the loss to the Group.
There have been material increases in staffing levels in all collections functions to manage the increase in the number of customers in financial difficulty. In the UK and Ireland, there is a common collection and recovery operational model managed by Group Manufacturing. During 2008, there was significant investment in systems development and staff training to make collections activity more efficient and effective.
In the UK there have been several initiatives to ensure fair and appropriate treatment of customers experiencing difficulties. For mortgage customers the Group will not initiate repossession proceedings for at least six months after arrears are evident.
Preventative measures have also been a key focus throughout 2008, and as a result, the Group has announced the introduction of over 1,000 dedicated Money Sense advisers in its branch network who will provide free financial counselling to both customers and non-customers. The Group has also implemented a programme to proactively contact customers who exhibit early signs of financial stress but are not yet in Collections to offer them assistance in managing their finances more effectively.
Business review continuedBalance sheet analysis (audited)
The following table provides an analysis of the credit quality of financial assets by the Group’s internal credit quality steps.
| 2008 | | AQ1 £m | | | AQ2 £m | | | AQ3 £m | | | AQ4 £m | | | AQ5 £m | | | Accruing past due £m | | | Non- accrual £m | | | Impairment provision £m | | | Total £m | |
| Cash and balance at central banks | | | 12,400 | | | | — | | | | — | | | | — | | | | — | | | | — | | | | — | | | | — | | | | 12,400 | |
| Loans and advances to banks (2) | | | 131,963 | | | | 872 | | | | 1,247 | | | | 282 | | | | 943 | | | | — | | | | 129 | | | | (127 | ) | | | 135,309 | |
| Loans and advances to customers | | | 310,950 | | | | 141,849 | | | | 187,899 | | | | 150,705 | | | | 59,191 | | | | 15,667 | | | | 19,350 | | | | (10,889 | ) | | | 874,722 | |
| Debt securities | | | 259,207 | | | | 1,461 | | | | 1,485 | | | | 3,755 | | | | 1,626 | | | | — | | | | 52 | | | | (37 | ) | | | 267,549 | |
| Settlement balances | | | 12,612 | | | | 516 | | | | 290 | | | | 129 | | | | 256 | | | | 4,029 | | | | — | | | | — | | | | 17,832 | |
| Derivatives | | | 912,728 | | | | 36,528 | | | | 30,079 | | | | 5,181 | | | | 8,032 | | | | 11 | | | | — | | | | — | | | | 992,559 | |
| Other financial instruments | | | 691 | | | | — | | | | 161 | | | | — | | | | — | | | | — | | | | — | | | | — | | | | 852 | |
| | | | 1,640,551 | | | | 181,226 | | | | 221,161 | | | | 160,052 | | | | 70,048 | | | | 19,707 | | | | 19,531 | | | | (11,053 | ) | | | 2,301,223 | |
| | | | | | | | | | | | | | | | | | | | | | | | | | | | | | | | | | | | | |
| Commitments | | | 209,359 | | | | 55,109 | | | | 48,554 | | | | 23,458 | | | | 25,244 | | | | — | | | | — | | | | — | | | | 361,724 | |
| Contingent liabilities | | | 19,693 | | | | 18,461 | | | | 19,502 | | | | 10,977 | | | | 2,904 | | | | — | | | | — | | | | — | | | | 71,537 | |
| Total off-balance sheet | | | 229,052 | | | | 73,570 | | | | 68,056 | | | | 34,435 | | | | 28,148 | | | | — | | | | — | | | | — | | | | 433,261 | |
| | | | | | | | | | | | | | | | | | | | | | | | | | | | | | | | | | | | | |
| 2007 | | | | | | | | | | | | | | | | | | | | | | | | | | | | | | | | | | | | |
| Cash and balance at central banks | | | 17,866 | | | | — | | | | — | | | | — | | | | — | | | | — | | | | — | | | | — | | | | 17,866 | |
| Loans and advances to banks (2) | | | 204,083 | | | | 5,797 | | | | 4,937 | | | | 407 | | | | 1,119 | | | | — | | | | 25 | | | | (3 | ) | | | 216,365 | |
| Loans and advances to customers | | | 275,715 | | | | 174,074 | | | | 221,561 | | | | 84,791 | | | | 55,273 | | | | 13,236 | | | | 10,337 | | | | (6,449 | ) | | | 828,538 | |
| Debt securities | | | 258,895 | | | | 15,688 | | | | 2,339 | | | | 1,372 | | | | 16,361 | | | | — | | | | 5 | | | | (4 | ) | | | 294,656 | |
| Settlement balances | | | 14,491 | | | | 98 | | | | 344 | | | | 21 | | | | 68 | | | | 1,567 | | | | — | | | | — | | | | 16,589 | |
| Derivatives | | | 240,114 | | | | 23,333 | | | | 11,299 | | | | 2,352 | | | | 304 | | | | — | | | | — | | | | — | | | | 277,402 | |
| Other financial instruments | | | 669 | | | | — | | | | — | | | | — | | | | 143 | | | | 65 | | | | — | | | | — | | | | 877 | |
| | | | 1,011,833 | | | | 218,990 | | | | 240,480 | | | | 88,943 | | | | 73,268 | | | | 14,868 | | | | 10,367 | | | | (6,456 | ) | | | 1,652,293 | |
| | | | | | | | | | | | | | | | | | | | | | | | | | | | | | | | | | | | | |
| Commitments | | | 131,750 | | | | 89,682 | | | | 74,126 | | | | 25,320 | | | | 17,301 | | | | — | | | | — | | | | — | | | | 338,179 | |
| Contingent liabilities | | | 26,120 | | | | 16,314 | | | | 11,740 | | | | 4,032 | | | | 3,714 | | | | — | | | | — | | | | — | | | | 61,920 | |
| Total off-balance sheet | | | 157,870 | | | | 105,996 | | | | 85,866 | | | | 29,352 | | | | 21,015 | | | | — | | | | — | | | | — | | | | 400,099 | |
(1) | Credit risk assets as reported internally to senior management exclude certain exposures and take account of netting agreements including master netting arrangements that provide a right of legal set off but do not meet the criteria for offset in IFRS. The analysis of credit risk assets on page 68 uses the same risk bands as above and is a sub-set of the full analysis given above. |
(2) | Excluding items in the course of collection of £2,888 million (2007 – £3,095 million). |
The following loans and advances to customers were past due at the balance sheet date but not considered impaired:
| | | Past due 1-29 days £m | | | Past due 30-59 days £m | | | Past due 60-89 days £m | | | Past due 90 days or more £m | | | Total £m | |
| 2008 | | | 9,517 | | | | 2,941 | | | | 1,427 | | | | 1,782 | | | | 15,667 | |
| 2007 | | | 8,768 | | | | 2,745 | | | | 1,354 | | | | 369 | | | | 13,236 | |
These balances include loans and advances to customers that are past due through administrative and other delays in recording payments or in finalising documentation and other events unrelated to credit quality.
Business review continuedIndustry risk – geographical analysis (audited)
The following table analyses financial assets by location of office and by industry type.
| | | Group | |
| 2008 | | Loans and advances to banks and customers £m | | | Debt securities and equity shares £m | | | Derivatives £m | | | Other (1) £m | | | Total £m | | | Netting and offset (2) £m | |
| UK | | | | | | | | | | | | | | | | | | |
| Central and local government | | | 6,106 | | | | 36,466 | | | | 5,798 | | | | 14 | | | | 48,384 | | | | 1,987 | |
| Manufacturing | | | 26,006 | | | | 1,080 | | | | 11,208 | | | | 180 | | | | 38,474 | | | | 6,279 | |
| Construction | | | 13,426 | | | | 144 | | | | 754 | | | | 26 | | | | 14,350 | | | | 1,485 | |
| Finance | | | 197,659 | | | | 84,696 | | | | 532,857 | | | | 6,257 | | | | 821,469 | | | | 480,762 | |
| Service industries and business activities | | | 88,420 | | | | 10,154 | | | | 13,278 | | | | 1,471 | | | | 113,323 | | | | 7,624 | |
| Agriculture, forestry and fishing | | | 3,118 | | | | 93 | | | | 34 | | | | 15 | | | | 3,260 | | | | 87 | |
| Property | | | 74,050 | | | | 2,008 | | | | 5,094 | | | | 71 | | | | 81,223 | | | | 1,026 | |
| Individuals: | | | | | | | | | | | | | | | | | | | | | | | | |
| Home mortgages | | | 80,967 | | | | — | | | | 14 | | | | — | | | | 80,981 | | | | 52 | |
| Other | | | 27,479 | | | | 250 | | | | 36 | | | | 25 | | | | 27,790 | | | | 5 | |
| Finance leases and instalment credit | | | 17,363 | | | | 3 | | | | 25 | | | | — | | | | 17,391 | | | | 119 | |
| Interest accruals | | | 4,323 | | | | 774 | | | | — | | | | — | | | | 5,097 | | | | — | |
| Total UK | | | 538,917 | | | | 135,668 | | | | 569,098 | | | | 8,059 | | | | 1,251,742 | | | | 499,426 | |
| US | | | | | | | | | | | | | | | | | | | | | | | | |
| Central and local government | | | 482 | | | | 24,996 | | | | 45 | | | | 33 | | | | 25,556 | | | | — | |
| Manufacturing | | | 13,298 | | | | 102 | | | | 1,809 | | | | 128 | | | | 15,337 | | | | 217 | |
| Construction | | | 885 | | | | 63 | | | | 122 | | | | 6 | | | | 1,076 | | | | — | |
| Finance | | | 30,433 | | | | 37,346 | | | | 355,502 | | | | 5,754 | | | | 429,035 | | | | 323,910 | |
| Service industries and business activities | | | 28,232 | | | | 1,498 | | | | 8,535 | | | | 907 | | | | 39,172 | | | | 2,346 | |
| Agriculture, forestry and fishing | | | 30 | | | | — | | | | 3 | | | | 1 | | | | 34 | | | | — | |
| Property | | | 6,579 | | | | 5 | | | | 97 | | | | — | | | | 6,681 | | | | — | |
| Individuals: | | | | | | | | | | | | | | | | | | | | | | | | |
| Home mortgages | | | 34,235 | | | | — | | | | — | | | | — | | | | 34,235 | | | | — | |
| Other | | | 14,368 | | | | — | | | | — | | | | — | | | | 14,368 | | | | — | |
| Finance leases and instalment credit | | | 3,066 | | | | — | | | | — | | | | — | | | | 3,066 | | | | — | |
| Interest accruals | | | 499 | | | | 466 | | | | — | | | | — | | | | 965 | | | | — | |
| Total US | | | 132,107 | | | | 64,476 | | | | 366,113 | | | | 6,829 | | | | 569,525 | | | | 326,473 | |
| Europe | | | | | | | | | | | | | | | | | | | | | | | | |
| Central and local government | | | 2,045 | | | | 24,065 | | | | 228 | | | | 5 | | | | 26,343 | | | | — | |
| Manufacturing | | | 29,348 | | | | 776 | | | | 371 | | | | — | | | | 30,495 | | | | 2 | |
| Construction | | | 5,838 | | | | 1 | | | | 91 | | | | — | | | | 5,930 | | | | — | |
| Finance | | | 35,989 | | | | 34,533 | | | | 8,174 | | | | 3,621 | | | | 82,317 | | | | 61 | |
| Service industries and business activities | | | 60,179 | | | | 11,754 | | | | 2,823 | | | | 92 | | | | 74,848 | | | | 780 | |
| Agriculture, forestry and fishing | | | 5,750 | | | | 50 | | | | 1 | | | | — | | | | 5,801 | | | | — | |
| Property | | | 23,072 | | | | 19 | | | | 299 | | | | — | | | | 23,390 | | | | — | |
| Individuals: | | | | | | | | | | | | | | | | | | | | | | | | |
| Home mortgages | | | 118,549 | | | | 50 | | | | 4 | | | | — | | | | 118,603 | | | | — | |
| Other | | | 9,024 | | | | 29 | | | | 218 | | | | | | | | 9,271 | | | | — | |
| Finance leases and instalment credit | | | 1,815 | | | | 15 | | | | — | | | | — | | | | 1,830 | | | | — | |
| Interest accruals | | | 1,889 | | | | 1 | | | | — | | | | — | | | | 1,890 | | | | — | |
| Total Europe | | | 293,498 | | | | 71,293 | | | | 12,209 | | | | 3,718 | | | | 380,718 | | | | 843 | |
| Rest of the World | | | | | | | | | | | | | | | | | | | | | | | | |
| Central and local government | | | 7,079 | | | | 16,766 | | | | 311 | | | | 145 | | | | 24,301 | | | | — | |
| Manufacturing | | | 6,837 | | | | 178 | | | | 772 | | | | — | | | | 7,787 | | | | — | |
| Construction | | | 758 | | | | 6 | | | | 17 | | | | — | | | | 781 | | | | 3 | |
| Finance | | | 21,469 | | | | 4,267 | | | | 42,621 | | | | 407 | | | | 68,764 | | | | 31,695 | |
| Service industries and business activities | | | 13,706 | | | | 949 | | | | 1,297 | | | | — | | | | 15,952 | | | | 108 | |
| Agriculture, forestry and fishing | | | 157 | | | | 1 | | | | 7 | | | | — | | | | 165 | | | | — | |
| Property | | | 2,932 | | | | 480 | | | | 96 | | | | — | | | | 3,508 | | | | 41 | |
| Individuals: | | | | | | | | | | | | | | | | | | | | | | | | |
| Home mortgages | | | 847 | | | | — | | | | — | | | | — | | | | 847 | | | | — | |
| Other | | | 5,089 | | | | — | | | | 18 | | | | — | | | | 5,107 | | | | 79 | |
| Finance leases and instalment credit | | | 111 | | | | 5 | | | | — | | | | — | | | | 116 | | | | — | |
| Interest accruals | | | 428 | | | | — | | | | — | | | | — | | | | 428 | | | | — | |
| Total Rest of the World | | | 59,413 | | | | 22,652 | | | | 45,139 | | | | 552 | | | | 127,756 | | | | 31,926 | |
Business review continued| | | Group | |
| 2008 | | Loans and advances to banks and customers £m | | | Debt securities and equity shares £m | | | Derivatives £m | | | Other (1) £m | | | Total £m | | | Netting and offset (2) £m | |
| Total | | | | | | | | | | | | | | | | | | |
| Central and local government | | | 15,712 | | | | 102,293 | | | | 6,382 | | | | 197 | | | | 124,584 | | | | 1,987 | |
| Manufacturing | | | 75,489 | | | | 2,136 | | | | 14,160 | | | | 308 | | | | 92,093 | | | | 6,498 | |
| Construction | | | 20,907 | | | | 214 | | | | 984 | | | | 32 | | | | 22,137 | | | | 1,488 | |
| Finance | | | 285,550 | | | | 160,842 | | | | 939,154 | | | | 16,039 | | | | 1,401,585 | | | | 836,428 | |
| Service industries and business activities | | | 190,537 | | | | 24,355 | | | | 25,933 | | | | 2,470 | | | | 243,295 | | | | 10,858 | |
| Agriculture, forestry and fishing | | | 9,055 | | | | 144 | | | | 45 | | | | 16 | | | | 9,260 | | | | 87 | |
| Property | | | 106,633 | | | | 2,512 | | | | 5,586 | | | | 71 | | | | 114,802 | | | | 1,067 | |
| Individuals: | | | | | | | | | | | | | | | | | | | | | | | | |
| Home mortgages | | | 234,598 | | | | 50 | | | | 18 | | | | — | | | | 234,666 | | | | 52 | |
| Other | | | 55,960 | | | | 279 | | | | 272 | | | | 25 | | | | 56,536 | | | | 84 | |
| Finance leases and instalment credit | | | 22,355 | | | | 23 | | | | 25 | | | | — | | | | 22,403 | | | | 119 | |
| Interest accruals | | | 7,139 | | | | 1,241 | | | | — | | | | — | | | | 8,380 | | | | — | |
| | | | 1,023,935 | | | | 294,089 | | | | 992,559 | | | | 19,158 | | | | 2,329,741 | | | | 858,668 | |
Notes:
(1) | Includes settlement balances of £17,832 million.The loan to deposit ratio for the Group’s Core business at 31 December 2010 improved to 96% from 104% at 31 December 2009. |
(2) | This column shows the amount by whichIt is a strategic objective to improve the Group’s credit risk exposure is reduced through arrangements, such as master netting agreements, which give the Group a legal rightloan to set-off the financial asset against a financial liability duedeposit ratio to the same counterparty. In addition, the Group holds collateral in respect of individual loans and advances to banks and to customers. This collateral includes mortgages over property (both personal and commercial); charges over business assets such as plant, inventories and trade debtors; and guarantees of lending from parties other than the borrower. The Group obtains collateral in the form of securities in reverse repurchase agreements. Cash and securities are received as collateral in respect of derivative transactions.100%, or better, by 2013. |
| | | Group | |
| 2007 | | Loans and advances to banks and customers £m | | | Debt securities and equity shares £m | | | Derivatives £m | | | Other (1) £m | | | Total £m | | | Netting and offset (2) £m | |
| UK | | | | | | | | | | | | | | | | | | |
| Central and local government | | | 4,728 | | | | 30,285 | | | | 3,912 | | | | — | | | | 38,925 | | | | 1,531 | |
| Manufacturing | | | 21,083 | | | | 2,751 | | | | 4,800 | | | | — | | | | 28,634 | | | | 4,032 | |
| Construction | | | 12,363 | | | | 456 | | | | 741 | | | | — | | | | 13,560 | | | | 1,684 | |
| Finance | | | 294,682 | | | | 106,201 | | | | 239,858 | | | | 12,716 | | | | 653,457 | | | | 186,420 | |
| Service industries and business activities | | | 74,399 | | | | 16,801 | | | | 4,412 | | | | — | | | | 95,612 | | | | 6,687 | |
| Agriculture, forestry and fishing | | | 2,570 | | | | 66 | | | | 58 | | | | — | | | | 2,694 | | | | 104 | |
| Property | | | 63,715 | | | | 640 | | | | 969 | | | | 7 | | | | 65,331 | | | | 2,033 | |
| Individuals: | | | | | | | | | | | | | | | | | | | | | | | | |
| Home mortgages | | | 73,916 | | | | 1,795 | | | | 5 | | | | — | | | | 75,716 | | | | — | |
| Other | | | 28,747 | | | | 1,140 | | | | 15 | | | | 23 | | | | 29,925 | | | | 7 | |
| Finance leases and instalment credit | | | 15,632 | | | | 131 | | | | 27 | | | | — | | | | 15,790 | | | | 5 | |
| Interest accruals | | | 3,512 | | | | 1,607 | | | | — | | | | — | | | | 5,119 | | | | — | |
| Total UK | | | 595,347 | | | | 161,873 | | | | 254,797 | | | | 12,746 | | | | 1,024,763 | | | | 202,503 | |
| US | | | | | | | | | | | | | | | | | | | | | | | | |
| Central and local government | | | 386 | | | | 23,506 | | | | 10 | | | | 212 | | | | 24,114 | | | | — | |
| Manufacturing | | | 7,399 | | | | 608 | | | | 111 | | | | — | | | | 8,118 | | | | 13 | |
| Construction | | | 793 | | | | 96 | | | | — | | | | — | | | | 889 | | | | — | |
| Finance | | | 69,867 | | | | 39,049 | | | | 9,354 | | | | 3,095 | | | | 121,365 | | | | 23,026 | |
| Service industries and business activities | | | 16,474 | | | | 2,190 | | | | 233 | | | | 1 | | | | 18,898 | | | | 18 | |
| Agriculture, forestry and fishing | | | 20 | | | | 4 | | | | — | | | | — | | | | 24 | | | | — | |
| Property | | | 6,456 | | | | 4,089 | | | | — | | | | — | | | | 10,545 | | | | — | |
| Individuals: | | | | | | | | | | | | | | | | | | | | | | | | |
| Home mortgages | | | 27,882 | | | | — | | | | — | | | | — | | | | 27,882 | | | | — | |
| Other | | | 10,879 | | | | — | | | | — | | | | — | | | | 10,879 | | | | — | |
| Finance leases and instalment credit | | | 2,228 | | | | — | | | | — | | | | — | | | | 2,228 | | | | — | |
| Interest accruals | | | 1,421 | | | | 379 | | | | — | | | | — | | | | 1,800 | | | | 2 | |
| Total US | | | 143,805 | | | | 69,921 | | | | 9,708 | | | | 3,308 | | | | 226,742 | | | | 23,059 | |
Business review continuedIndustry risk – geographical analysis (continued)
| | | Group | |
| 2007 | | Loans and advances to banks and customers £m | | | Debt securities and equity shares £m | | | Derivatives £m | | | Other( 1) £m | | | Total £m | | | Netting and offset (2) £m | |
| Europe | | | | | | | | | | | | | | | | | | |
| Central and local government | | | 2,371 | | | | 30,593 | | | | 132 | | | | — | | | | 33,096 | | | | 9 | |
| Manufacturing | | | 15,159 | | | | 13 | | | | 361 | | | | — | | | | 15,533 | | | | 214 | |
| Construction | | | 4,779 | | | | — | | | | 13 | | | | — | | | | 4,792 | | | | — | |
| Finance | | | 40,481 | | | | 42,418 | | | | 6,285 | | | | 157 | | | | 89,341 | | | | 84,200 | |
| Service industries and business activities | | | 46,500 | | | | 540 | | | | 481 | | | | — | | | | 47,521 | | | | 24,648 | |
| Agriculture, forestry and fishing | | | 4,650 | | | | 2 | | | | 42 | | | | — | | | | 4,694 | | | | — | |
| Property | | | 15,768 | | | | 67 | | | | 8 | | | | — | | | | 15,843 | | | | — | |
| Individuals: | | | | | | | | | | | | | | | | | | | | | | | | |
| Home mortgages | | | 81,557 | | | | 18 | | | | — | | | | — | | | | 81,575 | | | | — | |
| Other | | | 16,292 | | | | 3,292 | | | | — | | | | — | | | | 19,584 | | | | — | |
| Finance leases and instalment credit | | | 1,620 | | | | — | | | | — | | | | — | | | | 1,620 | | | | — | |
| Interest accruals | | | 2,872 | | | | 1,101 | | | | — | | | | — | | | | 3,973 | | | | — | |
| Total Europe | | | 232,049 | | | | 78,044 | | | | 7,322 | | | | 157 | | | | 317,572 | | | | 109,071 | |
| Rest of the World | | | | | | | | | | | | | | | | | | | | | | | | |
| Central and local government | | | 2,592 | | | | 18,821 | | | | 94 | | | | — | | | | 21,507 | | | | — | |
| Manufacturing | | | 8,078 | | | | 46 | | | | 738 | | | | — | | | | 8,862 | | | | — | |
| Construction | | | 825 | | | | 79 | | | | 3 | | | | — | | | | 907 | | | | 1 | |
| Finance | | | 37,502 | | | | 16,919 | | | | 3,797 | | | | 1,210 | | | | 59,428 | | | | 6,059 | |
| Service industries and business activities | | | 14,449 | | | | 1,825 | | | | 661 | | | | — | | | | 16,935 | | | | 103 | |
| Agriculture, forestry and fishing | | | 1,941 | | | | — | | | | — | | | | — | | | | 1,941 | | | | — | |
| Property | | | 2,898 | | | | 217 | | | | 28 | | | | — | | | | 3,143 | | | | — | |
| Individuals: | | | | | | | | | | | | | | | | | | | | | | | | |
| Home mortgages | | | 1,740 | | | | — | | | | — | | | | — | | | | 1,740 | | | | — | |
| Other | | | 12,261 | | | | — | | | | — | | | | — | | | | 12,261 | | | | 3 | |
| Finance leases and instalment credit | | | 18 | | | | — | | | | 254 | | | | 45 | | | | 317 | | | | — | |
| Interest accruals | | | 945 | | | | 11 | | | | — | | | | — | | | | 956 | | | | — | |
| Total Rest of the World | | | 83,249 | | | | 37,918 | | | | 5,575 | | | | 1,255 | | | | 127,997 | | | | 6,166 | |
| Total | | | | | | | | | | | | | | | | | | | | | | | | |
| Central and local government | | | 10,077 | | | | 103,205 | | | | 4,148 | | | | 212 | | | | 117,642 | | | | 1,540 | |
| Manufacturing | | | 51,719 | | | | 3,418 | | | | 6,010 | | | | — | | | | 61,147 | | | | 4,259 | |
| Construction | | | 18,760 | | | | 631 | | | | 757 | | | | — | | | | 20,148 | | | | 1,685 | |
| Finance | | | 442,532 | | | | 204,587 | | | | 259,294 | | | | 17,178 | | | | 923,591 | | | | 299,705 | |
| Service industries and business activities | | | 151,822 | | | | 21,356 | | | | 5,787 | | | | 1 | | | | 178,966 | | | | 31,456 | |
| Agriculture, forestry and fishing | | | 9,181 | | | | 72 | | | | 100 | | | | — | | | | 9,353 | | | | 104 | |
| Property | | | 88,837 | | | | 5,013 | | | | 1,005 | | | | 7 | | | | 94,862 | | | | 2,033 | |
| Individuals: | | | | | | | | | | | | | | | | | | | | | | | | |
| Home mortgages | | | 185,095 | | | | 1,813 | | | | 5 | | | | — | | | | 186,913 | | | — | |
| Other | | | 68,179 | | | | 4,432 | | | | 15 | | | | 23 | | | | 72,649 | | | | 10 | |
| Finance leases and instalment credit | | | 19,498 | | | | 131 | | | | 281 | | | | 45 | | | | 19,955 | | | | 5 | |
| Interest accruals | | | 8,750 | | | | 3,098 | | | | — | | | | — | | | | 11,848 | | | | 2 | |
| | | | 1,054,450 | | | | 347,756 | | | | 277,402 | | | | 17,466 | | | | 1,697,074 | | | | 340,799 | |
Notes:
(1) | Incudes settlement balances of £16,589 million. |
| |
(2) | This column shows the amount by which the Group’s credit risk exposure is reduced through arrangements, such as master netting agreements, which give the Group a legal right to set-off the financial asset against a financial liability due to the same counterparty. In addition, the Group holds collateral in respect of individual loans and advances to banks and to customers. This collateral includes mortgages over property (both personal and commercial); charges over business assets such as plant, inventories and trade debtors; and guarantees of lending from parties other than the borrower. The Group obtains collateral in the form of securities in reverse repurchase agreements. Cash and securities are received as collateral in respect of derivative transactions. |
Business review continuedThe Group classifies impaired assets as either Risk Elements in Lending (REIL) or Potential Problem Loans (PPL). REIL represents non-accrual loans, loans that are accruing but are past due 90 daysAssets and restructured loans. PPL represents impaired assets which are not included in REIL but where information about possible credit problems cause management to have serious doubts about the future ability of the borrower to comply with loan repayment terms.
Both REIL and PPL are reported gross of the value of any security held, which could reduce the eventual loss should it occur, and gross of any provision marked. Therefore impaired assets which are highly collateralised, such as mortgages, will have a low coverage ratio of provisions held against reported impaired balance.
The analyses of risk elements and impairment charges as discussed below form a key part of the data provided to senior management on the credit performance of the Group’s portfolios.
Risk elements in lending and potential problem loans (audited)
| | | | | | | | | 2008 | | | | | | | | | | | | | | | 2007 | | | | | | | |
| Division | | REIL £m | | | PPL £m | | | REIL and PPL £m | | | Total provision £m | | | Total provision as % of REIL % | | | Total provision as % of REIL & PPL % | | | REIL £m | | | PPL £m | | | REIL and PPL £m | | | Total provision £m | | | Total provision as % of REIL % | | | Total provision as % of REIL & PPL % | |
| Global Markets | | | | | | | | | | | | | | | | | | | | | | | | | | | | | | | | | | | | |
| – Global Banking & Markets | | | 6,192 | | | | 18 | | | | 6,210 | | | | 3,491 | | | | 56 | % | | | 56 | % | | | 952 | | | | 67 | | | | 1,019 | | | | 586 | | | | 62 | % | | | 58 | % |
| – Global Transaction Services | | | 284 | | | | — | | | | 284 | | | | 245 | | | | 86 | % | | | 86 | % | | | 336 | | | | — | | | | 336 | | | | 170 | | | | 51 | % | | | 51 | % |
| Total Global Markets | | | 6,476 | | | | 18 | | | | 6,494 | | | | 3,736 | | | | 58 | % | | | 58 | % | | | 1,288 | | | | 67 | | | | 1,355 | | | | 756 | | | | 59 | % | | | 56 | % |
| Regional Markets | | | | | | | | | | | | | | | | | | | | | | | | | | | | | | | | | | | | | | | | | | | | | | | | |
| – UK Retail & Commercial Banking | | | 7,900 | | | | 200 | | | | 8,100 | | | | 3,709 | | | | 47 | % | | | 46 | % | | | 5,535 | | | | 63 | | | | 5,598 | | | | 3,281 | | | | 59 | % | | | 59 | % |
| – US Retail & Commercial Banking | | | 770 | | | | — | | | | 770 | | | | 932 | | | | 121 | % | | | 121 | % | | | 317 | | | | — | | | | 317 | | | | 304 | | | | 96 | % | | | 96 | % |
| – Europe & Middle East Retail & Commercial Banking | | | 3,341 | | | | 8 | | | | 3,349 | | | | 822 | | | | 25 | % | | | 25 | % | | | 725 | | | | 1 | | | | 726 | | | | 418 | | | | 58 | % | | | 58 | % |
| – Asia Retail & Commercial Banking | | | 304 | | | | — | | | | 304 | | | | 252 | | | | 83 | % | | | 83 | % | | | 386 | | | | — | | | | 386 | | | | 183 | | | | 47 | % | | | 47 | % |
| Total Regional Markets | | | 12,315 | | | | 208 | | | | 12,523 | | | | 5,715 | | | | 46 | % | | | 46 | % | | | 6,963 | | | | 64 | | | | 7,027 | | | | 4,186 | | | | 60 | % | | | 60 | % |
| Other | | | — | | | | — | | | | — | | | | — | | | | — | | | | — | | | | — | | | | — | | | | — | | | | 14 | | | | — | | | | — | |
| RBS share of shared assets | | | — | | | | — | | | | — | | | | — | | | | — | | | | — | | | | — | | | | — | | | | — | | | | 16 | | | | — | | | | — | |
| RFS Holdings minority interest | | | 2,470 | | | | — | | | | 2,470 | | | | 1,565 | | | | 63 | % | | | 63 | % | | | 2,480 | | | | 540 | | | | 3,020 | | | | 1,480 | | | | 60 | % | | | 49 | % |
| Group | | | 21,261 | | | | 226 | | | | 21,487 | | | | 11,016 | | | | 52 | % | | | 51 | % | | | 10,731 | | | | 671 | | | | 11,402 | | | | 6,452 | | | | 60 | % | | | 57 | % |
Business review continued
liabilities by contractual cashflow maturity
The table below sets out the Group’s loans that are classified as REIL and PPL.
| | | | | | | |
| | | Group £m | | | Group £m | |
| Non-accrual loans (1) | | | 19,479 | | | | 10,362 | |
| Accrual loans past due 90 days (2) | | | 1,782 | | | | 369 | |
| Total REIL | | | 21,261 | | | | 10,731 | |
| PPL (3) | | | 226 | | | | 671 | |
| Total REIL and PPL | | | 21,487 | | | | 11,402 | |
| REIL and PPL as % of customer loans and advances – gross (4) | | | 2.52 | % | | | 1.64 | % |
The sub-categories of REIL and PPL are calculated as described in notes 1 to 4 below.
Notes:
(1) | All loans against which an impairment provision is held are reported in the non-accrual category. |
(2) | Loans where an impairment event has taken place but no impairment recognised. This category is used for fully collateralised non-revolving credit facilities. |
(3) | Loans for which an impairment event has occurred but no impairment provision is necessary. This category is used for fully collateralised advances and revolving credit facilities where identification as 90 days overdue is not feasible. |
(4) | Gross of provisions and excluding reverse repurchase agreements. |
REIL as at 31 December 2008 was £21,261 million (2007 – £10,731 million). As a percentage of customer lending, REIL and PPL in aggregate was 2.52% of customer loans and advances at 31 December 2008 (2007 – 1.64%).
Impairment loss provision methodology (audited)
Provisions for impairment losses are assessed under three categories:
● | Individually assessed provisions: provisions required for individually significant impaired assets which are assessed on a case by case basis, taking into account the financial condition of the counterparty and any guarantor and collateral held after being stressed for downside risk. This incorporates an estimate of the discounted value of any recoveries and realisation of security or collateral. The asset continues to be assessed on an individual basis until it is repaid in full, transferred to the performing portfolio or written-off.
|
● | Collectively assessed provisions: provisions on impaired credits below an agreed threshold which are assessed on a portfolio basis, to reflect the homogeneous nature of the assets, such as credit cards or personal loans. The provision is determined from a quantitative review of the relevant portfolio, taking account of the level of arrears, security and average loss experience over the recovery period.
|
● | Latent loss provisions: provisions held against the estimated impairment in the performing portfolio which have yet to be identified as at the balance sheet date. To assess the latent loss within the portfolios, the Group has developed methodologies to estimate the time that an asset can remain impaired within a performing portfolio before it is identified and reported as such.
|
Provision analysis (audited)
The Group’s consumer portfolios, which consist of high volume, small value credits, have highly efficient largely automated processes for identifying problem credits and very short timescales, typically three months, before resolution or adoption of various recovery methods. Corporate portfolios consist of higher value, lower volume credits, which tend to be structured to meet individual customer requirements. Provisions are assessed on a case by case basis by experienced specialists with input from professional valuers and accountants. The Group operates a clear provisions governance framework which sets thresholds whereby suitable oversight and challenge is undertaken and significant cases will be presented to a committee chaired by the Group Chief Executive or the Group Finance Director.
Business review continuedImpairment charge (audited)
The following table shows total impairment losses charged to the income statement.
| | | | 2008 £m | | | | 2007 £m | |
| New impairment losses | | | 8,391 | | | | 2,310 | |
| less: recoveries of amounts previously written-off | | | (319 | ) | | | (342 | ) |
| Charge to income statement | | | 8,072 | | | | 1,968 | |
| Comprising: | | | | | | | | |
| Loan impairment losses | | | 7,091 | | | | 1,946 | |
| Impairment losses on available-for-sale securities | | | 981 | | | | 22 | |
| Charge to income statement | | | 8,072 | | | | 1,968 | |
| Impairment losses by division: | | | | | | | | |
| Global Markets | | | | | | | | |
| – Global Banking & Markets | | | 3,643 | | | | 67 | |
| – Global Transaction Services | | | 60 | | | | 14 | |
| Regional Markets | | | | | | | | |
| – UK Retail & Commercial Banking | | | 1,964 | | | | 1,368 | |
| – US Retail & Commercial Banking | | | 1,041 | | | | 340 | |
| – Europe & Middle East Retail & Commercial Banking | | | 526 | | | | 118 | |
| – Asia Retail & Commercial Banking | | | 171 | | | | 24 | |
| RBS Insurance | | | 42 | | | | — | |
| Other | | | (15 | ) | | | (1 | ) |
| RFS Holdings minority interest | | | 640 | | | | 38 | |
| Group | | | 8,072 | | | | 1,968 | |
Analysis of loan impairment charge (audited)
| | | 2008 £m | | | 2007 £m | |
| Latent loss impairment charge | | | 822 | | | | 88 | |
| Collectively assessed impairment charge | | | 2,606 | | | | 1,584 | |
| Individually assessed impairment charge (1) | | | 3,545 | | | | 274 | |
| Charge to income statement | | | 6,973 | | | | 1,946 | |
| Charge as a % of customer loans and advances – gross (2) | | | 0.82 | % | | | 0.28 | % |
Notes:
(1) Excludes loan impairment charge against loans and advances to banks of £118 million (2007 – nil).
(2) Gross of provisions and excluding reverse repurchase agreements.
Analysis of loan impairment provisions (audited)
| | | 2008 £m | | | 2007 £m | |
| Latent loss provisions | | | 1,944 | | | | 1,050 | |
| Collectively assessed provisions | | | 4,102 | | | | 3,845 | |
| Individually assessed provisions | | | 4,843 | | | | 1,554 | |
| Total provisions (1) | | | 10,889 | | | | 6,449 | |
| Total provision as a % of customer loans and advances – gross (2) | | | 1.3 | % | | | 0.9 | % |
Notes:
(1) Excludes provisions against loans and advances to banks of £127 million (2007 – £3 million).
(2) Gross of provisions and excluding reverse repurchase agreements.
Business review continuedProvisions coverage (audited)
The Group’s provision coverage ratios are shown in the table below.
| | | | | | | |
| | | £m | | | £m | |
| Total provision expressed as a: | | | | | | |
| % of REIL | | | 52% | | | | 60% | |
| % of REIL and PPL | | | 51% | | | | 57% | |
The coverage ratio of closing provisions to REIL and PPL decreased from 57% to 51% during 2008. The lower coverage ratio reflects amounts written-off and the changing mix from unsecured to secured exposures.
Movement in loan impairment provisions (audited)
The following table shows the movement in the provision for impairment losses for loans and advances.
| | | Individually assessed £m | | | Collectively assessed £m | | | Latent £m | | | Total 2008 £m | | | | 2007 £m | |
| At 1 January | | | 1,568 | | | | 3,834 | | | | 1,050 | | | | 6,452 | | | | 3,935 | |
| Transfer to disposal groups | | | (222 | ) | | | (351 | ) | | | (194 | ) | | | (767 | ) | | | — | |
| Currency translation and other adjustments | | | 1,065 | | | | 81 | | | | 295 | | | | 1,441 | | | | 137 | |
| Acquisition of subsidiaries | | | — | | | | — | | | | — | | | | — | | | | 2,221 | |
| Disposal of subsidiaries | | | — | | | | (149 | ) | | | (29 | ) | | | (178 | ) | | | — | |
| Net increase in provisions of discontinued operations | | | — | | | | — | | | | — | | | | — | | | | 46 | |
| Amounts written-off | | | (1,165 | ) | | | (1,983 | ) | | | — | | | | (3,148 | ) | | | (2,011 | ) |
| Recoveries of amounts previously written-off | | | 113 | | | | 206 | | | | — | | | | 319 | | | | 342 | |
| Charged to the income statement | | | 3,663 | | | | 2,606 | | | | 822 | | | | 7,091 | | | | 1,946 | |
| Unwind of discount | | | (52 | ) | | | (142 | ) | | | — | | | | (194 | ) | | | (164 | ) |
| At 31 December (1) | | | 4,970 | | | | 4,102 | | | | 1,944 | | | | 11,016 | | | | 6,452 | |
Note:
(1) | The provison for impairment losses at 31 December 2008 include £127 million relating to loans and advances to banks (2007 – £3 million). |
Movement in loan impairment provisions (audited)
The movement in provisions balance by division is shown in the table below.
| | | Global Banking & Markets £m | | | Global Transaction Services £m | | | UK Retail & Commercial Banking £m | | | US Retail & Commercial Banking £m | | | Europe & Middle East Retail & Commercial Banking £m | | | Asia Retail & Commercial Banking £m | | | Central Items £m | | | RBS Share of Shared Assets £m | | | RFS Holdings minority interest £m | | | Total 2008 £m | | | | 2007 £m | |
| At 1 January | | | 586 | | | | 170 | | | | 3,281 | | | | 304 | | | | 418 | | | | 183 | | | | 14 | | | | 16 | | | | 1,480 | | | | 6,452 | | | | 3,935 | |
| Transfers to disposal groups | | | — | | | | — | | | | — | | | | — | | | | — | | | | — | | | | — | | | | — | | | | (767 | ) | | | (767 | ) | | | — | |
| Currency translation and other adjustments | | | 496 | | | | 52 | | | | 12 | | | | 219 | | | | 147 | | | | 57 | | | | — | | | | — | | | | 458 | | | | 1,441 | | | | 137 | |
| Acquisition of subsidiaries | | | — | | | | — | | | | — | | | | — | | | | — | | | | — | | | | — | | | | — | | | | — | | | | — | | | | 2,221 | |
| Disposal of subsidiaries | | | — | | | | — | | | | (108 | ) | | | — | | | | (70 | ) | | | — | | | | — | | | | — | | | | — | | | | (178 | ) | | | — | |
| Net increase in provisions of discontinued operations | | | — | | | | — | | | | — | | | | — | | | | — | | | | — | | | | — | | | | — | | | | — | | | | — | | | | 46 | |
| Amounts written-off | | | (307 | ) | | | (34 | ) | | | (1,414 | ) | | | (710 | ) | | | (174 | ) | | | (153 | ) | | | (64 | ) | | | (16 | ) | | | (276 | ) | | | (3,148 | ) | | | (2,011 | ) |
| Recoveries of amounts previously written-off | | | 10 | | | | 1 | | | | 113 | | | | 80 | | | | 7 | | | | — | | | | 50 | | | | — | | | | 58 | | | | 319 | | | | 342 | |
| Charge to income statement | | | 2,718 | | | | 59 | | | | 1,965 | | | | 1,039 | | | | 526 | | | | 171 | | | | — | | | | — | | | | 613 | | | | 7,091 | | | | 1,946 | |
| Discount unwind | | | (12 | ) | | | (3 | ) | | | (140 | ) | | | — | | | | (32 | ) | | | (6 | ) | | | — | | | | — | | | | (1 | ) | | | (194 | ) | | | (164 | ) |
| At 31 December | | | 3,491 | | | | 245 | | | | 3,709 | | | | 932 | | | | 822 | | | | 252 | | | | — | | | | — | | | | 1,565 | | | | 11,016 | | | | 6,452 | |
Liquidity risk (audited)
The Group’s liquidity policy is designed to ensure that the Group can at all times meet its obligations as they fall due.
Liquidity management within the Group addresses the overall balance sheet structure and the control, within prudent limits, of risk arising from the mismatch of maturities across the balance sheet and from exposure to undrawn commitments and other contingent obligations.
The management of liquidity risk within the Group is undertaken within a formal governance structure. The Group Board of Directors oversees the liquidity risk appetite and strategy of the Group; the Group Executive Management Committee reviews the key liquidity metrics and trends in the context of the Group’s overall risk profile; the Group Asset and Liability Management Committee (GALCO), chaired by the Group Finance Director and including the chief executives of the business divisions as well as the Group Treasurer, Group Chief Risk Officer and heads of other relevant Group functions, sets explicit metrics across a number of asset and liability targets and these are cascaded to the business and monitored by the Group Treasury and risk functions.
Group Treasury has overall responsibility for the daily monitoring and control of the Group’s liquidity and funding positions. The Liquidity Managers’ Forum is chaired and directed by the Group Treasurer with membership including the Head of Short Term Markets and Financing, GBM. The forum typically meets weekly with more frequent, ad hoc, meetings as necessary. There are Regional and Country ALCOs that oversee Group policy in businesses in Europe, Asia and the Americas. The Group is divided into Liquidity Reporting Units each of which is required to have its own liquidity limits and contingency funding plan. In addition, all subsidiaries and branches outside the UK are required to comply with local regulatory liquidity requirements and are subject to Group Treasury oversight.
Management of term structure
The Group evaluates on a regular basis its structural liquidity risk and applies a variety of balance sheet management and term funding strategies to maintain this risk within its normal policy parameters. The degree of maturity mismatch within the overall long-term structure of the Group’s assets and liabilities is managed within internal policy guidelines, aimed at ensuring term asset commitments may be funded on an economic basis over their life. In managing its overall term structure, the Group analyses and takes into account the effect of retail and corporate customer behaviour on actual asset and liability maturities where they differ materially from the underlying contractual maturities.
Daily management
The primary focus of the daily management activity is to ensure access to sufficient liquidity to meet cash flow obligations within key time horizons, in particular out to one month ahead. The short-term maturity structure of the Group’s liabilities and assets is managed daily to ensure that all material or potential cash flow obligations, arising from undrawn commitments and other contingent obligations can be met.
Potential sources include cash inflows from maturing assets, new borrowings or the sale of various debt securities held (after allowing for appropriate haircuts). Short-term liquidity risk is generally managed on a consolidated basis with liquidity mismatch limits in place for subsidiaries and non-UK branches which have material local treasury activities, thereby assuring that the daily maintenance of the Group’s overall liquidity risk position is not compromised. ABN AMRO, Citizens Financial Group and RBS Insurance manage liquidity locally, given different regulatory regimes, subject to review by Group Treasury. As integration of ABN AMRO’s businesses within the Group proceeds, the liquidity risk policies, parameters and metrics used will be progressively aligned within a single framework.
Stress testing
The Group performs stress tests to simulate how events may impact its funding and liquidity capabilities. Such tests inform the overall balance sheet structure and help define suitable limits for control of the risk arising from the mismatch of maturities across the balance sheet and from undrawn commitments and other contingent obligations. The form and content of stress tests are updated where required as market conditions evolve.
Contingency planning
Contingency funding plans have been developed to anticipate and respond to approaching or actual material deterioration in market conditions. The Group reviews its contingency plans in the light of evolving market conditions. The contingency funding plan covers: the available sources of contingent funding to supplement cash flow shortages; the lead times to obtain such funding; the roles and responsibilities of those involved in the contingency plans, including the communication lines for escalation of events which give rise to liquidity stress; assumptions, including the expected change impact of market conditions; and the ability and circumstances within which the Group accesses central bank liquidity.
Global developments (unaudited)
The global financial system has experienced its greatest crisis in the post war period and the dislocation became most acute in the second half of 2008. This loss of confidence in the world’s banking system led to massive dislocation in the capital markets and resulted in the effective closure of the term debt and securitisation markets and money markets. Government intervention in, and support for, the international financial system has increased to unprecedented levels taking the form of capital injections, guaranteed funding, asset insurance schemes and expanded facilities from a number of central banks:
● | In September 2007, the Bank of England announced that to alleviate strains in longer-maturity money markets, it would conduct auctions to provide funds at three month maturity against a wider range of collateral, including mortgage collateral, than in its weekly open market operations. |
Business review continued● | In April 2008, the Bank of England launched a special liquidity scheme allowing banks to swap temporarily illiquid mortgage and other assets for Treasury Bills. The scheme closed to new issuances on 30 January 2009. However, it will provide liquidity support for a further three years. |
● | In September 2008, the major central banks announced coordinated action to improve US$ liquidity. As part of this action, the Bank of England and ECB commenced US dollar repo operations. Eligible collateral consists of securities routinely eligible in the Bank of England’s and ECB’s short-term repo open market operations together with conventional US Treasuries. The Bank of England concluded a reciprocal swap agreement (swap line) with the US Federal Reserve. On 3 February 2009, the Bank of England announced the extension of this facility until 30 October 2009. |
● | In October 2008, the pool of eligible collateral securities for its open market operations was extended to include bank debt guaranteed under the Government’s bank debt guarantee scheme. |
● | In October 2008, the Government announced a credit guarantee scheme. It will guarantee new unsecured borrowing in return for a fee. Initially the guarantee period ended on 9 April 2009 but on 19 January 2009 the Government announced an extension to 31 December 2009. It also announced new arrangements, expected to start in April 2009, to guarantee asset-backed securities issued by banks. |
● | In October 2008 the European Central Bank expanded its list of eligible collateral to include marketable debt instruments denominated in non-euro currencies (and issued in the euro area) among others. This is to remain in force until the end of 2009. Enhancements were also made to the provision of longer-term refinancing operations including conducting them through a fixed rate tender procedure with full allotment. This is to stay in place for as long as needed and at least until 31 March 2009. |
● | On 27 October 2008 the Federal Reserve Bank commenced the Commercial Paper Funding Facility to provide a liquidity backstop to issuers of commercial paper. A special purpose vehicle (SPV) funded by the Federal Reserve Bank of New York will purchase eligible three- month unsecured and asset-backed commercial paper from eligible issuers. In February 2009 the FED announced an extension to this facility until 30 October 2009. |
● | In October 2008 the UK Government announced recapitalisation plans for a number of UK banks including RBS. |
● | In January 2009, it was announced that the Bank of England will permit drawings from the discount window facility with a term of 364 days, in addition to the standard option to draw for 30 days. |
● | In January 2009, the Government announced that the Bank of England had been authorised to purchase up to £50 billion of high-quality private sector assets under an asset purchase facility. The following sterling assets are initially eligible for purchase: commercial paper, corporate bonds, paper issued under the Credit Guarantee Scheme (CGS), syndicated loans and asset-backed securities created in viable securitisation structures. |
● | In January 2009, the Government announced an asset protection scheme. The Government will insure, for a commercial fee, certain bank assets against losses. It is anticipated that the scheme will commence in April 2009. The UK banks, including the Group, have been in discussions with the Tripartite Authorities about the scheme’s terms. |
● | In January 2009, the FSA has announced that it will ensure that the application of the current International Basel Accord does not create any unnecessary or unintended pro-cyclical effects. |
● | On 3 February 2009 the Federal Reserve Bank announced an extension to a number of its liquidity facilities until 30 October 2009. These included the Term Securities Lending Facility (TSLF), originally announced in March 2008. Under the TSLF, the Federal Reserve Bank of New York auctions 28-day term loans of Treasury securities to primary dealers in exchange for other program eligible collateral. |
Liquidity management in 2008 (audited)
The exposure of the Group to wholesale market funding increased markedly in 2008 following the acquisition of the wholesale banking business of ABN AMRO in the latter half of 2007. The amount of unsecured wholesale funding represented by bank funding and debt securities increased from £154 billion in June 2007 to £362 billion in December 2007. The gap between customer loans and customer deposits increased over this period from £86 billion to £121 billion.
The market disruption during 2008 had a marked effect on the Group’s liquidity and funding which was at its most acute in the autumn of 2008 following the collapse of Lehman Brothers. During that period, the Group’s credit ratings were downgraded constraining both access to and tenor of wholesale funding and there was an outflow of customer deposits. The effective closure of the term funding markets and sharp reduction in the quantity and maturity of short term bank funding had profound consequences for the Group.
Whilst the Group’s customer funding sources remain well diversified and its retail franchise proved resilient, the availability of longer term funding diminished. The Group therefore increased its shorter term wholesale funding exposure, increased its access to central bank funding and issued government guaranteed debt to fund the balance sheet. The government schemes have enabled the mitigation of the financial crisis as the Group rebalances its asset and liability structure.
An analysis of the Group’s funding is set out below.
| | | 2008 | | | 2007 | |
| Sources of funding | | £m | | | % | | | £m | | | % | |
| Customer accounts (excluding repos) | | | | | | | | | | | | | | | | |
| Repayable on demand | | | 327,547 | | | | 24 | | | | 346,074 | | | | 24 | |
| Time deposits | | | 253,822 | | | | 19 | | | | 201,373 | | | | 14 | |
| Total customer accounts (excluding repos) | | | 581,369 | | | | 43 | | | | 547,447 | | | | 38 | |
| Debt securities in issue over one year remaining maturity | | | 125,782 | | | | 9 | | | | 118,152 | | | | 8 | |
| Subordinated liabilities | | | 49,154 | | | | 4 | | | | 38,043 | | | | 3 | |
| Owners’ equity | | | 58,879 | | | | 4 | | | | 53,038 | | | | 4 | |
| Total customer accounts and long term funds | | | 815,184 | | | | 60 | | | | 756,680 | | | | 53 | |
| Repo agreements with customers | | | 58,143 | | | | 5 | | | | 134,916 | | | | 10 | |
| Repo agreements with banks | | | 83,666 | | | | 6 | | | | 163,038 | | | | 11 | |
| Total customer accounts, long term funds and collateralised borrowing | | | 956,993 | | | | 71 | | | | 1,054,634 | | | | 74 | |
| Debt securities in issue up to one year remaining maturity | | | 174,507 | | | | 13 | | | | 156,020 | | | | 11 | |
| Deposits by banks (excluding repos) | | | 174,378 | | | | 13 | | | | 149,256 | | | | 10 | |
| Short positions | | | 42,536 | | | | 3 | | | | 73,501 | | | | 5 | |
| Total | | | 1,348,414 | | | | 100 | | | | 1,433,411 | | | | 100 | |
Customer accounts – the principal source of funds for the Group is its core customer deposits gathered by its retail banking, private client, corporate and SME franchises. The underlying strength of the franchise is demonstrated by the performance of the Group in these markets as customer deposits increased from £547 billion in December 2007 to £581 billion at the end of December 2008. There was a fluctuation in balances at the height of the market disruption in October 2008 but this was recovered by the year end. The Group’s multi-brand offering and strong client focus is a key part of the funding strategy and continues to benefit the Group’s funding position.
Repo agreements are borrowings collateralised by a range of debt securities and other assets undertaken with a range of corporate and institutional customers and banks. These reduced significantly in the course of 2008 as the Group took strategic actions and wholesale markets retrenched.
Short positions in various securities are held primarily by GBM including RBS Greenwich Capital in the US.
Debt securities in issue over one year, subordinated liabilities and equity – during 2008, the debt markets saw reduced activity, in both the term and the securitisation markets; as a result the maturity profile of the Group’s wholesale funding has become shorter in duration over the course of the year. This was partly offset by issues of government guaranteed debt in the latter part of 2008. The maturity profile of debt securities is predominantly concentrated under one year and this is a source of refinancing risk in the coming twelve months.
The Group raised £27 billion of equity capital during the course of 2008 from a rights issue of £12 billion in June 2008 and a placing and open offer in December 2008 which provided a further £15 billion of equity capital. In December 2008 a further £5 billion was raised from a preference share issue which was repaid from the proceeds of the Second Placing and Open Offer in April 2009.
Short term debt and bank deposits – the Group saw considerable pressure and risk aversion in the short term debt and bank deposit markets. In order to relieve funding shortages in the market, central banks across the world allowed banks to pledge assets to access funding. The Group has used central bank schemes to support its funding and pledged assets into several of these schemes in a number of countries in which it operates. The Group has set up a series of initiatives to improve the liquidity value of its assets to assist in relieving funding pressures.
Undrawn commitments – the Group provides undrawn commitments to both its corporate and personal customers in the form of products such as overdrafts and credit card facilities. The commitments portfolio is well diversified in terms of customers, geography and business type. The total amount of the Group’s undrawn commitments at the end of 2008 was £352 billion.
Business review continuedConduits – the Group’s most significant multi-seller conduits have thus far continued to fund the vast majority of their assets solely through ABCP issuance. There were significant disruptions to the liquidity of the financial markets during the year following the bankruptcy filing of Lehman Brothers in September 2008 and this required a small amount of the assets held in certain conduits to be funded by the Group rather than through ABCP issuance. By the end of 2008 there had been an improvement in market conditions, supported by central bank initiatives, which enabled normal ABCP funding to replace this Group funding of the conduits.
The average maturity of ABCP issued by the Group’s conduits as at 31 December 2008 was 72.1 days (2007– 60.9 days).
The total assets held by the Group’s sponsored conduits are £49.9 billion (2007– £48.1 billion). Since these liquidity facilities are sanctioned on the basis of total conduit purchase commitments, the liquidity facility commitments will exceed the level of assets held, with the difference representing undrawn commitments.
The Group values the funding flexibility and liquidity provided by the ABCP market to fund client and Group-originated assets. Whilst there are plans to decrease the multi-seller conduit business in line with the Group’s balance sheet, the Group is reviewing the potential for new own-asset conduit structures to add funding diversity.
Outlook for 2009 (unaudited)
The market outlook for 2009 remains uncertain with the prospect of recession on a global scale. The wholesale funding markets remain difficult with a high degree of risk aversion towards the banking market and no restoration of the unguaranteed debt capital markets for bank issuance yet visible. The continuation of these conditions means that the use of central bank and other government facilities are likely to be required for some time. Other deposit initiatives have commenced to widen wholesale and other retail deposit gathering actions.
Group balance sheet (audited)
The following tables show the contractual undiscounted cash flows receivable and payable up to a period of twenty years including future receipts and payments of interest.
On balanceinterest of on-balance sheet assets by contractual maturitymaturity. The balances in the table below do not agree directly to the consolidated balance sheet, as the table includes all cash flows relating to principal and future coupon payments presented on an undiscounted basis.
| | 0-3 months | 3-12 months | 1-3 years | 3-5 years | 5-10 years | 10-20 years |
| 2010 | £m | £m | £m | £m | £m | £m |
| Assets by contractual maturity | | | | | | |
| Cash and balances at central banks | 56,988 | — | — | 1 | — | 25 |
| Loans and advances to banks | 33,809 | 1,377 | 711 | 120 | 193 | 79 |
| Debt securities | 11,247 | 9,816 | 25,059 | 22,400 | 40,600 | 22,128 |
| Settlement balances | 11,334 | 231 | — | — | 41 | — |
| Other financial assets | 458 | 221 | 207 | 15 | 405 | — |
| Total maturing assets | 113,836 | 11,645 | 25,977 | 22,536 | 41,239 | 22,232 |
| Loans and advances to customers | 112,465 | 86,592 | 120,139 | 69,304 | 78,131 | 63,015 |
| Derivatives held for hedging | 530 | 1,588 | 2,612 | 638 | 210 | 101 |
| | 226,831 | 99,825 | 148,728 | 92,478 | 119,580 | 85,348 |
| | | | | | | |
| Liabilities by contractual maturity | | | | | | |
| Deposits by banks | 43,396 | 4,417 | 1,243 | 304 | 651 | 374 |
| Debt securities in issue | 89,583 | 43,032 | 31,862 | 22,569 | 24,209 | 6,697 |
| Subordinated liabilities | 2,485 | 2,611 | 6,570 | 8,691 | 8,672 | 4,607 |
| Settlement balances and other liabilities | 12,423 | 59 | 136 | 177 | 385 | 25 |
| Total maturing liabilities | 147,887 | 50,119 | 39,811 | 31,741 | 33,917 | 11,703 |
| Customer accounts | 402,457 | 18,580 | 8,360 | 4,651 | 4,393 | 2,384 |
| Derivatives held for hedging | 608 | 936 | 2,103 | 969 | 681 | 253 |
| | 550,952 | 69,635 | 50,274 | 37,361 | 38,991 | 14,340 |
| | | | | | | |
| Maturity gap | (34,051) | (38,474) | (13,834) | (9,205) | 7,322 | 10,529 |
| Cumulative maturity gap | (34,051) | (72,525) | (86,359) | (95,564) | (88,242) | (77,713) |
| | | | | | | |
| Guarantees and commitments notional amount | | | | | | |
Guarantees (1) | 31,026 | — | — | — | — | — |
Commitments (2) | 266,822 | — | — | — | — | — |
For notes to this table refer to page 82.
| | | Group | |
| 2008 | | 0-3 months £m | | | 3-12 months £m | | | 1-3 years £m | | | 3-5 years £m | | | 5-10 years £m | | | 10-20 years £m | |
| Cash and balances at central banks | | | 12,333 | | | | 25 | | | | — | | | | — | | | | 2 | | | | 29 | |
| Loans and advances to banks | | | 61,630 | | | | 19,369 | | | | 2,673 | | | | 921 | | | | 111 | | | | 70 | |
| Loans and advances to customers | | | 195,553 | | | | 81,054 | | | | 138,378 | | | | 125,621 | | | | 160,271 | | | | 152,084 | |
| Debt securities | | | 26,006 | | | | 12,895 | | | | 24,629 | | | | 23,927 | | | | 57,846 | | | | 24,535 | |
| Derivatives held for hedging | | | 266 | | | | 1,796 | | | | 2,281 | | | | 1,359 | | | | 1,517 | | | | 649 | |
| Settlement balances | | | 17,830 | | | | — | | | | — | | | | — | | | | 2 | | | | — | |
| Other financial assets | | | 621 | | | | 193 | | | | 58 | | | | 111 | | | | 343 | | | | — | |
| | | | 314,239 | | | | 115,332 | | | | 168,019 | | | | 151,939 | | | | 220,092 | | | | 177,367 | |
Business reviewcontinued | Business review |
| Risk and balance sheet management |
Balance sheet management: Funding and liquidity risk continued
Assets and liabilities by contractual cashflow maturitycontinued
| | 0-3 months | 3-12 months | 1-3 years | 3-5 years | 5-10 years | 10-20 years |
| 2009 | £m | £m | £m | £m | £m | £m |
| Assets by contractual maturity | | | | | | |
| Cash and balances at central banks | 52,239 | — | — | 1 | 25 | — |
| Loans and advances to banks | 42,615 | 1,757 | 966 | 282 | 868 | 71 |
| Debt securities | 17,581 | 14,484 | 29,675 | 26,788 | 52,104 | 30,335 |
| Settlement balances | 12,020 | 6 | 1 | — | 8 | 1 |
| Other financial assets | 265 | 215 | 402 | 127 | 421 | — |
| Total maturing assets | 124,720 | 16,462 | 31,044 | 27,198 | 53,426 | 30,407 |
| Loans and advances to customers | 126,238 | 65,946 | 130,323 | 101,984 | 180,595 | 202,809 |
| Derivatives held for hedging | 488 | 1,547 | 3,049 | 1,076 | 751 | 10 |
| | 251,446 | 83,955 | 164,416 | 130,258 | 234,772 | 233,226 |
| | | | | | | |
| Liabilities by contractual maturity | | | | | | |
| Deposits by banks | 65,966 | 15,541 | 3,934 | 2,301 | 632 | 12 |
| Debt securities in issue | 100,220 | 49,300 | 56,869 | 25,915 | 27,326 | 3,819 |
| Subordinated liabilities | 1,929 | 1,892 | 3,654 | 4,963 | 20,157 | 6,105 |
| Settlement balances and other liabilities | 12,048 | 100 | 139 | 104 | 239 | 83 |
| Total maturing liabilities | 180,163 | 66,833 | 64,596 | 33,283 | 48,354 | 10,019 |
| Customer accounts | 521,400 | 15,619 | 5,944 | 4,221 | 8,490 | 4,392 |
| Derivatives held for hedging | 660 | 1,566 | 3,232 | 1,264 | 1,674 | 1,508 |
| | 702,223 | 84,018 | 73,772 | 38,768 | 58,518 | 15,919 |
| | | | | | | |
| Maturity gap | (55,443) | (50,371) | (33,552) | (6,085) | 5,072 | 20,388 |
| Cumulative maturity gap | (55,443) | (105,814) | (139,366) | (145,451) | (140,379) | (119,991) |
| | | | | | | |
| Guarantees and commitments notional amount | | | | | | |
Guarantees (1) | 39,952 | — | — | — | — | — |
Commitments (2) | 291,634 | — | — | — | — | — |
For notes to this table refer to page 82.
| | | Group | |
| 2008 | | 0-3 months £m | | | 3-12 months £m | | | 1-3 years £m | | | 3-5 years £m | | | 5-10 years £m | | | 10-20 years £m | |
| Deposits by banks | | | 154,614 | | | | 14,347 | | | | 3,345 | | | | 2,754 | | | | 2,048 | | | | 34 | |
| Customer accounts | | | 523,268 | | | | 33,450 | | | | 6,577 | | | | 6,337 | | | | 7,298 | | | | 5,319 | |
| Debt securities in issue | | | 131,714 | | | | 48,652 | | | | 40,067 | | | | 38,223 | | | | 38,667 | | | | 5,626 | |
| Derivatives held for hedging | | | 394 | | | | 2,216 | | | | 2,543 | | | | 1,334 | | | | 2,682 | | | | 1,373 | |
| Subordinated liabilities | | | 1,753 | | | | 4,271 | | | | 6,824 | | | | 5,793 | | | | 24,503 | | | | 13,030 | |
| Settlement balances and other liabilities | | | 13,351 | | | | 5 | | | | 12 | | | | 6 | | | | 10 | | | | 6 | |
| | | | 825,094 | | | | 102,941 | | | | 59,368 | | | | 54,447 | | | | 75,208 | | | | 25,388 | |
Business review continued
Business reviewcontinued | Business review |
| Risk and balance sheet management |
Balance sheet management: Funding and liquidity risk continued
OtherAssets and liabilities by contractual cash obligations
The table below summarises the Group’s other contractual cash obligations by payment date.
| | | Group | |
| 2008 | | 0-3 months £m | | | 3-12 months £m | | | 1-3 years £m | | | 3-5 years £m | | | 5-10 years £m | | | 10-20 years £m | |
| Operating leases | | | 146 | | | | 433 | | | | 976 | | | | 751 | | | | 1,448 | | | | 1,851 | |
| Contractual obligations to purchase goods or services | | | 237 | | | | 892 | | | | 486 | | | | 208 | | | | 303 | | | | 1 | |
| | | | 383 | | | | 1,325 | | | | 1,462 | | | | 959 | | | | 1,751 | | | | 1,852 | |
| | 0-3 months | 3-12 months | 1-3 years | 3-5 years | 5-10 years | 10-20 years |
| 2008 | £m | £m | £m | £m | £m | £m |
| Assets by contractual maturity | | | | | | |
| Cash and balances at central banks | 12,333 | 25 | — | — | 2 | 29 |
| Loans and advances to banks | 61,630 | 19,369 | 2,673 | 921 | 111 | 70 |
| Debt securities | 26,006 | 12,895 | 24,629 | 23,927 | 57,846 | 24,535 |
| Settlement balances | 17,830 | — | — | — | 2 | — |
| Other financial assets | 621 | 193 | 58 | 111 | 343 | — |
| Total maturing assets | 118,420 | 32,482 | 27,360 | 24,959 | 58,304 | 24,634 |
| Loans and advances to customers | 195,553 | 81,054 | 138,378 | 125,621 | 160,271 | 152,084 |
| Derivatives held for hedging | 266 | 1,796 | 2,281 | 1,359 | 1,517 | 649 |
| | 314,239 | 115,332 | 168,019 | 151,939 | 220,092 | 177,367 |
| | | | | | | |
| Liabilities by contractual maturity | | | | | | |
| Deposits by banks | 154,614 | 14,347 | 3,345 | 2,754 | 2,048 | 34 |
| Debt securities in issue | 131,714 | 48,652 | 40,067 | 38,223 | 38,667 | 5,626 |
| Subordinated liabilities | 1,753 | 4,271 | 6,824 | 5,793 | 24,503 | 13,030 |
| Settlement balances and other liabilities | 13,351 | 5 | 12 | 6 | 10 | 6 |
| Total maturing liabilities | 301,432 | 67,275 | 50,248 | 46,776 | 65,228 | 18,696 |
| Customer accounts | 523,268 | 33,450 | 6,577 | 6,337 | 7,298 | 5,319 |
| Derivatives held for hedging | 394 | 2,216 | 2,543 | 1,334 | 2,682 | 1,373 |
| | 825,094 | 102,941 | 59,368 | 54,447 | 75,208 | 25,388 |
| | | | | | | |
| Maturity gap | (183,012) | (34,793) | (22,888) | (21,817) | (6,924) | 5,938 |
| Cumulative maturity gap | (183,012) | (217,805) | (240,693) | (262,510) | (269,434) | (263,496) |
| | | | | | | |
| 2007 | | | | | | | | | | | | | | | | | | |
| Operating leases | | | 90 | | | | 268 | | | | 655 | | | | 569 | | | | 1,060 | | | | 1,958 | |
| Contractual obligations to purchase goods or services | | | 441 | | | | 1,007 | | | | 748 | | | | 199 | | | | 5 | | | | 2 | |
| | | | 531 | | | | 1,275 | | | | 1,403 | | | | 768 | | | | 1,065 | | | | 1,960 | |
The Group’s undrawn formal facilities, credit lines and other commitments to lend were £352,398 million (2007 – £332,811 million). While the Group has given commitments to provide these funds, some facilities may be subject to certain conditions being met by the counterparty. The Group does not expect all facilities to be drawn, and some may lapse before drawdown.| (1) | The Group is only called upon to satisfy a guarantee when the guaranteed party fails to meet its obligations. The Group expects most guarantees it provides to expire unused. |
| (2) | The Group has given commitments to provide funds to customers under undrawn formal facilities, credit lines and other commitments to lend subject to certain conditions being met by the counterparty. The Group does not expect all facilities to be drawn, and some may lapse before drawdown. |
The tables above show the timing of cash inflows and outflows to settle financial assets and liabilities. They have been prepared on the following basis:
The contractual maturity of on-balance sheet assets and liabilities above highlight the maturity transformation which underpins the role of banks to lend long-term but funded predominantly by short-term liabilities such as customer deposits. This is achieved through the diversified funding franchise of the Group across an extensive retail, wealth and SME customer base, and across a wide geographic network. In practice, the behavioural profile of many assets and liabilities exhibit greater stability and longer maturity than the contractual maturity.
Financial assets have been reflected in the time band of the latest date on which they could be repaid, unless earlier repayment can be demanded by the reporting entity; financialGroup. Financial liabilities are included at the earliest date on which the counterparty can require repayment regardless of whether or not such early repayment results in a penalty. If the repayment of a financial asset or liabilityinstrument is triggered by, or is subject to, specific criteria such as market price hurdles being reached, the asset is included in the time band which contains the latest date on which it can repaybe repaid regardless of early repayment whereas therepayment. The liability is included atin the time band which contains the earliest possible date that the conditions could be fulfilled without considering the probability of the conditions being met.
For example, if a structured note is automatically prepaid when an equity index exceeds a certain level, the cash outflow will be included in the less than three months period whatever the level of the index at the year end. The settlement date of debt securities in issue, issued by certain securitisation vehicles consolidated by the Group, depends on when cash flows are received from the securitised assets. Where these assets are prepayable, the timing of the cash outflow relating to securities assumes that each asset will be prepaid at the earliest possible date. As the repayment of assets and liabilities are linked, the repayment of assets in securitisations are shown on the earliest date that the asset can be prepaid as this is the basis used for liabilities.
Assets and liabilities with a contractual maturity of greater than 20twenty years – - the principal amounts of financial assets and liabilities that are repayable after 20twenty years or where the counterparty has no right to repayment of the principal are excluded from the table, as are interest payments after 20twenty years.
Held-for-trading assets and liabilities – held-for-trading assets and liabilities amounting to £1,226.8£665 billion (assets) and £1,146.7£586 billion (liabilities) (2007 – £678.6(2009 - £651 billion assets, £478.6£568 billion liabilities; 2008 - £1,227 billion assets, £1,147 billion liabilities) have been excluded from the table in view of their short-term nature.
This contractual analysis highlights the maturity transformation of the balance sheet that is fundamental to the structure of banking. In practice, this is not a reflection of the actual behaviour of assets or liabilities. In particular the customer funding of the balance sheet exhibits much greater stability and maturity than the tables indicate. This is because the funding franchise of the Group is diversified across an extensive retail network.82
Regulatory environment (audited)
The Group is subject to the FSA’s liquidity regime, whilst overseas subsidiaries and branches are subject to local regimes.
Sterling liquidity
The FSA requires the Group, on a consolidated basis, to maintain daily a minimum ratio of 100% between:
●Business reviewcontinued | a stock of qualifying high quality liquid assets (primarily UKBusiness review |
| Risk and EU government securities, treasury bills and cash held in branches); andbalance sheet management |
Balance sheet management: Interest rate risk
The banking book consists of interest bearing assets, liabilities and derivative instruments used to mitigate risks which are accounted for on an accrual basis, as well as non-interest bearing balance sheet items which are not subjected to fair value accounting.
The Group provides financial products to satisfy a variety of customer requirements. Loans and deposits are designed to meet customer objectives with regard to repricing frequency, tenor, index, prepayment, optionality and other features. These characteristics are aggregated to form portfolios of assets and liabilities with varying degrees of sensitivity to changes in market rates. Mismatches in these sensitivities give rise to net interest income (NII) volatility as the level of interest rates rise and fall. For example, a bank with a floating rate loan portfolio and largely fixed rate deposits will see its NII rise as interest rates rise and fall as rates decline. Due to the long-term nature of many banking book portfolios, layered repricing characteristics and maturities, it is likely the NII will vary from period to period even with no change in market rate level. New business volumes originated in any period will alter the interest rate sensitivity of a bank if it differs from portfolios originated in prior periods.
Interest rate risk in the banking book (IRRBB) is assessed using a set of standards to define, measure and report the market risk. It is the Group’s policy to minimise interest rate sensitivity in banking book portfolios and where interest rate risk is retained to ensure that appropriate measures and limits are applied. Key conventions in evaluating IRRBB are subjected to approval of divisional ALCOs and GALCO. Limits on IRRBB are proposed by the Group Treasurer for approval by ERF annually. IRRBB is measured using a version of the same VaR methodology that is used for the Group’s trading portfolios. Net interest income exposures are measured in terms of sensitivity over time to movements in interest rates. Additionally, Citizens measures the sensitivity of the market value of equity to changes in forward interest rates.
Divisions with the exception of Citizens and GBM are required to manage banking book exposures through internal transactions with Group Treasury to the greatest extent possible. Residual risks in divisions must be measured and reported as described.
Group Treasury aggregates exposures arising from its own external activities and positions transferred in from divisions. Where appropriate, Group Treasury nets offsetting risk exposures to determine a residual exposure to rate movements. Hedging transactions using cash and derivative instruments are executed to manage within the GALCO approved VaR limits.
Citizens and GBM manage their own IRRBB exposures within approved limits to satisfy their business objectives.
IRRBB VaR for the Group's retail and commercial banking activities at a 99% confidence level was as follows:
| | Average | Period end | Maximum | Minimum |
| | £m | £m | £m | £m |
| 2010 | 57.5 | 96.2 | 96.2 | 30.0 |
| 2009 | 85.5 | 101.3 | 123.2 | 53.3 |
| 2008 | 130.0 | 76.7 | 197.4 | 76.7 |
A breakdown of the Group's IRRBB VaR by currency is shown below.
| Currency | 2010 £m | 2009 £m | 2008 £m |
| EUR | 32.7 | 32.2 | 30.9 |
| GBP | 79.3 | 111.2 | 26.0 |
| USD | 120.6 | 42.1 | 57.9 |
| Other | 9.7 | 9.0 | 14.0 |
Key points
● | Interest rate exposure at 31 December 2010 was slightly lower than at the sum of: sterling wholesale net outflows contractually due within five working days (offset upend of 2009. The average exposure in 2010 was 33% below the average for 2009. |
| In general, actions taken throughout 2010 to a limit of 50%,mitigate earnings sensitivity from interest rate movements were executed in US dollars, hence the year on year shift in VaR by 85% of sterling certificates of deposit held which mature beyond five working days);currency. |
Business reviewcontinued | Business review |
| Risk and 5% of retail deposits with a residual contractual maturity of five working days or less. The FSA also sets an absolute minimum level for the stock of qualifying liquid assets that the Group is required to maintain each day.balance sheet management |
GivenBalance sheet management: Sensitivity of net interest income*
The Group seeks to mitigate the developmentseffect of prospective interest rate movements which could reduce future net interest income through the movement of market rates in 2008 the FSA has published new proposals for liquidity management (CP08/22) to replaceGroup’s retail and commercial businesses, whilst balancing the cost of such hedging activities on the current regulatory framework. net revenue stream. Hedging activities also consider the impact on market value sensitivity under stress.
The FSAfollowing table shows the sensitivity of net interest income over the next twelve months to an immediate up and down 100 basis points change to all interest rates. In addition the table includes a 100 basis points steepening and flattening of the yield curves over a one year horizon.
| | 2010 | 2009 | 2008 |
| | £m | £m | £m |
| +100bp shift in yield curves | 232 | 510 | 139 |
| - 100bp shift in yield curves | (352) | (687) | (234) |
| Steepener | (30) | | |
| Flattener | (22) | | |
Key points
| The Group executed transactions in 2010 to reduce the exposure to rising rates related to capital raised in December 2009. |
| Actions taken during the year increased the current base level of net interest income, while reducing the Group’s overall asset sensitivity. |
Structural foreign currency exposures
Structural foreign exchange exposures represent net investment in subsidiaries, associates and branches, the functional currencies of which are currencies other than sterling. The Group hedges structural foreign exchange exposures only in limited circumstances. The Group’s objective is proposing a major overhaulto ensure, where practical, that its consolidated capital ratios are largely protected from the effect of liquidity risk regulation that will include:changes in exchange rates.
The Group seeks to limit the sensitivity to its Core Tier 1 ratio to 20 basis points in a 10% rate shock scenario. The Group’s structural foreign exchange position is reviewed by GALCO regularly.
The table below sets out the Group's structural foreign exchange exposures.
| | Net assets of overseas operations | RFS Holdings minority interest | Net investments in foreign operations | Net investment hedges | Structural foreign currency exposures pre-economic hedges | Economic hedges (1) | Residual structural foreign currency exposures |
| 2010 | £m | £m | £m | £m | £m | £m | £m |
| US dollar | 17,137 | 2 | 17,135 | (1,820) | 15,315 | (4,058) | 11,257 |
| Euro | 8,443 | 33 | 8,410 | (578) | 7,832 | (2,305) | 5,527 |
| Other non-sterling | 5,320 | 244 | 5,076 | (4,135) | 941 | — | 941 |
| | 30,900 | 279 | 30,621 | (6,533) | 24,088 | (6,363) | 17,725 |
| | | | | | | | |
| 2009 | | | | | | | |
| US dollar | 15,589 | (2) | 15,591 | (3,846) | 11,745 | (5,696) | 6,049 |
| Euro | 21,900 | 13,938 | 7,962 | (2,351) | 5,611 | (3,522) | 2,089 |
| Other non-sterling | 5,706 | 511 | 5,195 | (4,001) | 1,194 | — | 1,194 |
| | 43,195 | 14,447 | 28,748 | (10,198) | 18,550 | (9,218) | 9,332 |
| | | | | | | | |
| 2008 | | | | | | | |
| US dollar | 17,480 | (19) | 17,499 | (3,659) | 13,840 | (7,806) | 6,034 |
| Euro | 26,943 | 15,431 | 11,512 | (7,461) | 4,051 | (4,109) | (58) |
| Chinese Renminbi | 3,928 | 1,898 | 2,030 | (1,082) | 948 | — | 948 |
| Brazilian Real | 5,088 | 621 | 4,467 | (3,096) | 1,371 | — | 1,371 |
| | 53,439 | 17,931 | 35,508 | (15,298) | 20,210 | (11,915) | 8,295 |
●(1) | Improved systemsThe economic hedges represent US dollar and controls including governance standards, pricing, intra day systemseuro preference shares in issue that are treated as equity under IFRS, and collateral management.do not qualify as hedges for accounting purposes. |
Key points
| Changes in foreign currency exchange rates will affect equity in proportion to the structural foreign currency exposure. A 5% strengthening in foreign currencies against sterling would result in a gain of £1,200 million (2009 - £930 million; 2008 - £1,010 million) recognised in equity, while a 5% weakening in foreign currencies would result in a loss of £1,150 million (2009 - £880 million; 2008 - £960 million) recognised in equity. |
| Structural foreign currency exposures have increased in sterling terms due to exchange rate movements and reduced hedging. The increased exposures more effectively offset retranslation movements in RWAs, reducing the sensitivity of the Group’s capital ratios to exchange rate movements. |
* unaudited
Business reviewcontinued | Business review |
| Risk and balance sheet management |
Balance sheet management: Equity risk
The Group holds equity positions in order to achieve strategic objectives, support venture capital transactions or in respect of customer restructuring arrangements. The Group is exposed to market risk on these banking book equity positions because they are measured at fair value. Fair values are based on available market prices wherever possible. In the event that market prices are not available, fair value is based on appropriate valuation techniques or management estimates.
The table below sets out the Group's banking book equity positions.
| | Listed | Unlisted | Total |
| 2010 | £m | £m | £m |
| Group | 535 | 2,080 | 2,615 |
| | | | |
| 2009 | | | |
| Group before RFS MI | 401 | 2,388 | 2,789 |
| RFS MI | 60 | 211 | 271 |
| Group | 461 | 2,599 | 3,060 |
| | | | |
| 2008 | | | |
| Group before RFS MI | 4,211 | 2,759 | 6,970 |
| RFS MI | 56 | 259 | 315 |
| Group | 4,267 | 3,018 | 7,285 |
●(1) | Individual liquid assessments that will include mandatory scenariosThe table above excludes equity exposures held-for-trading and an analysis of principal liquidity exposure factors.those held by insurance/assurance entities. |
● | Reporting standards improved both in scope and frequency by enhanced mismatch reporting. |
Outlook for 2011*
Whilst there have been improvements in the state of the global economy over the course of 2010, the outlook for 2011 remains uncertain. In line with meeting the objectives of the strategic plan, the Group is actively focusing on closing the customer funding gap, continuing to exit Non-Core businesses and reducing undrawn and contingent commitments. These actions will result in a reduction in the need for short-term wholesale funding; the Group is targeting £150 billion by 2013 compared with £157 billion at the end of 2010. The Group will continue to reduce reliance on government supported schemes and be governed by the state of the markets and economies in which it operates. These strategies are aimed at insuring that the Group is more resilient to any further disruptions in the market and better placed to take advantage of favourable trading conditions as they return.
* unaudited
Business reviewcontinued | Business review |
| Risk and balance sheet management |
Risk management: Credit risk
All the disclosures in this section (pages 86 to 105) are audited unless otherwise indicated by an asterisk (*).
Credit risk is the risk of financial loss owing to the failure of customers or counterparties to meet payment obligations. The quantum and nature of credit risk assumed across the Group's different businesses varies considerably, while the overall credit risk outcome usually exhibits a high degree of correlation to the macroeconomic environment.
Credit risk organisation
The existence of a strong credit risk management organisation is vital to support the ongoing profitability of the Group. The potential for loss through economic cycles is mitigated through the embedding of a robust credit risk culture within the business units and through a focus on the importance of sustainable lending practices. The role of the credit risk management organisation is to own the credit approval, concentration and risk appetite frameworks and to act as the ultimate authority for the approval of credit. This, together with strong independent oversight and challenge, enables the business to maintain a sound lending environment within risk appetite.
Responsibility for development of Group-wide policies, credit risk frameworks, Group-wide portfolio management and assessment of provision adequacy sits within the functional Group Credit Risk organisation (GCR) under the management of the Group Chief Credit Officer. Execution of these policies and frameworks is the responsibility of the risk management organisations located within the Group’s business divisions. These divisional credit risk functions work together with GCR to ensure that the Board’s expressed risk appetite is met within a clearly defined and managed control environment. Each credit risk function within the division is managed by a Chief Credit Officer who reports jointly to a divisional Chief Risk Officer and to the Group Chief Credit Officer. Divisional activities within credit risk include credit approval, transaction and portfolio analysis, early problem recognition and ongoing credit risk stewardship.
GCR is additionally responsible for verifying compliance by the divisions with all Group credit policies. It is assisted in this by a credit quality assurance function owned by the Group Chief Credit Officer and housed within the divisions.
Credit risk appetite
Credit risk appetite is managed and controlled through a series of frameworks designed to limit concentration by sector, counterparty, country or asset class. These are supported by a suite of Group-wide and divisional policies setting out the risk parameters within which business units may operate. Information on the Group’s credit portfolios is reported to the Board via the divisional and Group level risk committees detailed in the Governance section on page 60.
Product/asset class
| Retail : a formal risk appetite framework establishes Group-level statements and thresholds that are cascaded through all retail franchises in the Group and to granular business lines. These include measures that relate to both aggregate portfolios and to origination asset quality that are monitored frequently to ensure consistency with Group standards and appetite. This appetite setting and monitoring then informs the processes and parameters employed in origination activities that require a large volume of small scale credit decisions, typically involving an application for a new product or a change in facilities on an existing product. The majority of these decisions are based upon automated strategies utilising credit and behaviour scoring techniques. Scores and strategies are typically segmented by product, brand and other significant drivers of credit risk. These data driven strategies utilise a wide range of credit information relating to a customer including, where appropriate, information across customers’ holdings. A small number of credit decisions are subject to additional manual underwriting by authorised approvers in specialist units. These include higher value, more complex, small business and personal unsecured transactions and some residential mortgage applications. |
| Wholesale: formal policies, specialised tools and expertise, tailored monitoring and reporting and in certain cases specific limits and thresholds are deployed to address certain lines of business across the Group where the nature of credit risk incurred could represent a concentration or a specific/heightened risk in some other form. Such portfolios are subject to formal governance, including periodic review, at either Group or divisional level, depending on materiality. |
Sector
Across wholesale portfolios, exposures are assigned to, and reviewed in the context of, a defined set of industry sectors. Through this sector framework, appetite and portfolio strategies are agreed and set at aggregate and more granular levels where exposures have the potential to represent excessive concentration or where trends in both external factors and internal portfolio performance give cause for concern. Formal periodic reviews are undertaken at Group or divisional level depending on materiality; these may include an assessment of the Group’s franchise in a particular sector, an analysis of the outlook (including downside outcomes), identification of key vulnerabilities and stress/scenario tests. Specific reporting on trends in sector risk and on status versus agreed appetite and portfolio strategies is provided to senior management and to the Board.
Single name
Within wholesale portfolios, much of the activity undertaken by the credit risk function is organised around the assessment, approval and management of the credit risk associated with a borrower or group of related borrowers.
A formal single name concentration framework addresses the risk of outsized exposure to a borrower or borrower group. The framework includes specific and elevated approval requirements; additional reporting and monitoring; and the requirement to develop plans to address and reduce excess exposures over an appropriate timeframe.
Business reviewcontinued | Business review |
| Risk and balance sheet management |
Credit risk appetite continued
Credit approval authority is discharged by way of Contentsa framework of individual delegated authorities that requires at least two individuals to approve each credit decision, one from the business and one from the credit risk management function. Both parties must hold sufficient delegated authority under the Group-wide authority grid. Whilst both parties are accountable for the quality of each decision taken, the credit risk management approver holds ultimate sanctioning authority. The level of authority granted to individuals is dependent on their experience and expertise with only a small number of senior executives holding the highest authority provided under the framework. Daily monitoring of individual counterparty limits is undertaken.
At a minimum, credit relationships are reviewed and re-approved annually. The renewal process addresses: borrower performance, including reconfirmation or adjustment of risk parameter estimates; the adequacy of security; and compliance with terms and conditions. For certain counterparties, early warning indicators are also in place to detect deteriorating trends of concern in limit utilisation or account performance.
Single name concentrations
Reducing the risk arising from concentrations to single names remains a key focus of management attention. Notwithstanding continued market illiquidity and the impact of negative credit migration caused by the current economic environment, significant progress was made in 2010 and credit exposures in excess of single name concentration limits fell by over 40% during the year.
Country
Country risk arises from sovereign events (default or restructuring); economic events (contagion of sovereign default to other parts of the economy, cyclical economic shock); political events (convertibility restrictions and expropriation or nationalisation); and natural disaster or conflict. Such events have the potential to impact elements of the Group’s credit portfolio that are directly or indirectly linked to the affected country and can also give rise to market, liquidity, operational and franchise risk related losses.
The framework for the Group’s appetite for country risk is set by the Executive Risk Forum (ERF) in the form of limits by country risk grade, with sub-limits on medium-term exposure. Authority is delegated to the Group Country Risk Committee to manage exposures within the framework, with escalation where needed to ERF. Specific limits are set for individual countries based on a risk assessment taking into account the Group’s franchise and business mix in that country. Additional limitations (for example, on foreign-currency exposure and product types with higher potential for loss in case of country events) may be established to address specific vulnerabilities in the context of a country's outlook and/or the Group's business strategy in a particular country. A country watch list framework is in place to proactively monitor emerging issues and facilitate the development of mitigation strategies.
Global Restructuring Group
The Global Restructuring Group (GRG) manages problem and potential problem exposures in the Group's wholesale credit portfolios. Its primary
function is to actively manage the exposures to minimise loss for the Group and, where feasible, to return the exposure to the Group’s mainstream loan book.
Originating business units consult with GRG prior to transfer to GRG when a potentially negative event or trend emerges which might affect a customer’s ability to service its debt or increase the Group’s risk exposure to that customer. Such circumstances include deteriorating trading performance, likely breach of covenant, challenging macroeconomic conditions, a missed payment or the expectation of a missed payment to the Group or another creditor.
On transfer of the relationship, GRG devises a bespoke strategy that optimises recoveries from the debt. This strategy may also involve GRG reviewing the business operations and performance of the customer. A number of alternative approaches will typically be considered including:
| Covenant relief: the temporary waiver or recalibration of covenants may be granted to mitigate a potential or actual covenant breach. Such relief is usually granted in exchange for fees, increased margin, additional security, or a reduction in maturity profile of the original loan. |
| Amendment of restrictive covenants: restrictions in loan documents may be amended or waived as part of an overall remedial strategy to allow: additional indebtedness; the granting of collateral; the sale of a business; the granting of junior lien on the collateral; or other fundamental change in capital or operating structure of the enterprise. |
| Variation in margin: contractual margin may be amended to bolster the customer’s day-to-day liquidity, with the aim of helping to sustain the customer’s business as a going concern. This would normally be accompanied by the Group receiving an exit payment, payment in kind or deferred fee. |
| Payment holidays and loan rescheduling: payment holidays or changes to the contracted amortisation profile including extensions in contracted maturity or roll-overs may be granted to improve customer liquidity. Such concessions often depend on the expectation that liquidity will recover when market conditions improve or from capital raising initiatives that access alternative sources of liquidity. Recently, these types of concessions have become more common in commercial real estate transactions in situations when a shortage of market liquidity rules out immediate refinancing and short-term forced collateral sales unattractive. |
| Forgiveness of all or part of the outstanding debt: debt may be forgiven or exchanged for equity where a fundamental shift in the customer’s business or economic environment means that other forms of restructuring strategies are unlikely to succeed in isolation and the customer is incapable of servicing current debt obligations. Debt forgiveness is often an element in leveraged finance transactions which are typically structured on the basis of projected cash flows from operational activities rather than underlying tangible asset values. Maintaining the business as a going concern with a sustainable level of debt is the preferred option rather than realising the underlying assets, provided that the underlying business model and strategy are considered viable. |
Business reviewcontinued | Business review |
| Risk and balance sheet management |
Risk management: Credit risk continued
Global Restructuring Group continued
Depending on the case in question, GRG may employ a combination of these options in order to achieve the best outcome. It may also consider alternative approaches, either alone or together with the options listed above.
The following are generally considered as options of last resort:
| Enforcement of security or otherwise taking control of assets: where the Group holds underlying collateral or other security interest and is entitled to enforce its rights, it may take ownership or control of the assets. The Group’s preferred strategy is to consider other possible options prior to exercising these rights. |
| Insolvency: where there is no suitable restructuring option or the business is no longer regarded as sustainable, insolvency will be considered. Insolvency may be the only option that ensures that the assets of the business are properly and efficiently distributed to relevant creditors. |
As discussed above, GRG will consider a range of possible restructuring strategies. At the time of execution, the ultimate outcome of the strategy adopted is unknown and highly dependent on the cooperation of the borrower and the continued existence of a viable business. The customer’s financial position, its anticipated future prospects and the likely effect of the restructuring including any concessions are considered by the GRG relationship manager to establish whether an impairment provision is required, subject to divisional and Group governance.
During 2010, GRG completed corporate loan restructurings totalling £6.2 billion (exposures of more than £5 million) of which £2.7 billion were classified as impaired. Of these restructurings £2.4 billion related to commercial real estate and £2.1 billion to manufacturing. The incidence of the main types of arrangements is analysed below:
| | % of loans (by value) | |
| Term extensions | | | 54 | |
| Debt forgiveness | | | 25 | |
| Debt for equity | | | 23 | |
| Interest rate concessions and payment moratoriums | | | 36 | |
The total above exceeds 100% as an individual case can involve more than one type of arrangement.
Transfer of restructured loans to the performing book follows assessment by relationship managers in GRG. All cases are individually assessed; when no further losses are expected the loan is returned to performing status. Restructured loans that carry an impairment provision remain classified as impaired. Of the £3.5 billion of corporate loans that were transferred to the performing book with a concession during 2010, loans amounting to £1.8 billion had a negotiated margin increase as compensation for concessions granted.
Retail collections and recoveries
There are collections and recoveries functions in each of the consumer businesses. Their role is to provide support and assistance to customers who are currently experiencing difficulties in meeting their financial obligations. Where possible, the aim of the collections and recoveries teams is to return the customer to a satisfactory position, by working with them to restructure their finances. If this is not possible, the team has the objective of reducing the loss to the Group.
Forbearance*
The Group’s retail forbearance activities involve granting various contract revisions not normally available, such as reduced repayments, payment moratoriums and the roll up of arrears, principally to retail customers with secured lending that are experiencing temporary financial difficulties.
Loans are identified for forbearance primarily as a result of contact from the customer or payment arrears and it is only granted following an assessment of the customer’s ability to pay. For those loans that are classified as impaired, the Group’s objective is to minimise the loss on these accounts; for currently performing loans the aim is to enable the customer to continue to service the loan.
Forbearance lending for which an impairment loss provision has been recognised remains classified as non-performing. Where the customer met the loan terms prior to modification and where there is an expectation that the customer will meet the revised terms, these loans are classified as performing loans.
Retail loan forbearance arrangements during 2010 totalled £3.3 billion (residential mortgages £3.1 billion), of which £1.0 billion were classified as impaired. The incidence of the main types of retail forbearance is analysed below.
| | % of loans (by value) | |
| Reduced repayments | | | 59 | |
| Payment moratoriums | | | 20 | |
| Roll up of arrears | | | 19 | |
| Interest reductions | | | 6 | |
| Term extensions | | | 3 | |
The total exceeds 100% as an individual case can involve more than one type of arrangement.
Of the forbearance arrangements agreed in the performing book during 2010, less than 15% were impaired as at 31 December 2010.
* unaudited
Business reviewcontinued | Business review |
| Risk and balance sheet management |
Risk management: Credit risk continued
Credit risk mitigation*
The Group employs a number of structures and techniques to mitigate credit risk. Netting of debtor and creditor balances will be undertaken in accordance with relevant regulatory and internal policies; exposure on over-the-counter derivative and secured financing transactions is further mitigated by the exchange of financial collateral and documented on market standard terms. Further mitigation may be undertaken in a range of transactions, from retail mortgage lending to large wholesale financing, by structuring a security interest in a physical or financial asset; credit derivatives, including credit default swaps, credit linked debt instruments, and securitisation structures; and guarantees and similar instruments (for example, credit insurance) from related and third parties are used in the management of credit portfolios, typically to mitigate credit concentrations in relation to an individual obligor, a borrower group or a collection of related borrowers.
The use and approach to credit risk mitigation varies by product type, customer and business strategy. Minimum standards applied across the Group cover: general requirements, including acceptable credit risk mitigation types and any conditions or restrictions applicable to those mitigants; the means by which legal certainty is to be established, including required documentation and all necessary steps required to establish legal rights; acceptable methodologies for the initial and any subsequent valuations of collateral and the frequency with which they are to be revalued (for example, daily in the trading book); actions to be taken in the event the current value of mitigation falls below required levels; management of the risk of correlation between changes in the credit risk of the customer and the value of credit risk mitigation; management of concentration risks, for example, setting thresholds and controls on the acceptability of credit risk mitigants and on lines of business that are characterised by a specific collateral type or structure; and collateral management to ensure that credit risk mitigation remains legally effective and enforceable.
Credit risk measurement
Credit risk models are used throughout the Group to support the quantitative risk assessment element of the credit approval process, ongoing credit risk management, monitoring and reporting and portfolio analytics. Credit risk models used by the Group may be divided into three categories, as follows.
Probability of default/customer credit grade (PD)
These models assess the probability that a customer will fail to make full and timely repayment of their obligations. The probability of a customer failing to do so is measured over a one year period through the economic cycle, although certain retail scorecards use longer periods for business management purposes.
Wholesale businesses: as part of the credit assessment process, each counterparty is assigned an internal credit grade derived from a default probability. There are a number of different credit grading models in use across the Group, each of which considers risk characteristics particular to that type of customer. The credit grading models score a combination of quantitative inputs (for example, recent financial performance) and qualitative inputs, (for example, management performance or sector outlook).
Retail businesses: each customer account is separately scored using models based on the most material drivers of default. In general, scorecards are statistically derived using customer data. Customers are assigned a score, which in turn is mapped to a probability of default. The probabilities of default are used to group customers into risk pools. Pools are then assigned a weighted average probability of default using regulatory default definitions.
Exposure at default
Facility usage models estimate the expected level of utilisation of a credit facility at the time of a borrower’s default. For revolving and variable draw down type products which are not fully drawn, the exposure at default (EAD) will typically be higher than the current utilisation. The methodologies used in EAD modelling provide an estimate of potential exposure and recognise that customers may make more use of their existing credit facilities as they approach default.
Counterparty credit risk exposure measurement models are used for derivative and other traded instruments where the amount of credit risk exposure may be dependent upon one or more underlying market variables such as interest or foreign exchange rates. These models drive internal credit risk activities such as limit and excess management.
Loss given default
These models estimate the economic loss that may be experienced (the amount that cannot be recovered) by the Group on a credit facility in the event of default. The Group’s loss given default (LGD) models take into account both borrower and facility characteristics for unsecured or partially unsecured facilities, as well as the quality of any risk mitigation that may be in place for secured facilities, plus the cost of collections and a time discount factor for the delay in cash recovery.
* unaudited
Business reviewcontinued | Business review |
| Risk and balance sheet management |
Risk management: Credit risk continued
Credit risk assets*
Credit risk assets consist of:
| Lending: cash and balances at central banks and loans and advances to banks and customers (including overdraft facilities, instalment credit and finance leases); |
| Rate risk management (RRM); and |
| Contingent obligations, primarily letters of credit and guarantees. |
Reverse repurchase agreements and issuer risk (primarily debt securities - see page 116) are excluded. Where relevant, and unless otherwise stated, the data reflects the effect of credit mitigation techniques.
| Divisional analysis | | | 2010 £m | | | | 2009 £m | |
| UK Retail | | | 108,302 | | | | 103,029 | |
| UK Corporate | | | 105,886 | | | | 110,009 | |
| Wealth | | | 18,875 | | | | 16,553 | |
| Global Transaction Services | | | 35,462 | | | | 32,428 | |
| Ulster Bank | | | 40,750 | | | | 42,042 | |
| US Retail & Commercial | | | 51,699 | | | | 52,104 | |
| Retail & Commercial | | | 360,974 | | | | 356,165 | |
| Global Banking & Markets | | | 171,891 | | | | 205,588 | |
| Other | | | 36,659 | | | | 3,305 | |
| Core | | | 569,524 | | | | 565,058 | |
| Non-Core | | | 125,383 | | | | 158,499 | |
| | | | 694,907 | | | | 723,557 | |
Key points
| All Core divisions either broadly maintained or reduced credit risk assets over the period. The exception, ‘Other’, is driven by exposures in Group Treasury. Growth here has occurred within the highest asset quality bands reflecting exposure to central banks in US, UK and Germany. |
| Non-Core exposure reduced in line with targets during 2010 as a result of disposals and active run-down of assets. Key reductions include the country exits in Asia & Latin America, material reductions in the Leveraged Finance business through asset sales and restructurings and unwinding of trades within the Markets business. |
Credit risk assets: Asset quality*
Using the PD models described previously, customers are assigned credit grades and scores, which are used for internal management reporting across portfolios, including a Group level asset quality scale, as shown below.
Internal reporting and oversight of risk assets is principally differentiated by credit grades. Customers are assigned credit grades, based on various credit grading models that reflect the key drivers of default for the customer type. All credit grades across the Group map to both a Group level asset quality scale, used for external financial reporting, and a master grading scale for wholesale exposures used for internal management reporting across portfolios. Accordingly, measures of risk exposure may be readily aggregated and reported at increasing levels of granularity depending on stakeholder or business need.
| | | 2010 | | 2009 |
| Asset quality band | PD range | Core £m | Non-Core £m | Total £m | % of total | Core £m | Non-Core £m | Total £m | % of total |
| AQ1 | 0% - 0.034% | 175,793 | 17,728 | 193,521 | 27.8 | | 149,132 | 23,226 | 172,358 | 23.8 |
| AQ2 | 0.034% - 0.048% | 18,274 | 2,526 | 20,800 | 3.0 | | 18,029 | 3,187 | 21,216 | 2.9 |
| AQ3 | 0.048% - 0.095% | 26,244 | 4,259 | 30,503 | 4.4 | | 26,703 | 7,613 | 34,316 | 4.7 |
| AQ4 | 0.095% - 0.381% | 64,277 | 15,052 | 79,329 | 11.4 | | 78,144 | 18,154 | 96,298 | 13.3 |
| AQ5 | 0.381% - 1.076% | 90,639 | 18,767 | 109,406 | 15.7 | | 92,908 | 24,977 | 117,885 | 16.3 |
| AQ6 | 1.076% - 2.153% | 73,367 | 12,913 | 86,280 | 12.4 | | 76,206 | 18,072 | 94,278 | 13.0 |
| AQ7 | 2.153% - 6.089% | 41,399 | 10,451 | 51,850 | 7.5 | | 44,643 | 15,732 | 60,375 | 8.3 |
| AQ8 | 6.089% - 17.222% | 15,300 | 4,308 | 19,608 | 2.8 | | 18,923 | 4,834 | 23,757 | 3.4 |
| AQ9 | 17.222% - 100% | 11,398 | 8,621 | 20,019 | 2.9 | | 11,589 | 8,074 | 19,663 | 2.7 |
| AQ10 | 100% | 18,003 | 25,005 | 43,008 | 6.2 | | 16,756 | 22,666 | 39,422 | 5.5 |
Other (1) | | 34,830 | 5,753 | 40,583 | 5.9 | | 32,025 | 11,964 | 43,989 | 6.1 |
| | | 569,524 | 125,383 | 694,907 | 100.0 | | 565,058 | 158,499 | 723,557 | 100.0 |
Note:
| (1) | ‘Other’ largely comprises assets covered by the standardised approach for which a PD equivalent to those assigned to assets covered by the internal ratings based approach is not available. |
*unaudited
Business reviewcontinued | Business review |
| Risk and balance sheet management |
Risk management: Credit risk continued
Credit risk assets: Asset quality* continued
| | | | 2010 | | | | 2009 | |
AQ10 credit risk assets | | | AQ10 £m | | | | % of divisional credit risk assets | | | | AQ10 £m | | | | % of divisional credit risk assets | |
| UK Retail | | | 5,017 | | | | 4.6 | | | | 4,846 | | | | 4.7 | |
| UK Corporate | | | 5,130 | | | | 4.8 | | | | 5,604 | | | | 5.1 | |
| Wealth | | | 9 | | | | — | | | | 11 | | | | 0.1 | |
| Global Transaction Services | | | 349 | | | | 1.0 | | | | 242 | | | | 0.7 | |
| Ulster Bank | | | 4,348 | | | | 10.7 | | | | 2,741 | | | | 6.5 | |
| US Retail & Commercial | | | 599 | | | | 1.2 | | | | 506 | | | | 1.0 | |
| Retail & Commercial | | | 15,452 | | | | 4.3 | | | | 13,950 | | | | 3.9 | |
| Global Banking & Markets | | | 2,551 | | | | 1.5 | | | | 2,806 | | | | 1.4 | |
| Core | | | 18,003 | | | | 3.2 | | | | 16,756 | | | | 3.0 | |
| Non-Core | | | 25,005 | | | | 19.9 | | | | 22,666 | | | | 14.3 | |
| | | | 43,008 | | | | 6.2 | | | | 39,422 | | | | 5.5 | |
The table below provides a breakdown of AQ10 credit risk assets by sector.
| AQ10 credit risk assets | | | 2010 £m | | | | 2009 £m | |
| Personal | | | 7,620 | | | | 6,955 | |
| Property | | | 23,672 | | | | 20,145 | |
| Banks and financial institutions | | | 1,981 | | | | 1,928 | |
| Transport and storage | | | 1,689 | | | | 1,026 | |
| Other | | | 8,046 | | | | 9,368 | |
| | | | 43,008 | | | | 39,422 | |
Key points
| The Core divisions have generally seen an improvement in asset quality within the performing book during 2010 as the economic environment has slowly improved. |
| A notable exception is Ulster Bank where weakness in the Irish property sector continues to impact portfolio trends and the stock of defaulted assets (AQ10) continues to grow. Refer to section on Ulster Bank on pages 101 to 105 for more details. |
| Non-Core exposure has reduced across all AQ bands with the exception of AQ10, where the transfer of additional property assets from Ulster Bank and defaults within the property sector in Ireland and globally have led to an increase over 2009. Credit migration for the remaining Non-Core portfolio has been neutral since the end of the first quarter of 2010. |
| There have been no major changes in the specific sectors contributing to AQ10 band with property (55%) remaining the dominant contributor. |
* unaudited
Business reviewcontinued | Business review |
| Risk and balance sheet management |
Risk management: Credit risk continued
Credit risk assets* continued
Country risk
Under the Group's country risk framework, country exposures are actively managed both for countries that represent a larger concentration and for those which, under the country watch list process, have been identified as exhibiting signs of actual or potential stress.
The country risk tables below show credit risk assets exceeding £1 billion by borrowers domiciled in countries with an external rating of A+ and below from Standard & Poor’s, Moody’s or Fitch and selected eurozone countries. The numbers are stated gross of mitigating action which may have been taken to reduce or eliminate exposure to country risk events.
| | | Lending | | | | |
| | | Central and local government | | | Central bank | | | Other financial institutions | | | Corporate | | | Personal | | | Total | | | Core | | | Non-Core | | | RRM and contingent obligations | |
| 2010 | | | £m | | | | £m | | | | £m | | | | £m | | | | £m | | | | £m | | | | £m | | | | £m | | | | £m | |
| Republic of Ireland | | | 61 | | | | 2,119 | | | | 900 | | | | 19,881 | | | | 20,228 | | | | 43,189 | | | | 32,431 | | | | 10,758 | | | | 3,496 | |
| Italy | | | 45 | | | | 78 | | | | 1,086 | | | | 2,483 | | | | 27 | | | | 3,719 | | | | 1,817 | | | | 1,902 | | | | 2,312 | |
| India | | | 262 | | | | — | | | | 1,614 | | | | 2,590 | | | | 273 | | | | 4,739 | | | | 4,085 | | | | 654 | | | | 1,249 | |
| China | | | 17 | | | | 298 | | | | 1,240 | | | | 753 | | | | 64 | | | | 2,372 | | | | 2,136 | | | | 236 | | | | 1,572 | |
| Turkey | | | 282 | | | | 68 | | | | 485 | | | | 1,365 | | | | 12 | | | | 2,212 | | | | 1,520 | | | | 692 | | | | 547 | |
| South Korea | | | — | | | | 276 | | | | 1,039 | | | | 555 | | | | 2 | | | | 1,872 | | | | 1,822 | | | | 50 | | | | 643 | |
| Russia | | | — | | | | 110 | | | | 251 | | | | 1,181 | | | | 58 | | | | 1,600 | | | | 1,475 | | | | 125 | | | | 216 | |
| Mexico | | | — | | | | 8 | | | | 149 | | | | 999 | | | | 1 | | | | 1,157 | | | | 854 | | | | 303 | | | | 148 | |
| Brazil | | | — | | | | — | | | | 825 | | | | 315 | | | | 5 | | | | 1,145 | | | | 1,025 | | | | 120 | | | | 120 | |
| Romania | | | 36 | | | | 178 | | | | 42 | | | | 426 | | | | 446 | | | | 1,128 | | | | 7 | | | | 1,121 | | | | 142 | |
| Poland | | | — | | | | 168 | | | | 13 | | | | 655 | | | | 6 | | | | 842 | | | | 736 | | | | 106 | | | | 381 | |
| Portugal | | | 86 | | | | — | | | | 63 | | | | 611 | | | | 6 | | | | 766 | | | | 450 | | | | 316 | | | | 537 | |
| | | | | | | | | | | | | | | | | | | | | | | | | | | | | | | | | | | | | |
| Additional selected eurozone countries | | | | | | | | | | | | | | | | | | | | | | | | | | | | | | | | | |
| Spain | | | 19 | | | | 5 | | | | 258 | | | | 6,962 | | | | 407 | | | | 7,651 | | | | 3,130 | | | | 4,521 | | | | 2,447 | |
| Greece | | | 14 | | | | 36 | | | | 49 | | | | 188 | | | | 16 | | | | 303 | | | | 173 | | | | 130 | | | | 214 | |
| | | | | | | | | | | | | | | | | | | | | | | | | | | | | | | | | | | | | |
| 2009 | | | | | | | | | | | | | | | | | | | | | | | | | | | | | | | | | | | | |
| Republic of Ireland | | | 78 | | | | 1,830 | | | | 1,693 | | | | 21,518 | | | | 22,348 | | | | 47,467 | | | | 32,479 | | | | 14,988 | | | | 4,820 | |
| Italy | | | 10 | | | | 119 | | | | 751 | | | | 4,465 | | | | 27 | | | | 5,372 | | | | 1,877 | | | | 3,495 | | | | 2,146 | |
| India | | | — | | | | 109 | | | | 499 | | | | 2,752 | | | | 63 | | | | 3,423 | | | | 3,240 | | | | 183 | | | | 1,691 | |
| China | | | 50 | | | | 296 | | | | 780 | | | | 947 | | | | 42 | | | | 2,115 | | | | 1,845 | | | | 270 | | | | 425 | |
| Turkey | | | 255 | | | | 335 | | | | 207 | | | | 1,870 | | | | 10 | | | | 2,677 | | | | 1,918 | | | | 759 | | | | 274 | |
| South Korea | | | — | | | | 6 | | | | 903 | | | | 656 | | | | 1 | | | | 1,566 | | | | 1,467 | | | | 99 | | | | 1,458 | |
| Russia | | | — | | | | 58 | | | | 84 | | | | 1,578 | | | | 27 | | | | 1,747 | | | | 1,275 | | | | 472 | | | | 511 | |
| Mexico | | | 2 | | | | 45 | | | | 161 | | | | 1,262 | | | | 1 | | | | 1,471 | | | | 594 | | | | 877 | | | | 112 | |
| Brazil | | | — | | | | — | | | | 623 | | | | 420 | | | | 3 | | | | 1,046 | | | | 833 | | | | 213 | | | | 282 | |
| Romania | | | 49 | | | | 392 | | | | 46 | | | | 637 | | | | 507 | | | | 1,631 | | | | 37 | | | | 1,594 | | | | 169 | |
| Poland | | | — | | | | 22 | | | | 40 | | | | 1,038 | | | | 6 | | | | 1,106 | | | | 996 | | | | 110 | | | | 625 | |
| Portugal | | | — | | | | — | | | | 51 | | | | 861 | | | | 5 | | | | 917 | | | | 582 | | | | 335 | | | | 461 | |
| | | | | | | | | | | | | | | | | | | | | | | | | | | | | | | | | | | | | |
| Additional selected eurozone countries | | | | | | | | | | | | | | | | | | | | | | | | | | | | | | | | | |
| Spain | | | 30 | | | | 17 | | | | 373 | | | | 7,658 | | | | 438 | | | | 8,516 | | | | 2,957 | | | | 5,559 | | | | 2,325 | |
| Greece | | | 21 | | | | 37 | | | | 52 | | | | 290 | | | | 16 | | | | 416 | | | | 245 | | | | 171 | | | | 194 | |
*unaudited
Business reviewcontinued | Business review |
| Risk and balance sheet management |
Risk management: Credit risk continued
Credit risk assets* continued
Key points
| Credit risk assets relating to most of the countries above declined in 2010, reflecting active exposure management. In addition to the overall exposure reductions, granular portfolio reviews have been and continue to be undertaken with a view to adjusting the tenor profile and better alignment of the Group’s country risk appetite to the risk of adverse economic and political developments. |
| Reductions were seen in corporate and personal exposures, particularly in the Non-Core portfolios. This contrasted with increases in financial institutions in a number of countries, mostly due to increases in RRM exposure. Some countries in Asia have seen increased exposures during 2010, including two of the Group’s strategically important countries in this region, China and India, following reductions in 2008 and 2009. |
| The Group broadened its country risk framework in 2010, to capture advanced as well as emerging market countries. Cross-country assessments were conducted to identify portfolio vulnerabilities to a number of risk scenarios, including a eurozone sovereign debt crisis. Limit controls are being applied on a risk differentiated basis and selected exposure actions have been taken. Further scenario stress testing is continuing, and covers the potential for economic and political shocks in the eurozone and in the broader global environment. |
| For selected eurozone countries, the general trend in lending was lower, due in part to a depreciation of the euro against sterling by 3% over the year. |
| Republic of Ireland (ROI): lending fell by £4.3 billion in 2010, resulting from reductions in personal lending by £2.1 billion, central banks and other financial institutions by £0.5 billion and corporate clients by £1.6 billion. An increase was seen in Ulster Bank’s central bank exposure due to higher cash balances as part of its liquidity portfolio. The general trend in exposure remains downward. Divisional analysis is set out below: |
| | Ulster Bank represents more than 95% (£32 billion) of the Group’s Core lending to ROI and has seen a minimal increase of £0.64 billion in 2010, largely because of a rise of £0.3 billion in central bank placing due to increased cash holdings. Ulster Bank Core provisions at 31 December 2010 increased by 70% due to the continuing deterioration in the Irish economy. |
| | Non-Core lending to ROI (£10.8 billion) declined by £4.2 billion in 2010, mainly due to a reduction in exposure to corporate and financial institutions of £3 billion during the year. In addition, customer advances in Lombard Ireland decreased by 30% during the year to £0.9 billion. Overall default levels have continued to show signs of stabilisation. |
| | Global Banking & Markets (GBM) accounts for a further £0.6 billion of the Core lending exposure, largely relating to domestic and foreign owned financial institutions. In addition, overall limits to the major Irish domestic banks have halved since 31 December 2008 to £1.2 billion, with the majority representing collateralised RRM or guarantees for third-party obligations. Overall credit quality remains acceptable with a majority of the exposure to investment grade entities. |
| Spain: lending fell by £0.9 billion, due to a reduction in corporate activity. During the fourth quarter, this reduction accelerated. Non-Core represents 59% of the Group’s total exposure to Spain in 2010 (2009 - 65%). In the course of 2010, progress was made towards increased collateralisation of the portfolio. |
| Italy: lending decreased by £1.7 billion, as a result of a net reduction in corporate lending of £2.0 billion and an increase to financial institutions of £0.3 billion. In addition, there was an increase in RRM exposure to financial institutions by £0.7 billion; the non-lending portfolio is comprised predominantly of collateralised trading activity. |
| Portugal: lending decreased slightly by £0.1 billion related to reductions in corporate activity. Non-Core represents 41% of the total exposure; the structure of the exposure was enhanced through a shift to short-term and collateralised products to support the hedging needs of customers. |
| Greece: lending fell by £0.1 billion, due to a reduction in corporate activity. Continuous close scrutiny of the portfolio throughout the year and divestment of selected assets have improved the overall quality of the portfolio, available-for-sale (AFS) debt securities represent the primary concentration. |
| Total exposure to Egypt was £253 million at 31 December 2010, including lending of £124 million. The Group has minimal exposures to North African countries. |
* unaudited
Business reviewcontinued | Business review |
| Risk and balance sheet management |
Risk management: Credit risk continued
Credit risk assets* continued
Portfolio by industry and geography
Industry analysis plays an important part in assessing the potential for concentration risk in the loan portfolio. Particular attention is given to industry sectors where the Group believes there is a high degree of risk or potential for volatility in the future.
The table below analyses credit risk assets by industry sector and geography.
Industry sector (1) | | | | | | | | | | | | | | | | | | | | | | | | | | | |
2010 | | UK £m | | | Western Europe (excl. UK) £m | | | North America £m | | | Asia Pacific £m | | | Latin America £m | | | Other (2) £m | | | Total £m | | | Core £m | | | Non-Core £m | |
| Personal | | | 124,594 | | | | 22,661 | | | | 34,970 | | | | 1,864 | | | | 126 | | | | 843 | | | | 185,058 | | | | 174,287 | | | | 10,771 | |
| Banks | | | 6,819 | | | | 39,828 | | | | 5,098 | | | | 11,072 | | | | 1,394 | | | | 2,503 | | | | 66,714 | | | | 65,494 | | | | 1,220 | |
| Other financial institutions | | | 17,550 | | | | 14,986 | | | | 14,773 | | | | 4,200 | | | | 8,732 | | | | 1,557 | | | | 61,798 | | | | 47,227 | | | | 14,571 | |
Sovereign (3) | | | 20,209 | | | | 24,826 | | | | 18,088 | | | | 3,243 | | | | 125 | | | | 1,790 | | | | 68,281 | | | | 66,556 | | | | 1,725 | |
| Property | | | 66,015 | | | | 31,501 | | | | 9,857 | | | | 1,992 | | | | 3,090 | | | | 1,758 | | | | 114,213 | | | | 61,385 | | | | 52,828 | |
| Natural resources | | | 6,696 | | | | 7,863 | | | | 9,771 | | | | 3,655 | | | | 1,396 | | | | 4,143 | | | | 33,524 | | | | 24,427 | | | | 9,097 | |
| Manufacturing | | | 10,599 | | | | 8,529 | | | | 6,744 | | | | 2,673 | | | | 917 | | | | 2,062 | | | | 31,524 | | | | 28,088 | | | | 3,436 | |
Transport (4) | | | 13,842 | | | | 8,480 | | | | 5,389 | | | | 6,161 | | | | 2,658 | | | | 6,592 | | | | 43,122 | | | | 27,899 | | | | 15,223 | |
| Retail and leisure | | | 24,716 | | | | 6,663 | | | | 5,316 | | | | 1,438 | | | | 1,174 | | | | 945 | | | | 40,252 | | | | 34,100 | | | | 6,152 | |
| Telecommunication, media and technology | | | 5,495 | | | | 5,764 | | | | 3,283 | | | | 2,187 | | | | 328 | | | | 786 | | | | 17,843 | | | | 12,076 | | | | 5,767 | |
| Business services | | | 19,364 | | | | 4,536 | | | | 6,238 | | | | 973 | | | | 1,086 | | | | 381 | | | | 32,578 | | | | 27,985 | | | | 4,593 | |
| | | | 315,899 | | | | 175,637 | | | | 119,527 | | | | 39,458 | | | | 21,026 | | | | 23,360 | | | | 694,907 | | | | 569,524 | | | | 125,383 | |
| | | | | | | | | | | | | | | | | | | | | | | | | | | | | | | | | | | | | |
| 2009 | | | | | | | | | | | | | | | | | | | | | | | | | | | | | | | | | | | | |
| Personal | | | 120,193 | | | | 23,597 | | | | 37,680 | | | | 1,374 | | | | 63 | | | | 897 | | | | 183,804 | | | | 165,143 | | | | 18,661 | |
| Banks | | | 7,850 | | | | 36,705 | | | | 4,975 | | | | 9,121 | | | | 1,378 | | | | 2,137 | | | | 62,166 | | | | 58,246 | | | | 3,920 | |
| Other financial institutions | | | 14,800 | | | | 14,125 | | | | 17,697 | | | | 4,820 | | | | 8,441 | | | | 1,473 | | | | 61,356 | | | | 43,762 | | | | 17,594 | |
Sovereign (3) | | | 18,172 | | | | 27,421 | | | | 4,038 | | | | 3,950 | | | | 414 | | | | 2,217 | | | | 56,212 | | | | 53,595 | | | | 2,617 | |
| Property | | | 72,768 | | | | 35,558 | | | | 11,221 | | | | 3,507 | | | | 3,127 | | | | 1,440 | | | | 127,621 | | | | 74,892 | | | | 52,729 | |
| Natural resources | | | 7,876 | | | | 9,460 | | | | 9,817 | | | | 3,029 | | | | 3,523 | | | | 4,972 | | | | 38,677 | | | | 26,058 | | | | 12,619 | |
| Manufacturing | | | 11,197 | | | | 14,875 | | | | 8,718 | | | | 3,695 | | | | 1,306 | | | | 2,633 | | | | 42,424 | | | | 33,400 | | | | 9,024 | |
Transport (4) | | | 14,097 | | | | 7,033 | | | | 7,287 | | | | 5,294 | | | | 2,604 | | | | 7,140 | | | | 43,455 | | | | 28,362 | | | | 15,093 | |
| Retail and leisure | | | 25,811 | | | | 8,236 | | | | 6,148 | | | | 3,602 | | | | 1,205 | | | | 1,691 | | | | 46,693 | | | | 35,580 | | | | 11,113 | |
| Telecommunication, media and technology | | | 6,128 | | | | 8,340 | | | | 4,854 | | | | 2,040 | | | | 680 | | | | 1,409 | | | | 23,451 | | | | 13,645 | | | | 9,806 | |
| Business services | | | 20,497 | | | | 6,772 | | | | 6,950 | | | | 1,137 | | | | 1,439 | | | | 903 | | | | 37,698 | | | | 32,375 | | | | 5,323 | |
| | | | 319,389 | | | | 192,122 | | | | 119,385 | | | | 41,569 | | | | 24,180 | | | | 26,912 | | | | 723,557 | | | | 565,058 | | | | 158,499 | |
| | | | | | | | | | | | | | | | | | | | | | | | | | | | | | | | | | | | | |
| 2008 | | | | | | | | | | | | | | | | | | | | | | | | | | | | | | | | | | | | |
| Personal | | | 116,870 | | | | 25,802 | | | | 49,182 | | | | 2,918 | | | | 73 | | | | 1,609 | | | | 196,454 | | | | | | | | | |
| Banks | | | 11,030 | | | | 45,656 | | | | 12,179 | | | | 8,336 | | | | 1,693 | | | | 3,274 | | | | 82,168 | | | | | | | | | |
| Other financial institutions | | | 25,266 | | | | 17,481 | | | | 29,125 | | | | 5,836 | | | | 12,892 | | | | 1,979 | | | | 92,579 | | | | | | | | | |
Sovereign (3) | | | 4,755 | | | | 8,610 | | | | 3,396 | | | | 9,032 | | | | 459 | | | | 2,837 | | | | 29,089 | | | | | | | | | |
| Property | | | 78,689 | | | | 43,777 | | | | 13,530 | | | | 5,092 | | | | 3,750 | | | | 1,608 | | | | 146,446 | | | | | | | | | |
| Natural resources | | | 10,092 | | | | 20,469 | | | | 15,726 | | | | 4,366 | | | | 3,694 | | | | 8,907 | | | | 63,254 | | | | | | | | | |
| Manufacturing | | | 14,049 | | | | 22,416 | | | | 17,383 | | | | 5,041 | | | | 1,848 | | | | 4,427 | | | | 65,164 | | | | | | | | | |
Transport (4) | | | 16,447 | | | | 12,553 | | | | 9,320 | | | | 8,347 | | | | 3,545 | | | | 8,572 | | | | 58,784 | | | | | | | | | |
| Retail and leisure | | | 26,143 | | | | 11,047 | | | | 8,060 | | | | 1,655 | | | | 871 | | | | 1,106 | | | | 48,882 | | | | | | | | | |
| Telecommunication, media and technology | | | 7,483 | | | | 11,638 | | | | 12,264 | | | | 3,171 | | | | 1,145 | | | | 2,122 | | | | 37,823 | | | | | | | | | |
| Business services | | | 20,191 | | | | 4,863 | | | | 7,895 | | | | 667 | | | | 266 | | | | 351 | | | | 34,233 | | | | | | | | | |
| | | | 331,015 | | | | 224,312 | | | | 178,060 | | | | 54,461 | | | | 30,236 | | | | 36,792 | | | | 854,876 | | | | | | | | | |
| (1) | Based on new sector mappings which are aligned to the sector concentration framework. |
| (2) | ‘Other’ comprises Central and Eastern Europe, Middle East, Central Asia and Africa. |
| (3) | Sovereign includes central bank exposures. |
| (4) | Excludes net investment in operating leases in shipping and aviation portfolios as they are accounted for as property, plant and equipment; however, operating leases are included in the monitoring and management of these portfolios. |
*unaudited
Business reviewcontinued | Business review |
| Risk and balance sheet management |
Risk management: Credit risk continued
Credit risk assets* continued
Key points
| Exposure reductions occurred across most industry sectors and geographic regions. |
| Modest growth in North America is attributable to the weakening of sterling against the US dollar during the period and higher short-term exposures to central banks. |
| At 9.6% of total exposure, the banks sector is one of the largest in the Group, although it is geographically diversified with activities conducted in the Group's key markets across the world. Exposure is predominantly to major global banks (23% of sector exposure), defined as those with diversified domestic and international activities. The product range is diverse and includes loans and advances, treasury and capital markets products. Overall there has been a gradual downward trend in exposures to banks, but exposures have fluctuated markedly due to lines being drawn and repaid over short periods and mark to market movements associated with trading activity. Overall asset quality has stabilised in line with improving economic conditions, although the sovereign crisis affecting several eurozone countries has placed downward pressure on the asset quality of banks in these countries (11% of sector exposure). |
| Exposures to the non bank financial sector are dominated by traded products and spread across a wide range of financial institutions including insurance companies, securitisations, financial intermediaries, finance companies, unleveraged and leveraged funds (including hedge funds). The majority of these are domiciled in the UK, Western Europe and US with no other material geographic or sector concentrations and business is developed selectively. Asset quality has stabilised as the economic environment has improved. Exposures to defaulted entities totalled £1.8 billion, 3% of total exposure to this sector. |
| Sovereigns comprise activities with central governments, central banks and sub sovereigns such as local authorities in the Group's key markets in the UK, Western Europe and USA. The Group’s exposure to sovereigns fluctuates according to the Group's liquidity requirements and cash positions which determine the level of cash placed with sovereign entities. The asset quality of the portfolios has been impacted by the sovereign crisis in several eurozone countries and the resultant multiple downgrading of these countries. |
| The Group’s exposure to the property sector totals £114 billion, a reduction of 11% in the period, of which 76% is commercial real estate (further detail on pages 96 and 97). The remainder comprises lending to property-related sectors including housing associations, estate agents and management companies. The majority of property (with the exception of Non-Core) is within the UK Corporate division (33%) and Ulster Bank (6%). |
| Exposure to the manufacturing sector is concentrated in the industrial (40%), agriculture (24%) and food & consumer (21%) sub-sectors. The overall reduction in exposure of £10.9 billion is partly due to the run-off and restructuring of assets in Western Europe and in the Non-Core portfolio. Portfolio asset quality has held up well during the year but fluctuating commodity prices continue to pose a key risk to the more cyclical sub-sectors. Manufacturing exposure in default totals £1.5 billion (2009 - £3.7 billion). |
| The transport sector accounts for 6% of exposure and primarily comprises loans and advances to borrowers in the shipping, automotive and aviation segments in the Core bank. Aviation Capital and a portfolio of shipping loans are held within Non-Core. Core bank exposure resides primarily in Corporate Banking and Global Banking & Markets and the portfolio is well diversified geographically. In aggregate, the exposure within and asset quality of the Core portfolio remained stable over the year. Global economic conditions and related trends in trade flows and discretionary consumer spending continue to inform the Group’s cautious stance. Transport exposure in default totals of £1.7 billion (2009 - £1 billion). |
| Whilst there have been no material impairment charges for shipping to date, the exposure that is subject to a heightened level of monitoring currently stands at approximately £2.8 billion out of a total portfolio of £13 billion, which reflects the continued difficult market conditions that have been experienced during 2010. Recent quarterly vessel valuations undertaken by external shipbrokers show that the majority of our exposures remain fully secured. Conditions will remain challenging for the foreseeable future. |
* unaudited
Business reviewcontinued | Business review |
| Risk and balance sheet management |
Risk management: Credit risk continued
Credit risk assets* continued
Key credit portfolios
Commercial real estate
The definition of commercial real estate was revised during 2010 to include commercial investment properties, residential investment properties, commercial development properties and residential development properties (including house builders); 2009 data are presented on a consistent basis.
The commercial real estate lending portfolio totalled £87 billion at 31 December 2010, a 11% decrease over the prior year (2009 - £98 billion). The Non-Core portion of the portfolio totalled £46 billion (52% of the portfolio) in 2010 (2009 - £47 billion, or 48% of the portfolio) and includes exposures in Ulster Bank Group as discussed on page 105.
| | | 2010 | | | 2009 | |
| | Investment £m | | | Development £m | | | Total £m | | | Investment £m | | | Development £m | | | Total £m | |
| Core | | | | | | | | | | | | | | | | | | |
| UK Corporate | | | 24,879 | | | | 5,819 | | | | 30,698 | | | | 27,143 | | | | 7,331 | | | | 34,474 | |
| Ulster Bank | | | 4,284 | | | | 1,090 | | | | 5,374 | | | | 6,131 | | | | 3,838 | | | | 9,969 | |
| US Retail & Commercial | | | 3,061 | | | | 653 | | | | 3,714 | | | | 2,812 | | | | 1,084 | | | | 3,896 | |
| Global Banking & Markets | | | 1,131 | | | | 644 | | | | 1,775 | | | | 1,997 | | | | 818 | | | | 2,815 | |
| | | | 33,355 | | | | 8,206 | | | | 41,561 | | | | 38,083 | | | | 13,071 | | | | 51,154 | |
| | | | | | | | | | | | | | | | | | | | | | | | | |
Non-Core | | | | | | | | | | | | | | | | | | | | | | | | |
| UK Corporate | | | 7,591 | | | | 3,263 | | | | 10,854 | | | | 7,390 | | | | 3,959 | | | | 11,349 | |
| Ulster Bank | | | 3,854 | | | | 8,760 | | | | 12,614 | | | | 2,061 | | | | 6,271 | | | | 8,332 | |
| US Retail & Commercial | | | 1,202 | | | | 220 | | | | 1,422 | | | | 1,409 | | | | 431 | | | | 1,840 | |
| Global Banking & Markets | | | 20,502 | | | | 417 | | | | 20,919 | | | | 24,638 | | | | 873 | | | | 25,511 | |
| | | | 33,149 | | | | 12,660 | | | | 45,809 | | | | 35,498 | | | | 11,534 | | | | 47,032 | |
| | | | | | | | | | | | | | | | | | | | | | | | | |
| | | | 66,504 | | | | 20,866 | | | | 87,370 | | | | 73,581 | | | | 24,605 | | | | 98,186 | |
| | | 2010 | | 2009 | |
| | | Investment | | | Development | | | | | Investment | | | Development | | | | |
| | | Commercial | | | Residential | | | Commercial | | | Residential | | | Total | | Commercial | | | Residential | | | Commercial | | | Residential | | | Total | |
By geography (1) | | | £m | | | | £m | | | | £m | | | | £m | | | | £m | | | £m | | | | £m | | | | £m | | | | £m | | | | £m | |
| UK (excluding Northern Ireland) | | | 32,979 | | | | 7,255 | | | | 1,520 | | | | 8,296 | | | | 50,050 | | | 36,731 | | | | 7,042 | | | | 1,875 | | | | 10,155 | | | | 55,803 | |
| Island of Ireland | | | 5,056 | | | | 1,148 | | | | 2,785 | | | | 6,578 | | | | 15,567 | | | 5,384 | | | | 1,047 | | | | 3,484 | | | | 6,305 | | | | 16,220 | |
| Western Europe | | | 10,359 | | | | 707 | | | | 25 | | | | 46 | | | | 11,137 | | | 12,565 | | | | 840 | | | | 184 | | | | 225 | | | | 13,814 | |
| US | | | 6,010 | | | | 1,343 | | | | 542 | | | | 412 | | | | 8,307 | | | 6,522 | | | | 1,355 | | | | 881 | | | | 778 | | | | 9,536 | |
| RoW | | | 1,622 | | | | 25 | | | | 138 | | | | 524 | | | | 2,309 | | | 2,068 | | | | 27 | | | | 239 | | | | 479 | | | | 2,813 | |
| | | | 56,026 | | | | 10,478 | | | | 5,010 | | | | 15,856 | | | | 87,370 | | | 63,270 | | | | 10,311 | | | | 6,663 | | | | 17,942 | | | | 98,186 | |
| | | | | | | | | | | | | | | | | | | | | | | | | | | | | | | | | | | | | | | | |
| | | | 2010 | | | 2009 | |
| | | Investment | | | Development | | | | | | Investment | | | Development | | | | | |
| | | Core | | | Non-Core | | | Core | | | Non-Core | | | Total | | Core | | | Non-Core | | | Core | | | Non-Core | | | Total | |
| By geography (1) | | | £m | | | | £m | | | | £m | | | | £m | | | | £m | | | £m | | | | £m | | | | £m | | | | £m | | | | £m | |
| UK (excluding Northern Ireland) | | | 26,168 | | | | 14,066 | | | | 5,997 | | | | 3,819 | | | | 50,050 | | | 29,195 | | | | 14,578 | | | | 7,482 | | | | 4,548 | | | | 55,803 | |
| Island of Ireland | | | 3,159 | | | | 3,044 | | | | 963 | | | | 8,401 | | | | 15,567 | | | 4,699 | | | | 1,732 | | | | 3,702 | | | | 6,087 | | | | 16,220 | |
| Western Europe | | | 409 | | | | 10,657 | | | | 25 | | | | 46 | | | | 11,137 | | | 905 | | | | 12,500 | | | | 215 | | | | 194 | | | | 13,814 | |
| US | | | 3,375 | | | | 3,978 | | | | 733 | | | | 221 | | | | 8,307 | | | 3,193 | | | | 4,684 | | | | 1,289 | | | | 370 | | | | 9,536 | |
| RoW | | | 244 | | | | 1,404 | | | | 488 | | | | 173 | | | | 2,309 | | | 91 | | | | 2,004 | | | | 383 | | | | 335 | | | | 2,813 | |
| | | | 33,355 | | | | 33,149 | | | | 8,206 | | | | 12,660 | | | | 87,370 | | | 38,083 | | | | 35,498 | | | | 13,071 | | | | 11,534 | | | | 98,186 | |
| (1) | Excludes RRM and contingent obligations. |
Key points
| The decrease in exposure occurred primarily in the UK and Europe in the development and investment books. The asset mix remains relatively unchanged. |
| Commercial real estate will remain challenging for key markets, such as the UK, Republic of Ireland and US; new business will be accommodated within a reduced limit framework. |
| Liquidity in the market remains low with focus on refinancing and support for the existing client base. |
| The Ulster Bank Non-Core increase relative to 2009 reflects the swapping of the residual mortgage portfolio for the Commercial real estate portfolio with Ulster Bank Core in the third quarter of 2010. |
*unaudited
Business reviewcontinued | Business review |
| Risk and balance sheet management |
Risk management: Credit risk continued
Credit risk assets* continued
Key credit portfolios
Commercial real estate continued
| | | 2010 | | | 2009 | |
By sub-sector (1) | | UK (excl NI) £m | | | Island of Ireland £m | | | Western Europe £m | | | US £m | | | RoW £m | | | Total £m | | | UK (excl NI) £m | | | Island of Ireland £m | | | Western Europe £m | | | US £m | | | RoW £m | | | Total £m | |
| Residential | | | 15,551 | | | | 7,726 | | | | 753 | | | | 1,755 | | | | 549 | | | | 26,334 | | | | 17,197 | | | | 7,352 | | | | 1,065 | | | | 2,134 | | | | 505 | | | | 28,253 | |
| Office | | | 8,551 | | | | 1,402 | | | | 4,431 | | | | 1,311 | | | | 891 | | | | 16,586 | | | | 9,381 | | | | 1,536 | | | | 5,034 | | | | 1,614 | | | | 975 | | | | 18,540 | |
| Retail | | | 4,928 | | | | 674 | | | | 711 | | | | 529 | | | | 106 | | | | 6,948 | | | | 5,760 | | | | 686 | | | | 998 | | | | 492 | | | | 700 | | | | 8,636 | |
| Industrial | | | 10,413 | | | | 1,780 | | | | 3,309 | | | | 2,193 | | | | 284 | | | | 17,979 | | | | 11,378 | | | | 2,599 | | | | 3,592 | | | | 2,053 | | | | 402 | | | | 20,024 | |
| Mixed/Other | | | 10,607 | | | | 3,985 | | | | 1,933 | | | | 2,519 | | | | 479 | | | | 19,523 | | | | 12,087 | | | | 4,047 | | | | 3,125 | | | | 3,243 | | | | 231 | | | | 22,733 | |
| | | | 50,050 | | | | 15,567 | | | | 11,137 | | | | 8,307 | | | | 2,309 | | | | 87,370 | | | | 55,803 | | | | 16,220 | | | | 13,814 | | | | 9,536 | | | | 2,813 | | | | 98,186 | |
Maturity profile of portfolio (1) | | | 2010 £m | |
< 1 year(2) | | | 22,514 | |
| 1-2 years | | | 18,085 | |
| 2-3 years | | | 12,848 | |
| > 3 years | | | 33,923 | |
| | | 87,370 | |
| (1) | Excludes RRM and contingent obligations. |
| (2) | Includes on demand and past due assets. |
Key points
| Of the total portfolio at 31 December 2010, £45.5 billion (2009 - £58.1 billion) is managed normally with annual reviews, £9.2 billion (2009 - £17.9 billion) is receiving heightened credit oversight under the Group watchlist process (“watch”) and £32.6 billion (2009 - £22.2 billion) is managed within the GRG. |
| As at 31 December 2010, 55% of the Group’s credit risk assets rated AQ10 related to the property sector, up from 51% at 31 December 2009. Consistent with the trend seen in the total portfolio, the rate of migration to default slowed during the second half of 2010 in most portfolios. In Non-Core and Ulster Bank property remains the primary driver of growth in the defaulted loan book. |
| Short-term lending to property developers without firm long-term financing in place is characterised as speculative. Speculative lending at origination represents less than 2% of the portfolio. The Group’s appetite for originating speculative commercial real estate lending is very limited and any such business requires senior management approval. Current market conditions have resulted in some borrowers experiencing difficulty in finalising long-term finance arrangements. These borrowers are managed within the problem debt management process in “watch” or the GRG. |
| Tighter risk appetite criteria for new business origination have been implemented during the year but will take time to be reflected in the performance of the portfolio. Whilst there has been some recovery in the value of prime properties in the UK, the Group observes that it has been selective. To date this improvement has not fed through into lower quality properties in the UK and has not been evident in other regions, notably the eurozone, Republic of Ireland and the US. |
| The Group may agree maturity extensions, interest roll-ups and other remedial measures, as part of the Group’s early problem management framework for customers experiencing temporary financial difficulties. Excluding Ulster Bank Group, customers with loans totalling £0.6 billion (where exposures exceeded £10 million) benefited from such measures during 2010. Within GRG a restructured loan without an impairment provision is returned to the performing book once the revised terms are being met by the customer. During 2010, within GRG (excluding Ulster Bank Group), such activity for counterparties with exposures in excess of £5 million amounted to £0.3 billion. Refer to page 101 for a discussion on Ulster Bank Group. |
* unaudited
Business reviewcontinued | Business review |
| Risk and balance sheet management |
Risk management: Credit risk continued
Credit risk assets* continued
Key credit portfolios continued
Retail assets
The Group's retail lending portfolio includes mortgages, credit cards, unsecured loans, auto finance and overdrafts. The majority of personal lending exposures are in the UK, Ireland and the US. The analysis below includes both Core and Non-Core balances.
| | | | | | | | | | |
Personal credit risk assets (1) | | | 2010 £m | | | | 2009 £m | | | | 2008 £m | |
| UK Retail | | | | | | | | | | | | |
| - mortgages | | | 92,592 | | | | 85,529 | | | | 74,528 | |
| - cards, loans and overdrafts | | | 18,072 | | | | 20,316 | | | | 22,475 | |
| Ulster Bank | | | | | | | | | | | | |
| - mortgages | | | 21,162 | | | | 22,304 | | | | 24,531 | |
| - other personal | | | 1,017 | | | | 1,172 | | | | 1,350 | |
| Citizens | | | | | | | | | | | | |
| - mortgages | | | 24,575 | | | | 26,534 | | | | 34,394 | |
| - auto and cards | | | 6,062 | | | | 6,917 | | | | 9,126 | |
- other (2) | | | 3,455 | | | | 4,205 | | | | 5,286 | |
Other (3) | | | 18,123 | | | | 16,827 | | | | 24,764 | |
| | | | 185,058 | | | | 183,804 | | | | 196,454 | |
| (1) | Prior years have been revised to reflect improvements in data categorisation. |
| (2) | Mainly student loans and recreational vehicles/marine. |
| (3) | Personal exposures in other divisions. |
Refer to the section on Ulster Bank group on page 104 for discussion on Ulster Bank residential mortgages.
Residential mortgages
The table below details the distribution of residential mortgages by indexed LTV.
| | | | UK Retail | | | | Citizens | |
Distribution by average LTV (1) | | | 2010 % | | | | 2009 % | | | | 2008 % | | | | 2010 % | | | | 2009 (2) % | | | | 2008 % | |
| <= 50% | | | 38.5 | | | | 39.2 | | | | 46.1 | | | | 25.8 | | | | 26.4 | | | | 29.7 | |
| > 50% and <= 70% | | | 23.2 | | | | 21.0 | | | | 21.5 | | | | 17.3 | | | | 16.6 | | | | 19.7 | |
| > 70% and <= 90% | | | 26.2 | | | | 24.5 | | | | 19.7 | | | | 27.4 | | | | 26.3 | | | | 31.8 | |
| > 90% | | | 12.1 | | | | 15.3 | | | | 12.7 | | | | 29.5 | | | | 30.7 | | | | 18.8 | |
| | | | | | | | | | | | | | | | | | | | | | | | | |
| Total portfolio average LTV at 31 December | | | 58.2 | | | | 59.1 | | | | 54.5 | | | | 75.3 | | | | 74.5 | | | | 69.1 | |
| | | | | | | | | | | | | | | | | | | | | | | | | |
| Average LTV on new originations during the year | | | 64.2 | | | | 67.2 | | | | 67.2 | | | | 64.8 | | | | 62.6 | | | | 64.3 | |
| (1) | LTV averages are calculated by transaction volume. |
| (2) | Revised to reflect updated data and analysis completed after the reporting date. |
| (3) | Analysis covers the main mortgage brands in each of the Group’s three consumer markets and covers 96% of total mortgage portfolio. |
The table below details residential mortgages which are three months or more in arrears (by volume).
| | | 2010 | | | 2009 | | | 2008 | |
| | | % | | | % | | | % | |
UK Retail (1) | | | 1.7 | | | �� | 1.6 | | | | 1.3 | |
| Citizens | | | 1.4 | | | | 1.5 | | | | 0.9 | |
| (1) | Based on the 3+ months arrears rate for RBS and NatWest (81% of standard mortgages as at December 2010) together with the equivalent manually applied collections status flag for RBS/NatWest ‘Offset’ and other brand mortgages; in total 93% of total mortgage assets. The ‘One Account’ current account mortgage is excluded (£6.7 billion of assets - 7% of assets) of which 0.8% of accounts were 90 days continually in excess of the limit at 31 December 2010 (2009 - 0.6%). Consistent with the way the Council of Mortgage Lenders publishes member arrears information the 3+ month’s arrears rate now excludes accounts in repossession and cases with shortfalls post property sale; 2009 data have been revised accordingly. |
*unaudited
Business reviewcontinued | Business review |
| Risk and balance sheet management |
Risk management: Credit risk continued
Credit risk assets* continued
Key credit portfolios
Retail credit assets: UK residential mortgages continued
Key points
| The UK mortgage portfolio totalled £92.6 billion at 31 December 2010, an increase of 8% from 31 December 2009, due to continued strong sales growth and lower redemption rates in historical terms. Of the total portfolio, 98% is designated as Core business with the primary brands being the Royal Bank of Scotland, NatWest, the One Account and First Active (Non-Core is made up of Direct Line Mortgages). The assets comprise prime mortgage lending and include 6.8% (£6.2 billion) of exposure to residential buy-to-let at 31 December 2010. There is a small legacy self certification book (0.3% of total assets); which was withdrawn from sale in 2004. |
| Gross new mortgage lending in 2010 was strong at £15.9 billion. The average LTV for new business during 2010 was 64.2% compared with 67.2% in 2009. The maximum LTV available to new customers remains at 90%. Based on the Halifax House Price index as at September 2010, the book averaged indexed LTV has reduced to 58.2% at 31 December 2010 from 59.1% at 31 December 2009 influenced by favourable house price movements with the proportion of balances in negative equity at 31 December 2010 standing at 6.9% down from 10.9% at 31 December 2009. |
| The arrears rate (more than 3 payments in arrears, excluding repossessions and shortfalls post property sale) increased slightly to 1.7% at 31 December 2010 from 1.6% at 31 December 2009. After a period of deterioration the arrears rate has stabilised and has remained broadly stable since late 2009. The arrears rate on the buy-to-let portfolio was 1.3 % at 31 December 2010 (2009 - 1.4%). |
| The mortgage impairment charge was £183 million for the year ended 31 December 2010 compared to £129 million for 2009, with a proportion of the 2010 charge (approximately £70 million) being the result of adjustments reflecting reduced expectations of recovery on prior period defaulted debt and refinement of provision methodology. Underlying default trends improved throughout 2010 when compared with 2009. Provisions as a percentage of loans and receivables have increased to 0.37% at 31 December 2010 compared with 0.25% at 31 December 2009. Default and arrears rates remain sensitive to economic developments and are currently supported by the low interest rate environment and strong book growth with recent business yet to mature. |
| A number of initiatives aimed at supporting customers experiencing temporary financial difficulties remain in place. Forbearance activities include offering reduced or deferred payment terms on a temporary basis for a period of up to 12 months during which arrears continue to accrue on the account. Forbearance activities in the performing book amounted to £0.6 billion during 2010. It is Group policy not to initiate repossession proceedings for at least six months after arrears are evident. The number of properties repossessed in 2010 was 1,392 compared to 1,251 in 2009. |
Citizens real estate
Key points
| Citizens total residential real estate portfolio totalled $38.2 billion at 31 December 2010 (2009 - $42.5 billion). The real estate portfolio comprises $9.7 billion (Core: $8.6 billion; Non-Core: $1.1 billion) of first lien residential mortgages and $28.5 billion (Core: $23.7 billion; Non-Core: $4.8 billion) of home equity loans and lines (first and second lien). Home Equity Core consists of 46% first lien position while Non-Core consists of 97% second lien position. The Core business comprises 84% of the portfolio and Non-Core comprising 16%, with the serviced by others (SBO) portfolio being the largest component at 75% of the Non-Core portfolio. |
| Citizens continue to focus primarily on the ‘footprint states’ of New England, Mid-Atlantic and Mid-West targeting low risk products and maintaining conservative risk policies. Loan acceptance criteria were tightened during 2009 to address deteriorating economic and market conditions. As at 31 December 2010, the portfolio consisted of $31.5 billion (82% of the total portfolio) in these footprint states. |
| The SBO portfolio is part of Non-Core and consists of purchased pools of home equity loans and lines (96% second lien) with current LTV (105%) and geographic profiles (73% outside of Citizens footprint) leading to an annualised charge-off rate of 10.6% in 2010. The SBO book has been closed to new purchases since the third quarter of 2007 and is in run-off, with exposure down from $5.5 billion at 31 December 2009 to $4.5 billion at 31 December 2010. The arrears rate of the SBO portfolio decreased from 3.1% at 31 December 2009 to 2.7% at 31 December 2010 due to more effective account servicing and collections, following a service conversion in 2009. |
| The current weighted average LTV of the real estate portfolio increased slightly from 74.5% at 31 December 2009 to 75.3% at 31 December 2010, driven by a down turn in home prices. The current weighted average LTV of the real estate portfolio excluding SBO is 70.0%. |
| The arrears rate decreased slightly from 1.5% at 31 December 2009 to 1.4% at 31 December 2010. Delinquency rates have stabilised in recent months for both residential mortgages and home equity loans and lines. Citizens’ participates in the US Government Home Affordable Modification Program (HAMP) alongside other bank sponsored initiatives. Under HAMP, any borrower requesting a modification must be first reviewed to see if they meet the criteria of this programme. If the borrower does not qualify for HAMP, then they are reviewed for internal modification programmes. The HAMP programme is available only for first lien loans to owner-occupied. All second lien home equity lines and loans are modified using internal programmes. |
| The cumulative effect of these arrangements has helped the Group’s customers. Modified loan balances were $566 million at 31 December 2010 (2009 - $235 million). |
* unaudited
Business reviewcontinued | Business review |
| Risk and balance sheet management |
Risk management: Credit risk continued
Credit risk assets* continued
Key credit portfolios continued
Retail credit assets: Personal lending
The Group's personal lending portfolio includes credit cards, unsecured loans, auto finance and overdrafts. The majority of personal lending exposures exist in the UK and the US. New defaults as a proportion of average loans and receivables are shown in the following table.
| | | 2010 | | | 2009 | | | 2008 | |
| | | Average loans and receivables £m | | | Impairment charge as a % of loans and receivables % | | | Average loans and receivables £m | | | Impairment charge as a % of loans and receivables % | | | Average loans and receivables £m | | | Impairment charge as a % of loans and receivables % | |
| Personal lending |
UK Retail cards (1) | | | 6,025 | | | | 5.0 | | | | 6,101 | | | | 8.7 | | | | 6,617 | | | | 6.4 | |
UK Retail loans (1) | | | 9,863 | | | | 4.8 | | | | 12,062 | | | | 5.9 | | | | 13,545 | | | | 3.3 | |
| | | | | | | | | | | | | | | | | | | | | | | | | |
| | | | $m | | | % | | | | $m | | | % | | | | $m | | | % | |
Citizens cards (2,3) | | | 1,555 | | | | 9.9 | | | | 1,772 | | | | 9.7 | | | | 2,275 | | | | 4.9 | |
Citizens auto loans (2) | | | 8,133 | | | | 0.6 | | | | 9,759 | | | | 1.2 | | | | 11,386 | | | | 1.1 | |
| (1) | The ratio for UK Retail assets refers to the impairment charges for the year. |
| (2) | The ratio for Citizens refers to charge-offs in the year, net of recoveries realised in the year. |
| (3) | The 2009 data have been revised to exclude the Kroger Personal Finance portfolio, which was sold in 2010. |
Key points
| The UK personal lending portfolio, of which 98% is in Core businesses, comprises credit cards, unsecured loans and overdrafts and totalled £18.1 billion at 31 December 2010 (2009 - £20.3 billion), a decrease of 11% due to continued subdued loan recruitment activity and a continuing general market trend of customers repaying unsecured loan balances with cards and current account balances remaining stable. The Non-Core portfolio consists of the direct finance loan portfolios (Direct Line, Lombard, Mint and Churchill), and totalled £0.45 billion at 31 December 2010 (2009 - £0.7 billion). |
| Risk appetite continues to be actively managed across all products. Support continues for customers experiencing financial difficulties through “breathing space initiatives” on all unsecured products, whereby a thirty day period is given to allow customers to establish a debt repayment plan. During this time the Group suspends collection activity. A further extension of thirty days can be granted if progress is made and discussions are continuing. Investment in collection and recovery processes continues, addressing both continued support for the Group’s customers and the management of impairments. |
| Benefiting from a combination of risk appetite tightening and a more favourable economic environment, impairment losses on unsecured lending have reduced significantly during 2010 from £1,603 million at 31 December 2009 to £991 million at 31 December 2010 with the downward trajectory moderating significantly in the latter part of the year. Impairments will remain sensitive to the external environment. |
| Industry benchmarks for cards arrears remain stable, with the Group continuing to perform favourably. |
| Outstanding balances for the Citizens credit card portfolio totalled $1.53 billion at 31 December 2010. This figure excludes the Kroger Personal Finance portfolio, which was sold on 27 May 2010. Core assets comprised 86.3% of the portfolio. |
| The Citizens cards business has traditionally adopted conservative risk strategies compared to the US market as a whole. Given the economic climate, Citizens has over the past 24 months introduced tighter lending criteria and lower credit limits. These actions have led to improving new business quality and a business performing on par with industry benchmarks (provided by VISA). The latest available metrics show the rate for 60+ days delinquency as a percentage of total outstanding balances at 3.17% in December 2010 (compared to an industry figure of 3.22%) and net contractual charge-offs as a percentage of total outstanding balances at 4.76% in December 2010 (compared to an industry figure of 5.67%). We expect further improvement based on early delinquency trends. |
| Citizens is a leading regional provider of retail auto financing to US consumers through a network of 3,433 auto dealers located in 23 US states. Citizens maintain a conservative, prime indirect auto lending credit programme with loss rates that have historically been below national averages. Current outstanding retail auto loan balances totalled $7.9 billion (includes Core and Non-Core) at 31 December 2010 of which 96% of the portfolio is in the Core business. The $324 million of Non-Core auto assets are anticipated to run-off by 2013. The tightening of credit parameters in 2008-09, along with enhanced collection activities and seasonal factors, has resulted in improved credit performance. The net charge-off rate on the total auto portfolio fell to 0.34% at 31 December 2010, down from 1.3% at 31 December 2009. The 30+ DPD delinquency rate fell from 2.6% as of 31 December 2009 to 1.6% at 31 December 2010 even as balances fell by $917 million. The 1.7% 30+ DPD delinquency rate on the total auto loan portfolio at 30 September 2010 Citizens was favourable to the 2.6% nationwide bank indirect auto delinquency rate as reported by Experian. |
*unaudited
Business reviewcontinued | Business review |
| Risk and balance sheet management |
Risk management: Credit risk continued
Ulster Bank Group (Core and Non-Core)*
Ulster Bank Group accounts for 8% of the Group’s total credit risk assets or 7% of the Group’s Core credit risk assets. The Irish economy has experienced severe economic headwinds resulting in a substantial rise in unemployment and a steep property value correction over the last two years. Ulster Bank Group has not been immune to the downturn which has resulted in a significant migration of credit quality to lower grades and a substantial increase in loan impairments. Ulster Bank Group’s commercial real estate and mortgage portfolios have been acutely affected and these account for 81% of the 2010 impairment charges (2009 - 75%).
Core
Impairment charges increased by £512 million at 31 December 2009 to £1,161 million at 31 December 2010, reflecting the deteriorating economic environment in Ireland with rising default levels across both personal and corporate portfolios. Lower asset values, particularly property related, together with pressure on borrowers with a dependence on consumer spending have resulted in higher corporate loan losses while higher unemployment, lower incomes and increased taxation have driven mortgage impairment increases. Ulster Bank Group is helping customers in this difficult environment. Forbearance policies which are deployed through the 'Flex' initiative are aimed at assisting customers in financial difficulty. These policies have been reviewed in 2010 given the structural problem that exist in Ireland with the scale and duration of customers in financial difficulty. The industry definition in the Republic of Ireland of an unsustainable mortgage (18 months accumulated interest) has been used to underpin the policy which will improve identification of customers where forbearance may not be appropriate. The forbearance portfolios account for 5.8% (7,383 mortgages) of the Ulster Bank Group mortgage portfolio (by value) at 31 December 2010 with 75% of these customers (by value) in amortising or interest only agreements.
Non-Core
Impairment charges increased from £1,277 million at 31 December 2009 to £2,682 million at 31 December 2010, reflecting the deteriorating economic environment in Ireland with rising default levels across the portfolio. Lower asset values, in property related lending and most specifically in development lending have resulted in higher corporate loan losses.
In the third quarter of 2010, £6.1 billion of residential mortgages and some corporate exposures were transferred from Non-Core to Core; at the same time £5 billion of commercial real estate loans were transferred from Core to Non-Core.
Credit risk assets by industry and geography
Credit risk assets include £51 billion and £3 billion of lending to customers and financial institutions respectively, with the remaining exposure company RRM and contingent obligations.
| | | Republic of Ireland | | | UK | | | Other | | | Total | |
Industry sector (1) | | Core | | | Non- Core | | | Total | | | Core | | | Non- Core | | | Total | | | Core | | | Non- Core | | | Total | | | Core | | | Non- Core | | | Total | |
| | | £m | | | | £m | | | | £m | | | | £m | | | | £m | | | | £m | | | | £m | | | | £m | | | | £m | | | | £m | | | | £m | | | | £m | |
2010 | | | | | | | | | | | | | | | | | | | | | | | | | | | | | | | | | | | | | | | | | | | | | | | | |
| Personal | | | 20,064 | | | | 120 | | | | 20,184 | | | | 2,730 | | | | 22 | | | | 2,752 | | | | 5 | | | | — | | | | 5 | | | | 22,799 | | | | 142 | | | | 22,941 | |
| Banks | | | 107 | | | | — | | | | 107 | | | | 3 | | | | — | | | | 3 | | | | 14 | | | | — | | | | 14 | | | | 124 | | | | — | | | | 124 | |
Non-banks and financial institutions | | | 167 | | | | 88 | | | | 255 | | | | 46 | | | | 24 | | | | 70 | | | | 4 | | | | — | | | | 4 | | | | 217 | | | | 112 | | | | 329 | |
Sovereign (2) | | | 2,174 | | | | — | | | | 2,174 | | | | 672 | | | | — | | | | 672 | | | | — | | | | — | | | | — | | | | 2,846 | | | | — | | | | 2,846 | |
| Property | | | 3,609 | | | | 8,431 | | | | 12,040 | | | | 2,704 | | | | 4,281 | | | | 6,985 | | | | 305 | | | | 770 | | | | 1,075 | | | | 6,618 | | | | 13,482 | | | | 20,100 | |
| Retail and leisure | | | 1,923 | | | | 608 | | | | 2,531 | | | | 795 | | | | 75 | | | | 870 | | | | 108 | | | | — | | | | 108 | | | | 2,826 | | | | 683 | | | | 3,509 | |
| Other Corporate | | | 4,033 | | | | 338 | | | | 4,371 | | | | 1,089 | | | | 88 | | | | 1,177 | | | | 198 | | | | — | | | | 198 | | | | 5,320 | | | | 426 | | | | 5,746 | |
| | | | 32,077 | | | | 9,585 | | | | 41,662 | | | | 8,039 | | | | 4,490 | | | | 12,529 | | | | 634 | | | | 770 | | | | 1,404 | | | | 40,750 | | | | 14,845 | | | | 55,595 | |
| 2009 | | | | | | | | | | | | | | | | | | | | | | | | | | | | | | | | | | | | | | | | | | | | | | | | |
| Personal | | | 16,008 | | | | 6,302 | | | | 22,310 | | | | 2,782 | | | | 24 | | | | 2,806 | | | | 4 | | | | — | | | | 4 | | | | 18,794 | | | | 6,326 | | | | 25,120 | |
| Banks | | | 99 | | | | — | | | | 99 | | | | 4 | | | | — | | | | 4 | | | | 28 | | | | — | | | | 28 | | | | 131 | | | | — | | | | 131 | |
Non-banks and financial institutions | | | 190 | | | | 19 | | | | 209 | | | | 170 | | | | 16 | | | | 186 | | | | 3 | | | | — | | | | 3 | | | | 363 | | | | 35 | | | | 398 | |
Sovereign (2) | | | 1,909 | | | | — | | | | 1,909 | | | | 347 | | | | — | | | | 347 | | | | — | | | | — | | | | — | | | | 2,256 | | | | — | | | | 2,256 | |
| Property | | | 6,686 | | | | 5,852 | | | | 12,538 | | | | 4,540 | | | | 2,635 | | | | 7,175 | | | | 759 | | | | 413 | | | | 1,172 | | | | 11,985 | | | | 8,900 | | | | 20,885 | |
| Retail and leisure | | | 2,638 | | | | 288 | | | | 2,926 | | | | 579 | | | | 22 | | | | 601 | | | | 126 | | | | — | | | | 126 | | | | 3,343 | | | | 310 | | | | 3,653 | |
| Other Corporate | | | 4,145 | | | | 228 | | | | 4,373 | | | | 894 | | | | 72 | | | | 966 | | | | 131 | | | | — | | | | 131 | | | | 5,170 | | | | 300 | | | | 5,470 | |
| | | | 31,675 | | | | 12,689 | | | | 44,364 | | | | 9,316 | | | | 2,769 | | | | 12,085 | | | | 1,051 | | | | 413 | | | | 1,464 | | | | 42,042 | | | | 15,871 | | | | 57,913 | |
Notes:
| (1) | In the third quarter of 2010, £6.1 billion of residential mortgages and some corporate exposures were transferred from Non-Core; at the same time £5 billion of commercial real estate loans were transferred from Core to Non-Core. |
| (2) | Includes central bank exposures. |
* unaudited
Business reviewcontinued | Business review |
| Risk and balance sheet management |
Risk management: Credit risk continued
Ulster Bank Group (Core and Non-Core)*continued
Risk elements in lending and impairments by sector
| | | Gross loans (1) | | | REIL | | | Provisions | | | REIL as a % of gross loans | | | Provisions as a % of REIL | | | Provisions as a % of gross loans | | | Impairment charge | | | Amounts written-off | |
| 2010 | | | £m | | | | £m | | | | £m | | | % | | | % | | | % | | | | £m | | | | £m | |
| Ulster Bank Group | | | | | | | | | | | | | | | | | | | | | | | | | | | | | |
| Mortgages | | | 21,162 | | | | 1,566 | | | | 439 | | | | 7.4 | | | | 28.0 | | | | 2.1 | | | | 336 | | | | 7 | |
| Personal unsecured | | | 1,282 | | | | 185 | | | | 158 | | | | 14.4 | | | | 85.4 | | | | 12.3 | | | | 48 | | | | 30 | |
| Commercial real estate | | | | | | | | | | | | | | | | | | | | | | | | | | | | | | | | |
| - investment | | | 8,138 | | | | 2,989 | | | | 1,332 | | | | 36.7 | | | | 44.6 | | | | 16.4 | | | | 889 | | | | — | |
| - development | | | 9,850 | | | | 6,406 | | | | 2,820 | | | | 65.0 | | | | 44.0 | | | | 28.6 | | | | 1,875 | | | | — | |
| Other corporate | | | 11,009 | | | | 2,515 | | | | 1,228 | | | | 22.8 | | | | 48.8 | | | | 11.2 | | | | 695 | | | | 11 | |
| | | | 51,441 | | | | 13,661 | | | | 5,977 | | | | 26.6 | | | | 43.8 | | | | 11.6 | | | | 3,843 | | | | 48 | |
| Core | | | | | | | | | | | | | | | | | | | | | | | | | | | | | | | | |
| Mortgages | | | 21,162 | | | | 1,566 | | | | 439 | | | | 7.4 | | | | 28.0 | | | | 2.1 | | | | 294 | | | | 7 | |
| Personal unsecured | | | 1,282 | | | | 185 | | | | 158 | | | | 14.4 | | | | 85.4 | | | | 12.3 | | | | 48 | | | | 30 | |
| Commercial real estate | | | | | | | | | | | | | | | | | | | | | | | | | | | | | | | | |
| - investment | | | 4,284 | | | | 598 | | | | 332 | | | | 14.0 | | | | 55.5 | | | | 7.7 | | | | 259 | | | | — | |
| - development | | | 1,090 | | | | 65 | | | | 37 | | | | 6.0 | | | | 56.9 | | | | 3.4 | | | | 116 | | | | — | |
| Other corporate | | | 9,039 | | | | 1,205 | | | | 667 | | | | 13.3 | | | | 55.4 | | | | 7.4 | | | | 444 | | | | 11 | |
| | | | 36,857 | | | | 3,619 | | | | 1,633 | | | | 9.8 | | | | 45.1 | | | | 4.4 | | | | 1,161 | | | | 48 | |
| Non-Core | | | | | | | | | | | | | | | | | | | | | | | | | | | | | | | | |
| Mortgages | | | — | | | | — | | | | — | | | | — | | | | — | | | | — | | | | 42 | | | | — | |
| Commercial real estate | | | | | | | | | | | | | | | | | | | | | | | | | | | | | | | | |
| - investment | | | 3,854 | | | | 2,391 | | | | 1,000 | | | | 62.0 | | | | 41.8 | | | | 25.9 | | | | 630 | | | | — | |
| - development | | | 8,760 | | | | 6,341 | | | | 2,783 | | | | 72.4 | | | | 43.9 | | | | 31.8 | | | | 1,759 | | | | — | |
| Other corporate | | | 1,970 | | | | 1,310 | | | | 561 | | | | 66.5 | | | | 42.8 | | | | 28.5 | | | | 251 | | | | — | |
| | | | 14,584 | | | | 10,042 | | | | 4,344 | | | | 68.9 | | | | 43.3 | | | | 29.8 | | | | 2,682 | | | | — | |
*unaudited
Business reviewcontinued | Business review |
| Risk and balance sheet management |
Risk management: Credit risk continued
Ulster Bank Group (Core and Non-Core)*continued
| | | Gross loans (1) | | | REIL | | | Provisions | | | REIL as a % of gross loans | | | Provisions as a % of REIL | | | Provisions as a % of gross loans | | | Impairment charge | | | Amounts written-off | |
| 2009 | | | £m | | | | £m | | | | £m | | | % | | | % | | | % | | | | £m | | | | £m | |
| Ulster Bank Group | | | | | | | | | | | | | | | | | | | | | | | | | | | | | |
| Mortgages | | | 22,201 | | | | 882 | | | | 153 | | | | 4.0 | | | | 17.3 | | | | 0.7 | | | | 116 | | | | 3 | |
| Personal unsecured | | | 2,433 | | | | 174 | | | | 145 | | | | 7.2 | | | | 83.3 | | | | 6.0 | | | | 66 | | | | 27 | |
| Commercial real estate | | | | | | | | | | | | | | | | | | | | | | | | | | | | | | | | |
| - investment | | | 8,192 | | | | 1,748 | | | | 413 | | | | 21.3 | | | | 23.6 | | | | 5.0 | | | | 370 | | | | — | |
| - development | | | 10,109 | | | | 4,268 | | | | 1,106 | | | | 42.2 | | | | 25.9 | | | | 10.9 | | | | 953 | | | | 4 | |
| Other corporate | | | 12,479 | | | | 1,976 | | | | 648 | | | | 15.8 | | | | 32.8 | | | | 5.2 | | | | 421 | | | | — | |
| | | | 55,414 | | | | 9,048 | | | | 2,465 | | | | 16.3 | | | | 27.2 | | | | 4.4 | | | | 1,926 | | | | 34 | |
| Core | | | | | | | | | | | | | | | | | | | | | | | | | | | | | | | | |
| Mortgages | | | 16,199 | | | | 558 | | | | 102 | | | | 3.4 | | | | 18.3 | | | | 0.6 | | | | 74 | | | | 3 | |
| Personal unsecured | | | 2,433 | | | | 174 | | | | 145 | | | | 7.2 | | | | 83.3 | | | | 6.0 | | | | 66 | | | | 27 | |
| Commercial real estate | | | | | | | | | | | | | | | | | | | | | | | | | | | | | | | | |
| - investment | | | 6,131 | | | | 250 | | | | 105 | | | | 4.1 | | | | 42.0 | | | | 1.7 | | | | 84 | | | | — | |
| - development | | | 3,838 | | | | 428 | | | | 284 | | | | 11.2 | | | | 66.4 | | | | 7.4 | | | | 221 | | | | 4 | |
| Other corporate | | | 11,106 | | | | 850 | | | | 326 | | | | 7.7 | | | | 38.4 | | | | 2.9 | | | | 204 | | | | — | |
| | | | 39,707 | | | | 2,260 | | | | 962 | | | | 5.7 | | | | 42.6 | | | | 2.4 | | | | 649 | | | | 34 | |
| Non-Core | | | | | | | | | | | | | | | | | | | | | | | | | | | | | | | | |
| Mortgages | | | 6,002 | | | | 324 | | | | 51 | | | | 5.4 | | | | 15.7 | | | | 0.8 | | | | 42 | | | | — | |
| Commercial real estate | | | | | | | | | | | | | | | | | | | | | | | | | | | | | | | | |
| - investment | | | 2,061 | | | | 1,498 | | | | 308 | | | | 72.7 | | | | 20.6 | | | | 14.9 | | | | 286 | | | | — | |
| - development | | | 6,271 | | | | 3,840 | | | | 822 | | | | 61.2 | | | | 21.4 | | | | 13.1 | | | | 732 | | | | — | |
| Other corporate | | | 1,373 | | | | 1,126 | | | | 322 | | | | 82.0 | | | | 28.6 | | | | 23.5 | | | | 217 | | | | — | |
| | | | 15,707 | | | | 6,788 | | | | 1,503 | | | | 43.2 | | | | 22.1 | | | | 9.6 | | | | 1,277 | | | | — | |
Key points
| Increases in REIL reflect difficult conditions in both commercial and residential sectors in the Republic of Ireland. Of the REIL at 31 December 2010, 74% was in Non-Core. |
| Provisions increased from £2.5 billion to £6.0 billion and the coverage ratio increased to 44% from 27% at 31 December 2009. 69% of the provision at 31 December 2010 related to commercial real estate. |
* unaudited
Business reviewcontinued | Business review |
| Risk and balance sheet management |
Risk management: Credit risk continued
Ulster Bank Group (Core and Non-Core)*continued
Residential mortgages
The table below shows how the steep value correction has affected the distribution of residential mortgages by loan-to-value (LTV) (indexed). LTV is based upon gross loan amounts and, whilst including defaulted loans, does not account for impairments already taken.
By average LTV (1) | | 2010 % | | | 2009 % | | | 2008 % | |
| <= 50% | | | 35.9 | | | | 40.7 | | | | 47.1 | |
| > 50% and <= 70% | | | 13.5 | | | | 15.2 | | | | 17.1 | |
| > 70% and <= 90% | | | 13.5 | | | | 15.5 | | | | 18.2 | |
| > 90% | | | 37.1 | | | | 28.6 | | | | 17.6 | |
| | | | | | | | | | | | | |
| Total portfolio average LTV at 31 December | | | 71.2 | | | | 62.5 | | | | 54.3 | |
| | | | | | | | | | | | | |
| Average LTV on new originations during the year | | | 75.9 | | | | 72.8 | | | | 71.1 | |
| (1) | LTV averages calculated by transaction volume. |
Key points
| The residential mortgage portfolio across Ulster Bank Group totalled £21.2 billion at 31 December 2010; with 90% in the Republic of Ireland and 10% in Northern Ireland. The portfolio size has declined by 4% in the Republic of Ireland since 31 December 2009 with Northern Ireland increasing by 12% over the same period. New business originations continue to be very low, especially in the Republic of Ireland. In 2010, 3,557 new mortgages were originated of which, 92% were in Northern Ireland. |
| The arrears rate continues to increase due to the continued challenging economic environment. At 31 December 2010, the arrears rate was 6.0%, compared to 3.3% at 31 December 2009. As a result, the impairment charge for 2010 was £336 million compared with £116 million for 2009. Repossessions totalled 76 in 2010, compared with 96 in 2009; 75% of the repossessions were voluntary. |
| Ulster Bank Group has a number of initiatives in place aimed at increasing the level of support to customers experiencing temporary financial difficulties. At 31 December 2010, forbearance arrangements had been agreed in respect of 5.8% (£1.2 billion) of Ulster Bank Group’s residential mortgage portfolio. The majority (79%) relates to customers in the performing book. Loans in respect of which forbearance arrangements were agreed during 2010 amounted to £1.7 billion in the performing book and £0.5 billion in the impaired book. |
*unaudited
Business reviewcontinued | Business review |
| Risk and balance sheet management |
Risk management: Credit risk continued
Ulster Bank Group (Core and Non-Core)*continued
Commercial real estate
The Commercial real estate lending portfolio for Ulster Bank Group totalled £18 billion at 31 December 2010 and decreased by 2% during the year. The Non-Core portion of the portfolio totalled £12.6 billion (70% of the portfolio). Of the total Ulster commercial real estate portfolio, 24% is in Northern Ireland, 63% is in the Republic of Ireland and 13% is in the UK.
The definition of commercial real estate was revised during 2010 to include commercial investment properties, residential investment properties, commercial development properties and residential development properties which include house builders.
| | | Development | | | Investment | | | | |
| | | Commercial £m | | | Residential £m | | | Commercial £m | | | Residential £m | | | Total £m | |
| Exposure by geography |
| 2010 | | | | | | | | | | | | | | | |
| Island of Ireland | | | 2,785 | | | | 6,578 | | | | 5,072 | | | | 1,098 | | | | 15,533 | |
| UK (excluding Northern Ireland) | | | 110 | | | | 359 | | | | 1,831 | | | | 115 | | | | 2,415 | |
| Other | | | — | | | | 17 | | | | 22 | | | | 1 | | | | 40 | |
| | | | 2,895 | | | | 6,954 | | | | 6,925 | | | | 1,214 | | | | 17,988 | |
| | | | | | | | | | | | | | | | | | | | | |
| 2009 | | | | | | | | | | | | | | | | | | | | |
| Island of Ireland | | | 3,404 | | | | 6,305 | | | | 5,453 | | | | 1,047 | | | | 16,209 | |
| UK (excluding Northern Ireland) | | | 240 | | | | 153 | | | | 1,586 | | | | 83 | | | | 2,062 | |
| Other | | | — | | | | 7 | | | | 1 | | | | 22 | | | | 30 | |
| | | | 3,644 | | | | 6,465 | | | | 7,040 | | | | 1,152 | | | | 18,301 | |
Property remains the primary driver of growth in the defaulted loan book for Ulster Bank Group. The outlook remains challenging with limited liquidity in the marketplace to support refinancing. The decrease in asset valuations has placed pressure on the portfolio with more clients seeking renegotiation of terms in the context of granting structural enhancements.
Within its early problem management framework, Ulster Bank Group may agree various remedial measures with customers in the performing book that are experiencing temporary financial difficulties. During 2010, customers with loans amounting to £0.4 billion (exposures greater than £5 million) benefited from such measures. During 2010, impaired loans amounting to £2.1 billion (exposures greater than £5 million) were restructured and remain in the non-performing book.
* unaudited
Business reviewcontinued | Business review |
| Risk and balance sheet management |
Risk management: Credit risk continued
Balance sheet analysis
All the disclosures in this section (pages 106 to 120) are audited unless otherwise indicated by an asterisk (*).
The following tables provide an analysis of financial assets by industry sector, geography and internal credit quality gradings. Credit risk assets analysed on the preceding pages are reported internally to senior management, however they exclude certain exposures, primarily debt securities, and take account of legal agreements, including master netting arrangements that provide a right of legal set-off but do not meet the criteria for offset in IFRS. The analysis below is therefore provided to supplement the credit risk assets analysis and to reconcile to the consolidated balance sheet.
Industry and geographical analysis
The tables below and on pages 107 to 113 analyse total financial assets gross of provisions by industry sector (for Group before RFS MI) and geography (for Group before RFS MI and RFS MI).
Industry analysis
The table below analyses total financial assets by industry.
| | Loans and advances | | | | | | Netting and offset (2) |
| | Core | Non-Core | Total | Securities | Derivatives | Other (1) | Total | |
| 2010 | £m | £m | £m | £m | £m | £m | £m | | £m |
| Total | | | | | | | | | |
| Central and local government | 7,426 | 1,671 | 9,097 | 130,890 | 7,560 | 291 | 147,838 | | 3,916 |
| Finance - banks | 99,583 | 1,024 | 100,607 | — | — | — | 100,607 | | — |
- other (3) | 97,967 | 7,891 | 105,858 | 95,954 | 399,318 | 12,185 | 613,315 | | 403,387 |
| Residential mortgages | 140,359 | 6,142 | 146,501 | 808 | 6 | — | 147,315 | | 14 |
| Personal lending | 33,581 | 3,891 | 37,472 | 63 | 15 | 48 | 37,598 | | 11 |
| Property | 42,455 | 47,651 | 90,106 | 2,937 | 3,830 | 28 | 96,901 | | 1,041 |
| Construction | 8,680 | 3,352 | 12,032 | 87 | 780 | — | 12,899 | | 1,392 |
| Manufacturing | 26,186 | 6,520 | 32,706 | 897 | 3,229 | — | 36,832 | | 2,156 |
| Service industries and business activities | 95,252 | 22,384 | 117,636 | 8,077 | 12,285 | 388 | 138,386 | | 6,400 |
| Agriculture, forestry and fishing | 3,758 | 135 | 3,893 | 29 | 40 | — | 3,962 | | 94 |
| Finance lease and instalment credit | 8,320 | 8,530 | 16,850 | 15 | 14 | — | 16,879 | | 134 |
| Interest accruals | 921 | 279 | 1,200 | 1,398 | — | — | 2,598 | | — |
| Total gross of provisions | 564,488 | 109,470 | 673,958 | 241,155 | 427,077 | 12,940 | 1,355,130 | | 418,545 |
| Provisions | | | (18,182) | (1,477) | — | (29) | (19,688) | | n/a |
| Group before RFS MI | | | 655,776 | 239,678 | 427,077 | 12,911 | 1,335,442 | | 418,545 |
| RFS MI gross of provisions | | | 2 | — | — | — | 2 | | — |
| Group | | | 655,778 | 239,678 | 427,077 | 12,911 | 1,335,444 | | 418,545 |
| | | | | | | | | | |
| Comprising: | | | | | | | | | |
| Repurchase agreements | | | | | | | | | 10,712 |
| Derivative balances | | | | | | | | | 361,493 |
| Derivative collateral | | | | | | | | | 31,015 |
| Other | | | | | | | | | 15,325 |
| | | | | | | | | | 418,545 |
For notes to this table refer to page 113.
Business reviewcontinued | Business review |
| Risk and balance sheet management |
Risk management: Credit risk continued
Balance sheet analysis: Industry and geography analysis continued
| | Loans and advances | | | | | Netting and offset (2) |
| | Core | Non-Core | Total | Securities | Derivatives | Other (1) | Total |
| 2009 | £m | £m | £m | £m | £m | £m | £m | £m |
| Total | | | | | | | | |
| Central and local government | 6,388 | 1,532 | 7,920 | 142,812 | 6,998 | 205 | 157,935 | 1,725 |
| Finance - banks | 81,695 | 1,937 | 83,632 | — | — | — | 83,632 | — |
- other (3) | 88,617 | 11,957 | 100,574 | 99,284 | 409,452 | 12,110 | 621,420 | 372,343 |
| Residential mortgages | 127,975 | 12,932 | 140,907 | 717 | 11 | — | 141,635 | 7 |
| Personal lending | 35,313 | 6,358 | 41,671 | 1 | 38 | 40 | 41,750 | 21 |
| Property | 49,054 | 50,372 | 99,426 | 4,497 | 4,184 | 108 | 108,215 | 1,114 |
| Construction | 9,502 | 5,258 | 14,760 | 615 | 923 | 63 | 16,361 | 1,450 |
| Manufacturing | 30,454 | 14,402 | 44,856 | 1,954 | 5,353 | 116 | 52,279 | 3,184 |
| Service industries and business activities | 100,729 | 33,662 | 134,391 | 14,519 | 11,180 | 794 | 160,884 | 5,811 |
| Agriculture, forestry and fishing | 3,726 | 553 | 4,279 | 254 | 44 | 9 | 4,586 | 76 |
| Finance lease and instalment credit | 8,147 | 11,956 | 20,103 | 306 | 16 | — | 20,425 | 39 |
| Interest accruals | 1,667 | 555 | 2,222 | 1,571 | — | — | 3,793 | — |
| Total gross of provisions | 543,267 | 151,474 | 694,741 | 266,530 | 438,199 | 13,445 | 1,412,915 | 385,770 |
| Provisions | | | (15,173) | (1,475) | — | — | (16,648) | n/a |
| Group before RFS MI | | | 679,568 | 265,055 | 438,199 | 13,445 | 1,396,267 | 385,770 |
| RFS MI gross of provisions | | | 142,688 | 21,730 | 3,255 | 9 | 167,682 | 55 |
| RFS MI provision | | | (2,110) | (3) | — | — | (2,113) | n/a |
| Group | | | 820,146 | 286,782 | 441,454 | 13,454 | 1,561,836 | 385,825 |
| | Loans and advances | Securities | Derivatives | Other (1) | Total | Netting and offset (2) |
| |
| 2008 | £m | £m | £m | £m | £m | £m |
| Total | | | | | | |
| Central and local government | 15,497 | 100,099 | 6,382 | 197 | 122,175 | 1,987 |
| Finance - banks | 127,287 | — | — | — | 127,287 | — |
- other (3) | 139,083 | 146,869 | 938,819 | 16,026 | 1,240,797 | 836,404 |
| Residential mortgages | 139,391 | 29 | 18 | — | 139,438 | 52 |
| Personal lending | 51,070 | 278 | 60 | 25 | 51,433 | 34 |
| Property | 103,276 | 2,494 | 5,586 | 71 | 111,427 | 1,067 |
| Construction | 20,250 | 213 | 984 | 32 | 21,479 | 1,488 |
| Manufacturing | 71,165 | 1,413 | 14,159 | 308 | 87,045 | 6,498 |
| Service industries and business activities | 169,844 | 22,764 | 25,417 | 2,463 | 220,488 | 10,918 |
| Agriculture, forestry and fishing | 4,628 | 144 | 45 | 16 | 4,833 | 87 |
| Finance lease and instalment credit | 22,355 | 23 | 25 | — | 22,403 | 119 |
| Interest accruals | 6,369 | 1,241 | — | — | 7,610 | — |
| Total gross of provisions | 870,215 | 275,567 | 991,495 | 19,138 | 2,156,415 | 858,654 |
| Provisions | (9,451) | (210) | — | — | (9,661) | n/a |
| Group before RFS MI | 860,764 | 275,357 | 991,495 | 19,138 | 2,146,754 | 858,654 |
| RFS MI gross of provisions | 153,720 | 18,522 | 1,064 | 20 | 173,326 | 14 |
| RFS MI provision | (1,565) | — | — | — | (1,565) | n/a |
| Group | 1,012,919 | 293,879 | 992,559 | 19,158 | 2,318,515 | 858,668 |
For notes to this table refer to page 113.
Business reviewcontinued | Business review |
| Risk and balance sheet management |
Risk management: Credit risk continued
Balance sheet analysis: Industry and geography analysis continued
Loans and advances to banks and customers by geography
The table below analyses loans and advances gross of provisions by geography (location of office).
| | 2010 | 2009 | 2008 |
| | £m | £m | £m |
Loans and advances to banks (1) | | | |
| - UK | 70,400 | 59,348 | 106,913 |
| - US | 9,810 | 8,537 | 5,830 |
| - Europe | 10,655 | 5,535 | 7,670 |
| - RoW | 9,778 | 10,611 | 9,213 |
| Group before RFS MI | 100,643 | 84,031 | 129,626 |
| RFS MI | 2 | 7,879 | 8,698 |
| | 100,645 | 91,910 | 138,324 |
| | | | |
| Loans and advances to customers | | | |
| - UK | 374,822 | 386,798 | 431,302 |
| - US | 90,752 | 93,209 | 125,786 |
| - Europe | 83,586 | 102,571 | 135,524 |
| - RoW | 24,155 | 28,132 | 47,977 |
| Group before RFS MI | 573,315 | 610,710 | 740,589 |
| RFS MI | — | 134,809 | 145,022 |
| | 573,315 | 745,519 | 885,611 |
| | | | |
| Group before RFS MI | 673,958 | 694,741 | 870,215 |
| RFS MI | 2 | 142,688 | 153,720 |
| Group | 673,960 | 837,429 | 1,023,935 |
Note:
| (1) | Loans and advances to banks includes £36 million of accrued interest (2009 - £399 million; 2008 - £2,339 million). |
Key points
| · | Residential mortgages increased by £6 billion during 2010 with increases in UK Retail, reflecting continued strong sales growth and lower redemption rates, partially offset by reduced lending in both Ulster Bank and US Retail & Commercial (US R&C) reflecting low new business originations and tightened loan acceptance criteria respectively. |
| · | Reduction in unsecured lending reflects subdued recruitment activity and the continuing market trend of repaying unsecured loans in UK Retail and lower personal auto loans in US R&C. |
| · | The Group’s loans and advances to property and construction sectors reduced by £12 billion, primarily in the UK and Europe in both development and investment portfolios. Underlying Non-Core property loans declined by £7.7 billion during the year. This was partly offset by a transfer of £5.0 billion in development property loans as part of Ulster Banks strategic decision to cease early stage development property lending. |
| · | Exposure to the manufacturing sector is concentrated in industrial agriculture and food & consumer subsectors. The overall reduction in exposure in the year was partly due to the run off and restructuring of assets in Europe and in the Non Core portfolio. |
| · | Service industries and business activities comprise transport, retail & leisure, telecommunications, media and technology and business services. Transport primarily comprises loans to borrowers in the shipping, automotive and aviation segments. Aviation capital and a portfolio of shipping loans are held within Non-Core. Core portfolios in UK Corporate and GBM are well diversified geographically. Global economic conditions and related trends in trade flows and discretionary consumer spending continue to inform the Group’s cautious stance.* |
| · | Shipping continued to experience difficult market conditions in 2010. Whilst there have been no material shipping impairments to date, the exposures subject to a heightened level of monitoring currently stand at £2.8 billion (out of a total portfolio of £13 billion). Recent quarterly vessel valuations undertaken by external shipbrokers show that the majority of the Group’s exposures remain fully secured. Conditions are expected to remain challenging for the foreseeable future.* |
*unaudited
Business reviewcontinued | Business review |
| Risk and balance sheet management |
Risk management: Credit risk continued
Balance sheet analysis: Industry and geography analysis continued
The tables below and on pages 109 to 113 analyse financial assets by geography (location of office) and industry.
| | Loans and advances | | | | | Netting and offset (2) |
| | Core | Non-Core | Total | Securities | Derivatives | Other (1) | Total |
| 2010 | £m | £m | £m | £m | £m | £m | £m | £m |
| UK | | | | | | | | |
| Central and local government | 6,339 | 173 | 6,512 | 72,428 | 7,300 | 173 | 86,413 | 3,916 |
| Finance - banks | 69,911 | 481 | 70,392 | — | — | — | 70,392 | — |
- other (3) | 61,180 | 6,024 | 67,204 | 51,015 | 249,324 | 5,390 | 372,933 | 256,949 |
| Residential mortgages | 99,928 | 1,665 | 101,593 | 748 | 6 | — | 102,347 | 14 |
| Personal lending | 23,035 | 585 | 23,620 | 1 | 9 | 23 | 23,653 | 11 |
| Property | 34,970 | 30,492 | 65,462 | 2,477 | 3,739 | 28 | 71,706 | 1,041 |
| Construction | 7,041 | 2,310 | 9,351 | 39 | 741 | — | 10,131 | 1,392 |
| Manufacturing | 12,689 | 1,510 | 14,199 | 354 | 2,159 | — | 16,712 | 2,150 |
| Service industries and business activities | 58,265 | 11,742 | 70,007 | 2,993 | 7,940 | 337 | 81,277 | 6,306 |
| Agriculture, forestry and fishing | 2,872 | 67 | 2,939 | — | 35 | — | 2,974 | 94 |
| Finance lease and instalment credit | 5,589 | 7,785 | 13,374 | 15 | 14 | — | 13,403 | 134 |
| Interest accruals | 471 | 98 | 569 | 501 | — | — | 1,070 | — |
| Group | 382,290 | 62,932 | 445,222 | 130,571 | 271,267 | 5,951 | 853,011 | 272,007 |
| | | | | | | | | |
| US | | | | | | | | |
| Central and local government | 263 | 53 | 316 | 25,741 | 5 | 112 | 26,174 | — |
| Finance - banks | 9,798 | 12 | 9,810 | — | — | — | 9,810 | — |
- other (3) | 25,306 | 826 | 26,132 | 23,975 | 121,717 | 4,950 | 176,774 | 123,862 |
| Residential mortgages | 20,548 | 3,653 | 24,201 | 60 | — | — | 24,261 | — |
| Personal lending | 6,816 | 2,704 | 9,520 | — | — | — | 9,520 | — |
| Property | 1,611 | 3,318 | 4,929 | 99 | 23 | — | 5,051 | — |
| Construction | 442 | 78 | 520 | 5 | 16 | — | 541 | — |
| Manufacturing | 5,459 | 143 | 5,602 | 434 | 583 | — | 6,619 | — |
| Service industries and business activities | 14,198 | 2,725 | 16,923 | 3,285 | 2,764 | 42 | 23,014 | — |
| Agriculture, forestry and fishing | 31 | — | 31 | 28 | 3 | — | 62 | — |
| Finance lease and instalment credit | 2,315 | — | 2,315 | — | — | — | 2,315 | — |
| Interest accruals | 190 | 73 | 263 | 240 | — | — | 503 | — |
| Group | 86,977 | 13,585 | 100,562 | 53,867 | 125,111 | 5,104 | 284,644 | 123,862 |
| | | | | | | | | |
| Europe | | | | | | | | |
| Central and local government | 365 | 1,017 | 1,382 | 18,648 | 66 | — | 20,096 | — |
| Finance - banks | 10,315 | 312 | 10,627 | — | — | — | 10,627 | — |
- other (3) | 2,641 | 1,019 | 3,660 | 17,076 | 746 | 53 | 21,535 | 1 |
| Residential mortgages | 19,473 | 621 | 20,094 | — | — | — | 20,094 | — |
| Personal lending | 2,270 | 600 | 2,870 | 62 | — | 25 | 2,957 | — |
| Property | 5,139 | 12,636 | 17,775 | 43 | — | — | 17,818 | — |
| Construction | 1,014 | 873 | 1,887 | 27 | 1 | — | 1,915 | — |
| Manufacturing | 5,853 | 4,181 | 10,034 | 105 | 39 | — | 10,178 | 6 |
| Service industries and business activities | 17,538 | 6,071 | 23,609 | 900 | 99 | 1 | 24,609 | 92 |
| Agriculture, forestry and fishing | 849 | 68 | 917 | 1 | — | — | 918 | — |
| Finance lease and instalment credit | 369 | 745 | 1,114 | — | — | — | 1,114 | — |
| Interest accruals | 170 | 102 | 272 | 575 | — | — | 847 | — |
| Group before RFS MI | 65,996 | 28,245 | 94,241 | 37,437 | 951 | 79 | 132,708 | 99 |
| RFS MI | | | 2 | — | — | — | 2 | — |
| Group | | | 94,243 | 37,437 | 951 | 79 | 132,710 | 99 |
For notes to this table refer to page 113.
Business reviewcontinued | Business review |
| Risk and balance sheet management |
Risk management: Credit risk continued
Balance sheet analysis: Industry and geography analysis continued
| | Loans and advances | | | | | Netting and offset (2) |
| | Core | Non-Core | Total | Securities | Derivatives | Other (1) | Total |
| 2010 | £m | £m | £m | £m | £m | £m | £m | £m |
| RoW | | | | | | | | |
| Central and local government | 459 | 428 | 887 | 14,073 | 189 | 6 | 15,155 | — |
| Finance - banks | 9,559 | 219 | 9,778 | — | — | — | 9,778 | — |
- other (3) | 8,840 | 22 | 8,862 | 3,888 | 27,531 | 1,792 | 42,073 | 22,575 |
| Residential mortgages | 410 | 203 | 613 | — | — | — | 613 | — |
| Personal lending | 1,460 | 2 | 1,462 | — | 6 | — | 1,468 | — |
| Property | 735 | 1,205 | 1,940 | 318 | 68 | — | 2,326 | — |
| Construction | 183 | 91 | 274 | 16 | 22 | — | 312 | — |
| Manufacturing | 2,185 | 686 | 2,871 | 4 | 448 | — | 3,323 | — |
| Service industries and business activities | 5,251 | 1,846 | 7,097 | 899 | 1,482 | 8 | 9,486 | 2 |
| Agriculture, forestry and fishing | 6 | — | 6 | — | 2 | — | 8 | — |
| Finance lease and instalment credit | 47 | — | 47 | — | — | — | 47 | — |
| Interest accruals | 90 | 6 | 96 | 82 | — | — | 178 | — |
| Group | 29,225 | 4,708 | 33,933 | 19,280 | 29,748 | 1,806 | 84,767 | 22,577 |
| | | | | | | | | |
| 2009 | | | | | | | | |
| UK | | | | | | | | |
| Central and local government | 4,482 | 276 | 4,758 | 79,663 | 6,752 | 4 | 91,177 | 1,725 |
| Finance - banks | 58,141 | 979 | 59,120 | — | — | — | 59,120 | — |
- other (3) | 56,429 | 8,093 | 64,522 | 45,513 | 257,109 | 5,492 | 372,636 | 238,926 |
| Residential mortgages | 90,688 | 1,896 | 92,584 | 653 | 11 | — | 93,248 | 7 |
| Personal lending | 24,613 | 1,137 | 25,750 | 1 | 9 | 22 | 25,782 | 21 |
| Property | 36,407 | 35,387 | 71,794 | 3,761 | 4,086 | 104 | 79,745 | 1,114 |
| Construction | 6,964 | 3,640 | 10,604 | 354 | 849 | 62 | 11,869 | 1,450 |
| Manufacturing | 14,644 | 3,255 | 17,899 | 1,643 | 4,222 | 102 | 23,866 | 3,184 |
| Service industries and business activities | 62,756 | 15,877 | 78,633 | 10,279 | 7,849 | 742 | 97,503 | 5,810 |
| Agriculture, forestry and fishing | 2,946 | 138 | 3,084 | 252 | 39 | 9 | 3,384 | 76 |
| Finance lease and instalment credit | 5,343 | 10,843 | 16,186 | 294 | 16 | — | 16,496 | 39 |
| Interest accruals | 1,032 | 180 | 1,212 | 457 | — | — | 1,669 | — |
| Group before RFS MI | 364,445 | 81,701 | 446,146 | 142,870 | 280,942 | 6,537 | 876,495 | 252,352 |
| RFS MI | | | 444 | 49 | 1 | — | 494 | — |
| Group | | | 446,590 | 142,919 | 280,943 | 6,537 | 876,989 | 252,352 |
| | | | | | | | | |
| US | | | | | | | | |
| Central and local government | 196 | 64 | 260 | 24,620 | 9 | 141 | 25,030 | — |
| Finance - banks | 8,448 | 76 | 8,524 | — | — | — | 8,524 | — |
- other (3) | 19,404 | 1,803 | 21,207 | 27,086 | 125,599 | 5,779 | 179,671 | 113,670 |
| Residential mortgages | 21,842 | 4,317 | 26,159 | 64 | — | — | 26,223 | — |
| Personal lending | 7,373 | 3,599 | 10,972 | — | — | — | 10,972 | — |
| Property | 1,498 | 3,788 | 5,286 | 56 | 30 | — | 5,372 | — |
| Construction | 490 | 132 | 622 | 72 | 50 | — | 744 | — |
| Manufacturing | 5,895 | 1,200 | 7,095 | 243 | 580 | — | 7,918 | — |
| Service industries and business activities | 14,358 | 4,505 | 18,863 | 3,320 | 2,486 | — | 24,669 | — |
| Agriculture, forestry and fishing | 27 | — | 27 | 1 | 2 | — | 30 | — |
| Finance lease and instalment credit | 2,417 | — | 2,417 | — | — | — | 2,417 | — |
| Interest accruals | 220 | 94 | 314 | 334 | — | — | 648 | — |
| Group before RFS MI | 82,168 | 19,578 | 101,746 | 55,796 | 128,756 | 5,920 | 292,218 | 113,670 |
| RFS MI | | | 360 | — | — | — | 360 | — |
| Group | | | 102,106 | 55,796 | 128,756 | 5,920 | 292,578 | 113,670 |
For notes to this table refer to page 113.
Business reviewcontinued | Business review |
| Risk and balance sheet management |
Risk management: Credit risk continued
Balance sheet analysis: Industry and geography analysis continued
| | Loans and advances | | | | | Netting and offset (2) |
| | Core | Non-Core | Total | Securities | Derivatives | Other (1) | Total |
| 2009 | £m | £m | £m | £m | £m | £m | £m | £m |
| Europe | | | | | | | | |
| Central and local government | 334 | 1,164 | 1,498 | 25,328 | 68 | 24 | 26,918 | — |
| Finance - banks | 4,906 | 528 | 5,434 | — | — | — | 5,434 | — |
- other (3) | 4,161 | 1,028 | 5,189 | 22,913 | 1,699 | 43 | 29,844 | — |
| Residential mortgages | 15,055 | 6,718 | 21,773 | — | — | — | 21,773 | — |
| Personal lending | 1,877 | 1,009 | 2,886 | — | — | 17 | 2,903 | — |
| Property | 10,812 | 9,417 | 20,229 | 1 | 17 | 4 | 20,251 | — |
| Construction | 1,946 | 1,167 | 3,113 | 1 | 1 | 1 | 3,116 | — |
| Manufacturing | 7,311 | 8,609 | 15,920 | 42 | 123 | — | 16,085 | — |
| Service industries and business activities | 19,088 | 9,895 | 28,983 | 331 | 88 | 51 | 29,453 | — |
| Agriculture, forestry and fishing | 737 | 356 | 1,093 | 1 | — | — | 1,094 | — |
| Finance lease and instalment credit | 379 | 1,094 | 1,473 | 12 | — | — | 1,485 | — |
| Interest accruals | 266 | 249 | 515 | 706 | — | — | 1,221 | — |
| Group before RFS MI | 66,872 | 41,234 | 108,106 | 49,335 | 1,996 | 140 | 159,577 | — |
| RFS MI | | | 140,098 | 21,681 | 3,232 | 9 | 165,020 | — |
| Group | | | 248,204 | 71,016 | 5,228 | 149 | 324,597 | — |
| | | | | | | | | |
| RoW | | | | | | | | |
| Central and local government | 1,376 | 28 | 1,404 | 13,201 | 169 | 36 | 14,810 | — |
| Finance - banks | 10,200 | 354 | 10,554 | — | — | — | 10,554 | — |
- other (3) | 8,623 | 1,033 | 9,656 | 3,772 | 25,045 | 796 | 39,269 | 19,747 |
| Residential mortgages | 390 | 1 | 391 | — | — | — | 391 | — |
| Personal lending | 1,450 | 613 | 2,063 | — | 29 | 1 | 2,093 | — |
| Property | 337 | 1,780 | 2,117 | 679 | 51 | — | 2,847 | — |
| Construction | 102 | 319 | 421 | 188 | 23 | — | 632 | — |
| Manufacturing | 2,604 | 1,338 | 3,942 | 26 | 428 | 14 | 4,410 | — |
| Service industries and business activities | 4,527 | 3,385 | 7,912 | 589 | 757 | 1 | 9,259 | 1 |
| Agriculture, forestry and fishing | 16 | 59 | 75 | — | 3 | — | 78 | — |
| Finance lease and instalment credit | 8 | 19 | 27 | — | — | — | 27 | — |
| Interest accruals | 149 | 32 | 181 | 74 | — | — | 255 | — |
| Group before RFS MI | 29,782 | 8,961 | 38,743 | 18,529 | 26,505 | 848 | 84,625 | 19,748 |
| RFS MI | | | 1,786 | — | 22 | — | 1,808 | 55 |
| Group | | | 40,529 | 18,529 | 26,527 | 848 | 86,433 | 19,803 |
For notes to this table refer to page 113.
Business reviewcontinued | Business review |
| Risk and balance sheet management |
Risk management: Credit risk continued
Balance sheet analysis: Industry and geography analysis continued
| 2008 | Loans and advances £m | Securities £m | Derivatives £m | Other (1) £m | Total £m | Netting and offset (2) £m |
| UK | | | | | | |
| Central and local government | 6,106 | 36,466 | 5,798 | 14 | 48,384 | 1,987 |
| Finance - banks | 105,100 | — | — | — | 105,100 | — |
- other (3) | 92,030 | 84,601 | 532,857 | 6,257 | 715,745 | 480,762 |
| Residential mortgages | 80,967 | — | 14 | — | 80,981 | 52 |
| Personal lending | 27,469 | 250 | 36 | 25 | 27,780 | 5 |
| Property | 74,010 | 2,008 | 5,094 | 71 | 81,183 | 1,026 |
| Construction | 13,426 | 144 | 754 | 26 | 14,350 | 1,485 |
| Manufacturing | 25,999 | 1,080 | 11,208 | 180 | 38,467 | 6,279 |
| Service industries and business activities | 88,334 | 10,154 | 13,278 | 1,471 | 113,237 | 7,624 |
| Agriculture, forestry and fishing | 3,118 | 93 | 34 | 15 | 3,260 | 87 |
| Finance lease and instalment credit | 17,363 | 3 | 25 | — | 17,391 | 119 |
| Interest accruals | 4,293 | 774 | — | — | 5,067 | — |
| Group before RFS MI | 538,215 | 135,573 | 569,098 | 8,059 | 1,250,945 | 499,426 |
| RFS MI | 702 | 95 | — | — | 797 | — |
| Group | 538,917 | 135,668 | 569,098 | 8,059 | 1,251,742 | 499,426 |
| US | | | | | | |
| Central and local government | 482 | 24,996 | 45 | 33 | 25,556 | — |
| Finance - banks | 5,814 | — | — | — | 5,814 | — |
- other (3) | 24,618 | 37,344 | 355,502 | 5,754 | 423,218 | 323,910 |
| Residential mortgages | 34,235 | — | — | — | 34,235 | — |
| Personal lending | 14,368 | — | — | — | 14,368 | — |
| Property | 6,579 | 5 | 97 | — | 6,681 | — |
| Construction | 885 | 63 | 122 | 6 | 1,076 | — |
| Manufacturing | 13,127 | 102 | 1,809 | 128 | 15,166 | 217 |
| Service industries and business activities | 27,914 | 1,498 | 8,535 | 907 | 38,854 | 2,346 |
| Agriculture, forestry and fishing | 30 | — | 3 | 1 | 34 | — |
| Finance lease and instalment credit | 3,066 | — | — | — | 3,066 | — |
| Interest accruals | 498 | 466 | — | — | 964 | — |
| Group before RFS MI | 131,616 | 64,474 | 366,113 | 6,829 | 569,032 | 326,473 |
| RFS MI | 491 | 2 | — | — | 493 | — |
| Group | 132,107 | 64,476 | 366,113 | 6,829 | 569,525 | 326,473 |
| | | | | | | |
For notes to this table refer to page 113.
Business reviewcontinued | Business review |
| Risk and balance sheet management |
Risk management: Credit risk continued
Balance sheet analysis: Industry and geography analysis continued
| 2008 | Loans and advances £m | Securities £m | Derivatives £m | Other (1) £m | Total £m | Netting and offset (2) £m |
| Europe | | | | | | |
| Central and local government | 1,830 | 21,929 | 228 | 5 | 23,992 | — |
| Finance - banks | 7,274 | — | — | — | 7,274 | — |
- other (3) | 10,480 | 20,657 | 7,840 | 3,608 | 42,585 | — |
| Residential mortgages | 23,394 | 29 | 4 | — | 23,427 | — |
| Personal lending | 4,641 | 28 | 19 | — | 4,688 | — |
| Property | 19,769 | 1 | 299 | — | 20,069 | — |
| Construction | 5,183 | — | 91 | — | 5,274 | — |
| Manufacturing | 25,843 | 53 | 371 | — | 26,267 | 2 |
| Service industries and business activities | 40,444 | 10,163 | 2,347 | 85 | 53,039 | 840 |
| Agriculture, forestry and fishing | 1,327 | 50 | 1 | — | 1,378 | — |
| Finance lease and instalment credit | 1,815 | 15 | — | — | 1,830 | — |
| Interest accruals | 1,194 | 1 | — | — | 1,195 | — |
| Group before RFS MI | 143,194 | 52,926 | 11,200 | 3,698 | 211,018 | 842 |
| RFS MI | 150,304 | 18,367 | 1,009 | 20 | 169,700 | 1 |
| Group | 293,498 | 71,293 | 12,209 | 3,718 | 380,718 | 843 |
| | | | | | | |
| RoW | | | | | | |
| Central and local government | 7,079 | 16,708 | 311 | 145 | 24,243 | — |
| Finance - banks | 9,099 | — | — | — | 9,099 | — |
- other (3) | 11,955 | 4,267 | 42,620 | 407 | 59,249 | 31,732 |
| Residential mortgages | 795 | — | — | — | 795 | — |
| Personal lending | 4,592 | — | 5 | — | 4,597 | 29 |
| Property | 2,918 | 480 | 96 | — | 3,494 | 41 |
| Construction | 756 | 6 | 17 | — | 779 | 3 |
| Manufacturing | 6,196 | 178 | 771 | — | 7,145 | — |
| Service industries and business activities | 13,152 | 949 | 1,257 | — | 15,358 | 108 |
| Agriculture, forestry and fishing | 153 | 1 | 7 | — | 161 | — |
| Finance lease and instalment credit | 111 | 5 | — | — | 116 | — |
| Interest accruals | 384 | — | — | — | 384 | — |
| Group before RFS MI | 57,190 | 22,594 | 45,084 | 552 | 125,420 | 31,913 |
| RFS MI | 2,223 | 58 | 55 | — | 2,336 | 13 |
| Group | 59,413 | 22,652 | 45,139 | 552 | 127,756 | 31,926 |
| (1) | Includes settlement balances of £11,605 million at 31 December 2010 (2009 - £12,033 million; 2008 - £17,832 million). |
| (2) | This shows the amount by which the Group´s credit risk exposure is reduced through arrangements, such as master netting agreements, which give the Group a legal right to set-off the financial asset against a financial liability due to the same counterparty. In addition, the Group holds collateral in respect of individual loans and advances to banks and customers. This collateral includes mortgages over property (both personal and commercial); charges over business assets such as plant, inventories and trade debtors; and guarantees of lending from parties other than the borrower. The Group obtains collateral in the form of securities in reverse repurchase agreements. Cash and securities are received as collateral in respect of derivative transactions. |
| (3) | Loans made by the Group's consolidated conduits to asset owning companies are included within Finance. |
Business reviewcontinued | Business review |
| Risk and balance sheet management |
Risk management: Credit risk continued
Balance sheet analysis continued
Asset quality
The asset quality analysis presented below is based on the Group’s internal asset quality ratings which have ranges for the probability of default, as set out below. Customers are assigned credit grades, based on various credit grading models that reflect the key drivers of default for the customer type. All credit grades across the Group map to both a Group level asset quality scale, used for external financial reporting, and a master grading scale for wholesale exposures used for internal management reporting across portfolios. Debt securities are analysed by external ratings agencies and are therefore excluded from the table below and are set out on pages 116 and 117.
| Asset quality band | Probability of default range |
| AQ1 | 0% - 0.034% |
| AQ2 | 0.034% - 0.048% |
| AQ3 | 0.048% - 0.095% |
| AQ4 | 0.095% - 0.381% |
| AQ5 | 0.381% - 1.076% |
| AQ6 | 1.076% - 2.153% |
| AQ7 | 2.153% - 6.089% |
| AQ8 | 6.089% - 17.222% |
| AQ9 | 17.222% - 100% |
| AQ10 | 100% |
| | Cash and balances at central banks | Loans and advances to banks (1) | Loans and advances to customers | Settlement balances | Derivatives | Other financial instruments | Commitments | Contingent liabilities | Total |
| 2010 | £m | £m | £m | £m | £m | £m | £m | £m | £m |
| Total | | | | | | | | | |
| AQ1 | 56,655 | 91,952 | 126,444 | 6,815 | 408,489 | 658 | 78,728 | 9,745 | 779,486 |
| AQ2 | 14 | 598 | 13,282 | 1,271 | 2,659 | 3 | 26,128 | 1,980 | 45,935 |
| AQ3 | 48 | 2,197 | 25,981 | 156 | 3,317 | — | 25,731 | 4,337 | 61,767 |
| AQ4 | 188 | 639 | 95,777 | 571 | 3,391 | 6 | 41,027 | 6,522 | 148,121 |
| AQ5 | 99 | 2,322 | 114,796 | 64 | 4,860 | 144 | 38,612 | 5,169 | 166,066 |
| AQ6 | 3 | 159 | 65,497 | 34 | 1,070 | — | 25,991 | 2,230 | 94,984 |
| AQ7 | 2 | 178 | 46,072 | 1 | 857 | 69 | 18,752 | 2,456 | 68,387 |
| AQ8 | — | 15 | 16,573 | 14 | 403 | — | 9,289 | 9,545 | 35,839 |
| AQ9 | — | 115 | 14,263 | 2 | 450 | 80 | 3,889 | 932 | 19,731 |
| AQ10 | 5 | 355 | 5,644 | 2 | 1,581 | — | 2,829 | 407 | 10,823 |
| Past due | — | 10 | 13,430 | 2,675 | — | — | — | — | 16,115 |
| Impaired | — | 145 | 35,556 | — | — | 375 | — | — | 36,076 |
| Impairment provision | — | (127) | (18,055) | — | — | (29) | — | — | (18,211) |
| Group before RFS MI | 57,014 | 98,558 | 555,260 | 11,605 | 427,077 | 1,306 | 270,976 | 43,323 | 1,465,119 |
| RFS MI | — | 2 | — | — | — | — | — | 32 | 34 |
| Group | 57,014 | 98,560 | 555,260 | 11,605 | 427,077 | 1,306 | 270,976 | 43,355 | 1,465,153 |
| | | | | | | | | | |
| Core | | | | | | | | | |
| AQ1 | 56,637 | 91,298 | 103,645 | 6,814 | 396,419 | 366 | 71,091 | 9,651 | 735,921 |
| AQ2 | 14 | 550 | 10,534 | 1,271 | 2,243 | 3 | 24,923 | 1,728 | 41,266 |
| AQ3 | 48 | 2,165 | 22,851 | 155 | 3,132 | — | 23,546 | 4,268 | 56,165 |
| AQ4 | 10 | 539 | 85,779 | 571 | 3,017 | 6 | 36,909 | 5,070 | 131,901 |
| AQ5 | 99 | 2,247 | 100,051 | 64 | 3,988 | 15 | 35,302 | 4,924 | 146,690 |
| AQ6 | 3 | 138 | 53,498 | 34 | 805 | — | 24,050 | 2,140 | 80,668 |
| AQ7 | 2 | 154 | 38,438 | 1 | 595 | 69 | 17,605 | 2,309 | 59,173 |
| AQ8 | — | 15 | 13,290 | 14 | 257 | — | 8,617 | 9,434 | 31,627 |
| AQ9 | — | 107 | 9,898 | 2 | 237 | 50 | 3,442 | 886 | 14,622 |
| AQ10 | 5 | 300 | 2,777 | 2 | 368 | — | 1,500 | 250 | 5,202 |
| Past due | — | 3 | 10,744 | 2,629 | — | — | — | — | 13,376 |
| Impaired | — | 144 | 13,367 | — | — | 375 | — | — | 13,886 |
| Impairment provision | — | (126) | (7,740) | — | — | (29) | — | — | (7,895) |
| Group before RFS MI | 56,818 | 97,534 | 457,132 | 11,557 | 411,061 | 855 | 246,985 | 40,660 | 1,322,602 |
| | | | | | | | | | |
For the note to this table refer to page 116.
Business reviewcontinued | Business review |
| Risk and balance sheet management |
Risk management: Credit risk continued
Balance sheet analysis: Asset quality continued
| | Cash and balances at central banks | Loans and advances to banks (1) | Loans and advances to customers | Settlement balances | Derivatives | Other financial instruments | Commitments | Contingent liabilities | Total |
| 2010 | £m | £m | £m | £m | £m | £m | £m | £m | £m |
| Non-Core | | | | | | | | | |
| AQ1 | 18 | 654 | 22,799 | 1 | 12,070 | 292 | 7,637 | 94 | 43,565 |
| AQ2 | — | 48 | 2,748 | — | 416 | — | 1,205 | 252 | 4,669 |
| AQ3 | — | 32 | 3,130 | 1 | 185 | — | 2,185 | 69 | 5,602 |
| AQ4 | 178 | 100 | 9,998 | — | 374 | — | 4,118 | 1,452 | 16,220 |
| AQ5 | — | 75 | 14,745 | — | 872 | 129 | 3,310 | 245 | 19,376 |
| AQ6 | — | 21 | 11,999 | — | 265 | — | 1,941 | 90 | 14,316 |
| AQ7 | — | 24 | 7,634 | — | 262 | — | 1,147 | 147 | 9,214 |
| AQ8 | — | — | 3,283 | — | 146 | — | 672 | 111 | 4,212 |
| AQ9 | — | 8 | 4,365 | — | 213 | 30 | 447 | 46 | 5,109 |
| AQ10 | — | 55 | 2,867 | — | 1,213 | — | 1,329 | 157 | 5,621 |
| Accruing past due | — | 7 | 2,686 | 46 | — | — | — | — | 2,739 |
| Impaired | — | 1 | 22,189 | — | — | — | — | — | 22,190 |
| Impairment provision | — | (1) | (10,315) | — | — | — | — | — | (10,316) |
| Group before RFS MI | 196 | 1,024 | 98,128 | 48 | 16,016 | 451 | 23,991 | 2,663 | 142,517 |
| 2009 | | | | | | | | | |
| AQ1 | 51,521 | 72,384 | 106,062 | 6,582 | 389,019 | 754 | 62,085 | 9,446 | 697,853 |
| AQ2 | — | 1,725 | 10,780 | 306 | 11,550 | 9 | 27,598 | 4,526 | 56,494 |
| AQ3 | 1 | 2,175 | 29,958 | 199 | 10,791 | — | 28,364 | 6,088 | 77,576 |
| AQ4 | 23 | 1,357 | 102,922 | 605 | 8,296 | — | 52,496 | 14,948 | 180,647 |
| AQ5 | 2 | 2,497 | 124,724 | 149 | 8,270 | 37 | 43,239 | 7,387 | 186,305 |
| AQ6 | 1 | 424 | 94,513 | 40 | 2,548 | — | 30,847 | 2,448 | 130,821 |
| AQ7 | — | 110 | 46,928 | 33 | 2,181 | 98 | 26,724 | 2,352 | 78,426 |
| AQ8 | — | 137 | 23,593 | — | 1,448 | — | 12,507 | 1,008 | 38,693 |
| AQ9 | — | 184 | 16,025 | — | 2,030 | — | 5,141 | 1,279 | 24,659 |
| AQ10 | — | 277 | 9,142 | 3 | 2,026 | — | 3,618 | 507 | 15,573 |
| Accruing past due | — | 36 | 14,475 | 3,910 | 40 | — | — | — | 18,461 |
| Impaired | — | 206 | 31,588 | 197 | — | — | — | — | 31,991 |
| Impairment provision | — | (157) | (15,016) | — | — | — | — | — | (15,173) |
| Group before RFS MI | 51,548 | 81,355 | 595,694 | 12,024 | 438,199 | 898 | 292,619 | 49,989 | 1,522,326 |
| RFS MI | 713 | 7,865 | 132,699 | 9 | 3,255 | — | 5,022 | 4,031 | 153,594 |
| Group | 52,261 | 89,220 | 728,393 | 12,033 | 441,454 | 898 | 297,641 | 54,020 | 1,675,920 |
For the note to this table refer to page 116.
Business reviewcontinued | Business review |
| Risk and balance sheet management |
Risk management: Credit risk continued
Balance sheet analysis: Asset qualitycontinued
| | Cash and balances at central banks | Loans and advances to banks (1) | Loans and advances to customers | Settlement balances | Derivatives | Other financial instruments | Commitments | Contingent liabilities | Total |
| 2008 | £m | £m | £m | £m | £m | £m | £m | £m | £m |
| AQ1 | 9,314 | 93,845 | 141,636 | 8,468 | 837,899 | 475 | 122,075 | 10,268 | 1,223,980 |
| AQ2 | 506 | 6,380 | 18,440 | 1,229 | 27,207 | 31 | 23,113 | 2,129 | 79,035 |
| AQ3 | 1,005 | 12,556 | 62,235 | 1,938 | 35,719 | 62 | 26,267 | 2,843 | 142,625 |
| AQ4 | 1,005 | 11,041 | 129,292 | 1,422 | 46,057 | 62 | 63,966 | 13,196 | 266,041 |
| AQ5 | — | 1,048 | 160,605 | 252 | 26,799 | — | 63,599 | 17,738 | 270,041 |
| AQ6 | — | 673 | 99,765 | 217 | 6,581 | 222 | 17,771 | 11,254 | 136,483 |
| AQ7 | — | 201 | 56,762 | 248 | 4,452 | — | 17,740 | 7,602 | 87,005 |
| AQ8 | — | 292 | 23,449 | — | 1,362 | — | 14,120 | 1,170 | 40,393 |
| AQ9 | — | 343 | 12,265 | 9 | 2,022 | — | 5,814 | 1,061 | 21,514 |
| AQ10 | — | 274 | 5,844 | — | 3,386 | — | 1,827 | 435 | 11,766 |
| Accruing past due | — | — | 13,262 | 4,029 | 11 | — | — | — | 17,302 |
| Impaired | — | 129 | 17,034 | — | — | — | — | — | 17,163 |
| Impairment provision | — | (127) | (9,324) | — | — | — | — | — | (9,451) |
| Group before RFS MI | 11,830 | 126,655 | 731,265 | 17,812 | 991,495 | 852 | 356,292 | 67,696 | 2,303,897 |
| RFS MI | 570 | 8,676 | 143,457 | 20 | 1,064 | — | 5,432 | 3,841 | 163,060 |
| Group | 12,400 | 135,331 | 874,722 | 17,832 | 992,559 | 852 | 361,724 | 71,537 | 2,466,957 |
Note:
| (1) | Excluding items in the course of collection from other banks of £1,958 million (2009 - £2,533 million; 2008 - £2,888 million). |
Debt securities
The table below analyses debt securities by issuer and external ratings.
| | Central and local government | Banks and building societies £m | ABS (1) £m | Corporate £m | Other £m | Total £m | % of total |
| 2010 | UK £m | US £m | Other £m |
| Total | | | | | | | | | |
| AAA | 13,486 | 33,846 | 44,784 | 2,374 | 51,235 | 846 | 17 | 146,588 | 67 |
| AA to AA+ | — | — | 18,025 | 3,036 | 6,335 | 779 | — | 28,175 | 13 |
| A to AA- | — | — | 9,138 | 4,185 | 3,244 | 1,303 | 5 | 17,875 | 8 |
| BBB- to A- | — | — | 2,843 | 1,323 | 3,385 | 2,029 | 6 | 9,586 | 5 |
| Non-investment grade | — | — | 1,766 | 1,766 | 4,923 | 2,786 | 4 | 11,245 | 5 |
| Unrated | — | — | 52 | 310 | 1,703 | 1,722 | 224 | 4,011 | 2 |
| | 13,486 | 33,846 | 76,608 | 12,994 | 70,825 | 9,465 | 256 | 217,480 | 100 |
| | | | | | | | | | |
| Core | | | | | | | | | |
| AAA | 13,110 | 33,535 | 44,761 | 2,205 | 47,441 | 807 | 16 | 141,875 | 70 |
| AA to AA+ | — | — | 18,025 | 2,908 | 3,656 | 775 | — | 25,364 | 13 |
| A to AA- | — | — | 9,138 | 4,007 | 1,879 | 1,223 | 5 | 16,252 | 8 |
| BBB- to A- | — | — | 2,843 | 1,297 | 1,108 | 1,956 | 6 | 7,210 | 4 |
| Non-investment grade | — | — | 1,460 | 1,638 | 3,052 | 2,428 | 2 | 8,580 | 4 |
| Unrated | — | — | 52 | 297 | 978 | 1,077 | 212 | 2,616 | 1 |
| | 13,110 | 33,535 | 76,279 | 12,352 | 58,114 | 8,266 | 241 | 201,897 | 100 |
| | | | | | | | | | |
| Non-Core | | | | | | | | | |
| AAA | 376 | 311 | 23 | 169 | 3,794 | 39 | 1 | 4,713 | 30 |
| AA to AA+ | — | — | — | 128 | 2,679 | 4 | — | 2,811 | 18 |
| A to AA- | — | — | — | 178 | 1,365 | 80 | — | 1,623 | 11 |
| BBB- to A- | — | — | — | 26 | 2,277 | 73 | — | 2,376 | 15 |
| Non-investment grade | — | — | 306 | 128 | 1,871 | 358 | 2 | 2,665 | 17 |
| Unrated | — | — | — | 13 | 725 | 645 | 12 | 1,395 | 9 |
| | 376 | 311 | 329 | 642 | 12,711 | 1,199 | 15 | 15,583 | 100 |
For the note to this table refer to page 117.
Business reviewcontinued | Business review |
| Risk and balance sheet management |
Risk management: Credit risk continued
Balance sheet analysis: Debt securities continued
| | Central and local government | Banks and building societies £m | ABS (1) £m | Corporate £m | Other £m | Total £m | % of total (2) |
| 2009 | UK £m | US £m | Other £m |
| AAA | 26,601 | 23,219 | 44,396 | 4,012 | 65,067 | 2,263 | — | 165,558 | 66 |
| AA to AA+ | — | — | 22,003 | 4,930 | 8,942 | 1,429 | — | 37,304 | 15 |
| A to AA- | — | — | 13,159 | 3,770 | 3,886 | 1,860 | — | 22,675 | 9 |
| BBB- to A- | — | — | 3,847 | 823 | 4,243 | 2,187 | — | 11,100 | 5 |
| Non-investment grade | — | — | 353 | 169 | 3,515 | 2,042 | — | 6,079 | 2 |
| Unrated | — | — | 504 | 289 | 1,949 | 2,601 | 1,036 | 6,379 | 3 |
| Group before RFS MI | 26,601 | 23,219 | 84,262 | 13,993 | 87,602 | 12,382 | 1,036 | 249,095 | 100 |
| RFS MI | 721 | 183 | 11,871 | 3,803 | 580 | 906 | 95 | 18,159 | |
| Group | 27,322 | 23,402 | 96,133 | 17,796 | 88,182 | 13,288 | 1,131 | 267,254 | |
| | | | | | | | | | |
| 2008 | | | | | | | | | |
| AAA | 18,787 | 16,514 | 43,197 | 8,126 | 93,853 | 3,953 | — | 184,430 | 73 |
| BBB- to AA+ | — | — | 15,862 | 13,013 | 11,437 | 10,172 | — | 50,484 | 20 |
| Non-investment grade | — | — | 242 | 127 | 3,678 | 2,259 | — | 6,306 | 2 |
| Unrated | — | — | 409 | 1,445 | 2,175 | 4,517 | 3,393 | 11,939 | 5 |
| Group before RFS MI | 18,787 | 16,514 | 59,710 | 22,711 | 111,143 | 20,901 | 3,393 | 253,159 | 100 |
| RFS MI | — | 7 | 10,761 | 1,652 | — | 885 | 1,085 | 14,390 | |
| Group | 18,787 | 16,521 | 70,471 | 24,363 | 111,143 | 21,786 | 4,478 | 267,549 | |
Notes:
| (1) | Asset-backed securities. |
| (2) | Percentage calculated on Group before RFS MI. |
Key points
| · | The proportion of AAA rated securities was broadly unchanged during the year whilst the proportion of non-investment grade and unrated securities increased from 5% to 7%. |
| · | Holdings of debt securities issued by non-investment grade governments comprised: Greece £1.0 billion; Romania £0.3 billion; Turkey £0.2 billion; and Indonesia £0.2 billion. |
| · | Increase in non-investment grade securities reflects purchases by GBM’s mortgage trading business. Non-investment grade securities also increased as a result of credit downgrades and rating withdrawals of certain ABS structures in Non-Core during the year. |
Business reviewcontinued | Business review |
| Risk and balance sheet management |
Risk management: Credit risk continued
Balance sheet analysis: Debt securities continued
The table below analyses debt securities by issuer and measurement classification. Net numbers below are illustrative only and do not reflect net presentation under IFRS.
| | Central and local government | Banks and building societies | ABS | Corporate | Other | Total |
| | UK | US | Other |
| 2010 | £m | £m | £m | £m | £m | £m | £m | £m |
| Held-for-trading (HFT) | 5,097 | 15,956 | 43,224 | 5,778 | 21,988 | 6,590 | 236 | 98,869 |
| Designated as at fair value through profit or loss | 1 | — | 262 | 3 | 119 | 16 | 1 | 402 |
| Available-for-sale | 8,377 | 17,890 | 33,122 | 7,198 | 42,515 | 2,011 | 17 | 111,130 |
| Loans and receivables | 11 | — | — | 15 | 6,203 | 848 | 2 | 7,079 |
| Total | 13,486 | 33,846 | 76,608 | 12,994 | 70,825 | 9,465 | 256 | 217,480 |
| Short positions (HFT) | (4,200) | (11,398) | (18,909) | (1,853) | (1,335) | (3,288) | (34) | (41,017) |
| Net | 9,286 | 22,448 | 57,699 | 11,141 | 69,490 | 6,177 | 222 | 176,463 |
| | | | | | | | | |
| 2009 | | | | | | | | |
| Held-for-trading | 8,128 | 10,427 | 50,150 | 6,103 | 28,820 | 6,892 | 893 | 111,413 |
| Designated as at fair value through profit or loss | 122 | 3 | 385 | 418 | 394 | 1,087 | 20 | 2,429 |
| Available-for-sale | 18,350 | 12,789 | 33,727 | 7,472 | 50,464 | 2,550 | 30 | 125,382 |
| Loans and receivables | 1 | — | — | — | 7,924 | 1,853 | 93 | 9,871 |
| Group before RFS MI | 26,601 | 23,219 | 84,262 | 13,993 | 87,602 | 12,382 | 1,036 | 249,095 |
| RFS MI | 721 | 183 | 11,871 | 3,803 | 580 | 906 | 95 | 18,159 |
| Short positions (HFT) | (5,805) | (8,957) | (14,491) | (1,951) | (3,616) | (2,199) | (512) | (37,531) |
| Net | 21,517 | 14,445 | 81,642 | 15,845 | 84,566 | 11,089 | 619 | 229,723 |
| | | | | | | | | |
| 2008 | | | | | | | | |
| Held-for-trading | 5,372 | 9,859 | 37,518 | 10,947 | 39,879 | 11,013 | 1,571 | 116,159 |
| Designated as at fair value through profit or loss | 2,085 | 510 | 456 | — | 236 | 1,551 | 456 | 5,294 |
| Available-for-sale | 11,330 | 6,145 | 21,735 | 11,650 | 62,067 | 4,588 | 1,207 | 118,722 |
| Loans and receivables | — | — | — | 114 | 8,961 | 3,749 | 160 | 12,984 |
| Group before RFS MI | 18,787 | 16,514 | 59,709 | 22,711 | 111,143 | 20,901 | 3,394 | 253,159 |
| RFS MI | — | 7 | 10,762 | 1,652 | — | 885 | 1,084 | 14,390 |
| Group | 18,787 | 16,521 | 70,471 | 24,363 | 111,143 | 21,786 | 4,478 | 267,549 |
Key point
| · | Debt securities continued to decline during 2010, primarily in GBM’s European sovereign exposures as well as in ABS. Reduction in ABS in US Retail & Commercial and Non-Core reflects balance sheet reduction strategies whereas GBM’s sell down followed increased liquidity in US RMBS market, primarily in the first half of the year. |
Business reviewcontinued | Business review |
| Risk and balance sheet management |
Risk management: Credit risk continued
Balance sheet analysis continued
Derivatives
The table below analyses the Group’s derivative assets by internal credit quality banding and residual maturity. Master netting agreements in respect of mark-to-market (mtm) values and collateral do not result in a net presentation in the Group’s balance sheet under IFRS.
| | 2010 | 2009 Total £m |
| | 0-3 months £m | 3-6 months £m | 6-12 months £m | 1-5 years £m | Over 5 years £m | Total £m |
| |
| AQ1 | 30,840 | 10,755 | 17,554 | 135,311 | 214,029 | 408,489 | 389,019 |
| AQ2 | 319 | 105 | 212 | 1,561 | 462 | 2,659 | 11,550 |
| AQ3 | 1,284 | 391 | 626 | 610 | 406 | 3,317 | 10,791 |
| AQ4 | 989 | 155 | 240 | 1,726 | 281 | 3,391 | 8,296 |
| AQ5 | 1,016 | 81 | 201 | 1,447 | 2,115 | 4,860 | 8,270 |
| AQ6 | 134 | 46 | 71 | 653 | 166 | 1,070 | 2,548 |
| AQ7 | 150 | 29 | 44 | 375 | 259 | 857 | 2,181 |
| AQ8 | 2 | 1 | 10 | 118 | 272 | 403 | 1,448 |
| AQ9 | 104 | 8 | 39 | 110 | 189 | 450 | 2,030 |
| AQ10 | 170 | 11 | 52 | 353 | 995 | 1,581 | 2,026 |
| Accruing past due | — | — | — | — | — | — | 40 |
| | 35,008 | 11,582 | 19,049 | 142,264 | 219,174 | 427,077 | 438,199 |
| RFS MI | | | — | 3,255 |
| Group | | | 427,077 | 441,454 |
| Counterparty mtm netting | | | (330,397) | (358,917) |
Cash collateral held against derivative exposures (1) | | | (31,096) | (33,667) |
| Net exposure | | | | | | 65,584 | 48,870 |
The tables below analyse the Group’s derivative assets by contract type and residual maturity and the effect of position netting and collateral.
| | 0-3 months £m | 3-6 months £m | 6-12 months £m | 1-5 years £m | Over 5 years £m | Total £m | Counterparty mtm netting £m | Net exposure £m |
| Contract type |
| 2010 | | | | | | | | |
| Exchange rate | 28,938 | 7,820 | 9,360 | 23,174 | 13,961 | 83,253 | (69,509) | 13,744 |
| Interest rate | 4,822 | 3,533 | 7,927 | 104,026 | 191,423 | 311,731 | (236,513) | 75,218 |
| Credit derivatives | 497 | 99 | 313 | 12,374 | 13,589 | 26,872 | (22,728) | 4,144 |
| Equity and commodity | 751 | 130 | 1,449 | 2,690 | 201 | 5,221 | (1,647) | 3,574 |
| | 35,008 | 11,582 | 19,049 | 142,264 | 219,174 | 427,077 | (330,397) | 96,680 |
| | | | | | | | | |
Cash collateral held against derivative exposures (1) | | | | | | (31,096) |
| Net exposure | | | | | | | | 65,584 |
| | | | | | | | | |
| 2009 | | | | | | | | |
| Exchange rate | 19,127 | 5,824 | 7,603 | 23,831 | 11,967 | 68,352 | (47,885) | 20,467 |
| Interest rate | 8,415 | 8,380 | 16,723 | 111,144 | 176,799 | 321,461 | (270,791) | 50,670 |
| Credit derivatives | 201 | 112 | 390 | 19,859 | 21,186 | 41,748 | (36,411) | 5,337 |
| Equity and commodity | 1,562 | 436 | 1,109 | 3,057 | 474 | 6,638 | (3,830) | 2,808 |
| | 29,305 | 14,752 | 25,825 | 157,891 | 210,426 | 438,199 | (358,917) | 79,282 |
| | | | | | |
| RFS MI | | | 3,255 | — | 3,255 |
| Group | | | 441,454 | (358,917) | 82,537 |
Cash collateral held against derivative exposures (1) | | | | | (33,667) |
| Net exposure | | | | | | | | 48,870 |
| | | | | | | | | |
Note:
| (1) | As at 31 December 2010, in addition to cash collateral the Group holds collateral in the form of securities of £2.9 billion (2009 - £3.6 billion) against derivative positions. |
Business reviewcontinued | Business review |
| Risk and balance sheet management |
Risk management: Credit risk continued
Balance sheet analysis: Derivatives continued
| | 0-3 months £m | 3-6 months £m | 6-12 months £m | 1-5 years £m | Over 5 years £m | Gross assets £m | Counterparty mtm netting £m | Net exposure £m |
| Contract type |
| 2008 | | | | | | | | |
| Exchange rate | 65,428 | 21,106 | 25,150 | 43,860 | 17,339 | 172,883 | (113,451) | 59,432 |
| Interest rate | 14,195 | 17,364 | 23,603 | 193,254 | 405,926 | 654,342 | (597,482) | 56,860 |
| Credit derivatives | 932 | 384 | 2,511 | 83,599 | 54,940 | 142,366 | (112,119) | 30,247 |
| Equity and commodity | 4,807 | 2,864 | 5,579 | 8,069 | 585 | 21,904 | (10,645) | 11,259 |
| | 85,362 | 41,718 | 56,843 | 328,782 | 478,790 | 991,495 | (833,697) | 157,798 |
| | | | | | | | | |
| RFS MI | | | | | | 1,064 | — | 1,064 |
| Group | | | | | | 992,559 | (833,697) | 158,862 |
Key points
| · | Whilst gross exchange rate contracts increased due to the trading fluctuations and favourable movements in forward rates and volume, the mix in counterparty netting arrangements reduced the net exposure. |
| · | In a year of significant quarterly interest rate volatility, the overall annual interest rate trend was downwards, with all major rate indices moving down by at least 30 basis points in the medium to long end, with USD and GBP dropping approximately 70 basis points in the 5 year yield curve. The increase in gross asset values caused by the drop in interest rates was offset by the greater use of London Clearing House (LCH) as a counterparty, up from 56% at the end of 2009 to 60% by end of 2010. Reduction in non-LCH related netting increased the net exposure, excluding the effect of collateral arrangements. * |
| · | The reduction in credit derivatives primarily reflected the APS credit derivative reducing from £1.4 billion at the start of the year to £550 million at end of 2010. The effect of credit spread widening in GBM and Non-Core were offset by portfolio reductions, as part of de-risking, and currency movements. |
Cross border exposures
Cross border exposures are loans and advances including finance leases and instalment credit receivables and other monetary assets, such as debt securities and net derivatives, including non-local currency claims of overseas offices on local residents.
The Group monitors the geographical breakdown of these exposures based on the country of domicile of the borrower or guarantor of ultimate risk. Cross border exposures exclude exposures to local residents in local currencies.
The table below sets out the Group’s cross border exposures greater than 0.5% of the Group’s total assets. None of these countries have experienced repayment difficulties that have required restructuring of outstanding debt.
| | 2010 | | 2009 Total | | 2008 Total |
| | Government | Banks | Other | Total | | |
| | £m | £m | £m | £m | | £m | | £m |
| United States | 21,201 | 14,382 | 36,813 | 72,396 | | 74,409 | | 91,544 |
| France | 17,293 | 16,007 | 6,756 | 40,056 | | 37,489 | | 58,251 |
| Germany | 22,962 | 6,276 | 10,467 | 39,705 | | 41,727 | | 40,812 |
| Japan | 7,983 | 6,962 | 7,542 | 22,487 | | 18,939 | | 14,933 |
| Spain | 1,401 | 4,248 | 11,589 | 17,238 | | 27,118 | | 36,441 |
| Netherlands | 2,900 | 3,055 | 10,824 | 16,779 | | 20,262 | | 34,283 |
| Italy | 6,409 | 1,083 | 2,188 | 9,680 | | 14,412 | | 16,582 |
| Cayman Islands | 2 | 94 | 7,330 | 7,426 | | 10,786 | | 18,126 |
| Republic of Ireland | 199 | 3,789 | 3,101 | 7,089 | | 14,902 | | 18,662 |
| Belgium | 1,461 | 752 | 2,806 | 5,019 | | 9,340 | | 16,313 |
*unaudited
Business reviewcontinued | Business review |
| Risk and balance sheet management |
Risk management: Credit risk continued
REIL, provisions and reserves
All the disclosures in this section (pages 121 to 132) are audited. The Group classifies impaired assets as either risk elements in lending (REIL) or potential problem loans (PPL). REIL represents impaired loans, and loans that are accruing but are past due 90 days. PPL represents impaired assets which are not included in REIL, but where information about possible credit problems cause management to have serious doubts about the future ability of the borrower to comply with loan repayment terms.
Both REIL and PPL are reported gross and take no account of the value of any security held which could reduce the eventual loss should it occur, nor of any provision marked. Therefore impaired assets which are highly collateralised, such as mortgages, will have a low coverage ratio of provisions held against the reported impaired balance.
The analysis of risk elements in lending and impairments below, form a key part of the data provided to senior management on the credit performance of the Group's portfolios.
The table below analyses the Group's REIL and PPL and takes no account of the value of any security held which could reduce the eventual loss should it occur, nor of any provisions.
| | 2010 | | 2009 | | 2008 |
| | Core | Non-Core | Group | | Core | Non-Core | Group before RFS MI | RFS MI | Group | | Group before RFS MI | Group |
| | £m | £m | £m | | £m | £m | £m | £m | £m | | £m | £m |
Impaired loans (1) | | | | | | | | | | | | |
| UK | 7,903 | 7,835 | 15,738 | | 6,558 | 7,311 | 13,869 | 3 | 13,872 | | 8,724 | 8,733 |
| Overseas | 5,608 | 14,355 | 19,963 | | 4,173 | 13,769 | 17,942 | 3,211 | 21,153 | | 8,358 | 10,746 |
| | 13,511 | 22,190 | 35,701 | | 10,731 | 21,080 | 31,811 | 3,214 | 35,025 | | 17,082 | 19,479 |
| | | | | | | | | | | | | |
Accruing loans past due 90 days or more (2) | | | | | | | | | | | | |
| UK | 1,434 | 939 | 2,373 | | 1,146 | 1,089 | 2,235 | — | 2,235 | | 1,201 | 1,201 |
| Overseas | 262 | 262 | 524 | | 212 | 731 | 943 | 46 | 989 | | 508 | 581 |
| | 1,696 | 1,201 | 2,897 | | 1,358 | 1,820 | 3,178 | 46 | 3,224 | | 1,709 | 1,782 |
| Total REIL | 15,207 | 23,391 | 38,598 | | 12,089 | 22,900 | 34,989 | 3,260 | 38,249 | | 18,791 | 21,261 |
| | | | | | | | | | | | | |
Potential problem loans (3) | 473 | 160 | 633 | | 272 | 652 | 924 | 85 | 1,009 | | 226 | 226 |
| | | | | | | | | | | | | |
| Total REIL and PPL | 15,680 | 23,551 | 39,231 | | 12,361 | 23,552 | 35,913 | 3,345 | 39,258 | | 19,017 | 21,487 |
| | | | | | | | | | | | | |
| | | | | | | | | | | | | |
REIL as a % of gross loans to customers (4) | 3.7% | 20.7% | 7.3% | | 2.8% | 15.1% | 6.1% | 2.4% | 5.4% | | 2.7% | 2.5% |
REIL and PPL as a % of gross loans to customers (4) | 3.8% | 20.8% | 7.4% | | 2.9% | 15.5% | 6.2% | 2.5% | 5.5% | | 2.7% | 2.5% |
Closing provision for impairment as a % of total REIL | 51% | 44% | 47% | | 56% | 37% | 44% | 65% | 46% | | 50% | 52% |
Closing provision for impairment as a % of total REIL and PPL | 49% | 44% | 46% | | 55% | 36% | 43% | 63% | 45% | | 50% | 51% |
Notes:
| (1) | All loans against which an impairment provisions is held. |
| (2) | Loans where an impairment event has taken place but no impairment recognised. This category is used for fully collateralised non-revolving credit facilities. |
| (3) | Loans for which an impairment event has occurred but no impairment provision is necessary. This category is used for advances and revolving credit facilities where the past due concept is not applicable. |
| (4) | Includes gross loans relating to disposal groups but excludes reverse repos. |
Business reviewcontinued | Business review |
| Risk and balance sheet management |
Risk management: Credit risk continued
REIL, provisions and reserves continued
Movement in REIL and PPL
The table below details the movement in REIL and PPL during the year ended 31 December 2010.
| | REIL | | PPL | | Total |
| | Core | Non-Core | Total | | Core | Non-Core | Total | | Core | Non-Core | Total |
| | £m | £m | £m | | £m | £m | £m | | £m | £m | £m |
| At 1 January 2010 | 12,089 | 22,900 | 34,989 | | 272 | 652 | 924 | | 12,361 | 23,552 | 35,913 |
| Intra-group transfers | (142) | 142 | — | | 147 | (147) | — | | 5 | (5) | — |
Currency translation and other adjustments | 22 | (124) | (102) | | (1) | 2 | 1 | | 21 | (122) | (101) |
| Additions | 11,435 | 11,915 | 23,350 | | 1,539 | 502 | 2,041 | | 12,974 | 12,417 | 25,391 |
| Transfers | 69 | (185) | (116) | | (85) | (61) | (146) | | (16) | (246) | (262) |
Disposals, restructurings and repayments | (5,385) | (6,694) | (12,079) | | (1,399) | (788) | (2,187) | | (6,784) | (7,482) | (14,266) |
| Amounts written-off | (2,881) | (4,563) | (7,444) | | — | — | — | | (2,881) | (4,563) | (7,444) |
| At 31 December 2010 | 15,207 | 23,391 | 38,598 | | 473 | 160 | 633 | | 15,680 | 23,551 | 39,231 |
Key points
| · | REIL increased by £3.1 billion or 26% in Core reflecting net increases in impaired loans in UK Corporate (£1.6 billion) and Ulster Bank (£1.4 billion). |
| · | In UK Corporate impaired loans increased reflecting a number of specific cases which resulted in REIL/PPL as a % of loans increasing from 2.2% to 3.7%. |
| · | Provisions, REIL and related coverage ratios in Ulster Bank increased reflecting a deterioration in customer credit quality due to a fall in Irish property prices. |
| · | In US Retail & Commercial, impairment losses declined following a gradual improvement in the underlying credit environment, throughout 2010. |
| · | Increase in provisions and related REIL in Non-Core reflected difficult conditions in specific sectors, particularly UK and Irish commercial property. |
Past due analysis
The table below shows loans and advances to customers that were past due at the balance sheet date but not considered impaired:
| | | | | | 2009 | | |
| | 2010 | | | | Group before RFS MI | | | | |
| | Core | Non-Core | Total | | Core | Non-Core | RFS MI | Group | | 2008 Group |
| | £m | £m | £m | | £m | £m | £m | £m | £m | | £m |
| Past due 1-29 days | 6,401 | 822 | 7,223 | | 5,101 | 1,486 | 6,587 | 1,209 | 7,796 | | 9,517 |
| Past due 30-59 days | 1,725 | 392 | 2,117 | | 1,943 | 357 | 2,300 | 424 | 2,724 | | 2,941 |
| Past due 60-89 days | 922 | 271 | 1,193 | | 2,203 | 207 | 2,410 | 177 | 2,587 | | 1,427 |
| Past due 90 days or more | 1,696 | 1,201 | 2,897 | | 1,358 | 1,820 | 3,178 | 46 | 3,224 | | 1,782 |
| | 10,744 | 2,686 | 13,430 | | 10,605 | 3,870 | 14,475 | 1,856 | 16,331 | | 15,667 |
Note:
| (1) | The amounts shown above include loans and advances to customers that are past due through administrative and other delays in recording payments or in finalising documentation and other events unrelated to credit quality. |
*unaudited
Business reviewcontinued | Business review |
| Risk and balance sheet management |
Risk management: Credit risk continued
REIL, provisions and reserves continued
Loans, REIL and impairments by industry and geography
The tables below analyse gross loans and advances to customers and banks (excluding reverse repos and disposal groups), REIL, provisions, impairment charge and amounts written-off relating to these loans, by industry and geography (by location of office).
| | Total |
| | Gross loans £m | REIL £m | Provisions £m | REIL as a % of gross loans % | Provisions as a % of REIL % | Provisions as a % of gross loans % | Impairment charge £m | Amounts written-off £m |
| 2010 |
| Central and local government | 8,452 | — | — | — | — | — | — | — |
| Finance | | | | | | | | |
| - banks | 58,036 | 145 | 127 | 0.2 | 88 | 0.2 | (13) | 12 |
| - other | 54,561 | 1,129 | 595 | 2.1 | 53 | 1.1 | 198 | 141 |
| Residential mortgages | 146,501 | 4,276 | 877 | 2.9 | 21 | 0.6 | 1,014 | 669 |
| Personal lending | 37,472 | 3,544 | 2,894 | 9.5 | 82 | 7.7 | 1,370 | 1,577 |
| Property | 90,106 | 19,584 | 6,736 | 21.7 | 34 | 7.5 | 4,682 | 1,009 |
| Construction | 12,032 | 2,464 | 875 | 20.5 | 36 | 7.3 | 530 | 146 |
| Manufacturing | 32,317 | 1,199 | 503 | 3.7 | 42 | 1.6 | (92) | 1,547 |
Service industries and business activities | 117,510 | 5,258 | 2,285 | 4.5 | 43 | 1.9 | 1,293 | 822 |
| Agriculture, forestry and fishing | 3,893 | 152 | 86 | 3.9 | 57 | 2.2 | 31 | 6 |
| Finance leases and instalment credit | 16,850 | 847 | 554 | 5.0 | 65 | 3.3 | 252 | 113 |
| Interest accruals | 1,109 | — | — | — | — | — | — | — |
| Latent | — | — | 2,650 | — | — | — | (121) | — |
| | 578,839 | 38,598 | 18,182 | 6.7 | 47 | 3.1 | 9,144 | 6,042 |
| of which: | | | | | | | | |
| UK | 382,609 | 18,111 | 8,537 | 4.7 | 47 | 2.2 | 3,912 | 2,271 |
| Europe | 94,119 | 16,436 | 7,270 | 17.5 | 44 | 7.7 | 3,878 | 1,663 |
| US | 75,430 | 2,330 | 1,643 | 3.1 | 71 | 2.2 | 1,020 | 1,660 |
| RoW | 26,681 | 1,721 | 732 | 6.5 | 43 | 2.7 | 334 | 448 |
| Group before RFS MI | 578,839 | 38,598 | 18,182 | 6.7 | 47 | 3.1 | 9,144 | 6,042 |
| RFS MI | 2 | — | — | — | — | — | 42 | — |
| Group | 578,841 | 38,598 | 18,182 | 6.7 | 47 | 3.1 | 9,186 | 6,042 |
Business reviewcontinued | Business review |
| Risk and balance sheet management |
Risk management: Credit risk continued
REIL, provisions and reserves continued
Loans, REIL and impairments by industry and geography continued
| | Total |
| 2009 | Gross loans £m | REIL £m | Provisions £m | REIL as a % of gross loans % | Provisions as a % of REIL % | Provisions as a % of gross loans % | Impairment charge £m | Amounts written-off £m |
| Central and local government | 7,660 | — | — | — | — | — | — | — |
| Finance | | | | | | | | |
| - banks | 48,934 | 206 | 157 | 0.4 | 76 | 0.3 | 34 | — |
| - other | 60,386 | 1,539 | 419 | 2.5 | 27 | 0.7 | 886 | 692 |
| Residential mortgages | 140,907 | 3,284 | 551 | 2.3 | 17 | 0.4 | 909 | 642 |
| Personal lending | 41,671 | 3,940 | 2,926 | 9.5 | 74 | 7.0 | 2,517 | 2,002 |
| Property | 99,426 | 14,318 | 3,422 | 14.4 | 24 | 3.4 | 3,296 | 650 |
| Construction | 14,760 | 2,232 | 519 | 15.1 | 23 | 3.5 | 479 | 287 |
| Manufacturing | 44,674 | 3,131 | 2,088 | 7.0 | 67 | 4.7 | 1,520 | 784 |
Service industries and business activities | 134,076 | 5,308 | 1,860 | 4.0 | 35 | 1.4 | 1,964 | 1,281 |
| Agriculture, forestry and fishing | 4,279 | 137 | 73 | 3.2 | 53 | 1.7 | 30 | 5 |
| Finance leases and instalment credit | 20,103 | 894 | 418 | 4.4 | 47 | 2.1 | 271 | 135 |
| Interest accruals | 1,728 | — | — | — | — | — | — | — |
| Latent | — | — | 2,740 | — | — | — | 1,184 | — |
| | 618,604 | 34,989 | 15,173 | 5.7 | 43 | 2.5 | 13,090 | 6,478 |
| of which: | | | | | | | | |
| UK | 394,297 | 16,104 | 6,922 | 4.1 | 43 | 1.8 | 5,593 | 2,924 |
| Europe | 107,803 | 13,390 | 5,449 | 12.4 | 41 | 5.1 | 3,270 | 427 |
| US | 84,072 | 4,115 | 2,020 | 4.9 | 49 | 2.4 | 3,273 | 2,656 |
| RoW | 32,432 | 1,380 | 782 | 4.3 | 57 | 2.4 | 954 | 471 |
| Group before RFS MI | 618,604 | 34,989 | 15,173 | 5.7 | 43 | 2.5 | 13,090 | 6,478 |
| RFS MI | 142,688 | 3,260 | 2,110 | 2.3 | 65 | 1.5 | 1,044 | 461 |
| Group | 761,292 | 38,249 | 17,283 | 5.0 | 45 | 2.3 | 14,134 | 6,939 |
Business reviewcontinued | Business review |
| Risk and balance sheet management |
Risk management: Credit risk continued
REIL, provisions and reserves continued
Loans, REIL and impairments by industry and geography continued
| | Core |
| | Gross loans £m | REIL £m | Provisions £m | REIL as a % of gross loans % | Provisions as a % of REIL % | Provisions as a % of gross loans % | Impairment charge £m | Amounts written-off £m |
| 2010 |
| Central and local government | 6,781 | — | — | — | — | — | — | — |
| Finance | | | | | | | | |
| - banks | 57,033 | 144 | 126 | 0.3 | 88 | 0.2 | (5) | 1 |
| - other | 46,910 | 567 | 402 | 1.2 | 71 | 0.9 | 191 | 53 |
| Residential mortgages | 140,359 | 3,999 | 693 | 2.8 | 17 | 0.5 | 578 | 243 |
| Personal lending | 33,581 | 3,131 | 2,545 | 9.3 | 81 | 7.6 | 1,157 | 1,271 |
| Property | 42,455 | 3,287 | 818 | 7.7 | 25 | 1.9 | 739 | 98 |
| Construction | 8,680 | 610 | 222 | 7.0 | 36 | 2.6 | 189 | 38 |
| Manufacturing | 25,797 | 555 | 266 | 2.2 | 48 | 1.0 | 119 | 124 |
Service industries and business activities | 95,127 | 2,576 | 948 | 2.7 | 37 | 1.0 | 687 | 349 |
| Agriculture, forestry and fishing | 3,758 | 94 | 57 | 2.5 | 61 | 1.5 | 24 | 5 |
| Finance leases and instalment credit | 8,321 | 244 | 140 | 2.9 | 57 | 1.7 | 63 | 42 |
| Interest accruals | 831 | — | — | — | — | — | — | — |
| Latent | — | — | 1,649 | — | — | — | (5) | — |
| | 469,633 | 15,207 | 7,866 | 3.2 | 52 | 1.7 | 3,737 | 2,224 |
| of which: | | | | | | | | |
| UK | 319,679 | 9,337 | 4,797 | 2.9 | 51 | 1.5 | 2,234 | 1,519 |
| Europe | 65,874 | 3,905 | 2,027 | 5.9 | 52 | 3.1 | 936 | 111 |
| US | 62,085 | 1,027 | 824 | 1.7 | 80 | 1.3 | 425 | 556 |
| RoW | 21,995 | 938 | 218 | 4.3 | 23 | 1.0 | 142 | 38 |
| Group before RFS MI | 469,633 | 15,207 | 7,866 | 3.2 | 52 | 1.7 | 3,737 | 2,224 |
| 2009 | | | | | | | | |
| Central and local government | 6,128 | — | — | — | — | — | — | — |
| Finance | | | | | | | | |
| - banks | 47,574 | 168 | 135 | 0.4 | 80 | 0.3 | 12 | — |
| - other | 50,673 | 1,038 | 259 | 2.0 | 25 | 0.5 | 256 | 113 |
| Residential mortgages | 127,975 | 2,670 | 341 | 2.1 | 13 | 0.3 | 305 | 146 |
| Personal lending | 35,313 | 3,344 | 2,560 | 9.5 | 77 | 7.2 | 1,816 | 1,398 |
| Property | 49,054 | 1,766 | 468 | 3.6 | 27 | 1.0 | 417 | 37 |
| Construction | 9,502 | 457 | 131 | 4.8 | 29 | 1.4 | 58 | 30 |
| Manufacturing | 30,272 | 491 | 191 | 1.6 | 39 | 0.6 | 136 | 93 |
Service industries and business activities | 100,438 | 1,762 | 669 | 1.8 | 38 | 0.7 | 500 | 365 |
| Agriculture, forestry and fishing | 3,726 | 90 | 46 | 2.4 | 51 | 1.2 | 24 | 4 |
| Finance leases and instalment credit | 8,147 | 303 | 116 | 3.7 | 38 | 1.4 | 52 | 100 |
| Interest accruals | 1,179 | — | — | — | — | — | — | — |
| Latent | — | — | 2,005 | — | — | — | 991 | — |
| | 469,981 | 12,089 | 6,921 | 2.6 | 57 | 1.5 | 4,567 | 2,286 |
| of which: | | | | | | | | |
| UK | 315,254 | 7,704 | 4,209 | 2.4 | 55 | 1.3 | 2,884 | 1,645 |
| Europe | 66,707 | 2,607 | 1,709 | 3.9 | 66 | 2.6 | 750 | 46 |
| US | 64,526 | 1,497 | 876 | 2.3 | 59 | 1.4 | 813 | 576 |
| RoW | 23,494 | 281 | 127 | 1.2 | 45 | 0.5 | 120 | 19 |
| Group before RFS MI | 469,981 | 12,089 | 6,921 | 2.6 | 57 | 1.5 | 4,567 | 2,286 |
Business reviewcontinued | Business review |
| Risk and balance sheet management |
Risk management: Credit risk continued
REIL, provisions and reserves continued
Loans, REIL and impairments by industry and geography continued
| | Non-Core |
| | Gross loans £m | REIL £m | Provisions £m | REIL as a % of gross loans % | Provisions as a % of REIL % | Provisions as a %of gross loans % | Impairment charge £m | Amounts written-off £m |
| 2010 |
| Central and local government | 1,671 | — | — | — | — | — | — | — |
| Finance | | | | | | | | |
| - banks | 1,003 | 1 | 1 | 0.1 | 100 | 0.1 | (8) | 11 |
| - other | 7,651 | 562 | 193 | 7.3 | 34 | 2.5 | 7 | 88 |
| Residential mortgages | 6,142 | 277 | 184 | 4.5 | 66 | 3.0 | 436 | 426 |
| Personal lending | 3,891 | 413 | 349 | 10.6 | 85 | 9.0 | 213 | 306 |
| Property | 47,651 | 16,297 | 5,918 | 34.2 | 36 | 12.4 | 3,943 | 911 |
| Construction | 3,352 | 1,854 | 653 | 55.3 | 35 | 19.5 | 341 | 108 |
| Manufacturing | 6,520 | 644 | 237 | 9.9 | 37 | 3.6 | (211) | 1,423 |
Service industries and business activities | 22,383 | 2,682 | 1,337 | 12.0 | 50 | 6.0 | 606 | 473 |
| Agriculture, forestry and fishing | 135 | 58 | 29 | 43.0 | 50 | 21.5 | 7 | 1 |
| Finance leases and instalment credit | 8,529 | 603 | 414 | 7.1 | 69 | 4.9 | 189 | 71 |
| Interest accruals | 278 | — | — | — | — | — | — | — |
| Latent | — | — | 1,001 | — | — | — | (116) | — |
| | 109,206 | 23,391 | 10,316 | 21.4 | 44 | 9.4 | 5,407 | 3,818 |
| of which: | | | | | | | | |
| UK | 62,930 | 8,774 | 3,740 | 13.9 | 43 | 5.9 | 1,678 | 752 |
| Europe | 28,245 | 12,531 | 5,243 | 44.4 | 42 | 18.6 | 2,942 | 1,552 |
| US | 13,345 | 1,303 | 819 | 9.8 | 63 | 6.1 | 595 | 1,104 |
| RoW | 4,686 | 783 | 514 | 16.7 | 66 | 11.0 | 192 | 410 |
| Group before RFS MI | 109,206 | 23,391 | 10,316 | 21.4 | 44 | 9.4 | 5,407 | 3,818 |
| 2009 | | | | | | | | |
| Central and local government | 1,532 | — | — | — | — | — | — | — |
| Finance | | | | | | | | |
| - banks | 1,360 | 38 | 22 | 2.8 | 58 | 1.6 | 22 | — |
| - other | 9,713 | 501 | 160 | 5.2 | 32 | 1.6 | 630 | 579 |
| Residential mortgages | 12,932 | 614 | 210 | 4.7 | 34 | 1.6 | 604 | 496 |
| Personal lending | 6,358 | 596 | 366 | 9.4 | 61 | 5.8 | 701 | 604 |
| Property | 50,372 | 12,552 | 2,954 | 24.9 | 24 | 5.9 | 2,879 | 613 |
| Construction | 5,258 | 1,775 | 388 | 33.8 | 22 | 7.4 | 421 | 257 |
| Manufacturing | 14,402 | 2,640 | 1,897 | 18.3 | 72 | 13.2 | 1,384 | 691 |
Service industries and business activities | 33,638 | 3,546 | 1,191 | 10.5 | 34 | 3.5 | 1,464 | 916 |
| Agriculture, forestry and fishing | 553 | 47 | 27 | 8.5 | 57 | 4.9 | 6 | 1 |
| Finance leases and instalment credit | 11,956 | 591 | 302 | 4.9 | 51 | 2.5 | 219 | 35 |
| Interest accruals | 549 | — | — | — | — | — | — | — |
| Latent | — | — | 735 | — | — | — | 193 | — |
| | 148,623 | 22,900 | 8,252 | 15.4 | 36 | 5.6 | 8,523 | 4,192 |
| of which: | | | | | | | | |
| UK | 79,043 | 8,400 | 2,713 | 10.6 | 32 | 3.4 | 2,709 | 1,279 |
| Europe | 41,096 | 10,783 | 3,740 | 26.2 | 35 | 9.1 | 2,520 | 381 |
| US | 19,546 | 2,618 | 1,144 | 13.4 | 44 | 5.9 | 2,460 | 2,080 |
| RoW | 8,938 | 1,099 | 655 | 12.3 | 60 | 7.3 | 834 | 452 |
| Group before RFS MI | 148,623 | 22,900 | 8,252 | 15.4 | 36 | 5.6 | 8,523 | 4,192 |
Business reviewcontinued | Business review |
| Risk and balance sheet management |
Risk management: Credit risk continued
REIL, provisions and reserves continued
Risk elements in lending and potential problem loans by division
The tables below analyse the Group’s loans and advances to banks and customers (excluding reverse repos and disposal groups) and related REIL, PPL, provisions, impairments, amounts written-off and related ratios by division.
| | Gross loans | REIL | PPL | REIL & PPL | Provisions | Provisions as % of REIL | Provisions as % of REIL & PPL | REIL & PPL as a % of gross loans | Impairment charge | Amounts written-off |
| 2010 | £m | £m | £m | £m | £m | % | % | % | £m | £m |
| UK Retail | 108,813 | 4,620 | 175 | 4,795 | 2,741 | 59 | 57 | 4.4 | 1,160 | 1,135 |
| UK Corporate | 111,744 | 3,967 | 221 | 4,188 | 1,732 | 44 | 41 | 3.7 | 761 | 349 |
| Wealth | 18,350 | 223 | 38 | 261 | 66 | 30 | 25 | 1.4 | 18 | 9 |
| Global Transaction Services | 17,484 | 146 | 6 | 152 | 147 | 101 | 97 | 0.9 | 8 | 49 |
| Ulster Bank | 39,786 | 3,619 | 2 | 3,621 | 1,633 | 45 | 45 | 9.1 | 1,161 | 48 |
| US Retail & Commercial | 48,661 | 913 | — | 913 | 505 | 55 | 55 | 1.9 | 483 | 547 |
| Retail & Commercial | 344,838 | 13,488 | 442 | 13,930 | 6,824 | 51 | 49 | 4.0 | 3,591 | 2,137 |
| Global Banking & Markets | 122,054 | 1,719 | 31 | 1,750 | 1,042 | 61 | 60 | 1.4 | 146 | 87 |
| RBS Insurance and other | 2,741 | — | — | — | — | — | — | — | — | — |
| Core | 469,633 | 15,207 | 473 | 15,680 | 7,866 | 52 | 50 | 3.3 | 3,737 | 2,224 |
| Non-Core | 109,206 | 23,391 | 160 | 23,551 | 10,316 | 44 | 44 | 21.6 | 5,407 | 3,818 |
| Group before RFS MI | 578,839 | 38,598 | 633 | 39,231 | 18,182 | 47 | 46 | 6.8 | 9,144 | 6,042 |
| RFS MI | 2 | — | — | — | — | — | — | — | 42 | — |
| Group | 578,841 | 38,598 | 633 | 39,231 | 18,182 | 47 | 46 | 6.8 | 9,186 | 6,042 |
| | | | | | | | | | | |
| 2009 | | | | | | | | | | |
| UK Retail | 103,812 | 4,641 | — | 4,641 | 2,677 | 58 | 58 | 4.5 | 1,679 | 1,150 |
| UK Corporate | 111,671 | 2,330 | 97 | 2,427 | 1,271 | 55 | 52 | 2.2 | 923 | 352 |
| Wealth | 15,525 | 218 | 38 | 256 | 55 | 25 | 21 | 1.6 | 33 | 12 |
| Global Transaction Services | 14,146 | 197 | 4 | 201 | 189 | 96 | 94 | 1.4 | 39 | 23 |
| Ulster Bank | 42,344 | 2,260 | 2 | 2,262 | 962 | 43 | 43 | 5.3 | 649 | 34 |
| US Retail & Commercial | 48,937 | 643 | — | 643 | 478 | 74 | 74 | 1.3 | 702 | 546 |
| Retail & Commercial | 336,435 | 10,289 | 141 | 10,430 | 5,632 | 55 | 54 | 3.1 | 4,025 | 2,117 |
| Global Banking & Markets | 130,898 | 1,800 | 131 | 1,931 | 1,289 | 72 | 67 | 1.5 | 542 | 169 |
| RBS Insurance and other | 2,648 | — | — | — | — | — | — | — | — | — |
| Core | 469,981 | 12,089 | 272 | 12,361 | 6,921 | 57 | 56 | 2.6 | 4,567 | 2,286 |
| Non-Core | 148,623 | 22,900 | 652 | 23,552 | 8,252 | 36 | 35 | 15.8 | 8,523 | 4,192 |
| Group before RFS MI | 618,604 | 34,989 | 924 | 35,913 | 15,173 | 43 | 42 | 5.8 | 13,090 | 6,478 |
| RFS MI | 142,688 | 3,260 | 85 | 3,345 | 2,110 | 65 | 63 | 2.3 | 1,044 | 461 |
Group | 761,292 | 38,249 | 1,009 | 39,258 | 17,283 | 45 | 44 | 5.2 | 14,134 | 6,939 |
| | | | | | | | | | | |
| 2008 | | | | | | | | | | |
| UK Retail | 94,565 | 3,832 | — | 3,832 | 2,086 | 54 | 54 | 4.1 | 1,019 | 823 |
| UK Corporate | 117,036 | 1,254 | 74 | 1,328 | 696 | 56 | 52 | 1.1 | 319 | 377 |
| Wealth | 14,033 | 107 | 24 | 131 | 34 | 32 | 26 | 0.9 | 15 | 8 |
| Global Transaction Services | 16,950 | 53 | — | 53 | 43 | 81 | 81 | 0.3 | 48 | 15 |
| Ulster Bank | 46,628 | 1,196 | 1 | 1,197 | 491 | 41 | 41 | 2.6 | 106 | 20 |
| US Retail & Commercial | 62,168 | 424 | — | 424 | 298 | 70 | 70 | 0.7 | 437 | 312 |
| Retail & Commercial | 351,380 | 6,866 | 99 | 6,965 | 3,648 | 53 | 52 | 2.0 | 1,944 | 1,555 |
| Global Banking & Markets | 227,116 | 869 | 18 | 887 | 621 | 71 | 70 | 0.4 | 306 | 343 |
| RBS Insurance and other | 6,401 | — | — | — | — | — | — | — | — | 80 |
| Core | 584,897 | 7,735 | 117 | 7,852 | 4,269 | 55 | 54 | 1.3 | 2,250 | 1,978 |
| Non-Core | 187,258 | 11,056 | 109 | 11,165 | 5,182 | 47 | 46 | 6.0 | 4,228 | 919 |
| Group before RFS MI | 772,155 | 18,791 | 226 | 19,017 | 9,451 | 50 | 50 | 2.5 | 6,478 | 2,897 |
| RFS MI | 153,696 | 2,470 | — | 2,470 | 1,565 | 63 | 63 | 1.6 | 613 | 251 |
Group | 925,851 | 21,261 | 226 | 21,487 | 11,016 | 52 | 51 | 2.3 | 7,091 | 3,148 |
Business reviewcontinued | Business review |
| Risk and balance sheet management |
Risk management: Credit risk continued
REIL, provisions and reserves continued
Impairment loss provision methodology
Provisions for impairment losses are assessed under three categories:
| · | Individually assessed provisions: provisions required for individually significant impaired assets which are assessed on a case by case basis, taking into account the financial condition of the counterparty and any guarantee and other collateral held after being stressed for downside risk. This incorporates an estimate of the discounted value of any recoveries and realisation of security or collateral. The asset continues to be assessed on an individual basis until it is repaid in full, transferred to the performing portfolio or written-off; |
| · | Collectively assessed provisions: provisions on impaired credits below an agreed threshold which are assessed on a portfolio basis, to reflect the homogeneous nature of the assets, such as credit cards or personal loans. The provision is determined from a quantitative review of the relevant portfolio, taking account of the level of arrears, security and average loss experience over the recovery period. It incorporates loss experience adjustments, where appropriate, in the light of current economic and credit conditions. These include review of current cash collections profile performance against historic trends, updates to metric inputs - including model recalibrations and monitoring of operational processes used in managing exposure - including the time taken to process non-performing exposures; and |
| · | Latent loss provisions: provisions held against impairments in the performing portfolio that have been incurred as a result of events occurring before the balance sheet date but which have not been identified at the balance sheet date. The Group has developed methodologies to estimate latent loss provisions that reflect: |
| – historical loss experience adjusted where appropriate, in the light of current economic and credit conditions; and |
| – the period (‘emergence period’) between an impairment event occurring and a loan being identified and reported as impaired. |
| · | Recoverable cash flows or proceeds are estimated using two parameters: loss given default (LGD) - this is the estimated loss amount, expressed as a percentage, that will be incurred if the borrower defaults; and the probability that the borrower will default (PD). |
| · | Emergence periods are estimated at a portfolio level and reflect the portfolio product characteristics such as a coupon period and repayment terms, and the duration of the administrative process required to report and identify an impaired loan as such. Emergence periods vary across different portfolios from 2 to 225 days. They are based on actual experience within the particular portfolio and are reviewed regularly. |
| · | The Group's retail business segment their performing loan books into homogenous portfolios such as mortgages, credit cards or unsecured loans, to reflect their different credit characteristics. Latent provisions are computed by applying portfolio-level LGDs, PDs and emergence periods. The wholesale calculation is based on similar principles but there is no segmentation into portfolios: PDs and LGDs are calculated on an individual basis. |
| · | Once a loss event has occurred, a loan is assessed for an impairment provision. In the case of loans that are restructured due to the financial condition of the borrower, the loss event and consequent loan impairment provision assessment (based on management’s best estimate of the incurred loss) almost invariably take place prior to the restructuring. The quantum of the loan impairment provision may change once the terms of the restructuring are known resulting in an additional provision charge or a release of provision in the period in which the restructuring takes place. |
Provisions and AFS reserves
The Group's consumer portfolios, which consist of high volume, small value credits, have highly efficient largely automated processes for identifying problem credits and very short timescales, typically three months, before resolution or adoption of various recovery methods. Corporate portfolios consist of higher value, lower volume credits, which tend to be structured to meet individual customer requirements.
Provisions are assessed on a case by case basis by experienced specialists with input from professional valuers and accountants. The Group operates a transparent provisions governance framework, setting thresholds to trigger enhanced oversight and challenge.
Analyses of provisions are set out on page 129.
Available-for-sale financial assets are initially recognised at fair value plus directly related transaction costs and are subsequently measured at fair value with changes in fair value reported in owners’ equity until disposal, at which stage the cumulative gain or loss is recognised in profit or loss. When there is objective evidence that an available-for-sale financial asset is impaired, any decline in its fair value below original cost is removed from equity and recognised in profit or loss.
Impairment losses are recognised when there is objective evidence of impairment. The Group reviews its portfolios of available-for-sale financial assets for such evidence which includes: default or delinquency in interest or principal payments; significant financial difficulty of the issuer or obligor; and it becoming probable that the issuer will enter bankruptcy or other financial reorganisation. However, the disappearance of an active market because an entity’s financial instruments are no longer publicly traded is not evidence of impairment. Furthermore, a downgrade of an entity’s credit rating is not, of itself, evidence of impairment, although it may be evidence of impairment when considered with other available information. A decline in the fair value of a financial asset below its cost or amortised cost is not necessarily evidence of impairment. Determining whether objective evidence of impairment exists requires the exercise of management judgment. The unrecognised losses on the Group’s available-for-sale debt securities are concentrated in its portfolios of mortgage-backed securities. The losses reflect the widening of credit spreads as a result of the reduced market liquidity in these securities and the current uncertain macroeconomic outlook in the US and Europe. The underlying securities remain unimpaired.
Analyses of AFS debt securities and related AFS reserves are set out on pages 131 and 132.
Business reviewcontinued | Business review |
| Risk and balance sheet management |
Risk management: Credit risk continued
REIL, provisions and reserves continued
Movement in loan impairment provisions
The movement in provisions balance by division is shown in the table below.
| | UK Retail | UK Corporate | Wealth | GTS (1) | Ulster Bank | US R&C (2) | | Total R&C (2) | GBM (3) | | Total Core | Non-Core | RFS MI | Group |
| 2010 | £m | £m | £m | £m | £m | £m | | £m | £m | | £m | £m | £m | £m |
| At 1 January | 2,677 | 1,271 | 55 | 189 | 962 | 478 | | 5,632 | 1,289 | | 6,921 | 8,252 | 2,110 | 17,283 |
| Intra-group transfers | — | — | — | — | (351) | — | | (351) | (217) | | (568) | 568 | — | — |
| Transfer to disposal groups | — | — | — | — | — | — | | — | — | | — | (72) | — | (72) |
| Currency translation and other adjustments | — | 71 | 4 | (2) | (22) | 19 | | 70 | (86) | | (16) | 59 | — | 43 |
| Disposal of subsidiaries | — | — | — | — | — | — | | — | — | | — | (20) | (2,152) | (2,172) |
| Amounts written-off | (1,135) | (349) | (9) | (49) | (48) | (547) | | (2,137) | (87) | | (2,224) | (3,818) | — | (6,042) |
| Recoveries of amounts previously written-off | 128 | 8 | — | 1 | 1 | 72 | | 210 | 3 | | 213 | 198 | — | 411 |
| Charged to the income statement | | | | | | | | | | | | | | |
| - continuing operations | 1,160 | 761 | 18 | 8 | 1,161 | 483 | | 3,591 | 146 | | 3,737 | 5,407 | — | 9,144 |
- discontinued operations | — | — | — | — | — | — | | — | — | | — | — | 42 | 42 |
| Unwind of discount | (89) | (30) | (2) | — | (70) | — | | (191) | (6) | | (197) | (258) | — | (455) |
| At 31 December | 2,741 | 1,732 | 66 | 147 | 1,633 | 505 | | 6,824 | 1,042 | | 7,866 | 10,316 | — | 18,182 |
| | | | | | | | | | | | | | | |
| Individually assessed | | | | | | | | | | | | | | |
| - banks | — | — | 2 | 7 | — | — | | 9 | 117 | | 126 | 1 | — | 127 |
| - customers | — | 546 | 57 | 111 | 502 | 56 | | 1,272 | 676 | | 1,948 | 8,161 | — | 10,109 |
| Collectively assessed | 2,526 | 689 | — | 14 | 733 | 177 | | 4,139 | — | | 4,139 | 1,157 | — | 5,296 |
| Latent | 215 | 497 | 7 | 15 | 398 | 272 | | 1,404 | 249 | | 1,653 | 997 | — | 2,650 |
| | 2,741 | 1,732 | 66 | 147 | 1,633 | 505 | | 6,824 | 1,042 | | 7,866 | 10,316 | — | 18,182 |
| | | | | | | | | | | | | | | |
| 2009 | | | | | | | | | | | | | | |
| At 1 January | 2,086 | 696 | 34 | 43 | 491 | 298 | | 3,648 | 621 | | 4,269 | 5,182 | 1,565 | 11,016 |
| Transfer to disposal groups | — | — | — | — | — | — | | — | (16) | | (16) | (305) | (3) | (324) |
| Currency translation and other adjustments | 67 | 5 | 1 | 128 | (109) | (34) | | 58 | 365 | | 423 | (851) | (102) | (530) |
| Disposal of subsidiaries | — | — | — | — | — | — | | — | (62) | | (62) | (3) | — | (65) |
| Amounts written-off | (1,150) | (352) | (12) | (23) | (34) | (546) | | (2,117) | (169) | | (2,286) | (4,192) | (461) | (6,939) |
| Recoveries of amounts previously written-off | 97 | 20 | — | 2 | 1 | 58 | | 178 | 11 | | 189 | 136 | 74 | 399 |
| Charged to the income statement | | | | | | | | | | | | | | |
| - continuing operations | 1,679 | 923 | 33 | 39 | 649 | 702 | | 4,025 | 542 | | 4,567 | 8,523 | — | 13,090 |
| - discontinued operations | — | — | — | — | — | — | | — | — | | — | — | 1,044 | 1,044 |
| Unwind of discount | (102) | (21) | (1) | — | (36) | — | | (160) | (3) | | (163) | (238) | (7) | (408) |
| At 31 December | 2,677 | 1,271 | 55 | 189 | 962 | 478 | | 5,632 | 1,289 | | 6,921 | 8,252 | 2,110 | 17,283 |
| | | | | | | | | | | | | | | |
| Individually assessed | | | | | | | | | | | | | | |
| - banks | — | — | 2 | 8 | — | — | | 10 | 125 | | 135 | 22 | — | 157 |
| - customers | — | 205 | 44 | 156 | 280 | 14 | | 699 | 573 | | 1,272 | 6,229 | 1,295 | 8,796 |
| Collectively assessed | 2,475 | 475 | — | 17 | 412 | 130 | | 3,509 | — | | 3,509 | 1,266 | 479 | 5,254 |
| Latent | 202 | 591 | 9 | 8 | 270 | 334 | | 1,414 | 591 | | 2,005 | 735 | 336 | 3,076 |
| | 2,677 | 1,271 | 55 | 189 | 962 | 478 | | 5,632 | 1,289 | | 6,921 | 8,252 | 2,110 | 17,283 |
Notes:
| (1) | Global Transaction Services. |
| (3) | Global Banking & Markets. |
Business reviewcontinued | Business review |
| Risk and balance sheet management |
Risk management: Credit risk continued
REIL, provisions and reserves continued
Analysis of loan impairment charge
The following table analyses impairment losses.
| | 2010 £m | 2009 £m | 2008 £m |
| |
| Latent loss | (121) | 1,184 | 769 |
| Collectively assessed | 3,070 | 3,994 | 2,391 |
| Individually assessed | 6,208 | 7,878 | 3,200 |
| Loans to customers | 9,157 | 13,056 | 6,360 |
| Loans to banks | (13) | 34 | 118 |
| Securities | 112 | 809 | 961 |
| Charge to income statement | 9,256 | 13,899 | 7,439 |
| | | | |
Charge relating to customer loans as a % of gross customer loans (1) | 1.7% | 2.3% | 0.9% |
Note:
| (1) | Gross of provisions and excluding reverse repurchase agreements and including gross loans relating to disposal groups. |
| | 2010 | | 2009 | | 2008 |
| | Core £m | Non-Core £m | Group £m | | Core £m | Non-Core £m | Group £m | | Group £m |
| Loan impairment losses | | | | | | | | | |
| - customers | 3,742 | 5,415 | 9,157 | | 4,555 | 8,501 | 13,056 | | 6,360 |
| - banks | (5) | (8) | (13) | | 12 | 22 | 34 | | 118 |
| | 3,737 | 5,407 | 9,144 | | 4,567 | 8,523 | 13,090 | | 6,478 |
| | | | | | | | | | |
| Impairment losses on securities | | | | | | | | | |
| - debt securities | 40 | 41 | 81 | | 98 | 503 | 601 | | 858 |
| - equity securities | 4 | 27 | 31 | | 13 | 195 | 208 | | 103 |
| | 44 | 68 | 112 | | 111 | 698 | 809 | | 961 |
| | | | | | | | | | |
| Charge to income statement | 3,781 | 5,475 | 9,256 | | 4,678 | 9,221 | 13,899 | | 7,439 |
Key point
| · | Provisions are 3.44% of loans and advances at 31 December 2010, compared with 2.69% at 31 December 2009. Non-Core figures were 9.14% versus 5.79%. |
Business reviewcontinued | Business review |
| Risk and balance sheet management |
Risk management: Credit risk continued
REIL, provisions and reserves continued
Available-for-sale debt securities and related reserves
The table below analyses available-for-sale (AFS) debt securities by issuer and related AFS reserves, for countries exceeding £0.5 billion at any reporting date below, together with the total of those individually less than £0.5 billion.
| | 2010 | | 2009 |
| | Government | ABS | Other | Total | AFS reserves | | Government | ABS | Other | Total | AFS reserves |
| | £m | £m | £m | £m | £m | | £m | £m | £m | £m | £m |
| US | 17,890 | 20,872 | 763 | 39,525 | (116) | | 12,789 | 24,788 | 668 | 38,245 | (302) |
| UK | 8,377 | 4,002 | 2,284 | 14,663 | (106) | | 18,350 | 4,372 | 3,267 | 25,989 | (169) |
| Germany | 10,653 | 1,360 | 535 | 12,548 | (35) | | 12,283 | 1,036 | 406 | 13,725 | (24) |
| Netherlands | 3,469 | 6,773 | 713 | 10,955 | (59) | | 4,329 | 7,522 | 1,558 | 13,409 | (115) |
| France | 5,912 | 575 | 900 | 7,387 | 33 | | 6,456 | 543 | 812 | 7,811 | 9 |
| Spain | 88 | 6,773 | 169 | 7,030 | (939) | | 162 | 8,070 | 355 | 8,587 | (117) |
| Japan | 4,354 | — | 82 | 4,436 | — | | 1,426 | — | 100 | 1,526 | (7) |
| Australia | — | 486 | 1,586 | 2,072 | (34) | | — | 581 | 1,213 | 1,794 | (85) |
| Italy | 906 | 243 | 24 | 1,173 | (86) | | 1,007 | 380 | 72 | 1,459 | (39) |
| Belgium | 763 | 34 | 243 | 1,040 | (34) | | 788 | 34 | 397 | 1,219 | (24) |
| Hong Kong | 905 | — | 8 | 913 | — | | 975 | — | — | 975 | — |
| Greece | 895 | — | — | 895 | (517) | | 1,389 | — | — | 1,389 | (196) |
| Singapore | 649 | — | 209 | 858 | — | | 564 | 13 | 105 | 682 | — |
| Switzerland | 657 | — | 156 | 813 | 11 | | 653 | — | 28 | 681 | 11 |
| Denmark | 629 | — | 172 | 801 | 2 | | 659 | — | 256 | 915 | 2 |
| South Korea | 261 | 429 | — | 690 | (2) | | — | 526 | — | 526 | (3) |
| Republic of Ireland | 104 | 177 | 408 | 689 | (74) | | 150 | 529 | 319 | 998 | (154) |
| India | 548 | — | 139 | 687 | 2 | | 480 | — | — | 480 | 3 |
| Luxembourg | 253 | 78 | 226 | 557 | 20 | | — | 222 | 307 | 529 | 11 |
| Austria | 274 | 51 | 152 | 477 | (20) | | 249 | 202 | 142 | 593 | (17) |
| Portugal | 92 | 106 | 43 | 241 | (36) | | 552 | 125 | 45 | 722 | (18) |
Other (individually < £0.5 billion) | 1,710 | 556 | 414 | 2,680 | (71) | | 1,605 | 1,521 | 2 | 3,128 | (654) |
| Group before RFS MI | 59,389 | 42,515 | 9,226 | 111,130 | (2,061) | | 64,866 | 50,464 | 10,052 | 125,382 | (1,888) |
| RFS MI | — | — | — | — | — | | 12,689 | 580 | 4,647 | 17,916 | 170 |
| Group | 59,389 | 42,515 | 9,226 | 111,130 | (2,061) | | 77,555 | 51,044 | 14,699 | 143,298 | (1,718) |
Key points
| · | Exposure to Spain reduced by £1.6 billion during 2010, largely in residential mortgage-backed covered bond exposures to financial institutions. |
| · | Italian exposures declined by £0.3 billion during 2010 from a combination of reductions in corporate clients and financial institutions, primarily in GBM. |
| · | The £500 million reductions in both Greek and Portuguese exposures primarily reflect disposals. |
Business reviewcontinued | Business review |
| Risk and balance sheet management |
Risk management: Credit risk continued
REIL, provisions and reserves continued
Available-for-sale debt securities: gross unrealised losses
The table below shows the fair value of available-for-sale debt securities that were in an unrealised loss position at 31 December, and the related gross unrealised losses.
| | Less than 12 months | | More than 12 months | | Total |
| | | Gross | | | Gross | | | Gross |
| | | unrealised | | | unrealised | | | unrealised |
| | Fair value | losses | | Fair value | losses | | Fair value | losses |
| 2010 | £m | £m | | £m | £m | | £m | £m |
| UK central and local government | 716 | 10 | | — | — | | 716 | 10 |
| US central and local government | 51 | 1 | | 4 | — | | 55 | 1 |
| Other central and local government | 4,327 | 6 | | 1,737 | 612 | | 6,064 | 618 |
| Banks and building societies | 1,649 | 16 | | 462 | 16 | | 2,111 | 32 |
| Asset backed securities | 2,519 | 101 | | 12,867 | 3,296 | | 15,386 | 3,397 |
| Corporate | 204 | 4 | | 108 | 32 | | 312 | 36 |
| Other | 463 | — | | 11 | 3 | | 474 | 3 |
| | 9,929 | 138 | | 15,189 | 3,959 | | 25,118 | 4,097 |
| | | | | | | | | |
| 2009 | | | | | | | | |
| UK central and local government | 2,727 | 57 | | 26 | — | | 2,753 | 57 |
| US central and local government | 5,349 | 88 | | 7 | 1 | | 5,356 | 89 |
| Other central and local government | 5,863 | 203 | | 391 | 6 | | 6,254 | 209 |
| Banks and building societies | 8,421 | 56 | | 827 | 6 | | 9,248 | 62 |
| Asset backed securities | 3,185 | 983 | | 23,832 | 2,330 | | 27,017 | 3,313 |
| Corporate | 384 | 14 | | 166 | 34 | | 550 | 48 |
| Other | 710 | 3 | | 16 | 3 | | 726 | 6 |
| Group before RFS MI | 26,639 | 1,404 | | 25,265 | 2,380 | | 51,904 | 3,784 |
| RFS MI | 1,890 | 64 | | 161 | 62 | | 2,051 | 126 |
| Group | 28,529 | 1,468 | | 25,426 | 2,442 | | 53,955 | 3,910 |
| | | | | | | | | |
| 2008 | | | | | | | | |
| US central and local government | 260 | 3 | | 4,770 | 163 | | 5,030 | 166 |
| Other central and local government | 13,341 | 555 | | 39 | 6 | | 13,380 | 561 |
| Banks and building societies | 1,402 | 95 | | 1,168 | 49 | | 2,570 | 144 |
| Asset backed securities | 15,032 | 2,432 | | 25,033 | 693 | | 40,065 | 3,125 |
| Corporate | 618 | 267 | | 2,325 | 136 | | 2,943 | 403 |
| Other | 9 | 1 | | 235 | 78 | | 244 | 79 |
| Group before RFS MI | 30,662 | 3,353 | | 33,570 | 1,125 | | 64,232 | 4,478 |
| RFS MI | 4,598 | 3,303 | | 6,032 | 49 | | 10,630 | 3,352 |
| Group | 35,260 | 6,656 | | 39,602 | 1,174 | | 74,862 | 7,830 |
Business reviewcontinued | Business review |
| Risk and balance sheet management |
Market risk (audited)
All the disclosures in this section (pages 133 to 138) are audited unless indicated otherwise with an asterisk (*).
Market risk arises from changes in interest rates, foreign currency, credit spread, equity prices and risk related factors such as market volatilities. Market risk is actively managed and aligned with the Group’s risk appetite. Market conditions were difficult throughout 2008 with significant volatility and write-downs across markets and portfolios.
The Group manages market risk in thecentrally within its trading and non-trading (treasury) portfolios using thethrough a comprehensive market risk management framework. TheThis framework includes limits based on, but not limited to,value-at-risk (VaR) limits, backtesting,, stress testing, scenario analysis, position/positions and sensitivity analysis and model validation.analyses.
The focusmajority of market risk exposure is in GBM and Non-Core. The Group is also exposed to market risk through 2008 has beeninterest rate risk on overhaulingits non-trading activities. There are additional non-trading market risks in the Retail and reviewingCommercial businesses of the Group, principally interest rate risk and foreign exchange risk. These aspects are discussed in more detail in Balance sheet management - Interest rate risk on page 83 and structural foreign currency exposures on page 84.
Organisation and structure
The Executive Risk Forum approves market risk appetite for trading and non-trading activities. The Global Head of Market & Insurance Risk is responsible for the Group Market Risk Control Framework and under delegated authority from the Executive Risk Forum, sets a limit framework within the context of the approved market risk appetite, which is cascaded down through legal entity, division, business and desk level market risk limits.
A daily report summarises the Group’s market risk exposures against agreed limits. This daily report is sent to the Head of Restructuring & Risk, Global Head of Market & Insurance Risk, business Chief Risk Officers and appropriate business Risk Managers.
The head of each business, assisted by the business risk management team, is accountable for all market risks associated with its activities. Oversight and support is provided to the business by the Global Head of Market & Insurance Risk, assisted by the Group and business Market Risk teams. The Global Market Risk Committee reviews and makes recommendations concerning the market risk profile across the Group, including risk appetite, limits for trading book activities, reflecting market performance and events.utilisation. The Committee meets monthly and is chaired by the Global Head of Market Risk & Insurance Risk. Attendees include respective business Risk Managers and Group Market Risk.
Measurement (audited)Risk measurement and control
A numberAt the Group level, the risk appetite is expressed in the form of techniques are used to calculate the Group’s exposure to market risk, includinga combination of VaR, sensitivity analysis and stress testing.
testing limits. VaR is a technique that produces estimates of the potential change in the market value of a portfolio over a specified time horizon at given confidence levels. For internal risk management purposes, the Group’s VaR assumes a time horizon of one trading day and a confidence level of 95%99%. The trading book market riskGroup's VaR model is calculated using VaR atbased on a confidence level of 99% and a time horizon of ten trading days. From 2009,historical simulation model, utilising data from the Group is adopting 99% confidence limits, in line with industry practice.previous two years.
The Group calculates VaR using historical simulation models but does not make any assumption aboutmodel has been approved by the nature or type of underlying loss distribution.FSA to calculate regulatory capital for the trading book. The methodology uses the previous 500 trading days of market data and calculates bothapproval covers general market risk (i.e.in interest rate, foreign exchange, equity and limited commodity products and specific risk in interest rate and equity products.
As the risk due to movement in general market benchmarks) and idiosyncraticVaR model is an important market risk (i.e.measurement and control tool and is used for determining a significant component of the market risk due to movementscapital, it is regularly assessed. The main approach employed is the technique known as back-testing which counts the number of days when a loss (as defined by the FSA), exceeds the corresponding daily VaR estimate, measured at a 99% confidence interval. The FSA categorises a VaR model as green, amber or red. A green model is consistent with a good working model and is achieved for models that have four or less back-testing exceptions in a 12 month period. For the valueGroup’s trading book, a green model status was maintained throughout 2010.
The Group’s VaR should be interpreted in light of securities by reference to specific issuers). All VaR models havethe limitations which include:of the methodology used, as follows:
● | Historical dataSimulation VaR may not provide the best estimate of the joint distributionfuture market movements. It can only provide a prediction of risk factor changes in the future and may fail to capture the risk of possible extreme adverse market movements which have notbased on events that occurred in the historical window used500 trading day time series. Therefore, events that are more severe than those in the calculations.historical data series cannot be predicted. |
● | VaR usingThe use of a one-day time horizon does not fully capture the market risk of positions that cannot be liquidated or hedged within one day. |
● | VaR using a 95%99% confidence level does not reflect the extent of potential losses beyond that percentile. |
| The use of a one-day time horizon will not fully capture the profit and loss implications of positions that cannot be liquidated or hedged within one day. |
| The Group computes the VaR of trading portfolios at the close of business. Positions may change substantially during the course of the trading day and intra-day profit and losses will be incurred. |
These limitations mean that the Group cannot guarantee that losses will not exceed the VaR.
A risk not in VaR framework has been developed to quantify those market risks not adequately captured by the market standard VaR methodology. Where risks are not included in the model, various non-VaR controls (for example, position monitoring, sensitivity limits, triggers or stress limits) are in place.
The Group undertakes daily stress testing to identify the potential losses in excess of VaR. Stress testing is used to calculate a range of trading book exposures which result from extreme market events. Stress testing measures the impact of exceptional changes in market rates and prices on the fair value of the Group’s trading portfolios. The Group calculates historical stress tests and hypothetical stress tests.
Historical stress tests calculate the loss that would be generated if the market movements that occurred during historical market events were repeated. Hypothetical stress tests calculate the loss that would be generated if a specific set of adverse market movements were to occur.
Business reviewcontinued | Business review |
| Risk and balance sheet management |
Risk management: Market riskcontinued
Risk measurement and control continued
The Global Market Risk Stress Testing Committee reviews and discusses all matters relating to Market Risk Stress Testing. Stress test exposures are discussed with senior management and relevant information is reported to the Group Risk Committee, Executive Risk Forum and the Board. Breaches in the Group’s market risk stress testing limits are monitored and reported.
In addition to VaR and stress testing, the Group calculates a wide range of sensitivity and position risk measures, for example interest rate ladders or option revaluation matrices. These measures provide valuable additional controls, often at individual desk or strategy level.
Model validation governance
Pricing models are developed and owned by the front office. Where pricing models are used as the basis of books and records valuations, they are all subject to independent review and sign-off. Models are assessed by the Group Model Product Review Committee (GMPRC) as having either immaterial or material model risk (valuation uncertainty arising from choice of modelling assumptions), the assessment being made on the basis of expert judgement. Those models assessed as having material model risk are prioritised for independent quantitative review. Independent quantitative review aims to quantify model risk (i.e. the impact of missing risk factors in the front office model or the possibility that we may be mismarking these products relative to other market participants who may be using an alternative model) by comparing model outputs against alternative independently developed models. The results of the independent quantitative review are used by Market Risk to inform risk limits and by Finance to inform reserves. Governance over this process is provided by GMPRC, a forum which brings together Front Office Quantitative Analysts, Market Risk, Finance and Quantitative Research Centre (QuaRC), Group Risk’s independent quantitative model review function.
Risk (market risk, incremental default risk, counterparty credit risk) models are developed both within business units and by Group functions. Risk models are also subject to independent review and sign-off. Meetings are held with the FSA every quarter to discuss the traded market risk, including changes in models, management, back testing results, risks not included in the VaR framework and other model performance statistics.
As part of the ongoing review and analysis of the suitability of the VaR model, a methodology enhancement to the ABS VaR was approved and incorporated into the regulatory model in 2010. The credit crisis in 2007 - 2009 caused large price changes for some structured bonds and the spread based approach to calculating VaR for these instruments started to give inaccurate risk levels, particularly for bonds trading at a significant discount to par. The methodology enhancement harmonised the VaR approach in the US and Europe by replacing the absolute spread-based approach with a more reliable and granular relative price-based mapping scheme. The enhancement better reflects the risk in the context of position changes, downgrades and vintage as well as improving differentiation between prime, Alt-A and sub-prime exposures.
The VaR disclosure is broken down into trading and non-trading portfolios. Trading VaR relates to the main trading activities of the Group and non-trading reflects the risk associated with reclassified assets, money market business and the management of internal funds flow within the Group’s businesses.
Traded portfolios (audited)
The primary focus of the Group’s trading activities is client facilitation.to provide an extensive range of debt and equity financing, risk management and investment services to its customers, including major corporations and financial institutions around the world. The Group also undertakes:undertakes these activities organised along six principal business lines: money markets; rates flow trading; currencies and commodities; equities; credit markets; and portfolio management & origination.
● | Market making – quoting firm bid (buy) and offer (sell) prices with the intention of profiting from the spread between the quotes. |
● | Arbitrage – entering into offsetting positions in different but closely related markets in order to profit from market imperfections. |
● | Proprietary activity – taking positions in financial instruments as principal in order to take advantage of anticipated market conditions. |
Financial instruments held in the Group’s trading portfolios include, but are not limited to: debt securities, loans, deposits, equities, securities sale and repurchase agreements and derivative financial instruments (futures, forwards, swaps and options).
The Group participates in exchange traded and over-the-counter (OTC) derivatives markets. The Group buys and sells financial instruments that are traded or cleared on an exchange, including interest rate swaps, futures and options. Holders of exchange traded instruments provide margin daily with cash or other security at the exchange, to which the holders look for ultimate settlement.
The Group also buys and sells financial instruments that are traded OTC, rather than on a recognised exchange. These instruments range from commoditised transactions in derivative markets, to trades where the specific terms are tailored to the requirements of the Group’s customers. In many cases, industry standard documentation is used, most commonly in the form of a master agreement, with individual transaction confirmations.
The Group calculates the VaR of trading portfolios at the close of business and positions may change substantially during the course of a trading day. Further controls are in place to limit the Group’s intra-day exposure, such as the calculation of the VaR for selected portfolios. The Group cannot guarantee that losses will not exceed the VaR amounts indicated due to the limitations and nature of VaR measurements.
Business review continued
Assets and liabilities in the trading book are measured at their fair value. Fair value is the amount at which the instrument could be exchanged in a current transaction between willing parties. The fair values are determined following IAS 39 guidance which requires banks to use quoted market prices or valuation techniques (models) that make the maximum use of observable inputs. When marking to market using a model, the valuation methodologies are reviewed and approved either by the market risk function in the business or at Group level.function. Group Risk provides an independent evaluation of the model for transactions deemed by the Group Model Product Review Committee (MPRC)(GMPRC) to be large, complex and/or innovative. Any profits or losses on the revaluation of positions are recognised in the daily profit and loss.
Business reviewcontinued | Business review |
| Risk and balance sheet management |
Traded portfolios continued
The VaR for the Group’s 20082010 trading portfolios segregatedanalysed by type of market risk exposure is shown below.
£ million (unaudited)Daily VaR graph*
Note:
(1) The traded market risk VaR excludes super senior tranches of asset backed CDOs.
The average total VaR utilisation increased in 2008 compared with 2007 as a result of increased market volatility. This increase was offset by a reduction inGroup has disclosed separately the Counterparty Exposure Management (CEM) trading book exposure throughoutand the period, due to a reductionexposure of Core without CEM. CEM manages the OTC derivative counterparty credit risk on behalf of GBM, by actively controlling risk concentrations and reducing unwanted risk exposures. The hedging transactions CEM enters into are booked in the sizetrading book, and therefore contribute to the market risk VaR exposure of the inventory held onGroup. The counterparty exposures themselves are not captured in VaR for regulatory capital. In the balance sheet as a resultinterest of sales, reclassification of assetstransparency and to more properly represent the non-tradingtrading book and write-downs. The average equity VaR increased in 2008 compared with 2007, due to the integration of ABN AMRO from 17 October 2007.
| | | | | | | |
| | | Average £m | | | Period end £m | | | Maximum £m | | | Minimum £m | | | Average £m | | | Period end £m | | | Maximum £m | | | Minimum £m | |
| Interest rate | | | 20.7 | | | | 26.3 | | | | 36.5 | | | | 12.1 | | | | 12.5 | | | | 15.0 | | | | 21.8 | | | | 7.6 | |
| Credit spread | | | 37.2 | | | | 40.4 | | | | 51.2 | | | | 26.0 | | | | 18.8 | | | | 41.9 | | | | 45.2 | | | | 12.6 | |
| Currency | | | 4.5 | | | | 8.7 | | | | 10.5 | | | | 1.2 | | | | 2.6 | | | | 3.0 | | | | 6.9 | | | | 1.1 | |
| Equity | | | 12.3 | | | | 9.4 | | | | 19.9 | | | | 6.0 | | | | 5.4 | | | | 14.0 | | | | 22.0 | | | | 1.4 | |
| Commodity | | | 6.7 | | | | 6.3 | | | | 18.2 | | | | — | | | | 0.2 | | | | 0.5 | | | | 1.6 | | | | — | |
| Diversification | | | — | | | | (43.3 | ) | | | — | | | | — | | | | — | | | | (28.7 | ) | | | — | | | | — | |
| Total | | | 44.6 | | | | 47.8 | | | | 60.9 | | | | 29.9 | | | | 21.6 | | | | 45.7 | | | | 50.1 | | | | 13.2 | |
The 2008 data intable below analyses the table above excludes exposures to super-senior tranchesVaR for the Group’s trading portfolios segregated by type of asset backed CDOs,market risk exposure.
| | 2010 | | 2009 |
| Trading VaR | Average £m | Period end £m | Maximum £m | Minimum £m | | Average £m | Period end £m | Maximum £m | Minimum £m |
| Interest rate | 51.6 | 57.0 | 83.0 | 32.5 | | 57.0 | 50.5 | 112.8 | 28.1 |
| Credit spread | 166.3 | 133.4 | 243.2 | 110.2 | | 148.3 | 174.8 | 231.2 | 66.9 |
| Currency | 17.9 | 14.8 | 28.0 | 8.4 | | 17.9 | 20.7 | 35.8 | 9.2 |
| Equity | 9.5 | 10.9 | 17.9 | 2.7 | | 13.0 | 13.1 | 23.2 | 2.7 |
| Commodity | 9.5 | 0.5 | 18.1 | 0.5 | | 14.3 | 8.9 | 32.1 | 6.5 |
| Diversification | | (75.6) | | | | | (86.1) | | |
| | 168.5 | 141.0 | 252.1 | 103.0 | | 155.2 | 181.9 | 229.0 | 76.8 |
| | | | | | | | | | |
| Core (Total) | 103.6 | 101.2 | 153.4 | 58.3 | | 101.5 | 127.3 | 137.8 | 54.8 |
| CEM | 53.3 | 54.6 | 82.4 | 30.3 | | 29.7 | 38.6 | 41.3 | 11.5 |
| Core excluding CEM | 82.8 | 78.7 | 108.7 | 53.6 | | 86.7 | 97.4 | 128.5 | 54.9 |
| | | | | | | | | | |
Non-Core | 105.7 | 101.4 | 169.4 | 63.2 | | 86.3 | 84.8 | 162.1 | 29.3 |
*unaudited
Business reviewcontinued | Business review |
| Risk and balance sheet management |
Risk management: Market riskcontinued
Traded portfolios continued
Key points
| · | The Group’s period end VaR reduced as the exceptional volatility of the market data from the period of the financial crisis dropped out of the 500 days of time series data used in the VaR calculation. The credit spread VaR was particularly impacted as a result of this effect. |
| · | The Group’s maximum and average credit and Non-Core VaR were higher in 2010 than in 2009 due to Non-Core exiting several highly structured positions which, due to their complexity and layering, required unwinding with different counterparties over different periods. The timing of the unwind led to an increased VaR, until the exit was completed in October and the VaR then reduced back to the levels held earlier in the year. |
| · | CEM VaR was greater in 2010 than 2009 due to the novation of counterparty risk hedging trades from RBS N.V. to RBS plc. For RBS N.V. there is no local regulatory requirement for counterparty hedges to be included in VaR, as they are treated on a standardised basis but on novation to CEM in RBS plc, under UK regulatory requirements, the trades were captured by the VaR model resulting in an increase in VaR. |
| · | CEM trading VaR also increased as a consequence of the implementation of a discounting approach based on the real funding cost for the collateralised derivatives. |
| · | Commodity VaR decreased during the year since a significant part of the Group’s interest in RBS Sempra Commodities JV was sold during the year. |
GBM traded revenue*
Key points*
| · | The average daily revenue earned from GBM’s trading, balance sheet management and other trading activities in 2010 was £25.4 million compared with £37.8 million in 2009. The standard deviation of these daily revenues was £22.0 million compared with £32.3 million in 2009. The standard deviation measures the variation of daily revenues about the mean value of those revenues. |
| · | An analysis of the frequency distribution of daily revenue shows that there were 22 days with negative revenue during 2010 compared with 16 days in 2009. The most frequent result is daily revenue of between £25 million and £30 million with 37 occurrences in 2010 compared with 26 occurrences in 2009. |
| · | The effect of any month end adjustments, not attributable to a specific daily market move, is spread evenly over the days in the month in question. |
| · | The graph of daily revenues for 2010 shows a narrower distribution of revenues compared with 2009. |
* unaudited
Business reviewcontinued | Business review |
| Risk and balance sheet management |
Risk management: Market riskcontinued
Non-traded portfolios
VaR no longer produces anis not always the most appropriate measure of risk for these exposures dueassets in the non-trading book, particularly for those in Non-Core which will diminish over time as the asset inventory is sold down.
In order to better represent the illiquidity and opaquenessrisk of the pricing of these instruments over an extended period. For these exposures,non-traded portfolios, the maximum potential loss is equal to the aggregate net exposure, which was £1,398 million as at 31 December 2008. For more information, please refer to the discussion of Credit market and related exposures – Super senior CDOs on page 111 and Financial statements: Note 11, Financial instruments – Valuation – level 3 portfolios – collateralised debt obligations on pages 189 and 190.
RBS Sempra Commodities LLP, the commodities-marketing joint venture between RBS and Sempra Energy, was formed on 1 April 2008, and its trading risks were included in the disclosed VaR from that date.
Business review continued
Backtesting, stress testing and sensitivity analysis (audited)
The Group undertakes a programme of daily backtesting, which compares the actual profit or loss realised in trading activity totable below analyses the VaR estimation. The results offor the backtesting processnon-trading portfolios but excludes Structured Credit Portfolios (SCP) in Non-Core. These assets are one of the methods by which the Group monitors the ongoing suitability of its VaR model.
A ‘Risks not in VaR’ framework has been developed to address those market risks not adequately captured by the market standard VaR methodology. Where risks are not included in the model various non-VaR controls (e.g. position monitoring, sensitivity limits, triggers or stress limits) are in place.
The Group undertakes daily stress testing to identify the potential losses in excess of VaR. Stress testing is used to calculateshown separately on a range of trading book exposures which result from exceptional but plausible market events. Stress testing measures the impact of abnormal changes in market ratesdrawn notional and prices on the fair value of the Group’s trading portfolios. GEMC approves the high-level market stress test limit for the Group. The Group calculates historical stress testsbasis by maturity profile and hypothetical stress tests.
Historical stress tests calculate the loss that would be generated if the market movements that occurred during historical market events were repeated. Hypothetical stress tests calculate the loss that would be generated if a specific set of adverse market movements were to occur.
Stress testing is also undertaken at key trading strategy level, for those strategies where the associated market risks are not adequately captured by VaR. Stress test exposures are discussed with senior managementasset class and are reported to GRC, GEMCmanaged on both an asset and RWA basis.
Also excluded from the Board. Breaches innon-traded VaR are the Group’s market risk stress testing limits are monitoredloans and reported.
In addition to VaR and stress testing, the Group calculates a wide range of sensitivity and position risk measures, for example interest rate ladders or option revaluation matrices. These measures provide valuable additional controls, often at individual desk or strategy level.
Model validation governance (audited)
Pricing models are developed and owned by the front office. Where pricing models are used as the basis of books and records valuations, they are all subject to independent review and sign-off. Models are assessed by MPRC as having either immaterial or material model risk (valuation uncertainty arising from choice of modelling assumptions), the assessment being made on the basis of expert judgement. Those models assessed as having material model risk are prioritised for independent quantitative review. Independent quantitative review aims to quantify model risk by comparing model outputs against alternative independently developed models. The results of independent quantitative review are used by Market Risk to inform risk limits and by Finance to inform reserves. Governance over this process is provided by MPRC, a forum which brings together front office quants, market risk, finance and QuaRC (Quantitative Research Centre, Group Risk’s independent quantitative model review function). Risk (market risk, incremental default risk, counterparty credit risk) models are developed both within business units and by Group functions. Risk models are also subject to independent review and sign-off. Meetings are held with the FSA every quarter to discuss the traded market risk, including changes in models, management, back testing results, other risks not included in the VaR framework and other model performance statistics.
Risk control (audited)
All divisionsreceivables products that are exposed to market risk inmanaged within the course of their business are required to comply with the requirements of the Group’s Market Risk Policy Standards (MRPS). The main risk management tools are delegated authorities, specifically hard limits and discussion triggers, independent model valuation, a robust and efficient risk system and timely and accurate management information.
Limits form part of the dealing authorities and constitute one of the cornerstones of the marketcredit risk management framework. Upon notification of a limit breach,The 2009 and 2010 VaR data below is shown on this basis; however the appropriate body must take one of the following actions:
● | Instructions can be given to reduce positions so as to bring the Group within the agreed limits. |
● | A temporary increase in the limit (for instance, in order to allow orderly unwinding of positions) can be granted. |
● | A permanent increase in the limit can be granted. |
Non-traded portfolios (audited)
Risks in non-traded portfolios mainly arise in retail and commercial banking assets and liabilities and financial investments designated as available-for-sale and held-to-maturity.
Group Treasury is responsible for setting and monitoring the adequacy and effectiveness of management, using a framework that identifies, measures, monitors and controls the underlying risk. GALCO approves the Group’s non-traded market risk appetite, expressed as statistical and non-statistical risk limits, which are delegated to the businesses responsible.
Various banking regulators review non-trading market risk as part of their regulatory oversight. As home regulator, the FSA has responsibility for reviewing non-trading market risk at a Group consolidated level.
Business review continuedThe Group is exposed to the following non-traded risks:
Interest Rate Risk in the Banking Book (IRRBB) represents exposures to instruments whose values vary with the level or volatility of interest rates. These instruments include, but are not limited to, loans, debt securities, equity shares, deposits, certificates of deposits, and other debt securities issued, loan capital and derivatives. Hedging instruments used to mitigate these risks include related derivatives such as options, futures, forwards and swaps. Interest rate risk arises from the Group’s non-trading activities in four principal forms:
● | Repricing risk – arises from differences in the repricing terms of the Group’s assets and liabilities. |
● | Optionality – arises where a customer has an option to exit a deal early. |
● | Basis risk – arises, for example, where one month LIBOR is used to fund base rate assets. |
● | Yield curve risk – arises as a result of non-parallel changes in the yield curve. |
From an economic perspective, it is the Group’s policy to minimise the sensitivity to changes in interest rates in its retail and commercial businesses and, where interest rate risk is retained, to ensure that appropriate resources, measures and limits are applied.
Non-trading interest rate risk is calculated in each business on the basis of establishing the repricing behaviour of each asset, liability and off-balance sheet product. For many retail and commercial products, the actual interest rate repricing characteristics differ from the contractual repricing. In most cases, the repricing maturity is determined by the market interest rate that most closely fits the historical behaviour of the product interest rate. For non-interest bearing current accounts, the repricing maturity is determined by the stability of the portfolio. The repricing maturities used are approved by Group Treasury and divisional asset and liability committees at least annually. Key conventions are reviewed annually by GALCO.
A static maturity gap report is produced as at the month-end for each business, in each functional currency based on the behavioural repricing for each product. It is Group policy to include in the gap report, non-financial assets and liabilities, mainly property, plant and equipment and the Group’s capital and reserves, spread over medium and longer term maturities. The report includes hedge transactions, principally derivatives.
Any residual non-trading interest rate exposures are controlled by limiting repricing mismatches in the individual business balance sheets. Potential exposures to interest rate movements in the medium to long-term are measured and controlled using a version of the same VaR methodology that is useddata for the Group’s trading portfolios. Net accrual income exposures are measured2008 period could not be recalculated excluding the SCP and controlled in terms of sensitivity over time to movements in interest rates.
Risk is managed within VaR limits approved by GALCO, through the execution of cash and derivative instruments (see Note 13 on the accounts, on page 199). Execution of the hedging is carried out by the relevant division through the Group’s treasury functions. The residual risk position is reported to divisional asset and liability committees, GALCO and the Board.
Foreign Exchange Risk in the Banking Book (FXRBB) represents exposures to changes in the values of current holdings and future cashflows denominated in other currencies. Hedging instruments used to mitigate these risks include foreign currency options, currency swaps, futures, forwards and deposits. Foreign exchange risk results from the Group’s investments in overseas subsidiaries, associates and branches in three principal forms:
(i) | Structural foreign currency exposures that arise from net investment in overseas subsidiaries, associates and branches; |
(ii) | Transactional/commercial foreign currency exposures that arise from mismatches in the currency balance sheet; and |
(iii) | Foreign currency profit streams. |
Equity Risk in the Banking Book (ERBB) is defined as the potential variation in the Group’s non-trading income and reserves arising from changes in equity prices/income. This risk may crystallise during the course of normal business activities or in stressed market conditions. Equity positions in the Group’s banking book are retained to achieve strategic objectives, support venture capital transactions or in respect of restructuring arrangements. From an economic perspective, it is the Group’s policy to ensure that equity exposures in the banking book are identified, monitored and controlled, with the aim of maximising their potential strategic or business value.
The commercial decision to invest in equity holdings is taken by GEMC, GCC or an appropriate sub-committee within delegated authority. Investments of a strategic nature are referred to GEMC for approval; those involving the purchase or sale by the Group or subsidiary companies also require Board approval, after consideration by GEMC.
Treasury (audited)
The Group’s treasury activities include its money market business and the management of internal funds flow within the Group’s businesses. In addition, this includes GBM trading portfolio assets that have been reclassified to available-for-sale. Money marketLAR portfolios include cash instruments (principally debt securities, loans and deposits) and related hedging derivatives. VaR for the Group’s treasury portfolios, which relates mainly to interest rate risk including credit spreads, was £52.0 million at 31 December 2008 (2007 – £5.5 million). During the year the maximum VaR was £52.0 million (2007 – £6.4 million), the minimum £4.8 million (2007 – £1.3 million) and the average £8.3 million (2007 – £3.7 million).
Business review continued
Non-trading interest rate VaR (audited)
Non-trading interest rate VaR for the Group’s treasury and retail and commercial banking activities was £70.6 million at 31 December 2008 (2007 – £42.9 million) with the major exposure being to changes in longer term US dollar interest rates. During 2008, the maximum VaR was £117.6 million (2007 – £53.6 million), the minimum was £53.9 million (2007 – £32.9 million) and the average was £75.1 million (2007 – £43.2 million).
A breakdown of the Group’s non-trading VaR on a statutory basis by currency is shown below.
| | | | 2008 £m | | | | 2007 £m | |
| EUR | | | 19.0 | | | | 4.5 | |
| GBP | | | 18.3 | | | | 7.3 | |
| USD | | | 64.8 | | | | 52.8 | |
| Other | | | 4.5 | | | | 2.6 | |
Citizens Financial Group (CFG) was the main contributor to overall non- trading interest rate VaR. CFG manages non-trading interest rate risk with the objective of minimising accrual accounted earnings volatility. To do so it uses a variety of income simulation and valuation risk measures that more effectively capture the risk to earningsmentioned above due to mortgage prepaymentdata and competitive deposit pricing behaviour than a VaR-based methodology would. This balance sheet management approach is common for US retail banks. Interest rate risk in the banking book is managed by a professional treasury function which optimises the yield, whilst staying within approved limits on interest rate risk, liquidity and capitalisation.system constraints.
Mortgages, home equity loans and mortgage-backed securities (MBS) comprise a large portion of CFG’s assets. In the US, mortgage and home equity customers may prepay loans without penalty. However, under the requirements of FAS 133, the risk that they may do so cannot be hedged in a cost effective manner and must be born by the lender. Prepayment risk is a primary component of interest rate risk in the banking book at CFG.
| | | | | | | |
| | | Principal(1) US$m | | | Carrying amount US$m | | | Principal(1) US$m | | | Carrying amount US$m | |
| Total MBS and mortgages | | | 63,542 | | | | 63,165 | | | | 69,948 | | | | 69,672 | |
| MBS – total | | | | | | | | | | | | | | | | |
| – high grade (AA or AAA rated) | | | 26,268 | | | | 25,893 | | | | 26,848 | | | | 26,572 | |
| – rated C to A | | | 602 | | | | 600 | | | | — | | | | — | |
| MBS – commercial | | | | | | | | | | | | | | | | |
| – high grade (AA or AAA rated) | | | 2,253 | | | | 2,089 | | | | 2,205 | | | | 2,211 | |
| MBS – retail | | | | | | | | | | | | | | | | |
| – high grade (AA or AAA rated) | | | 24,015 | | | | 23,804 | | | | 24,643 | | | | 24,631 | |
| – rated C to A | | | 602 | | | | 600 | | | | — | | | | — | |
| Residential Mortgage and Home Equity Loans (non-securitised, fixed rate and ARM, prepayable) | | | 36,672 | | | | 36,672 | | | | 43,100 | | | | 43,100 | |
Note:
(1) The principal on MBS is the redemption amount on maturity or, in the case of an amortising instrument, the sum of future redemption amounts through the residual life of the security.
Business review continuedIn addition to VaR, the following measures are reported to CFG ALCO, Group Treasury, GALCO and the Board:
● | The sensitivity of net accrual earnings to a variety of parallel and non-parallel movements in interest rates. |
● | Economic value of equity (EVE) sensitivity to a series of parallel movements in interest rates. EVE is only used within CFG and to meet the FSA prescribed standard shock test of +/- 200bp parallel shock. |
| | | Percent increase/ decrease in CFG EVE(1) | |
| (unaudited) | | 2% parallel upward movement in US interest rates | | | 2% parallel downward movement in US interest rates (No negative rates allowed) | |
| Period end | | | (0.7 | ) | | | (19.0 | ) |
| Maximum | | | (18.2 | ) | | | (20.8 | ) |
| Minimum | | | (0.7 | ) | | | (4.4 | ) |
| Average | | | (12.2 | ) | | | (12.6 | ) |
Note:
(1) Economic value of equity is the net present value of assets and liabilities calculated by discounting expected cash flows of each instrument over its expected life. Risk to EVE is quantified by calculating the impact of interest rate changes on the net present value of equity and is expressed as a percentage of CFG regulatory capital.
Sensitivity of net interest income (unaudited)
There have been no material changes to the Group’s measurement and management of the sensitivity of net interest income to movement in interest rates.
The Group aims, through its management of market risk in non-trading portfolios, to mitigate the effect of prospective interest movements which could reduce future net interest income, whilst balancing the cost of such hedging activities on the current net revenue stream.
The table below sets outanalyses the effect on future net interest income of a sustained +/-100bp parallel rise/fall in all yield curves.risk for the Group’s non-trading portfolios.
| | 2010 | | 2009 |
| Non-trading VaR | Average £m | Period end £m | Maximum £m | Minimum £m | | Average £m | Period end £m | Maximum £m | Minimum £m |
| Interest rate | 8.7 | 10.4 | 20.5 | 4.4 | | 13.0 | 13.9 | 26.3 | 7.7 |
| Credit spread | 32.0 | 16.1 | 101.2 | 15.4 | | 81.7 | 100.3 | 131.5 | 39.7 |
| Currency | 2.1 | 3.0 | 7.6 | 0.3 | | 1.4 | 0.6 | 7.0 | 0.2 |
| Equity | 1.2 | 3.1 | 4.6 | 0.2 | | 3.3 | 2.2 | 5.8 | 1.6 |
| Diversification | | (15.9) | | | | | (20.4) | | |
| | 30.9 | 16.7 | 98.0 | 13.7 | | 80.4 | 96.6 | 126.9 | 46.8 |
| | | | | | | | | | |
| Core | 30.5 | 15.6 | 98.1 | 12.8 | | 78.4 | 95.9 | 126.9 | 46.8 |
Non-Core | 1.3 | 2.8 | 4.1 | 0.2 | | 3.5 | 1.9 | 16.9 | — |
Key points
| | | |
+ 100bp shiftThe non-traded credit spread, Core and total VaR have decreased significantly due to the implementation of the relative price-based mapping scheme in yield curves | | | 138.9 | |
– 100bp shiftthe VaR methodology discussed above and the sales of available-for-sale securities in yield curves | | | (234.1 | )the US mortgage business. |
| The business model for the US mortgage business has focussed its activity on client facilitation flow trading during 2010. This has encompassed the disposal of a large portfolio of illiquid available-for-sale securities that were sold throughout the year, resulting in the non-traded VaR reducing. In parallel, the risk management of the business has been significantly enhanced to ensure that the business remains focussed on client facilitation flow trading of liquid assets. Tools have been implemented to monitor the liquidity of trading volumes, asset aged inventory controls have been tightened and granular asset concentration risk limits imposed, to complement the existing VaR and stress testing market risk frameworks. |
The interest rate sensitivities in the table above are illustrative only and are based on simplified scenarios.
The figures represent the effect on pro forma net interest income of movements of the yield curve based on the Group’s current non-trading interest rate risk profile. This effect however does not incorporate actions that would be taken by the business units to mitigate the effect of this interest rate risk. In reality the business units proactively seek to change the interest rate risk profile to minimise losses and optimise net revenues.
The projections also assume that interest rates of all maturities move by the same amount and therefore do not reflect the potential effect on net interest income of some rates changing whilst others remain the same.
The projections do not take into account the effect on net interest income of anticipated differences in changes between interest rates and interest rates linked to other bases (such as central bank rates or product rates for which the entity has discretion over the timing and extent of rate changes). The projections make other simplifying assumptions, including that all positions run to maturity and that there are no negative interest rates.
Business reviewcontinued | Business review |
| Risk and balance sheet management |
Risk management: Market riskcontinued
Currency risk (audited)
The Group does not maintain material non-trading open currency positions other than the structural foreign currency translation exposures arising from its investments in foreign subsidiaries and associated undertakings and their related currency funding. The Group’s policy in relation to structural positions is to match fund the structural foreign currency exposure arising from net asset value, including goodwill, in foreign subsidiaries, equity accounted investments and branches, except where doing so would materially increase the sensitivity of either the Group’s or the subsidiary’s regulatory capital ratios to currency movements. The policy requires structural foreign exchange positions to be reviewed regularly by GALCO. Foreign exchange differences arising on the translation of foreign operations are recognised directly in equity together with the effective portion of foreign exchange differences arising on hedging instruments.
Equity classification of foreign currency denominated preference share issuances requires that these shares be held on the balance sheet at historic cost. Consequently, these share issuances have the effect of increasing the Group’s structural foreign currency position.
The tables below set out the Group’s structural foreign currency exposures:
| 2008 | | Net assets of overseas operations £m | | | Minority interests £m | | | Net investments in foreign operations £m | | | Net investment hedges £m | | | Structural foreign currency exposures £m | |
| US dollar | | | 17,480 | | | | (19 | ) | | | 17,499 | | | | (3,659 | ) | | | 13,840 | |
| Euro | | | 26,943 | | | | 15,431 | | | | 11,512 | | | | (7,461 | ) | | | 4,051 | |
| Chinese RMB | | | 3,928 | | | | 1,898 | | | | 2,030 | | | | (1,082 | ) | | | 948 | |
| Other non-sterling | | | 5,088 | | | | 621 | | | | 4,467 | | | | (3,096 | ) | | | 1,371 | |
| | | | 53,439 | | | | 17,931 | | | | 35,508 | | | | (15,298 | ) | | | 20,210 | |
| | Drawn notional | | Fair value |
| | CDOs | CLOs | MBS (1) | Other ABS | Total | | CDOs | CLOs | MBS (1) | Other ABS | Total |
| 2010 | £m | £m | £m | £m | £m | | £m | £m | £m | £m | £m |
| 1-2 years | — | — | — | 47 | 47 | | — | — | — | 42 | 42 |
| 2-3 years | 85 | 19 | 44 | 98 | 246 | | 81 | 18 | 37 | 91 | 227 |
| 3-4 years | — | 41 | 20 | 205 | 266 | | — | 37 | 19 | 191 | 247 |
| 4-5 years | 16 | — | — | — | 16 | | 15 | — | — | — | 15 |
| 5-10 years | 98 | 466 | 311 | 437 | 1,312 | | 87 | 422 | 220 | 384 | 1,113 |
| >10 years | 412 | 663 | 584 | 550 | 2,209 | | 161 | 515 | 397 | 367 | 1,440 |
| | 611 | 1,189 | 959 | 1,337 | 4,096 | | 344 | 992 | 673 | 1,075 | 3,084 |
| | | | | | | | | | | | |
| 2009 | | | | | | | | | | | |
| 1-2 years | — | — | — | 81 | 81 | | — | — | — | 68 | 68 |
| 2-3 years | 40 | — | — | 19 | 59 | | 24 | — | — | 18 | 42 |
| 3-4 years | 19 | 18 | 42 | 99 | 178 | | 16 | 17 | 31 | 76 | 140 |
| 4-5 years | 17 | 47 | 36 | 332 | 432 | | 3 | 41 | 29 | 275 | 348 |
| 5-10 years | 107 | 685 | 424 | 521 | 1,737 | | 90 | 594 | 251 | 394 | 1,329 |
| >10 years | 594 | 1,114 | 820 | 573 | 3,101 | | 193 | 896 | 468 | 325 | 1,882 |
| | 777 | 1,864 | 1,322 | 1,625 | 5,588 | | 326 | 1,548 | 779 | 1,156 | 3,809 |
| 2007 | | | | | | | | | | | | | | | |
| US dollar | | | 14,819 | | | | 303 | | | | 14,516 | | | | (2,541 | ) | | | 11,975 | |
| Euro | | | 46,629 | | | | 28,647 | | | | 17,982 | | | | (8,818 | ) | | | 9,164 | |
| Chinese RMB | | | 2,600 | | | | — | | | | 2,600 | | | | (1,939 | ) | | | 661 | |
| Brazilian real | | | 3,755 | | | | 3,755 | | | | — | | | | — | | | | — | |
| Other non-sterling | | | 3,905 | | | | 519 | | | | 3,386 | | | | (1,219 | ) | | | 2,167 | |
| | | | 71,708 | | | | 33,224 | | | | 38,484 | | | | (14,517 | ) | | | 23,967 | |
Note:
| (1) | Mortgage-backed securities (MBS) include sub-prime residential mortgage-backed securities with a notional amount of £471 million (2009 - £682 million) and a fair value of £329 million (2009 - £415 million), all with residual maturities of greater than 10 years. |
Retranslation gains and lossesThe SCP are within Non-Core. The risk on this portfolio is not measured or disclosed using VaR, as the Group’s net investments in operations together with those on instruments hedging these investments are recognised directly in equity. Changes in foreign currency exchange rates will affect equity in proportion toGroup believes this is not an appropriate tool for the structural foreign currency exposure. A five percent strengthening in foreign currencies would result in a gainbanking book portfolio comprising of £1,010 million (2007 – £1,200 million) recognised in equity, while a five per cent weakening in foreign currencies would result in a loss of £960 million (2007 - £1,140 million) recognised in equity. These movements in equity would offset retranslation effects on the Group's foreign currency denominated risk weighted assets, reducing the sensitivityilliquid debt securities. The main driver of the Group's Tier 1 capital ratio to movementsreduction in foreign currency exchange rates.
Equity risk (audited)
Equity positions are measured at fair value. Fair value calculations are baseddrawn notional is the asset sales from a portfolio within an unwound securitisation arbitrage conduit. The impact of disposals on available market prices wherever possible. In the event that market prices are not available,portfolio fair value is based on appropriate valuation techniques or management estimates.has been partially offset by an increase in residual average price to 75% (2009 - 68%).
The types, nature and amounts of exchange-traded exposures, private equity exposures, and other exposures vary significantly. Such exposures may take the form of listed and unlisted equity shares, linked equity fund investments, private equity and venture capital investments, preference shares classified as equity and Federal Home Loan Stock.
The table below sets out the balance sheet value of equity exposures at December 2008.
| | Listed £m | | | Unlisted £m | | | Total £m | |
| | | 4,267 | | | | 3,018 | | | | 7,285 | |
* excludes equity exposures held-for-trading purposes and by insurance/assurance entities
Business reviewcontinued | Business review |
| Risk and balance sheet management |
Business review Risk managementcontinuedAll the disclosures in this section (pages 139 to 143) are unaudited and are marked with an asterisk (*).
Risk control (unaudited)
The prime risk control mechanism for non-traded market risk exposures is the completion of monthly IRRBB and quarterly FXRBB returns by the Group’s business units, collated as part of month-end reporting by Group Treasury to GALCO. In relation to equity risk, risk is mitigated by proper controls in relation to identification of risk prior to investing.
Financial control functions are required to confirm to Group Treasury that returns materially capture all balance sheet items and thus reconcile to core source systems.
Monthly returns by the Group’s business units, collated as part of month-end reporting by Group Treasury to GALCO, are used to build a Group IRRBB VaR position and to ensure businesses comply with materiality limits on a pre and post hedge basis for interest rates, as stipulated by Group Treasury.
For FXRBB, the Group policy states that any foreign currency exposure is managed to de minimis limits. Group Treasury monitors adherence to this policy via a quarterly return.
For both IRRBB and FXRBB information is included in regulatory and statutory returns.
Group Market Risk exercise independent oversight and governance of the interest rate and foreign exchange exposures managed in Group Treasury by granting market risk limits in addition to authorising Group Treasury to deal in specific instruments for the purpose of managing the Group's non-trading interest rate and foreign exchange exposures. All market risk methodologies that relate to limits specified under this delegated authority are applied under the direction of Group Market Risk.
Insurance risk (unaudited)risk*
The Group is exposed to insurance risk directly through its general and life insurance businesses.
Insurance risk arises through fluctuations in the timing, frequency and/or severity of insured events, relative to the expectations at the time of underwriting. Insurance risk is managed in four distinct ways:
● | Underwritingunderwriting and pricing risk management:management is managed through the use of underwriting guidelines which detail the class, nature and type of business that may be accepted, pricing policies by product line and brand, and centralised control of wordings and any subsequent changes.
changes; |
● | Claimsclaims risk management:management is handled using a range of automated controls and manual processes.
processes; |
● | Reservingreserving risk management:management is the riskapplied to ensure that the technical reserves are assessed incorrectly such that insufficientsufficient funds have been retained to handle and pay claims as the amounts fall due, both in relation to those claims which have already occurred or will occur in future periods of insurance. Claims developmentReserving risk is managed through the detailed analysis of historical and industry claims data provides information on the historical pattern ofand robust control procedures around reserving risk.
models; and |
● | Reinsurancereinsurance risk management:management is used to protect against adverse claims experience on business within normalwhich exceeds internal risk appetite. The Group uses various types of reinsurance to transfer risk that is outside the Group's risk appetite, (e.g. catastrophic events, adverse frequencyincluding individual risk excess of large claims)loss reinsurance, catastrophe excess of loss reinsurance and to provide protection on business not within its risk appetite (e.g. quota share reinsurance on certain classes of business).
reinsurance. |
The aggregate amount of business by product and entity is determined through the business plans.
Overall, insurance risk is predictable over time, given the large volumes of data. UncertaintyHowever, uncertainty does exist, especially around predictions such as the variations in weather.weather for example. Risk is minimised through the application of documented insurance risk policies, coupled with risk governance frameworks.frameworks and the purchase of reinsurance.
General insurance business
The Group’sGroup underwrites retail and SME insurance with a focus in its general insurance operation is on high volume, relatively straightforward products. The key insurance risks are as follows:
● | Motormotor insurance contracts (private and commercial): claims experience varies due to a range of factors, including age, gender and driving experience together with the type of vehicle and location.
location; |
● | Propertyproperty insurance contracts (residential and commercial): the major causes of claims for property insurance are weather (flood, storm), theft, fire, subsidence and various types of accidental damage.
damage; and |
● | Otherother commercial insurance contracts: risk arises from business interruption and loss arising from the negligence of the insured (liability insurance). Business interruption claims arise from the losses of income, revenue and/or profit as a result of property damage claims. Liability insurance includes employer’s liability and public/products liability.
|
Most general insurance contracts are written on an annual basis, which means that the Group’sGroup's liability extends for a 12twelve month period, after which the Group is entitled to decline to renew the policy or can impose renewal terms by amending the premium, terms and conditions.
An analysis of gross and net insurance claims can be found in Note 24 on the report and accounts (see page 216).
Business review continuedLife insurance business
The Group’s three regulated life companies, National Westminster Life Assurance Limited, Royal Scottish Assurance plc (RSA) and Direct Line Life Insurance Company Limited, are required to meet minimum capital requirements at all times under the FSA Prudential Sourcebook.
The capital resources covering the regulatory requirement are not transferable to other areas of the Group. To ensure that the capital requirement is satisfied at all times, each company holds a voluntary buffer above the regulatory minimum. Reserving risk is managed for life businesses through detailed analysis of historical and industry claims data and robust control procedures around reserving models. The Group uses exclusively proportional reinsurance, quota share and surplus, for its life insurance entities.
The Group is not exposed to price, currency, credit, or interest risk on unit linked life contracts but it is exposed to variation in management fees. In the UK, the Group also writes insurance contracts with minimum guaranteed death benefits that expose it to the risk that declines in the value of underlying investments may increase the Group’s net exposure to mortality risk.
The Group’s long-term assurance contracts include whole-life, term assurance, endowment assurance, flexible whole life, pension and annuity contracts that are expected to remain in force for an extended period of time. Contracts under which the Group does not accept significant insurance risk are classified as investment contracts. Long term business provisions are calculated in accordance with the UK accounting standard FRS 27 ‘Life Assurance’.
Estimations (assumptions) including future mortality, morbidity, persistency and levels of expenses are made in calculating actuarial reserves. Key metrics include:
| Assumptions | | 2008 | | | 2007 | | | 2006 | |
| Valuation interest rate | | | | | | | | | |
| Term assurance | | | 2.50% | | | | 3.00% | | | | 3.00% | |
| Interest | | | 2.50% | | | | 3.00% | | | | 3.00% | |
| Unit growth | | | 3.70% | | | | 3.50% | | | | 3.50% | |
| Expense inflation | | | 3.00% | | | | 4.00% | | | | 4.00% | |
Sample mortality rates, expressed as deaths per million per annum, for term assurance products (age 40).
| Mortality | | 2008 per annum | | | 2007 per annum | | | 2006 per annum | |
| Male non-smoker | | | 723 | | | | 810 | | | | 517 | |
| Male smoker | | | 1,590 | | | | 1,830 | | | | 983 | |
| Female non-smoker | | | 568 | | | | 460 | | | | 278 | |
| Female smoker | | | 1,277 | | | | 1,310 | | | | 618 | |
Expenses:
Pre-2000 products – RSA | | 2008
per annum
| | | 2007
per annum
| | | 2006
per annum
| |
Lifestyle protection plan | | | £29.30 | | | | £25.18 | | | | £28.96 | |
Mortgage savings plan | | | £65.92 | | | | £56.67 | | | | £65.15 | |
Pre-2000 products – NatWest Life | | | | | | | | | |
Term assurances
| | | £26.01 | | | | £26.01 | | | | £26.01 | |
Linked life bonds | | | £26.01 | | | | £26.01 | | | | £26.01 | |
Post-2000 products | | | | | | | | | |
Term assurances | | | £23.17 | | | | £23.16 | | | | £23.16 | |
Guaranteed bonds | | | £25.71 | | | | £25.71 | | | | £25.71 | |
Business review continuedThe key factors that increase the frequency of claims include epidemics or widespread changes in lifestyle.
The Group uses base tables of standard mortality appropriate to the type of contract being written and the territory in which the insured person resides. These are adjusted to reflect the Group’s experience and expectations for future mortality improvements as appropriate.
Sensitivity factor | Description of sensitivity factor applied |
Interest rate and investment return | Change in market interest rates of ±1%
The test allows consistently for similar changes to investment returns and movements in the market value of backing fixed interest securities
|
Expenses | Increase in maintenance expenses of 10% |
Assurance mortality/morbidity | Increase in mortality/morbidity rates for assurance contracts of 5% |
Annuitant mortality | Reduction in mortality rates for annuity contracts of 5% |
The above UK sensitivity factors are applied through actuarial and statistical models, with the following impactnotes on the financial statements.statements (see page 288).
| | | Impact on profit and equity | |
| Risk factor | | Variability | | | | 2008 £m | | | | 2007 £m | |
| Interest rates | | | +1% | | | | (11 | ) | | | (18 | ) |
| Interest rates | | | –1% | | | | 11 | | | | 15 | |
| Expenses | | | +10% | | | | (7 | ) | | | (5 | ) |
| Assurance mortality/morbidity | | | +5% | | | | (9 | ) | | | (8 | ) |
| Annuitant mortality | | | –5% | | | | — | | | | — | |
Reinsurance
The Group uses various types of reinsurance to transfer risk that is outside the Group’s risk appetite, including:
● | Per individual risk excess of loss reinsurance. |
● | Catastrophe excess of loss reinsurance. |
● | Quota share and surplus reinsurance. |
Business review continuedOperational risk (unaudited)risk*
Operational risk is the risk of financial loss or reputational impact resulting from fraud; human error; ineffectiveinadequate or inadequately designedfailed internal processes, or systems; improper behaviour; legal events;people and systems, or from external events. Operational risk is an integral and unavoidable part of the Group’s business as it is inherent in the processes it operates in to provide services to customers and generate profit for shareholders.
An objective of operational risk management is not to remove operational risk altogether, but to manage the risk to an acceptable level, taking into account the cost of minimising the risk withas against the resultant reduction in exposure. Strategies to manage operational risk include avoidance, transfer, acceptance and mitigation by controls.
Group Policy Framework (GPF)
The GPF supports a consistent approach to how we do business and helps everyone understand their individual and collective responsibilities. It is a core component of the Group’s Risk Appetite Framework; it supports the risk appetite setting process, and also underpins the control environment.
Work to design, implement and embed an enhanced GPF has continued throughout 2010 and will extend into 2011. The Group’s plans for ongoing development of GPF will support increased consistency in risk appetite setting across all risk types faced by the Group, including alignment to the Group’s strategic business and risk objectives. The Group will use relevant external reference points such as peers and rating agencies to challenge and verify the content of the Policy Standards making up GPF.
Appropriate and effectively implemented Policy Standards are a fundamental component of GPF and support attainment and maintenance of an ‘upper quartile’ control framework as compared against the Group’s relevant peer set.
The GPF requires consideration and agreement through Group governance of the level of risk appetite we have and how this is justifiable in the context of our strategic objectives.
There will be ongoing reassessment of risks, risk appetite and controls or risk acceptance.within the GPF and where appropriate, potential issues will be identified and addressed to ensure the Group moves in line with the set objectives and remains constantly aligned with the ‘upper quartile’ objective and market practice at all times.
* unaudited
Business reviewcontinued | Business review |
| Risk and balance sheet management |
Through the three lines of defence model the Group obtains assurance that the standards in the GPF are being adhered to. GPF defines requirements for testing and gathering evidence which demonstrates that each division and function is appropriately controlled.
GPF is owned and managed by the Group’s operational risk function and relies upon the operational risk framework for effective implementation and ongoing maintenance.
Three lines of defence model
To ensure appropriate responsibility is allocated for the management, reporting and escalation of operational risk, the Group operates a three lines of defence model which outlines principles for the roles, responsibilities and accountabilities for operational risk management.
Operational Risk – three lines1st line of defence model The business |
1st Line2nd line of defence Operational risk | | | 2nd Line3rd line of defence | | | 3rd Line of defenceGroup Internal Audit |
| | | | | | | |
The Business
Accountable for the ownership and day-to-day management and control of operational risk. Responsible for implementing processes in compliance with Group policies. Responsible for testing key controls and monitoring compliance with Group policies. | | | Operational Risk
Responsible for the implementation and maintenance of the operational risk framework, tools and methodologies. Responsible for oversight and challenge on the adequacy of the risk and control processes operating in the business. | | | Group Internal Audit
Responsible for providing independent assurance on the design, adequacy and effectiveness of the Group’s system of internal controls. |
Responsible for implementing processes in compliance with Group policies. | | | Responsible for oversight and challenge on the adequacy of the risk and control processes operating in the business. | | | |
Responsible for testing key controls and monitoring compliance with Group policies. | | | | | | |
The Group’s Operational Risk Policy Standards (ORPS) are incorporated in the GPF. They provide the direction for delivering effective operational risk management and are designed to enable the consistent identification, assessment, management, monitoring and reporting of operational risk across the Group.
The three lines of defence model and the Operational Risk Policy and Principles (ORPP)ORPS apply throughout the Group and are implemented taking into account the nature and scale of the underlying business. The ORPP provides the direction for delivering effective operational risk management. It comprises principles, minimum standards and processes that enable the consistent identification, assessment, management, monitoring and reporting of operational risk across the Group. The objectives of the ORPP are to protect the Group from financial loss or damage to its reputation, its customers or staff and to ensure that it meets all necessary regulatory and legal requirements.
The Group-wide processes defined in the ORPP are supported by the following key operational risk management techniques:techniques are included in the ORPS;
● | Risk and control assessments: business units identify and assess operational risks to ensure that they are effectively managed, prioritised, documented and aligned to risk appetite.appetite; |
● | Scenario analysis: scenarios for operational risk are used to assess the possible impact of extreme but plausible operational risk loss events. Scenario assessments provide a forward-lookingforward looking basis for managing exposures that are beyond the Group’s risk appetite.appetite; |
● | Loss data management: each business unit’s internal loss data management process captures all operational risk loss events above £10,000. Thiscertain minimum thresholds. The data is used to enhance the adequacy and effectiveness of controls, identify opportunities to prevent or reduce the impact of re-occurrence,recurrence, identify emerging themes, enable formal loss event reporting and inform risk and control assessments and scenario analysis. Escalation of individual events to senior management is determined by the seriousness of the event. Operational loss events are categorised under the following headings: |
- clients, products and business practices;
- technology and infrastructure failures;
- employment practices and workplace safety;
- internal fraud;
- external fraud;
- execution, delivery and process management;
- malicious damage; and
- disaster and public safety.
| – | Clients, products and business practices; |
| – | Technology and infrastructure failures; |
| – | Employment practices and workplace safety; |
| – | Execution, delivery and process management; |
| – | Disaster and public safety. |
● | Key risk indicators: business units monitor key risk indicators against their material risks. These indicators are used to monitor the operational risk profile and exposure to losses against thresholds which trigger risk management actions. |
● | New product approval process: this process ensures that all new products or significant variations to existing products are subject to a comprehensive risk assessment. Products are evaluated and approved by specialist areas and are subject to executive approval prior to launch.launch; and |
| Self certification process: this requires management to monitor and report regularly on the internal control framework for which they are responsible, confirming its adequacy and effectiveness. This includes certifying compliance with the requirements of Group policies. |
Business review continued
In 2008, the Group introduced a new self-certification process, which requires management to regularly monitor and report on the internal control framework for which they are responsible and regularly review and confirm its adequacy and effectiveness. This includes certifying compliance with the requirements of Group policies.
The ORPP requires eachEach business unit to determine appropriate mitigation techniques to reducemust manage its operational risk exposure towithin an acceptable level, and thattesting the adequacy and effectiveness of controls and other risk mitigants (e.g.(for example, insurance) are tested regularly and documenting the results documented.results. Where unacceptable control weaknesses are identified, action plans must be produced and tracked to completion.
The Group purchases insurance to provide the business with financial protection against specific losses and to comply with statutory or contractual requirements. Insurance is primarily used as an additionala risk mitigation tool in controlling the Group’s exposures. However, as insurance only providesexposures providing protection against financial loss once a risk has crystallised, it is used as a complement to other controls.crystallised.
* unaudited
Business reviewcontinued | Business review |
| Risk and balance sheet management |
Risk management: Operational risk*continued
Operational risk metrics
Reporting forms an integral part of operational risk management. The Group’s risk management processes are designed to ensure that operational risk issues are identified, escalated and managed on a timely basis. Operational risk exposuresExposures for each division are reported through monthly risk and control reports, which provide detaildetails on the risk exposures and action plans for each significant business process.
Operational risk eventsplans. Events that have ana material, actual or potential financial impact in excess of £1 million, or which have a material impact on the Group’s finances, reputation or customers, are escalated and reported to divisional and Group executive.executives.
The graph below shows the operational risk events by category and value for 2007 and 2008.
Operational risk events (greater than £10,000) by riskevent category –- % of total risk events by count.
The chart below shows a similar distributionas at 31 December 2010, execution, delivery and process management, together with external fraud, continued to account for circa 90% of loss event numbers across the risk categories in 2008 as those in 2007.losses by count during 2010.
Business review continued
Operational risk events by category – % of total by value
The charts below show that execution, delivery, and process management accounted for over 60%a similar distribution of losses by value during 2008. This differs from 2007 where a single large valueacross the risk categories, captured at the date the event meant that clients, productsoccurred and business practices was the largest category.updated as losses crystallise.
Note:
Financial crime| (1) | Work continued throughout 2010 to ensure the treatment, capture and recording of losses in RBS N.V. mirrored the RBS group approach. This has resulted in a small movement in the 2009 metrics recorded in this report compared to those recorded last year. |
Financial crime
A high proportion of the Group’s operational risk events have a low financial cost associated with them and a very small proportion of operational risk events have a material impact. In 2010, 96% of reported operational losses had a value of £100,000 or less (2009 - 95%), but accounted for 33% of the overall impact (2009 - 18%). In contrast, 0.3% of the operational risk events had a value of £1 million or greater (2009 - 1%), but accounted for 35% of the overall impact (2009 - 61%).
Fraud prevention
Fraud remains a big challenge forto the Group, especially givenand the sophisticationrest of the criminal fraternity. However, thefinancial services industry. The Group continues to respond to such threats, by continuing to investthis threat, continually investing in people and processes for both detective and preventative measures, especially relatingin relation to cardthe impact of organised crime against the Group. The Group's key strategic programmes continue to focus on solutions for payment fraud, and cyber crime. Key initiatives include changes to authentication of payments, ATM security, software enhancementsidentification of counterfeit documentation and improvementonline banking protection for the Group’s customers. The Group’s investments have resulted in counterfeit detection.multi-million pound savings and, through close working ties with law enforcement agencies, handing down of significant custodial sentences
* unaudited
Business reviewcontinued | Business review |
| Risk and balance sheet management |
Risk management: Operational risk*continued
Physical security environment
The numberGroup continues to implement strong security measures to ensure the safety of staff, the Group’s customers and businesses from physical attacks on our retail business was broadly staticharm. Against an ever changing threat environment, these measures are kept under constant review and adapted accordingly. The past year has seen protests groups continue to target the Group (most notably Climate Camp in 2008 compared with 2007. Business plansAugust 2010); robust processes are in place to ensure the safety of customers and controls have been enhancedstaff during these demonstrations. The Group also continues to reflectmitigate against the increase in size of the global business during the year, for example changes to retail and ATM security and sharing best practice with competitors and law enforcement agencies.threat posed by international related terrorism.
Information security
The Group is committed to protecting customer, employee and Group information. Under a Group-wide policy framework, Group Information Security is developing, maintaininginformation with regard to the loss of confidentiality, integrity and implementing policiesavailability. This extends to all physical and systems to secure suchelectronic information. All employees and agentsrelated third parties of the Group are responsible for the protection of Group assets, systems and information. All customer information is treated as confidential and appropriate security is applied to protect the information. The Group Information Security Policies are aligned to international standards and regulatory requirements.
The Group recognisesAdditionally, the Group’s information security relating to the loss of confidentiality, integrity or availability of our information and systems, as a specific risk, which is managed through a Group Information Security Policy. Thispolicy is reviewed annuallyregularly and includes processes for managing and ensuringmonitoring compliance with the policy. The same standards apply to information controlled by the Group or managed by authorised third parties.
The Group continues to invest in programmes to enhance and maintain information security controls and systems. For example, during 2008, security reviews on2010 the Group have risk assessed the externally facing websites and penetration tested those websites that contain confidential, high-risk Group data and established an assurance team to implement an ongoing programme of third party suppliers and vendors were significantly increased.reviews.
Business continuity
The management of crisis situations and the need to ensure the continuity of business across the Group and the management of crisis situations is a key activity within the risk function. A consistent crisis and incident management framework has been rolled out across the Group, to ensure that any incident is identified, managed and resolved through skilled divisional, country, regional and global teams. A six step methodology is in place within the Group for managing incidents.
Key risks and threats that the Group is consistently monitoring from the crisis and incident managementa business continuity perspective include pandemics, terrorism, environmental impacts and technology disruptions.
Business continuity plans have been implementedare in place to ensure that the Group can continue key products, services, products and operations. A consistent crisis management framework has been developed that includes a six step methodology and allows incidents to be managed and resolved through skilled global teams.
All business continuity plans, related activities and systems are tested annually. The plan data is validated every 6 months and where the impact on business is high, the validation frequency is increased to every 3 months.
Regulatory risk*
Regulatory risk arises from the non-adherence to international and national rules and regulations. The Group manages regulatory risk through a regulatory risk and compliance framework that seeks to ensure the Group is in compliance with all banking, securities, insurance and anti-money laundering regulations defined by more than 120 different regulatory bodies and central banks across the world. This framework comprises global regulatory risk policies, tracking of regulatory developments, training and awareness, assurance and monitoring and regulatory relationship management.
Global regulatory risk policies
Within the Group Policy Framework (GPF), regulatory risk and compliance policies define minimum standards for all businesses to adhere to on a global basis. These policies are primarily driven by the rules and regulations set by the FSA as the Group’s lead regulator. These global minimum standards are supplemented by division specific policies where appropriate (product specific or local market specific requirements).
Regulatory developments
Regulatory environments are constantly evolving and it is critical that the Group both understands early on the drivers for this change and be able to assess the potential impact of prospective rules and regulations on the different businesses. The regulatory developments tracker seeks to identify, track and monitor all such material changes and ensure that an appointed senior executive is responsible for assessing the potential impacts on the Group’s business. Such activity supports both effective engagement in the regulatory consultation process, and planning for the introduction of new or changed rules and regulations.
During the last 12 months the Group has experienced unprecedented levels of prospective rules and regulations particularly in the area of prudential regulation (capital, liquidity, governance and risk management), and to the treatment of systemically important entities, in particular through initiatives on recovery and resolution plans (‘living wills’) - see page 344 for regulatory developments and reviews.
Training and awareness
Maintaining compliance with existing rules and regulations requires a continued investment in professional training and maintaining risk awareness. The group undertakes extensive training both with group wide learning initiatives (e.g. anti-money laundering) as well as divisional or product specific training. To support the professional development of the Group’s regulatory risk staff the Group has a comprehensive progressive training programme that is deployed on a global basis.
Assurance and monitoring
Assurance and monitoring activities are key to ensuring that the Group can demonstrate ongoing compliance with existing rules and regulations. Such activities are conducted in both the first line and second line of defence. Work to design, implement and embed enhanced monitoring tools was undertaken in 2010 and will continue into 2011.
Regulatory relationship management
The Group is committed to working with its regulators in an open and constructive way as it deals with both the evolution of regulatory frameworks as well as the ongoing compliance to existing rules and regulations. The regulatory relationship management tool is used to track, record, monitor and report on all material regulatory engagement to ensure that activities remain co-ordinated across the Group - see page 343 for a description of the key regulatory and supervisory bodies with which the Group engages.
* unaudited
Business review continued
Other risks (unaudited)
Regulatory risk
Regulatory risk is managed by designing, maintaining and implementing policies and systems in order to ensure effective compliance with all regulatory and legal requirements in the jurisdictions in which the Group operates. The Group’s approach to regulatory risk has three distinct elements:
·Business reviewcontinued | TheBusiness review of potential changes in regulation to ensure that the Group addresses the risks arising from such changes |
| Risk and responds appropriately;balance sheet management |
· | The monitoring of compliance with existing rules and regulations and the mitigation of the consequences of any inadvertent non compliance; and |
Risk managementcontinued
· | The management of effective relationships with regulators to ensure constructive engagement. |
Reputation risk*
Under a Group-wide framework of high-level policies, the Group and its subsidiaries engage co-operatively with all regulatory authorities in all the relevant jurisdictions, whether in response to regulatory change, on-going supervisory requirements or regulatory investigations.
During the course of 2008, responsibility for policy and oversight of anti-money laundering, sanctions and counter-terrorist financing moved to the Group Head of Regulatory Risk & Compliance.
Reputation risk is defined as the potential loss in reputation that could lead to negative publicity, loss of revenue, costly litigation, a decline in the customer base or the exit of key Group employees.
Reputation is the body of perceptions and opinions heldrisk can arise from actions taken by the stakeholdersGroup or a failure to take action, such as failing to assess the environmental, social or ethical impacts of an organisation; customers, suppliers, employees, investors, interest groups, regulators and government. Reputation determines how stakeholders are likelyclients or projects that the Group has provided products or services to.
The Group seeks to behave towards an organisation. Reputation risk arises from any activity that could have an adversesafeguard its reputation by considering the impact on the reputationvalue of its franchise from how it conducts business, its choice of customers and the way stakeholders view the Group. There are several important drivers ofManaging the Group’s reputation of a company (and reputation risk) including: financial performance; corporate governance and quality of management; ethical, social and environmental performance; marketing, innovation and customer relationships; and regulatory compliance and litigation.
The Group protects its reputation by understanding and managing reputation risks, including failure to meetis the expectations of stakeholders.
The Group will only enter into a commercial transaction or customer relationship which is legal and complies with regulatory requirements, has economic substance or business purpose and is not designed or used for inappropriate accounting or tax purposes. The Group takes care to understand the issues that matter most to stakeholders, balance the viewsjoint responsibility of all stakeholdersemployees, and address them coherently. Risks toreputational considerations should, as part of standard practice, be integrated into the reputation ofGroup’s day-to-day decision making structures.
Currently the Group are identified, assessed, managed, monitoredmanages reputational risk through a number of functions, such as divisions, Group Communications, Group Sustainability and reported.an Environmental, Social and Ethical (ESE) risk management function. The Group pays particular attention to the reputationlatter function is responsible for assessing ESE risks associated with the introduction of new products or customer relationships.business engagements and business divisions.
It is the responsibility of the management of all Group companies, acting through individual business units, to ensure that appropriate controls and procedures are in place to identify and manage the risks to the reputation of the Group arising from their activity.
The Board has ultimate responsibility for managing any impact on the reputation of the Group arising from its operations. HoweverThe Group Sustainability Committee (established at the beginning of 2010) sets the overall strategy and approach for the management of Group sustainability, however all parts of the Group take responsibility for reputation management.
The risk is viewed as material given the central nature of the Group’s market reputation in the strategic risk objectives.
Pension riskrisk*
The Group is exposed to risk tofrom its defined benefit pension schemes to the extent that the assets of the schemes do not fully match the timing and amount of the schemes’ liabilities. Pension scheme liabilities vary with changes to long-term interest rates, inflation, pensionable salaries and the longevity of scheme members as assets comprise investment portfolios which are heldwell as changes in legislation. The Group is exposed to meet projected liabilities to scheme members. Risk arises because returns from these investments may be less than expected or there may be greater than expected increases in the estimatedrisk that the market value of the schemes’ liabilities.assets, together with future returns and any additional future contributions could be considered insufficient to meet the liabilities as they fall due. In such circumstances, the Group could be obliged, or may choose, to make additional contributions to the schemes.
The RBS Group Pension Fund (“Main scheme”) is the largest of the schemes and the main source of pension obligation risk,risk. The Main scheme operates under a trust deed under which the corporate trustee, RBS Pension Trustees Limited, is a wholly owned subsidiary of The Royal Bank of Scotland plc and the RBStrustee board comprises six directors selected by the Group Pension Fund. and four directors nominated by members.
The trustee is solely responsible for the investment of the schemes assets which are held separately from the assets of the Group. The Group and the trustee must agree on the investment principles and the funding plan.
In October 2006, thisthe Main scheme was closed to new employees. In November 2009, the Group confirmed that it was making changes to the Main scheme and a number of other defined benefit schemes including the introduction of a limit of 2% per annum (or Consumer Price Indices (CPI) inflation, if lower) to the amount of any salary increase that will count for pensionable purposes.
Risk appetite and investment policy are agreed by the Board of Trusteestrustee with quantitative and qualitative input from the scheme actuaries and investment advisers. The Board of Trusteestrustee also consults with the Group to obtain its view on the appropriate level of risk within the pension fund.
The Group maintains an independent review of risk within the Pension Funds.
GALCOits pension funds. The Group Risk Committee now monitors pension obligation risk which is assessed by estimatingon an ongoing basis with a monthly report illustrating the potential funding deficitpositions and key sensitivities of the scheme with a twelve month risk horizon, and with a numberGroup’s pension schemes. Additionally, as part of different confidence levels. Monte Carlo simulations are used, based on assumptions of statistical distribution of future equity returns, future real and nominal interest rates, sensitivity ofthe Internal Capital Adequacy Assessment Process (ICAAP) process, the change in asset and liability values to changes in equity returns and real and nominal interest rates, the impact of an adverse change in longevity assumptions and mitigation available to the Group.is modelled over a twelve-month time horizon under a stressed scenario.
The most recent funding valuation was carried out asof the Main scheme at 31 March 2007. This showed2010 is currently in progress. Further details are given in Note 4 on the fund to be in surplus, and therefore there was no need in 2008 for additional payments over and above the regular contributions. accounts.
The next funding valuation is scheduled to be carried out asMain scheme, which represents 84% of plan assets at 31 March 2010.December 2010, is invested in a diversified portfolio of quoted and private equity, government and corporate fixed interest and index-linked bonds, and other assets including property and hedge funds. The trustee has taken measures to partially mitigate inflation and interest rate risks both by investment in suitable physical assets and by entering into inflation and interest rate swaps. The Main scheme has an additional exposure to rewarded risk by investing in equity futures.
The table below shows the impact on the Main schemes assets and liabilities (measured according to IAS 19 ‘Employee Benefits’) of changes in interest rates and equity values at the year end, taking account of the current asset allocation and hedging arrangements.
| | Change in value of assets £m | Change in value of liabilities £m | Decrease/ (increase) in net pension obligations £m |
| As at 31 December 2010 | | | |
| Fall in nominal swap yields of 0.25% at all durations with no change in credit spreads | 422 | 193 | 229 |
| Fall in real swap yields of 0.25% at all durations with no change in credit spreads | 355 | 799 | (444) |
| Fall in credit spreads of 0.25% at all durations with no change in nominal or real swap yields | 98 | 1,005 | (907) |
| Fall in equity values of 10% | (1,083) | — | (1,083) |
* unaudited
Business reviewcontinued | Business review |
| Risk and balance sheet management |
Business review continued
Other risk exposures
Credit market and relatedRisk management: Other risk exposures
All the disclosures in this section (pages 144 to 160) are audited unless otherwise indicated with an asterisk (*).
Explanatory note (unaudited)
These disclosures provide information foron certain elements of the Group’s businessGroup's credit market activities, affected by the unprecedented market events of 2008, the majority of which arose withinare in Non-Core and, to a lesser extent, Global Banking and& Markets, (GBM). The disclosures are focused around GBM’s credit markets activities, including the conduit business, which have been particularly affected by the widespread market disruptions, as well as similar exposures in US Retail & Commercial (‘Citizens’) and Group Treasury.
In preparing these For credit valuation adjustments (CVA), leveraged finance and conduits disclosures, the Group took into consideration the leading practice disclosure recommendations of the Financial Stability Forum issued in April 2008.
Market background (unaudited)
Overall, 2008information presented has been characterised by rapid dislocationanalysed between the Group's Core and Non-Core businesses.
Definitions of acronyms used in financial markets. In many cases, the dramatic liquidity squeeze and rise in funding costs for financial institutions has resulted in reluctance or inability of market participants to transact, and has adversely affected the performance of most financial institutions globally, including the Group. Stock markets have experienced extraordinary falls, and levels of volatility have been at record highs. Commodity prices have reduced sharplythis section can be found in the second half of the year, and credit spreads continuedGlossary on pages 390 to widen. Market perception of counterparty risk increased and the failure of major credit protection providers caused fair value losses for the Group and other market participants and further increased the costs of mitigating credit exposure. Sustained falls globally in both residential and commercial real estate prices, fund valuations and worsening loan performance combined with a sustained lack of liquidity in the market, resulted in a greater amount of assets being valued at significantly lower prices.395.
An indication of the continued decline in the price of asset backed securities (ABS), in particular those collateralised with sub-prime assets, is shown in the following graph. While not fully representative of the Group’s ABS exposures or pricing basis, the ABX series of indices charted in the graph show, in bond price terms, how differently rated ABS referencing US sub-prime mortgages securitised in 2007 have performed during the year.
The graph below provides an indication of the change in credit worthiness of corporate entities to which the Group has significant exposure through its credit products in the form of credit derivatives and bonds. The MarkiT iTraxx Europe graph demonstrates the impact of the movement of credit spreads in price terms for a basket of European corporate entities (prices rebased to 100 at the beginning of the year).
Business review continued
The first quarter of 2008 saw a further credit and liquidity shortages experienced during 2007, culminating in the collapse of Bear Stearns in March. The centre of the credit issues remained the ABS market with worsening US economic data supporting higher levels of default expectation in the property market. However, these default expectations started to go beyond the sub-prime market with Alt A and other non-conforming classes of loans particularly seeing significant price deterioration. In addition, wider economic concerns led to heavy fair value losses in the commercial mortgage backed securities (CMBS) market, in corporate debt and in leveraged loan exposures. Following this tightening of conditions, the Group incurred significant losses in March and took steps in April to materially strengthen its capital base through a £12 billion rights issue which was completed in June.
During the second quarter ABS prices initially rallied and steadied, however towards the end of the quarter a negative house price trend in the UK became clear, and in the US, market reaction to sub-prime mortgages extended to prime and near prime lending. Corporate credit spreads followed a similar pattern reacting to rising oil prices, inflationary pressures and continuing high LIBOR despite base rate cuts to 5% in April.
Credit spreads continued to widen across the market through the third quarter and liquidity levels reduced further, resulting in pressure on banks and economies worldwide. This culminated in the demise of Lehman Brothers in September and further market consolidation and global state intervention to provide support to the banking sector.
During the fourth quarter there was a continued lack of confidence in the inter-bank market, with demand for stable investments resulting in US treasuries reaching negative spreads. Corporate and ABS prices fell further particularly in the last two months of the year increasing pressure on banks’ capital positions. The Group moved to strengthen its capital position through an open offer to raise £15 billion, underwritten by the UK government. The year concluded with S&P downgrading the credit ratings of eleven global banks, including the Group.
Asset-backed exposuressecurities
Significant risk concentrations (audited)
The Group’s credit markets activities gives rise to risk concentrations that have been particularly affected by the market turmoil experienced since the second half of 2007. The Group structures, originates, distributes and trades debt in the form of loan, bond and derivative instruments in all major currencies and debt capital markets in North America, Western Europe, Asia and major emerging markets.
During 2008, certain assets identified as being high risk were also transferred to a centrally managed asset unit, set up to provide specific management The carrying value of this portfolio of higher risk assets. Transferred assets are predominantly ABS and associated protection purchased from monoline insurers and other counterparties.
The tables below summarise the net exposures and balance sheet carrying values of theseGroup's debt securities by measurement classification and references to sections with further information on specific products.
| | | | | | | | | | | | | | | | |
| Net exposure (1) | | | 2008
£m | | | | 2007
£m | | | | 2008
£m | | | | 2007
£m | | | | 2008
£m | | | | 2007
£m | | | | 2008
£m | | | | 2007
£m | | | | 2008
£m | | | | 2007
£m | |
| RMBS | | | 24,462 | | | | 35,105 | | | | 44,450 | | | | 27,875 | | | | 2,578 | | | | 5 | | | | 182 | | | | 90 | | | | 71,672 | | | | 63,075 | |
| CMBS | | | 1,178 | | | | 2,749 | | | | 918 | | | | 977 | | | | 1,437 | | | | 626 | | | | 13 | | | | 47 | | | | 3,546 | | | | 4,399 | |
| CDOs/CLOs | | | 2,463 | | | | 7,288 | | | | 2,538 | | | | 2,174 | | | | 1,282 | | | | — | | | | — | | | | 23 | | | | 6,283 | | | | 9,485 | |
| Other ABS | | | 195 | | | | 3,479 | | | | 6,572 | | | | 5,579 | | | | 3,621 | | | | 72 | | | | 40 | | | | 186 | | | | 10,428 | | | | 9,316 | |
| Total | | | 28,298 | | | | 48,621 | | | | 54,478 | | | | 36,605 | | | | 8,918 | | | | 703 | | | | 235 | | | | 346 | | | | 91,929 | | | | 86,275 | |
| | | | 2009 | | 2008 |
| | 2010 Group | | Group before RFS MI | Group | | Group before RFS MI | Group |
| | £bn | | £bn | £bn | | £bn | £bn |
| Securities issued by central and local governments | 124.0 | | 134.1 | 146.9 | | 95.1 | 105.8 |
| Asset-backed securities | 70.8 | | 87.6 | 88.1 | | 111.1 | 111.1 |
| Securities issued by corporates and other entities | 9.7 | | 13.4 | 14.4 | | 24.3 | 26.2 |
| Securities issued by banks and building societies | 13.0 | | 14.0 | 17.8 | | 22.7 | 24.4 |
| | 217.5 | | 249.1 | 267.2 | | 253.2 | 267.5 |
| Carrying value (2) | | | | | | | | | | | | | | | | | | | | | | | | | | | | |
| RMBS | | | 27,849 | | | | 37,280 | | | | 44,791 | | | | 27,880 | | | | 2,618 | | | | 5 | | | | 182 | | | | 90 | | | | 75,440 | | | | 65,255 | |
| CMBS | | | 2,751 | | | | 3,916 | | | | 1,126 | | | | 976 | | | | 1,437 | | | | 626 | | | | 13 | | | | 37 | | | | 5,327 | | | | 5,555 | |
| CDOs/CLOs | | | 7,774 | | | | 15,477 | | | | 9,579 | | | | 2,173 | | | | 1,284 | | | | — | | | | — | | | | 26 | | | | 18,637 | | | | 17,676 | |
| Other ABS | | | 1,505 | | | | 5,758 | | | | 6,572 | | | | 5,579 | | | | 3,621 | | | | 72 | | | | 41 | | | | 186 | | | | 11,739 | | | | 11,595 | |
| Total | | | 39,879 | | | | 62,431 | | | | 62,068 | | | | 36,608 | | | | 8,960 | | | | 703 | | | | 236 | | | | 339 | | | | 111,143 | | | | 100,081 | |
(1) | Net exposure is carrying value after taking account of hedge protection purchased from monolines and other counterparties but excludes the effect of counterparty credit valuation adjustment. The protection provides credit protection against the notional and interest cash flows due to the holders of debt instruments in the event of default by the debt security counterparty. The value of the protection is based on the underlying instrument being protected. |
(2) | Carrying value is the amount recorded on the balance sheet. |
(3) | Certain instruments have been reclassified from the held-for-trading category to loans and receivables or available-for-sale categories, as permitted by the amendment to IAS 39 issued in October 2008, therefore affecting comparability by measurement classification. |
Business review continued
Asset backedThe Group’s credit market activities gave rise to risk concentrations in asset-backed securities (ABS) are securities that represent an interest in an underlying pool of referenced assets. The referenced pool can comprise any assets which attract a set of associated cash flows but are commonly pools of residential or commercial mortgages and, in the case of Collateralised Debt Obligations (CDOs), the referenced pool may be ABS or other classes of assets. The process by which the risks and rewards of the pool are passed on to investors via the issuance of securities with varying seniority is commonly referred to as securitisation.
During 2008, as the problems in the sub-prime sector spread to other asset classes on a global basis and credit spreads widened due to concerns over creditworthiness of underlying assets, securitisation volumes continued to be thin. Over the preceding years GBM had established itself as an active arranger of third-party securitisations and a secondary dealer in these securities, and GBM had therefore accumulated assets that became difficult to sell given market conditions.
. The Group has exposures to ABS which are predominantly debt securities, but can also be held in derivative form. These positions had been acquired primarily throughABS have an interest in an underlying pool of referenced assets. The risks and rewards of the Group’s activities inreferenced pool are passed onto investors by the US leveraged finance market which were expanded during 2007. Theseissue of securities with varying seniority, by a special purpose entity.
Debt securities include residential mortgage-backed securities (‘RMBS’)(RMBS), commercial mortgage-backed securities (‘CMBS’)(CMBS), ABS CDOscollateralised debt obligations (CDOs), collateralised loan obligations (CLOs) and other ABS. In many cases the risk onassociated with these assets is hedged viaby way of credit derivative protection, purchased over the specific asset or relevant ABS indices. The counterparty to some of these hedge transactions are monoline insurers (see Monoline insurers on page 114).
The following tables summarise the gross and net exposureexposures and carrying values of these securities by geography of the Group’s holdings of ABS increased from £86.3 billionunderlying assets at 31 December 20072010, 2009 and 2008. Gross exposures represent the principal amounts relating to £91.9 billion by 31 December 2008, where underlying reductions have been more than offsetABS. G10 government RMBS comprises securities that are: (a) guaranteed or effectively guaranteed by the effectUS government, by way of exchange rates. The net exposure incorporatesits support for US federal agencies and government sponsored enterprises or (b) guaranteed by the Dutch government. Net exposures represent the carrying value after taking account of the hedge protection purchased from monoline insurers and other counterparties, but excludesexclude the effect of counterparty credit valuation adjustments. AllThe hedge provides credit protection referred toof both principal and interest cash flows in the credit market and related exposures section relates to economic hedges that do not qualify for hedge accounting.
Through a sustained de-risking exerciseevent of default by the Group made reductions tocounterparty. The value of this protection is based on the overall risk through a combination of direct asset sales and switching to lower risk assets through trading activities. As a large proportion of the ABS are denominated in US dollars, these reductions in exposure were partially offset due to the movement in the exchange rate against sterling.
underlying instrument being protected. The majority of the Group’s RMBS portfoliotables at 31 December 2008,2009 exclude RMBS covered bonds in terms ofRFS MI, comprising gross exposure - £558 million, carrying value - £579 million, and net exposure was AAA rated guaranteed or effectively guaranteed- £579 million.
Business reviewcontinued | Business review |
| Risk and balance sheet management |
Risk management: Other risk exposurescontinued
Asset-backed securities by product, geography and measurement classification
| | | | | | | FVTPL (1) | | |
| | US | UK | Other Europe | RoW (2) | Total | HFT (3) | DFV (4) | AFS (5) | LAR (6) |
| 2010 | £m | £m | £m | £m | £m | £m | £m | £m | £m |
| Gross exposure | | | | | | | | | |
| RMBS: G10 government | 24,207 | 16 | 6,422 | — | 30,645 | 13,840 | — | 16,805 | — |
| RMBS: covered bond | 138 | 208 | 8,525 | — | 8,871 | — | — | 8,871 | — |
| RMBS: prime | 1,784 | 3,385 | 1,118 | 192 | 6,479 | 1,605 | 1 | 4,749 | 124 |
| RMBS: non-conforming | 1,249 | 2,107 | 92 | — | 3,448 | 708 | — | 1,313 | 1,427 |
| RMBS: sub-prime | 792 | 365 | 139 | 221 | 1,517 | 819 | — | 496 | 202 |
| CMBS | 3,086 | 1,451 | 912 | 45 | 5,494 | 2,646 | 120 | 1,409 | 1,319 |
| CDOs | 12,156 | 128 | 453 | — | 12,737 | 7,951 | — | 4,687 | 99 |
| CLOs | 6,038 | 134 | 879 | 9 | 7,060 | 1,062 | — | 5,572 | 426 |
| Other ABS | 3,104 | 1,144 | 2,871 | 1,705 | 8,824 | 1,533 | — | 4,523 | 2,768 |
| | 52,554 | 8,938 | 21,411 | 2,172 | 85,075 | 30,164 | 121 | 48,425 | 6,365 |
| | | | | | | | | | |
| Carrying value | | | | | | | | | |
| RMBS: G10 government | 24,390 | 16 | 5,958 | — | 30,364 | 13,765 | — | 16,599 | — |
| RMBS: covered bond | 142 | 208 | 7,522 | — | 7,872 | — | — | 7,872 | — |
| RMBS: prime | 1,624 | 3,000 | 931 | 192 | 5,747 | 1,384 | 1 | 4,249 | 113 |
| RMBS: non-conforming | 1,084 | 1,959 | 92 | — | 3,135 | 605 | — | 1,102 | 1,428 |
| RMBS: sub-prime | 638 | 255 | 120 | 205 | 1,218 | 681 | — | 344 | 193 |
| CMBS | 2,936 | 1,338 | 638 | 38 | 4,950 | 2,262 | 118 | 1,281 | 1,289 |
| CDOs | 3,135 | 69 | 254 | — | 3,458 | 1,341 | — | 2,021 | 96 |
| CLOs | 5,334 | 102 | 635 | 3 | 6,074 | 691 | — | 4,958 | 425 |
| Other ABS | 2,780 | 945 | 2,615 | 1,667 | 8,007 | 1,259 | — | 4,089 | 2,659 |
| | 42,063 | 7,892 | 18,765 | 2,105 | 70,825 | 21,988 | 119 | 42,515 | 6,203 |
| | | | | | | | | | |
| Net exposure | | | | | | | | | |
| RMBS: G10 government | 24,390 | 16 | 5,958 | — | 30,364 | 13,765 | — | 16,599 | — |
| RMBS: covered bond | 142 | 208 | 7,522 | — | 7,872 | — | — | 7,872 | — |
| RMBS: prime | 1,523 | 2,948 | 596 | 192 | 5,259 | 897 | 1 | 4,248 | 113 |
| RMBS: non-conforming | 1,081 | 1,959 | 92 | — | 3,132 | 602 | — | 1,102 | 1,428 |
| RMBS: sub-prime | 289 | 253 | 112 | 176 | 830 | 305 | — | 332 | 193 |
| CMBS | 1,823 | 1,336 | 458 | 38 | 3,655 | 1,188 | 10 | 1,230 | 1,227 |
| CDOs | 1,085 | 39 | 245 | — | 1,369 | 743 | — | 530 | 96 |
| CLOs | 1,387 | 102 | 629 | 1 | 2,119 | 673 | — | 1,021 | 425 |
| Other ABS | 2,293 | 748 | 2,609 | 1,659 | 7,309 | 690 | — | 4,081 | 2,538 |
| | 34,013 | 7,609 | 18,221 | 2,066 | 61,909 | 18,863 | 11 | 37,015 | 6,020 |
For notes to this table refer to page 147.
Business reviewcontinued | Business review |
| Risk and balance sheet management |
Risk management: Other risk exposurescontinued
Asset-backed securities by product, geography and measurement classification continued
| | | | | | | FVTPL (1) | | |
| | US | UK | Other Europe | RoW (2) | Total | HFT (3) | DFV (4) | AFS (5) | LAR (6) |
| 2009 | £m | £m | £m | £m | £m | £m | £m | £m | £m |
| Gross exposure | | | | | | | | | |
| RMBS: G10 government | 26,644 | 17 | 7,016 | 94 | 33,771 | 13,536 | — | 20,235 | — |
| RMBS: covered bond | 49 | 297 | 9,019 | — | 9,365 | — | — | 9,365 | — |
| RMBS: prime | 2,965 | 5,276 | 4,567 | 222 | 13,030 | 6,274 | 147 | 5,761 | 848 |
| RMBS: non-conforming | 1,341 | 2,138 | 128 | — | 3,607 | 635 | — | 1,498 | 1,474 |
| RMBS: sub-prime | 1,668 | 724 | 195 | 561 | 3,148 | 1,632 | 17 | 1,020 | 479 |
| CMBS | 3,422 | 1,781 | 1,420 | 75 | 6,698 | 2,936 | 209 | 1,842 | 1,711 |
| CDOs | 12,382 | 329 | 571 | 27 | 13,309 | 9,080 | 1 | 3,923 | 305 |
| CLOs | 9,092 | 166 | 2,169 | 1,173 | 12,600 | 5,346 | — | 6,581 | 673 |
| Other ABS | 3,587 | 1,980 | 5,031 | 1,569 | 12,167 | 2,912 | 18 | 5,252 | 3,985 |
| | 61,150 | 12,708 | 30,116 | 3,721 | 107,695 | 42,351 | 392 | 55,477 | 9,475 |
| | | | | | | | | | |
| Carrying value | | | | | | | | | |
| RMBS: G10 government | 26,984 | 17 | 6,870 | 33 | 33,904 | 13,397 | — | 20,507 | — |
| RMBS: covered bond | 50 | 288 | 8,734 | — | 9,072 | — | — | 9,072 | — |
| RMBS: prime | 2,696 | 4,583 | 4,009 | 212 | 11,500 | 5,133 | 141 | 5,643 | 583 |
| RMBS: non-conforming | 958 | 1,957 | 128 | — | 3,043 | 389 | — | 1,180 | 1,474 |
| RMBS: sub-prime | 977 | 314 | 146 | 387 | 1,824 | 779 | 17 | 704 | 324 |
| CMBS | 3,237 | 1,305 | 924 | 43 | 5,509 | 2,279 | 216 | 1,637 | 1,377 |
| CDOs | 3,275 | 166 | 400 | 27 | 3,868 | 2,064 | 1 | 1,600 | 203 |
| CLOs | 6,736 | 112 | 1,469 | 999 | 9,316 | 3,296 | — | 5,500 | 520 |
| Other ABS | 2,886 | 1,124 | 4,369 | 1,187 | 9,566 | 1,483 | 19 | 4,621 | 3,443 |
| | 47,799 | 9,866 | 27,049 | 2,888 | 87,602 | 28,820 | 394 | 50,464 | 7,924 |
| | | | | | | | | | |
| Net exposure | | | | | | | | | |
| RMBS: G10 government | 26,984 | 17 | 6,870 | 33 | 33,904 | 13,397 | — | 20,507 | — |
| RMBS: covered bond | 50 | 288 | 8,734 | — | 9,072 | — | — | 9,072 | — |
| RMBS: prime | 2,436 | 3,747 | 3,018 | 172 | 9,373 | 3,167 | 142 | 5,480 | 584 |
| RMBS: non-conforming | 948 | 1,957 | 128 | — | 3,033 | 379 | — | 1,180 | 1,474 |
| RMBS: sub-prime | 565 | 305 | 137 | 290 | 1,297 | 529 | 17 | 427 | 324 |
| CMBS | 2,245 | 1,228 | 595 | 399 | 4,467 | 1,331 | 203 | 1,556 | 1,377 |
| CDOs | 743 | 124 | 382 | 26 | 1,275 | 521 | 1 | 550 | 203 |
| CLOs | 1,636 | 86 | 1,104 | 39 | 2,865 | 673 | — | 1,672 | 520 |
| Other ABS | 2,117 | 839 | 4,331 | 1,145 | 8,432 | 483 | 19 | 4,621 | 3,309 |
| | 37,724 | 8,591 | 25,299 | 2,104 | 73,718 | 20,480 | 382 | 45,065 | 7,791 |
For notes to this table refer to page 147.
Business reviewcontinued | Business review |
| Risk and balance sheet management |
Risk management: Other risk exposurescontinued
Asset-backed securities by product, geography and measurement classification continued
| | | | | | | FVTPL (1) | | |
| | US | UK | Other Europe | RoW (2) | Total | HFT (3) | DFV (4) | AFS (5) | LAR (6) |
| 2008 | £m | £m | £m | £m | £m | £m | £m | £m | £m |
| Carrying value | | | | | | | | | |
| RMBS: G10 government | 33,464 | 25 | 7,642 | 46 | 41,177 | 18,631 | — | 22,546 | — |
| RMBS: covered bond | 44 | 296 | 10,040 | — | 10,380 | — | — | 10,380 | — |
| RMBS: prime | 5,623 | 4,754 | 6,154 | 246 | 16,777 | 7,272 | 166 | 8,769 | 570 |
| RMBS: non-conforming | 1,111 | 2,906 | — | — | 4,017 | 352 | — | 2,183 | 1,482 |
| RMBS: sub-prime | 1,824 | 445 | 439 | 381 | 3,089 | 1,594 | 16 | 913 | 566 |
| CMBS | 2,145 | 1,395 | 1,646 | 141 | 5,327 | 2,751 | 13 | 1,126 | 1,437 |
| CDOs | 8,275 | 259 | 441 | 45 | 9,020 | 4,389 | — | 4,280 | 351 |
| CLOs | 6,428 | 329 | 2,605 | 255 | 9,617 | 3,385 | — | 5,299 | 933 |
| Other ABS | 3,582 | 1,622 | 5,098 | 1,437 | 11,739 | 1,505 | 41 | 6,571 | 3,622 |
| | 62,496 | 12,031 | 34,065 | 2,551 | 111,143 | 39,879 | 236 | 62,067 | 8,961 |
| | | | | | | | | | |
| Net exposure | | | | | | | | | |
| RMBS: G10 government | 33,464 | 25 | 7,642 | 46 | 41,177 | 18,631 | — | 22,546 | — |
| RMBS: covered bond | 44 | 296 | 10,040 | — | 10,380 | — | — | 10,380 | — |
| RMBS: prime | 5,548 | 3,667 | 5,212 | 215 | 14,642 | 5,138 | 166 | 8,768 | 570 |
| RMBS: non-conforming | 1,106 | 2,906 | — | — | 4,012 | 346 | — | 2,184 | 1,482 |
| RMBS: sub-prime | 358 | 408 | 380 | 313 | 1,459 | 346 | 16 | 571 | 526 |
| CMBS | 1,147 | 1,225 | 1,095 | 79 | 3,546 | 1,178 | 13 | 918 | 1,437 |
| CDOs | 2,402 | 127 | 311 | — | 2,840 | 1,618 | — | 873 | 349 |
| CLOs | 874 | 259 | 2,139 | 171 | 3,443 | 845 | — | 1,665 | 933 |
| Other ABS | 3,507 | 1,367 | 4,299 | 1,256 | 10,429 | 196 | 40 | 6,572 | 3,621 |
| | 48,450 | 10,280 | 31,118 | 2,080 | 91,928 | 28,298 | 235 | 54,477 | 8,918 |
Notes:
| (1) | Fair value through profit or loss. |
| (4) | Designated as at fair value. |
| (6) | Loans and receivables. |
Business reviewcontinued | Business review |
| Risk and balance sheet management |
Risk management: Other risk exposurescontinued
The table below summarises the rating levels of £51.1 billion, comprising:ABS carrying values. Credit ratings are based on those from rating agencies Standard & Poor’s (S&P), Moody’s and Fitch and have been mapped onto the S&P scale.
| | AAA | AA to AA+ | A to AA- | BBB- to A- | Non-investment grade | Unrated | Total |
| 2010 | £m | £m | £m | £m | £m | £m | £m |
| RMBS: G10 government | 28,835 | 1,529 | — | — | — | — | 30,364 |
| RMBS: covered bond | 7,107 | 357 | 408 | — | — | — | 7,872 |
| RMBS: prime | 4,355 | 147 | 67 | 82 | 900 | 196 | 5,747 |
| RMBS: non-conforming | 1,754 | 144 | 60 | 316 | 809 | 52 | 3,135 |
| RMBS: sub-prime | 317 | 116 | 212 | 39 | 458 | 76 | 1,218 |
| CMBS | 2,789 | 392 | 973 | 500 | 296 | — | 4,950 |
| CDOs | 444 | 567 | 296 | 203 | 1,863 | 85 | 3,458 |
| CLOs | 2,490 | 1,786 | 343 | 527 | 332 | 596 | 6,074 |
| Other ABS | 3,144 | 1,297 | 885 | 1,718 | 265 | 698 | 8,007 |
| | 51,235 | 6,335 | 3,244 | 3,385 | 4,923 | 1,703 | 70,825 |
| | | | | | | | |
| 2009 | | | | | | | |
| RMBS: G10 government | 33,779 | 125 | — | — | — | — | 33,904 |
| RMBS: covered bond | 8,645 | 360 | 67 | — | — | — | 9,072 |
| RMBS: prime | 9,211 | 676 | 507 | 547 | 558 | 1 | 11,500 |
| RMBS: non-conforming | 1,981 | 197 | 109 | 160 | 594 | 2 | 3,043 |
| RMBS: sub-prime | 578 | 121 | 306 | 87 | 579 | 153 | 1,824 |
| CMBS | 3,441 | 599 | 1,022 | 298 | 147 | 2 | 5,509 |
| CDOs | 615 | 944 | 254 | 944 | 849 | 262 | 3,868 |
| CLOs | 2,718 | 4,365 | 607 | 260 | 636 | 730 | 9,316 |
| Other ABS | 4,099 | 1,555 | 1,014 | 1,947 | 152 | 799 | 9,566 |
| | 65,067 | 8,942 | 3,886 | 4,243 | 3,515 | 1,949 | 87,602 |
| | | | | | | | |
| 2008 | | | | | | | |
| RMBS: G10 government | 41,168 | | | — | — | 9 | 41,177 |
| RMBS: covered bond | 10,380 | | | — | — | — | 10,380 |
| RMBS: prime | 15,252 | | | 1,417 | 106 | 2 | 16,777 |
| RMBS: non-conforming | 3,532 | | | 337 | 146 | 2 | 4,017 |
| RMBS: sub-prime | 1,362 | | | 936 | 790 | 1 | 3,089 |
| CMBS | 3,702 | | | 1,586 | 38 | 1 | 5,327 |
| CDOs | 4,510 | | | 2,041 | 2,088 | 381 | 9,020 |
| CLOs | 7,299 | | | 1,601 | 268 | 449 | 9,617 |
| Other ABS | 6,649 | | | 3,519 | 242 | 1,329 | 11,739 |
| | 93,854 | — | — | 11,437 | 3,678 | 2,174 | 111,143 |
Key points
| · | Carrying values of asset-backed securities decreased by £16.8 billion during 2010 with net reductions across all portfolios. |
| · | Within G10 government RMBS, net sell-downs by the US Mortgage Trading business in GBM in the first quarter of 2010, as part of the Group’s repositioning in light of the US government’s purchase of US assets was off-set by purchases in the second half of the year, with the latter reflecting the perceived investor appetite. The decrease in the US AFS portfolio reflected balance sheet restructuring in US Retail & Commercial during the third quarter of 2010. |
| £33.5A £5.8 billion reduction was seen in prime RMBS primarily in GBM and Group Treasury, across European (£4.7 billion) and US (£1.1 billion) portfolios reflecting respectively balance sheet management and repositioning in light of increased liquidity in the US agency securitiesRMBS market. |
| · | £7.6CDO and CLO portfolios declined by £3.7 billion of Dutch government guaranteed RMBSreflecting asset reductions in Non-Core; however, some CDO exposures were downgraded during the year resulting in increased non-investment grade positions. |
Business reviewcontinued | Business review |
| Risk and balance sheet management |
Risk management: Other risk exposurescontinued
Non-investment grade and unrated ABS
The table below summarises the carrying values by accounting classification of non-investment grade or not publicly rated ABS.
| | Non-investment grade | | Unrated |
| | HFT | AFS | LAR | Total | | HFT | AFS | LAR | Total |
| 2010 | £m | £m | £m | £m | | £m | £m | £m | £m |
| RMBS: prime | 354 | 535 | 11 | 900 | | 196 | — | — | 196 |
| RMBS: non-conforming | 389 | 414 | 6 | 809 | | 52 | — | — | 52 |
| RMBS: sub-prime | 437 | 21 | — | 458 | | 76 | — | — | 76 |
| CMBS | 198 | 17 | 81 | 296 | | — | — | — | — |
| CDOs | 691 | 1,151 | 21 | 1,863 | | 85 | — | — | 85 |
| CLOs | 239 | 5 | 88 | 332 | | 267 | 329 | — | 596 |
| Other ABS | 148 | 17 | 100 | 265 | | 191 | 162 | 345 | 698 |
| | 2,456 | 2,160 | 307 | 4,923 | | 867 | 491 | 345 | 1,703 |
| | | | | | | | | | |
| 2009 | | | | | | | | | |
| RMBS: prime | 120 | 430 | 8 | 558 | | — | 1 | — | 1 |
| RMBS: non-conforming | 253 | 341 | — | 594 | | — | 2 | — | 2 |
| RMBS: sub-prime | 339 | 240 | — | 579 | | 153 | — | — | 153 |
| CMBS | 89 | 3 | 55 | 147 | | 1 | — | 1 | 2 |
| CDOs | 487 | 300 | 62 | 849 | | 143 | 119 | — | 262 |
| CLOs | 269 | 359 | 8 | 636 | | 207 | 523 | — | 730 |
| Other ABS | 78 | 63 | 11 | 152 | | 270 | 134 | 395 | 799 |
| | 1,635 | 1,736 | 144 | 3,515 | | 774 | 779 | 396 | 1,949 |
| | | | | | | | | | |
| 2008 | | | | | | | | | |
| RMBS: G10 government | — | — | — | — | | 9 | — | — | 9 |
| RMBS: prime | 59 | 47 | — | 106 | | 2 | — | — | 2 |
| RMBS: non-conforming | 69 | 74 | 3 | 146 | | 1 | 1 | — | 2 |
| RMBS: sub-prime | 636 | 124 | 30 | 790 | | 1 | — | — | 1 |
| CMBS | 38 | — | — | 38 | | — | — | 1 | 1 |
| CDOs | 1,219 | 869 | — | 2,088 | | 173 | 142 | 66 | 381 |
| CLOs | 80 | 188 | — | 268 | | 165 | 279 | 5 | 449 |
| Other ABS | 122 | 49 | 71 | 242 | | 115 | 404 | 810 | 1,329 |
| | 2,223 | 1,351 | 104 | 3,678 | | 466 | 826 | 882 | 2,174 |
Key point
| · | £10.0Non-investment grade securities increased by £1.4 billion of European mortgage covered bonds issuedwhich £1.0 billion was in CDOs reflecting purchases by financial institutionsGBM’s Mortgage Trading business as well as credit down grades and rating withdrawals of certain ABS structures in Non-Core during the year. |
Business review continued
The tables below analyse carrying values of these debt securities by measurement classification and rating and fair value hierarchy level.
| | | RMBS | | | | | | | | | | | | |
| | | | | | Non | | | | | | | | | | | | | | | | |
| | | Sub-prime | | | conforming | | | Guaranteed | | | Other | | | CMBS | | | CDOs/CLOs | | | Other ABS | | | Total | |
| 2008 | | | £m | | | | £m | | | | £m | | | | £m | | | | £m | | | | £m | | | | £m | | | | £m | |
| AAA rated (1) | | | | | | | | | | | | | | | | | | | | | | | | | | | | | | | | |
| Held-for-trading | | | 393 | | | | 203 | | | | 18,622 | | | | 6,226 | | | | 2,306 | | | | 4,698 | | | | 380 | | | | 32,828 | |
| Available-for-sale | | | 522 | | | | 1,914 | | | | 22,546 | | | | 18,764 | | | | 982 | | | | 6,459 | | | | 4,826 | | | | 56,013 | |
| Loans and receivables | | | 431 | | | | 1,415 | | | | — | | | | 476 | | | | 405 | | | | 652 | | | | 1,443 | | | | 4,822 | |
| Designated at fair value | | | 16 | | | | — | | | | — | | | | 166 | | | | 9 | | | | — | | | | — | | | | 191 | |
| | | | 1,362 | | | | 3,532 | | | | 41,168 | | | | 25,632 | | | | 3,702 | | | | 11,809 | | | | 6,649 | | | | 93,854 | |
| BBB- and above rated (1) | | | | | | | | | | | | | | | | | | | | | | | | |
| Held-for-trading | | | 564 | | | | 79 | | | | — | | | | 985 | | | | 407 | | | | 1,439 | | | | 890 | | | | 4,364 | |
| Available-for-sale | | | 267 | | | | 194 | | | | — | | | | 338 | | | | 144 | | | | 1,642 | | | | 1,292 | | | | 3,877 | |
| Loans and receivables | | | 105 | | | | 64 | | | | — | | | | 94 | | | | 1,031 | | | | 561 | | | | 1,296 | | | | 3,151 | |
| Designated at fair value | | | — | | | | — | | | | — | | | | — | | | | 4 | | | | — | | | | 41 | | | | 45 | |
| | | | 936 | | | | 337 | | | | — | | | | 1,417 | | | | 1,586 | | | | 3,642 | | | | 3,519 | | | | 11,437 | |
| Non-investment grade (1) | | | | | | | | | | | | | | | | | | | | | | | | |
| Held-for-trading | | | 636 | | | | 69 | | | | — | | | | 59 | | | | 38 | | | | 1,299 | | | | 120 | | | | 2,221 | |
| Available-for-sale | | | 124 | | | | 74 | | | | — | | | | 47 | | | | — | | | | 1,057 | | | | 50 | | | | 1,352 | |
| Loans and receivables | | | 30 | | | | 3 | | | | — | | | | — | | | | — | | | | — | | | | 72 | | | | 105 | |
| | | | 790 | | | | 146 | | | | — | | | | 106 | | | | 38 | | | | 2,356 | | | | 242 | | | | 3,678 | |
| Not publicly rated (1) | | | | | | | | | | | | | | | | | | | | | | | | |
| Held-for-trading | | | 1 | | | | 1 | | | | 9 | | | | 2 | | | | — | | | | 338 | | | | 115 | | | | 466 | |
| Available-for-sale | | | — | | | | 1 | | | | — | | | | — | | | | — | | | | 421 | | | | 404 | | | | 826 | |
| Loans and receivables | | | — | | | | — | | | | — | | | | — | | | | 1 | | | | 71 | | | | 810 | | | | 882 | |
| | | | 1 | | | | 2 | | | | 9 | | | | 2 | | | | 1 | | | | 830 | | | | 1,329 | | | | 2,174 | |
| Total | | | | | | | | | | | | | | | | | | | | | | | | |
| Held-for-trading | | | 1,594 | | | | 352 | | | | 18,631 | | | | 7,272 | | | | 2,751 | | | | 7,774 | | | | 1,505 | | | | 39,879 | |
| Available-for-sale | | | 913 | | | | 2,183 | | | | 22,546 | | | | 19,149 | | | | 1,126 | | | | 9,579 | | | | 6,572 | | | | 62,068 | |
| Loans and receivables | | | 566 | | | | 1,482 | | | | — | | | | 570 | | | | 1,437 | | | | 1,284 | | | | 3,621 | | | | 8,960 | |
| Designated at fair value | | | 16 | | | | — | | | | — | | | | 166 | | | | 13 | | | | — | | | | 41 | | | | 236 | |
| Total | | | 3,089 | | | | 4,017 | | | | 41,177 | | | | 27,157 | | | | 5,327 | | | | 18,637 | | | | 11,739 | | | | 111,143 | |
| Of which carried at fair value: | | | | | | | | | | | | | | | | | | | | | | | | |
| Level 2 (2) | | | 2,459 | | | | 2,485 | | | | 40,942 | | | | 26,442 | | | | 3,316 | | | | 14,643 | | | | 6,677 | | | | 96,964 | |
| Level 3 (3) | | | 64 | | | | 50 | | | | 235 | | | | 145 | | | | 574 | | | | 2,710 | | | | 1,441 | | | | 5,219 | |
| | | | 2,523 | | | | 2,535 | | | | 41,177 | | | | 26,587 | | | | 3,890 | | | | 17,353 | | | | 8,118 | | | | 102,183 | |
(1) | Credit ratings are based on those from S&P, Fitch or Moody’s and have been mapped on to S&P scale. |
(2) | Valued using techniques based significantly on observable market data. Instruments in this level are valued using: |
| (a) | quoted prices for similar instruments in markets which are not considered to be active; or |
| (b) | valuation techniques where all the inputs that have a significant effect on the valuation are directly or indirectly based on observable market data. |
(3) | Instruments in this category have been valued using a valuation technique where at least one input which could have a significant effect on the instrument’s valuation is not based on observable market data. |
Business review continued
| | | | | | | | | | | | | | | | |
| | | | | | | | | | | | | | | | | | | | | | |
| 2007(1) | | Sub-prime £m | | | Non conforming £m | | | Guaranteed £m | | | Other £m | | | CMBS £m | | | CDOs/CLOs £m | | | Other ABS £m | | | Total £m | |
Carrying value: credit rating and classification AAA rated (2) | | | | | | | | | | | | | | | | | | | | | | | | |
| Held-for-trading | | | 1,790 | | | | 2,093 | | | | 15,502 | | | | 12,952 | | | | 3,285 | | | | 12,067 | | | | 3,495 | | | | 51,184 | |
| Available-for-sale | | | 139 | | | | 865 | | | | 16,545 | | | | 10,313 | | | | 964 | | | | 2,152 | | | | 5,073 | | | | 36,051 | |
| Designated at fair value | | | — | | | | — | | | | — | | | | 72 | | | | 37 | | | | 7 | | | | — | | | | 116 | |
| | | | 1,929 | | | | 2,958 | | | | 32,047 | | | | 23,337 | | | | 4,286 | | | | 14,226 | | | | 8,568 | | | | 87,351 | |
| BBB- and above rated (2) | | | | | | | | | | | | | | | | | | | | | | | | |
| Held-for-trading | | | 2,476 | | | | 530 | | | | — | | | | 557 | | | | 574 | | | | 1,509 | | | | 1,077 | | | | 6,723 | |
| Available-for-sale | | | — | | | | — | | | | — | | | | 18 | | | | 12 | | | | 1 | | | | 208 | | | | 239 | |
| Loans and receivables | | | — | | | | — | | | | — | | | | — | | | | 626 | | | | — | | | | — | | | | 626 | |
| Designated at fair value | | | 2 | | | | — | | | | — | | | | — | | | | — | | | | 17 | | | | — | | | | 19 | |
| | | | 2,478 | | | | 530 | | | | — | | | | 575 | | | | 1,212 | | | | 1,527 | | | | 1,285 | | | | 7,607 | |
| Non-investment grade (2) | | | | | | | | | | | | | | | | | | | | | | | | |
| Held-for-trading | | | 616 | | | | 146 | | | | — | | | | 27 | | | | 35 | | | | 1,082 | | | | 91 | | | | 1,997 | |
| Available-for-sale | | | — | | | | — | | | | — | | | | — | | | | — | | | | — | | | | 14 | | | | 14 | |
| Loans and receivables | | | 5 | | | | — | | | | — | | | | — | | | | — | | | | — | | | | 72 | | | | 77 | |
| Designated at fair value | | | 16 | | | | — | | | | — | | | | — | | | | — | | | | — | | | | — | | | | 16 | |
| | | | 637 | | | | 146 | | | | — | | | | 27 | | | | 35 | | | | 1,082 | | | | 177 | | | | 2,104 | |
| Not publicly rated | | | | | | | | | | | | | | | | | | | | | | | | |
| Held-for-trading | | | 191 | | | | 144 | | | | 125 | | | | 131 | | | | 22 | | | | 819 | | | | 1,095 | | | | 2,527 | |
| Available-for-sale | | | — | | | | — | | | | — | | | | — | | | | — | | | | 20 | | | | 284 | | | | 304 | |
| Designated at fair value | | | — | | | | — | | | | — | | | | — | | | | — | | | | 2 | | | | 186 | | | | 188 | |
| | | | 191 | | | | 144 | | | | 125 | | | | 131 | | | | 22 | | | | 841 | | | | 1,565 | | | | 3,019 | |
| Total | | | | | | | | | | | | | | | | | | | | | | | | |
| Held-for-trading | | | 5,073 | | | | 2,913 | | | | 15,627 | | | | 13,667 | | | | 3,916 | | | | 15,477 | | | | 5,758 | | | | 62,431 | |
| Available-for-sale | | | 139 | | | | 865 | | | | 16,545 | | | | 10,331 | | | | 976 | | | | 2,173 | | | | 5,579 | | | | 36,608 | |
| Loans and receivables | | | 5 | | | | — | | | | — | | | | — | | | | 626 | | | | — | | | | 72 | | | | 703 | |
| Designated at fair value | | | 18 | | | | — | | | | — | | | | 72 | | | | 37 | | | | 26 | | | | 186 | | | | 339 | |
| Total | | | 5,235 | | | | 3,778 | | | | 32,172 | | | | 24,070 | | | | 5,555 | | | | 17,676 | | | | 11,595 | | | | 100,081 | |
| Of which: | | | | | | | | | | | | | | | | | | | | | | | | |
| | | | | | | | | | | | | | | | | | | | | | | | | |
| Level 2 (3) | | | 5,171 | | | | 3,598 | | | | 32,172 | | | | 24,070 | | | | 4,929 | | | | 15,926 | | | | 11,393 | | | | 97,259 | |
| Level 3 (4) | | | 59 | | | | 180 | | | | — | | | | — | | | | — | | | | 1,750 | | | | 130 | | | | 2,119 | |
| | | | 5,230 | | | | 3,778 | | | | 32,172 | | | | 24,070 | | | | 4,929 | | | | 17,676 | | | | 11,523 | | | | 99,378 | |
Notes:
(1)Business reviewcontinued | Carrying values at 31 December 2007 above include ABN AMRO’s liquidity portfolio of £18.6 billion of ABS which were part of shared assets then; this portfolio was transferred to RBS Group Treasury in the first half of 2008.Business review |
(2) | Credit ratings are based on those from rating agencies Standard & Poor’s (S&P), Moody’s and Fitch and have been mapped onto S&P scale. |
(3) | Valuation is based significantly on observable market data. Instruments in this category are valued using: |
| | – | quoted prices for similar instruments or identical instruments in markets which are not considered to be active; orRisk and balance sheet management |
| – | valuation techniques where all the inputs that have a significant effect on the valuation are directly or indirectly based on observable market data. |
(4) | Instruments in this category have been valued using a valuation technique where at least one input which could have a significant effect on the instrument’s valuation is not based on observable market data. |
Business review continued
Residential mortgage-backed securities (audited)
Residential mortgage backed securities (RMBS)RMBS are securities that represent an interest in a portfolio of residential mortgages. Repayments made on the underlying mortgages are used to make payments to holders of the RMBS. The risk of the RMBS will vary primarily depending on the quality and geographic region of the underlying mortgage assets and the credit enhancement of the securitisation structure.
Several tranches of notes are issued, each secured against the same portfolio of mortgages, but providing differing levels of seniority to match the risk appetite of investors. The most junior (or equity) notes will suffer early capital and interest losses experienced by the referenced mortgage collateral, with each more senior note benefiting from the protection provided by the subordinated notes below. Additional credit enhancements may be provided to the holder of senior RMBS notes, including guarantees over the value of the exposures, often provided by monoline insurers.
The main categories of mortgages that serve as collateral to RMBS held by the Group with related vintages are set out below and described below. As can be seen fromin the table below, the Group’s RMBS portfolio covers a range of geographic locations and different categories are usedGlossary on pages 390 to classify the exposures depending on the geographical region of the underlying mortgage. These categories are described below.395. The US market has more established definitions of differing underlying mortgage quality and these are used as the basis for the Group’sGroup's RMBS categorisation.
Sub-prime mortgages:The Group classifies RMBS as sub-prime or Alt-A based on industry standard criteria, including Fair Isaac Corporation scores (FICO), level of documentation and loan-to-value (LTV) ratios of the underlying mortgage loans. RMBS are loans toclassified as sub-prime borrowers typically having weakened credit histories that include payment delinquencies, and potentially more severe problems such as court judgements and bankruptcies. They may also display reduced repayment capacity as measured by credit scores, high debt-to-income ratios, or other criteria indicating heightened risk of default.
Non-conforming mortgages (or ‘Alt-A’ used for US exposure) have a higher credit quality than sub-prime mortgages, but lower than those prime borrowers. Withinif the US mortgage industry, non-conforming mortgages are those that do not meet the lending criteria for US agency mortgages (described below). For non-US mortgages, judgement is applied in identifyingportfolio comprises loans with similar characteristicsFICO scores between 500 and 650 with full or limited documentation. Mortgages in Alt-A RMBS portfolios have FICO scores of 640 to US non-conforming loans720, limited documentation and also include self-certified loans. Alt-A describes a categoryan original LTV of mortgages in which lenders consider70% to 95%. The FICO score is the risk to be greater than prime mortgages though less than sub-prime. The offered interest rate is usually representative of the associated risk level.
Guaranteed mortgages are mortgages that form part of a mortgage backed security issuance by a government agency, ordetermining factor in the US an entity that benefits from a guarantee (direct or indirect) provided by the US government. For US RMBS, this category includes, amongst others, RMBS issued by Ginnie Mae, Freddie Mac and Fannie Mae. For European RMBS, this includes mortgages guaranteed by the Dutch Government.
Other prime mortgages are thoseclassification of a higher credit quality than non-conforming and sub-prime mortgages, and exclude guaranteed mortgages.
Covered mortgage bonds are debt instruments that have recourse to a pool of mortgage assets, where investors have a preferred claim if a default occurs. These underlying assets are segregated from the other assets held by the issuing entity. These underlying assets are segregated from other assets held by the issuing entity.
The tables below show the Group’s RMBS net exposures and carrying values by measurement classification, underlying asset type,as sub-prime or Alt-A.
The table below analyses the main geographical locationsvintage of the property that the mortgage is secured against,Group's carrying value of RMBS portfolios by geography and the year in which the underlying mortgage was originated.
| | | | | | | |
| | | | | | | | | | | | | | | | | | | | | | | | | |
| | | Sub-prime | | | Non conforming | | | Guaranteed (2) | | | Other(3) | | | Total | | | Sub-prime | | | Non conforming | | | Guaranteed (2) | | | Other(3) | | | Total | |
| | | | £m | | | | £m | | | | £m | | | | £m | | | | £m | | | | £m | | | | £m | | | | £m | | | | £m | | | | £m | |
| Net exposure: (1) | | | | | | | | | | | | | | | | | | | | | | | | | | | | | | | | | | | | | | | | |
| Held-for-trading | | | 345 | | | | 346 | | | | 18,631 | | | | 5,140 | | | | 24,462 | | | | 3,497 | | | | 2,913 | | | | 15,627 | | | | 13,068 | | | | 35,105 | |
| Available-for-sale | | | 572 | | | | 2,184 | | | | 22,546 | | | | 19,148 | | | | 44,450 | | | | 139 | | | | 865 | | | | 16,539 | | | | 10,332 | | | | 27,875 | |
| Loans and receivables | | | 527 | | | | 1,482 | | | | — | | | | 569 | | | | 2,578 | | | | 5 | | | | — | | | | — | | | | — | | | | 5 | |
| Designated at fair value | | | 16 | | | | — | | | | — | | | | 166 | | | | 182 | | | | 18 | | | | — | | | | — | | | | 72 | | | | 90 | |
| | | | 1,460 | | | | 4,012 | | | | 41,177 | | | | 25,023 | | | | 71,672 | | | | 3,659 | | | | 3,778 | | | | 32,166 | | | | 23,472 | | | | 63,075 | |
| Carrying values: (2) | | | | | | | | | | | | | | | | | | | | | | | | | | | | | | |
| Held-for-trading | | | 1,594 | | | | 352 | | | | 18,631 | | | | 7,272 | | | | 27,849 | | | | 5,073 | | | | 2,913 | | | | 15,627 | | | | 13,667 | | | | 37,280 | |
| Available-for-sale | | | 913 | | | | 2,183 | | | | 22,546 | | | | 19,149 | | | | 44,791 | | | | 139 | | | | 865 | | | | 16,545 | | | | 10,331 | | | | 27,880 | |
| Loans and receivables | | | 566 | | | | 1,482 | | | | — | | | | 570 | | | | 2,618 | | | | 5 | | | | — | | | | — | | | | — | | | | 5 | |
| Designated at fair value | | | 16 | | | | — | | | | — | | | | 166 | | | | 182 | | | | 18 | | | | — | | | | — | | | | 72 | | | | 90 | |
| | | | 3,089 | | | | 4,017 | | | | 41,177 | | | | 27,157 | | | | 75,440 | | | | 5,235 | | | | 3,778 | | | | 32,172 | | | | 24,070 | | | | 65,255 | |
(1) | Net exposures reflect the effect of hedge protection purchased from monolines and other counterparties but excludes the effect of counterparty credit valuation adjustment. Carrying value is the amount recorded on the balance sheet. |
(2) | Prime guaranteed exposures and carrying values include: |
| · | £7.6 billion (2007 – £6.0 billion) available-for-sale exposures guaranteed by the Dutch government |
| · | £5.7 billion (2007 – £5.0 billion) guaranteed by US government via Ginnie Mae of which £0.5 billion (2007 – £0.3 billion) are held-for-trading |
| · | £27.8 billion (2007 – £21.0 million) effectively guaranteed by the US government via its support for Freddie Mac and Fannie Mae of which £18.1 billon (2007 – £15.2 billion) are held-for-trading |
(3) | Other prime mortgage exposures include £10.0 billion (2007 – £7.8 billion) covered European mortgage bonds. |
| | By geography | | By classification |
| | US | UK | Other Europe | RoW | Total | G10 government | Covered bond | Prime | Non- conforming | Sub-prime |
| 2010 | £m | £m | £m | £m | £m | £m | £m | £m | £m | £m |
| 2004 and earlier | 4,405 | 175 | 1,057 | 50 | 5,687 | 4,148 | 641 | 678 | 90 | 130 |
| 2005 | 2,579 | 176 | 3,435 | 28 | 6,218 | 2,379 | 2,410 | 634 | 567 | 228 |
| 2006 | 1,082 | 2,249 | 5,460 | 121 | 8,912 | 2,106 | 3,451 | 2,129 | 736 | 490 |
| 2007 | 2,576 | 2,370 | 4,135 | 33 | 9,114 | 4,774 | 1,352 | 1,280 | 1,477 | 231 |
| 2008 | 2,314 | 58 | 420 | 155 | 2,947 | 2,598 | 18 | 223 | 104 | 4 |
| 2009 and later | 14,922 | 410 | 116 | 10 | 15,458 | 14,359 | – | 803 | 161 | 135 |
| | 27,878 | 5,438 | 14,623 | 397 | 48,336 | 30,364 | 7,872 | 5,747 | 3,135 | 1,218 |
| | | | | | | | | | | |
| 2009 | | | | | | | | | | |
| 2004 and earlier | 8,504 | 293 | 1,760 | 33 | 10,590 | 7,951 | 752 | 1,460 | 99 | 328 |
| 2005 | 4,221 | 783 | 4,252 | 74 | 9,330 | 3,801 | 2,582 | 2,173 | 510 | 264 |
| 2006 | 1,847 | 3,116 | 7,449 | 216 | 12,628 | 2,691 | 4,135 | 4,514 | 690 | 598 |
| 2007 | 1,844 | 2,957 | 5,916 | 60 | 10,777 | 4,394 | 1,585 | 2,842 | 1,529 | 427 |
| 2008 and later | 15,249 | 10 | 510 | 249 | 16,018 | 15,067 | 18 | 511 | 215 | 207 |
| | 31,665 | 7,159 | 19,887 | 632 | 59,343 | 33,904 | 9,072 | 11,500 | 3,043 | 1,824 |
| | | | | | | | | | | |
| 2008 | | | | | | | | | | |
| 2004 and earlier | 6,839 | 887 | 2,122 | 102 | 9,950 | 5,959 | 702 | 2,507 | 122 | 660 |
| 2005 | 9,666 | 1,694 | 5,265 | 65 | 16,690 | 7,179 | 2,993 | 4,794 | 1,371 | 353 |
| 2006 | 3,136 | 3,273 | 9,139 | 234 | 15,782 | 3,803 | 4,471 | 5,376 | 872 | 1,260 |
| 2007 and later | 22,425 | 2,572 | 7,749 | 272 | 33,018 | 24,236 | 2,214 | 4,100 | 1,652 | 816 |
| | 42,066 | 8,426 | 24,275 | 673 | 75,440 | 41,177 | 10,380 | 16,777 | 4,017 | 3,089 |
Business review continued
| | | | | | | |
| | | | | | | | | | | | | | | | | | | | | | | | | |
| United States | | Sub-prime £m | | | Alt-A £m | | | Guaranteed £m | | | Other £m | | | Total £m | | | Sub-prime £m | | | Alt-A £m | | | Guaranteed £m | | | Other £m | | | Total £m | |
| Net exposure | | | | | | | | | | | | | | | | | | | | | | | | | | | | | | |
| Held-for-trading | | | 302 | | | | 346 | | | | 18,577 | | | | 968 | | | | 20,193 | | | | 2,953 | | | | 2,189 | | | | 15,502 | | | | 1,419 | | | | 22,063 | |
| Available-for-sale | | | 53 | | | | 760 | | | | 14,887 | | | | 4,409 | | | | 20,109 | | | | — | | | | 640 | | | | 10,504 | | | | 1,359 | | | | 12,503 | |
| Loans and receivables | | | 3 | | | | — | | | | — | | | | 215 | | | | 218 | | | | — | | | | — | | | | — | | | | — | | | | — | |
| | | | 358 | | | | 1,106 | | | | 33,464 | | | | 5,592 | | | | 40,520 | | | | 2,953 | | | | 2,829 | | | | 26,006 | | | | 2,778 | | | | 34,566 | |
| Carrying values | | | | | | | | | | | | | | | | | | | | | | | | | | | | | | |
| Held-for-trading | | | 1,427 | | | | 352 | | | | 18,577 | | | | 1,043 | | | | 21,399 | | | | 4,277 | | | | 2,189 | | | | 15,502 | | | | 1,419 | | | | 23,387 | |
| Available-for-sale | | | 394 | | | | 760 | | | | 14,887 | | | | 4,409 | | | | 20,450 | | | | — | | | | 640 | | | | 10,504 | | | | 1,359 | | | | 12,503 | |
| Loans and receivables | | | 3 | | | | — | | | | — | | | | 215 | | | | 218 | | | | — | | | | — | | | | — | | | | — | | | | — | |
| | | | 1,824 | | | | 1,112 | | | | 33,464 | | | | 5,667 | | | | 42,067 | | | | 4,277 | | | | 2,829 | | | | 26,006 | | | | 2,778 | | | | 35,890 | |
| Of which originated in: | | | | | | | | | | | | | | | | | | | | | | | | | | | | | | |
| – 2004 and earlier | | | 474 | | | | 122 | | | | 5,534 | | | | 709 | | | | 6,839 | | | | 746 | | | | 165 | | | | 2,532 | | | | 406 | | | | 3,849 | |
| – 2005 | | | 259 | | | | 718 | | | | 6,014 | | | | 2,675 | | | | 9,666 | | | | 1,065 | | | | 437 | | | | 3,209 | | | | 275 | | | | 4,986 | |
| – 2006 | | | 718 | | | | 115 | | | | 1,689 | | | | 614 | | | | 3,136 | | | | 1,734 | | | | 1,188 | | | | 5,557 | | | | 1,017 | | | | 9,496 | |
| – 2007 and later | | | 373 | | | | 157 | | | | 20,227 | | | | 1,669 | | | | 22,426 | | | | 732 | | | | 1,039 | | | | 14,708 | | | | 1,080 | | | | 17,559 | |
| | | | 1,824 | | | | 1,112 | | | | 33,464 | | | | 5,667 | | | | 42,067 | | | | 4,277 | | | | 2,829 | | | | 26,006 | | | | 2,778 | | | | 35,890 | |
| | | | | | | |
| United Kingdom | | Sub-prime £m | | | Non conforming £m | | | Prime £m | | | Total £m | | | Sub-prime £m | | | Non
conforming £m | | | Prime £m | | | Total £m | |
| Net exposure | | | | | | | | | | | | | | | | | | | | | | | | |
| Held-for-trading | | | 33 | | | | — | | | | 258 | | | | 291 | | | | 150 | | | | 724 | | | | 2,411 | | | | 3,285 | |
| Available-for-sale | | | 154 | | | | 1,423 | | | | 3,446 | | | | 5,023 | | | | 7 | | | | 157 | | | | 931 | | | | 1,095 | |
| Loans and receivables | | | 205 | | | | 1,482 | | | | 118 | | | | 1,805 | | | | 5 | | | | — | | | | — | | | | 5 | |
| Designated at fair value | | | 16 | | | | — | | | | 166 | | | | 182 | | | | 18 | | | | — | | | | 72 | | | | 90 | |
| | | | 408 | | | | 2,905 | | | | 3,988 | | | | 7,301 | | | | 180 | | | | 881 | | | | 3,414 | | | | 4,475 | |
| Carrying values: | | | | | | | | | | | | | | | | | | | | | | | | |
| Held-for-trading | | | 70 | | | | — | | | | 1,345 | | | | 1,415 | | | | 150 | | | | 724 | | | | 2,740 | | | | 3,614 | |
| Available-for-sale | | | 154 | | | | 1,423 | | | | 3,446 | | | | 5,023 | | | | 7 | | | | 157 | | | | 935 | | | | 1,099 | |
| Loans and receivables | | | 205 | | | | 1,482 | | | | 118 | | | | 1,805 | | | | 5 | | | | — | | | | — | | | | 5 | |
| Designated at fair value | | | 16 | | | | — | | | | 166 | | | | 182 | | | | 18 | | | | — | | | | 72 | | | | 90 | |
| | | | 445 | | | | 2,905 | | | | 5,075 | | | | 8,425 | | | | 180 | | | | 881 | | | | 3,747 | | | | 4,808 | |
| Of which originated in: | | | | | | | | | | | | | | | | | | | | | | | | |
| – 2004 and earlier | | | 72 | | | | — | | | | 815 | | | | 887 | | | | 13 | | | | 22 | | | | 911 | | | | 946 | |
| – 2005 | | | 42 | | | | 652 | | | | 1,000 | | | | 1,694 | | | | 1 | | | | 10 | | | | 512 | | | | 523 | |
| – 2006 | | | 209 | | | | 756 | | | | 2,308 | | | | 3,273 | | | | 49 | | | | 110 | | | | 1,256 | | | | 1,415 | |
| – 2007 and later | | | 122 | | | | 1,497 | | | | 952 | | | | 2,571 | | | | 117 | | | | 739 | | | | 1,068 | | | | 1,924 | |
| | | | 445 | | | | 2,905 | | | | 5,075 | | | | 8,425 | | | | 180 | | | | 881 | | | | 3,747 | | | | 4,808 | |
Business review continued
| | | | | | | |
| | | | | | | | | | | | | | | | | | | | | | | | | |
| Europe | | Sub-prime £m | | | Guaranteed £m | | | Covered £m | | | Other £m | | | Total £ml | | | Sub-prime £m | | | Guaranteed £m | | | Covered £m | | | Other £m | | | Total £m | |
| Net exposure | | | | | | | | | | | | | | | | | | | | | | | | | | | | | | |
| Held-for-trading | | | 10 | | | | — | | | | — | | | | 3,898 | | | | 3,908 | | | | 321 | | | | — | | | | — | | | | 9,157 | | | | 9,478 | |
| Available-for-sale | | | 57 | | | | 7,642 | | | | 10,040 | | | | 1,106 | | | | 18,845 | | | | — | | | | 6,012 | | | | 7,822 | | | | 57 | | | | 13,891 | |
| Loans and securities | | | 313 | | | | — | | | | — | | | | 208 | | | | 521 | | | | — | | | | — | | | | — | | | | — | | | | — | |
| | | | 380 | | | | 7,642 | | | | 10,040 | | | | 5,212 | | | | 23,274 | | | | 321 | | | | 6,012 | | | | 7,822 | | | | 9,214 | | | | 23,369 | |
| Carrying values | | | | | | | | | | | | | | | | | | | | | | | | | | | | | | |
| Held-for-trading | | | 30 | | | | — | | | | — | | | | 4,839 | | | | 4,869 | | | | 324 | | | | — | | | | — | | | | 9,429 | | | | 9,753 | |
| Available-for-sale | | | 57 | | | | 7,642 | | | | 10,040 | | | | 1,107 | | | | 18,846 | | | | — | | | | 6,012 | | | | 7,822 | | | | 57 | | | | 13,891 | |
| Loans and securities | | | 352 | | | | — | | | | — | | | | 208 | | | | 560 | | | | — | | | | — | | | | — | | | | — | | | | — | |
| | | | 439 | | | | 7,642 | | | | 10,040 | | | | 6,154 | | | | 24,275 | | | | 324 | | | | 6,012 | | | | 7,822 | | | | 9,486 | | | | 23,644 | |
| Of which originated in: | | | | | | | | | | | | | | | | | | | | | | | | | | | | | | |
| – 2004 and earlier | | | 48 | | | | 418 | | | | 702 | | | | 954 | | | | 2,122 | | | | 81 | | | | 367 | | | | 577 | | | | 1,395 | | | | 2,420 | |
| – 2005 | | | 17 | | | | 1,165 | | | | 2,993 | | | | 1,090 | | | | 5,265 | | | | 33 | | | | 1,117 | | | | 2,160 | | | | 1,946 | | | | 5,256 | |
| – 2006 | | | 148 | | | | 2,059 | | | | 4,466 | | | | 2,466 | | | | 9,139 | | | | 63 | | | | 1,780 | | | | 3,801 | | | | 3,897 | | | | 9,541 | |
| – 2007 and later | | | 226 | | | | 4,000 | | | | 1,879 | | | | 1,644 | | | | 7,749 | | | | 147 | | | | 2,748 | | | | 1,284 | | | | 2,248 | | | | 6,427 | |
| | | | 439 | | | | 7,642 | | | | 10,040 | | | | 6,154 | | | | 24,275 | | | | 324 | | | | 6,012 | | | | 7,822 | | | | 9,486 | | | | 23,644 | |
In other geographical regions not covered above, RMBS portfolios included:
·Business reviewcontinued | net RMBS exposures of £314 million (2007 – £205 million) comprising: held-for-trading nil (2007 – £73 million); available-for-sale £308 million (2007 – £132 million)Business review |
| Risk and loans and receivables £6 million (2007 – nil).balance sheet management |
· | RMBS carrying values of £381 million (2007 – £454 million) comprising: held-for-trading £67 million (2007 – £322 million); available-for-sale £308 million (2007 – £132) and loans and receivables £6 million (2007 – nil). |
· | RMBS non-conforming available-for-sale net exposures and carry values of nil (2007 – £68 million). |
Business review continued
The Group’s largest concentration of RMBS assets relate to a portfolio of US agency asset backed securities comprising mainly current year vintage positions of £33.5 billion at 31 December 2008 (2007: £26.0 billion). Due to the US government backing explicit or implicit in these securities, the counterparty creditRisk management: Other risk exposure is low. The losses arising from the movements in fair value recorded for these assets were comparatively lower than other RMBS. Financial markets and economic conditions have been extremely difficult in the US throughout 2008, particularly in the last quarter. Credit conditions have deteriorated and financial markets have experienced widespread illiquidity and elevated levels of volatility due to forced de-leveraging. Transaction activity in the securities portfolio has been reduced due to general market illiquidity. Residential mortgages have been affected by the stress that consumers experienced from depreciating house prices, rising unemployment and tighter credit conditions, resulting in higher levels of delinquencies and foreclosures. In particular, the deteriorating economy and financial markets have negatively impacted the valuation, liquidity, and credit quality of private-label securities.
Citizens maintains an available-for-sale investment securities portfolio to provide high-quality collateral to provide a liquidity buffer and to enhance earnings. The size of the portfolio has been relatively stable through 2008, but both the absolute and relative size (% of earning assets) declined in 2006-2007. The portfolio comprises high credit quality mortgage-backed securities, to ensure both pledgeability and liquidity. The U.S. Government guarantees on MBS, whether explicit or implicit, put most of the portfolio in a secure credit position. The non-agency MBS holdings derive credit support in two ways. Firstly, there is senior and subordinated structuring, and Citizens hold only the most senior tranches. Secondly, there is high quality supporting loan collateral. The collateral quality is evidenced (a) by the vintages, with 82% issued in 2005 and earlier, (b) by the borrower’s weighted loan to value (LTV) ratio of 65%, and (c) by the borrower’s weighted-average FICO score of 734.
£7.6 billion (2007 – £6.0 billion) of the RMBS exposure consists of available-for-sale portfolio of European RMBS in Group Treasury, referencing primarily Dutch and Spanish government-backed loans, and accordingly the quality of these assets has held up relative to other RMBS types. A further £10.0 billion (2007 – £7.8 billion) European RMBS comprised covered mortgage bonds.
The Group has other portfolios of RMBS from secondary trading activities, warehoused positions previously acquired with the intention of further securitisation and a portfolio of assets from the unwinding of a securities arbitrage conduit. This conduit was established to benefit from the margin between the assets purchased and the notes issued. The majority of these held-for-trading RMBS have been grouped together for management purposes.
Some of these assets (£7.0 billion) were reclassified from held-for-trading category to the loans and receivables (£1.8 billion) and available-for-sale categories during the year (£5.2 billion).
Overall, the Group has recognised significant fair value losses on RMBS assets during the year due to reduced market liquidity and deteriorating credit ratings of these assets. The Group has reduced its exposure to RMBS predominantly through fair value hedges and asset sales during the year. These decreases were partially offset by the weakening of sterling relative to the US dollar and euro.
Commercial mortgage-backed securities (audited)
Commercial mortgages backed securities (CMBS) are securities that are secured by mortgage loans on commercial land and buildings. The securities are structured in the same way as an RMBS but typically the underlying assets referenced will be of greater individual value. The performance of the securities are highly dependent upon the sector of commercial property referenced and the geographical region.
The Group accumulated CMBS for the purpose of securitisation and secondary trading. The largest holding of CMBS arose as a result of the Group’s purchase of senior tranches in mezzanine and high grade CMBS structures from third parties. These securities are predominantly hedged with monoline insurers. As a result, the Group’s risk is limited to the counterparty credit risk exposure to the hedge. The Group also holds CMBS arising from securitisations of European commercial mortgages originated by the Group.
The following table shows the composition of the Group’s holdings of CMBS portfolios.
| | | | | | | |
| | | US £m | | | UK £m | | | Europe £m | | | ROW(1) £m | | | Total £m | | | US £m | | | UK £m | | | Europe £m | | | ROW £m | | | Total £m | |
| Office | | | 435 | | | | 938 | | | | 402 | | | | — | | | | 1,775 | | | | 599 | | | | 534 | | | | — | | | | — | | | | 1,133 | |
| Mixed use | | | 32 | | | | 106 | | | | 1,048 | | | | 45 | | | | 1,231 | | | | — | | | | 73 | | | | 192 | | | | — | | | | 265 | |
| Healthcare | | | 805 | | | | 143 | | | | — | | | | — | | | | 948 | | | | 1,210 | | | | — | | | | — | | | | — | | | | 1,210 | |
| Retail | | | 295 | | | | 43 | | | | 17 | | | | 48 | | | | 403 | | | | 398 | | | | 13 | | | | — | | | | — | | | | 411 | |
| Industry | | | 24 | | | | 13 | | | | 81 | | | | — | | | | 118 | | | | 61 | | | | — | | | | — | | | | 100 | | | | 161 | |
| Multi-family | | | 40 | | | | — | | | | 49 | | | | — | | | | 89 | | | | 48 | | | | — | | | | — | | | | — | | | | 48 | |
| Leisure | | | — | | | | 76 | | | | — | | | | — | | | | 76 | | | | — | | | | — | | | | — | | | | — | | | | — | |
| Hotel | | | 40 | | | | 35 | | | | — | | | | — | | | | 75 | | | | 36 | | | | — | | | | — | | | | — | | | | 36 | |
| Other | | | 474 | | | | 41 | | | | 49 | | | | 48 | | | | 612 | | | | 932 | | | | 530 | | | | 765 | | | | 64 | | | | 2,291 | |
| | | | 2,145 | | | | 1,395 | | | | 1,646 | | | | 141 | | | | 5,327 | | | | 3,284 | | | | 1,150 | | | | 957 | | | | 164 | | | | 5,555 | |
Business review continued
Asset-backed collateralised debt and loan obligations (audited)
Collateralised debt obligations are securities whose performance is dependant on a portfolio of referenced underlying securitised assets. The referenced assets generally consist of ABS, but may also include other classes of assets. Collateralised loan obligations represent securities in special purpose entities, the assets of which are primarily cash flows from underlying leveraged loans.
The Group’s ABS CDO and CLO net exposures comprised:
| | | | 2008
£m | | | | 2007
£m | |
| Super senior CDOs | | | 1,375 | | | | 3,834 | |
| Other CDOs | | | 1,465 | | | | 1,569 | |
| CLOs | | | 3,443 | | | | 4,082 | |
| | | | 6,283 | | | | 9,485 | |
The Group’s CDO exposures comprise CDOs structured by the Group from 2003 to 2007 that were unable to be sold to third parties due to prevailing illiquid markets with net exposures of £1.4 billion (2007 – £3.8 billion), as well as other CDO net exposures of £1.5 billion (2007 – £1.6 billion) purchased from third parties some of which are fully hedged through CDSs with other banks or monoline insurers.
Business review continued
Super senior CDOs
Super senior CDOs represent the most senior positions in a CDO, having subordination instruments (usually represented by a combination of equity, mezzanine and senior notes) which absorb losses before the super senior note is affected. Losses will only be suffered by the super senior note holders after a certain threshold of defaults of the underlying reference assets has been reached. The threshold is usually referred to in percentage terms of defaults of the remaining pool, and known as the ‘attachment point’. These super senior instruments carry an AAA rating at point of origination, or are senior to other AAA rated notes in the same structure. The level of defaults occurring on recent vintage sub-prime mortgages and other asset classes has been higher than originally expected. This has meant that the subordinate positions have diminished significantly in value, credit quality and rating and, as a result, the super senior tranches of the CDOs have a higher probability of suffering losses than at origination. The ratings of the majority of the underlying collateral are now below investment grade.
Depending on the quality of the underlying reference assets at issuance, the super senior tranches will be either classified as high grade or mezzanine. The majority of the Group’s total exposure relates to high grade super senior tranches of ABS CDOs. This is based upon the original classification of the deals derived from the underlying reference asset rating quality. The table below summarises the carrying amounts and net exposures after hedge protection of the Group’s super senior CDOs as at 31 December 2008. The collateral rating is determined with reference to S&P ratings where available. Where S&P ratings are not available the lower of Moody’s and Fitch ratings have been used.
| | | | | | | |
| | | High grade | | | Mezzanine | | | Total | | | High grade | | | Mezzanine | | | Total | |
| | | | £m | | | | £m | | | | £m | | | | £m | | | | £m | | | | £m | |
| Gross exposure | | | 7,673 | | | | 3,720 | | | | 11,393 | | | | 6,420 | | | | 3,040 | | | | 9,460 | |
| Fair value adjustment | | | (3,423 | ) | | | (691 | ) | | | (4,114 | ) | | | (3,347 | ) | | | (1,250 | ) | | | (4,597 | ) |
| | | | 4,250 | | | | 3,029 | | | | 7,279 | | | | 3,073 | | | | 1,790 | | | | 4,863 | |
| Write-downs on net open position | | | (3,019 | ) | | | (2,885 | ) | | | (5,904 | ) | | | (492 | ) | | | (537 | ) | | | (1,029 | ) |
| Net exposure after hedges | | | 1,231 | | | | 144 | | | | 1,375 | | | | 2,581 | | | | 1,253 | | | | 3,834 | |
| | | % | | | % | | | % | | | % | | | % | | | % | |
| Average price | | | 29 | | | | 6 | | | | 21 | | | | 84 | | | | 70 | | | | 79 | |
| Underlying RMBS sub-prime assets (origination) | | | 69 | | | | 91 | | | | 79 | | | | 69 | | | | 91 | | | | 79 | |
| Of which originated in: | | | | | | | | | | | | | | | | | | |
| 2005 and earlier | | | 24 | | | | 23 | | | | 24 | | | | 24 | | | | 23 | | | | 24 | |
| 2006 | | | 28 | | | | 69 | | | | 46 | | | | 28 | | | | 69 | | | | 46 | |
| 2007 | | | 48 | | | | 8 | | | | 30 | | | | 48 | | | | 8 | | | | 30 | |
| Collateral by rating at reporting date: (2) | | | | | | | | | | | | | | | | | | |
| AAA | | | 14 | | | | — | | | | 9 | | | | 36 | | | | — | | | | 23 | |
| BBB- and above | | | 35 | | | | 5 | | | | 24 | | | | 62 | | | | 31 | | | | 51 | |
| Non-investment grade | | | 51 | | | | 95 | | | | 67 | | | | 2 | | | | 69 | | | | 26 | |
| | | | | | | | | | | | | | | | | | | | | | | | | |
| Attachment point (3) | | | 29 | | | | 46 | | | | 36 | | | | 29 | | | | 46 | | | | 35 | |
| Attachment point post write down | | | 77 | | | | 97 | | | | 88 | | | | 40 | | | | 62 | | | | 50 | |
Notes:
(1) | The above table includes data for two trades liquidated in the last quarter of 2008 to provide consistency with comparatives. |
(2) | Credit ratings are based on those from rating agencies Standard & Poor’s (S&P), Moody’s and Fitch and have been mapped onto S&P scale. |
(3) | Attachment point is the minimum level of losses in a portfolio which a tranche is exposed to, as a percentage of the total notional size of the portfolio. For example, a 5 – 10% tranche has an attachment point of 5% and a detachment point of 10%. When the accumulated loss of the reference pool is less than 5% of the total initial notional of the pool, the tranche will not be affected. However, when the loss has exceeded 5%, any further losses will be deducted from the tranche’s notional principal until detachment point, 10%, is reached. |
The change in net exposure during the year is analysed below.
| | | High grade £m | | | Mezzanine £m | | | Total £m | |
| Net exposure at 1 January 2008 | | | 2,581 | | | | 1,253 | | | | 3,834 | |
| Net income statement effect | | | (1,836 | ) | | | (1,140 | ) | | | (2,976 | ) |
| Foreign exchange and other movements | | | 486 | | | | 31 | | | | 517 | |
| Net exposure at 31 December 2008 | | | 1,231 | | | | 144 | | | | 1,375 | |
Business review continued
High grade super senior exposures
As shown in the table below, the majority of the Group’s high grade super senior exposures, represent securities retained in CDO structures originated by the Group.
| | Gross exposure
£m
| |
Group originated deals | | | 6,776 | |
Third party structures | | | 897 | |
| | | 7,673 | |
At origination, the reference assets of the high grade structures predominantly comprised investment grade tranches of sub-prime residential mortgage securitisations along with other senior tranches of some combination of ABS assets, including prime and Alt-A RMBS, CMBS, trust preferred ABS, student loan backed ABS and CDO assets. The underlying assets referenced by these super senior securities are primarily more recent vintages (the year the underlying loan was originated), with 48% being 2007. Generally, loans with more recent vintages carry greater discounts, reflecting the market perception of greater default levels than on earlier loan vintages.
The fair value of these assets has fallen significantly during the period, representing the decline in performance in the underlying reference assets and the lack of an active market for the securities. Some of the Group’s holdings (£3.4 billion) have been hedged with monoline counterparties (see page 114).
Mezzanine super senior CDOs
The tranches of CDOs have suffered a greater level of price decline than high grade tranches due to the relative credit quality of the underlying assets. As shown in the table below, the majority of the Group’s mezzanine super senior net exposures represent securities retained in CDO structures originated by the Group.
| | Gross exposure
£m
| |
Group originated deals | | | 3,565 | |
Third party structures | | | 155 | |
| | | 3,720 | |
Business review continued
Other CDOs
The net exposure of the Group’s other senior CDOs was £1.5 billion after hedge protection with bank or monoline counterparties. The unhedged exposures comprise CDOs representing smaller positions with various types of underlying collateral, rating and vintage characteristics. The positions hedged with derivative protection from banks include a number of positions referencing early vintages of RMBS and other ABS assets. The Group therefore has no net exposure to certain CDOs before credit valuation adjustment. Due to the early vintage, the assets underlying these structures have not deteriorated to the same degree as the more recently issued securities. The protection purchased is from banks as opposed to monoline insurers and the credit valuation adjustment on banks is less than on monoline insurers.
Additionally, the Group has one exposure that, while not structured as a super senior security, incorporates similar risk characteristics. The exposure results from options sold to a third-party conduit structure on a portfolio of ABS. The Group assumed the risk of these securities only after the first loss protection of had been eroded. The Group also has protection purchased against the remainder of this exposure through a CDS purchased from a monoline insurer.
The Group holds other subordinated note positions in CDO vehicles which have experienced significant reductions in value since inception. The majority of these positions are junior notes that have been fully written down by the Group with no ongoing exposure remaining at the balance sheet date.
CLOs
Collateralised loan obligations represent securities in special purpose entities (SPEs), the assets of which are primarily cash flows from underlying leveraged loans.
The Group has CLO exposures resulting from a number of trading activities. They consist of exposures retained by the Group and from notes purchased from third-party structures. The Group holds super senior securities in two CLO structures which were originated by the Group in 2005 and 2007. The underlying collateral of these structures predominantly references leveraged loans.
£2.3 billion of these assets were reclassified from the held-for-trading category to the loans and receivables (£0.8 billion) and available-for-sale (£1.5 billion) categories during the year.
Other asset backed securities (audited)
Other assets backed securities are securities issued from securitisation vehicles, similar to those in RMBS and CMBS structures, which reference cashflow generating assets other than mortgages. The wide variety of referenced underlying assets result in diverse asset performance levels.
The Group has accumulated these assets from a range of trading and funding activities. The Group’s other asset-backed securities (carrying value) by underlying asset type and geographical region are shown below.
| | | | | | | |
| | | US £m | | | UK £m | | | Europe £m | | | ROW £m | | | Total £m | | | US £m | | | UK £m | | | Europe £m | | | ROW £m | | | Total £m | |
| Covered bonds | | | — | | | | — | | | | 3,301 | | | | — | | | | 3,301 | | | | — | | | | — | | | | 2,895 | | | | — | | | | 2,895 | |
| Auto | | | 97 | | | | 29 | | | | 466 | | | | 13 | | | | 605 | | | | 156 | | | | 36 | | | | 108 | | | | 13 | | | | 313 | |
| Equipment | | | 15 | | | | — | | | | — | | | | 16 | | | | 31 | | | | 60 | | | | 20 | | | | 20 | | | | 7 | | | | 107 | |
| Other consumer | | | 956 | | | | 428 | | | | 118 | | | | 729 | | | | 2,231 | | | | 384 | | | | 17 | | | | 56 | | | | 6 | | | | 463 | |
| Utilities and energy | | | 47 | | | | 19 | | | | 48 | | | | 143 | | | | 257 | | | | 99 | | | | 35 | | | | 34 | | | | 13 | | | | 181 | |
| Aircraft leases | | | 459 | | | | 24 | | | | — | | | | 273 | | | | 756 | | | | 287 | | | | 36 | | | | 36 | | | | 141 | | | | 500 | |
| Other leases | | | 1 | | | | 525 | | | | 455 | | | | — | | | | 981 | | | | 378 | | | | 135 | | | | 133 | | | | 50 | | | �� | 696 | |
| Trade receivables | | | 15 | | | | 8 | | | | — | | | | — | | | | 23 | | | | 68 | | | | 24 | | | | 24 | | | | 9 | | | | 125 | |
| Film / entertainment | | | 134 | | | | — | | | | — | | | | — | | | | 134 | | | | 84 | | | | 30 | | | | 29 | | | | 11 | | | | 154 | |
| Student loans | | | 953 | | | | — | | | | — | | | | — | | | | 953 | | | | 629 | | | | 32 | | | | 32 | | | | 12 | | | | 705 | |
| Other | | | 905 | | | | 588 | | | | 711 | | | | 263 | | | | 2,467 | | | | 2,797 | | | | 1,120 | | | | 1,200 | | | | 339 | | | | 5,456 | |
| | | | 3,582 | | | | 1,621 | | | | 5,099 | | | | 1,437 | | | | 11,739 | | | | 4,942 | | | | 1,485 | | | | 4,567 | | | | 601 | | | | 11,595 | |
Business review continued
The covered bonds comprise asset-backed securities issued by several Spanish financial institutions. These securities benefit from additional credit enhancement provided by the issuing institutions. The other major asset types that increased since 2007 include other consumer loans by £1.8 billion, leases by £0.5 billion and student loans by £0.2 billion. These and other increases were driven by the weakening of sterling against the US dollar and euro.
Other mortgage-related exposures (unaudited)
The Group’s whole loans and warehouse facilities collateralised by mortgages are analysed below. These facilities primarily relate to UK and European mortgages with US mortgages representing £260 million of whole loans, of which more than 75% comprised prime mortgages.
| | | | | | | |
| | | Whole loans £m | | | Warehouse facilities £m | | | Whole loans £m | | | Warehouse facilities £m | |
| Prime | | | 1,905 | | | | 1,731 | | | | 453 | | | | 575 | |
| Commercial | | | 1,262 | | | | 409 | | | | 2,200 | | | | 900 | |
| Non-conforming | | | 1,396 | | | | 1,019 | | | | 57 | | | | 1,445 | |
| Sub-prime | | | 27 | | | | — | | | | 97 | | | | — | |
| | | | 4,590 | | | | 3,159 | | | | 2,807 | | | | 2,920 | |
Counterparty valuation adjustments (audited)
Credit valuation adjustments
Credit valuation adjustments (CVAs) represent(CVA)
CVA represents an estimate of the adjustment to arrive at fair value that a market participant would make to incorporate the credit risk inherent in counterparty derivative exposures. During 2008, as credit spreads have widened, there has been a significant increase in the CVA as set out in the table below.
| | | | 2008
£m | | | | 2007
£m | |
| Monoline insurers | | | 5,988 | | | | 862 | |
| CDPCs | | | 1,311 | | | | 44 | |
| Other counterparties | | | 1,738 | | | | 263 | |
| Total CVA adjustments | | | 9,037 | | | | 1,169 | |
The wideningtable below details the Group’s CVA by type of credit spreads of corporate and financial institution counterparties during the year contributed to a significant increase in the level of CVA adjustments recorded across all counterparties particularly monoline insurers and credit derivative product companies.counterparty.
| | 2010 £m | 2009 £m | 2008 £m |
| Monoline insurers | 2,443 | 3,796 | 5,988 |
| CDPCs | 490 | 499 | 1,311 |
| Other counterparties | 1,714 | 1,588 | 1,738 |
| | 4,647 | 5,883 | 9,037 |
The monoline insurer CVA is calculated on a trade-by-trade basis, and is derived using market observable monoline credit spreads. The majority of the monoline CVA is taken against credit derivatives hedging exposures to ABS. The CDPC CVA is calculated using a similar approach. However, in the absence of market observable credit spreads, the cost of hedging the counterparty risk is estimated by analysing the underlying trades and the cost of hedging expected default losses in excess of the capital available in each vehicle.
The CVA for all other counterparties, including those in respect of derivatives with banks, is calculated either on a trade-by-trade basis, reflecting the estimated cost of hedging the risk through credit derivatives, or on a portfolio basis reflecting an estimate of the amount a third party would charge to assume the risk.
Monoline insurers
The Group has purchased protection from monoline insurers (“monolines”), mainly against specific ABS, CDOs and CLOs. Monoline insurers are entities whichABS. Monolines specialise in providing credit protection against the notionalprincipal and interest cash flows due to the holders of debt instruments in the event of default by the debt securityinstrument counterparty. This protection is typically held in the form of derivatives such as credit default swaps (CDS)(CDSs) referencing the underlying exposures held directly or synthetically by the Group.
DuringThe gross mark-to-market of the yearmonoline protection depends on the market value of securities protected by monoline insurers continued to decline as markets deteriorated. Asthe instruments against which protection has been bought. A positive fair value, or a valuation gain, in the protection is recognised if the fair value of the protected assets declined,instrument it references decreases. For the majority of trades the gross mark-to-market of the monoline protection is determined directly from the fair value price of the underlying reference instrument, however for the remainder of the trades, the gross mark-to-market is determined using industry standard models.
The methodology employed to calculate the monoline CVA uses market implied probability of defaults and internally assessed recovery levels to determine the level of expected loss on monoline exposures of different maturities. The probability of default is calculated with reference to market observable credit spreads and recovery levels. CVA is calculated at a trade level by applying the expected loss, corresponding to each trade’s expected maturity, to the gross mark-to-market of the monoline protection. The expected maturity of each trade reflects the scheduled notional amortisation of the underlying reference instruments and whether payments due from the monoline are received at the point of default or over the life of the underlying reference instruments.
The table below summarises the Group's exposure to monolines, all of which are in Non-Core.
| | 2010 £m | 2009 £m | 2008 £m |
| Gross exposure to monolines | 4,023 | 6,170 | 11,581 |
| Hedges with financial institutions | (71) | (531) | (789) |
| Credit valuation adjustment | (2,443) | (3,796) | (5,988) |
| Net exposure to monolines | 1,509 | 1,843 | 4,804 |
| | | | |
| Credit valuation adjustment as a % of gross exposure | 61% | 62% | 52% |
| | | | |
Counterparty and credit risk RWAs* | £17.8bn | £13.7bn | £7.3bn |
The net income statement effect relating to monoline exposures is detailed below.
| | 2010 | 2009 | 2008 |
| | £m | £m | £m |
| Credit valuation adjustment at 1 January | (3,796) | (5,988) | (862) |
| Credit valuation adjustment at 31 December | (2,443) | (3,796) | (5,988) |
| Decrease/(increase) in credit valuation adjustment | 1,353 | 2,192 | (5,126) |
| Net debit relating to realisations, hedges, foreign exchange and other movements | (844) | (3,290) | (347) |
| Net (debit)/credit relating to reclassified debt securities | (305) | (1,468) | 1,916 |
Net credit/(debit) to income statement (1) | 204 | (2,566) | (3,557) |
Note:
| (1) | Comprises the following elements for the year ended 2010 and 2009: |
| - a loss of £5 million (2009 - £2,387 million) in income from trading activities; - impairment reversals/(losses) of £71 million (2009 - (£239) million); and - other income of £138 million (2009 - £60 million) relating to reclassified debt securities. |
* unaudited
Business reviewcontinued | Business review |
| Risk and balance sheet management |
Risk management: Other risk exposurescontinued
Monoline insurers continued
A number of debt instruments with monoline protection were reclassified from HFT to AFS in 2008. Changes in the fair value since the reclassification are recognised in the income statement to the extent that they are considered to be impaired. Changes in the fair value of the CDS protection fromrelated monoline insurers increased. AsCDSs continue to be recorded in the monoline insurers had concentrated their exposures to credit market risks, their perceived credit quality has deteriorated as concerns increased regarding the abilityincome statement.
The fair value of these counterparties to meet their contractual obligations. This resultedreclassified debt securities at 31 December 2010 was £5,572 million (1 July 2008 - £6,293 million after adjusting for both principal based cash flows and foreign exchange effects between 1 July 2008 and 31 December 2010). As a result of these reclassifications, total cumulative losses of £331 million have not been recognised in increased levels of CVA being recorded on the protection asset.
The change in exposure during the year has been driven by the increased value of purchased derivative protection and the strengthening of the US dollar against sterling as significantly all of the exposures are US dollar denominated. The combination of greater exposure and widening credit spreads has increased the level of CVA required. Towards the end of the year the Group reached settlement on a group of contracts with one monoline counterparty, thereby reducing the overall exposure.
The tables below analyse the Group’s holdings of CDS with monoline counterparties.
| | | | 2008
£m | | | | 2007
£m | |
| Gross exposure to monolines | | | 11,581 | | | | 3,409 | |
| Hedges with bank counterparties | | | (789 | ) | | | — | |
| Credit valuation adjustment | | | (5,988 | ) | | | (862 | ) |
| Net exposure to monolines | | | 4,804 | | | | 2,547 | |
The table below summarises monoline exposures by rating. Credit ratings are based on those from rating agencies S&P and Moody's. Where the ratings differ, the lower of the two is taken.
| 2010 | Notional: protected assets £m | Fair value: reference protected assets £m | Gross exposure £m | Credit valuation adjustment £m | Hedges £m | Net exposure £m |
A to AA- | 6,336 | 5,503 | 833 | 272 | — | 561 |
| Non-investment grade | 8,555 | 5,365 | 3,190 | 2,171 | 71 | 948 |
| | 14,891 | 10,868 | 4,023 | 2,443 | 71 | 1,509 |
| Of which: | | | | | | |
| CMBS | 4,149 | 2,424 | 1,725 | 1,253 | | |
| CDOs | 1,133 | 256 | 877 | 593 | | |
| CLOs | 6,724 | 6,121 | 603 | 210 | | |
| Other ABS | 2,393 | 1,779 | 614 | 294 | | |
| Other | 492 | 288 | 204 | 93 | | |
| | 14,891 | 10,868 | 4,023 | 2,443 | | |
| 2009 | | | | | | |
A to AA- | 7,143 | 5,875 | 1,268 | 378 | — | 890 |
| Non-investment grade | 12,598 | 7,696 | 4,902 | 3,418 | 531 | 953 |
| | 19,741 | 13,571 | 6,170 | 3,796 | 531 | 1,843 |
| Of which: | | | | | | |
| CMBS | 4,253 | 2,034 | 2,219 | 1,562 | | |
| CDOs | 2,284 | 797 | 1,487 | 1,059 | | |
| CLOs | 10,007 | 8,584 | 1,423 | 641 | | |
| Other ABS | 2,688 | 1,861 | 827 | 412 | | |
| Other | 509 | 295 | 214 | 122 | | |
| | 19,741 | 13,571 | 6,170 | 3,796 | | |
| 2008 | | | | | | |
| A to AA+ | 8,937 | 6,537 | 2,400 | 1,067 | — | 1,333 |
| BBB- to A- | 16,895 | 8,396 | 8,499 | 4,426 | 768 | 3,305 |
| Non-investment grade | 2,188 | 1,506 | 682 | 495 | 21 | 166 |
| | 28,020 | 16,439 | 11,581 | 5,988 | 789 | 4,804 |
| | | | | | | |
| Of which: | | | | | | |
| CMBS | 4,849 | 2,388 | 2,461 | 1,429 | | |
| CDOs | 5,779 | 1,395 | 4,384 | 2,201 | | |
| CLOs | 12,865 | 9,673 | 3,192 | 1,556 | | |
| Other ABS | 3,759 | 2,525 | 1,234 | 627 | | |
| Other | 768 | 458 | 310 | 175 | | |
| | 28,020 | 16,439 | 11,581 | 5,988 | | |
Business review continued
The change in CVA is analysed in the table below:Business reviewcontinued | Business review |
| Risk and balance sheet management |
Risk management: Other risk exposurescontinued
Monoline insurers continued
Key points
| · | | | £m | |
At 1 January 2008 | | | 862 | |
CVA realised in 2008 | | | (1,737 | ) |
Net benefit on counterparty hedges | | | 304 | |
Foreign currency movements | | | 1,086 | |
Net benefit on reclassified debt securities | | | 1,916 | |
Net income statement effect | | | 3,557 | |
Balance at 31 December 2008 | | | 5,988 | Exposure to monolines decreased over the period due to a combination of restructuring certain exposures and higher prices of underlying reference instruments, partially offset by the strengthening of the US dollar against sterling. |
| | | | | | | |
| | | Notional amount protected assets £m | | | Fair value protected assets £m | | | Gross exposure £m | | | Credit valuation adjustment £m | | | Notional amount protected assets £m | | | Fair
value
protected assets £m | | | Gross exposure £m | | | Credit valuation adjustment £m | |
| AAA/AA rated | | | | | | | | | | | | | | | | | | | | | | | | |
| CDOs | | | — | | | | — | | | | — | | | | — | | | | 4,976 | | | | 3,006 | | | | 1,970 | | | | 150 | |
| RMBS | | | 3 | | | | 2 | | | | 1 | | | | — | | | | 73 | | | | 73 | | | | — | | | | — | |
| CMBS | | | 613 | | | | 496 | | | | 117 | | | | 51 | | | | 3,731 | | | | 3,421 | | | | 310 | | | | 34 | |
| CLOs | | | 6,506 | | | | 4,882 | | | | 1,624 | | | | 718 | | | | 9,941 | | | | 9,702 | | | | 239 | | | | 44 | |
| Other ABS | | | 1,548 | | | | 990 | | | | 558 | | | | 251 | | | | 4,553 | | | | 4,388 | | | | 165 | | | | 14 | |
| Other | | | 267 | | | | 167 | | | | 100 | | | | 47 | | | | 622 | | | | 516 | | | | 106 | | | | 1 | |
| | | | 8,937 | | | | 6,537 | | | | 2,400 | | | | 1,067 | | | | 23,896 | | | | 21,106 | | | | 2,790 | | | | 243 | |
| · | The CVA decreased on a total basis, reflecting the reduction in exposure, but was stable on a relative basis with the impact of tighter credit spreads offset by an increase in the expected lives of certain trades. |
| A/BBB rated | | | | | | | | | | | | | | | | | | | | | | | | |
| CDO of RMBS | | | 5,385 | | | | 1,363 | | | | 4,022 | | | | 1,938 | | | | — | | | | — | | | | — | | | | — | |
| RMBS | | | 90 | | | | 63 | | | | 27 | | | | 10 | | | | — | | | | — | | | | — | | | | — | |
| CMBS | | | 4,236 | | | | 1,892 | | | | 2,344 | | | | 1,378 | | | | — | | | | — | | | | — | | | | — | |
| CLOs | | | 6,009 | | | | 4,523 | | | | 1,486 | | | | 778 | | | | — | | | | — | | | | — | | | | — | |
| Other ABS | | | 910 | | | | 433 | | | | 477 | | | | 243 | | | | — | | | | — | | | | — | | | | — | |
| Other | | | 265 | | | | 122 | | | | 143 | | | | 79 | | | | — | | | | — | | | | — | | | | — | |
| | | | 16,895 | | | | 8,396 | | | | 8,499 | | | | 4,426 | | | | — | | | | — | | | | — | | | | — | |
| · | The reduction in the Group’s RWA requirements over the quarter was driven by the reduction in exposure to monolines and the impact of restructuring certain risk structures. |
| Sub-investment grade | | | | | | | | | | | | | | | | | | | | | | | | |
| CDO of RMBS | | | 394 | | | | 32 | | | | 362 | | | | 263 | | | | 918 | | | | 453 | | | | 465 | | | | 465 | |
| RMBS | | | — | | | | — | | | | — | | | | — | | | | — | | | | — | | | | — | | | | — | |
| CMBS | | | — | | | | — | | | | — | | | | — | | | | — | | | | — | | | | — | | | | — | |
| CLOs | | | 350 | | | | 268 | | | | 82 | | | | 60 | | | | — | | | | — | | | | — | | | | — | |
| Other ABS | | | 1,208 | | | | 1,037 | | | | 171 | | | | 123 | | | | — | | | | — | | | | — | | | | — | |
| Other | | | 237 | | | | 169 | | | | 68 | | | | 49 | | | | 154 | | | | — | | | | 154 | | | | 154 | |
| | | | 2,189 | | | | 1,506 | | | | 683 | | | | 495 | | | | 1,072 | | | | 453 | | | | 619 | | | | 619 | |
| Total | | | | | | | | | | | | | | | | | | | | | | | | |
| CDO of RMBS | | | 5,779 | | | | 1,395 | | | | 4,384 | | | | 2,201 | | | | 5,894 | | | | 3,459 | | | | 2,435 | | | | 615 | |
| RMBS | | | 93 | | | | 65 | | | | 28 | | | | 10 | | | | 73 | | | | 73 | | | | — | | | | — | |
| CMBS | | | 4,849 | | | | 2,388 | | | | 2,461 | | | | 1,429 | | | | 3,731 | | | | 3,421 | | | | 310 | | | | 34 | |
| CLOs | | | 12,865 | | | | 9,673 | | | | 3,192 | | | | 1,556 | | | | 9,941 | | | | 9,702 | | | | 239 | | | | 44 | |
| Other ABS | | | 3,666 | | | | 2,460 | | | | 1,206 | | | | 617 | | | | 4,553 | | | | 4,388 | | | | 165 | | | | 14 | |
| Other | | | 769 | | | | 458 | | | | 311 | | | | 175 | | | | 776 | | | | 516 | | | | 260 | | | | 155 | |
| | | | 28,021 | | | | 16,439 | | | | 11,582 | | | | 5,988 | | | | 24,968 | | | | 21,559 | | | | 3,409 | | | | 862 | |
| · | During the year there was a significant increase in the RWA requirements of RBS N.V. following its migration to the Basel II regime. Regulatory intervention at certain monoline counterparties triggered International Swaps and Derivative Association (ISDA) credit events in the period. At the point of trigger the exposure to these counterparties was excluded from the RWA calculations and capital deductions of £171 million were taken instead. The impact of this together with restructuring certain exposures and an improvement in the rating of underlying reference bonds held by the Group to investment grade status were the main drivers of the reduction in RWA requirements during the second half of the year. * |
The Group also has indirect exposureexposures to monoline insurers through wrapped securities and other assets which have an intrinsicwith credit enhancement from a monoline insurer.insurers. These securities are traded with the benefit of this credit enhancement and therefore anyenhancement. Any deterioration in the credit rating of the monoline is reflected in the market prices forfair value of these assets.
Business review continued
Credit derivative product companies
A credit derivative product company (CDPC) is a company that sells protection on credit derivatives. CDPCs are similar to monoline insurers. However, unlike monoline insurers, however, they are not regulated as insurers.
The Group has £4.8 billion of exposures withpurchased credit protection from CDPCs which predominatly relatesthrough tranched and single name credit derivatives. The Group's exposure to CDPCs is predominantly due to tranched credit derivatives. Tranched credit derivatives have exposure to certain default losses that arise in reference(“tranches”). A tranche references a portfolio of assets. The Group has bought protection on tranched credit derivatives from CDPCs. The reference portfolios of assets are predominantly investment grade loans and bonds and on average, the trades have exposure toprovides protection against total portfolio default losses that exceed 16%exceeding a certain percentage of the portfolio notional (the attachment point) up to aanother percentage (the detachment point).
The Group has predominantly traded senior tranches with CDPCs, the average attachment and detachment points are 13% and 49% respectively (2009 - 15% and 51% respectively; 2008 - 16% and 50% respectively), and the majority of the loans and bonds in the reference portfolios are investment grade.
The gross mark-to-market of the CDPC protection is determined using industry standard models. The methodology employed to calculate the CDPC CVA is different to that outlined above for monolines, as there are no market observable credit spreads and recovery levels for these entities. The level of 50%. CDS spreads have widenedexpected loss on CDPC exposures is estimated with reference to recent market events impacting CDPCs, including communication activity, and credit protection has become more valuableby analysing the underlying trades and the grosscost of hedging expected default losses in excess of the capital in each vehicle.
A summary of the Group's exposure to CDPCs all of which are in Non-Core is detailed below.
| | 2010 £m | 2009 £m | 2008 £m |
| Gross exposure to CDPCs | 1,244 | 1,275 | 4,776 |
| Credit valuation adjustment | (490) | (499) | (1,311) |
| Net exposure to CDPCs | 754 | 776 | 3,465 |
| | | | |
| Credit valuation adjustment as a % of gross exposure | 39% | 39% | 27% |
| | | | |
Counterparty and credit risk RWAs* | £7.2bn | £7.5bn | £5.0bn |
| | | | |
Capital deductions* | £280m | £347m | — |
* unaudited
Business reviewcontinued | Business review |
| Risk and balance sheet management |
Risk management: Other risk exposurescontinued
Credit derivative product companies continued
The table below details CDPC exposures by rating.
| 2010 | Notional: protected assets £m | Fair value: reference protected assets £m | Gross exposure £m | Credit valuation adjustment £m | Net exposure £m |
| AAA | 213 | 212 | 1 | — | 1 |
| A to AA- | 644 | 629 | 15 | 4 | 11 |
| Non-investment grade | 20,066 | 19,050 | 1,016 | 401 | 615 |
| Unrated | 4,165 | 3,953 | 212 | 85 | 127 |
| | 25,088 | 23,844 | 1,244 | 490 | 754 |
| 2009 | | | | | |
| AAA | 1,658 | 1,637 | 21 | 5 | 16 |
BBB- to A- | 1,070 | 1,043 | 27 | 9 | 18 |
| Non-investment grade | 17,696 | 16,742 | 954 | 377 | 577 |
| Unrated | 3,926 | 3,653 | 273 | 108 | 165 |
| | 24,350 | 23,075 | 1,275 | 499 | 776 |
| 2008 | | | | | |
| AAA | 6,351 | 4,780 | 1,571 | 314 | 1,257 |
| AA to AA+ | 1,195 | 1,116 | 79 | 16 | 63 |
| A to AA- | 13,092 | 10,891 | 2,201 | 657 | 1,544 |
| BBB- to A- | 4,601 | 3,676 | 925 | 324 | 601 |
| | 25,239 | 20,463 | 4,776 | 1,311 | 3,465 |
The table below details the net income statement effect arising from CDPC exposures.
| | 2010 | 2009 | 2008 |
| | £m | £m | £m |
| Credit valuation adjustment at 1 January | (499) | (1,311) | (44) |
| Credit valuation adjustment at 31 December | (490) | (499) | (1,311) |
| Decrease/(increase) in credit valuation adjustment | 9 | 812 | (1,267) |
| Net (debit)/credit relating to realisations, hedges, foreign exchange and other movements | (150) | (1,769) | 652 |
| Income from trading activities - net losses | (141) | (957) | (615) |
Key points
| · | Losses reduced significantly in 2010 due to smaller exposures and reduced losses on hedges that were introduced to cap the exposures. |
| · | The CVA decrease for the year reflected exposure reductions, due to trade commutations, tighter credit spreads of the underlying reference portfolios, partially offset by an increase in the relative value of senior tranches compared with the underlying reference portfolios and foreign currency movements. |
| · | Counterparty and credit RWAs and capital deductions decreased in line with the exposure. |
| · | Certain CDPCs, where the Group has hedges in place to cap the exposure, are excluded from the RWA calculations with capital deduction taken instead. |
Other counterparties
The CVA for all other counterparties has increased. Atis calculated on a portfolio basis reflecting an estimate of the same time,amount a third party would charge to assume the credit qualityrisk.
Expected losses are determined from the market implied probability of CDPCdefaults and internally assessed recovery levels. The probability of default is calculated with reference to observable credit spreads and observable recovery levels. For counterparties has declined, reflectingwhere observable data do not exist, the negative impactprobability of their concentrateddefault is determined from the average credit spreads and recovery levels of baskets of similarly rated entities. A weighting of 50% to 100% is applied to arrive at the CVA. The weighting reflects portfolio churn and varies according to the counterparty credit quality.
Business reviewcontinued | Business review |
| Risk and balance sheet management |
Risk management: Other risk exposurescontinued
Credit derivative product companies continued
Expected losses are applied to estimated potential future exposures which are modelled to reflect the volatility of the market factors which drive the exposures and the correlation between those factors. Potential future exposures arising from vanilla products (including interest rate and foreign exchange derivatives) are modelled jointly using the Group's core counterparty risk systems. The majority of the Group's CVA held in relation to other counterparties arises on these vanilla products. The exposures arising from all other product types are modelled and assessed individually. The potential future exposure to each counterparty is the aggregate of the exposures arising on the underlying product types.
The correlation between exposure and counterparty risk is also incorporated within the CVA calculation where this risk is considered significant. The risk primarily arises on trades with emerging market counterparties where the gross mark-to-market value of the trade, and
therefore the counterparty exposure, increases as the strength of the local currency declines.
Collateral held under a declining market. As a resultcredit support agreement is factored into the CVA adjustments takencalculation. In such cases where the Group holds collateral against counterparty exposures, CVA is held to the extent that residual risk remains.
CVA is held against exposures to theseall counterparties have increased significantly as described above.
The tables below present a comparisonwith the exception of the protected assets andCDS protection that the fair value and CVAGroup has purchased from HM Treasury, as part of its participation in the CDPC protection.
| | | 2008 | | | 2007 | |
| | | | £m | | | | £m | |
| Gross exposure to CDPCs | | | 4,776 | | | | 863 | |
| Credit valuation adjustment | | | (1,311 | ) | | | (44 | ) |
| Net exposure to CDPCs | | | 3,465 | | | | 819 | |
| | | | | | | |
| | | Notional amount protected assets £m | | | Fair value protected assets £m | | | Gross exposure £m | | | Credit valuation adjustment £m | | | Notional amount protected assets £m | | | Fair value protected assets £m | | | Gross exposure £m | | | Credit valuation adjustment £m | |
| AAA/AA rated | | | 19,092 | | | | 15,466 | | | | 3,626 | | | | 908 | | | | 20,605 | | | | 19,742 | | | | 863 | | | | 44 | |
| A/BBB rated | | | 6,147 | | | | 4,997 | | | | 1,150 | | | | 403 | | | | — | | | | — | | | | — | | | | — | |
| | | | 25,239 | | | | 20,463 | | | | 4,776 | | | | 1,311 | | | | 20,605 | | | | 19,742 | | | | 863 | | | | 44 | |
The movementnet income statement effect arising from the change in level of CVA for all other counterparties and related trades is shown in the year in CDPC CVA is analysed below:table below.
| | 2010 | 2009 |
| | £m | £m |
| Credit valuation adjustment at 1 January | (1,588) | (1,738) |
| Credit valuation adjustment at 31 December | (1,714) | (1,588) |
| (Increase)/decrease in credit valuation adjustment | (126) | 150 |
| Net debit relating to realisations, hedges, foreign exchange and other movements | (19) | (841) |
| Income from trading activities - net losses | (145) | (691) |
Key points
| · | The increase in CVA held against exposures to other counterparties was driven by rating downgrades of certain counterparties and the net impact of changes in credit spreads and counterparty exposures due to market moves. This increase was partially offset by a decrease due to the disposal of parts of the RBS Sempra Commodities JV business during the year. |
| · | | | £m | |
At 1 January 2008 | | | 44 | |
Net benefitLosses on CVA hedges | | | 533 | |
Net benefit and realised defaults are the primary driver of the loss arising on FXforeign exchange, hedges, | | | 119 | |
Net income statement effect | | | 615 | |
Balance at 31 December 2008 | | | 1,311 | realisations and other movements. |
Table of ContentsBusiness reviewcontinued | Business review |
| Risk and balance sheet management |
Business review Risk management: Other risk exposurescontinued
LeverageLeveraged finance (audited)Leveraged finance is commonly employed to facilitate corporate finance transactions, such as acquisitions or buy-outs.buy-outs, and is so called due to the high ratio of debt to equity (leverage) common in such transactions. A bank acting as a lead manager for a leveraged finance transaction will typically underwrite thea loan, alone or with others, and then syndicate the loan to other participants.
The Group’s syndicated loan book represent amounts retained from underwriting positions where the Group was lead manager or underwriter, in excesstypically held a portion of the Group’s intended long term participation.
Since the beginningthese loans as part of the credit market dislocation in the second half of 2007, investor appetite for leveraged loans and similar risky assets has fallen dramatically, with secondary prices falling due to selling pressure and margins increasing, thus also affecting theits long-term portfolio once primary market. There were a small number of deals executed in the first half of 2008 which were much less significant in overall quantum and leverage and which were priced at less than mid-2007 levels. Concerted efforts to sell positions during the first half of 2008 were only partially successful due to the rapid change in market conditions since origination of the loans.syndication is completed. Most of the leveraged finance loans held as part of the syndicated lending portfolio were reclassified from HFT to LAR in 2008.
The gross exposure represents the held-for-trading categorytotal amount of leveraged finance committed by the Group. The net exposure represents the balance sheet carrying values of drawn leveraged finance and the total undrawn amount. The difference between gross and net exposures is principally due to loansthe cumulative effect of impairment provisions and receivables categoryhistoric write-downs on assets prior to reclassification.
The table below shows the Groups global markets sponsor-led leveraged finance exposures, all of which are in the second half of 2008.Non-Core, by industry and geography.
| | 2010 | | 2009 | | 2008 Total £m |
| | UK £m | Americas £m | Other Europe £m | RoW £m | Total £m | | UK £m | Americas £m | Other Europe £m | RoW £m | Total £m | |
| Gross exposure: | | | | | | | | | | | | | |
TMT (1) | 1,451 | 689 | 686 | 473 | 3,299 | | 1,656 | 1,781 | 1,081 | 605 | 5,123 | | 6,527 |
| Industrial | 1,009 | 273 | 1,144 | 285 | 2,711 | | 1,523 | 1,584 | 1,781 | 207 | 5,095 | | 5,410 |
| Retail | 290 | 8 | 867 | 61 | 1,226 | | 476 | 17 | 1,354 | 71 | 1,918 | | 3,082 |
| Other | 1,074 | 188 | 627 | 182 | 2,071 | | 1,527 | 244 | 1,168 | 191 | 3,130 | | 3,286 |
| | 3,824 | 1,158 | 3,324 | 1,001 | 9,307 | | 5,182 | 3,626 | 5,384 | 1,074 | 15,266 | | 18,305 |
| | | | | | | | | | | | | | |
| Net exposure: | | | | | | | | | | | | | |
TMT (1) | 1,267 | 656 | 633 | 338 | 2,894 | | 1,532 | 1,502 | 1,045 | 590 | 4,669 | | 6,148 |
| Industrial | 911 | 181 | 1,094 | 277 | 2,463 | | 973 | 524 | 1,594 | 205 | 3,296 | | 3,708 |
| Retail | 277 | 8 | 817 | 57 | 1,159 | | 445 | 17 | 1,282 | 68 | 1,812 | | 2,714 |
| Other | 1,014 | 188 | 622 | 182 | 2,006 | | 1,461 | 244 | 1,147 | 191 | 3,043 | | 3,199 |
| | 3,469 | 1,033 | 3,166 | 854 | 8,522 | | 4,411 | 2,287 | 5,068 | 1,054 | 12,820 | | 15,769 |
| | | | | | | | | | | | | | |
| Of which: | | | | | | | | | | | | | |
| Drawn | 2,952 | 673 | 2,433 | 694 | 6,752 | | 3,737 | 1,944 | 3,909 | 950 | 10,540 | | 12,619 |
| Undrawn | 517 | 360 | 733 | 160 | 1,770 | | 674 | 343 | 1,159 | 104 | 2,280 | | 3,150 |
| | 3,469 | 1,033 | 3,166 | 854 | 8,522 | | 4,411 | 2,287 | 5,068 | 1,054 | 12,820 | | 15,769 |
Notes:
| (1) | Telecommunications, media and technology. |
| (2) | All of the above exposures are classified as LAR, except £154 million (2009 - £143 million; 2008 - £102 million) which are classified as HFT. |
The table below shows the carrying value ofGroup’s movement in leveraged finance exposures by industry and geography.during the year.
| | | 2008 | | | 2007(1) | |
| | | Americas £m | | | UK £m | | | Europe £m | | | ROW £m | | | Total £m | | | Americas £m | | | UK £m | | | Europe £m | | | ROW £m | | | Total £m | |
| TMT | | | 1,681 | | | | 628 | | | | 402 | | | | 45 | | | | 2,756 | | | | 6,924 | | | | 424 | | | | 482 | | | | 25 | | | | 7,855 | |
| Retail | | | 166 | | | | 550 | | | | 707 | | | | 21 | | | | 1,444 | | | | 542 | | | | 1,318 | | | | 800 | | | | 49 | | | | 2,709 | |
| Industrial | | | 280 | | | | 391 | | | | 413 | | | | — | | | | 1,084 | | | | 249 | | | | 2,003 | | | | 1,074 | | | | 44 | | | | 3,370 | |
| Other | | | 11 | | | | 552 | | | | 141 | | | | 35 | | | | 739 | | | | 25 | | | | 339 | | | | 271 | | | | 13 | | | | 648 | |
| | | | 2,138 | | | | 2,121 | | | | 1,663 | | | | 101 | | | | 6,023 | | | | 7,740 | | | | 4,084 | | | | 2,627 | | | | 131 | | | | 14,582 | |
| Of which: | | | | | | | | | | | | | | | | | | | | | | | | | | | | | | |
| Held-for-trading | | | 31 | | | | 31 | | | | 41 | | | | — | | | | 103 | | | | 7,607 | | | | 3,694 | | | | 689 | | | | 51 | | | | 12,041 | |
| Loan and receivables | | | 2,107 | | | | 2,090 | | | | 1,622 | | | | 101 | | | | 5,920 | | | | 133 | | | | 390 | | | | 1,938 | | | | 80 | | | | 2,541 | |
| | | | 2,138 | | | | 2,121 | | | | 1,663 | | | | 101 | | | | 6,023 | | | | 7,740 | | | | 4,084 | | | | 2,627 | | | | 131 | | | | 14,582 | |
| | 2010 | | 2009 |
| | Drawn £m | Undrawn £m | Total £m | | Drawn £m | Undrawn £m | Total £m |
| Balance at 1 January | 10,540 | 2,280 | 12,820 | | 12,619 | 3,150 | 15,769 |
| Transfers (out)/in (from credit trading business) | (38) | 12 | (26) | | 563 | 41 | 604 |
| Sales and restructurings | (3,575) | (273) | (3,848) | | (247) | (144) | (391) |
| Repayments and facility reductions | (488) | (272) | (760) | | (934) | (392) | (1,326) |
| Funded deals | (11) | 11 | — | | 166 | (166) | — |
| Lapsed/collapsed deals | — | — | — | | — | (19) | (19) |
| Changes in fair value | 73 | — | 73 | | (31) | — | (31) |
| Accretion of interest | 50 | — | 50 | | 100 | — | 100 |
| Net recoveries/(impairment provisions) | 131 | — | 131 | | (1,041) | — | (1,041) |
| Exchange and other movements | 70 | 12 | 82 | | (655) | (190) | (845) |
| Balance at 31 December | 6,752 | 1,770 | 8,522 | | 10,540 | 2,280 | 12,820 |
| Of which: | | | | | | | | | | | | | | | | | | | | | | | | | | | | | | |
| Drawn | | | 2,081 | | | | 2,090 | | | | 1,453 | | | | 94 | | | | 5,718 | | | | 2,249 | | | | 4,025 | | | | 2,478 | | | | 122 | | | | 8,874 | |
| Undrawn | | | 57 | | | | 31 | | | | 210 | | | | 7 | | | | 305 | | | | 5,491 | | | | 59 | | | | 149 | | | | 9 | | | | 5,708 | |
| | | | 2,138 | | | | 2,121 | | | | 1,663 | | | | 101 | | | | 6,023 | | | | 7,740 | | | | 4,084 | | | | 2,627 | | | | 131 | | | | 14,582 | |
| · | Reduction in exposures reflect the Non-Core strategy. |
| · | Approximately 92% of the above exposures represent senior lending at 31 December 2010. |
(1)Business reviewcontinued | Leveraged finance as disclosed above for 31 December 2007 has been aligned with definitions used in 2008Business review |
| Risk and is consequently £76 million higher than previously published.balance sheet management |
The table below analyses the movement in the amounts reported above.
| | | | | | | |
| | | Drawn £m | | | Undrawn £m | | | Total £m | | | Drawn £m | | | Undrawn £m | | | Total £m | |
| At 1 January 2008 | | | 6,516 | | | | 5,525 | | | | 12,041 | | | | 2,358 | | | | 183 | | | | 2,541 | |
| Reclassifications | | | (3,602 | ) | | | — | | | | (3,602 | ) | | | 3,602 | | | | — | | | | 3,602 | |
| Reclassifications – income effect | | | 216 | | | | — | | | | 216 | | | | 19 | | | | — | | | | 19 | |
| Additions | | | 1,171 | | | | 682 | | | | 1,853 | | | | 235 | | | | — | | | | 235 | |
| Sales | | | (3,826 | ) | | | (1,882 | ) | | | (5,708 | ) | | | (473 | ) | | | (81 | ) | | | (554 | ) |
| Realised losses on sales | | | (298 | ) | | | — | | | | (298 | ) | | | (197 | ) | | | — | | | | (197 | ) |
| Funded deals | | | 1,298 | | | | (1,298 | ) | | | — | | | | — | | | | — | | | | — | |
| Lapsed/collapsed deals | | | (415 | ) | | | (3,738 | ) | | | (4,153 | ) | | | (173 | ) | | | — | | | | (173 | ) |
| Change in fair value | | | (462 | ) | | | (156 | ) | | | (618 | ) | | | n/a | | | | n/a | | | | n/a | |
| Impairment provisions | | | n/a | | | | n/a | | | | n/a | | | | (1,191 | ) | | | — | | | | (1,191 | ) |
| Exchange and other movements | | | 211 | | | | 161 | | | | 372 | | | | 1,603 | | | | 35 | | | | 1,638 | |
| Presentation changes | | | (778 | ) | | | 778 | | | | — | | | | (96 | ) | | | 96 | | | | — | |
| At 31 December 2008 | | | 31 | | | | 72 | | | | 103 | | | | 5,687 | | | | 233 | | | | 5,920 | |
Leveraged financecontinued
In addition to the above, UK Corporate and Ulster Bank have leveraged finance syndicated portfolio discussed above, the Group has £7 billion of portfolio positions, mostly to European companies, that have been classifiedexposures as loans and receivables since origination.set out below.
| | 2010 | 2009 | 2008 |
| | £m | £m | £m |
| UK Corporate | | | |
- debt financing (1) | 3,664 | 4,041 | 4,496 |
- senior debt transactions (2) | 2,604 | 3,034 | 2,330 |
| Total UK Corporate | 6,268 | 7,075 | 6,826 |
| Ulster Bank | 597 | 621 | 694 |
| | 6,865 | 7,696 | 7,520 |
117| (1) | Loans for UK mid-market buyouts, supplementing equity capital provided by third party private equity investors. |
| (2) | Loans to UK mid-corporates supporting acquisitions, recapitalisations or general corporate purposes where higher leverage criteria were met. |
SPEs and conduits
SPEs (audited)Special purpose entities
The Group arranges securitisations to facilitate client transactions and undertakes securitisations to sell financial assets or to fund specific portfolios of assets. The Group also acts as an underwriter and depositor in securitisation transactions involving both client and proprietary transactions. In a securitisation, assets, or interests in a pool of assets, are transferred generally to a special purpose entity (SPE) which then issues liabilities to third party investors. SPEs are vehicles established for a specific, limited purpose, usually do not carry out a business or trade and typically have no employees. They take a variety of legal forms –- trusts, partnerships and companies –- and fulfil many different functions. As well as being a key element of securitisations, SPEs are also used in fund management activities to segregate custodial duties from the fund management advice provided by the Group.
It is primarily the extent of risks and rewards assumed that determines whether these entities are consolidated in the Group’sGroup's financial statements. The following section aims to address the significant exposures which arise from the Group’sGroup's activities through specific types of SPEs.
The Group sponsors and arranges own-asset securitisations, whereby the sale of assets or interests in a pool of assets into an SPE is financed by the issuance of securities to investors. The pool of assets held by the SPE may be originated by the Group, or (in the case of whole loan programmes) purchased from third parties, and may be of varying credit quality. Investors in the debt securities issued by the SPE are rewarded through credit-linked returns, according to the credit rating of their securities. The majority of securitisations are supported through liquidity facilities, other credit enhancements and derivative hedges extended by financial institutions, some of which offer protection against initial defaults in the pool of assets. Thereafter, losses are absorbed by investors in the lowest ranking notes in the priority of payments. Investors in the most senior ranking debt securities are typically shielded from loss, since any subsequent losses may trigger repayment of their initial principal.
The Group also employs synthetic structures, where assets are not sold to the SPE, but credit derivatives are used to transfer the credit risk of the assets to an SPE. Securities may then be issued by the SPE to investors, on the back of the credit protection sold to the Group by the SPE.
In general residentialResidential and commercial mortgages and credit card receivables form the types of assets generally included in cash securitisations, while corporate loans and commercial mortgages typically serve as reference obligations in synthetic securitisations.
The Group sponsors own-asset securitisations primarily as a way of diversifying funding sources, managing specific risk concentrations, and achieving capital efficiency.sources. The Group purchases the securities issued in own-asset securitisations set up for funding purposes.own asset securitisations. During 2008, the Group was able to pledge AAA-ratedAAA rated asset-backed securities as collateral for repurchase agreements with major central banks under schemes such as the Bank of England’sEngland's Special Liquidity Scheme, launched in April 2008, which allowed banks to temporarily swap high-quality mortgage-backed and other securities for liquid UK Treasury Bills.treasury bills. This practice has contributed to the Group’sGroup's sources of funding during 2008 in the face of the contraction in the UK market for inter-bank lending, particularly during 2008 and the2009, and investor base for securitisations.
The Group typically does not retaintable below sets out the majorityasset categories, together with the carrying value of risksthe assets and rewards of own-assetassociated liabilities for those securitisations set up for the purposes of risk diversification and capital efficiency,other asset transfers, other than conduits (discussed below), where the majority of investors tendassets continue to be third parties. Therefore,recorded on the Group's balance sheet
| | 2010 | | 2009 | | 2008 |
| | Assets | Liabilities | | Assets | Liabilities | | Assets | Liabilities |
| | £m | £m | | £m | £m | | £m | £m |
| Residential mortgages | 76,212 | 18,215 | | 69,927 | 15,937 | | 55,714 | 20,075 |
| Credit card receivables | 3,993 | 34 | | 2,975 | 1,592 | | 3,004 | 3,197 |
| Other loans | 30,988 | 974 | | 36,448 | 1,010 | | 1,679 | 1,071 |
| Finance lease receivables | 510 | 510 | | 597 | 597 | | 1,077 | 857 |
Assets are significantly greater than liabilities, as all notes issued by funding related own asset securitisation SPEs are purchased by Group is typically not required to consolidate the related SPEs.companies.
The Group has also established whole loan securitisation programmes in the US and UK where assets originated by third parties are warehoused by the Group for securitisation. The majority of these vehicles are not consolidated by the Group, as it is not exposed to the risks and rewards of ownership.
Business reviewcontinued | Business review |
| Risk and balance sheet management |
Risk management: Other risk exposurescontinued
Conduits (audited)
The Group sponsors and administers a number of asset-backed commercial paper (ABCP) conduits. A conduit is an SPE that issues commercial paper and uses the proceeds to purchase or fund a pool of assets. The commercial paper is secured on the assets and is redeemed either by further commercial paper issuance, repayment of assets or funding from liquidity drawings.facilities. Commercial paper is typically short-dated, – the length of time from issuance to maturity of the paper is typicallyusually up to three months.
The Group’sGroup-sponsored conduits can be divided into multi-seller conduits and own- assetown-asset conduits. In line with market practice, theThe Group consolidates both types of conduit where itthe substance of the relationship between the Group and the conduit vehicle is exposedsuch that the vehicle is controlled by the Group. Liquidity commitments from the Group to the conduit exceed the nominal amount of assets funded by the conduit as liquidity commitments are sized to cover the funding cost of the related assets.
During the year both multi-seller and own asset conduit assets have been reduced in line with wider Group balance sheet management. The total assets held by Group-sponsored conduits were £20.0 billion at 31 December 2010 (31 December 2009 - £27.4 billion; 31 December 2008 - £49.9 billion).
| | 2010 | | 2009 | | 2008 £m |
| | Core £m | Non-Core £m | Total £m | | Core £m | Non-Core £m | Total £m | |
| Total assets held by the conduits | 16,390 | 3,624 | 20,014 | | 23,409 | 3,957 | 27,366 | | 49,857 |
Commercial paper issued (1) | 15,522 | 2,540 | 18,062 | | 22,644 | 2,939 | 25,583 | | 48,684 |
| | | | | | | | | | |
| Liquidity and credit enhancements | | | | | | | | | |
| Deal specific liquidity | | | | | | | | | |
| - drawn | 868 | 1,109 | 1,977 | | 738 | 1,059 | 1,797 | | 1,172 |
| - undrawn | 21,935 | 2,980 | 24,915 | | 28,628 | 3,852 | 32,480 | | 57,929 |
PWCE (2) | 1,025 | 257 | 1,282 | | 1,167 | 341 | 1,508 | | 2,391 |
| | 23,828 | 4,346 | 28,174 | | 30,533 | 5,252 | 35,785 | | 61,492 |
| | | | | | | | | | |
Maximum exposure to loss (3) | 22,803 | 4,089 | 26,892 | | 29,365 | 4,911 | 34,276 | | 59,101 |
Notes:
| (1) | Includes £0.7 billion of ABCP issued to RBS plc at 31 December 2010. |
| (2) | Programme-wide credit enhancement. |
| (3) | Maximum exposure to loss is determined as the Group’s total liquidity commitments to the conduits and additionally programme-wide credit support which would absorb first loss on transactions where liquidity support is provided by a third party. |
Information relating to assets in the conduits is set out on pages 159 and 160.
Multi-seller conduits accounted for 44% of the total liquidity and credit enhancements committed by the Group at 31 December 2010 (2009 - 43%; 2008 - 69%). The Group’s multi-seller conduits have continued to fund the vast majority of riskstheir assets solely through ABCP issuance. There have been no significant systemic failures within the financial markets similar to that experienced in the second half of 2008 following Lehman Brothers bankruptcy filing in September 2008. The improvement in market conditions has allowed these conduits to move to normal ABCP funding conditions and rewards of ownership of these entities. reduced the need for backstop funding from the Group.
Key points
| · | Total assets decreased during the year by £7.4 billion in line with the Group’s strategy of reducing conduit exposure. |
| · | The average maturity of ABCP issued by the Group’s conduits has risen throughout 2010, to 69.4 days (2009 - 58.4 days; 2008 - 72.1 days). |
| · | The maturity of the commercial paper issued by the Group’s conduits to mitigate the short-term contingent liquidity risk of providing back-up facilities. The Group’s limits sanctioned for such liquidity facilities in 2010 totalled approximately £22.6 billion for multi-seller conduits (2009 - £25.0 billion; 2008 - £42.9 billion). For a very small number of transactions within one multi-seller conduit the liquidity facilities have been provided by third-party banks. This typically occurs on transactions where the third-party bank does not use, or have, its own conduit vehicles. |
| · | The Group’s maximum exposure to loss on its multi-seller conduits is £22.8 billion (2009 - £25.2 billion; 2008 - £43.2 billion), being the total amount of the Group’s liquidity commitments plus the extent of PWCE of conduit assets for which liquidity facilities were not provided by third parties. |
| · | The Group holds two own-asset conduits, which have assets that were previously funded by the Group. The Group’s maximum exposure to loss on these two conduits was £4.1 billion in 2010 (2009 - £9.1 billion; 2008 - £15.9 billion), with £2.2 billion of ABCP outstanding at that date (2009 - £7.7 billion; 2008 - £14.8 billion). |
| · | Additionally the Group established an own-asset conduit in 2009 with a committed liquidity of £26.0 billion (2009 - £25.1 billion) to access the Bank of England’s open market operations for contingent funding purposes. |
The Group also extends liquidity commitments to multi-seller conduits sponsored by other banks, but typically does not consolidate these entities as it isthe Group does not exposedretain the majority of the risks and rewards.
Funding and liquidity
The Group’s most significant multi-seller conduits have thus far continued to fund the vast majority of their assets solely through ABCP issuance. There were significant disruptions to the liquidity of the financial markets during the year following the bankruptcy filing of Lehman Brothers in September 2008 and this required a small amount of the assets held in certain conduits to be funded by the Group rather than through ABCP issuance. By the end of 2008 there had been an improvement in market conditions, supported by central bank initiatives, which enabled normal ABCP funding to replace this Group funding of the conduits.
The average maturity of ABCP issued by the Group’s conduits as at 31 December 2008 was 72.1 days (2007 – 60.9 days).
The total assets held by the Group’s sponsored conduits are £49.9 billion (2007 – £48.1 billion). Since these liquidity facilities are sanctioned on the basis of total conduit purchase commitments, the liquidity facility commitments will exceed the level of assets held, with the difference representing undrawn commitments.
Business review continued
The Group values the funding flexibility and liquidity provided by the ABCP market to fund client- and Group-originated assets. Whereas there are plans to decrease the multi-seller conduit business in line with the Group’s balance sheet, the Group is reviewing the potential for new own-asset conduit structures to add funding diversity.
Multi-seller conduits
The multi-seller conduits were established by the Group for the purpose of providing its clients with access to diversified and flexible funding sources. A multi-seller conduit typically purchases or funds assets originated by the banks’ clients. The multi-seller conduits form the vast majority of the Group’s conduit business (69.4% of the total liquidity and credit enhancements committed by the Group). The Group sponsors six multi-seller conduits which finance assets from Europe, North America and Asia-Pacific.
Assets purchased or financed by the multi-seller conduits include auto loans, residential mortgages, credit card receivables, consumer loans and trade receivables. All assets held by the conduits are recorded on the Group’s balance sheet either as loans and receivables or debt securities.
The third-party assets financed by the conduits are structured with a significant degree of first-loss credit enhancement provided by the originators of the assets. This credit enhancement, which is specific to each transaction, can take the form of over-collateralisation, excess spread or subordinated loan, and typically ensures the conduit asset has a rating equivalent to at least a single-A credit. In addition, and in line with general market practice, the Group provides a small second-loss layer of programme-wide protection to the multi-seller conduits. Given the nature and investment grade equivalent quality of the first loss enhancement provided to the structures, the Group has only a minimal risk of loss on its program wide exposure. The issued ABCP is rated P-1/A1 by Moody’s and Standard & Poor’s.
The Group provides liquidity back-up facilities to the conduits it sponsors. These facilities can be drawn upon by the conduits in the event of a disruption in the ABCP market, or when certain trigger events occur such that ABCP cannot be issued. For a very small number of transactions within two of the multi-seller conduits sponsored by the Group these liquidity facilities have been provided by third-party banks. This typically occurs on transactions where the third-party bank does not use, or have, its own conduit vehicles. Conduit commercial paper issuance is managed such that the spread of maturity dates of the issued ABCP mitigates the short-term contingent liquidity risk of providing back-up facilities. Limits sanctioned for such facilities as at 31 December 2008 totalled approximately £42.9 billion (2007 – £49.2 billion).
The Group’s maximum exposure to loss on its multi-seller conduits is £43.2 billion (2007 – £49.4 billion), being the total amount of the Group’s liquidity commitments plus the extent of programme-wide credit enhancements which relate to conduit assets for whom liquidity facilities were provided by third parties.
Own-asset conduits
The Group also holds three own-asset conduits which fund assets which have been funded at one time by the Group. These vehicles represent 25% of the Group’s conduit business (as a percentage of the total liquidity and credit enhancements committed by the Group), with £14.8 billion of ABCP outstanding at 31 December 2008 (2007 – £10.4 billion). The Group’s maximum exposure to loss on its own-asset conduits is £15.9 billion (2007 – £13.5 billion), being the total drawn and undrawn amount of the Group’s liquidity commitments to these conduits.
Securitisation arbitrage conduits
The Group no longer sponsors any securitisation arbitrage conduits. As part of the integration of ABN AMRO and a strategic review of the conduit business, the sole securitisation arbitrage conduit was dissolved in 2008. All of its assets were transferred to a centrally managed asset unit for run-off or sale.
The Group’s exposure from both its consolidated conduits, including those to which the Group is economically exposed and those which are shared with the other consortium members, and its involvement with third-party conduits are set out in the following table.
was £136 million (2009 - £587 million; 2008 - £3.9 billion) representing deal specific liquidity.
Business review continued
| | | | | | | |
| | | Consolidated conduits £m | | | Third party £m | | | Total £m | | | Consolidated conduits £m | | | Third party £m | | | Total £m | |
| Total assets held by the conduits | | | 49,857 | | | | | | | | | | 48,070 | | | | | | | |
| | | | | | | | | | | | | | | | | | | | | |
| Commercial paper issued | | | 48,684 | | | | | | | | | | 46,532 | | | | | | | |
| | | | | | | | | | | | | | | | | | | | | |
| Liquidity and credit enhancements: | | | | | | | | | | | | | | | | | | | | |
| deal specific drawn liquidity | | | | | | | | | | | | | | | | | | | | | | | | |
| – drawn | | | 1,172 | | | | 3,078 | | | | 4,250 | | | | 1,537 | | | | 2,280 | | | | 3,817 | |
| – undrawn | | | 57,929 | | | | 198 | | | | 58,127 | | | | 61,347 | | | | 490 | | | | 61,837 | |
| | | | | | | | | | | | | | | | | | | | | | | | | |
| programme-wide liquidity | | | | | | | | | | | | | | | | | | | | | | | | |
| – drawn | | | — | | | | 102 | | | | 102 | | | | — | | | | 250 | | | | 250 | |
| – undrawn | | | — | | | | 504 | | | | 504 | | | | 75 | | | | 899 | | | | 974 | |
| Programme-wide credit enhancements (2) | | | 2,391 | | | | — | | | | 2,391 | | | | 3,096 | | | | — | | | | 3,096 | |
| | | | 61,492 | | | | 3,882 | | | | 65,374 | | | | 66,055 | | | | 3,919 | | | | 69,974 | |
| Maximum exposure to loss (3) | | | 59,101 | | | | 3,882 | | | | 62,983 | | | | 62,959 | | | | 3,919 | | | | 68,878 | |
Notes:
(1) | Total assets held by the conduits and commercial paper issued at 31 December 2007 included: |
| · | £5.2 billion assets and commercial paper issued relating to and by the Group’s securitisation arbitrage conduit which was dissolved in 2008 |
| · | £10.7 billion assets (corporate loans) and £10.5 billion commercial paper issued relating to a shared conduit – see below. |
| · | £1.3 billion assets relating to reactivated conduits which started to issue commercial paper in the second half of 2008. |
(2) | Programme-wide credit enhancement. |
(3) | Maximum exposure to loss is determined as the maximum loss being the maximum amount by borrowers may drawn on their conduits facility for which the Group has provided committed liquidity and credit backstop facilities. |
Business reviewcontinued | Business review |
| Risk and balance sheet management |
Business review continued
The Group’s exposure from the conduit shared with the other consortium members is set out below:
| | | | 2008 £m | | | | 2007 £m | |
| Total assets held by the conduits | | | 13,286 | | | | 10,650 | |
| | | | | | | | | |
| Commercial paper issued | | | 13,028 | | | | 10,452 | |
| | | | | | | | | |
| Liquidity and credit enhancements: deal specific drawn liquidity | | | | | | | | |
| – drawn | | | 258 | | | | 198 | |
| – undrawn | | | 13,566 | | | | 11,868 | |
| | | | 13,824 | | | | 12,066 | |
| Maximum exposure to loss | | | 13,824 | | | | 12,066 | |
Collateral analysis, geographic, profile, credit ratings and weighted average lives of the assets in the assets relating to the Group’s consolidated conduits and related undrawn commitments are set out in the tablesdetailed below.
| | | | | | | | | | | | | |
| | | Funded assets | | | | | | Liquidity for third parties | | | Total exposure | |
| | Loans | | | Securities | | | Total | | | Undrawn | |
| 2010 | | | £m | | | | £m | | | | £m | | | | £m | | | | £m | | | | £m | |
| Auto loans | | | 4,943 | | | | 346 | | | | 5,289 | | | | 2,964 | | | | — | | | | 8,253 | |
| Corporate loans | | | 115 | | | | 2,340 | | | | 2,455 | | | | 106 | | | | — | | | | 2,561 | |
| Credit card receivables | | | 2,088 | | | | — | | | | 2,088 | | | | 1,209 | | | | — | | | | 3,297 | |
| Trade receivables | | | 761 | | | | — | | | | 761 | | | | 1,090 | | | | — | | | | 1,851 | |
| Student loans | | | 757 | | | | — | | | | 757 | | | | 532 | | | | (132 | ) | | | 1,157 | |
| Consumer loans | | | 1,889 | | | | — | | | | 1,889 | | | | 111 | | | | — | | | | 2,000 | |
| Mortgages | | | | | | | | | | | | | | | | | | | | | | | | |
| - prime | | | 2,569 | | | | 3 | | | | 2,572 | | | | 752 | | | | — | | | | 3,324 | |
| - non-conforming | | | 1,371 | | | | — | | | | 1,371 | | | | 20 | | | | — | | | | 1,391 | |
| - sub-prime residential mortgages | | | 103 | | | | — | | | | 103 | | | | 19 | | | | — | | | | 122 | |
| - commercial | | | 210 | | | | 450 | | | | 660 | | | | 76 | | | | (21 | ) | | | 715 | |
| Other | | | 1,072 | | | | 997 | | | | 2,069 | | | | (8 | ) | | | (10 | ) | | | 2,051 | |
| | | | 15,878 | | | | 4,136 | | | | 20,014 | | | | 6,871 | | | | (163 | ) | | | 26,722 | |
| | | | | | | | | | | | | | | | | | | | | | | | | |
| 2009 | | | | | | | | | | | | | | | | | | | | | | | | |
| Auto loans | | | 4,293 | | | | 356 | | | | 4,649 | | | | 2,526 | | | | — | | | | 7,175 | |
| Corporate loans | | | 106 | | | | 7,695 | | | | 7,801 | | | | 161 | | | | — | | | | 7,962 | |
| Credit card receivables | | | 4,083 | | | | — | | | | 4,083 | | | | 1,058 | | | | — | | | | 5,141 | |
| Trade receivables | | | 806 | | | | — | | | | 806 | | | | 1,351 | | | | — | | | | 2,157 | |
| Student loans | | | 915 | | | | — | | | | 915 | | | | 263 | | | | (132 | ) | | | 1,046 | |
| Consumer loans | | | 1,686 | | | | — | | | | 1,686 | | | | 222 | | | | — | | | | 1,908 | |
| Mortgages | | | | | | | | | | | | | | | | | | | | | | | | |
| - prime | | | 2,739 | | | | 3 | | | | 2,742 | | | | 750 | | | | — | | | | 3,492 | |
| - non-conforming | | | 1,548 | | | | — | | | | 1,548 | | | | 193 | | | | — | | | | 1,741 | |
| - commercial | | | 413 | | | | 458 | | | | 871 | | | | 155 | | | | (22 | ) | | | 1,004 | |
| Other | | | 872 | | | | 1,393 | | | | 2,265 | | | | 232 | | | | (12 | ) | | | 2,485 | |
| | | | 17,461 | | | | 9,905 | | | | 27,366 | | | | 6,911 | | | | (166 | ) | | | 34,111 | |
| | | | | | | | | | | | | | | | | | | | | | | | | |
| 2008 | | | | | | | | | | | | | | | | | | | | | | | | |
| Auto loans | | | 9,924 | | | | 383 | | | | 10,307 | | | | 1,871 | | | | — | | | | 12,178 | |
| Corporate loans | | | 430 | | | | 11,042 | | | | 11,472 | | | | 534 | | | | — | | | | 12,006 | |
| Credit card receivables | | | 5,844 | | | | — | | | | 5,844 | | | | 922 | | | | — | | | | 6,766 | |
| Trade receivables | | | 2,745 | | | | — | | | | 2,745 | | | | 1,432 | | | | (71 | ) | | | 4,106 | |
| Student loans | | | 2,555 | | | | — | | | | 2,555 | | | | 478 | | | | (132 | ) | | | 2,901 | |
| Consumer loans | | | 2,371 | | | | — | | | | 2,371 | | | | 409 | | | | — | | | | 2,780 | |
| Mortgages | | | | | | | | | | | | | | | | | | | | | | | | |
| - prime | | | 4,416 | | | | 2,250 | | | | 6,666 | | | | 1,188 | | | | — | | | | 7,854 | |
| - non-conforming | | | 2,181 | | | | — | | | | 2,181 | | | | 727 | | | | — | | | | 2,908 | |
| - commercial | | | 1,228 | | | | 507 | | | | 1,735 | | | | 66 | | | | (23 | ) | | | 1,778 | |
| Other | | | 1,851 | | | | 2,130 | | | | 3,981 | | | | 1,615 | | | | — | | | | 5,596 | |
| | | | 33,545 | | | | 16,312 | | | | 49,857 | | | | 9,242 | | | | (226 | ) | | | 58,873 | |
| | | | | | | |
| | | | | | | | | Liquidity from third | | | Total | | | | | | | | | Liquidity from third | | | Total | |
| | | Loans £m | | | Securities
£m | | | Total £m | | | Undrawn £m | | | parties £m | | | exposure £m | | | Loans £m | | | Securities £m | | | Total £m | | | Undrawn £m | | | parties £m | | | exposure £m | |
| Auto loans | | | 9,924 | | | | 383 | | | | 10,307 | | | | 1,871 | | | | — | | | | 12,178 | | | | 8,066 | | | | 578 | | | | 8,644 | | | | 3,701 | | | | (102 | ) | | | 12,243 | |
| Corporate loans | | | 430 | | | | 11,042 | | | | 11,472 | | | | 534 | | | | — | | | | 12,006 | | | | 36 | | | | 8,927 | | | | 8,963 | | | | 1,390 | | | | — | | | | 10,353 | |
| Credit card receivables | | | 5,844 | | | | — | | | | 5,844 | | | | 922 | | | | — | | | | 6,766 | | | | 5,104 | | | | 90 | | | | 5,194 | | | | 1,206 | | | | — | | | | 6,400 | |
| Trade receivables | | | 2,745 | | | | — | | | | 2,745 | | | | 1,432 | | | | (71 | ) | | | 4,106 | | | | 3,068 | | | | 320 | | | | 3,388 | | | | 2,386 | | | | — | | | | 5,774 | |
| Student loans | | | 2,555 | | | | — | | | | 2,555 | | | | 478 | | | | (132 | ) | | | 2,901 | | | | 335 | | | | 262 | | | | 597 | | | | 1,082 | | | | (132 | ) | | | 1,547 | |
| Consumer loans | | | 2,371 | | | | — | | | | 2,371 | | | | 409 | | | | — | | | | 2,780 | | | | 1,886 | | | | — | | | | 1,886 | | | | 403 | | | | — | | | | 2,289 | |
| Mortgages | | | | | | | | | | | | | | | | | | | | | | | | | | | | | | | | | | | | | | | | | | | | | | | | |
| Prime | | | 4,416 | | | | 2,250 | | | | 6,666 | | | | 1,188 | | | | — | | | | 7,854 | | | | 4,424 | | | | 2,263 | | | | 6,687 | | | | 664 | | | | — | | | | 7,351 | |
| Non-conforming | | | 2,181 | | | | — | | | | 2,181 | | | | 727 | | | | — | | | | 2,908 | | | | 2,343 | | | | 234 | | | | 2,577 | | | | 740 | | | | — | | | | 3,317 | |
| Sub-prime | | | — | | | | — | | | | — | | | | — | | | | — | | | | — | | | | 9 | | | | 117 | | | | 126 | | | | 363 | | | | — | | | | 489 | |
| Commercial | | | 1,228 | | | | 507 | | | | 1,735 | | | | 66 | | | | (23 | ) | | | 1,778 | | | | 799 | | | | 1,094 | | | | 1,893 | | | | 168 | | | | (23 | ) | | | 2,038 | |
| Buy-to-let | | | — | | | | — | | | | — | | | | — | | | | — | | | | — | | | | — | | | | 61 | | | | 61 | | | | 8 | | | | — | | | | 69 | |
| CDOs | | | — | | | | — | | | | — | | | | — | | | | — | | | | — | | | | — | | | | 2,129 | | | | 2,129 | | | | 268 | | | | — | | | | 2,397 | |
| Other | | | 1,851 | | | | 2,130 | | | | 3,981 | | | | 1,615 | | | | — | | | | 5,596 | | | | 2,976 | | | | 2,947 | | | | 5,923 | | | | 2,433 | | | | — | | | | 8,356 | |
| | | | 33,545 | | | | 16,312 | | | | 49,857 | | | | 9,242 | | | | (226 | ) | | | 58,873 | | | | 29,046 | | | | 19,022 | | | | 48,068 | | | | 14,812 | | | | (257 | ) | | | 62,623 | |
Business reviewcontinued | Business review |
| Risk and balance sheet management |
| | | | |
| | | | | | Weighted Average life | | | Credt ratings (S&P equivalent) | |
| 2008 | | UK £m | | | Europe £m | | | US £m | | | ROW £m | | | Total £m | | | AAA £m | | | AA £m | | | | A £m | | | BBB £m | | | Below BBB £m | |
| Auto loans | | | 801 | | | | 1,706 | | | | 7,402 | | | | 398 | | | | 10,307 | | | | 1.7 | | | | 6,075 | | | | 883 | | | | 3,349 | | | | — | | | | — | |
| Corporate loans | | | 1,714 | | | | 4,347 | | | | 3,289 | | | | 2,122 | | | | 11,472 | | | | 4.9 | | | | 10,767 | | | | 132 | | | | 573 | | | | — | | | | — | |
| Credit card receivables | | | 633 | | | | — | | | | 4,999 | | | | 212 | | | | 5,844 | | | | 0.7 | | | | 3,465 | | | | 62 | | | | 2,171 | | | | 146 | | | | — | |
| Trade receivables | | | 68 | | | | 922 | | | | 1,371 | | | | 384 | | | | 2,745 | | | | 0.7 | | | | 120 | | | | 1,025 | | | | 1,600 | | | | — | | | | — | |
| Student loans | | | 144 | | | | — | | | | 2,411 | | | | — | | | | 2,555 | | | | 0.3 | | | | 2,296 | | | | 144 | | | | 115 | | | | — | | | | — | |
| Consumer loans | | | 708 | | | | 1,195 | | | | 468 | | | | — | | | | 2,371 | | | | 1.7 | | | | 387 | | | | 993 | | | | 923 | | | | 68 | | | | — | |
| Mortgages | | | | | | | | | | | | | | | | | | | | | | | | | | | | | | | | | | | | | | | | | | | | |
| Prime | | | — | | | | 2,244 | | | | — | | | | 4,422 | | | | 6,666 | | | | 2.8 | | | | 2,675 | | | | 3,876 | | | | 115 | | | | — | | | | — | |
| Non-conforming | | | 960 | | | | 1,221 | | | | — | | | | — | | | | 2,181 | | | | 4.6 | | | | 351 | | | | 368 | | | | 475 | | | | 987 | | | | — | |
| Sub-prime | | | — | | | | — | | | | — | | | | — | | | | — | | | | — | | | | — | | | | — | | | | — | | | | — | | | | — | |
| Commercial | | | 713 | | | | 453 | | | | 74 | | | | 495 | | | | 1,735 | | | | 11.0 | | | | 274 | | | | 518 | | | | 474 | | | | 469 | | | | — | |
| Buy-to-let | | | — | | | | — | | | | — | | | | — | | | | — | | | | — | | | | — | | | | — | | | | — | | | | — | | | | — | |
| CDOs | | | — | | | | — | | | | — | | | | — | | | | — | | | | — | | | | — | | | | — | | | | — | | | | — | | | | — | |
| Other | | | 166 | | | | 1,198 | | | | 684 | | | | 1,933 | | | | 3,981 | | | | 3.5 | | | | 3 | | | | 958 | | | | 2,786 | | | | 234 | | | | — | |
| | | | 5,907 | | | | 13,286 | | | | 20,698 | | | | 9,966 | | | | 49,857 | | | | 2.8 | | | | 26,413 | | | | 8,959 | | | | 12,581 | | | | 1,904 | | | | — | |
Risk management: Other risk exposurescontinued
Conduits continued
| | CP funded assets |
| | Geographic distribution | | Credit ratings (S&P equivalent) |
| | UK | Other Europe | US | RoW | Total | Weighted average life - years | AAA | AA | A | BBB | Below BBB |
| 2010 | £m | £m | £m | £m | £m | £m | £m | £m | £m | £m |
| Auto loans | 429 | 962 | 3,434 | 464 | 5,289 | 1.6 | 4,827 | 354 | 101 | 7 | — |
| Corporate loans | 22 | 1,513 | 709 | 211 | 2,455 | 0.8 | 2,166 | 161 | 128 | — | — |
| Credit card receivables | 144 | — | 1,944 | — | 2,088 | 1.4 | 1,912 | 125 | — | 51 | — |
| Trade receivables | — | 261 | 500 | — | 761 | 1.1 | 265 | 353 | 95 | 48 | — |
| Student loans | 116 | — | 641 | — | 757 | 1.9 | 641 | 116 | — | — | — |
| Consumer loans | 766 | 462 | 661 | — | 1,889 | 2.5 | 16 | — | 1,873 | — | — |
| Mortgages | | | | | | | | | | | — |
| - prime | 161 | — | — | 2,411 | 2,572 | 2.7 | 1,043 | 1,476 | 32 | 21 | — |
| - non-conforming | 712 | 659 | — | — | 1,371 | 4.8 | 782 | 273 | 316 | — | — |
| - sub-prime | 103 | — | — | — | 103 | 2.3 | — | 68 | — | 35 | — |
| - commercial | 627 | — | — | 33 | 660 | 11.8 | 16 | 5 | 635 | 4 | — |
| Other | 447 | 455 | 353 | 814 | 2,069 | 1.7 | 95 | 52 | 1,242 | 680 | — |
| | 3,527 | 4,312 | 8,242 | 3,933 | 20,014 | 2.3 | 11,763 | 2,983 | 4,422 | 846 | — |
| | | | | | | | | | | | |
| 2009 | | | | | | | | | | | |
| Auto loans | 476 | 982 | 2,621 | 570 | 4,649 | 1.8 | 2,965 | 1,547 | 137 | — | — |
| Corporate loans | 312 | 5,213 | 1,411 | 865 | 7,801 | 1.0 | 7,584 | 111 | 106 | — | — |
| Credit card receivables | 177 | — | 3,823 | 83 | 4,083 | 0.8 | 2,781 | 759 | 420 | 123 | — |
| Trade receivables | — | 334 | 438 | 34 | 806 | 0.7 | 446 | 266 | 60 | 34 | — |
| Student loans | 117 | — | 798 | — | 915 | 0.7 | 798 | 117 | — | — | — |
| Consumer loans | 733 | 800 | 153 | — | 1,686 | 1.5 | 68 | 50 | 1,553 | 15 | — |
| Mortgages | | | | | | | | | | | |
| - prime | 138 | — | — | 2,604 | 2,742 | 3.1 | 949 | 1,746 | 28 | 3 | 16 |
| - non-conforming | 599 | 949 | — | — | 1,548 | 3.7 | 1,070 | 379 | 99 | — | — |
| - commercial | 641 | 194 | — | 36 | 871 | 14.7 | 25 | 3 | 840 | — | 3 |
| Other | 121 | 670 | 298 | 1,176 | 2,265 | 2.3 | 170 | 249 | 950 | 896 | — |
| | 3,314 | 9,142 | 9,542 | 5,368 | 27,366 | 1.9 | 16,856 | 5,227 | 4,193 | 1,071 | 19 |
| | | | | | | | | | | | |
| 2008 | | | | | | | | | | | |
| Auto loans | 801 | 1,706 | 7,402 | 398 | 10,307 | 1.7 | 6,075 | 883 | 3,349 | — | — |
| Corporate loans | 1,714 | 4,347 | 3,289 | 2,122 | 11,472 | 4.9 | 10,767 | 132 | 573 | — | — |
| Credit card receivables | 633 | — | 4,999 | 212 | 5,844 | 0.7 | 3,465 | 62 | 2,171 | 146 | — |
| Trade receivables | 68 | 922 | 1,371 | 384 | 2,745 | 0.7 | 120 | 1,025 | 1,600 | — | — |
| Student loans | 144 | — | 2,411 | — | 2,555 | 0.3 | 2,296 | 144 | 115 | — | — |
| Consumer loans | 708 | 1,195 | 468 | — | 2,371 | 1.7 | 387 | 993 | 923 | 68 | — |
| Mortgages | | | | | | | | | | | |
| - prime | — | 2,244 | — | 4,422 | 6,666 | 2.8 | 2,675 | 3,876 | 115 | — | — |
| - non-conforming | 960 | 1,221 | — | — | 2,181 | 4.6 | 351 | 368 | 475 | 987 | — |
| - commercial | 713 | 453 | 74 | 495 | 1,735 | 11.0 | 274 | 518 | 474 | 469 | — |
| Other | 166 | 1,198 | 684 | 1,933 | 3,981 | 1.2 | 3 | 958 | 2,786 | 234 | — |
| | 5,907 | 13,286 | 20,698 | 9,966 | 49,857 | 3.0 | 26,413 | 8,959 | 12,581 | 1,904 | — |
Business reviewcontinued | Business review |
| Risk and balance sheet management |
Business review continued
| | | | |
| | | | | | Weighted average life £m | | | Credt ratings (S&P equivalent) | |
| | | UK £m | | | Europe £m | | | US £m | | | ROW £m | | | Total £m | | | AAA £m | | | AA £m | | | | A £m | | | BBB £m | | | Below BBB £m | |
| 2007 |
| Auto loans | | | 2,250 | | | | 1,259 | | | | 4,793 | | | | 341 | | | | 8,643 | | | | 1.9 | | | | 1,457 | | | | 3,184 | | | | 3,940 | | | | 62 | | | | — | |
| Corporate Loans | | | 1,127 | | | | 1,551 | | | | 4,658 | | | | 1,627 | | | | 8,963 | | | | 6.5 | | | | 8,838 | | | | 15 | | | | 110 | | | | — | | | | — | |
| Credit card receivables | | | 654 | | | | — | | | | 4,402 | | | | 138 | | | | 5,194 | | | | 1.0 | | | | 1,286 | | | | 913 | | | | 2,848 | | | | 147 | | | | — | |
| Trade receivables | | | 299 | | | | 816 | | | | 1,965 | | | | 309 | | | | 3,389 | | | | 0.9 | | | | 187 | | | | 732 | | | | 2,183 | | | | 236 | | | | 51 | |
| Student loans | | | 140 | | | | — | | | | 457 | | | | — | | | | 597 | | | | 1.6 | | | | 270 | | | | 311 | | | | 16 | | | | — | | | | — | |
| Consumer loans | | | 648 | | | | 724 | | | | 514 | | | | — | | | | 1,886 | | | | 1.2 | | | | 1,018 | | | | 473 | | | | 395 | | | | — | | | | — | |
| Mortgages | | | | | | | | | | | | | | | | | | | | | | | | | | | | | | | | | | | | | | | — | | | | — | |
| Prime | | | 276 | | | | 565 | | | | 983 | | | | 4,863 | | | | 6,687 | | | | 3.3 | | | | 1,896 | | | | 2,181 | | | | 2,610 | | | | — | | | | — | |
| Non-conforming | | | 1,675 | | | | 833 | | | | — | | | | 69 | | | | 2,577 | | | | 5.1 | | | | 268 | | | | 1,596 | | | | 713 | | | | — | | | | — | |
| Sub-prime | | | — | | | | — | | | | 9 | | | | 117 | | | | 126 | | | | 0.2 | | | | 117 | | | | — | | | | 9 | | | | — | | | | — | |
| Commercial | | | 1,023 | | | | 233 | | | | 198 | | | | 439 | | | | 1,893 | | | | 9.6 | | | | 746 | | | | 630 | | | | 401 | | | | 116 | | | | — | |
| Buy-to-let | | | 61 | | | | — | | | | — | | | | — | | | | 61 | | | | — | | | | 37 | | | | 24 | | | | | | | | — | | | | — | |
| CDOs | | | 137 | | | | 520 | | | | 1,473 | | | | — | | | | 2,130 | | | | 2.7 | | | | 2,115 | | | | 15 | | | | — | | | | — | | | | — | |
| Other | | | 579 | | | | 1,071 | | | | 1,950 | | | | 2,323 | | | | 5,923 | | | | 2.8 | | | | 2,362 | | | | 784 | | | | 2,652 | | | | 125 | | | | — | |
| | | | 8,869 | | | | 7,572 | | | | 21,402 | | | | 10,226 | | | | 48,069 | | | | 3.3 | | | | 20,597 | | | | 10,858 | | | | 15,877 | | | | 686 | | | | 51 | |
All the disclosures in this section (pages 161 to 164) are unaudited and are marked with an asterisk (*).
Structured investment vehicles (unaudited)
The Group does not sponsor any structured investment vehicles.References to 'Group' in this section relate to 'Group before RFS MI'.
Key aspects of the Scheme
Business review continued
Investment funds set up and managed byOn 22 December 2009, the Group (unaudited)
The Group’s investment funds are managed by RBSacceded to the Asset Management (RBSAM), which is an integrated asset management business, which manages investmentsProtection Scheme (APS or ‘the Scheme’) with HM Treasury (HMT) acting on behalf of third-party institutional and high net worth investors, as well as for the Group. RBSAM is active in most traditional asset classes and employs both fund of funds structures and multi-manager strategies. Its offering includes money market funds, long only funds and alternative investment funds.
Money market funds
The Group has established and manages a number of money market funds for its customers. When a new fund is launched, RBSAM as fund manager typically provides a limited amount of seed capital toUK Government. Under the funds. RBSAM does not have investments in these funds greater than £25 million. As RBSAM does not have holdings in these funds of significant size and as the risks and rewards of ownership are not withScheme, the Group these funds are not consolidated by the Group.
purchased credit protection over a portfolio of specified assets and exposures ("covered assets") from HMT. The funds have been authorised by the Irish Financial Services Regulatory Authority as UCITS pursuant to the UCITS Regulations (UCITS Regulations refer to the European Communities’ Undertakings for Collective Investment in Transferable Securities Regulations) and are therefore restricted in the typesportfolio of investments and borrowings they can make. The structurecovered assets had a par value of the assets within the funds is designed to meet the liabilities of the funds to their investors who have no recourse other than to the assets of the funds. The risks to the Group as a result are restricted to reputational damage if the funds were unable to meet withdrawals when requested on a timely basis or in full.
Money market funds had total assets of £13.6approximately £282 billion at 31 December 2008 (2007 – £11.2 billion)and the protection is subject to a first loss of £60 billion and covers 90% of subsequent losses net of recoveries. Once through the first loss, when a covered asset has experienced a trigger event losses and recoveries in respect of that asset are included in the balance receivable under APS. Receipts from HMT will, over time, amount to 90% of cumulative losses (net of cumulative recoveries) on the portfolio of covered assets less the first loss amount.
The Group has the right to terminate the Scheme at any time provided that the Financial Services Authority has confirmed in writing to HMT that it has no objection. On termination, the Group is liable to pay HMT a termination fee. The termination fee comprises the difference between £2.5 billion (or, if higher, a sum related to the economic benefit of regulatory capital relief obtained from APS) and the aggregate fees paid. In addition, the Group would have to repay any amounts received from HMT under the terms of APS. In consideration for the protection provided by the APS, the Group paid an initial premium of £1.4 billion on 31 December 2009. A further premium of £700 million was paid on 31 December 2010. The sub categoriesQuarterly premiums of money market funds are:£125 million are payable from 31 December 2011 and subsequently until the earlier of 31 December 2099 and the termination of the agreement.
Losses are recognised when a covered asset has experienced a trigger event which comprises of failure to pay subject to grace periods, bankruptcy and restructuring.
APS assets are spread across the Group’s main divisions. High volume commercial and retail exposures were selected on a portfolio basis where assets were high risk and in arrears at 31 December 2008. Large corporate and GBM exposures were selected at the counterparty/asset level based on individual risk reviews and defaulted assets in the workout/restructuring unit.
HMT has the right to appoint step-in managers to carry out any oversight, management or additional functions on behalf of HMT to ensure that the covered assets are managed and administered in compliance with the agreed terms and conditions. This right is exercisable if certain step-in triggers occur. These include:
| · | £8.0 billion (2007 – £5.1 billion)losses on covered assets in Money Funds denominatedtotal exceed 125% of the first loss amount or losses on an individual covered asset class exceed specified thresholds; |
| · | a breach of specified obligations in sterling, US dollarsthe APS rules or the accession agreement; |
| · | the Group has failed or is failing to comply with any of the conditions in the APS rules in relation to asset management, monitoring and euro, which investreporting, and governance and oversight, and such failure is persistent and material or it is evidence of a systematic problem; and |
| · | material or systematic data deficiencies in short-dated, highly rated money market securitiesthe information provided to HMT in accordance with the objectiveterms of providing security, performancethe APS. |
HMT may at any time elect to cease to exercise its step-in rights in whole or part when it is satisfied that the step-in triggers have been remedied.
* unaudited
Business reviewcontinued | Business review |
| Risk and liquidity.balance sheet management |
Risk management: Asset Protection Scheme*continued
Covered assets: roll forward to 31 December 2010
The table below details the movement in covered assets in the year.
| £bn |
| Covered assets at 1 January 2009 | 282.0 |
| Disposals | (3.0) |
Non-contractual early repayments | (8.9) |
| Maturities and amortisation | (26.1) |
| Rollovers and covered amount cap adjustments | (1.7) |
| Effect of foreign currency movements and other adjustments | (11.8) |
| Covered assets at 31 December 2009 | 230.5 |
| Disposals | (9.7) |
| Maturities, amortisation and early repayments | (28.7) |
Reclassified assets (2) | 3.1 |
| Withdrawals | (2.9) |
| Effect of foreign currency movements and other adjustments | 2.4 |
| Covered assets at 31 December 2010 | 194.7 |
| (1) | The Asset Protection Agency (APA) and the Group have now reached agreement on substantially all eligibility issues. |
| (2) | In Q2 2010, the APA and the Group reached agreement over the classification of some structured credit assets which resulted in adjustments to the covered amount, without affecting the underlying risk protection. |
Key points
| · | The reduction in covered assets was due to run-off of the portfolio, disposals, early repayments and maturing loans. |
| · | £4.9As part of the Group’s risk reduction strategy significant disposals were made from the Structured Credit Portfolio (2010 - £3.0 billion). The Group took advantage of market conditions and executed sales from its derivative, loan and leveraged finance portfolios (2010 - £6.7 billion). |
Credit impairments and write downs
The table below analyses the cumulative credit impairment losses and adjustments to par value (including AFS reserves) relating to the covered assets.
| | 2010 | 2009 | 2008 |
| | £m | £m | £m |
| Loans and advances | 18,033 | 14,240 | 7,705 |
| Debt securities | 11,747 | 7,816 | 7,942 |
| Derivatives | 2,043 | 6,834 | 6,575 |
| | 31,823 | 28,890 | 22,222 |
| | | | |
| By division: | | | |
| UK Retail | 2,964 | 2,431 | 1,492 |
| UK Corporate | 1,382 | 1,007 | 285 |
| Ulster Bank | 804 | 486 | 234 |
| Retail & Commercial | 5,150 | 3,924 | 2,011 |
| Global Banking & Markets | 1,496 | 1,628 | 1,640 |
| Core | 6,646 | 5,552 | 3,651 |
Non-Core | 25,177 | 23,338 | 18,571 |
| | 31,823 | 28,890 | 22,222 |
Key points
| · | The increase in Non-Core impairments of £1.8 billion (2007 – £5.5 billion)accounted for the majority of the increase in multi-manager money market funds denominatedcredit impairments and write downs in sterling, US dollars and euro, which invest in short dated, highly rated securities.2010. |
| · | £0.7 billion (2007 – £0.6 billion)The APA and the Group reached agreement for the purposes of the Scheme, on the classification of some structured credit assets which has resulted in Money Funds Plus denominated in sterling, US dollarsadjustments to credit impairments and euro, which invest in longer-dated, highly ratedwrite downs mainly between debt securities with the objective of providing security, enhanced performance and liquidity. |
derivatives.Non-money market funds
RBSAM has also established a number of non-money market funds to enable investors to invest in a range of assets including bonds, equities, hedge funds, private equity and real estate. The Group does not have investments in these funds greater than £200 million. As RBSAM does not have holdings in these funds of significant size and as the risks and rewards of ownership are not with the Group, these funds are not consolidated by the Group.
The non-money market funds had total assets of £18.7 billion at 31 December 2008 (31 December 2007 – £19.4 billion). The sub categories of non-money market funds are:
· | £16.0 billion (2007 – £17.0 billion) in multi-manager funds, which offer fund of funds products across bond, equity, hedge fund, private equity and real estate asset classes. |
| · | £1.6 billion (2007 – £1.3 billion)The reduction in committed capitalGBM is largely a result of transfers to private equity investments, which invests primarilyNon-Core in equitythe second half of the year. |
* unaudited
Business reviewcontinued | Business review |
| Risk and balance sheet management |
Risk management: Asset Protection Scheme*continued
First loss utilisation
The triggered amount is equivalent to the aggregate outstanding principal amount on the trigger date excluding interest, fees, premium or any other non-principal sum that is accrued or payable, except where it was capitalised on or before 31 December 2008. At the trigger date, in economic terms, there is an exchange of assets, with the Group receiving a two year interest-bearing government receivable in exchange for the asset.
APS recoveries include any return of value on a triggered asset, although these are only recognised for the Scheme reporting purposes when they are realised in cash. The net triggered amount at any point in time only takes into account cash recoveries to date. As with any bespoke and highly complex legal agreement there are various areas of interpretation, some of which could have a material impact on the net triggered amount identified to date.
The Scheme rules are designed to allow for data correction over the life of the Scheme.
The table below summarises the triggered amount and related cash recoveries by division.
| | 2010 | | 2009 |
| | Triggered amount | Cash recoveries to date | Net triggered amount | | Triggered amount | Cash recoveries to date | Net triggered amount |
| | £m | £m | £m | | £m | £m | £m |
| UK Retail | 3,675 | 455 | 3,220 | | 3,340 | 129 | 3,211 |
| UK Corporate | 4,640 | 1,115 | 3,525 | | 3,570 | 604 | 2,966 |
| Ulster Bank | 1,500 | 160 | 1,340 | | 704 | 47 | 657 |
| Retail & Commercial | 9,815 | 1,730 | 8,085 | | 7,614 | 780 | 6,834 |
| Global Banking & Markets | 2,547 | 749 | 1,798 | | 1,748 | 108 | 1,640 |
| Core | 12,362 | 2,479 | 9,883 | | 9,362 | 888 | 8,474 |
Non-Core | 32,138 | 4,544 | 27,594 | | 18,905 | 777 | 18,128 |
| | 44,500 | 7,023 | 37,477 | | 28,267 | 1,665 | 26,602 |
| Loss credits | | | 1,241 | | | | — |
| | | | 38,718 | | | | 26,602 |
| (1) | The triggered amount on a covered asset is calculated when an asset is triggered (due to bankruptcy, failure to pay after a grace period or restructuring with an impairment) and is the lower of the covered amount and the outstanding amount for each covered asset. The Group expects additional assets to trigger upon expiry of relevant grace periods based on the current risk rating and level of impairments on covered assets. |
| (2) | Following the reclassification of some structured credit assets from derivatives to debt securities, the APA and the Group also reached agreement on an additional implied write down trigger in respect of private companies.these assets. This occurs if (a) on two successive relevant payment dates, the covered asset has a rating of Caa2 or below by Moody’s, CCC or below by Standard & Poor’s or Fitch or a comparable rating from an internationally recognised credit rating agency and/or (b) on any two successive relevant payment dates, the mark-to-market value of the covered asset is equal to or less than 40 per cent of the par value of the covered asset, in each case as at such relevant payment date. |
| (3) | Under the Scheme rules, the Group may apply to the APA for loss credits in respect of the disposal of non-triggered assets. A loss credit counts towards the first loss threshold and is typically determined by the APA based on the expected loss of the relevant asset. |
| (4) | The Group and the APA remain in discussion with regard to loss credits in relation to the withdrawal of £2.0 billion of derivative assets during Q2 2010 and the disposal of approximately £1.6 billion of structured finance and leveraged finance assets in 2010. |
| (5) | The Scheme rules contain provision for on-going revision of data. |
Key points
| · | The Group received loss credits in relation to some of the withdrawals and disposals of £1.2 billion in 2010. |
| · | The Group currently expects recoveries on triggered amounts to be approximately 45% over the life of the relevant assets. On this basis, the expected loss on triggered assets at 31 December 2010 is approximately £25 billion (42%) of the £60 billion first loss threshold under APS. |
* unaudited
·Business reviewcontinued | £1.1 billion (2007 – £1.1 billion) in credit investments, which invests in various financial instruments.Business review |
| Risk and balance sheet management |
Risk management: Asset Protection Scheme*continued
Risk-weighted assets
The table below analyses by division, risk-weighted assets (RWAs) covered by APS.
| | 2010 | 2009 |
| | £bn | £bn |
| UK Retail | 12.4 | 16.3 |
| UK Corporate | 22.9 | 31.0 |
| Ulster | 7.9 | 8.9 |
| Retail & Commercial | 43.2 | 56.2 |
| Global Banking & Markets | 11.5 | 19.9 |
| Core | 54.7 | 76.1 |
Non-Core | 50.9 | 51.5 |
| APS RWAs | 105.6 | 127.6 |
Key points
· The decrease of £22.0 billion in RWAs reflects disposals and early repayments as well as changes in risk parameters.
· In Non-Core, disposals and early repayments were offset by changes in risk parameters.
* unaudited
The structure of the assets within the funds is designed to meet the liabilities of the funds to their investors who have no recourse other than to the assets of the funds. The risks to the Group as a result are restricted to reputational damage if the funds were unable to meet withdrawals when requested on a timely basis or in full, and the Group’s own investment in the funds.
The Group’s maximum exposure to non-money market funds is represented by the investment in the shares of each fund and was £200 million at 31 December 2008 (2007 – £171 million).
Governance
125166 | |
127168 | |
| 170 | Report of the directors |
133175 | |
140187 | |
141189 | |
153205 | |
154206 | |
| Board of directors and secretary
Chairman
Philip Hampton (age 57)
N (Chairman)
Appointed to the Board on 19 January 2009 and to the position of Chairman on 3
February 2009. Philip Hampton was previously chairman of J Sainsbury plc and
group finance director of Lloyds TSB Group plc, BT Group plc, BG Group plc,
British Gas and British Steel plc, an executive director of Lazards and a
non-executive director of RMC Group plc. He is also former chairman of UK
Financial Investments Limited which manages the UK Government's shareholding in
banks. He is currently a non-executive director of Anglo American plc.
Key to pictures
1. Philip Hampton, Chairman
2. Stephen Hester, Group Chief Executive
3. Bruce Van Saun, Group Finance Director
4. Colin Buchan
5. Sandy Crombie
6. Penny Hughes
7. Joe MacHale
8. John McFarlane
9. Brendan Nelson 10. Arthur 'Art' Ryan 11. Philip Scott 12. Aileen Taylor
Abbreviations
A Member of the Audit Committee N Member of the Nominations Committee R Member
of the Remuneration Committee Ri Member of the Board Risk Committee
* Independent non-executive director
Executive directors
Stephen Hester (age 50)
Group Chief Executive
Appointed to the Board on 1 October 2008 and to the position of Group Chief
Executive on 21 November 2008, Stephen Hester was chief executive of The
British Land Company PLC. He was previously chief operating officer of Abbey
National plc and prior to that he held positions with Credit Suisse First
Boston including Chief Financial Officer, Head of Fixed Income and co-Head of
European Investment Banking. From February 2008 to October 2008 he served as a
non-executive deputy chairman of Northern Rock plc. He is also a trustee of The
Foundation and Friends of the Royal Botanical Gardens, Kew.
Bruce Van Saun (age 53)
Group Finance Director
Appointed to the Board on 1 October 2009, Bruce Van Saun has more than 25 years
financial services experience. From 1997 to 2008 he held a number of senior
positions with Bank of New York and later Bank of New York Mellon, most
recently as vice chairman and chief financial officer and before that he was
responsible for the Asset Management and Market Related businesses. Prior to
that, he held senior positions with Deutsche Bank, Wasserstein Perella Group
and Kidder Peabody and Co. He has served on several corporate boards as a
non-executive director and has been active in numerous community
organisations.
Group Secretary
Aileen Taylor (age 38)
Aileen Taylor assumed the role of Group Secretary in May 2010 and provides
secretariat and corporate governance advice and support to the Group Board and
its senior Committees. Aileen was appointed Deputy Group Secretary and Head of
Group Secretariat in 2007, and prior to that held various legal, secretariat
and risk roles at divisional and business level. Aileen is a Fellow of the
Chartered Institute of Bankers in Scotland and a Fellow of the Industry and
Parliament Trust.
|
Executive directors
Appointed to the Board on 1 October 2008 and as Group Chief Executive on 21 November 2008, Stephen Hester was chief executive of The British Land Company PLC. He was previously chief operating officer of Abbey National plc and prior to that he held positions with Credit Suisse First Boston including Chief Financial Officer, Head of Fixed Income and co-Head of European Investment Banking. In February 2008, he was appointed non-executive deputy chairman of Northern Rock plc, a position he relinquished on 1 October 2008. He is also a trustee of The Foundation and Friends of the Royal Botanical Gardens, Kew.

Appointed to the Board in March 2000, Gordon Pell was formerly group director of Lloyds TSB UK Retail Banking before joining National Westminster Bank Plc as a director in February 2000 and then becoming Chief Executive, Retail Banking. He is also a director of Race for Opportunity and a member of the FSA Practitioner Panel. He was appointed chairman of the Business Commission on Racial Equality in the Workplace in July 2006 and deputy chairman of the Board of the British Bankers Association in September 2007.
Appointed to the Board in February 2006, Guy Whittaker joined RBS after spending 25 years with Citigroup where he was the group treasurer based in New York and prior to that had held a number of management positions within the financial markets business based in London.
Key to abbreviations
A member of the Audit Committee
N member of the Nominations Committee
R member of the Remuneration Committee
* independent non-executive director
Non-executive directors
|
Governance
Non-executive directors
Colin Buchan* (age 56) A, N, Ri
Appointed to the Board in June 2002, Colin Buchan was educated in South Africa
and spent the early part of his career in South Africa and the Far East. He has
considerable international investment banking experience, as well as experience
in very large risk management in the equities business. He was formerly a
member of the group management board of UBS AG and head of equities of UBS
Warburg, and was the former chairman of UBS Securities Canada Inc. He is
chairman of Standard Life Investments Limited and a director of Standard Life
plc and Black Rock World Mining Trust Plc. Colin is a fellow of the Chartered
Institute of Bankers of Scotland.
Sandy Crombie* (age 62) Senior Independent Director, N, R, Ri
Appointed to the Board in June 2009, Sandy Crombie was previously Group Chief
Executive of Standard Life Plc. He was also previously a director of the
Association of British Insurers and a member of the Chancellor of the
Exchequer's High Level Group. In 2007, he was the Prince of Wales' Ambassador
for Corporate Social Responsibility in Scotland. He currently serves as
Chairman of the Edinburgh UNESCO City of Literature Trust and Creative
Scotland, as Vice Chairman of the Board of Governors of the Royal Scottish
Academy of Music and Drama, and President of The Cockburn Association.
Penny Hughes* (age 51) N, R (Chair)
Penny Hughes joined the Board on 1 January 2010 and is currently a
non-executive director of Home Retail Group plc, Cable and Wireless Worldwide plc
and Wm Morrison Supermarkets plc. She is a former non-executive director of Gap
Inc, Vodafone PLC and Reuters PLC. Penny chairs the Remuneration Committee of
Home Retail Group. Penny was a director and chairman of the Remuneration
Committee of Skandinaviska Enskilda Banken AB until she stepped down on 20
October 2009. Penny spent the majority of her executive career at Coca-Cola
where she held a number of leadership positions. In 1992, she was appointed as
President, Coca-Cola Great Britain and Ireland. She is also a Trustee of the
British Museum and President of the Advertising Association.
Joe MacHale* (age 59) N, Ri
Appointed to the Board in September 2004, Joe MacHale is currently a
non-executive director and chairman of the remuneration committee of Brit
Insurance Holdings plc, and a trustee and treasurer of MacMillan Cancer
Support. He held a number of senior executive positions with J P Morgan between
1979 and 2001 and was latterly chief executive of J P Morgan Europe, Middle
East and Africa Region. He is a fellow of the Institute of Chartered
Accountants and the Chairman of Prytania Group.
John McFarlane* (age 63) N, R
Appointed to the Board on 1 October 2008, John McFarlane is former chief
executive officer of Australia and New Zealand Banking Group Limited.
Previously he was a group executive director of Standard Chartered and was head
of Citicorp/Citibank in the UK and Ireland. He is currently a non-executive
director of Westfield Holdings Limited and a director of Old Oak Holdings
Limited. He is a former president of the International Monetary Conference and
a former chairman of the Australian Bankers Association. He has previously
served as a director of the London Stock Exchange and a member of the Auditing
Practices Board.
Brendan Nelson* (age 61) A (Chairman), N, Ri
Appointed to the Board on 1 April 2010, Brendan Nelson is the former global
chairman, Financial Services for KPMG. Previously, he held a range of senior
leadership roles within KPMG including as a member of the KPMG UK board from
1999 until 2006 and as vice chairman from 2006. He has been a board member of
the Financial Services Skills Council since 2008 and was chairman of the Audit
Committee of the Institute of Chartered Accountants of Scotland from 2005 until
2008. He joined the Board of BP plc in November 2010.
Arthur 'Art' Ryan* (age 68) N
Appointed to the Board on 1 October 2008, Art Ryan is the former chairman,
chief executive officer and president of Prudential Financial Inc. Previously
he held senior positions with Chase Manhattan Bank NA. He is currently a
non-executive director of Regeneron Pharmaceuticals Inc. and an active member
of numerous community boards. He was a founding member of the Financial
Services Forum.
Philip Scott* (age 56) A, N, Ri (Chairman)
Appointed to the Board on 1 November 2009, Philip Scott has wide-ranging
experience of financial services and risk management, including previous
responsibility for Aviva's continental European and international life and
long-term savings businesses. He held a number of senior executive positions
during his career at Aviva, including his role as Group Finance Director until
January 2010.-Philip is also an experienced non-executive director and is
currently on the board of Diageo plc. He is a Fellow of the Institute of
Actuaries and The Association of Certified Public Accountants.
|
|
The Executive Committee provides executive input to the Group Board, and
monitors and reports to the Group Board on all operational and day to day
activities in relation to the Group's businesses.
It is responsible for managing Group wide issues and those operational issues
material to the broader Group.
Key to pictures
1 Stephen Hester, Group Chief Executive
2 Bruce Van Saun, Group Finance Director
3 Ellen Alemany, Chief Executive, Citizens and Head of Americas
4 Nathan Bostock, Head of Restructuring and Risk
5 Paul Geddes, Chief Executive, RBS Insurance
6 Brian Hartzer, Chief Executive, UK Retail, Wealth and Ulster Bank
7 John Hourican, Chief Executive, Global Banking and Markets
8 Chris Sullivan, Chief Executive, UK Corporate
9 Ron Teerlink, Chief Administrative Officer
|
|
Governance
Executive Committee
Stephen Hester, Group Chief Executive
Bruce Van Saun, Group Finance Director M For biographies see page166
Ellen Alemany (age 55)
Chief Executive, Citizens and Head of Americas
Ellen Alemany joined the RBS Group in June 2007 as Chief Executive Officer of
Citizens Financial Group, Inc. and Head of RBS Americas. She became Chairman of
Citizens Financial Group, Inc. in March 2009. Prior to this appointment, Ellen
was the CEO for Global Transaction Services at Citigroup, one of Citi's 12
publicity reported product lines. Ellen joined Citibank in 1987 and has held
various positions including EVP for Commercial Business Group, Chairman and CEO
for Citibank International plc and Citibank's European Bank.
Nathan Bostock (age 50) Head of Restructuring and Risk
Nathan Bostock joined the RBS Group in June 2009 as Head of Restructuring and
Risk with responsibility for the Non-Core Division and APS, the Global
Restructuring Group and the control functions of Group Legal and Secretariat and
Risk Management. Before joining RBS, Nathan spent eight years with Abbey
National plc in several roles and was latterly the CFO and main Board Director
responsible for Products and Marketing, HR, Insurance and Cards. Before joining
Abbey in 2001, Nathan spent ten years with RBS in a number of roles, including
Chief Operating Officer of Treasury and Capital Markets and Group Risk
Director. A Chartered Accountant, Nathan worked with Coopers and Lybrand, before
starting his career in banking. He spent seven years in Chase Manhattan Bank in
a variety of areas and functions. He also holds a BSc (Hons) in Mathematics.
Paul Geddes (age 41)
Chief Executive, RBS Insurance
Paul Geddes graduated from Oxford in 1990, where he read Politics, Philosophy
and Economics. His career started at Procter and Gamble, in the UK and Europe. He
entered retailing in 1997, holding senior roles in Kingfisher and GUS Groups
before joining the RBS Group in 2004 as Managing Director, Products and
Marketing, Retail Banking. He was appointed CEO, Retail Banking in December
2006 and CEO, UK Retail in February 2009, before taking overall responsibility
for some of the UK's best-known insurance brands, including Direct Line,
Churchill, Privilege and Green Flag as CEO, RBS Insurance in August 2009. Paul
is a Fellow of the Chartered Institute of Bankers in Scotland.
Brian Hartzer (age 44)
Chief Executive, UK Retail, Wealth and Ulster Bank
Brian Hartzer has been the Chief Executive Officer for Retail, Wealth and
Ulster Bank since August 2009. He joined RBS from ANZ in Australia, where he
was Chief Executive Officer Australia, as well as Global Segment Lead for
Retail and Wealth. Brian joined ANZ in 1999 as Managing Director, Consumer
Finance, and later ran ANZ's Personal Banking division. Prior to joining ANZ,
Brian spent ten years as a financial services consultant in New York, San
Francisco, and Melbourne. Brian is a graduate of Princeton University and holds
joint US and Australian citizenship.
John Hourican (age 40)
Chief Executive, Global Banking and Markets
John Hourican was appointed Chief Executive of Global Banking and Markets in
October 2008. Prior to this John held a variety of positions across the RBS
Group, including CFO of ABN AMRO Group, Head of Leveraged Finance and Chief
Operating Officer of Global Banking and Markets. John was educated at the
National University of Ireland and received his Postgraduate Diploma from
Dublin City University before starting his career at Price Waterhouse, where he
worked in Dublin, London and Hong Kong. He is a fellow of the Institute of
Chartered Accountants in Ireland.
Chris Sullivan (age 53) Chief Executive, UK Corporate
Chris Sullivan was appointed Chief Executive of the UK Corporate Banking
Division and the GTS Division in August 2009. His previous role was Chief
Executive of RBS Insurance, the second largest general insurance provider in
the UK. Prior to this, Chris was Chief Executive of Retail and Deputy Chief
Executive of Retail Markets. Chris is Vice Chairman of the Association of
British Insurers, Chairman of the General Insurance Council and a member of the
CBI President's Committee. He spent five years as Chief Executive of Lombard
Asset Finance and under his leadership it attained a leading position in the UK
and Europe. Chris Sullivan earned his Fellowship of Chartered Institute of
Bankers Scotland for his services to Scottish Banking.
Ron Teerlink (age 50) Chief Administrative Officer
In April 2008, Ron Teerlink joined the RBS Group as Chief Executive of Business
Services, becoming the Group Chief Administrative Officer in February 2009. At
the same time he was re-appointed to the Managing Board of ABN AMRO to oversee
the integration programme. Ron started his career with ABN Bank in 1986 as an
IT/Systems analyst and held various functional positions before becoming Chief
Operating Officer of the Wholesale Clients Business in 2002. He was appointed
Chief Executive Officer of Group Shared Services in 2004 and joined ABN AMRO's
Managing Board in January 2006, where he was responsible for Services and
Market Infrastructure. Ron holds a Masters degree in Economics from Amsterdam's
Vrije Universiteit.
Management Committee
The Management Committee, comprising our major business and functional leaders,
meets three to four times annually as a vehicle for strategy and business
performance review.
It comprises members of the Executive Committee plus:
Elaine Arden, Group Human Resources Director
Scott Barton, Chief Executive, Global Transaction Services Chris Campbell,
Group General Counsel
Mark Catton, Chief Executive, UK Corporate and Institutional Banking Rory
Cullinan, Head of Non-Core Division John Cummins, Group Treasurer Jennifer
Hill, Group Director -- Strategy and Corporate Finance Suneel Kamlani, President
of Global Banking and Markets Marco Mazzucchelli, Global Head of Banking and Deputy
CEO, GBM Cormac McCarthy, Chief Executive, Ulster Bank John McCormick, Chief
Executive, GBM Asia Pacific Andrew McLaughlin, Head of Communications and Group
Chief Economist Peter Nielsen, Global Head of Markets David Stephen, Deputy
Group Chief Risk Officer Brian Stevenson, Chairman, Global Transaction Services
Rory Tapner, Chief Executive, Wealth Management
|

| Report of the directors | Governance |
The directors present their report together with the audited accounts for the year ended 31 December 2010.
Group structure
The company is a holding company owning the entire issued ordinary share capital of The Royal Bank of Scotland plc, the principal direct operating subsidiary undertaking of the company. The Group comprises the company and all its subsidiary and associated undertakings, including the Royal Bank and NatWest. Details of the principal subsidiary undertakings of the company are shown in Note 18 on the accounts.
Following placing and open offers in December 2008 and in April 2009, HM Treasury owned approximately 70.3% of the enlarged ordinary share capital of the company. In December 2009, the company issued a further £25.5 billion of new capital to HM Treasury. This new capital took the form of B shares, which do not generally carry voting rights at general meetings of ordinary shareholders but are convertible into ordinary shares and qualify as Core Tier 1 capital.
During the year, the company converted certain non-cumulative convertible preference shares into ordinary shares in the company. As a result, HM Treasury’s holding in the company’s ordinary shares reduced to 67.8%.
Results and dividends
The loss attributable to the ordinary and B shareholders of the company for the year ended 31 December 2010 amounted to £1,125 million compared with a loss of £3,607 million for the year ended 31 December 2009, as set out in the consolidated income statement on page 209.
The company did not pay a dividend on ordinary shares in 2009 or 2010.
The Group has undertaken that, unless otherwise agreed with the European Commission, neither the company nor any of its direct or indirect subsidiaries (other than companies in the RBS Holdings N.V. group, which are subject to different restrictions, see below) will pay external investors any dividends or coupons on existing hybrid capital instruments (including preference shares, B shares and upper and lower tier 2 instruments) for a period of two years from 30 April 2010 (the “Deferral Period”), or exercise any call rights in relation to these capital instruments between 24 November 2009 and the end of the Deferral Period, unless there is a legal obligation to do so. Hybrid capital instruments issued after 24 November 2009 will generally not be subject to the restriction on dividend or coupon payments or call options.
The Group has agreed that RBS Holdings N.V. will not pay investors any coupons on, or exercise any call rights in relation to, specified hybrid capital instruments for an effective period of two years from 1 April 2011, unless in any such case there is a legal obligation to do so. RBS Holdings N.V. and its group companies are also subject to restrictions on the exercise of call rights in relation to their other hybrid capital instruments.
Business review
Activities
The Group is engaged principally in providing a wide range of banking, insurance and other financial services. Further details of the organisational structure and business overview of the Group, including the products and services provided by each of its divisions and the competitive markets in which they operate, are contained in the Business review on pages 5 and 6.
Risk factors
The Group’s future performance and results could be materially different from expected results depending on the outcome of certain potential risks and uncertainties. Certain risk factors the Group faces are summarised on page 7. Fuller details of these and other risk factors are set out on pages 352 to 369.
The reported results of the Group are also sensitive to the accounting policies, assumptions and estimates that underlie the preparation of its financial statements. Details of the Group’s critical accounting policies and key sources of accounting judgments are included in Accounting policies on pages 216 to 227.
The Group’s approach to risk management, including its financial risk management objectives and policies and information on the Group’s exposure to price, credit, liquidity and cash flow risk, is discussed in the Risk and balance sheet management section of the Business review on pages 59 to 164.
Financial performance
A review of the Group's performance during the year ended 31 December 2010, including details of each division, and the Group's financial position as at that date is contained in the Business review on pages 8 to 58.
ABN AMRO
In 2007, RFS Holdings B.V., which was jointly owned by the Group, the Dutch State (successor to Fortis) and Santander (the “Consortium Members”) completed the acquisition of ABN AMRO Holding N.V..
RFS Holdings B.V. has now substantially completed the separation of the business units of ABN AMRO Holding N.V.. As part of this reorganisation, on 6 February 2010, the businesses of ABN AMRO Holding N.V. acquired by the Dutch State were legally demerged from those acquired by the Group and were transferred into a newly established company, ABN AMRO Bank N.V. (save for certain assets and liabilities acquired by the Dutch State that were not part of the legal separation and which will be transferred to the Dutch State as soon as possible).
Legal separation of ABN AMRO Bank N.V. occurred on 1 April 2010, with the shares in that entity being transferred by ABN AMRO Holding N.V (renamed RBS Holdings N.V. at legal separation) to a holding company called ABN AMRO Group N.V., which is owned by the Dutch State. Following legal separation, RBS Holdings N.V. has one direct subsidiary, The Royal Bank of Scotland N.V. (“RBS N.V.”), a fully operational bank within the Group. RBS N.V. is independently rated and regulated by the Dutch Central Bank. Certain assets within RBS N.V. continue to be shared by the Consortium Members.
The shareholdings of RFS Holdings B.V. were amended on 31 December 2010, resulting in approximately 98% of its issued share capital now being held by the Group.
Report of the directors continued | Governance |
Business divestments
Significant progress has been made on the Group’s European Commission-mandated disposal programme, with three of the four disposals largely agreed. In August 2010, agreement was reached on the sale of the Group’s RBS branches in England and Wales and NatWest branches in Scotland to Santander UK plc. The sale remains subject to regulatory and other approvals.
The sale of 80.01% of the Global Merchant Services (“GMS”) business to a consortium of Advent International and Bain Capital completed in November 2010. The Group holds a 19.99% minority stake in the new GMS business, to be known as WorldPay.
The sale of RBS Sempra Commodities’ Metals, Oil and European Energy business lines to J.P.Morgan completed in July 2010. The sale of Sempra Energy Solutions to Noble Americas Gas & Power Corp completed in November 2010, while the sale of Sempra North American Power and Gas to J.P.Morgan completed in December 2010.
Employees
As at 31 December 2010, the Group employed over 148,500 employees (full-time equivalent basis) throughout the world. Details of employee related costs are included in Note 3 on the accounts.
Employee learning and development
The Group maintains a strong commitment to creating and providing learning opportunities for all its employees through a variety of personal development, training programmes, learning networks and targeted leadership programmes. Employees are also encouraged to do voluntary work with community partners.
Employee communication
Employee engagement is encouraged through a range of communication channels, at both divisional and Group level. These channels provide access to news and information in a number of ways, including the intranet, magazines, video, team meetings led by line managers, briefings held by senior managers and regular dialogue with employees and employee representatives.
The Group Chief Executive and other senior Group executives regularly communicate with, and encourage feedback from, employees across a range of channels.
Employee consultation
Each year, all employees are invited to complete the global employee opinion survey. The survey is confidential and independently managed by Towers Watson. The survey provides a channel for employees to express their views and opinions about the Group on a range of key issues.
The 2010 survey took place in September 2010 and the final response rate was 81%. This represents over 119,000 employees participating in the survey, from more than 50 countries.
The Group recognises employee representative organisations such as trade unions and work councils in a number of businesses and countries.
The Group has two European employee fora that provide elected representatives with an opportunity to understand better its European operations. Engagement with its employees and such bodies remains important to the Board in September 2004, Archie HunterGroup.
Diversity and inclusion
The Group recognises that the diversity of its workforce is a chartered accountant. He was Scottish senior partnersignificant and necessary asset to the business. During 2010, the Group executive renewed its commitment to ensuring a working environment that is inclusive to all and one that will enable all employees to develop to their full potential.
The Group has a range of KPMGpolicies and processes that extend through the employee life-cycle including recruitment, flexible working and support for ill-health and disability-related absence. Diversity performance is monitored and reviewed at Group and divisional executive level. This commitment extends beyond the Group including support of external charitable networks and fora and as part of the community engagement and supplier relationships. Internally, the Group supports initiatives such as the Women in Business network.
Safety, health and wellbeing
Ensuring the safety, health and wellbeing of employees and customers is core to the Group’s business, and a fundamental social responsibility for the Group.
During 2010, the Group continued to focus on compliance, governance and managing risk across all jurisdictions. Enhanced services and supporting communication were implemented to support the health and wellbeing of employees, particularly given the impact of the economic environment.
Pre-employment screening
The Group has a comprehensive pre-employment screening process to guard against possible infiltration and employee-related fraud for all direct and non-direct staff engaged on Group business.
Code of conduct
The code of conduct applies to all employees globally and to all those engaged by the Group, but who are not employees, such as contractors and those engaged through external agencies.
The code of conduct exists to promote honest and ethical conduct, including the handling of actual or apparent conflicts of interest between 1992personal and 1999professional relationships. The Group recognises that personal conduct, business integrity and presidentthe Group’s security are crucial, and the code of conduct serves to inform employees of the Group’s expectations of their behaviour and practices.
Report of the directors continued | Governance |
Sustainability
Sustainability is central to the way the Group is managed. Sustainability is not just about the many responsibilities and obligations that the Group has in a legal sense, but about specific issues that need to be addressed to ensure that the Group is a healthy and respected business operating on a sustainable basis. There is a clear governance structure for Group Sustainability that oversees and aligns the Group's approach to the range of social, ethical and environmental issues which confront the business on a daily basis.
The InstituteGroup continues to do significant work and address challenges across five key themes: Fair banking, Supporting enterprise, Employee engagement, Safety and security, and Citizenship and environmental sustainability.
Going concern
The Group’s business activities and financial position, the factors likely to affect its future development and performance and its objectives and policies in managing the financial risks to which it is exposed and its capital are discussed in the Business review. The risk factors which could adversely affect the Group’s future results are set out on pages 352 to 369. The Group’s regulatory capital resources and significant developments since 2009 and anticipated future developments are detailed in the Capital section on pages 66 to 73. The Funding and liquidity risk section, pages 74 to 82, describes the Group’s funding and liquidity profile, including changes in key metrics, the build up of Chartered Accountantsliquidity reserves and the outlook for 2011.
Having reviewed the Group’s forecasts, projections and other relevant evidence, the directors have a reasonable expectation that the Group and the company will continue in operational existence for the foreseeable future. Accordingly, the financial statements of Scotlandthe Group and of the company have been prepared on a going concern basis.
BBA disclosure code
In September 2010, the British Bankers’ Association published its Code for Financial Reporting Disclosure. The code sets out five disclosure principles together with supporting guidance. The principles are that the Group and other major UK banks will provide high quality, meaningful and decision-useful disclosures; review and enhance their financial instrument disclosures for key areas of interest to market participants; assess the applicability and relevance of good practice recommendations to their disclosures acknowledging the importance of such guidance; seek to enhance the comparability of financial statement disclosures across the UK banking sector; and clearly differentiate in 1997/1998. He has extensive professional experiencetheir annual reports between information that is audited and information that is unaudited. The Group’s 2010 financial statements have been prepared in compliance with the code’s principles.
Corporate governance
The company is committed to high standards of corporate governance. Details are given on pages 175 to 186. The corporate governance statement forms part of this Report of the directors.
Share capital
Details of the ordinary share capital and preference share capital at 31 December 2010 and movements during the year, are shown in Note 29 on the accounts.
Additional information
Where not provided elsewhere in the Report of the directors, the following additional information is required to be disclosed by Part 6 of Schedule 7 to the Large and Medium-sized Companies and Groups (Accounts and Reports) Regulations 2008.
The rights and obligations attaching to the company’s ordinary shares and preference shares are set out in the company’s Articles of Association, copies of which can be obtained from Companies House in the UK and North and South America. He is currently chairmanor at www.rbs.com.
On a show of Macfarlane Group plc,hands at a director of Edinburgh US Tracker Trust plc and a governorgeneral meeting of the Beatson Institutecompany every holder of ordinary shares and cumulative preference shares present in person or by proxy and entitled to vote shall have one vote. On a poll, every holder of ordinary shares present in person or by proxy and entitled to vote shall have one vote for Cancer Research.every share held. On a poll, holders of cumulative preference shares present in person or by proxy and entitled to vote shall have four votes for every share held. The voting rights of holders of non-cumulative preference shares are set out in Note 29 on the accounts. The notices of Annual General Meetings and General Meetings specify the deadlines for exercising voting rights and appointing a proxy or proxies to vote in relation to resolutions to be passed at the meeting.
The cumulative preference shares represent less than 0.01% and the non-cumulative preference shares represent less than 0.73% of the total voting rights of the company respectively, the remainder being represented by the ordinary shares.
AppointedThere are no restrictions on the transfer of ordinary shares in the company other than certain restrictions which may from time to time be imposed by laws and regulations (for example, insider trading laws). Pursuant to the Board in September 2004, Joe MacHale is currently a non-executive director and chairman of the remuneration committee of Brit Insurance Holdings plc, and a trustee and treasurer of MacMillan Cancer Support. He held a number of senior executive positions with J P Morgan between 1979 and 2001 and was latterly chief executive of J P Morgan Europe, Middle East and Africa Region. He is a fellow of the Institute of Chartered Accountants.

Appointed to the Board on 1 October 2008, John McFarlane is former chief executive officer of Australia and New Zealand Banking Group Limited. Previously he was a group executive director of Standard Chartered and was head of Citicorp/Citibank in the UK and Ireland. He is currently a non-executive director of Westfield Holdings Limited and a director of Old Oak Holdings Limited. He is a former president of the International Monetary Conference and a former chairman of the Australian Bankers Association. He has previously served as a director of the London Stock Exchange and a member of the Auditing Practices Board.

Appointed to the Board on 1 October 2008, Arthur Ryan is the former chairman, chief executive officer and president of Prudential Financial Inc. Previously he held senior positions with Prudential Insurance and the former Chase Manhattan Bank NA. He is currently a non-executive director of Regeneron Pharmaceuticals Inc. and an active member of numerous community boards. He was a founding memberListing Rules of the Financial Services Forum.Authority (FSA), certain employees of the company require the approval of the company to deal in the company’s shares.
The rules governing the appointment of directors are set out in the company’s Articles of Association and on page 176. The company’s Articles of Association may only be amended by a special resolution at a general meeting of shareholders.
Report of the directors continued | Governance |
A number of the company’s share plans include restrictions on transfers of shares while shares are subject to the plans or the terms under which the shares were awarded.
The rights and obligations of holders of non-cumulative preference shares are set out in Note 29 on the accounts.
Except in relation to the Dividend Access Share, the company is not aware of any agreements between shareholders that may result in restrictions on the transfer of securities and/or voting rights. There are no persons holding securities carrying special rights with regard to control of the company.
Under the rules of certain employee share plans, eligible employees are entitled to acquire shares in the company, and shares are held in trust for participants by The Royal Bank and Ulster Bank Dublin Trust Company as Trustees. Voting rights are exercised by the Trustees on receipt of participants’ instructions. If a participant does not submit an instruction to the Trustee no vote is registered.
The Royal Bank of Scotland plc 1992 Employee Share Trust, The Royal Bank of Scotland Group plc 2001 Employee Share Trust and The Royal Bank of Scotland Group plc 2007 US Employee Share Trust hold shares on behalf of the Group’s employee share plans. The voting rights are exercisable by the Trustees, however, in accordance with investor protection guidelines, the Trustees abstain from voting. The Trustees would take independent advice before accepting any offer in respect of their shareholdings for the company in a takeover bid situation.
Awards granted under the company’s employee share plans may be met through a combination of newly issued shares and shares acquired in the market by the company’s employee benefit trusts.
A change of control of the company following a takeover bid may cause a number of agreements to which the company is party to take effect, alter or terminate. All of the company’s employee share plans contain provisions relating to a change of control. Outstanding awards and options may vest and become exercisable on change of control, subject where appropriate to the satisfaction of any performance conditions at that time and pro-rating of awards. In the context of the company as a whole, these agreements are not considered to be significant.
Directors
The names and brief biographical details of the directors are shown on pages 166 and 167.
Colin Buchan, Sandy Crombie, Philip Hampton, Stephen Hester, Penny Hughes, Joe MacHale, John McFarlane, Art Ryan, Philip Scott and Bruce Van Saun all served throughout the year and to the date of signing of the financial statements.
Gordon Pell retired as an executive director on 31 March 2010.
Brendan Nelson was appointed as a non-executive director on 1 April 2010.
Archie Hunter retired as a non-executive director on 28 April 2010.
All directors of the company will stand for re-election by shareholders at the 2011 Annual General Meeting and annually thereafter. Colin Buchan will stand down as a non-executive director on 5 August 2011 following the announcement of the Group’s interim results, having served just over nine years on the Board.
Group General Counsel and Group Secretary
Miller McLean was appointedretired as Group General Counsel and Group Secretary in August 1994.on 30 April 2010. He is a trustee of the Industrywas succeeded by Chris Campbell as Group General Counsel and Parliament Trust, non-executive chairman of The Whitehall and IndustryAileen Taylor as Group and president of the Chartered Institute of Bankers in Scotland.Secretary. For certain recent developments relating to matters discussed in this report, which is dated 25 February 2009, you should read the “Recent Developments” section of this document.
Capital restructuring
In November 2008, HM Treasury announced the establishment of UK Financial Investments Limited, a company wholly owned by the UK Government which will manage, on an arms-length basis, the UK Government’s shareholding in the company and other banks that subscribed to the government’s recapitalisation fund.
Following a placing and open offer in December 2008, HM Treasury now holds approximately 58% of the enlarged issued ordinary share capital of the company. In addition, HM Treasury holds £5 billion non- cumulative sterling preference shares in the company.
Subsequently, on 19 January 2009, the company announced in conjunction with HM Treasury and UK Financial Investments Limited, that the preference shares held by HM Treasury will be replaced with new ordinary shares. Eligible shareholders will be able to apply to subscribe for approximately £5 billion of new ordinary shares pro rata to their existing shareholdings at a fixed price of 31.75 pence per share by way of an open offer. Any shares not taken up by shareholders in the open offer (or otherwise placed on behalf of the company) will be subscribed for by HM Treasury at a fixed price of 31.75 pence per share and the aggregate proceeds of the open offer will be used to fund the redemption of the preference shares held by HM Treasury, together with the redemption premium on the preference shares, accrued dividend, and commissions payable to HM Treasury on the offer. The preference shares will be redeemed at 101 per cent of their issue price. Dividends will continue to accrue on the preference shares until redemption. This may result in HM Treasury’s shareholding increasing to approximately 70% of the enlarged ordinary share capital of the company.
Results and dividends
The loss attributable to the ordinary shareholders of the company for the year ended 31 December 2008 amounted to £24,137 million compared with a profit of £7,303 million for the year ended 31 December 2007, as set out in the consolidated income statement on page 158.
The company did not pay an interim dividend in 2008. On 15 September 2008, shareholders received one new ordinary share for every 40 shares held on the record date of 12 September 2008 by way of a capitalisation issue.
As part of an agreement with HM Treasury, the company undertook not to pay any dividends on the ordinary shares until such time as the £5 billion non-cumulative sterling preference shares issued to HM Treasury in December 2008 were repaid.
Upon redemption of the preference shares as noted above, the restriction on payment of ordinary dividends will be removed. However, it is not the Board’s intention to pay a dividend on ordinary shares in 2009.
Business review
Activities
The company is a holding company owning the entire issued ordinary share capital of The Royal Bank of Scotland plc, the principal direct operating subsidiary undertaking of the company. The “Group” comprises the company and all its subsidiary and associated undertakings, including the Royal Bank and NatWest. Details of the principal subsidiary undertakings of the company are shown in Note 16 on the accounts.
The Group is engaged principally in providing a wide range of banking, insurance and other financial services. Further details of the organisational structure and business overview of the Group, including the products and services provided by each of its divisions and the competitive markets in which they operate, is contained in the Business review on pages 4 to 5 and 12.
The Group is currently undertaking a strategic review that is expected to re-focus the Group on those businesses with clear competitive advantages and attractive marketing positions, primarily in stable, low-to-medium risk sectors.
Risk factors
The Group’s future performance and results could be materially different from expected results depending on the outcome of certain potential risks and uncertainties. Details of the principal risk factors the Group faces are given in the Business review on pages 13 to 20.
The reported results of the Group are also sensitive to the accounting policies, assumptions and estimates that underlie the preparation of its financial statements. Details of the Group’s critical accounting policies and key sources of accounting judgements are included in the Accounting policies on pages 162 to 172.
The Group’s approach to risk management, including its financial risk management objectives and policies and information on the Group’s exposure to price, credit, liquidity and cash flow risk, is discussed in the Risk, capital and liquidity management section of the Business review on pages 57 to 123.
Financial performance
A review of the Group’s performance during the year ended 31 December 2008, including details of each division, and the Group’s financial position as at that date is contained in the Business review on pages 34 to 52.
Business developments
In October 2007, RFS Holdings B.V. (RFS Holdings), a company jointly owned by the company, Fortis N.V., Fortis SA/NV and Banco Santander S.A. and controlled by the company, completed the acquisition of ABN AMRO Holding N.V. (ABN AMRO).
On 3 October 2008, the State of the Netherlands acquired Fortis Bank Nederland (Holding) N.V. (including the Fortis interest in RFS Holdings that represents the remaining Fortis-acquired businesses of ABN AMRO) as well as Fortis’ participation in certain Dutch insurance activities. On 24 December 2008, the Fortis interest in RFS Holdings was transferred from Fortis Bank Nederland (Holding) N.V. into the direct ownership of the State of the Netherlands, subject to completion of certain formalities. On the same date, the State of the Netherlands executed a Deed of Accession with the company, Banco Santander S.A., and RFS Holdings pursuant to which it acceded to the Consortium and Shareholders’ Agreement dated 28 May 2007 (as subsequently amended from time to time).
RFS Holdings is implementing an orderly separation of the business units of ABN AMRO with the company retaining the following ABN AMRO business units:
· | Continuing businesses of Business Unit North America; |
· | Business Unit Global Clients (excluding the Brazil Global Clients Business) and wholesale clients in the Netherlands (including former Dutch wholesale clients) and Latin America (excluding Brazil); |
· | Business Unit Asia including Private Clients India and Indonesia; and Interest in Prime Bank, Pakistan (excluding the interest in Saudi Hollandi); |
· | Business Unit Europe (excluding Antonveneta); |
Employees
As at 31 December 2008, the Group employed over 199,000 employees (full-time equivalent basis) throughout the world. Details of employee related costs are included in Note 3 on the accounts on page 175.
The Group utilises a wide range of recruitment channels to ensure that the recruitment and development of its employees are fully aligned to its organisational requirements.
The Group offers a competitive remuneration and benefits package to all employees.
Employees are able to participate in incentive plans specific to their business, and the Buy As You Earn and Sharesave schemes align the interests of employees with those of shareholders.
Employee learning and development
The Group maintains a strong commitment to creating and providing learning opportunities for all its employees through a variety of personal development and training programmes and learning networks. Employees are encouraged to do voluntary work with community partners.
Employee communication
Employee engagement is encouraged through a range of communication channels, at both a divisional and Group level. These channels provide access to news and information in a number of ways, including the intranet, magazines, video, team meetings led by line managers, briefings held by senior managers and regular dialogue with employees and employee representatives.
The Group Chief Executive and other senior Group executives regularly communicate with employees across a range of channels.
Employee consultation
Each year, all employees are invited to complete the global employee opinion survey. The survey is confidential and independently managed by Towers Perrin-ISR. The survey provides a channel for employees to express their views and opinions about the Group on a range of key issues.
In 2008, the response rate was 88%, the second highest response rate since the survey began. This represents over 156,000 employees participating in the survey, from more than 50 countries and in 20 languages. For the first time, this survey was extended to former ABN AMRO employees.
The Group recognises employee representative organisations such as trade unions and work councils in a number of businesses and countries. The Group has a European Employee Communication Council that provides elected representatives with an opportunity to understand better the impact on its European operations.
Diversity
The Group's Diversity policy and associated policy standards set a framework for broadening the Group’s talent base, achieving the highest levels of performance and enabling all employees to reach their full potential irrespective of age, disability, gender, marital status, political opinion, race, religion or belief or sexual orientation.
The Group is also committed to ensuring that all prospective applicants for employment are treated fairly and equitably throughout the recruitment process and its comprehensive resourcing standards cover the attraction and retention of individuals with disabilities. Reasonable adjustments are provided to support applicants in the recruitment process where these are required. The Group provides reasonable workplace adjustments for new entrants into the Group and for existing employees who become disabled during their employment.
Safety, health and wellbeing
Protecting its employees and customers from harm is a fundamental principle of the way the Group operates and its goal is to minimise work related injuries and ill health. The Group also recognises that the general health and wellbeing of its employees impacts on their engagement and productivity. Promoting good health, and providing support to its employees when they need it, is therefore also core to its approach.
During 2008, the Group focused on the core themes of globalisation of safety, health and wellbeing, improving health and raising awareness, while continuing to manage safety and health risks.
Pre-employment screening
The Group has a comprehensive pre-employment screening policy to guard against possible infiltration and employee-related fraud. In addition to existing workplace security measures, all people engaged on Group business are now being screened prior to commencing employment.
The Code of Conduct and related policies forms part of the terms and conditions of employment for all those employed by the Group and sets standards for those not directly employed such as contractors and agency workers.
The code supports the Group’s aim to operate in a similar way across the many countries in which it operates and is therefore applicable to employees in all locations. The code is a high level collection of key policies to inform employees of the Group’s expectations of their behaviour and practices.
Corporate responsibility
The Group believes that meeting high standards of environmental, social and ethical responsibility is key to the way it does business.
The Group’s business is managed in a way that takes account of the social and environmental impact of its activities. In order to identify the issues that matter most to its stakeholders, an annual research project is conducted. This work provides the foundation of the corporate responsibility strategy. It enables all parts of the Group to focus their efforts and resources on the most important issues. Having the right management structures in place and clear leadership helps set the framework against which this happens. There are issue-specific steering groups that feed into the Corporate Responsibility Forum, which considers the Group’s current performance and proposes new initiatives. The Group’s governance structure for corporate responsibility extends throughout the organisation.
Further details of the Group’s corporate responsibility policies will be contained in the 2008 Corporate Responsibility Report.
Going concern
The Group’s business activities and financial position; the factors likely to affect its future development and performance; and its objectives and policies in managing the financial risks to which it is exposed and its capital are discussed in the Business review.
As set out in the Business review, recent economic conditions have seen severe dislocation in many financial markets and an unprecedented reduction in liquidity globally. ‘Liquidity risk’ describes the measures governments and central banks in the UK and around the world have taken to provide capital and liquidity to banks. The Group used a number of these funding facilities during 2008 and its funding and capital plans for the next twelve months from the date of approval of these accounts assume continuing reliance on and the continuation of these measures. These plans have been shared with the Tripartite Authorities in the UK.
Following the rights issue in June 2008 and the open offer in December 2008, the Group’s capital ratios are at historically high levels and will be further strengthened by the restructuring of the UK Government’s preference shares. The UK Government owns 57.9% of the ordinary share capital of the Group. This could increase to 70.4% following the fully underwritten open offer announced in January 2009 and provides tangible evidence of the UK Government’s support for the Group reflecting its importance to the UK economy and financial system.
The directors have reviewed the Group’s forecasts, projections and other relevant evidence including the ongoing measures from governments and central banks in the UK and around the world to sustain the banking sector. Whilst the Group has received no guarantees, the directors have a reasonable expectation, based on experience to date, of continued and sufficient access to the funding facilities referred to above and, accordingly, that the Group and the company will continue in operational existence for the foreseeable future. The financial statements of the Group and of the company have, therefore, been prepared on a going concern basis.
Corporate governance
The company is committed to high standards of corporate governance. Details are given on pages 133 to 137.
Ordinary share capital
In June 2008, the company issued 6,123 million ordinary shares of 25p each through a rights issue on the basis of 11 new ordinary shares for every 18 existing shares held, at an issue price of £2 per share, raising £12 billion.
In September 2008, the company issued 403 million ordinary shares of 25p to existing shareholders by way of a capitalisation issue on the basis of one new ordinary share for every 40 shares held.
In December 2008, the company issued 22,910 million ordinary shares of 25p each by way of a Placing and Open Offer on the basis of 18 new ordinary shares for every 13 existing shares held, at an issue price of 65.5 pence per share, raising £14.7 billion. HM Treasury acquired 22,854 million of these shares and now holds 57.9% of the enlarged ordinary share capital of the company.
During the year, the ordinary share capital was also increased by 13.5 million ordinary shares allotted as a result of awards and the exercise of options under the company’s share schemes.
Details of the authorised and issued ordinary share capital at 31 December 2008 are shown in Note 27 on the accounts.
Preference share capital
In December 2008, the company issued 5 million non-cumulative sterling preference shares to HM Treasury at £1,000 per preference share, raising £5 billion.
As discussed on page 127, the company, subject to shareholder approval, intends to issue new ordinary shares by way of an open offer, the proceeds from which will be used to redeem the preference shares issued to HM Treasury, together with the accrued dividend.
Details of the authorised and issued preference share capital at 31 December 2008 are shown in Note 27 on the accounts.
Authority to repurchase shares
At the Annual General Meeting in 2008, shareholders renewed the authority for the company to make market purchases of up to 1,000,710,085 ordinary shares. The directors have not used this authority to date and there is no current intention that the authority will be exercised. This authority will lapse at the conclusion of the AGM of the company in 2009 and no renewal will be sought.
Additional information
Where not provided previously in the Report of the directors, the following provides the additional information required to be disclosed by Part 7 of the Companies Act 1985 as amended.
The rights and obligations attaching to the company’s ordinary shares and preference shares are set out in the company’s Articles of Association, copies of which can be obtained from Companies House in the UK or at www.rbs.com.
On a show of hands at a general meeting of the company every holder of ordinary shares and cumulative preference shares present in person or by proxy and entitled to vote shall have one vote. On a poll, every holder of ordinary shares present in person or by proxy and entitled to vote shall have one vote for every share held. On a poll, holders of
cumulative preference shares present in person or by proxy and entitled to vote shall have four votes for every share held. The Notice of the Annual General Meeting specifies the deadlines for exercising voting rights and appointing a proxy or proxies to vote in relation to resolutions to be passed at the meeting.
The cumulative preference shares represent less than 0.01 % of the total voting rights of the company, the remainder being represented by the ordinary shares.
There are no restrictions on the transfer of ordinary shares in the company other than certain restrictions which may from time to time be imposed by laws and regulations (for example, insider trading laws). Pursuant to the Listing Rules of the Financial Services Authority, certain employees of the company require the approval of the company to deal in the company’s shares.
A number of the company’s share plans include restrictions on transfers of shares while the shares are subject to the plans, in particular the Employee Share Ownership Plan.
The rights and obligations of holders of non-cumulative preference shares are set out in Note 27 on the accounts on pages 227 to 229.
The company is not aware of any agreements between shareholders that may result in restrictions on the transfer of securities and/or voting rights. There are no persons holding securities carrying special rights with regard to control of the company.
Under the rules of certain employee share plans, eligible employees are entitled to acquire shares in the company, and shares are held in trust for participants by The Royal Bank and Ulster Bank Dublin Trust Company as Trustees. Voting rights are exercised by the Trustees on receipt of participants’ instructions. If a participant does not submit an instruction to the Trustee no vote is registered.
The Royal Bank of Scotland Group plc 2001 Employee Share Trust, The Royal Bank of Scotland Group plc 2007 US Employee Share Trust and The Royal Bank of Scotland plc 1992 Employee Share Trust hold shares on behalf of the Group’s employee share plans. The voting rights are exercisable by the Trustees, however, in accordance with investor protection guidelines, the Trustees abstain from voting. The Trustees would take independent advice before accepting any offer in respect of their shareholdings for the company in a takeover bid situation.
The rules governing the appointment of directors are set out in Corporate governance on page 133. The company’s Articles of Association may only be amended by a special resolution at a general meeting of shareholders.
A change of control of the company following a takeover bid may cause a number of agreements to which the company is party to take effect, alter or terminate. In addition, a number of executive directors' service agreements may be affected on a change of control. All of the company’s employee share plans contain provisions relating to a change of control. Outstanding awards and options may vest and become exercisable on change of control, subject where appropriate to the satisfaction of any performance conditions at that time and pro- rating of awards. In the context of the company as a whole, these agreements are not considered to be significant.
The names and brief biographical details of the directors are shown on pages 125 and 126.
Gordon Pell, Guy Whittaker, Colin Buchan, Archie Hunter and Joe MacHale served throughout the year and to the date of signing of the financial statements.
Stephen Hester, John McFarlane and Arthur 'Art' Ryan were appointed as directors on 1 October 2008.
Johnny Cameron ceased to be a director on 13 October 2008.
Sir Fred Goodwin and Mark Fisher ceased to be directors on 21 November 2008.
Larry Fish ceased to be a director on 31 December 2008.
Sir Tom McKillop ceased to be Chairman on 3 February 2009.
Philip Hampton was appointed as a director and Chairman-designate on 19 January 2009 and as Chairman on 3 February 2009.
Jim Currie, Bill Friedrich, Bud Koch, Janis Kong, Sir Steve Robson, Bob Scott and Peter Sutherland ceased to be directors on 6 February 2009.
Philip Hampton, Stephen Hester, John McFarlane and Arthur ‘Art’ Ryan will retire and offer themselves for election at the forthcoming Annual General Meeting. Details of the service agreement for Stephen Hester are set out on page 143. No other director seeking election has a service agreement.
Directors’ interests
The interests of the directors in the shares of the company at 31 December 20082010 are shown on page 153.205. None of the directors held an interest in the loan capital of the company or in the shares or loan capital of any of the subsidiary undertakings of the company, during the period from 1 January 20082010 to 2523 February 2009.2011.
Directors'Directors’ indemnities
In terms of section 236 of the Companies Act 2006 the directors of the company, members of the Group Executive Management Committee and Approved Persons of the Group (under the Financial Services and Markets Act 2000) have been granted(the “Companies Act”), Qualifying Third Party Indemnity Provisions have been issued by the company.
Directors' disclosurecompany to auditors:
Eachdirectors, members of the directors atGroup’s Executive and Management Committees and FSA Approved Persons.
In terms of section 236 of the Companies Act, Qualifying Pension Scheme Indemnity Provisions have been issued to all trustees of the Group’s pension schemes.
Post balance sheet events
There have been no significant events between the year end and the date of approval of this report confirms that:these accounts which would require a change to or disclosure in the accounts.
(a)
| so far as the director is aware, there is no relevant audit information of which the company’s auditors are unaware; and |
Shareholdings
Report of the directors (continued)
(b) | the director has taken all the steps that he ought to have taken as a director to make himself aware of any relevant audit information and to establish that the company’s auditors are aware of that information. |
This confirmation is given and should be interpreted in accordance with the provisions of section 234ZA of the Companies Act 1985.
The table below shows the shareholders that have notified the Group that they hold more than 3% of the total voting rights inof the undernoted classes of shares ascompany at 31 December 2008.2010.
| |
| Solicitor For The Affairs of Her Majesty’s Treasury as Nominee for Her Majesty’s Treasury | Number of shares | % held |
| Ordinary shares | 39,644,835,194 | 67.8 |
| B shares (non-voting) | 51,000,000,000 | 100.0 |
| | | Number of shares | | | % held | |
| Ordinary shares: | | | | | | |
| Solicitor For The Affairs of Her Majesty’s Treasury As Nominee for Her Majesty’s Treasury | | | 22,853,798,818 | | | | 57.92 | |
| 11% cumulative preference shares: | | | | | | | | |
| Guardian Royal Exchange Assurance plc | | | 129,830 | | | | 25.97 | |
| Windsor Life Assurance Company Limited | | | 51,510 | | | | 10.30 | |
| Cleaning Tokens Limited | | | 25,500 | | | | 5.10 | |
| Mr S J and Mrs J A Cockburn | | | 15,520 | | | | 3.10 | |
| Mr Stephen J Cockburn | | | 15,290 | | | | 3.06 | |
| 51/2% cumulative preference shares: | | | | | | | | |
| Mr P S and Mrs J M Allen; Miss C L Allen, and Miss J C Allen | | | 112,949 | | | | 28.23 | |
| Commercial Union Assurance plc | | | 91,429 | | | | 22.86 | |
Bassett-Patrick Securities Limited (1) | | | 46,255 | | | | 11.56 | |
| E M Behrens Charitable Trust | | | 20,000 | | | | 5.00 | |
| Trustees of The Stephen Cockburn Limited Pension Scheme | | | 19,879 | | | | 4.97 | |
| Mrs Gina Wild | | | 19,800 | | | | 4.95 | |
| Miss Elizabeth Hill | | | 16,124 | | | | 4.03 | |
| Mr W T Hardison Jr. | | | 13,532 | | | | 3.38 | |
(1)Report of the directors continued | Notification has been received on behalf of Mr A W R Medlock and Mrs H M Medlock that they each have an interest in the holding of 512% cumulative preference shares registered in the name of Bassett-Patrick Securities Limited noted above and that there are further holdings of 5,300 and 5,000 shares, respectively, of that class registered in each of their names.Governance |
Charitable contributions
In 2008 the contribution to2010, the Group’s Community Investment programmesoverall community contribution was £66.3£56.1 million (2007 – £57.7(2009 - £63.9 million). The total amount given for charitable purposes by the company and its subsidiary undertakings during the year ended 31 December 20082010 was £24.8£29.6 million (2007 – £32.1(2009 - £34.7 million).
The company’sTo ensure it makes its community investmentinvestments as effective as possible, the Group’s policy is focusedto focus its resources on thea small number of substantial strategic programmes. These are issues most relevant to it as a financial institution including preventing exclusion from banking services, promotingand relate broadly to financial understandingeducation, supporting enterprise and supporting small businessesmicrofinance and entrepreneurs.the charitable endeavours of employees.
Political donations
At the Annual General Meeting in 2006,2010, shareholders gave authority under Part 14 of the Companies Act, for a period of one year, for the company (and its subsidiaries) to make political donations and incur political expenditure up to a maximum aggregate sum of £500,000£500,000. This authorisation was taken as a precautionary measureprecaution only, as the company has a longstanding policy of not making political donations or incurring political expenditure within the ordinary meaning of those words. Shareholders will be asked to renew this authorisation at the Annual General Meeting in light2011.
During 2010, the Group made no political donations in the UK or EU. In keeping with the Group’s employment policies, Coutts & Company allowed a member of staff paid leave during the year to stand for election at the UK General Election. This might constitute political expenditure for the purposes of the Companies Act, as the definition in the Companies Act is capable of having a very wide definitionsmeaning. The amount of expenditure in The Political Parties, Electionsrelation to the paid leave was £2,128.
RBS Services Australia Limited, a company acquired by the Group through its acquisition of ABN AMRO, made donations of AUS$126,552 (£75,397) during 2010 to Australian political parties and Referendums Act 2000, for a period of four years.Australian party-affiliated fundraising vehicles. These authorities have not been used.
payments were fully compliant with ABN AMRO policy and Australian electoral law. No politicalfurther donations werewill be made during the year and it is not proposed that the Group’s longstanding policy of not making contributions to any political party be changed.
Policy and practice on payment of creditors
The Group is committed to maintaining a sound commercial relationship with its suppliers. Consequently, it is the Group’s policy to negotiate and agree terms and conditions with its suppliers, which includesinclude the giving of an undertaking to pay suppliers within 30 days of receipt of a correctly prepared invoice submitted in accordance with the terms of the contract or such other payment period as may be agreed.
At 31 December 2008,2010, the Group’s trade creditors represented 3029 days (2007 –(2009 - 30 days) of amounts invoiced by suppliers.
Directors’ disclosure to auditors
Each of the directors at the date of approval of this report confirms that:
(a) so far as the director is aware, there is no relevant audit information of which the company’s auditors are unaware; and
(b) the director has taken all the steps that he/she ought to have taken as a director to make himself/herself aware of any relevant audit information and to establish that the company’s auditors are aware of that information.
This confirmation is given and should be interpreted in accordance with the provisions of section 418 of the Companies Act.
Auditors
The auditors, Deloitte LLP, have indicated their willingness to continue in office. A resolution to re-appoint Deloitte LLP as the company’s auditorauditors will be proposed at the forthcoming Annual General Meeting.
By order of the Board
Miller McLeanAileen Taylor
Secretary
2523 February 20092011
The Royal Bank of Scotland Group plc
is registered in Scotland No. 45551.45551
| Corporate governance | Governance |
The company is committed to high standards of corporate governance, business integrity and professionalism in all its activities.
Throughout the year ended 31 December 2008,2010, the company has complied with all of the provisions of the Combined Code issued by the Financial Reporting Council in June 20062008 (the “Code”"Code") except in relation to the provision that the Remuneration Committee should have delegated responsibility for setting remuneration for the Chairman and executive directors. The company considers that this is a matter which should rightly be reserved for the Board. No director is involved in decisions regarding his or her own remuneration.
During the period following the changesAlthough not applicable to the Board on 6 February 2009 to the date of this Report and Accounts,current accounting period, the company has not had a senior independent director andalso complied with the Remuneration Committee has comprised two independent non-executive directors and the Chairmanmain provisions of the Board, not the three independent non-executive directors requiredUK Corporate Governance Code issued by the Code.Financial Reporting Council in May 2010 (the “new Code”) except as noted above. The Board iscompany has also taken steps to implement the recommendations arising from the review of governance in the processbanks and financial institutions undertaken by Sir David Walker (the “Walker Review”), details of recruiting three additional independent non-executive directors and plans to appoint a senior independent director and an additional memberwhich are described in this section. A copy of the Remuneration Committee as part of the recruitment process.new Code can be found at http://www.frc.org.uk/corporate.
The company has also complied in all material respects with the Financial Reporting Council Guidance on Audit Committees issued in October 2008 in all material respects.December 2010.
Under the US Sarbanes-Oxley Act of 2002 (the “Act”"Act"), specific standards of corporate governance and business and financial disclosures apply to companies with securities registered in the US. The company complies with all applicable sections of the Act.
The New York Stock Exchange
As a foreign issuer with American Depositary Shares (ADS) representing ordinary shares, preference shares and debt securities listed on the New York Stock Exchange (NYSE)(the “NYSE”), the company must disclose any significant ways in which its corporate governance practices differ from those followed by US companies under the NYSE’sNYSE corporate governance listing standards. In addition, the company must comply fully with the provisions of the listing standards that relate to the composition, responsibilities and operation of audit committees. These provisions incorporate the relevant rules concerning audit committees of the US Securities Exchange Act of 1934.1934 (“Exchange Act”).
The company has reviewed its corporate governance arrangements and is satisfied that these are consistent with the NYSE’s corporate governance listing practices, with the exception that the Chairman of the Board is also the Chairman of the Nominations Committee, andwhich is a member ofpermitted under the Remuneration Committee, both of which are permitted by the UK Combined Code (since the Chairman was considered independent on appointment). The company’s Audit, NominationBoard Risk, Remuneration and RemunerationNominations Committees are otherwise composed solely of non-executive directors deemed by the Board to be independent. The NYSE’sNYSE corporate governance listing standards also require that a compensation committee has direct responsibility to review and approve the Group Chief ExecutiveExecutive’s remuneration. The
As stated above, in the case of the company, the Board, rather than the Remuneration Committee, reserves the authority to make the final determination of the remuneration of the Group Chief Executive.
The Group Audit Committee complies with the provisions of the NYSE’sNYSE corporate governance listing standards that relate to the composition, responsibilities and operation of audit committees. In June 2008,May 2010, the company submitted its required annual written affirmation to the NYSE confirming its full compliance with those and other applicable provisions. More detailed information about the Audit Committee and its work during 20082010 is set out in the Audit Committee Reportreport on pages 136 and 137.179 to 182.
Board of directors
The Board is the principalmain decision-making forum for the company. It has overall responsibility for leadingmanagement of the business and controllingaffairs of the companyGroup, the establishment of Group strategy and the allocation and raising of capital, and is accountable to shareholders for financial and operational performance. The Board approvesconsiders strategic issues and ensures the Group strategymanages risk effectively through approving and monitors performance.monitoring the Group’s risk appetite, considering Group stress scenarios and agreed mitigants and identifying longer term strategic threats to the Group’s business operations. The Board has adopted a formal schedule of matters detailing key aspects of the company’s affairs reserved to it for its decision. This schedule is reviewed annually.bi-annually.
The roles of the Chairman and Group Chief Executive are distinct and separate, with a clear division of responsibilities. The Chairman leads the Board and ensures the effective engagement and contribution of all executive and non-executive directors. The Group Chief Executive has responsibility for all Group businesses and acts in accordance with the authority delegated by the Board. Responsibility for the development of policy and strategy and operational management is delegated to the Group Chief Executive and other executive directors.the Group Finance Director.
All directors participate in discussing strategy, performance and the financial and risk management of the company. Meetings of the Board are structured to allow open discussion.sufficient time for consideration of all items and the Chairman encourages constructive challenge and debate.
There were nine scheduledFor 2010, eleven Board meetings during 2008.were scheduled. Individual attendance at these meetings is set out on page 178. The directors were supplied with comprehensive papers in advance of each Board meeting covering the Group’s principalmeeting. The Group Chief Executive provides a written report on business activities.activities at each Board meeting. Members of executive management attend and make regular presentations at meetings of the Board. In addition to scheduled meetings, a number of ad hoc Board meetingsThe Chairman and Chairman’s Committee meetings were held during 2008. These meetings were attended by the majority of directors.non-executive directors meet at least once per year without executive directors present.
The Board is aware of the other commitments of its directors and has established procedures for ensuring that the Board’s powers for authorising directors’ conflicts of interest are being operated effectively. With effect from 1 October 2008, the Companies Act 2006 introduced a statutory duty on directors to avoid conflicts of interest.interest unless authorised. Since that date, the Board has considered, and where appropriate authorised, any actual or potential conflicts of interests that directors may have.
Corporate governance continued | Governance |
Board balance and independence
The Board currently comprises the Chairman, threetwo executive directors and fiveeight independent non-executive directors.directors, one of whom is the Senior Independent Director. The Board functions effectively and efficiently and is considered to be of an appropriate size. The directors provide the Group with the knowledge, mix of skills experience and networks of contactsexperience required. The Board Committees comprise directors with a variety of relevant skills and experience so that no undue reliance is placed on any individual.
The non-executive directors combine broad business and commercial experience with independent and objective judgement. The balance between non-executive and executive directors enables the Board to provide clear and effective leadership and maintain the highest standards of integrity across the company’sGroup’s business activities. The names and biographies of all Board members are set out on pages 125 and 126.
In addition to the Chairman, there are five independent and three non-independent directors (i.e. the executive directors) on the Board. Following Bob Scott ceasing to be a director on 6 February 2009, a replacement senior independent director will be appointed in due course. The Board plans to appoint, in consultation with HM Treasury, three new independent non-executive directors to the Board during 2009.
The Board considers that the Chairman was independent on appointment and all non-executive directors are independent for the purposes of the Code. The standard terms and conditions of the appointment of non-executive directors are available on the Group’s website (www.rbs.com) and copies are available on request.
Re-election of directors
Directors mustIn accordance with the provisions of the new Code, all directors of the company will stand for re-election by shareholders at least once every three years. Any non-executive directors who have served for more than nine years will also stand for annual re-election and the Board will consider their independence at that time. The proposed re-election of directors is subject to prior review by the Board.
The names of directors standing for election at the 2009company’s 2011 Annual General Meeting and annually thereafter. Colin Buchan will stand down as a non-executive director on 5 August 2011 following the announcement of the Group’s interim results, having served just over nine years on the Board.
The names and biographical details of directors are includedshown on page 130pages 166 and further167. Further information will be given in the Chairman’s letter to shareholders in relation to the company’s Annual General Meeting.Meeting can be found in the Chairman’s letter to shareholders.
Information, induction and professional development
All directors receive accurate, timely and clear information on all relevant matters, and have access to the advice and services of the Group General Counsel and Group Secretary who is responsible to the Board for ensuring that Board procedures are followed and that applicable rules and regulations are complied with. In addition, all directors are able, if necessary, to obtain independent professional advice at the company’s expense.
In line with recommendations of the Walker Review and the new Code, the company has reviewed the induction programme for new directors. Each new director receives a formal induction on joining the Board, including visits to the Group’s major businesses and meetings with directors and senior management.management and key stakeholders. The induction is tailored to the director’s specific requirements.
The company has undertaken a comprehensive review of the ongoing professional development programme for directors. Directors are advised of appropriate training and professional development opportunities and undertake the training and professional development they consider necessary in assisting them to carry out their duties as a director.
Performance evaluation
TheFollowing the external Board has undertakenevaluation carried out in 2009, a number of initiatives were implemented aimed at improving the overall performance and effectiveness of the Board, including greater advance planning in relation to Board agendas to allow more in-depth discussion of businesses and enhancement of Board engagement in risk management and setting risk appetite.
A formal and rigorous internal evaluation of its ownthe performance of the Board and thatNominations Committee during 2010 was carried out by the Group Secretary. A detailed framework of its committees and individual directors.
In 2008, thisquestions was conducted internally using detailed questionnaires andused to structure individual meetings held by the Group Secretary with each director.director and regular meeting attendees. The Group Secretary then discussed the outcomes and recommendations with the Chairman. Amongst the areas reviewed were the role and organisation of the Board and Board Committees, Board and Committee composition, Board processes, the structure and frequency of meetings, and processes,Board performance and reporting, strategy and risk management and external relationships. relationships, including those with shareholders and regulators.
The Board has considered and discussed reports on the outcomes of the evaluationsevaluation and is satisfied with the way in which the evaluation was conducted. The evaluation concluded that the Board is strong and operating effectively, headed by an excellent Chairman, who facilitates good, constructive debate. Generally, the Board is viewed as currently being of the appropriate size and has a good dynamic, although Board composition should be kept under continual review to ensure that the correct balance of skills and experience is maintained, particularly on Board Committees. On the structure of Board meeting agendas it was suggested that greater time could be allocated for discussions on key issues to allow in-depth focus on items which are material to the Group and to encourage an emphasis on debate and discussion rather than formal presentation.
Separate in-depth evaluations have been conducted.were carried out for each of the Audit Committee, Board Risk Committee and Remuneration Committee by the Group Secretary, where appropriate in conjunction with the Committee Chair. Further information on the evaluations carried out in relation to the Audit Committee, Board Risk Committee and Remuneration Committee is set out on pages 182, 186 and 190 respectively.
A number of initiatives are already underway aimed at improvingAdditionally, directors were asked to provide feedback on their fellow directors. This feedback was shared with each director by the overallChairman, who met with each director individually to discuss their own performance and effectiveness ofongoing professional development.
Separately, the Board, including further Board appointments, restructuring Board agendas and allowing more time at Board meetings to consider strategic issues. In addition, a number of actions have already been taken to enhance reporting to the Board and Audit Committee on risk matters, liquidity and funding.
In addition, the former Chairman evaluated the individual performance of each director. The former senior independent directorSenior Independent Director canvassed the views of the executive directors and met with the non-executive directors as a group, without the former Chairman present, to consider histhe Chairman’s performance. Feedback was sought on governance and stewardship of the Group, relationships with key external and internal stakeholders, execution of the Group’s Strategic Plan and delivery of value and return to shareholders. The Senior Independent Director also canvassed views from United Kingdom Financial Investments Limited (UKFI) and the FSA. The results of this were then shared with the Chairman who agreed to consider the points raised and provide separate responses in due course.
Corporate governance continued | Governance |
Board Committees
In order to provide effective oversight and leadership, the Board has established a number of Board Committees with particular responsibilities. The Committee chairmanship and membership are reviewed on a regular basis. The names and biographies of all Board Committee members are set out on pages 125166 and 126.167.
The terms of reference of the Audit, Remuneration and Nominations Committees and the standard terms and conditions of appointment of non-executive directorsundernoted committees are available on the Group’s website (www.rbs.com) and copies are available on request.
Audit Committee
All members of theThe Audit Committee areis comprised of at least three independent non-executive directors. The Audit Committee holds at least fiveheld seven scheduled meetings each year. in 2010.
The Audit Committee’sCommittee is responsible for assisting the Board in discharging its responsibilities in relation to the disclosure of the financial affairs of the Group. The Audit Committee reviews the accounting policies, financial reporting and regulatory compliance practices of the Group, the Group’s system and standards of internal controls, monitors the Group’s processes for internal audit and external audit and reviews the practices of the Divisional Risk and Audit Committees. The Audit Committee report is set out on pages 136179 to 182.
Board Risk Committee
The Board Risk Committee is comprised of at least three independent non-executive directors. The Board Risk Committee held six scheduled meetings and 137.three additional meetings in 2010.
The Board Risk Committee is responsible for providing oversight and advice to the Board in relation to current and potential future
risk exposures of the Group and future risk strategy, including determination of risk appetite and tolerance. The Board Risk Committee report is set out on pages 185 and 186.
Remuneration Committee
The Remuneration Committee is comprised of at least three independent non-executive directors. The Remuneration Committee held nine scheduled meetings and six additional meetings in 2010.
The Remuneration Committee is responsible for the overview of the Groups remuneration policy and remuneration governance framework, ensuring that remuneration arrangements are consistent with and promote effective risk management. The committee also makes recommendations to the Board on the remuneration arrangements for executive directors.
The Remuneration Report, including a letter from the Chair of the Remuneration Committee, is set out on pages 187 to 204.
Nominations Committee
All non-executive directors together withare members of the Nominations Committee which is chaired by the Chairman of the Board.Group. The RemunerationGroup Chief Executive is invited to attend meetings. The Nominations Committee holds at least threetwo scheduled meetings each year.
The Directors’ Remuneration Report is containedper year, and also meets on pages 141 to 152.
Nominations Committee
The Nominations Committee comprises independent non-executive directors, under the chairmanship of the Chairman of the Board. The Nominations Committee meetsan ad hoc basis as required.
The Nominations Committee is responsible for assisting the Board in the formal selection and appointment of directors. for:
| assisting the Board in the formal selection and appointment of directors having regard to the overall balance of skills, knowledge, experience and diversity on the Board; |
| reviewing the structure, size and composition of the Board and making recommendations to the Board on any appropriate changes; |
| reviewing membership and Chairmanship of Group Board Committees; and |
| considering succession planning for the Chairman, Group Chief Executive and non-executive directors, taking into account the skills and expertise which will be needed on the Board in the future. No director is involved in decisions regarding his or her own succession. |
The committeeNominations Committee engages with external consultants, it considers potential candidates and recommends appointments of new directors to the Board.
Group Sustainability Committee
The appointmentsGroup Sustainability Committee (GSC) was established in 2009 and is chaired by the Senior Independent Director. The GSC is responsible for reviewing the Group’s overall sustainability strategy, values and policies and aligning the Group’s approach to social, environmental and ethical issues. All key business areas are basedrepresented on merit against objective criteria, including the time availableGSC and it is attended by the Group Chairman.
Further details of the potential directorGroup’s sustainability policies are available on www.rbs.com/sustainability and the commitment which will be required.
In addition, the Nominations Committee considers succession planning for the Chairman, Group Chief Executive and non-executive directors. The Nominations Committee takes into account the knowledge, mix of skills, experience and networks of contacts which are anticipated to be needed on the Board in the future. The Chairman, Group Chief Executive and non-executive directors meet to consider executive succession planning. No director is involved in decisions regarding his or her own succession.Annual Sustainability Report.
Corporate governance continued | Governance |
Meetings
The number of scheduled meetings of the Board and the Audit, Board Risk, Remuneration and Nominations Committees and individual attendance at these meetings by members in 20082010 is shown below.
| | Board | Audit | Remuneration | Nominations |
| Total number of | | | | |
| meetings in 2008 | 9 | 6 | 3 | |
| Number of meetings | | | | |
| attended in 2008: | | | | |
| Sir Tom McKillop (1) | 9 | — | 3 | 5 |
| Sir Fred Goodwin (2) | 8 | — | — | — |
| Mr Buchan | 8 | 6 | 2 | — |
| Mr Cameron (3) | 7 | — | — | — |
| Dr Currie (4) | 9 | — | 3 | — |
| Mr Fish | 8 | — | — | — |
| Mr Fisher (2) | 6 | — | — | — |
| Mr Friedrich (4) | 9 | 6 | — | — |
| Mr Hester (5) | 3 | — | — | — |
| Mr Hunter | 9 | 6 | — | 5 |
| Mr Koch (4) | 9 | — | — | — |
| Mrs Kong (4) | 9 | — | 3 | — |
| Mr MacHale | 9 | 6 | — | — |
| Mr McFarlane (5) | 3 | — | — | — |
| Mr Pell | 9 | — | — | — |
| Sir Steve Robson (4) | 7 | 6 | — | — |
| Mr Ryan (5) | 3 | — | — | — |
| Mr Scott (4) | 9 | — | 3 | 3 |
| Mr Sutherland (4) | 7 | — | 3 | 4 |
| Mr Whittaker | 9 | — | — | — |
| | Board | Audit | Board Risk | Remuneration | Nominations |
| Total number of scheduled meetings in 2010 | 11 | 7 | 6 | 9 | 2 |
| Number of meetings attended in 2010 | | | | | |
| Philip Hampton | 11 | | | | 2 |
| Stephen Hester | 11 | | | | |
Colin Buchan (1) | 10 | 6 | 6 | 4 | 2 |
| Sandy Crombie | 11 | | 6 | 9 | 2 |
| Penny Hughes | 11 | | | 9 | 2 |
Joe MacHale (2) | 11 | 3 | 5 | | 2 |
| John McFarlane | 11 | | | 9 | 2 |
Brendan Nelson (3) | 8 | 4 | 3 | | 2 |
Art Ryan (4) | 6 | | | | 1 |
| Philip Scott | 10 | 7 | 6 | | 1 |
| Bruce Van Saun | 11 | | | | |
| | | | | | |
| Former directors | | | | | |
Archie Hunter (5) | 4 | 3 | 3 | | |
Gordon Pell (6) | 2 | | | | |
Notes:
| (1) | Sir Tom McKillop ceasedStood down from the Remuneration Committee with effect from 1 June 2010. |
| (2) | Stood down from the Audit Committee with effect from 30 April 2010. |
| (3) | Appointed as a director on 1 April 2010. |
| (4) | Unable to attend a number of Board and Committee meetings during 2010 due to family illness. |
| (5) | Ceased to be a director on 3 February 2009.28 April 2010. |
(2)(6) | Sir Fred Goodwin and Mark Fisher ceased to be directors on 21 November 2008. |
(3) | Johnny Cameron ceasedCeased to be a director on 13 October 2008.31 March 2010. |
(4) | Jim Currie, Bill Friedrich, Bud Koch, Janis Kong, Sir Steve Robson, Bob Scott and Peter Sutherland ceased to be directors on 6 February 2009. |
(5) | Stephen Hester, John McFarlane and Arthur 'Art' Ryan were appointed as directors on 1 October 2008. |
Relations with shareholders
The company communicates with shareholders through the Annual Report and Accounts and by providing information in advance of the Annual General Meeting. Individual shareholders can raise matters relating to their shareholdings and the business of the Group at any time throughout the year primarily by letter, telephone or email via the Group’s website (www.rbs.com/ir).
Shareholders are given the opportunity to ask questions at the Annual General Meeting or submit written questions in advance. The chairmen of the Audit, Board Risk, Remuneration and Nominations Committees are available to answer questions at the Annual General Meeting. The Senior Independent Director is also available.
Communication with the company’scompany's largest institutional shareholders is undertaken as part of the company’s investor relations programme. The Chairman meets with the Group’s top 20 investors at least once every 12 months to discuss issues such as strategy, business performance and corporate governance. DuringInvestor Relations programme:
| · | The Group Chief Executive meets regularly with UKFI, the organisation set up to manage the Government’s investments in financial institutions, to discuss the strategy and financial performance of the Group. He also undertakes an annual programme of meetings with the company’s largest institutional shareholders, as does the Group Finance Director. |
| The Chairman independently meets with the Group’s largest institutional shareholders annually to hear their feedback on management, strategy, business performance and corporate governance. Additionally, the Chairman, Senior Independent Director and chairs of the Board Committees met with the governance representatives of a number of institutional shareholders during the year. |
| The Senior Independent Director is available if any shareholder has concerns that they feel are not being addressed through the normal channels. |
| The Chair of the Remuneration Committee consults with institutional shareholders in respect of the Group’s remuneration policy. |
Throughout the year, the Chairman, Group Chief Executive and Group Finance Director communicate shareholder feedback to the Board and the directors received analysts’receive independent analyst notes and reports and a monthly report from the Group’s investor relations department which includes an analysis ofreviewing share price movements and the Group’s performance against the sector, and key broker comments. In addition, information on major investor relations activities and changes to external credit ratings is provided.sector. Detailed market and shareholder feedback is also provided to the Board after results and other market announcements. The senior independent director was available throughout 2008 to shareholders should they have considered their concerns were not being addressed through the normal channels.major public announcements such as earnings releases. The arrangements used to ensure that directors develop an understanding of the views of major shareholders are considered as part of the annual Board performance evaluation.
The Chairman, Group Chief Executive and Group Finance Director communicate shareholder views to the Board as a whole.
The Board commissions a survey of investor perceptions periodically. The survey is undertaken on behalf of the Board by independent consultants and the outcomes of the study are considered by the Board.
Corporate governance continued | Governance |
Membership
I assumed the role of Chairman of the Audit Committee on 28 April 2010, following the retirement of Archie Hunter. The current members of the Committee are Colin Buchan, Philip Scott and myself. Joe MacHale stood down from the Audit Committee are Archie Hunter (Chairman), Colin Buchanwith effect from 30 April 2010 and Joe MacHale. All served throughout 2008 as did former membersis now a member of the committee, Bill FriedrichBoard Risk Committee and Sir Steve Robson, until their retirement as directors on 6 February 2009. Asset Protection Scheme (APS) Senior Oversight Committee.
All members of the Audit Committee are independent non-executive directors. The Audit Committee holds at least five scheduled meetings each year, two of which are held immediately prior to submissionColin Buchan and Philip Scott served throughout 2010, and I became a member of the interim and annual financial statements to the Board. This core programme is supplemented by additionalCommittee with effect from 1 April 2010. Attendance of each member at meetings as required. A total of ten meetings were held in 2008. Audit Committee meetings are attended by relevant executive directors, the internal and external auditors and finance and risk management executives. At least twice per annum the Audit Committee meets privately with the external auditors. Since 2000,in 2010 is shown on page 178.
The members of the Audit Committee has undertaken an annual programme of visits to the Group's business divisions and control functions. The objectare also members of the programmeBoard Risk Committee. This common membership ensures effective governance across all Finance and Risk issues, and that agendas are aligned and overlap is avoided. The Audit and Board Risk Committees also have strong links with the Remuneration Committee, with particular regard to allowensuring that relevant Finance and Risk matters are factored into the Audit Committee to gain a better understandingdetermination of the Group and an invitation to attend is extended to all non-executive directors. The programmeappropriate levels of future visits is considered annually and the norm is for two to three visits to be undertaken each year. The Committee undertook three visits in 2008.compensation.
The Audit Committee is responsible for:Committee’s primary responsibilities are to:
The Audit Committee is satisfied that it has complied with the relevant provisions of the Code and the new Code.
Audit Committee Chairman
As Chairman of the Audit Committee, I play a leading role in the setting of the annual agenda planner for the Committee and with the agenda for each Committee meeting. Prior to every Committee meeting, I hold meetings with each of the Head of Group Internal Audit, the external auditors, the Group Finance Director and the Group Chief Accountant. These meetings are instrumental in ensuring that I am briefed on all relevant issues and that these are brought to the attention of the Audit Committee.
Meetings and visits
A total of seven meetings of the Audit Committee were held in 2010, including meetings held immediately prior to the submission of the interim and annual financial statements to the Boards and the quarterly Interim Management Statements. Audit Committee meetings are attended by relevant executive directors, the internal and external auditors and Finance and Risk management executives. Other executives, subject matter experts and external advisers are also invited to attend the Audit Committee, as required, to present and advise on reports commissioned by the Committee. At least twice per annum the Audit Committee meets privately with the external auditors.
The Audit Committee’s annual programme of visits to the Group's business divisions and control functions continued in 2010, and these are now also attended by the Board Risk Committee. The object of the programme is to allow the Audit Committee and the Board Risk Committee to gain a better understanding of the Group and an invitation to attend is extended to all non-executive directors. The programme of future visits is considered annually. The Audit Committee and the Board Risk Committee undertook six visits in 2010. These were to the Global Banking & Markets business; the Non-Core Division, Global Restructuring Group and the Asset Protection Scheme; Major Change Projects ongoing in the Group; the US Asset-backed Securities business; Risk Management and the Global Banking & Markets, Global Transaction Services and Private Banking businesses in Asia.
Corporate governance continued | Governance |
Work in 2010
During 2010, the work of the Audit Committee focused on a number of key areas, including:
| accounting, financial reporting and regulatory compliance; |
| impairments and fair values; |
| standards of internal control, including the work of the internal and external auditors; |
| provisioning and credit exposures; |
| general insurance reserves; and |
| the work and role of Divisional Risk and Audit Committees in so far as they relate to the work of the Committee. |
The Audit Committee received regular updates on accounting issues and developments from both the Group Chief Accountant and from the external auditors, who presented for approval to the Committee their audit plan, their audit fee proposal and engagement letter, as well as confirmation of their independence and a comprehensive report of all non-audit fees.
The Audit Committee focused on a number of salient judgments and reporting issues in the preparation of the 2010 accounts, including:
| valuation methodologies and assumptions for financial instruments carried at fair value including the Group's credit market exposures and the disclosures provided; |
| actuarial assumptions for the Group Pension Fund; |
| impairment losses in the Group's portfolio of loans and advances and available-for-sale securities; |
| impairment of goodwill and other purchased intangible assets; |
| the Group’s tax position, including the treatment of deferred tax assets; and |
| compliance with the requirements of the Sarbanes-Oxley Act 2002. |
In its consideration of each of these issues, the aims of the Audit Committee have been to:
| understand and challenge the valuation and other accounting judgments made by management; |
| review the conclusions of the external auditors and, where applicable, other experts and to understand how they came to their conclusions; and |
| satisfy itself that the disclosures in the financial statements about these estimates and valuations are transparent and appropriate. |
The Audit Committee was regularly advised of whistleblowing events which occurred within the Group; of complaints raised with members of the Group’s executive team; of significant internal investigations undertaken within the Group; and of internal regulatory reviews and investigations.
Group Internal Audit’s role is to continuously assess how operating risks are being managed and controlled throughout the Group and report regularly to the Group Executive and Audit Committee on the results of these assessments; and to influence the continuous development of the risk management and control process through sharing best practice.
The Audit Committee oversees the work of Group Internal Audit, and receives a quarterly report from the Head of Group Internal Audit. This report rates the quality of the control environment of all the Group’s divisions and of management’s level of awareness on these matters. Group Internal Audit report to the Committee on areas where improvements are required to the control environment. The Audit Committee actively monitors these reports and ensures relevant matters raised are dealt with in a timely and appropriate manner. These reports offer the Audit Committee oversight of Group Internal Audit’s work, and allow the Audit Committee to monitor the level of internal control within the Group.
The Audit Committee oversees the Group’s compliance with the rules of the APS, and reviews regular progress reports from RBS Risk Management.
Relevant management also presented on a number of specific reporting, compliance and internal control matters.
As far as it can determine, the Audit Committee received all the information and material it required to allow it to meet its obligations in respect of the 2010 financial statements.
Corporate governance continued | Governance |
External auditors
Deloitte LLP has been the company’s auditors since March 2000.
The Audit Committee undertakes an annual evaluation to assess the independence and objectivity of the external auditors and the effectiveness of the audit process, taking into consideration relevant professional and regulatory requirements. The annual evaluation is carried out following completion of the annual accounts and audit.
In assessing the effectiveness of the Group’s external auditors the Audit Committee has regard to:
| the experience and expertise of the senior members of the engagement team; |
| the proposed scope of the audit work planned and executed; |
| the quality of the dialogue between the external auditors, the Committee and senior management; |
| the clarity, quality and robustness of written reports presented to the Committee setting out the external auditor’s findings arising from the audit; |
| the quality of the observations provided to the company by the external auditor on the Group’s systems of internal control; and |
| the views of management on the performance of the external auditors. |
The outcomes of the evaluation were considered by the Audit Committee and Board.
In addition to the annual evaluation performed by the Audit Committee, the external auditors conduct their own annual review of audit quality.
Twelve service criteria for the audit have been defined by the external auditors to measure their performance against the quality commitments set out in their annual audit plan, under the headings of “quality of audit approach and conduct”, “independence and objectivity”, “quality of the team” and “value added”. A questionnaire is completed by each Divisional CFO and each Divisional Risk and Audit Committee chairman after the completion of the annual audit and by relevant members of Group management and the Audit Committee. A follow up interview is held with each of them by senior partners independent of their immediate service teams. The results of this exercise will be presented to the Audit Committee, with actions defined and agreed to address any areas where performance has fallen below expected standards.
The external auditors are required to rotate the lead audit partner responsible for the audit every five years and, in 2010, a new audit partner was appointed to lead the audit for the year ending 31 December 2010. There are no contractual obligations restricting the company's choice of external auditor.
The Audit Committee is responsible for making recommendations to the Board in relation to the appointment, re-appointment and removal of the external auditors. In order to make a recommendation to the Board, the Audit Committee consider and discuss the performance of the external auditor in the previous year, taking account of the outcomes of the annual evaluation carried out. The Board submits the Audit Committee's recommendations to shareholders for their approval at the Annual General Meeting. The Board has endorsed the Audit Committee's recommendation that shareholders be requested to approve the reappointment of Deloitte LLP as external auditors at the Annual General Meeting in April 2011.
The Audit Committee approves the terms of engagement of the external auditors. The Audit Committee also fixes the remuneration of the external auditors as authorised by shareholders at the Annual General Meeting.
Audit and non-audit services
The Audit Committee has adopted a policy on the engagement of the external auditors to supply audit and non-audit services, which takes into account relevant legislation regarding the provision of such services by an external audit firm.
In particular, the Group may not engage the external auditors to provide any of the non-audit services described below:
| bookkeeping or other services related to the accounting records or financial statements; |
| financial information systems design and implementation; |
| appraisal or valuation services, fairness opinions or contribution-in-kind reports; |
| internal audit outsourcing services; |
| management functions or human resources; |
| broker or dealer, investment adviser, or investment banking services; |
| legal services and expert services unrelated to the audit; or |
| other services determined to be impermissible by the US Public Company Accounting Oversight Board. |
The Audit Committee reviews the policy annually and prospectively approves the provision of audit services and certain non-audit services by the external auditors.
Corporate governance continued | Governance |
Prospectively approved non-audit services include the following classes of service:
| reports providing assurance to third parties over certain of the Group's internal controls prepared under US Statement of Auditing Standards 70 or similar auditing standards in other jurisdictions. |
For all other permitted non-audit services, Audit Committee approval must be sought, on a case by case basis, before the provision of the service commences. In August 2010, the Audit Committee approved changes to the existing non-audit services policy. The new streamlined process allows for the Chairman of the Audit Committee (or, in his absence, a designated delegate) to approve any non-audit services request with a value under £100,000. Any request with a value above this amount must be approved by the full Audit Committee. To ensure good governance all requests, regardless of financial limits, have to be approved by the Group Chief Accountant and Group Sourcing and Vendor Management. At each Audit Committee meeting, any non-audit services requests which have been approved since the previous meeting are considered for ratification.
In addition, the Audit Committee reviews and monitors the independence and objectivity of the external auditors when it approves non-audit work to be carried out by them, taking into consideration relevant legislation, ethical guidance and ethical guidance.the level of non-audit services relative to audit services. The approval process is rigorously applied to prevent the auditors from functioning in the role of management, auditing their own work, or serving in an advocacy role. Information on the audit and non-audit services carried out by the external auditors is detailed in Note 5 to the Group’s accounts.accounts.
during 2010 was conducted. The evaluation used detailed questionnaires and individual meetings were held with each member. Amongst the areas reviewed were the role of the Committee, composition, meetings and processes, performance and reporting, policy and procedures, divisional committees, induction and continuing professional development and communication.
The Committee has considered and discussed the report on the outcomes of the evaluation and is satisfied with the way in which management had satisfied itself that the Groupevaluation has access to sufficient funding and capital overbeen conducted, the next 12 months. The Committee reviewed and challenged the assumptions underlying management's analysis and discussed with the external auditors its review of management's analysis and conclusions.
In January 2011 the Audit Committee undertook an internal evaluation of Group Internal Audit. The Committee sought views from members and attendees of the Committee, the external auditor, Divisional Chief Executive Officers and Finance Directors, Divisional Risk and Audit Committee and subsidiary audit committee Chairmen. The evaluation concluded that the function operated effectively and the Board agreed with these findings. In 2008, the Audit Committee conducted an internal review of Group Internal Audit that involved participants throughout the Group as well as the external auditors. The Audit Committee concluded that the functionhad operated effectively throughout 2010.
Divisional Risk and the Board agreed with the Audit Committee’s findings.Committees
Corporate governance continued | Governance |
Corporate governance continued | Governance |
A company'scompany’s internal control over financial reporting is a process designed by, or under the supervision of, the company'scompany’s principal executive and principal financial officers, or persons performing similar functions, and implementedeffected by the company'scompany’s board of directors, management, and other personnel to provide reasonable assurance regarding the reliability of financial reporting and the preparation of financial statements for external purposes in accordance with generally accepted accounting principles. A company'scompany’s internal control over financial reporting includes those policies and procedures that (1) pertain to the maintenance of records that, in reasonable detail, accurately and fairly reflect the transactions and dispositions of the assets of the company; (2) provide reasonable assurance that transactions are recorded as necessary to permit preparation of financial statements in accordance with generally accepted accounting principles, and that receipts and expenditures of the company are being made only in accordance with authorisations of management and directors of the company; and (3) provide reasonable assurance regarding prevention or timely detection of unauthorised acquisition, use, or disposition of the company'scompany’s assets that could have a material effect on the financial statements.
Corporate governance continued | Governance |
Board Risk Committee Report by Philip Scott, Chairman
Membership
Archie Hunter was a member of the Board Risk Committee until 28 April 2010 when he stood down as a non-executive director at the end of his existing term.
Colin Buchan, Brendan Nelson and I are also members of the Audit Committee. This common membership ensures effective governance across all Finance and Risk issues, and that agendas are aligned and overlap is avoided. The Board Risk Committee and Audit Committee also have strong links with the Remuneration Committee, with particular regard to ensuring that relevant Finance and Risk matters are factored in to the determination of appropriate levels of compensation.
The Board Risk Committee is responsible for:
| providing oversight and advice to the Group, The Royal Bank of Scotland plc and National Westminster Bank Plc Boards (the “Boards”) in relation to current and potential future risk exposures of the Group and risk strategy, including determination of risk appetite and tolerance; |
| reviewing the performance of the Group relative to risk appetite; |
| assisting on such other matters as may be referred to it by the Boards; |
| oversight of the effectiveness of key Group policies, referred to as the Group Policy Framework; |
| promoting a risk awareness culture within the Group; and |
| reporting to the Group Board, identifying any matters within its remit in respect of which it considers that action or improvement is needed and making recommendations as to the steps to be taken. |
The terms of reference of the Board Risk Committee are available at www.rbs.com and these are considered annually by the Board Risk Committee and approved by the Board.
Qualitative and quantitative information regarding the risks arising from the Group's financial instruments required under International Financial Reporting Standard 7 are incorporated within the financial statements and Business review.
Meetings and visits
A total of nine meetings of the Board Risk Committee were held during 2010. Meetings are held as soon as practicable prior to Audit Committee meetings to ensure that the work of the two Committees is coordinated and consistent. A meeting is held immediately prior to submission of the interim and annual financial statements to the Board and the quarterly Interim Management Statements. This core programme is supplemented by additional meetings as required. Board Risk Committee meetings are attended by relevant executive directors, risk management, finance executives and the internal auditors. External advice may be sought by the Board Risk Committee where considered appropriate.
The Board Risk Committee took part in an annual programme of visits to the Group's business divisions and control functions in 2010, along with the Audit Committee. The object of the programme is to allow the Board Risk Committee and the Audit Committee to gain a better understanding of the Group and an invitation to attend is extended to all non-executive directors. The programme of future visits is considered annually. The Board Risk Committee and the Audit Committee undertook six visits in 2010. These were to the Global Banking & Markets business; the Non-Core Division, Global Restructuring Group and the Asset Protection Scheme; Major Change Projects ongoing in the Group; the US Asset-backed Securities business; Risk Management and the Global Banking & Markets, Global Transaction Services and Private Banking businesses in Asia.
Work in 2010
During 2010, the work of the Board Risk Committee focused on a wide range of matters, including the following key areas:
| risk strategy and policy; |
| risk appetite, framework and limits; |
| risk management operating model; and |
In recognitionCorporate governance continued | Governance |
At each meeting of the crisisBoard Risk Committee, the Group Chief Risk Officer provided the Committee with a presentation on the key risk issues faced by the Group. An update was also given on the key issues discussed at the Group’s Executive Risk Forum. In 2010 the Board Risk Committee considered a range of matters including:
| the Group’s economic capital model; |
| the structured credit portfolio; |
| the output of stress testing and scenario planning; |
| the operational plan for the Group’s risk management function including organisation, resource and budget; |
| treating customers fairly and customer complaints; and |
| remuneration strategy and policy, including recommendations to the Remuneration Committee. |
The Board Risk Committee played a key oversight role in global financial servicesthe review, design and implementation of risk management and measurement strategies and risk management policy across the Group.
The Board Risk Committee considered the Group's risk profile relative to current and future Group strategy. The Committee reported to the Board following each meeting on its consideration of the risk profile of the Group and any longer term macro or perceived strategic threats to the Group and made recommendations as appropriate.
The Group Policy Framework provides a basis for ongoing self-assessment of appropriate risk appetite. The Board Risk Committee received regular reports on the development of the Group Policy Framework during 2010.
The Group risk appetite framework was developed significantly during 2010 and continues to be enhanced. Risk appetite was regularly reviewed by the Board Risk Committee, which makes recommendations to the Board on risk appetite and tolerance as part of this ongoing process. This includes the Risk Management Operating Model, including the frameworks for credit, operational, regulatory, market, insurance and business continuity risk.
The Committee also considered the Group's exposure to country, single name and sector concentration risk and ensured rigorous stress and scenario testing of the Group's business was undertaken. The output of this testing was reviewed by the Board Risk Committee throughout 2010 with a view to ensuring appropriate actions were taken where necessary. It made recommendations to the Group Board regarding related authorities, limits and mandates.
In February 2010, the Committee was presented with and approved the RBS Risk Management operational plan, considering the adequacy and effectiveness of resource and the unprecedented losses incurredscope and nature of the work undertaken by the function.
The Committee considered the adequacy and effectiveness of the technology infrastructure supporting the finance and risk management framework.
The Committee reviewed the risk input to divisional bonus pools and provided advice to the Remuneration Committee on risk weightings to be applied to performance objectives which are incorporated within the incentive structure for the Group's senior executives. The Committee also reviewed clawback proposals made by Group Human Resources and made recommendations to the Remuneration Committee in 2008,this respect.
As required under the Walker Review, the Committee will meet as required to review the due diligence of any proposed strategic transaction (involving a merger, acquisition or disposal) prior to the Group Board approval of the transaction.
Performance evaluation
An internal review of the effectiveness of the Board Risk Committee during 2010 was conducted. The evaluation used detailed questionnaires and individual meetings were held with each member. Amongst the areas reviewed were the Role of the Committee, Composition, Meetings and Processes, Performance and Reporting, Policy and Procedures, Divisional Committees, Induction and Continuing Professional Development and Communication.
The evaluation concluded that the Board Risk Committee operated effectively throughout 2010. The Committee was seen as effective in meeting its objectives, although it was acknowledged that this was a relatively new Committee having only been formed in January 2010. The evaluation concluded that the commitment of its members was outstanding, with members willing to spend the time necessary to discharge the Committee's responsibilities. As a new Committee, the structure, content and length of Committee meetings was considered to be appropriate. It was acknowledged that the Committee makes the best use of skills, experience and competencies of its members and a high level of technical expertise was required of members.
The Committee considered and discussed the report on the outcomes of the evaluation and is satisfied with the way in which the evaluation was conducted, the conclusions and the recommendations for action. The outcomes of the evaluation have been reported to the Board and the actions are being progressed.
Divisional Risk and Audit Committees
Since 2005, Divisional Audit Committees have been responsible for reviewing each division's business. Following the creation of the Board Risk Committee in January 2010, the Group’s Divisional Audit Committees became Divisional Risk and Audit Committees and their terms of reference were revised to ensure full alignment with the Audit Committee and Board Risk Committee. With input from the Audit Committee, Board Risk Committee, Group Finance and Group Risk, a new framework was approved by the Audit Committee and Board Risk Committee in December 2010 and implemented in January 2011.
Philip Scott
Chairman of the Board Risk Committee
23 February 2011
| Letter from the Chair of the Remuneration Committee | Governance |
Dear Shareholder,
I am pleased to be presenting the Group’s Remuneration Report for 2010.
During the year, the Remuneration Committee has been working withbuilt on the executive to bring about fundamental changeprogress made during 2009 when significant changes were made to the waystructure of rewards to staff following a thorough review of remuneration workspolicy. We have continued to embed these practices throughout the Group. Thereorganisation to ensure that they are aligned with good corporate governance and robust risk management.
Our focus is to ensure that our remuneration policy continues to support delivery of the Group’s Strategic Plan. We are working hard to complete a hugely challenging and complex turnaround and are on track to deliver across a range of measures. The Group plays an obviousimportant economic role, both as an employer and a lender. If we are going to achieve our strategic objectives and deliver a return to our shareholders including the UK taxpayer, we need for very significant changetalented and motivated management and employees. This requires us to compensationpay them fairly within the context of the markets in which they operate. In setting pay policy, and practice across the industry and we intend that the Group will lead that process in consultation with our major shareholders.
As we embark on a process of change, our approach has sought to balance the realitytake account of our current situation with the needduties to offer a competitive remuneration package for teamsshareholders and individualsour strategic objectives and seek to ensure that shareholder interests are performing well and in a manner that is sustainable in the long-term. Achieving this balance is essential to our task of rebuilding the Group's standalone strength as well as repaying the support of the UK taxpayers.
In previous years the Directors’ Remuneration Report has described how remuneration policies are being implemented for executive directors, but given the exceptional circumstances, I would like to take this opportunity to describe in greater detail how the Group is approaching remuneration for all employees.
Immediate key decisions taken by the Group were as follows:
· | There have been no discretionary cash bonuses for any employees for performance in 2008. No bonuses have been paid to anyone directly associated with the Group’s major losses. There are some limited contractual commitments to pay bonuses, typically as part of an agreement on recruitment, and these have been honoured. |
· | Where there has been exceptional performance by key individuals and teams, employees have been given deferred bonus awards. These awards will be released in three instalments in 2010, 2011 and 2012, in the form of RBS Group subordinated debt, by which time we hope the Group will be well on its way to standalone financial strength. |
If the performance on which these deferred bonus awards was based later turns out to have been materially different or if there is subsequent material loss or reputational damagenot damaged as a result of activitystaff retention, recruitment or motivation issues. Our commitment is to reward success not failure, and we are also very conscious of the need to demonstrate restraint.
Across the Group we operate a range of incentive structures which are designed to reinforce messages about what employees are being asked to achieve, and deliver pay for performance. Our key objective in determining bonus awards is not to pay more than is warranted given business performance. In this context performance includes financial and non financial measures, risk performance and any other relevant factors. Our aggregate bonus awards for 2010 are lower than prior year as a result of lower profits and bonuses in the deferral period,investment banking division and our recognition of the need for moderation. There is clear focus on differentiation, so that individually and by business, the best performers and the best performance will continue to be rewarded. There is strong central governance and oversight of both bonus pools and individual awards, and each year a significant proportion of staff will receive zero bonus.
The key elements of our remuneration policy are:
Pay for performance
Performance related pay is designed to reflect success or otherwise atfailure against the discretionrange of targets which we set for our people, taking into account the context in which results were achieved. By way of example, the pay arrangements for executive directors are aligned to the performance of the Group and performance related pay is paid entirely in shares over several years. Executive directors have “no reward for failure” provisions in their service contracts.
Performance management
We operate a structured process to ensure that all employees have clear objectives that are linked to long-term plans designed to drive business objectives including financial performance, risk, people and customer measures. Assessment of individuals’ performance is subject to a rigorous review of achievements against their objectives.
Risk adjustment
Focus on risk is achieved through clear risk input into incentive plan design and target setting, as well as a thorough risk review of performance, bonus pools and clawback. The Remuneration Committee has been supported in this by the Board Risk Committee and the RBS Risk Management function.
Deferral
The Remuneration Committee is acutely aware of the external focus on the role of incentive payments in the financial sector. The reality is that these remain a key part of the structure of pay across the industry. However, we have radically reformed our incentive plans. For our more senior employees annual awards are deferred over three years and a portion of the awards are paid in shares which increases alignment with the interests of shareholders. There will be a £2,000 cap on cash bonuses paid in March 2011, as was the case last year.
Clawback
We have had clawback provisions in place since 2009, which means that, in certain circumstances, the Group can reduce deferred annual incentives and long-term incentive awards up to the point they are released. Clawback allows us to respond appropriately if the performance factors on which reward decisions were based turn out not to reflect the corresponding performance in the longer term.
Shareholder consultation
In early 2011, we consulted extensively with institutional shareholders and other stakeholders on our remuneration approach. The consultation process involved one to one meetings and a roundtable session hosted by the Association of British Insurers and National Association of Pension Funds. Our presentation covered our wider remuneration policy as well as executive directors’ remuneration and we have been pleased with both the level of engagement with investors and the positive feedback we have received.
Topics discussed with investors included pay positioning, scale and design of incentive structures, risk alignment of remuneration, deferral, clawback and remuneration disclosures. We have listened to the feedback from investors and have made a number of enhancements to disclosures in the Remuneration Report as a result.
Investors recognised the difficult challenge faced by the Remuneration Committee then partin positioning pay competitively to support business goals, while being mindful of these awards may be reduced or cancelledthe wider economic environment and the need to show restraint. The Remuneration Committee and the Board have considered carefully their responsibilities and have applied judgement to achieve a balance whereby remuneration policy supports business goals without payment (‘clawback’).causing unacceptably high people risks.
· | No profit share payment has been made for financial year 2008 andLetter from the scheme has been withdrawn going forward. We have made changes to benefits for some employees below manager level as partChair of the transitional arrangements to end the annual entitlement to profit share bonuses.Remuneration Committee continued | Governance |
· | Annual base salary increases in 2009 will be made to a limited number of employees and salary increases will be below inflation for all businesses across the Group. |
No bonuses have been paid toThe retention and motivation of our executive directors in relationis crucial over the next three years and whilst most aspects of our remuneration policy remain unchanged, we are making some changes to 2008 performance,enhance the overall effectiveness of executive director remuneration. These include replacing the annual incentive plan with a long-term Share Bank and no deferred awards have been made. Over the past four years, the long term incentive awards granted under the Medium Term Performance Plan have lapsed duechanges to the performance criteriameasures for the Long Term Incentive Plan (LTIP). We have introduced a scorecard of measures relating to risk and strategic goals to sit alongside the existing measures of total shareholder return and economic profit. These measures ensure that rewards for executive directors are aligned with achieving a sustainable long-term platform for the future success of the Group across a range of areas including risk, profitability, franchise strength and people. Details of these changes are set out in the Remuneration Report.
While the primary focus of the remuneration policy clearly has to be to support the business to deliver the Strategic Plan, some shareholders asked for reassurance that the Remuneration Committee had in place sufficient tools to be able to adjust remuneration appropriately should another financial crisis occur. I am pleased to confirm that a huge amount of progress has been made in this respect.
The starting point is making sure we set the right objectives in the first place. Risk is a key factor when setting annual and long term objectives and an independent review of risk objectives is undertaken by the RBS Risk Management function and the Board Risk Committee. At the end of each performance period, performance outcomes and bonus pool proposals are subject to rigorous review by the control functions, independent of the businesses/divisions. Our LTIP also has a risk underpin whereby awards will not being met.
In respect of 2009,vest unless the Remuneration Committee is satisfied on risk performance. Both annual and long term awards are subject to clawback and, accordingly, the Remuneration Committee has made key decisions in relationdiscretion to reduce the number of shares under award or determine that no shares will vest.
Changes to approach
In addition to the changes made to executive directors’ remuneration of executive directors:arrangements, the Remuneration Committee reached decisions on the following key areas during 2010:
| There will be no base salary increase in 2009.establishing a governance framework for incentive plans and bonus funding across the Group, involving the Finance, Risk and Human Resources functions at all key decision points; |
| Any bonus earned in 2009 will be deferred and subject to clawback provisions. |
· | No further payments will be made under the company’s Profit Sharing Schemea structure of deferment for 2009 onwards. |
· | Annual incentives for 2009 will be based on performance against a framework of measures, with all payments deferred for up to three years, with potential clawback.the ability to clawback if appropriate; and |
| The exceptional maximum annual incentive opportunity will not be available.the introduction of a new Long Term Incentive Plan following consultation with a number of institutional shareholders. |
· | The individual performance management processes will be strengthened at executive levels. This includes a revised performance scorecard. The five performance areas are strategic direction, finance and operations, stakeholder management (including employee and customer satisfaction), efficiency and control, and capability and development. |
The new LTIP received the approval of over 99% of shareholders at the Annual General Meeting in 2010, and at the same meeting the Remuneration Report received overwhelming shareholder support.
· | Long term incentive awards will continue to be made under the Medium-term Performance Plan and the Executive Share Option Plan but the level of awards will be lowered compared to 2008. All awards will only vest if stretching performance conditions are met in three years’ time. |
External developments· | The provision for an undiscounted pension on early retirement at employer request will not apply to any executive director appointed in the future. |
A number of external developments have impacted remuneration and remuneration policy in 2010, including the publication of the FSA’s revised Remuneration Code (the “FSA Code”). In light of the FSA Code, a review was undertaken of the remuneration policy and governance arrangements. I am pleased to report that the Group has been fully compliant with all aspects of the FSA Code from 1 January 2011.
The Remuneration Committee recognisessupports the UK Government’s position that an international approach is required in relation to regulation on remuneration and disclosure. To rebuild the value of the company, an international level playing field that allows the Group and other UK banks to compete fairly with international competitors is essential.
On 9 February 2011, the UK Government issued a statement in connection with Project Merlin, which represents commitments by the UK’s four largest banks, including the RBS Group, on matters including lending, shareholder engagement and pay disclosures. The banks have agreed that aggregate UK bonus pools will be lower than last year reflecting consideration of the public mood and engagement with key stakeholders. Furthermore, as a result of the Project Merlin agreement, we are disclosing in this year’s Remuneration Report the pay of our two executive directors and the pay of the five highest paid senior executive officers. The Remuneration Committee has also reviewed the remuneration of the ten highest paid staff in each of the Group’s performancedivisions.
Throughout 2010 we continued to work through a period of unprecedented restructuring. The Group has not only impacted its shareholdersdelivered remuneration arrangements that are FSA compliant, take proper account of the public mood and customers, but also its employeescall for restraint and support the overarching objective of maximising shareholder returns and delivering a profit for the taxpayer. Importantly, these arrangements are consistent with the Project Merlin agreement.
On behalf of the Remuneration Committee I would like to place on record our sincere appreciation for our people who have worked so verycontinued to focus on service to our customers, managing risk and driving the performance of our core and non-core businesses. Our people are working hard over many years to build an organisation of which they were proud and which provided a secure livelihood for them and their families. The Board deeply regrets that our employees’ trust has been eroded and their welfare affected during the last year. While it is both necessary and appropriate that we adopt stringent measures for employee compensation, we are more mindful than ever of the need forhelp return the Group to continuefinancial strength and the Remuneration Committee is committed to develop the best employment practicescreating an environment in our industry to enable us to retain and recruit outstanding talent. This is critical to the delivery of our strategic plan and to build a sustainable and successful Group for the future.which they can meet their ambitions.
Colin Buchan
ChairmanPenny Hughes
Chair of the Remuneration Committee
2523 February 20092011
| Directors’ remuneration report | Governance |
Membership of the Remuneration Committee
For certain recent developments relating to matters discussed in this report, which is dated 25 February 2009, you should read the “Recent Developments” section of this document.
The current members of the Remuneration Committee are Colin Buchan (committee chairman)Penny Hughes (Chair since 1 June 2010), Sandy Crombie, and John McFarlane and Philip Hampton.McFarlane. The members of the Remuneration Committee compriseare all independent non- executive directors, together with thenon-executive directors. Colin Buchan stepped down as Chairman of the Board.
During 2008, Jim Currie, Janis Kong, Sir Tom McKillop, Bob Scott and Peter Sutherland were membersmember of the Remuneration Committee.Committee on 1 June 2010. Attendance of each member at meetings of the Remuneration Committee in 2010 is shown on page 178.
Responsibilities
The Remuneration Committee makesis responsible for setting the Group’s policy on remuneration and overseeing its implementation, considering executive remuneration and making recommendations to the Group Board onin respect of the remuneration arrangements forof the executive directors and the Chairman. The Board as a whole reserves the authority to make the final determination of the remuneration of directors as it considers that this two-stage process allows greater consideration and evaluation and is consistent with the unitary nature of the Board.Group. No director is included in decisions regarding his or her own remuneration.
The Remuneration Committee is also approvesresponsible for setting the remuneration arrangements for members of senior executives below Board levelthe Group’s Executive Committee and Management Committee, as well as all higher-earning employees and any employees falling within the definition of “Code Staff” under the FSA Code. Details of the FSA Code can be found at www.fsa.gov.uk.
The Remuneration Committee undertakes a regular review of the adequacy and effectiveness of the remuneration policy to ensure it is fully aligned with the Group's long-term objectives. The Committee receives a number of reports to assist it in its oversight of remuneration policy, such as on risk and financial performance across the Group.
In determining directors’ remuneration, the Remuneration Committee has taken into account pay and employment conditions of employees of the company. It does this using an analysis of annual market data against an assessment of the competitiveness of current base salary ranges or benchmarks and actual salaries in payment. Salary increases for executive directors are also considered in the context of salary increases for the wider employee population.
The Remuneration Committee considers remuneration in the context of the wider Group agenda such as talent development and the external market environment. The Remuneration Committee recognises that remuneration is only one aspect of the value proposition which the Group presents to our employees, and that engagement, flexibility and career development are important factors. It has received in-depth presentations from Human Resources functions in the USA and Asia so as to have a better understanding of the unique issues in these areas. Penny Hughes has also attended a number of external meetings and workshops with organisations such as Women in Business and the Young Bankers’ Association to gain a broader understanding of the people agenda.
The Remuneration Committee also receives regular updates on regulatory developments and general remuneration issues, as well as market and benchmarking data from its remuneration advisors to support its decisions.
In December 2010, the Asset Protection Scheme Performance and Reward Committee (APSPRC) was formed. It is responsible for reviewing, reporting and, in certain cases, making recommendations to the Remuneration Committee in respect of (i) collective overall and individual performance of individuals who manage business units or assets which are assigned to or participate in the Asset Protection Scheme (APS), and members of the Group Executive Managementexecutive against the APS performance targets; (“APS In-Scope employees”) (ii) the individual proportion of the incentive and bonus components of the remuneration of those employees to be evaluated against APS performance targets for each calendar year and (iii) whether clawback should be applied to any deferred compensation elements of the remuneration of those employees prior to their vesting.
The Remuneration Committee onconsiders recommendations and reviews reports from the recommendationAPSPRC and is responsible for determining the remuneration of APS In-Scope employees.
Remuneration advisors
On 14 September 2010, the Remuneration Committee appointed PricewaterhouseCoopers LLP (“PwC”) as its remuneration advisors, replacing Towers Watson. PwC were appointed after a formal selection process of panel interviews following the submission of detailed written proposals by a number of remuneration advisors. One aspect taken into account as part of the selection process was that the remuneration advisors be signatories to the voluntary code of conduct in relation to executive remuneration consulting in the UK. Both PwC and Towers Watson are signatories to the code of conduct and the relationship between the Remuneration Committee and both companies takes account of this.
During the year, as well as advice received from Towers Watson and PwC, the Committee took account of the views of the Group Chairman, Philip Hampton; Group Chief Executive, and maintains high level oversight of the application of remuneration policy below this level. The Committee oversees annual incentive plans and reviews all long-term incentive arrangements operated by the Group.
The non-executive directors’ fees are reviewed annually by the Board, on the recommendation of the Chairman of the Board. The level of remuneration reflects the responsibility and time commitment of directors and the level of fees paid to non-executive directors of comparable major UK companies. Non-executive directors do not participate in any incentive or performance plan; with the exception of the Chairman, more details of which can be found on page 143. It has been agreed that no increase to non-executive directors’ fees will be made in 2009.
During the year, the Remuneration Committee received advice from Watson Wyatt and Mercer on matters relating to directors’ remuneration in the UK and US respectively, together with advice from theStephen Hester; Group Director, Human Resources Directors, Neil Roden (until October 2010) and Elaine Arden (from October 2010); the Group General Counsel and Group Secretary, Miller McLean (until April 2010); and the Group Secretary, Aileen Taylor (from May 2010). Advice was received from Nathan Bostock, Head of Restructuring and Risk, on general remuneration matters. In addition,risk-adjustment of measures for bonus pool funding and a risk review of individual performance evaluations for the Management Committee. The Chairman of the Board Risk Committee, Philip Scott, also attended a Remuneration Committee has taken account ofmeeting to advise the views of the Group Chief ExecutiveCommittee on performance assessment of the executive directors and members of the Group Executive Management Committee.matters relating to risk adjustment.
Watson WyattPwC also providedprovides professional services in the ordinary course of business including assurance, advisory, tax and legal to subsidiaries of the Group. Towers Watson also provides actuarial advice and benefits administration services to subsidiaries of the Group and investment consulting and actuarial advice to the trustees of some of the Group’sGroup's pension funds. Mercer provided advice and support in connection with a range of compensation benefits, pension actuarial and investment matters. The advisersadvisors to the Remuneration Committee are appointed independently by the Committee, which reviews its selection of advisers annually. The Committee is notified of any work that is being undertaken by its advisors and is satisfied that there are processes in place to ensure that the consultants from Watson Wyattadvice it receives is independent.
Directors’ remuneration report continued | Governance |
Performance evaluation
An internal review of the effectiveness of the Remuneration Committee during 2010 was conducted. The evaluation used detailed questionnaires and Mercer who adviseindividual meetings were held with each member. Amongst the areas reviewed were the role of the Committee, operate independentlycomposition, meetings and processes, continuing professional development and communication.
Generally, the Committee was considered to be effective and meeting its objectives, with members willing to spend the time necessary to discharge their responsibilities. Whilst the Committee was viewed as being of the consulting teams undertaking otherright size and headed by a strong Chair, composition will be kept under review to maintain the correct balance of skills and experience. Improvement in the quality of Committee papers was acknowledged, although work is being undertaken to deliver further improvements. The importance of a strong link between the Committee and the Board Risk Committee was recognised and, whilst it was acknowledged that this relationship was working well, it was agreed that further improvements should be actively considered.
The Committee has considered and discussed the report on the outcomes of the evaluation and is satisfied with the way in which the evaluation has been conducted, the conclusions and the recommendations for actions. The outcomes of the evaluation have been reported to the Board and the actions are being progressed.
Group-wide remuneration policy
The Remuneration Committee has reviewed the Group's remuneration policy which is anticipated will apply in 2011 and in subsequent years.
The remuneration policy supports the Group's business strategy and is designed to:
| attract, retain, motivate and reward high calibre employees to deliver superior long-term business performance; and |
| ensure that the Group's metrics, reward structures and governance processes as a whole provide coverage of the key risks in an appropriate way. |
The key principles underpinning the remuneration policy are set out below:
Reward is linked to business and individual performance and appropriate account is taken of risk factors associated with that business, including where appropriate risks associated with the sustainability agenda.
Reward structures are designed to offer value for money in the markets where the Group operates. Both annual compensation and total compensation are set around market median competitiveness although our pay-for-performance policy allows for higher pay for the highest performers.
The composition of reward generally allows for customisation through individual choice, in order to maximise value delivered to employees.
Governance
There is a robust governance framework in place to ensure that reward design and delivery complies with appropriate policy, standards, and meets relevant regulatory requirements.
The Remuneration Committee undertakes an annual review of the adequacy and effectiveness of the remuneration policy to ensure it is fully aligned with the Group’s long-term objectives. There is also a key role for the RBS Risk Management function in the management and oversight of reward structures and decision-making. The Remuneration Committee will consider any issues raised by the Board Risk Committee prior to approving the policy.
The individual elements of employees' remuneration packages are as follows:
Base salary
Base salaries should be appropriate in the specific market for the business in which an individual works and also reflect the talents, skills and competencies that the individual brings to the Group. There should be a sufficient level of fixed pay so that inappropriate risk-taking is not encouraged.
Annual incentives
Annual incentives are designed to reward good financial and non-financial performance that supports the business strategy, taking into account the Group’s risk appetite and personal contribution in the context that it was delivered.
The approach to determining an appropriate annual incentive pool is based around four technical workstreams led by the central control functions (Finance, Human Resources and RBS Risk Management). The workstreams provide context around how much a market-competitive/on target pool would be on financial performance, on risk performance, on capital adequacy and on the impact of incentive awards on the balance sheet.
Performance is central to the determination of annual incentive pools. Performance assessment is based on a balanced scorecard of measures including financial performance, risk, people and customer measures.
Overall expenditure on annual incentives is reviewed by the Remuneration Committee at the end of each year taking into account the performance of the business on the basis described above. This is further scrutinised on a divisional and functional basis based on a range of different efficiency and risk adjusted profit measures including changes in Economic Profit for shareholders.
Allocation of any variable reward from the pool depends on divisional, functional and individual performance against the performance measures set at the beginning of the year. Individual performance assessment is supported by a structured performance management framework. Targets should be specific, measurable, set at the beginning of the year and communicated to the employees.
The Group only uses guaranteed bonuses in limited circumstances in accordance with the FSA Code.
Directors’ remuneration report continued | Governance |
Deferred awards
The purpose of deferred awards is to support a performance culture where employees recognise the importance of sustainable Group, business and individual performance. Under the Group-wide deferral arrangements a significant proportion of annual incentive awards for our more senior employees will be deferred over a three year period. Deferred awards are subject to clawback.
A new deferral plan was approved by shareholders on 15 December 2009. Under this plan, annual incentives are deferred into awards vesting over a three year period. A significant portion of deferral is in a form which meets regulatory requirements.
Long-Term Incentive Plans
To encourage the creation of value over the long term and to align the rewards of the participants with the returns to shareholders, the
Group provides employees in senior roles (executive level and selected senior management) the opportunity to receive annual awards of long-term incentives.
A new Long-Term Incentive Plan was approved by shareholders on 28 April 2010, under which awards are structured as performance-vesting shares. For the most senior roles, vesting will be based partly on divisional or functional performance and partly on performance across the Group.
Awards will not vest unless the Remuneration policy
ItCommittee is satisfied that risk management during the performance period has been agreed with HM Treasury that, in additioneffective at a Group and division/functional level. The Remuneration Committee's determination will be informed by input from the Group Chief Risk Officer and the Board Risk Committee. Specifically, prior to complying with the Association of British Insurer's best practice code on remuneration,vesting, the Remuneration Committee will have regard to risk and compliance across the Group and divisions and make an assessment of future risks as appropriate.
All awards are subject to clawback.
Pension arrangements
The Group aims to provide competitive retirement benefits. Since October 2006, UK employees have been eligible for a cash allowance in lieu of pension provision and have had the facility to choose to have part of their remuneration in the form of contributions to The Royal Bank of Scotland Group Retirement Savings Plan. A little over one half of UK employees continue to work to ensure that futureparticipate in defined benefit pension arrangements.
Executive remuneration arrangements are linked to long-term value creation in line with the Group’s business strategy, with appropriate account taken of risk and avoiding a bias towards short-term indicators such as profit or revenues. The company is also actively engaged in discussions with the Financial Services Authority (FSA) in relation to remuneration policies and practices across the banking sector and intends that any remuneration policies should take account of the FSA’s remuneration design criteria.
Accordingly, in conjunction with the Board and independent advisers and in consultation with shareholders, the Remuneration Committee is undertaking a comprehensive review of its remuneration policy which it will complete during 2009.
UK-based executive directors’ remuneration balance
The chart above shows the make up of remuneration opportunity for on- target annual performance, and with long term incentive awards shown at their fair value at the date of grant. Short term incentive payments earned in relation to 2009 performance will be deferred and will vest, subject to satisfactory performance, over the following three years. The actual value of the share option and MPP awards will depend on performance over the period 2009 – 2011 and the share price at the time awards vest.
Components of executive directors’ remuneration 2009
UK based directors
Salary
Base salaries of executive directors have beenare reviewed and itannually. It has been agreed that the Group Chief Executive will receive no increasesincrease in base salariessalary in 2011. The annual salary for the Group Finance Director will be made as part of the annual 2009 review.increased from £725,000 to £750,000 with effect from 1 April 2011.
Benefits
Executive directors are eligible to receive various employee benefits or a cash equivalent from a flexible benefits account, on a similar basis to other employees.
Details of pension arrangements of directors are shown on page 152. Where cash allowances are paid in place203. Gordon Pell retired from the Group and the Board on 31 March 2010, shortly after his normal pension age of pension accrual (or60. Details of his pension accrual on salary over the pension earnings cap), they are shown on page 147. Executive directors also receive cover for death-in-service benefits.in this report. Following Gordon Pell's retirement, no current director is a member of the Group's defined benefit pension plans.
For all executive directors joining on or after 1 October 2006, pension provision is in the form of a pension allowance which may be used to participate in The Royal Bank of Scotland Group Defined Contribution Pension FundRetirement Savings Plan which is open to all employees, or to invest in alternative pension arrangements, or to take all or some of the allowance in cash. In addition, as employees, executive directors are eligible to participate in Sharesave and Buy As You Earn schemes.plans. These schemesplans are not subject to performance conditions since they are operated on an all- employeeall-employee basis. Executive directors also receive death-in-service cover.
In addition to salary and benefits, executive directors receive variable remuneration in the form of annual and long-term incentives.
Annual incentives
NoFollowing consultation with UKFI and other institutional shareholders, a Share Bank arrangement has been put in place for the executive directors’ annual incentive has been awarded to anyawards for 2010 and 2011. The Share Bank arrangement replaces the previous annual incentive arrangement and means that the executive director in relation to 2008 performance.directors will receive no cash bonus.
UK-based executive2010
The 2010 targets covered progress against the Strategic Plan, financial performance, risk efficiency and control measures as well as stakeholder and people management. Executive directors have a normal maximum annual incentive opportunity of between 160% and 200% of salary (with an exceptional maximum opportunity of 200-250%250% of salary). The on-target opportunity is 107% to 133% of salary.
The Remuneration Committee has determined that,reviewed the annual incentive awards for the executive directors for 2010 performance, taking into account performance against targets set at the beginning of 2010. Performance was assessed across a broad range of quantitative and qualitative measures and was supported by a robust performance management framework including a formal half year review.
During 2010, performance has been strong and all the Group's main performance indicators are ahead of the Strategic Plan both in terms of timing and outcomes. There are, however, a small number of areas where the Group is not performing well ahead of the targets which have been set. Accordingly, the Remuneration Committee has recommended, and the Board (excluding executive directors) has agreed, that the Group Chief Executive and Group Finance Director should receive annual incentive awards of 170% and 186% of salary respectively.
Directors’ remuneration report continued | Governance |
For 2010 performance, the executive directors’ annual incentive will be delivered entirely as an allocation into Share Bank. The allocated shares will vest in two equal tranches in March 2012 and 2013, and must then be held for a further six months. The Group Chief Executive has voluntarily agreed to a total holding period of twelve months after vesting. Clawback provisions will again apply prior to vesting of the shares.
2011
The maximum potential allocation of shares in respect of the 2011 financial year ending 31 December 2009,under Share Bank will be 6.0 million shares for the exceptionalGroup Chief Executive and 3.75 million shares for the Group Finance Director. These allocations were agreed, following consultation with shareholders at the beginning of 2011. The potential allocations represent normal maximum incentive opportunity will not be available.
Any annual incentive payments earned in 2009levels for executive directors based on the share price prevailing at the start of the consultation period and will be deferred and releasedassessed for final allocation in equal annual instalments over three years. The Remuneration Committee will reserve the right to review performance prior to each element of deferred incentive vesting and reduce the proportion2012 on that vests if there is evidence that the financial performance for 2009 was materially inaccurate or there is a material loss or reputational damage as a result of activitybasis. Depending on share price movement during the deferral period.performance period, the value of the final allocation could further increase or decrease.
Any incentive payments to executive directorsBetween 0% and 100% of the maximum potential allocation will be formally allocated into Share Bank in 2009 will reflectMarch 2012 based on 2011 performance across five performance categories: Strategic Direction, Financestrategic direction; business delivery and Operations, Stakeholders, Efficiencyfinancial performance; stakeholders (including delivery against UK government lending commitments); risk and Controlcontrol; and Capabilitycapability and Development. Group business unitdevelopment. Fixing the number of shares in this way avoids unintended consequences arising from share price volatility around award dates and functionalprovides a clear alignment with shareholder interests through the year.
The Remuneration Committee will determine the actual allocation to Share Bank by reference to the extent to which executive directors have met the performance targets. Shares allocated in respect of 2011 performance will vest in two equal tranches in March 2013 and 2014 respectively. Clawback provisions will apply to shares allocated to Share Bank for the period prior to their vesting.
Share awards made as part of Share Bank will be considered as appropriate.delivered under the rules of the Deferral Plan approved by shareholders in 2009.
An illustration of Share Bank for the 2011 performance year is set out below:
To comply with the FSA Code, shares will be subject to a holding period of six months after vesting.
Long-term incentives
The companyGroup provides long-term incentives which are designed to link reward with the long-term success of the Group and recognise the responsibility participants have in driving its future success and delivering value for shareholders.
Performance conditions attaching to awards made to executive directors under the LTIP in 2010 are shown on page 200.
As in 2010, awards in 2011 will be granted under the LTIP, and will be entirely in the form of shares (rather than share options and share or share equivalent awards. Their objective isoptions).
Awards to encourageexecutive directors have a normal maximum limit of 400% of salary. Whilst the creationaward policy for executive directors may be increased in exceptional circumstances, prior shareholder consultation would be undertaken.
Awards granted to executive directors in 2011 will be capped at 375% of agreed salary.
Performance criteria for awards granted to executive directors under the LTIP in 2011
Performance conditions for the 2011 LTIP awards have been chosen not only to align executive directors directly with outcomes for shareholders but also with those key actions required to deliver shareholder value over the long term and to align the rewards of the executive directors with the returns to shareholders. The Remuneration Committee is formulating proposals under which awards may be madefactor in the future under two plans;growing regulatory emphasis on risk-adjusted financial metrics. The four performance measurement areas set out below are equally weighted:
| Relative Total Shareholder Return (TSR) (25%); |
| Core Bank Economic Profit (25%); |
| Balance Sheet & Risk (25%); and |
| Strategic Scorecard (25%). |
The four performance conditions attached to the Medium-term Performance Planawards (see description of performance conditions on pages 193 to 195) will each have the ability to deliver a number of shares worth up to 100% of salary (based on agreed salary at date of grant and share price based on a five day average prior to grant); however, the Executive Share Option Plan. Any awardsnumber of shares that vest will be subject to rigorousan overall cap in value of 375% of salary (again, based on agreed salary and share price at the time the award was made).
There is an underpin to the performance conditions on which shareholderswhereby awards will only vest if the Committee is satisfied that risk management during the performance period has been effective and that financial and non-financial performance has been satisfactory, in line with the Strategic Plan. In assessing this, the Committee will be consulted.advised independently by the Board Risk Committee.
Medium-term Performance Plan192
Directors’ remuneration report continued | Governance |
Relative TSR (applying to 25% of overall 2011 LTIP award in total)
Relative TSR has been retained in the LTIP to provide a direct connection between the reward provided to executive directors and the relative performance delivered to our shareholders.
The Medium-term Performance Plan was approvedrelative TSR performance condition is identical to that applying for 2010 LTIP awards. The relative TSR measure compares the Group’s performance over a three year performance period against a basket of banks from the UK and overseas, weighted towards those companies most similar to the Group.
The companies in the comparator group for 2011 awards are as follows:
| Comparator companies | Weighting |
| 1 | Barclays | 200% |
| 2 | Lloyds Banking Group | |
| 3 | Santander | 150% |
| 4 | HSBC | |
| 5 | Standard Chartered | |
| 6 | Citigroup | 100% |
| 7 | Deutsche Bank | |
| 8 | JP Morgan Chase | |
| 9 | Bank of America | 50% |
| 10 | BBVA | |
| 11 | BNP Paribas | |
| 12 | Credit Agricole | |
| 13 | Credit Suisse Group | |
| 14 | National Australia Bank Limited | |
| 15 | Royal Bank of Canada | |
| 16 | Societe Generale | |
| 17 | The Toronto-Dominion Bank Group | |
| 18 | UBS | |
| 19 | Unicredito | |
| 20 | Wells Fargo & Company | |
To receive any of the LTIP awards subject to this performance measure the Group’s performance must be at least as good as the median of the comparator companies, with vesting as follows:
| 20% of the award will vest if the Group’s TSR is at the median of the companies in the comparator group. |
| 100% of the award will vest if the Group’s TSR is at the upper quartile of the companies in the comparator group. |
A pro-rata proportion of the award will vest in between these points.
Core bank Economic Profit (applying to 25% of overall 2011 LTIP award in total)
At the end of the performance period for these awards, the value of the Group will be determined by the Core bank’s ability to generate enduring returns for shareholders. For this reason for the 2011 LTIP awards the Economic Profit measure is focused on the Core bank. The focus on Core bank Economic Profit ensures that performance reflects enduring earnings for the bank, while the Balance Sheet & Risk targets capture performance of Non-Core.
Economic Profit, being a risk-adjusted financial measure, is consistent with the FSA Code, and also provides a balance between measuring growth and the cost of capital employed in delivering that growth.
Directors’ remuneration report continued | Governance |
Core bank Economic Profit is defined as return attributable to shareholders in April 2001. Each executive director is eligible for an annual awardless equity multiplied by the cost of equity:
| return attributable to shareholders is Core Operating Profit reported in the financial statements, excluding fair value of own debt and APS, taxed at a standard tax rate of 28%. |
| equity is defined as tangible equity allocated to the Core businesses, with adjustments to strip out distorting impacts arising from fair value of own debt, available-for-sale reserves, cashflow hedging reserve, and APS. |
| current cost of equity is 12%, which is subject to review at least annually. |
Targets have been set so that maximum vesting under the plan in the form of share or share equivalent awards. Whilst the rulesawards is only achieved for performance ahead of the plan allowGroup’s refreshed Strategic Plan. 25% of this portion of the award will vest at threshold performance. Threshold vesting requires average return on tangible equity over the performance period at a reasonable margin above the cost of capital.
Due to the commercially sensitive nature of these targets details of the actual targets, and performance against these, will be disclosed retrospectively once the award vests.
Balance Sheet & Risk and Strategic Scorecard (applying to 50% of overall 2011 LTIP award in total)
For the 2011 awards, 25% of the overall award will vest based on achievement of Balance Sheet & Risk targets and 25% of the overall award will vest on achievement of Strategic Scorecard targets, over shares worth upa three year period.
These measures have been chosen to onecomplement the Core bank Economic Profit and Relative TSR measures in aligning the LTIP with the advancement of the strategic position and capability of the organisation and the building of a half times earnings,sustainable business. The 2011 measures will have a particular focus on risk reduction, the resolution of the Non-Core business and the building of a sustainable and responsible franchise for the Group.
To ensure that the Group is positioned to deliver sustainable value for shareholders beyond the initial turnaround timeframe, the balanced Strategic Scorecard rewards management for delivering a robust basis for future growth in terms of the strength of our franchise, efficiency, reputation, and the strength and engagement of our employees.
For the first of these awards, the Remuneration Committee has adopted a policywill assess and judge performance against the measures set out below.
| Performance measures |
Balance Sheet & Risk measures and targets | Non-Core assets |
| Cumulative Non-Core loss |
| Group Core Tier 1 Capital |
| Wholesale funding |
| Liquidity reserves |
| Leverage ratio |
| Loan to deposit ratio |
| Risk Appetite Framework |
| Funded assets |
| Attributes driving credit rating |
Strategic Scorecard measures and targets | UK Retail and Commercial franchise |
| US Retail and Commercial franchise |
| Investment Banking franchise |
| Measures from Group’s customer dashboard |
| Cost:income ratio in Core bank |
| European Commission divestments |
| Sustainability |
| Relative Economic Profit Growth |
| Progress in people issues |
| Embed strategic thinking, balanced business evolution |
| Majority of Group’s divisions to have met the ‘5 tests’ at heart of the Strategic Plan |
Where possible, quantitative strategic measures will be used. However, it is also important to the Group to focus on qualitative measures which consider issues such as reputation, customer excellence, organisational capability and sustainability given these will support the long term goals of granting awardsthe business.
Targets for each measure will be set at the start of the performance period. Where applicable these will be aligned with the bank’s published Strategic Plan targets. At the end of the period each measure will be assessed against the target, and vesting will be based on the proportion of targets fully met (see below), qualified by Remuneration Committee discretion taking other relevant factors into account. Consideration will also be given to volume of lending over the performance period, subject to commercial viability.
To avoid unintended consequences, the scorecard will not be set in a multiple of salary. No changesformulaic manner, but will provide a framework for structured Remuneration Committee discretion, which will be madesupported by disclosure at the end of the performance period justifying the vesting decision arrived at. In addition, commentary will be provided on an annual basis in relation to this policy without prior consultation with shareholders.progress against targets (where not commercially sensitive).
| Vesting point | | Indicative performance |
| Does not meet | 0% | Over half of objectives not met |
| Partially meets | 25% | Half of objectives met |
| Significantly meets | 62.5% | Two-thirds of objectives met |
| Fully meets | 100% | Objectives met or exceeded in all material respects |
Qualified by Remuneration Committee discretion taking into account changes in circumstances over the performance period, the relative importance of the measures, the margin by which individual targets have been missed or exceeded, and any other relevant factors. |
The award levels for 2009 will be reduced from the policy applied for awards in 2008.
Directors’ remuneration report continued | Governance |
Risk underpin and clawback
The Executive Share OptionRemuneration Committee will also review financial and operational performance against the Strategic Plan was approved by shareholders atand risk performance prior to agreeing vesting of awards.
If the company’s 2007 Annual General Meeting.Remuneration Committee considers that the vesting outcome calibrated in line with the performance conditions outlined above does not reflect the Group's underlying financial results or if the Committee considers that the financial results have been achieved with excessive risk, then the terms of the awards allow for an underpin to be used to reduce vesting of an award, or to allow the award to lapse in its entirety.
All awards are subject to clawback.
2011 compensation framework
The chart below summarises the 2011 compensation framework (illustration for the Group Chief Executive):
In 2008, options were grantedorder to executive directors undercomply with the Executive Share Option Plan approved by shareholders in 2007, overFSA Code, shares worth between one and a half times salary and three times salary. For 2009, the award levels will be reduced from the policy applied in 2008.subject to a holding period of six months after vesting.
Directors’ remuneration report continued | Governance |
Shareholding guidelines
The Group operates shareholding guidelines for executive directors. The target shareholding level is 200% of gross annual salary for the Group Chief Executive and 100% of gross annual salary for executive directors. Target shareholding levels are determined by reference to ordinary shares held, together with any vested awards under the Group’s Medium-term Performance Plan. Executive directors have a period of five years in which to build up their shareholdings to meet the guideline levels.
UK-based executive directors' remuneration balance
Executive director pay mix
Group Chief Executive –- Stephen Hester
Stephen Hester became 
Group Chief Executive on 21 November 2008. His annual basic salary is £1,200,000.Finance Director - Bruce Van Saun
Mr Hester also received certain shareThe charts above show the composition of remuneration opportunity for on-target annual performance, and with the long term incentive awards on appointment as Group Chief Executiveshown at the expected value. Short term incentive payments earned in relation to 2011 performance will be deferred and share awards to replace bonus and share awards he forfeited on leaving The British Land Company PLC. Mr Hester was granted conditional share awards over a total of 10,407,081 shares. Subject to their terms, the majority of these awards will vest between February 2009 (immediately after the announcement of the 2008 annual results) and the third anniversary of his appointment as Group Chief Executive.
Chairman – Philip Hampton
Philip Hampton became Chairman-designate on 19 January 2009, and Chairman on 3 February 2009. His fee is £750,000 per annum. He will also receive a one-off restricted share award over shares in the company which will vest, subject to the satisfaction of appropriate performance conditions, on the third anniversarysatisfactory performance. The actual value of the date of grant. The amount of this awardlong term incentive awards will be two times his annual fee, baseddepend on performance over the period 2011 to 2013 and the share price at the datetime the awards vest.
Non-executive directors
The level of grant.
Sir Fred Goodwin
Sir Fred Goodwin’s employment with reflects their responsibility and time commitment and the company ended on 31 January 2009. Under the termslevel of an agreement reached on 13 October 2008, he has waivedfees paid to non-executive directors of comparable major UK companies. Non-executive directors do not participate in any payment in lieu of notice and his rights in respect of unvested executive share options and unvested awards under the Medium-term Performance Plan have lapsed. He will not receive a short term incentive paymentor performance plan. Non-executive director fees are reviewed regularly. Fees paid to non-executive directors for the financial year ended 31 December 2008.2010 are set out on page 199.
Johnny Cameron
Johnny Cameron’s employment with the company will end on 28 February 2009. Under the terms of an agreement reached with him on 19 December 2008, he will not receive pay in lieu of notice or short term incentive payments for 2008 or 2009.
Mark Fisher
Mark Fisher’s employment with the company will end on 6 March 2009. He will not receive any short term incentive payment in respect of either 2008 or 2009.
The performance graph below illustrates the performance of the company over the past five years in terms of total shareholder return compared with that of the companies comprising the FTSE 100 Index. This Index has been selected because it represents a cross-section of leading UK companies. The total shareholder return for FTSE banks for the same period has been added for comparison. The total shareholder return for the company and the indices have been rebased to 100 for 2003.2005. The second graph below illustrates the same performance of the company during 2010.
Total shareholder return
Total shareholder return - one year
Directors’ remuneration report continued | Governance |
Service contractsThe company’scompany's policy in relation to the duration of contracts with directors is that executive directors’directors' contracts generally continue until termination by either party, subject to the required notice, or until retirement. The notice period under the service contracts of executive directors will not normally exceed 12twelve months. In relation to newly recruited executive directors, subject to the prior approval of the Remuneration Committee, the notice period may be extended beyond 12twelve months if there is a clear case for this. Where a longer period of notice is initially approved on appointment, it will normally be structured such that it will automatically reduce to 12twelve months in due course.
All new service contracts for executive directors are subject to approval by the Remuneration Committee. Those contracts normally include standard clauses covering the performance review process, the company’scompany's normal disciplinary procedure, and terms for dismissal in the event of failure to perform or in situations involving actions in breach of the Group’sGroup's policies and standards.
Any compensation payment made in connection with the departure of an executive director will be subject to approval by the Remuneration Committee, having regard to the terms of the service contract and the reasons for termination. Any Board members who leave the company in the future will receive a severance package which is reasonable and perceived as fair.
No compensation payment was madepaid to Sir Fred Goodwin, Johnny Cameron or Mark Fisher in respectGordon Pell on his retirement from employment of their ceasing to be directors.the Group on 31 March 2010. Details of his pension are shown on page 203.
Information regarding directors’directors' service contracts is shown below:
| | Date of current contract | Notice period – from the company | Notice period – from executive |
| Executive directors | | | |
MrStephen Hester | 4 November 2008 | see note (1)12 months | 12 months |
Mr PellBruce Van Saun | 20 February 2006 | 12 months | 6 months |
Mr Whittaker | 19 December 20058 September 2009 | 12 months | 12 months |
| | | | |
Former executive directorsdirector | | | |
Sir Fred GoodwinGordon Pell | 1 August 1998 | see page 143 | see page 143 |
Mr Cameron | 29 March 1998Contract expired | 12 months | 6 months |
Mr Fisher | 27 February 2007 | 12 months | 12 months |
(1) | On appointment, Mr Hester was entitled to 24 months notice from the company. This will be reduced on a daily basis, so that it will be 12 months by the first anniversary of the commencement of his employment. As at 25 February 2009, Mr Hester’s notice period was 20½ months. |
Except as noted below, in the event of severance where any contractual notice period is not worked, the employing company may pay a sum to the executive in lieu of this period of notice. Any such payment would, at maximum, comprise base salary and a cash value in respect of fixed benefits (including pension plan contributions).the notice period. In the event of situations involving breach of the employing company’scompany's policies resulting in dismissal, reduced or no payments may be made to the executive. Depending on the circumstances of the termination of employment, the executive may be entitled, or the Remuneration Committee may exercise its discretion to allow the executive to exercise, outstanding awards under long-term incentive arrangements to vest, subject to the rules of the relevant plan.
Stephen Hester
If Stephen Hester's employment is terminated by reason of his personal underperformance, the company is entitled to terminate by giving written notice with immediate effect and without making any payment in lieu thereof and Stephen Hester will forfeit any unvested stock awards.
In the event that Stephen Hester’sHester's employment is terminated by the company (other than by reason of his personal underperformance), the following will apply. First, Mr Hesterhe will be entitled to receive a payment in lieu of notice to the value of base salary, bonus and benefits (including pension contributions). Secondly, any share awards granted to him to replace bonus and share awards he forfeited on leaving The British Land Company PLC will vest immediately on such termination. If he resigns voluntarily and the company does not require him to work out his notice period, Stephen Hester may receive a payment in lieu of notice based on salary only (i.e. no bonus or benefits). In both cases the treatment of any other unvested stock awards will be determined at the discretion of the Remuneration Committee.
If Mr Hester’sBruce Van Saun
In the event that Bruce Van Saun's employment is terminated by reason of his personal underperformance, the company is entitled to terminate by giving written notice with immediate effect and without making any payment in lieu thereof and Mr Hester will forfeit any unvested stock awards. If he resigns voluntarily and the company does not require him to work out his notice period, Mr Hester may receive aof notice. Any payment in lieu of notice that may be made to Bruce Van Saun would be based on salary only (i.e. no bonus or benefits).
The company has agreed that, provided certain conditions are met, on leaving employment, Bruce Van Saun will not forfeit awards under the rules of the Deferral Plan, the Medium-term Performance Plan and he will also forfeit any unvested stock awards.the Executive Share Option Plan.
Gordon Pell
Gordon Pell is a memberretired from employment of The Royal Bankthe Group on 31 March 2010 on attaining his normal retirement age. In line with the rules of Scotlandthe Group Pension Fund, (the RBS Fund) and is contractually entitled to receive all pension benefits in accordance with its terms. The RBS Fund rules allow all members, including executive directors, who retire early at the request of their employer to receive a pension based on accrued service with no discount applied for early retirement. The provision for an undiscounted pension on early retirement at employer request will not apply to any executive director appointed in the future. The RBS Fund is closed to employees, including any executive directors, joining the Group after 30 September 2006.payment of his pension.
Directors’ remuneration report continued | Governance |
Chairman and non-executive directors
Under the Articles of Association of the company, directors must stand for re-election by shareholders at least once every three years. However, in accordance with the provisions of the UK Corporate Governance Code, all directors of the company will stand for re-election by shareholders at the company’s 2011 Annual General Meeting and annually thereafter. The original dates of appointment as directors of the company and the dates for the Chairman and non-executive directorsdirectors’ and the dates for next election or re-election are as follows:
| | Date first appointed | Date for election or or next re-election
|
| Philip Hampton | 19 January 2009 | 20092011 |
MrColin Buchan(1) | 1 June 2002 | 2011 |
Mr HunterSandy Crombie | 1 September 2004June 2009 | 20102011 |
MrPenny Hughes | 1 January 2010 | 2011 |
| Joe MacHale | 1 September 2004 | 20102011 |
MrJohn McFarlane | 1 October 2008 | 20092011 |
MrBrendan Nelson | 1 April 2010 | 2011 |
| Art Ryan | 1 October 2008 | 2011 |
| Philip Scott | 1 November 2009 | 2011 |
Under the company’s Articles of Association, all directors must resign and seek re-election by shareholders at least every three years. The dates in the table above reflect the latest date for election or re-election.| (1) | Colin Buchan will stand down as a non-executive director of the Group on 5 August 2011 following the announcement of the Group’s interim results, having served just over nine years on the Board. |
The non-executive directors do not have service contracts or notice periods although they have letters of engagement reflecting their responsibilities and commitments. These letters make clear to non-executive directors the time commitment they are expected to give to their Board duties. Brendan Nelson, Philip Scott and Penny Hughes' letters of engagement specifically state that their time commitment should be in line with the Walker Review in respect of their general Board duties and additional time as necessary in respect of Committee duties, including in particular any Committees which they chair.
No compensation would be paid to any non-executive director in the event of termination.termination of appointment.
The Chairman, Philip Hampton will beis entitled to receive a cash payment in lieu of notice if his appointment is terminated byas a result of the Group other than by reasonGroup's majority shareholder seeking to effect the termination of his personal underperformance. This payment will be based on aappointment. The applicable notice period of 24 months initially, reducing on a daily basis sois twelve months. In the event that from the first anniversarycompany terminates Philip Hampton's appointment without good reason, or his re-election is not approved by shareholders in General Meeting resulting in the termination of his appointment, hishe will be entitled to receive a cash payment in lieu of notice period is 12 months.of twelve months' fees.
Directors’ remuneration report continued | Governance |
The tables and explanatory notes on pages 147199 to 152203 report the remuneration of each director for the year ended 31 December 20082010 and have been audited by the company’scompany's auditors, Deloitte LLP.
| | | Salary/ fees £000 | | | Pension allowance £000 | | | Benefits £000 | | | 2008 Total £000 | | | 2007 Total £000 | |
| Executive directors | | | | | | | | | | | | | | | |
| Mr Hester (1) | | | 163 | | | | 52 | | | | 1 | | | | 216 | | | | — | |
| Mr Pell | | | 908 | | | | — | | | | 1 | | | | 909 | | | | 2,204 | |
| Mr Whittaker | | | 829 | | | | 282 | | | | 4 | | | | 1,115 | | | | 2,450 | |
| | | | | | | | | | | | | | | | | | | | | |
| Former Chairman | | | | | | | | | | | | | | | | | | | | |
| Sir Tom McKillop (2) | | | 787 | | | | — | | | | — | | | | 787 | | | | 750 | |
| | | | | | | | | | | | | | | | | | | | | |
| Former executive directors | | | | | | | | | | | | | | | | | | | | |
| Sir Fred Goodwin (3) | | | 1,297 | | | | — | | | | 39 | | | | 1,336 | | | | 4,190 | |
| Mr Cameron (4) | | | 902 | | | | 312 | | | | 25 | | | | 1,239 | | | | 3,256 | |
| Mr Fish (5) | | | 324 | | | | — | | | | 40 | | | | 364 | | | | 1,253 | |
| Mr Fisher (6) | | | 760 | | | | 187 | | | | 441 | | | | 1,388 | | | | 2,358 | |
Directors' remuneration
Notes:| | Salary/ fees £000 | Performance bonus £000 | Benefits £000 | 2010 Total £000 | 2009 Total £000 |
| Chairman | | | | | |
Philip Hampton (1) | 750 | — | — | 750 | 700 |
| | | | | | |
| Executive directors | | | | | |
Stephen Hester (2) | 1,219 | 2,040 | 8 | 3,267 | 1,227 |
Bruce Van Saun (2,3,4) | 725 | 1,349 | 224 | 2,298 | 700 |
| | | | | | |
| Former executive director | | | | | |
Gordon Pell (5) | 233 | — | 1 | 234 | 933 |
Notes:
| (1) | Mr Hester was appointed Group Chief Executive on 21 November 2008. He was previously a non-executive director from 1 October 2008. |
(2) | Sir Tom McKillop ceased to beRemuneration for 2009 reflects Philip Hampton’s appointment as Deputy Chairman and a directorChairman-designate on 19 January 2009 and his appointment as Chairman on 3 February 2009. |
| (2) | Further information on pension arrangements for Stephen Hester and Bruce Van Saun can be found on page 203. |
| (3) | Sir Fred Goodwin ceasedRemuneration for 2009 reflects Bruce Van Saun’s appointment to be Group Chief Executive and a directorthe Board on 21 November 2008. His employment with the Group ceased on 31 January1 October 2009. |
| (4) | Mr Cameron ceasedBenefits include costs for Bruce Van Saun’s relocation to be a director on 13 October 2008 and will cease employment with the Group on 28 February 2009.UK during 2010. |
| (5) | From 1 January 2008 until 30 April 2008, Mr Fish was an executive director of the company. He became a non-executive director on 1 May 2008 and ceased to be a director onRetired with effect from 31 December 2008. Throughout this period, he was non-executive chairman of RBS America and Citizens. Mr Fish is a non-executive director of Textron Inc. and Tiffany & Co. and retained the fees paid to him in this respect. For 2008, he received remuneration from Textron Inc. of US$260,500, including deferred fees. He received an annual fee of US$48,500 from Tiffany & Co.March 2010. |
As disclosed in the 2009 remuneration report, no payment for loss of office was made to Guy Whittaker (who ceased to be a director on 30 September 2009). After leaving the Group, Mr Whittaker was paid a total of £729,381 representing salary and benefits due under his contract of employment for the balance of his notice period.
Gordon Pell is currently Deputy Chairman of Coutts & Co and a non-executive director of RBS Coutts Bank Limited. He receives a combined annual fee of £100,000 in respect of these roles.
The table below sets out the remuneration paid to non-executive directors for the year ended 31 December 2010. No changes were made in relation to non-executive director fees during 2010 except to standardise the Board Risk Committee, Audit Committee and Remuneration Committee membership fee at £25,000 with effect from 1 January 2010. Fees paid to the Chairs of the Board Risk, Audit and Remuneration Committees have also been standardised at £150,000. This constitutes an increase in the fee payable to the Chair of the Remuneration Committee, reflecting the increased workload of that Committee and the time commitment required from the Committee Chair. For individual directors, differences in remuneration between 2009 and 2010 reflect any change in Committee responsibilities and, where applicable, the date they were appointed to the Board during 2009 or 2010, as set out in the notes below.
| | Board fees | Board Committee fees | 2010 Total | 2009 Total |
| | £000 | £000 | £000 | £000 |
| Non-executive directors | | | | |
Colin Buchan (1) | 73 | 77 | 150 | 152 |
Sandy Crombie (2) | 150 | — | 150 | 88 |
Penny Hughes (3) | 130 | — | 130 | — |
Joe MacHale (4) | 73 | 68 | 141 | 111 |
| John McFarlane | 73 | 30 | 103 | 93 |
Brendan Nelson (5) | 111 | — | 111 | — |
| Art Ryan | 73 | 30 | 103 | 92 |
Philip Scott (6) | 150 | — | 150 | 25 |
| | | | | |
| Former non-executive director | | | | |
Archie Hunter (7) | 24 | 31 | 55 | 166 |
(6) | Mr Fisher ceased to be a director on 21 November 2008 and will cease employment with the Group on 6 March 2009. In line with the its international assignment policy, costs such as additional tax and accommodation incurred as a result of Mr Fisher’s assignment to the Netherlands are met by the Group. These additional costs are shown in ‘Benefits’ above. |
| | | Board fees £000 | | | Board committee fees £000 | | | 2008 Total £000 | | | 2007 Total £000 | |
| Non-executive directors | | | | | | | | | | | | |
| Mr Buchan | | | 73 | | | | 57 | | | | 130 | | | | 122 | |
| Mr Hunter | | | 73 | | | | 101 | | | | 174 | | | | 162 | |
| Mr MacHale | | | 73 | | | | 33 | | | | 106 | | | | 100 | |
| Mr McFarlane (1) | | | 18 | | | | — | | | | 18 | | | | — | |
| Mr Ryan (1) | | | 18 | | | | — | | | | 18 | | | | — | |
| | | | | | | | | | | | | | | | | |
| Former non-executive directors | | | | | | | | | | | | | | | | |
| Dr Currie (2) | | | 73 | | | | 16 | | | | 89 | | | | 85 | |
| Mr Friedrich (2) | | | 73 | | | | 33 | | | | 106 | | | | 100 | |
| Mr Koch (2) | | | 73 | | | | — | | | | 73 | | | | 70 | |
| Mrs Kong (2) | | | 73 | | | | 16 | | | | 89 | | | | 85 | |
| Sir Steve Robson (2) | | | 73 | | | | 33 | | | | 106 | | | | 100 | |
| Mr Scott (2, 3) | | | | | | | | | | | 174 | | | | 160 | |
| Mr Sutherland (2) | | | 73 | | | | 29 | | | | 102 | | | | 97 | |
| (1) | AppointedStepped down as directorsa member and Chairman of the Remuneration Committee on 1 October 2008.June 2010. |
| (2) | RetiredAppointed as directorsSenior Independent Director on 6 February1 June 2009. |
(3) | Mr Scott’s senior independent director fee covered Fee is inclusive and covers all Board and Board Committee work including Chairmanshipwork. |
| (3) | Appointed on 1 January 2010 and became Chair of the Remuneration Committee.Committee on 1 June 2010. From 1 June 2010 fee is inclusive and covers all Board and Board Committee work. |
| (4) | Stepped down as a member of the Audit Committee on 30 April 2010. Member of the Asset Protection Scheme Senior Oversight Committee from January 2010. |
| (5) | Appointed on 1 April 2010 and became Chairman of the Audit Committee on 28 April 2010. Fee is inclusive and covers all Board and Board Committee work. |
| (6) | Fee is inclusive and covers all Board and Board Committee work. |
| (7) | Retired with effect from 28 April 2010. |
No director received any expense allowances chargeable to UK income tax or compensation for loss of office/termination payment. The non-executive directors did not receive any bonus payments or benefits.benefits.
The LTIP was approved by shareholders in April 2010. It replaced both the ESOP and the MPP. Details of Contentsawards made in prior years under the ESOP and MPP are shown on pages 201 and 202. Employees in senior roles (executive level and selected senior management) are eligible to receive annual awards of long-term incentives. The awards will be structured as performance-vesting deferred shares.
The performance conditions for the LTIP awards focus on shareholder value, while factoring in the growing regulatory emphasis on risk-adjusted financial metrics.
| | Awards granted in 2010 | Market price on award £ | Awards vested in 2010 | Market price on vesting £ | Awards held at 31 December 2010 | End of period for qualifying conditions to be fulfilled |
Stephen Hester (1) | 8,578,432 | 0.49 | | | 8,578,432 | 14.05.13 |
Bruce Van Saun (2) | 5,182,803 | 0.49 | | | 5,182,803 | 14.05.13 |
Notes:
| (1) | Stephen Hester has agreed to a voluntary holding period of two further years beyond the vesting date for the net post-tax number of vested shares in respect of at least one third of the award. |
| (2) | Bruce Van Saun has agreed to a voluntary holding period of two further years beyond the vesting date for the net post-tax number of vested shares for the amount over 300% of his salary. |
No variation was made to any of the terms of the plan during the year.
Performance criteria for awards granted to executive directors under the LTIP in 2010
Awards to executive directors under the LTIP in 2010 are subject to improvement in Economic Profit (50%) as well as relative TSR (25%) and absolute TSR (25%).
Relative TSR
The relative TSR measure compares the Group's performance against a group of comparator banks from the UK and overseas, weighted towards those companies most similar to the Group. The comparator companies and relevant weightings and vesting schedule are the same as those for the 2011 LTIP awards, as set out on page 193.
Absolute TSR
The absolute TSR measure is based on the achievement of share price targets by the end of the performance period.
In respect of the absolute TSR performance measure for the LTIP awards in 2010, vesting is on a straight-line basis and is determined as follows:
| to receive vesting of 100% of the shares, the share price would need to reach 77.5 pence or more; |
| to receive 20% of the award (threshold), the share price would need to reach 57.5 pence or more; and |
| below 57.5p, vesting would be zero. |
Economic profit
Maximum vesting of the economic profit measure will be triggered by early delivery of Core business profitability, well ahead of the range implied by the published Strategic Plan targets and also in excess of the cost of capital.
Risk underpin and clawback
If the Remuneration Committee consider that the vesting outcome calibrated in line with the performance conditions outlined above does not reflect the Group's underlying financial results, or if the Committee considers that the financial results have been achieved with excessive risk, then the terms of the awards allow for an underpin to be used to reduce vesting of an award, or to allow the award to lapse in its entirety.
Awards are subject to clawback.
OptionsDirectors’ remuneration report continued | Governance |
Deferred awards
In 2009, the Group changed its approach to subscribe for ordinary sharespaying bonuses. Annual awards are now deferred over three years and a portion of 25p each i n the companyawards will be paid in shares. For executive directors, the entire award is delivered in the form of shares. These steps help to ensure that the interests of those receiving awards are aligned with those of our shareholders. Below are details of deferred awards granted to and exercised by,executive directors during the year ended 31 December 20082010. Awards are shown in the table below. Options held at 1 January 2008structured as conditional rights to receive shares and all subsequent figures have been restatedare subject to reflect the rights issue in June 2008 and the capitalisation issue in September 2008.clawback.
| | | | | | | | | | | | | | | | | | |
| | | Options held at 1 January 2008 | | | Options granted in 2008 | | | Number | | | Market price at date of exercise £ | | | Options lapsed in 2008 | | | Option price £ | | | |
Options held at 31 December 2008 | |
| Number | | | | Exercise period | |
| Mr Pell | | | 104,252 | | | | | | | | | | | | | | | | 4.80 | | | 104,252 | | | | | 14.08.04 – 13.08.11 | |
| | | | 98,879 | | | | | | | | | | | | | | | | 5.07 | | | 98,879 | | | | | 14.03.05 – 13.03.12 | |
| | | | 178,412 | | | | | | | | | | | | | | | | 3.45 | | | 178,412 | | | | | 13.03.06 – 12.03.13 | |
| | | | 169,158 | | | | | | | | | | | | | | | | 4.84 | | | 169,158 | | | | | 11.03.07 – 10.03.14 | |
| | | | 181,304 | | | | | | | | | | | | | | | | 4.83 | | | 181,304 | | | | | 10.03.08 – 09.03.15 | |
| | | | 223,428 | | | | | | | | | | | | | | | | 5.17 | | | 223,428 | | | | | 09.03.09 – 08.03.16 | |
| | | | 310,364 | | | | | | | | | | | | | | | | 4.70 | | | 310,364 | | | | | 16.08.10 – 15.08.17 | |
| | | | | | | | 640,871 | | | | | | | | | | | | | 2.97 | | | 640,871 | | | | | 06.03.11 – 05.03.18 | |
| | | | 1,265,797 | | | | | | | | | | | | | | | | | | | | 1,906,668 | | | | | | |
| Mr Whittaker | | | 203,113 | | | | | | | | | | | | | | | | | 5.17 | | | 203,113 | | | | | 09.03.09 – 08.03.16 | |
| | | | 335,269 | | | | | | | | | | | | | | | | | 4.70 | | | 335,269 | | | | | 16.08.10 – 15.08.17 | |
| | | | 4,423 | | | | | | | | | | | | | | 4,423 | | | | 3.86 | | | — | | | | | | |
| | | | | | | | 582,803 | | | | | | | | | | | | | | 2.97 | | | 582,803 | | | | | 06.03.11 – 05.03.18 | |
| | | | | | | | 9,218 | | | | | | | | | | | | | | 1.89 | | | 9,218 | | | | | 01.10.15 – 31.03.16 | (1) |
| | | | 542,805 | | | | | | | | | | | | | | | | | | | | | 1,130,403 | | | | | | |
| Sir Fred Goodwin (2) | | | 10,614 | | | | | | | | | | | | | | | | | | 3.12 | | | 10,614 | | | | | 01.02.09 – 03.03.09 | |
| | | | 97,826 | | | | | | | | | | | | | | | | | | 3.34 | | | 97,826 | | | | | 01.02.09 – 02.06.09 | |
| | | | 550,458 | | | | | | | | | | | | | | | | | | 2.18 | | | 550,458 | | | | | 01.02.09 – 31.01.10 | |
| | | | 4,538 | | | | | | | | | | | | | | | | | | 3.64 | | | 4,538 | | | | | 01.02.09 – 31.07.09 | (1) |
| | | | 156,559 | | | | | | | | | | | | | | | | | | 4.80 | | | 156,559 | | | | | 01.02.09 – 31.01.10 | |
| | | | 147,960 | | | | | | | | | | | | | | | | | | 5.07 | | | 147,960 | | | | | 01.02.09 – 31.01.10 | |
| | | | 260,812 | | | | | | | | | | | | | | | | | | 3.45 | | | 260,812 | | | | | 01.02.09 – 31.01.10 | |
| | | | 516,521 | | | | | | | | | | | | | | | | | | 4.84 | | | 516,521 | | | | | 01.02.09 – 31.01.10 | |
| | | | 569,814 | | | | | | | | | | | | | | | | | | 4.83 | | | 569,814 | | | | | 01.02.09 – 31.01.10 | |
| | | | 580,333 | | | | | | | | | | | | | | | | | | 5.17 | | | — | | waived | | | 09.03.09 – 08.03.16 | |
| | | | 830,192 | | | | | | | | | | | | | | | | | | 4.70 | | | — | | waived | | | 16.08.10 – 15.08.17 | |
| | | | | | | | 1,508,727 | | | | | | | | | | | | | | 2.97 | | | — | | waived | | | 06.03.11 – 05.03.18 | |
| | | | 3,725,627 | | | | | | | | | | | | | | | | | | | | | 2,315,102 | | | | | | |
| Mr Cameron (3) | | | 68,764 | | | | | | | | | | | | | | | | | | 3.12 | | | — | | lapsed | | | — | |
| | | | 137,610 | | | | | | | | | | | | | | | | | | | 2.18 | | | — | | lapsed | | | — | |
| | | | 93,863 | | | | | | | | | | | | | | | | | | | 4.80 | | | — | | lapsed | | | — | |
| | | | 113,925 | | | | | | | | | | | | | | | | | | | 5.07 | | | — | | lapsed | | | — | |
| | | | 188,444 | | | | | | | | | | | | | | | | | | | 3.45 | | | — | | lapsed | | | — | |
| | | | 180,781 | | | | | | | | | | | | | | | | | | | 4.84 | | | — | | lapsed | | | — | |
| | | | 290,089 | | | | | | | | | | | | | | | | | | | 4.83 | | | — | | lapsed | | | — | |
| | | | 304,674 | | | | | | | | | | | | | | | | | | | 5.17 | | | — | | lapsed | | | — | |
| | | | 447,026 | | | | | | | | | | | | | | | | | | | 4.70 | | | — | | lapsed | | | — | |
| | | | | | | | 847,713 | | | | | | | | | | | | | | | 2.97 | | | — | | lapsed | | | — | |
| | | | | | | | 4,966 | | | | | | | | | | | | | | | 1.89 | | | — | | lapsed | | | — | (1) |
| | | | 1,825,176 | | | | | | | | | | | | | | | | | | | | | | — | | | | | | |
| Mr Fish | | | 386,479 | | | | | | | | 386,479 | | | | 2.80 | | | | | | | | 2.60 | | | — | | | | | | |
| | | | 134,715 | | | | | | | | | | | | | | | | | | | | 4.83 | | | 134,715 | | | | | 10.03.08 – 09.03.15 | |
| | | | 398,130 | | | | | | | | | | | | | | | | | | | | 5.17 | | | 398,130 | | | | | 09.03.09 – 08.03.16 | |
| | | | 625,329 | | | | | | | | | | | | | | | | | | | | 4.70 | | | 625,329 | | | | | 16.08.10 – 15.08.17 | |
| | | | 1,544,653 | | | | | | | | | | | | | | | | | | | | | | | 1,158,174 | | | | | | |
| Mr Fisher(4) | | | 51,162 | | | | | | | | | | | | | | | | | | | | 2.58 | | | 51,162 | | | | | 01.04.02 – 31.03.09 | |
| | | | 518 | | | | | | | | | | | | | | | | | | | | 3.64 | | | 518 | | | | | 01.10.08 – 31.03.09 | (1) |
| | | | 119,267 | | | | | | | | | | | | | | | | | | | | 2.18 | | | 119,267 | | | | | 29.03.03 – 28.03.10 | |
| | | | 78,099 | | | | | | | | | | | | | | | | | | | | 4.80 | | | 78,099 | | | | | 14.08.04 – 13.08.11 | |
| | | | 81,324 | | | | | | | | | | | | | | | | | | | | 5.07 | | | 81,324 | | | | | 14.03.05 – 13.03.12 | |
| | | | 145,094 | | | | | | | | | | | | | | | | | | | | 3.45 | | | 145,094 | | | | | 13.03.06 – 12.03.13 | |
| | | | 142,041 | | | | | | | | | | | | | | | | | | | | 4.84 | | | 142,041 | | | | | 11.03.07 – 10.03.14 | |
| | | | 217,565 | | | | | | | | | | | | | | | | | | | | 4.83 | | | 217,565 | | | | | 10.03.08 – 09.03.15 | |
| | | | 220,042 | | | | | | | | | | | | | | | | | | | | 5.17 | | | 220,042 | | | | | 09.03.09 – 08.03.16 | |
| | | | 312,919 | | | | | | | | | | | | | | | | | | | | 4.70 | | | 312,919 | | | | | 16.08.10 – 15.08.17 | |
| | | | 1,922 | | | | | | | | | | | | | | | | 1,922 | | | | 3.93 | | | — | | | | | | |
| | | | | | | | 593,399 | | | | | | | | | | | | | | | | 2.97 | | | 593,399 | | | | | 06.03.11 – 05.03.18 | |
| | | | | | | | 4,966 | | | | | | | | | �� | | | | | | | 1.89 | | | 4,966 | | | | | 01.10.11 – 31.03.12 | (1) |
| | | | 1,369,953 | | | | | | | | | | | | | | | | | | | | | | | 1,966,396 | | | | | | |
| | Awards held at 1 January 2010 | Awards granted in 2010 | Market price on award £ | Awards vested in 2010 | Market price on vesting £ | Awards held at 31 December 2010 | End of period for qualifying conditions to be fulfilled |
| Bruce Van Saun | — | 957,071 | 0.38 | | | 957,071 | 18.06.12 |
Notes:Stephen Hester agreed to waive his Deferred Awards in 2010.
Share options
The Executive Share Option Plan (ESOP) was approved by shareholders in April 2007. No further awards will be made under the ESOP.
| | | Options exercised in 2010 | | | | |
| | Options held at 1 January 2010 | Number | Market price at date of exercise £ | Options lapsed in 2010 | Option price £ | |
Options held at 31 December 2010 |
| Number | Exercise period |
| Stephen Hester | 9,550,000 | | | | 0.37 | 9,550,000 | 22.06.12 - 21.06.19 |
| | | | | | | | |
Gordon Pell (1) | 104,252 | | | | 4.80 | 104,252 | 14.08.04 - 13.08.11 |
| | 98,879 | | | | 5.07 | 98,879 | 14.03.05 - 13.03.12 |
| | 178,412 | | | | 3.45 | 178,412 | 13.03.06 - 12.03.13 |
| | 169,158 | | | | 4.84 | 169,158 | 11.03.07 - 10.03.14 |
| | 181,304 | | | | 4.83 | 181,304 | 10.03.08 - 09.03.15 |
| | 310,364 | | | 310,364 | 4.70 | — | lapsed (2) |
| | 640,871 | | | 640,871 | 2.97 | — | lapsed (2) |
| | 1,683,240 | | | 951,235 | | 732,005 | |
| | | | | | | | |
| Bruce Van Saun | 905,306 | | | | 0.57 | 905,306 | 08.09.12 - 07.09.19 |
Notes:
| (1) | Options held under the sharesave schemes, which are not subject to performance conditions. |
(2) | Options held at 21 November 200831 March 2010 when heGordon Pell ceased to be a director. Unvested awards were waived on cessation and lapsed on 31 January 2009. In respect of his vested options under The Royal Bank of Scotland Group plc 1999 Executive Share Option Scheme, any options. |
exercisable at 31 January 2009 remain exercisable subject to and in accordance with the rules of that plan for 12 months from that date, but not after the 10th anniversary of their grant.
(3)(2) | Options held at 13 October 2008 when he ceasedThis award was subject to be a director. All outstanding awards will lapse when his employment with the company ends on 28 February 2009,performance conditions which is reflected in the table above.were not achieved. |
(4) | Options held at 21 November 2008 when he ceased to be a director. All outstanding awards will lapse when his employment with the company ends on 6 March 2009. |
No options had their terms and conditions varied during the accounting period toyear ended 31 December 2008.2010. No payment is required on the award of an option.
For executive share options grantedThe plan was amended in 2007 and 2008, the performance condition is based on the average annual growth2009 to introduce a clawback provision for grants made in the company’s adjusted EPS over the three-year performance period commencing with the year of grant. The calibration of the EPS growth measure is agreed by the Remuneration Committee at the time of each grant having regard to the business plan, prevailing economic conditions and analysts’ forecasts.
2009.In respect of the grant of options in 2008, options will only be exercisable if, over2009, the three-year period, the growth in the company’s adjusted EPS has been at least 5 per cent. per annum (the “threshold level”). The percentage of options that vest is then determinedperformance conditions for executive directors are based on a straight-line basis between 30 per cent. at the threshold levelcombination of relative and 100 per cent. at the maximum level for growth in adjusted EPS of 9 per cent. per annum.absolute Total Shareholder Return (TSR) measures.
The market price of the company’scompany's ordinary shares at 31 December 20082010 was 49.4p39.07p and the range during the year ended 31 December 20082010 was 41.4p31.25p to 370.5p.58.05p.
In the ten year period to 31 December 2008,2010, awards made that could require new issue shares under the company’scompany's share plans represented 2.1 %4.1% of the company’scompany's issued ordinary share capital (including the B share capital), leaving an available dilution headroom of 7.9%5.9%. The company meets its employee share plan obligations through a combination of new issue shares and market purchase shares.
Directors’ remuneration report continued | Governance |
Medium-Term Performance Plan (MPP)
Scheme interests at 1 January 2008 andThe MPP was approved by shareholders in April 2001. No further awards will be made under the related market price on award in the table below have been restated to reflect the rights issue in June 2008 and the capitalisation issue in September 2008.MPP.
| | Scheme interests (share equivalents) at 1 January 2010 | Market price on award £ | Awards vested in 2010 | Awards exercised in 2010 | Scheme interests (share equivalents) at 31 December 2010 | End of period for qualifying conditions to be fulfilled |
Stephen Hester (1) | 4,800,000 | 0.37 | | | 4,800,000 | 22.06.12 |
Gordon Pell (2) | 305,177 | 2.97 | | | — | lapsed |
Bruce Van Saun (3) | 1,810,611 | 0.57 | | | 1,810,611 | 22.06.12 |
| | | Scheme interests (share equivalents) at 1 January 2008 | | | Awards granted in 2008 | | | Market price on award £ | | Awards vested in 2008 | Awards exercised in 2008 | | | Share interest (share equivalents) at 31 December 2008 | | | End of period for qualifying conditions to be fulfilled | |
| Mr Pell | | | 148,953 | | | | | | | 5.17 | | Nil | | | | | — | | lapsed | 31.12.08 | |
| | | | 138,384 | | | | | | | 5.85 | | | | | | | 138,384 | | | | 31.12.09 | |
| | | | | | | | 305,177 | | | | 2.97 | | | | | | | 305,177 | | | | 31.12.10 | |
| | | | 287,337 | | | | | | | | | | | | | | | 443,561 | | | | | |
| Mr Whittaker | | | 135,410 | | | | | | | | 5.17 | | Nil | | | | | — | | lapsed | 31.12.08 | |
| | | | 128,134 | | | | | | | | 5.85 | | | | | | | 128,134 | | | | 31.12.09 | |
| | | | | | | | 277,525 | | | | 2.97 | | | | | | | 277,525 | | | | 31.12.10 | |
| | | | 263,544 | | | | | | | | | | | | | | | 405,659 | | | | | |
| Sir Fred Goodwin (1) | | | 333,324 | | | | | | | | 4.56 | | | | | | | 333,324 | | vested | 31.12.03 | |
| | | | 121,288 | | | | | | | | 5.19 | | | | | | | 121,288 | | vested | 31.12.04 | |
| | | | 348,202 | | | | | | | | 5.17 | | Nil | | | | | — | | lapsed | 31.12.08 | |
| | | | 333,145 | | | | | | | | 5.85 | | | | | | | — | | waived | 31.12.09 | |
| | | | | | | | 754,364 | | | | 2.97 | | | | | | | — | | waived | 31.12.10 | |
| | | | 1,135,959 | | | | | | | | | | | | | | | 454,612 | | | | | |
| Mr Cameron (2) | | | 199,994 | | | | | | | | 4.56 | | | | | | | — | | vested | 31.12.03 | |
| | | | 79,096 | | | | | | | | 5.19 | | | | | | | — | | vested | 31.12.04 | |
| | | | 174,103 | | | | | | | | 5.17 | | Nil | | | | | — | | lapsed | 31.12.08 | |
| | | | 170,845 | | | | | | | | 5.85 | | | | | | | — | | lapsed | 31.12.09 | |
| | | | | | | | 403,673 | | | | 2.97 | | | | | | | — | | lapsed | 31.12.10 | |
| | | | 624,038 | | | | | | | | | | | | | | | — | | | | | |
| Mr Fish | | | 111,479 | | | | | | | | 5.17 | | Nil | | | | | — | | lapsed | 31.12.08 | |
| | | | 102,587 | | | | | | | | 5.85 | | | | | | | 102,587 | | | | 31.12.09 | |
| | | | 214,066 | | | | | | | | | | | | | | | 102,587 | | | | | |
| Mr Fisher (3) | | | 71,651 | | | | | | | | 4.56 | | | | | | | 71,651 | | vested | 31.12.03 | |
| | | | 28,660 | | | | | | | | 5.19 | | | | | | | 28,660 | | vested | 31.12.04 | |
| | | | 125,741 | | | | | | | | 5.17 | | Nil | | | | | — | | lapsed | 31.12.08 | |
| | | | 119,593 | | | | | | | | 5.85 | | | | | | | 119,593 | | | | 31.12.09 | |
| | | | | | | | 282,570 | | | | 2.97 | | | | | | | 282,570 | | | | 31.12.10 | |
| | | | 345,645 | | | | | | | | | | | | | | | 502,474 | | | | | |
| (1) | Stephen Hester has voluntarily agreed to retain any shares that he receives for a further two years past the vesting date. |
| (2) | Awards held at 21 November 200831 March 2010 when heGordon Pell ceased to be a director. Unvested awardsThis award was subject to performance conditions which were waived on cessation and lapsed on 31 January 2009.not achieved. |
(2) | Awards held at 13 October 2008 when he ceased to be a director. Subsequently Mr Cameron exercised his vested awards on 5 December 2008. All outstanding awards will lapse when his employment with the company ends on 28 February 2009. |
| (3) | Awards held at 21 November 2008 when he ceased to be a director. All unvested awards and any vested, but unexercised, awards will lapse when his employment with the company ends on 6 March 2009.End of qualifying period 22 June 2012, however award unavailable for exercise until 8 September 2012, three years from date of award. |
For any awards that have vested, participants holding option-based awards can exercise their right over the underlying share equivalents at any time up to ten years from the date of grant.
No variation was made to any of the terms of the plan during the year.
Awards made in 2007 and 2008 are subject to two performance measures; 50% of the award vests on a relative Total Shareholder Return (TSR) measure and 50% vests on growth in adjusted earnings per share (EPS) over the three year performance period.
For the TSR element, vesting is based on the level of outperformance by the Group of the median of the comparator group TSR over the performance period. Awards made under the plan will not vest if the company’s TSR is below the median of the comparator group. Achievement of median TSR performance against comparator companies will result in vesting of 25% of the award. Outperformance of median TSR performance by up to 9% will result in vesting on a straight-line basis from 25% to 125%, outperformance by 9% to 18% will result in vesting on a straight-line basis from 125% to 200%. Vesting at 200% will occur if the company outperforms the median TSR performance of the comparator group by at least 18%. For awards made in 2007, the companies in the comparator group were ABN AMRO Holdings N.V.; Banco Santander Central Hispano, S.A.; Barclays PLC; Citigroup Inc; HBOS plc; HSBC Holdings plc; Lloyds TSB Group plc and Standard Chartered PLC. Following the acquisition of ABN AMRO by the consortium members in October 2007, the Remuneration Committee agreed that Fortis N.V. would replace ABN AMRO in the comparator group. Subsequently, for awards made in 2008, Fortis N.V. was replaced by Deutsche Bank Group.
The level of EPS growth over the three year period is calculated by comparing the adjusted EPS in the year prior to the year of grant with that in the final year of the performance period. Each year the vesting schedule for the EPS growth measure is agreed by the Remuneration Committee at the time of grant, having regard to the business plan, performance relative to comparators and analysts’ forecasts.
For the awards made in 2007, the EPS element of the awards will not vest if EPS growth is below 5% per annum compound over the three year period. Where EPS growth is between 5% per annum and 10% per annum vesting will occur on a straight-line basis from 25% to 100%. Vesting at 100% will occur if EPS growth is at least 10% per annum compound. For the awards made in 2008, an EPS growth threshold level of 5% per annum to a maximum level of 9% per annum was agreed.
Restricted Share Award
Interests at 1 January 2008 and the related prices on award and vesting in the table below have been restated to reflect the rights issue in June 2008 and the capitalisation issue in September 2008.| | Awards held at 1 January 2010 | Awards granted in 2010 | Market price on award £ | Awards vested in 2010 | Market price on vesting £ | Value of awards vested £ | Awards held at 31 December 2010 | End of period for qualifying conditions to be fulfilled |
| Stephen Hester | 5,506,987(1) | | 0.48 | 469,064 | 0.4491 | 210,657 | | |
| | | | | 695,167 | 0.4368 | 303,649 | | |
| | | | | 879,458 | 0.3814 | 335,425 | 3,463,298 | 21.11.08 - 29.05.11 |
| | 1,221,374(2) | | 0.48 | 610,687 | 0.4050 | 247,328 | 610,687 | 21.11.09 - 21.11.11 |
| | 6,728,361 | | | 2,654,376 | | 1,097,059 | 4,073,985 | |
Philip Hampton (3) | 5,172,413 | | 0.29 | | | | 5,172,413 | 27.02.12 |
| | | Awards held at 1 January 2008 | | | Awards granted in 2008 | | | Market price on award £ | | | Awards vested in 2008 | | | Market price on vesting £ | | | Value of Awards vested £ | | | Awards held at 31 December 2008 | | | End of the period for qualifying conditions to be fulfilled | |
| Mr Hester | | | — | | | | 8,575,019 | | | | 0.48 | | | | 577,964 | | | | 0.48 | | | | 277,423 | | | | 7,997,055 | | | | 21.11.08 – 29.05.11 | (1) |
| | | | — | | | | 1,832,062 | | | | 0.48 | | | | | | | | | | | | | | | | 1,832,062 | | | | 21.11.09 – 21.11.11 | (2) |
| | | | — | | | | 10,407,081 | | | | | | | | | | | | | | | | | | | | 9,829,117 | | | | | |
| | | | | | | | | | | | | | | | | | | | | | | | | | | | | | | | | |
Mr Whittaker (3) | | | 109,208 | | | | | | | | 5.41 | | | | 109,208 | | | | 3.37 | | | | 368,503 | | | | — | | | | | |
| | | | 90,718 | | | | | | | | 5.41 | | | | | | | | | | | | | | | | 90,718 | | | | 01.02.09 | (4,5) |
| | | | 44,500 | | | | | | | | 5.41 | | | | | | | | | | | | | | | | 44,500 | | | | 01.02.10 | |
| | | | 244,426 | | | | | | | | | | | | | | | | | | | | | | | | 135,218 | | | | | |
| (1) | Awards to replace bonus and share awards MrStephen Hester forfeited on leaving The British Land Company PLC, which reflect the vesting dates of the original awards. Initially Stephen Hester was awarded 10,407,081 restricted shares on joining the Group. |
| (2) | These awards vest as to 1/3 on each of the first, second and third anniversary of award, subject to their terms. |
| (3) | Awards were grantedThe Remuneration Committee can amend the award made to Mr Whittaker in lieuPhilip Hampton as it considers appropriate. However, shareholder approval will be required to amend certain provisions to his advantage. These provisions relate to the basis for determining his entitlement to, and the terms of unvested share awards from his previous employer. |
(4) | shares or other benefits and for the adjustment thereof (if any) if there is a capitalisation issue, rights issue or open offer, sub-division or consolidation of shares or reduction of capital or any other variation of capital and the amendment power itself. The end period for qualifying conditions is subjectRemuneration Committee may, without shareholder approval, make minor amendments to any restrictions on dealing infacilitate the Group’s shares which may be in place and to which Mr Whittaker may be subject. As a resultadministration of the close period prioraward, to the announcementcomply with or take account of any proposed or existing legislation or to obtain or maintain favourable tax, exchange control or regulatory treatment for Philip Hampton or his employer. The benefit of the Group’s results,award is not pensionable. In assessing the endperformance to determine the vesting of this award, the Remuneration Committee will consider a number of factors which demonstrate whether Philip Hampton has led the successful and sustainable rebuilding of the period for qualifying conditionsGroup. The Committee will also require to be fulfilled in 2009satisfied that the vesting level is 26 February 2009. |
(5) | Award has now vested and shares will be released to Mr Whittaker on 26 February 2009. |
Citizens Long Term Incentive Plan (1)
| Interests at 1 January 2008 | Benefits received from awards
vesting duringcommensurate with the year
| Interests at 31 December 2008 |
Mr Fish | LTIP awards forunderlying financial performance of the 3 year periods: | | |
| 01.01.05 – 31.12.07 | nil | — |
| 01.01.06 – 31.12.08 | nil(2)
| — |
| 01.01.07 – 31.12.09 | nil(2)
| —Group. |
(1) | This cash LTIP was approved by shareholders at the company’s Annual General Meeting in April 2005. Performance is measured on a combination of growth in Profit before tax and Relative Return on Equity based on a comparison of Citizens with comparator US banks. |
(2) | When Mr Fish stepped down from the Board on 31 December 2008, under the terms of the Citizens LTIP, his outstanding awards vested, subject to pro-rating for the elapsed proportion of the performance period and for performance to date. As a result, there was nil vesting for all awards. |
No variation was made to any of the terms of the plan during the year.
Directors’ remuneration report continued | Governance |
Stephen Hester and Guy Whittaker are provided with a cash allowance in place of pension benefits as detailed on page 147.
During 2008, Johnny Cameron, Sir Fred Goodwin and2010, Gordon Pell accrued pensionable service in The Royal Bank of Scotland Group Pension Fund (the “RBS Fund”).RBS Fund) until his retirement date of 31 March 2010. The RBS Fund is a defined benefit fund registered with HM Revenue & Customs under the Finance Act 2004.
Sir Fred Goodwin was, and Gordon Pell is,was provided with additional pension benefits on a defined benefit basis outwith the RBS Fund. The figures shown below include the accrual in respect of these arrangements. A funded, non-registered arrangement provides Sir Fred Goodwin’s benefits to the extent they are not provided by the RBS Fund.
Johnny Cameron’s benefits were based on salary limited to the pensions earning cap and he received a cash allowance in place of pension on salary above this cap.
Mark Fisher opted to cease future accrual of pension benefit within the RBS Fund with effect from 6 April 2006. The increase in pension shown in the table arises from his increase in pensionable salary over the year. He was provided with a cash allowance in place of further pension benefits as detailed on page 147.
The cash allowances for Johnny Cameron and Mark Fisher are shown on page 147.
Larry Fish accrued pension benefits under a number of arrangements in the US. Defined benefits were built up under the Citizens’ Qualified Plan, Excess Plan and Supplemental Executive Retirement Arrangement. In addition, he was a member of two defined contribution arrangements: a Qualified 401(k) Plan and an Excess 401(k) Plan until he became a non-executive director on 1 May 2008.
Of the total transfer value shown as at 31 December 2008, 54% relates to benefits in funded pension schemes.
Disclosure of these benefits has been made in accordance with the United Kingdom Listing AuthorityAuthority's Listing Rules and with the Directors’ Remuneration ReportLarge and Medium-sized Companies and Groups (Accounts and Reports) Regulations 2002.2008.
| | Age at 31 December 2008 | | | Accrued entitlement at 31 December 2008 £000 p.a | | | Additional pension earned during the year ended 31 December 2008 £000 p.a | | | Additional pension earned during the year ended 31 December 2008* £000 p.a | | | Transfer value as at 31 December 2008 £000 | | | Transfer value as at 31 December 2007 £000 | | | Increase in transfer value during year ended 31 December 2008 £000 | | | Transfer value for the additional pension earned during the year ended 31 December 2008* £000 | |
| Mr Pell | | | 58 | | | | 517 | | | | 94 | | | | 77 | | | | 9,831 | | | | 8,403 | | | | 1,428 | | | | 1,473 | |
| Sir Fred Goodwin | | | 50 | | | | 693 | | | | 114 | | | | 92 | | | | 16,630 | (1) | | | 8,370 | | | | 8,260 | | | | 2,060 | |
| Mr Cameron | | | 54 | | | | 62 | | | | 6 | | | | 4 | | | | 1,363 | (1) | | | 931 | | | | 432 | | | | 78 | |
| Mr Fish | | | 64 | | | | $2,237 | | | | $157 | | | | $157 | | | | $27,004 | | | | $24,101 | | | | $2,903 | | | | $1,893 | |
| Mr Fisher | | | 48 | | | | 398 | | | | 61 | | | | 48 | | | | 4,810 | | | | 4,562 | | | | 248 | | | | 581 | |
Defined benefit arrangements | Age at 31 December 2010 | Accrued entitlement at 31 December 2010 £000 p.a. | Additional pension earned during the year ended 31 December 2010 £000 p.a. | Additional pension earned during the year ended 31 December 2010* £000 p.a. | Transfer value as at 31 December 2010 £000 | Transfer value as at 31 December 2009 £000 | Increase in transfer value during the year ended 31 December 2010 £000 | Transfer value for the additional pension earned during the year ended 31 December 2010 (2) £000 |
| Gordon Pell | 60 | 563 | (19) | (19) | 12,732 | 13,581 | (849) | (441) |
*Net of statutory revaluation applying to deferred pensionspensions.
| (1) | Sir Fred GoodwinGordon Pell retired from employment with effect fromon 31 January 2009 and Johnny Cameron will retire from employment with effect from 28 February 2009. They were contractually entitled to an immediate pension based on their accrued service, including any service transferred in, with no discount for early payment.March 2010. The valuation of their pensions as at 31 December 2008figures in the table above takes accountshow his cash equivalent transfer value (CETV) as at the end of the payment datesyear, using the appropriate factors that would apply at that date. Prior to his retirement and subsequent exchange of these pensions. Employees in the RBS Fund, including directors, who retire earlypart of his pension for a lump sum his accrued pension was £590,940 p.a. at the request31 March 2010. The equivalent CETV of their employer, are entitled to an immediate pension with no discount for early payment. The provision for an early undiscounted pension on early retirementthis pre-commutation amount was £13,394,000 as at employer request will not apply to any executive director appointed in the future. Except as noted above for Sir Fred Goodwin and Johnny Cameron, the valuations in the table above make no allowance for early retirement.31 March 2010. |
| (2) | The decrease in pension during the year is a result of the lump sum of £488,579 (plus an additional £91,075 in respect of the excess above his personal lifetime allowance) taken by Gordon Pell on retirement which offset the accrual from 31 December 2009 to 31 March 2010. |
Gordon Pell retired from the Group on 31 March 2010, shortly after his normal pension age of 60. His pension at retirement was based on his 39 years of service with Lloyds TSB and with the Group, part of which has been funded by a transfer payment from a Lloyds TSB pension plan. As required by the Large and Medium-sized Companies and Groups (Accounts and Reports) Regulations 2008, the value shown above is the value at the end of the year of the residual pension.
There is a significant difference in the form of disclosure required by the Combined CodeListing Rules and the Directors’ Remuneration ReportLarge and Medium-sized Companies and Groups (Accounts and Reports) Regulations 2002.2008. The former requires disclosure of the additional pension earned during the yearperiod and the transfer value equivalent to this pension based on stock marketfinancial conditions at the end of the year.period. The latter requires the disclosure of the difference between the transfer value at the start and end of the yearperiod and is therefore dependent on the change in stock marketfinancial conditions over the course of the year. The above disclosure has been made in accordance with both of these documents.that time.
The transfer values disclosed above do not represent a sum paid or payable to the individual director. Instead they represent a potential liability of the Group’s pension schemes.
The proportion of benefits represented by funded pension schemes for Gordon Pell is 39%.
Stephen Hester and Larry FishBruce Van Saun are provided with a cash allowance in place of pension benefits or have contributions made to a defined contribution pension arrangement, as detailed below:
| | 2010 | 2009 |
| | £000 | £000 |
| Cash allowances in place of pension | | |
| Stephen Hester | 420 | 420 |
| Bruce Van Saun | — | 80 |
| | | |
| Pension contributions to a defined contribution pension arrangement | | |
| Bruce Van Saun | 321 | — |
Directors’ remuneration report continued | Governance |
Project Merlin - disclosure commitments
The Group is 46%committed to increasing the transparency of remuneration within the financial services industry and 2% respectively. All benefitscontributing to an international level playing field on disclosure. In addition to aligning with FSA requirements on remuneration disclosure by 31 December 2011, the Group has enhanced its Directors’ Remuneration Report to include the five highest paid senior executive officers as well as maintaining disclosure levels for Johnny Cameron, Mark Fisherexecutive directors.
The data below relates to the five members of the Group’s Executive Committee with the highest total remuneration for 2010. For consistency, figures are shown in GBP. Where applicable, currency conversion was based on the 2010 average exchange rate for fixed remuneration and Sir Fred Goodwin arethe 31 December 2010 spot rate for bonus figures, in funded pension schemes.line with the approach taken in this Report.
| | Executive A | | Executive B | | Executive C | | Executive D | | Executive E |
| | £000 | £000 | | £000 | £000 | | £000 | £000 | | £000 | £000 | | £000 | £000 |
Salary (1) | | 1,779 | | | 700 | | | 750 | | | 750 | | | 650 |
| Variable remuneration (cash) | 2 | | | 2 | | | 2 | | | 2 | | | 2 | |
| Variable remuneration (bond) | 488 | | | 1,018 | | | 253 | | | 238 | | | 193 | |
Variable remuneration (shares subject to retention) | 490 | | | 1,020 | | | 255 | | | 240 | | | 195 | |
| Deferred remuneration (bond) | 734 | | | 1,530 | | | 383 | | | 360 | | | 293 | |
Deferred remuneration (shares subject to retention) | 734 | | | 1,530 | | | 383 | | | 360 | | | 293 | |
Variable in Executive Reward Schemes (shares) (2) | 1,718 | | | 133 | | | 1,333 | | | 1,292 | | | 1,000 | |
Total variable remuneration (3) | | 4,166 | | | 5,233 | | | 2,609 | | | 2,492 | | | 1,976 |
| Total remuneration | | 5,945 | | | 5,933 | | | 3,359 | | | 3,242 | | | 2,626 |
| | | | | | | | | | | | | | | |
In accordance with US market practice, Larry Fish’s pensionable remuneration was limitedNo sign-on or severance awards have been made during 2010 to US$4 million per annum.any of the above individuals.
Larry Fish retired from employment with effect from 30 April 2008 and his pension benefits started on 1 May 2008.Notes:
| (1) | In addition, the total value of pension and other allowances paid during 2010 for each individual shown in the table above was: |
| Pension and other allowances | £000 |
| Executive A | 736 |
| Executive B | 294 |
| Executive C | 293 |
| Executive D | 647 |
| Executive E | 244 |
| (2) | Executive Reward Schemes (shares) include long-term incentive awards made following the end of the relevant financial year. The amounts shown reflect two thirds of the grant-date face value of the underlying shares to reflect an approximate performance factor applicable to these awards. The exact number of shares under each award will be based on the share price prior to grant and will therefore be determined at the time of grant. |
| (3) | Variable remuneration reflects the amounts of variable remuneration awarded in respect of the financial year and has been split into different elements based on the deferral position applicable for each employee. Deferral arrangements are compliant with the requirements of the FSA Code. |
Contributions and allowances paid in the year ended 31 December 2008 under defined contribution arrangements were:
| | | | 2008 $000 | | | | 2007 $000 | |
| Mr Fish | | | 6 | | | | 60 | |
Colin Buchan
ChairmanChair of the Remuneration Committee
2523 February 20092011
| Directors’ interest in shares | Governance |
Shares beneficially owned at 1 January 2008 in the tables below have been restated to reflect the capitalisation issue of ordinary shares in September 2008.
| | | | | | 31 December 2008 | |
| Executive directors | | Shares beneficially owned at 1 January 2008 or date of appointment, if later | | | Shares beneficially owned | | | Value (1) £ | |
| Mr Hester (2) | | — | | | | 340,524 | | | | 168,219 | |
| Mr Pell | | | 159,278 | | | | 611,927 | | | | 302,292 | |
| Mr Whittaker | | | 285,145 | | | | 1,313,173 | | | | 648,707 | |
Notes:
| | | 31 December 2010 |
| | Shares beneficially owned at 1 January 2010 or date of appointment, if later | Shares beneficially owned | Value (1) £ |
| Chairman | | | |
| Philip Hampton | 276,312 | 276,312 | 107,955 |
| | | | |
| Executive director | | | |
| Stephen Hester | 2,167,419 | 3,463,297 | 1,353,110 |
| | | | |
| Non-executive directors | | | |
| Colin Buchan | 157,515 | 157,515 | 61,541 |
| Sandy Crombie | 200,000 | 200,000 | 78,140 |
| Penny Hughes | 8,175 | 8,175 | 3,194 |
| Joe MacHale | 284,317 | 284,317 | 111,083 |
| John McFarlane | 50,000 | 50,000 | 19,535 |
| Brendan Nelson | — | 120,018 | 46,891 |
| Art Ryan | 50,000 | 50,000 | 19,535 |
| Philip Scott | 500,000 | 500,000 | 195,350 |
Note:
| (1) | The valueValue is based on the share price at 31 December 2008,2010, which was 49.4p.39.07p. During the year ended 31 December 20082010 the share price ranged from 41.4p31.25p to 370.5p.58.05p. |
(2) | Appointed as a director on 1 October 2008. |
As at 31 December 2008, the executive directors held a technical interest as potential beneficiaries in The Royal Bank of Scotland Group plc 2001 Employee Share Trust (51,680,795 shares), The Royal Bank of Scotland plc 1992 Employee Share Trust (1,028,914 shares) and The Royal Bank of Scotland Group plc 2007 US Employee Share Trust (8,455,545 shares), being trusts operated for the benefit of employees of the company and its subsidiaries.
| Non-executive directors | | Shares beneficially owned at 1 January 2008 or date of appointment, if later | | | Shares beneficially owned at 31 December 2008 | | | Value(1) £ | |
| Mr Buchan | | | 41,000 | | | | 157,515 | | | | 77,812 | |
| Mr Hunter | | | 10,762 | | | | 41,344 | | | | 20,424 | |
| Mr MacHale | | | 74,005 | | | | 284,317 | | | | 140,453 | |
| Mr Ryan (4) | | | — | | | | 50,000 | | | | 24,700 | |
| | | | | | | | | | | | | |
| Former Chairman | | | | | | | | | | | | |
| Sir Tom McKillop (2) | | | 213,200 | | | | 819,086 | | | | 404,628 | |
| | | | | | | | | | | | | |
| Former Non-executive directors | | | | | | | | | | | | |
| Dr Currie (3) | | | 1,709 | | | | 10,504 | | | | 5,189 | |
| Mr Friedrich (3) | | | 113,236 | | | | 435,039 | | | | 214,909 | |
| Mr Koch (3) | | | 92,250 | | | | 354,413 | | | | 175,080 | |
| Mrs Kong (3) | | | 26,650 | | | | 102,383 | | | | 50,577 | |
| Mr Scott (3) | | | 23,927 | | | | 91,915 | | | | 45,406 | |
| Mr Sutherland (3) | | | 18,084 | | | | 69,473 | | | | 34,320 | |
(1) | The value is based on the share price at 31 December 2008, which was 49.4p. During the year ended 31 December 2008 the share price ranged from 41.4p to 370.5p. |
(2) | Sir Tom McKillop ceased to be Chairman and a director on 3 February 2009. |
(3) | Retired as directors on 6 February 2009. |
(4) | Appointed as a director on 1 October 2008. |
No other director had an interest in the company’scompany's ordinary shares during the year.
No directoryear or held a non-beneficial interest in the shares of the company at 31 December 2008,2010, at 1 January 20082010 or date of appointment if later. The interests shown above include connected persons of the directors.
As at 2523 February 20092011, there were no changes to the directors’directors' interests in shares shown in the tablestable above.
Preference shares
Mr Koch held 20,000 non-cumulative preference shares of US$0.01 each at 31 December 2008 (2007 – 20,000). No other director shown above had an interest in the preference shares during the year.
Update to shareholdings of directors
Gordon Pell’s option over 223,428 shares at ₤5.17 lapsed on 9 March 2009. Guy Whittaker’s options over (i) 45,592 shares at £0.38 were granted on 16 January 2009; (ii) 9,218 shares at £1.89 lapsed on 6 January 2009 and (iii) 203,113 shares at £5.17 lapsed on 9 March 2009.
Guy Whittaker’s restricted stock award over 90,718 shares vested on 26 February 2009. Stephen Hester’s restricted stock award over 1,502,291 shares vested on 26 February 2009. Philip Hampton’s restricted stock award over 5,172,413 shares was granted on 27 February 2009.
As at 24 April, 2009, the most recent practicable date prior to the filing of this annual report on Form 20-F, the shareholdings of (i) Stephen Hester increased to 1,225,643 shares, (ii) Guy Whittaker increased to 1,366,622 shares and (iii) Philip Hampton increased to 26,312 shares.
The directors are required by Article 4 of the IAS Regulation (European Commission Regulation No 1606/2002) to prepare Group accounts, and as permitted by the Companies Act 19852006 have elected to prepare company accounts, for each financial year in accordance with International Financial Reporting Standards as adopted by the European Union. They are responsible for preparing accounts that present fairly the financial position, financial performance and cash flows of the Group and the company. In preparing those accounts, the directors are required to:
| select suitable accounting policies and then apply them consistently; |
| make judgements and estimates that are reasonable and prudent; and |
| state whether applicable accounting standards have been followed, subject to any material departures disclosed and explained in the accounts. |
The directors are responsible for keeping proper accounting records which disclose with reasonable accuracy at any time the financial position of the Group and to enable them to ensure that the Annual Report and Accounts complies with the Companies Act 1985.2006. They are also responsible for safeguarding the assets of the Group and hence for taking reasonable steps for the prevention and detection of fraud and other irregularities.
By order of the Board
Miller McLean
Aileen Taylor
Secretary
2523 February 20092011
We, the directors listed below, confirm that to the best of our knowledge:
| the financial statements, prepared in accordance with International Financial Reporting Standards, give a true and fair view of the assets, liabilities, financial position and profit or loss of the company and the undertakings included in the consolidation taken as a whole; and |
| the Business review, which is incorporated into the Directors’Directors' report, includes a fair review of the development and performance of the business and the position of the company and the undertakings included in the consolidation taken as a whole, together with a description of the principal risks and uncertainties that they face. |
By order of the Board
Philip Hampton | Stephen Hester | Bruce Van Saun |
| Chairman | Group Chief Executive | Group Finance Director |
23 February 2011
Board of directors
| Chairman | Executive directors | Non-executive directors |
| Philip Hampton | Stephen Hester Group Chief ExecutiveBruce Van Saun
| Guy Whittaker
Group Finance Director
|
| | |
25 February 2009 | | |
| | |
Board of directors
| | |
| | |
Chairman
Philip Hampton
| Executive directors
Stephen Hester
Gordon Pell
Guy Whittaker
| Non-executive directors
Colin Buchan Archie HunterSandy Crombie
Penny Hughes Joe MacHale John McFarlane Brendan Nelson Arthur ‘Art’ Ryan Philip Scott |
Financial statements| Financial statements | Contents |
| 208 | Independent auditor’s report |
| 209 | Consolidated income statement |
| 210 | Consolidated statement of comprehensive income |
| 211 | Balance sheets |
| 212 | Statements of changes in equity |
| 215 | Cash flow statements |
| 216 | Accounting policies |
| 228 | Notes on the accounts |
| | 1 | Net interest income | 228 |
| | 2 | Non-interest income (excluding insurance net premium income) | 229 |
| | 3 | Operating expenses | 230 |
| | 4 | Pension costs | 233 |
| | 5 | Auditor’s remuneration | 237 |
| | 6 | Tax | 238 |
| | 7 | Profit attributable to preference shareholders and paid-in equity holders | 238 |
| | 8 | Ordinary dividends | 239 |
| | 9 | Profit dealt with in the accounts of the company | 239 |
| | 10 | Earnings per ordinary and B share | 240 |
| | 11 | Financial instruments - classification | 241 |
| | 12 | Financial instruments - valuation | 251 |
| | 13 | Financial instruments - maturity analysis | 266 |
| | 14 | Financial assets - impairments | 269 |
| | 15 | Derivatives | 270 |
| | 16 | Debt securities | 273 |
| | 17 | Equity shares | 274 |
| | 18 | Investments in Group undertakings | 275 |
| | 19 | Intangible assets | 276 |
| | 20 | Property, plant and equipment | 279 |
| | 21 | Prepayments, accrued income and other assets | 281 |
| | 22 | Discontinued operations and assets and liabilities of disposal groups | 281 |
| | 23 | Short positions | 283 |
| | 24 | Accruals, deferred income and other liabilities | 283 |
| | 25 | Deferred tax | 283 |
| | 26 | Insurance business | 285 |
| | 27 | Subordinated liabilities | 290 |
| | 28 | Non-controlling interests | 298 |
| | 29 | Share capital | 299 |
| | 30 | Reserves | 302 |
| | 31 | Leases | 303 |
| | 32 | Collateral and securitisations | 305 |
| | 33 | Capital resources | 306 |
| | 34 | Memorandum items | 307 |
| | 35 | Net cash inflow/(outflow) from operating activities | 315 |
| | 36 | Analysis of the net investment in business interests and intangible assets | 316 |
| | 37 | Interest received and paid | 316 |
| | 38 | Analysis of changes in financing during the year | 317 |
| | 39 | Analysis of cash and cash equivalents | 317 |
| | 40 | Segmental analysis | 318 |
| | 41 | Directors’ and key management remuneration | 324 |
| | 42 | Transactions with directors and key management | 324 |
| | 43 | Related parties | 324 |
| | 44 | Post balance sheet events | 326 |
| | 45 | Consolidating financial information | 327 |
| | 1 | Net interest income | 173 |
| | 2 | Non-interest income | 173 |
| | | (excluding insurance premium income) | |
| | 3 | Operating expenses | 174 |
| | 4 | Pension costs | 176 |
| | 5 | Auditors’ remuneration | 178 |
| | 6 | Tax | 179 |
| | 7 | Profit attributable to other owners | 180 |
| | 8 | Ordinary dividends | 180 |
| | 9 | Profit dealt with in the accounts of the company | 180 |
| | 10 | Earnings per ordinary share | 181 |
| | 11 | Financial instruments | 181 |
| | 12 | Past due and impaired financial assets | 197 |
| | 13 | Derivatives | 199 |
| | 14 | Debt securities | 201 |
| | 15 | Equity shares | 203 |
| | 16 | Investments in Group undertakings | 204 |
| | 17 | Intangible assets | 205 |
| | 18 | Property, plant and equipment | 208 |
| | 19 | Prepayments, accrued income and other assets | 209 |
| | 20 | Discontinued operations and assets and liabilities of disposal groups | 210 |
| | 21 | Settlement balances and short positions | 211 |
| | 22 | Accruals, deferred income and other liabilities | 211 |
| | 23 | Deferred taxation | 212 |
| | 24 | Insurance business | 213 |
| | 25 | Subordinated liabilities | 220 |
| | 26 | Minority interests | 226 |
| | 27 | Share capital | 227 |
| | 28 | Owners’ equity | 230 |
| | 29 | Leases | 232 |
| | 30 | Collateral and securitisations | 233 |
| | 31 | Capital resources | 235 |
| | 32 | Memorandum items | 236 |
| | 33 | Net cash (outflow)/inflow from operating activities | 240 |
| | 34 | Analysis of the net investment in business interests and intangible assets | 241 |
| | 35 | Interest received and paid | 243 |
| | 36 | Analysis of changes in financing during the year | 244 |
| | 37 | Analysis of cash and cash equivalents | 244 |
| | 38 | Segmental analysis | 245 |
| | 39 | Directors’ and key management remuneration | 250 |
| | 40 | Transactions with directors, officers and others | 251 |
| | 41 | Related parties | 251 |
| | 42 | Post balance sheet events | 252 |
We have audited the financial statementsaccompanying consolidated balance sheets of The Royal Bank of Scotland Group plc (“the company”) and its subsidiaries (together “the Group”"the Group") for the year endedas of 31 December 2008 which comprise the accounting policies, the balance sheets as at 31 December2010, 2009 and 2008 and 2007, the related consolidated income statements, theconsolidated statements of comprehensive income, consolidated statements of changes in equity and consolidated cash flow statements the statements of recognised income and expense for each of the three years in the period ended 31 December 2008,2010, the related Notesnotes 1 to 4245 and the information identified as ‘audited’ in the Risk capital and liquiditybalance sheet management section of the Business review. These financial statements have been prepared underare the accounting policies set out therein. We have also audited the information in the partresponsibility of the directors’ remuneration report that is described as having been audited.
Respective responsibilities of directors and auditors
The directors’ responsibilities for preparing the annual report, the directors’ remuneration report and the financial statements in accordance with applicable law and International Financial Reporting Standards (IFRS), as adopted by the European Union, are set out in the statement of directors’ responsibilities.
Group's management. Our responsibility is to audit the financial statements and the part of the directors’ remuneration report described as having been audited in accordance with relevant legal and regulatory requirements and International Standards on Auditing (UK and Ireland).
We report to you our opinion as to whether the financial statements give a true and fair view and whether the financial statements and the part of the directors’ remuneration report described as having been audited have been properly prepared in accordance with the Companies Act 1985, and as regards the Group’s consolidated financial statements, Article 4 of the IAS Regulation. We also report to you whether in our opinion, the information given in the directors’ report is consistent with the financial statements. The information given in the directors’ report includes that specific information presented in the Business review that is cross referred from the business review section of the directors’ report.
In addition we report to you if, in our opinion, the company has not kept proper accounting records, we have not received all the information and explanations we require for our audit, or if information specified by law regarding directors’ remuneration and other transactions is not disclosed.
We review whether the corporate governance statement reflects the company’s compliance with the nine provisions of the 2006 Combined Code specified for our review by the Listing Rules of the Financial Services Authority, and we report if it does not.
The Listing Rules do not require us to consider whether the Board or management’s statements on internal control cover all risks and controls, or formexpress an opinion on the effectiveness of the Group’s corporate governance procedures or its risk and control procedures.these financial statements based on our audits.
We read the other information contained in the Annual Report and Accounts 2008 as described in the contents section, including the unaudited part of the directors’ remuneration report, and consider whether it is consistent with the audited financial statements. We consider the implications for our report if we become aware of any apparent misstatements or material inconsistencies with the financial statements. Our responsibilities do not extend to any further information outside the Annual Report and Accounts 2008.
Basis of audit opinion
We conducted our audit in accordance with International Standards on Auditing (UK and Ireland) issued by the Auditing Practices Board and with the standards of the Public Company Accounting Oversight Board (United States). Those standards require that we plan and perform the audit to obtain reasonable assurance about whether the financial statements are free of material misstatement. An audit includes examination,examining, on a test basis, of evidence relevant tosupporting the amounts and disclosures in the financial statements and the part of the directors’ remuneration report described as having been audited. Itstatements. An audit also includes an assessment ofassessing the accounting principles used and significant estimates and judgements made by management, as well as evaluating the directors in the preparation of theoverall financial statements, and of whether the accounting policies are appropriate to the circumstances of the company and the Group, consistently applied and adequately disclosed.
statement presentation. We planned and performedbelieve that our audit so as to obtain all the information and explanations which we considered necessary in order to provide us with sufficient evidence to giveprovides a reasonable assurance that the financial statements and the part of the directors’ remuneration report described as having been audited are free from material misstatement, whether caused by fraud or other irregularity or error. In formingbasis for our opinion, we also evaluated the overall adequacy of the presentation of information in the financial statements and the part of the directors’ remuneration report described as having been audited.opinion.
UK opinion
In our opinion:
· | the Group financial statements give a true and fair view, in accordance with IFRS as adopted by the European Union, of the state of the Group’s affairs as at 31 December 2008 and of its loss and cash flows for the year then ended; |
· | the company financial statements give a true and fair view, in accordance with IFRS as adopted by the European Union as applied in accordance with the provisions of the companies Act 1985, of the state of affairs of the company as at 31 December 2008; |
· | the financial statements and the part of the directors’ remuneration report described as having been audited have been properly prepared in accordance with the Companies Act 1985 and, as regards the Group financial statements, Article 4 of the IAS Regulation; and |
· | the information given in the directors’ report is consistent with the financial statements. |
Separate opinion in relation to IFRS
As explained in the accounting policies, the Group, in addition to complying with its legal obligation to comply with IFRS as adopted by the European Union, has also complied with IFRS as issued by the International Accounting Standards Board (IASB).
In our opinion, the financial statements give a true and fair view, in accordance with IFRS, of the state of the Group’s affairs as at 31 December 2008 and of its loss and cash flows for the year then ended.
US opinion
In our opinion, thesuch consolidated financial statements present fairly, in all material respects,aspects, the financial position of the Group as at 31 December 20082010, 2009 and 20072008, and the results of its operations and its cash flows for each of the three years in the period ended 31 December 2008,2010, in conformity with IFRSInternational Financial Reporting Standards ("IFRS") as adopted for use in the European Union and IFRS as issued by the IASB.International Accounting Standards Board.
TheNote 45 to the financial statements was added for the year ended 31 December 2007 were restated for the matters disclosedinclusion of consolidating financial information in Note 1respect of the Accounting Polices.The Royal Bank of Scotland plc in accordance with Regulation S-X Rule 3-10.
We have also audited, in accordance with the standards of the Public Company Accounting Oversight Board (United States), the Group’sGroup's internal control over financial reporting as atof 31 December 2008,2010 based on the criteria established in Internal Control-Integrated Framework issued by the Committee of Sponsoring Organisations of the Treadway Commission.
OurCommission and our report dated 2523 February 2009 which is included in this Annual Report on Form 20-F for the year ended 31 December 2008 expresses2011 expressed an unqualified opinion on the effectiveness of the Group’sGroup's internal control over financial reporting of the Group.reporting.
/s/ Deloitte LLP
Chartered Accountants and Registered Auditors
Edinburgh,London, United Kingdom
2523 February 20092011 (31 March 2011 for the consolidating financial information included in Note 45)
| Consolidated income statement | Financial statements |
| for the year ended 31 December 2010 | |
| | Note | 2010 £m | 2009 (1) £m | 2008 (1) £m |
| Interest receivable | | 22,776 | 26,311 | 42,190 |
| Interest payable | | (8,567) | (12,923) | (26,708) |
| Net interest income | 1 | 14,209 | 13,388 | 15,482 |
| Fees and commissions receivable | 2 | 8,193 | 8,738 | 8,855 |
| Fees and commissions payable | 2 | (2,211) | (2,790) | (2,444) |
| Income/(loss) from trading activities | 2 | 4,517 | 3,761 | (9,025) |
| Gain on redemption of own debt | 2 | 553 | 3,790 | — |
| Other operating income (excluding insurance net premium income) | 2 | 1,479 | 873 | 2,153 |
| Insurance net premium income | 26 | 5,128 | 5,266 | 5,709 |
| Non-interest income | | 17,659 | 19,638 | 5,248 |
| Total income | | 31,868 | 33,026 | 20,730 |
| Staff costs | | | | |
| - excluding curtailment gains | | (9,671) | (9,993) | (8,898) |
| - pension schemes curtailment gains | | — | 2,148 | — |
| Premises and equipment | | (2,402) | (2,594) | (2,163) |
| Other administrative expenses | | (3,995) | (4,449) | (4,716) |
| Depreciation and amortisation | | (2,150) | (2,166) | (2,377) |
| Write-down of goodwill and other intangible assets | | (10) | (363) | (16,911) |
| Operating expenses | 3 | (18,228) | (17,417) | (35,065) |
| Profit/(loss) before other operating charges and impairment losses | | 13,640 | 15,609 | (14,335) |
| Insurance net claims | 26 | (4,783) | (4,357) | (3,917) |
| Impairment losses | 14 | (9,256) | (13,899) | (7,439) |
| Operating loss before tax | | (399) | (2,647) | (25,691) |
| Tax (charge)/credit | 6 | (634) | 429 | 2,167 |
| Loss from continuing operations | | (1,033) | (2,218) | (23,524) |
| Loss from discontinued operations, net of tax | 22 | (633) | (105) | (11,018) |
| Loss for the year | | (1,666) | (2,323) | (34,542) |
| | | | | |
| Loss attributable to: | | | | |
| Non-controlling interests | | (665) | 349 | (10,832) |
| Preference shareholders | 7 | 105 | 878 | 536 |
| Paid-in equity holders | 7 | 19 | 57 | 60 |
| Ordinary and B shareholders | | (1,125) | (3,607) | (24,306) |
| | | (1,666) | (2,323) | (34,542) |
| | | | | |
Per ordinary and B share (2) | | | | |
| Basic loss from continuing operations | 10 | (0.5p) | (6.3p) | (146.2p) |
| | | | | |
| Diluted loss from continuing operations | 10 | (0.5p) | (6.3p) | (146.2p) |
| | | | | |
| Basic loss from discontinued operations | 10 | — | (0.1p) | (0.5p) |
| | | | | |
| Diluted loss from discontinued operations | 10 | — | (0.1p) | (0.5p) |
| | | | | |
| Dividends | 8 | — | — | 19.3p |
Notes:
| | | | | | 2008 | | | 2007 | | | 2006 | |
| | | Note | | | | £m | | | | £m | | | | £m | |
| Interest receivable | | | | | | 49,522 | | | | 32,252 | | | | 24,688 | |
| Interest payable | | | | | | (30,847 | ) | | | (20,183 | ) | | | (14,092 | ) |
| Net interest income | | | 1 | | | | 18,675 | | | | 12,069 | | | | 10,596 | |
| Fees and commissions receivable | | | 2 | | | | 9,831 | | | | 8,278 | | | | 7,116 | |
| Fees and commissions payable | | | 2 | | | | (2,386 | ) | | | (2,193 | ) | | | (1,922 | ) |
| (Loss)/income from trading activities | | | 2 | | | | (8,477 | ) | | | 1,292 | | | | 2,675 | |
| Other operating income (excluding insurance premium income) | | | 2 | | | | 1,899 | | | | 4,833 | | | | 3,564 | |
| Insurance net premium income | | | 24 | | | | 6,326 | | | | 6,087 | | | | 5,973 | |
| Non-interest income | | | | | | | 7,193 | | | | 18,297 | | | | 17,406 | |
| Total income | | | | | | | 25,868 | | | | 30,366 | | | | 28,002 | |
| Staff costs | | | | | | | 10,241 | | | | 7,338 | | | | 6,723 | |
| Premises and equipment | | | | | | | 2,593 | | | | 1,703 | | | | 1,421 | |
| Other administrative expenses | | | | | | | 5,464 | | | | 2,969 | | | | 2,658 | |
| Depreciation and amortisation | | | | | | | 3,154 | | | | 1,932 | | | | 1,678 | |
| Write-down of goodwill and other intangible assets | | | | | | | 32,581 | | | | — | | | | — | |
| Operating expenses | | | 3 | | | | 54,033 | | | | 13,942 | | | | 12,480 | |
| (Loss)/profit before other operating charges and impairment | | | | | | | (28,165 | ) | | | 16,424 | | | | 15,522 | |
| Insurance net claims | | | 24 | | | | 4,430 | | | | 4,624 | | | | 4,458 | |
| Impairment | | | 12 | | | | 8,072 | | | | 1,968 | | | | 1,878 | |
| Operating (loss)/profit before tax | | | | | | | (40,667 | ) | | | 9,832 | | | | 9,186 | |
| Tax | | | 6 | | | | (2,323 | ) | | | 2,044 | | | | 2,689 | |
| (Loss)/profit from continuing operations | | | | | | | (38,344 | ) | | | 7,788 | | | | 6,497 | |
| Profit/(loss) from discontinued operations, net of tax | | | 20 | | | | 3,971 | | | | (76 | ) | | | — | |
| (Loss)/profit for the year | | | | | | | (34,373 | ) | | | 7,712 | | | | 6,497 | |
| | | | | | | | | | | | | | | | | |
| (Loss)/profit attributable to: | | | | | | | | | | | | | | | | |
| Minority interests | | | | | | | (10,832 | ) | | | 163 | | | | 104 | |
| Other owners | | | 7 | | | | 596 | | | | 246 | | | | 191 | |
| Ordinary shareholders | | | | | | | (24,137 | ) | | | 7,303 | | | | 6,202 | |
| | | | | | | | (34,373 | ) | | | 7,712 | | | | 6,497 | |
| Per 25p ordinary share: | | | | | | | | | | | | | | | | |
| Basic earnings | | | 10 | | | | (145.7p | ) | | | 64.0 | p | | | 54.4 | p |
| | | | | | | | | | | | | | | | | |
| Diluted earnings | | | 10 | | | | (145.7p | ) | | | 63.4 | p | | | 53.9 | p |
| | | | | | | | | | | | | | | | | |
| Dividends | | | 8 | | | | 19.3 | p | | | 27.0 | p | | | 21.6 | p |
| (1) | The Dutch retail and other banking businesses transferred to the Dutch State on 1 April 2010 are recognised as discontinued operations. Comparative information has been changed accordingly. |
| (2) | B shares rank pari-passu with ordinary shares. |
The accompanying notes on pages 173228 to 252,331, the accounting policies on pages 162216 to 172227 and the audited sections of ‘Thethe Business Review:review: Risk Capital and Liquidity Management’balance sheet management on pages 5759 to 123164 form an integral part of these financial statements.
| Consolidated statement of comprehensive income | Financial statements |
| for the year ended 31 December 2010 | |
Balance sheets at 31 December 2008
| | Note | 2010 £m | 2009 £m | 2008 £m |
| Loss for the year | | (1,666) | (2,323) | (34,542) |
| Other comprehensive income/(loss) | | | | |
Available-for-sale financial assets | | (389) | 2,016 | (7,406) |
| Cash flow hedges | | 1,454 | 684 | (1,456) |
| Currency translation | | 81 | (3,300) | 15,425 |
| Actuarial gains/(losses) on defined benefit plans | 4 | 158 | (3,665) | (2,287) |
| Other comprehensive income/(loss) before tax | | 1,304 | (4,265) | 4,276 |
| Tax (charge)/credit | | (309) | 430 | 2,786 |
| Other comprehensive income/(loss) after tax | | 995 | (3,835) | 7,062 |
| Total comprehensive loss for the year | | (671) | (6,158) | (27,480) |
| | | | | |
| Total comprehensive loss recognised in the statement of changes in equity is attributable as follows: | | | | |
| Non-controlling interests | | (197) | (1,346) | (4,332) |
| Preference shareholders | | 105 | 878 | 536 |
| Paid-in equity holders | | 19 | 57 | 60 |
| Ordinary and B shareholders | | (598) | (5,747) | (23,744) |
| | | (671) | (6,158) | (27,480) |
| | | | | | Group | | | Company | |
| | | | | | | 2008 £m | | | Restated 2007 £m | | | | 2008 £m | | | | 2007 £m | |
| | | Note | |
| Assets | | | | | | | | | | | | | | | | | | |
| Cash and balances at central banks | | | 11 | | | | 12,400 | | | | 17,866 | | | | — | | | | — | |
| Loans and advances to banks | | | 11 | | | | 138,197 | | | | 219,460 | | | | 27,031 | | | | 7,686 | |
| Loans and advances to customers | | | 11 | | | | 874,722 | | | | 828,538 | | | | — | | | | 307 | |
| Debt securities subject to repurchase agreements | | | 30 | | | | 80,576 | | | | 107,651 | | | | — | | | | — | |
| Other debt securities | | | | | | | 186,973 | | | | 187,005 | | | | — | | | | — | |
| Debt securities | | | 14 | | | | 267,549 | | | | 294,656 | | | | — | | | | — | |
| Equity shares | | | 15 | | | | 26,330 | | | | 53,026 | | | | — | | | | — | |
| Investments in Group undertakings | | | 16 | | | | — | | | | — | | | | 42,196 | | | | 43,542 | |
| Settlement balances | | | | | | | 17,832 | | | | 16,589 | | | | — | | | | — | |
| Derivatives | | | 13 | | | | 992,559 | | | | 277,402 | | | | 1,168 | | | | 173 | |
| Intangible assets | | | 17 | | | | 20,049 | | | | 49,916 | | | | — | | | | — | |
| Property, plant and equipment | | | 18 | | | | 18,949 | | �� | | 18,745 | | | | — | | | | — | |
| Deferred taxation | | | 23 | | | | 7,082 | | | | 3,119 | | | | 3 | | | | — | |
| Prepayments, accrued income and other assets | | | 19 | | | | 24,402 | | | | 15,662 | | | | 489 | | | | 127 | |
| Assets of disposal groups | | | 20 | | | | 1,581 | | | | 45,850 | | | | — | | | | — | |
| Total assets | | | | | | | 2,401,652 | | | | 1,840,829 | | | | 70,887 | | | | 51,835 | |
| | | | | | | | | | | | | | | | | | | | | |
| Liabilities | | | | | | | | | | | | | | | | | | | | |
| Deposits by banks | | | 11 | | | | 258,044 | | | | 312,294 | | | | 1,802 | | | | 5,572 | |
| Customer accounts | | | 11 | | | | 639,512 | | | | 682,363 | | | | 26 | | | | — | |
| Debt securities in issue | | | 11 | | | | 300,289 | | | | 274,172 | | | | 14,179 | | | | 13,453 | |
| Settlement balances and short positions | | | 21 | | | | 54,277 | | | | 91,021 | | | | — | | | | — | |
| Derivatives | | | 13 | | | | 971,364 | | | | 272,052 | | | | 361 | | | | 179 | |
| Accruals, deferred income and other liabilities | | | 22 | | | | 31,482 | | | | 34,208 | | | | 47 | | | | 8 | |
| Retirement benefit liabilities | | | 4 | | | | 2,032 | | | | 460 | | | | — | | | | — | |
| Deferred taxation | | | 23 | | | | 4,165 | | | | 5,400 | | | | — | | | | 3 | |
| Insurance liabilities | | | 24 | | | | 9,976 | | | | 10,162 | | | | — | | | | — | |
| Subordinated liabilities | | | 25 | | | | 49,154 | | | | 38,043 | | | | 10,314 | | | | 7,743 | |
| Liabilities of disposal groups | | | 20 | | | | 859 | | | | 29,228 | | | | — | | | | — | |
| Total liabilities | | | | | | | 2,321,154 | | | | 1,749,403 | | | | 26,729 | | | | 26,958 | |
| | | | | | | | | | | | | | | | | | | | | |
| Minority interests | | | 26 | | | | 21,619 | | | | 38,388 | | | | — | | | | — | |
| Equity owners | | | 27, 28 | | | | 58,879 | | | | 53,038 | | | | 44,158 | | | | 24,877 | |
| Total equity | | | | | | | 80,498 | | | | 91,426 | | | | 44,158 | | | | 24,877 | |
| | | | | | | | | | | | | | | | | | | | | |
| Total liabilities and equity | | | | | | | 2,401,652 | | | | 1,840,829 | | | | 70,887 | | | | 51,835 | |
The accompanying notes on pages 173228 to 252,331, the accounting policies on pages 162216 to 172227 and the audited sections of ‘Thethe Business Review:review: Risk Capital and Liquidity Management’balance sheet management on pages 5759 to 123164 form an integral part of these financial statements.
| Balance sheets | Financial statements |
| as at 31 December 2010 | |
| | | Group | | Company |
| | Note | 2010 £m | 2009 £m | 2008 £m | | 2010 £m | 2009 £m | 2008 £m |
| Assets | | | | | | | | |
| Cash and balances at central banks | 11 | 57,014 | 52,261 | 12,400 | | — | — | — |
| Loans and advances to banks | 11 | 100,518 | 91,753 | 138,197 | | 19,535 | 31,238 | 27,031 |
| Loans and advances to customers | 11 | 555,260 | 728,393 | 874,722 | | 6,689 | 2,777 | — |
| Debt securities subject to repurchase agreements | 32 | 80,104 | 66,883 | 80,576 | | — | — | — |
| Other debt securities | | 137,376 | 200,371 | 186,973 | | 1,454 | 1,286 | — |
| Debt securities | 16 | 217,480 | 267,254 | 267,549 | | 1,454 | 1,286 | — |
| Equity shares | 17 | 22,198 | 19,528 | 26,330 | | — | — | — |
| Investments in Group undertakings | 18 | — | — | — | | 49,125 | 64,766 | 42,196 |
| Settlement balances | | 11,605 | 12,033 | 17,832 | | — | 11 | — |
| Derivatives | 15 | 427,077 | 441,454 | 992,559 | | 1,475 | 1,169 | 1,168 |
| Intangible assets | 19 | 14,448 | 17,847 | 20,049 | | — | — | — |
| Property, plant and equipment | 20 | 16,543 | 19,397 | 18,949 | | — | — | — |
| Deferred tax | 25 | 6,373 | 7,039 | 7,082 | | 2 | 2 | 3 |
| Prepayments, accrued income and other assets | 21 | 12,576 | 20,985 | 24,402 | | 28 | 43 | 489 |
| Assets of disposal groups | 22 | 12,484 | 18,542 | 1,581 | | — | — | — |
| Total assets | | 1,453,576 | 1,696,486 | 2,401,652 | | 78,308 | 101,292 | 70,887 |
| | | | | | | | | |
| Liabilities | | | | | | | | |
| Deposits by banks | 11 | 98,790 | 142,144 | 258,044 | | — | 93 | 1,802 |
| Customer accounts | 11 | 510,693 | 614,202 | 639,512 | | 1,029 | 13,264 | 26 |
| Debt securities in issue | 11 | 218,372 | 267,568 | 300,289 | | 8,742 | 11,788 | 14,179 |
| Settlement balances | | 10,991 | 10,413 | 11,741 | | — | — | — |
| Short positions | 23 | 43,118 | 40,463 | 42,536 | | — | — | — |
| Derivatives | 15 | 423,967 | 424,141 | 971,364 | | 231 | 446 | 361 |
| Accruals, deferred income and other liabilities | 24 | 23,089 | 30,327 | 31,482 | | 1,034 | 1,357 | 47 |
| Retirement benefit liabilities | 4 | 2,288 | 2,963 | 2,032 | | — | — | — |
| Deferred tax | 25 | 2,142 | 2,811 | 4,165 | | — | — | — |
| Insurance liabilities | 26 | 6,794 | 10,281 | 9,976 | | — | — | — |
| Subordinated liabilities | 27 | 27,053 | 37,652 | 49,154 | | 8,048 | 8,762 | 10,314 |
| Liabilities of disposal groups | 22 | 9,428 | 18,890 | 859 | | — | — | — |
| Total liabilities | | 1,376,725 | 1,601,855 | 2,321,154 | | 19,084 | 35,710 | 26,729 |
| | | | | | | | | |
| Non-controlling interests | 28 | 1,719 | 16,895 | 21,619 | | — | — | — |
| Owners’ equity | 29,30 | 75,132 | 77,736 | 58,879 | | 59,224 | 65,582 | 44,158 |
| Total equity | | 76,851 | 94,631 | 80,498 | | 59,224 | 65,582 | 44,158 |
| | | | | | | | | |
| Total liabilities and equity | | 1,453,576 | 1,696,486 | 2,401,652 | | 78,308 | 101,292 | 70,887 |
The accompanying notes on pages 228 to 331, the accounting policies on pages 216 to 227 and the audited sections of the Business review: Risk and balance sheet management on pages 59 to 164 form an integral part of these financial statements.
The accounts were approved by the Board of directors on 2523 February 20092011 and signed on its behalf by:
Philip Hampton Chairman | | Stephen Hester Group Chief Executive | | Bruce Van Saun Group Finance Director |
The Royal Bank of Scotland Group plc
Registered No. SC45551
Philip HamptonStatements of changes in equity | Stephen Hester | Guy WhittakerFinancial statements |
Chairmanfor the year ended 31 December 2010 | Group Chief Executive | Group Finance Director |
| | Group | | Company |
| | 2010 | 2009 | 2008 | | 2010 | 2009 | 2008 |
| | £m | £m | £m | | £m | £m | £m |
| Called-up share capital | | | | | | | |
| At 1 January | 14,630 | 9,898 | 2,530 | | 14,630 | 9,898 | 2,530 |
| Ordinary shares issued in respect of placing and open offers | — | 4,227 | 5,728 | | — | 4,227 | 5,728 |
| Ordinary shares issued in respect of rights issue | — | — | 1,531 | | — | — | 1,531 |
| Ordinary shares issued in respect of capitalisation issue | — | — | 101 | | — | — | 101 |
| B shares issued | — | 510 | — | | — | 510 | — |
| Preference shares issued in respect of placing and open offer | — | — | 5 | | — | — | 5 |
| Ordinary shares issued | 523 | — | 3 | | 523 | — | 3 |
| Preference shares redeemed | (1) | (5) | — | | (1) | (5) | — |
| Cancellation of non-voting deferred shares | (27) | — | — | | (27) | — | — |
| At 31 December | 15,125 | 14,630 | 9,898 | | 15,125 | 14,630 | 9,898 |
| | | | | | | | |
| Paid-in equity | | | | | | | |
| At 1 January | 565 | 1,073 | 1,073 | | 565 | 1,073 | 1,073 |
| Securities redeemed | (132) | (308) | — | | (132) | (308) | — |
| Transfer to retained earnings | (2) | (200) | — | | (2) | (200) | — |
| At 31 December | 431 | 565 | 1,073 | | 431 | 565 | 1,073 |
| | | | | | | | |
| Share premium account | | | | | | | |
| At 1 January | 23,523 | 27,471 | 17,322 | | 23,523 | 27,471 | 17,322 |
Ordinary shares issued in respect of placing and open offer, net of £95 million expenses | — | 1,047 | — | | — | 1,047 | — |
Ordinary shares issued in respect of rights issue, net of £246 million expenses | — | — | 10,469 | | — | — | 10,469 |
| Ordinary shares issued in respect of capitalisation issue | — | — | (101) | | — | — | (101) |
| Expenses of placing and open offer | — | — | (265) | | — | — | (265) |
| Ordinary shares issued | 281 | — | 46 | | 281 | — | 46 |
| Redemption of preference shares classified as debt | 118 | — | — | | 118 | — | — |
| Preference shares redeemed | — | (4,995) | — | | — | (4,995) | — |
| At 31 December | 23,922 | 23,523 | 27,471 | | 23,922 | 23,523 | 27,471 |
| | | | | | | | |
| Merger reserve | | | | | | | |
| At 1 January | 25,522 | 10,881 | 10,881 | | 14,641 | — | — |
| Issue of B shares, net of £399 million expenses | — | 24,591 | — | | — | 24,591 | — |
| Placing and open offer | — | — | 14,273 | | — | — | 14,273 |
| Transfer to retained earnings | (12,250) | (9,950) | (14,273) | | (12,250) | (9,950) | (14,273) |
| At 31 December | 13,272 | 25,522 | 10,881 | | 2,391 | 14,641 | — |
| | | | | | | | |
| Available-for-sale reserve | | | | | | | |
| At 1 January | (1,755) | (3,561) | 1,032 | | — | — | — |
| Unrealised gains/(losses) | 179 | 1,202 | (6,808) | | — | — | — |
| Realised (gains)/losses | (519) | 981 | 842 | | — | — | — |
| Tax | 74 | (377) | 1,373 | | — | — | — |
Recycled to profit or loss on disposal of businesses, net of £5 million tax | (16) | — | — | | — | — | — |
| At 31 December | (2,037) | (1,755) | (3,561) | | — | — | — |
| | | | | | | | |
| Cash flow hedging reserve | | | | | | | |
| At 1 January | (252) | (876) | (555) | | (1) | (4) | (5) |
| Amount recognised in equity | 180 | 380 | (603) | | — | — | — |
| Amount transferred from equity to earnings | (59) | 513 | 198 | | 1 | 3 | 2 |
| Tax | (67) | (269) | 84 | | — | — | (1) |
Recycled to profit or loss on disposal of businesses, net of £19 million tax | 58 | — | — | | — | — | — |
| At 31 December | (140) | (252) | (876) | | — | (1) | (4) |
| Statements of changes in equity | Financial statements |
| for the year ended 31 December 2010 |
| | Group | | Company |
| | 2010 | 2009 | 2008 | | 2010 | 2009 | 2008 |
| | £m | £m | £m | | £m | £m | £m |
| Foreign exchange reserve | | | | | | | |
| At 1 January | 4,528 | 6,385 | (426) | | — | — | — |
| Retranslation of net assets | 997 | (2,322) | 11,970 | | — | — | — |
| Foreign currency (losses)/gains on hedges of net assets | (458) | 456 | (5,801) | | — | — | — |
| Tax | 63 | 9 | 642 | | — | — | — |
| Recycled to profit or loss on disposal of businesses | 8 | — | — | | — | — | — |
| At 31 December | 5,138 | 4,528 | 6,385 | | — | — | — |
| | | | | | | | |
| Capital redemption reserve | | | | | | | |
| At 1 January | 170 | 170 | 170 | | 170 | 170 | 170 |
| Preference shares redeemed | 1 | — | — | | 1 | — | — |
| Cancellation of non-voting deferred shares | 27 | — | — | | 27 | — | — |
| At 31 December | 198 | 170 | 170 | | 198 | 170 | 170 |
| | | | | | | | |
| Contingent capital reserve | | | | | | | |
| At 1 January | (1,208) | — | — | | (1,208) | — | — |
| Contingent capital agreement - consideration payable | — | (1,208) | — | | — | (1,208) | — |
| At 31 December | (1,208) | (1,208) | — | | (1,208) | (1,208) | — |
| | | | | | | | |
| Retained earnings | | | | | | | |
| At 1 January | 12,134 | 7,542 | 21,072 | | 13,262 | 5,550 | 3,787 |
Loss attributable to ordinary and B shareholders and other equity owners | | | | | | | |
| - continuing operations | (973) | (2,600) | (23,624) | | (4,554) | (1,503) | (9,602) |
| - discontinued operations | (28) | (72) | (86) | | — | — | — |
| Ordinary dividends paid | — | — | (2,312) | | — | — | (2,312) |
| Equity preference dividends paid | (105) | (878) | (536) | | (105) | (878) | (536) |
| Paid-in equity dividends paid, net of tax | (19) | (57) | (60) | | (19) | (57) | (60) |
| Transfer from paid-in equity | | | | | | | |
| - gross | 2 | 200 | — | | 2 | 200 | — |
| - tax | (1) | — | — | | (1) | — | — |
| Equity owners gain on withdrawal of non-controlling interests | | | | | | | |
| - gross | 40 | 629 | — | | — | — | — |
| - tax | (11) | (176) | — | | — | — | — |
| Redemption of equity preference shares | (2,968) | — | — | | (2,968) | — | — |
| Gain on redemption of equity preference shares | 609 | — | — | | 616 | — | — |
| Redemption of preference shares classified as debt | (118) | — | — | | (118) | — | — |
| Transfer from merger reserve | 12,250 | 9,950 | 14,273 | | 12,250 | 9,950 | 14,273 |
Actuarial gains/(losses) recognised in retirement benefit schemes | | | | | | | |
| - gross | 158 | (3,756) | (1,807) | | — | — | — |
| - tax | (71) | 1,043 | 472 | | — | — | — |
| Purchase of non-controlling interests | (38) | — | — | | — | — | — |
Net cost of shares bought and used to satisfy share-based payments | (13) | (16) | (19) | | — | — | — |
| Share-based payments | | | | | | | |
| - gross | 385 | 325 | 177 | | — | — | — |
| - tax | 6 | — | (8) | | — | — | — |
| At 31 December | 21,239 | 12,134 | 7,542 | | 18,365 | 13,262 | 5,550 |
| | | | | | | | |
| Own shares held | | | | | | | |
| At 1 January | (121) | (104) | (61) | | — | — | — |
| Shares purchased | (700) | (33) | (64) | | — | — | — |
| Shares issued under employee share schemes | 13 | 16 | 21 | | — | — | — |
| At 31 December | (808) | (121) | (104) | | — | — | — |
| | | | | | | | |
| Equity owners at 31 December | 75,132 | 77,736 | 58,879 | | 59,224 | 65,582 | 44,158 |
| | | Group | | | Company | |
| | | 2008 | | | 2007 | | | 2006 | | | 2008 | | | 2007 | | | 2006 | |
| | | | £m | | | | £m | | | | £m | | | | £m | | | | £m | | | | £m | |
| Available-for-sale investments | | | | | | | | | | | | | | | | | | | | | | | | |
| Net valuation (losses)/gains taken direct to equity | | | (8,096 | ) | | | (776 | ) | | | 4,792 | | | | — | | | | — | | | | — | |
| Net loss/(profit) taken to income | | | 690 | | | | (513 | ) | | | (313 | ) | | | — | | | | — | | | | — | |
| | | | | | | | | | | | | | | | | | | | | | | | | |
| Cash flow hedges | | | | | | | | | | | | | | | | | | | | | | | | |
| Net losses taken direct to equity | | | (1,618 | ) | | | (426 | ) | | | (109 | ) | | | — | | | | — | | | | — | |
| Net losses/(gains) taken to earnings | | | 162 | | | | (138 | ) | | | (140 | ) | | | 2 | | | | 3 | | | | 3 | |
| | | | | | | | | | | | | | | | | | | | | | | | | |
| Exchange differences on translation of foreign operations | | | 15,425 | | | | 2,210 | | | | (1,681 | ) | | | — | | | | — | | | | — | |
| Actuarial (losses)/gains on defined benefit plans | | | (2,287 | ) | | | 2,189 | | | | 1,781 | | | | — | | | | — | | | | — | |
| Income before tax on items recognised direct in equity | | | 4,276 | | | | 2,546 | | | | 4,330 | | | | 2 | | | | 3 | | | | 3 | |
| Tax on items recognised direct in equity | | | 2,786 | | | | (170 | ) | | | (1,173 | ) | | | (1 | ) | | | (1 | ) | | | (1 | ) |
| Net income recognised direct in equity | | | 7,062 | | | | 2,376 | | | | 3,157 | | | | 1 | | | | 2 | | | | 2 | |
| (Loss)/profit for the period | | | (34,373 | ) | | | 7,712 | | | | 6,497 | | | | (9,602 | ) | | | 2,499 | | | | 3,499 | |
| Total recognised income and expense for the year | | | (27,311 | ) | | | 10,088 | | | | 9,654 | | | | (9,601 | ) | | | 2,501 | | | | 3,501 | |
| | | | | | | | | | | | | | | | | | | | | | | | | |
| Attributable to: | | | | | | | | | | | | | | | | | | | | | | | | |
| Equity owners | | | (22,979 | ) | | | 8,610 | | | | 7,707 | | | | (9,601 | ) | | | 2,501 | | | | 3,501 | |
| Minority interests | | | (4,332 | ) | | | 1,478 | | | | 1,947 | | | | — | | | | — | | | | — | |
| | | | (27,311 | ) | | | 10,088 | | | | 9,654 | | | | (9,601 | ) | | | 2,501 | | | | 3,501 | |
| Statements of changes in equity | Financial statements |
| for the year ended 31 December 2010 |
| | Group | | Company |
| | 2010 | 2009 | 2008 | | 2010 | 2009 | 2008 |
| | £m | £m | £m | | £m | £m | £m |
| Non-controlling interests | | | | | | | |
| At 1 January | 16,895 | 21,619 | 38,388 | | — | — | — |
| Currency translation adjustments and other movements | (466) | (1,434) | 9,256 | | — | — | — |
| Acquisition of ABN AMRO | — | — | 356 | | — | — | — |
| (Loss)/profit attributable to non-controlling interests | | | | | | | |
| - continuing operations | (60) | 382 | 100 | | — | — | — |
| - discontinued operations | (605) | (33) | (10,932) | | — | — | — |
| Dividends paid | (4,200) | (313) | (285) | | — | — | — |
| Movements in available-for-sale securities | | | | | | | |
| - unrealised (losses)/gains | (56) | 299 | (1,288) | | — | — | — |
| - realised losses/(gains) | 37 | (466) | (152) | | — | — | — |
| - tax | 5 | (36) | (7) | | — | — | — |
- recycled to profit or loss on disposal of discontinued operations, net of £2 million tax | (7) | — | — | | — | — | — |
| Movements in cash flow hedging reserve | | | | | | | |
| - amount recognised in equity | (120) | (209) | (1,015) | | — | — | — |
| - amount transferred from equity to earnings | — | — | (36) | | — | — | — |
| - tax | 39 | 59 | 220 | | — | — | — |
- recycled to profit or loss on disposal of discontinued operations, net of £340 million tax | 1,036 | — | — | | — | — | — |
Actuarial gains/(losses) recognised in retirement benefit schemes | | | | | | | |
| - gross | — | 91 | (480) | | — | — | — |
| - tax | — | 1 | 2 | | — | — | — |
| Equity raised | 559 | 9 | 1,071 | | — | — | — |
| Equity withdrawn and disposals | (11,298) | (2,445) | (13,579) | | — | — | — |
| Transfer to retained earnings | (40) | (629) | — | | — | — | — |
| At 31 December | 1,719 | 16,895 | 21,619 | | — | — | — |
| | | | | | | | |
| Total equity at 31 December | 76,851 | 94,631 | 80,498 | | 59,224 | 65,582 | 44,158 |
| | | | | | | | |
Total comprehensive loss recognised in the statement of changes in equity is attributable as follows: | | | | | | | |
| Non-controlling interests | (197) | (1,346) | (4,332) | | — | — | — |
| Preference shareholders | 105 | 878 | 536 | | 105 | 878 | 536 |
| Paid-in equity holders | 19 | 57 | 60 | | 19 | 57 | 60 |
| Ordinary and B shareholders | (598) | (5,747) | (23,744) | | (4,677) | (2,435) | (10,197) |
| | (671) | (6,158) | (27,480) | | (4,553) | (1,500) | (9,601) |
The accompanying notes on pages 173228 to 252,331, the accounting policies on pages 162216 to 172227 and the audited sections of ‘Thethe Business Review:review: Risk Capital and Liquidity Management’balance sheet management on pages 5759 to 123164 form an integral part of these financial statements.
| Cash flow statements | Financial statements |
| for the year ended 31 December 2010 |
| | | Group | | Company |
| | Note | 2010 £m | 2009 £m | 2008 £m | | 2010 £m | 2009 £m | 2008 £m |
| Operating activities | | | | | | | | |
| Operating loss before tax | | (399) | (2,647) | (25,691) | | (4,471) | (1,286) | (10,017) |
| Operating loss before tax on discontinued operations | | (541) | (49) | (10,937) | | — | — | — |
| Adjustments for: | | | | | | | | |
| Depreciation and amortisation | | 2,220 | 2,809 | 3,154 | | — | — | — |
| Write-down of goodwill and other intangible assets | | 10 | 363 | 32,581 | | — | — | — |
| Write-down of investment in subsidiaries | | — | — | — | | 5,124 | 5,139 | 14,321 |
| Interest on subordinated liabilities | | 500 | 1,490 | 2,144 | | 462 | 537 | 499 |
| Charge for defined benefit pension schemes | | 540 | 659 | 490 | | — | — | — |
| Pension scheme curtailment gains | | (78) | (2,148) | — | | — | — | — |
| Cash contribution to defined benefit pension schemes | | (832) | (1,153) | (810) | | — | — | — |
| Gain on redemption of own debt | | (553) | (3,790) | — | | (53) | (238) | — |
| Elimination of non-cash items on discontinued activities | | — | — | 592 | | — | — | — |
| Elimination of foreign exchange differences | | (691) | 12,217 | (41,874) | | 272 | (753) | 1,778 |
| Other non-cash items | | 1,455 | 7,940 | 8,772 | | (1) | 20 | (478) |
| Net cash flows from trading activities | | 1,631 | 15,691 | (31,579) | | 1,333 | 3,419 | 6,103 |
| Changes in operating assets and liabilities | | 17,095 | (15,964) | (42,219) | | (10,238) | 12,537 | (22,254) |
| Net cash flows from operating activities before tax | | 18,726 | (273) | (73,798) | | (8,905) | 15,956 | (16,151) |
| Income taxes received/(paid) | | 565 | (719) | (1,540) | | (133) | 409 | 119 |
| Net cash flows from operating activities | 35 | 19,291 | (992) | (75,338) | | (9,038) | 16,365 | (16,032) |
| | | | | | | | | |
| Investing activities | | | | | | | | |
| Sale and maturity of securities | | 47,604 | 76,492 | 53,390 | | — | — | — |
| Purchase of securities | | (43,485) | (73,593) | (55,229) | | — | — | — |
| Investment in subsidiaries | | — | — | — | | (1,884) | (23,902) | (10,349) |
| Disposal of subsidiaries | | — | — | — | | 6 | 7,908 | 700 |
| Sale of property, plant and equipment | | 2,011 | 1,948 | 2,228 | | — | — | — |
| Purchase of property, plant and equipment | | (2,113) | (4,898) | (5,757) | | — | — | — |
| Proceeds on disposal of discontinued activities | | — | — | 20,113 | | — | — | — |
| Net investment in business interests and intangible assets | 36 | 3,446 | 105 | 2,252 | | — | — | — |
| Repayments from subsidiaries | | — | — | — | | — | 274 | — |
| Transfer out of discontinued operations | | (4,112) | — | — | | — | — | — |
| Net cash flows from investing activities | | 3,351 | 54 | 16,997 | | (1,878) | (15,720) | (9,649) |
| | | | | | | | | |
| Financing activities | | | | | | | | |
| Issue of ordinary shares | | 1 | — | 49 | | 1 | — | 49 |
| Placing and open offers | | — | 5,274 | 19,741 | | — | 5,274 | 19,741 |
| Rights issue | | — | — | 12,000 | | — | — | 12,000 |
| Issue of B shares | | — | 25,101 | — | | — | 12,801 | — |
| Issue of subordinated liabilities | | — | 2,309 | 2,413 | | — | — | — |
| Proceeds of non-controlling interests issued | | 559 | 9 | 1,427 | | — | — | — |
| Redemption of paid-in equity | | (132) | (308) | — | | (132) | (308) | — |
| Redemption of preference shares | | (2,359) | (5,000) | — | | (2,352) | (5,000) | — |
| Redemption of non-controlling interests | | (5,282) | (422) | (13,579) | | — | — | — |
| Shares purchased by employee trusts | | (700) | (33) | (64) | | — | — | — |
| Shares issued under employee share schemes | | — | — | 2 | | — | — | — |
| Repayment of subordinated liabilities | | (1,588) | (5,145) | (1,727) | | (98) | (458) | — |
| Dividends paid | | (4,240) | (1,248) | (3,193) | | (124) | (935) | (2,908) |
| Interest on subordinated liabilities | | (639) | (1,746) | (1,967) | | (475) | (557) | (466) |
| Net cash flows from financing activities | | (14,380) | 18,791 | 15,102 | | (3,180) | 10,817 | 28,416 |
| Effects of exchange rate changes on cash and cash equivalents | | 82 | (8,592) | 29,209 | | 5 | (83) | 761 |
| | | | | | | | | |
| Net increase/(decrease) in cash and cash equivalents | | 8,344 | 9,261 | (14,030) | | (14,091) | 11,379 | 3,496 |
| Cash and cash equivalents at 1 January | | 144,186 | 134,925 | 148,955 | | 16,448 | 5,069 | 1,573 |
| Cash and cash equivalents at 31 December | 39 | 152,530 | 144,186 | 134,925 | | 2,357 | 16,448 | 5,069 |
| | | | | | Group | | | Company | |
| | | | | | 2008 | | | 2007 | | | 2006 | | | 2008 | | | 2007 | | | 2006 | |
| | | Note | | | | £m | | | | £m | | | | £m | | | | £m | | | | £m | | | | £m | |
| Operating activities | | | | | | | | | | | | | | | | | | | | | | | | | | | |
| Operating (loss)/profit before tax | | | | | | (40,667 | ) | | | 9,832 | | | | 9,186 | | | | (10,017 | ) | | | 2,372 | | | | 3,486 | |
| Operating profit before tax on discontinued activities | | | | 4,208 | | | | 68 | | | | — | | | | — | | | | — | | | | — | |
| | | | | | | | | | | | | | | | | | | | | | | | | | | | |
| Adjustments for: | | | | | | | | | | | | | | | | | | | | | | | | | | | |
| Depreciation and amortisation | | | | | | 3,154 | | | | 1,932 | | | | 1,678 | | | | — | | | | — | | | | — | |
| Write-down of goodwill and other intangible assets | | | | 32,581 | | | | — | | | | — | | | | — | | | | — | | | | — | |
| Write-down of investment in subsidiaries | | | | | | | | | | | | | | | | | | 14,321 | | | | — | | | | — | |
| Interest on subordinated liabilities | | | | | | 2,144 | | | | 1,518 | | | | 1,386 | | | | 499 | | | | 470 | | | | 520 | |
| Charge for defined benefit pension schemes | | | | | | 490 | | | | 489 | | | | 580 | | | | — | | | | — | | | | — | |
| Cash contribution to defined benefit pension schemes | | | | (810 | ) | | | (599 | ) | | | (536 | ) | | | — | | | | — | | | | — | |
| Elimination of non-cash items on discontinued activities | | | | 592 | | | | 62 | | | | — | | | | — | | | | — | | | | — | |
| Elimination of foreign exchange differences | | | | | | (41,874 | ) | | | (10,282 | ) | | | 4,516 | | | | 1,778 | | | | (58 | ) | | | (22 | ) |
| Other non-cash items | | | | | | 8,603 | | | | (3,235 | ) | | | (1,120 | ) | | | (478 | ) | | | 1 | | | | 18 | |
| Net cash (outflow)/inflow from trading activities | | | | (31,579 | ) | | | (215 | ) | | | 15,690 | | | | 6,103 | | | | 2,785 | | | | 4,002 | |
| Changes in operating assets and liabilities | | | | | | (42,219 | ) | | | 28,261 | | | | 3,980 | | | | (22,254 | ) | | | 15,562 | | | | (508 | ) |
| Net cash flows from operating activities before tax | | | | (73,798 | ) | | | 28,046 | | | | 19,670 | | | | (16,151 | ) | | | 18,347 | | | | 3,494 | |
| Income taxes (paid)/received | | | | | | (1,540 | ) | | | (2,442 | ) | | | (2,229 | ) | | | 119 | | | | 6 | | | | 154 | |
| Net cash flows from operating activities | | | 33 | | | | (75,338 | ) | | | 25,604 | | | | 17,441 | | | | (16,032 | ) | | | 18,353 | | | | 3,648 | |
| | | | | | | | | | | | | | | | | | | | | | | | | | | | | |
| Investing activities | | | | | | | | | | | | | | | | | | | | | | | | | | | | |
| Sale and maturity of securities | | | | | | | 53,390 | | | | 63,007 | | | | 27,126 | | | | — | | | | — | | | | — | |
| Purchase of securities | | | | | | | (55,229 | ) | | | (61,020 | ) | | | (19,126 | ) | | | — | | | | — | | | | — | |
| Investment in subsidiaries | | | | | | | — | | | | — | | | | — | | | | (10,349 | ) | | | (18,510 | ) | | | (1,097 | ) |
| Disposal of subsidiaries | | | | | | | — | | | | — | | | | — | | | | 700 | | | | 6 | | | | — | |
| Sale of property, plant and equipment | | | | | | | 2,228 | | | | 5,786 | | | | 2,990 | | | | — | | | | — | | | | — | |
| Purchase of property, plant and equipment | | | | | | | (5,757 | ) | | | (5,080 | ) | | | (4,282 | ) | | | — | | | | — | | | | — | |
| Proceeds on disposal of discontinued activities | | | | | 20,113 | | | | (334 | ) | | | — | | | | — | | | | — | | | | — | |
| Net investment in business interests and intangible assets | 34 | | | | 2,252 | | | | 13,640 | | | | (63 | ) | | | — | | | | — | | | | — | |
| Loans to subsidiaries | | | | | | | — | | | | — | | | | — | | | | — | | | | — | | | | — | |
| Repayments from subsidiaries | | | | | | | — | | | | — | | | | — | | | | — | | | | 469 | | | | 547 | |
| Net cash flows from investing activities | | | | | | | 16,997 | | | | 15,999 | | | | 6,645 | | | | (9,649 | ) | | | (18,035 | ) | | | (550 | ) |
| | | | | | | | | | | | | | | | | | | | | | | | | | | | | |
| Financing activities | | | | | | | | | | | | | | | | | | | | | | | | | | | | |
| Issue of ordinary shares | | | | | | | 49 | | | | 77 | | | | 104 | | | | 49 | | | | 77 | | | | 104 | |
| Placing and open offer | | | | | | | 19,741 | | | | — | | | | — | | | | 19,741 | | | | — | | | | — | |
| Rights issue | | | | | | | 12,000 | | | | — | | | | — | | | | 12,000 | | | | — | | | | — | |
| Issue of other equity interests | | | | | | | — | | | | 3,600 | | | | 671 | | | | | | | | 3,600 | | | | 671 | |
| Issue of paid up equity | | | | | | | — | | | | 1,073 | | | | — | | | | — | | | | 1,073 | | | | — | |
| Issue of subordinated liabilities | | | | | | | 2,413 | | | | 1,018 | | | | 3,027 | | | | — | | | | — | | | | 399 | |
| Proceeds of minority interests issued | | | | | | | 1,427 | | | | 31,095 | | | | 1,354 | | | | — | | | | — | | | | — | |
| Redemption of minority interests | | | | | | | (13,579 | ) | | | (545 | ) | | | (81 | ) | | | — | | | | — | | | | — | |
| Repurchase of ordinary shares | | | | | | | — | | | | — | | | | (991 | ) | | | — | | | | — | | | | (991 | ) |
| Shares purchased by employee trusts | | | | | | | (64 | ) | | | (65 | ) | | | (254 | ) | | | — | | | | — | | | | — | |
| Shares issued under employee share schemes | | | | | 2 | | | | 79 | | | | 108 | | | | — | | | | — | | | | 7 | |
| Repayment of subordinated liabilities | | | | | | | (1,727 | ) | | | (1,708 | ) | | | (1,318 | ) | | | — | | | | (469 | ) | | | (547 | ) |
| Dividends paid | | | | | | | (3,193 | ) | | | (3,411 | ) | | | (2,727 | ) | | | (2,908 | ) | | | (3,290 | ) | | | (2,661 | ) |
| Interest on subordinated liabilities | | | | | | | (1,967 | ) | | | (1,522 | ) | | | (1,409 | ) | | | (466 | ) | | | (455 | ) | | | (497 | ) |
| Net cash flows from financing activities | | | | | | | 15,102 | | | | 29,691 | | | | (1,516 | ) | | | 28,416 | | | | 536 | | | | (3,515 | ) |
| Effects of exchange rate changes on cash and cash equivalents | | | | | | | 29,209 | | | | 6,010 | | | | (3,468 | ) | | | 761 | | | | 62 | | | | (52 | ) |
| | | | | | | | | | | | | | | | | | | | | | | | | | | | | |
| Net (decrease)/increase in cash and cash equivalents | | | | | (14,030 | ) | | | 77,304 | | | | 19,102 | | | | 3,496 | | | | 916 | | | | (469 | ) |
| Cash and cash equivalents 1 January | | | | | | | 148,955 | | | | 71,651 | | | | 52,549 | | | | 1,573 | | | | 657 | | | | 1,126 | |
| Cash and cash equivalents 31 December | | | | | | | 134,925 | | | | 148,955 | | | | 71,651 | | | | 5,069 | | | | 1,573 | | | | 657 | |
The accompanying notes on pages 173228 to 252,331, the accounting policies on pages 162216 to 172227 and the audited sections of ‘Thethe Business Review:review: Risk Capital and Liquidity Management’balance sheet management on pages 57 to 12359 to 164 form an integral part of these financial statements.
| Accounting policies | Financial statements |
|
1. Presentation of accounts
The accounts are prepared on a going concern basis (see page 172 of the Report of the directors) and in accordance with International Financial Reporting Standards issued by the International Accounting Standards Board (IASB) and interpretations issued by the International Financial Reporting Interpretations Committee (IFRIC) of the IASB (together IFRS) as adopted by the European Union (EU) (together IFRS). The EU has not adopted the complete text of IAS 39 ‘Financial Instruments: Recognition and Measurement’; it has relaxed some of the standard’sstandard's hedging requirements. The Group has not taken advantage of this relaxation and has adopted IAS 39 as issued by the IASB: the Group’sGroup's financial statements are prepared in accordance with IFRS as issued by the IASB. The date of transition to IFRS for the Group and the company (The Royal Bank of Scotland Group plc) and the date of their opening IFRS balance sheets was 1 January 2004.
The Group has adopted the revised IFRS 8 ‘Operating Segments’3 ‘Business Combinations’ and related revisions to IAS 27 ‘Consolidated and Separate Financial Statements’ issued in January 2008 and also IFRIC 17 ‘Distributions of Non-cash Assets to Owners’ and the IASB’s consequential amendments to IFRS 5 ‘Non-Current Assets Held for Sale and Discontinued Operations’ issued in December 2008. They apply to transactions on or after 1 January 2010 and have not resulted in the restatement of previously published financial information. There have been no material acquisitions in the year. In accordance with effectIFRS 5, before and after the amendment, the Dutch retail and other banking businesses that were transferred to the Dutch State on 1 April 2010 have been recognised as discontinued operations with consequent changes to the presentation of comparative financial information.
There are a number of other changes to IFRS that were effective from 1 January 2008. Early adoption of IFRS 8 has not materially affected segmental disclosures.
In October 2008,2010. They have had no material effect on the IASB issuedGroup’s financial statements: in April 2009, ‘Improvements to IFRS’ - making non-urgent but necessary amendments to standards, primarily to remove inconsistencies and the European Union endorsed,to clarify wording; and amendments to IAS 39 ‘Financial Instruments: Recognition and Measurement’ - limited changes to permit the reclassification of financial assets out of the held-for-trading (HFT) and available-for-sale (AFS) categories subject to certain restrictions. Transfers mustIAS 39 issued in July 2008 clarified that (a) a one-sided risk can be made at fair value and this fair value becomes the instruments’ new cost or amortised cost. The amendments are effective from 1 July 2008. Reclassifications made before 1 November 2008 were backdated to 1 July 2008; subsequent reclassifications were effective from the date the reclassification was made.
The Group has reclassified certain loans and debt securities out of the held-for-trading and available-for-sale categories into the loans and receivables category. It has also reclassified certain debt securities out of the held-for-trading category into the available-for-sale category. The balance sheet values of these assets, the effect of the reclassification on the income statement and the impairment losses relating to these assets are shown in Note 11 Financial instruments on page 193.
The 2007 comparative amounts have been restated for the netting of certain derivative asset and derivative liability balances with the London Clearing House as described in Note 13; the finalisation of the ABN AMRO acquisition accounting as set out in Note 34; and for the classification of Banco Realdesignated as a discontinued operation as described in Note 20.hedged risk i.e. an option can be used to hedge a risk above or below a specified threshold and (b) inflation can be a hedged risk but only if the cash flows include a specified inflation portion.
The Group is not required to include reconciliations of shareholders’ equity and net income under IFRS and US GAAP in its filings with the Securities and Exchange Commission in the US.
The company is incorporated in the UK and registered in Scotland. The accounts are prepared on the historical cost basis except that the following assets and liabilities are stated at their fair value: derivative financial instruments, held-for-trading financial assets and financial liabilities, financial assets and financial liabilities that are designated as at fair value through profit or loss, available-for-sale financial assets and investment property. Recognised financial assets and financial liabilities in fair value hedges are adjusted for changes in fair value in respect of the risk that is hedged.
The company accounts are presented in accordance with the Companies Act 1985.2006.
2. Basis of consolidation
The consolidated financial statements incorporate the financial statements of the company and entities (including certain special purpose entities) that continue to beare controlled by the Group (its subsidiaries).Group. Control exists where the Group has the power to govern the financial and operating policies of the entity; generally conferred by holding a majority of voting rights. On acquisition of a subsidiary, its identifiable assets, liabilities and contingent liabilities are included in the consolidated accounts at their fair value. Any excess of the cost (the fair value of assets given, liabilities incurred or assumed and equity instruments issued by the Group plus any directly attributable costs) of an acquisition over the fair value of the net assets acquired is recognised as goodwill. The interest of minority shareholders is stated at their share of the fair value of the subsidiary’ssub sidiary's net assets.
The results of subsidiaries acquired are included in the consolidated income statement from the date control passes up until the Group ceases to control them through a sale or significant change in circumstances. Changes in interest that do not result in a loss of control are recognised in equity.
All intra-group balances, transactions, income and expenses are eliminated on consolidation. The consolidated accounts are prepared using uniform accounting policies.
3. Revenue recognition
Interest income on financial assets that are classified as loans and receivables, available-for-sale or held-to-maturity and interest expense on financial liabilities other than those at fair value through profit or loss are determined using the effective interest method. The effective interest method is a method of calculating the amortised cost of a financial asset or financial liability (or group of financial assets or liabilities) and of allocating the interest income or interest expense over the expected life of the asset or liability. The effective interest rate is the rate that exactly discounts estimated future cash flows to the instrument’sinstrument's initial carrying amount. Calculation of the effective interest rate takes into account fees payable or receivable that are an integral part of the instrument’sinstrument's yield, premiums or discounts on acquisitionacquisitio n or issue, early redemption fees and transaction costs. All contractual terms of a financial instrument are considered when estimating future cash flows.
Financial assets and financial liabilities held-for-trading or designated as at fair value through profit or loss are recorded at fair value. Changes in fair value are recognised in profit or loss together with dividends and interest receivable and payable.
Commitment and utilisation fees are determined as a percentage of the outstanding facility. If it is unlikely that a specific lending arrangement will be entered into, such fees are taken to profit or loss over the life of the facility otherwise they are deferred and included in the effective interest rate on the advance.
Fees in respect of services are recognised as the right to consideration accrues through the provision of the service to the customer. The arrangements are generally contractual and the cost of providing the service is incurred as the service is rendered. The price is usually fixed and always determinable. The application of this policy to significant fee types is outlined below.
Accounting policies continued | Financial statements |
Payment services: - this comprises income received for payment services including cheques cashed, direct debits, Clearing House Automated Payments (the UK electronic settlement system) and CHAPsBACS payments (the automated clearing house that processes direct debits and direct credits). These are generally charged on a per transaction basis. The income is earned when the payment or transaction occurs. Charges for payment services are usually debited to the customer’scustomer's account monthly or quarterly in arrears. Accruals are raisedIncome is accrued at period end for services provided but not charged at period end.yet charged.
Card related services: - fees from credit card business include:
| · | Commission received from retailers for processing credit and debit card transactions: income is accrued to the income statement as the service is performed; |
| · | Interchange received: as issuer, the Group receives a fee (interchange) each time a cardholder purchases goods and services. The Group also receives interchange fees from other card issuers for providing cash advances through its branch and Automated Teller Machineautomated teller machine networks. These fees are accrued once the transaction has taken place; and |
| · | An annual fee payable by a credit card holder is deferred and taken to profit or loss over the period of the service i.e. 12 months. |
Insurance brokerage: - this is made up of fees and commissions received from the agency sale of insurance. Commission on the sale of an insurance contract is earned at the inception of the policy, as the insurance has been arranged and placed. However, provision is made where commission is refundable in the event of policy cancellation in line with estimated cancellations.
InvestmentInvestment management fees: - fees charged for managing investments are recognised as revenue as the services are provided. Incremental costs that are directly attributable to securing an investment management contract are deferred and charged as expense as the related revenue is recognised.
IInsurance premiums - nsurance premiums:see accountingAccounting policy 12.
4. Assets held for sale and discontinued operations
A non-current asset (or disposal group) is classified as held for sale if the Group will recover the carrying amount principally through a sale transaction rather than through continuing use. A non-current asset (or disposal group) classified as held for sale is measured at the lower of its carrying amount and fair value less costs to sell. If the asset (or disposal group) is acquired as part of a business combination it is initially measured at fair value less costs to sell. Assets and liabilities of disposal groups classified as held for sale and non-current assets classified as held for sale are shown separately on the face of the balance sheet.
The results of discontinued operations are shown as a single amount on the face of the income statement comprising the post-tax profit or loss of discontinued operations and the post-tax gain or loss recognised either on measurement to fair value less costs to sell or on the disposal of the discontinued operation. A discontinued operation is a cash-generating unit or a group of cash-generating units that either has been disposed of, or is classified as held for sale, and (a) represents a separate major line of business or geographical area of operations, (b) is part of a single co-ordinated plan to dispose of a separate major line of business or geographical area of operations or (c) is a subsidiary acquired exclusively with a view to resale.
5. Pensions and other post-retirement benefits
The Group provides post-retirement benefits in the form of pensions and healthcare plans to eligible employees.
For defined benefit schemes, scheme liabilities are measured on an actuarial basis using the projected unit credit method and discounted at a rate that reflects the current rate of return on a high quality corporate bond of equivalent term and currency to the scheme liabilities. Scheme assets are measured at their fair value. Any surplus or deficit of scheme assets over liabilities is recognised in the balance sheet as an asset (surplus) or liability (deficit). The current service cost, curtailments and any past service costs together with the expected return on scheme assets less the unwinding of the discount on the scheme liabilities is charged to operating expenses. Actuarial gains and losses are recognised in full in the period in which they occur outside profit or loss and presented in the consolidated statement of recognised income and expense. Contributionscomprehensive income. Contri butions to defined contribution pension schemes are recognised in the income statement when payable.
Accounting policies continued | Financial statements |
6. Intangible assets and goodwill
Intangible assets that are acquired by the Group are stated at cost less accumulated amortisation and impairment losses. Amortisation is charged to profit or loss over the assets’assets' estimated economic lives using methods that best reflect the pattern of economic benefits and is included in depreciation and amortisation. The estimated useful economic lives are as follows:
| Core deposit intangibles | 6 to 10 years |
| Other acquired intangibles | 5 to 10 years |
| Computer software | 3 to 5 years |
Expenditure on internally generated goodwill and brands is written-off as incurred. Direct costs relating to the development of internal-use computer software are capitalised once technical feasibility and economic viability have been established. These costs include payroll, the costs of materials and services, and directly attributable overheads. Capitalisation of costs ceases when the software is capable of operating as intended. During and after development, accumulated costs are reviewed for impairment against the projected benefits that the software is expected to generate. Costs incurred prior to the establishment of technical feasibility and economic viability are expensed as incurred as are all training costs and general overheads. The costs of licences to use computer software that are expected to generate economic benefits beyond one year are also capitalised.
Acquired goodwill, being the excess of the cost of an acquisition over the Group’sGroup's interest in the net fair value of the identifiable assets, liabilities and contingent liabilities of the subsidiary, associate or joint venture acquired, is initially recognised at cost and subsequently at cost less any accumulated impairment losses. Goodwill arising on the acquisition of subsidiaries and joint ventures is included in the balance sheet category ‘Intangible assets’ and that on associates within their carrying amounts. The gain or loss on the disposal of a subsidiary, associate or joint venture includes the carrying value of any related goodwill.
On implementation of IFRS, the Group did not restate business combinations that occurred before January 2004. Under previous GAAP, goodwill arising on acquisitions after 1 October 1998 was capitalised and amortised over its estimated useful economic life. Goodwill arising on acquisitions before 1 October 1998 was deducted from equity. The carrying amount of goodwill in the Group’s opening IFRS balance sheet (1 January 2004) was £ 13,131 million, its carrying value under previous GAAP.
7. Property, plant and equipment
Items of property, plant and equipment (except investment property - see Accounting policy 9) are stated at cost less accumulated depreciation and impairment losses. Where an item of property, plant and equipment comprises major components having different useful lives, they are accounted for separately. Property that is being constructed or developed for future use as investment property is classified as property, plant and equipment and stated at cost until construction or development is complete, at which time it is reclassified as investment property.
Depreciation is charged to profit or loss on a straight-line basis so as to write-off the depreciable amount of property, plant and equipment (including assets owned and let on operating leases (except investment property – see accounting policy 9))leases) over their estimated useful lives.
The depreciable amount is the cost of an asset less its residual value. Land is not depreciated. Estimated useful lives are as follows:
| Freehold and long leasehold buildings | 50 years |
| Short leaseholds | unexpired period of the lease |
| Property adaptation costs | 10 to 15 years |
| Computer equipment | up to 5 years |
| Other equipment | 4 to 15 years |
Under previous GAAP, the Group’s freehold and long leasehold property occupied for its own use was recorded at valuation on the basis of existing use value. The Group elected to use this valuation as at 31 December 2003 (£ 2,391 million) as deemed cost for its opening IFRS balance sheet (1 January 2004).
8. Impairment of intangible assets and property, plant and equipment
At each reporting date, the Group assesses whether there is any indication that its intangible assets, or property, plant and equipment are impaired. If any such indication exists, the Group estimates the recoverable amount of the asset and the impairment loss if any. Goodwill is tested for impairment annually or more frequently if events or changes in circumstances indicate that it might be impaired. If an asset does not generate cash flows that are independent from those of other assets or groups of assets, the recoverable amount is determined for the cash-generating unit to which the asset belongs. The recoverable amount of an asset is the higher of its fair value less cost to sell and its value in use. Value in use is the present value of future cash flows from the asset or cash-generating unit discounted at a rate that reflects market interest rates adjusted for risks specific to the asset or cash-generating unit that have not been reflected in the estimation of future cash flows. If the recoverable amount of an intangible or tangible asset is less than its carrying value, an impairment loss is recognised immediately in profit or loss and the carrying value of the asset reduced by the amount of the loss. A reversal of an impairment loss on intangible assets (excluding goodwill) or property, plant and equipment is recognised as it arises provided the increased carrying value does not exceed that which it would have been had no impairment loss been recognised. Impairment losses on goodwill are not reversed.
9. Investment property
Investment property comprises freehold and leasehold properties that are held to earn rentals or for capital appreciation or both. It is not depreciated but is stated at fair value based on valuations by independent registered valuers. Fair value is based on current prices for similar properties in the same location and condition. Any gain or loss arising from a change in fair value is recognised in profit or loss. Rental income from investment property is recognised on a straight-line basis over the term of the lease. Lease incentives granted are recognised as an integral part of the total rental income.
Accounting policies continued | Financial statements |
10. Foreign currencies
The Group’sGroup's consolidated financial statements are presented in sterling which is the functional currency of the company.
Transactions in foreign currencies are translated into sterling at the foreign exchange rate ruling at the date of the transaction. Monetary assets and liabilities denominated in foreign currencies are translated into sterling at the rates of exchange ruling at the balance sheet date.
Foreign exchange differences arising on translation are reported in income from trading activities except for differences arising on cash flow hedges and hedges of net investments in foreign operations. Non-monetary items denominated in foreign currencies that are stated at fair value are translated into sterling at foreign exchange rates ruling at the dates the values were determined. Translation differences arising on non-monetary items measured at fair value are recognised in profit or loss except for differences arising on available-for-sale non-monetary financial assets, for example equity shares, which are included in the available-for-sale reserve in equity unless the asset is the hedged item in a fair value hedge.
The assets and liabilities of foreign operations, including goodwill and fair value adjustments arising on acquisition, are translated into sterling at foreign exchange rates ruling at the balance sheet date. The revenues and expenses of foreign operations are translated into sterling at average exchange rates unless these do not approximate to the foreign exchange rates ruling at the dates of the transactions. Foreign exchange differences arising on the translation of a foreign operation are recognised directly in equity and included in profit or loss on its disposal.
11. Leases
Contracts to lease assets are classified as finance leases if they transfer substantially all the risks and rewards of ownership of the asset to the customer. Other contracts to lease assets are classified as operating leases.
Finance lease receivables are stated in the balance sheet at the amount of the net investment in the lease being the minimum lease payments and any unguaranteed residual value discounted at the interest rate implicit in the lease. Finance lease income is allocated to accounting periods so as to give a constant periodic rate of return before tax on the net investment. Unguaranteed residual values are subject to regular review to identify potential impairment. If there has been a reduction in the estimated unguaranteed residual value, the income allocation is revised and any reduction in respect of amounts accrued is recognised immediately.
Rental income from operating leases is credited to the income statement on a receivable basis over the term of the lease. Operating lease assets are included within Property, plant and equipment and depreciated over their useful lives (see accountingAccounting policy 7).
12. Insurance
General insurance
General insurance comprises short-duration contracts, principally property and liability insurance contracts. Due to the nature of the products sold – retail-based- predominantly property, and casualty, motor home and personal health insurance contracts –- the insurance protection is provided on an even basis throughout the term of the policy.
Premiums from general insurance contracts Consequently, written premiums are recognised inon a straight-line basis over the accounting period in which they begin.of the policy. Insurance premiums exclude insurance premium tax. Unearned premiums represent the proportion of the net premiums that relate to periods of insurance after the balance sheet date and are calculated over the period of exposure under the policy, on a daily basis, 24th’s24th's basis or allowing for the estimated incidence of exposure under policies which are longer than twelve months. Provision is made where necessary for the estimated amount of claims over and above unearned premiums including that in respect of future written businessbus iness on discontinued lines under the run-off of delegated underwriting authority arrangements. The provision is designed to meet future claims and related expenses and is calculated across related classes of business on the basis of a separate carry forward of deferred acquisition expenses after making allowance for investment income.
Acquisition expenses relating to new and renewed business for all classes are expensed over the period during which the premiums are earned. The principal acquisition costs so deferred are commissions payable, and costs associated with the telesales and underwriting staff and prepaid claims handling costs in respect of delegated claims handling arrangements for claims which are expected to occur after the balance sheet date.staff. Claims and the related reinsurance are recognised in the accounting period in which the loss occurs. Provision is made for the full cost of settling outstanding claims at the balance sheet date, including claims estimated to have been incurred but not yet reported at that date, and claims handling expenses. The relatedProvisions are only discounted where claims, principally motor, either have been or are expected to be settled by periodical payments. Related reinsurance receivable isreceivables are recognised on the same basis and at the same time.
Life assurance
The Group’sGroup's long-term assurance contracts include whole-life term assurance, endowment assurance, flexible whole-life, pension and annuity contracts that are expected to remain in force for an extended period of time. Long-term assurance contracts under which the Group does not accept significant insurance risk are classified as financial instruments.
The Group recognises the value of in-force long-term assurance contracts as an asset. Cash flows associated with in-force contracts and related assets, including reinsurance cash flows, are projected, using appropriate assumptions as to future mortality, persistency and levels of expenses and excluding the value of future investment margins, to estimate future surpluses attributable to the Group. These surpluses, discounted at a risk-adjusted rate, are recognised as a separate asset. Changes in the value of this asset are included in profit or loss.
Premiums on long-term insurance contracts are recognised as income when receivable. Claims on long-term insurance contracts reflect the cost of all claims arising during the year, including claims handling costs. Claims are recognised when the Group becomes aware of the claim.
Reinsurance
The Group has reinsurance treaties that transfer significant insurance risk. Liabilities for reinsured contracts are calculated gross of reinsurance and a separate reinsurance asset recorded.
Accounting policies continued | Financial statements |
13. Provisions
The Group recognises a provision for a present obligation resulting from a past event when it is more likely than not that it will be required to transfer economic benefits to settle the obligation and the amount of the obligation can be estimated reliably.
Provision is made for restructuring costs, including the costs of redundancy, when the Group has a constructive obligation to restructure. An obligation exists when the Group has a detailed formal plan for the restructuring and has raised a valid expectation in those affected by starting to implement the plan or announcing its main features.
If the Group has a contract that is onerous, it recognises the present obligation under the contract as a provision. An onerous contract is one where the unavoidable costs of meeting the obligations under it exceed the expected economic benefits. When the Group vacates a leasehold property, a provision is recognised for the costs under the lease less any expected economic benefits (such as rental income).
Contingent liabilities are possible obligations arising from past events whose existence will be confirmed only by uncertain future events or present obligations arising from past events that are not recognised because either an outflow of economic benefits is not probable or the amount of the obligation cannot be reliably measured. Contingent liabilities are not recognised but information about them is disclosed unless the possibility of any outflow of economic benefits in settlement is remote.
14. TaxationTax
Provision is made for taxationtax at current enacted rates on taxable profits, arising in income or in equity, taking into account relief for overseas taxationtax where appropriate. Deferred taxationtax is accounted for in full for all temporary differences between the carrying amount of an asset or liability for accounting purposes and its carrying amount for tax purposes, except in relation to overseas earnings where remittance is controlled by the Group, and goodwill.
Deferred tax assets are only recognised to the extent that it is probable that they will be recovered.
15. Financial assets
On initial recognition, financial assets are classified into held-to-maturity investments; available-for-sale financial assets; held-for-trading; designated as at fair value through profit or loss; or loans and receivables.
Held-to-maturity investments - – a financial asset may be classified as a held-to-maturity investment only if it has fixed or determinable payments, a fixed maturity and the Group has the positive intention and ability to hold to maturity. Held-to-maturity investments are initially recognised at fair value plus directly related transaction costs. They are subsequently measured at amortised cost using the effective interest method (see accountingAccounting policy 3) less any impairment losses.losses.
Held-for-trading - – a financial asset is classified as held-for-trading if it is acquired principally for sale in the near term, or forms part of a portfolio of financial instruments that are managed together and for which there is evidence of short-term profit taking, or it is a derivative (not in a qualifying hedge relationship). Held-for-trading financial assets are recognised at fair value with transaction costs being recognised in profit or loss. Subsequently they are measured at fair value. Gains and losses on held-for-trading financial assets are recognised in profit or loss as they arise.
Designated as at fair value through profit or loss - – financial assets may be designated as at fair value through profit or loss only if such designation (a) eliminates or significantly reduces a measurement or recognition inconsistency; or (b) applies to a group of financial assets, financial liabilities or both, that the Group manages and evaluates on a fair value basis; or (c) relates to an instrument that contains an embedded derivative which is not evidently closely related to the host contract.
Financial assets that the Group designates on initial recognition as being at fair value through profit or loss are recognised at fair value, with transaction costs being recognised in profit or loss, and are subsequently measured at fair value. Gains and losses on financial assets that are designated as at fair value through profit or loss are recognised in profit or loss as they arise.
The principal category ofIn 2009 and 2008, financial assets designated as at fair value through profit or loss is policyholders’included policyholders' assets underpinning insurance and investment contracts issued by the Group's life assurance businesses. Fair value designation significantly reduces the measurement inconsistency that would arise if these assets were classified as available-for-sale.
Loans and receivables –- non-derivative financial assets with fixed or determinable repayments that are not quoted in an active market are classified as loans and receivables, except those that are classified as available-for-sale or as held-for-trading, or designated as at fair value through profit or loss. Loans and receivables are initially recognised at fair value plus directly related transaction costs. They are subsequently measured at amortised cost using the effective interest method (see accountingAccounting policy 3) less any impairment losses.
Accounting policies continued | Financial statements |
Available-for-sale - –financialfinancial assets that are not classified as held-to-maturity; held-for-trading; designated as at fair value through profit or loss; or loans and receivables, are classified as available-for-sale. Financial assets can be designated as available-for-sale on initial recognition. Available-for-sale financial assets are initially recognised at fair value plus directly related transaction costs. They are subsequently measured at fair value. Unquoted equity investments whose fair value cannot be measured reliably are carried at cost and classified as available-for-sale financial assets. Impairment losses and exchange differences resulting from retranslating the amortised cost of foreign currency monetary available-for-sale financial assets are recognised in profitprofi t or loss together with interest calculated using the effective interest method (see accountingAccounting policy 3). Other changes in the fair value of available-for-sale financial assets and any related tax are reported in a separate component of shareholders’shareholders' equity until disposal, when the cumulative gain or loss is recognised in profit or loss.
Reclassifications - – held-for-trading and available-for-sale financial assets that meet the definition of loans and receivables (non-derivative financial assets with fixed or determinable payments that are not quoted in an active market) may be reclassified to loans and receivables if the Group has the intention and ability to hold the financial asset for the foreseeable future or until maturity. The Group typically regards the foreseeable future as twelve months from the date of reclassification. Additionally, held-for-trading financial assets that do not meet the definition of loans and receivables may, in rare circumstances, be transferred to available-for-sale financial assets or to held-to-maturity investments. Reclassifications are made at fair value. This fair value beco mes the asset's new cost or amortised cost as appropriate. Gains and losses recognised up to the date of reclassification are not reversed.
Regular way purchases of financial assets classified as loans and receivables are recognised on settlement date; issues of equity or financial liabilities measured at amortised cost are recognised on settlement date; all other regular way purchasestransactions in financial instruments are recognised on trade date.
Fair value for a net open position in a financial asset that is quoted in an active market is the current bid price times the number of units of the instrument held. Fair values for financial assets not quoted in an active market are determined using appropriate valuation techniques including discounting future cash flows, option pricing models and other methods that are consistent with accepted economic methodologies for pricing financial assets.
16. Impairment of financial assets
The Group assesses at each balance sheet date whether there is any objective evidence that a financial asset or group of financial assets classified as held-to-maturity, available-for-sale or loans and receivables is impaired. A financial asset or portfolio of financial assets is impaired and an impairment loss incurred if there is objective evidence that an event or events since initial recognition of the asset have adversely affected the amount or timing of future cash flows from the asset.
Financial assets carried at amortised cost -– if there is objective evidence that an impairment loss on a financial asset or group of financial assets classified as loans and receivables or as held-to- maturityheld-to-maturity investments has been incurred, the Group measures the amount of the loss as the difference between the carrying amount of the asset or group of assets and the present value of estimated future cash flows from the asset or group of assets discounted at the effective interest rate of the instrument at initial recognition. For collateralised loans and receivables, estimated future cash flows include cash flows that may result from foreclosure less the costs of obtaining and selling the collateral, whether or not foreclosure is probable.
Where, in the course of the orderly realisation of a loan, it is exchanged for equity shares or properties, the exchange is accounted for as the sale of the loan and the acquisition of equity securities or investment properties. Where the Group’s interest in equity shares following the exchange is such that the Group controlling an entity, that entity is consolidated.
Impairment losses are assessed individually for financial assets that are individually significant and individually or collectively for assets that are not individually significant. In making collective assessment of impairment, financial assets are grouped into portfolios on the basis of similar risk characteristics. Future cash flows from these portfolios are estimated on the basis of the contractual cash flows and historical loss experience for assets with similar credit risk characteristics. Historical loss experience is adjusted, on the basis of current observable data, to reflect the effects of current conditions not affecting the period of historical experience.
Impairment losses are recognised in profit or loss and the carrying amount of the financial asset or group of financial assets reduced by establishing an allowance for impairment losses. If, in a subsequent period, the amount of the impairment loss reduces and the reduction can be ascribed to an event after the impairment was recognised, the previously recognised loss is reversed by adjusting the allowance. Once an impairment loss has been recognised on a financial asset or group of financial assets, interest income is recognised on the carrying amount using the rate of interest at which estimated future cash flows were discounted in measuring impairment.
Impaired loans and receivables are written off, i.e. the impairment provision is applied in writing down the loan's carrying value partially or in full, when the Group concludes that there is no longer any realistic prospect of recovery of part or all of the loan. For portfolios that are collectively assessed for impairment, the timing of write off principally reflects historic recovery experience for each portfolio. For loans that are individually assessed for impairment, the timing of write off is determined on a case-by-case basis. Such loans are reviewed regularly and write offs will be prompted by bankruptcy, insolvency, restructuring and similar events. Most debt is written off within five years of the recognition of the initial impairment. It is not the Group’s usual practice to write-off all or part of the asset at the time an impairm ent loss is recognised; it may however, take place in rare circumstances. Amounts recovered after a loan has been written off are credited to the loan impairment charge for the period in which they are received.
Accounting policies continued | Financial statements |
Financial assets carried at fair value - – when a decline in the fair value of a financial asset classified as available-for-sale has been recognised directly in equity and there is objective evidence that the asset is impaired, the cumulative loss is removed from equity and recognised in profit or loss. The loss is measured as the difference between the amortised cost of the financial asset and its current fair value. Impairment losses on available-for-sale equity instruments are not reversed through profit or loss, but those on available-for-sale debt instruments are reversed, if there is an increase in fair value that is objectively related to a subsequent event.
17. Financial liabilities
On initial recognition financial liabilities are classified into held-for-trading; designated as at fair value through profit or loss; or amortised cost.
AHeld-for-trading - a financial liability is classified as held-for-trading if it is incurred principally for repurchase in the near term, or forms part of a portfolio of financial instruments that are managed together and for which there is evidence of short-term profit taking, or it is a derivative (not in a qualifying hedge relationship). Held-for-trading financial liabilities are recognised at fair value with transaction costs being recognised in profitp rofit or loss. Subsequently they are measured at fair value. Gains and losses are recognised in profit or loss as they arise.
Financial liabilities that the Group designates on initial recognition as being at fair value through profit or loss are recognised at fair value, with transaction costs being recognised in profit or loss, and are subsequently measured at fair value. Gains and losses on financial liabilities that are designatedDesignated as at fair value through profit or loss are recognised in profit or loss as they arise.
Financial- financial liabilities may be designated as at fair value through profit or loss only if such designation (a) eliminates or significantly reduces a measurement or recognition inconsistency; or (b) applies to a group of financial assets, financial liabilities or both that the Group manages and evaluates on a fair value basis; or (c) relates to an instrument that contains an embedded derivative which is not evidently closely related to the host contract.
The principal categories ofFinancial liabilities that the Group designates on initial recognition as being at fair value through profit or loss are recognised at fair value, with transaction costs being recognised in profit or loss, and are subsequently measured at fair value. Gains and losses on financial liabilities that are designated as at fair value through profit or loss are recognised in profit or loss as they arise.
Financial liabilities designated as at fair value through profit or loss are (a)include structured liabilities issued by the Group: designation significantly reduces the measurement inconsistency between these liabilities and the related derivatives carried at fair value; and (b)in 2009 and 2008 investment contracts issued by the Group's life assurance businesses: fair value designation significantly reduces the measurement inconsistency that would arise if these liabilities were measured at amortised cost.
AllAmortised cost - all other financial liabilities are measured at amortised cost using the effective interest method (see accountingAccounting policy 3).
Fair value for a net open position in a financial liability that is quoted in an active market is the current offer price times the number of units of the instrument held or issued. Fair values for financial liabilities not quoted in an active market are determined using appropriate valuation techniques including discounting future cash flows, option pricing models and other methods that are consistent with accepted economic methodologies for pricing financial liabilities.
18. Financial guarantee contracts
a debt instrument if the customer fails to do so. A financial guarantee is recognised as a liability; initially at fair value and, if not designated as at fair value through profit or loss, subsequently at the higher of its initial value less cumulative amortisation and any provision under the contract measured in accordance with Accounting policy 13. Amortisation is calculated so as to recognise fees receivable in profit or loss over the period of the guarantee.
18.19. Loan commitments
Provision is made for loan commitments, other than those classified as held-for-trading, if it is probable that the facility will be drawn and the resulting loan will be recognised at a value less than the cash advanced. Syndicated loan commitments in excess of the level of lending under the commitment approved for retention by the Group are classified as held-for-trading and measured at fair value.
19.20. Derecognition
A financial asset is derecognised when it has been transferred and the transfer qualifies for derecognition. A transfer requires that the Group either:either (a) transfers the contractual rights to receive the asset’sasset's cash flows; or (b) retains the right to the asset’sasset's cash flows but assumes a contractual obligation to pay those cash flows to a third party. After a transfer, the Group assesses the extent to which it has retained the risks and rewards of ownership of the transferred asset. If substantially all the risks and rewards have been retained, the asset remains on the balance sheet. If substantially all the risks and rewards have been transferred, the asset is derecognised. If substantially all the risks and rewards have been neither retained nor transferred, the Group assesses whether or not it has retained control of the asset. If it has not retainedreta ined control, the asset is derecognised. Where the Group has retained control of the asset, it continues to recognise the asset to the extent of its continuing involvement.
A financial liability is removed from the balance sheet when the obligation is discharged, or cancelled, or expires. On the redemption or settlement of debt securities (including subordinated liabilities) issued by the Group, the Group derecognises the debt instrument and records a gain or loss being the difference between the debt's carrying amount and the cost of redemption or settlement. The same treatment applies where the debt is exchanged for a new debt issue that has terms substantially different from those of the existing debt. The assessment of whether the terms of the new debt instrument are substantially different takes into account qualitative and quantitative characteristics including a comparison of the discounted present value of the cash flows under the new terms with the discounted present value of the remaining cash flows of the original debt issue.
Accounting policies continued | Financial statements |
21. Sale and repurchase transactions
Securities subject to a sale and repurchase agreement under which substantially all the risks and rewards of ownership are retained by the Group continue to be shown on the balance sheet and the sale proceeds recorded as a deposit.financial liability. Securities acquired in a reverse sale and repurchase transaction under which the Group is not exposed to substantially all the risks and rewards of ownership are not recognised on the balance sheet and the consideration paid is recorded in Loans and advances to banks or Loans and advances to customers as appropriate.a financial asset.
Securities borrowing and lending transactions are usually secured by cash or securities advanced by the borrower. Borrowed securities are not recognised on the balance sheet or lent securities derecognised. Cash collateral receivedgiven or givenreceived is treated as a loan or deposit; collateral in the form of securities is not recognised. However, where securities borrowed are transferred to third parties, a liability for the obligation to return the securities to the stock lending counterparty is recorded.
21.22. Netting
Financial assets and financial liabilities are offset and the net amount presented in the balance sheet when, and only when, the Group currently has a legally enforceable right to set off the recognised amounts; and it intends either to settle on a net basis, or to realise the asset and settle the liability simultaneously. The Group is party to a number of arrangements, including master netting agreements, that give it the right to offset financial assets and financial liabilities but where it does not intend to settle the amounts net or simultaneously and therefore the assets and liabilities concerned are presented gross.
22.23. Capital instruments
The Group classifies a financial instrument that it issues as a financial asset, financial liability or an equity instrument in accordance with the substance of the contractual arrangement. An instrument is classified as a liability if it is a contractual obligation to deliver cash or another financial asset, or to exchange financial assets or financial liabilities on potentially unfavourable terms. An instrument is classified as equity if it evidences a residual interest in the assets of the Group after the deduction of liabilities. The components of a compound financial instrument issued by the Group are classified and accounted for separately as financial assets, financial liabilities or equity as appropriate.
23.24. Derivatives and hedging
Derivative financial instruments are initially recognised, and subsequently measured, at fair value. Derivative fair values are determined from quoted prices in active markets where available. Where there is no active market for an instrument, fair value is derived from prices for the derivative’sderivative's components using appropriate pricing or valuation models.
A derivative embedded in a contract is accounted for as a stand-alone derivative if its economic characteristics are not closely related to the economic characteristics of the host contract; unless the entire contract is carriedmeasured at fair value throughwith changes in fair value recognised in profit or loss.
Gains and losses arising from changes in the fair value of a derivative are recognised as they arise in profit or loss unless the derivative is the hedging instrument in a qualifying hedge. The Group enters into three types of hedge relationship: hedges of changes in the fair value of a recognised asset or liability or firm commitment (fair value hedges); hedges of the variability in cash flows from a recognised asset or liability or a highly probable forecast transaction (cash flow hedges); and hedges of the net investment in a foreign operation.
Hedge relationships are formally documented at inception. The documentation includes identification ofidentifies the hedged item and the hedging instrument and details the risk that is being hedged and the way in which effectiveness will be assessed at inception and during the period of the hedge. If the hedge is not highly effective in offsetting changes in fair values or cash flows attributable to the hedged risk, consistent with the documented risk management strategy, hedge accounting is discontinued.
Fair value hedge - – in a fair value hedge, the gain or loss on the hedging instrument is recognised in profit or loss. The gain or loss on the hedged item attributable to the hedged risk is recognised in profit or loss and adjusts the carrying amount of the hedged item. Hedge accounting is discontinued if the hedge no longer meets the criteria for hedge accountingaccounting; or if the hedging instrument expires or is sold, terminated or exercisedexercised; or if hedge designation is revoked. If the hedged item is one for which the effective interest rate method is used, any cumulative adjustment is amortised to profit or loss over the life of the hedged item using a recalculated effective interest rate.
Cash flow hedge - –wherein a derivative financial instrument is designated as acash flow hedge, of the variability in cash flows of a recognised asset or liability or a highly probable forecast transaction, the effective portion of
the gain or loss on the hedging instrument is recognised directly in equity. Theequity and the ineffective portion is recognised in profit or loss. When the forecast transaction results in the recognition of a financial asset or financial liability, the cumulative gain or loss is reclassified from equity in the same periods in which the asset or liability affects profit or loss. Otherwise the cumulative gain or loss is removed from equity and recognised in profit or loss at the same time as the hedged transaction. Hedge accounting is discontinued if the hedge no longer meets the criteria for hedge accounting; if the hedging instrument expires or is sold, terminated or exercised; if the forecast transaction is no longer expected to occur; or if hedge designation is revoked. On the discontinuance of hedge accounting (except where a forecast transaction is no longer expected to occur), the cumulative unrealised gain or loss recognised in equity is recognised in profit or loss when the hedged cash flow occurs or, if the forecast transaction results in the recognition of a financial asset or financial liability, in the same periods during which the asset or liability affects profit or loss. Where a forecast transaction is no longer expected to occur, the cumulative unrealised gain or loss in equity is recognised in profit or loss immediately.
Hedge of net investment in a foreign operation - – in the hedge of a net investment in a foreign operation, the portion of foreign exchange differences arising on the hedging instrument determined to be an effective hedge is recognised directly in equity. Any ineffective portion is recognised in profit or loss. Non-derivative financial liabilities as well as derivatives may be the hedging instrument in a net investment hedge.
Accounting policies continued | Financial statements |
25. Share-based payments
The Group grantsawards shares and options over shares in The Royal Bank of Scotland Group plc to its employees under various share option schemes. The Group has applied IFRS 2 ‘Share-based Payment’ to grants under these schemes after 7 November 2002 that had not vested on 1 January 2005.employees. The expense for these transactions is measured based on the fair value on the date the optionsawards are granted. The fair value of an option is estimated using valuation techniques which take into account the option’sits exercise price, its term, the risk-free interest rate and the expected volatility of the market price of The Royal Bank of Scotland Group plc’splc's shares. Vesting conditions are not taken into account when measuring fair value, but are reflected by adjusting the numberproportion of options included in the measurement of the transaction such that the amount recognised reflects the numberawards that actually vest. The fair value is expensed on a straight-line basis over the vesting period. Following an amendment to IFRS 2 for accounting periods starting after 1 January 2009, the cancellation of an award with non-vesting conditions triggers immediate recognitio n of an expense in respect of any unrecognised element of the fair value of the award.
25.26. Cash and cash equivalents
Cash and cash equivalents comprises cash and demand deposits with banks together with short-term highly liquid investments that are readily convertible to known amounts of cash and subject to insignificant risk of change in value.
26.27. Shares in Group entities
The company’scompany's investments in its subsidiaries are stated at cost less any impairment.
Critical accounting policies and key sources of estimation uncertainty
The reported results of the Group are sensitive to the accounting policies, assumptions and estimates that underlie the preparation of its financial statements. UK company law and IFRS require the directors, in preparing the Group’sGroup's financial statements, to select suitable accounting policies, apply them consistently and make judgements and estimates that are reasonable and prudent. In the absence of an applicable standard or interpretation, IAS 8 ‘Accounting Policies, Changes in Accounting Estimates and Errors’, requires management to develop and apply an accounting policy that results in relevant and reliable information in the light of the requirements and guidance in IFRS dealing with similar and related issues and the IASB’s FrameworkIASB's ‘Framework for the Preparation and Presentation of Financial Statements.Statements’. The judgements and assumptionsass umptions involved in the Group’sGroup's accounting policies that are considered by the Board to be the most important to the portrayal of its financial condition are discussed below. The use of estimates, assumptions or models that differ from those adopted by the Group would affect its reported results.
The Group’sGroup's loan impairment provisions are established to recognise incurred impairment losses in its portfolio of loans classified as loans and receivables and carried at amortised cost. A loan is impaired when there is objective evidence that events since the loan was granted have affected expected cash flows from the loan. Such objective evidence, indicative that a borrower’s financial condition has deteriorated, can include for loans that are individually assessed: the non-payment of interest or principal; debt restructuring; probable bankruptcy or liquidation; significant reduction in the value of any security; breach of limits or covenants; and deteriorating trading performance and, for collectively assessed portfolios: the borrowers’ payment status and observable data about relevant macroeconomic measures.
The impairment loss is the difference between the carrying value of the loan and the present value of estimated future cash flows at the loan’sloan's original effective interest rate.
At 31 December 2008,2010, gross loans and advances to customers totalled £ 885,611£573,315 million (2007 – £ 834,987(2009 - £745,519 million; 2008 - £885,611 million) and customer loan impairment provisions amounted to £ 10,889£18,055 million (2007 – £ 6,449(2009 - £17,126 million; 2008 - £10,889 million).
There are two components to the Group’sGroup's loan impairment provisions: individual and collective.
Individual component – - all impaired loans that exceed specific thresholds are individually assessed for impairment. Individually assessed loans principally comprise the Group’sGroup's portfolio of commercial loans to medium and large businesses. Impairment losses are recognised as the difference between the carrying value of the loan and the discounted value of management’smanagement's best estimate of future cash repayments and proceeds from any security held. These estimates take into account the customer’scustomer's debt capacity and financial flexibility; the level and quality of its earnings; the amount and sources of cash flows; the industry in which the counterparty operates; and the realisable value of any security held. Estimating the quantum and timing of future recoveries involves significant judgement. The size of receipts will depend on the future performance of the borrower and the value of security, both of which will be affected by future economic conditions; additionally, collateral may not be readily marketable. The actual amount of future cash flows and the date they are received may differ from these estimates and consequently actual losses incurred may differ from those recognised in these financial statements.
Collective component –this- this is made up of two elements: loan impairment provisions for impaired loans that are below individual assessment thresholds (collective impaired loan(collectively assessed provisions) and for loan losses that have been incurred but have not been separately identified at the balance sheet date (latent loss provisions). TheseCollectively assessed provisions are established on a portfolio basis using a present value methodology taking into account the level of arrears, security, past loss experience, credit scores and defaults based on portfolio trends. The most significant factors in establishing these provisions are the expected loss rates and the related average life. These portfolios include credit card receivables and other personal advances including mortgages. The future creditcredi t quality of these portfolios is subject to uncertainties that could cause actual credit losses to differ materially from reported loan impairment provisions. These uncertainties include the economic environment, notably interest rates and their effect on customer spending, the unemployment level, payment behaviour and bankruptcy trends. Latent loss provisions are held against estimated impairment losses in the performing portfolio that have yet to be identified as at the balance sheet date. To assess the latent loss within its portfolios, the Group has developed methodologies to estimate the time that an asset can remain impaired within a performing portfolio before it is identified and reported as such.
Accounting policies continued | Financial statements |
Pensions
The Group operates a number of defined benefit pension schemes as described in Note 4 on the accounts. The assets of the schemes are measured at their fair value at the balance sheet date. Scheme liabilities are measured using the projected unit method, which takes account of projected earnings increases, using actuarial assumptions that give the best estimate of the future cash flows that will arise under the scheme liabilities. These cash flows are discounted at the interest rate applicable to high-quality corporate bonds of the same currency and term as the liabilities. Any recognisable surplus or deficit of scheme assets over liabilities is recognised in the balance sheet as an asset (surplus) or liability (deficit).
In determining the value of scheme liabilities, financial and demographic assumptions are made as toincluding price inflation, dividend growth, pension increases, earnings growth and employees. There is athe longevity of scheme members. A range of assumptions that could be adopted in valuing the schemes’schemes' liabilities. Different assumptions could significantly alter the amount of the surplus or deficit recognised in the balance sheet and the pension cost charged to the income statement. The assumptions adopted for the Group’sGroup's pension schemes are set out in Note 4 on the accounts, together with sensitivities of the sensitivity of reported amountsbalance sheet and income statement to changes in those assumptions.
A pension asset of £36£105 million and a liability of £2,032£2,288 million were recognised in the balance sheet at 31 December 2010 (2009 - asset - £58 million, liability - £2,963 million; 2008 (2007- asset – £575 million;- £36 million, liability – £460- £2,032 million).
Financial instruments classified as held-for-trading or designated as at fair value through profit or loss and financial assets classified as available-for-sale are recognised in the financial statements at fair value. All derivatives are measured at fair value. Gains or losses arising from changes in the fair value of financial instruments classified as held-for-trading or designated as at fair value through profit or loss are included in the income statement. Unrealised gains and losses on available-for-sale financial assets are recognised directly in equity unless an impairment loss is recognised.
Financial instruments measured at fair value include:
Loans and advances (held-for-trading and designated as at fair value though profit or loss) – - principally comprise reverse repurchase agreements (reverse repos) and syndicated loans. In repurchase agreements one party agrees to sell securities to another and simultaneously agrees to repurchase the securities at a future date for a specified price. The repurchase price is fixed at the outset, usually being the original sale price plus an amount representing interest for the period from the sale to the repurchase. Syndicated loans measured at fair value are amounts retained, from syndications where the Group was lead manager or underwriter, in excess of the Group’s intended long term participation.cash collateral.
Debt securities (held-for-trading, designated as at fair value though profit or loss and available-for-sale) –- debt securities include those issued by governments, municipal bodies, mortgage agencies and financial institutions as well as corporate bonds, debentures and residual interests in securitisations.
Equity securities (held-for-trading, designated as at fair value though profit or loss and available-for-sale) – - comprise equity shares of companies or corporations both listed and unlisted.
Deposits by banks and customer accounts (held-for-trading and designated as at fair value though profit or loss) – - deposits measured at fair value principally include repurchase agreements (repos) discussed above, cash collateral and investment contracts issued by the Group’sGroup's life assurance businesses.
Debt securities in issue (held-for-trading and designated as at fair value though profit or loss) – measured at fair value and - principally comprise medium term notes.
Short positions (held-for-trading) –- arise in dealing and market making activities where debt securities and equity shares are sold which the Group does not currently possess.
Derivatives – - these include swaps forwards, futures and options. They may be traded on an organised exchange (exchange-traded) or over-the-counter (OTC). Holders of exchange traded derivatives are generally required to provide margin daily in the form of cash or other collateral.
Swaps include currency(currency swaps, interest rate swaps, credit default swaps, total return swaps and equity and equity index swaps. A swap is an agreement to exchange cash flows in the future in accordance with a pre-arranged formula. In currency swap transactions, interest payment obligations are exchanged on assets and liabilities denominated in different currencies; the exchange of principal may be notional or actual. Interest rate swap contracts generally involve exchange of fixed and floating interest payment obligations without the exchange of the underlying principal amounts.
Forwards includeswaps), forward foreign exchange contracts, and forward rate agreements. A forward contract is a contract to buy (or sell) a specified amount of a physical or financial commodity, at an agreed price, on an agreed future date. Forward foreign exchange contracts are contracts for the delayed delivery of currency on a specified future date. Forward
rate agreements, are contracts under which two counterparties agree on the interest to be paid on a notional deposit of a specified term starting on a specific future date; there is no exchange of principal. Futures are exchange-traded forward contracts to buy (or sell) standardised amounts of underlying physical or financial commodities. The Group buys and sells currency,futures (currency, interest rate and equity futures.
Options include exchange-tradedequity) and options (exchange-traded options on currencies, interest rates and equities and equity indices and OTC currency and equity options, interest rate caps and floors and swaptions. They are contracts that give the holder the right but not the obligation to buy (or sell) a specified amount of the underlying physical or financial commodity at an agreed price on an agreed date or over an agreed period.swaptions).
Fair value is the amount for which an asset could be exchanged, or a liability settled, between knowledgeable, willing parties in an arm’s length transaction. Fair values are determined from quoted prices in active markets for identical financial assets or financial liabilities where these are available. Fair value for a net open position in a financial asset or financial liabilityinstrument in an active market is the current bid or offer price times the number of units of the instrument held. Where a trading portfolio contains bothheld times the current bid price (for financial assets andassets) or offer price (for financial liabilities which are derivatives ofliabilities). In determining the same underlying instrument, fair value is determined by valuing theof derivative financial instruments gross long and short positions measured at current mid market prices with an adjustment atare adjusted by bid-offer reserves calculated on a portfolio levelbasis. Credit valuation adjustments are made when valuing derivative financial assets to incorporate counterparty credit risk. Adjustments are also made when valuing financial liabilities to reflect the net open long or short position to amend the valuation to bid or offer as appropriate.Group’s own credit standing. Where the market for a financial instrument is not active, fair value is established using a valuation technique. These valuation techniques involve a degree of estimation, the extent of which depends on the instrument’s complexity and the availability of market-based data. TheMore details about the Group’s valuation methodologies and the sensitivity to reasonably possible alternative assumptions of the fair value of financial instruments valued using techniques where at least one significant input is unobservable isare given in Note 1112 on pages 187 and 188.251 to 265.
Accounting policies continued | Financial statements |
General insurance claims
The Group makes provision for the full cost of settling outstanding claims arising from its general insurance business at the balance sheet date, including claims estimated to have been incurred but not yet reported at that date and claims handling expenses. General insurance claims provisions amounted to £ 5,478£6,726 million at 31 December 2010 (2009 - £5,802 million; 2008 (2007 – £ 5,466- £5,478 million).
Provisions are determined by management based on experience of claims settled and on statistical models which require certain assumptions to be made regarding the incidence, timing and amount of claims and any specific factors such as adverse weather conditions. In order to calculate the total provision required, the historical development of claims is analysed using statistical methodology to extrapolate, within acceptable probability parameters, the value of outstanding claims at the balance sheet date. Also included in the estimation of outstanding claims are other assumptions such as the inflationary factor used for bodily injury claims which is based on historical trends and, therefore, allows for some increase due to changes in common law and statute.statute; and the incidence of periodical payment orders and the rate at which payments under them are discounted. Costs for both direct and indirect claims handling expenses are also included. Outward reinsurance recoveries are accounted for in the same accounting period as the direct claims to which they relate. The outstanding claims provision is based on information available to management and the eventual outcome may vary from the original assessment. Actual claims experience may differ from the historical pattern on which the estimate is based and the cost of settling individual claims may exceed that assumed.
Goodwill
The Group capitalises goodwill arising on the acquisition of businesses, as discussed in accounting policy 6. The carrying value of goodwill as at 31 December 2008 was £ 15,562 million (2007 – £42,953 million).
Goodwill is the excess of the cost of an acquired business over the fair value of its net assets. The determination of the fair value of assets and liabilities of businesses acquired requires the exercise of management judgement; for example those financial assets and liabilities for which there are no quoted prices, and those non-financial assets where valuations reflect estimates of market conditions, such as property. Different fair values would result in changes to the goodwill arising and to the post-acquisition performance of the acquisition. Goodwill is not amortised but is tested for impairment annually or more frequently if events or changes in circumstances indicate that it might be impaired.
For the purposes of impairment testing, goodwill acquired in a business combination is allocated to each of the Group’s cash-generating units or groups of cash-generating units expected to benefit from the combination. Goodwill impairment testing involves the comparison of the carrying value of a cash-generating unit or group of cash-generating units with its recoverable amount. The recoverable amount is the higher of the unit’s fair value and its value in use. Value in use is the present value of expected future cash flows from the cash-generating unit or group of cash-generating units. Fair value is the amount obtainable for the sale of the cash-generating unit in an arm’s length transaction between knowledgeable, willing parties.
Impairment testing inherently involves a number of judgmental areas: the preparation of cash flow forecasts for periods that are beyond the normal requirements of management reporting; the assessment of the discount rate appropriate to the business; estimation of the fair value of cash-generating units; and the valuation of the separable assets of each business whose goodwill is being reviewed. Sensitivity to changes in assumptions is discussed in Note 17 on page 207.
Deferred tax
The Group makes provision for deferred tax on short-term and other temporary differences where tax recognition occurs at a different time from accounting recognition. Deferred tax assets of £6,373 million were recognised as at 31 December 2010 (2009 - £7,039 million; 2008 - £7,082 million).
The Group has recognised deferred tax assets in respect of losses, principally in the UK, and short-term timing differences. Tax reliefDeferred tax assets are recognised in respect of unused tax losses to the extent that it is givenprobable that there will be future taxable profits against which the losses can be utilised. Business projections prepared for operating losses byimpairment reviews (see Note 19) indicate that sufficient future taxable income will be available against which to offset when future profits arise and therefore the recoverability ofthese recognised deferred tax assets is a matterwithin eight years (2009 - eight years). The Group's cumulative losses are principally attributable to the recent unparalleled market conditions. Deferred tax assets of judgement.£2,008 million (2009 - £2,163 million; 2008 - £1,748 million) have not been recognised in respect of tax losses carried forward in jurisdictions where doubt exists over the availability of future taxable profits.
Accounting policies continued | Financial statements |
International Financial Reporting Standards
The International Accounting Standards Board issued a revised IAS 23 ‘Borrowing Costs’ in March 2007. Entities are required to capitalise borrowing costs attributable to the development or construction of intangible assets or property plant or equipment. The standard is effective for accounting periods beginning on or after 1 January 2009 and is not expected to have a material effect on the Group or company.
The IASB issued a revised IAS 1 ‘Presentation of Financial Statements’‘Improvements to IFRS’ in September 2007 effective for accounting periods beginning on or after 1 January 2009. TheMay 2010 implementing minor changes to IFRS, making non-urgent but necessary amendments to the presentation requirements for financial statements are not expectedstandards, primarily to have a material effect on the Group or company.
remove inconsistency and to clarify wording. The IASB published a revised IFRS 3 ‘Business Combinations’ and related revisions to IAS 27 ‘Consolidated and Separate Financial Statements’ following the completion in January 2008 of its project on the acquisition and disposal of subsidiaries. The standards improve convergence with US GAAP and provide new guidance on accounting for changes in interests in subsidiaries. The cost of an acquisition will comprise only consideration paid to vendors for equity; other costs will be expensed immediately. Groups will only account for goodwill on acquisition of a subsidiary; subsequent changes in interest will be recognised in equity and only on a loss of control will there be a profit or loss on disposal to be recognised in income. The changes are effective for accountingannual periods beginning on or after 1 July 2009 but both standards may be adopted together for accounting periods beginning on or after 1 July 2007. These changes will affect the Group’s accounting for future acquisitions and disposals of subsidiaries.
The IASB published revisions to IAS 32 ‘Financial Instruments: Presentation’ and consequential revisions to other standards in February 2008 to improve the accounting for and disclosure of puttable financial instruments. The revisions are effective for accounting periods beginning on or after 1 January 2009 but together they may be adopted earlier. They are not expected to have a material affect on the Group or the company.
The IASB issued an amendment, 'Vesting Conditions and Cancellations', to IFRS 2 'Share-based Payment' in January 2008 that will change the accounting for share awards that have non-vesting conditions. The fair value of these awards does not currently take account of the effect of non-vesting conditions and where such conditions are not subsequently met, costs recognised up to the date of cancellation are reversed. The amendment requires costs not recognised up to the date of cancellation to be recognised immediately. The amendment is effective for accounting periods beginning on or after 1 January 2009. The Group estimates that adoption will cause a restatement of 2008 results, reducing profit by £ 110 million with no material affect on earlier periods. There is not expected to be a material effect on the company.
The IASB issued amendments to a number of standards in May 2008 as part of its annual improvements project. The amendments are effective for accounting periods beginning on or after 1 January 20092010 and are not expected to have a material effect on the Group or the company.
Also in May 2008, theThe IASB issued amendmentsIFRS 9 ‘Financial Instruments’ in November 2009 simplifying the classification and measurement requirements in IAS 39 ‘Financial Instruments: Recognition and Measurement’ in respect of financial assets. The standard reduces the measurement categories for financial assets to two: fair value and amortised cost. A financial asset is classified on the basis of the entity's business model for managing the financial asset and the contractual cash flow characteristics of the financial asset. Only assets with contractual terms that give rise to cash flows on specified dates that are solely payments of principal and interest on the principal amount outstanding and which are held within a business model whose objective is to hold assets in order to collect contractual cash flows are classified as amortised cost. All ot her financial assets are measured at fair value. Changes in the value of financial assets measured at fair value are generally taken to profit or loss.
In October 2010, IFRS 9 was updated to include the classification and measurement of liabilities. It is not markedly different from IAS 39 except for liabilities measured at fair value where the movement is due to changes in credit rating of the preparer it is recognised not in profit or loss but in other comprehensive income.
The standard is effective for annual periods beginning on or after 1 January 2013; early application is permitted.
This standard makes major changes to the framework for the classification and measurement of financial assets and will have a significant effect on the Group's financial statements. The changes relating to the classification and measurement of liabilities carried at fair value will have a less significant effect on the Group. The Group is assessing these impacts which are likely to depend on the outcome of the other phases of IASB's IAS 39 replacement project.
The IASB issued ‘Disclosures - Transfers of Financial Assets (Amendments to IFRS 7 Financial Instruments: Disclosures)’ in October 2010 to extend the standard’s disclosure requirements about derecognition to align with US GAAP. The revisions are effective for annual periods beginning on or after 1 ‘First-time Adoption of International Financial Reporting Standards’July 2011 and IAS 27 ‘Consolidated and Separate Financial Statements’ that change the investor's accounting for the cost of an investment in a subsidiary, jointly controlled entity or associate. It doeswill not affect the consolidated accounts but may prospectively affectfinancial position or reported performance of the company’s accounting and presentation of receipts of dividends from such entities.Group or the company.
The IASB issued an amendment to IAS 3912 ‘Income Taxes’ in July 2008December 2010 to clarify that recognition of deferred tax should have regard to the IFRS stance on eligible hedged items.expected manner of recovery or settlement of the asset or liability. The amendment isand consequential withdrawal of SIC 21 ‘Deferred Tax: Recovery of Underlying Assets’, effective for accountingannual periods beginning on or after 1 January 2009 and2012, is not expected to have a material effect on the Group or the Bank.company.
The International Financial Reporting Interpretations Committee (IFRIC) issued IFRIC 19 ‘Extinguishing Financial Liabilities with Equity Instruments’ in December 2009. The interpretation IFRIC 15 ‘Agreementsclarifies that the profit or loss on extinguishing liabilities by issuing equity instruments should be measured by reference to fair value, preferably of the equity instruments. The interpretation, effective for the Construction of Real Estate’ in July 2008. This interpretation clarifies the accountingGroup for construction profits. It is applicable for accountingannual periods beginning on or after 1 January 2009 and2011, is not expected to have a material effect on the Group or the company.
The IFRIC issued interpretation IFRIC 16 ‘Hedges of a| Notes on the accounts | Financial statements |
1 Net Investment in a Foreign Operation’ in July 2008. The interpretation addresses the nature of the hedged risk and the amount of the hedged item; where in a group the hedging item could be held; and what amounts should be reclassified from equity on the disposal of a foreign operation that had been subject to hedging. The interpretation is effective for accounting periods beginning on or after 1 October 2008 and is not expected to have a material effect on the Group or company.interest income| | Group |
| | 2010 | 2009 | 2008 |
| | £m | £m | £m |
| Loans and advances to customers | 18,889 | 21,356 | 34,949 |
| Loans and advances to banks | 591 | 830 | 2,201 |
| Debt securities | 3,296 | 4,125 | 5,040 |
| Interest receivable | 22,776 | 26,311 | 42,190 |
| | | | |
| Customer accounts: demand deposits | 1,228 | 970 | 3,475 |
| Customer accounts: savings deposits | 1,148 | 1,245 | 2,261 |
| Customer accounts: other time deposits | 1,345 | 2,546 | 7,906 |
| Deposits by banks | 1,333 | 2,898 | 6,362 |
| Debt securities in issue | 3,277 | 4,482 | 8,919 |
| Subordinated liabilities | 417 | 1,291 | 1,959 |
| Internal funding of trading businesses | (181) | (509) | (4,174) |
| Interest payable | 8,567 | 12,923 | 26,708 |
| | | | |
| Net interest income | 14,209 | 13,388 | 15,482 |
The IFRIC issued interpretation IFRIC 17 ‘Distributions of Non-Cash Assets to Owners’ and the IASB made consequential amendments to IFRS 5 'Non-Current Assets Held for Sale and Discontinued Operations' in December 2008. The interpretation requires distributions to be presented at fair value with any surplus or deficit to be recognised in income. The amendment to IFRS 5 extends the definition of disposal groups and discontinued operations to disposals by way of distribution. The interpretation is effective for accounting periods beginning on or after 1 July 2009, to be adopted at the same time as IFRS 3 (revised 2008), and is not expected to have a material effect on the Group or company.228
The IFRIC issued interpretation IFRIC 18 ‘Transfers of Assets from Customers’ in January 2009. The interpretation addresses the accounting by suppliers that receive assets from customers, requiring measurement at fair value. The interpretation is effective for assets from customers received on or after 1 July 2009 and is not expected to have a material effect on the Group or company.Notes on the accounts continued | Financial statements |
Notes on the accounts
| | | Group | |
| | | 2008 | | | 2007 | | | 2006 | |
| | | | £m | | | | £m | | | | £m | |
| Loans and advances to customers | | | 41,812 | | | | 28,568 | | | | 22,195 | |
| Loans and advances to banks | | | 2,356 | | | | 1,570 | | | | 843 | |
| Debt securities | | | 5,354 | | | | 2,114 | | | | 1,650 | |
| Interest receivable | | | 49,522 | | | | 32,252 | | | | 24,688 | |
| | | | | | | | | | | | | |
| Customer accounts: demand deposits | | | 4,341 | | | | 4,327 | | | | 3,083 | |
| Customer accounts: savings deposits | | | 3,911 | | | | 2,560 | | | | 1,373 | |
| Customer accounts: other time deposits | | | 8,108 | | | | 6,301 | | | | 4,444 | |
| Deposits by banks | | | 6,576 | | | | 3,406 | | | | 2,621 | |
| Debt securities in issue | | | 9,941 | | | | 5,687 | | | | 3,286 | |
| Subordinated liabilities | | | 2,144 | | | | 1,530 | | | | 1,386 | |
| Internal funding of trading business | | | (4,174 | ) | | | (3,628 | ) | | | (2,101 | ) |
| Interest payable | | | 30,847 | | | | 20,183 | | | | 14,092 | |
| | | | | | | | | | | | | |
| Net interest income | | | 18,675 | | | | 12,069 | | | | 10,596 | |
| | Group |
| | 2010 | 2009 | 2008 |
| | £m | £m | £m |
| Fees and commissions receivable | 8,193 | 8,738 | 8,855 |
| | | | |
| Fees and commissions payable | | | |
| - banking | (1,892) | (2,351) | (2,043) |
| - insurance related | (319) | (439) | (401) |
| | (2,211) | (2,790) | (2,444) |
Income/(loss) from trading activities (1) | | | |
| Foreign exchange | 1,491 | 2,340 | 1,906 |
| Interest rate | 1,862 | 3,883 | 1,026 |
| Credit | 41 | (4,147) | (12,207) |
| Other | 1,123 | 1,685 | 250 |
| | 4,517 | 3,761 | (9,025) |
| | | | |
Gain on redemption of own debt (2) | 553 | 3,790 | — |
| | | | |
| Other operating income (excluding insurance net premium income) | | | |
| Operating lease and other rental income | 1,394 | 1,323 | 1,469 |
Changes in the fair value of own debt attributable to own credit (3) | 249 | 51 | 977 |
| Changes in the fair value of securities and other financial assets and liabilities | (180) | 42 | (1,266) |
| Changes in the fair value of investment properties | (405) | (117) | (86) |
| Profit on sale of securities | 496 | 162 | 164 |
| Profit on sale of property, plant and equipment | 50 | 40 | 177 |
| (Loss)/profit on sale of subsidiaries and associates | (107) | (144) | 934 |
| Life business profits/(losses) | 90 | 156 | (52) |
| Dividend income | 69 | 78 | 276 |
| Share of profits less losses of associated entities | 70 | (268) | 45 |
Other income (4) | (247) | (450) | (485) |
| | 1,479 | 873 | 2,153 |
| | | Group | |
| | | 2008 | | | 2007 | | | 2006 | |
| | | | £m | | | | £m | | | | £m | |
| Fees and commissions receivable | | | 9,831 | | | | 8,278 | | | | 7,116 | |
| Fees and commissions payable: | | | | | | | | | | | | |
| – banking | | | (1,985 | ) | | | (1,727 | ) | | | (1,432 | ) |
| – insurance related | | | (401 | ) | | | (466 | ) | | | (490 | ) |
| | | | (2,386 | ) | | | (2,193 | ) | | | (1,922 | ) |
| | | | | | | | | | | | | |
| (Loss)/income from trading activities: | | | | | | | | | | | | |
Foreign exchange (1) | | | 1,994 | | | | 1,085 | | | | 738 | |
Interest rate (2) | | | 1,454 | | | | 1,414 | | | | 973 | |
Credit (3) | | | (12,200 | ) | | | (1,446 | ) | | | 841 | |
Equities and commodities (4) | | | 275 | | | | 239 | | | | 123 | |
| | | | (8,477 | ) | | | 1,292 | | | | 2,675 | |
| Other operating income: | | | | | | | | | | | | |
| Operating lease and other rental income | | | 1,525 | | | | 1,671 | | | | 1,755 | |
| Changes in the fair value of own debt | | | 977 | | | | 152 | | | | — | |
| Changes in the fair value of securities and other financial assets and liabilities | | | (1,730 | ) | | | 970 | | | | 430 | |
| Changes in the fair value of investment properties | | | (86 | ) | | | 288 | | | | 486 | |
| Profit on sale of securities | | | 342 | | | | 544 | | | | 369 | |
| Profit on sale of property, plant and equipment | | | 167 | | | | 741 | | | | 216 | |
| Profit on sale of subsidiaries and associates | | | 943 | | | | 67 | | | | 44 | |
| Life company (losses)/profits | | | (52 | ) | | | 187 | | | | 219 | |
| Dividend income | | | 281 | | | | 137 | | | | 92 | |
| Share of profits less losses of associated entities | | | 69 | | | | 25 | | | | 36 | |
| Other income | | | (537 | ) | | | 51 | | | | (83 | ) |
| | | | 1,899 | | | | 4,833 | | | | 3,564 | |
The analysis of trading income is based on how the business is organised and the underlying risks managed.
| (1) | The analysis of trading income/(loss) is based on how the business is organised and the underlying risks managed. Trading income/(loss) comprises gains and losses on financial instruments held for trading, both realised and unrealised, interest income and dividends and the related funding costs. |
Trading income comprises gains and losses on financial instruments held for trading, both realised and unrealised, interest income and dividends and the related funding costs. The types of instruments include:
(1) | - | Foreign exchange: spot foreign exchange contracts, currency swaps and options, emerging markets and related hedges and funding. |
(2) | - | Interest rate: interest rate swaps, forward foreign exchange contracts, forward rate agreements, interest rate options, interest rate futures and related hedges and funding. |
(3) | - | Credit: asset-backed securities, corporate bonds, credit derivatives and related hedges and funding. |
(4) | Equities and commodities:- | Other: equities, commodities, equity derivatives, commodity contracts and related hedges and funding.funding. |
| (2) | In May 2010, the Group redeemed certain subordinated debt securities and equity preference shares in exchange for cash or senior debt. The exchanges involving instruments classified as liabilities all met the criteria in IFRS for treatment as the extinguishment of the original liability and the recognition of a new financial liability. Gains on these exchanges and on the redemption of securities classified as liabilities for cash, totalling £553 million were credited to profit or loss. No amounts have been recognised in profit or loss in relation to the redemption of securities classified as equity in the Group financial statements. The difference between the consideration and the carrying value for these securities amounting to £651 million has been recorded in equity. A similar series of exchange and tender offers completed in April 2009 and resulted in a gain of £3,790 million being credited to profit or loss and £829 million being recorded in equity. |
| (3) | Measured as the change in fair value from movements in the period in the credit risk premium payable by the Group. |
| (4) | Includes income from activities other than banking and insurance. |
Notes on the accounts continued | Financial statements |
| | | Group | | Group |
| | | 2008 | | | 2007 | | | 2006 | | 2010 | 2009 | 2008 |
| | | | £m | | | | £m | | | | £m | | £m | £m |
| Wages, salaries and other staff costs | | | 8,907 | | | | 6,230 | | | | 5,652 | | 7,945 | 8,039 | 7,471 |
| Bonus tax | | 99 | 208 | — |
| Social security costs | | | 696 | | | | 471 | | | | 389 | | 661 | 675 | 648 |
| Share-based compensation | | | — | | | | 65 | | | | 65 | | 397 | 329 | 169 |
| Pension costs | | | | | | | | | | | | | | |
| – defined benefit schemes (see Note 4) | | | 490 | | | | 489 | | | | 580 | | |
| – defined contribution schemes | | | 148 | | | | 83 | | | | 37 | | |
| - defined benefit schemes (see Note 4) | | 519 | 638 | 473 |
| - curtailment gains (see Note 4) | | (78) | (2,148) | — |
| - defined contribution schemes | | 128 | 104 | 137 |
| Staff costs | | | 10,241 | | | | 7,338 | | | | 6,723 | | 9,671 | 7,845 | 8,898 |
| | | | | | | | | | | | | | | |
| Premises and equipment | | | 2,593 | | | | 1,703 | | | | 1,421 | | 2,402 | 2,594 | 2,163 |
| Other administrative expenses | | | 5,464 | | | | 2,969 | | | | 2,658 | | 3,995 | 4,449 | 4,716 |
| | | | | | | | | | | | | | | |
| Property, plant and equipment (see Note 18) | | | 1,584 | | | | 1,297 | | | | 1,293 | | |
| Intangible assets (see Note 17) | | | 1,570 | | | | 635 | | | | 385 | | |
| Property, plant and equipment (see Note 20) | | 1,428 | 1,427 | 1,406 |
| Intangible assets (see Note 19) | | 722 | 739 | 971 |
| Depreciation and amortisation | | | 3,154 | | | | 1,932 | | | | 1,678 | | 2,150 | 2,166 | 2,377 |
| | | | | | | | | | | | | | | |
| Write-down of goodwill and other intangible assets | | | 32,581 | | | | — | | | | — | | 10 | 363 | 16,911 |
| | | | 54,033 | | | | 13,942 | | | | 12,480 | | 18,228 | 17,417 | 35,065 |
Integration costs included in operating expenses comprise expenditure incurred in respect of cost reduction and revenue enhancement programmes set in connectionconnected with the various acquisitions made by the Group.
| | | Group | | Group |
| | | 2008 | | | 2007 | | | 2006 | | 2010 | 2009 | 2008 |
| | | | £m | | | | £m | | | | £m | | £m | £m |
| Staff costs | | | 503 | | | | 18 | | | | 76 | | 210 | 365 | 503 |
| Premises and equipment | | | 25 | | | | 4 | | | | 10 | | 3 | 78 | 25 |
| Other administrative expenses | | | 486 | | | | 26 | | | | 32 | | 143 | 398 | 486 |
| Depreciation and amortisation | | | 36 | | | | 60 | | | | 16 | | 20 | 18 | 36 |
| | | | 1,050 | | | | 108 | | | | 134 | | 376 | 859 | 1,050 |
Restructuring costs included in operating expenses comprise:
| | | 2008
£m
| |
Staff costs | | | 251 | |
Premises and equipment | | | 15 | |
Other administrative expenses | | | 41 | |
| | | 307 | |
| | 2010 | 2009 | 2008 |
| | £m | £m | £m |
| Staff costs | 353 | 328 | 251 |
| Premises and equipment | 117 | 48 | 15 |
| Other administrative expenses | 104 | 51 | 41 |
| | 574 | 427 | 307 |
Divestment costs included in operating expenses comprise:
No restructuring costs were incurred in 2007 and 2006.
| | 2010 | 2009 | 2008 |
| | £m | £m | £m |
| Staff costs | 51 | — | — |
| Premises and equipment | 6 | — | — |
| Other administrative expenses | 25 | — | — |
| | 82 | — | — |
Notes on the accounts continued | Financial statements |
3 Operating expenses continuedThe average number of persons employed, rounded to the nearest hundred, in the continuing operations of the Group during the year, excluding temporary staff, was 197,100 (2007 – 157,200; 2006 – 142,600)153,400 (2009 - 166,400; 2008 - 175,400); on the same basis the discontinued operations employed 32,200 (2007 – 13,300; 2006 – nil)6,200 employees (2009 - 28,100; 2008 - 58,300). The average number of temporary employees during 2010 was 11,600 (2009 - 9,700; 2008 was 7,000 (2007 – 4,900)- 7,000). The number of persons employed in the continuing operations of the Group at 31 December, excluding temporary staff, was as follows:
| | | Group | | Group |
| | | 2008 | | | 2007 | | | 2006 | | 2010 | 2009 | 2008 |
| UK Retail | | 26,300 | 28,500 | 31,700 |
| UK Corporate | | 13,000 | 12,600 | 13,600 |
| Wealth | | 5,300 | 4,800 | 5,300 |
| Global Transaction Services | | 2,400 | 3,200 | 3,600 |
| Ulster Bank | | 4,400 | 4,600 | 5,600 |
| US Retail & Commercial | | 16,500 | 16,400 | 17,300 |
| Global Banking & Markets | | | 18,700 | | | | 17,600 | | | | 7,600 | | 15,500 | 15,100 | 15,700 |
| Global Transaction Services | | | 4,200 | | | | 3,900 | | | | 2,500 | | |
| UK Retail & Commercial Banking | | | 46,100 | | | | 45,700 | | | | 46,300 | | |
| US Retail & Commercial Banking | | | 18,700 | | | | 19,000 | | | | 19,800 | | |
| Europe & Middle East Retail & Commercial Banking | | | 7,900 | | | | 8,700 | | | | 5,700 | | |
| Asia Retail & Commercial Banking | | | 11,600 | | | | 12,500 | | | | 4,600 | | |
| RBS Insurance | | | 17,400 | | | | 18,000 | | | | 18,500 | | 15,000 | 14,600 | 15,300 |
| Group Manufacturing | | | 43,600 | | | | 44,500 | | | | 34,100 | | |
| Centre | | | 4,200 | | | | 3,800 | | | | 2,700 | | |
| RBS share of shared assets | | | 400 | | | | 1,200 | | | | — | | |
| Central items | | 4,300 | 3,800 | 4,300 |
| Core | | 102,700 | 103,600 | 112,400 |
| Non-Core | | 6,400 | 13,700 | 15,000 |
| | | 109,100 | 117,300 | 127,400 |
| Business Services | | 36,100 | 41,600 | 44,500 |
| Integration | | 300 | 500 | 900 |
| RFS Holdings minority interest | | | 26,700 | | | | 28,600 | | | | — | | — | 300 | 200 |
| Total | | | 199,500 | | | | 203,500 | | | | 141,800 | | 145,500 | 159,700 | 173,000 |
| | | | | | | | | | | | | | |
| UK | | | 105,800 | | | | 108,000 | | | | 105,700 | | 93,000 | 98,400 | 105,600 |
| US | | | 27,100 | | | | 26,500 | | | | 26,200 | | |
| USA | | 23,900 | 25,600 | 27,100 |
| Europe | | | 40,200 | | | | 40,500 | | | | 8,100 | | 10,800 | 12,600 | 14,400 |
| Rest of the World | | | 26,400 | | | | 28,500 | | | | 1,800 | | 17,800 | 23,100 | 25,900 |
| Total | | | 199,500 | | | | 203,500 | | | | 141,800 | | 145,500 | 159,700 | 173,000 |
DiscontinuedThere were no persons employed in discontinued operations excluding temporary staff, employed 2,600 personsas at 31 December 2010 (2009 - 24,800; 2008 (2007 – 53,200; 2006 – nil)- 29,100).
Share-based payments
As described in the Remuneration report on pages 189 to 204, the Group grants share-based awards to employees principally on the following bases:
| Award plan | Eligible employees | Nature of award (1) | Vesting conditions (2) | Issue dates |
| Sharesave | UK, Republic of Ireland, Channel Islands, Gibraltar and Isle of Man | Option to buy shares under employee savings plan | Continuing employment or leavers in certain circumstances | 2011 to 2018 |
| Deferred performance awards | All | Awards of ordinary shares | Continuing employment or leavers in certain circumstances | 2011 to 2014 |
| Restricted share awards | Senior employees | Awards of conditional shares | Continuing employment or leavers in certain circumstances and/or achievement of performance conditions | 2011 to 2014 |
Long-term incentives (3) | Senior employees | Awards of conditional shares or share options | Continuing employment or leavers in certain circumstances and/or achievement of performance conditions | 2011 to 2020 |
| (1) | Awards are equity-settled unless international comparability is better served by cash-settled awards. |
| (2) | All awards have vesting conditions and therefore some may not vest. |
| (3) | Long-term incentives include the Executive Share Option Plan, the Long-Term Incentive Plan and the Medium-Term Performance Plan. |
| (4) | The strike price of options and the fair value on granting awards of fully paid shares is the average market price over the five trading days preceding grant date. |
Notes on the accounts continued | Financial statements |
Sharesave| | 2010 | | 2009 |
| | Average exercise price £ | Shares under option (million) | | Average exercise price £ | Shares under option (million) |
| At 1 January | 0.50 | 1,038 | | 2.88 | 84 |
| Granted | 0.43 | 147 | | 0.38 | 1,176 |
| Exercised | 0.38 | (5) | | — | — |
| Lapsed | 0.45 | (168) | | 0.77 | (222) |
| At 31 December | 0.48 | 1,012 | | 0.50 | 1,038 |
Deferred performance awards
| | 2010 |
| | Value at grant £m | Shares awarded (million) |
| At 1 January | — | — |
| Granted | 1,043 | 2,755 |
| Forfeited | (34) | (90) |
| At 31 December | 1,009 | 2,665 |
None of the share awards vested in 2010. The awards granted in 2010 vest evenly over the following two anniversaries.
Restricted share awards
| | 2010 | | 2009 |
| | Value at grant £m | Shares awarded (million) | | Value at grant £m | Shares awarded (million) |
| At 1 January | 117 | 325 | | 48 | 31 |
| Granted | 26 | 55 | | 94 | 309 |
| Exercised | (6) | (15) | | (16) | (5) |
| Lapsed | (27) | (30) | | (9) | (10) |
| At 31 December | 110 | 335 | | 117 | 325 |
The market value of awards exercised in 2010 was £6 million (2009 - £2 million).
Long-term incentives
| | 2010 | | 2009 |
| | Value at grant £m | Shares awarded (million) | Options over shares (million) | | Value at grant £m | Shares awarded (million) | Options over shares (million) |
| At 1 January | 122 | 7 | 413 | | 79 | 1 | 92 |
| Granted | 115 | 247 | 3 | | 70 | 8 | 353 |
| Exercised | — | — | (1) | | — | — | — |
| Lapsed | (18) | (4) | (38) | | (27) | (2) | (32) |
| At 31 December | 219 | 250 | 377 | | 122 | 7 | 413 |
The market value of awards exercised in 2010 was less than £1 million (2009 - nil). There are vested options over 33 million shares exercisable up to 2020 (2009 - 33 million shares up to 2014).
At 31 December 2010 a provision of £6 million had been made in respect of 16 million share awards and 3 million options over shares that may be cash-settled (2009 - £6 million in respect of 16 million share awards and 3 million options over shares).
The fair value of options granted in 2010 was determined using a pricing model that included: expected volatility of shares determined at the grant date based on historic volatility over a period of up to seven years; an expected option lives that equal the vesting period; no dividends on equity shares; and a risk-free interest rate determined from the UK gilt rates with terms matching the expected lives of the options.
Notes on the accounts continued | Financial statements |
4 Pension costs
Members of theThe Group sponsorsponsors a number of pension schemes in the UK and overseas, predominantly defined benefit schemes, whose assets are independent of the Group’s finances. The principal defined benefit scheme is The Royal Bank of Scotland Retirement Fund (the “Main scheme”) which accounts for 84% (2009 - 61%; 2008 - 56%) of the Group’s retirement benefit obligations.
The Group’s defined benefit schemes generally provide a pension of one-sixtieth of final pensionable salary for each year of service prior to retirement up to a maximum of 40 years. Employees do not make contributions for basic pensions but may make voluntary contributions to secure additional benefits on a money-purchase basis. Since October 2006, the Main scheme has been closed to new entrants who have instead been offered membership of The Royal Bank of Scotland Group Pension Fund (‘Retirement Savings Plan, a defined contribution pension scheme. In 2009, pensionable salary increases in the Main scheme’) has been closedscheme and certain other UK and Irish schemes were limited to new entrants.2% per annum or CPI inflation if lower.
The Group also provides post-retirement benefits other than pensions, principally through subscriptions to private healthcare schemes in the UK and the US and unfunded post-retirement benefit plans. Provision for the costs of these benefits is charged to the income statement over the average remaining future service lives of eligible employees. The amounts are not material.
Interim valuations of the Group’s schemes under IAS 19 ‘Employee Benefits’ were prepared to 31 December bywith the support of independent actuaries, using the following assumptions:
| | | | | | | | |
| Principal actuarial assumptions at 31 December | | 2008 | | | 2007 | | | 2006 | | | 2008 | | | 2007 | | | 2006 | | |
| | | | | | | | | | | | Weighted average | | |
| Principal actuarial assumptions at 31 December (weighted average) | | Main scheme | | All schemes |
| 2010 | 2009 | 2008 | 2010 | 2009 | 2008 |
| Discount rate | | | 6.5 | % | | | 6.0 | % | | | 5.3 | % | | | 6.0 | % | | | 5.8 | % | | | 5.3 | % | 5.5% | 5.9% | 6.5% | | 5.4% | 5.7% | 6.0% |
| Expected return on plan assets (weighted average) | | | 7.1 | % | | | 6.9 | % | | | 6.9 | % | | | 6.3 | % | | | 6.8 | % | | | 6.9 | % | |
| Rate of increase in salaries* | | | 4.0 | % | | | 4.5 | % | | | 4.2 | % | | | 3.4 | % | | | 4.0 | % | | | 4.1 | % | |
| Expected return on plan assets | | 6.7% | 6.8% | 7.1% | | 6.3% | 6.1% | 6.3% |
| Rate of increase in salaries | | 1.8% | 1.8% | 4.0% | | 2.0% | 2.0% | 3.4% |
| Rate of increase in pensions in payment | | | 2.7 | % | | | 3.2 | % | | | 2.9 | % | | | 2.4 | % | | | 2.8 | % | | | 2.8 | % | 3.3% | 3.5% | 2.7% | | 3.0% | 3.0% | 2.4% |
| Inflation assumption | | | 2.7 | % | | | 3.2 | % | | | 2.9 | % | | | 2.4 | % | | | 2.9 | % | | | 2.9 | % | 3.3% | 3.5% | 2.7% | | 3.2% | 3.0% | 2.4% |
| | Main scheme | | All schemes |
| Major classes of plan assets as a percentage of total plan assets | 2010 | 2009 | 2008 | | 2010 | 2009 | 2008 |
| Quoted equities | 25.9% | 38.9% | 52.9% | | 28.2% | 36.2% | 38.0% |
| Private equity | 5.4% | 5.1% | 6.5% | | 4.5% | 3.1% | 3.7% |
| Index-linked bonds | 27.0% | 23.7% | 18.0% | | 24.1% | 15.2% | 11.4% |
| Government fixed interest bonds | — | — | 1.2% | | 1.9% | 18.9% | 23.2% |
| Corporate and other bonds | 26.2% | 19.7% | 18.5% | | 24.8% | 14.7% | 15.1% |
| Hedge funds | 3.2% | 3.6% | — | | 3.5% | 3.1% | 0.8% |
| Property | 3.4% | 3.5% | 3.7% | | 3.6% | 3.6% | 3.9% |
| Derivatives | 0.9% | — | (1.8%) | | 1.2% | 0.8% | 1.5% |
| Cash and other assets | 7.8% | 5.3% | 1.0% | | 8.1% | 4.3% | 2.4% |
| Equity exposure of equity futures | 25.6% | 10.6% | — | | 21.4% | 6.3% | — |
| Cash exposure of equity futures | (25.4%) | (10.4%) | — | | (21.3%) | (6.2%) | — |
| | 100.0% | 100.0% | 100.0% | | 100.0% | 100.0% | 100.0% |
* RateThe Main scheme, which represents 84% of increase in salariesplan assets at 31 December 2010 following the divestment during 2010 of ABN AMRO’s principal pension scheme in the Netherlands (2009 - 59%; 2008 - 57%), is invested in a diversified portfolio of quoted and private equity, government and corporate fixed-interest and index-linked bonds, and other assets including property and hedge funds. The Main Scheme assumedscheme also employs derivative instruments, where appropriate, to be 2.0% overachieve a desired asset class exposure or to match assets more closely to liabilities. The value of assets shown reflects the next two years.actual physical assets held by the scheme, with any derivative holdings valued on a mark-to-market basis. The return on assets on the total scheme has been based on the asset exposure created allowing for the net impact of the derivatives on the risk and return profile of the holdings.
Notes on the accounts continued | Financial statements |
| | | | | | | |
| Major classes of plan assets as a percentage of total plan assets | | 2008 | | | 2007 | | | 2006 | | | 2008 | | | 2007 | | | 2006 | |
| Equities | | | 59.4 | % | | | 61.0 | % | | | 60.5 | % | | | 42.2 | % | | | 57.8 | % | | | 60.7 | % |
| Index-linked bonds | | | 18.0 | % | | | 18.2 | % | | | 17.3 | % | | | 11.4 | % | | | 13.1 | % | | | 16.1 | % |
| Government fixed interest bonds | | | 1.2 | % | | | 1.2 | % | | | 2.5 | % | | | 26.8 | % | | | 12.9 | % | | | 3.3 | % |
| Corporate and other bonds | | | 18.5 | % | | | 15.1 | % | | | 14.0 | % | | | 14.3 | % | | | 12.0 | % | | | 13.9 | % |
| Property | | | 3.7 | % | | | 3.8 | % | | | 4.3 | % | | | 3.9 | % | | | 3.0 | % | | | 4.5 | % |
| Cash and other assets | | | (0.8 | %) | | | 0.7 | % | | | 1.4 | % | | | 1.4 | % | | | 1.2 | % | | | 1.5 | % |
| | 2010 | | 2009 | | 2008 |
| | Notional amounts | Fair value | | Notional amounts | Fair value | | Notional amounts | Fair value |
| Assets | Liabilities | Assets | Liabilities | Assets | Liabilities |
| | £m | £m | £m | | £m | £m | £m | | £m | £m | £m |
| Inflation rate swaps | 2,132 | 69 | 8 | | 1,171 | 75 | 3 | | 947 | 1 | 43 |
| Interest rate swaps | 10,727 | 270 | 110 | | 4,893 | 46 | 114 | | 868 | 18 | — |
| Total return swaps | 466 | 16 | — | | — | — | — | | — | — | — |
| Currency swaps | (973) | — | 1 | | — | — | — | | — | — | — |
| Equity futures | 4,851 | 49 | 14 | | 1,730 | 37 | — | | 15 | — | — |
| Currency forwards | 4,883 | 35 | 91 | | 2,908 | 58 | 70 | | 1,966 | 21 | 267 |
The investment strategy of other schemes is similar to that of the Main scheme, adjusted to take account of the nature of liabilities, risk appetite of the trustees, size of the scheme and any local regulatory constraints. The use of derivative instruments outside of the Main scheme is not material.
Swaps are part of the management of the inflation and interest rate sensitivity of the Main scheme liabilities. They have been executed at prevailing market rates and within standard market bid/offer spreads. Substantially all swaps are with The Royal Bank of Scotland plc and National Westminster Bank Plc (the “banks”). At 31 December 2010, the gross notional value of the swaps was £12,352 million (2009 - £6,064 million; 2008 - £1,815 million) and had a net positive fair value of £236 million (2009 - £4 million positive; 2008 - £24 million negative) to the scheme.
Collateral is required on all swap transactions with those between the banks and the Main scheme on terms that do not allow the banks to re-hypothecate. The banks had delivered £210 million of collateral at 31 December 2010 (2009 - held £6 million; 2008 - held £36 million).
Ordinary shares of the company with a fair value of £15£9 million (2007 – £69(2009 - £4 million; 2006 – £892008 - £15 million) are held by the Group’s pension schemes; £15 million (2007 – £65 million; 2006 – £87 million) in theGroup's Main scheme which also holds other financial instruments issued by the Group with a value of £ 421£264 million (2007 – £ 606(2009 - £192 million; 2006 – £ 2582008 - £421 million).
The expected return on plan assets at 31 December is based upon the weighted average of the following assumed returns on the major classes of plan assets:assets, allowing for the net impact of derivatives on the risk and return profile:
| | | Main scheme | | | All schemes | |
| | | 2010 | | | 2009 | | | 2008 | | | 2010 | | | 2009 | | | 2008 | |
| Quoted equities | | | 7.7% | | | | 8.0% | | | | 8.4% | | | | 7.5% | | | | 7.8% | | | | 8.4% | |
| Private equity | | | 7.7% | | | | 8.0% | | | | 8.4% | | | | 7.7% | | | | 8.0% | | | | 8.4% | |
| Index-linked bonds | | | 4.2% | | | | 4.5% | | | | 3.9% | | | | 4.0% | | | | 4.5% | | | | 3.9% | |
| Government fixed interest bonds | | | — | | | | — | | | | 3.9% | | | | 2.9% | | | | 4.0% | | | | 4.3% | |
| Corporate and other bonds | | | 5.5% | | | | 5.9% | | | | 6.1% | | | | 5.2% | | | | 5.8% | | | | 5.7% | |
| Hedge funds | | | 6.0% | | | | 6.2% | | | | — | | | | 5.3% | | | | 4.3% | | | | 8.4% | |
| Property | | | 6.7% | | | | 6.2% | | | | 6.1% | | | | 6.4% | | | | 6.0% | | | | 6.1% | |
| Derivatives | | | 0.0% | | | | 0.0% | | | | 2.5% | | | | 0.0% | | | | 0.0% | | | | 2.5% | |
| Cash and other assets | | | 4.0% | | | | 4.2% | | | | 2.5% | | | | 3.7% | | | | 3.8% | | | | 5.1% | |
| Equity exposure of equity futures | | | 7.7% | | | | 8.0% | | | | — | | | | 7.7% | | | | 8.0% | | | | — | |
| Cash exposure of equity futures | | | 4.0% | | | | 4.2% | | | | — | | | | 4.0% | | | | 4.2% | | | | — | |
| Total fund | | | 6.7% | | | | 6.8% | | | | 7.1% | | | | 6.3% | | | | 6.1% | | | | 6.3% | |
| Post-retirement mortality assumptions (Main scheme) | 2010 | 2009 | 2008 |
| Longevity at age 60 for current pensioners (years) | | | |
| Males | 27.2 | 27.1 | 26.1 |
| Females | 29.6 | 29.5 | 26.9 |
| | | | |
| Longevity at age 60 for future pensioners currently aged 40 (years) | | | |
| Males | 29.3 | 29.2 | 28.1 |
| Females | 30.8 | 30.8 | 28.2 |
Notes on the accounts continued | Financial statements |
| | | | | | | |
| | | 2008 | | | 2007 | | | 2006 | | | 2008 | | | 2007 | | | 2006 | |
| Equities | | | 8.4 | % | | | 8.1 | % | | | 8.1 | % | | | 8.4 | % | | | 8.1 | % | | | 8.1 | % |
| Index-linked bonds | | | 3.9 | % | | | 4.5 | % | | | 4.5 | % | | | 3.9 | % | | | 4.5 | % | | | 4.5 | % |
| Government fixed interest bonds | | | 3.9 | % | | | 4.5 | % | | | 4.5 | % | | | 4.3 | % | | | 4.7 | % | | | 4.5 | % |
| Corporate and other bonds | | | 6.1 | % | | | 5.5 | % | | | 5.3 | % | | | 5.7 | % | | | 5.5 | % | | | 5.3 | % |
| Property | | | 6.1 | % | | | 6.3 | % | | | 6.3 | % | | | 6.1 | % | | | 6.3 | % | | | 6.3 | % |
| Cash and other assets | | | 2.5 | % | | | 4.6 | % | | | 4.6 | % | | | 5.1 | % | | | 4.5 | % | | | 4.4 | % |
4 Pension costscontinued
| Post-retirement mortality assumptions (Main scheme) | | 2008 | | | 2007 | | | 2006 | |
| Longevity at age 60 for current pensioners (years): | | | | | | | | | |
| Males | | | 26.1 | | | | 26.0 | | | | 26.0 | |
| Females | | | 26.9 | | | | 26.8 | | | | 28.9 | |
| | | | | | | | | | | | | |
| Longevity at age 60 for future pensioners (years): | | | | | | | | | | | | |
| Males | | | 28.1 | | | | 28.1 | | | | 26.8 | |
| Females | | | 28.2 | | | | 28.2 | | | | 29.7 | |
| | | Main scheme | | | All schemes | |
| | | Fair value of plan assets £m | | | Present value of defined benefit obligations £m | | | Net pension deficit/ (surplus) £m | | | Fair value of plan assets £m | | | Present value of defined benefit obligations £m | | | Net pension deficit/ (surplus) £m | |
| |
| |
| |
| |
| Changes in value of net pension deficit/(surplus) |
| At 1 January 2009 | | | 14,804 | | | | 15,594 | | | | 790 | | | | 25,756 | | | | 27,752 | | | | 1,996 | |
| Currency translation and other adjustments | | | — | | | | — | | | | — | | | | (699 | ) | | | (813 | ) | | | (114 | ) |
| Income statement | | | | | | | | | | | | | | | | | | | | | | | | |
| Expected return | | | 1,029 | | | | | | | | (1,029 | ) | | | 1,553 | | | | | | | | (1,553 | ) |
| Interest cost | | | | | | | 999 | | | | 999 | | | | | | | | 1,614 | | | | 1,614 | |
| Current service cost | | | | | | | 300 | | | | 300 | | | | | | | | 583 | | | | 583 | |
| Past service cost | | | | | | | 15 | | | | 15 | | | | | | | | 15 | | | | 15 | |
| Gains on curtailments | | | | | | | (1,947 | ) | | | (1,947 | ) | | | | | | | (2,148 | ) | | | (2,148 | ) |
| | | | 1,029 | | | | (633 | ) | | | (1,662 | ) | | | 1,553 | | | | 64 | | | | (1,489 | ) |
| Statement of comprehensive income | | | | | | | | | | | | | | | | | | | | | | | | |
| - Actuarial gains and losses | | | 993 | | | | 4,473 | | | | 3,480 | | | | 1,344 | | | | 5,009 | | | | 3,665 | |
| Contributions by employer | | | 536 | | | | — | | | | (536 | ) | | | 1,153 | | | | — | | | | (1,153 | ) |
| Contributions by plan participants and other scheme members | | | 2 | | | | 2 | | | | — | | | | 15 | | | | 15 | | | | — | |
| Benefits paid | | | (741 | ) | | | (741 | ) | | | — | | | | (1,175 | ) | | | (1,175 | ) | | | — | |
| Expenses included in service cost | | | (20 | ) | | | (20 | ) | | | — | | | | (22 | ) | | | (22 | ) | | | — | |
| At 1 January 2010 | | | 16,603 | | | | 18,675 | | | | 2,072 | | | | 27,925 | | | | 30,830 | | | | 2,905 | |
| Currency translation and other adjustments | | | — | | | | — | | | | — | | | | (206 | ) | | | (206 | ) | | | — | |
| Income statement | | | | | | | | | | | | | | | | | | | | | | | | |
| Expected return | | | 1,114 | | | | | | | | (1,114 | ) | | | 1,428 | | | | | | | | (1,428 | ) |
| Interest cost | | | | | | | 1,091 | | | | 1,091 | | | | | | | | 1,402 | | | | 1,402 | |
| Current service cost | | | | | | | 345 | | | | 345 | | | | | | | | 499 | | | | 499 | |
| Past service cost | | | | | | | 76 | | | | 76 | | | | | | | | 67 | | | | 67 | |
| Gains on curtailments | | | | | | | — | | | | — | | | | | | | | (78 | ) | | | (78 | ) |
| | | | 1,114 | | | | 1,512 | | | | 398 | | | | 1,428 | | | | 1,890 | | | | 462 | |
| Statement of comprehensive income | | | | | | | | | | | | | | | | | | | | | | | | |
| - Actuarial gains and losses | | | 1,718 | | | | 1,674 | | | | (44 | ) | | | 1,797 | | | | 1,639 | | | | (158 | ) |
| Disposal of subsidiaries | | | — | | | | — | | | | — | | | | (7,993 | ) | | | (8,187 | ) | | | (194 | ) |
| Contributions by employer | | | 444 | | | | — | | | | (444 | ) | | | 832 | | | | — | | | | (832 | ) |
| Contributions by plan participants and other scheme members | | | — | | | | — | | | | — | | | | 10 | | | | 10 | | | | — | |
| Benefits paid | | | (716 | ) | | | (716 | ) | | | — | | | | (922 | ) | | | (922 | ) | | | — | |
| Expenses included in service cost | | | (53 | ) | | | (53 | ) | | | — | | | | (55 | ) | | | (55 | ) | | | — | |
| At 31 December 2010 | | | 19,110 | | | | 21,092 | | | | 1,982 | | | | 22,816 | | | | 24,999 | | | | 2,183 | |
| Net pension deficit/(surplus) comprises | 2010 £m | 2009 £m | 2008 £m |
| Net assets of schemes in surplus (included in Prepayments, accrued income and other assets, Note 21) | (105) | (58) | (36) |
| Net liabilities of schemes in deficit | 2,288 | 2,963 | 2,032 |
| | 2,183 | 2,905 | 1,996 |
Notes on the accounts continued | Financial statements |
| | | | | | | |
| | | Fair value of plan assets | | | Present value of defined benefit obligations | | | Net pension deficit/ (surplus) | | | Fair value of plan assets | | | Present value of defined benefit obligations | | | Net pension deficit/ (surplus) | |
| Changes in value of net pension deficit/(surplus) | | | £m | | | | £m | | | | £m | | | | £m | | | | £m | | | | £m | |
| At 1 January 2007 | | | 17,374 | | | | 19,004 | | | | 1,630 | | | | 18,959 | | | | 20,951 | | | | 1,992 | |
| Currency translation and other adjustments | | | — | | | | — | | | | — | | | | 381 | | | | 397 | | | | 16 | |
| Income statement: | | | | | | | | | | | | | | | | | | | | | | | | |
| Expected return | | | 1,182 | | | | | | | | (1,182 | ) | | | 1,394 | | | | | | | | (1,394 | ) |
| Interest cost | | | | | | | 1,007 | | | | 1,007 | | | | | | | | 1,177 | | | | 1,177 | |
| Current service cost | | | | | | | 566 | | | | 566 | | | | | | | | 684 | | | | 684 | |
| Past service cost | | | | | | | 19 | | | | 19 | | | | | | | | 22 | | | | 22 | |
| | | | 1,182 | | | | 1,592 | | | | 410 | | | | 1,394 | | | | 1,883 | | | | 489 | |
| Statement of recognised income and expense: | | | | | | | | | | | | | | | | | | | | | | | | |
| Actuarial gains and losses | | | 163 | | | | (1,937 | ) | | | (2,100 | ) | | | 19 | | | | (2,170 | ) | | | (2,189 | ) |
| Acquisition of subsidiaries | | | — | | | | — | | | | — | | | | 6,997 | | | | 7,173 | | | | 176 | |
| Intra-group transfers | | | 30 | | | | 30 | | | | — | | | | — | | | | — | | | | — | |
| Contributions by employer | | | 416 | | | | — | | | | (416 | ) | | | 599 | | | | — | | | | (599 | ) |
| Contributions by plan participants | | | — | | | | — | | | | — | | | | 5 | | | | 5 | | | �� | — | |
| Benefits paid | | | (551 | ) | | | (551 | ) | | | — | | | | (652 | ) | | | (652 | ) | | | — | |
| Expenses included in service cost | | | (39 | ) | | | (39 | ) | | | — | | | | (40 | ) | | | (40 | ) | | | — | |
| At 1 January 2008 | | | 18,575 | | | | 18,099 | | | | (476 | ) | | | 27,662 | | | | 27,547 | | | | (115 | ) |
| Transfers to disposal groups | | | — | | | | — | | | | — | | | | (1 | ) | | | (49 | ) | | | (48 | ) |
| Currency translation and other adjustments | | | — | | | | — | | | | — | | | | 2,497 | | | | 2,692 | | | | 195 | |
| Income statement: | | | | | | | | | | | | | | | | | | | | | | | | |
| Expected return | | | 1,271 | | | | | | | | (1,271 | ) | | | 1,865 | | | | | | | | (1,865 | ) |
| Interest cost | | | | | | | 1,080 | | | | 1,080 | | | | | | | | 1,622 | | | | 1,622 | |
| Current service cost | | | | | | | 437 | | | | 437 | | | | | | | | 705 | | | | 705 | |
| Past service cost | | | | | | | 21 | | | | 21 | | | | | | | | 28 | | | | 28 | |
| | | | 1,271 | | | | 1,538 | | | | 267 | | | | 1,865 | | | | 2,355 | | | | 490 | |
| Statement of recognised income and expense: | | | | | | | | | | | | | | | | | | | | | | | | |
| Actuarial gains and losses | | | (4,784 | ) | | | (3,389 | ) | | | 1,395 | | | | (6,051 | ) | | | (3,764 | ) | | | 2,287 | |
| Disposal of subsidiaries | | | — | | | | — | | | | — | | | | (31 | ) | | | (34 | ) | | | (3 | ) |
| Contributions by employer | | | 396 | | | | — | | | | (396 | ) | | | 810 | | | | — | | | | (810 | ) |
| Contributions by plan participants | | | — | | | | — | | | | — | | | | 9 | | | | 9 | | | | — | |
| Benefits paid | | | (630 | ) | | | (630 | ) | | | — | | | | (978 | ) | | | (978 | ) | | | — | |
| Expenses included in service cost | | | (24 | ) | | | (24 | ) | | | — | | | | (26 | ) | | | (26 | ) | | | — | |
| At 31 December 2008 | | | 14,804 | | | | 15,594 | | | | 790 | | | | 25,756 | | | | 27,752 | | | | 1,996 | |
The pension charge/(credit) to the income statement comprises:
| | 2010 £m | 2009 £m | 2008 £m |
| Continuing operations | 441 | (1,510) | 473 |
| Discontinued operations | 21 | 21 | 17 |
| | 462 | (1,489) | 490 |
Curtailment gains of £78 million have been recognised in 2010 arising from changes to pension benefits in a subsidiary’s scheme. Curtailment gains of £2,148 million were recognised in 2009 arising from changes to pension benefits in the Main scheme and certain other subsidiaries’ schemes due to the capping of future salary increases that will count for pension purposes to the lower of 2% or the rate of CPI inflation in any year. The curtailment gains in 2009 were separately disclosed on the face of the income statement due to their size.
Net pension deficit comprises: | | | £m | |
Net assets of schemes in surplus (included in Prepayments, accrued income and other assets, Note 19) | | | (36 | ) |
Net liabilities of schemes in deficit | | | 2,032 | |
| | | 1,996 | |
At 31 December 2008,Following the legal separation of ABN AMRO Bank N.V. on 1 April 2010, ABN AMRO’s principal pension scheme in the Netherlands was transferred to the State of the Netherlands. At 31 December 2009, this scheme had fair value of plan assets of £8,181£8,118 million (2007 – £6,417(2008 - £8,181 million) and present value of defined benefit obligations £8,589of £8,298 million (2007 – £6,189(2008 - £8,589 million). The principal actuarial assumptions at 31 December 20082009 were: discount rate 5.4% (2007 –5.25% (2008 - 5.4%); expected return on plan assets (weighted average) 4.7% (2007 – 6.2%5.25% (2008 - 5.25%); rate of increase in salaries 2.5% (2007 –(2008 - 2.5%); rate of increase in pensions in payment 2.0% (2007 –(2008 - 2.0%); and inflation assumption 2.0% (2007 –(2008 - 2.0%).
The Group expects to contribute £807£500 million to its defined benefit pension schemes in 20092011 (Main scheme – £385- £333 million). Of the net liabilities of schemes in deficit, £201£161 million (2007 – £212(2009 - £198 million; 2008 - £201 million) relates to unfunded schemes.
The most recent funding valuation of the Main UK scheme was 31 March 2007. A funding valuation of the Main UK scheme at 31 March 2010 is currently in progress. The scheme trustees and the Group are in discussion on this valuation and the level of contributions to be paid by the Group and expect to reach agreement by 30 June 2011. The Group expects that in addition to estimated contributions of £300 - £350 million for future accrual of benefits, it will make additional contributions, as yet unquantified, in 2011 and subsequent years to improve the funding position of the scheme.
Cumulative net actuarial losses of £4,224 million (2009 - £4,382 million losses; 2008 - £717 million (2007 – £1,570 million gains; 2006 – £619 million losses)gains) have been recognised in the statement of recognisedcomprehensive income, and expense, of which £3,252 million losses (2009 - £3,296 million losses; 2008 - £184 million gains (2007 – £1,579 million gains; 2006 – £521 million losses)gains) relate to the Main scheme.
| | Main scheme | | All schemes |
| History of defined benefit schemes | 2010 £m | 2009 £m | 2008 £m | 2007 £m | 2006 £m | | 2010 £m | 2009 £m | 2008 £m | 2007 £m | 2006 £m |
| Fair value of plan assets | 19,110 | 16,603 | 14,804 | 18,575 | 17,374 | | 22,816 | 27,925 | 25,756 | 27,662 | 18,959 |
Present value of defined benefit obligations | 21,092 | 18,675 | 15,594 | 18,099 | 19,004 | | 24,999 | 30,830 | 27,752 | 27,547 | 20,951 |
| Net deficit/(surplus) | 1,982 | 2,072 | 790 | (476) | 1,630 | | 2,183 | 2,905 | 1,996 | (115) | 1,992 |
| | | | | | | | | | | | |
| | | | | | | | | | | | |
Experience (losses)/gains on plan liabilities | (858) | 135 | (55) | (256) | (4) | | (882) | 328 | (65) | (210) | (19) |
Experience gains/(losses) on plan assets | 1,718 | 993 | (4,784) | 163 | 552 | | 1,797 | 1,344 | (6,051) | 19 | 587 |
Actual return/(loss) on pension schemes assets | 2,832 | 2,022 | (3,513) | 1,345 | 1,574 | | 3,225 | 2,897 | (4,186) | 1,413 | 1,660 |
Actual return/(loss) on pension schemes assets - % | 17.2% | 13.8% | (19.0%) | 7.8% | 9.9% | | 15.6% | 11.4% | (14.5%) | 6.9% | 9.6% |
Notes on the accounts continued | Financial statements |
4 Pension costs (continued)continued | | | | | | | |
| History of defined benefit schemes | | | 2008 £m | | | | 2007 £m | | | | 2006 £m | | | | 2005 £m | | | | 2004 £m | | | | 2008 £m | | | | 2007 £m | | | | 2006 £m | | | | 2005 £m | | | | 2004 £m | |
| Fair value of plan assets | | | 14,804 | | | | 18,575 | | | | 17,374 | | | | 15,914 | | | | 13,569 | | | | 25,756 | | | | 27,662 | | | | 18,959 | | | | 17,388 | | | | 14,798 | |
| Present value of defined benefit obligations | | | 15,594 | | | | 18,099 | | | | 19,004 | | | | 19,118 | | | | 16,051 | | | | 27,752 | | | | 27,547 | | | | 20,951 | | | | 21,123 | | | | 17,738 | |
| Net (deficit)/surplus | | | (790 | ) | | | 476 | | | | (1,630 | ) | | | (3,204 | ) | | | (2,482 | ) | | | (1,996 | ) | | | 115 | | | | (1,992 | ) | | | (3,735 | ) | | | (2,940 | ) |
| Experience losses on plan liabilities | | | (55 | ) | | | (256 | ) | | | (4 | ) | | | (41 | ) | | | (624 | ) | | | (65 | ) | | | (210 | ) | | | (19 | ) | | | (68 | ) | | | (631 | ) |
| Experience gains on plan assets | | | (4,784 | ) | | | 163 | | | | 552 | | | | 1,556 | | | | 392 | | | | (6,051 | ) | | | 19 | | | | 587 | | | | 1,661 | | | | 408 | |
| Actual return on pension schemes assets | | | (3,513 | ) | | | 1,345 | | | | 1,574 | | | | 2,486 | | | | 1,230 | | | | (4,186 | ) | | | 1,413 | | | | 1,660 | | | | 2,677 | | | | 1,328 | |
The table below sets out the sensitivities of the pension cost for the year and the present value of detaileddefined benefit obligations at the balance sheet dates31 December to a change in the principal actuarial assumptions:
| | | | | | | |
| | | | | | | |
| | | in pension cost for the year | | | in obligation at 31 December | | | in pension cost for the year | | | in obligation at 31 December | |
| | | 2008 | | | 2007 | | | 2008 | | | 2007 | | | 2008 | | | 2007 | | | 2008 | | | 2007 | |
| | | | £m | | | | £m | | | | £m | | | | £m | | | | £m | | | | £m | | | | £m | | | | £m | |
| 25 bps increase in the discount rate | | | (37 | ) | | | (41 | ) | | | (696 | ) | | | (874 | ) | | | (53 | ) | | | (49 | ) | | | (1,161 | ) | | | (1,318 | ) |
| 25 bps increase in inflation | | | 77 | | | | 83 | | | | 624 | | | | 800 | | | | 114 | | | | 98 | | | | 1,089 | | | | 1,245 | |
| 25 bps additional rate of increase in pensions in payment | | | 41 | | | | 43 | | | | 383 | | | | 461 | | | | 63 | | | | 51 | | | | 695 | | | | 760 | |
| 25 bps additional rate of increase in deferred pensions | | | 8 | | | | 5 | | | | 94 | | | | 113 | | | | 15 | | | | 7 | | | | 227 | | | | 239 | |
| 25 bps additional rate of increase in salaries | | | 28 | | | | 35 | | | | 168 | | | | 216 | | | | 35 | | | | 40 | | | | 219 | | | | 265 | |
| Longevity increase of 1 year | | | 31 | | | | 31 | | | | 302 | | | | 390 | | | | 50 | | | | 37 | | | | 700 | | | | 761 | |
| | Main scheme | | All schemes |
| | Increase/(decrease) | | Increase/(decrease) |
| | in pension cost for year | | in obligation at 31 December | | in pension cost for year | | in obligation at 31 December |
| | 2010 | 2009 | 2008 | | 2010 | 2009 | 2008 | | 2010 | 2009 | 2008 | | 2010 | 2009 | 2008 |
| | £m | £m | £m | | £m | £m | £m | | £m | £m | £m | | £m | £m | £m |
| 0.25% increase in the discount rate | (17) | (21) | (37) | | (925) | (790) | (696) | | (42) | (41) | (53) | | (1,245) | (1,261) | (1,161) |
| 0.25% increase in inflation | 59 | 49 | 77 | | 799 | 654 | 624 | | 89 | 93 | 114 | | 1,106 | 1,143 | 1,089 |
0.25% additional rate of increase in pensions in payment | 37 | 33 | 41 | | 527 | 442 | 383 | | 43 | 47 | 63 | | 599 | 596 | 695 |
0.25% additional rate of increase in deferred pensions | 21 | 16 | 8 | | 265 | 214 | 94 | | 44 | 25 | 15 | | 497 | 366 | 227 |
0.25% additional rate of increase in salaries | 6 | 8 | 28 | | 56 | 66 | 168 | | 30 | 17 | 35 | | 270 | 125 | 219 |
| Longevity increase of 1 year | 34 | 29 | 31 | | 519 | 416 | 302 | | 59 | 50 | 50 | | 781 | 734 | 700 |
Amounts paid to the company’sGroup's auditors for statutory audit and other services were as follows:are set out below. All audit related and other services are approved by the Audit Committee and are subject to strict controls to ensure the external auditor’s independence is unaffected by the provision of other services. The Audit Committee recognise that for certain assignments the auditors are best placed to perform the work economically; for other work the Group selects the supplier best placed to meet its requirements. The Group’s auditors are permitted to tender for such work in competition with other firms where the work is permissible under audit independence rules.
| | Group |
| | 2010 | 2009 |
| | £m | £m |
| Audit services | | |
- statutory audit (1) | 30.0 | 41.3 |
- audit related including regulatory reporting (2) | 3.2 | 3.3 |
| | 33.2 | 44.6 |
| Tax services | | |
| - compliance services | 0.3 | 1.1 |
| - advisory services | 0.2 | 0.3 |
| | 0.5 | 1.4 |
All other services (3) | 9.3 | 7.5 |
| Total | 43.0 | 53.5 |
| | | Group | |
| | | 2008 | | | 2007 | |
| | | | £m | | | | £m | |
| Audit Services | | | | | | | | |
– Statutory audit (1) | | | 44.1 | | | | 20.4 | |
| – Audit related including regulatory reporting | | | 3.1 | | | | 1.4 | |
| | | | 47.2 | | | | 21.8 | |
| Tax Services | | | | | | | | |
| – Compliance services | | | 0.3 | | | | 0.2 | |
| – Advisory services | | | 0.3 | | | | 0.2 | |
| | | | 0.6 | | | | 0.4 | |
| All other services | | | 10.9 | | | | 9.0 | |
| Total | | | 58.7 | | | | 31.2 | |
| (1) | IncludesThe prior year fees of £23.1include £21.9 million (2007 – nil) in respect of the audit of ABN AMRO HoldingHoldings N.V. Deloitte were appointed, of which £8.8 million related to the interests of the State of the Netherlands and Santander. |
| (2) | Includes fees of £1.2 million (2009 - £1.7 million) in relation to reviews of interim financial information and £2.0 million (2009 - £1.6 million) in respect of reports to the Group's regulators in the UK and overseas. |
| (3) | Includes fees of £0.5 million (2009 - £2.1 million) in respect of work performed by the auditors as auditorsreporting accountants on debt and equity issuances undertaken by the Group, including securitisations and fees of ABN AMRO£2.9 million (2009 - nil) in 2008. In 2007, fees paid to Ernst & Young forrespect of audit and assurance of financial information in connection with disposals by the audit of ABN AMRO Holding N.V. were £33.9 million. These fees are not included above.Group. |
6 TaxNotes on the accounts continued | Financial statements |
| | | Group | |
| | | 2008 | | | 2007 | | | 2006 | |
| | | | £m | | | | £m | | | | £m | |
| Current taxation: | | | | | | | | | | | | |
| Charge for the year | | | 1,230 | | | | 2,514 | | | | 2,626 | |
| Over provision in respect of prior periods | | | (254 | ) | | | (39 | ) | | | (253 | ) |
| Relief for overseas taxation | | | (34 | ) | | | (198 | ) | | | (147 | ) |
| | | | 942 | | | | 2,277 | | | | 2,226 | |
| Deferred taxation: | | | | | | | | | | | | |
| (Credit)/charge for the year | | | (3,167 | ) | | | 95 | | | | 396 | |
| (Under)/over provision in respect of prior periods | | | (98 | ) | | | (328 | ) | | | 67 | |
| Tax (credit)/charge for the year | | | (2,323 | ) | | | 2,044 | | | | 2,689 | |
| | Group |
| | 2010 | 2009 | 2008 |
| | £m | £m | £m |
| Current tax | | | |
| Charge for the year | (251) | (494) | (1,386) |
| Over provision in respect of prior periods | 41 | 191 | 254 |
| Relief for overseas tax | — | — | 34 |
| | (210) | (303) | (1,098) |
| Deferred tax | | | |
| (Charge)/credit for the year | (738) | 1,041 | 3,167 |
| Over/(under) provision in respect of prior periods | 314 | (309) | 98 |
| Tax (charge)/credit for the year | (634) | 429 | 2,167 |
The actual tax charge(charge)/credit differs from the expected tax chargecredit computed by applying the standard rate of UK corporation tax of 28.5% (2007 – 30%28% (2009 - 28%; 2006 – 30%2008 - 28.5%) as follows:
| | | 2008 | | | 2007 | | | 2006 | | 2010 | 2009 | 2008 |
| | | | £m | | | | £m | | | | £m | | £m | £m |
| Expected tax (credit)/charge | | (11,590 | ) | | | 2,950 | | | | 2,756 | | |
| Expected tax credit | | 112 | 741 | 7,322 |
| Non-deductible goodwill impairment | | 8,292 | | | | 12 | | | | — | | (3) | (102) | (3,826) |
| Unrecognised timing differences | | 274 | | | | 29 | | | | — | | 11 | 274 | (274) |
| Other non-deductible items | | 330 | | | | 222 | | | | 288 | | |
| Items not allowed for tax | | |
| - losses on strategic disposals and write-downs | | (311) | (152) | (108) |
| - other | | (328) | (356) | (270) |
| Non-taxable items | | (491 | ) | | | (595 | ) | | | (251 | ) | | |
| - gain on sale of Global Merchant Services | | 221 | — |
| - gain on redemption of own debt | | 11 | 693 | — |
| - other | | 341 | 410 | 491 |
| Taxable foreign exchange movements | | 80 | | | | 16 | | | | 5 | | 4 | 1 | (80) |
| Foreign profits taxed at other rates | | 203 | | | | (25 | ) | | | 63 | | (517) | (276) | (509) |
| Reduction in deferred tax liability following change in the rate of UK corporation tax | | — | | | | (189 | ) | | | — | | |
| Losses in year not recognised | | 942 | | | | 2 | | | | — | | |
| UK tax rate change - deferred tax impact | | (82) | — |
| Losses in year where no deferred tax asset recognised | | (450) | (780) | (942) |
| Losses brought forward and utilised | | (11 | ) | | | (11 | ) | | | 14 | | 2 | 94 | 11 |
Adjustments in respect of prior periods (1) | | (352 | ) | | | (367 | ) | | | (186 | ) | |
| Actual tax (credit)/charge | | | (2,323 | ) | | | 2,044 | | | | 2,689 | | |
Adjustments in respect of prior years (1) | | 355 | (118) | 352 |
| Actual tax (charge)/credit | | (634) | 429 | 2,167 |
| (1) | Prior year tax adjustments include releases of tax provisions in respect of structured transactions and investment disposals, and adjustments to reflect submitted tax computations in the UK and overseas. |
(1) Prior period tax adjustments principally comprise releases of tax provisions in respect of structured transactions and investment disposals, and adjustments to reflect submitted tax computations in the UK and overseas.
| (2) | In the Budget on 22 June 2010, the UK Government proposed, amongst other things, to reduce Corporation Tax rates in four annual decrements of 1% with effect from 1 April 2011. The first decrement was enacted in the Finance (No 2) Act 2010 and as a consequence the closing deferred tax assets and liabilities have been recognised at an effective rate of 27%. The impact of this change on the tax charge for the year is set out in the table above. |
The effective tax rate for the year was 5.7% (2007 – 20.8%; 2006 – 29.3%). The deferred tax credit is net of £210 million deferred tax expense arising from the write-down of the carrying value of previously recognised deferred tax assets.
| | | Group | | Group |
| | | 2008 | | | 2007 | | | 2006 | | 2010 £m | 2009 £m | 2008 £m |
| | | | £m | | | | £m | | | | £m | | |
| Dividends paid to other owners: | | | | | | | | | | | | | |
| Preference shareholders | | |
| Non-cumulative preference shares of US$0.01 | | 293 | | | 152 | | | 99 | | 105 | 342 | 293 |
| Non-cumulative preference shares of €0.01 | | 183 | | | 94 | | | 92 | | — | 201 | 183 |
| Non-cumulative preference shares of £1 | | 60 | | | — | | | — | | | |
- issued to UK Financial Investments Limited (1) | | — | 274 | — |
| - other | | — | 61 | 60 |
| | | |
| Paid-in equity holders | | | |
| Interest on securities classified as equity, net of tax | | 60 | | | — | | | — | | 19 | 57 | 60 |
| Total | | | 596 | | | 246 | | | 191 | | 124 | 935 | 596 |
Note:
| (1) | Includes £50 million redemption premium on repayment of preference shares. |
Notes on the accounts continued | Financial statements |
8 Ordinary dividends
(1)The company did not pay an ordinary dividend in 2010 or 2009. In accordance with IAS 32, certain preference share issued by2008, the company are included in subordinated liabilities and the related finance cost in interest payable.
(2) Between 1 January 2009 and the date of approval of these accounts, dividends amounting to US$163 million have been declaredpaid a final dividend, in respect of equity preference shares for payment on 31 March 2009.
Prior year2007, of 19.3p per ordinary dividends per share in the table below have been restated(restated for the effect of the rights issue in June 2008 and the capitalisation issue in September 2008.
| | | Group | |
| | | 2008 | | | 2007 | | | 2006 | | | 2008 | | | 2007 | | | 2006 | |
| | | p per share | | | p per share | | | p per share | | | | £m | | | | £m | | | | £m | |
| Final dividend for previous year declared during the current year | | | 19.3 | | | | 18.5 | | | | 14.8 | | | | 2,312 | | | | 2,091 | | | | 1,699 | |
| Interim dividend | | | — | | | | 8.5 | | | | 6.8 | | | | — | | | | 953 | | | | 771 | |
| Total dividends paid on ordinary equity shares | | | 19.3 | | | | 27.0 | | | | 21.6 | | | | 2,312 | | | | 3,044 | | | | 2,470 | |
9 Profit dealt with in the accounts of the company
As permitted by section 230(3)408(3) of the Companies Act 1985,2006, the primary financial statements of the company do not include an income statement.statement or statement of comprehensive income. Condensed information is set out below:
| | | Company | | |
| | | 2008 | | | 2007 | | | 2006 | | |
| | | | £m | | | | £m | | | | £m | | |
| Income statement | | 2010 £m | 2009 £m | 2008 £m |
| Dividends received from banking subsidiary | | 4,639 | | | 2,330 | | | 3,502 | | 60 | 2,523 | 4,639 |
| Dividends received from other subsidiaries | | 163 | | | 415 | | | 229 | | 24 | 408 | 163 |
| Gain on redemption of own debt | | 53 | 238 | — |
| Total income | | 4,802 | | | 2,745 | | | 3,731 | | 137 | 3,169 | 4,802 |
| Interest receivable from subsidiaries | | 793 | | | 460 | | | 516 | | 1,042 | 997 | 793 |
| Interest payable to subsidiaries | | (495 | ) | | (307 | ) | | (246 | ) | (263) | (251) | (495) |
| Other net interest payable and operating expenses | | (796 | ) | | (526 | ) | | (515 | ) | (263) | (62) | (796) |
| Write-down of investments in subsidiaries | | (14,321 | ) | | — | | | — | | (5,124) | (5,139) | (14,321) |
| Operating (loss)/profit before tax | | (10,017 | ) | | 2,372 | | | 3,486 | | |
| Tax | | 415 | | | 127 | | | 13 | | |
| (Loss)/profit for the year | | | (9,602 | ) | | 2,499 | | | 3,499 | | |
| Operating loss before tax | | (4,471) | (1,286) | (10,017) |
| Tax (charge)/credit | | (83) | (217) | 415 |
| Loss for the year | | (4,554) | (1,503) | (9,602) |
| | | | | | | | | | | | | | |
| (Loss)/profit attributable to: | | | | | | | | | | | | | |
| Ordinary shareholders | | (10,198 | ) | | 2,253 | | | 3,308 | | |
| Other owners | | 596 | | | 246 | | | 191 | | |
| Loss attributable to: | | | |
| Preference shareholders | | 105 | 878 | 536 |
| Paid-in equity holders | | 19 | 57 | 60 |
| Ordinary and B shareholders | | (4,678) | (2,438) | (10,198) |
| | | | (9,602 | ) | | 2,499 | | | 3,499 | | (4,554) | (1,503) | (9,602) |
| Statement of comprehensive income | 2010 £m | 2009 £m | 2008 £m |
| Loss for the year | (4,554) | (1,503) | (9,602) |
| Other comprehensive income | | | |
| Cash flow hedges | 1 | 3 | 2 |
| Tax on comprehensive income | — | — | (1) |
| Other comprehensive income for the year, net of tax | 1 | 3 | 1 |
| Total comprehensive loss for the year | (4,553) | (1,500) | (9,601) |
| | | | |
| Attributable to: | | | |
| Preference shareholders | 105 | 878 | 536 |
| Paid-in equity holders | 19 | 57 | 60 |
| Ordinary and B shareholders | (4,677) | (2,435) | (10,197) |
| Total comprehensive loss for the year | (4,553) | (1,500) | (9,601) |
Notes on the accounts continued | Financial statements |
The earningsEarnings per ordinary and B share arehave been calculated based on the following:
| | Group |
| | 2010 £m | 2009 £m | 2008 £m |
| Earnings | | | |
| Loss attributable to ordinary and B shareholders | (1,125) | (3,607) | (24,306) |
| Loss from discontinued operations attributable to ordinary and B shareholders | 28 | 72 | 86 |
| Gain on redemption of preference shares and paid-in equity | 610 | 200 | — |
| Loss from continuing operations attributable to ordinary and B shareholders | (487) | (3,335) | (24,220) |
| | | | |
| Weighted average number of shares (millions) | | | |
| Ordinary shares in issue during the year | 56,245 | 51,494 | 16,563 |
| B shares in issue during the year | 51,000 | 1,397 | — |
Weighted average number of ordinary and B shares in issue during the year (1) | 107,245 | 52,891 | 16,563 |
| | | Company | |
| | | 2008 | | | 2007 | | | 2006 | |
| | | | £m | | | | £m | | | | £m | |
| Earnings: | | | | | | | | | | | | |
| (Loss)/profit attributable to ordinary shareholders | | | (24,137 | ) | | | 7,303 | | | | 6,202 | |
| Add back finance cost on dilutive convertible securities | | | — | | | | 60 | | | | 64 | |
| Diluted earnings attributable to ordinary shareholders | | | (24,137 | ) | | | 7,363 | | | | 6,266 | |
| | | Number of shares - millions | |
| Number of ordinary shares: | | | | | | | | | |
| Weighted average number of ordinary shares in issue during the year | | | 16,563 | | | | 11,413 | | | | 11,411 | |
| Effect of dilutive share options and convertible securities | | | — | | | | 198 | | | | 208 | |
| Diluted weighted average number of ordinary shares during the year | | | 16,563 | | | | 11,611 | | | | 11,619 | |
| (1) | Following reconsideration of the terms of the B share subscription agreement with HM Treasury, it is no longer treated as dilutive. The comparative amount for the year ended 31 December 2009 has been restated. |
The numbersnumber of ordinary shares in issue in prior years have been2008 was adjusted retrospectively for the bonus element of the rights issue completed in June 2008 and the capitalisation issue in September 2008. None of the convertible securities had a dilutive effect in 2010, 2009 or 2008. All convertible securities had a dilutive effect in 2007 and 2006 and have been included in the computation of diluted earnings per share.
The effect of discontinued operations on earnings per share is not material.
Notes on the accounts continued | Financial statements |
11 Financial instruments
Classification - classification
The following tables analyse the Group’s financial assets and financial liabilities in accordance with the categories of financial instruments in IAS 39. Assets and liabilities outside the scope of IAS 39 are shown separately.
| | | Group | | Group |
| | | Held-for-trading | | | Designated as at fair value through profit or loss | | | Hedging derivatives | | | Available-for-sale | | | Loans and receivables | | | Other (amortised cost) | | | Finance leases | | | Non financial assets/ liabilities | | | Total | | Held-for- trading | Designated as at fair value through profit or loss | Hedging derivatives | Available- for-sale | Loans and receivables | Other financial instruments (amortised cost) | Finance leases | Non financial assets/ liabilities | Total |
| 2008 | | | £m | | | | £m | | | | £m | | | | £m | | | | £m | | | | £m | | | | £m | | | | £m | | | | £m | | |
| 2010 | | £m | £m |
| Assets | | | | | | | | | | | | | | | | | | | | | | | | | | | | | | | | | | | | | |
| Cash and balances at central banks | | — | | | — | | | | | | | — | | | 12,400 | | | | | | | — | | | | | | | 12,400 | | — | | — | 57,014 | | 57,014 |
Loans and advances to banks (1) | | 56,234 | | | — | | | | | | | — | | | 81,963 | | | | | | | — | | | | | | | 138,197 | | |
Loans and advances to customers (2, 3) | | 51,501 | | | 2,141 | | | | | | | — | | | 806,627 | | | | | | | 14,453 | | | | | | | 874,722 | | |
Debt securities (4) | | 116,280 | | | 5,428 | | | | | | | 132,856 | | | 12,985 | | | | | | | — | | | | | | | 267,549 | | |
| - reverse repos | | 38,215 | — | | — | 4,392 | | 42,607 |
- other (1) | | 26,082 | — | | — | 31,829 | | 57,911 |
| Loans and advances to customers | | |
| - reverse repos | | 41,110 | — | | — | 11,402 | | 52,512 |
- other (2) | | 19,903 | 1,100 | | — | 471,308 | | 10,437 | | 502,748 |
| Debt securities | | 98,869 | 402 | | 111,130 | 7,079 | | 217,480 |
| Equity shares | | 17,054 | | | 2,101 | | | | | | | 7,175 | | | — | | | | | | | — | | | | | | | 26,330 | | 19,186 | 1,013 | | 1,999 | — | | 22,198 |
| Settlement balances | | — | | | — | | | | | | | — | | | 17,832 | | | | | | | — | | | | | | | 17,832 | | — | | — | 11,605 | | 11,605 |
| Derivatives | | 985,700 | | | — | | | 6,859 | | | — | | | — | | | | | | | — | | | | | | | 992,559 | | 421,648 | | 5,429 | | — | | 427,077 |
| Intangible assets | | — | | | — | | | | | | | — | | | | | | | | | | | — | | | 20,049 | | | 20,049 | | | 14,448 |
| Property, plant and equipment | | — | | | — | | | | | | | — | | | | | | | | | | | | | | | 18,949 | | | 18,949 | | | 16,543 |
| Deferred taxation | | — | | | — | | | | | | | — | | | — | | | | | | | — | | | 7,082 | | | 7,082 | | |
| Deferred tax | | | 6,373 |
| Prepayments, accrued income and other assets | | — | | | — | | | | | | | — | | | 1,326 | | | | | | | | | | | 23,076 | | | 24,402 | | — | | — | 1,306 | | | 11,270 | 12,576 |
| Assets of disposal groups | | — | | | — | | | | | | | — | | | | | | | | | | | | | | | 1,581 | | | 1,581 | | | | | 12,484 |
| | | | 1,226,769 | | | 9,670 | | | 6,859 | | | 140,031 | | | 933,133 | | | | | | | 14,453 | | | 70,737 | | | 2,401,652 | | 665,013 | 2,515 | 5,429 | 113,129 | 595,935 | | 10,437 | 61,118 | 1,453,576 |
| | | |
| Liabilities | | | | | | | | | | | | | | | | | | | | | | | | | | | | | | | | | | | | | |
Deposits by banks (5) | | 81,154 | | | — | | | | | | | | | | | | | | | 176,890 | | | — | | | | | | | 258,044 | | |
Customer accounts (6, 7) | | 55,926 | | | 8,054 | | | | | | | | | | | | | | | 575,532 | | | — | | | | | | | 639,512 | | |
Debt securities in issue (8, 9) | | 3,992 | | | 47,451 | | | | | | | | | | | | | | | 248,846 | | | — | | | | | | | 300,289 | | |
| Settlement balances and short positions | | 42,536 | | | — | | | | | | | | | | | | | | | 11,741 | | | — | | | | | | | 54,277 | | |
| Deposits by banks | | |
| - repos | | 20,585 | — | | 12,154 | | 32,739 |
- other (3) | | 28,216 | — | | 37,835 | | 66,051 |
| Customer accounts | | |
| - repos | | 53,031 | — | | 29,063 | | 82,094 |
- other (4) | | 14,357 | 4,824 | | 409,418 | | 428,599 |
Debt securities in issue (5,6) | | 7,730 | 43,488 | | 167,154 | | 218,372 |
| Settlement balances | | — | | 10,991 | | 10,991 |
| Short positions | | 43,118 | — | | 43,118 |
| Derivatives | | 963,088 | | | — | | | 8,276 | | | | | | | | | | | — | | | — | | | | | | | 971,364 | | 419,103 | | 4,864 | | 423,967 |
| Accruals, deferred income and other liabilities | | 260 | | | — | | | | | | | | | | | | | | | 1,619 | | | 22 | | | 29,581 | | | 31,482 | | — | | 1,793 | 458 | 20,838 | 23,089 |
| Retirement benefit liabilities | | | | | | | | | | | | | | | | | | | | | | | | | | | | | | 2,032 | | | 2,032 | | | 2,288 |
| Deferred taxation | | | | | | | | | | | | | | | | | | | | | | | | | | | | | | 4,165 | | | 4,165 | | |
| Deferred tax | | | 2,142 |
| Insurance liabilities | | | | | | | | | | | | | | | | | | | | | | | | | | | | | | 9,976 | | | 9,976 | | | 6,794 |
| Subordinated liabilities | | — | | | 1,509 | | | | | | | | | | | | | | | 47,645 | | | — | | | — | | | 49,154 | | — | 1,129 | | 25,924 | | 27,053 |
| Liabilities of disposal groups | | | | | | — | | | | | | | | | | | | | | | — | | | — | | | 859 | | | 859 | | | 9,428 |
| | | | 1,146,956 | | | 57,014 | | | 8,276 | | | | | | | | | | | 1,062,273 | | | 22 | | | 46,613 | | | | 2,321,154 | | 586,140 | 49,441 | 4,864 | | 694,332 | 458 | 41,490 | 1,376,725 |
| Equity | | | | | | | | | | | | | | | | | | | | | | | | | | | | | | | | | | 80,498 | | | 76,851 |
| | | | | | | | | | | | | | | | | | | | | | | | | | | | | | | | | | | | 2,401,652 | | | 1,453,576 |
For notes relating to this table refer to page 244.
| | | Group | |
| | | Held-for-trading | | | Designated as at fair value through profit or loss | | | Hedging derivatives | | | Available-for-sale | | | Loans and receivables | | | Other (amortised cost) | | | Finance leases | | | Non financial assets/ liabilities | | | Total | |
| 2007 | | | £m | | | | £m | | | | £m | | | | £m | | | | £m | | | | £m | | | | £m | | | | £m | | | | £m | |
| Assets | | | | | | | | | | | | | | | | | | | | | | | | | | | | | | | | | | | | |
| Cash and balances at central banks | | | — | | | | — | | | | | | | | — | | | | 17,866 | | | | | | | | — | | | | | | | | 17,866 | |
Loans and advances to banks (1) | | | 71,639 | | | | — | | | | | | | | — | | | | 147,821 | | | | | | | | — | | | | | | | | 219,460 | |
Loans and advances to customers (2, 3) | | | 103,811 | | | | 3,067 | | | | | | | | — | | | | 709,090 | | | | | | | | 12,570 | | | | | | | | 828,538 | |
Debt securities (4) | | | 190,671 | | | | 5,777 | | | | | | | | 95,536 | | | | 2,672 | | | | | | | | — | | | | | | | | 294,656 | |
| Equity shares | | | 37,546 | | | | 7,866 | | | | | | | | 7,614 | | | | — | | | | | | | | — | | | | | | | | 53,026 | |
| Settlement balances | | | — | | | | — | | | | | | | | — | | | | 16,589 | | | | | | | | — | | | | | | | | 16,589 | |
| Derivatives | | | 274,849 | | | | — | | | | 2,553 | | | | — | | | | — | | | | | | | | — | | | | | | | | 277,402 | |
| Intangible assets | | | | | | | | | | | | | | | | | | | | | | | | | | | | | | | 49,916 | | | | 49,916 | |
| Property, plant and equipment | | | | | | | | | | | | | | | | | | | | | | | | | | | | | | | 18,745 | | | | 18,745 | |
| Deferred taxation | | | — | | | | — | | | | — | | | | — | | | | — | | | | — | | | | — | | | | 3,119 | | | | 3,119 | |
| Prepayments, accrued income and other assets | | | — | | | | — | | | | | | | | — | | | | 877 | | | | | | | | — | | | | 14,785 | | | | 15,662 | |
| Assets of disposal groups | | | | | | | | | | | | | | | | | | | | | | | | | | | | | | | 45,850 | | | | 45,850 | |
| | | | 678,516 | | | | 16,710 | | | | 2,553 | | | | 103,150 | | | | 894,915 | | | | | | | | 12,570 | | | | 132,415 | | | | 1,840,829 | |
| Liabilities | | | | | | | | | | | | | | | | | | | | | | | | | | | | | | | | | | | | |
Deposits by banks (5) | | | 65,491 | | | | — | | | | | | | | | | | | | | | | 246,803 | | | | — | | | | | | | | 312,294 | |
Customer accounts (6, 7) | | | 60,426 | | | | 7,505 | | | | | | | | | | | | | | | | 614,432 | | | | — | | | | | | | | 682,363 | |
Debt securities in issue (8, 9) | | | 9,455 | | | | 41,834 | | | | | | | | | | | | | | | | 222,883 | | | | — | | | | | | | | 274,172 | |
| Settlement balances and short positions | | | 73,501 | | | | — | | | | | | | | | | | | | | | | 17,520 | | | | — | | | | | | | | 91,021 | |
| Derivatives | | | 269,343 | | | | — | | | | 2,709 | | | | | | | | | | | | — | | | | — | | | | | | | | 272,052 | |
| Accruals, deferred income and other liabilities | | | 209 | | | | — | | | | | | | | | | | | | | | | 1,545 | | | | 19 | | | | 32,435 | | | | 34,208 | |
| Retirement benefit liabilities | | | | | | | | | | | | | | | | | | | | | | | | | | | | | | | 460 | | | | 460 | |
| Deferred taxation | | | | | | | | | | | | | | | | | | | | | | | | | | | | | | | 5,400 | | | | 5,400 | |
| Insurance liabilities | | | | | | | | | | | | | | | | | | | | | | | | | | | | | | | 10,162 | | | | 10,162 | |
| Subordinated liabilities | | | — | | | | 897 | | | | | | | | | | | | | | | | 37,146 | | | | — | | | | — | | | | 38,043 | |
| Liabilities of disposal groups | | | | | | | | | | | | | | | | | | | | | | | | | | | | | | | 29,228 | | | | 29,228 | |
| | | | 478,425 | | | | 50,236 | | | | 2,709 | | | | | | | | | | | | 1,140,329 | | | | 19 | | | | 77,685 | | | | 1,749,403 | |
| Equity | | | | | | | | | | | | | | | | | | | | | | | | | | | | | | | | | | | 91,426 | |
| | | | | | | | | | | | | | | | | | | | | | | | | | | | | | | | | | | | 1,840,829 | |
Notes on the accounts continued | Financial statements |
| | Group |
| | Held-for- trading | Designated as at fair value through profit or loss | Hedging derivatives | Available- for-sale | Loans and receivables | Other financial instruments (amortised cost) | Finance leases | Non financial assets/ liabilities | Total |
| 2009 | £m | £m | £m | £m | £m | £m | £m | £m | £m |
| Assets | | | | | | | | | |
| Cash and balances at central banks | — | — | | — | 52,261 | | | | 52,261 |
| Loans and advances to banks | | | | | | | | | |
| - reverse repos | 26,886 | — | | — | 8,211 | | | | 35,097 |
- other (1) | 18,563 | — | | — | 38,093 | | | | 56,656 |
| Loans and advances to customers | | | | | | | | | |
| - reverse repos | 26,313 | — | | — | 14,727 | | | | 41,040 |
- other (2) | 15,964 | 1,981 | | — | 656,310 | | 13,098 | | 687,353 |
| Debt securities | 111,482 | 2,603 | | 143,298 | 9,871 | | | | 267,254 |
| Equity shares | 14,443 | 2,192 | | 2,893 | — | | | | 19,528 |
| Settlement balances | — | — | | — | 12,033 | | | | 12,033 |
| Derivatives | 436,857 | | 4,597 | | | | | | 441,454 |
| Intangible assets | | | | | | | | 17,847 | 17,847 |
| Property, plant and equipment | | | | | | | | 19,397 | 19,397 |
| Deferred tax | | | | | | | | 7,039 | 7,039 |
Prepayments, accrued income and other assets | — | — | | — | 1,421 | | | 19,564 | 20,985 |
| Assets of disposal groups | | | | | | | | 18,542 | 18,542 |
| | 650,508 | 6,776 | 4,597 | 146,191 | 792,927 | | 13,098 | 82,389 | 1,696,486 |
| | | | | | | | | | |
| Liabilities | | | | | | | | | |
| Deposits by banks | | | | | | | | | |
| - repos | 20,962 | — | | | | 17,044 | | | 38,006 |
- other (3) | 32,647 | — | | | | 71,491 | | | 104,138 |
| Customer accounts | | | | | | | | | |
| - repos | 41,520 | — | | | | 26,833 | | | 68,353 |
- other (4) | 11,348 | 8,580 | | | | 525,921 | | | 545,849 |
Debt securities in issue (5,6) | 3,925 | 41,537 | | | | 222,106 | | | 267,568 |
| Settlement balances | — | — | | | | 10,413 | | | 10,413 |
| Short positions | 40,463 | — | | | | | | | 40,463 |
| Derivatives | 417,634 | | 6,507 | | | | | | 424,141 |
Accruals, deferred income and other liabilities | — | — | | | | 1,889 | 467 | 27,971 | 30,327 |
| Retirement benefit liabilities | | | | | | | | 2,963 | 2,963 |
| Deferred tax | | | | | | | | 2,811 | 2,811 |
| Insurance liabilities | | | | | | | | 10,281 | 10,281 |
| Subordinated liabilities | — | 1,277 | | | | 36,375 | | | 37,652 |
| Liabilities of disposal groups | | | | | | | | 18,890 | 18,890 |
| | 568,499 | 51,394 | 6,507 | | | 912,072 | 467 | 62,916 | 1,601,855 |
| Equity | | | | | | | | | 94,631 |
| | | | | | | | | | 1,696,486 |
For notes relating to this table refer to page 244.
Notes on the accounts continued | Financial statements |
11 Financial instruments - classification continued
| | Group |
| | Held-for- trading | Designated as at fair value through profit or loss | Hedging derivatives | Available- for-sale | Loans and receivables | Other financial instruments (amortised cost) | Finance leases | Non financial assets/ liabilities | Total |
| 2008 | £m | £m | £m | £m | £m | £m | £m | £m | £m |
| Assets | | | | | | | | | |
| Cash and balances at central banks | — | — | | — | 12,400 | | | | 12,400 |
| Loans and advances to banks | | | | | | | | | |
| - reverse repos | 26,056 | — | | — | 32,715 | | | | 58,771 |
- other (1) | 30,178 | — | | — | 49,248 | | | | 79,426 |
| Loans and advances to customers | | | | | | | | | |
| - reverse repos | 22,539 | — | | — | 16,774 | | | | 39,313 |
- other (2) | 28,962 | 2,141 | | — | 789,853 | | 14,453 | | 835,409 |
| Debt securities | 116,280 | 5,428 | | 132,856 | 12,985 | | | | 267,549 |
| Equity shares | 17,054 | 2,101 | | 7,175 | — | | | | 26,330 |
| Settlement balances | — | — | | — | 17,832 | | | | 17,832 |
| Derivatives | 985,700 | | 6,859 | | | | | | 992,559 |
| Intangible assets | | | | | | | | 20,049 | 20,049 |
| Property, plant and equipment | | | | | | | | 18,949 | 18,949 |
| Deferred tax | | | | | | | | 7,082 | 7,082 |
Prepayments, accrued income and other assets | — | — | | — | 1,326 | | | 23,076 | 24,402 |
| Assets of disposal groups | | | | | | | | 1,581 | 1,581 |
| | 1,226,769 | 9,670 | 6,859 | 140,031 | 933,133 | | 14,453 | 70,737 | 2,401,652 |
| | | | | | | | | | |
| Liabilities | | | | | | | | | |
| Deposits by banks | | | | | | | | | |
| - repos | 43,196 | — | | | | 40,470 | | | 83,666 |
- other (3) | 37,958 | — | | | | 136,420 | | | 174,378 |
| Customer accounts | | | | | | | | | |
| - repos | 39,942 | — | | | | 18,201 | | | 58,143 |
- other (4) | 15,984 | 8,054 | | | | 557,331 | | | 581,369 |
Debt securities in issue (5,6) | 3,992 | 47,451 | | | | 248,846 | | | 300,289 |
| Settlement balances | — | — | | | | 11,741 | | | 11,741 |
| Short positions | 42,536 | — | | | | | | | 42,536 |
| Derivatives | 963,088 | | 8,276 | | | | | | 971,364 |
Accruals, deferred income and other liabilities | 260 | — | | | | 1,619 | 22 | 29,581 | 31,482 |
| Retirement benefit liabilities | | | | | | | | 2,032 | 2,032 |
| Deferred tax | | | | | | | | 4,165 | 4,165 |
| Insurance liabilities | | | | | | | | 9,976 | 9,976 |
| Subordinated liabilities | — | 1,509 | | | | 47,645 | | | 49,154 |
| Liabilities of disposal groups | | | | | | | | 859 | 859 |
| | 1,146,956 | 57,014 | 8,276 | | | 1,062,273 | 22 | 46,613 | 2,321,154 |
| Equity | | | | | | | | | 80,498 |
| | | | | | | | | | 2,401,652 |
For notes relating to this table refer to page 244.
Notes on the accounts continued | Financial statements |
Amounts included in the consolidated income statement:
| | Group |
| | 2010 £m | 2009 £m | 2008 £m |
| Gains/(losses) on financial assets/liabilities designated as at fair value through profit or loss | 279 | 1,441 | (901) |
| Gains/(losses) on disposal or settlement of loans and receivables | 267 | (573) | 4 |
Notes:
| (1) | Includes reverse repurchase agreements of £58,771 million (2007 – £175,941 million) and items in the course of collection from other banks of £1,958 million (2009 - £2,533 million; 2008 -£2,888 million (2007 – £3,095 million). |
| (2) | Includes reverse repurchase agreements of £39,313 million (2007 – £142,357 million). |
(3) | The change in fair value of loans and advances to customers designated as at fair value through profit andor loss attributable to changes in credit risk was £328£20 million charge for the year and cumulatively a credit of £82 million (2009 - release £157 million; cumulative £140 million credit; 2008 - £328 million charge; cumulative £440 million cumulatively. The amounts for 2007 were not material. |
(4) | Includes treasury bills and similar securities of £31,509 million (2007 – £16,315 million) and other eligible bills of £25,028 million (2007 – £1,914 million)credit). |
(5)(3) | Includes repurchase agreements of £83,666 million (2007 – £163,038 million) and items in the course of transmission to other banks of £542£577 million (2007 – £372(2009 - £770 million; 2008 - £542 million). |
(6) | Includes repurchase agreements of £58,143 million (2007 – £134,916 million). |
(7)(4) | The carryngcarrying amount of other customer accounts designated as at fair value through profit or loss is £233 million lower (2009 - £101 million lower; 2008 - £47 million lower (2007 – £77 million greater)lower) than the principal amount. No amounts have been recognised in profit or loss for changes in credit risk associated with these liabilities as the changes are immaterial, measured as the change in fair value from movements in the period in the credit risk premium payable. The amounts include investment contracts with a carrying value of £5,364£41 million (2007 – £5,555(2009 - £5,170 million; 2008 - £5,364 million). |
(8)(5) | Comprises bonds and medium term notes of £156,841£154,282 million (2007 – £119,578(2009 - £164,900 million; 2008 - £156,841 million) and certificates of deposit and other commercial paper of £143,448£64,090 million (2007 – £154,594(2009 - £102,668 million; 2008 - £143,448 million). |
(9)(6) | £1,054 million (2007 – £162 million) has been recognised in profit or loss for changes in credit risk associated with debt securities in issue designated as at fair value through profit or loss measured as the change in fair value from movements in the period in the credit risk premium payable by the Group. The carrying amount is £1,145£751 million (2007 – £317(2009 - £810 million; 2008 - £1,145 million) lower than the principal amount. |
(10)(7) | During 20082009, the Group reclassified financial assets from the held-for-trading category into the loans and receivables category and in 2008 from the held-for-trading and available-for-sale categories into the loans and receivables category and from the held-for-trading category into the available-for-sale category (see page 193)pages 247 to 250). |
Notes on the accounts continued | Financial statements |
11 Financial instruments (continued)- classification continued
The following tables analyse the company’scompany's financial assets and financial liabilities in accordance with the categories of financial instruments in IAS 39. Assets and liabilities outside the scope of IAS 39 are shown separately.
| | Company |
| | Held-for- trading | Hedging derivatives | Loans and receivables | Other financial instruments (amortised cost) | Non financial assets/ liabilities | Total |
| 2010 | £m | £m | £m | £m | £m | £m |
| Assets | | | | | | |
Loans and advances to banks (1) | — | | 19,535 | | | 19,535 |
Loans and advances to customers (2) | — | | 6,689 | | | 6,689 |
Debt securities (2) | — | | 1,454 | | | 1,454 |
| Investments in Group undertakings | | | | | 49,125 | 49,125 |
Derivatives (2) | 1,223 | 252 | | | | 1,475 |
| Deferred tax | | | | | 2 | 2 |
| Prepayments, accrued income and other assets | — | | — | | 28 | 28 |
| | 1,223 | 252 | 27,678 | — | 49,155 | 78,308 |
| | | | | | | |
| Liabilities | | | | | | |
Customer accounts (4) | — | | | 1,029 | | 1,029 |
| Debt securities in issue | — | | | 8,742 | | 8,742 |
Derivatives (4) | 231 | — | | | | 231 |
| Accruals, deferred income and other liabilities | — | | | — | 1,034 | 1,034 |
| Subordinated liabilities | — | | | 8,048 | | 8,048 |
| | 231 | — | | 17,819 | 1,034 | 19,084 |
| Equity | | | | | | 59,224 |
| | | | | | | 78,308 |
| 2009 | | | | | | |
| Assets | | | | | | |
Loans and advances to banks (1) | — | | 31,238 | | | 31,238 |
Loans and advances to customers (2) | — | | 2,777 | | | 2,777 |
Debt securities (2) | — | | 1,286 | | | 1,286 |
| Investments in Group undertakings | | | | | 64,766 | 64,766 |
| Settlement balances | | | | | 11 | 11 |
Derivatives (2) | 930 | 239 | | | | 1,169 |
| Deferred tax | | | | | 2 | 2 |
| Prepayments, accrued income and other assets | — | | — | | 43 | 43 |
| | 930 | 239 | 35,301 | | 64,822 | 101,292 |
| | | | | | | |
| Liabilities | | | | | | |
Deposits by banks (3) | — | | | 93 | | 93 |
Customer accounts (4) | — | | | 13,264 | | 13,264 |
| Debt securities in issue | — | | | 11,788 | | 11,788 |
Derivatives (4) | 432 | 14 | | | | 446 |
| Accruals, deferred income and other liabilities | — | | | — | 1,357 | 1,357 |
| Subordinated liabilities | — | | | 8,762 | | 8,762 |
| | 432 | 14 | | 33,907 | 1,357 | 35,710 |
| Equity | | | | | | 65,582 |
| | | | | | | 101,292 |
For notes relating to this table refer to page 246.
Notes on the accounts continued | Financial statements |
11 Financial instruments - classification continued
The following tables analyse the company's financial assets and financial liabilities in accordance with the categories of financial instruments in IAS 39. Assets and liabilities outside the scope of IAS 39 are shown separately.
| | | Company | |
| | | Held-for-trading | | | Hedging derivatives | | | Loans and receivables | | | Other (amortised cost) | | | Non financial assets/ liabilities | | | Total | |
| 2008 | | | £m | | | | £m | | | | £m | | | | £m | | | | £m | | | | £m | |
| Assets | | | | | | | | | | | | | | | | | | | | | | | | |
Loans and advances to banks (1) | | | — | | | | | | | | 27,031 | | | | | | | | — | | | | 27,031 | |
| Investments in Group undertakings | | | — | | | | | | | | — | | | | | | | | 42,196 | | | | 42,196 | |
Derivatives (3) | | | 975 | | | | 193 | | | | — | | | | | | | | — | | | | 1,168 | |
| Deferred taxation | | | — | | | | — | | | | — | | | | — | | | | 3 | | | | 3 | |
| Prepayments, accrued income and other assets | | | — | | | | | | | | — | | | | | | | | 489 | | | | 489 | |
| | | | 975 | | | | 193 | | | | 27,031 | | | | | | | | 42,688 | | | | 70,887 | |
| Liabilities | | | | | | | | | | | | | | | | | | | | | | | | |
Deposits by banks (2) | | | — | | | | | | | | — | | | | 1,802 | | | | — | | | | 1,802 | |
Customer accounts (2) | | | | | | | | | | | | | | | 26 | | | | | | | | 26 | |
| Debt securities in issue | | | — | | | | | | | | — | | | | 14,179 | | | | — | | | | 14,179 | |
Derivatives (2) | | | 136 | | | | 225 | | | | — | | | | — | | | | — | | | | 361 | |
| Accruals, deferred income and other liabilities | | | — | | | | | | | | — | | | | — | | | | 47 | | | | 47 | |
| Subordinated liabilities | | | — | | | | | | | | — | | | | 10,314 | | | | — | | | | 10,314 | |
| | | | 136 | | | | 225 | | | | — | | | | 26,321 | | | | 47 | | | | 26,729 | |
| | | | | | | | | | | | | | | | | | | | | | | | | |
| Equity | | | | | | | | | | | | | | | | | | | | | | | 44,158 | |
| | | | | | | | | | | | | | | | | | | | | | | | 70,887 | |
| 2007 | | | | | | | | | | | | | | | | | | | |
| | | | Company | |
| | | | Held-for- trading | | | Hedging derivatives | | | Loans and receivables | | | Other financial instruments (amortised cost) | | | Non financial assets/ liabilities | | | Total | |
| 2008 | | | | £m | | | | £m | | | | £m | | | | £m | | | | £m | | | | £m | |
| Assets | | | | | | | | | | | | | | | | | | | | | | | | | | | | | | | | | | | | | | | | | | |
Loans and advances to banks (1) | | — | | | — | | | 7,686 | | | | | | — | | | 7,686 | | | | — | | | | | | | | 27,031 | | | | | | | | | | | | 27,031 | |
Loans and advances to customers (3) | | — | | | — | | | 307 | | | | | | — | | | 307 | | |
| Investments in Group undertakings | | — | | | — | | | — | | | | | | 43,542 | | | 43,542 | | | | | | | | | | | | | | | | | | | | 42,196 | | | | 42,196 | |
Derivatives (3) | | 173 | | | — | | | — | | | | | | — | | | 173 | | |
Derivatives (2) | | | | 975 | | | | 193 | | | | | | | | | | | | | | | | 1,168 | |
| Deferred tax | | | | | | | | | | | | | | | | | | | | 3 | | | | 3 | |
| Prepayments, accrued income and other assets | | — | | | — | | | — | | | | | | 127 | | | 127 | | | | — | | | | | | | | — | | | | | | | | 489 | | | | 489 | |
| | | | 173 | | | — | | | 7,993 | | | | | | 43,669 | | | 51,835 | | | | 975 | | | | 193 | | | | 27,031 | | | | | | | | 42,688 | | | | 70,887 | |
| | | | | | | | | | | | | | | | | | | | | | | | | | |
| Liabilities | | | | | | | | | | | | | | | | | | | | | | | | | | | | | | | | | | | | | | | | | | | | | | | |
Deposits by banks (2) | | — | | | — | | | | | | | 5,572 | | | — | | | 5,572 | | |
Deposits by banks (3) | | | | — | | | | | | | | | | | | 1,802 | | | | | | | | 1,802 | |
Customer accounts (4) | | | | — | | | | | | | | | | | | 26 | | | | | | | | 26 | |
| Debt securities in issue | | — | | | — | | | | | | | 13,453 | | | — | | | 13,453 | | | | — | | | | | | | | | | | | 14,179 | | | | | | | | 14,179 | |
Derivatives (2) | | 125 | | | 54 | | | | | | | — | | | — | | | 179 | | |
Derivatives (4) | | | | 136 | | | | 225 | | | | | | | | | | | | | | | | 361 | |
| Accruals, deferred income and other liabilities | | — | | | — | | | | | | | — | | | 8 | | | 8 | | | | — | | | | | | | | | | | | — | | | | 47 | | | | 47 | |
| Deferred taxation | | — | | | — | | | | | | | — | | | 3 | | | 3 | | |
| Subordinated liabilities | | — | | | — | | | | | | | 7,743 | | | — | | | 7,743 | | | | — | | | | | | | | | | | | 10,314 | | | | | | | | 10,314 | |
| | | | 125 | | | 54 | | | | | | | 26,768 | | | 11 | | | | 26,958 | | |
| | | | | | | | | | | | | | | | | | | | | | | | | | | | 136 | | | | 225 | | | | | | | | 26,321 | | | | 47 | | | | 26,729 | |
| Equity | | | | | | | | | | | | | | | | | | | | | | 24,877 | | | | | | | | | | | | | | | | | | | | | | | | 44,158 | |
| | | | | | | | | | | | | | | | | | | | | | | | 51,835 | | | | | | | | | | | | | | | | | | | | | | | | 70,887 | |
| (1) | Includes amounts due from subsidiaries of £19,535 million (2009 - £31,238 million; 2008 - £27,031 million). |
(1) Incudes| (2) | Due from subsidiaries. |
| (3) | Includes amounts due to subsidiaries of nil (2009 - £4 million; 2008 - £1,706 million). |
Notes on the accounts continued | Financial statements |
11 Financial instruments - classification continued
Reclassification of financial instruments
The Group has reclassified financial assets from subsidiariesthe held-for-trading (HFT) and available-for-sale (AFS) categories into the loans and receivables (LAR) category (as permitted by paragraph 50D of £27,031 million (2007 – £7,130 million)IAS 39 as amended) and from the held-for-trading category into the available-for-sale category (as permitted by paragraph 50B of IAS 39 as amended).
The turbulence in the financial markets during the second half of 2008 was regarded by management as rare circumstances in the context of paragraph 50B of IAS 39 as amended.
(2) Due to subsidiaries.
The tables below show the carrying value, fair value and the effect on profit or loss of reclassifications undertaken by the Group in 2008 and 2009. There were no reclassifications in 2010.
| | | | 31 December 2010 | | | | Amount recognised in profit or loss | | | | Amount that would have been recognised had reclassification not occurred | | | | Reduction in profit or loss as result of reclassification | |
| | | | Carrying value | | | | Fair value | | | | Income | | | | Impairment releases/(losses) | | | | | | | |
| 2010 | | | £m | | | | £m | | | | £m | | | | £m | | | | £m | | | | £m | |
| Reclassified from HFT to LAR | | | | | | | | | | | | | | | | | | | | | | | | |
| Loans | | | | | | | | | | | | | | | | | | | | | | | | |
| - leveraged finance | | | 1,100 | | | | 963 | | | | 88 | | | | 59 | | | | 317 | | | | 170 | |
| - corporate and other loans | | | 4,278 | | | | 3,465 | | | | 146 | | | | (205 | ) | | | 174 | | | | 233 | |
| | | | 5,378 | | | | 4,428 | | | | 234 | | | | (146 | ) | | | 491 | | | | 403 | |
| Debt securities | | | | | | | | | | | | | | | | | | | | | | | | |
| - CDO | | | 22 | | | | 22 | | | | 1 | | | | — | | | | 1 | | | | — | |
| - RMBS | | | 983 | | | | 787 | | | | 24 | | | | (1 | ) | | | 139 | | | | 116 | |
| - CMBS | | | 844 | | | | 732 | | | | — | | | | (13 | ) | | | 133 | | | | 146 | |
| - CLOs | | | 417 | | | | 368 | | | | 8 | | | | (3 | ) | | | 67 | | | | 62 | |
| - other ABS | | | 626 | | | | 559 | | | | (6 | ) | | | — | | | | 3 | | | | 9 | |
| - other | | | 638 | | | | 653 | | | | 21 | | | | — | | | | 81 | | | | 60 | |
| | | | 3,530 | | | | 3,121 | | | | 48 | | | | (17 | ) | | | 424 | | | | 393 | |
| | | | 8,908 | | | | 7,549 | | | | 282 | | | | (163 | ) | | | 915 | | | | 796 | |
Reclassified from HFT to AFS (1) | | | | | | | | | | | | | | | | | | | | | | | | |
| Debt securities | | | | | | | | | | | | | | | | | | | | | | | | |
| - CDO | | | 1,537 | | | | 1,537 | | | | 136 | | | | 57 | | | | 369 | | | | 176 | |
| - RMBS | | | 2,018 | | | | 2,018 | | | | 40 | | | | (4 | ) | | | 34 | | | | (2 | ) |
| - CMBS | | | 52 | | | | 52 | | | | 5 | | | | — | | | | 11 | | | | 6 | |
| - CLOs | | | 2,406 | | | | 2,406 | | | | 212 | | | | — | | | | 298 | | | | 86 | |
| - other ABS | | | 339 | | | | 339 | | | | 19 | | | | — | | | | 17 | | | | (2 | ) |
| - other | | | 94 | | | | 94 | | | | 29 | | | | — | | | | 36 | | | | 7 | |
| | | | 6,446 | | | | 6,446 | | | | 441 | | | | 53 | | | | 765 | | | | 271 | |
| Equity securities | | | 1 | | | | 1 | | | | 29 | | | | — | | | | 38 | | | | 9 | |
| | | | 6,447 | | | | 6,447 | | | | 470 | | | | 53 | | | | 803 | | | | 280 | |
Reclassified from AFS to LAR (2) | | | | | | | | | | | | | | | | | | | | | | | | |
| Debt securities | | | 422 | | | | 380 | | | | (31 | ) | | | (50 | ) | | | (81 | ) | | | — | |
| | | | 15,777 | | | | 14,376 | | | | 721 | | | | (160 | ) | | | 1,637 | | | | 1,076 | |
Notes:
| (1) | The amount taken to AFS reserves was £326 million. |
| (2) | The amount that would have been taken to AFS reserves if reclassification had not occurred is £98 million. |
(3) Due from subsidiaries.247
Notes on the accounts continued | Financial statements |
| | | | 31 December 2009 | | | | Amount recognised in profit or loss | | | | Amount that would have been recognised had reclassification not occurred | | | | Reduction in profit or loss as result of reclassification | |
| | | | Carrying value | | | | Fair value | | | | Income | | | | Impairment losses | | | | | | | |
| 2009 | | | £m | | | | £m | | | | £m | | | | £m | | | | £m | | | | £m | |
| Reclassified from HFT to LAR | | | | | | | | | | | | | | | | | | | | | | | | |
| Loans | | | | | | | | | | | | | | | | | | | | | | | | |
| - leveraged finance | | | 2,574 | | | | 2,257 | | | | 109 | | | | (902 | ) | | | 482 | | | | 1,275 | |
| - corporate and other loans | | | 5,302 | | | | 4,114 | | | | 99 | | | | (361 | ) | | | (321 | ) | | | (59 | ) |
| | | | 7,876 | | | | 6,371 | | | | 208 | | | | (1,263 | ) | | | 161 | | | | 1,216 | |
| Debt securities | | | | | | | | | | | | | | | | | | | | | | | | |
| - CDO | | | 21 | | | | 21 | | | | 2 | | | | — | | | | 2 | | | | — | |
| - RMBS | | | 1,532 | | | | 1,168 | | | | (115 | ) | | | — | | | | (25 | ) | | | 90 | |
| - CMBS | | | 826 | | | | 596 | | | | (44 | ) | | | — | | | | 24 | | | | 68 | |
| - CLOs | | | 647 | | | | 536 | | | | (43 | ) | | | (16 | ) | | | 39 | | | | 98 | |
| - other ABS | | | 1,145 | | | | 1,070 | | | | (13 | ) | | | — | | | | — | | | | 13 | |
| - other | | | 886 | | | | 882 | | | | 34 | | | | — | | | | 254 | | | | 220 | |
| | | | 5,057 | | | | 4,273 | | | | (179 | ) | | | (16 | ) | | | 294 | | | | 489 | |
| | | | 12,933 | | | | 10,644 | | | | 29 | | | | (1,279 | ) | | | 455 | | | | 1,705 | |
Reclassified from HFT to AFS (1) | | | | | | | | | | | | | | | | | | | | | | | | |
| Debt securities | | | | | | | | | | | | | | | | | | | | | | | | |
| - CDO | | | 1,170 | | | | 1,170 | | | | 35 | | | | (226 | ) | | | 40 | | | | 231 | |
| - RMBS | | | 3,042 | | | | 3,042 | | | | 335 | | | | (84 | ) | | | 460 | | | | 209 | |
| - CMBS | | | 63 | | | | 63 | | | | (2 | ) | | | — | | | | 11 | | | | 13 | |
| - CLOs | | | 2,676 | | | | 2,676 | | | | 57 | | | | — | | | | 704 | | | | 647 | |
| - other ABS | | | 508 | | | | 508 | | | | 20 | | | | — | | | | 44 | | | | 24 | |
| - other | | | 142 | | | | 142 | | | | (3 | ) | | | (118 | ) | | | 34 | | | | 155 | |
| | | | 7,601 | | | | 7,601 | | | | 442 | | | | (428 | ) | | | 1,293 | | | | 1,279 | |
| Equity securities | | | 28 | | | | 28 | | | | (1 | ) | | | — | | | | — | | | | 1 | |
| | | | 7,629 | | | | 7,629 | | | | 441 | | | | (428 | ) | | | 1,293 | | | | 1,280 | |
Reclassified from AFS to LAR (2) | | | | | | | | | | | | | | | | | | | | | | | | |
| Debt securities | | | 869 | | | | 745 | | | | 21 | | | | — | | | | 21 | | | | — | |
| | | | 21,431 | | | | 19,018 | | | | 491 | | | | (1,707 | ) | | | 1,769 | | | | 2,985 | |
Notes:
| (1) | The amount taken to AFS reserves was £1,067 million. |
| (2) | The amount that would have been taken to AFS reserves if reclassification had not occurred is £(73) million. |
Notes on the accounts continued | Financial statements |
11 Financial instruments - classification continued
The following table provides information for reclassifications made in 2009.
| | | | | | | | | | | | | | | | | | | | | | | 2009 | | | 2008 | |
| | | 2009 - on reclassification | | 31 December 2009 | | | | | | | After reclassification | | | | | | | | | | | | | |
| | | | Carrying value | | | Effective Interest rate | | | | Expected cash flows | | | | Carrying value | | | | Fair value | | | | Gains/ (losses) up to the date of reclassification | | | | Income | | | | Impairment losses | | | | Amount that would have been recognised had reclassification not occurred | | | | Reduction in profit or loss as result of reclassification | | | | Gains/ (losses) recognised in the income statement in prior period | |
| | | | £m | | | % | | | | £m | | | | £m | | | | £m | | | | £m | | | | £m | | | | £m | | | | £m | | | | £m | | | | £m | |
| Reclassified from HFT to LAR | | | | | | | | | | | | | | | | | | | | | | | | | | | | | | | | | | | | | | | | |
| Loans | | | | | | | | | | | | | | | | | | | | | | | | | | | | | | | | | | | | | | | | | | | |
| - leveraged finance | | | 510 | | | | 13.37 | | | | 1,075 | | | | — | | | | — | | | | — | | | | (70 | ) | | | (71 | ) | | | (141 | ) | | | — | | | | (76 | ) |
- corporate and other loans | | | 1,230 | | | | 2.85 | | | | 1,565 | | | | 887 | | | | 924 | | | | (103 | ) | | | 26 | | | | (180 | ) | | | (115 | ) | | | 39 | | | | 14 | |
| | | | 1,740 | | | | | | | | 2,640 | | | | 887 | | | | 924 | | | | (103 | ) | | | (44 | ) | | | (251 | ) | | | (256 | ) | | | 39 | | | | (62 | ) |
| | | | | | | | | | | | | | | | | | | | | | | | | | | | | | | | | | | | | | | | | | | | | |
| Debt securities | | | | | | | | | | | | | | | | | | | | | | | | | | | | | | | | | | | | | | | | | | | | |
| - RMBS | | | 86 | | | | 3.30 | | | | 94 | | | | 78 | | | | 74 | | | | (2 | ) | | | 2 | | | | — | | | | (3 | ) | | | (5 | ) | | | (3 | ) |
| - CMBS | | | 64 | | | | 2.17 | | | | 67 | | | | 41 | | | | 36 | | | | (3 | ) | | | (6 | ) | | | — | | | | (10 | ) | | | (4 | ) | | | (14 | ) |
| - other ABS | | | 39 | | | | 2.51 | | | | 41 | | | | 7 | | | | 7 | | | | 1 | | | | 1 | | | | — | | | | — | | | | (1 | ) | | | (10 | ) |
| - other | | | 66 | | | | 13.19 | | | | 147 | | | | 64 | | | | 71 | | | | (29 | ) | | | 3 | | | | — | | | | 11 | | | | 8 | | | | (12 | ) |
| | | | 255 | | | | | | | | 349 | | | | 190 | | | | 188 | | | | (33 | ) | | | — | | | | — | | | | (2 | ) | | | (2 | ) | | | (39 | ) |
| | | | 1,995 | | | | | | | | 2,989 | | | | 1,077 | | | | 1,112 | | | | (136 | ) | | | (44 | ) | | | (251 | ) | | | (258 | ) | | | 37 | | | | (101 | ) |
Notes on the accounts continued | Financial statements |
The following table provides information for reclassifications made in 2008.
| | | | | | | | | | | | 2008 | | | | 2007 | |
| | | | 2008 - on reclassification | | | | 31 December 2008 | | | | | | | | After reclassification | | | | | | | | | | | | | |
| | | | Carrying value | | | Effective interest rate | | | | Expected cash flows | | | | Carrying value | | | | Fair value | | | | Gains/ (losses) up to the date of reclassification | | | | Income | | | | Impairment losses | | | | Amount that would have been recognised had reclassification not occurred | | | | Increase in profit or loss as result of reclassification | | | | Gains/(losses)recognised in the income statement in prior period | |
| | | | £m | | | % | | | | £m | | | | £m | | | | £m | | | | £m | | | | £m | | | | £m | | | | £m | | | | £m | | | | £m | |
Reclassified from HFT to LAR | | | | | | | | | | | | | | | | | | | | | | | | | | | | | | | | | | | | | | | | | | | |
| Loans | | | | | | | | | | | | | | | | | | | | | | | | | | | | | | | | | | | | | | | | | | | |
| - leveraged finance | | | 3,602 | | | | 10.14 | | | | 6,091 | | | | 4,304 | | | | 2,714 | | | | (456 | ) | | | 455 | | | | — | | | | (1,015 | ) | | | 1,470 | | | | (155 | ) |
- corporate and other loans | | | 5,205 | | | | 6.03 | | | | 7,752 | | | | 6,053 | | | | 5,143 | | | | (74 | ) | | | 267 | | | | — | | | | (639 | ) | | | 906 | | | | (46 | ) |
| | | | 8,807 | | | | | | | | 13,843 | | | | 10,357 | | | | 7,857 | | | | (530 | ) | | | 722 | | | | — | | | | (1,654 | ) | | | 2,376 | | | | (201 | ) |
| Debt securities | | | | | | | | | | | | | | | | | | | | | | | | | | | | | | | | | | | | | | | | | | | | |
| - CDO | | | 215 | | | | 4.92 | | | | 259 | | | | 236 | | | | 221 | | | | 4 | | | | 5 | | | | — | | | | (11 | ) | | | 16 | | | | 5 | |
| - RMBS | | | 1,765 | | | | 6.05 | | | | 2,136 | | | | 2,059 | | | | 1,579 | | | | (115 | ) | | | 171 | | | | — | | | | (293 | ) | | | 464 | | | | (12 | ) |
| - CMBS | | | 1,877 | | | | 4.77 | | | | 2,402 | | | | 2,144 | | | | 1,776 | | | | (42 | ) | | | 50 | | | | — | | | | (293 | ) | | | 343 | | | | (19 | ) |
| - CLOs | | | 835 | | | | 6.34 | | | | 1,141 | | | | 1,121 | | | | 851 | | | | (22 | ) | | | 104 | | | | — | | | | (164 | ) | | | 268 | | | | (14 | ) |
| - other ABS | | | 2,203 | | | | 5.07 | | | | 3,203 | | | | 2,242 | | | | 1,943 | | | | (68 | ) | | | 129 | | | | — | | | | (151 | ) | | | 280 | | | | 3 | |
| - other | | | 2,548 | | | | 2.64 | | | | 2,778 | | | | 2,615 | | | | 2,401 | | | | 73 | | | | 7 | | | | — | | | | (162 | ) | | | 169 | | | | 95 | |
| | | | 9,443 | | | | | | | | 11,919 | | | | 10,417 | | | | 8,771 | | | | (170 | ) | | | 466 | | | | — | | | | (1,074 | ) | | | 1,540 | | | | 58 | |
| | | | 18,250 | | | | | | | | 25,762 | | | | 20,774 | | | | 16,628 | | | | (700 | ) | | | 1,188 | | | | — | | | | (2,728 | ) | | | 3,916 | | | | (143 | ) |
Reclassified from HFT to AFS | | | | | | | | | | | | | | | | | | | | | | | | | | | | | | | | | | | | | | | | | | | | |
Debt securities (1) | | | | | | | | | | | | | | | | | | | | | | | | | | | | | | | | | | | | | | | | | | | | |
| - CDO | | | 3,592 | | | | 10.32 | | | | 5,607 | | | | 1,346 | | | | 1,346 | | | | (994 | ) | | | (514 | ) | | | (446 | ) | | | (1,468 | ) | | | 508 | | | | (400 | ) |
| - RMBS | | | 5,205 | | | | 8.03 | | | | 8,890 | | | | 5,171 | | | | 5,171 | | | | (531 | ) | | | 21 | | | | — | | | | (131 | ) | | | 152 | | | | (4 | ) |
| - CMBS | | | 590 | | | | 6.65 | | | | 836 | | | | 256 | | | | 256 | | | | (110 | ) | | | (48 | ) | | | — | | | | (408 | ) | | | 360 | | | | 4 | |
| - CLOs | | | 3,498 | | | | 4.89 | | | | 4,257 | | | | 3,759 | | | | 3,759 | | | | (353 | ) | | | (797 | ) | | | — | | | | (1,633 | ) | | | 836 | | | | 36 | |
| - other ABS | | | 1,323 | | | | 5.70 | | | | 2,013 | | | | 712 | | | | 712 | | | | (185 | ) | | | (36 | ) | | | — | | | | (5 | ) | | | (31 | ) | | | (42 | ) |
| - other | | | 756 | | | | 10.17 | | | | 1,311 | | | | 777 | | | | 777 | | | | — | | | | 131 | | | | — | | | | (3 | ) | | | 134 | | | | (1 | ) |
| | | | 14,964 | | | | | | | | 22,914 | | | | 12,021 | | | | 12,021 | | | | (2,173 | ) | | | (1,243 | ) | | | (446 | ) | | | (3,648 | ) | | | 1,959 | | | | (407 | ) |
| Equity shares | | | 34 | | | | — | | | | 32 | | | | 26 | | | | 26 | | | | (9 | ) | | | — | | | | — | | | | (9 | ) | | | 9 | | | | 13 | |
| | | | 14,998 | | | | | | | | 22,946 | | | | 12,047 | | | | 12,047 | | | | (2,182 | ) | | | (1,243 | ) | | | (446 | ) | | | (3,657 | ) | | | 1,968 | | | | (394 | ) |
Reclassified from AFS to LAR: | | | | | | | | | | | | | | | | | | | | | | | | | | | | | | | | | | | | | | | | | | | | |
Debt securities (2) | | | 694 | | | | 1.38 | | | | 760 | | | | 1,016 | | | | 956 | | | | (12 | ) | | | 6 | | | | — | | | | 6 | | | | — | | | | — | |
| | | | 33,942 | | | | | | | | 49,468 | | | | 33,837 | | | | 29,631 | | | | (2,894 | ) | | | (49 | ) | | | (446 | ) | | | (6,379 | ) | | | 5,884 | | | | (537 | ) |
Notes:
| (1) | The amount taken to AFS reserves was £(2,193) million. |
| (2) | The amount that would have been in AFS reserves if reclassification had not occurred is £(39) million. |
Notes on the accounts continued | Financial statements |
12 Financial instruments - valuation
Valuation of financial instruments carried at fair value
Control environment
The Group’sGroup's control environment for the determination of the fair value of financial instruments has been designed to ensure there areincludes formalised review protocols for independentthe review and validation of fair values separate from thoseindependent of the businesses entering into the transactions. This includesThere are specific controls to ensure consistent pricing policies and procedures, incorporating disciplined price verification for both proprietary and counterparty risk trades.verification. The Group ensures specialthat appropriate attention is given to bespoke transactions, structured products, illiquid products and other assetsinstruments which are difficult to price.
The business entering into the transaction is responsible for the initial determination and recording of the fair value of the transaction. There are daily controls over the profit or loss recorded by trading and treasury front office traders.
A key element of the control environment segregated from the recording of the transaction’s valuation, is the independent price verification (IPV) process. Valuations are first calculatedperformed by the business which entered into the transaction. Such valuations may be directdirectly from available prices, or may be derived using a model and variable model inputs. These valuations are reviewed, and if necessary amended, by the IPV process. This process involves a team independent of those trading the financial instruments, reviewing valuations in the light of available pricing evidence.
All IPV variances are classified as either ‘hard’ or ‘soft’. A variance is hard where the independent information represents tradable or liquid prices, and soft where it does not. Adjustments are required for all hard variances and for aggressive soft variances, but with conservative variances not requiring adjustment.
Monthly meetings are held between the business and the support functions to discuss the results of the IPV and reserves process in detail.
IPV is performed at a frequency to match the availability of independent data, and the size of the Group’s exposure.data. For liquid instruments the processIPV is performed daily. The minimum frequency of review in GBMthe Group is monthly for exposures in the regulatory trading book, positions, and six monthly for exposures in the regulatory banking book positions.book. The IPV control includes formalised reporting and escalation of any valuation differences in breach of definedestablished thresholds. In addition, within GBM, there is a dedicated team (theThe Global Pricing Unit) whichUnit (GPU) determines IPV policy, monitors adherence to that policy, and performs additional independent reviewreviews on highly subjective valuation issues.issues for GBM and Non-Core.
In GBM, when models are used to value products, thoseValuation models are subject to a review process which requires different levels of model documentation, testing and review, depending on the complexity of the model and the size of the Group’sGroup's exposure. A key element of the control environment over model use in GBM is a modelled product review committee, which comprisesmade up of valuations experts from several functions within GBM. Thethe Group. This committee sets the policy for model documentation, testing and review, and prioritises models with significant exposure for review by the Group’s quantitative research centre. This centre,Group's Quantitative Research Centre (QuaRC). Potential valuation uncertainty is a key input in determining model review priorities at these meetings. The QuaRC team within Group Risk, which is independent of the trading businesses, assesses the appropriateness of the application of the model to the product, the mathematical robustness of the model, and (where appropriate), considers alternative modelling approaches.
GBM also maintains aSenior management valuation control committee that meetscommittees meet formally on a monthly basis to discuss independent pricing, reserving and valuation issues relating to both GBM and Non-Core exposures. All material methodology changes require review escalated items and to consider highly complex and subjective valuation matters.ratification by these committees. The committee includescommittees include valuation specialists representing several independent review functions (includingwhich comprise market risk, quantitative researchQuaRC and finance)finance.
The Group Executive Valuation Committee discusses the issues escalated by the Modelled Product Review Committee, GBM and Non-Core senior membersmanagement Valuations Control Committee and other relevant issues, including the APS credit derivative valuation. The committee covers key material and subjective valuation issues within the trading business. The committee will provide ratification to the appropriateness of areas with high levels of residual valuation uncertainty. Committee membership includes the Group’sGroup Finance Director, the Group Chief Accountant, Global Head of Market and Insurance Risk, GBM Chief Financial Officer and Non-Core Chief Financial Officer, and representation from front office trading businesses.and finance.
CertainValuation issues, adjustments and reserves are reported to the GBM, Non-Core and Group Audit Committees. Key judgmental issues are described in reports submitted to these Audit Committees.
New products
The Group has formal review procedures to ensure that new products, asset classes and risk types are appropriately reviewed to ensure, amongst other things, that valuation is appropriate. Group Operational Risk owns the Group New Product Approval Process, the scope of which includes new business, markets, models, risks and structures.
During 2010, the Group made a significant and ongoing investment into enhancing its already robust control environment. This included a new global IPV and reserving tool, which partly automates the process of carrying out IPV and consolidation of reserves into a single central portal.
Valuation hierarchy
There is a process to review and control the classification of financial instruments have become more difficultinto the three level hierarchy established by IFRS 7. Some instruments may not easily fall into a level of the fair value hierarchy per IFRS 7 (see pages 255 to 256) and subjectivejudgment may be required as to valuewhich level the instrument is classified.
Initial classification of a financial instrument is carried out by the Business Unit Control (BUC) team following the principles in IFRS. BUC base their judgment on information gathered during the IPV process for instruments which include the sourcing of independent prices and have therefore been transferredmodel inputs. The quality and completeness of the information gathered in the IPV process gives an indication as to a centrally managed asset unit, to separate them from business as usual activities and to allow dedicated focus on the managementliquidity and valuation uncertainty of an instrument.
These initial classifications are challenged by GPU and are subject to further review by local CFO, divisional CFO and the exposures. The unit has aGroup Chief Accountant. Particular attention is paid during the review processes upon instruments crossing from one level to another, new instrument classes or products, instruments that are generating significant profit and loss and instruments where valuation committee comprising senior representatives of the trading function, risk management and GBM Global Pricing Unit which meets regularly anduncertainty is responsible for monitoring, assessing and enhancing the adequacy of the valuation techniques being adopted for these instruments.high.
Notes on the accounts continued | Financial statements |
Valuation techniques
The Group derives fair value of its instruments differently depending on whether the instrument is a non-modelled or modelled product.
Non-modelled products
Non-modelled products are valued directly from a price input and are typically valued on a position by position basis and include cash, equities and most debt securities.
Modelled products
Modelled products are those that are valued using a pricing model, ranging in complexity from comparatively vanilla products such as interest rate swaps and options (e.g. interest rate caps and floors) through to more complex derivatives. The valuation of modelled products requires an appropriate model and inputs into this model. Sometimes models are also used to derive inputs (e.g. to construct volatility surfaces). The Group uses a number of modelling methodologies.
Inputs to determine the fair values of financial instruments for which observable prices in active markets for identical instruments are not available. These techniques include: relative value methodologies based on observable prices for similar instruments; present value approaches where future cash flows from the asset or liability are estimated and then discounted using a risk-adjusted interest rate; option pricingvaluation models (such as Black-Scholes or binomial option pricing models) and simulation models such as Monte-Carlo.
The principal inputs to these valuation techniques are listed below. Values between and beyond available data points are obtained by interpolation and extrapolation. When utilising valuation techniques, the fair value can be significantly affected by the choice of valuation model and by underlying assumptions made concerning factors such as the amounts and timing of cash flows, discount rates and credit risk. The principal inputs to these valuation techniques are as follows:
| · | Bond prices –- quoted prices are generally available for government bonds, certain corporate securities and some mortgage-related products. |
| · | Credit spreads –- where available, these are derived from prices of CDScredit default swaps or other credit based instruments, such as debt securities. For others, credit spreads are obtained from pricing services. |
| · | Interest rates –- these are principally benchmark interest rates such as the London Inter-BankInterbank Offered Rate (LIBOR) and quoted interest rates in the swap, bond and futures markets. |
| · | Foreign currency exchange rates –- there are observable markets both for spot and forward contracts and futures in the world’sworld's major currencies. |
11 Financial instruments (continued)
| · | Equity and equity index prices –- quoted prices are generally readily available for equity shares listed on the world’sworld's major stock exchanges and for major indices on such shares. |
| · | Commodity prices –- many commodities are actively traded in spot and forward contracts and futures on exchanges in London, New York and other commercial centres. |
| · | Price volatilities and correlations –- volatility is a measure of the tendency of a price to change with time. Correlation measures the degree to which two or more prices or other variables are observed to move together. If they move in the same direction there is positive correlation; if they move in opposite directions there is negative correlation. Volatility is a key input in valuing options and the valuation of certain products such as derivatives with more than one underlying variable that are correlation-dependent. Volatility and correlation values are obtained from broker quotations, pricing services or derived from option prices. |
| · | Prepayment rates –- the fair value of a financial instrument that can be prepaid by the issuer or borrower differs from that of an instrument that cannot be prepaid. In valuing prepayable instruments that are not quoted in active markets, the Group considers the value of the prepayment option. |
| · | Counterparty credit spreads –- adjustments are made to market prices (or parameters) when the creditworthiness of the counterparty differs from that of the assumed counterparty in the market price (or parameters). |
| · | Recovery rates / rates/loss given default –- these are used as an input to valuation models and reserves for ABSasset-backed-securities and other credit products as an indicator of severity of losses on default. Recovery rates are primarily sourced from market data providers or inferred from observable credit spreads. |
The Group may use consensus prices for the source of independent pricing for some assets. The consensus service encompasses the equity, interest rate, currency, commodity, credit, property, fund and bond markets, providing comprehensive matrices of vanilla prices and a wide selection of exotic products. GBM and Non-Core contribute to consensus pricing services where there is a significant interest either from a positional point of view or to test models for future business use. Data sourced from consensus pricing services is used for a combination of control processes including direct price testing, evidence of observability and model testing. In practice this means that the Group submits prices for all material positions for which a service is available.
In order to determine a reliable fair value, where appropriate, the Groupmanagement applies valuation adjustments to the pricing information derivedgathered from the above sources. These adjustments reflect the Group’sGroup's assessment of factors that market participants would consider in setting a price, to the extent that these factors have not already been included in the information from the above sources.price. Furthermore, on an ongoing basis, the Group assesses the appropriateness of any model used. To the extent that the price provided by internal models does not represent the fair value of the instrument, for instance in highly stressed market conditions, the Group makes adjustments to the model valuation to calibrate to other available pricing sources. Where unobservable inputs are used, the Group may determine a range of possible valuations based uponderived from differing and stress scenarios to determine the sensitivity associated with the valuation. When establishing the fair value of a financial instrument using a valuation technique, the Group considers certain adjustments to the modelled price which market participants would make when pricing that instrument. Such adjustments include the credit quality of the counterparty and adjustments to correct model valuationscompensate for any known limitations. In addition, the Group makes adjustments to defer income for financial instruments valued at inception where the valuation of that financial instrument materially depends on one or more unobservable model inputs.limitations.
The Group refines and modifies its valuation techniques as markets and products develop and as the pricing for individual products becomes more or less readily available. While the Group believes its valuation techniques are appropriate and consistent with other market participants, the use of different methodologies or assumptions could result in different estimates of fair value at the balance sheet date.
Notes on the accounts continued | Financial statements |
12 Financial instruments - valuation continued
Valuation hierarchyreserves
When valuing financial instruments in the trading book, adjustments are made to mid-market valuations to cover bid-offer spread, liquidity and credit risk.
The table below shows the valuation reserves and adjustments.
| | | | 2010 £m | | | | 2009 £m | | | | 2008 £m | |
| Credit valuation adjustments | | | | | | | | | | | | |
| Monoline insurers | | | 2,443 | | | | 3,796 | | | | 5,988 | |
| Credit derivative product companies | | | 490 | | | | 499 | | | | 1,311 | |
| Other counterparties | | | 1,714 | | | | 1,588 | | | | 1,738 | |
| | | | 4,647 | | | | 5,883 | | | | 9,037 | |
| Bid-offer and liquidity reserves | | | 2,797 | | | | 2,814 | | | | 3,260 | |
| | | | 7,444 | | | | 8,697 | | | | 12,297 | |
Credit valuation adjustments (CVA)
Credit valuation adjustments represent an estimate of the adjustment to fair value that a market participant would make to incorporate the credit risk inherent in counterparty derivative exposures. The Group makes such credit adjustments to derivative exposures it has to counterparties, as well as debit valuation adjustments to liabilities issued by the Group. CVA is discussed in Risk and balance sheet management - Other risk exposures - Credit valuation adjustments (pages 151 to 155).
Bid-offer and liquidity reserves
Fair value positions are adjusted to bid (for assets) or offer (for liabilities) levels, by marking individual cash based positions directly to bid or offer or by taking bid-offer reserves calculated on a portfolio basis for derivatives.
The bid-offer approach is based on current market spreads and standard market bucketing of risk. Risk data is used as the primary source of information within bid-offer calculations and is aggregated when it is more granular than market standard buckets.
Bid-offer adjustments for each risk factor are determined by aggregating similar risk exposures arising on different products. Additional basis bid/offer reserves are taken where these are charged in the market. Risk associated with non identical underlying exposures is not netted down unless there is evidence that the cost of closing the combined risk exposure is less than the cost of closing on an individual basis. For example: interest rate delta bid-offer methodology (when viewed in isolation) allows aggregation of risk across different tenor bases. Tenor basis bid-offer reserves are then applied to compensate for the netting within the (original) delta bid-offer calculation.
Bid-offer spreads vary by maturity and risk type to reflect different spreads in the market. For positions where there is no observable quote, the bid-offer spreads are widened in comparison to proxies to reflect reduced liquidity or observability. Bid-offer methodologies also incorporate liquidity triggers whereby wider spreads are applied to risks above pre-defined thresholds.
Netting is applied across risk buckets where there is market evidence to support this. For example, calendar netting and cross strike netting effects are taken into account where such trades occur regularly within the market. Netting will also apply where long and short risk in two different risk buckets can be closed out in a single market transaction at less cost than by way of two separate transactions (closing out the individual bucketed risk in isolation).
Vanilla risk on exotic products is typically reserved as part of the overall portfolio based calculation e.g. delta and vega risk is included within the delta and vega bid-offer calculations. Aggregation of risk arising from different models is in line with the Group's risk management practices; the model review control process considers the appropriateness of model selection in this respect.
Product related risks such as correlation risk attract specific bid-offer reserves. Additional reserves are provided for exotic products to ensure overall reserves match market close-out costs. These market close-out costs inherently incorporate risk decay and cross-effects which are unlikely to be adequately reflected in static hedges based on vanilla instruments.
Where there is limited bid-offer information for a product, a conservative approach is adopted, taking into account pricing approach and risk management strategy.
Derivative discounting
The market convention for some derivative products has moved to pricing collateralised derivatives using the overnight indexed swap (OIS) curve, which reflects the interest rate typically paid on cash collateral. In order to reflect observed market practice the Group’s valuation approach for the substantial portion of its collateralised derivatives was amended to use OIS. Previously the Group had discounted these collateralised derivatives based on LIBOR. The rate for discounting uncollateralised derivatives was also changed in line with observable market pricing. This change resulted in a net increase in income from trading activities of £127 million for 2010.
Amounts deferred on initial recognition
On initial recognition of financial assets and liabilities valued using valuation techniques incorporating information other than observable market data, any difference between the transaction price and that derived from the valuation technique is deferred. Such amounts are recognised in profit or loss over the life of the transaction; when market data becomes observable; or when the transaction matures or is closed out as appropriate. At 31 December 2010, net gains of £167 million (2009 - £204 million; 2008 - £102 million) were carried forward in the balance sheet. During the year net gains of £62 million (2009 - £127 million; 2008 - £89 million) were deferred and £99 million (2009 - £25 million; 2008 - £65 million) recognised in the income statement.
Notes on the accounts continued | Financial statements |
Own credit
The Group takes into account the effect of its own credit standing when valuing financial liabilities recorded at fair value in accordance with IFRS. The categories of financial liabilities on which own credit spread adjustments are made are issued debt held at fair value, including issued structured notes and derivatives. An own credit adjustment is applied to positions where it is believed that counterparties would consider the Group's creditworthiness when pricing trades.
For issued debt and structured notes, this adjustment is based on independent quotes from market participants for the debt issuance spreads above average inter-bank rates, (at a range of tenors) which the market would demand when purchasing new senior or sub-debt issuances from the Group. Where necessary, these quotes are interpolated using a curve shape derived from credit default swap prices.
The fair value of the Group's derivative financial liabilities has also been adjusted to reflect the Group's own credit risk. The adjustment takes into account collateral posted by the Group and the effects of master netting agreements.
The own credit adjustment for fair value does not alter cash flows, is not used for performance management and is disregarded for regulatory capital reporting processes and will reverse over time as the liabilities mature.
The reserve movement between periods will not equate to the reported profit or loss for own credit. The balance sheet reserves are stated by conversion of underlying currency balances at spot rates for each period whereas the income statement includes intra-period foreign exchange sell-offs.
The effect of change in credit spreads could be reversed in future periods, provided the liability is not repaid at a premium or a discount.
The table below shows own credit adjustments on own liabilities.
| | Debt securities in issue (1) £m | Subordinated liabilities £m | Total £m | Derivatives £m | Total £m |
| Cumulative own credit adjustment |
| 2010 | 2,091 | 325 | 2,416 | 534 | 2,950 |
| 2009 | 1,857 | 474 | 2,331 | 467 | 2,798 |
| 2008 | 1,346 | 1,027 | 2,373 | 450 | 2,823 |
| | | | | | |
| | | | | | |
| Carrying values of underlying liabilities | £bn | £bn | £bn | | |
| 2010 | 51.2 | 1.1 | 52.3 | | |
| 2009 | 45.5 | 1.3 | 46.8 | | |
| 2008 | 51.4 | 1.5 | 52.9 | | |
Note:
| (1) | Consists of wholesale and retail note issuances. |
Notes on the accounts continued | Financial statements |
12 Financial instruments - valuation continued
Valuation hierarchy
The following tables show financial instruments carried at fair value on the Group’s balance sheet by valuation method.hierarchy - level 1, level 2 and level 3.
| | 2010 | | 2009 | | 2008 |
| | Level 1 | Level 2 | Level 3 | Total | | Level 1 | Level 2 | Level 3 | Total | | Level 1 | Level 2 | Level 3 | Total | |
| | £bn | £bn | £bn | £bn | | £bn | £bn | £bn | £bn | | £bn | £bn | £bn | £bn | |
| Assets | | | | | | | | | | | | | | | |
| Loans and advances to banks | | | | | | | | | | | | | | | |
| Reverse repos | — | 38.2 | — | 38.2 | | — | 26.9 | — | 26.9 | | — | 26.1 | — | 26.1 | |
| Collateral | — | 25.1 | — | 25.1 | | — | 18.4 | — | 18.4 | | — | 29.7 | — | 29.7 | |
| Other | — | 0.6 | 0.4 | 1.0 | | — | 0.1 | — | 0.1 | | — | 0.4 | — | 0.4 | |
| | — | 63.9 | 0.4 | 64.3 | | — | 45.4 | — | 45.4 | | — | 56.2 | — | 56.2 | |
| Loans and advances to customers | | | | | | | | | | | | | | | |
| Reverse repos | — | 41.1 | — | 41.1 | | — | 26.3 | — | 26.3 | | — | 22.5 | — | 22.5 | |
| Collateral | — | 14.4 | — | 14.4 | | — | 9.6 | — | 9.6 | | — | 14.2 | — | 14.2 | |
| Other | — | 6.2 | 0.4 | 6.6 | | — | 7.3 | 1.1 | 8.4 | | — | 13.8 | 3.1 | 16.9 | |
| | — | 61.7 | 0.4 | 62.1 | | — | 43.2 | 1.1 | 44.3 | | — | 50.5 | 3.1 | 53.6 | |
| Debt securities | | | | | | | | | | | | | | | |
| Government | 110.2 | 13.7 | — | 123.9 | | 130.1 | 16.7 | — | 146.8 | | 68.7 | 37.2 | — | 105.9 | |
| MBS | — | 49.5 | 0.7 | 50.2 | | — | 61.2 | 0.6 | 61.8 | | — | 75.6 | 1.1 | 76.7 | |
| CDOs | — | 1.0 | 2.4 | 3.4 | | — | 2.6 | 1.0 | 3.6 | | — | 6.9 | 1.7 | 8.6 | |
| CLOs | — | 3.6 | 2.1 | 5.7 | | — | 8.0 | 0.8 | 8.8 | | — | 7.7 | 1.0 | 8.7 | |
| Other ABS | — | 4.0 | 1.4 | 5.4 | | — | 5.2 | 0.9 | 6.1 | | — | 6.6 | 1.5 | 8.1 | |
| Corporate | — | 7.7 | 0.9 | 8.6 | | — | 10.8 | 0.6 | 11.4 | | 0.9 | 15.8 | 1.3 | 18.0 | |
| Banks and building societies | 0.1 | 12.2 | 0.7 | 13.0 | | 0.2 | 17.5 | 0.2 | 17.9 | | 4.0 | 20.0 | 0.3 | 24.3 | |
| Other | — | 0.2 | — | 0.2 | | — | 1.0 | — | 1.0 | | 0.1 | 4.2 | — | 4.3 | |
| | 110.3 | 91.9 | 8.2 | 210.4 | | 130.3 | 123.0 | 4.1 | 257.4 | | 73.7 | 174.0 | 6.9 | 254.6 | |
| Equity shares | 18.4 | 2.8 | 1.0 | 22.2 | | 15.4 | 2.6 | 1.5 | 19.5 | | 15.4 | 9.8 | 1.1 | 26.3 | |
| Derivatives | | | | | | | | | | | | | | | |
| Foreign exchange | — | 83.2 | 0.1 | 83.3 | | — | 69.2 | 0.2 | 69.4 | | 2.2 | 171.0 | 0.1 | 173.3 | |
| Interest rate | 1.7 | 308.3 | 1.7 | 311.7 | | 0.3 | 321.8 | 1.5 | 323.6 | | 0.4 | 652.9 | 1.5 | 654.8 | |
| Credit - APS | — | — | 0.6 | 0.6 | | — | — | 1.4 | 1.4 | | — | — | — | — | |
| Credit - other | — | 23.2 | 3.1 | 26.3 | | 0.1 | 37.2 | 3.0 | 40.3 | | 0.8 | 133.6 | 8.0 | 142.4 | |
| Equities and commodities | 0.1 | 4.9 | 0.2 | 5.2 | | 0.4 | 6.1 | 0.3 | 6.8 | | 0.5 | 20.9 | 0.7 | 22.1 | |
| | 1.8 | 419.6 | 5.7 | 427.1 | | 0.8 | 434.3 | 6.4 | 441.5 | | 3.9 | 978.4 | 10.3 | 992.6 | |
| Total assets | 130.5 | 639.9 | 15.7 | 786.1 | | 146.5 | 648.5 | 13.1 | 808.1 | | 93.0 | 1,268.9 | 21.4 | 1,383.3 | |
| | | | | | | | | | | | | | | | |
| Of which: | | | | | | | | | | | | | | | |
| Core | 129.4 | 617.6 | 7.2 | 754.2 | | | | | | | | | | | |
| Non-Core | 1.1 | 22.3 | 8.5 | 31.9 | | | | | | | | | | | |
| | 130.5 | 639.9 | 15.7 | 786.1 | | | | | | | | | | | |
| Of which AFS debt securities: | | | | | | | | | | | | | | | |
| Government | 53.0 | 6.4 | — | 59.4 | | 70.1 | 7.5 | — | 77.6 | | 16.4 | 33.6 | — | 50.0 | |
| MBS | — | 31.1 | 0.4 | 31.5 | | — | 39.1 | 0.2 | 39.3 | | — | 45.6 | 0.4 | 46.0 | |
| CDOs | — | 0.6 | 1.4 | 2.0 | | — | 1.2 | 0.4 | 1.6 | | — | 3.6 | 0.6 | 4.2 | |
| CLOs | — | 3.5 | 1.5 | 5.0 | | — | 5.4 | 0.1 | 5.5 | | — | 4.7 | 0.6 | 5.3 | |
| Other ABS | — | 2.9 | 1.1 | 4.0 | | — | 4.0 | 0.6 | 4.6 | | — | 5.5 | 1.0 | 6.5 | |
| Corporate | — | 2.0 | — | 2.0 | | — | 3.3 | — | 3.3 | | 0.6 | 4.4 | 0.4 | 5.4 | |
| Banks and building societies | 0.1 | 7.1 | — | 7.2 | | 0.2 | 11.0 | — | 11.2 | | 3.8 | 9.3 | — | 13.1 | |
| Other | — | — | — | — | | — | 0.2 | — | 0.2 | | 0.1 | 2.2 | — | 2.3 | |
| | 53.1 | 53.6 | 4.4 | 111.1 | | 70.3 | 71.7 | 1.3 | 143.3 | | 20.9 | 108.9 | 3.0 | 132.8 | |
| Equity shares | 0.3 | 1.4 | 0.3 | 2.0 | | 0.5 | 1.7 | 0.7 | 2.9 | | 4.8 | 2.1 | 0.3 | 7.2 | |
| Total AFS assets | 53.4 | 55.0 | 4.7 | 113.1 | | 70.8 | 73.4 | 2.0 | 146.2 | | 25.7 | 111.0 | 3.3 | 140.0 | |
| | | | | | | | | | | | | | | | |
| Of which: | | | | | | | | | | | | | | | |
| Core | 52.8 | 49.2 | 1.0 | 103.0 | | | | | | | | | | | |
| Non-Core | 0.6 | 5.8 | 3.7 | 10.1 | | | | | | | | | | | |
| | 53.4 | 55.0 | 4.7 | 113.1 | | | | | | | | | | | |
| | | | | | | |
| | | Level 1(1) | | | Level 2 (2) | | | Level 3 (3) | | | Total | | | Level 1 (1) | | | Level 2 (2) | | | Level 3 (3) | | | Total | |
| | | £bn | | | £bn | | | £bn | | | £bn | | | £bn | | | £bn | | | £bn | | | £bn | |
| Assets | | | | | | | | | | | | | | | | | | | | | | | | |
| Fair value through profit or loss: | | | | | | | | | | | | | | | | | | | | | | | | |
| Loans and advances to banks | | | — | | | | 56.2 | | | | — | | | | 56.2 | | | | — | | | | 71.5 | | | | 0.1 | | | | 71.6 | |
| Loans and advances to customers | | | — | | | | 50.5 | | | | 3.1 | | | | 53.6 | | | | — | | | | 93.8 | | | | 13.1 | | | | 106.9 | |
| Debt securities | | | 52.8 | | | | 65.1 | | | | 3.8 | | | | 121.7 | | | | 83.1 | | | | 101.8 | | | | 11.6 | | | | 196.5 | |
| Equity shares | | | 10.6 | | | | 7.8 | | | | 0.8 | | | | 19.2 | | | | 36.5 | | | | 8.0 | | | | 0.9 | | | | 45.4 | |
| Derivatives | | | 3.9 | | | | 978.4 | | | | 10.3 | | | | 992.6 | | | | 1.9 | | | | 270.3 | | | | 5.2 | | | | 277.4 | |
| | | | 67.3 | | | | 1,158.0 | | | | 18.0 | | | | 1,243.3 | | | | 121.5 | | | | 545.4 | | | | 30.9 | | | | 697.8 | |
| Available-for-sale: | | | | | | | | | | | | | | | | | | | | | | | | | | | | | | | | |
| Debt securities | | | 20.9 | | | | 108.8 | | | | 3.1 | | | | 132.8 | | | | 32.1 | | | | 62.3 | | | | 1.1 | | | | 95.5 | |
| Equity shares | | | 4.8 | | | | 2.1 | | | | 0.3 | | | | 7.2 | | | | 5.8 | | | | 1.0 | | | | 0.8 | | | | 7.6 | |
| | | | 25.7 | | | | 110.9 | | | | 3.4 | | | | 140.0 | | | | 37.9 | | | | 63.3 | | | | 1.9 | | | | 103.1 | |
| | | | | | | | | | | | | | | | | | | | | | | | | | | | | | | | | |
| | | | 93.0 | | | | 1,268.9 | | | | 21.4 | | | | 1,383.3 | | | | 159.4 | | | | 608.7 | | | | 32.8 | | | | 800.9 | |
| Liabilities | | | | | | | | | | | | | | | | | | | | | | | | | | | | | | | | |
| Deposits by banks and customers | | | — | | | | 144.8 | | | | 0.3 | | | | 145.1 | | | | — | | | | 132.0 | | | | 1.4 | | | | 133.4 | |
| Debt securities in issue | | | — | | | | 47.0 | | | | 4.4 | | | | 51.4 | | | | — | | | | 42.1 | | | | 9.2 | | | | 51.3 | |
| Short positions | | | 36.0 | | | | 6.5 | | | | — | | | 42.5 | | | | 63.6 | | | | 9.9 | | | | — | | | | 73.5 | |
| Derivatives | | | 3.6 | | | | 963.8 | | | | 4.0 | | | | 971.4 | | | | 2.1 | | | | 265.6 | | | | 4.4 | | | | 272.1 | |
Other financial liabilities (4) | | | — | | | | 1.5 | | | | 0.3 | | | | 1.8 | | | | — | | | | 0.9 | | | | 0.2 | | | | 1.1 | |
| | | | 39.6 | | | | 1,163.8 | | | | 9.0 | | | | 1,212.2 | | | | 65.7 | | | | 450.5 | | | | 15.2 | | | | 531.4 | |
Notes on the accounts continued | Financial statements |
| | 2010 | | 2009 | | 2008 |
| | Level 1 | Level 2 | Level 3 | Total | | Level 1 | Level 2 | Level 3 | Total | | Level 1 | Level 2 | Level 3 | Total |
| | £bn | £bn | £bn | £bn | | £bn | £bn | £bn | £bn | | £bn | £bn | £bn | £bn |
| Liabilities | | | | | | | | | | | | | | |
| Deposits by banks | | | | | | | | | | | | | | |
| Repos | — | 20.6 | — | 20.6 | | — | 21.0 | — | 21.0 | | — | 43.1 | — | 43.1 |
| Collateral | — | 26.6 | — | 26.6 | | — | 28.2 | — | 28.2 | | — | 33.2 | — | 33.2 |
| Other | — | 1.6 | — | 1.6 | | — | 4.4 | — | 4.4 | | — | 4.8 | — | 4.8 |
| | — | 48.8 | — | 48.8 | | — | 53.6 | — | 53.6 | | — | 81.1 | — | 81.1 |
| Customer accounts | | | | | | | | | | | | | | |
| Repos | — | 53.0 | — | 53.0 | | — | 41.5 | — | 41.5 | | — | 39.9 | — | 39.9 |
| Collateral | — | 10.4 | — | 10.4 | | — | 8.0 | — | 8.0 | | — | 12.4 | — | 12.4 |
| Other | — | 8.7 | 0.1 | 8.8 | | — | 11.8 | 0.1 | 11.9 | | — | 11.4 | 0.3 | 11.7 |
| | — | 72.1 | 0.1 | 72.2 | | — | 61.3 | 0.1 | 61.4 | | — | 63.7 | 0.3 | 64.0 |
| Debt securities in issue | — | 49.0 | 2.2 | 51.2 | | — | 43.2 | 2.3 | 45.5 | | — | 47.0 | 4.4 | 51.4 |
| Short positions | 35.0 | 7.3 | 0.8 | 43.1 | | 27.1 | 13.2 | 0.2 | 40.5 | | 36.0 | 6.5 | — | 42.5 |
| Derivatives | | | | | | | | | | | | | | |
| Foreign exchange | 0.1 | 89.3 | — | 89.4 | | — | 63.9 | — | 63.9 | | 2.2 | 171.2 | — | 173.4 |
| Interest rate | 0.2 | 298.0 | 1.0 | 299.2 | | 0.1 | 310.5 | 0.8 | 311.4 | | 0.4 | 639.7 | 0.9 | 641.0 |
| Credit | — | 25.0 | 0.3 | 25.3 | | — | 38.1 | 1.0 | 39.1 | | 0.1 | 130.0 | 2.6 | 132.7 |
| Equities and commodities | 0.1 | 9.6 | 0.4 | 10.1 | | 1.0 | 8.5 | 0.2 | 9.7 | | 0.9 | 22.9 | 0.5 | 24.3 |
| | 0.4 | 421.9 | 1.7 | 424.0 | | 1.1 | 421.0 | 2.0 | 424.1 | | 3.6 | 963.8 | 4.0 | 971.4 |
Other (3) | — | 1.1 | — | 1.1 | | — | 1.3 | — | 1.3 | | — | 1.5 | 0.3 | 1.8 |
| Total liabilities | 35.4 | 600.2 | 4.8 | 640.4 | | 28.2 | 593.6 | 4.6 | 626.4 | | 39.6 | 1,163.6 | 9.0 | 1,212.2 |
| | | | | | | | | | | | | | | |
| Of which: | | | | | | | | | | | | | | |
| Core | 35.4 | 586.9 | 3.8 | 626.1 | | | | | | | | | | |
| Non-Core | — | 13.3 | 1.0 | 14.3 | | | | | | | | | | |
| | 35.4 | 600.2 | 4.8 | 640.4 | | | | | | | | | | |
For notes relating to this table refer to page 258.
Notes on the accounts continued | Financial statements |
12 Financial instruments - valuation continued
The table below analyses level 3 balances and related valuation sensitivities.
| | 2010 | | 2009 | | |
| | | Sensitivity (2) | | | Sensitivity (2) | | |
| | Balance | Favourable | Unfavourable | | Balance | Favourable | Unfavourable | | |
| | £bn | £m | £m | | £bn | £m | £m | | Assumptions |
| Assets | | | | | | | | | |
| Loans and advances | 0.8 | 70 | (60) | | 1.1 | 80 | (40) | | Credit spreads, indices |
| Debt securities | | | | | | | | | |
| MBS | 0.7 | 120 | (80) | | 0.6 | 60 | (10) | | Prepayment rates, probability of default, loss severity and yield |
| CDOs | 2.4 | 180 | (20) | | 1.0 | 130 | (80) | | Implied collateral valuation, default rates, housing prices, correlation |
| CLOs | 2.1 | 180 | (50) | | 0.8 | 80 | (50) | | Credit spreads, recovery rates, correlation |
| Other ABS | 1.4 | 150 | (80) | | 0.9 | 120 | (40) | | Credit spreads |
| Corporate | 0.9 | 60 | (60) | | 0.6 | 70 | (20) | | Credit spreads |
| Bank and building societies | 0.7 | 60 | (60) | | 0.2 | 10 | (30) | | Credit spreads |
| | 8.2 | 750 | (350) | | 4.1 | 470 | (230) | | |
| Equity shares | 1.0 | 160 | (160) | | 1.5 | 280 | (220) | | Fund valuation |
| Derivatives | | | | | | | | | |
| Foreign exchange | 0.1 | — | — | | 0.2 | 10 | — | | Volatility, correlation |
| Interest rate | 1.7 | 150 | (140) | | 1.5 | 80 | (100) | | Volatility, correlation |
| Credit - APS | 0.6 | 860 | (940) | | 1.4 | 1,370 | (1,540) | | Credit spreads, correlation, expected losses, discount rate recoveries, loss credits |
| Credit - other | 3.1 | 320 | (170) | | 3.0 | 420 | (360) | | Counterparty credit risk, correlation, volatility |
| Equities and commodities | 0.2 | — | — | | 0.3 | 20 | (20) | | Correlation, dividends |
| | 5.7 | 1,330 | (1,250) | | 6.4 | 1,900 | (2,020) | | |
| Total assets | 15.7 | 2,310 | (1,820) | | 13.1 | 2,730 | (2,510) | | |
| | | | | | | | | | |
| Total assets - 2008 | | | | | 21.4 | 1,880 | (2,200) | | |
| | | | | | | | | | |
| Of which AFS debt securities: | | | | | | | | | |
| MBS | 0.4 | 10 | — | | 0.2 | — | — | | |
| CDOs | 1.4 | 100 | (10) | | 0.4 | 40 | (20) | | |
| CLOs | 1.5 | 110 | (10) | | 0.1 | 10 | (10) | | |
| Other ABS | 1.1 | 80 | (40) | | 0.6 | 40 | (20) | | |
| | 4.4 | 300 | (60) | | 1.3 | 90 | (50) | | |
| Equity shares | 0.3 | 60 | (60) | | 0.7 | 100 | (90) | | |
| Total AFS assets | 4.7 | 360 | (120) | | 2.0 | 190 | (140) | | |
| | | | | | | | | | |
| Total AFS assets - 2008 | | | | | 3.3 | 150 | (230) | | |
For notes relating to this table refer to page 258.
Notes on the accounts continued | Financial statements |
| | 2010 | | 2009 | | |
| | | Sensitivity (2) | | | Sensitivity (2) | | |
| | Balance | Favourable | Unfavourable | | Balance | Favourable | Unfavourable | | |
| | £bn | £m | £m | | £bn | £m | £m | | Assumptions |
| Liabilities | | | | | | | | | |
| Customer accounts - other | 0.1 | 60 | (60) | | 0.1 | — | (10) | | Credit spreads, correlation |
| Debt securities in issue | 2.2 | 90 | (110) | | 2.3 | 50 | (10) | | Volatility, correlation |
| Short positions | 0.8 | 20 | (50) | | 0.2 | 10 | (20) | | Credit spreads, correlation |
| Derivatives | | | | | | | | | |
| Foreign exchange | — | — | (10) | | — | — | — | | |
| Interest rate | 1.0 | 70 | (90) | | 0.8 | 40 | (60) | | Volatility, correlation |
| Credit - other | 0.3 | 40 | (40) | | 1.0 | 80 | (100) | | Counterparty credit risk, correlation, volatility |
| Equity and commodities | 0.4 | 10 | — | | 0.2 | 20 | (70) | | Correlation, dividends |
| | 1.7 | 120 | (140) | | 2.0 | 140 | (230) | | |
| | 4.8 | 290 | (360) | | 4.6 | 200 | (270) | | |
| | | | | | | | | | |
| Total liabilities - 2008 | | | | | 9.0 | 550 | (490) | | |
| (1) | ValuedLevel 1: valued using unadjusted quoted prices in active markets, for identical financial instruments. This category includesExamples include G10 government securities, listed equity shares, certain exchange-traded derivatives G10 government securities and certain US agency securities. |
(2) | ValuedLevel 2: valued using techniques based significantly on observable market data. Instruments in this category are valued using: |
| (a) | quoted prices for similar instruments or identical instruments in markets which are not considered to be active; or |
| | valuation techniques where all the inputs that have a significant effect on the valuationvaluations are directly or indirectly based on observable market data. |
The type of instruments that trade in markets that are not considered to be active, but are based on quoted market prices, brokerbanker dealer quotations, or alternative pricing sources with reasonable levels of price transparency and those instruments valued using techniques include most government agency securities, investment-grade corporate bonds, certain mortgage products, certainmost bank and bridge loans, repos and reverse repos, less liquid listed equities, state and municipal obligations, most physical commodities, investment contracts issued by the Group’sGroup's life assurance businesses(2009 and 2008) and certain money market securities and loan commitments and most OTC derivatives.
(3) | Instruments in this category have been valued using a valuation technique where at least one input (which could have a significant effect on the instrument’s valuation) is not based on observable market data. Where inputs can be observed from market data without undue cost and effort, the observed input is used. Otherwise, the Group determines a reasonable level for the input. |
Level 3: instruments in this category have been valued using a valuation technique where at least one input which could have a significant effect on the instrument’s valuation, is not based on observable market data. Where inputs can be observed from market data without undue cost and effort, the observed input is used. Otherwise, the Group determines a reasonable level for the input. Financial instruments included within level 3 of the fair value hierarchy primarily consist ofinclude cash instruments which trade infrequently, certain syndicated and commercial mortgage loans, unlisted equity shares, certain residual interests in securitisations, super senior tranches of high grade and mezzanine collateralised debt obligations (CDOs), andCDOs, other mortgage-based products and less liquid debt securities, certain structured debt securities in issue, and OTC derivatives where valuation depends upon unobservable inputs such as certain credit and exotic derivatives. No gain or loss is recognised on the initial recognition of a financial instrument valued using a technique incorporating significant unobservable data.
(4)(2) | Other financial liabilities compriseSensitivity represents the favourable and unfavourable effect on the income statement or the statement of comprehensive income due to reasonably possible changes to valuations using reasonably possible alternative inputs to the Group's valuation techniques or models. Totals for sensitivities are not indicative of the total potential effect on the income statement or the statement of comprehensive income. |
| (3) | Comprise subordinated liabilitiesliabilities. |
The level 3 sensitivities above are calculated at a trade or low level portfolio basis. They are not calculated on an overall portfolio basis and therefore do not reflect the likely overall potential uncertainty on the whole portfolio. The figures are aggregated and do not reflect the correlated nature of some of the sensitivities. In particular, for some of the portfolios the sensitivities may be negatively correlated where a downwards movement in one asset would produce an upwards movement in another, but due to the additive presentation of the above figures this correlation cannot be observed. For example, with assets in the APS scheme, the downwards sensitivity on the underlying asset would be materially offset by the consequent upward movement of the APS derivative, so whilst the net sensitivity of the two positions may be lower, it would be shown with the gross upside and downside sensitivity of the two assets inflating the overall sensitivity figures in the above table. The actual potential downside sensitivity of the total portfolio may be less than the non-correlated sum of the additive figures as shown in the above table.
Key points
| · | Level 3 assets of £15.7 billion represented 2.0% (2009 - £13.1 billion and write downs relating1.6%) of total assets carried at fair value, an increase of £2.6 billion, reflecting the movement of some lower quality AFS CDOs and CLOs in Non-Core in Q1 2010, where price discovery indicated uncertainty in observability. In addition, the use of more conservative internal recovery rates for the calculation of CVA for certain monolines resulted in these credit derivatives moving to undrawn syndicated loan facilities.level 3. This was partially offset by disposals in Q3 2010 and tighter credit spreads. The fair value of APS credit derivative decreased from £1,400 million to £550 million primarily due to the reduction in overall assets covered by the scheme. |
| · | Level 3 liabilities increased to £4.8 billion, mainly reflecting the impact of wider credit spreads on short positions. |
| · | The favourable and unfavourable effects of reasonably possible alternative assumptions on financial instruments carried at fair value were £2,310 million and (£1,820) million respectively of which £860 million and (£940) million related to the APS credit derivative. The reduction in the APS sensitivity corresponds with a decrease in the overall value of the protection that the scheme provides. |
Notes on the accounts continued | Financial statements |
12 Financial instruments - valuation continued
11 FinancialJudgmental issues
The diverse range of products traded by the Group results in a wide range of instruments (continued)
Level 3 loans and advances decreased by £10 billion, primarily reflecting reclassificationthat are classified into the three level hierarchy. Whilst the majority of certain loans (leveraged finance and other corporate loans) to loans and receivables (LAR) and fair value adjustments on the remaining portfolio at the endthese instruments naturally fall into a particular level, for some products an element of judgment is required. The majority of the year.
Debt securities categorised as level 3 at the end of the year include £5.2 billion of asset-backed securities and £1.7 billion of corporate and other debt securities. The decrease during the year reflects termination of a deal in early 2008, reclassification of illiquid mortgage-backed securities (MBS) to loans and receivables, fair value changes, and the transfer of certain previous illiquid MBS, primarily sub-prime from level 3 to level 2.
Level 3 derivative assets at 31 December 2008 include credit derivative trades with credit derivative product companies (CDPCs) with a fair value of £3.5 billion after credit valuation adjustments of £1.3 billion. At 31 December 2007 these credit derivative trades with CDPCs had a fair value of £0.8 billion after a credit valuation of £44 million and were included within level 2 of the fair value hierarchy. Other level 3 derivative assets at 31 December 2008 include illiquid credit default swaps (CDSs), other credit derivatives, commodity derivatives and illiquid interest rate derivatives.
Debt securities in issue, categorised as level 3, were structured medium term notes and the decrease in the year primarily reflects the termination of a deal in the first half of 2008.
The tables below presents the Level 3Group’s financial instruments carried at fair value are classified as level 2: inputs are observable either directly (i.e. as a price) or indirectly (i.e. derived from prices).
Active and inactive markets
A key input in the decision making process for the allocation of assets to a particular level is liquidity. In general, the degree of valuation uncertainty depends on the degree of liquidity of an input. For example, a derivative can be placed into level 2 or level 3 dependent upon its liquidity.
Where markets are liquid or very liquid, little judgment is required. However, when the information regarding the liquidity in a particular market is not clear, a judgment may need to be made. This can be made more difficult as assessing the liquidity of a market may not always be straightforward. For an equity traded on an exchange, daily volumes of trading can be seen, but for an-over-the counter (OTC) derivative assessing the liquidity of the market with no central exchange can be more difficult.
A key related issue is where a market moves from liquid to illiquid or vice versa. Where this change is considered to be temporary, the classification is not changed. For example, if there is little market trading in a product on a reporting date but at the balance sheetprevious reporting date and during the intervening period the market has been considered to be liquid, the instrument will continue to be classified in the same level in the hierarchy. This is to provide consistency so that transfers between levels are driven by genuine changes in market liquidity and do not reflect short term or seasonal effects.
Interaction with the IPV process
The determination of an instrument’s level cannot be made at a global product level as a single product type can be in more than one level. For example, a single name corporate credit default swap could be in level 2 or level 3 depending on whether the reference counterparty is liquid or illiquid.
As part of the Group’s IPV process, data is gathered at a trade level from market trading activity, trading systems, pricing services, consensus pricing providers, brokers and research material amongst other sources.
The breadth and detail of this data allows a good assessment to be made of liquidity and pricing uncertainty, which assists with the process of allocation to an appropriate level. Where suitable independent pricing information is not readily available the instrument will be considered to be level 3.
Modelled products
For modelled products the market convention is to quote these trades through the model inputs or parameters as opposed to a cash price equivalent. A mark-to-market is derived from the use of the independent market inputs calculated using the Group’s model.
The decision to classify a modelled asset as level 2 or 3 will be dependent upon the product/model combination, the currency, the maturity, the observability of input parameters and other factors. All these need to be assessed to classify the asset.
An assessment is made of each input into a model. There may be multiple inputs into a model and each is assessed in turn for observability and quality. If an input fails the observability or quality tests then the instrument is considered to be in level 3 unless the input can be shown to have an insignificant effect on the overall valuation of the product.
The majority of derivative instruments are classified as level 2 as they are vanilla products valued using observable inputs. The valuation uncertainty on these is considered to be low and both input and output testing may be available. Examples of these products would be vanilla interest rate swaps, foreign exchange swaps and liquid single name credit derivatives.
Non-modelled products
Non-modelled products are generally quoted on a price basis main assumptionsand can therefore be considered for each of the 3 levels. This is determined by the liquidity and valuation uncertainty of the instruments which is in turn measured from the availability of independent data used by the IPV process.
The availability and quality of independent pricing information is considered during the classification process. An assessment is made regarding the quality of the independent information. For example where consensus prices are used for non-modelled products, a key assessment of the quality of a price is the depth of the number of prices used to provide the consensus price. If the depth of contributors falls below a set hurdle rate, the instrument is considered to be level 3. This hurdle rate is consistent with the rate used in the valuationIPV process to determine whether or not the data is of sufficient quality to adjust the instrument’s valuations. However where an instrument is generally considered to be illiquid, but regular quotes from market participants exist, these instruments may be cl assified as level 2 depending on frequency of quotes, other available pricing and reasonably possible increaseswhether the quotes are used as part of the IPV process or decreases in fair value based on reasonably possible alternative assumptions:
| | | | | | | | | Reasonably possible alternative assumptions | |
| Assets | Valuation basis/ technique | | Main assumptions | | Carrying value £bn | | | Increase in fair value £m | | | Decrease in fair value £m | |
| Loans and advances | Proprietary model | | Credit spreads, indices | | | 3.1 | | | | 70 | | | | 50 | |
| Debt securities: | | | | | | | | | | | | | | | |
– RMBS (1) | Industry standard model | | Prepayment rates, probability of | | | | | | | | | | | | |
| | | | default, loss severity and yield | | | 0.5 | | | | 40 | | | | 90 | |
– CMBS (2) | Industry standard model | | Prepayment rates, probability of | | | | | | | | | | | | |
| | | | default, loss severity and yield | | | 0.6 | | | | 30 | | | | 30 | |
| – CDOs | Proprietary model | | Implied collateral | | | | | | | | | | | | |
| | | | valuation, defaults rates, | | | | | | | | | | | | |
| | | | housing prices, correlation | | | 1.7 | | | | 410 | | | | 440 | |
– CLOs (3) | Industry standard simulation model | | Credit spreads | | | | | | | | | | | | |
| | | | recovery rates, correlation | | | 1.0 | | | | 40 | | | | 40 | |
| – Other | Proprietary model | | Credit spreads | | | 3.1 | | | | 50 | | | | 50 | |
| Derivatives | | | | | | | | | | | | | | | |
| – credit | Proprietary CVA model, industry | | Counterparty credit risk, | | | | | | | | | | | | |
| | option models, correlation model | | correlation, volatility | | | 8.0 | | | | 1,030 | | | | 1,200 | |
| – equity | Proprietary model | | Volatility, correlation, dividends | | | 0.1 | | | | – | | | | 10 | |
| – interest rate and commodity | Proprietary model | | Volatility, correlation | | | 2.2 | | | | 130 | | | | 130 | |
| Equity shares – private equity | Valuation statements | | Fund valuations | | | 1.1 | | | | 80 | | | | 160 | |
| 31 December 2008 | | | | | | 21.4 | | | | 1,880 | | | | 2,200 | |
| | | | | | | | | | | | | | | | |
| 31 December 2007 | | | | | | 32.7 | | | | 610 | | | | 700 | |
(1) Residential mortgage-backed securities.
(2) Commercial mortgage-backed securities.
(3) Collateralised loan obligations.
not.
Notes on the accounts continued | Financial statements |
TableFor some instruments with a wide number of Contentsavailable price sources, there may be differing quality of available information and there may be a wide range of prices from different sources. In these situations an assessment is made as to which source is the highest quality and this will be used to determine the classification of the asset. For example,| | | | | | | | | Reasonably possible alternative assumptions | |
| Liabilities | Valuation basis/ technique | | Main assumptions | | Carrying amount £bn | | | Increase fair value £m | | | Decrease fair value £m | |
| Debt securities in issue | Proprietary model | | Credit spreads | | | 4.4 | | | | 170 | | | | 190 | |
| Derivatives | | | | | | | | | | | | | | | |
| Credit derivatives | Proprietary CVA model, | | Counterparty credit risk | | | | | | | | | | | | |
| | industry option models, correlation model | | correlation, volatility | | | 2.6 | | | | 160 | | | | 180 | |
| Other derivatives | Proprietary model | | Volatility, correlation | | | 1.4 | | | | 120 | | | | 120 | |
| Other portfolios | Proprietary model | | Credit spreads, correlation | | | 0.6 | | | | 40 | | | | 60 | |
| 31 December 2008 | | | | | | 9.0 | | | | 490 | | | | 550 | |
| | | | | | | | | | | | | | | | |
| 31 December 2007 | | | | | | 15.3 | | | | 120 | | | | 120 | |
Instruments that cross levels
Some instruments will predominantly be in one level or the other, but others may cross between levels. For example, a cross currency swap may be between very liquid currency pairs where pricing is readily observed in the market and will therefore be classified as level 2. The cross currency swap may also be between two illiquid currency pairs in which case the swap would be placed into level 3. Defining the difference between liquid and illiquid may be based upon the number of consensus providers the consensus price is made up from and whether the consensus price can be supplemented by other sources.
Certain portfolios in level 2 contain instruments whose fair values incorporate the judgements discussed above. These include a portfolio of ABS in Non-Core of £5.7 billion that had more than average level of valuation uncertainty with a range of £5.6 billion to £5.9 billion using alternative valuation assumptions.
Level 3 portfolios and sensitivity methodologies
For each of the portfolio categories shown in the tables above, table, set out below isthere follows a description of the types of products that comprise the portfolio and the valuation techniques that are applied in determining fair value, including a description of valuation techniques used including for those in levellevels 2 and 3 and inputs to those models and techniques. Where reasonably possible alternative assumptions of unobservable inputs used in models would change the fair value of the portfolio significantly, the alternative inputs are indicated along with the impact this would have on the fair value.indicated. Where there have been significant changes to valuation techniques during the year a discussion of the reasons for this are also included.
Loans and advances to customers
Loans in level 3 primarily comprise US commercial mortgages and syndicated loans.mortgages.
Commercial mortgages
These senior and mezzanine commercial mortgages are loans secured on commercial land and buildings that were originated or acquired by GBMthe Group for securitisation. Senior commercial mortgages carry a variable interest rate and mezzanine or more junior commercial mortgages may carry a fixed or variable interest rate. Factors affecting the value of these loans may include, but are not limited to, loan type, underlying property type and geographic location, loan interest rate, loan to value ratios, debt service coverage ratios, prepayment rates, cumulative loan loss information, yields, investor demand, market volatility since the last securitisation, and credit enhancement. Where observable market prices for a particular loan are not available, the fair value will typically be determined with reference to observable market transactions in other loansloan s or credit related products including debt securities and credit derivatives. Assumptions are made about the relationship between the loan and the available benchmark data. Using reasonably possible alternative assumptions for credit spreads (taking into account all other applicable factors) would reduce the fair value of these mortgages of £1.1 billion by up to £18 million or increase the fair value by up to £25 million.
Syndicated lending
The Group’s syndicated lending activities are conducted by the syndicate business in conjunction with the various product lines covering corporate, leveraged, real estate and project finance activities. When a commitment to lend is entered into, the Group estimates the proportion of the loan that is intended to be held for trading on draw down, and the proportion it anticipates to retain on its balance sheet as a loan and receivable. Where the commitment is intended to be syndicated, the commitment to lend is fair valued through profit or loss. On drawdown, the portion of the loan expected to be syndicated is recorded at fair value as a held-for-trading asset, and the expected hold portion is measured at amortised cost less, where appropriate, impairment.
The Group values the portion of the loan expected to be syndicated held at fair value by using market observable syndication prices in the same or similar assets. Where these prices are not available, a discounted cash flow model is used. The model incorporates observable assumptions such as current interest rates and yield curves, the notional and tender amount of the loan, and counterparty credit quality where it is derived from credit default swap spreads using market indices. The model also incorporates unobservable assumptions, including expected refinancing periods, and counterparty credit quality where it is derived from the Group’s internal risk assessments. Derivatives arising from commitments to lend are measured using the same model, based on proxy notional amounts.
Using reasonably possible alternative assumptions for expected cash flows to value these assets of £2.0 billion would reduce the fair value by up to £32 million or increase the fair value by up to £45 million. The assumptions to determine these amounts were based on restructuring scenarios and expected margins.
Debt securities
Residential mortgage backed securities (RMBS)RMBS
RMBS where the underlying assets are US agency-backed mortgages and there is regular trading are generally classified as level 2 in the fair value hierarchy. RMBS are also classified as level 2 when regular trading is not prevalent in the market, but similar executed trades or third-party data including indices, broker quotes and pricing services can be used to substantiate the fair value. RMBS are classified as level 3 when trading activity is not available and a model is utilised which useswith significant unobservable data.data is utilised.
In determining whether an instrument is similar to that being valued, the Group considers a range of factors, principally: the lending standards of the brokers and underwriters that originated the mortgages, the lead manager of the security, the issue date of the respective securities, the underlying asset composition (including origination date, loan to value ratios, historic loss information and geographic location of the mortgages), the credit rating of the instrument, and any credit protection that the instrument may benefit from, such as insurance wraps or subordinated tranches. Where there are instances of market observable data for several similar RMBS tranches, the Group considers the extent of similar characteristics shared with the instrument being valued, together with the frequency,
11 Financial instruments (continued)
tenor and nature of the trades that have been observed.observed . This method is most frequently used for US and UK RMBS. The RMBS of Dutch and Spanish originated mortgages guaranteed by those governments are valued using the credit spreads of the respective government debt and certain assumptions made by the Group, or based on observable prices from Bloomberg or consensus pricing services.
Where there is an absence of trading activity, models are used. The Group primarily uses an industry standard model to project the expected future cash flows to be received from the underlying mortgages and to forecast how these cash flows will be distributed to the various holders of the RMBS. This model utilises data provided by the servicer of the underlying mortgage portfolio, layering on assumptions for mortgage prepayments, probability of default, expected losses, and yield. The Group uses data from third-party sources to calibrate its assumptions, including pricing information from third partythird-party pricing services, independent research, broker quotes, and other independent sources. An assessment is made of third-party data source to determine its applicability and reliability. The Group adjusts the model price with a liquidity premium to reflect the price that the instrument could be traded at in the market and may also make adjustments for model deficiencies.
The weighted average of the key significant inputs utilised in valuing US level 3 RMBS positions are shown in the table below.
| | Weighted-average inputs | |
| 2008 | Non-agency prime RMBS | | | Alt-A RMBS | |
| Yield | 11.02% | | | 20.69% | |
| Probability of default | 3.00 CDR | (2) | | 40.00 CDR | (1) |
| Loss severity | 45.00% | (2) | | 52.25% | (2) |
| Prepayment | 12.67 CPR | | | 10.65 CPR | |
Notes:
(1) Constant default rate or probability of default.
(2) Constant prepayment rate.
The fair value of securities within each class of asset changes on a broadly consistent basis in response to changes in given market factors. However, the extent of the change, and therefore the range of reasonably possible alternative assumptions, may be either more or less pronounced, depending on the particular terms and circumstances of the individual security. Through most of 2008, while default rates on sub-prime mortgages were on the rise, there was less transparency and historical data to predict future defaults on both Alt-A and prime securities. As such, theThe Group feltbelieves that probability of default was the least transparent input into Alt-A and prime RMBS modelled valuations throughout 2008 (and most sensitive to variations). The Group believes that a range of 500 basis points greater than and 500 basis points less than the weighted average constant default rate, and a range of 200 basis points greater than and 200 basis points less than the weighted average constant default rate represents a reasonably possible set of acceptable pricing alternatives for Alt-A and prime RMBS, respectively. These assumptions consider the inherently risky nature of Alt-A over prime securities, as well as declining economic conditions leading to an increased likelihood of default at year-end. While other key inputs may possess characteristics of unobservability in both Alt-A and prime modelled valuations, the effect of utilising reasonably possible alternatives for these respective inputs would have an immaterial effect on the overall valuation. Using these reasonably possible alternative assumptions the fair value of RMBS of £0.5 billion would be £90 million lower or £40 million higher.
Notes on the accounts continued | Financial statements |
12 Financial instruments - valuation continued
Commercial mortgage backed securities
CMBS isare valued using an industry standard model and the inputs, where possible, are corroborated using observable market data.
For senior CMBS and subordinated tranches, the Group determined that the most sensitive input to reasonably possible alternatives valuation is probability of default and yield respectively. Using reasonably possible alternative assumptions for these inputs, the fair value of CMBS of £0.6 billion would be £30 million lower or £30 million higher.
Collateralised debt obligations
CDOs purchased from third partiesthird-parties are valued using independent, third- partythird-party quotes or independent lead manager indicative prices. For super senior CDOs which have been originated by the Group no specific third- partythird-party information is available. The valuation of these super senior CDOs therefore takes into consideration outputs from a proprietary model, market data and appropriate valuation adjustments.
The Group’s proprietary model calculates the expected cashflows from the underlying mortgages using assumptions, derived from publicly available data on future macroeconomic conditions (including house price appreciation and depreciation) and on defaults and delinquencies on these underlying mortgages. The model used by the Group comprises an econometric loan-level model which provides the input to an industry standard ABS model, the output of which feeds a proprietary model generating expected cashflows which are discounted using a risk adjusted rate.
Due to the subjectivity of the inputs to the pricing model, alternative valuation points are constructed to benchmark the output of the model. These valuation points include determining an ABS index implied collateral valuation, which provides a market calibrated valuation data point. A collateral net asset value methodology is also considered which usesusing dealer buy side marks is used to determine an upper bound for super senior CDO valuations. An ABS index implied collateral valuation is also used to provide a market calibrated valuation data point. Both the ABS index implied valuation and the collateral net asset value methodology apply an assumed immediate liquidation approach.
The Group, using all pricing points available, may make necessary and appropriate valuation adjustments to the pricing information derived from the proprietary model. These adjustments reflect the Group’s assessment of factors that market participants would consider in setting a price, to the extent that these factors that have not already been included in the model and may include adjustments made for liquidity discounts.
In order to provide disclosures of the valuation of super senior CDOs using reasonably possible alternative assumptions, the Group has considered macroeconomic conditions, including house price appreciation and depreciation, and the effect of regional variations. The output from using these alternative assumptions has been compared with inferred pricing from other published data. The Group believes that reasonably possible alternative assumptions could reduce or increase valuations by up to 4%. Using these alternative assumptions would reduce the fair value of level 3 CDOs of £1.7 billion by up to £440 million (super senior CDOs: £292 million) and increase the fair value by up to £410 million (super senior CDOs: £ 292 million).
Collateralised loan obligations
To determine the fair value of CLOs purchased from third parties, the Group useuses third-party broker or lead manager quotes as the primary pricing source. These quotes are benchmarked to consensus pricing sources where they are available.
For CLOs originated and still held by the Group, the fair value is determined using a correlation model based on a Monte Carlo simulation framework. The main model inputs are credit spreads and recovery rates of the underlying assets and their correlation. A credit curve is assigned to each underlying asset based on prices from third- partythird-party dealer quotes and cash flow profiles, sourced from an industry standard model. Losses are calculated taking into account the attachment and detachment point of the exposure. AsWhere the correlation inputs to this model are not observable, CLOs are deemed to beclassified as level 3. Using reasonably possible alternative assumptions the fair value of CLOs of £1.0 billion would be £40 million lower or £40 million higher.
Other asset-backed and corporate debt securities
Other level 3 debt securities comprise £1.4 billion of other ABS and £1.7 billion of other debt securities. Where observable market prices for a particular debt security are not available, the fair value will typically be determined with reference to observable market transactions in other related products, such as similar debt securities or credit derivatives. Assumptions are made about the relationship between the individual debt security and the available benchmark data. Where significant management judgementjudgment has been applied in identifying the most relevant related product, or in determining the relationship between the related product and the instrument itself, the valuationinstrument is shownclassified as level 3.
Equity shares
Private equity investments include unit holdings and limited partnership interests primarily in level 3. Using differing assumptions about this relationship would result in different fair values for these assets. The main assumption made is thatcorporate private equity funds, debt funds and fund of relative creditworthiness. Using reasonably possible alternative assumption credit assumptions, taking into account the underlying currency, tenor, and rating of the debt securities within each portfolio, would reducehedge funds. Externally managed funds are valued using recent prices where available. Where not available, the fair value of investments in externally managed funds is generally determined using statements or other debt securitiesinformation provided by the fund managers.
The Group considers that valuations may rely significantly on the judgments and estimates made by the fund managers, particularly in assessing private equity components. Given the decline in liquidity in world markets, and the level of £3.1 billion by up to £50 million or increase the fair value by up to £50 million.subjectivity, these are included in level 3.
Derivatives
Level 3 derivative assets comprised credit derivatives of £8.0 billion, equity derivatives of £0.1 billion and interest rate, foreign exchange rate and commodity derivative contracts of £2.2 billion. Derivative liabilities comprise credit derivatives of £2.6 billion interest rate, foreign exchange rate and commodity derivatives contracts of £1.4 billion.
Derivatives are priced using quoted prices for the same or similar instruments where these are available. However, the majority of derivatives are valued using pricing models. Inputs for these models are usually observed directly in the market, or derived from observed prices. However, it is not always possible to observe or corroborate all model inputs. Unobservable inputs used are based on estimates taking into account a range of available information including historic analysis, historic traded levels, market practice, comparison to other relevant benchmark observable data and consensus pricing data.
Credit derivatives - APS
The Group’sGroup purchased credit protection over a portfolio of specified assets and exposures (covered assets) from HMT. The Group has a right to terminate the APS at any time provided that the Financial Services Authority has confirmed in writing to HMT that it has no objection to the proposed termination. On termination the Group must pay HMT the higher of the regulatory capital relief received and £2.5 billion less premiums paid plus the aggregate of amounts received from the UK Government under the APS. In consideration for the protection provided by the APS, the Group paid an initial premium of £1.4 billion on 31 December 2009. A further premium of £700 million was paid on 31 December 2010. Quarterly premiums of £125 million will be payable from 31 December 2011 and subsequently until the earlier of 2099 and the termination of t he agreement.
The APS is a single contract providing credit protection in respect of the covered assets. Under IFRS, credit protection is treated either as a financial guarantee contract or as a derivative financial instrument depending on the terms of the agreement and the nature of the protected assets and exposures. The Group has concluded, principally because the covered portfolio includes significant exposure in the form of derivatives, that the APS does not meet the criteria to be treated as a financial guarantee contract. The contract has therefore been accounted for as a derivative financial instrument. It was recognised initially and measured subsequently at fair value with changes in fair value recognised in profit or loss within income from trading activities. There is no change in the recognition and measurement of the covered assets as a result of t he APS.
Where protection is provided on a particular seniority of exposure, as is the case with the APS, which requires initial losses to be taken by the Group, it is termed ‘tranched’ protection. The model being used to value the APS - a Gaussian Copula model with stochastic recoveries - is used by the Group to value tranches traded by the exotic credit desk and is a model that is currently used within the wider market.
The option to exit the APS is not usually present in such tranched trades and consequently, there is no standard market practice for reflecting this part of the trade within the standard model framework. The approach that has been adopted assumes that the Group will not exit the trade before the minimum level of fees has been paid and at this point it will be clear whether it should exit the trade or not. The APS derivative is valued as the payment of the minimum level of fees in return for protection receipts which are in excess of both the first loss and the total future premiums.
Notes on the accounts continued | Financial statements |
The model primarily uses the following inputs in relation to each individual asset: notional, maturity, probability of default and expected recovery rate given default. Other key inputs include: the correlation between the underlying assets; the range of possible recovery rates on the underlying assets (“alpha”); the size of the first loss; and the level of expected losses on covered assets that have been sold, that can be treated as losses for the purpose of the APS (“loss credits”).
During 2010, refinements were made to the treatment of derivative trades in the valuation model. This followed a change in the nature of protection provided in relation to certain structured credit trades involving mainly asset backed securities and associated bought protection credit derivatives: the risk of losses arising on the derivative trades due to counterparty risk was replaced by the risk of incurring losses on the underlying asset backed securities that are not recovered through the derivative trades. The valuation refinements were made to accurately reflect the impact of this change and ensure a consistent treatment across all derivative trades.
The APS protects a wide range of asset types, and hence, the correlation between the underlying assets cannot be observed from market data. In the absence of this, the Group determines a reasonable level for this input. The expected recovery rate given default is based on internally assessed levels. The probability of default is calculated with reference to data observable in the market. Where possible, data is obtained for each asset within the APS, but for most of the assets, such observable data does not exist. In these cases, this important input is determined from information available for similar entities by geography and rating. The approach for doing this was refined during the year in order to accurately reflect both changes in market conditions and the profile of the portfolio of covered assets.
As the inputs into the valuation model are not all observable the APS derivative is a level 3 asset. The fair value of the credit protection at 31 December 2010 was £0.55 billion (2009 - £1.40 billion).
The Group has used the following reasonably possible alternative assumptions in relation to those inputs that could have a significant effect on the valuation of the APS:
Correlation: +/- 10%
The correlation uncertainty relates to both the nature of the underlying portfolio and the seniority of protection. The +/-10% correlation range looks reasonable in light of market observable correlations of similar levels of protection seniority, for portfolios of investment grade and high yield assets.
Range of possible recovery rates on underlying assets (alpha): +/- 10%
The level of alpha used in the valuation of the APS is in line with that used to value tranches traded by the exotic credit desk and assumes that the underlying assets have a wide range of potential recovery rates. As the APS protects a wider range of asset classes than is generally referenced by exotic credit trades, there is uncertainty in relation to this approach. A comparison of actual recoveries to expected recoveries supports the approach adopted and, in light of this, only changes of +/-10% in the assumed width of this range are considered reasonable.
Credit spreads: +/- 10%
The credit spread uncertainty relates to determining the probability of default for assets where there is no such observable data in the market. An analysis of the impact on credit spreads of small changes in the ratings assumptions in key geographic regions indicated that overall credit spread movements in the +/- 10% range look reasonable.
Discount curve: +/- 1%
Due to the long-dated contractual maturity of the APS, and the requirement to pay fixed levels of premiums each year, the valuation is sensitive to long-term interest rates. Valuation uncertainty arises due to the illiquidity of such interest rates. An interest rate range of +/- 1% is considered reasonable.
Loss credits: +/- 10%
The level of expected losses on covered assets that have been sold that can be treated as losses for the purpose of the APS are assessed by the Asset Protection Agency. For disposals made by the Group where this assessment has not been completed, the Group makes an estimate of the likely assessment for the purpose of valuing of the APS. A range of +/- 10% in the level of assessment is considered reasonable.
Using the above reasonably possible alternative assumptions, the fair value of the APS derivative could be higher by approximately £860 million or lower by approximately £940 million as detailed in the table below.
| Sensitivity | Favourable £m | Unfavourable £m |
| Correlation +/- 10% | 300 | 300 |
| Recover alpha +/- 10% | 250 | 300 |
| Spreads +/-10% | 125 | 100 |
| Discount curve +/- 1% | 175 | 230 |
| Loss credit +/- 10% | 10 | 10 |
| Total | 860 | 940 |
Individual sensitivities above have been aggregated and do not reflect the correlated effect of some of the assumptions as related sensitivities.
Notes on the accounts continued | Financial statements |
12 Financial instruments - valuation continued
Credit derivatives - other
The Group's other credit derivatives include vanilla and bespoke portfolio tranches, gap risk products and certain other unique trades.
Valuation of single name credit derivatives is carried out using industry standard models. Where single name derivatives have been traded and there is a lack of independent data or the quality of the data is weak, these instruments are classified into level 3. These assets will be priced using the Group’s standard credit derivative model using a proxy curve based upon a suitable alternative single name curve, a cash based product or a sector based curve. Where the sector based curve is used, the proxy will be chosen taking maturity, rating, seniority, geography and internal credit review on recoveries into account. Sensitivities for these instruments will be based upon the selection of reasonable alternative assumptions which may include adjustments to the credit curve and recovery rate assumptions.
The bespoke portfolio tranches are synthetic tranches referenced to a bespoke portfolio of corporate names on which the Group purchases credit protection. Bespoke portfolio tranches are valued using Gaussian Copula, a standard method which uses observable market inputs (credit spreads, index tranche prices and recovery rates) to generate an output price for the tranche viaby way of a mapping methodology. In essence this method takes the expected loss of the tranche expressed as a fraction of the expected loss of the whole underlying portfolio and calculates which detachment point on the liquid index, and hence which correlation level, coincides with this expected loss fraction. Where the inputs intoto this valuation technique are observable in the market, bespoke tranches are considered to be level 2 assets. Where inputs are not observable, bespoke tranchestranch es are considered to be level 3 assets. However, all transactions executed with a CDPC counterparty are considered level 3 as the counterparty credit risk assessment is a significant component of these valuations.
Gap risk products are leveraged trades, with the counterparty’scounterparty's potential loss capped at the amount of the initial principal invested. Gap risk is the probability that the market will move discontinuously too quickly to exit a portfolio and return the principal to the counterparty without incurring losses, should an unwind event be triggered. This optionality is embedded within these portfolio structures and is very rarely traded outright in the market. Gap risk is not observable in the markets and, as such, these structures are deemed to be level 3 instruments.
Other unique trades are valued using a specialised model for each instrument and the same market data inputs as all other trades where applicable. By their nature, the valuation is also driven by a variety of other model inputs, many of which are unobservable in the market.
11 Financial instruments (continued)
Where these instruments have embedded optionality it isthey are valued using a variation of the Black-Scholes option pricing formula, and where they have correlation exposure it isthey are valued using a variant of the Gaussian Copula model. The volatility or unique correlation inputs required to value these products are generally unobservable and the instruments are therefore deemed to be level 3 instruments.
OtherEquity derivatives
ExoticEquity derivative products are split into equity interestexotic derivatives and equity hybrids. Equity exotic derivatives have payouts based on the performance of one or more stocks, equity funds or indices. Most payouts are based on the performance of a single asset and are valued using observable market option data. Unobservable equity derivative trades are typically complex basket options on stocks. Such basket option payouts depend on the performance of more than one equity asset and require correlations for their valuation. Valuation is then performed using industry standard valuation models, with unobservable correlation inputs calculated by reference to correlations observed between similar underlyings.
Equity hybrids have payouts based on the performance of a basket of underlyings where underlyings are from different asset classes. Correlations between these different underlyings are typically unobservable with no market information on closely related assets available. Where no market for the correlation input exists, these inputs are based on historical time series.
Interest rate and commodity derivatives
Interest rate and commodity options provide a payout (or series of payouts) linked to the performance of one or more underlying, including equities, interest rates, foreign exchange rates and commodities. Included in commodities derivatives are energy contracts entered into by RBS Sempra Commodities. Most of these contracts are valued using models that incorporate observable data. A small number are more complex, structured derivatives which incorporate in their valuation assumptions regarding power price volatilities and correlation between inputs, which are not market observable. These include certain tolling agreements, where power is purchased in return for a given quantity of fuel, and load deals, where a seller agrees to deliver a fixed proportion of power used by a client’s utility customers.
Exotic options do not trade in active markets except in a small number of cases. Consequently, the Group uses models to determine fair value using valuation techniques typical for the industry. These techniques can be divided, firstly, into modelling approaches and, secondly, into methods of assessing appropriate levels for model inputs. The Group uses a variety of proprietary models for valuing exotic trades.
Exotic valuation inputs include correlation between equities, interest rates, foreign exchange rates and commodity prices. Correlations for more liquid equity and rate pairs are valued using independently sourced consensus pricing levels. Where a consensus pricing benchmark is unavailable, these instruments are categorisedclassified as level 3.
Reasonably possible alternative assumptions
In determiningThe carrying value of debt securities in issue is represented partly by underlying cash and partly through a derivative component. The classification of the effect of reasonably possible alternative assumptions for unobservable inputs, the Group has considered credit derivative trades with CDPCs separately from all otheramount in level 3 derivatives due to the significant element of subjectivity in determining the counterparty credit risk.
The fair value of credit derivative trades with CDPCs as at 31 December 2008 was £4.8 billion before applying a CVA of £1.3 billion. The Group’s credit derivative exposures to CDPCs are valued using pricing models with inputs observed directly in the market. An adjustment is made to the model valuation as the creditworthiness of CDPC counterparties differs from that of the credit risk assumptions used in the model. The adjustment reflects the estimated cost of hedging the counterparty risk arising from each trade. In the absence of market observable credit spreads of CDPCs, the cost of hedging the counterparty risk is estimated from an analysis of the underlying trades and the cost of hedging expected default losses in excess of the capital available in each vehicle. A reasonably possible alternative approach would be to estimate the cost of hedging the counterparty risk from market observable credit spreads of entities considered similar to CDPCs (for example monoline insurers with similar business or similarly rated entities). These reasonably possible alternative approaches would reduce the fair value credit derivatives with CDPCs by up to £740 million or increase the fair value by up to £600 million.
For all other level 3 derivatives, unobservable inputs are principally comprised of correlations and volatilities. Where a derivative valuation relies significantly on an unobservable input, the valuation is shown in level 3. It is usual for such derivative valuations to depend on several observable, and one or few unobservable model inputs. In determining reasonably possible alternative assumptions, the relative impact of unobservable inputs as compared to those which may be observed was considered. Using reasonably possible alternative assumptions the fair value of all other level 3 derivative assets (excluding CDPCs) would be reduced by up to £600 million or increased by up to £560 million and derivative liabilities of £4.0 billion, would be reduced by up to £300 million or increased by upto £280 million.
Equity shares – private equity
Private equity investments include unit holdings and limited partnership interests primarily in corporate private equity funds, debt funds and fund of hedges funds. Externally managed funds are valued using recent prices where available. Where not available, the fair value of investments in externally managed funds is generally determined using statements or other information provideddriven by the fund managers.derivative component and not by the cash element.
Although such valuations are provided from third parties, the Group recognises that such valuations may rely significantly on the judgements and estimates made by those fund managers, particularly in assessing private equity components. Following the decline in liquidity in world markets, the Group believes that there is sufficient subjectivity in such valuations to report them in level 3.
Reasonably possible alternative valuations have been determined based on the historic trends in valuations received, and by considering the possible impact of market movements towards the end of the reporting period, which may not be fully reflected in valuations received. Using these reasonably possible alternate assumptions would reduce the fair value of externally managed funds of £1.1 billion by up to £160 million or increase the fair value by up to £80 million.
Other financial instruments
Other thanIn addition to the portfolios discussed above, there are other financial instruments which are held at fair value determined from data which are not market observable, or incorporating material adjustments to market observed data. Using reasonably possible alternate assumptions appropriateThese include subordinated liabilities and write downs relating to the liability in question, such as credit spreads, derivative inputs and equity correlations, would reduce the fair value of other financial instruments held at fair value of £5.0 billion, primarily debt securities in issue of £4.4 billion, by up to £250 million or increase the fair value by up to £210 million.undrawn syndicated loan facilities.
Notes on the accounts continued | Financial statements |
| | At 1 January 2010 | | Transfers in/(out) of Level 3 | Issuances | Purchases | Settlements | Sales | Foreign exchange | At 31 December 2010 | | Gains/ (losses) relating to instruments held at year end |
Gains/(losses) recognised in the |
Income statement | SOCI |
| 2010 | £m | £m | £m | £m | £m | £m | £m | £m | £m | £m | | £m |
| Assets | | | | | | | | | | | | |
FVTPL (1) | | | | | | | | | | | | |
| Loans and advances | 1,059 | 169 | — | 10 | — | 169 | (451) | (165) | 52 | 843 | | 38 |
| Debt securities | 2,782 | 294 | — | 1,770 | — | 1,973 | (386) | (2,682) | 33 | 3,784 | | 154 |
| Equity shares | 711 | 414 | — | (26) | — | 654 | — | (1,027) | (10) | 716 | | 54 |
| Derivatives | 6,429 | (1,561) | — | 1,728 | — | 948 | (299) | (1,534) | 26 | 5,737 | | (1,556) |
| FVTPL assets | 10,981 | (684) | — | 3,482 | — | 3,744 | (1,136) | (5,408) | 101 | 11,080 | | (1,310) |
| | | | | | | | | | | | | |
| AFS | | | | | | | | | | | | |
| Debt securities | 1,325 | 26 | 511 | 2,909 | — | 306 | (458) | (274) | 34 | 4,379 | | 10 |
| Equity shares | 749 | (4) | (39) | (118) | — | 22 | (2) | (343) | 14 | 279 | | (4) |
| AFS assets | 2,074 | 22 | 472 | 2,791 | — | 328 | (460) | (617) | 48 | 4,658 | | 6 |
| | 13,055 | (662) | 472 | 6,273 | — | 4,072 | (1,596) | (6,025) | 149 | 15,738 | | (1,304) |
| | | | | | | | | | | | | |
| Liabilities | | | | | | | | | | | | |
| Deposits | 103 | — | — | 11 | — | — | (32) | — | 2 | 84 | | — |
| Debt securities in issue | 2,345 | 336 | — | (212) | 413 | — | (695) | — | 16 | 2,203 | | 309 |
| Short positions | 184 | (187) | — | 792 | 6 | — | (2) | (16) | (1) | 776 | | (179) |
| Derivatives | 1,987 | (258) | — | (152) | — | 318 | (175) | (27) | 47 | 1,740 | | (187) |
| Other financial liabilities | 1 | — | — | — | — | — | — | — | — | 1 | | — |
| | 4,620 | (109) | — | 439 | 419 | 318 | (904) | (43) | 64 | 4,804 | | (57) |
Own credit
When valuing financial liabilities recorded at fair value, the Group takes into account the effect of its own credit standing. The categories of financial liabilities on which own credit spread adjustments are made are issued debt, including issued structured notes, and derivatives. An own credit adjustment is applied to positions where it is believed that counterparties would consider the Group’s creditworthiness when pricing trades.
For issued debt and structured notes, this adjustment is based on independent quotes from market participants for the debt issuance spreads above average inter-bank rates (at a range of tenors) which the market would demand when purchasing new senior or sub-debt issuances from the Group. Where necessary, these quotes are interpolated using a curve shape derived from CDS prices.
The fair value of the Group’s derivative financial liabilities reflects the Group’s own credit risk. The adjustment takes into account collateral posted by the Group and the effects of master netting agreements. No adjustments were made for own credit risk in relation to derivative liabilities in prior periods as it was not a significant factor in the pricing of derivative transactions by market participants. The change in methodology reflects market turbulence in 2008 which led to participants focussing increased attention on counterparty credit quality.
The table below shows the own credit spread adjustments on liabilities recorded in the income statement during the year.
| | | Debt securities in issue | |
| | | Held-for-trading | | | Designated at fair value through profit and loss | | | Total | | | Derivatives | | | Total | |
| | | | £m | | | | £m | | | | £m | | | | £m | | | | £m | |
| At 1 January 2008 | | | 304 | | | | 152 | | | | 456 | | | | — | | | | 456 | |
| Effect of changes to credit spreads | | | 376 | | | | 583 | | | | 959 | | | | 450 | | | | 1,409 | |
| Benefit of foreign exchange hedges | | | 392 | | | | 195 | | | | 587 | | | | — | | | | 587 | |
| New issues | | | 274 | | | | 97 | | | | 371 | | | | — | | | | 371 | |
| At 31 December 2008 | | | 1,346 | | | | 1,027 | | | | 2,373 | | | | 450 | | | | 2,823 | |
11 Financial instruments (continued)
Reclassification of financial instruments
As discussed in accounting policies on page 162, during 2008 the Group reclassified financial assets from the held-for-trading and available-for-sale categories into the loans and receivables category (as permitted by paragraph 50D of IAS 39 as amended) and from the held¬for-trading category into the available-for-sale category (as permitted by paragraph 50B of IAS 39 as amended).
The turbulence in the financial markets during the second half of 2008 was regarded by management as rare circumstances in the context of paragraph 50B of IAS 39 as amended.
The balance sheet values of these assets, the effect of the reclassification on the income statement for the period from the date of reclassification to 31 December 2008 and the gains and losses relating to these assets recorded in the income statement for the years ended 31 December 2008, 2007 and 2006 were as follows:
| | | | | | | | | | | | | | | | |
| | | 2008 – on reclassification | | | | | | | | | | | | | | | | | | | |
| | | Carrying value | | | Effective interest rate | | | Expected cash flows | | | Carrying value | | | Fair value | | | Gains/(losses) up to the date of reclassi- fication | | | Income | | | Impairment losses | | | Gains/ (losses) in AFS reserves | | | Amount that would have been recognised | | | Gains/(losses) recognised in the income statement in prior periods | |
| | | | £m | | | % | | | | £m | | | | £m | | | | £m | | | | £m | | | | £m | | | | £m | | | | £m | | | | £m | | | | £m | | | | £m | |
| Reclassified from HFT to LAR: | | | | | | | | | | | | | | | | | | | | | | | | | | | | | | | | | | | | | | | | | | | | | | | |
| Loans: | | | | | | | | | | | | | | | | | | | | | | | | | | | | | | | | | | | | | | | | | | | | | | | |
| Leveraged finance | | | 3,602 | | | | 10.15 | | | | 6,083 | | | | 4,304 | | | | 2,523 | | | | (457 | ) | | | 454 | | | | — | | | | | | | | (1,206 | ) | | | (155 | ) | | | — | |
| Corporate loans | | | 5,040 | | | | 6.19 | | | | 7,582 | | | | 5,827 | | | | 4,940 | | | | (76 | ) | | | 198 | | | | — | | | | | | | | (681 | ) | | | (50 | ) | | | 3 | |
| | | | 8,642 | | | | | | | | 13,665 | | | | 10,131 | | | | 7,463 | | | | (533 | ) | | | 652 | | | | — | | | | | | | | (1,887 | ) | | | (205 | ) | | | 3 | |
| Debt securities: | | | | | | | | | | | | | | | | | | | | | | | | | | | | | | | | | | | | | | | | | | | | | | | | |
| CDO of RMBS | | | 215 | | | | 4.92 | | | | 259 | | | | 236 | | | | 221 | | | | 4 | | | | 5 | | | | — | | | | | | | | (11 | ) | | | 5 | | | | 6 | |
| RMBS | | | 1,765 | | | | 6.05 | | | | 2,136 | | | | 2,011 | | | | 1,536 | | | | (115 | ) | | | 157 | | | | — | | | | | | | | (302 | ) | | | (12 | ) | | | — | |
| CMBS | | | 1 | | | | 11.11 | | | | 4 | | | | 1 | | | | 1 | | | | 1 | | | | — | | | | — | | | | | | | | — | | | | — | | | | — | |
| CLOs | | | 835 | | | | 6.34 | | | | 1,141 | | | | 952 | | | | 717 | | | | (22 | ) | | | 104 | | | | — | | | | | | | | (130 | ) | | | (14 | ) | | | (2 | ) |
| Other ABS | | | 2,203 | | | | 5.07 | | | | 3,202 | | | | 2,514 | | | | 2,028 | | | | (67 | ) | | | 129 | | | | — | | | | | | | | (338 | ) | | | 3 | | | | (1 | ) |
| Other | | | 2,538 | | | | 2.62 | | | | 2,764 | | | | 2,602 | | | | 2,388 | | | | 72 | | | | 3 | | | | — | | | | | | | | (166 | ) | | | 94 | | | | 476 | |
| | | | 7,557 | | | | | | | | 9,506 | | | | 8,316 | | | | 6,891 | | | | (127 | ) | | | 398 | | | | — | | | | | | | | (947 | ) | | | 76 | | | | 479 | |
| Total | | | 16,199 | | | | | | | | 23,171 | | | | 18,447 | | | | 14,354 | | | | (660 | ) | | | 1,050 | | | | — | | | | | | | | (2,834 | ) | | | (129 | ) | | | 482 | |
| | | | | | | | | | | | | | | | | | | | | | | | | | | | | | | | | | | | | | | | | | | | | | | | | |
| Reclassified from HFT to AFS: | | | | | | | | | | | | | | | | | | | | | | | | | | | | | | | | | | | | | | | | | | | | | | | | |
| Debt securities: | | | | | | | | | | | | | | | | | | | | | | | | | | | | | | | | | | | | | | | | | | | | | | | | |
| CDO of RMBS | | | 6,228 | | | | 8.14 | | | | 8,822 | | | | 5,695 | | | | 5,695 | | | | (1,330 | ) | | | 1,147 | | | | (464 | ) | | | (1,069 | ) | | | (280 | ) | | | (400 | ) | | | — | |
| RMBS | | | 5,205 | | | | 8.03 | | | | 8,890 | | | | 5,171 | | | | 5,171 | | | | (530 | ) | | | 24 | | | | — | | | | (162 | ) | | | (122 | ) | | | (4 | ) | | | 73 | |
| CMBS | | | 32 | | | | 6.81 | | | | 85 | | | | 31 | | | | 31 | | | | (5 | ) | | | 5 | | | | — | | | | (3 | ) | | | 2 | | | | (4 | ) | | | — | |
| CLOs | | | 1,457 | | | | 5.02 | | | | 1,804 | | | | 1,288 | | | | 1,288 | | | | (168 | ) | | | 421 | | | | | | | | (383 | ) | | | 58 | | | | (36 | ) | | | 1 | |
| Other ABS | | | 2,199 | | | | 6.02 | | | | 3,183 | | | | 1,847 | | | | 1,847 | | | | (356 | ) | | | (10 | ) | | | — | | | | (354 | ) | | | (311 | ) | | | (42 | ) | | | 72 | |
| Other | | | 614 | | | | 12.55 | | | | 1,311 | | | | 698 | | | | 698 | | | | — | | | | 130 | | | | — | | | | (166 | ) | | | (5 | ) | | | (1 | ) | | | — | |
| | | | 15,735 | | | | | | | | 24,095 | | | | 14,730 | | | | 14,730 | | | | (2,389 | ) | | | 1,717 | | | | (464 | ) | | | (2,137 | ) | | | (658 | ) | | | (487 | ) | | | 146 | |
| | | | | | | | | | | | | | | | | | | | | | | | | | | | | | | | | | | | | | | | | | | | | | | | | |
| Reclassification from AFS to LAR: | | | | | | | | | | | | | | | | | | | | | | | | | | | | | | | | | | | | | | | | | | | | | | | | |
| Debt securities | | | 704 | | | | 1.38 | | | | 772 | | | | 1,028 | | | | 968 | | | | (12 | )(1) | | | 6 | | | | — | | | | — | | | | (37 | )(1) | | | — | | | | — | |
| Total | | | 32,638 | | | | | | | | 48,038 | | | | 34,205 | | | | 30,052 | | | | (3,061 | ) | | | 2,773 | | | | (464 | ) | | | (2,137 | ) | | | (3,529 | ) | | | (616 | ) | | | 628 | |
| | At 1 January 2009 | | | Transfers in/(out) of Level 3 | Reclassification | Purchases and issuances | Sales and settlements | Foreign exchange | At 31 December 2009 | | Gains/ (losses) relating to instruments held at year end |
Gains/(losses) recognised in the |
Income statement | SOCI |
| 2009 | £m | £m | £m | £m | £m | £m | £m | £m | £m | | £m |
| Assets | | | | | | | | | | | |
FVTPL (1) | | | | | | | | | | | |
| Loans and advances | 3,148 | 130 | — | 330 | (1,537) | 22 | (898) | (136) | 1,059 | | 11 |
| Debt securities | 3,846 | (49) | — | 104 | (157) | 378 | (1,207) | (133) | 2,782 | | (165) |
| Equity shares | 793 | (49) | — | 133 | — | 22 | (151) | (37) | 711 | | (48) |
| Derivatives | 10,265 | (3,672) | — | (211) | — | 1,811 | (1,301) | (463) | 6,429 | | (1,079) |
| FVTPL assets | 18,052 | (3,640) | — | 356 | (1,694) | 2,233 | (3,557) | (769) | 10,981 | | (1,281) |
| | | | | | | | | | | | |
| AFS | | | | | | | | | | | |
| Debt securities | 3,102 | (329) | (47) | (929) | — | 128 | (491) | (109) | 1,325 | | (9) |
| Equity shares | 325 | (128) | (13) | 632 | — | 53 | (75) | (45) | 749 | | (51) |
| AFS assets | 3,427 | (457) | (60) | (297) | — | 181 | (566) | (154) | 2,074 | | (60) |
| | 21,479 | (4,097) | (60) | 59 | (1,694) | 2,414 | (4,123) | (923) | 13,055 | | (1,341) |
| | | | | | | | | | | | |
| Liabilities | | | | | | | | | | | |
| Deposits | 290 | 43 | — | (217) | — | 15 | (23) | (5) | 103 | | — |
| Debt securities in issue | 4,362 | 57 | — | (1,682) | — | 493 | (638) | (247) | 2,345 | | (41) |
| Short positions | 41 | (45) | — | 188 | — | 4 | (4) | — | 184 | | 12 |
| Derivatives | 4,035 | (215) | — | (978) | — | 76 | (744) | (187) | 1,987 | | (244) |
| Other financial liabilities | 257 | — | — | — | — | — | (242) | (14) | 1 | | — |
| | 8,985 | (160) | — | (2,689) | — | 588 | (1,651) | (453) | 4,620 | | (273) |
| (1) | Fair value through profit or loss. |
(1) Gains/(losses) recognised in the available-for-sale reserve.
Notes on the accounts continued | Financial statements |
Amounts included in the consolidated income statement:
| | | Group | |
| | | 2008 | | | 2007 | | | 2006 | |
| | | | £m | | | | £m | | | | £m | |
| Gains on financial assets/liabilities designated as at fair value through profit or loss | | | (901 | ) | | | 1,074 | | | | 573 | |
| Gains on disposal or settlement of loans and receivables | | | 4 | | | | 3 | | | | 21 | |
On the initial recognition of financial assets and liabilities valued using12 Financial instruments - valuation techniques incorporating information other than observable market data, any difference between the transaction price and that derived from the valuation technique is deferred. Such amounts are recognised in profit or loss over the life of the transaction; when market data become observable; or when the transaction matures or is closed out as appropriate. At 31 December 2008, net gains of £ 102 million (2007 – £ 72 million) were carried forward in the balance sheet. During the year net gains of £89 million (2007 – £67 million) were deferred and £65 million (2007 – £ 10 million) released to profit or loss.
continued
Fair value of financial instruments not carried at fair value
The following table shows the carrying valuesvalue and the fair valuesvalue of financial instruments carried on the balance sheetssheet at amortised cost.
| | | | | | | | Group |
| | | 2008 Carrying Value | | | 2008 Fair value | | | 2007 Carrying value | | | 2007 Fair value | | | 2008 Carrying value | | | 2008 Fair value | | | 2007 Carrying value | | | 2007 Fair value | | 2010 Carrying value | 2010 Fair value | 2009 Carrying value | 2009 Fair value | 2008 Carrying value | 2008 Fair value |
| | | | £m | | | | £m | | | | £m | | | | £m | | | | £m | | | | £m | | | | £m | | | | £m | | £bn | £bn |
| Financial assets | | | | | | | | | | | | | | | | | | | | | | | | | | | | | | | | | |
| Cash and balances at central banks | | | 12,400 | | | | 12,400 | | | | 17,866 | | | | 17,866 | | | | — | | | | — | | | | — | | | | — | | 57.0 | 52.3 | 12.4 |
| | | | | | | | | | | | | | | | | | | | | | | | | | | | | | | | | | |
| Loans and advances to banks | | | | | | | | | | | | | | | | | | | | | | | | | | | | | | | | | 36.2 | 36.1 | 46.3 | 46.0 | 82.0 | 81.9 |
| Loans and receivables | | | 81,963 | | | | 81,929 | | | | 147,821 | | | | 147,818 | | | | 27,031 | | | | 27,031 | | | | 7,686 | | | | 7,686 | | |
| | | | | | | | | | | | | | | | | | | | | | | | | | | | | | | | | | |
| Loans and advances to customers | | | | | | | | | | | | | | | | | | | | | | | | | | | | | | | | | 493.1 | 468.8 | 684.1 | 650.9 | 821.1 | 776.1 |
| Loans and receivables | | | 806,627 | | | | 761,619 | | | | 709,090 | | | | 711,346 | | | | — | | | | — | | | | 307 | | | | 307 | | |
| Finance leases | | | 14,453 | | | | 14,527 | | | | 12,570 | | | | 12,376 | | | | — | | | | — | | | | — | | | | — | | |
| | | | | | | | | | | | | | | | | | | | | | | | | | | | | | | | | | |
| Debt securities | | | | | | | | | | | | | | | | | | | | | | | | | | | | | | | | | 7.1 | 6.4 | 9.9 | 9.0 | 13.0 | 11.5 |
| Loans and receivables | | | 12,985 | | | | 11,500 | | | | 2,672 | | | | 2,644 | | | | — | | | | — | | | | — | | | | — | | |
| | | | | | | | | | | | | | | | | | | | | | | | | | | | | | | | | | |
| Settlement balances | | | 17,832 | | | | 17,832 | | | | 16,589 | | | | 16,589 | | | | — | | | | — | | | | — | | | | — | | 11.6 | 12.0 | 17.8 |
| | | | | | | | | | | | | | | | | | | | | | | | | | | | | | | | | | | |
| Financial liabilities | | | | | | | | | | | | | | | | | | | | | | | | | | | | | | | | | | |
| Deposits by banks | | | 176,890 | | | | 176,266 | | | | 246,803 | | | | 246,627 | | | | 1,802 | | | | 1,802 | | | | 5,572 | | | | 5,572 | | 50.0 | 50.4 | 88.5 | 88.3 | 176.9 | 176.3 |
| | | | | | | | | | | | | | | | | | | | | | | | | | | | | | | | | | |
| Customer accounts | | | 575,532 | | | | 576,378 | | | | 614,432 | | | | 614,067 | | | | 26 | | | | 26 | | | | — | | | | — | | 438.5 | 438.6 | 552.8 | 552.1 | 575.5 | 576.4 |
| | | | | | | | | | | | | | | | | | | | | | | | | | | | | | | | | | |
| Debt securities in issue | | | 248,846 | | | | 241,295 | | | | 222,883 | | | | 222,763 | | | | 14,179 | | | | 14,010 | | | | 13,453 | | | | 13,453 | | 167.2 | 163.8 | 222.1 | 218.5 | 248.8 | 241.3 |
| | | | | | | | | | | | | | | | | | | | | | | | | | | | | | | | | | |
| Settlement balances | | | 11,741 | | | | 11,741 | | | | 17,520 | | | | 17,520 | | | | — | | | | — | | | | — | | | | — | | 11.0 | 10.4 | 11.7 | 11.7 |
| | | | | | | | | | | | | | | | | | | | | | | | | | | | | | | | | | |
| Subordinated liabilities | | | 47,645 | | | | 36,446 | | | | 37,146 | | | | 35,793 | | | | 10,314 | | | | 8,752 | | | | 7,743 | | | | 6,983 | | 25.9 | 21.9 | 36.4 | 31.6 | 47.6 | 36.4 |
The fair values of the company’s financial assets and liabilities are not materially different from their carrying values apart from subordinated liabilities, 2010 carrying value £8.0 billion, fair value £5.8 billion (2009 - carrying value £8.8 billion; fair value £4.9 billion; 2008 - carrying value £10.3 billion; fair value £8.8 billion) and debt securities, 2010 carrying value £1.5 billion, fair value £1.8 billion (2009 - carrying value £1.3 billion, fair value £1.3 billion; 2008 - nil)
Notes:
The fair value is the amount an asset could be exchanged, or a liability settled, between knowledgeable, willing parties in an arm's length transaction. Quoted market values are used where available; otherwise, fair values have been estimated based on discounted expected future cash flows and other valuation techniques. These techniques involve uncertainties and require assumptions and judgments covering prepayments, credit risk and discount rates. Changes in these assumptions would significantly affect estimated fair values. The fair values reported would not necessarily be realised in an immediate sale or settlement. As a wide range of valuation techniques is available, it may be inappropriate to compare the Group's fair value information to independent markets or other financial institutions.
The fair values of intangible assets, such as core deposits, credit card and other customer relationships are not included in the calculation of these fair values as they are not financial instruments.
The assumptions and methodologies underlying the calculation of fair values of financial instruments at the balance sheet date are as follows:
The fair value of financial instruments which are of short maturity (three months or less) approximates their carrying value. This mainly applies to cash and balances at central banks, items in the course of collection from other banks, settlement balances, items in the course of transmission to other banks and demand deposits.
Loans and advances to banks and customers
Fair value is estimated by grouping loans into homogeneous portfolios and applying a discount rate to the cash flows. The discount rate is based on the market rate applicable at the balance sheet date for a similar portfolio with similar maturity and credit risk characteristics.
Debt securities
Fair values are determined using quoted prices where available or by reference to quoted prices of similar instruments.
Deposits by banks and customer accounts
The fair values of deposits are estimated using discounted cash flow valuation techniques.
Debt securities in issue and subordinated liabilities
Fair values are determined using quoted prices where available or by reference to valuation techniques, adjusting for own credit spreads where appropriate.
(1) Notes on the accounts continued
| Financial assets and financial liabilities for which carrying amount approximates to fair value because they are of short maturity.statements |
(2)
| Fair values are estimated by discounting expected future cash flows; using current interest rates and making adjustments for credit. |
(3)
| The fair value of deposits repayable on demand is equal to their carrying value. The fair value of other deposits by banks and customer accounts is estimated by discounting expected future cash flows at current rates and adjusting, where appropriate, for the Group’s own credit spread. The fair value of many of these instruments approximates to their carrying value because they are of short maturity or reprice frequently. |
(4)
| The fair value of short-term debt securities in issue is close to their carrying value. The fair value of other debt securities in issue is based on quoted prices; where these are unavailable fair value is estimated using other valuation techniques. |
(5)
| The fair value of subordinated liabilities in issue is based on quoted prices; where these are unavailable fair value is estimated using other valuation techniques. |
(6)
| The fair value of amounts due from and to subsidiaries is equal to their carrying value. |
11 | Financial instruments (continued) |
13 Financial instruments - maturity analysis
Remaining maturity
The following table shows the residual maturity of financial instruments, based on contractcontractual date of maturity.
| | | Group | | Group |
| | | | | | | | 2010 | | 2009 | | 2008 |
| | | Less than 12 months | | | More than 12 months | | | Total | | | Less than 12 months | | | More than 12 months | | | Total | | Less than 12 months | More than 12 months | Total | | Less than 12 months | More than 12 months | Total | | Less than 12 months | More than 12 months | Total |
| | | | £m | | | | £m | | | | £m | | | | £m | | | | £m | | | | £m | | £m | £m | £m | | £m | | £m |
| Assets | | | | | | | | | | | | | | | | | | | | | | | | | | | | | | | |
| Cash and balances at central banks | | 12,364 | | | 36 | | | 12,400 | | | 17,866 | | | — | | | 17,866 | | 56,997 | 17 | 57,014 | | 52,229 | 32 | 52,261 | | 12,364 | 36 | 12,400 |
| Loans and advances to banks | | 133,565 | | | 4,632 | | | 138,197 | | | 187,969 | | | 31,491 | | | 219,460 | | 98,789 | 1,729 | 100,518 | | 89,622 | 2,131 | 91,753 | | 133,565 | 4,632 | 138,197 |
| Loans and advances to customers | | 338,751 | | | 535,971 | | | 874,722 | | | 395,753 | | | 432,785 | | | 828,538 | | 199,626 | 355,634 | 555,260 | | 227,745 | 500,648 | 728,393 | | 338,751 | 535,971 | 874,722 |
| Debt securities | | 69,912 | | | 197,637 | | | 267,549 | | | 70,088 | | | 224,568 | | | 294,656 | | 42,678 | 174,802 | 217,480 | | 69,197 | 198,057 | 267,254 | | 69,912 | 197,637 | 267,549 |
| Equity shares | | — | | | 26,330 | | | 26,330 | | | — | | | 53,026 | | | 53,026 | | — | 22,198 | 22,198 | | — | 19,528 | | — | 26,330 |
| Settlement balances | | 17,795 | | | 37 | | | 17,832 | | | 16,561 | | | 28 | | | 16,589 | | 11,605 | — | 11,605 | | 12,022 | 11 | 12,033 | | 17,795 | 37 | 17,832 |
| Derivatives | | 184,278 | | | 808,281 | | | 992,559 | | | 50,841 | | | 226,561 | | | 277,402 | | 65,639 | 361,438 | 427,077 | | 70,537 | 370,917 | 441,454 | | 184,278 | 808,281 | 992,559 |
| | | | | | | | | | | | | | | | | | | | | | | | | | | | | | | | |
| Liabilities | | | | | | | | | | | | | | | | | | | | | | | | | | | | | | | |
| Deposits by banks | | 248,896 | | | 9,148 | | | 258,044 | | | 302,934 | | | 9,360 | | | 312,294 | | 95,241 | 3,549 | 98,790 | | 135,641 | 6,503 | 142,144 | | 248,896 | 9,148 | 258,044 |
| Customer accounts | | 611,047 | | | 28,465 | | | 639,512 | | | 650,685 | | | 31,678 | | | 682,363 | | 492,609 | 18,084 | 510,693 | | 586,628 | 27,574 | 614,202 | | 611,047 | 28,465 | 639,512 |
| Debt securities in issue | | 174,507 | | | 125,782 | | | 300,289 | | | 156,020 | | | 118,152 | | | 274,172 | | 94,048 | 124,324 | 218,372 | | 140,826 | 126,742 | 267,568 | | 174,507 | 125,782 | 300,289 |
| Settlement balances and short positions | | 24,448 | | | 29,829 | | | 54,277 | | | 44,466 | | | 46,555 | | | 91,021 | | 16,981 | 37,128 | 54,109 | | 17,952 | 32,924 | 50,876 | | 24,448 | 29,829 | 54,277 |
| Derivatives | | 175,908 | | | 795,456 | | | 971,364 | | | 54,624 | | | 217,428 | | | 272,052 | | 71,306 | 352,661 | 423,967 | | 71,625 | 352,516 | 424,141 | | 175,908 | 795,456 | 971,364 |
| Subordinated liabilities | | 3,394 | | | 45,760 | | | 49,154 | | | 1,896 | | | 36,147 | | | 38,043 | | 964 | 26,089 | 27,053 | | 2,144 | 35,508 | 37,652 | | 3,394 | 45,760 | 49,154 |
| | | | | | | | | |
| | | Company |
| | | 2010 | | 2009 | | 2008 |
| | | Less than 12 months | More than 12 months | Total | | Less than 12 months | More than 12 months | Total | | Less than 12 months | More than 12 months | Total |
| | | £m | £m | £m | | £m | | £m |
| Assets | | | | | | | | |
| Loans and advances to banks | | 4,651 | 14,884 | 19,535 | | 16,447 | 14,791 | 31,238 | | 16,096 | 10,935 | 27,031 |
| Loans and advances to customers | | 3,855 | 2,834 | 6,689 | | — | 2,777 | | — |
| Debt securities | | — | 1,454 | 1,454 | | 52 | 1,234 | 1,286 | | — |
| Settlement balances | | — | — | — | | 11 | — | 11 | | — |
| Derivatives | | 2 | 1,473 | 1,475 | | 80 | 1,089 | 1,169 | | 221 | 947 | 1,168 |
| | | | | | | | | |
| Liabilities | | | | | | | | |
| Deposits by banks | | — | — | — | | 93 | — | 93 | | 1,802 | — | 1,802 |
| Customer accounts | | 1,029 | — | 1,029 | | 13,264 | — | 13,264 | | 26 | — | 26 |
| Debt securities in issue | | 1,460 | 7,282 | 8,742 | | 4,965 | 6,823 | 11,788 | | 7,253 | 6,926 | 14,179 |
| Derivatives | | 25 | 206 | 231 | | 53 | 393 | 446 | | 227 | 134 | 361 |
| Subordinated liabilities | | 307 | 7,741 | 8,048 | | 130 | 8,632 | 8,762 | | 424 | 9,890 | 10,314 |
| | | Company | |
| | | | | | | |
| | | Less than 12 months | | | More than 12 months | | | Total | | | Less than 12 months | | | More than 12 months | | | Total | |
| | | | £m | | | | £m | | | | £m | | | | £m | | | | £m | | | | £m | |
| Assets | | | | | | | | | | | | | | | | | | | | | | | | |
| Loans and advances to banks | | | 16,096 | | | | 10,935 | | | | 27,031 | | | | 1,655 | | | | 6,031 | | | | 7,686 | |
| Loans and advances to customers | | | — | | | | — | | | | — | | | | 307 | | | | — | | | | 307 | |
| Derivatives | | | 221 | | | | 947 | | | | 1,168 | | | | 127 | | | | 46 | | | | 173 | |
| | | | | | | | | | | | | | | | | | | | | | | | | |
| Liabilities | | | | | | | | | | | | | | | | | | | | | | | | |
| Deposits by banks | | | 1,802 | | | | — | | | | 1,802 | | | | 5,572 | | | | — | | | | 5,572 | |
| Customer accounts | | | 26 | | | | — | | | | 26 | | | | — | | | | — | | | | — | |
| Debt securities in issue | | | 7,253 | | | | 6,926 | | | | 14,179 | | | | 8,855 | | | | 4,598 | | | | 13,453 | |
| Derivatives | | | 227 | | | | 134 | | | | 361 | | | | 102 | | | | 77 | | | | 179 | |
| Subordinated liabilities | | | 424 | | | | 9,890 | | | | 10,314 | | | | 119 | | | | 7,624 | | | | 7,743 | |
Notes on the accounts continued | Financial statements |
13 Financial instruments - maturity analysis continued
On balance sheet liabilitiesThe following tables show by contractual maturity, the contractual undiscounted cash flows payable up to a period of twenty20 years from the balance sheet date, including future payments of interest. | | Group |
| | 0-3 months | 3-12 months | 1-3 years | 3-5 years | 5-10 years | 10-20 years |
| 2010 | £m | £m | £m | £m | £m | £m |
| Deposits by banks | 43,396 | 4,417 | 1,243 | 304 | 651 | 374 |
| Customer accounts | 402,457 | 18,580 | 8,360 | 4,651 | 4,393 | 2,384 |
| Debt securities in issue | 89,583 | 43,032 | 31,862 | 22,569 | 24,209 | 6,697 |
| Derivatives held for hedging | 608 | 936 | 2,103 | 969 | 681 | 253 |
| Subordinated liabilities | 2,485 | 2,611 | 6,570 | 8,691 | 8,672 | 4,607 |
| Settlement balances and other liabilities | 12,423 | 59 | 136 | 177 | 385 | 25 |
| | 550,952 | 69,635 | 50,274 | 37,361 | 38,991 | 14,340 |
| | | | | | | |
| Guarantees and commitments - notional amount | | | | | | |
Guarantees (1) | 31,026 | — | — | — | — | — |
Commitments (2) | 266,822 | — | — | — | — | — |
| | 297,848 | — | — | — | — | — |
| | | | | | | |
| 2009 | | | | | | |
| Deposits by banks | 65,966 | 15,541 | 3,934 | 2,301 | 632 | 12 |
| Customer accounts | 521,400 | 15,619 | 5,944 | 4,221 | 8,490 | 4,392 |
| Debt securities in issue | 100,220 | 49,300 | 56,869 | 25,915 | 27,326 | 3,819 |
| Derivatives held for hedging | 660 | 1,566 | 3,232 | 1,264 | 1,674 | 1,508 |
| Subordinated liabilities | 1,929 | 1,892 | 3,654 | 4,963 | 20,157 | 6,105 |
| Settlement balances and other liabilities | 12,048 | 100 | 139 | 104 | 239 | 83 |
| | 702,223 | 84,018 | 73,772 | 38,768 | 58,518 | 15,919 |
| | | | | | | |
| Guarantees and commitments - notional amount | | | | | | |
Guarantees (1) | 39,952 | — | — | — | — | — |
Commitments (2) | 291,634 | — | — | — | — | — |
| | 331,586 | — | — | — | — | — |
| | | | | | | |
| 2008 | | | | | | |
| Deposits by banks | 154,614 | 14,347 | 3,345 | 2,754 | 2,048 | 34 |
| Customer accounts | 523,268 | 33,450 | 6,577 | 6,337 | 7,298 | 5,319 |
| Debt securities in issue | 131,714 | 48,652 | 40,067 | 38,223 | 38,667 | 5,626 |
| Derivatives held for hedging | 394 | 2,216 | 2,543 | 1,334 | 2,682 | 1,373 |
| Subordinated liabilities | 1,753 | 4,271 | 6,824 | 5,793 | 24,503 | 13,030 |
| Settlement balances and other liabilities | 13,351 | 5 | 12 | 6 | 10 | 6 |
| | 825,094 | 102,941 | 59,368 | 54,447 | 75,208 | 25,388 |
| (1) | The Group is only called upon to satisfy a guarantee when the guaranteed party fails to meet its obligations. The Group expects most guarantees it provides to expire unused. |
| (2) | The Group has given commitments to provide funds to customers under undrawn formal facilities, credit lines and other commitments to lend subject to certain conditions being met by the counterparty. The Group does not expect all facilities to be drawn, and some may lapse before drawdown. |
On balance sheet liabilities
| | | Group | |
| | | | | | | |
| | | 0-3 months | | | 3-12 months | | | 1-3 years | | | 3-5 years | | | 5-10 years | | | 10-20 years | |
| 2008 | | | £m | | | | £m | | | | £m | | | | £m | | | | £m | | | | £m | |
| Deposits by banks | | | 154,614 | | | | 14,347 | | | | 3,345 | | | | 2,754 | | | | 2,048 | | | | 34 | |
| Customer accounts | | | 523,268 | | | | 33,450 | | | | 6,577 | | | | 6,337 | | | | 7,298 | | | | 5,319 | |
| Debt securities in issue | | | 131,714 | | | | 48,652 | | | | 40,067 | | | | 38,223 | | | | 38,667 | | | | 5,626 | |
| Derivatives held for hedging | | | 394 | | | | 2,216 | | | | 2,543 | | | | 1,334 | | | | 2,682 | | | | 1,373 | |
| Subordinated liabilities | | | 1,753 | | | | 4,271 | | | | 6,824 | | | | 5,793 | | | | 24,503 | | | | 13,030 | |
| Settlement balances and other liabilities | | | 13,351 | | | | 5 | | | | 12 | | | | 6 | | | | 10 | | | | 6 | |
| | | | 825,094 | | | | 102,941 | | | | 59,368 | | | | 54,447 | | | | 75,208 | | | | 25,388 | |
| 2007 | | | | | | | | | | | | | | | | | | | | | | | | |
| Deposits by banks | | | 220,914 | | | | 21,580 | | | | 3,206 | | | | 2,225 | | | | 1,509 | | | | 434 | |
| Customer accounts | | | 561,003 | | | | 30,539 | | | | 9,430 | | | | 4,509 | | | | 11,615 | | | | 9,052 | |
| Debt securities in issue | | | 111,292 | | | | 37,292 | | | | 57,562 | | | | 34,917 | | | | 44,166 | | | | 4,223 | |
| Derivatives held for hedging | | | 252 | | | | 667 | | | | 822 | | | | 449 | | | | 605 | | | | 118 | |
| Subordinated liabilities | | | 641 | | | | 3,720 | | | | 5,603 | | | | 3,466 | | | | 22,735 | | | | 6,354 | |
| Settlement balances and other liabilities | | | 17,998 | | | | 5 | | | | 14 | | | | 6 | | | | 12 | | | | 7 | |
| | | | 912,100 | | | | 93,803 | | | | 76,637 | | | | 45,572 | | | | 80,642 | | | | 20,188 | |
267
| | | Company | |
| | | | | | | |
| | | 0-3 months | | | 3-12 months | | | 1-3 years | | | 3-5 years | | | 5-10 years | | | 10-20 years | |
| 2008 | | | £m | | | | £m | | | | £m | | | | £m | | | | £m | | | | £m | |
| Deposits by banks | | | 116 | | | | 1,707 | | | | — | | | | — | | | | — | | | | — | |
| Debt securities in issue | | | 4,448 | | | | 3,105 | | | | 1,334 | | | | 6,105 | | | | — | | | | — | |
| Derivatives held for hedging | | | 186 | | | | 16 | | | | 30 | | | | 1 | | | | — | | | | — | |
| Subordinated liabilities | | | 158 | | | | 458 | | | | 1,464 | | | | 1,376 | | | | 4,241 | | | | 5,149 | |
| | | | 4,908 | | | | 5,286 | | | | 2,828 | | | | 7,482 | | | | 4,241 | | | | 5,149 | |
| 2007 | | | | | | | | | | | | | | | | | | | | | | | | |
| Deposits by banks | | | 116 | | | | 5,544 | | | | — | | | | — | | | | — | | | | — | |
| Debt securities in issue | | | 824 | | | | 8,477 | | | | 3,447 | | | | 1,372 | | | | — | | | | — | |
| Derivatives held for hedging | | | 52 | | | | 1 | | | | — | | | | 2 | | | | — | | | | — | |
| Subordinated liabilities | | | 116 | | | | 347 | | | | 1,119 | | | | 1,045 | | | | 3,282 | | | | 3,909 | |
| | | | 1,108 | | | | 14,369 | | | | 4,566 | | | | 2,419 | | | | 3,282 | | | | 3,909 | |
Notes on the accounts continued | Financial statements |
| | Company |
| | 0-3 months | 3-12 months | 1-3 years | 3-5 years | 5-10 years | 10-20 years |
| 2010 | £m | £m | £m | £m | £m | £m |
| Customer accounts | 1,029 | — | — | — | — | — |
| Debt securities in issue | 589 | 1,089 | 6,436 | 128 | 1,248 | — |
| Subordinated liabilities | 317 | 310 | 1,357 | 1,873 | 1,998 | 3,482 |
| | 1,935 | 1,399 | 7,793 | 2,001 | 3,246 | 3,482 |
| | | | | | | |
| 2009 | | | | | | |
| Deposits by banks | 93 | — | — | — | — | — |
| Customer accounts | 964 | 12,337 | — | — | — | — |
| Debt securities in issue | 3,132 | 2,080 | 2,732 | 3,615 | 1,255 | — |
| Derivatives held for hedging | (5) | (23) | (19) | 13 | 64 | — |
| Subordinated liabilities | 106 | 406 | 1,146 | 2,010 | 2,634 | 3,923 |
| | 4,290 | 14,800 | 3,859 | 5,638 | 3,953 | 3,923 |
| | | | | | | |
| 2008 | | | | | | |
| Deposits by banks | 116 | 1,707 | — | — | — | — |
| Debt securities in issue | 4,448 | 3,105 | 1,334 | 6,105 | — | — |
| Derivatives held for hedging | 186 | 16 | 30 | 1 | — | — |
| Subordinated liabilities | 158 | 458 | 1,464 | 1,376 | 4,241 | 5,149 |
| | 4,908 | 5,286 | 2,828 | 7,482 | 4,241 | 5,149 |
The tablestable above showshows the timing of cash outflows to settle financial liabilities. They have beenliabilities, prepared on the following basis:
Financial liabilities are included at the earliest date on which the counterparty can require repayment regardless of whether or not such early repayment results in a penalty. If repayment is triggered by, or is subject to, specific criteria such as market price hurdles being reached, the liability is included at the earliest possible date that the conditions could be fulfilled without considering the probability of the conditions being met. For example, if a structured note is automatically prepaid when an equity index exceeds a certain level, the cash outflow will be included in the less than three monthsmonths' period whatever the level of the index at the year end. The settlement date of debt securities in issue issuedgiven by certain securitisation vehicles consolidated by the Group depends on when cash flows are received from the securitised assets. WhereWher e these assets are prepayable, the timing of the cash outflow relating to securities assumes that each asset will be prepaid at the earliest possible date.
Liabilities with a contractual maturity of greater than 20 years - – the principal amounts of financial liabilities that are repayable after 20 years or where the counterparty has no right to repayment of the principal, are excluded from the table as arealong with interest payments after 20 years.
Held-for-trading assets and liabilities - – held-for-trading assets and liabilities amounting to £1,146.7£665.0 billion (assets) and £586.1 billion (liabilities) (2007 – £ 478.6 billion)(2009 - £650.5 billion assets and £568.5 billion liabilities) have been excluded from the table in view of their short term nature.
12Notes on the accounts continued | Financial statements |
14 Financial assets - impairments
The following table shows the movement in the provision for impairment losses foron loans and advances.
| | | Group | | Group |
| | | Individually assessed | | | Collectively assessed | | | Latent | | | Total 2008 | | | 2007 | | | 2006 | | Individually assessed | Collectively assessed | Latent | Total 2010 | 2009 | 2008 |
| | | | £m | | | | £m | | | | £m | | | | £m | | | | £m | | | | £m | | £m | £m |
| At 1 January | | 1,568 | | | 3,834 | | | 1,050 | | | 6,452 | | | 3,935 | | | 3,887 | | 8,953 | 5,254 | 3,076 | 17,283 | 11,016 | 6,452 |
| Transfer to disposal groups | | (222 | ) | | (351 | ) | | (194 | ) | | (767 | ) | | — | | | — | | (72) | — | (72) | (324) | (767) |
| Currency translation and other adjustments | | 1,065 | | | 81 | | | 295 | | | 1,441 | | | 137 | | | (61 | ) | (15) | 27 | 31 | 43 | (530) | 1,441 |
| Acquisition of subsidiaries | | — | | | — | | | — | | | — | | | 2,221 | | | — | | |
| Disposal of subsidiaries | | — | | | (149 | ) | | (29 | ) | | (178 | ) | | — | | | — | | (1,344) | (526) | (302) | (2,172) | (65) | (178) |
| Net increase in provisions of discontinued operations | | — | | | — | | | — | | | — | | | 46 | | | — | | |
| Amounts written-off | | (1,165 | ) | | (1,983 | ) | | — | | | (3,148 | ) | | (2,011 | ) | | (1,841 | ) | (3,323) | (2,719) | — | (6,042) | (6,939) | (3,148) |
| Recoveries of amounts previously written-off | | 113 | | | 206 | | | — | | | 319 | | | 342 | | | 215 | | 90 | 321 | — | 411 | 399 | 319 |
| Charged to the income statement | | 3,663 | | | 2,606 | | | 822 | | | 7,091 | | | 1,946 | | | 1,877 | | |
| Charged/(credited) to the income statement – continuing operations | | 6,195 | 3,070 | (121) | 9,144 | 13,090 | 6,478 |
| Charged/(credited) to the income statement – discontinued operations | | 35 | 41 | (34) | 42 | 1,044 | 613 |
| Unwind of discount | | (52 | ) | | (142 | ) | | — | | | (194 | ) | | (164 | ) | | (142 | ) | (283) | (172) | — | (455) | (408) | (194) |
At 31 December (1) | | | 4,970 | | | 4,102 | | | 1,944 | | | 11,016 | | | 6,452 | | | 3,935 | | 10,236 | 5,296 | 2,650 | 18,182 | 17,283 | 11,016 |
Notes:
(1) | The provision for impairment losses at 31 December 2008 includesIncludes £127 million relating to loans and advances to banks (2007 – £3(2009 - £157 million; 2006 – £22008 - £127 million). |
| (2) | There is no provision for impairment losses in the company. |
| | | Group | | |
| | | 2008 | | | 2007 | | | 2006 | | Group |
| Impairment losses charged to the income statement | | | £m | | | | £m | | | | £m | | 2010 £m | 2009 £m | 2008 £m |
| Loans and advances to customers | | 6,973 | | | 1,946 | | | 1,877 | | 9,157 | 13,056 | 6,360 |
| Loans and advances to banks | | 118 | | | — | | | — | | (13) | 34 | 118 |
| | | 7,091 | | | 1,946 | | | 1,877 | | 9,144 | 13,090 | 6,478 |
| | | | | | | | | | | | | | |
| Debt securities | | 878 | | | 20 | | | — | | 81 | 601 | 858 |
| Equity shares | | 103 | | | 2 | | | 1 | | 31 | 208 | 103 |
| | | 981 | | | 22 | | | 1 | | 112 | 809 | 961 |
| | | | 8,072 | | | 1,968 | | | 1,878 | | 9,256 | 13,899 | 7,439 |
| | | Group | |
| | | 2008 | | | 2007 | | | 2006 | |
| | | | £m | | | | £m | | | | £m | |
| Gross income not recognised but which would have been recognised under the original terms of non-accrual and restructured loans | | | | | | | | | | | | |
| Domestic | | | 393 | | | | 390 | | | | 370 | |
| Foreign | | | 342 | | | | 155 | | | | 77 | |
| | | | 735 | | | | 545 | | | | 447 | |
| | | | | | | | | | | | | |
| Interest on non-accrual and restructured loans included in net interest income | | | | | | | | | | | | |
| Domestic | | | 150 | | | | 165 | | | | 142 | |
| Foreign | | | 43 | | | | 16 | | | | 15 | |
| | | | 193 | | | | 181 | | | | 157 | |
The following table showstables show an analysis of impaired financial assets.
| | Group |
| | 2010 | | 2009 | | 2008 |
| | | | Carrying | | | | Carrying | | | | Carrying |
| | Cost | Provision | value | | Cost | Provision | value | | Cost | Provision | value |
| | £m | £m | £m | | £m | £m | £m | | £m | £m | £m |
| Loans and receivables | | | | | | | | | | | |
Loans and advances to banks (1) | 145 | 127 | 18 | | 206 | 157 | 49 | | 129 | 127 | 2 |
Loans and advances to customers (2) | 35,556 | 15,405 | 20,151 | | 34,801 | 14,050 | 20,751 | | 19,350 | 8,945 | 10,405 |
| | 35,701 | 15,532 | 20,169 | | 35,007 | 14,207 | 20,800 | | 19,479 | 9,072 | 10,407 |
| | | Group | |
| | | | | | | |
| | | Cost £m | | | Provision £m | | | Net book value £m | | | Cost £m | | | Provision £m | | | Net book value £m | |
| Impaired financial assets | | | | | | | | | | | | | | | | | | |
Loans and advances to banks (1) | | | 129 | | | | 127 | | | | 2 | | | | 25 | | | | 3 | | | | 22 | |
Loans and advances to customers (2) | | | 19,350 | | | | 8,945 | | | | 10,405 | | | | 10,337 | | | | 5,399 | | | | 4,938 | |
Debt securities (1) | | | 52 | | | | 37 | | | | 15 | | | | 5 | | | | 4 | | | | 1 | |
Equity shares (1) | | | 260 | | | | 173 | | | | 87 | | | | 142 | | | | 70 | | | | 72 | |
| | | | 19,791 | | | | 9,282 | | | | 10,509 | | | | 10,509 | | | | 5,476 | | | | 5,033 | |
Notes:
| (1) | Impairment provisions individually assessed. |
| (2) | Impairment provisions individually assessed on balances of £25,492 million (2009 - £24,540 million; 2008 -£11,313 million (2007 – £3,178 million). |
| | Group |
| | Carrying | Carrying | Carrying |
| | Value | Value | Value |
| | 2010 | 2009 | 2008 |
| | £m | £m | £m |
| Available-for-sale securities | | | |
| Debt securities | 580 | 758 | 618 |
| Equity shares | 43 | 180 | 87 |
| | | | |
| Loans and receivables | | | |
| Debt securities | 230 | — | — |
| | 853 | 938 | 705 |
Notes on the accounts continued | Financial statements |
The Group holds collateral in respect of certain loans and advances to banks and to customers that are past due or impaired. Such collateral includes mortgages over property (both personal and commercial); charges over business assets such as plant, inventories and trade debtors; and guarantees of lending from parties other than the borrower.
The following table shows financial and non-financial assets, recognised on the Group's balance sheet, obtained during the year by taking possession of collateral or calling on other credit enhancements.
| | | 2008 | | | 2007 | | Group |
| Group | | | £m | | | | £m | | |
| | | 2010 | 2009 | 2008 |
| | | £m | £m |
| Residential property | | 41 | | | 32 | | 47 | 52 | 41 |
| Other property | | 6 | | | 8 | | 139 | 110 | 6 |
| Cash | | 59 | | | 18 | | 127 | 283 | 59 |
| Other assets | | 30 | | | 5 | | 28 | 42 | 30 |
| | | | 136 | | | 63 | | 341 | 487 | 136 |
In general, the Group seeks to dispose of property and other assets not readily convertible into cash, obtained by taking possession of collateral, that are not readily convertible into cash as rapidly as the market for the individual asset permits.
Loans that have been renegotiated in the past 12 months that would otherwise have been past due or impaired amounted to £2,637£5,758 million as at 31 December 2010 (2009 - £2,698 million; 2008 (2007 – £ 930- £2,637 million).
Companies in the Group transact derivatives as principal either as a trading activity or to manage balance sheet foreign exchange, interest rate and credit risk.
The Group enters into fair value hedges, cash flow hedges and hedges of net investments in foreign operations. The majority of the Group’sGroup's interest rate hedges relate to the management of the Group’sGroup's non-trading interest rate risk. The Group manages this risk to Value-at-Riskwithin approved limits. TheResidual risk is assessed using gap reports that show maturity mismatches. To the extent that such mismatches exceed predetermined limits theypositions are closed by executinghedged with derivatives principally interest rate swaps. Suitable larger ticket financial instruments are fair value hedged; the remaining exposure, where possible, is hedged by derivatives documented as cash flow hedges and qualifying for hedge accounting. The majority of the Group’sGroup's fair value hedges involve interest rate swaps hedging the interest rate risk in recognised financial assets and financial liabilities. Cash flow hedges relate to exposureexposures to the variability in future interest payments and receipts on forecast transactions and ono n recognised financial assets and financial liabilities. The Group hedges its net investments in foreign operations with currency borrowings and forward foreign exchange contracts.
For cash flow hedge relationships of interest rate risk, the hedged items are actual and forecast variable interest rate cash flows arising from financial assets and financial liabilities with interest rates linked to LIBOR, EURIBOR or the Bank of England Official Bank Rate. The financial assets are customer loans and the financial liabilities are customer deposits and LIBOR linked medium-term notes and other issued securities. As at 31 December 2008,2010, variable rate financial assets of £34.6£41.7 billion and variable rate financial liabilities of £56.4£11.4 billion were hedged in such cash flow hedge relationships.
For cash flow hedging relationships, the initial and ongoing prospective effectiveness is assessed by comparing movements in the fair value of the expected highly probable forecast interest cash flows with movements in the fair value of the expected changes in cash flows from the hedging interest rate swap or by comparing the respective changes in the price value of a basis point. Prospective effectiveness is measured on a cumulative basis i.e. over the entire life of the hedge relationship. The method of calculating hedge ineffectiveness is the hypothetical derivative method. Retrospective effectiveness is assessed by comparing the actual movements in the fair value of the cash flows and actual movements in the fair value of the hedged cash flows from the interest rate swap over the life to date of the hedging relationship.
Exchange rate contracts in cash flow hedge relationships hedge future foreign currency cash inflow and outflows; mainly principal and interest on foreign currency loans.
For fair value hedge relationships of interest rate risk, the hedged items are typically large corporate fixed-rate loans, fixed-ratefixed rate finance leases, fixed-ratefixed rate medium-term notes or preference shares classified as debt. As atAt 31 December 20082010, fixed rate financial assets of £42.5£48.8 billion and fixed rate financial liabilities of £46.4£63.9 billion were hedged by interest rate swaps in fair value hedge relationships.
The initial and ongoing prospective effectiveness of fair value hedge relationships is assessed on a cumulative basis by comparing movements in the fair value of the hedged item attributable to the hedged risk with changes in the fair value of the hedging interest rate swap or by comparing the respective changes in the price value of a basis point. Retrospective effectiveness is assessed by comparing the actual movements in the fair value of the hedged items attributable to the hedged risk with actual movements in the fair value of the hedging derivative over the life to date of the hedging relationship.
Notes on the accounts continued | Financial statements |
15 Derivatives continued
| | | Group | |
| | | | | | | |
| | | Notional amounts £bn | | | Assets £m | | | Liabilities £m | | | Notional amounts £bn | | | Assets £m | | | Liabilities £m | |
| Exchange rate contracts | | | | | | | | | | | | | | | | | | |
| Spot, forwards and futures | | | 2,316 | | | | 83,065 | | | | 83,568 | | | | 2,134 | | | | 29,829 | | | | 29,629 | |
| Currency swaps | | | 1,074 | | | | 53,398 | | | | 54,728 | | | | 887 | | | | 14,785 | | | | 13,789 | |
| Options purchased | | | 616 | | | | 36,762 | | | | — | | | | 488 | | | | 13,750 | | | | — | |
| Options written | | | 668 | | | | — | | | | 35,017 | | | | 519 | | | | — | | | | 13,892 | |
| | | | | | | | | | | | | | | | | | | | | | | | | |
| Interest rate contracts | | | | | | | | | | | | | | | | | | | | | | | | |
| Interest rate swaps | | | 37,901 | | | | 548,040 | | | | 532,180 | | | | 24,798 | | | | 142,470 | | | | 141,479 | |
| Options purchased | | | 5,673 | | | | 99,192 | | | | — | | | | 4,084 | | | | 30,681 | | | | — | |
| Options written | | | 3,775 | | | | — | | | | 102,216 | | | | 3,640 | | | | — | | | | 31,199 | |
| Futures and forwards | | | 8,555 | | | | 7,600 | | | | 6,620 | | | | 3,164 | | | | 807 | | | | 987 | |
| | | | | | | | | | | | | | | | | | | | | | | | | |
| Credit Derivatives | | | 2,208 | | | | 142,366 | | | | 132,734 | | | | 2,402 | | | | 34,123 | | | | 29,855 | |
| | | | | | | | | | | | | | | | | | | | | | | | | |
| Equity and commodity contracts | | | 622 | | | | 22,136 | | | | 24,301 | | | | 281 | | | | 10,957 | | | | 11,222 | |
| | | | | | | | 992,559 | | | | 971,364 | | | | | | | | 277,402 | | | | 272,052 | |
The following table shows the notional amounts and fair values of the Group's derivatives.
| | Group |
| | 2010 | | 2009 | | 2008 |
| | Notional | | | | Notional | | | | Notional | | |
| | amount | Assets | Liabilities | | amount | Assets | Liabilities | | amount | Assets | Liabilities |
| | £bn | £m | £m | | £bn | £m | £m | | £bn | £m | £m |
| Exchange rate contracts | | | | | | | | | | | |
| Spot, forwards and futures | 2,807 | 39,859 | 41,424 | | 2,004 | 26,744 | 24,898 | | 2,316 | 83,065 | 83,568 |
| Currency swaps | 1,000 | 28,696 | 34,328 | | 922 | 25,883 | 23,466 | | 1,074 | 53,398 | 54,728 |
| Options purchased | 503 | 14,698 | — | | 440 | 16,656 | — | | 616 | 36,762 | — |
| Options written | 544 | — | 13,623 | | 476 | — | 15,555 | | 668 | — | 35,017 |
| | | | | | | | | | | | |
| Interest rate contracts | | | | | | | | | | | |
| Interest rate swaps | 29,792 | 251,312 | 243,807 | | 30,956 | 265,528 | 253,793 | | 37,901 | 548,040 | 532,180 |
| Options purchased | 2,619 | 57,359 | — | | 3,180 | 55,976 | — | | 5,673 | 99,192 | — |
| Options written | 2,731 | — | 54,141 | | 2,539 | — | 55,589 | | 3,775 | — | 102,216 |
| Futures and forwards | 4,618 | 3,060 | 1,261 | | 6,555 | 2,088 | 2,033 | | 8,555 | 7,600 | 6,620 |
| | | | | | | | | | | | |
| Credit derivatives | 1,357 | 26,872 | 25,344 | | 1,621 | 41,748 | 39,127 | | 2,208 | 142,366 | 132,734 |
| | | | | | | | | | | | |
| Equity and commodity contracts | 179 | 5,221 | 10,039 | | 188 | 6,831 | 9,680 | | 622 | 22,136 | 24,301 |
| | | 427,077 | 423,967 | | | 441,454 | 424,141 | | | 992,559 | 971,364 |
Certain derivative asset and liability balances with the London Clearing House, which meet the offset criteria in IAS 32 ‘Financial InstrumentsInstruments: Presentation’, are now shown net. Comparative figures have been restated, reducing derivative assets and liabilities at 31 December 2007 by £60,008 million.
Included above are derivatives held for hedging purposes as follows:
| | | | | | | | 2010 | | 2009 | | 2008 |
| | | Assets £m | | | Liabilities £m | | | Assets £m | | | Liabilities £m | | Assets | Liabilities | | Assets | Liabilities | | Assets | Liabilities |
| Fair value hedging: | | | | | | | | | | | | | |
| | | £m | | £m | | £m | £m |
| Fair value hedging | | | | | | | |
| Exchange rate contracts | | 1,257 | | | 1,412 | | | 62 | | | 344 | | — | | 160 | 38 | | 1,257 | 1,412 |
| Interest rate contracts | | 2,944 | | | 3,330 | | | 1,598 | | | 1,062 | | 2,496 | 3,767 | | 2,672 | 3,292 | | 2,944 | 3,330 |
| | | | | | | | | | | | | | | | | | | | | | | |
| Cash flow hedging: | | | | | | | | | | | | | | | | | |
| Cash flow hedging | | | | | | | |
| Exchange rate contracts | | 2 | | | 90 | | | 155 | | | 78 | | — | | 2 | 7 | | 2 | 90 |
| Interest rate contracts | | 2,503 | | | 2,834 | | | 738 | | | 1,014 | | 2,903 | 995 | | 1,753 | 3,080 | | 2,503 | 2,834 |
| Commodity contracts | | 39 | | | 14 | | | — | | | — | | — | | — | | 39 | 14 |
| | | | | | | | | | | | | | | | | | | | | | | |
| Net investment hedging: | | | | | | | | | | | | | | | | | |
| Net investment hedging | | | | | | | |
| Exchange rate contracts | | 114 | | | 596 | | | — | | | 211 | | 30 | 102 | | 10 | 90 | | 114 | 596 |
Hedge ineffectiveness recognised in other operating income comprised:
| | | | 2008 £m | | | | 2007 £m | | | | 2006 £m | |
| Fair value hedging: | | | | | | | | | | | | |
| (Losses)/gains on the hedged items attributable to the hedged risk | | | (965 | ) | | | 81 | | | | 219 | |
| Gains/(losses) on the hedging instruments | | | 884 | | | | (87 | ) | | | (215 | ) |
| Fair value ineffectiveness | | | (81 | ) | | | (6 | ) | | | 4 | |
| Cash flow hedging ineffectiveness | | | (16 | ) | | | 9 | | | | 4 | |
| | | | (97 | ) | | | 3 | | | | 8 | |
| | 2010 | 2009 | 2008 |
| | £m | £m | £m |
| Fair value hedging | | | |
| Gains/(losses) on the hedged items attributable to the hedged risk | 343 | 512 | (965) |
| (Losses)/gains on the hedging instruments | (405) | (455) | 884 |
| Fair value ineffectiveness | (62) | 57 | (81) |
| Cash flow hedging ineffectiveness | (37) | 14 | (16) |
| | (99) | 71 | (97) |
13Notes on the accounts continued | Derivatives (continued)Financial statements |
The following tables show, for interest rate swaps in cash flow hedges,the Group, when the hedged cash flows are expected to occur and when they will affect profit or loss.income for designated cash flow hedges.
| | | 2008 | | Group |
| | | 0-1 years £m | 1-2 years £m | 2-3 years £m | 3-4 years £m | 4-5 years £m | 5-10 years £m | 10-20 years £m | Over 20 years £m | Total £m |
| 2010 | |
Hedged forecast cash flows expected to occur | | 0-1 years £m | | | 1-2 years £m | | | 2-3 years £m | | | 3-4 years £m | | | 4-5 years £m | | | 5-10 years £m | | | 10-20 years £m | | | Over 20 years £m | | | Total £m | | | |
| Forecast receivable cash flows | | 985 | | | 779 | | | 667 | | | 554 | | | 423 | | | 1,323 | | | 407 | | | 45 | | | 5,183 | | 280 | 254 | 219 | 161 | 120 | 169 | 30 | — | 1,233 |
| Forecast payable cash flows | | (1,732 | ) | | (1,614 | ) | | (1,390 | ) | | (1,059 | ) | | (890 | ) | | (2,880 | ) | | (1,397 | ) | | (257 | ) | | (11,219 | ) | (47) | (41) | (33) | (30) | (137) | (176) | (54) | (548) |
| | | | |
| Hedged forecast cash flows affect on profit or loss | | | |
| Forecast receivable cash flows | | 281 | 250 | 214 | 157 | 112 | 161 | 28 | — | 1,203 |
| Forecast payable cash flows | | (46) | (41) | (33) | (30) | (29) | (137) | (175) | (54) | (545) |
| | | | |
| 2009 | | | |
| Hedged forecast cash flows expected to occur | | | |
| Forecast receivable cash flows | | 504 | 466 | 423 | 267 | 163 | 379 | 141 | — | 2,343 |
| Forecast payable cash flows | | (554) | (521) | (416) | (350) | (299) | (990) | (819) | (167) | (4,116) |
| | | | |
| Hedged forecast cash flows affect on profit or loss | | | |
| Forecast receivable cash flows | | 503 | 467 | 422 | 255 | 163 | 371 | 141 | — | 2,322 |
| Forecast payable cash flows | | (554) | (518) | (409) | (346) | (296) | (978) | (818) | (167) | (4,086) |
| | | 2008 | | |
Hedged forecast cash flows affect profit or loss | | 0-1 years £m | | | 1-2 years £m | | | 2-3 years £m | | | 3-4 years £m | | | 4-5 years £m | | | 5-10 years £m | | | 10-20 years £m | | | Over 20 years £m | | | Total £m | | |
| 2008 | | | |
| Hedged forecast cash flows expected to occur | | | |
| Forecast receivable cash flows | | 871 | | | 758 | | | 659 | | | 548 | | | 421 | | | 1,284 | | | 397 | | | 40 | | | 4,978 | | 985 | 779 | 667 | 554 | 423 | 1,323 | 407 | 45 | 5,183 |
| Forecast payable cash flows | | (1,701 | ) | | (1,576 | ) | | (1,323 | ) | | (1,023 | ) | | (878 | ) | | (2,771 | ) | | (1,337 | ) | | (128 | ) | | (10,737 | ) | (1,732) | (1,614) | (1,390) | (1,059) | (890) | (2,880) | (1,397) | (257) | (11,219) |
| | | | |
| Hedged forecast cash flows affect on profit or loss | | | |
| Forecast receivable cash flows | | 871 | 758 | 659 | 548 | 421 | 1,284 | 397 | 40 | 4,978 |
| Forecast payable cash flows | | (1,701) | (1,576) | (1,323) | (1,023) | (878) | (2,771) | (1,337) | (128) | (10,737) |
The following table shows the notional amounts and fair values of the company's derivatives.
| | | Company |
| | | 2010 | | 2009 | | 2008 |
| | | Company | | Notional | | | Notional | | | Notional | |
| | | | | | | | amount | Assets | Liabilities | | amount | Assets | Liabilities | | amount | Assets | Liabilities |
| | | Notional amounts £bn | | | Assets £m | | | Liabilities £m | | | Notional amounts £bn | | | Assets £m | | | Liabilities £m | | £bn | £m | | £bn | £m | | £bn | £m |
| Exchange rate contracts | | 7 | | | 792 | | | 353 | | | 13 | | | 154 | | | 178 | | 6 | 1,195 | 231 | | 10 | 875 | 422 | | 7 | 792 | 353 |
| Interest rate contracts | | 5 | | | 376 | | | 8 | | | 1 | | | 19 | | | 1 | | 4 | 280 | — | | 4 | 294 | 24 | | 5 | 376 | 8 |
| | | | | | | 1,168 | | | 361 | | | | | | | | 173 | | | 179 | | | 1,475 | 231 | | | 1,169 | 446 | | | 1,168 | 361 |
Included above are derivatives held for hedging purposes as follows;follows:
| | 2010 | | 2009 | | 2008 |
| Fair value hedging | Assets £m | Liabilities £m | | Assets £m | Liabilities £m | | Assets £m | Liabilities £m |
| Exchange rate contracts | — | — | | — | — | | — | 225 |
| Interest rate contracts | 252 | — | | 239 | 14 | | 193 | — |
| | | | | | | |
| Fair value hedging | | Assets £m | | | Liabilities £m | | | Assets £m | | | Liabilities £m | |
| Exchange rate contracts | | | — | | | | 225 | | | | — | | | | 54 | |
| Interest rate contracts | | | 193 | | | | — | | | | — | | | | — | |
14Notes on the accounts continued | Financial statements |
| | | | |
| | | UK central and local government | | | US central and local government | | | Other central and local government | | | Bank and building society | | | Mortgage and other asset backed securities(1) | | | Corporate | | | Other(2) | | | Total | |
| 2008 | | | £m | | | | £m | | | | £m | | | | £m | | | | £m | | | | £m | | | | £m | | | | £m | |
| Held-for-trading | | | 5,372 | | | | 9,859 | | | | 37,519 | | | | 4,407 | | | | 39,879 | | | | 17,671 | | | | 1,573 | | | | 116,280 | |
Designated as at fair value through profit or loss | | | 2,085 | | | | 510 | | | | 472 | | | | 89 | | | | 236 | | | | 1,580 | | | | 456 | | | | 5,428 | |
| Available-for-sale | | | 11,330 | | | | 6,152 | | | | 32,480 | | | | 12,038 | | | | 62,067 | | | | 6,501 | | | | 2,288 | | | | 132,856 | |
| Loans and receivables | | | — | | | | — | | | | — | | | | 114 | | | | 8,961 | | | | 3,749 | | | | 161 | | | | 12,985 | |
| | | | 18,787 | | | | 16,521 | | | | 70,471 | | | | 16,648 | | | | 111,143 | | | | 29,501 | | | | 4,478 | | | | 267,549 | |
| | | | | | | | | | | | | | | | | | | | | | | | | | | | | | | | | |
| Available-for-sale | | | | | | | | | | | | | | | | | | | | | | | | | | | | | | | | |
| Gross unrealised gains | | | 41 | | | | 41 | | | | 1,104 | | | | 1,372 | | | | 1,238 | | | | 332 | | | | 266 | | | | 4,394 | |
| Gross unrealised losses | | | — | | | | (166 | ) | | | (3,457 | ) | | | (146 | ) | | | (3,533 | ) | | | (448 | ) | | | (80 | ) | | | (7,830 | ) |
16 Debt securities
| | Group |
| | UK central and local government | US central and local government | Other central and local government | Banks and building societies | Asset backed securities (1) | Corporate | Other (2) | Total |
| 2010 | £m | £m | £m | £m | £m | £m | £m | £m |
| Held-for-trading | 5,097 | 15,956 | 43,224 | 5,778 | 21,988 | 6,590 | 236 | 98,869 |
| Designated as at fair value | 1 | — | 262 | 3 | 119 | 16 | 1 | 402 |
| Available-for-sale | 8,377 | 17,890 | 33,122 | 7,198 | 42,515 | 2,011 | 17 | 111,130 |
| Loans and receivables | 11 | — | — | 15 | 6,203 | 848 | 2 | 7,079 |
| | 13,486 | 33,846 | 76,608 | 12,994 | 70,825 | 9,465 | 256 | 217,480 |
| | | | | | | | | |
| Available-for-sale | | | | | | | | |
| Gross unrealised gains | 349 | 341 | 700 | 60 | 1,057 | 87 | 1 | 2,595 |
| Gross unrealised losses | (10) | (1) | (618) | (32) | (3,396) | (37) | (3) | (4,097) |
| | | | | | | | | |
| | | | | | | | | |
| 2009 | | | | | | | | |
| Held-for-trading | 8,128 | 10,427 | 50,219 | 6,103 | 28,820 | 6,892 | 893 | 111,482 |
| Designated as at fair value | 122 | 3 | 402 | 483 | 394 | 1,178 | 21 | 2,603 |
| Available-for-sale | 19,071 | 12,972 | 45,512 | 11,210 | 51,044 | 3,365 | 124 | 143,298 |
| Loans and receivables | 1 | — | — | — | 7,924 | 1,853 | 93 | 9,871 |
| | 27,322 | 23,402 | 96,133 | 17,796 | 88,182 | 13,288 | 1,131 | 267,254 |
| | | | | | | | | |
| Available-for-sale | | | | | | | | |
| Gross unrealised gains | 109 | 213 | 1,062 | 148 | 783 | 90 | 7 | 2,412 |
| Gross unrealised losses | (60) | (89) | (266) | (119) | (3,314) | (56) | (6) | (3,910) |
| | | | | | | | | |
| | | | | | | | | |
| 2008 | | | | | | | | |
| Held-for-trading | 5,372 | 9,859 | 37,519 | 11,021 | 39,879 | 11,057 | 1,573 | 116,280 |
| Designated as at fair value | 2,085 | 510 | 472 | 89 | 236 | 1,580 | 456 | 5,428 |
| Available-for-sale | 11,330 | 6,152 | 32,480 | 13,139 | 62,067 | 5,400 | 2,288 | 132,856 |
| Loans and receivables | — | — | — | 114 | 8,961 | 3,749 | 161 | 12,985 |
| | 18,787 | 16,521 | 70,471 | 24,363 | 111,143 | 21,786 | 4,478 | 267,549 |
| | | | | | | | | |
| Available-for-sale | | | | | | | | |
| Gross unrealised gains | 41 | 41 | 1,104 | 1,372 | 1,238 | 332 | 266 | 4,394 |
| Gross unrealised losses | — | (166) | (3,457) | (168) | (3,533) | (426) | (80) | (7,830) |
| | | Group | |
| | | UK central and local government | | | US central and local government | | | Other central and local government | | | Bank and building society | | | Mortgage and other asset backed securities(1) | | | Corporate | | | Other(2) | | | Total | |
| 2007 | | | £m | | | | £m | | | | £m | | | | £m | | | | £m | | | | £m | | | | £m | | | | £m | |
| Held-for-trading | | | 10,370 | | | | 12,670 | | | | 60,356 | | | | 7,830 | | | | 62,430 | | | | 35,769 | | | | 1,246 | | | | 190,671 | |
| Designated as at fair value | | | | | | | | | | | | | | | | | | | | | | | | | | | | | | | | |
| through profit or loss | | | 2,235 | | | | 397 | | | | 101 | | | | 154 | | | | 340 | | | | 2,125 | | | | 425 | | | | 5,777 | |
| Available-for-sale | | | 1,030 | | | | 2,169 | | | | 31,597 | | | | 11,835 | | | | 36,607 | | | | 6,551 | | | | 5,747 | | | | 95,536 | |
| Loans and receivables | | | — | | | | — | | | | 1,896 | | | | — | | | | 704 | | | | — | | | | 72 | | | | 2,672 | |
| | | | 13,635 | | | | 15,236 | | | | 93,950 | | | | 19,819 | | | | 100,081 | | | | 44,445 | | | | 7,490 | | | | 294,656 | |
| Available-for-sale | | | | | | | | | | | | | | | | | | | | | | | | | | | | | | | | |
| Gross unrealised gains | | | 29 | | | | 14 | | | | 56 | | | | 12 | | | | 18 | | | | 22 | | | | 1 | | | | 152 | |
| Gross unrealised losses | | | — | | | | (62 | ) | | | (276 | ) | | | (42 | ) | | | (181 | ) | | | (22 | ) | | | (10 | ) | | | (593 | ) |
| (1) | Includes securities issued by US federal agencies and government sponsored entities, and covered bonds. |
| (2) | Includes securities, other than asset-backed securities, issued by US federal agencies and government sponsored entities. |
(2) | Includes non asset backed securities issued by US federal agencies and government sponsored entities. |
| (3) | During 20082009, the Group reclassified financial assetsdebt securities from the held-for-trading category into the loans and receivables category and in 2008 from the held-for-trading and available-for-sale categories into the loans and receivables category and from the held-for-trading category into the available-for-sale category (see page 193)pages 247 to 250). |
Gross gains of £635 million (2009 - £1,155 million; 2008 - £880 million) and gross losses of £159 million (2009 - £1,255 million; 2008 - £838 million) were realised on the sale of available-for-sale securities.
The company holds debt securities issued by a Group undertaking of £1,454 million (2009 - £1,286 million; 2008 - nil) classified as loans and receivables.
Notes on the accounts continued | Financial statements |
The following table analyses by issuer, the Group’sGroup's available-for-sale debt securities by remaining maturity and the related yield (based on weighted averages)., by remaining maturity.
| | Within 1 year | | After 1 but within 5 years | | After 5 but within 10 years | | After 10 years | | Total |
| | Amount | Yield | | Amount | Yield | | Amount | Yield | | Amount | Yield | | Amount | Yield |
| 2010 | £m | % | | £m | % | | £m | % | | £m | % | | £m | % |
UK central and local governments | 851 | 1.4 | | 2,525 | 2.8 | | 3,333 | 3.9 | | 1,668 | 4.2 | | 8,377 | 3.4 |
US central and local governments | 363 | 0.4 | | 6,806 | 1.5 | | 10,698 | 3.3 | | 23 | 5.1 | | 17,890 | 2.6 |
Other central and local governments | 10,235 | 2.2 | | 10,960 | 3.2 | | 8,878 | 3.3 | | 3,049 | 4.0 | | 33,122 | 3.0 |
| Bank and building societies | 2,756 | 3.6 | | 4,020 | 2.8 | | 408 | 4.6 | | 14 | 2.8 | | 7,198 | 3.2 |
Asset backed securities (1) | 2,688 | 2.5 | | 14,628 | 1.9 | | 10,058 | 2.3 | | 15,141 | 2.7 | | 42,515 | 2.3 |
| Corporates | 366 | 2.7 | | 1,034 | 3.9 | | 544 | 4.9 | | 67 | 4.8 | | 2,011 | 4.0 |
Other (2) | 4 | 1.6 | | 12 | — | | — | — | | 1 | — | | 17 | 0.3 |
| | 17,263 | 2.4 | | 39,985 | 2.4 | | 33,919 | 3.1 | | 19,963 | 3.0 | | 111,130 | 2.7 |
| | | | | | After 1 but within 5 years | | | After 5 but within 10 years | | | | | | | |
| | | Amount | | | Yield | | | Amount | | | Yield | | | Amount | | | Yield | | | Amount | | | Yield | | | Amount | | | Yield | |
| 2008 | | | £m | | | % | | | | £m | | | % | | | | £m | | | % | | | | £m | | | % | | | | £m | | | % | |
| UK central and local government | | | 9,320 | | | | 2.0 | % | | | 1,307 | | | | 3.8 | % | | | 670 | | | | 7.2 | % | | | 33 | | | | 4.6 | % | | | 11,330 | | | | 2.5 | % |
| US central and local government | | | 37 | | | | 3.6 | % | | | 232 | | | | 3.9 | % | | | 4,980 | | | | 3.8 | % | | | 903 | | | | 5.6 | % | | | 6,152 | | | | 4.0 | % |
| Other central and local government | | | 4,770 | | | | 3.5 | % | | | 9,046 | | | | 4.3 | % | | | 18,655 | | | | 3.2 | % | | | 9 | | | | 3.2 | % | | | 32,480 | | | | 3.5 | % |
| Bank and building society | | | 5,753 | | | | 2.2 | % | | | 3,919 | | | | 3.7 | % | | | 2,046 | | | | 4.8 | % | | | 320 | | | | 3.3 | % | | | 12,038 | | | | 3.0 | % |
Mortgage-backed securities(1) | | | 2,806 | | | | 4.1 | % | | | 13,286 | | | | 2.6 | % | | | 17,510 | | | | 3.9 | % | | | 28,465 | | | | 4.6 | % | | | 62,067 | | | | 3.9 | % |
| Corporate | | | 1,024 | | | | 4.6 | % | | | 3,454 | | | | 5.1 | % | | | 1,565 | | | | 7.4 | % | | | 458 | | | | 3.5 | % | | | 6,501 | | | | 5.4 | % |
Other(2) | | | 202 | | | | 3.4 | % | | | 298 | | | | 3.9 | % | | | 1,134 | | | | 4.5 | % | | | 654 | | | | 4.4 | % | | | 2,288 | | | | 4.2 | % |
| Total fair value | | | 23,912 | | | | 2.7 | % | | | 31,542 | | | | 3.5 | % | | | 46,560 | | | | 3.8 | % | | | 30,842 | | | | 4.6 | % | | | 132,856 | | | | 3.7 | % |
Notes:
| (1) | Includes securities issued by US federal agencies and government sponsored entities. |
| (2) | Includes non-asset backed securities, issued by US federal agencies and government sponsored entities. |
The table below shows the fair value of available-for-sale debt securities that were in an unrealised loss position at 31 December.
| | | | | | | | | | |
| | | Fair value | | | Gross unrealised losses | | | Fair value | | | Gross unrealised losses | | | Fair value | | | Gross unrealised losses | |
| 2008 | | | £m | | | | £m | | | | £m | | | | £m | | | | £m | | | | £m | |
| US central and local government | | | 260 | | | | 3 | | | | 10,777 | | | | 163 | | | | 11,037 | | | | 166 | |
| Other central and local government | | | 17,939 | | | | 3,450 | | | | 39 | | | | 7 | | | | 17,978 | | | | 3,457 | |
| Bank and building society | | | 1,402 | | | | 95 | | | | 1,192 | | | | 51 | | | | 2,594 | | | | 146 | |
Mortgage-backed securities(1) | | | 15,032 | | | | 2,840 | | | | 25,033 | | | | 693 | | | | 40,065 | | | | 3,533 | |
| Corporate | | | 618 | | | | 267 | | | | 2,326 | | | | 181 | | | | 2,944 | | | | 448 | |
Other(2) | | | 9 | | | | 1 | | | | 235 | | | | 79 | | | | 244 | | | | 80 | |
| | | | 35,260 | | | | 6,656 | | | | 39,602 | | | | 1,174 | | | | 74,862 | | | | 7,830 | |
Notes:
(1)
| Includes securities issued by US federal agencies and government sponsored entities. |
(2)
| Includes nonother than asset-backed securities, issued by US federal agencies and government sponsored entities. |
17 Equity shares
| | Group |
| | 2010 | | 2009 | | 2008 |
| | Listed | Unlisted | Total | | Listed | Unlisted | Total | | Listed | Unlisted | Total |
| | £m | £m | £m | | £m | £m | £m | | £m | £m | £m |
| Held-for-trading | 19,110 | 76 | 19,186 | | 14,394 | 49 | 14,443 | | 15,894 | 1,160 | 17,054 |
Designated as at fair value through profit or loss | 282 | 731 | 1,013 | | 1,548 | 644 | 2,192 | | 1,340 | 761 | 2,101 |
| | |
| Available-for-sale | 650 | 1,349 | 1,999 | | 937 | 1,956 | 2,893 | | 4,882 | 2,293 | 7,175 |
| | 20,042 | 2,156 | 22,198 | | 16,879 | 2,649 | 19,528 | | 22,116 | 4,214 | 26,330 |
| | | | | | | | | | | | |
| Available-for-sale | | | | | | | | | | | |
| Gross unrealised gains | 67 | 232 | 299 | | 293 | 312 | 605 | | 1,505 | 172 | 1,677 |
| Gross unrealised losses | (17) | (145) | (162) | | (14) | (68) | (82) | | (225) | (103) | (328) |
Gross gains of £1,633£83 million (2007 – £60(2009 - £385 million; 2008 - £181 million) and gross losses of £1,411£63 million (2007 – £12(2009 - £123 million; 2008 - £59 million) were realised on the sale of available-for-sale securities.
14 | Debt securities (continued) |
Impairment losses on available-for-sale debt securities are recognised when there is objective evidence of impairment. The Group reviews its portfolios of available-for-sale financial assets for such evidence which includes: default or delinquency in interest or principal payments; significant financial difficulty of the issuer or obligor; and it becoming probable that the issuer will enter bankruptcy or other financial reorganisation. However, the disappearance of an active market because an entity’s financial instruments are no longer publicly traded is not evidence of impairment. Furthermore, a downgrade of an entity’s credit rating is not, of itself, evidence of impairment, although it may be evidence of impairment when considered with other available information. A decline in the fair value of a financial asset below its cost or amortised cost is not necessarily evidence of impairment. Determining whether objective evidence of impairment exists requires the exercise of management judgment. The unrecognised losses on the Group’s available-for-sale debt securities are concentrated in its portfolios of mortgage-backed securities and of securities issued by central and local governments other than the UK and the US. The losses reflect the widening of credit spreads as a result of the reduced market liquidity in these securities and the current uncertain macro-economic outlook in US and Europe. The underlying securities remain unimpaired.
| | | | |
| | | | | | | |
| | | Listed | | | Unlisted | | | Total | | | Listed | | | Unlisted | | | Total | |
| | | | £m | | | | £m | | | | £m | | | | £m | | | | £m | | | | £m | |
| Held-for-trading | | | 15,894 | | | | 1,160 | | | | 17,054 | | | | 33,696 | | | | 3,850 | | | | 37,546 | |
| Designated as at fair value through profit or loss | | | 1,340 | | | | 761 | | | | 2,101 | | | | 1,856 | | | | 6,010 | | | | 7,866 | |
| Available-for-sale | | | 4,882 | | | | 2,293 | | | | 7,175 | | | | 5,622 | | | | 1,992 | | | | 7,614 | |
| | | | 22,116 | | | | 4,214 | | | | 26,330 | | | | 41,174 | | | | 11,852 | | | | 53,026 | |
| Available-for-sale | | | | | | | | | | | | | | | | | | | | | | | | |
| Gross unrealised gains | | | 1,505 | | | | 172 | | | | 1,677 | | | | 3,467 | | | | 130 | | | | 3,597 | |
| Gross unrealised losses | | | (225 | ) | | | (103 | ) | | | (328 | ) | | | (3 | ) | | | (7 | ) | | | (10 | ) |
Gross gains of £190 million (2007 – £475 million) and gross losses of £70 million (2007 – £9 million) were realised on the sale of available-for- sale equity shares.
Dividend income from available-for-sale equity shares was £281£69 million (2007 – £ 137(2009 - £78 million; 2006 – £922008 - £276 million).
Unquoted equity investments whose fair value cannot be reliably measured are carried at cost and classified as available-for-sale financial assets. They include capital stock (redeemable at cost) in the Federal Home Loan Bank and the Federal Reserve Bank of £0.9£0.8 billion (2007 – £0.5(2009 - £0.8 billion; 2008 - £0.9 billion) that the Group’sGroup's banking subsidiaries in the US are required to hold; and a number of individually small shareholdings in unlisted companies.
Disposals in the year generated no gains or losses (2007 – £0.5of £2 million gain; 2006 – £ 56 million gain)(2009 - £21 million; 2008 - nil).
16Notes on the accounts continued | InvestmentsFinancial statements |
18 Investments in Group undertakings
Investments in Group undertakings are carried at cost less impairment. Movements during the year were as follows:
| | Company |
| | 2010 | 2009 | 2008 |
| | £m | £m | £m |
| At 1 January | 64,766 | 42,196 | 43,542 |
| Currency translation and other adjustments | (49) | (566) | 2,839 |
| Additional investments in Group undertakings | 1,884 | 36,202 | 10,323 |
| Additions | — | — | 26 |
| Redemption of investments in Group undertakings | (12,346) | (7,908) | — |
| Disposals | (6) | (19) | (213) |
| Impairment of investments | (5,124) | (5,139) | (14,321) |
| At 31 December | 49,125 | 64,766 | 42,196 |
| | | | |
| | | 2008 | | | 2007 | |
| | | | £m | | | | £m | |
| At 1 January | | | 43,542 | | | | 21,784 | |
| Currency translation and other adjustments | | | 2,839 | | | | 535 | |
| Additional investments in Group undertakings | | | 10,323 | | | | 3,663 | |
| Impairment of investment in RFS Holdings B.V. | | | (14,321 | ) | | | — | |
| Disposals | | | (213 | ) | | | (6 | ) |
| Additions | | | 26 | | | | 17,566 | |
| At 31 December | | | 42,196 | | | | 43,542 | |
The principal subsidiary undertakings of the company are shown below. Their capital consists of ordinary and preference shares which are unlisted with the exception of certain preference shares issued by NatWest and ABN AMRO. RBS Holdings N.V.
The Royal Bank of Scotland plc, RBS Insurance Group Limited and RFS Holdings B.V. are directly owned by the company, and all of the other subsidiary undertakings are owned directly, or indirectly through intermediate holding companies, by these companies. All of these subsidiaries are included in the Group’sGroup's consolidated financial statements and have an accounting reference date of 31 December.
| | Nature of business | Country of incorporation
and principal area of
operation | Group interest |
| The Royal Bank of Scotland plc | Banking | Great Britain | 100% |
National Westminster Bank Plc(1) | Banking | Great Britain | 100% |
| Citizens Financial Group, Inc. | Banking | US | 100% |
Coutts & CoCompany (2) | Private banking | Great Britain | 100% |
Greenwich Capital Markets,RBS Securities Inc. | Broker dealer | US | 100% |
| RBS Insurance Group Limited | Insurance | Great Britain | 100% |
Ulster Bank Limited(3) | Banking | Northern Ireland | 100% |
ABN AMRO BankRBS Holdings N.V.(4)
| Banking | The Netherlands | 38%98% |
Notes:
| (1) | The company does not hold any of the NatWest preference shares in issue. |
| |
| (2) | Coutts & CoCompany is incorporated with unlimited liability. Its registered office is 440 Strand, London WC2R 0QS. |
| |
| (3) | Ulster Bank Limited and its subsidiaries also operate in the Republic of Ireland. |
| |
| (4) | RFS Holdings B.V. (RFS) owns 100% of the outstanding shares of ABNRBS Holdings N.V. (ABN AMRO Holding N.V. (ABN AMRO)prior to 1 April 2010). TheUntil 31 December 2010, the company ownsowned 38% of RFS; the balance of shares iswere held by the State of the Netherlands, successor to Fortis N.V., Fortis SA/NV, and Banco Santander S.A. (the consortium members). Although the company doesdid not control a majority of the voting rights in RFS, through the terms foof the Consortium and Shareholders' Agreement and RFS's Articles of Association, it controlscontrolled the board of RFS and RFS is a subsidiary of the company. The capital and income rightsRFS Holdings has substantially completed the separation of shares issuedthe business units of ABN AMRO Holding N.V. As part of this reorganisation, on 6 February 2010, the businesses of ABN AMRO Holding N.V. acquired by RFS are linked to the net assets and income ofDutch State were legally demerged from the ABN AMRO business unitsHolding N.V. businesses acquired by the Group and were transferred into a newly established holding company, ABN AMRO Bank N.V. (save for certain assets and liabilities acquired by the Dutch State that were not part of the legal separation and which will be transferred to the individual consortium members have agreedDutch State as soon as possible). Legal separation of ABN AMRO Bank N.V. occurred on 1 April 2010, with the shares in that entity being transferred by RBS Holdings N.V. to acquire.a holding company called ABN AMRO Group N.V., which is owned by the Dutch State. Following legal separation, RBS Holdings N.V. has one direct subsidiary, The Royal Bank of Scotland N.V. (RBS N.V.), a fully operational bank within the Group. RBS N.V. is independently rated and regulated by the Dutch Central Bank. On 31 December 2010, the shareholdings of RFS were amended such that approximately 98% of its issued share capital is now held by the company with the remainder owned by the State of the Netherlands and Banco Santander S.A. Certain assets within RBS N.V. continue to be shared by the Consortium Members. On the division of an entity by demerger, Dutch law establishes a cross liability between surviving entities in respect of the creditors at the time of the demerger. RBS N.V.’s cross liability is limited by law to the lower of its equity and the debts of ABN AMRO Bank N.V. on 1 April 2010. The likelihood of any cross liability crystallising is considered remote. |
The above information is provided in relation to the principal related undertakings as permitted by Section 231(5)410(2) of the Companies Act 1985.2006. Full information on all related undertakings will beis included in the Annual Return delivered to the RegistrantRegistrar of Companies for Scotland.
| 19 Intangible assets | Group |
| | Goodwill | Core deposit intangibles | Other purchased intangibles | Internally generated software | Total |
| 2010 | £m | £m | £m | £m | £m |
| Cost | | | | | |
| At 1 January 2010 | 42,643 | 2,553 | 4,139 | 4,815 | 54,150 |
| Currency translation and other adjustments | (374) | (59) | (63) | (21) | (517) |
| Additions | — | — | 46 | 742 | 788 |
| Disposal of subsidiaries | (15,130) | (1,882) | (1,664) | (544) | (19,220) |
| Disposals and write-off of fully amortised assets | — | — | — | (417) | (417) |
| At 31 December 2010 | 27,139 | 612 | 2,458 | 4,575 | 34,784 |
| | | | | | |
| Accumulated amortisation and impairment | | | | | |
| At 1 January 2010 | 28,379 | 1,562 | 2,577 | 3,785 | 36,303 |
| Currency translation and other adjustments | (510) | (29) | (31) | (24) | (594) |
| Disposal of subsidiaries | (13,268) | (1,139) | (1,027) | (304) | (15,738) |
| Disposals and write-off of fully amortised assets | — | — | — | (391) | (391) |
| Charge for the year - continuing operations | — | 68 | 301 | 353 | 722 |
| Charge for the year - discontinued operations | — | — | 2 | 22 | 24 |
| Write down of goodwill and other intangible assets | 10 | — | — | — | 10 |
| At 31 December 2010 | 14,611 | 462 | 1,822 | 3,441 | 20,336 |
| | | | | | |
| Net book value at 31 December 2010 | 12,528 | 150 | 636 | 1,134 | 14,448 |
| | | | | | |
| 2009 | | | | | |
| Cost | | | | | |
| At 1 January 2009 | 45,624 | 2,780 | 4,367 | 4,524 | 57,295 |
| Transfers to disposal groups | (238) | — | — | — | (238) |
| Currency translation and other adjustments | (2,743) | (225) | (281) | (65) | (3,314) |
| Additions | — | — | 53 | 559 | 612 |
| Disposal of subsidiaries | — | — | — | (16) | (16) |
| Disposals and write-off of fully amortised assets | — | (2) | — | (187) | (189) |
| At 31 December 2009 | 42,643 | 2,553 | 4,139 | 4,815 | 54,150 |
| | | | | | |
| Accumulated amortisation and impairment | | | | | |
| At 1 January 2009 | 30,062 | 1,407 | 2,369 | 3,408 | 37,246 |
| Currency translation and other adjustments | (2,046) | (106) | (137) | (58) | (2,347) |
| Disposal of subsidiaries | — | — | — | (13) | (13) |
| Disposals and write-off of fully amortised assets | — | (1) | — | (138) | (139) |
| Charge for the year - continuing operations | — | 89 | 183 | 467 | 739 |
| Charge for the year - discontinued operations | — | 173 | 162 | 119 | 454 |
| Write down of goodwill and other intangible assets | 363 | — | — | — | 363 |
| At 31 December 2009 | 28,379 | 1,562 | 2,577 | 3,785 | 36,303 |
| | | | | | |
| Net book value at 31 December 2009 | 14,264 | 991 | 1,562 | 1,030 | 17,847 |
17Notes on the accounts continued | Financial statements |
| | | | |
| | | Goodwill | | | Core deposit intangibles | | | Other purchased intangibles | | | Internally generated software | | | Total | |
| 2008 | | | £m | | | | £m | | | | £m | | | | £m | | | | £m | |
| Cost: | | | | | | | | | | | | | | | | | | | | |
| At 1 January 2008 | | | 42,953 | | | | 2,344 | | | | 3,489 | | | | 3,882 | | | | 52,668 | |
| Transfers to disposal groups | | | (3,692 | ) | | | (240 | ) | | | (105 | ) | | | (146 | ) | | | (4,183 | ) |
| Currency translation and other adjustments | | | 8,905 | | | | 680 | | | | 961 | | | | 214 | | | | 10,760 | |
| Acquisition of subsidiaries | | | 524 | | | | — | | | | — | | | | — | | | | 524 | |
| Additions | | | — | | | | — | | | | 23 | | | | 602 | | | | 625 | |
| Disposal of subsidiaries | | | (3,066 | ) | | | — | | | | — | | | | (7 | ) | | | (3,073 | ) |
| Disposals and write-off of fully amortised assets | | | — | | | | (4 | ) | | | (1 | ) | | | (21 | ) | | | (26 | ) |
| At 31 December 2008 | | | 45,624 | | | | 2,780 | | | | 4,367 | | | | 4,524 | | | | 57,295 | |
| Accumulated amortisation and impairment: | | | | | | | | | | | | | | | | | | | | |
| At 1 January 2008 | | | — | | | | 238 | | | | 223 | | | | 2,291 | | | | 2,752 | |
| Transfer to disposal groups | | | — | | | | — | | | | — | | | | (37 | ) | | | (37 | ) |
| Currency translation and other adjustments | | | — | | | | 150 | | | | 210 | | | | 69 | | | | 429 | |
| Disposals and write-off of fully amortised assets | | | — | | | | (3 | ) | | | (1 | ) | | | (19 | ) | | | (23 | ) |
| Charge for the year | | | — | | | | 337 | | | | 582 | | | | 651 | | | | 1,570 | |
| Write down of goodwill and other intangible assets | | | 30,062 | | | | 685 | | | | 1,355 | | | | 453 | | | | 32,555 | |
| At 31 December 2008 | | | 30,062 | | | | 1,407 | | | | 2,369 | | | | 3,408 | | | | 37,246 | |
| Net book value at 31 December 2008 | | | 15,562 | | | | 1,373 | | | | 1,998 | | | | 1,116 | | | | 20,049 | |
| 2007 | | | | | | | | | | | | | | | | | | | | |
| Cost: | | | | | | | | | | | | | | | | | | | | |
| At 1 January 2007 | | | 17,889 | | | | 265 | | | | 275 | | | | 2,642 | | | | 21,071 | |
| Currency translation and other adjustments | | | 1,187 | | | | 105 | | | | 177 | | | | 52 | | | | 1,521 | |
| Acquisition of subsidiaries | | | 23,917 | | | | 1,974 | | | | 3,034 | | | | 791 | | | | 29,716 | |
| Additions | | | — | | | | — | | | | 6 | | | | 481 | | | | 487 | |
| Goodwill written off | | | (40 | ) | | | — | | | | — | | | | — | | | | (40 | ) |
| Disposals and write-off of fully amortised assets | | | — | | | | — | | | | (3 | ) | | | (84 | ) | | | (87 | ) |
| At 31 December 2007 | | | 42,953 | | | | 2,344 | | | | 3,489 | | | | 3,882 | | | | 52,668 | |
| Accumulated amortisation: | | | | | | | | | | | | | | | | | | | | |
| At 1 January 2007 | | | — | | | | 127 | | | | 97 | | | | 1,943 | | | | 2,167 | |
| Currency translation and other adjustments | | | — | | | | 1 | | | | 3 | | | | 3 | | | | 7 | |
| Disposals and write-off of fully amortised assets | | | — | | | | — | | | | (1 | ) | | | (80 | ) | | | (81 | ) |
| Charge for the year – continuing operations | | | — | | | | 110 | | | | 124 | | | | 401 | | | | 635 | |
| Charge for the year – discontinued operations | | | — | | | | — | | | | — | | | | 24 | | | | 24 | |
| At 31 December 2007 | | | — | | | | 238 | | | | 223 | | | | 2,291 | | | | 2,752 | |
| Net book value at 31 December 2007 | | | 42,953 | | | | 2,106 | | | | 3,266 | | | | 1,591 | | | | 49,916 | |
| | Group |
| | Goodwill | Core deposit intangibles | Other purchased intangibles | Internally generated software | Total |
| 2008 | £m | £m | £m | £m | £m |
| Cost | | | | | |
| At 1 January 2008 | 42,953 | 2,344 | 3,489 | 3,882 | 52,668 |
| Transfers to disposal groups | (3,692) | (240) | (105) | (146) | (4,183) |
| Currency translation and other adjustments | 8,905 | 680 | 961 | 214 | 10,760 |
| Acquisition of subsidiaries | 524 | — | — | — | 524 |
| Additions | — | — | 23 | 602 | 625 |
| Disposal of subsidiaries | (3,066) | — | — | (7) | (3,073) |
| Disposals and write-off of fully amortised assets | — | (4) | (1) | (21) | (26) |
| At 31 December 2008 | 45,624 | 2,780 | 4,367 | 4,524 | 57,295 |
| | | | | | |
| Accumulated amortisation and impairment | | | | | |
| At 1 January 2008 | — | 238 | 223 | 2,291 | 2,752 |
| Transfer to disposal groups | — | — | — | (37) | (37) |
| Currency translation and other adjustments | — | 150 | 210 | 69 | 429 |
| Disposals and write-off of fully amortised assets | — | (3) | (1) | (19) | (23) |
| Charge for the year - continuing operations | — | 89 | 301 | 581 | 971 |
| Charge for the year - discontinued operations | — | 248 | 281 | 70 | 599 |
| Write down of goodwill and other intangible assets - continuing operations | 15,524 | — | 927 | 434 | 16,885 |
| Write down of goodwill and other intangible assets - discontinued operations | 14,538 | 685 | 428 | 19 | 15,670 |
| At 31 December 2008 | 30,062 | 1,407 | 2,369 | 3,408 | 37,246 |
| | | | | | |
| Net book value at 31 December 2008 | 15,562 | 1,373 | 1,998 | 1,116 | 20,049 |
Goodwill analysed by operating segment is shown in Note 40.
Impairment review
The Group’sGroup's goodwill acquired in business combinations is reviewed annually at 30 September for impairment by comparing the recoverable amount of each cash generating unit (CGU) to which goodwill has been allocated with its carrying value. In light of the unprecedented market conditions the review has been updated to reflect the latest position as at 31 December 2008.
The Group recognised goodwill of £23.3 billion (€33.5 billion) following the preliminary allocation of fair values since acquiring ABN AMRO on 17 October 2007. On final allocation of fair values, goodwill of £23.9 billion (€34.2 billion) was recognised (see Note 34), of which £17.6 billion (€25.3 billion) was attributable to minority interests. Of the minority interests goodwill, £5.4 billion (€5.7 billion) was in respect of Santander acquired businesses which were subsequently sold during 2008. The remaining goodwill in respect of the State of the Netherlands minority interest of £18.8 billion (€19.6 billion) was reduced in part by £2.7 billion (€2.9 billion) following the sale of the Asset Management business with £14.6 billion (€15.2 billion) of the remainder subsequently impaired following the acquisition by the State of the Netherlands for £6.2 billion (€6.5 billion). In addition, a further £1.1 billion (€1.2 billion) impairment was recognised on other intangible assets attributable to the State of the Netherlands acquired businesses.
On the finalisation of the allocation of fair values, goodwill arising on the acquisition of ABN AMRO attributable to the Group has been allocated to those CGUs which are expected to benefit from the synergies of the combination based on their relative values. In addition, following the reorganisation of the Group, reporting structure, NatWest and Citizens goodwill was reallocated to the appropriate CGUs.
The CGUsexcluding RFS Holdings minority interest, where the goodwill arising is significant, principally arose on the acquisitions of NatWest, ABN AMRO, Charter One ABN AMRO and Churchill and are as follows:
| | Recoverable amount based on | Goodwill at 30 September 2010 £m | Goodwill at 30 September 2009 £m |
| UK Retail | Value in use | 2,697 | 2,697 |
| UK Corporate | Value in use | 2,693 | 2,693 |
| Wealth | Value in use | 611 | 611 |
| Global Transaction Services | Value in use | 2,376 | 2,749 |
| US Retail & Commercial | Value in use | 2,811 | 2,761 |
| RBS Insurance | Value in use | 935 | 935 |
| | Recoverable amount based on | Goodwill prior to write down £m | Write down £m | Goodwill at 31 December 2008 £m |
| UK Retail & Commercial Banking | Value in use | 6,009 | — | 6,009 |
| Global Banking & Markets | Value in use | 8,946 | (8,946) | — |
| Global Transaction Services | Value in use | 3,121 | — | 3,121 |
| Europe & Middle East Retail & Commercial Banking | Value in use | 1,201 | (1,201) | — |
| Asia Retail & Commercial Banking | Value in use | 970 | (863) | 107 |
| US Retail & Commercial Banking | Value in use | 7,405 | (4,382) | 3,023 |
| RBS Insurance | Value in use | 935 | — | 935 |
| | Recoverable amount based on: | | Goodwill prior to write down | | | Write down | | | Goodwill at 31 December | |
| 2008 | | | | £m | | | | £m | | | | £m | |
| Global Banking & Markets | Value in use | | | 8,946 | | | | (8,946 | ) | | | — | |
| Global Transaction Services | Value in use | | | 3,121 | | | | — | | | | 3,121 | |
| UK Retail & Commercial Banking | Value in use | | | 6,009 | | | | — | | | | 6,009 | |
| US Retail & Commercial Banking | Value in use | | | 7,405 | | | | (4,382 | ) | | | 3,023 | |
| Europe & Middle East Retail & Commercial Banking | Value in use | | | 1,201 | | | | (1,201 | ) | | | — | |
| Asia Retail & Commercial Banking | Value in use | | | 970 | | | | (863 | ) | | | 107 | |
| RBS Insurance | Value in use | | | 935 | | | | — | | | | 935 | |
| Recoverable amount | | Goodwill at
30 SeptemberNotes on the accounts continued
| |
2007 | based on: | | | £m | |
RBS Insurance | Fair value less costs to sell | | | 1,064 | |
Global Banking & Markets | Fair value less costs to sell | | | 2,346 | |
UK Corporate Banking | Fair value less costs to sell | | | 1,630 | |
Retail | Fair value less costs to sell | | | 4,278 | |
Wealth Management | Fair value less costs to sell | | | 1,100 | |
Citizens – Retail Banking | Value in use | | | 2,067 | |
Citizens – Commercial Banking | Value in use | | | 2,274 | |
Citizens – Consumer Financial Services | Value in use | | | 1,701 | statements |
Impairment testing involves the comparison of the carrying value of a CGU or group of CGUs with its recoverable amount. The analysisrecoverable amount is the higher of the unit's fair value and its value in use. Value in use is the present value of expected future cash flows from the CGU or group of CGUs. Fair value is the amount obtainable for the sale of the CGU in an arm's length transaction between knowledgeable, willing parties.
Impairment testing inherently involves a number of judgmental areas: the preparation of cash flow forecasts for periods that are beyond the normal requirements of management reporting; the assessment of the discount rate appropriate to the business; estimation of the fair value of CGUs; and the valuation of the separable assets of each business whose goodwill by operating segment is shown in Note 38.being reviewed. Sensitivity to the variables more significant to each assessment are presented below.
17 | Intangible assets (continued) |
In 2007, theThe recoverable amounts for all CGUs except Citizens,at 30 September 2010 were based on fair value less costs to sell. Fair value was based upon a price-earnings methodology using current earnings for each unit. Approximate price earnings multiples, validated against independent analyst information, were applied to each CGU. The multiples used were in the range 9.5 – 13.0 times earnings after charging manufacturing costs. The goodwill allocated to Global Banking & Markets, UK Corporate Banking, Retail and Wealth Management principally arose from the acquisition of NatWest in 2000. The recoverable amount of these cash generating units exceeded their carrying value by over £15 billion. The recoverable amount for RBS Insurance exceeded its carrying value by over £1.5 billion. The multiples or earnings would have to be less than one third of those used to cause the value in use of the units to equal their carrying value.
In light of the unprecedented market turmoil, fair value was increasingly hard to appraise and consequently the Group has generally adopted value in use tests for CGUs in 2008, based upon management’stest, using management's latest five yearfive-year forecasts. The long-term growth rates have been based on respective country GDP rates adjusted for inflation. The risk discount rates are based on observable market long-term government bond yields and average industry betas adjusted for an appropriate risk premium based on independent analysis.
Goodwill in respectThe recoverable amount of Global Banking & Markets principally arose from the acquisition of ABN AMRO in October 2007. The failure of a number of banks and severe weakness in the global economy during the second half of 2008 resulted in a fundamental reappraisal of business forecasts, leading to the conclusion that the Global Banking & Markets business at 31 December 2008 could support no goodwill allocated from the ABN AMRO or NatWest acquisitions. In addition, impairments were recognised in respect of intangible assets and certain property, plant and equipment: the customer relationship intangible was impaired by £0.9 billion and capitalised software was impaired by £0.4 billion. The value in use wasUK Retail, based on a 3% (2009 - 4%) terminal growth rate and pre-tax15.7% (2009 - 14.6%) pre tax discount rate, exceeded the carrying amount by £6.9 billion (2009 - £0.7 billion). A 1% change in the discount rate or the terminal growth rate would change the recoverable amount by approximately £1.5 billion (2009 - £0.9 billion) and £0.9 billion (2009 - £0.5 billion) respectively. In addition, a 5% change in the forecast pre tax earnings would change the recoverable amount by approximately £0.9 billion (2009 - £0.4 billion).
The recoverable amount of 19.5%UK Corporate, based on 3% (2009 - 4%) terminal growth rate and a 15.6% (2009 - 15.1%) pre tax discount rate, exceeded its carrying value by £5.3 billion (2009 - £6.1 billion). The result was insensitive to reasonably possible changesA 1% change in key assumptions.the discount rate or the terminal growth rate would change the recoverable amount by approximately £1.6 billion (2009 - £1.4 billion) and £0.9 billion (2009 - £0.9 billion) respectively. In addition, a 5% change in the forecast pre tax earnings would change the recoverable amount by approximately £1.0 billion (2009 - £0.8 billion).
The recoverable amount of the Global Transaction Services businessWealth, based on a 3% (2009 - 4%) terminal growth rate and 15.7%a 12.0% (2009 - 15.3%) pre tax risk discount rate, exceeded its carrying value by more than 100% and was insensitive to a reasonably possible change in key assumptions. The goodwill arises principally from the global payments business acquired through the ABN AMRO acquisition along with cash management and corporate money transmission businesses previously in Citizens and Regional businesses.
UK Retail and Commercial Banking was formed at the beginning of 2008 when the Group brought together the businesses that use its UK branch network. It primarily comprised the UK Retail and Corporate banks but excluded their transaction services business. The recoverable amount was equal to the carrying amount including goodwill arising from the NatWest acquisition. This isof Global Transaction Services, based on a 4%3% (2009 - 3%) terminal growth rate and 15.9%a 12.8% (2009 - 16.7%) pre tax risk discount rate. A 1 %rate, exceeded its carrying value by more than 100% (2009 - 100%) and was insensitive to a reasonably possible change in key assumptions.
The recoverable amount of US Retail & Commercial, based on a 5% (2009 - 5%) terminal growth rate and a 14.9% (2009 - 14.8%) pre tax discount rate, exceeded its carrying value by £1.6 billion (2009 - £2.1 billion). A 1% change in the discount rate or the terminal growth rate would change the recoverable amount by over £2approximately £1.6 billion (2009 - £1.0 billion) and £1£0.8 billion (2009 - £0.8 billion) respectively. In addition, a 5% change in the forecast pre-taxpre tax earnings would change the recoverable amount by approximately £1 billion.£0.7 bill ion (2009 - £0.7 billion).
The goodwill in Europe & Middle East Retail and Commercial Banking arose from the Group’s interests in Ulster Bank Group principally arising outrecoverable amount of the acquisitions of NatWest and First Active. The Irish economy stalled in 2008, with the Government providing rescue packages to local banks, and forecasts within the eurozone economies have reduced accordingly. The impairment review,RBS Insurance, based on a 3% (2009 - 3%) terminal growth rate and 14.1 % pre-tax risk discount rate, showed all goodwill associated with the business was impaired. The result was insensitive to reasonably possible changes in key assumptions.
The Asia Retail and Commercial Banking business comprises much of the Group’s Wealth management business and retail operations in Asia. The outlook in the Asian economies has deteriorated and falling investment values have reduced the yield from managed portfolios. The allocated goodwill principally arising on the acquisition of ABN AMRO was impaired by £862 million based on a 5% terminal growth rate and 14% pre-tax risk discount rate. A 1% change in the discount rate or similar change in the terminal growth rate would change the recoverable amount by approximately £200 million and £100 million respectively. In addition, a 5% change in forecast pre-tax earnings would change the recoverable amount by approximately £50 million.
Further developments in the Group’s US businesses have led to the separation of the transaction services business, with the retail and commercial business being managed as a single unit. The 2007 impairment review indicated the recoverable amount of Citizens exceeded its carrying value by over £2.5 billion ($5 billion) using a terminal growth rate of 5% and a13.1% (2009 - 13.9%) pre tax discount rate of 16.5%. In 2008, rates of 5% and 18% were used respectively and the recoverable amount indicated an impairment of £4.4 billion ($6.4 billion). A 1% change in discount rate or the terminal growth rate would change the recoverable amount and hence goodwill impairment by over £1 billion ($2 billion) and £0.7 billion ($1 billion) respectively. In addition, a 5% change in forecast pre-tax earnings would change the recoverable amount by approximately £0.5 billion ($0.8 billion).
The goodwill allocated to RBS Insurance principally arose from the acquisition of Churchill in 2003. The recoverable amount based on a 3% terminal growth rate and 14.6% pre tax risk discount rate, exceeded the carrying amount by over £2.4 billion (2009 -£3 billion,.0 billion) and was insensitive to a reasonably possible changeschange in key assumptions.
In 2008, the recoverable amounts for all CGUs were based on value in use tests. Goodwill write downs were recorded in Global Banking & Markets, US Retail & Commercial, Europe & Middle East Retail & Commercial Banking and Asia Retail & Commercial Banking divisions. In addition, an impairment charge of £14.5 billion was recorded in respect of goodwill attributable to the State of Netherlands minority interest arising on the acquisition of ABN AMRO.
18Notes on the accounts continued | Financial statements |
| | | Group | |
| | | Investment properties | | | Freehold premises | | | Long leasehold premises | | | Short leasehold premises | | | Computers and other equipment | | | Operating lease assets | | | Total | |
| 2008 | | | £m | | | | £m | | | | £m | | | | £m | | | | £m | | | | £m | | | | £m | |
| Cost or valuation: | | | | | | | | | | | | | | | | | | | | | | | | | | | | |
| At 1 January 2008 | | | 3,431 | | | | 3,645 | | | | 215 | | | | 1,688 | | | | 3,929 | | | | 11,437 | | | | 24,345 | |
| Transfers to disposal groups | | | — | | | | (262 | ) | | | — | | | | (188 | ) | | | (349 | ) | | | — | | | | (799 | ) |
| Currency translation and other adjustments | | | 320 | | | | 452 | | | | 5 | | | | 149 | | | | 436 | | | | 1,313 | | | | 2,675 | |
| Acquisition of subsidiaries | | | — | | | | — | | | | — | | | | 30 | | | | 31 | | | | — | | | | 61 | |
| Disposal of subsidiaries | | | — | | | | — | | | | — | | | | (2 | ) | | | (57 | ) | | | (5,015 | ) | | | (5,074 | ) |
| Reclassifications | | | — | | | | (176 | ) | | | — | | | | 197 | | | | (14 | ) | | | (7 | ) | | | — | |
| Additions | | | 417 | | | | 486 | | | | 22 | | | | 61 | | | | 837 | | | | 3,794 | | | | 5,617 | |
| Expenditure on investment properties | | | 8 | | | | — | | | | — | | | | — | | | | — | | | | — | | | | 8 | |
| Change in fair value of investment properties | | | (86 | ) | | | — | | | | — | | | | — | | | | — | | | | — | | | | (86 | ) |
| Disposals and write-off of fully depreciated assets | | | (222 | ) | | | (113 | ) | | | (18 | ) | | | (68 | ) | | | (645 | ) | | | (2,188 | ) | | | (3,254 | ) |
| At 31 December 2008 | | | 3,868 | | | | 4,032 | | | | 224 | | | | 1,867 | | | | 4,168 | | | | 9,334 | | | | 23,493 | |
| Accumulated impairment, depreciation and amortisation: | | | | | | | | | | | | | | | | | | | | | | | | | | | | |
| At 1 January 2008 | | | — | | | | 391 | | | | 74 | | | | 436 | | | | 1,952 | | | | 2,747 | | | | 5,600 | |
| Transfers to disposal groups | | | — | | | | (60 | ) | | | — | | | | (91 | ) | | | (243 | ) | | | — | | | | (394 | ) |
| Currency translation and other adjustments | | | — | | | | (9 | ) | | | 1 | | | | 9 | | | | 148 | | | | 202 | | | | 351 | |
| Disposal of subsidiaries | | | — | | | | — | | | | — | | | | (1 | ) | | | (39 | ) | | | (1,447 | ) | | | (1,487 | ) |
| Reclassifications | | | — | | | | 17 | | | | (2 | ) | | | 1 | | | | (9 | ) | | | (7 | ) | | | — | |
| Write-off of property, plant and equipment | | | — | | | | 19 | | | | — | | | | — | | | | 7 | | | | — | | | | 26 | |
| Disposals and write-off of fully depreciated assets | | | — | | | | (22 | ) | | | — | | | | (31 | ) | | | (539 | ) | | | (544 | ) | | | (1,136 | ) |
| Charge for the year | | | — | | | | 86 | | | | 6 | | | | 169 | | | | 639 | | | | 684 | | | | 1,584 | |
| At 31 December 2008 | | | — | | | | 422 | | | | 79 | | | | 492 | | | | 1,916 | | | | 1,635 | | | | 4,544 | |
| Net book value at 31 December 2008 | | | 3,868 | | | | 3,610 | | | | 145 | | | | 1,375 | | | | 2,252 | | | | 7,699 | | | | 18,949 | |
20 Property, plant and equipment
| | Group |
| | Investment properties | Freehold premises | Long leasehold premises | Short leasehold premises | Computers and other equipment | Operating lease assets | Total |
| 2010 | £m | £m | £m | £m | £m | £m | £m |
| Cost or valuation | | | | | | | |
| At 1 January 2010 | 4,883 | 4,098 | 214 | 1,803 | 4,282 | 9,558 | 24,838 |
| Currency translation and other adjustments | — | 31 | 2 | 81 | 227 | 231 | 572 |
| Disposal of subsidiaries | — | (1,118) | — | (104) | (372) | (369) | (1,963) |
| Reclassifications | — | (104) | 76 | 15 | 13 | — | — |
| Additions | 511 | 103 | 5 | 137 | 411 | 1,178 | 2,345 |
| Expenditure on investment properties | 2 | — | — | — | — | — | 2 |
| Change in fair value of investment properties | (405) | — | — | — | — | — | (405) |
| Disposals and write-off of fully depreciated assets | (821) | (72) | (6) | (100) | (322) | (1,363) | (2,684) |
| At 31 December 2010 | 4,170 | 2,938 | 291 | 1,832 | 4,239 | 9,235 | 22,705 |
| | | | | | | | |
| Accumulated impairment, depreciation and amortisation | | | | | | | |
| At 1 January 2010 | — | 553 | 87 | 641 | 2,396 | 1,764 | 5,441 |
| Currency translation and other adjustments | — | 62 | 1 | 75 | 199 | 17 | 354 |
| Disposal of subsidiaries | — | (24) | — | (30) | (197) | (141) | (392) |
| Reclassifications | — | (17) | 17 | — | — | — | — |
| Write down of property, plant and equipment | — | 32 | 4 | 1 | 4 | — | 41 |
| Disposals and write-off of fully depreciated assets | — | (10) | (2) | (48) | (261) | (435) | (756) |
| Charge for the year - continuing operations | — | 106 | 11 | 148 | 536 | 627 | 1,428 |
| Charge for the year - discontinued operations | — | — | — | 6 | 23 | 17 | 46 |
| At 31 December 2010 | — | 702 | 118 | 793 | 2,700 | 1,849 | 6,162 |
| | | | | | | | |
| Net book value at 31 December 2010 | 4,170 | 2,236 | 173 | 1,039 | 1,539 | 7,386 | 16,543 |
| | | | | | | | |
| 2009 | | | | | | | |
| Cost or valuation | | | | | | | |
| At 1 January 2009 | 3,868 | 4,032 | 224 | 1,867 | 4,168 | 9,334 | 23,493 |
| Transfers to disposal groups | — | (32) | — | (62) | (80) | — | (174) |
| Currency translation and other adjustments | (85) | (134) | — | (65) | (131) | (561) | (976) |
| Disposal of subsidiaries | — | (15) | — | — | (19) | — | (34) |
| Reclassifications | 1 | 18 | 1 | (34) | 14 | — | — |
| Additions | 1,634 | 304 | 8 | 153 | 750 | 2,241 | 5,090 |
| Expenditure on investment properties | 8 | — | — | — | — | — | 8 |
| Change in fair value of investment properties | (117) | — | — | — | — | — | (117) |
| Disposals and write-off of fully depreciated assets | (426) | (75) | (19) | (56) | (420) | (1,456) | (2,452) |
| At 31 December 2009 | 4,883 | 4,098 | 214 | 1,803 | 4,282 | 9,558 | 24,838 |
| | | | | | | | |
| Accumulated impairment, depreciation and amortisation | | | | | | | |
| At 1 January 2009 | — | 422 | 79 | 492 | 1,916 | 1,635 | 4,544 |
| Transfers to disposal groups | — | — | — | (7) | (31) | — | (38) |
| Currency translation and other adjustments | — | (1) | — | (11) | (48) | (69) | (129) |
| Disposal of subsidiaries | — | (1) | — | — | (14) | — | (15) |
| Write down of property, plant and equipment | — | 5 | — | 5 | — | — | 10 |
| Disposals and write-off of fully depreciated assets | — | — | — | (2) | (126) | (419) | (547) |
| Charge for the year - continuing operations | — | 92 | 8 | 142 | 621 | 564 | 1,427 |
| Charge for the year - discontinued operations | — | 36 | — | 22 | 78 | 53 | 189 |
| At 31 December 2009 | — | 553 | 87 | 641 | 2,396 | 1,764 | 5,441 |
| | | | | | | | |
| Net book value at 31 December 2009 | 4,883 | 3,545 | 127 | 1,162 | 1,886 | 7,794 | 19,397 |
| 2007 | | | | | | | | | | | | | | | | | | | | | |
| Cost or valuation: | | | | | | | | | | | | | | | | | | | | | |
| At 1 January 2007 | | | 4,885 | | | | 2,579 | | | | 310 | | | | 1,254 | | | | 3,069 | | | | 11,589 | | | | 23,686 | |
| Currency translation and other adjustments | | | 96 | | | | 65 | | | | 1 | | | | 11 | | | | 12 | | | | (10 | ) | | | 175 | |
| Acquisition of subsidiaries | | | — | | | | 950 | | | | — | | | | 157 | | | | 191 | | | | 202 | | | | 1,500 | |
| Reclassifications | | | 3 | | | | (4 | ) | | | 3 | | | | 1 | | | | (3 | ) | | | — | | | | — | |
| Additions | | | 450 | | | | 592 | | | | 34 | | | | 309 | | | | 857 | | | | 2,791 | | | | 5,033 | |
| Transfers to disposal groups | | | — | | | | (4 | ) | | | (13 | ) | | | — | | | | — | | | | (422 | ) | | | (439 | ) |
| Expenditure on investment properties | | | 41 | | | | — | | | | — | | | | — | | | | — | | | | — | | | | 41 | |
| Change in fair value of investment properties | | | 288 | | | | — | | | | — | | | | — | | | | — | | | | — | | | | 288 | |
| Disposals and write-off of fully depreciated assets | | | (2,332 | ) | | | (533 | ) | | | (120 | ) | | | (44 | ) | | | (197 | ) | | | (2,713 | ) | | | (5,939 | ) |
| At 31 December 2007 | | | 3,431 | | | | 3,645 | | | | 215 | | | | 1,688 | | | | 3,929 | | | | 11,437 | | | | 24,345 | |
| Accumulated depreciation and amortisation: | | | | | | | | | | | | | | | | | | | | | | | | | | | | |
| At 1 January 2007 | | | — | | | | 446 | | | | 96 | | | | 374 | | | | 1,670 | | | | 2,680 | | | | 5,266 | |
| Currency translation and other adjustments | | | — | | | | (4 | ) | | | — | | | | (1 | ) | | | (1 | ) | | | 2 | | | | (4 | ) |
| Transfers to disposal groups | | | — | | | | — | | | | — | | | | — | | | | — | | | | (52 | ) | | | (52 | ) |
| Reclassifications | | | — | | | | (2 | ) | | | 2 | | | | — | | | | — | | | | — | | | | — | |
| Disposals and write-off of fully depreciated assets | | | — | | | | (122 | ) | | | (32 | ) | | | (25 | ) | | | (132 | ) | | | (610 | ) | | | (921 | ) |
| Charge for the year – continuing operations | | | — | | | | 66 | | | | 8 | | | | 87 | | | | 409 | | | | 727 | | | | 1,297 | |
| Charge for the year – discontinued operations | | | — | | | | 7 | | | | — | | | | 1 | | | | 6 | | | | — | | | | 14 | |
| At 31 December 2007 | | | — | | | | 391 | | | | 74 | | | | 436 | | | | 1,952 | | | | 2,747 | | | | 5,600 | |
| Net book value at 31 December 2007 | | | 3,431 | | | | 3,254 | | | | 141 | | | | 1,252 | | | | 1,977 | | | | 8,690 | | | | 18,745 | |
Notes on the accounts continued | Financial statements |
18 | Property, plant and equipment (continued) |
| | | 2008 | | | 2007 | |
| | | | £m | | | | £m | |
| Contracts for future capital expenditure not provided for in the accounts at the year end (excluding investment properties and operating lease assets) | | | 128 | | | | 201 | |
| Contractual obligations to purchase, construct or develop investment properties or to repair, maintain or enhance investment properties | | | 7 | | | | 9 | |
| Property, plant and equipment pledged as security | | | — | | | | 935 | |
| | Group |
| | Investment properties | Freehold premises | Long leasehold premises | Short leasehold premises | Computers and other equipment | Operating lease assets | Total |
| 2008 | £m | £m | £m | £m | £m | £m | £m |
| Cost or valuation | | | | | | | |
| At 1 January 2008 | 3,431 | 3,645 | 215 | 1,688 | 3,929 | 11,437 | 24,345 |
| Transfer to disposal groups | — | (262) | — | (188) | (349) | — | (799) |
| Currency translation and other adjustments | 320 | 452 | 5 | 149 | 436 | 1,313 | 2,675 |
| Acquisition of subsidiaries | — | — | — | 30 | 31 | — | 61 |
| Disposal of subsidiaries | — | — | — | (2) | (57) | (5,015) | (5,074) |
| Reclassifications | — | (176) | — | 197 | (14) | (7) | — |
| Additions | 417 | 486 | 22 | 61 | 837 | 3,794 | 5,617 |
| Expenditure on investment properties | 8 | — | — | — | — | — | 8 |
| Change in fair value of investment properties | (86) | — | — | — | — | — | (86) |
| Disposals and write-off of fully depreciated assets | (222) | (113) | (18) | (68) | (645) | (2,188) | (3,254) |
| At 31 December 2008 | 3,868 | 4,032 | 224 | 1,867 | 4,168 | 9,334 | 23,493 |
| | | | | | | | |
| Accumulated depreciation and amortisation | | | | | | | |
| At 1 January 2008 | — | 391 | 74 | 436 | 1,952 | 2,747 | 5,600 |
| Transfers to disposal groups | — | (60) | — | (91) | (243) | — | (394) |
| Currency translation and other adjustments | — | (9) | 1 | 9 | 148 | 202 | 351 |
| Disposal of subsidiaries | — | — | — | (1) | (39) | (1,447) | (1,487) |
| Reclassifications | — | 17 | (2) | 1 | (9) | (7) | — |
| Write down of property, plant and equipment | — | 19 | — | — | 7 | — | 26 |
| Disposals and write-off of fully depreciated assets | — | (22) | — | (31) | (539) | (544) | (1,136) |
Charge for the year - continuing operations | — | 86 | 6 | 139 | 534 | 641 | 1,406 |
| Charge for the year - discontinued operations | — | — | — | 30 | 105 | 43 | 178 |
| At 31 December 2008 | — | 422 | 79 | 492 | 1,916 | 1,635 | 4,544 |
| | | | | | | | |
| Net book value at 31 December 2008 | 3,868 | 3,610 | 145 | 1,375 | 2,252 | 7,699 | 18,949 |
Investment properties are valued to reflect fair value, that is, the market value of the Group’sGroup's interest at the reporting date excluding any special terms or circumstances relating to the use or financing of the property and transaction costs that would be incurred in making a sale. Observed market data such as rental yield, replacement cost and useful life, reflect relatively few transactions involving property that is not necessarily identical to property owned by the Group.
Valuations are carried out by management with the support of qualified surveyors who are members of the Royal Institution of Chartered Surveyors, or an equivalent overseas body. The valuation as at 31 December 20082010 for a significant majority of the Group’sGroup's investment properties was undertaken bywith the support of external valuers.
The fair value of investment properties includes £248 million of depreciation since purchase (2009 - £84 million appreciation; 2008 -£172 million (2007 – £234 million) of appreciation since purchase.appreciation).
Rental income from investment properties was £257£279 million (2007 – £300(2009 - £233 million; 2006 – £2782008 - £257 million). Direct operating expenses of investment properties were £42 million (2009 - £16 million; 2008 -£22 million (2007 – £49 million; 2006 – £54 million).
Property, plant and equipment, excluding investment properties, include £1,132£298 million (2007 – £717(2009 - £213 million; 2008 - £1,132 million) assets in the course of construction.
Freehold and long leasehold properties with a net book value of nil (2007 – £451£2 million (2009 - £5 million; 2006 – £164 million)2008 - nil) were sold subject to operating leases.
19Notes on the accounts continued | Financial statements |
| | | | | | | |
| | | 2008 | | | 2007 | | | 2008 | | | 2007 | |
| | | | £m | | | | £m | | | | £m | | | | £m | |
| Prepayments | | | 1,949 | | | | 1,988 | | | | — | | | | — | |
| Accrued income | | | 1,206 | | | | 1,214 | | | | — | | | | — | |
| Deferred expenses | | | 709 | | | | 385 | | | | — | | | | — | |
| Pension schemes in net surplus | | | 36 | | | | 575 | | | | — | | | | — | |
| Other assets | | | 20,502 | | | | 11,500 | | | | 489 | | | | 127 | |
| | | | 24,402 | | | | 15,662 | | | | 489 | | | | 127 | |
21 Prepayments, accrued income and other assets
| | Group | | Company |
| | 2010 | 2009 | 2008 | | 2010 | 2009 | 2008 |
| | £m | £m | £m | | £m | £m | £m |
| Prepayments | 1,529 | 1,872 | 1,949 | | — | — | — |
| Accrued income | 1,186 | 897 | 1,206 | | — | — | — |
| Deferred expenses | 568 | 596 | 709 | | — | — | — |
| Pension schemes in net surplus | 105 | 58 | 36 | | — | — | — |
| Other assets | 9,188 | 17,562 | 20,502 | | 28 | 43 | 489 |
| | 12,576 | 20,985 | 24,402 | | 28 | 43 | 489 |
209
22 Discontinued operations and assets and liabilities of disposal groups | Discontinued operations and assets and liabilities of disposal groups |
(a) Profit/(loss)Loss from discontinued operations, net of tax
| | | 2008 | | | 2007 | | 2010 | 2009 | 2008 |
| | | | £m | | | | £m | | £m | £m | £m |
| Discontinued operations: | | | | | | | | | |
| Discontinued operations | | |
| Total income | | 2,571 | | | 749 | | 1,433 | 5,664 | 7,709 |
| Operating expenses | | (1,407 | ) | | (493 | ) | (803) | (4,061) | (20,544) |
| Insurance net claims | | — | | | (28 | ) | (161) | (500) | (513) |
| Impairment losses | | (564 | ) | | (160 | ) | (42) | (1,051) | (1,197) |
| Profit before tax | | 600 | | | 68 | | |
| Gain on disposal | | 3,859 | | | — | | |
| Operating profit before tax | | 4,459 | | | 68 | | |
| Tax on profit | | (204 | ) | | (8 | ) | |
| Profit/(loss) before tax | | 427 | 52 | (14,545) |
| Gain on disposal before recycling of reserves | | 113 | — | 3,859 |
| Recycled reserves | | (1,076) | — |
| Operating (loss)/profit before tax | | (536) | 52 | (10,686) |
| Tax on profit/(loss) | | (92) | (58) | (48) |
| Tax on gain on disposal | | (33 | ) | | — | | — | — | (33) |
| Profit after tax | | 4,222 | | | 60 | | |
| Loss after tax | | (628) | (6) | (10,767) |
| | | | |
| Businesses acquired exclusively with a view to disposal | | | | | | | | | | |
| Loss after tax | | (251 | ) | | (136 | ) | (5) | (99) | (251) |
| Profit/(loss) from discontinued operations, net of tax | | | 3,971 | | | (76 | ) | |
| Loss from discontinued operations, net of tax | | (633) | (105) | (11,018) |
Discontinued operations reflect the results of the State of the Netherlands and Santander in RFS Holdings B.V., following the legal separation of ABN AMRO Bank N.V. on 1 April 2010. Consortium partners’ results are classified as discontinued operations and prior years have been re-presented accordingly. Discontinued operations in 2008 also reflect the results of Banco Real sold to Santander on 24 July 2008. There were no discontinued operations during 2006.
Businesses acquired exclusively with a view to disposal comprise those ABN AMRO businesses, including Banca Antonveneta, Asset Management and Private Equity, classified as disposal groups on the acquisition of ABN AMRO on 17 October 2007. The Asset Management business was sold to Fortis on 3 April 2008. Banca Antonveneta, excluding its subsidiary Interbanca, was sold to Banca Monte dei Paschi di Siena S.p.A. on 30 May 2008.
(b) Cash flows attributable to discontinued operations
Included within the Group’sGroup's cash flows are the following amounts attributable to discounteddiscontinued operations:
| | 2010 | 2009 | 2008 |
| | £m | £m | £m |
| Net cash flows from operating activities | 2,528 | (542) | (7,497) |
| Net cash flows from investing activities | 400 | (264) | 7,654 |
| Net cash flows from financing activities | 129 | 1,020 | 3,333 |
| Net increase/(decrease) in cash and cash equivalents | 3,062 | (402) | 4,946 |
| | | 2008 | | | 2007 | |
| | | | £m | | | | £m | |
| Net cash flows from operating activities | | | (124 | ) | | | (1,304 | ) |
| Net cash flows from investing activities | | | (368 | ) | | | 4,341 | |
| Net cash flows from financing activities | | | 339 | | | | (25 | ) |
| Net increase in cash and cash equivalents | | | 287 | | | | 3,172 | |
Notes on the accounts continued | Financial statements |
(c) Assets and liabilities of disposal groups
| | Sempra | Other | 2010 | 2009 | 2008 |
| | £m | £m | £m | £m | £m |
| Assets of disposal groups | | | | | |
| Cash and balances at central banks | — | 184 | 184 | 129 | — |
| Loans and advances to banks | 629 | 22 | 651 | 388 | — |
| Loans and advances to customers | 440 | 4,573 | 5,013 | 3,216 | — |
| Debt securities and equity shares | 17 | 3 | 20 | 904 | — |
| Derivatives | 4,768 | 380 | 5,148 | 6,361 | — |
| Intangible assets | — | — | — | 238 | — |
| Settlement balances | 555 | — | 555 | 1,579 | — |
| Property, plant and equipment | 18 | — | 18 | 136 | 66 |
| Other assets | 260 | 444 | 704 | 5,417 | — |
| Discontinued operations and other disposal groups | 6,687 | 5,606 | 12,293 | 18,368 | 66 |
| Assets acquired exclusively with a view to disposal | — | 191 | 191 | 174 | 1,515 |
| | 6,687 | 5,797 | 12,484 | 18,542 | 1,581 |
| | | | | | |
| Liabilities of disposal groups | | | | | |
| Deposits by banks | 266 | — | 266 | 618 | — |
| Customer accounts | 352 | 1,915 | 2,267 | 8,907 | — |
| Derivatives | 5,021 | 21 | 5,042 | 6,683 | — |
| Settlement balances | 907 | — | 907 | 950 | — |
| Subordinated liabilities | — | — | — | 6 | — |
| Other liabilities | 393 | 532 | 925 | 1,675 | — |
| Discontinued operations and other disposal groups | 6,939 | 2,468 | 9,407 | 18,839 | — |
| Liabilities acquired exclusively with a view to disposal | — | 21 | 21 | 51 | 859 |
| | 6,939 | 2,489 | 9,428 | 18,890 | 859 |
| | | 2008 | | | 2007 | |
| Assets of disposal groups | | | £m | | | | £m | |
| Disposal groups and other disposals | | | 66 | | | | 395 | |
| Assets acquired exclusively with a view to disposal | | | 1,515 | | | | 45,455 | |
| | | | 1,581 | | | | 45,850 | |
| Liabilities of disposal groups | | | | | | | | |
| Liabilities acquired exclusively with a view to disposal | | | 859 | | | | 29,228 | |
To comply with EC State Aid requirements, the Group has agreed to make a series of divestments within four years from December 2009. During 2010, the Group successfully completed the disposal of 80.01% of Global Merchant Services and substantially all of the RBS Sempra Commodities JV. Certain contracts of the RBS Sempra Commodities JV business were sold in risk transfer transactions prior to being novated to the purchaser and they comprise substantially all of its residual assets and liabilities. RBS Sempra Commodities JV was the only significant divestment that met the criteria for classification as a disposal group at 31 December 2010.
The other assets and liabilities classified as disposal groups include the project finance assets to be sold to The Bank of Tokyo-Mitsubishi UFJ, Ltd, and certain Non-Core interests in Latin America, Europe and the Middle East.
21Notes on the accounts continued | Financial statements |
| | | Group | |
| | | | 2008 £m | | | | 2007 £m | |
| Settlement balances (amortised cost) | | | 11,741 | | | | 17,520 | |
| Short positions (held-for-trading): | | | | | | | | |
Debt securities – Government | | | 32,519 | | | | 41,048 | |
– Other issuers | | | 6,374 | | | | 25,310 | |
| Equity shares | | | 3,643 | | | | 7,143 | |
| | | | 54,277 | | | | 91,021 | |
23 Short positions
| | Group |
| | 2010 | 2009 | 2008 |
| | £m | £m | £m |
| Debt securities | | | |
| - Government | 34,506 | 26,647 | 32,519 |
| - Other issuers | 6,510 | 10,871 | 6,374 |
| Equity shares | 2,102 | 2,945 | 3,643 |
| | 43,118 | 40,463 | 42,536 |
| | | Group | | | Company | |
| | | | 2008 £m | | | | 2007 £m | | | | 2008 £m | | | | 2007 £m | |
| Notes in circulation | | | 1,619 | | | | 1,545 | | | | — | | | | — | |
| Current taxation | | | 585 | | | | 1,630 | | | | — | | | | — | |
| Accruals | | | 7,531 | | | | 8,377 | | | | 3 | | | | — | |
| Deferred income | | | 7,640 | | | | 6,289 | | | | 4 | | | | — | |
| Other liabilities (1) | | | 14,107 | | | | 16,367 | | | | 40 | | | | 8 | |
| | | | 31,482 | | | | 34,208 | | | | 47 | | | | 8 | |
| (1) | All short positions are classified as held-for-trading. |
24 Accruals, deferred income and other liabilities
| | Group | | Company |
| | 2010 | 2009 | 2008 | | 2010 | 2009 | 2008 |
| | £m | £m | £m | | £m | £m | £m |
| Notes in circulation | 1,793 | 1,889 | 1,619 | | — | — | — |
| Current tax | 723 | 429 | 585 | | 114 | 169 | — |
| Accruals | 6,773 | 7,429 | 7,531 | | 3 | 3 | 3 |
| Deferred income | 4,766 | 5,818 | 7,640 | | 2 | 3 | 4 |
Other liabilities (1) | 9,034 | 14,762 | 14,107 | | 915 | 1,182 | 40 |
| | 23,089 | 30,327 | 31,482 | | 1,034 | 1,357 | 47 |
Note:
| (1) | (1)
| Other liabilities include £1£18 million (2007 – £9(2009 - £10 million; 2008 - £1 million) in respect of share-based compensation. |
Included in other liabilities are provisions for liabilities and charges as follows:
Group | | | Group £m | |
At 1 January 20082010 | | | 168 | 562 |
| Currency translation and other movements | (58) |
| Disposal of subsidiaries | (17) |
| Transfer to disposal groups | 12 | (33) |
| Charge to income statement - continuing operations | | | 116 | 453 |
| Releases to income statement - continuing operations | | | (42 | )(72) |
| Provisions utilised | | | (32 | )(211) |
At 31 December 20082010 | | | 222 | 624 |
(1) | ComprisesThe table above includes property provisions and other provisions arising in the normal course of business. |
25 Deferred tax
| | Group | | Company |
| | 2010 | 2009 | 2008 | | 2010 | 2009 | 2008 |
| | £m | £m | £m | | £m | £m | £m |
| Deferred tax liability | 2,142 | 2,811 | 4,165 | | — | — | — |
| Deferred tax asset | (6,373) | (7,039) | (7,082) | | (2) | (2) | (3) |
| Net deferred tax asset | (4,231) | (4,228) | (2,917) | | (2) | (2) | (3) |
Table of ContentsNotes on the accounts continued | Financial statements |
| | Group |
| | Pension | Accelerated capital allowances | Provisions | Deferred gains | IFRS transition | Fair value of financial instruments | Available- for-sale financial assets | Intangibles | Cash flow hedging | Share schemes | Tax losses carried forward | Other | Total |
| | £m | £m | £m | £m | £m | £m | £m | £m | £m | £m | £m | £m | £m |
At 1 January 2009 | (382) | 3,084 | (814) | 611 | (420) | (353) | (35) | 774 | (483) | (3) | (4,730) | (166) | (2,917) |
Transfers to disposal groups | — | — | 2 | — | — | (2) | — | — | — | — | — | 11 | 11 |
(Disposal)/ acquisition of subsidiaries | — | — | — | — | — | — | — | — | — | — | — | (8) | (8) |
Charge/(credit) to income statement | 691 | (165) | (740) | (81) | (6) | 164 | (483) | 397 | 165 | (6) | (973) | 305 | (732) |
(Credit)/charge to equity directly | (1,033) | — | — | (501) | 1 | — | 126 | — | 204 | — | 554 | 1 | (648) |
Currency translation and other adjustments | — | (104) | 72 | 107 | 52 | 7 | 1 | (63) | 54 | 1 | 15 | (76) | 66 |
At 1 January 2010 | (724) | 2,815 | (1,480) | 136 | (373) | (184) | (391) | 1,108 | (60) | (8) | (5,134) | 67 | (4,228) |
Transfers to disposal groups | — | (120) | — | — | — | — | 1 | — | — | — | — | — | (119) |
(Disposal)/ acquisition of subsidiaries | (32) | — | (1) | — | — | — | 120 | (631) | 6 | — | — | 65 | (473) |
Charge/(credit) to income statement | 46 | (91) | (24) | (21) | 77 | (20) | (160) | (12) | 273 | (12) | 470 | (102) | 424 |
Charge/(credit) to equity directly | 73 | — | — | (2) | — | — | (434) | — | 133 | (6) | 397 | 6 | 167 |
Currency translation and other adjustments | (1) | 52 | (96) | (25) | — | 112 | 23 | (36) | (61) | (5) | (7) | 42 | (2) |
At 31 December 2010 | (638) | 2,656 | (1,601) | 88 | (296) | (92) | (841) | 429 | 291 | (31) | (4,274) | 78 | (4,231) |
| IFRS transition |
| Company | | £m |
| At 1 January 2009 | (3) |
| Charge to income statement | |
| At 1 January 2010 and 31 December 2010 | (2) |
Provision for deferred taxation has been made as follows:
| | | Group | | | Company | |
| | | | 2008 £m | | | | 2007 £m | | | | 2008 £m | | | | 2007 £m | |
| Deferred tax liability | | | 4,165 | | | | 5,400 | | | | — | | | | 3 | |
| Deferred tax asset | | | (7,082 | ) | | | (3,119 | ) | | | (3 | ) | | | — | |
| Net deferred tax | | | (2,917 | ) | | | 2,281 | | | | (3 | ) | | | 3 | |
| | | | | | Group | |
| | | Pension £m | | | Accelerated capital allowances £m | | | Provisions £m | | | Deferred gains £m | | | IFRS transition £m | | | Fair value of financial instruments £m | | | Available for sale financial assets £m | | | Intangibles £m | | | Cash flow hedging £m | | | Share schemes £m | | | Tax losses carried forward £m | | | Other £m | | | Total £m | |
| At 1 January 2007 | | | (628 | ) | | | 3,818 | | | | (284 | ) | | | 922 | | | | (669 | ) | | | (132 | ) | | | — | | | | 255 | | | | (97 | ) | | | (75 | ) | | | — | | | | (2 | ) | | | 3,108 | |
| Acquisition/(disposals) of subsidiaries | | | (119 | ) | | | (284 | ) | | | (539 | ) | | | 50 | | | | — | | | | (184 | ) | | | — | | | | 1,037 | | | | — | | | | — | | | | (867 | ) | | | (64 | ) | | | (970 | ) |
| Charge/(credit) to income statement | | | 43 | | | | (138 | ) | | | (44 | ) | | | (141 | ) | | | 46 | | | | 72 | | | | — | | | | (65 | ) | | | (48 | ) | | | 8 | | | | (57 | ) | | | 91 | | | | (233 | ) |
| Charge/(credit) to equity directly | | | 660 | | | | — | | | | — | | | | (187 | ) | | | — | | | | 17 | | | | — | | | | — | | | | (107 | ) | | | 57 | | | | — | | | | (14 | ) | | | 426 | |
| Other | | | (7 | ) | | | (12 | ) | | | (19 | ) | | | (38 | ) | | | 4 | | | | (6 | ) | | | | | | | 26 | | | | — | | | | (1 | ) | | | 20 | | | | (17 | ) | | | (50 | ) |
| At 1 January 2008 | | | (51 | ) | | | 3,384 | | | | (886 | ) | | | 606 | | | | (619 | ) | | | (233 | ) | | | — | | | | 1,253 | | | | (252 | ) | | | (11 | ) | | | (904 | ) | | | (6 | ) | | | 2,281 | |
| Transfers to disposal groups | | | 19 | | | | 69 | | | | 528 | | | | 36 | | | | — | | | | — | | | | 80 | | | | (29 | ) | | | — | | | | — | | | | — | | | | 238 | | | | 941 | |
| Acquisition/(disposals)of subsidiaries | | | — | | | | (509 | ) | | | — | | | | — | | | | 6 | | | | 2 | | | | (2 | ) | | | 3 | | | | 1 | | | | — | | | | — | | | | 58 | | | | (441 | ) |
| Charge/(credit) to income statement | | | 157 | | | | (127 | ) | | | (106 | ) | | | 21 | | | | 195 | | | | (125 | ) | | | 350 | | | | (898 | ) | | | 286 | | | | (2 | ) | | | (3,079 | ) | | | 63 | | | | (3,265 | ) |
| (Credit)/charge to equity directly | | | (476 | ) | | | — | | | | — | | | | (6 | ) | | | 1 | | | | 3 | | | | (547 | ) | | | — | | | | (317 | ) | | | 10 | | | | (709 | ) | | | (3 | ) | | | (2,044 | ) |
| Other | | | (31 | ) | | | 267 | | | | (350 | ) | | | (46 | ) | | | (3 | ) | | | — | | | | 84 | | | | 445 | | | | (201 | ) | | | — | | | | (38 | ) | | | (516 | ) | | | (389 | ) |
| At 31 December 2008 | | | (382 | ) | | | 3,084 | | | | (814 | ) | | | 611 | | | | (420 | ) | | | (353 | ) | | | (35 | ) | | | 774 | | | | (483 | ) | | | (3 | ) | | | (4,730 | ) | | | (166 | ) | | | (2,917 | ) |
| Company | | | | | | | | | | | Total £m | |
| At 1 January 2007 | | | — | | | | (3 | ) | | | — | | | | (3 | ) |
| Charge to equity directly | | | — | | | | 1 | | | | 5 | | | | 6 | |
| At 1 January 2008 | | | — | | | | (2 | ) | | | 5 | | | | 3 | |
| (Credit)/charge to income statement | | | (4 | ) | | | 2 | | | | (5 | ) | | | (7 | ) |
| Other | | | 1 | | | | — | | | | — | | | | 1 | |
| At 31 December 2008 | | | (3 | ) | | | — | | | | — | | | | (3 | ) |
Notes:
| (1) | Deferred tax assets are recognised, as set out above, that depend on the availability of future taxable profits in excess of profits arising from the reversal of other temporary differences. Business projections prepared for impairment reviews (see Note 17)19) indicate it is probable that sufficient future taxable income will be available against which to offset these recognised deferred tax assets within 8eight years. UK losses do not expire and Netherlands losses expire after nine years. In jurisdictions where doubt exists over the availability of future taxable profits, deferred tax assets of £1,748£2,008 million (2007 – £687(2009 - £2,163 million; 2008 - £1,748 million) have not been recognised in respect of tax losses carried forward of £5,779£9,689 million (2007 – £2,043(2009 - £7,759 million; 2008 - £5,779 million). Of these losses, £15£41 million will expire within one year, £137£136 million within five years and £5,214£5,913 million thereafter. The balance of tax losses carried forward has no time limit. |
| (2) | Deferred tax liabilities of £980£279 million (2007 – £977(2009 - £279 million; 2008 - £980 million) have not been recognised in respect of retained earnings of overseas subsidiaries and held-over gains on the incorporation of overseas branches. Retained earnings of overseas subsidiaries are expected to be reinvested indefinitely or remitted to the UK free from further taxation.tax. No taxationtax is expected to arise in the foreseeable future in respect of held-over gains. Changes to UK tax legislation largely exempts from UK tax, overseas dividends received on or after 1 July 2009. |
24Notes on the accounts continued | Financial statements |
| | | Group | |
| | | | 2008
£m | | | | 2007
£m | | | | 2006
£m | |
| Insurance premium income | | | 6,626 | | | | 6,376 | | | | 6,243 | |
| Reinsurer’s share | | | (300 | ) | | | (289 | ) | | | (270 | ) |
| Net premium income | | | 6,326 | | | | 6,087 | | | | 5,973 | |
| | | | | | | | | | | | | |
| Insurance claims | | | 4,603 | | | | 4,742 | | | | 4,550 | |
| Reinsurer’s share | | | (173 | ) | | | (118 | ) | | | (92 | ) |
| Net claims | | | 4,430 | | | | 4,624 | | | | 4,458 | |
26 Insurance business
| | | Group |
| | | 2010 | 2009 | 2008 |
| | | £m | £m |
| Insurance premium income | | 5,379 | 5,529 | 6,009 |
| Reinsurers' share | | (251) | (263) | (300) |
| Net premium income | | 5,128 | 5,266 | 5,709 |
| | | | |
| Insurance claims | | 4,932 | 4,492 | 4,090 |
| Reinsurers' share | | (149) | (135) | (173) |
| Net claims | | 4,783 | 4,357 | 3,917 |
| | | | |
| | | Group |
| | | Group | | 2010 | 2009 | 2008 |
| Insurance liabilities | | | 2008
£m | | | | 2007
£m | | £m | £m |
| Life assurance business: | | | | | | | | | |
| Life assurance business | | |
| Unit linked insurance contracts | | 260 | | | 364 | | — | 292 | 256 |
| Other linked insurance contracts | | 3,929 | | | 4,034 | | |
| Index linked insurance contracts | | — | 1,090 | 1,331 |
| Participating bonds | | — | 2,793 | 2,602 |
| Other insurance contracts | | 309 | | | 298 | | 68 | 304 | 309 |
| | | 4,498 | | | 4,696 | | 68 | 4,479 | 4,498 |
| General insurance business | | 5,478 | | | 5,466 | | 6,726 | 5,802 | 5,478 |
| | | | 9,976 | | | 10,162 | | 6,794 | 10,281 | 9,976 |
General insurance business
(i) Claims and loss adjustment expensesexpenses.
| | | Group |
| | | Group | | Gross | Reinsurance | Net |
| | | Gross £m | | | Reinsurance £m | | | Net £m | | £m |
| Notified claims | | 3,735 | | | (205 | ) | | 3,530 | | 4,052 | (260) | 3,792 |
| Incurred but not reported | | 1,512 | | | (86 | ) | | 1,426 | | 1,426 | (27) | 1,399 |
| At 1 January 2007 | | 5,247 | | | (291 | ) | | 4,956 | | |
| At 1 January 2009 | | 5,478 | (287) | 5,191 |
| Cash paid for claims settled in the year | | (3,876 | ) | | 94 | | | (3,782 | ) | (3,812) | 69 | (3,743) |
| Increase/(decrease) in liabilities | | | | | | | | | | | | | |
| – arising from current year claims | | 4,643 | | | (49 | ) | | 4,594 | | |
| – arising from prior year claims | | (573 | ) | | (20 | ) | | (593 | ) | |
| - arising from current year claims | | 4,383 | (23) | 4,360 |
| - arising from prior year claims | | (79) | (53) | (132) |
| Disposal of subsidiary | | (124) | 5 | (119) |
| Net exchange differences | | 25 | | | 3 | | | 28 | | (44) | 3 | (41) |
| At 31 December 2007 | | | 5,466 | | | (263 | ) | | 5,203 | | |
| At 31 December 2009 | | 5,802 | (286) | 5,516 |
| | | |
| | | | | | | | | | | | | | |
| Notified claims | | 3,894 | | | (264 | ) | | 3,630 | | 4,101 | (276) | 3,825 |
| Incurred but not reported | | 1,572 | | | 1 | | | 1,573 | | 1,701 | (10) | 1,691 |
| At 1 January 2008 | | 5,466 | | | (263 | ) | | 5,203 | | |
| At 1 January 2010 | | 5,802 | (286) | 5,516 |
| Cash paid for claims settled in the year | | (3,969 | ) | | 97 | | | (3,872 | ) | (3,843) | 55 | (3,788) |
| Increase/(decrease) in liabilities | | | | | | | | | | | | | |
| – arising from current year claims | | 4,079 | | | (45 | ) | | 4,034 | | |
| – arising from prior year claims | | (241 | ) | | (66 | ) | | (307 | ) | |
| - arising from current year claims | | 4,459 | (24) | 4,435 |
| - arising from prior year claims | | 322 | (56) | 266 |
| Net exchange differences | | 143 | | | (10 | ) | | 133 | | (14) | 1 | (13) |
| At 31 December 2008 | | | 5,478 | | | (287 | ) | | 5,191 | | |
| At 31 December 2010 | | 6,726 | (310) | 6,416 |
| | | | | | | | | | | | | | |
| Notified claims | | 4,052 | | | (260 | ) | | 3,792 | | 4,375 | (305) | 4,070 |
| Incurred but not reported | | 1,426 | | | (27 | ) | | 1,399 | | 2,351 | (5) | 2,346 |
| At 31 December 2008 | | | 5,478 | | | (287 | ) | | 5,191 | | |
| At 31 December 2010 | | 6,726 | (310) | 6,416 |
Notes on the accounts continued | Financial statements |
Outstanding claims provisions are not discounted for the time value of money except for claims, principally motor, settled by periodical payments under the Courts Act 2003. Total reserves for claims outstanding in respect of periodical payments are £1,180.0 million (2009 - £91.6 million; 2008 - £29.0 million) gross and £826.6 million (2009 - £26.1 million; 2008 - £3.6 million) net of reinsurance. The corresponding undiscounted amounts are £4,320.9 million (2009 - £275.7 million; 2008 - £85.0 million) gross and £2,659.6 million (2009 - £61.8 million; 2008 - £12.1 million) net of reinsurance. The amounts for 2010 include a provision for estimated periodical payment orders incurred but not reported which is excluded from 2009 and 2008. The rate of interest used for the calculation of present values is 4.5% (2009 - 4.1%; 2008 - 5.0%). The average interval between the date of the last future cash flow being discounted and the end of the financial year is 49.4 years on open and settled cases.
(ii) Provisions for unearned premiums and unexpired short-term insurance risksrisks.
| | | Group | |
| Unearned premium provision | | Gross £m | | | Reinsurance £m | | | Net £m | |
| At 1 January 2007 | | | 2,850 | | | | (43 | ) | | | 2,807 | |
| Release in the year | | | (98 | ) | | | 2 | | | | (96 | ) |
| At 1 January 2008 | | | 2,752 | | | | (41 | ) | | | 2,711 | |
| Increase in the year | | | 175 | | | | — | | | | 175 | |
| Release in the year | | | (280 | ) | | | (38 | ) | | | (318 | ) |
| Net exchange differences | | | 64 | | | | — | | | | 64 | |
| At 31 December 2008 | | | 2,711 | | | | (79 | ) | | | 2,632 | |
| | Group |
| | Gross | Reinsurance | Net |
| | £m | £m | £m |
| At 1 January 2009 | 2,711 | (79) | 2,632 |
| Movement in the year | (211) | 12 | (199) |
| Exchange differences | (10) | — | (10) |
| At 1 January 2010 | 2,490 | (67) | 2,423 |
| Increase in the year | 2,191 | (76) | 2,115 |
| Release in the year | (2,393) | 71 | (2,322) |
| At 31 December 2010 | 2,288 | (72) | 2,216 |
| | | Group | |
| Gross performance of life business (life contracts) | | | 2008 £m | | | | 2007 £m | |
| Opening net assets | | | 604 | | | | 579 | |
| Profit from existing business: | | | | | | | | |
| Expected return | | | 41 | | | | 35 | |
| Experience variances | | | (15 | ) | | | (23 | ) |
| | | | 26 | | | | 12 | |
| New business contribution (1) | | | 14 | | | | 5 | |
| Operating assumption changes | | | 2 | | | | 6 | |
| Investment return variances | | | (46 | ) | | | (14 | ) |
| Economic assumption changes | | | (2 | ) | | | — | |
| Other | | | (10 | ) | | | 16 | |
| Closing net assets | | | 588 | | | | 604 | |
Life business
| | Group |
| | 2010 £m | 2009 £m | 2008 £m |
| Gross performance of life business (life contracts) |
| Opening net assets | 554 | 588 | 604 |
| Profit from existing business | | | |
| - expected return | 37 | 35 | 41 |
| - experience variances | 6 | (38) | (15) |
| | 43 | (3) | 26 |
New business contribution (1) | 18 | 31 | 14 |
| Operating assumption changes | — | 10 | 2 |
| Investment return variances | (12) | 32 | (46) |
| Economic assumption changes | 2 | (4) | (2) |
| Transfer to shareholders' funds | (71) | (106) | — |
| Disposal of subsidiaries | (402) | — | — |
| Other | (1) | 6 | (10) |
| Closing net assets | 131 | 554 | 588 |
Note:
| (1) | New business contribution represents the present value of future profits on new insurance contract business written during the year. year. |
Notes on the accounts continued | Financial statements |
26 Insurance business continued| | Group |
| | Life contracts £m | Investment contracts £m |
| Movement in provision for liabilities under life contracts and under linked and other investment contracts |
| At 1 January 2009 | 4,498 | 5,326 |
| Premiums received | | |
| - continuing operations | 250 | 349 |
| - discontinued operations | 278 | — |
| Fees and expenses | (16) | (13) |
| Investment return | 400 | 442 |
| Actuarial adjustments | (205) | — |
| Account balances paid on surrender and other terminations in the year | (546) | (712) |
| Exchange and other adjustments | (180) | (263) |
| At 1 January 2010 | 4,479 | 5,129 |
| Premiums received | 237 | 46 |
| Fees and expenses | (13) | (16) |
| Investment return | 100 | 228 |
| Actuarial adjustments | (174) | — |
| Account balances paid on surrender and other terminations in the year | (434) | (159) |
| Disposal of subsidiaries | (4,032) | (5,115) |
| Exchange and other adjustments | (95) | (113) |
| At 31 December 2010 | 68 | — |
24 Insurance business (continued)
| | | Group | |
| Movement in provision for liabilities under life contracts and under linked and other investment contracts | | Life contracts £m | | | Investment contracts £m | |
| At 1 January 2007 | | | 2,209 | | | | 2,246 | |
| Acquisition of subsidiaries | | | 2,275 | | | | 3,245 | |
| Premiums received | | | 784 | | | | 140 | |
| Fees and expenses | | | (30 | ) | | | (25 | ) |
| Investment return | | | 251 | | | | 93 | |
| Actuarial adjustments | | | (493 | ) | | | — | |
| Account balances paid on surrender and other terminations in the year | | | (468 | ) | | | (320 | ) |
| Exchange and other adjustments | | | 168 | | | | 176 | |
| At 1 January 2008 | | | 4,696 | | | | 5,555 | |
| Premiums received | | | 868 | | | | 330 | |
| Fees and expenses | | | (21 | ) | | | (38 | ) |
| Investment return | | | 17 | | | | (970 | ) |
| Actuarial adjustments | | | (233 | ) | | | — | |
| Account balances paid on surrender and other terminations in the year | | | (734 | ) | | | (455 | ) |
| Transfers to disposal groups | | | (686 | ) | | | — | |
| Exchange and other adjustments | | | 591 | | | | 904 | |
| At 31 December 2008 | | | 4,498 | | | | 5,326 | |
Investment contracts are presented within customer deposits.
Changes in assumptions during the year were not material to the profit recognised.
| | | Group |
| | | Group | | 2010 | 2009 | 2008 |
| Assets backing linked liabilities | | | 2008 £m | | | | 2007 £m | | £m | £m |
| Debt securities | | 4,500 | | | 2,899 | | — | 4,484 | 4,500 |
| Equity securities | | 4,816 | | | 6,863 | | — | 4,642 | 4,816 |
| Cash and cash equivalents | | 81 | | | 68 | | — | 102 | 81 |
| | | | | | | | | | | |
| The associated liabilities are: | | | | | | | | | | |
| Linked contracts classified as insurance contracts | | 4,189 | | | 4,398 | | |
| Linked contracts classified as investment contracts | | 5,208 | | | 5,432 | | |
| - linked contracts and participating bonds classified as insurance contracts | | — | 4,175 | 4,189 |
| - linked contracts classified as investment contracts | | — | 5,053 | 5,208 |
There are no options and guarantees relating to life assurance contracts that could in aggregate have a material effect on the amount, timing and uncertainty of the Group’s future cash flows.
The Group is exposed to insuranceInsurance risk either directly through its businesses or through using insurance to reduce other risk exposures.
Insurance risk is the risk of fluctuations in the timing, frequency or severity of insured events, relative to the expectations of the Group at the time of underwriting.
Underwriting and pricing risk
The Group manages underwriting and pricing risk through the use of underwriting guidelines which detail the class, nature and type of business that may be accepted; pricing policies by product line and by brand; and centralised control of policy wordings and any subsequent changes.
Claims management risk
The risk that claims are handled or paid inappropriately is managed using a range of IT system controls and manual processes conducted by experienced staff. These, together with a range of detailed policies and procedures ensure that all claims are handled in a timely, appropriate and accurate manner.
Reinsurance risk
Reinsurance is used to protect against the impact of major catastrophic events or unforeseen volumes of, or adverse trends in, large individual claims and to transfer risk that is outside the Group’sGroup's current risk appetite.
Reinsurance of risks above the Group’sGroup's risk appetite is only effective if the reinsurance premium makesis economic sense and the counterparty is financially secure. Acceptable reinsurers are rated A- or better unless specifically authorised.
Reserving risk
Reserving risk relates to both premiums and claims. It is the risk that reserves are assessed incorrectly such that insufficient funds have been retained to pay or handle claims as the amounts fall due. Claims development data provides information on the historical pattern of reserving risk.
| | | Accident year |
| Insurance claims – gross | | | 2001 £m | | | | 2002 £m | | | | 2003 £m | | | | 2004 £m | | | | 2005 £m | | | | 2006 £m | | | | 2007 £m | | | | 2008 £m | | | Total £m |
| Estimate of ultimate claims costs: | | | | | | | | | | | | | | | | | | | | | | | | | | | | | | | | | | |
| At end of accident year | | | 2,395 | | | | 3,013 | | | | 3,658 | | | | 3,710 | | | | 4,265 | | | | 4,269 | | | | 4,621 | | | | 4,080 | | | | 30,011 | |
| One year later | | | (70 | ) | | | 91 | | | | (140 | ) | | | (186 | ) | | | (92 | ) | | | (275 | ) | | | (71 | ) | | | — | | | | (743 | ) |
| Two years later | | | 20 | | | | 1 | | | | (106 | ) | | | (88 | ) | | | (147 | ) | | | (77 | ) | | | — | | | | — | | | | (397 | ) |
| Three years later | | | 12 | | | | (12 | ) | | | (55 | ) | | | (85 | ) | | | (60 | ) | | | — | | | | — | | | | — | | | | (200 | ) |
| Four years later | | | (40 | ) | | | (17 | ) | | | (47 | ) | | | (31 | ) | | | — | | | | — | | | | — | | | | — | | | | (135 | ) |
| Five years later | | | (1 | ) | | | (19 | ) | | | (21 | ) | | | — | | | | — | | | | — | | | | — | | | | — | | | | (41 | ) |
| Six years later | | | (9 | ) | | | (11 | ) | | | — | | | | — | | | | — | | | | — | | | | — | | | | — | | | | (20 | ) |
| Seven years later | | | 6 | | | | — | | | | — | | | | — | | | | — | | | | — | | | | — | | | | — | | | | 6 | |
| Current estimate of cumulative claims | | | 2,313 | | | | 3,046 | | | | 3,289 | | | | 3,320 | | | | 3,966 | | | | 3,917 | | | | 4,550 | | | | 4,080 | | | | 28,481 | |
| Cumulative payments to date | | | (2,235 | ) | | | (2,932 | ) | | | (3,060 | ) | | | (2,977 | ) | | | (3,442 | ) | | | (3,121 | ) | | | (3,393 | ) | | | (2,052 | ) | | | (23,212 | ) |
| | | | 78 | | | | 114 | | | | 229 | | | | 343 | | | | 524 | | | | 796 | | | | 1,157 | | | | 2,028 | | | | 5,269 | |
| | | | | | | |
| Liability in respect of prior years | | | | 91 | | |
| Claims handling costs | | | | 118 | | |
| Gross general insurance claims liability | | | | 5,478 | | |
Notes on the accounts continued | Financial statements |
| Insurance claims - gross | |
| | Accident year |
| | 2001 £m | 2002 £m | 2003 £m | 2004 £m | 2005 £m | 2006 £m | 2007 £m | 2008 £m | 2009 £m | 2010 £m | Total £m |
| |
| Estimate of ultimate claims costs: | | | | | | | | | | | |
| At end of accident year | 2,395 | 3,013 | 3,658 | 3,710 | 4,265 | 4,269 | 4,621 | 4,080 | 4,383 | 4,459 | 38,853 |
| One year later | (70) | 91 | (140) | (186) | (92) | (275) | (71) | 29 | 120 | | (594) |
| Two years later | 20 | 1 | (106) | (88) | (147) | (77) | (5) | 9 | | | (393) |
| Three years later | 12 | (12) | (55) | (85) | (60) | (16) | 14 | | | | (202) |
| Four years later | (40) | (17) | (47) | (31) | (55) | 2 | | | | | (188) |
| Five years later | (1) | (19) | (21) | — | 9 | | | | | | (32) |
| Six years later | (9) | (11) | (32) | 45 | | | | | | | (7) |
| Seven years later | 6 | (14) | 28 | | | | | | | | 20 |
| Eight years later | 4 | 14 | | | | | | | | | 18 |
| Nine years later | 9 | | | | | | | | | | 9 |
Current estimate of cumulative claims | 2,326 | 3,046 | 3,285 | 3,365 | 3,920 | 3,903 | 4,559 | 4,118 | 4,503 | 4,459 | 37,484 |
| Cumulative payments to date | (2,256) | (2,976) | (3,144) | (3,131) | (3,670) | (3,482) | (3,902) | (3,301) | (3,157) | (2,044) | (31,063) |
| | 70 | 70 | 141 | 234 | 250 | 421 | 657 | 817 | 1,346 | 2,415 | 6,421 |
| Liability in respect of earlier years | | | | | | | | | | | 172 |
| Claims handling costs | | | | | | | | | | | 133 |
| Gross general insurance claims liability | | | | | | | | | 6,726 |
| Insurance claims - net of reinsurance | | Insurance claims - net of reinsurance |
| | | Accident year | | Accident year |
| Insurance claims – net of reinsurance | | | 2001 £m | | | | 2002 £m | | | | 2003 £m | | | | 2004 £m | | | | 2005 £m | | | | 2006 £m | | | | 2007 £m | | | | 2008 £m | | | Total £m | | |
| | | 2001 | 2002 | 2003 | 2004 | 2005 | 2006 | 2007 | 2008 | 2009 | 2010 | Total |
| | | £m | £m | £m |
| Estimate of ultimate claims costs: | | | | | | | | | | | | | | | | | | | | | | | | | | | | | | | | | | | | | | | |
| At end of accident year | | 2,011 | | | 2,584 | | | 3,215 | | | 3,514 | | | 4,168 | | | 4,215 | | | 4,572 | | | 4,034 | | | 28,313 | | 2,011 | 2,584 | 3,215 | 3,514 | 4,168 | 4,215 | 4,572 | 4,034 | 4,360 | 4,435 | 37,108 |
| One year later | | (61 | ) | | 59 | | | (106 | ) | | (168 | ) | | (67 | ) | | (261 | ) | | (90 | ) | | — | | | (694 | ) | (61) | 59 | (106) | (168) | (67) | (261) | (90) | 24 | 99 | | (571) |
| Two years later | | 22 | | | (12 | ) | | (103 | ) | | (90 | ) | | (161 | ) | | (87 | ) | | — | | | — | | | (431 | ) | 22 | (12) | (103) | (90) | (161) | (87) | (17) | 9 | | | (439) |
| Three years later | | 13 | | | (3 | ) | | (53 | ) | | (81 | ) | | (64 | ) | | — | | | — | | | — | | | (188 | ) | 13 | (3) | (53) | (81) | (64) | (23) | 16 | | | (195) |
| Four years later | | (41 | ) | | (21 | ) | | (44 | ) | | (46 | ) | | — | | | — | | | — | | | — | | | (152 | ) | (41) | (21) | (44) | (46) | (60) | 10 | | | (202) |
| Five years later | | 1 | | | (24 | ) | | (23 | ) | | — | | | — | | | — | | | — | | | — | | | (46 | ) | 1 | (24) | (23) | (19) | 4 | | | (61) |
| Six years later | | (19 | ) | | (5 | ) | | — | | | — | | | — | | | — | | | — | | | — | | | (24 | ) | (19) | (5) | (34) | 45 | | | | (13) |
| Seven years later | | — | | | — | | | — | | | — | | | — | | | — | | | — | | | — | | | — | | — | (11) | 20 | | | | | 9 |
| Eight years later | | 1 | 10 | | | | 11 |
| Nine years later | | 8 | | | | 8 |
| Current estimate of cumulative claims | | 1,926 | | | 2,578 | | | 2,886 | | | 3,129 | | | 3,876 | | | 3,867 | | | 4,482 | | | 4,034 | | | 26,778 | | 1,935 | 2,577 | 2,872 | 3,155 | 3,820 | 3,854 | 4,481 | 4,067 | 4,459 | 4,435 | 35,655 |
| Cumulative payments to date | | (1,873 | ) | | (2,492 | ) | | (2,714 | ) | | (2,835 | ) | | (3,364 | ) | | (3,085 | ) | | (3,347 | ) | | (2,032 | ) | | (21,742 | ) | (1,887) | (2,525) | (2,786) | (2,970) | (3,590) | (3,435) | (3,849) | (3,276) | (3,133) | (2,030) | (29,481) |
| | | | 53 | | | 86 | | | 172 | | | 294 | | | 512 | | | 782 | | | 1,135 | | | 2,002 | | | 5,036 | | 48 | 52 | 86 | 185 | 230 | 419 | 632 | 791 | 1,326 | 2,405 | 6,174 |
| | | | | | | | | | | | | | | | | | | | | | | | | | | | | | | | | | | | | | |
| Liability in respect of prior years | | | | | | | | | | | | | | | | | | | | | | | | | | | | | | | | | | | 42 | | |
| Liability in respect of earlier years | | | | | | | 109 |
| Claims handling costs | | | | | | | | | | | | | | | | | | | | | | | | | | | | | | | | | | | 113 | | | | | | | 133 |
| Net general insurance claims liability | | | | | | | | | | | | | | �� | | | | | | | | | | | | | | | | | | | | | 5,191 | | Net general insurance claims liability | | | | | | 6,416 |
Claims reserves
It is the Group’s policy to hold undiscounted claims reserves (including reserves to cover claims which have been incurred but not reported (IBNR reserves)) for all classes at a sufficient level to meet all liabilities as they fall due.
The Group’s focus is on high volume and relatively straightforward products, for example home and motor. This facilitates the generation of comprehensive underwriting and claims data, which are used to accurately price and monitor the risks accepted.
Notes on the accounts continued | Financial statements |
2426 Insurance business (continued) continuedLoss ratios
The following table shows loss ratios for each major class of business, gross and net of reinsurance.
| | | | 2010 | | 2009 | | 2008 |
| | | | 2008 | | | 2007 | | | 2006 | | | Earned premiums | Claims incurred | Loss ratio | | Earned premiums | Loss ratio | | Earned premiums | Loss ratio |
| | | | Earned premiums £m | | | Claims incurred £m | | | Loss ratio % | | | Earned premiums £m | | | Loss ratio % | | | Earned premiums £m | | | Loss ratio % | | | £m | % | | £m | % | | £m | % |
| Residential property | Gross | | 1,103 | | | 529 | | | 48 | | | 1,087 | | | 82 | | | 1,121 | | | 56 | | Gross | 1,168 | 643 | 55 | | 1,129 | 53 | | 1,103 | 48 |
| | Net | | 1,034 | | | 529 | | | 51 | | | 1,020 | | | 86 | | | 1,061 | | | 59 | | Net | 1,107 | 643 | 58 | | 1,065 | 56 | | 1,034 | 51 |
| Personal motor | Gross | | 3,173 | | | 2,679 | | | 84 | | | 3,254 | | | 80 | | | 3,384 | | | 84 | | Gross | 2,829 | 3,530 | 125 | | 2,984 | 103 | | 3,173 | 84 |
| | Net | | 3,075 | | | 2,565 | | | 83 | | | 3,161 | | | 81 | | | 3,279 | | | 85 | | Net | 2,760 | 3,458 | 125 | | 2,901 | 103 | | 3,075 | 83 |
| Commercial property | Gross | | 194 | | | 79 | | | 41 | | | 211 | | | 55 | | | 218 | | | 37 | | Gross | 187 | 106 | 57 | | 182 | 41 | | 194 | 41 |
| | Net | | 174 | | | 80 | | | 46 | | | 191 | | | 60 | | | 198 | | | 38 | | Net | 169 | 106 | 63 | | 166 | 45 | | 174 | 46 |
| Commercial motor | Gross | | 143 | | | 130 | | | 91 | | | 142 | | | 75 | | | 90 | | | 69 | | Gross | 120 | 128 | 107 | | 136 | 100 | | 143 | 91 |
| | Net | | 141 | | | 128 | | | 91 | | | 133 | | | 80 | | | 88 | | | 68 | | Net | 119 | 124 | 104 | | 135 | 98 | | 141 | 91 |
| Other | Gross | | 994 | | | 422 | | | 42 | | | 851 | | | 40 | | | 842 | | | 47 | | Gross | 837 | 374 | 45 | | 848 | 51 | | 994 | 42 |
| | Net | | 828 | | | 426 | | | 51 | | | 839 | | | 41 | | | 833 | | | 49 | | Net | 834 | 369 | 44 | | 845 | 51 | | 828 | 51 |
| Total | Gross | | 5,607 | | | 3,839 | | | 68 | | | 5,545 | | | 73 | | | 5,655 | | | 71 | | Gross | 5,141 | 4,781 | 93 | | 5,279 | 82 | | 5,607 | 68 |
| | Net | | 5,252 | | | 3,728 | | | 71 | | | 5,344 | | | 75 | | | 5,459 | | | 73 | | Net | 4,989 | 4,700 | 94 | | 5,112 | 83 | | 5,252 | 71 |
The Group has no interest rate exposure from general insurance liabilities because provisions for claims under short-term insurance contracts are not discounted.
Frequency and severity of specific risks and sources of uncertainty
Most general insurance contracts are written on an annual basis, which means that the Group’s liability extends for a 12 month period, after which the Group is entitled to decline or renew or can impose renewal terms by amending the premium, terms and conditions, or both.
The frequency and severity of claims and the sources of uncertainty for the key classes that the Group is exposed to are as follows:
Motor insurance contracts (private(personal and commercial)
Claims experience is quite variable, due to a wide range of factors, but the principal ones are age, sex and driving experience of the driver, type and nature of vehicle, use of vehicle and area.
There are many sources of uncertainty that will affect the Group’s experience under motor insurance, including operational risk, reserving risk, premium rates not matching claims inflation rates, weather, the social, economic and legislative environment and reinsurance failure risk.
Property insurance contracts (residential and commercial)
The major causes of claims for property insurance are theft, flood, escape of water, fire, storm, subsidence and various types of accidental damage.
The major source of uncertainty in the Group’s property accountscontracts is the volatility of weather. Weather in the UK can affect most of the above perils. Over a longer period, the strength of the economy is also a factor.
Other commercial insurance contracts
Other commercial claims come mainly from business interruption and loss arising from the negligence of the insured (liability insurance). Business interruption losses come from the loss of income, revenue and/or profit as a result of property damage claims. Liability insurance includes employersemployers’ liability and public/productsproducts’ liability. Liability insurance is written on an occurrence basis, and is subject to claims that are identified over a substantial period of time, but where the loss event occurred during the life of the policy.
Fluctuations in the social and economic climate are a source of uncertainty in the Group’s business interruption and general liability accounts. Other sources of uncertainty are changes in the law, or its interpretation, and reserving risk. Other uncertainties are significant events (for example terrorist attacks) and any emerging new heads of damage or types of claim that are not envisaged when the policy is written.
The following table shows the expected maturity of undiscounted insurance liabilities up to twenty20 years, excluding those linked directly to the financial assets backing these contracts (2008 –(2010 - nil; 2009 - £4,175 million; 2008 - £4,189 million; 2007 – £4,398 million).
| | Group |
| | 0-3 months | 3-12 months | 1-3 years | 3-5 years | 5-10 years | 10-20 years |
| | £m | £m | £m | £m | £m | £m |
| 2010 | 724 | 1,503 | 1,821 | 898 | 734 | 442 |
| 2009 | 561 | 1,685 | 1,898 | 949 | 665 | 73 |
| 2008 | 623 | 1,645 | 1,899 | 903 | 487 | 53 |
| | | Group | |
| | | 0-3 months £m | | | 3-12 months £m | | | 1-3 years £m | | | 3-5 years £m | | | 5-10 years £m | | | 10-20 years £m | |
| 2008 | | | 623 | | | | 1,645 | | | | 1,899 | | | | 903 | | | | 487 | | | | 53 | |
| | | | | | | | | | | | | | | | | | | | | | | | | |
| 2007 | | | 710 | | | | 1,796 | | | | 1,961 | | | | 882 | | | | 395 | | | | 33 | |
Notes on the accounts continued | Financial statements |
27 Subordinated liabilities
Life business
The Group’s three UK regulated life companies, National Westminster Life Assurance Limited (NatWest Life), Royal Scottish Assurance plc (RSA) and Direct Line Life Insurance Company Limited, are required to meet minimum capital requirements at all times under the UK Financial Service Authority’s Prudential Sourcebook. The capital resources covering the regulatory requirement are not transferable to other areas of the Group. To ensure that the capital requirement is satisfied at all times, each company holds an additional voluntary buffer above the regulatory minimum.
The Group is not exposed to price, currency, credit, or interest risk on unit linked life contracts but it is exposed to variation in management fees. A decrease of 10% in the value of the assets would reduce the asset management fees by £5 million per annum (2007 – £2 million). The Group writes insurance contracts with minimum guaranteed death benefits that expose it to the risk that declines in the value of underlying investments may increase the Group’s net exposure to death risk.
The Group’s long-term assurance contracts include whole-life, term assurance, endowment assurances, flexible whole life, pension and annuity contracts that are expected to remain in force for an extended period of time.
Contracts under which the Group does not accept significant insurance risk are classified as investment contracts. As required by IFRS 4 ‘Insurance Contracts’ long term business provisions are calculated in accordance with existing local GAAP (UK accounting standard FRS 27 ‘Life Assurance’).
Estimations (assumptions) including future mortality, morbidity, persistency and levels of expenses are made in calculating actuarial reserves. Key metrics for the UK include:
| Assumptions | | 2008 | | | 2007 | | | 2006 | |
| Valuation interest rate | | | | | | | | | |
| Term assurance | | | 2.50 | % | | | 3.00 | % | | | 3.00 | % |
| Interest | | | 2.50 | % | | | 3.00 | % | | | 3.00 | % |
| Unit growth | | | 3.70 | % | | | 3.50 | % | | | 3.50 | % |
| Expense inflation | | | 3.00 | % | | | 4.00 | % | | | 4.00 | % |
Sample mortality rates, expressed as deaths per million per annum, for term assurance products (age 40).
| Mortality | | | | | | | | | |
| Male non-smoker | | | 723 | | | | 810 | | | | 517 | |
| Male smoker | | | 1,590 | | | | 1,830 | | | | 983 | |
| Female non-smoker | | | 568 | | | | 460 | | | | 278 | |
| Female smoker | | | 1,277 | | | | 1,310 | | | | 618 | |
| | Group | | Company |
| | 2010 | 2009 | 2008 | | 2010 | 2009 | 2008 |
| | £m | £m | £m | | £m | £m | £m |
| Dated loan capital | 20,658 | 24,597 | 30,162 | | 6,685 | 6,526 | 7,421 |
| Undated loan capital | 2,552 | 8,164 | 11,697 | | 563 | 574 | 1,071 |
| Preference shares | 1,112 | 2,000 | 2,194 | | 800 | 1,662 | 1,822 |
| Trust preferred securities | 2,731 | 2,891 | 5,101 | | — | — | — |
| | 27,053 | 37,652 | 49,154 | | 8,048 | 8,762 | 10,314 |
In 2007May 2010, the Group moved fromredeemed certain subordinated debt securities and equity preference shares in exchange for cash or senior debt. The exchanges involving instruments classified as liabilities all met the UK 80 seriescriteria in IFRS for treatment as the extinguishment of the original liability and the recognition of a new financial liability. Gains on these exchanges and on the redemption of securities classified as liabilities for cash, totalling £553 million were credited to profit or loss. No amounts have been recognised in profit or loss in relation to the 00redemption of securities classified as equity in the Group financial statements. The difference between the consideration and the carrying value for these securities amounting to £651 million has been recorded in equity.
A similar series for mortality.
Expenses:
Pre-2000 products – RSA | | 2008
per annum
| | | 2007
per annum
| | | 2006
per annum
| |
Lifestyle protection plan | | | £29.30 | | | | £25.18 | | | | £28.96 | |
Mortgage savings plan | | | £65.92 | | | | £56.67 | | | | £65.15 | |
| | | | | | | | | | | | |
Pre-2000 products – NatWest Life | | | | | | | | | | | | |
Term assurances | | | £26.01 | | | | £26.01 | | | | £26.01 | |
Linked life bonds | | | £26.01 | | | | £23.17 | | | | £23.17 | |
| | | | | | | | | | | | |
Post-2000 products | | | | | | | | | | | | |
Term assurances | | | £23.17 | | | | £23.16 | | | | £23.16 | |
Guaranteed bonds | | | £25.71 | | | | £25.71 | | | | £25.71 | |
24 Insurance business (continued)
Frequencyexchange and severity of claims – for contracts where death is the insured risk, the most significant factors that could increase the overall frequency of claims are epidemics or widespread changestender offers completed in lifestyle, resulting in earlier or more claims than expected.
For contracts where survival is the insured risk, the most significant factor is continued improvement in medical scienceApril 2009 and social conditions that would increase longevity.
For contracts with fixed and guaranteed benefits and fixed future premiums, there are no mitigating terms and conditions that reduce the insurance risk accepted. Participating contracts can resultresulted in a significant portiongain of the insurance risk£3,790 million and £829 million being shared with the insured party.
Sources of uncertaintyrecorded in the estimation of future benefit payments and premium receipts –equity. the Group uses base tables of standard mortality appropriate to the type of contract being written and the territory in which the insured person resides. These are adjusted to reflect the Group’s experience, mortality improvements and voluntary termination behaviour.
Sensitivity factor | Description of sensitivity factor applied |
Interest rate and investment return | Change in market interest rates of ±1 %. |
| The test allows consistently for similar changes to investment returns and movements in the market value of backing fixed interest securities. |
Expenses | Increase in maintenance expenses of 10% |
Assurance mortality/morbidity | Increase in mortality/morbidity rates for assurance contracts of 5% |
Annuitant mortality | Reduction in mortality rates for annuity contracts of 5% |
The above sensitivity factors are applied via actuarial and statistical models,Group has undertaken that, unless otherwise agreed with the following effectEuropean Commission, neither the company nor any of its direct or indirect subsidiaries (excluding companies in the RBS Holdings N.V. Group, which are subject to different restrictions, see below) will pay external investors any dividends or coupons on existing hybrid capital instruments (including preference shares, B shares and upper and lower tier 2 instruments) from 30 April 2010 for a period of two years thereafter (“the financial statements.
| | | Increase/(decrease) in profit and equity | |
| Risk factor | | | 2008 £m | | | | 2007 £m | |
| Interest rates | | | (11 | ) | | | (18 | ) |
| Interest rates | | | 11 | | | | 15 | |
| Expenses | | | (7 | ) | | | (5 | ) |
| Assurance mortality/morbidity | | | (9 | ) | | | (8 | ) |
LimitationsThe Group has agreed that RBS Holdings N.V. will not pay investors any coupons on, or exercise any call rights in relation to, specified hybrid capital instruments for an effective period of sensitivity analysis:two years from 1 April 2011, unless in any such case there is a legal obligation to do so. RBS Holdings N.V. and its group companies are also subject to restrictions on the above tables demonstrate the effectexercise of a changecall rights in a key UK assumption whilstrelation to their other assumptions remain unaffected. In reality, such an occurrence is unlikely, due to correlation between the assumptions and other factors. It should also be noted that these sensitivities are non-linear, and larger or smaller impacts should not be interpolated or extrapolated from these results. The sensitivity analyses do not take into consideration that assets and liabilities are actively managed and may vary at the time that any actual market movement occurs.hybrid capital instruments.| | | Group | | | Company | |
| | | | 2008 £m | | | | 2007 £m | | | | 2008 £m | | | | 2007 £m | |
| Dated loan capital | | | 30,162 | | | | 23,065 | | | | 7,421 | | | | 5,585 | |
| Undated loan capital | | | 11,697 | | | | 9,866 | | | | 1,071 | | | | 781 | |
| Preference shares | | | 2,194 | | | | 1,686 | | | | 1,822 | | | | 1,377 | |
| Trust preferred securities | | | 5,101 | | | | 3,426 | | | | — | | | | — | |
| | | | 49,154 | | | | 38,043 | | | | 10,314 | | | | 7,743 | |
Certain preference shares issued by the company are classified as liabilities; these securities remain subject to the capital maintenance rules of the Companies Act 1985.2006.
Notes on the accounts continued | Financial statements |
27 Subordinated liabilities continued
The following tables analyse the remaining contractual maturity of subordinated liabilities by (1) the final redemption date; and (2) the next callablecall date.
| | | Group |
| | | 2011 | 2012 | 2013-2015 | 2016-2020 | Thereafter | Perpetual | Total |
2010 - final redemption | | £m | £m | £m | £m | £m | £m | £m |
| Sterling | | 79 | — | 817 | 63 | 361 | 806 | 2,126 |
| US dollars | | 195 | 262 | 3,171 | 3,054 | 261 | 4,398 | 11,341 |
| Euro | | 663 | — | 3,368 | 3,849 | 1,611 | 866 | 10,357 |
| Other | | 27 | — | 1,612 | 1,252 | — | 338 | 3,229 |
| | | 964 | 262 | 8,968 | 8,218 | 2,233 | 6,408 | 27,053 |
| | Group |
| | Currently | 2011 | 2012 | 2013-2015 | 2016-2020 | Thereafter | Perpetual | Total |
2010 - call date | £m | £m | £m | £m | £m | £m | £m | £m |
| Sterling | 172 | 96 | 55 | 1,027 | 217 | 530 | 29 | 2,126 |
| US dollars | 3,099 | 2,889 | 1,228 | 1,960 | 800 | 1,052 | 313 | 11,341 |
| Euro | 613 | 1,940 | 849 | 2,387 | 3,855 | 664 | 49 | 10,357 |
| Other | 672 | 11 | 728 | 1,438 | 380 | — | — | 3,229 |
| | 4,556 | 4,936 | 2,860 | 6,812 | 5,252 | 2,246 | 391 | 27,053 |
| | | Group |
| | | 2010 | 2011 | 2012-2014 | 2015-2019 | Thereafter | Perpetual | Total |
2009 - final redemption | | £m | £m | £m | £m | £m | £m | £m |
| Sterling | | 122 | 8 | 164 | 1,778 | — | 2,603 | 4,675 |
| US dollars | | 407 | 196 | 1,457 | 5,314 | 323 | 5,294 | 12,991 |
| Euro | | 1,589 | 443 | 1,414 | 7,360 | 1,664 | 4,410 | 16,880 |
| Other | | 26 | — | 554 | 1,905 | — | 621 | 3,106 |
| | | 2,144 | 647 | 3,589 | 16,357 | 1,987 | 12,928 | 37,652 |
| | Group |
| | Currently | 2010 | 2011 | 2012-2014 | 2015-2019 | Thereafter | Perpetual | Total |
2009 - call date | £m | £m | £m | £m | £m | £m | £m | £m |
| Sterling | 174 | 408 | 202 | 496 | 1,720 | 1,504 | 171 | 4,675 |
| US dollars | 1,811 | 1,814 | 1,429 | 3,171 | 1,139 | 1,891 | 1,736 | 12,991 |
| Euro | 564 | 2,849 | 1,755 | 3,142 | 5,501 | 709 | 2,360 | 16,880 |
| Other | 419 | 576 | — | 1,025 | 914 | 172 | — | 3,106 |
| | 2,968 | 5,647 | 3,386 | 7,834 | 9,274 | 4,276 | 4,267 | 37,652 |
| | | Group |
| | | 2009 | 2010 | 2011-2013 | 2014-2018 | Thereafter | Perpetual | Total |
2008 - final redemption | | £m | £m | £m | £m | £m | £m | £m |
| Sterling | | 192 | 15 | 176 | 1,458 | 370 | 6,287 | 8,498 |
| US dollars | | 1,308 | 342 | 1,123 | 7,435 | 561 | 7,655 | 18,424 |
| Euro | | 1,865 | 1,378 | 1,991 | 7,923 | 1,957 | 4,087 | 19,201 |
| Other | | 29 | — | 7 | 2,284 | 34 | 677 | 3,031 |
| | | 3,394 | 1,735 | 3,297 | 19,100 | 2,922 | 18,706 | 49,154 |
| | Group |
| | Currently | 2009 | 2010 | 2011-2013 | 2014-2018 | Thereafter | Perpetual | Total |
2008 - call date | £m | £m | £m | £m | £m | £m | £m | £m |
| Sterling | — | 192 | 752 | 1,039 | 2,729 | 3,615 | 171 | 8,498 |
| US dollars | 1,833 | 3,247 | 2,601 | 4,814 | 1,951 | 2,053 | 1,925 | 18,424 |
| Euro | — | 2,351 | 3,137 | 5,699 | 7,021 | 942 | 51 | 19,201 |
| Other | — | 500 | 405 | 922 | 954 | 250 | — | 3,031 |
| | 1,833 | 6,290 | 6,895 | 12,474 | 12,655 | 6,860 | 2,147 | 49,154 |
| | | Group | |
| 2008 – final redemption | | | 2009 £m | | | | 2010 £m | | | | 2011-2013 £m | | | | 2014-2018 £m | | | Thereafter £m | | | Perpetual £m | | | Total £m | |
| Sterling | | | 192 | | | | 15 | | | | 176 | | | | 1,458 | | | | 370 | | | | 6,287 | | | | 8,498 | |
| US dollars | | | 1,308 | | | | 342 | | | | 1,123 | | | | 7,435 | | | | 561 | | | | 7,655 | | | | 18,424 | |
| Euro | | | 1,865 | | | | 1,378 | | | | 1,991 | | | | 7,923 | | | | 1,957 | | | | 4,087 | | | | 19,201 | |
| Other | | | 29 | | | | — | | | | 7 | | | | 2,284 | | | | 34 | | | | 677 | | | | 3,031 | |
| Total | | | 3,394 | | | | 1,735 | | | | 3,297 | | | | 19,100 | | | | 2,922 | | | | 18,706 | | | | 49,154 | |
| | | Group | |
| 2008 – call date | | Currently £m | | | | 2009 £m | | | | 2010 £m | | | | 2011-2013 £m | | | | 2014-2018 £m | | | Thereafter £m | | | Perpetual £m | | | Total £m | |
| Sterling | | | — | | | | 192 | | | | 752 | | | | 1,039 | | | | 2,729 | | | | 3,615 | | | | 171 | | | | 8,498 | |
| US dollars | | | 1,833 | | | | 3,247 | | | | 2,601 | | | | 4,814 | | | | 1,951 | | | | 2,053 | | | | 1,925 | | | | 18,424 | |
| Euro | | | — | | | | 2,351 | | | | 3,137 | | | | 5,699 | | | | 7,021 | | | | 942 | | | | 51 | | | | 19,201 | |
| Other | | | — | | | | 500 | | | | 405 | | | | 922 | | | | 954 | | | | 250 | | | | — | | | | 3,031 | |
| Total | | | 1,833 | | | | 6,290 | | | | 6,895 | | | | 12,474 | | | | 12,655 | | | | 6,860 | | | | 2,147 | | | | 49,154 | |
| | | Group | |
2007 – final redemption | | | 2008 £m | | | | 2009 £m | | | | 2010-2012 £m | | | | 2013-2017 £m | | | Thereafter £m | | | Perpetual £m | | | Total | |
| Sterling | | | 194 | | | | — | | | | 34 | | | | 1,405 | | | | 389 | | | | 5,818 | | | | 7,840 | |
| US dollars | | | 903 | | | | 1,540 | | | | 620 | | | | 5,477 | | | | 743 | | | | 3,985 | | | | 13,268 | |
| Euro | | | 764 | | | | 1,312 | | | | 1,405 | | | | 5,711 | | | | 1,674 | | | | 3,164 | | | | 14,030 | |
| Other | | | 35 | | | | — | | | | 6 | | | | 2,076 | | | | 325 | | | | 463 | | | | 2,905 | |
| Total | | | 1,896 | | | | 2,852 | | | | 2,065 | | | | 14,669 | | | | 3,131 | | | | 13,430 | | | | 38,043 | |
| | | Group | |
| 2007 – call date | | Currently £m | | | | 2008 £m | | | | 2009 £m | | | | 2010-2012 £m | | | | 2013-2017 £m | | | Thereafter £m | | | Perpetual £m | | | Total £m | |
| Sterling | | | — | | | | 194 | | | | — | | | | 1,497 | | | | 2,456 | | | | 3,527 | | | | 166 | | | | 7,840 | |
| US dollars | | | 1,347 | | | | 1,492 | | | | 2,585 | | | | 4,485 | | | | 1,678 | | | | 1,681 | | | | — | | | | 13,268 | |
| Euro | | | — | | | | 1,612 | | | | 1,685 | | | | 4,992 | | | | 5,091 | | | | 611 | | | | 39 | | | | 14,030 | |
| Other | | | — | | | | 35 | | | | 431 | | | | 843 | | | | 1,468 | | | | 128 | | | | — | | | | 2,905 | |
| Total | | | 1,347 | | | | 3,333 | | | | 4,701 | | | | 11,817 | | | | 10,693 | | | | 5,947 | | | | 205 | | | | 38,043 | |
Notes on the accounts continued | Financial statements |
| | | Company |
| | | 2011 | 2012 | 2013-2015 | 2016-2020 | Thereafter | Perpetual | Total |
2010 - final redemption | | £m | £m | £m | £m | £m | £m | £m |
| Sterling | | 11 | — | — | — | 400 | 16 | 427 |
| US dollars | | 243 | — | 1,558 | 225 | 2,698 | 1,337 | 6,061 |
| Euro | | 53 | — | — | — | 1,507 | — | 1,560 |
| | | 307 | — | 1,558 | 225 | 4,605 | 1,353 | 8,048 |
| | Company |
| | Currently | 2011 | 2012 | 2013-2015 | 2016-2020 | Thereafter | Perpetual | Total |
2010 - call date | £m | £m | £m | £m | £m | £m | £m | £m |
| Sterling | 15 | 11 | — | — | 400 | — | 1 | 427 |
| US dollars | 853 | 242 | — | 3,357 | 225 | 901 | 483 | 6,061 |
| Euro | — | 53 | 1,076 | — | 431 | — | — | 1,560 |
| | 868 | 306 | 1,076 | 3,357 | 1,056 | 901 | 484 | 8,048 |
| | | Company |
| | | 2010 | 2011 | 2012-2014 | 2015-2019 | Thereafter | Perpetual | Total |
2009 - final redemption | | £m | £m | £m | £m | £m | £m | £m |
| Sterling | | 13 | — | — | — | 400 | 200 | 613 |
| US dollars | | 62 | 185 | 1,075 | 630 | 2,578 | 2,013 | 6,543 |
| Euro | | 55 | — | — | — | 1,551 | — | 1,606 |
| | | 130 | 185 | 1,075 | 630 | 4,529 | 2,213 | 8,762 |
| | Company |
| | Currently | 2010 | 2011 | 2012-2014 | 2015-2019 | Thereafter | Perpetual | Total |
2009 - call date | £m | £m | £m | £m | £m | £m | £m | £m |
| Sterling | — | 212 | — | — | 400 | — | 1 | 613 |
| US dollars | 1,039 | 48 | 185 | 2,794 | 630 | 1,847 | — | 6,543 |
| Euro | — | 55 | — | 1,107 | 444 | — | — | 1,606 |
| | 1,039 | 315 | 185 | 3,901 | 1,474 | 1,847 | 1 | 8,762 |
| | | Company |
| | | 2009 | 2010 | 2011-2013 | 2014-2018 | Thereafter | Perpetual | Total |
2008 - final redemption | | £m | £m | £m | £m | £m | £m | £m |
| Sterling | | 9 | — | — | — | 400 | 200 | 609 |
| US dollars | | 415 | — | 717 | 1,381 | 2,863 | 2,661 | 8,037 |
| Euro | | — | — | — | — | 1,668 | — | 1,668 |
| | | 424 | — | 717 | 1,381 | 4,931 | 2,861 | 10,314 |
| | Company |
| | Currently | 2009 | 2010 | 2011-2013 | 2014-2018 | Thereafter | Perpetual | Total |
2008 - call date | £m | £m | £m | £m | £m | £m | £m | £m |
| Sterling | — | 9 | 199 | — | 400 | — | 1 | 609 |
| US dollars | 582 | 1,511 | 682 | 1,296 | 2,710 | 1,256 | — | 8,037 |
| Euro | — | — | — | 1,190 | 478 | — | — | 1,668 |
| | 582 | 1,520 | 881 | 2,486 | 3,588 | 1,256 | 1 | 10,314 |
25 Subordinated liabilities (continued)
| | | Company | |
| 2008 – final redemption | | | 2009 £m | | | | 2010 £m | | | | 2011-2013 £m | | | | 2014-2018 £m | | | Thereafter £m | | | Perpetual £m | | | Total £m | |
| Sterling | | | 9 | | | | — | | | | — | | | | — | | | | 400 | | | | 200 | | | | 609 | |
| US dollars | | | 415 | | | | — | | | | 717 | | | | 1,381 | | | | 2,863 | | | | 2,661 | | | | 8,037 | |
| Euro | | | — | | | | — | | | | — | | | | — | | | | 1,668 | | | | — | | | | 1,668 | |
| Total | | | 424 | | | | — | | | | 717 | | | | 1,381 | | | | 4,931 | | | | 2,861 | | | | 10,314 | |
| | | Company | |
| 2008 – call date | | Currently £m | | | | 2009 £m | | | | 2010 £m | | | | 2011-2013 £m | | | | 2014-2018 £m | | | Thereafter £m | | | Perpetual £m | | | Total £m | |
| Sterling | | | — | | | | 9 | | | | 199 | | | | — | | | | 400 | | | | — | | | | 1 | | | | 609 | |
| US dollars | | | 582 | | | | 1,511 | | | | 682 | | | | 1,296 | | | | 2,710 | | | | 1,256 | | | | — | | | | 8,037 | |
| Euro | | | — | | | | — | | | | — | | | | 1,190 | | | | 478 | | | | — | | | | — | | | | 1,668 | |
| Total | | | 582 | | | | 1,520 | | | | 881 | | | | 2,486 | | | | 3,588 | | | | 1,256 | | | | 1 | | | | 10,314 | |
| | | Company | |
| 2007 – final redemption | | | 2008 £m | | | | 2009 £m | | | | 2010-2012 £m | | | | 2013-2017 £m | | | Thereafter £m | | | Perpetual £m | | | Total £m | |
| Sterling | | | 13 | | | | — | | | | — | | | | — | | | | 399 | | | | 199 | | | | 611 | |
| US dollars | | | 61 | | | | 199 | | | | 148 | | | | 1,204 | | | | 2,259 | | | | 1,935 | | | | 5,806 | |
| Euro | | | 45 | | | | — | | | | — | | | | — | | | | 1,281 | | | | — | | | | 1,326 | |
| Total | | | 119 | | | | 199 | | | | 148 | | | | 1,204 | | | | 3,939 | | | | 2,134 | | | | 7,743 | |
| | | Company | |
| 2007 – call date | | Currently £m | | | | 2008 £m | | | | 2009 £m | | | | 2010-2012 £m | | | | 2013-2017 £m | | | Thereafter £m | | | Perpetual £m | | | Total £m | |
| Sterling | | | — | | | | 13 | | | | — | | | | 198 | | | | 399 | | | | — | | | | 1 | | | | 611 | |
| US dollars | | | 425 | | | | 435 | | | | 620 | | | | 643 | | | | 2,594 | | | | 1,089 | | | | — | | | | 5,806 | |
| Euro | | | — | | | | 45 | | | | — | | | | 914 | | | | 367 | | | | — | | | | — | | | | 1,326 | |
| Total | | | 425 | | | | 493 | | | | 620 | | | | 1,755 | | | | 3,360 | | | | 1,089 | | | | 1 | | | | 7,743 | |
Notes on the accounts continued | Financial statements |
27 Subordinated liabilities continued
Dated loan capital
| | 2010 | 2009 | 2008 |
| | £m | £m | £m |
| The company | | | |
| US$400 million 6.4% subordinated notes 2009 | — | — | 278 |
US$300 million 6.375% subordinated notes 2011 (redeemed February 2011) (1) | 199 | 201 | 231 |
US$750 million 5% subordinated notes 2013 (1) | 532 | 503 | 579 |
US$750 million 5% subordinated notes 2014 (1) | 559 | 521 | 616 |
US$250 million 5% subordinated notes 2014 (1) | 162 | 153 | 169 |
US$675 million 5.05% subordinated notes 2015 (1) | 492 | 468 | 550 |
US$350 million 4.7% subordinated notes 2018 (1) | 252 | 231 | 286 |
| | 2,196* | 2,077* | 2,709* |
| The Royal Bank of Scotland plc | | | |
| €300 million 4.875% subordinated notes 2009 | — | — | 298 |
| €1,000 million 6% subordinated notes 2013 | 989 | 1,014 | 1,083 |
| US$50 million floating rate subordinated notes 2013 | 38 | 36 | 36 |
| €500 million 6% subordinated notes 2013 | 439 | 452 | 487 |
£150 million 10.5% subordinated bonds 2013 (2) | 177 | 177 | 180 |
| US$1,250 million floating rate subordinated notes 2014 | — | — | 862 |
| AUD590 million 6% subordinated notes 2014 (callable January 2011) | 391 | 330 | 281 |
| AUD410 million floating rate subordinated notes 2014 (callable January 2011) | 272 | 229 | 195 |
| CAD700 million 4.25% subordinated notes 2015 | 452 | 419 | 409 |
| £250 million 9.625% subordinated bonds 2015 | 303 | 301 | 311 |
| US$750 million floating rate subordinated notes 2015 (callable September 2011) | 483 | 462 | 513 |
| €750 million floating rate subordinated notes 2015 | 725 | 741 | 783 |
| CHF400 million 2.375% subordinated notes 2015 | 287 | 244 | 257 |
| CHF100 million 2.375% subordinated notes 2015 | 83 | 69 | 72 |
| CHF200 million 2.375% subordinated notes 2015 | 136 | 117 | 125 |
| US$500 million floating rate subordinated notes 2016 (callable October 2011) | 322 | 308 | 346 |
| US$1,500 million floating rate subordinated notes 2016 (callable April 2011) | 967 | 926 | 1,038 |
| €500 million 4.5% subordinated notes 2016 (callable January 2011) | 450 | 476 | 511 |
| CHF200 million 2.75% subordinated notes 2017 (callable December 2012) | 138 | 120 | 129 |
| €100 million floating rate subordinated notes 2017 | 86 | 89 | 97 |
| €500 million floating rate subordinated notes 2017 (callable June 2012) | 432 | 445 | 482 |
| €750 million 4.35% subordinated notes 2017 (callable January 2017) | 721 | 728 | 770 |
| AUD450 million 6.5% subordinated notes 2017 (callable February 2012) | 302 | 255 | 217 |
| AUD450 million floating rate subordinated notes 2017 (callable February 2012) | 295 | 250 | 214 |
| US$1,500 million floating rate subordinated callable step-up notes 2017 (callable August 2012) | 966 | 925 | 1,029 |
| €2,000 million 6.93% subordinated notes 2018 | 1,999 | 2,017 | 2,136 |
| US$125.6 million floating rate subordinated notes 2020 | 81 | 78 | 87 |
| €1,000 million 4.625% subordinated notes 2021 (callable September 2016) | 949 | 962 | 1,019 |
| €300 million CMS linked floating rate subordinated notes 2022 | 280 | 292 | 303 |
| €144.4 million floating rate subordinated notes 2022 | 153 | 143 | 152 |
| | | | |
| National Westminster Bank Plc | | | |
| US$1,000 million 7.375% subordinated notes 2009 | — | — | 697 |
| €600 million 6% subordinated notes 2010 (redeemed January 2010) | — | 564 | 623 |
| €500 million 5.125% subordinated notes 2011 | 442 | 455 | 488 |
| £300 million 7.875% subordinated notes 2015 | 370 | 365 | 379 |
| £300 million 6.5% subordinated notes 2021 | 367 | 351 | 376 |
| | | | |
| Charter One Financial, Inc. | | | |
| US$400 million 6.375% subordinated notes 2012 | 265 | 255 | 287 |
| | | | |
| RBS Holdings USA Inc. | | | |
| US$170 million subordinated loan capital floating rate notes 2009 | — | — | 116 |
| US$100 million 5.575% senior subordinated revolving credit 2009 | — | — | 69 |
| US$500 million subordinated loan capital floating rate notes 2010 (redeemed December 2010) | — | 311 | 342 |
| | | | 2008 £m | | | | 2007 £m | |
| The company | | | | | | | | |
| US$400 million 6.4% subordinated notes 2009 (1) | | | 278 | | | | 202 | |
| US$300 million 6.375% subordinated notes 2011 (1) | | | 231 | | | | 163 | |
| US$750 million 5% subordinated notes 2013 (1) | | | 579 | | | | 382 | |
| US$750 million 5% subordinated notes 2014 (1) | | | 616 | | | | 386 | |
| US$250 million 5% subordinated notes 2014 (1) | | | 169 | | | | 123 | |
| US$675 million 5.05% subordinated notes 2015 (1) | | | 550 | | | | 357 | |
| US$350 million 4.7% subordinated notes 2018 (1) | | | 286 | | | | 173 | |
| | | | 2,709 | * | | | 1,786 | * |
| The Royal Bank of Scotland plc | | | | | | | | |
| €255 million 5.25% subordinated notes 2008 (redeemed July 2008) | | | — | | | | 192 | |
| €300 million 4.875% subordinated notes 2009 | | | 298 | | | | 228 | |
| €1,000 million 6% subordinated notes 2013 | | | 1,083 | | | | 790 | |
| US$50 million floating rate subordinated notes 2013 | | | 36 | | | | 26 | |
| €1,000 million floating rate subordinated notes 2013 (redeemed October 2008) | | | — | | | | 744 | |
| €500 million 6% subordinated notes 2013 | | | 487 | | | | 374 | |
| £150 million 10.5% subordinated bonds 2013 (2) | | | 180 | | | | 169 | |
| US$1,250 million floating rate subordinated notes 2014 (callable July 2009) | | | 862 | | | | 630 | |
| AUD590 million 6% subordinated notes 2014 (callable October 2009) | | | 281 | | | | 254 | |
| AUD410 million floating rate subordinated notes 2014 (callable October 2009) | | | 195 | | | | 182 | |
| CAD700 million 4.25% subordinated notes 2015 (callable March 2010) | | | 409 | | | | 358 | |
| £250 million 9.625% subordinated bonds 2015 | | | 311 | | | | 286 | |
| US$750 million floating rate subordinated notes 2015 (callable September 2010) | | | 513 | | | | 374 | |
| €750 million floating rate subordinated notes 2015 | | | 783 | | | | 564 | |
| CHF400 million 2.375% subordinated notes 2015 | | | 257 | | | | 166 | |
| CHF100 million 2.375% subordinated notes 2015 | | | 72 | | | | 41 | |
| CHF200 million 2.375% subordinated notes 2015 | | | 125 | | | | 86 | |
| US$500 million floating rate subordinated notes 2016 (callable October 2011) | | | 346 | | | | 252 | |
| US$1,500 million floating rate subordinated notes 2016 (callable April 2011) | | | 1,038 | | | | 757 | |
| €500 million 4.5% subordinated 2016 (callable January 2011) | | | 511 | | | | 379 | |
| CHF200 million 2.75% subordinated notes 2017 (callable December 2012) | | | 129 | | | | 89 | |
| €100 million floating rate subordinated notes 2017 | | | 97 | | | | 73 | |
| €500 million floating rate subordinated notes 2017 (callable June 2012) | | | 482 | | | | 371 | |
| €750 million 4.35% subordinated notes 2017 (callable January 2017) | | | 770 | | | | 548 | |
| AUD450 million 6.5% subordinated notes 2017 (callable February 2012) | | | 217 | | | | 202 | |
| AUD450 million floating rate subordinated notes 2017 (callable February 2012) | | | 214 | | | | 199 | |
| US$1,500 million floating rate subordinated callable step up | | | | | | | | |
| notes 2017 (callable August 2012) | | | 1,029 | | | | 752 | |
| €2,000 million 6.93% subordinated notes 2018 (issued April 2008; callable April 2018) | | | 2,136 | | | | — | |
| US$125.6 million floating rate subordinated notes 2020 | | | 87 | | | | 64 | |
| €1,000 million 4.625% subordinated notes 2021 (callable September 2016) | | | 1,019 | | | | 724 | |
| €300 million CMS linked floating rate subordinated notes 2022 | | | 303 | | | | 228 | |
| €144.4 million floating rate subordinated notes 2022 (issued June 2008; callable June 2022) | | | 152 | | | | — | |
| | | | | | | | | |
| National Westminster Bank Plc | | | | | | | | |
| US$1,000 million 7.375% subordinated notes 2009 | | | 697 | | | | 507 | |
| €600 million 6% subordinated notes 2010 | | | 623 | | | | 474 | |
| €500 million 5.125% subordinated notes 2011 | | | 488 | | | | 376 | |
| £300 million 7.875% subordinated notes 2015 | | | 379 | | | | 349 | |
| £300 million 6.5% subordinated notes 2021 | | | 376 | | | | 330 | |
| | | | | | | | | |
| Charter One Financial, Inc | | | | | | | | |
| US$400 million 6.375% subordinated notes 2012 | | | 287 | | | | 212 | |
| | | | | | | | | |
| Greenwich Capital Holdings, Inc | | | | | | | | |
| US$170 million subordinated loan capital floating rate notes 2009 | | | 116 | | | | 85 | |
| US$100 million 5.575% senior subordinated revolving credit 2009 | | | 69 | | | | 50 | |
| US$500 million subordinated loan capital floating rate notes 2010 (callable on any interest payment date) | | | 342 | | | | 249 | |
| | | | | | | | | |
| First Active Plc | | | | | | | | |
| £60 million 6.375% subordinated bonds 2018 (callable April 2013) | | | 66 | | | | 65 | |
Notes on the accounts continued | Financial statements |
2527 Subordinated liabilities (continued) continued
Dated loan capital (continued)
| | | | 2008 £m | | | | 2007 £m | |
| Other minority interest subordinated issues | | | 16 | | | | 16 | |
| | | | | | | | | |
| ABN AMRO and subsidiaries | | | | | | | | |
| €113 million 7.50% subordinated notes 2008 (redeemed January 2008) | | | — | | | | 83 | |
| €182 million 6.00% subordinated notes 2009 | | | 169 | | | | 132 | |
| €182 million 6.13% subordinated notes 2009 | | | 165 | | | | 127 | |
| €1,150 million 4.63% subordinated notes 2009 | | | 1,104 | | | | 848 | |
| €250 million 4.70% CMS linked subordinated notes 2019 | | | 195 | | | | 131 | |
| €800 million 6.25% subordinated notes 2010 | | | 795 | | | | 598 | |
| €100 million 5.13% flip flop Bermudan callable subordinated notes 2017 (callable December 2012) | | | 89 | | | | 75 | |
| €500 million floating rate Bermudan callable subordinated lower tier 2 notes 2018 (callable May 2013) | | | 455 | | | | 350 | |
| €1,000 million floating rate Bermudan callable subordinated lower tier 2 notes 2016 (callable September 2011) | | | 923 | | | | 710 | |
| €13 million zero coupon subordinated notes 2029 (callable June 2009) | | | 8 | | | | 2 | |
| €82 million floating rate subordinated notes 2017 | | | 72 | | | | 55 | |
| €103 million floating rate subordinated lower tier 2 notes 2020 | | | 89 | | | | 68 | |
| €170 million floating rate sinkable subordinated notes 2041 | | | 205 | | | | 184 | |
| €15 million CMS linked floating rate subordinated lower tier 2 notes 2020 | | | 10 | | | | 11 | |
| €1,500 million floating rate Bermudan callable subordinated lower tier 2 notes 2015 (callable June 2010) | | | 1,419 | | | | 1,087 | |
| €5 million floating rate Bermudan callable subordinated lower tier 2 notes 2015 (callable October 2010) | | | 5 | | | | 4 | |
| €65 million floating rate Bermudan callable subordinated lower tier 2 notes 2015 (callable October 2010) | | | 62 | | | | 48 | |
| US$12 million floating rate subordinated notes 2008 (redeemed June 2008) | | | — | | | | 6 | |
| US$12 million floating rate subordinated notes 2008 (redeemed June 2008) | | | — | | | | 6 | |
| US$165 million 6.14% subordinated notes 2019 | | | 152 | | | | 94 | |
| US$72 million 5.98% subordinated notes 2019 | | | 49 | | | | 7 | |
| US$500 million 4.65% subordinated notes 2018 | | | 359 | | | | 214 | |
| US$500 million floating rate Bermudan callable subordinated notes 2013 (redeemed September 2008) | | | — | | | | 232 | |
| US$1,500 million floating rate Bermudan callable subordinated notes 2015 (callable March 2010) | | | 982 | | | | 717 | |
| US$100 million floating rate Bermudan callable subordinated lower tier 2 notes 2015 (callable October 2010) | | | 68 | | | | 50 | |
| US$36 million floating rate Bermudan callable subordinated lower tier 2 notes 2015 (callable October 2010) | | | 25 | | | | 18 | |
| US$1,000 million floating rate Bermudan callable subordinated lower tier 2 notes 2017 (callable January 2012) | | | 661 | | | | 479 | |
| AUD575 million 6.50% Bermudan callable subordinated lower tier 2 notes 2018 (callable May 2013) | | | 286 | | | | 231 | |
| AUD175 million 7.46% Bermudan callable subordinated lower tier 2 notes 2018 (callable May 2013) | | | 79 | | | | 73 | |
| €26 million 7.42% subordinated notes 2016 | | | 28 | | | | 20 | |
| €7 million 7.38% subordinated notes 2016 | | | 8 | | | | 6 | |
| €256 million 5.25% subordinated notes 2008 (redeemed July 2008) | | | — | | | | 190 | |
| €13 million floating rate subordinated notes 2008 (redeemed June 2008) | | | — | | | | 9 | |
| £42 million 8.18% subordinated notes 2010 | | | 15 | | | | 19 | |
| £25 million 9.18% amortising MTN subordinated lower tier 2 notes 2011 | | | 9 | | | | 15 | |
| £750 million 5% Bermudan callable subordinated upper tier 2 notes 2016 | | | 728 | | | | 642 | |
| US$250 million 7.75% subordinated notes 2023 | | | 173 | | | | 127 | |
| US$150 million 7.13% subordinated notes 2093 | | | 104 | | | | 76 | |
| US$250 million 7.00% subordinated notes 2008 (redeemed April 2008) | | | — | | | | 127 | |
| US$68 million floating rate subordinated notes 2009 (6) | | | — | | | | 34 | |
| US$12 million floating rate subordinated notes 2009 (6) | | | — | | | | 6 | |
| BRL50 million floating rate subordinated notes 2013 (6) | | | — | | | | 14 | |
| BRL250 million floating rate subordinated notes 2013 (6) | | | — | | | | 71 | |
| BRL250 million floating rate subordinated notes 2014 (6) | | | — | | | | 71 | |
| BRL885 million floating rate subordinated notes 2014 (6) | | | — | | | | 251 | |
| BRL300 million floating rate subordinated notes 2014 (6) | | | — | | | | 85 | |
| PKR0.80 million floating rate subordinated notes 2012 | | | 7 | | | | 6 | |
| MYR200 million subordinated notes 2017 | | | 40 | | | | 30 | |
| TRY60 million subordinated notes | | | 34 | | | | 25 | |
| | | | 30,162 | | | | 23,065 | |
* | In addition the company has issued 0.5 million subordinated loan notes of €1,000 each, 1.95 million subordinated loan notes of US$1,000 each and 0.4 million subordinated loan notes of £1,000 each. These loan notes are included in the company balance sheet as loan capital but are reclassified as minority interest Trust Preferred Securities on consolidation (see Note 26). |
| | 2010 | 2009 | 2008 |
| | £m | £m | £m |
| First Active plc | | | |
| £60 million 6.375% subordinated bonds 2018 (callable April 2013) | 66 | 66 | 66 |
| | | | |
| RBS NV and subsidiaries | | | |
| €182 million 6.00% fixed rate subordinated notes 2009 | — | — | 169 |
| €182 million 6.13% fixed rate subordinated notes 2009 | — | — | 165 |
| €1,150 million 4.63% fixed rate subordinated notes 2009 | — | — | 1,104 |
| €250 million 4.70% CMS linked subordinated notes 2019 | 181 | 189 | 195 |
| €800 million 6.25% fixed rate subordinated notes 2010 (redeemed June 2010) | — | 733 | 795 |
| €100 million 5.13% flip flop Bermudan callable subordinated notes 2017 (callable December 2012) | 69 | 84 | 89 |
€500 million floating rate Bermudan callable subordinated lower tier 2 notes 2018 (callable May 2013) (6) | — | 426 | 455 |
€1,000 million floating rate Bermudan callable subordinated lower tier 2 notes 2016 (callable September 2011) (6) | — | 862 | 923 |
| €13 million zero coupon subordinated notes 2029 | 9 | 4 | 8 |
€82 million floating rate subordinated notes 2017 (6) | — | 68 | 72 |
€103 million floating rate subordinated lower tier 2 notes 2020 (6) | — | 83 | 89 |
| €170 million floating rate sinkable subordinated notes 2041 | 240 | 190 | 205 |
| €15 million CMS linked floating rate subordinated lower tier 2 notes 2020 | 10 | 10 | 10 |
| €1,500 million floating rate Bermudan callable subordinated lower tier 2 notes 2015 (callable March 2011) | 1,283 | 1,326 | 1,419 |
| €5 million floating rate Bermudan callable subordinated lower tier 2 notes 2015 (callable October 2011) | 4 | 4 | 5 |
€65 million floating rate Bermudan callable subordinated lower tier 2 notes 2015 (callable October 2010) (6) | — | 58 | 62 |
| US$165 million 6.14% subordinated notes 2019 | 104 | 132 | 152 |
| US$72 million 5.98% subordinated notes 2019 | 42 | 34 | 49 |
| US$500 million 4.65% subordinated notes 2018 | 326 | 293 | 359 |
| US$1,500 million floating rate Bermudan callable subordinated notes 2015 (callable March 2011) | 927 | 887 | 982 |
US$100 million floating rate Bermudan callable subordinated lower tier 2 notes 2015 (callable October 2010) (6) | — | 62 | 68 |
US$36 million floating rate Bermudan callable subordinated lower tier 2 notes 2015 (callable October 2010) (6) | — | 22 | 25 |
US$1,000 million floating rate Bermudan callable subordinated lower tier 2 notes 2017 (callable January 2012) (6) | — | 598 | 661 |
| AUD575 million 6.50% Bermudan callable subordinated lower tier 2 notes 2018 (callable May 2013) | 371 | 318 | 286 |
| AUD175 million floating rate Bermudan callable subordinated lower tier 2 notes 2018 (callable May 2013) | 111 | 93 | 79 |
| €26 million 7.42% subordinated notes 2016 | 26 | 27 | 28 |
| €7 million 7.38% subordinated notes 2016 | 7 | 7 | 8 |
| £42 million amortising MTN subordinated lower tier 2 notes 2010 (redeemed December 2010) | — | 7 | 15 |
| £25 million amortising MTN subordinated lower tier 2 notes 2011 (redeemed January 2011) | 3 | 8 | 9 |
£750 million 5% fixed rate Bermudan callable subordinated upper tier 2 notes 2016 (6) | — | 727 | 728 |
| US$250 million 7.75% fixed rate subordinated notes 2023 | 163 | 155 | 173 |
| US$150 million 7.13% fixed rate subordinated notes 2093 | 98 | 93 | 104 |
| PKR800 million floating rate subordinated notes 2012 | — | — | 7 |
| MYR200 million zero coupon subordinated notes 2017 | 42 | 36 | 40 |
| TRY60 million floating rate callable subordinated notes 2012 | — | — | 34 |
| | | | |
| Non-controlling interests subordinated issues | 20 | 12 | 16 |
| | 20,658 | 24,597 | 30,162 |
*In addition, the company has in issue €166 million (2009 - €166 million; 2008 - €500 million) subordinated loan notes of €1,000 each, US$633 million (2009 - US$827 million; 2008 - US$1,950 million) subordinated loan notes of US$1,000 each and £93 million (2009 - £93 million; 2008 - £400 million) subordinated loan notes of £1,000 each. These loan notes are included in the company balance sheet as loan capital but are reclassified as non-controlling interest trust preferred securities on consolidation (see Note 28).
| (1) | On-lent to The Royal Bank of Scotland plc on a subordinated basis. |
| (2) | Unconditionally guaranteed by the company. |
| (3) | In the event of certain changes in tax laws, dated loan capital issues may be redeemed in whole, but not in part, at the option of the issuer, at the principal amount thereof plus accrued interest, subject to prior regulatory approval. |
| (4) | Except as stated above, claims in respect of the Group’sGroup's dated loan capital are subordinated to the claims of other creditors. None of the Group’sGroup's dated loan capital is secured. |
| (5) | Interest on all floating rate subordinated notes is calculated by reference to market rates. |
| (6) | Transferred to Banco Santander S.A in July 2008.the Dutch State on legal separation of ABN AMRO Holding N.V. |
Notes on the accounts continued | Financial statements |
27 Subordinated liabilities continued
Undated loan capital
| | | | 2008 £m | | | | 2007 £m | |
| The company | | | | | | | | |
| US$350 million undated floating rate primary capital notes (callable on any interest payment date) (1) | | | 240 | | | | 175 | |
| US$1,200 million 7.648% perpetual regulatory tier one securities (callable September 2031) (1, 2) | | | 831 | | | | 606 | |
| | | | 1,071 | | | | 781 | |
| The Royal Bank of Scotland plc | | | | | | | | |
| £150 million 5.625% undated subordinated notes (callable June 2032) | | | 144 | | | | 144 | |
| £175 million 7.375% undated subordinated notes (callable August 2010) | | | 190 | | | | 183 | |
| €152 million 5.875% undated subordinated notes (redeemed October 2008) | | | — | | | | 114 | |
| £350 million 6.25% undated subordinated notes (callable December 2012) | | | 380 | | | | 354 | |
| £500 million 6% undated subordinated notes (callable September 2014) | | | 565 | | | | 517 | |
| €500 million 5.125% undated subordinated notes (callable July 2014) | | | 516 | | | | 371 | |
| €1,000 million floating rate undated subordinated notes (callable July 2014) | | | 966 | | | | 742 | |
| £500 million 5.125% undated subordinated notes (callable March 2016) | | | 556 | | | | 499 | |
| £200 million 5.625% subordinated upper tier 2 notes (callable September 2026) | | | 210 | | | | 210 | |
| £600 million 5.5% undated subordinated notes (callable December 2019) | | | 677 | | | | 595 | |
| £500 million 6.2% undated subordinated notes (callable March 2022) | | | 614 | | | | 543 | |
| £200 million 9.5% undated subordinated bonds (callable August 2018) (3) | | | 253 | | | | 228 | |
| £400 million 5.625% subordinated upper tier 2 notes (callable September 2026) | | | 397 | | | | 397 | |
| £300 million 5.625% undated subordinated notes (callable September 2026) | | | 431 | | | | 318 | |
| £350 million 5.625% undated subordinated notes (callable June 2032) | | | 364 | | | | 363 | |
| £400 million 5% undated subordinated notes (callable March 2011) | | | 424 | | | | 402 | |
| JPY25 billion 2.605% undated subordinates notes (callable November 2034) | | | 217 | | | | 103 | |
| CAD700 million 5.37% fixed rate undated subordinated notes (callable May 2016) | | | 464 | | | | 363 | |
| | | | | | | | | |
| National Westminster Bank Plc | | | | | | | | |
| US$500 million primary capital floating rate notes, Series A (callable on any interest payment date) | | | 343 | | | | 251 | |
| US$500 million primary capital floating rate notes, Series B (callable on any interest payment date) | | | 347 | | | | 256 | |
| US$500 million primary capital floating rate notes, Series C (callable on any interest payment date) | | | 346 | | | | 255 | |
| €400 million 6.625% fixed/floating rate undated subordinated notes (callable October 2009) | | | 388 | | | | 303 | |
| €100 million floating rate undated step-up notes (callable October 2009) | | | 97 | | | | 74 | |
| £325 million 7.625% undated subordinated step-up notes (callable January 2010) | | | 363 | | | | 357 | |
| £200 million 7.125% undated subordinated step-up notes (callable October 2022) | | | 201 | | | | 205 | |
| £200 million 11.5% undated subordinated notes (callable December 2022) (4) | | | 269 | | | | 269 | |
| | | | | | | | | |
| First Active plc | | | | | | | | |
| £20 million 11.75% perpetual tier two capital | | | 26 | | | | 23 | |
| €38 million 11.375% perpetual tier two capital | | | 52 | | | | 39 | |
| £1.3 million floating rate perpetual tier two capital | | | 2 | | | | 2 | |
| | | | | | | | | |
| ABN AMRO and subsidiaries | | | | | | | | |
| €9 million 4.650% perpetual convertible financing preference shares (redeemed October 2008) | | | — | | | | 7 | |
| €1,000 million 4.310% perpetual Bermudan callable subordinated tier 1 notes (callable March 2016) | | | 824 | | | | 598 | |
| | | | 11,697 | | | | 9,866 | |
| | 2010 | 2009 | 2008 |
| | £m | £m | £m |
| The company | | | |
US$106 million (2009 - US$163 million; 2008 - US$350 million) undated floating rate primary capital notes (callable on any interest payment date) (1,2) | 69 | 101 | 240 |
US$762 million (2009 - US$762 million; 2008 - US$1,200 million) 7.648% perpetual regulatory tier one securities (callable September 2031) (1,3,4) | 494 | 473 | 831 |
| | 563 | 574 | 1,071 |
| The Royal Bank of Scotland plc | | | |
£31 million (2009 - £96 million; 2008 - £175 million) 7.375% undated subordinated notes (callable August 2011) (1,2) | 31 | 101 | 190 |
£51 million (2009 - £117 million; 2008 - £350 million) 6.25% undated subordinated notes (callable December 2012) (1,2) | 55 | 126 | 380 |
£56 million (2009 - £138 million; 2008 - £500 million) 6% undated subordinated notes (callable September 2014) (1,2) | 61 | 143 | 565 |
€176 million (2009 - €197 million; 2008 - €500 million) 5.125% undated subordinated notes (callable July 2014) (1,2) | 166 | 194 | 516 |
€170 million (2009 - €243 million; 2008 - €1,000 million) floating rate undated subordinated notes (callable July 2014) (1,2) | 145 | 214 | 966 |
£54 million (2009 - £178 million; 2008 - £500 million) 5.125% undated subordinated notes (callable March 2016) (1,2) | 58 | 189 | 556 |
| £200 million 5.125% subordinated upper tier 2 notes (redeemed May 2010) | — | 210 | 210 |
£35 million (2009 - £260 million; 2008 - £600 million) 5.5% undated subordinated notes (callable December 2019) (1,2) | 35 | 272 | 677 |
£21 million (2009 - £174 million; 2008 - £500 million) 6.2% undated subordinated notes (callable March 2022) (1,2) | 43 | 206 | 614 |
£103 million (2009 - £145 million; 2008 - £200 million) 9.5% undated subordinated bonds (callable August 2018) (1,2,5) | 130 | 176 | 253 |
| £400 million 5.625% subordinated upper tier 2 notes | — | — | 397 |
£22 million (2009 - £83 million; 2008 - £300 million) 5.625% undated subordinated notes callable September 2026) (1,2) | 21 | 90 | 431 |
£19 million (2009 - £201 million; 2008 - £500 million) 5.625% undated subordinated notes (callable June 2032) (1,2) | 20 | 199 | 508 |
£1 million (2009 - £190 million; 2008 - £400 million) 5% undated subordinated notes (callable March 2011) (1,2) | 2 | 197 | 424 |
| JPY25 billion 2.605% undated subordinated notes (redeemed May 2010) | — | 173 | 217 |
CAD474 million (2009 and 2008 - CAD700 million) 5.37% fixed rate undated subordinated notes (callable May 2016) (2) | 340 | 452 | 464 |
| | | | |
| National Westminster Bank Plc | | | |
US$193 million (2009 - US$332 million; 2008 - US$500 million) primary capital floating rate notes, Series A (callable on any interest payment date) (1,2) | 124 | 205 | 343 |
US$229 million (2009 - US$293 million; 2008 - US$500 million) primary capital floating rate notes, Series B (callable on any interest payment date) (1,2) | 148 | 182 | 347 |
US$285 million (2009 - US$312 million; 2008 - US$500 million) primary capital floating rate notes, Series C (callable on any interest payment date) (1,2) | 184 | 192 | 346 |
€178 million (2009 and 2008 - €400 million) 6.625% fixed/floating rate undated subordinated notes (callable on any interest payment date) (2) | 154 | 358 | 388 |
€10 million (2009 and 2008 - €100 million) floating rate undated step-up notes (callable on any interest payment date) (2) | 9 | 90 | 97 |
£87 million (2009 - £162 million; 2008 - £325 million) floating undated subordinated step-up notes (callable January 2015) (1,2) | 89 | 174 | 363 |
£53 million (2009 - £127 million; 2008 - £200 million) 7.125% undated subordinated step-up notes (callable October 2022) (1,2) | 54 | 127 | 201 |
£35 million (2009 - £55 million; 2008 - £200 million) 11.5% undated subordinated notes (callable December 2022) (1,2,6) | 42 | 79 | 269 |
Notes on the accounts continued | Financial statements |
| | 2010 | 2009 | 2008 |
| | £m | £m | £m |
| First Active plc | | | |
| £20 million 11.75% perpetual tier two capital | 26 | 26 | 26 |
| €38 million 11.375% perpetual tier two capital | 50 | 51 | 52 |
| £1.3 million floating rate perpetual tier two capital | 2 | 2 | 2 |
| | | | |
| RBS NV and subsidiaries | | | |
€1,000 million 4.310% perpetual Bermudan callable subordinated tier 1 notes (callable March 2016) (10) | — | 834 | 824 |
€800 million 10.00% fixed perpetual mandatory convertible tier 1 notes 2099 (10) | — | 716 | — |
€967 million 10.00% fixed perpetual mandatory convertible tier 1 notes 2072 (10) | — | 866 | — |
€833 million 10.00% fixed perpetual mandatory convertible tier 1 notes 2073 (10) | — | 746 | — |
| | 2,552 | 8,164 | 11,697 |
| (1) | Partially repurchased following completion of the exchange and tender offers in April 2009. |
(1)(2) | Partially repurchased following completion of the exchange and tender offers in May 2010. |
| (3) | On-lent to The Royal Bank of Scotland plc on a subordinated basis. |
(2)(4) | The company can satisfy interest payment obligations by issuing sufficient ordinary shares to appointed Trustees to enable them, on selling these shares, to settle the interest payment. |
(3)(5) | Guaranteed by the company. |
(4)(6) | Exchangeable at the option of the issuer into 200 million 8.392% (gross) non-cumulative preference shares of £1 each of National Westminster Bank Plc at any time. |
(5)(7) | Except as stated above, claims in respect of the Group’sGroup's undated loan capital are subordinated to the claims of other creditors. None of the Group’sGroup's undated loan capital is secured. |
(6)(8) | In the event of certain changes in tax laws, undated loan capital issues may be redeemed in whole, but not in part, at the option of the Group, at the principal amount thereof plus accrued interest, subject to prior regulatory approval. |
(7)(9) | Interest on all floating rate subordinated notes is calculated by reference to market rates. |
| (10) | Transferred to the Dutch State on legal separation of ABN AMRO Holding N.V. |
25 Subordinated liabilities (continued)
Preference shares
| | | | 2008 £m | | | | 2007 £m | |
| The company | | | | | | | | |
| Non-cumulative preference shares of US$0.01 (1) | | | | | | | | |
| Series F US$200 million 7.65% (redeemable at option of issuer) | | | 137 | | | | 100 | |
| Series H US$300 million 7.25% (redeemable at option of issuer) | | | 205 | | | | 150 | |
| Series L US$850 million 5.75% (redeemable September 2009) | | | 582 | | | | 421 | |
| Non-cumulative convertible preference shares of US$0.01 (1) | | | | | | | | |
| Series 1 US$1,000 million 9.118% (redeemable March 2010) | | | 698 | | | | 510 | |
| Non-cumulative convertible preference shares of £0.01 (1) | | | | | | | | |
| Series 1 £200 million 7.387% (redeemable December 2010) | | | 211 | | | | 201 | |
| Cumulative preference shares of £1 | | | | | | | | |
| £0.5 million 11 % and £0.4 million 5.5% (non-redeemable) | | | 1 | | | | 1 | |
| | | | 1,834 | | | | 1,383 | |
| National Westminster Bank Plc | | | | | | | | |
| Non-cumulative preference shares of £1 | | | | | | | | |
| Series A £140 million 9% (non-redeemable) | | | 145 | | | | 143 | |
| Non-cumulative preference shares of US$25 | | | | | | | | |
| Series C US$300 million 7.7628% (2) | | | 215 | | | | 160 | |
| | | | 2,194 | | | | 1,686 | |
| | 2010 | 2009 | 2008 |
| | £m | £m | £m |
The company (1) | | | |
| Non-cumulative preference shares of US$0.01 | | | |
Series F US$156 million (2009 and 2008 - US$200 million) 7.65% (redeemable at option of issuer) (2) | 101 | 123 | 137 |
Series H US$242 million (2009 and 2008 - US$300 million) 7.25% (redeemable at option of issuer) (2) | 156 | 185 | 205 |
Series L US$751 million (2009 and 2008 - US$850 million) 5.75% (redeemable at option of issuer) (2) | 484 | 524 | 582 |
| | | | |
| Non-cumulative convertible preference shares of US$0.01 | | | |
Series 1 US$65 million (2009 and 2008 - US$1,000 million) 9.118% (redeemable at option of issuer) (3) | 43 | 630 | 698 |
| | | | |
| Non-cumulative convertible preference shares of £0.01 | | | |
Series 1 £15 million (2009 and 2008 - £200 million) 7.387% (redeemable at option of issuer) (3) | 15 | 199 | 211 |
| | | | |
| Cumulative preference shares of £1 | | | |
| £0.5 million 11% and £0.4 million 5.5% (non-redeemable) | 1 | 1 | 1 |
| | 800 | 1,662 | 1,834 |
| National Westminster Bank Plc | | | |
| Non-cumulative preference shares of £1 | | | |
| Series A £140 million 9% (non-redeemable) | 144 | 145 | 145 |
| | | | |
| Non-cumulative preference shares of US$25 | | | |
Series C US$246 million (2009 and 2008 - US$300 million) 7.7628% (2,4) | 168 | 193 | 215 |
| | 1,112 | 2,000 | 2,194 |
(1) | Further details of the contractual terms of the preference shares are given in Note 27 on page 229.29. |
| (2) | Partially repurchased following completion of the exchange and tender offers in May 2010. |
| (3) | Partially converted into ordinary shares in the company in 2010 (see Note 29). |
(2)
| (4) | Series C preference shares each carry a gross dividend of 8.625% inclusive of associated tax credit. Redeemable at the option of the issuer at par. |
Notes on the accounts continued | Financial statements |
27 Subordinated liabilities continued
Trust preferred securities
| | | | 2008 £m | | | | 2007 £m | |
| €1,250 million 6.467% (redeemable June 2012) (1) | | | 1,325 | | | | 979 | |
| US$750 million 6.8% (redeemable March 2008) (1) | | | 514 | | | | 374 | |
| US$850 million 4.709% (redeemable July 2013) (1) | | | 640 | | | | 421 | |
| US$650 million 6.425% (redeemable January 2034) (1) | | | 677 | | | | 344 | |
| | | | | | | | | |
| ABN AMRO and subsidiaries | | | | | | | | |
| US$1,285 million 6.03% Trust Preferred V | | | 760 | | | | 464 | |
| US$200 million 6.25% Trust Preferred VI | | | 121 | | | | 82 | |
| US$1,800 million 6.08% Trust Preferred VI I | | | 1,064 | | | | 762 | |
| | | | 5,101 | | | | 3,426 | |
| | 2010 | 2009 | 2008 |
| | £m | £m | £m |
€391 million (2009 - €391 million; 2008 - €1,250 million) 6.467% (redeemable June 2012) (1,2) | 339 | 362 | 1,325 |
US$486 million (2009 - US$486 million; 2008 - US$750 million) 6.8% (perpetual callable September 2009) (1,2) | 289 | 300 | 514 |
US$318 million (2009 - US$322 million; 2008 - US$850 million) 4.709% (redeemable July 2013) (1,2,3) | 190 | 196 | 640 |
US$394 million (2009 - US$394 million; 2008 - US$650 million) 6.425% (redeemable January 2034) (1,2) | 291 | 280 | 677 |
| | | | |
| RBS NV and subsidiaries | | | |
| US$1,285 million 5.90% Trust Preferred V | 633 | 696 | 760 |
| US$200 million 6.25% Trust Preferred VI | 100 | 107 | 121 |
| US$1,800 million 6.08% Trust Preferred VII | 889 | 950 | 1,064 |
| | 2,731 | 2,891 | 5,101 |
Notes:
(1) | The trust preferred securities issued by subsidiaries have no maturity date and are not redeemable at the option of the holders at any time. These securities may, with the consent of the UK Financial Services Authority, be redeemed, by the issuer on the dates specified above or on any interest payment date thereafter. They may also be redeemed in whole, but not in part, upon the occurrence of certain tax and regulatory events. Dividends are non-cumulative and may, subject to the restrictions described in (5) below, be paid provided distributable profits are sufficient unless payment would breach the capital adequacy requirements of the UK Financial Services Authority. Distributions are not made if dividends are not paid on any series of the company’s non-cumulative preference shares. The company classifies its obligations to these subsidiaries as dated loan capital. |
| (2) | Partially repurchased following completion of the exchange and tender offers in April 2009. |
| (3) | Partially repurchased following completion of the exchange and tender offers in May 2010. |
| (4) | Dividends are non-cumulative. They cannot be declared if RBS Holdings N.V. has not paid dividends on any parity securities. Distributions must be made, subject to the restrictions described in (5) below, if RBS Holdings N.V. pays a dividend on its ordinary shares or on its parity securities or redeems or repurchases such securities. |
| (5) | The trust preferred securities are subject to restrictions on dividend payments agreed with the European Commission (see Note 29). |
Notes on the accountscontinued | Financial statements |
26 Minority
28 Non-controlling interests
| | | ABN AMRO £m | | | Other interests £m | | | Total £m | | | ABN AMRO | | | Other interests | | | Total | |
| At 1 January 2007 | | — | | | 5,263 | | | 5,263 | | |
| | | | | £m | | | | £m | | | | £m | |
| At 1 January 2009 | | | | 16,183 | | | | 5,436 | | | | 21,619 | |
| Currency translation and other adjustments | | 1,694 | | | 140 | | | 1,834 | | | | (1,282 | ) | | | (152 | ) | | | (1,434 | ) |
| Acquisition of ABN AMRO | | 31,317 | | | 928 | | | 32,245 | | |
| Profit attributable to minority interests | | 10 | | | 153 | | | 163 | | |
| (Loss)/profit attributable to non-controlling interests | | | | | | | | | | | | | |
| - continuing operations | | | | (266 | ) | | | 648 | | | | 382 | |
| - discontinued operations | | | | (33 | ) | | | — | | | | (33 | ) |
| Dividends paid | | — | | | (121 | ) | | (121 | ) | | | — | | | | (313 | ) | | | (313 | ) |
| Losses on available-for-sale securities, net of tax | | (59 | ) | | (505 | ) | | (564 | ) | |
| Gains/(losses) on available-for-sale financial assets, net of tax | | | | 133 | | | | (336 | ) | | | (203 | ) |
| Movements in cash flow hedging reserves, net of tax | | 26 | | | — | | | 26 | | | | (150 | ) | | | — | | | | (150 | ) |
| Actuarial gains recognised in retirement benefit schemes, net of tax | | 19 | | | — | | | 19 | | | | 92 | | | | — | | | | 92 | |
| Equity raised | | 10 | | | 66 | | | 76 | | | | — | | | | 9 | | | | 9 | |
| Equity withdrawn | | (20 | ) | | (533 | ) | | (553 | ) | | | (9 | ) | | | (2,436 | ) | | | (2,445 | ) |
| At 31 December 2007 | | 32,997 | | | 5,391 | | | 38,388 | | |
| Transfer to retained earnings | | | | — | | | | (629 | ) | | | (629 | ) |
| At 1 January 2010 | | | | 14,668 | | | | 2,227 | | | | 16,895 | |
| Currency translation and other adjustments | | 8,098 | | | 1,158 | | | 9,256 | | | | (529 | ) | | | 63 | | | | (466 | ) |
| Acquisition of outstanding ABN AMRO ordinary shares | | 356 | | | — | | | 356 | | |
| (Loss)/profit attributable to minority interests | | (11,244 | ) | | 412 | | | (10,832 | ) | |
| (Loss)/profit attributable to non-controlling interests | | | | | | | | | | | | | |
- continuing operations | | | | (121 | ) | | | 61 | | | | (60 | ) |
- discontinued operations | | | | (605 | ) | | | — | | | | (605 | ) |
| Dividends paid | | — | | | (285 | ) | | (285 | ) | | | (4,028 | ) | | | (172 | ) | | | (4,200 | ) |
| Losses on available-for-sale securities, net of tax | | (144 | ) | | (1,303 | ) | | (1,447 | ) | |
| Losses on available-for-sale financial assets, net of tax | | | | (21 | ) | | | — | | | | (21 | ) |
| Movements in cash flow hedging reserves, net of tax | | (831 | ) | | — | | | (831 | ) | | | 955 | | | | — | | | | 955 | |
| Actuarial losses recognised in retirement benefit schemes, net of tax | | (478 | ) | | — | | | (478 | ) | |
| Equity raised | | — | | | 1,071 | | | 1,071 | | | | 501 | | | | 58 | | | | 559 | |
| Equity withdrawn | | (12,571 | ) | | (1,008 | ) | | (13,579 | ) | |
| At 31 December 2008 | | 16,183 | | | 5,436 | | | 21,619 | | |
| Equity withdrawn and disposals | | | | (10,525 | ) | | | (773 | ) | | | (11,298 | ) |
| Transfer to retained earnings | | | | — | | | | (40 | ) | | | (40 | ) |
| At 31 December 2010 | | | | 295 | | | | 1,424 | | | | 1,719 | |
ABN AMRO represents the other consortium members’Consortium Members' interests in RFS Holdings B.V. The capital and income rights of shares issued by RFS Holdings B.V. are linked to the net assets and income of the ABN AMRO business units which the individual consortium members haveConsortium Members agreed to acquire. The distribution to other Consortium Members of their respective interests occurred in 2010. Other minoritynon-controlling interests include trust preferred securities of £1,821£556 million (2007 –(2009 - £664 million; 2008 - £1,821 million) and in 2008 RBS China Sarl of £1,898 million (2007 – £2,438(£1,898 million). Equity withdrawn in respect of ABN AMRO relates to distributions to consortium members.Consortium Members.
Included in minoritynon-controlling interests are the following trust preferred securities (1):securities:
| | | 2010 | | | 2009 | | | 2008 | |
| | | | £m | | | | £m | | | | £m | |
US$357 million (2009 - US$357 million; 2008 - US$950 million) 5.512% (redeemable September 2014) (3) | | | 198 | | | | 198 | | | | 529 | |
US$276 million (2009 - US$470 million; 2008 - US$1,000 million) 3 month US$ LIBOR plus 0.80% (redeemable September 2014) (3,4) | | | 153 | | | | 261 | | | | 555 | |
€166 million (2009 - €166 million; 2008 - €500 million) 4.243% (redeemable January 2016) (3) | | | 112 | | | | 112 | | | | 337 | |
£93 million (2009 - £93 million; 2008 - £400 million) 5.6457% (redeemable June 2017) (3) | | | 93 | | | | 93 | | | | 400 | |
| | | | 556 | | | | 664 | | | | 1,821 | |
| | | | 2008 £m | | | | 2007 £m | |
| US$950 million 5.512% (redeemable September 2014) | | | 529 | | | | 529 | |
| US$1,000 million 3 month US$ LIBOR plus 0.80% (redeemable September 2014) | | | 555 | | | | 555 | |
| €500 million 4.243% (redeemable January 2016) | | | 337 | | | | 337 | |
| £400 million 5.6457% (redeemable June 2017) | | | 400 | | | | 400 | |
| | | | 1,821 | | | | 1,821 | |
| (1) | The trust preferred securities issued by subsidiaries have no maturity date and are not redeemable at the option of the holders at any time. These securities may, with the consent of the UK Financial Services Authority, be redeemed, in whole or in part, by the issuer on the dates specified above or on any interest payment date thereafter. They may also be redeemed in whole, but not in part, upon the occurrence of certain tax and regulatory events. Dividends are non-cumulative and discretionary. Distributions are not made if dividends are not paid on any series of the company’s non-cumulative preference shares. The company classifies its obligations to these subsidiaries as dated loan capital. |
| (2) | The trust preferred securities are subject to restrictions on dividend payments agreed with the European Commission (see Note 29). |
| (3) | Partially repurchased following completion of the exchange and tender offers in April 2009. |
| (4) | Partially repurchased following completion of the exchange and tender offers in May 2010. |
Notes on the accountscontinued | Financial statements |
| | | | Allotted, called up and fully paid | |
| | | Allotted, called up and fully paid | | | | | | 1 January 2010 | | | Issued during the year | | | Redeemed during the year | | | 31 December 2010 | |
| | | 1 January 2008 £m | | | Issued during the year £m | | | 31 December 2008 £m | | | 31 December 2008 £m | | | 31 December 2007 £m | | | | £m | | | | £m | | | | £m | | | | £m | |
| Ordinary shares of 25p | | 2,501 | | | 7,363 | | | 9,864 | | | 11,151 | | | 3,018 | | | | 14,091 | | | | 523 | | | | — | | | | 14,614 | |
| B shares of £0.01 | | | | 510 | | | | — | | | | — | | | | 510 | |
| Dividend access share of £0.01 | | | | — | | | | — | | | | — | | | | — | |
| Non-voting deferred shares of £0.01 | | 27 | | | — | | | 27 | | | 323 | | | 323 | | | | 27 | | | | — | | | | (27 | ) | | | — | |
| Additional Value Shares of £0.01 | | — | | | — | | | — | | | 27 | | | 27 | | | | — | | | | — | | | | — | | | | — | |
| Non-cumulative preference shares of US$0.01 | | 2 | | | — | | | 2 | | | 3 | | | 2 | | | | 2 | | | | — | | | | (1 | ) | | | 1 | |
| Non-cumulative convertible preference shares of US$0.01 | | — | | | — | | | — | | | — | | | — | | | | — | | | | — | | | | — | | | | — | |
| Non-cumulative preference shares of €0.01 | | — | | | — | | | — | | | — | | | — | | | | — | | | | — | | | | — | | | | — | |
| Non-cumulative convertible preference shares of €0.01 | | — | | | — | | | — | | | — | | | — | | | | — | | | | — | | | | — | | | | — | |
| Non-cumulative convertible preference shares of £0.25 | | — | | | — | | | — | | | 225 | | | 225 | | | | — | | | | — | | | | — | | | | — | |
| Non-cumulative convertible preference shares of £0.01 | | — | | | — | | | — | | | — | | | — | | | | — | | | | — | | | | — | | | | — | |
| Non-cumulative preference shares of £1 | | | | 1 | | | | — | | | | (1 | ) | | | — | |
| Cumulative preference shares of £1 | | 1 | | | — | | | 1 | | | 1 | | | 1 | | | | 1 | | | | — | | | | — | | | | 1 | |
| Non-cumulative preference shares of £1 | | 1 | | | 5 | | | 6 | | | 300 | | | 300 | | |
| | | Allotted, called up and fully paid | | | | | | Allotted, called up and fully paid | | | Authorised (1) | |
| Number of shares – thousands | | 2008 | | | 2007 | | | 2006 | | | 2008 | | | 2007 | | | 2006 | | |
| Number of shares - thousands | | | 2010 | | | 2009 | | | 2008 | | | 2008 | |
| Ordinary shares of 25p | | 39,456,005 | | | 10,006,215 | | | 3,152,844 | | | 44,603,278 | | | 12,070,492 | | | 5,079,375 | | | | 58,458,131 | | | | 56,365,721 | | | | 39,456,005 | | | | 44,603,278 | |
| B shares of £0.01 | | | | 51,000,000 | | | | 51,000,000 | | | | — | | | | — | |
Dividend access share of £0.01 (2) | | | | — | | | | — | | | | — | | | | — | |
| Non-voting deferred shares of £0.01 | | 2,660,556 | | | 2,660,556 | | | 2,660,556 | | | 32,300,000 | | | 32,300,000 | | | 32,300,000 | | | | — | | | | 2,660,556 | | | | 2,660,556 | | | | 32,300,000 | |
| Additional Value Shares of £0.01 | | — | | | — | | | — | | | 2,700,000 | | | 2,700,000 | | | 2,700,000 | | | | — | | | | — | | | | — | | | | 2,700,000 | |
| Non-cumulative preference shares of US$0.01 | | 308,015 | | | 308,015 | | | 240,000 | | | 516,000 | | | 419,500 | | | 419,500 | | | | 209,609 | | | | 308,015 | | | | 308,015 | | | | 516,000 | |
| Non-cumulative convertible preference shares of US$0.01 | | 1,000 | | | 1,000 | | | 1,000 | | | 3,900 | | | 3,900 | | | 3,900 | | | | 65 | | | | 1,000 | | | | 1,000 | | | | 3,900 | |
| Non-cumulative preference shares of €0.01 | | 2,526 | | | 2,526 | | | 2,500 | | | 66,000 | | | 66,000 | | | 66,000 | | | | 2,044 | | | | 2,526 | | | | 2,526 | | | | 66,000 | |
| Non-cumulative convertible preference shares of €0.01 | | — | | | — | | | — | | | 3,000 | | | 3,000 | | | 3,000 | | | | — | | | | — | | | | — | | | | 3,000 | |
| Non-cumulative convertible preference shares of £0.25 | | — | | | — | | | — | | | 900,000 | | | 900,000 | | | 900,000 | | | | — | | | | — | | | | — | | | | 900,000 | |
| Non-cumulative convertible preference shares of £0.01 | | 200 | | | 200 | | | 200 | | | 1,000 | | | 1,000 | | | 1,000 | | | | 15 | | | | 200 | | | | 200 | | | | 1,000 | |
| Non-cumulative preference shares of £1 | | | | 54 | | | | 750 | | | | 5,750 | | | | 300,000 | |
| Cumulative preference shares of £1 | | 900 | | | 900 | | | 900 | | | 900 | | | 900 | | | 900 | | | | 900 | | | | 900 | | | | 900 | | | | 900 | |
| Non-cumulative preference shares of £1 | | 5,750 | | | 750 | | | — | | | 300,000 | | | 300,000 | | | 300,000 | | |
Movement in ordinary shares in issue during the year:
| Movement in ordinary shares in issue - thousands | | NumberOrdinary shares of shares - thousands25p | |
At 1 January 20082009 | | | 10,006,215 | |
Shares issued in respect of the rights issue | | | 6,123,010 | |
Shares issued in respect of the capitalisation issue | | | 403,46839,456,005 | |
| Shares issued in respect of the placing and open offer | | | 22,909,77616,909,716 | |
Other sharesAt 1 January 2010 | | | 56,365,721 | |
| Shares issued | | | 13,5362,092,410 | |
At 31 December 20082010 | | | 39,456,00558,458,131 | |
| (1) | Prior to the Companies Act 2006, the authorised share capital of UK companies was divided between issued share capital and unissued share capital whose allotment was determined by the Articles of Association of a company and specific authorities granted to directors. Since 15 December 2009 when the company changed its constitution to reflect the Companies Act 2006, there is no authorised share capital. The meeting approving the changes also resolved to grant the directors the power to issue a nominal amount of £1,610 million B shares of 1p each and £44,250 million ordinary shares of 25p each in connection with the company's participation in the UK Government's Asset Protection Scheme. |
| (2) | One dividend access share in issue. |
Notes on the accountscontinued | Financial statements |
Ordinary shares
In June 2008,During the company issued 6,123year, the ordinary share capital was increased by 3.7 million ordinary shares of 25p each at 200p per share by way ofallotted as a rights issue. The rights issue was on the basisresult of 11 new shares for every 18 shares held on 9 May 2008. The net proceeds were £12 billion.
In September 2008, the company issued 403 million ordinary shares of 25p each by way of a capitalisation issue. The capitalisation was on the basis of one new share for every 40 shares held by shareholders on 12 September 2008.
In December 2008, the company issued 22,910 million ordinary shares of 25p each at 65.5p per share through a placing and open offer. This placing and open offer, which was fully underwritten by HM Treasury, was made available to shareholders on 31 October 2008. The net proceeds were £14.7 billion.
In addition, 13.5 million ordinary shares were issued during the year ended 31 December 2008 following the exercise of options under the company’s share schemes.
Total consideration, including the rights issue and placing and open offer identified above, of £27.3 billion was received on the issue of ordinary shares for cash.
During the year ended 31 December 2008, options were granted over 187.7 million ordinary shares under the company’scompany's executive and sharesave schemes. At 31 December 2008, options granted under the company’s various schemes, exercisable up to 2018 at prices ranging from 189p to 586p per share, were outstanding in respect of 181.9 million ordinary shares.plans.
On 16 January 2009, further options were granted over 1,176.1 million ordinary shares under the company’s sharesave scheme.
In addition, options granted under the NatWest executive scheme were outstanding in respect of 0.8 million ordinary shares exercisable up to 2009 at prices ranging from 248p to 258p per share.
Employee share trusts purchased 54.0 million1.6 billion ordinary shares at a cost of £63.7£672 million and awarded 3.317.9 million ordinary shares on receipt of £0.9£0.5 million on the exercise of awards under employee share schemes.plans.
The employee share trusts incurred costs of £0.3£3.7 million in purchasing the company’scompany's ordinary shares.
PreferenceIn March 2010, the company converted 935,228 non-cumulative convertible preference shares of US$0.01 into ordinary shares resulting in approximately 1.6 billion ordinary shares being issued.
In December 2008,2010, the company issued 5 million Series 2 non- cumulativeconverted 185,134 non-cumulative convertible preference shares of £1 at £1,000 each, the net proceeds£0.01 into ordinary shares resulting in approximately 487 million ordinary shares being £5 billion.issued.
On 19 JanuaryB shares and dividend access share
In December 2009, the Group announced that it had reachedcompany entered into an acquisition and contingent capital agreement with HM Treasury. HM Treasury agreed to acquire at 50p per share 51 billion B shares with a nominal value of 1p each and a dividend access share with a nominal value of 1p; these shares were issued to HM Treasury on 22 December 2009. Net proceeds were £25.1 billion. HM Treasury also agreed to subscribe for up to 16 billion further B shares with a nominal value of 1p each at 50p per share subject to certain conditions including the Group's Core Tier 1 capital ratio falling below 5%. The fair value of the consideration payable by the company on entering into this agreement amounted to £1,458 million; of this £1,208 million was debited to the contingent capital reserve.
The B shares do not generally carry voting rights at general meetings of ordinary shareholders. Each B share is entitled to the same cash dividend as an ordinary share (subject to anti-dilution adjustments). The B shares may be converted into ordinary shares at a fixed ratio of issue price (50p) divided by the conversion price (50p subject to anti-dilution adjustments) at the option of the holder at any time after issue.
HM Treasury has agreed not to convert its B shares into ordinary shares to the extent that its holding of ordinary shares following the conversion would represent more than 75% of the company's issued ordinary share capital.
The dividend access share entitles the holder to dividends equal to the greater of 7% of the aggregate issue price of B shares issued to HM Treasury and UK Financial Investments to replace the £5 billion of preference shares it holds with new ordinary shares. The offer250% of the newordinary dividend rate multiplied by the number of B shares issued, less any dividends paid on the B shares and on ordinary shares issued on conversion. Dividends on the dividend access share are discretionary unless a dividend has been paid on the ordinary shares, in which case dividends became mandatory. The dividend access share does not generally carry voting rights at general meetings of ordinary shareholders and redemptionis not convertible into ordinary shares.
The contingent capital commitment agreement can be terminated in whole or in part by the company, with the FSA's consent, at any time. It expires at the end of five years or, if earlier, on its termination in full.
Non-voting deferred shares
In November 2010, the preferencecompany cancelled all of its outstanding Non-voting deferred shares are subject to shareholder approval at an Extraordinary General Meeting.of £0.01 each, all of which were held by a nominee company wholly owned by the Group.
Preference shares
Under IFRS certain of the Group’sGroup's preference shares are classified as debt and are included in subordinated liabilities on the balance sheet.
Other securities
Certain of the Group’sGroup's subordinated securities in the legal form of debt are classified as equity under IFRS.
These securities entitle the holders to interest which may be deferred at the sole discretion of the company. Repayment of the securities is at the sole discretion of the company on giving between 30 and 60 days notice.
Notes on the accountscontinued | Financial statements |
29 Share capital continued
Non-cumulative preference shares
Non-cumulative preference shares entitle the holders thereof (subject to the terms of issue) to receive periodic non-cumulative cash dividends at specified fixed rates for each Series payable out of distributable profits of the company.
The non-cumulative preference shares are redeemable at the option of the company, in whole or in part from time to time at the rates detailed on the next pagebelow plus dividends otherwise payable for the then current dividend period accrued to the date of redemption.
| Class of preference share | | Number of shares in issue | | Interest rate | | Redemption date on or after | | Redemption price per share | | Debt/equity (1) | |
| Non-cumulative preference shares of US$0.01 | | | | | | | | | | | |
| Series F | | 6.3 million | | 7.65% | | 31 March 2007 | | US$25 | | Debt | |
| Series H | | 9.7 million | | 7.25% | | 31 March 2004 | | US$25 | | Debt | |
| Series L | | 30.0 million | | 5.75% | | 30 September 2009 | | US$25 | | Debt | |
| Series M | | 23.1 million | | 6.4% | | 30 September 2009 | | US$25 | | Equity | |
| Series N | | 22.1 million | | 6.35% | | 30 June 2010 | | US$25 | | Equity | |
| Series P | | 9.9 million | | 6.25% | | 31 December 2010 | | US$25 | | Equity | |
| Series Q | | 20.6 million | | 6.75% | | 30 June 2011 | | US$25 | | Equity | |
| Series R | | 10.2 million | | 6.125% | | 30 December 2011 | | US$25 | | Equity | |
| Series S | | 26.4 million | | 6.6% | | 30 June 2012 | | US$25 | | Equity | |
| Series T | | 51.2 million | | 7.25% | | 31 December 2012 | | US$25 | | Equity | |
| Series U | | 10,130 | | 7.64% | | 29 September 2017 | | US$100,000 | | Equity | |
| | | | | | | | | | | | |
| Non-cumulative convertible preference shares of US$0.01 | | | | | | | | | | | |
| Series 1 | | 64,772 | | 9.118% | | 31 March 2010 | | US$1,000 | | Debt | |
| | | | | | | | | | | | |
| Non-cumulative preference shares of €0.01 | | | | | | | | | | | |
| Series 1 | | 1.25 million | | 5.5% | | 31 December 2009 | | €1,000 | | Equity | |
| Series 2 | | 784,989 | | 5.25% | | 30 June 2010 | | €1,000 | | Equity | |
| Series 3 | | 9,429 | | 7.0916% | | 29 September 2017 | | €50,000 | | Equity | |
| | | | | | | | | | | | |
| Non-cumulative convertible preference shares of £0.01 | | | | | | | | | | | |
| Series 1 | | 14,866 | | 7.387% | | 31 December 2010 | | £1,000 | | Debt | |
| | | | | | | | | | | | |
| Non-cumulative preference shares of £1 | | | | | | | | | | | |
| Series 1 | | 54,442 | | 8.162% | | 5 October 2012 | | £1,000 | | Equity | |
27 Share capital (continued)
| Class of preference share | Number of shares in issue | Interest rate | Redemption date on or after | Redemption price per share | Debt or equity(1) |
| Non-cumulative preference shares of US$0.01 | | | | | |
| Series F | 8 million | 7.65% | 31 March 2007 | US$25 | Debt |
| Series H | 12 million | 7.25% | 31 March 2004 | US$25 | Debt |
| Series L | 34 million | 5.75% | 30 September 2009 | US$25 | Debt |
| Series M | 37 million | 6.4% | 30 September 2009 | US$25 | Equity |
| Series N | 40 million | 6.35% | 30 June 2010 | US$25 | Equity |
| Series P | 22 million | 6.25% | 31 December 2010 | US$25 | Equity |
| Series Q | 27 million | 6.75% | 30 June 2011 | US$25 | Equity |
| Series R | 26 million | 6.125% | 30 December 2011 | US$25 | Equity |
| Series S | 38 million | 6.6% | 30 June 2012 | US$25 | Equity |
| Series T | 64 million | 7.25% | 31 December 2012 | US$25 | Equity |
| Series U | 15,000 | 7.64% | 29 September 2017 | US$100,000 | Equity |
| Non-cumulative convertible preference shares of US$0.01 | | | | | |
| Series 1 | 1 million | 9.118% | 31 March 2010 | US$1,000 | Debt |
| Non-cumulative preference shares of €0.01 | | | | | |
| Series 1 | 1.25 million | 5.5% | 31 December 2009 | €1,000 | Equity |
| Series 2 | 1.25 million | 5.25% | 30 June 2010 | €1,000 | Equity |
| Series 3 | 26,000 | 7.0916% | 29 September 2017 | €50,000 | Equity |
| Non-cumulative convertible preference shares of £0.01 | | | | | |
| Series 1 | 200,000 | 7.387% | 31 December 2010 | £1,000 | Debt |
| Non-cumulative preference shares of £1 | | | | | |
| Series 1 | 750,000 | 8.162% | 5 October 2012 | £1,000 | Equity |
| Series 2 | 5 million | 12% | 2 December 2013 | £1,000 | Equity |
Note:
| (1) | Those preference shares where the Group has an obligation to pay dividends are classified as debt; those where distributions are discretionary are classified as equity. The conversion rights attaching to the convertible preference shares may result in the Group delivering a variable number of equity shares to preference shareholders; these convertible preference shares are treated as debt. |
(2)Notes on the accountscontinued | The whole of each series of preference share is issued or redeemed at the same time.Financial statements |
In the event that the non-cumulative convertible preference shares are not redeemed on or before the redemption date, the holder may convert them into ordinary shares in the company.company at the prevailing market price.
Under existing arrangements, no redemption or purchase of any non-cumulative preference shares may be made by the company without the prior consent of the UK Financial Services Authority.
On a winding-up or liquidation of the company, the holders of the non-cumulative preference shares will be entitled to receive, out of any surplus assets available for distribution to the company’scompany's shareholders (after payment of arrears of dividends on the cumulative preference shares up to the date of repayment) pari passu with the cumulative preference shares and all other shares of the company ranking pari passu with the non-cumulative preference shares as regards participation in the surplus assets of the company, a liquidation distribution per share equal to the applicable redemption price detailed in the table above, together with an amount equal to dividends for the then current dividend period accrued to the date of payment, before any distribution or payment may be made to holders of the ordinary shares as regards participation in the surplus assets of the company.
Except as described above, the holders of the non-cumulative preference shares have no right to participate in the surplus assets of the company.
Holders of the non-cumulative preference shares are not entitled to receive notice of or attend general meetings of the company except if any resolution is proposed for adoption by the shareholders of the company to vary or abrogate any of the rights attaching to the non- cumulativenon-cumulative preference shares or proposing the winding-up or liquidation of the company. In any such case, they are entitled to receive notice of and to attend the general meeting of shareholders at which such resolution is to be proposed and are entitled to speak and vote on such resolution (but not on any other resolution). In addition, in the event that, prior to any general meeting of shareholders, the company has failed to pay in full the three most recent quarterly dividend payments due on the non-cumulative dollar preference shares (other than Series U), the two most recent semi-annual dividend payments due on the non-cumulative convertible dollar preference shares and the most recent dividend payments due on the non-cumulative euro preference shares, the non- cumulativenon-cumulative sterling preference shares, the Series U non-cumulative dollar preference shares and the non-cumulative convertible sterling preference shares, the holders shall be entitled to receive notice of, attend, speak and vote at such meeting on all matters together with the holders of the ordinary shares. In these circumstances only, the rights of the holders of the non-cumulative preference shares so to vote shall continue until the company shall have resumed the payment in full of the dividends in arrears.
The series 2 non-cumulativeGroup has undertaken that, unless otherwise agreed with the European Commission, neither the company nor any of its direct or indirect subsidiaries (excluding companies in the RBS Holdings N.V. Group, which are subject to different restrictions) will pay external investors any dividends or coupons on existing hybrid capital instruments (including preference shares, B shares and upper and lower tier 2 instruments) from 30 April 2010 for a period of £1 each weretwo years thereafter ("the Deferral Period"), or exercise any call rights in relation to these capital instruments between 24 November 2009 and the end of the Deferral Period, unless there is a legal obligation to do so. Hybrid capital instruments issued to HM Treasury. The company,after 24 November 2009 will generally not be subject to shareholder approval, intends to issue new ordinary shares by way of an open offer, the proceeds will be used to repay the preference shares, issued to HM Treasury, together with the accrued dividend.restriction on dividend or coupon payments or call options. | | | | | | | |
| | | | 2008 £m | | | | 2007 £m | | | | 2006 £m | | | | 2008 £m | | | | 2007 £m | | | | 2006 £m | |
| Called-up share capital | | | | | | | | | | | | | | | | | | | | | | | | |
| At 1 January | | | 2,530 | | | | 815 | | | | 826 | | | | 2,530 | | | | 815 | | | | 826 | |
| Ordinary shares issued in respect of rights issue | | | 1,531 | | | | — | | | | — | | | | 1,531 | | | | — | | | | — | |
| Ordinary shares issued in respect of capitalisation issue | | | 101 | | | | — | | | | — | | | | 101 | | | | — | | | | — | |
| Ordinary shares issued in respect of placing and open offer | | | 5,728 | | | | — | | | | — | | | | 5,728 | | | | — | | | | — | |
| Preference shares issued in respect of placing and open offer | | | 5 | | | | — | | | | — | | | | 5 | | | | — | | | | — | |
| Other shares issued | | | 3 | | | | 139 | | | | 2 | | | | 3 | | | | 139 | | | | 2 | |
| Bonus issue of ordinary shares | | | — | | | | 1,576 | | | | — | | | | — | | | | 1,576 | | | | — | |
| Shares repurchased | | | — | | | | — | | | | (13 | ) | | | — | | | | — | | | | (13 | ) |
| At 31 December | | | 9,898 | | | | 2,530 | | | | 815 | | | | 9,898 | | | | 2,530 | | | | 815 | |
| Paid-in equity | | | | | | | | | | | | | | | | | | | | | | | | |
| At 1 January | | | 1,073 | | | | — | | | | — | | | | 1,073 | | | | — | | | | — | |
| Securities issued during the year | | | — | | | | 1,073 | | | | — | | | | — | | | | 1,073 | | | | — | |
| At 31 December | | | 1,073 | | | | 1,073 | | | | — | | | | 1,073 | | | | 1,073 | | | | — | |
| Share premium account | | | | | | | | | | | | | | | | | | | | | | | | |
| At 1 January | | | 17,322 | | | | 12,482 | | | | 11,777 | | | | 17,322 | | | | 12,482 | | | | 11,777 | |
| Ordinary shares issued in respect of rights issue, | | | | | | | | | | | | | | | | | | | | | | | | |
| net of £246 million expenses | | | 10,469 | | | | — | | | | — | | | | 10,469 | | | | — | | | | — | |
| Ordinary shares issued in respect of capitalisation issue | | | (101 | ) | | | — | | | | — | | | | (101 | ) | | | — | | | | — | |
| Expenses of placing and open offer | | | (265 | ) | | | — | | | | — | | | | (265 | ) | | | — | | | | — | |
| Other shares issued | | | 46 | | | | 6,257 | | | | 815 | | | | 46 | | | | 6,257 | | | | 815 | |
| Bonus issue of ordinary shares | | | — | | | | (1,576 | ) | | | — | | | | — | | | | (1,576 | ) | | | — | |
| Redemption of preference shares classified as debt | | | — | | | | 159 | | | | 271 | | | | — | | | | 159 | | | | 271 | |
| Shares repurchased | | | — | | | | — | | | | (381 | ) | | | — | | | | — | | | | (381 | ) |
| At 31 December | | | 27,471 | | | | 17,322 | | | | 12,482 | | | | 27,471 | | | | 17,322 | | | | 12,482 | |
| Merger reserve | | | | | | | | | | | | | | | | | | | | | | | | |
| At 1 January | | | 10,881 | | | | 10,881 | | | | 10,881 | | | | — | | | | — | | | | — | |
| Placing and open offer | | | 14,273 | | | | — | | | | — | | | | 14,273 | | | | — | | | | — | |
| Transfer to retained earnings | | | (14,273 | ) | | | — | | | | — | | | | (14,273 | ) | | | — | | | | — | |
| At 31 December | | | 10,881 | | | | 10,881 | | | | 10,881 | | | | — | | | | — | | | | — | |
| Available-for-sale reserve | | | | | | | | | | | | | | | | | | | | | | | | |
| At 1 January | | | 1,032 | | | | 1,528 | | | | (73 | ) | | | — | | | | — | | | | — | |
| Unrealised (losses)/gains in the year | | | (6,808 | ) | | | (191 | ) | | | 2,609 | | | | — | | | | — | | | | — | |
| Realised losses/(gains) in the year | | | 842 | | | | (513 | ) | | | (313 | ) | | | — | | | | — | | | | — | |
| Tax | | | 1,373 | | | | 208 | | | | (695 | ) | | | — | | | | — | | | | — | |
| At 31 December | | | (3,561 | ) | | | 1,032 | | | | 1,528 | | | | — | | | | — | | | | — | |
| Cash flow hedging reserve | | | | | | | | | | | | | | | | | | | | | | | | |
| At 1 January | | | (555 | ) | | | (149 | ) | | | 59 | | | | (5 | ) | | | (7 | ) | | | (9 | ) |
| Amount recognised in equity during the year | | | (603 | ) | | | (460 | ) | | | (109 | ) | | | — | | | | — | | | | — | |
| Amount transferred from equity to earnings in the year (1) | | | 198 | | | | (138 | ) | | | (140 | ) | | | 2 | | | | 3 | | | | 3 | |
| Tax | | | 84 | | | | 192 | | | | 41 | | | | (1 | ) | | | (1 | ) | | | (1 | ) |
| At 31 December | | | (876 | ) | | | (555 | ) | | | (149 | ) | | | (4 | ) | | | (5 | ) | | | (7 | ) |
| Foreign exchange reserve | | | | | | | | | | | | | | | | | | | | | | | | |
| At 1 January | | | (426 | ) | | | (872 | ) | | | 469 | | | | — | | | | — | | | | — | |
| Retranslation of net assets | | | 11,970 | | | | 1,339 | | | | (2,159 | ) | | | — | | | | — | | | | — | |
| Foreign currency (losses)/gains on hedges of net assets (2) | | | (5,801 | ) | | | (963 | ) | | | 818 | | | | — | | | | — | | | | — | |
| Tax | | | 642 | | | | 70 | | | | — | | | | — | | | | — | | | | — | |
| At 31 December | | | 6,385 | | | | (426 | ) | | | (872 | ) | | | — | | | | — | | | | — | |
| Capital redemption reserve | | | | | | | | | | | | | | | | | | | | | | | | |
| At 1 January | | | 170 | | | | 170 | | | | 157 | | | | 170 | | | | 170 | | | | 157 | |
| Shares repurchased during the year | | | — | | | | — | | | | 13 | | | | — | | | | — | | | | 13 | |
| At 31 December | | | 170 | | | | 170 | | | | 170 | | | | 170 | | | | 170 | | | | 170 | |
(1) | Of the amount transferred to earnings, £198 million (2007 – £138 million; 2006 – £140 million) was recorded in net interest income and nil (2007 and 2006 – nil) in other operating income. |
(2) | The hedging instruments in the majority of the Group’s net investment hedges are foreign currency borrowings, the effectiveness of these hedges is assessed prospectively (and on an ongoing basis) by comparing expected (actual) changes in the fair value of the currency net investments in foreign operations and expected (actual) changes in the fair value of the external currency liabilities (excluding accrued interest) attributable to changes in the spot exchange rate between the currency of the investment and sterling. |
28 Owners’ equity (continued)
| | | Group | | | Company | |
| | | | 2008 £m | | | | 2007 £m | | | | 2006 £m | | | | 2008 £m | | | | 2007 £m | | | | 2006 £m | |
| Retained earnings | | | | | | | | | | | | | | | | | | | | | | | | |
| At 1 January | | | 21,072 | | | | 15,487 | | | | 11,346 | | | | 3,787 | | | | 4,737 | | | | 4,794 | |
(Loss)/profit attributable to ordinary and equity preference shareholders | | | (23,541 | ) | | | 7,549 | | | | 6,393 | | | | (9,602 | ) | | | 2,499 | | | | 3,499 | |
| Ordinary dividends paid | | | (2,312 | ) | | | (3,044 | ) | | | (2,470 | ) | | | (2,312 | ) | | | (3,044 | ) | | | (2,470 | ) |
| Equity preference dividends paid | | | (536 | ) | | | (246 | ) | | | (191 | ) | | | (536 | ) | | | (246 | ) | | | (191 | ) |
| Paid-in equity dividends paid, net of tax | | | (60 | ) | | | — | | | | — | | | | (60 | ) | | | — | | | | — | |
Shares repurchased during the year | | | — | | | | — | | | | (624 | ) | | | — | | | | — | | | | (624 | ) |
| Redemption of preference shares classified as debt | | | — | | | | (159 | ) | | | (271 | ) | | | — | | | | (159 | ) | | | (271 | ) |
| Transfer from merger reserve | | | 14,273 | | | | — | | | | — | | | | 14,273 | | | | — | | | | — | |
Actuarial (losses)/gains recognised in retirement benefit schemes, net of tax | | | (1,335 | ) | | | 1,517 | | | | 1,262 | | | | — | | | | — | | | | — | |
| Net cost of shares bought and used to satisfy share-based payments | | | (19 | ) | | | (40 | ) | | | (38 | ) | | | — | | | | — | | | | | |
| Share-based payments, net of tax | | | — | | | | 8 | | | | 80 | | | | — | | | | — | | | | — | |
| At 31 December | | | 7,542 | | | | 21,072 | | | | 15,487 | | | | 5,550 | | | | 3,787 | | | | 4,737 | |
| | | | | | | | | | | | | | | | | | | | | | | | | |
| Own shares held | | | | | | | | | | | | | | | | | | | | | | | | |
| At 1 January | | | (61 | ) | | | (115 | ) | | | (7 | ) | | | — | | | | — | | | | (7 | ) |
| Shares purchased during the year | | | (64 | ) | | | (65 | ) | | | (254 | ) | | | — | | | | — | | | | — | |
| Shares issued under employee share schemes | | | 21 | | | | 119 | | | | 146 | | | | — | | | | — | | | | 7 | |
| At 31 December | | | (104 | ) | | | (61 | ) | | | (115 | ) | | | — | | | | — | | | | — | |
| | | | | | | | | | | | | | | | | | | | | | | | | |
| Owners’ equity at 31 December | | | 58,879 | | | | 53,038 | | | | 40,227 | | | | 44,158 | | | | 24,877 | | | | 18,197 | |
The30 Reserves
On 1 January 2008, the merger reserve comprisescomprised the premium on shares issued to acquire NatWest less goodwill amortisation charged under previous GAAP. No share premium was recorded in the company financial statements through the operation of the merger relief provisions of the Companies Act 1985.
UK law prescribes that only the reserves of the company are taken into account for the purpose of making distributions and in determining the permissible applications of the share premium account.
The Group optimises capital efficiency by maintaining reserves in subsidiaries, including regulated entities. Certain preference shares and subordinated debt are also included within regulatory capital. The remittance of reserves to the company or the redemption of shares or subordinated capital by regulated entities may be subject to maintaining the capital resources required by the relevant regulator.
At 31 December 2008, 61,165,254 (2007 – 10,474,782) ordinary shares of 25p each of the company were held by Employee Share Trusts in respect of share awards and options granted to employees.
Paid-in equity represents notes issued under the company’scompany's euro medium term note programme with an initial par value of US$1,600 million and CAD600 million that are classified as equity under IFRS. The notes attract coupons of 6.99% and 6.666% respectively until October 2017 when they change to 2.67% above the London interbank offered rate for 3-month US dollar deposits and 2.76% above the Canadian dollar offered rate respectively. Paid-in equity of US$1,036 million was repurchased in April 2009 and CAD279 million was repurchased in May 2010 as part of the liability management exercises.
Under the arrangements for the placing and open offer in December 2008, the company issued shares in exchange for shares in Encuentro Limited. No share premium was recorded in the company financial statements through the operation of the merger relief provisions of the Companies Act 1985.2006. The subsequent redemption of these shares gave rise to distributable profits of £14,273 million which have beenwere transferred from merger reserve to retained earnings.
Under the arrangements for accession to APS in December 2009, the company issued B shares in exchange for shares in Aonach Mor Limited. No share premium was recorded in the company financial statements through the operation of the merger relief provisions of the Companies Act 2006. The subsequent redemption of some of these shares gave rise to distributable profits of £12,250 million (2009 - £9,950 million) which were transferred from merger reserve to retained earnings.
At 31 December 2010, 1,717,095,004 (2009 - 138,695,912) ordinary shares of 25p each of the company were held by Employee Share Trusts in respect of share awards and options granted to employees.
Notes on the accountscontinued | Financial statements |
31 Leases
| | | Group | |
| Year in which receipt will occur | | Finance lease contracts and hire purchase agreements | | Operating lease assets: | |
| | Gross amounts £m | | Present value adjustments £m | | Other movements £m | | Present value £m | Future minimum lease rentals £m | |
| 2010 | | | | | | | | | |
| Within 1 year | | 3,559 | | (309) | | (20) | | 3,230 | | 997 | |
| After 1 year but within 5 years | | 7,833 | | (795) | | (245) | | 6,793 | | 2,388 | |
| After 5 years | | 7,843 | | (2,763) | | (263) | | 4,817 | | 998 | |
| Total | | 19,235 | | (3,867) | | (528) | | 14,840 | | 4,383 | |
| | | | | | | | | | | | |
| 2009 | | | | | | | | | |
| Within 1 year | | 3,617 | | (534) | | (30) | | 3,053 | | 781 | |
| After 1 year but within 5 years | | 8,582 | | (1,890) | | (212) | | 6,480 | | 2,514 | |
| After 5 years | | 11,251 | | (2,461) | | (334) | | 8,456 | | 1,018 | |
| Total | | 23,450 | | (4,885) | | (576) | | 17,989 | | 4,313 | |
| | | | | | | | | | | | |
| 2008 | | | | | | | | | |
| Within 1 year | | 3,783 | | (784) | | (24) | | 2,975 | | 918 | |
| After 1 year but within 5 years | | 9,843 | | (2,288) | | (162) | | 7,393 | | 2,479 | |
| After 5 years | | 12,962 | | (3,124) | | (385) | | 9,453 | | 1,141 | |
| Total | | 26,588 | | (6,196) | | (571) | | 19,821 | | 4,538 | |
| | | Group | |
| | | 2010 | | | 2009 | | | 2008 | |
| | | | £m | | | | £m | | | | £m | |
| Nature of operating lease assets on the balance sheet | | | | | | | | | | | | |
| Transportation | | | 6,162 | | | | 6,039 | | | | 5,883 | |
| Cars and light commercial vehicles | | | 1,016 | | | | 1,352 | | | | 1,199 | |
| Other | | | 208 | | | | 403 | | | | 617 | |
| | | | 7,386 | | | | 7,794 | | | | 7,699 | |
| | | | | | | | | | | | | |
| Amounts recognised as income and expense | | | | | | | | | | | | |
| Finance leases - contingent rental income | | | (160 | ) | | | (139 | ) | | | (37 | ) |
| Operating leases - minimum rentals payable | | | 519 | | | | 556 | | | | 566 | |
| | | | | | | | | | | | | |
| Finance lease contracts and hire purchase agreements | | | | | | | | | | | | |
| Accumulated allowance for uncollectable minimum receivables | | | 401 | | | | 313 | | | | 213 | |
Notes on the accountscontinued | Financial statements |
Minimum amounts receivable and payable under non-cancellable leases.
| | | Group | |
| | | Year in which receipt or payment will occur | |
| 2008 | | Within 1 year £m | | | After 1 but within 5 years £m | | | After 5 year £m | | | Total £m | |
| Finance lease assets: | | | | | | | | | | | | |
| Amounts receivable | | | 1,485 | | | | 6,112 | | | | 12,567 | | | | 20,164 | |
| Present value adjustment | | | (613 | ) | | | (2,004 | ) | | | (3,094 | ) | | | (5,711 | ) |
| Other movements | | | (24 | ) | | | (128 | ) | | | (341 | ) | | | (493 | ) |
| Present value amounts receivable | | | 848 | | | | 3,980 | | | | 9,132 | | | | 13,960 | |
| | | | | | | | | | | | | | | | | |
| Operating lease assets: | | | | | | | | | | | | | | | | |
| Future minimum lease receivables | | | 918 | | | | 2,479 | | | | 1,141 | | | | 4,538 | |
| | | | | | | | | | | | | | | | | |
| Operating lease obligations: | | | | | | | | | | | | | | | | |
| Future minimum lease payables: | | | | | | | | | | | | | | | | |
| Premises | | | 567 | | | | 1,715 | | | | 3,299 | | | | 5,581 | |
| Equipment | | | 12 | | | | 12 | | | | — | | | | 24 | |
| | | | 579 | | | | 1,727 | | | | 3,299 | | | | 5,605 | |
| | | | | | | | | | | | | | | | | |
| 2007 | | | | | | | | | | | | | | | | |
| Finance lease assets: | | | | | | | | | | | | | | | | |
| Amounts receivable | | | 1,297 | | | | 4,968 | | | | 11,648 | | | | 17,913 | |
| Present value adjustment | | | (390 | ) | | | (1,766 | ) | | | (3,187 | ) | | | (5,343 | ) |
| Other movements | | | (23 | ) | | | (144 | ) | | | (288 | ) | | | (455 | ) |
| Present value amounts receivable | | | 884 | | | | 3,058 | | | | 8,173 | | | | 12,115 | |
| | | | | | | | | | | | | | | | | |
| Operating lease assets: | | | | | | | | | | | | | | | | |
| Future minimum lease receivables | | | 1,073 | | | | 3,046 | | | | 1,473 | | | | 5,592 | |
| | | | | | | | | | | | | | | | | |
| Operating lease obligations: | | | | | | | | | | | | | | | | |
| Future minimum lease payables: | | | | | | | | | | | | | | | | |
| Premises | | | 350 | | | | 1,210 | | | | 3,017 | | | | 4,577 | |
| Equipment | | | 9 | | | | 14 | | | | — | | | | 23 | |
| | | | 359 | | | | 1,224 | | | | 3,017 | | | | 4,600 | |
| | | Group | |
| | | | 2008 £m | | | | 2007 £m | |
| Nature of operating lease assets in balance sheet | | | | | | | | |
| Transportation | | | 5,883 | | | | 6,859 | |
| Cars and light commercial vehicles | | | 1,199 | | | | 1,390 | |
| Other | | | 617 | | | | 441 | |
| | | | 7,699 | | | | 8,690 | |
| | | | | | | | | |
| Amounts recognised as income and expense | | | | | | | | |
| Finance lease receivables – contingent rental income | | | (37 | ) | | | (23 | ) |
| Operating lease payables – minimum payments | | | 566 | | | | 322 | |
| | | | | | | | | |
| Contracts for future capital expenditure not provided for at the year end | | | | | | | | |
| Operating leases | | | 237 | | | | 545 | |
| | | | | | | | | |
| Finance lease receivables | | | | | | | | |
| Unearned finance income | | | 5,711 | | | | 5,343 | |
| Accumulated allowance for uncollectible minimum lease receivables | | | 96 | | | | 63 | |
Residual value exposures
The tables below give details of the unguaranteed residual values included in the carrying value of finance lease receivables (see page 194)pages 241 to 244) and operating lease assets (see page 208)pages 279 and 280).
| | | Year in which residual value will be recovered | |
| 2008 | | Within 1 year £m | | | After 1 year but within 2 years £m | | | After 2 years but within 5 years £m | | | After 5 years £m | | | Total £m | |
| Operating leases | | | | | | | | | | | | | | | |
| Transportation | | | 794 | | | | 130 | | | | 1,701 | | | | 2,103 | | | | 4,728 | |
| Cars and light commercial vehicles | | | 577 | | | | 195 | | | | 182 | | | | 8 | | | | 962 | |
| Other | | | 112 | | | | 35 | | | | 48 | | | | 8 | | | | 203 | |
| Finance leases | | | 24 | | | | 29 | | | | 99 | | | | 341 | | | | 493 | |
| | | | 1,507 | | | | 389 | | | | 2,030 | | | | 2,460 | | | | 6,386 | |
| | | | | | | | | | | | | | | | | | | | | |
| 2007 | | | | | | | | | | | | | | | | | | | | |
| Operating leases | | | | | | | | | | | | | | | | | | | | |
| Transportation | | | 485 | | | | 253 | | | | 1,762 | | | | 2,505 | | | | 5,005 | |
| Cars and light commercial vehicles | | | 331 | | | | 467 | | | | 118 | | | | – | | | | 916 | |
| Other | | | 26 | | | | 47 | | | | 64 | | | | 18 | | | | 155 | |
| Finance leases | | | 23 | | | | 29 | | | | 115 | | | | 288 | | | | 455 | |
| | | | 865 | | | | 796 | | | | 2,059 | | | | 2,811 | | | | 6,531 | |
| | | Year in which residual value will be recovered | |
| | | Within 1 year | | | After 1 year but within 2 years | | | After 2 years but within 5 years | | | After 5 years | | | Total | |
| 2010 | | | £m | | | | £m | | | | £m | | | | £m | | | | £m | |
| Operating leases | | | | | | | | | | | | | | | | | | | | |
| - transportation | | | 357 | | | | 457 | | | | 1,834 | | | | 2,097 | | | | 4,745 | |
| - cars and light commercial vehicles | | | 503 | | | | 109 | | | | 100 | | | | 9 | | | | 721 | |
| - other | | | 30 | | | | 20 | | | | 39 | | | | 13 | | | | 102 | |
| Finance lease contracts | | | 20 | | | | 41 | | | | 131 | | | | 263 | | | | 455 | |
| Hire purchase agreements | | | — | | | | 3 | | | | 70 | | | | — | | | | 73 | |
| | | | 910 | | | | 630 | | | | 2,174 | | | | 2,382 | | | | 6,096 | |
| | | | | | | | | | | | | | | | | | | | | |
| 2009 | | | | | | | | | | | | | | | | | | | | |
| Operating leases | | | | | | | | | | | | | | | | | | | | |
| - transportation | | | 164 | | | | 327 | | | | 1,607 | | | | 2,255 | | | | 4,353 | |
| - cars and light commercial vehicles | | | 624 | | | | 134 | | | | 113 | | | | 7 | | | | 878 | |
| - other | | | 31 | | | | 32 | | | | 40 | | | | 7 | | | | 110 | |
| Finance lease contracts | | | 23 | | | | 35 | | | | 96 | | | | 313 | | | | 467 | |
| Hire purchase agreements | | | 7 | | | | 20 | | | | 61 | | | | 21 | | | | 109 | |
| | | | 849 | | | | 548 | | | | 1,917 | | | | 2,603 | | | | 5,917 | |
| | | | | | | | | | | | | | | | | | | | | |
| 2008 | | | | | | | | | | | | | | | | | | | | |
| Operating leases | | | | | | | | | | | | | | | | | | | | |
| - transportation | | | 794 | | | | 130 | | | | 1,701 | | | | 2,103 | | | | 4,728 | |
| - cars and light commercial vehicles | | | 577 | | | | 195 | | | | 182 | | | | 8 | | | | 962 | |
| - other | | | 112 | | | | 35 | | | | 48 | | | | 8 | | | | 203 | |
| Finance lease contracts | | | 24 | | | | 29 | | | | 99 | | | | 341 | | | | 493 | |
| Hire purchase agreements | | | — | | | | 9 | | | | 25 | | | | 44 | | | | 78 | |
| | | | 1,507 | | | | 398 | | | | 2,055 | | | | 2,504 | | | | 6,464 | |
The Group provides asset finance to its customers through acting as a lessor. It purchases plant, equipment and intellectual property, renting them to customers under lease arrangements that, depending on their terms, qualify as either operating or finance leases.
32 Collateral and securitisations
Securities repurchase agreements and lending transactions
The Group enters into securities repurchase agreements and securities lending transactions under which it receives or transfers collateral in accordance with normal market practice. Generally, the agreements require additional collateral to be provided if the value of the securities falls below a predetermined level.
Under standard terms for repurchase transactions in the UK and US markets, the recipient of collateral has an unrestricted right to sell or repledge it, subject to returning equivalent securities on settlement of the transaction.
The fair value (and carrying value) of securities transferred under repurchase transactions included within debt securities on the balance sheet were £80,576 million (2007 – £107,651 million)£80.1 billion (2009 - £66.9 billion; 2008 - £80.6 billion). All of these securities could be sold or repledged by the holder. Securities received as collateral under reverse repurchase agreements amounted to £89.3£94.3 billion (2007 – £373.7(2009 - £74.0 billion; 2008 - £89.3 billion), of which £49.0£93.5 billion (2007 – £337.8(2009 - £73.0 billion; 2008 - £49.0 billion) had been resold or repledged as collateral for the Group’sGroup's own transactions.
Other collateral given
| Group assets charged as security for liabilities | | | 2008 £m | | | | 2007 £m | |
| Loans and advances to banks | | | 13 | | | | 753 | |
| Loans and advances to customers | | | 118,933 | | | | 80,719 | |
| Debt securities | | | 15,490 | | | | 29,709 | |
| Property, plant and equipment | | | – | | | | 935 | |
| Other | | | 8 | | | | 1,765 | |
| | | | 134,444 | | | | 113,881 | |
| Liabilities secured by charges on Group assets | | | 2008 £m | | | | 2007 £m | |
| Deposits by banks | | | 15,429 | | | | 21,693 | |
| Customer accounts | | | 11,050 | | | | 6,670 | |
| Debt securities in issue | | | 58,689 | | | | 65,080 | |
| | | | 85,168 | | | | 93,443 | |
(1) | The table above includes assets used as collateral for central bank liquidity schemes. |
Of the assets above, £91.3 billion (2007 – £62.0 billion) relate to securitisations. In securitisations, debt securities are issued that are secured on assets of the Group: the rights to the cash flows from those assets are transferred to special purpose vehicles which issue debt securities. The holders of the notes are generally not able to sell or repledge the underlying assets. The remaining balances mainly relate to assets charged as security against deposits from central and federal banks and other public sector bodies.
Securitisations and other asset transfers
Continued recognition
The table below sets out the asset categories together with the carrying amounts of the assets and associated liabilities for those securitisations (see page 157) and other asset transfers where substantially all the risks and rewards of the asset have been retained by the Group.
| | | | | | | | | 2010 | | | 2009 | | | 2008 | |
| Asset type | | Assets £m | | | Liabilities £m | | | Assets £m | | | Liabilities £m | | | Assets £m | | | Liabilities £m | | | Assets £m | | | Liabilities £m | | | Assets £m | | | Liabilities £m | |
| Residential mortgages | | 49,184 | | | 20,075 | | | 23,652 | | | 23,436 | | | | 76,212 | | | | 18,215 | | | | 69,927 | | | | 15,937 | | | | 55,714 | | | | 20,075 | |
| Credit card receivables | | 3,004 | | | 3,197 | | | 2,948 | | | 2,664 | | | | 3,993 | | | | 34 | | | | 2,975 | | | | 1,592 | | | | 3,004 | | | | 3,197 | |
| Other loans | | 1,679 | | | 1,071 | | | 1,703 | | | 1,149 | | | | 30,988 | | | | 974 | | | | 36,448 | | | | 1,010 | | | | 1,679 | | | | 1,071 | |
| Commercial paper conduits | | 36,395 | | | 35,835 | | | 32,613 | | | 31,193 | | | | 20,014 | | | | 17,320 | | | | 27,366 | | | | 25,583 | | | | 49,857 | | | | 48,684 | |
| Finance lease receivables | | 1,077 | | | 857 | | | 1,038 | | | 823 | | | | 510 | | | | 510 | | | | 597 | | | | 597 | | | | 1,077 | | | | 857 | |
| | | 91,339 | | | 61,035 | | | 61,954 | | | 59,265 | | | | 131,717 | | | | 37,053 | | | | 137,313 | | | | 44,719 | | | | 111,331 | | | | 73,884 | |
Refer to page 158 for additional analysis on commercial paper conduits.
Assets are significantly greater than liabilities, as all notes issued by funding related own asset securitisation SPEs are purchased by Group companies.
Continuing involvement
At 31 December 2008,2010, securitised assets were £1.1£2.3 billion (2007 – £18.1(2009 - £3.1 billion; 2008 - £1.1 billion); retained interest £50£286.1 million (2007 – £1,037(2009 - £101.9 million; 2008 - £50.6 million); subordinated assets £9£4.2 million (2007 – £314(2009 - £90.7 million; 2008 - £9.0 million); and related liabilities £9£4.2 million (2007 – £314(2009 - £32.7 million; 2008 - £9.0 million).
Other collateral given
| Group assets pledged against Group liabilities | | | 2010 £m | | | | 2009 £m | | | | 2008 £m | |
| Loans and advances to banks | | | 27,271 | | | | 25,712 | | | | 43,126 | |
| Loans and advances to customers | | | 46,352 | | | | 38,924 | | | | 53,894 | |
| Debt securities | | | 7,200 | | | | 8,723 | | | | 13,191 | |
| | | | 80,823 | | | | 73,359 | | | | 110,211 | |
| Liabilities secured by Group assets | | | | | | | | | |
| Deposits by banks | | | 10,565 | | | | 12,724 | | | | 15,429 | |
| Customer accounts | | | 3,599 | | | | 3,319 | | | | 10,907 | |
| Debt securities in issue | | | — | | | | 1,237 | | | | 109 | |
| Derivatives | | | 93,570 | | | | 65,225 | | | | 137,667 | |
| | | | 107,734 | | | | 82,505 | | | | 164,112 | |
Notes on the accountscontinued | Financial statements |
The Group’sGroup's regulatory capital resources at 31 December in accordance with Financial Services Authority (FSA) definitions were as follows:
| Composition of regulatory capital | | Basel II 2008 £m | | | Basel I 2007 £m | |
| Tier 1: | | | | | | |
| Ordinary shareholders’ equity | | | 45,525 | | | | 44,684 | |
| Minority interests | | | 21,619 | | | | 38,388 | |
| Adjustment for: | | | | | | | | |
| – Goodwill and other intangible assets | | | (20,049 | ) | | | (48,492 | ) |
| – Goodwill and other intangible assets of discontinued businesses | | | – | | | | (3,232 | ) |
| – Unrealised losses on available-for-sale debt securities | | | 3,687 | | | | 630 | |
| – Reserves arising on revaluation of property and unrealised gains on available-for-sale equities | | | (984 | ) | | | (3,321 | ) |
| – Reallocation of preference shares and innovative securities | | | (1,813 | ) | | | (1,813 | ) |
| – Other regulatory adjustments | | | (362 | ) | | | 480 | |
| Core Tier 1 capital | | | 47,623 | | | | 27,324 | |
| | | | | | | | | |
| Preference shares | | | 16,655 | | | | 10,560 | |
| Innovative Tier 1 securities | | | 7,383 | | | | 6,480 | |
| Tax on the excess of expected losses over provisions | | | 615 | | | | n/a | |
| Tier 1 deductions | | | (2,429 | ) | | | n/a | |
| Total Tier 1 capital | | | 69,847 | | | | 44,364 | |
| | | | | | | | | |
| Tier 2: | | | | | | | | |
| Reserves arising on revaluation of property and unrealised gains on available-for-sale equities | | | 984 | | | | 3,321 | |
| Collective impairment allowances | | | 666 | | | | 2,582 | |
| Perpetual subordinated debt | | | 9,829 | | | | 9,042 | |
| Term subordinated debt | | | 23,162 | | | | 18,639 | |
| Minority and other interests in Tier 2 capital | | | 11 | | | | 109 | |
| Tier 2 deductions | | | (2,429 | ) | | | n/a | |
| Total Tier 2 capital | | | 32,223 | | | | 33,693 | |
| | | | | | | | | |
| Tier 3 | | | 260 | | | | 200 | |
| | | | | | | | | |
| Supervisory deductions: | | | | | | | | |
| Unconsolidated investments | | | 4,044 | | | | 4,297 | |
| Other deductions | | | 111 | | | | 5,986 | |
| Total deductions other than from Tier 1 capital | | | 4,155 | | | | 10,283 | |
| Total regulatory capital | | | 98,175 | | | | 67,974 | |
| Composition of regulatory capital | | | 2010 £m | | | | 2009 £m | | | | 2008 £m | |
| Tier 1 | | | | | | | | | | | | |
| Ordinary and B shareholders' equity | | | 70,388 | | | | 69,890 | | | | 45,525 | |
| Non-controlling interests | | | 1,719 | | | | 16,895 | | | | 21,619 | |
| Adjustments for: | | | | | | | | | | | | |
| - goodwill and other intangible assets - continuing businesses | | | (14,448 | ) | | | (17,847 | ) | | | (20,049 | ) |
- goodwill and other intangible assets - discontinued businesses | | | — | | | | (238 | ) | | | — | |
| - unrealised losses on available-for-sale (AFS) debt securities | | | 2,061 | | | | 1,888 | | | | 3,687 | |
| - reserves arising on revaluation of property and unrealised gains on AFS equities | | | (25 | ) | | | (207 | ) | | | (984 | ) |
| - reallocation of preference shares and innovative securities | | | (548 | ) | | | (656 | ) | | | (1,813 | ) |
| - other regulatory adjustments* | | | (1,097 | ) | | | (1,184 | ) | | | (362 | ) |
| Less excess of expected losses over provisions net of tax | | | (1,900 | ) | | | (2,558 | ) | | | (770 | ) |
| Less securitisation positions | | | (2,321 | ) | | | (1,353 | ) | | | (663 | ) |
| Less APS first loss | | | (4,225 | ) | | | (5,106 | ) | | | — | |
| Core Tier 1 capital | | | 49,604 | | | | 59,524 | | | | 46,190 | |
| Preference shares | | | 5,410 | | | | 11,265 | | | | 16,655 | |
| Innovative Tier 1 securities | | | 4,662 | | | | 5,213 | | | | 7,383 | |
| Tax on the excess of expected losses over provisions | | | 758 | | | | 1,020 | | | | 308 | |
| Less material holdings | | | (310 | ) | | | (601 | ) | | | (689 | ) |
| Total Tier 1 capital | | | 60,124 | | | | 76,421 | | | | 69,847 | |
| | | | | | | | | | | | | |
| Tier 2 | | | | | | | | | | | | |
| Reserves arising on revaluation of property and unrealised gains on AFS equities | | | 25 | | | | 207 | | | | 984 | |
| Collective impairment provisions | | | 778 | | | | 796 | | | | 666 | |
| Perpetual subordinated debt | | | 1,852 | | | | 4,950 | | | | 9,829 | |
| Term subordinated debt | | | 16,745 | | | | 20,063 | | | | 23,162 | |
| Non-controlling and other interests in Tier 2 capital | | | 11 | | | | 11 | | | | 11 | |
| Less excess of expected losses over provisions | | | (2,658 | ) | | | (3,578 | ) | | | (1,078 | ) |
| Less securitisation positions | | | (2,321 | ) | | | (1,353 | ) | | | (662 | ) |
| Less material holdings | | | (310 | ) | | | (601 | ) | | | (689 | ) |
| Less APS first loss | | | (4,225 | ) | | | (5,106 | ) | | | — | |
| Total Tier 2 capital | | | 9,897 | | | | 15,389 | | | | 32,223 | |
| | | | | | | | | | | | | |
| Tier 3 | | | — | | | | — | | | | 260 | |
| | | | | | | | | | | | | |
| Supervisory deductions | | | | | | | | | | | | |
| Unconsolidated investments | | | | | | | | | | | | |
| - RBS Insurance | | | (3,962 | ) | | | (4,068 | ) | | | (3,628 | ) |
| - other investments | | | (318 | ) | | | (404 | ) | | | (416 | ) |
| Other deductions | | | (452 | ) | | | (93 | ) | | | (111 | ) |
| Deductions from total capital | | | (4,732 | ) | | | (4,565 | ) | | | (4,155 | ) |
| | | | | | | | | | | | | |
| Total regulatory capital | | | 65,289 | | | | 87,245 | | | | 98,175 | |
| | | | | | | | | | | | | |
| *Includes reduction for own liabilities carried at fair value | | | (1,182 | ) | | | (1,057 | ) | | | (1,159 | ) |
It is the Group’sGroup's policy to maintain a strong capital base, to expand it as appropriate and to utilise it efficiently throughout its activities to optimise the return to shareholders while maintaining a prudent relationship between the capital base and the underlying risks of the business. In carrying out this policy, the Group has regard to the supervisory requirements of the FSA. The FSA uses Risk Asset Ratio (RAR) as a measure of capital adequacy forin the UK banks,banking sector, comparing a bank’sbank's capital resources with its risk-weighted assets (the assets and off-balance sheet exposures are ‘weighted’ to reflect the inherent credit and other risks); by international agreement, the RAR should be not less than 8% with a Tier 1 component of not less than 4%. The Group has complied with the FSAsFSA’s capital requirements throughout the year.
A number of subsidiaries and sub-groups within the Group, principally banking and insurance entities, are subject to various individual regulatory capital requirements in the UK and overseas.
Notes on the accountscontinued | Financial statements |
Contingent liabilities and commitments
The amounts shown in the table below are intended only to provide an indication of the volume of business outstanding at 31 December. Although the Group is exposed to credit risk in the event of non-performance of the obligations undertaken by customers, the amounts shown do not, and are not intended to, provide any indication of the Group’sGroup's expectation of future losses.
| | | Group | | | Group | |
| | | Less than 1 year £m | | | More than 1 year but less than 3 years £m | | | More than 3 years but less than 5 years £m | | | Over 5 years £m | | | | 2008
£m | | | | 2007
£m | | | Less than 1 year | | | More than 1 year but less than 3 years | | | More than 3 years but less than 5 years | | | Over 5 years | | | 2010 | | | 2009 | | | 2008 | |
| Contingent liabilities: | | | | | | | | | | | | | | | | | | | | | |
| | | | | £m | | | | £m | | | | £m | | | | £m | | | | £m | | | | £m | | | | £m | |
| Contingent liabilities | | | | | | | | | | | | | | | | | | | | | | | | | | | | | |
| Guarantees and assets pledged as collateral security | | 29,350 | | | 7,738 | | | 2,898 | | | 9,276 | | | 49,262 | | | 46,441 | | | | 20,044 | | | | 5,220 | | | | 2,178 | | | | 3,659 | | | | 31,101 | | | | 40,008 | | | | 49,262 | |
| Other contingent liabilities | | 9,093 | | | 6,637 | | | 2,252 | | | 4,293 | | | 22,275 | | | 15,479 | | | | 6,058 | | | | 2,877 | | | | 1,235 | | | | 2,084 | | | | 12,254 | | | | 14,012 | | | | 22,275 | |
| | | 38,443 | | | 14,375 | | | 5,150 | | | 13,569 | | | 71,537 | | | 61,920 | | | | 26,102 | | | | 8,097 | | | | 3,413 | | | | 5,743 | | | | 43,355 | | | | 54,020 | | | | 71,537 | |
| | | | | | | | | | | | | | | | | | | | | | | | | | | | | | | | | | | | | | | | | | | | | | | | | | | | | |
| Commitments: | | | | | | | | | | | | | | | | | | | | | | | | | |
| Commitments | | | | | | | | | | | | | | | | | | | | | | | | | | | | | |
| Undrawn formal standby facilities, credit lines and other commitments to lend | | | | | | | | | | | | | | | | | | | | | | | | | | | | | | | | | | | | | | | | | | | | | | | | | | | | |
| – less than one year | | 166,572 | | | – | | | – | | | – | | | 166,572 | | | 181,914 | | |
| – one year and over | | 22,209 | | | 70,301 | | | 62,725 | | | 30,591 | | | 185,826 | | | 150,897 | | |
| - less than one year | | | | 117,581 | | | | — | | | | — | | | | — | | | | 117,581 | | | | 127,423 | | | | 166,572 | |
| - one year and over | | | | 22,258 | | | | 80,267 | | | | 26,931 | | | | 19,785 | | | | 149,241 | | | | 164,211 | | | | 185,826 | |
| Other commitments | | 6,715 | | | 309 | | | 1,210 | | | 1,092 | | | 9,326 | | | 5,368 | | | | 1,623 | | | | 161 | | | | 2,366 | | | | 4 | | | | 4,154 | | | | 6,007 | | | | 9,326 | |
| | | 195,496 | | | 70,610 | | | 63,935 | | | 31,683 | | | 361,724 | | | 338,179 | | | | 141,462 | | | | 80,428 | | | | 29,297 | | | | 19,789 | | | | 270,976 | | | | 297,641 | | | | 361,724 | |
Banking commitments and contingent obligations, which have been entered into on behalf of customers and for which there are corresponding obligations from customers, are not included in assets and liabilities. The Group’sGroup's maximum exposure to credit loss, in the event of non-performance by the other party and where all counterclaims, collateral or security proves valueless, is represented by the contractual nominal amount of these instruments included in the table above. These commitments and contingent obligations are subject to the Group’sGroup's normal credit approval processes.
Contingent liabilities
Guarantees –- the Group gives guarantees on behalf of customers. A financial guarantee represents an irrevocable undertaking that the Group will meet a customer’scustomer's obligations to third parties if the customer fails to do so. The maximum amount that the Group could be required to pay under a guarantee is its principal amount as disclosed in the table above. The Group expects most guarantees it provides to expire unused.
Other contingent liabilities –- these include standby letters of credit, supporting customer debt issues and contingent liabilities relating to customer trading activities such as those arising from performance and customs bonds, warranties and indemnities.
Commitments
Commitments to lend –- under a loan commitment the Group agrees to make funds available to a customer in the future. Loan commitments, which are usually for a specified term may be unconditionally cancellable or may persist, provided all conditions in the loan facility are satisfied or waived. Commitments to lend include commercial standby facilities and credit lines, liquidity facilities to commercial paper conduits and unutilised overdraft facilities.
Other commitments –- these include documentary credits, which are commercial letters of credit providing for payment by the Group to a named beneficiary against presentation of specified documents, forward asset purchases, forward deposits placed and undrawn note issuance and revolving underwriting facilities, and other short-term trade related transactions.
Notes on the accountscontinued | Financial statements |
Contractual obligations for future expenditure not provided for in the accounts
The following table shows contractual obligations for future expenditure not provided for in the accounts at the year end.
| | | Group | |
| | | | 2010 £m | | | | 2009 £m | | | | 2008 £m | |
| Operating leases | | | | | | | | | | | | |
Minimum rentals payable under non-cancellable leases (1) | | | | | | | | | | | | |
| - within 1 year | | | 497 | | | | 479 | | | | 579 | |
| - after 1 year but within 5 years | | | 1,515 | | | | 1,691 | | | | 1,727 | |
| - after 5 years | | | 2,892 | | | | 3,055 | | | | 3,299 | |
| | | | 4,904 | | | | 5,225 | | | | 5,605 | |
| Property, plant and equipment | | | | | | | | | | | | |
| Contracts to buy, enhance or maintain investment properties | | | 2 | | | | — | | | | 7 | |
Contracts to buy assets to be leased under operating leases (2) | | | 2,585 | | | | 2,724 | | | | 6,063 | |
| Other capital expenditure | | | 150 | | | | 89 | | | | 128 | |
| | | | 2,737 | | | | 2,813 | | | | 6,198 | |
| | | | | | | | | | | | | |
Contracts to purchase goods or services (3) | | | 397 | | | | 665 | | | | 2,127 | |
| | | | 8,038 | | | | 8,703 | | | | 13,930 | |
Notes:
| (1) | Predominantly property leases. |
| (2) | Of which due within 1 year: £263 million (2009 - £370 million; 2008 - £3,769 million). |
| (3) | Of which due within 1 year: £283 million (2009 - £480 million; 2008 - £1,129 million). |
Trustee and other fiduciary activities
In its capacity as trustee or other fiduciary role, the Group may hold or place assets on behalf of individuals, trusts, companies, pension schemes and others. The assets and their income are not included in the Group’sGroup's financial statements. The Group earned fee income of £1,442£629 million (2007 – £695(2009 - £1,355 million; 2006 – £4722008 - £1,442 million) from these activities.
The Financial Services Compensation Scheme
The Financial Services Compensation Scheme (FSCS), the UK's statutory fund of last resort for customers of authorised financial services firms, pays compensation if a firm is unable to meet its obligations. The FSCS funds compensation for customers by raising management expenses levies and compensation levies on the industry. In relation to protected deposits, each deposit-taking institution contributes towards these levies in proportion to their share of total protected deposits on 31 December of the year preceding the scheme year (which runs from 1 April to 31 March), subject to annual maxima set by the Financial Services Authority (FSA). In addition, the FSCS has the power to raise levies (‘exit levies’) on firms who have ceased to participate in the scheme and are in the process of ceasing to be authorised for the amount that the firm would otherwise have been asked to pay during the relevant levy year. The FSCS also has the power to raise exit levies on such firms which look at their potential liability to pay levies in future years.
The FSCS has borrowed from HM Treasury to fund the compensation costs associated with Bradford & Bingley, Heritable Bank, Kaupthing Singer & Friedlander, Landsbanki ‘Icesave’ and London Scottish Bank plc. These borrowings are on an interest-only basis until September 2011.31 March 2012. The annual limit on the FSCS interest and management expenses levy for the three years fromperiod September 2008 to March 2012 in relation to these institutions has been capped at £1 billion per annum.
The FSCS will receive funds from asset sales, surplus cash flow, or other recoveries in relation to these institutions which will be used to reduce the principal amount of the FSCS's borrowings. Only afterAfter the interest only period which is expected to end in September 2011, will a schedule
32 Memorandum items (continued)
for repayment of any remaining principal outstanding (after recoveries) on the borrowings will be agreed between the FSCS and HM Treasury. It is expectedTreasury in the light of market conditions at that from that point,time and the FSCS will begin to raise compensation levies (principal repayments). No provision has been made for these levies as the amount is not yet known and is unlikely to be determined before 2011.known.
The Group has accrued £150£144 million for its share of FSCS management expenses levies for the 2008/92010/11 and 2009/102011/12 scheme years.
Notes on the accountscontinued | Financial statements |
34 Memorandum items continued
Bank levy
In his 22 June 2010 budget statement, the Chancellor announced that the UK Government will introduce an annual bank levy. The Finance Bill 2011 contains details of how the levy will be calculated and collected. The levy will be collected through the existing quarterly Corporation Tax collection mechanism starting with payment dates on or after the date the Finance Bill 2011 receives Royal Assent.
The levy will be based upon the total chargeable equity and liabilities as reported in the balance sheet at the end of a chargeable period. In determining the chargeable equity and liabilities the following amounts are excluded: Tier 1 capital; certain “protected deposits” (for example those protected under the Financial Services Compensation Scheme); liabilities that arise from certain insurance business within banking groups; liabilities in respect of currency notes in circulation; Financial Services Compensation Scheme liabilities; liabilities representing segregated client money; and deferred tax liabilities, current tax liabilities, liabilities in respect of the levy, revaluation of property liabilities, liabilities representing the revaluation of business premises and defined benefit retirement liabilities. It will also be permitted in specified circumstances to reduce certain liabilities by: netting against them certain assets; offsetting assets on the relevant balance sheets that would qualify as high quality liquid assets (in accordance with the FSA definition); and repo liabilities secured against sovereign and supranational debt.
The levy will be set at a rate of 0.075 per cent from 2011. Three different rates apply during 2011, these average to 0.075 per cent. Certain liabilities will be subject to only a half rate, namely: any deposits not otherwise excluded (except for those from financial institutions and financial traders); and liabilities with a maturity greater than one year at the balance sheet date. The levy will not be charged on the first £20 billion of chargeable liabilities.
If the levy had been applied to the balance sheet at 31 December 2010, the cost of the levy to RBS Group would be in the region of £350 million to £400 million in 2011.
Litigation
As a participant in the financial services industry, RBS Group operates in a legal and regulatory environment that exposes it to potentially significant litigation risks. As a result, the company and other members of RBS Group are involved in various disputes and legal proceedings in the United Kingdom, the United States and other jurisdictions, including litigation. Such cases are subject to many uncertainties, and their outcome is often difficult to predict, particularly in the earlier stages of a case.
Other than as set out in this section “Litigation”, so far as RBS Group is aware, no member of RBS Group is or has been engaged in or has pending or threatened any governmental, legal or arbitration proceedings which may have or have had in the recent past (covering the 12 months immediately preceding the date of this document) a significant effect on RBS Group’s financial position or profitability.
Unarranged overdraft charges
In the US, Citizens Financial Group, in common with other US banks, has been named as a defendant in a class action asserting that Citizens charges excessive overdraft fees. The plaintiffs claim that overdraft fees resulting from point of sale and automated teller machine (ATM) transactions violate the duty of good faith implied in Citizens’ customer account agreement and constitute an unfair trade practice. RBS Group considers that it has substantial and credible legal and factual defences to these claims and will defend them vigorously. RBS Group is unable reliably to estimate the liability, if any, that might arise or its effect on RBS Group’s consolidated net assets, operating results or cash flows in any particular period.
Shareholder litigation
RBS Group and a number of its subsidiaries and certain individual officers and directors have been named as defendants in a class action filed in the United States District Court for the Southern District of New York. The consolidated amended complaint alleges certain false and misleading statements and omissions in public filings and other communications during the period 1 March 2007 to 19 January 2009, and variously asserts claims under Sections 11, 12 and 15 of the US Securities Act of 1933, Sections 10 and 20 of the US Securities Exchange Act of 1934 (“Exchange Act”) and Rule 10b-5 thereunder.
The putative class is composed of (1) all persons who purchased or otherwise acquired RBS Group ordinary securities and US American depositary receipts (ADRs) between 1 March 2007 and 19 January 2009; and/or (2) all persons who purchased or otherwise acquired RBS Group Series Q, R, S, T and/or U non-cumulative dollar preference shares issued pursuant or traceable to the 8 April 2005 US Securities and Exchange Commission (SEC) registration statement and were damaged thereby. Plaintiffs seek unquantified damages on behalf of the putative class.
On 11 January 2011, the District Court dismissed all claims except those based on the purchase of RBS Group Series Q, R, S, T, and/or U non-cumulative dollar preference shares. The Court has not yet considered potential grounds for dismissal of the remaining claims, and directed RBS Group to re-file its motion to dismiss those claims within 45 days of its ruling. On 28 January 2011, a new complaint was filed asserting claims under Sections 10 and 20 of the Exchange Act on behalf of a putative class of purchasers of ADRs.
RBS Group has also received notification of similar prospective claims in the United Kingdom and elsewhere but no court proceedings have been commenced in relation to these claims.
RBS Group considers that it has substantial and credible legal and factual defences to the remaining and prospective claims and will defend them vigorously. RBS Group is unable to reliably estimate the liability, if any, that might arise or its effect on RBS Group’s consolidated net assets, operating results or cash flows in any particular period.
Notes on the accountscontinued | Financial statements |
Other securitisation and securities related litigation in the United States
RBS Group companies have been named as defendants in a number of purported class actions and other lawsuits in the United States that relate to the securitisation and securities underwriting businesses. In general, the cases involve the issuance of mortgage backed securities, collateralised debt obligations, or public debt or equity where the plaintiffs have brought actions against the issuers and underwriters of such securities (including RBS Group companies) claiming that certain disclosures made in connection with the relevant offerings of such securities were false or misleading with respect to alleged “sub-prime” mortgage exposure. RBS Group considers that it has substantial and credible legal and factual defences to these claims and will continue to defend them vigorously. RBS Group cannot at this stage reliably estimate the liability, if any, that may arise as a result of or in connection with these lawsuits, individually or in the aggregate, or their effect on RBS Group’s consolidated net assets, operating results or cash flows in any particular period.
World Online International N.V.
In November 2009, the Supreme Court in the Netherlands gave a declaratory judgment against World Online International N.V., Goldman Sachs International and ABN AMRO Bank N.V. (now known as The Royal Bank of Scotland N.V.) (“RBS NV”) in relation to claims arising out of the World Online initial public offering of 2000. It held that these defendants had committed certain wrongful acts in connection with the initial public offering. The judgment does not establish liability or the amount of any loss. The defendant banks have agreed to pay settlement sums to certain investors. RBS Group does not believe that such settlements or any final liability or loss will have a significant effect on RBS Group’s financial position or profitability.
Madoff
In December 2010, Irving Picard, as trustee for the bankruptcy estates of Bernard L. Madoff and Bernard L. Madoff Investment Securities LLC filed a claim against RBS NV for $270 million. This is a clawback action similar to claims filed against six other institutions in December. RBS NV (or its subsidiaries) invested in Madoff funds through feeder funds. The Trustee alleges that RBS NV received $71 million in redemptions from the feeder funds and $200 million from its swap counterparties while RBS NV “knew or should have known of Madoff’s possible fraud.” The Trustee alleges that those transfers were preferences or fraudulent conveyances under the US bankruptcy code and New York law and he asserts the purported right to claw them back for the benefit of Madoff’s estate. RBS Group considers that it has substantial and credible legal and factual defences to the claim and intends to defend it vigorously.
Summary of other disputes, legal proceedings and litigation
Members of RBS Group are engaged in other litigation in the United Kingdom and a number of overseas jurisdictions, including the United States, involving claims by and against them arising in the ordinary course of business. RBS Group has reviewed these other actual, threatened and known potential claims and proceedings and, after consulting with its legal advisers, does not expect that the outcome of any of these other claims and proceedings will have significant effect on RBS Group’s financial position or profitability in any particular period.
Investigations
TheRBS Group’s businesses and financial condition can be affected by the fiscal or other policies and other actions of various governmental and regulatory authorities in the United Kingdom, the European Union, the United States and elsewhere.
The RBS Group has engaged, and will continue to engage, in discussions with relevant regulators, including in the United Kingdom and the United States, on an ongoing and regular basis informing them ofregarding operational, systems and control evaluations and issues, as deemed appropriate or requiredincluding those related to compliance with applicable anti-bribery, anti-money laundering and itapplicable sanctions regimes. It is possible that any matters discussed or identified may result in investigatory actionsor other action being taken by the regulators, increased costs being incurred by theRBS Group, remediation of systems and controls, public or private censure, restriction of RBS Group’s business activities or fines. Any of these events or circumstances could have a material adverse impactsignificant effect on theRBS Group, its business, authorisations and licences, reputation, results of operations or share price.the price of securities issued by it.
There is continuing politicalPolitical and regulatory scrutiny of the operation of the retail banking and consumer credit industries in the United Kingdom and elsewhere.elsewhere continues. The nature and impact of future changes in policies and regulatory action are not predictable and are beyond theRBS Group’s control but could have an adverse impacta significant effect on theRBS Group’s businesses and earnings.earnings.
European UnionRetail banking
In the European Union, regulatory actions included an inquiry into retail banking initiated on 13 June 2005 in all of the then 25 member states by the European Commission’s Directorate General for Competition. The inquiry examined retail banking in Europe generally. On 31 January 2007, the European Commission (EC) announced that barriers to competition in certain areas of retail banking, payment cards and payment systems in the European Union had been identified. The European CommissionEC indicated that it will consider using its powers to address these barriers and will encourage national competition authorities to enforce European and national competition laws where appropriate. In addition, in late 2010, the EC launched an initiative pressing for increased transparency of bank fees.
Multilateral interchange fees
In 2007, the European CommissionEC issued a decision that while interchange is not illegal per se, MasterCard’s current multilateral interchange fee (MIF) arrangement for cross border payment card transactions with MasterCard and Maestro-brandedMaestro branded consumer credit and debit cards in the European Union are in breach of competition law. MasterCard was required by the decision to withdraw the relevant cross border MIFscross-border MIF (i.e. set these fees to zero) by 21 June 2008.
Notes on the accountscontinued | Financial statements |
34 Memorandum items continued
MasterCard lodged an appealappealed against the decision withto the European Court of First Instance on 1 March 2008, and RBS Group has intervened in the appeal proceedings. In addition, in summer 2008, MasterCard announced various changes to its scheme arrangements. The EC was concerned that these changes might be used as a means of circumventing the requirements of the infringement decision. In April 2009, MasterCard agreed an interim settlement on 12 June 2008 it announced that it would be temporarily withdrawing its cross border MIF,the level of cross-border MIFs with the EC pending the outcome of the appeal. The Groupappeal process and, as a result, the EC has been granted leave to intervene inadvised it will no longer investigate the appeal proceedings. non-compliance issue (although MasterCard is continuing with its appeal).
Visa’s cross-border MIFs were exempted in 2002 by the European CommissionEC for a period of five years up to 31 December 2007 subject to certain conditions. On 26 March 2008, the European CommissionEC opened a formal inquiry into Visa’s current MIF arrangements for cross border payment card transactions with Visa-brandedVisa branded debit and consumer credit cards in the European Union.Union and on 6 April 2009 the EC announced that it had issued Visa with a formal Statement of Objections. At the same time Visa announced changes to its interchange levels and introduced some changes to enhance transparency. There is no deadline for the closure of the inquiry.However, on 26 April 2010 Visa announced it had reached an agreement with the EC as regards immediate cross border debit card MIF rates only and in December 2010 the commitments were finalised for a four year period commencing December 2010 under Article 9 of Regulation 1/2003. The EC is continuing its investigations into Visa’s cross border MIF arrangements for deferred debit and credit transactions.
United Kingdom
In the United Kingdom, in September 2005, the Office of Fair Trading (OFT) received a super-complaint from the Citizens Advice Bureau relating to payment protection insurance (PPI). As a result,UK, the OFT commencedhas carried out investigations into Visa and MasterCard domestic credit card interchange rates. The decision by the OFT in the MasterCard interchange case was set aside by the Competition Appeal Tribunal (the CAT) in June 2006. The OFT’s investigations in the Visa interchange case and a second MasterCard interchange case are ongoing. On 9 February 2007, the OFT announced that it was expanding its investigation into domestic interchange rates to include debit cards. In January 2010 the OFT advised that it did not anticipate issuing a Statement of Objections prior to the European General Court’s judgment, although it has reserved the right to do so if it considers it appropriate.
The outcome of these investigations is not known, but they may have a significant effect on the consumer credit industry in general and, therefore, on RBS Group’s business in this sector.
Payment Protection Insurance
Having conducted a market study on PPI in April 2006. In October 2006, the OFT announced the outcome of the market study and,relating to Payment Protection Insurance (PPI), on 7 February 2007 following a period of consultation, the OFT referred the PPI market to the Competition Commission (CC) for an in-depth inquiry. The CC published its final report on 29 January 2009. It found a lack of competition in the PPI market as a result of various factors, including a lack of transparency2009 and barriersannounced its intention to entry for standalone providers. The CC will therefore impose by Orderorder a range of remedies, including a prohibition on actively selling PPI at point of sale of the credit product (and for 7 days thereafter), a ban on single premium policies and other measures to increase transparency (in order to improve customers’ ability to search and improve price competition). Barclays Bank PLC subsequently appealed certain CC findings to the CAT. On 16 October 2009, the CAT handed down a judgment quashing the ban on selling PPI at the point of sale of credit products and remitted the matter back to the CC for review. On 14 May 2010, the CC published its Provisional Decision following its review of remedies in the PPI market indicating that the CC still intends to impose a prohibition on selling PPI at point of sale of the credit product. On 14 October 2010, the CC published its final decision on remedies following the remittal which confirmed the point of sale prohibition. The deadline for implementation will be 2010.CC intends to make the final order in the first quarter of 2011, with the key measures coming into force in October 2011 and April 2012.
The FSAFinancial Services Authority (FSA) has been conducting a broad industry thematic review of PPI sales practices and in September 2008, the FSA announced that it intendsintended to escalate its level of regulatory intervention. The FSA is expected to publish a further update in 2009. Substantial numbers of customer complaints alleging the mis-selling of PPI policies have been made to banks and to the Financial Ombudsman Service (FOS) and many of these are being upheld by the FOS against the banks. Discussions
Following unsuccessful negotiations with the industry, the FSA issued consultation papers on PPI complaint handling and redress in September 2009 and again in March 2010. The FSA published its final policy statement on 10 August 2010 and instructed firms to implement the measures contained in it by 1 December 2010. The new rules impose significant changes with respect to the handling of mis-selling PPI complaints. On 8 October 2010, the British Bankers’ Association filed an application for judicial review of the FSA’s policy statement and of related guidance issued by the FOS. The court hearing took place from 25 to 28 January 2011 and judgment is awaited. RBS Group is unable to reliably estimate the liability, if any, that might arise from this litigation or its effect on RBS Group’s consolidated net assets, operating results or cash flows in any particular period. Separately, discussions continue between the FSA the FOS and industry bodies on how best to handle these complaints. Separately, discussions are ongoing between the FSA and theRBS Group in respect of concerns expressed by the FSA over certain categories of historichistorical PPI sales.
The OFT has carried out investigations into Visa and MasterCard domestic credit card interchange rates. The decision byGender equality in insurance contracts
A ruling is expected in March 2011 from the OFTEuropean Court of Justice (ECJ) in a case relating to gender equality in the MasterCard interchange case was set aside bypricing of and the Competition Appeals Tribunalprovision of benefits under insurance contracts and whether a person’s gender can be used as one of the factors in June 2006. The OFT’s investigations in the Visa interchange case and a second MasterCard interchange case are ongoing. The outcomecalculating insurance premiums. At this stage, it is not known, but these investigationspossible to estimate the effect, if any, which the ECJ’s ruling may have an impact on the consumer credit industry in general and, therefore, on the Group’s business in this sector. On 9 February 2007, the OFT announced that it was expanding its investigation into domestic interchange rates to include debit cards.Group.
On 29 March 2007, the OFT announced that, following an initial review into bank current account charges, it had decided to conduct a market study into personalPersonal current accounts in the United Kingdom and a formal investigation into the fairness of bank current account charges.
On 16 July 2008, the OFT published the results of its market study into personal current accountsPersonal Current Accounts (PCA) in the United Kingdom. The OFT found evidence of competition and several positive features in the personal current account market but believesbelieved that the market as a whole iswas not working well for consumers and that the ability of the market to function well hashad become distorted.
On 7 October 2009, the OFT published a follow-up report summarising the initiatives agreed between the OFT and personal current account providers to address the OFT’s concerns about transparency and switching, following its market study. Personal current account providers will take a number of steps to improve transparency, including providing customers with an annual summary of the cost of their account and making charges prominent on monthly statements. To improve the switching process, a number of steps are being introduced following work with BACS, the payment processor, including measures to reduce the impact on consumers of any problems with transferring direct debits.
Notes on the accountscontinued | Financial statements |
On 22 December 2009, the OFT published a further report in which it stated that it continued to have significant concerns about the operation of the personal current account market in the United Kingdom, in particular in relation to unarranged overdrafts, and that it believed that fundamental changes are required for the market to work in the best interests of bank customers. The OFT stated that it would discuss these issues intensively with banks, consumer groups and other organisations, with the aim of reporting on progress by the end of March 2010. On 16 March 2010, the OFT announced that it had secured agreement from the banks on four industry-wide initiatives, namely minimum standards on the operation of opt-outs from unarranged overdrafts, new working groups on information sharing with customers, best practice for PCA customers in financial difficulties and incurring charges, and PCA providers to publish their policies on dealing with PCA customers in financial difficulties. The OFT also announced its plan to conduct six-monthly ongoing reviews, to fully review the market again in 2012 and to undertake a brief analysis on barriers to entry. The first six-monthly ongoing review was completed in September 2010. The OFT noted progress in the areas of switching, transparency and unarranged overdrafts for the period March to September 2010, as well as highlighting further changes the OFT expects to see in the market. The next progress report is expected to be published by the OFT in March 2011.
On 26 May 2010, the OFT announced its review of barriers to entry. The review concerns retail banking for individuals and small and medium size enterprises (up to £25 million turnover) and will look at products which require a banking licence to sell mortgages, loan products and, where appropriate, other products such as insurance or credit cards where cross-selling may facilitate entry or expansion. The OFT published its report in November 2010. It advised that it expected its review to be relevant to the Independent Commission on Banking, the FSA, HM Treasury and the Department for Business, Innovation and Skills and to the devolved governments in the United Kingdom. The OFT has not indicated whether it will undertake any further work. The report maintained that barriers to entry remain, in particular regarding switching, branch networks and brands. At this stage, it is not possible to estimate the effect of the OFT’s report and recommendations regarding barriers to entry upon RBS Group.
Equity underwriting
On 10 June 2010, the OFT announced its intention to conduct a market study into equity underwriting and related services and sought views on scope by 9 July 2010. The OFT study was formally launched on 6 August 2010. The OFT undertook to examine the underwriting services for the different types of share issue used by FTSE 350 firms to raise capital in the UK including rights issues, placings and follow-on offers but excluding initial public offerings. The OFT has been looking at the way that the market works and the following three key issues: (i) how underwriting services are purchased; (ii) how underwriting services are provided; and (iii) how the regulatory environment affects the provision of underwriting services. The OFT published its report on 27 January 2011 identifying certain concerns around the level of equity underwriting fees. The OFT has identified a number of options which would enable companies and institutional shareholders to address these concerns and allow them to drive greater competition in the market. It is currently consulting with the banking industry, consumer groups and interested parties on its report. After this consultation the OFT will decide on next steps, which could include further discussions or agreed remedies with the industry, or possibly a reference ofprovisional decision not to refer the market to the CC.
The OFT’s investigation into the fairness of bank current account charges RBS Group is ongoing. On 12 August 2008,engaged in the OFT indicatedmarket study and it is not possible to estimate with any certainty what effect this study and any related developments may have on RBS Group, its business or results of operations.
Independent Commission on Banking
On 16 June 2010, HM Treasury published the terms of reference for the Government’s Independent Commission on Banking (ICB). The ICB is considering the structure of the United Kingdom banking sector and is looking at structural and non-structural measures to reform the banking system and to promote competition. It is mandated to formulate policy recommendations with a view to: (i) reducing systemic risk in the banking sector, exploring the risk posed by banks of different size, scale and function; (ii) mitigating moral hazard in the banking system; (iii) reducing the likelihood and impact of a bank’s failure; and (iv) promoting competition in retail and investment banking with a view to ensuring that the needs of banks’ customers are served efficiently and considering the extent to which large banks can gain competitive advantage from being perceived as “too big to fail”.
The ICB reports to the Cabinet Committee on Banking Reform and is required to produce a final report by the end of September 2011. RBS Group has responded to the call for evidence by the ICB. In addition it has attended a private hearing, as well as public hearings in Edinburgh and other banks that, althoughCardiff in December 2010. An issues paper by the ICB is expected in spring 2011. At this stage it hadis not concluded its investigation and had reached no final view, it had serious concerns that contractual terms relatingpossible to Relevant Charges in personal current account agreements were unfair underestimate the Regulations. The OFT is currently consulting with the Group and other banks on this issue. Given the stageeffect of the investigation, theICB’s report and recommendations upon RBS Group, cannot reliably estimate the impact of any adverse outcome of the OFT’s market study or investigation upon it, if any. However,
US dollar clearing activities
In May 2010, following a criminal investigation by the Group is co-operating fully with the OFT to achieve resolutionUnited States Department of the matters under investigation.
On 26 January 2007, the FSA issued a Statement of Good Practice relating to Mortgage Exit Administration Fees. On 1 March 2007, the Group adopted a policy of charging all customers the fee applicable at the time the customers took out the mortgage or, if later, varied their mortgage. The Group believes that it is currently in compliance with the Statement of Good Practice and will continue to monitorJustice (DoJ) into its performance against those standards.
United States
In July 2004, ABN AMRO signed a written agreement with the US regulatory authorities concerning ABN AMRO’s dollar clearing activities, in the New York branch. In addition, in December 2005, ABN AMRO agreed to a Cease and Desist Order with the Dutch Central Bank and various US federal and state regulators. This involved an agreement to pay an aggregate civil penaltyOffice of US$75 million and a voluntary endowment of US$5 million in connection with deficiencies in the US dollar clearing operations at ABN AMRO’s New York branch and OFAC compliance procedures regarding transactions originating at its Dubai branch. ABN AMRO and members of ABN AMRO’s management continue to provide information to law enforcement authorities in connection with ongoing criminal investigations relating to ABN AMRO’s dollar clearing activities, OFACForeign Assets Control compliance procedures and other Bank Secrecy Act compliance matters. The Cease and Desist Ordermatters, RBS NV formally entered into a Deferred Prosecution Agreement (DPA) with the Dutch Central BankDoJ resolving the investigation. The investigation was liftedin relation to activities before the Consortium Members acquired ABN AMRO Holding N.V. (now known as RBS Holdings N.V.). The agreement was signed by RBS NV and is binding on 26 July 2007that entity and its subsidiaries. Pursuant to the CeaseDPA, RBS NV paid a penalty of US$500 million and Desist Order agreed that it will comply with the US authoritiesterms of the DPA and continue to co-operate fully with any further investigations. Payment of the penalty was lifted on 9 September 2008. Although no written agreement has yet been reached and negotiations are ongoing, ABN AMRO has reachedmade from a provision established in April 2007 when an agreement in principle with the US Department of Justice that would resolve all presently known aspectsto settle was first announced. Upon satisfaction of the ongoing investigation. Underconditions of the DPA for the period of 12 months from May 2010, the matter will be fully resolved. Failure to comply with the terms of the agreementDPA during the 12 month period could result in principle, ABN AMROthe DoJ recommencing its investigations, the outcome of which would be uncertain and could result in public censure and fines or have an adverse effect on RBS Holdings N.V.’s operations, any of which could have a material adverse effect on its business, reputation, results of operation and financial condition.
Notes on the accountscontinued | Financial statements |
34 Memorandum items continued
Securitisation and collateralised debt obligation business
In September and October 2010,the United States would enter into a deferred prosecution agreement in which ABN AMRO would waive indictment and agree to the filingSEC requested voluntary production of information concerning residential mortgage backed securities underwritten by subsidiaries of RBS Group during the period from September 2006 to July 2007 inclusive. In November 2010, the SEC commenced formal proceedings and requested testimony from RBS employees. The investigation is in its preliminary stages and it is difficult to predict any potential exposure that may result.
In June 2009, in connection with an investigation into the role of investment banks in the United States District Court charging it with certain violationsorigination and securitisation of federal law based onsub prime loans in Massachusetts, the Massachusetts Attorney General issued subpoenas to various banks, including an RBS Group subsidiary, seeking information disclosedrelated to residential mortgage lending practices and sales and securitisation of residential mortgage loans. This investigation is ongoing and RBS Group is co-operating.
Previously, in an agreed factual statement. ABN AMRO would also agree to continue co-operating in2008, the United States’ ongoing investigation and to settle all known civil and criminal claims currently held by the United States for the sum of US$500 million. The precise terms of the deferred prosecution agreement are still under negotiation.
These compliance issues and the related sanctions and investigations have had, and will continue to have, an impact on ABN AMRO’s operations in the United States, including limitations on expansion. ABN AMRO is actively exploring all possible options to resolve these issues. The ultimate resolution of these compliance issues and related investigations and the nature and severity of possible additional sanctions cannot be predicted.
The New York State Attorney General has issued subpoenas to a wide array of participants in the sub-prime mortgagesecuritisation and securities industry, including mortgage originators, appraisers, due diligence firms, investment banks and rating agencies, focusing on the information underwriters obtained as part of the due diligence process from the independent due diligence firms and whether that information is adequately disclosed to investors.firms. RBS Greenwich Capital has producedGroup completed its production of documents requested by the New York State Attorney General in 2009, principally producing documents related to sub-prime loans that were pooled into one securitisation transaction. More recently, in September 2010, RBS Group subsidiaries received a request from the Nevada State Attorney General requesting information related to securitisations of mortgages issued by three specific originators. The investigation by the Nevada Attorney General is in the early stages and therefore it is difficult to predict the potential exposure from any such investigation. RBS Group and its subsidiaries are co-operating with these various investigations and requests.
US mortgages
RBS's Global Banking & Markets N.A. (GBM N.A.), has been a purchaser of non-agency US residential mortgages in the secondary market, and an issuer and underwriter of non-agency residential mortgage backed securities (RMBS). GBM N.A. did not originate or service any US residential mortgages and it was not a significant seller of mortgage loans to government sponsored enterprises (GSEs) (e.g. the Federal National Mortgage Association and the Federal Home Loan Mortgage Association).
In issuing RMBS, GBM N.A. generally assigned certain representations and warranties regarding the characteristics of the underlying loans made by the originator of the residential mortgages; however, in some circumstances, GBM N.A. made such representations and warranties itself. Where GBM N.A. has given those or other representations and warranties (whether relating to underlying loans or otherwise), GBM N.A. may be contractually required to repurchase such loans or indemnify certain parties against losses for certain breaches of such representations and warranties. In certain instances where it is required to repurchase loans or related securities, GBM N.A. may be able to assert claims against third parties who provided representations or warranties to GBM N.A. when selling loans to it; although the ability to make recoveries against such parties and outcome of such claims would be uncertain. During the two-year period ended 31 December 2010, GBM N.A. has received approximately US$38 million in repurchase demands in respect of loans made and related securities sold where obligations in respect of contractual representations or warranties were undertaken by GBM N.A. However, repurchase demands presented to GBM N.A. are subject to challenge and, to date, GBM N.A. has rebutted a significant percentage of these claims.
GBM N.A. has been named as a defendant in a number of suits relating to its role as issuer and underwriter of RMBS (see section above ‘other securitisation and securities related litigation in the United States’). Those lawsuits are in their early stages and we are not able to predict the outcome of such proceedings or their effect on the Group.
Citizens Financial Group (CFG) has not been an issuer or underwriter of non-agency RMBS. However, CFG is an originator and servicer of residential mortgages, and it routinely sells such mortgage loans in the secondary market and to GSEs. In the context of such sales, CFG makes certain representations and warranties regarding the characteristics of the underlying loans and, as a result, may be contractually required to repurchase such loans or indemnify certain parties against losses for certain breaches of the representations and warranties concerning the underlying loans. During the two-year period ended 31 December 2010, CFG has received approximately US$26 million in repurchase demands in respect of loans originated. However, repurchase demands presented to CFG are subject to challenge and, to date, CFG has rebutted a significant percentage of these claims.
Although there has been disruption in the ability of certain financial institutions operating in the United States to complete foreclosure proceedings in respect of US mortgage loans in a timely manner (or at all) over the last year (including as a result of interventions by certain states and local governments), to date, CFG has not been materially impacted by such disruptions and the Group has not ceased making foreclosures.
The Group cannot estimate what the future level of repurchase demands or ultimate exposure of GBM N.A. or CFG may be, and cannot give any assurance that the historical experience will continue in the future. Furthermore, the Group is unable estimate the extent to which the matters described above will impact it and future developments may have an adverse impact on the Group’s business, financial condition, results of operations, cash flow and the value of its securities.
Notes on the accountscontinued | Financial statements |
Other investigations
In additionApril 2009, the FSA notified RBS Group that it was commencing a supervisory review of the acquisition of ABN AMRO in 2007 and the 2008 capital raisings and an investigation into conduct, systems and controls within the Global Banking & Markets division of RBS Group. RBS Group and its subsidiaries co-operated fully with this review and investigation. On 2 December 2010, the FSA confirmed that it had completed its investigation and had concluded that no enforcement action, either against RBS Group or against individuals, was warranted. RBS Group is engaging constructively with the FSA with regard to the above,publication of a report by the FSA relating to the supervisory review, subject to any necessary commercial constraints.
In July 2010, the FSA notified RBS Group that it was commencing an investigation into the sale by Coutts & Co of ALICO (American Life Insurance Company) Premier Access Bond Enhanced Variable Rate Fund to customers between 2001 and 2008 as well as its subsequent review of those sales. On 11 January 2011, the FSA amended the date range on which their investigation is focused and the investigation start date is now December 2003. RBS Group and its subsidiaries are co-operating fully with this investigation.
In the United States, RBS Group and certain of the Group’s subsidiaries have received requests for information from various US governmental agencies, and self-regulatory organisations, and state governmental agencies including in connection with sub-prime mortgages and securitisations, collateralised debt obligations and synthetic products related to sub-prime mortgages. In particular, during March 2008, theRBS Group was advised by the SEC that it had commenced a non-public, formal investigation relating to theRBS Group’s USUnited States sub-prime securities exposures and USUnited States residential mortgage exposures. TheRBS Group and its subsidiaries are co-operatingco-operating with these various requests for information and investigations.
Litigation
United Kingdom
In commonThe Federal Reserve and state banking supervisors have been reviewing RBS Group’s US operations and RBS Group and its subsidiaries have been required to make improvements with other banksrespect to various matters, including enterprise-wide governance, Bank Secrecy Act and anti-money laundering compliance, risk management and asset quality. RBS Group is in the United Kingdom, the Royal Bankprocess of implementing measures for matters identified to date. RBS Group may become subject to formal and NatWest have received claimsinformal supervisory actions and complaints from a large number of customers challenging unarranged overdraft charges (the ‘Charges’) as contravening the Unfair Terms in Consumer Contracts Regulations 1999 (the ‘Regulations’)may be required by its US banking supervisors to take further actions and implement additional remedial measures with respect to these and additional matters. Any limitations or being unenforceable penalties (or both).
On 27 July 2007, the OFT issued proceedings in a test case against the banks which was intended to determine certain preliminary issues concerning the legal status and enforceability of contractual terms relating to the Charges. Because of the test case, most existing and new claims in the County Courts are currently stayed, the FSA temporarily waived the customer complaints-handling process and there is a standstill of Financial Ombudsman Service decisions.
32 Memorandum items (continued)
A High Court judgment in April 2008 addressed preliminary issues in respect of the banks’ contractual terms relating to the Charges in force in early 2008 (the ‘Current Terms’). The judgment held that the Current Terms used by the Royal Bank and NatWest (i) are not unenforceable as penalties, but (ii) are not exempt from assessment for fairness under the Regulations. The Group (in common with the other banks) has accepted that the ruling in the April judgment that the Current Terms are not exempt from assessment for fairness applies also to a sample of the Royal Bank and NatWest contractual terms relating to the Charges in force between 2001 and 2007 (the ‘Historic Terms’). The High Court made an order to this effect in October 2008.
The Group and the other banks have appealed against the rulings in April and October 2008 that the Current Terms and Historic Terms are not exempt from assessment for fairness under the Regulations. The hearing of the appeal in relation to Current Terms took place before the Court of Appeal in October and November 2008. The decision of the Court of Appeal is expected shortly. The appeal in relation to the Historic Terms is stayed pending the resolution of the appeal in relation to the Current Terms.
High Court judgmentsconditions placed on further preliminary issues were handed down in October 2008 and January 2009. These judgments primarily addressed the question of whether certain Historic Terms were capable of being unenforceable penalties. The Judge decided that all of the Royal Bank’s and most of NatWest’s Historic Terms were not penalties, but that a term contained in a set of NatWest 2001 terms and conditions was a contractual prohibition against using a card to obtain an unarranged overdraft. The Judge did not decide whether any charge payable upon a breach of this prohibition was a penalty. The Group has not appealed that decision.
The issues relating to the legal status and enforceability of the Charges are complex. The Group maintains that its Charges are fair and enforceable and believes that it has a number of substantive and credible defences. The Group cannot at this stage predict with any certainty the final outcome of the customer claims and complaints, the appeals referred to above and any further stages of the test case. It is unable reliably to estimate the liability, if any, that may arise as a result of or in connection with these matters or its effect on theRBS Group’s consolidated net assets, operating results or cash flows in any particular period.
United States
Proceedings, including consolidated class actions on behalf of former Enron securities holders, have been broughtactivities in the United States, against a large numberas well as the terms of defendants, including theany supervisory action applicable to RBS Group following the collapse of Enron. The claims against the Group could be significant; the class plaintiff’s position is that each defendant is responsible for an entire aggregate damage amount less settlements – they have not quantified claimed damages against the Group in particular. The Group considers that it has substantial and credible legal and factual defences to these claims and will continue to defend them vigorously. Recent decisions by the US Supreme Court and the US Federal Court for the Fifth Circuit provide further support for the Group’s position. The Group is unable reliably to estimate the liability, if any, that might arise or its effect on the Group’s consolidated net assets, operating results or cash flows in any particular period.
Group companies have been named as defendants in a number of purported class action and other lawsuits in the United States that relate to the sub-prime mortgage business. In general, the cases involve the issuance of sub-prime-related securities or the issuance of shares in companies with sub-prime-related exposure, where the plaintiffs have brought actions against the issuers and underwriters (including Group companies) of such securities claiming that certain disclosures made in connection with the relevant offerings of such securities were false or misleading. The Group considers that it has substantial and credible legal and factual defences to these claims and will continue to defend them vigorously. The Group does not currently expect that these lawsuits, individually or in the aggregate, will have a material impact on its consolidated net assets, operating results or cash flows in any particular period.
The company and a number of its subsidiaries and certain individual officers and directors have been named as defendants in a number of class action complaints filed in the United States District Court for the Southern District of New York. The complaints allege that public filings in connection with the issuance of non-cumulative dollar preference shares, ADS, including Series Q, Series R, Series S and Series T, contained false and misleading statements, and variously assert claims under Sections 11, 12 and 15 of the Securities Act 1933, Section 10 of the Securities Exchange Act of 1934 and SEC Rule 10b-5. Plaintiffs seek unquantified damages on behalf of purchasers of these shares. The proceedings are in their initial stages. The Group considers that it has substantial and credible legal and factual defences to these claims and will defend them vigorously. The Group is unable reliably to estimate the liability, if any, that might arise or its effect on the Group’s consolidated net assets, operating results or cash flows in any particular period.
Other disputes, legal proceedings and litigation
Members of the Group are engaged in other litigation in the United Kingdom and a number of overseas jurisdictions, including the United States, involving claims by and against them arising in the ordinary course of business. The Group has reviewed these other actual, threatened and known potential claims and proceedings and, after consulting with its legal advisers, does not expect that the outcome of these other claims and proceedings will, could have a material adverse effect on its consolidated net assets, operatingRBS Group’s business, results or cash flows in any particular period.of operations and financial condition.
Notes on the accountscontinued | Financial statements |
35 Net cash inflow/(outflow) from operating activities
| | | Group | | | Company | |
| | | 2010 | | | 2009 | | | 2008 | | | 2010 | | | 2009 | | | 2008 | |
| | | | £m | | | | £m | | | | £m | | | | £m | | | | £m | | | | £m | |
| Operating loss before tax - continuing operations | | | (399 | ) | | | (2,647 | ) | | | (25,691 | ) | | | (4,471 | ) | | | (1,286 | ) | | | (10,017 | ) |
| Operating loss before tax - discontinued operations | | | (541 | ) | | | (49 | ) | | | (10,937 | ) | | | — | | | | — | | | | — | |
| (Increase)/decrease in prepayments and accrued income | | | (67 | ) | | | 433 | | | | (921 | ) | | | — | | | | — | | | | — | |
| Interest on subordinated liabilities | | | 500 | | | | 1,490 | | | | 2,144 | | | | 462 | | | | 537 | | | | 499 | |
| (Decrease)/increase in accruals and deferred income | | | (1,915 | ) | | | (1,538 | ) | | | 3,961 | | | | (1 | ) | | | (1 | ) | | | 7 | |
| Provisions for impairment losses | | | 9,298 | | | | 14,950 | | | | 8,072 | | | | — | | | | — | | | | — | |
| Loans and advances written-off net of recoveries | | | (5,631 | ) | | | (6,540 | ) | | | (2,829 | ) | | | — | | | | — | | | | — | |
| Unwind of discount on impairment losses | | | (455 | ) | | | (408 | ) | | | (194 | ) | | | — | | | | — | | | | — | |
| Profit on sale of property, plant and equipment | | | (50 | ) | | | (43 | ) | | | (167 | ) | | | — | | | | — | | | | — | |
| Loss/(profit) on sale of subsidiaries and associates | | | 107 | | | | 135 | | | | (943 | ) | | | — | | | | — | | | | (487 | ) |
| Profit on sale of securities | | | (496 | ) | | | (294 | ) | | | (342 | ) | | | — | | | | — | | | | — | |
| Charge for defined benefit pension schemes | | | 540 | | | | 659 | | | | 490 | | | | — | | | | — | | | | — | |
| Pension scheme curtailment gains | | | (78 | ) | | | (2,148 | ) | | | — | | | | — | | | | — | | | | — | |
| Cash contribution to defined benefit pension schemes | | | (832 | ) | | | (1,153 | ) | | | (810 | ) | | | — | | | | — | | | | — | |
| Other provisions utilised | | | (211 | ) | | | (159 | ) | | | (32 | ) | | | — | | | | — | | | | — | |
| Depreciation and amortisation | | | 2,220 | | | | 2,809 | | | | 3,154 | | | | — | | | | — | | | | — | |
| Gain on redemption of own debt | | | (553 | ) | | | (3,790 | ) | | | — | | | | (53 | ) | | | (238 | ) | | | — | |
Write-down of goodwill and other intangible assets | | | 10 | | | | 363 | | | | 32,581 | | | | — | | | | — | | | | — | |
Write-down of investment in subsidiaries | | | — | | | | — | | | | — | | | | 5,124 | | | | 5,139 | | | | 14,321 | |
| Elimination of foreign exchange differences | | | (691 | ) | | | 12,217 | | | | (41,874 | ) | | | 272 | | | | (753 | ) | | | 1,778 | |
| Elimination of non-cash items on discontinued activities | | | — | | | | — | | | | 592 | | | | — | | | | — | | | | — | |
| Other non-cash items | | | 875 | | | | 1,404 | | | | 2,167 | | | | — | | | | 21 | | | | 2 | |
| Net cash inflow/(outflow) from trading activities | | | 1,631 | | | | 15,691 | | | | (31,579 | ) | | | 1,333 | | | | 3,419 | | | | 6,103 | |
| Decrease/(increase) in loans and advances to banks and customers | | | 42,766 | | | | 151,568 | | | | (5,469 | ) | | | (6,300 | ) | | | 4,121 | | | | (15,542 | ) |
| Decrease/(increase) in securities | | | 8,723 | | | | (5,902 | ) | | | 75,964 | | | | (168 | ) | | | (1,286 | ) | | | — | |
| Decrease/(increase) in other assets | | | 445 | | | | (1,839 | ) | | | (5,845 | ) | | | 105 | | | | (10 | ) | | | (73 | ) |
| Decrease/(increase) in derivative assets | | | 10,741 | | | | 544,744 | | | | (708,607 | ) | | | (306 | ) | | | (1 | ) | | | (995 | ) |
| Changes in operating assets | | | 62,675 | | | | 688,571 | | | | (643,957 | ) | | | (6,669 | ) | | | 2,824 | | | | (16,610 | ) |
| (Decrease)/increase in deposits by banks and customers | | | (24,794 | ) | | | (131,685 | ) | | | (78,166 | ) | | | (78 | ) | | | 11,533 | | | | (4,064 | ) |
| Increase/(decrease) in insurance liabilities | | | 494 | | | | 429 | | | | (186 | ) | | | — | | | | — | | | | — | |
| (Decrease)/increase in debt securities in issue | | | (28,493 | ) | | | (34,528 | ) | | | 27,222 | | | | (3,020 | ) | | | (1,828 | ) | | | (1,794 | ) |
| Increase/(decrease) in other liabilities | | | 1,108 | | | | 20 | | | | (8,869 | ) | | | (267 | ) | | | (66 | ) | | | 32 | |
| Increase/(decrease) in derivative liabilities | | | 2,454 | | | | (540,540 | ) | | | 699,601 | | | | (215 | ) | | | 85 | | | | 182 | |
| Increase/(decrease) in settlement balances and short positions | | | 3,651 | | | | 1,769 | | | | (37,864 | ) | | | 11 | | | | (11 | ) | | | — | |
| Changes in operating liabilities | | | (45,580 | ) | | | (704,535 | ) | | | 601,738 | | | | (3,569 | ) | | | 9,713 | | | | (5,644 | ) |
| Total income taxes received/(paid) | | | 565 | | | | (719 | ) | | | (1,540 | ) | | | (133 | ) | | | 409 | | | | 119 | |
| Net cash inflow/(outflow) from operating activities | | | 19,291 | | | | (992 | ) | | | (75,338 | ) | | | (9,038 | ) | | | 16,365 | | | | (16,032 | ) |
| | | | | | | |
| | | | 2008 £m | | | | 2007 £m | | | | 2006 £m | | | | 2008 £m | | | | 2007 £m | | | | 2006 £m | |
| Operating (loss)/profit before tax | | | (40,667 | ) | | | 9,832 | | | | 9,186 | | | | (10,017 | ) | | | 2,372 | | | | 3,486 | |
| Operating profit before tax on discontinued activities | | | 4,208 | | | | 68 | | | | — | | | | — | | | | — | | | | — | |
| (Increase)/decrease in prepayments and accrued income | | | (921 | ) | | | (662 | ) | | | 322 | | | | — | | | | (1 | ) | | | — | |
| Interest on subordinated liabilities | | | 2,144 | | | | 1,518 | | | | 1,386 | | | | 499 | | | | 470 | | | | 520 | |
| Increase/(decrease) in accruals and deferred income | | | 3,961 | | | | (818 | ) | | | 515 | | | | 7 | | | | — | | | | (27 | ) |
| Provisions for impairment losses | | | 8,072 | | | | 1,968 | | | | 1,877 | | | | — | | | | — | | | | — | |
| Loans and advances written-off net of recoveries | | | (2,829 | ) | | | (1,669 | ) | | | (1,626 | ) | | | — | | | | — | | | | — | |
| Unwind of discount on impairment losses | | | (194 | ) | | | (164 | ) | | | (142 | ) | | | — | | | | — | | | | — | |
| Profit on sale of property, plant and equipment | | | (167 | ) | | | (741 | ) | | | (216 | ) | | | — | | | | — | | | | — | |
| Profit on sale of subsidiaries and associates | | | (943 | ) | | | (67 | ) | | | (44 | ) | | | (487 | ) | | | — | | | | — | |
| Profit on sale of securities | | | (342 | ) | | | (544 | ) | | | (369 | ) | | | — | | | | — | | | | — | |
| Charge for defined benefit pension schemes | | | 490 | | | | 489 | | | | 580 | | | | — | | | | — | | | | — | |
| Cash contribution to defined benefit pension schemes | | | (810 | ) | | | (599 | ) | | | (536 | ) | | | — | | | | — | | | | — | |
| Other provisions utilised | | | (32 | ) | | | (211 | ) | | | (42 | ) | | | — | | | | — | | | | — | |
| Depreciation and amortisation | | | 3,154 | | | | 1,932 | | | | 1,678 | | | | — | | | | — | | | | — | |
| Write down of goodwill and other intangible assets | | | 32,581 | | | | — | | | | — | | | | — | | | | — | | | | — | |
| Write down of investment in subsidiaries | | | — | | | | — | | | | — | | | | 14,321 | | | | — | | | | — | |
| Elimination of foreign exchange differences | | | (41,874 | ) | | | (10,282 | ) | | | 4,516 | | | | 1,778 | | | | (58 | ) | | | (22 | ) |
| Elimination of non-cash items on discontinued activities | | | 592 | | | | 62 | | | | — | | | | — | | | | — | | | | — | |
| Other non-cash items | | | 1,998 | | | | (327 | ) | | | (1,395 | ) | | | 2 | | | | 2 | | | | 45 | |
| Net cash (outflow)/inflow from trading activities | | | (31,579 | ) | | | (215 | ) | | | 15,690 | | | | 6,103 | | | | 2,785 | | | | 4,002 | |
| (Increase)/decrease in loans and advances to banks and customers | | | (5,469 | ) | | | (90,829 | ) | | | (44,525 | ) | | | (15,542 | ) | | | (8 | ) | | | 346 | |
| Decrease/(increase) in securities | | | 75,964 | | | | (26,167 | ) | | | (16,703 | ) | | | — | | | | — | | | | — | |
| (Increase)/decrease in other assets | | | (5,845 | ) | | | (384 | ) | | | 671 | | | | (73 | ) | | | — | | | | 2 | |
| (Increase)/decrease in derivative assets | | | (708,607 | ) | | | (88,948 | ) | | | (18,616 | ) | | | (995 | ) | | | (173 | ) | | | 55 | |
| Changes in operating assets | | | (643,957 | ) | | | (206,328 | ) | | | (79,173 | ) | | | (16,610 | ) | | | (181 | ) | | | 403 | |
| (Decrease)/increase in deposits by banks and customers | | | (78,166 | ) | | | 81,645 | | | | 63,091 | | | | (4,064 | ) | | | 4,677 | | | | (164 | ) |
| (Decrease)/increase in insurance liabilities | | | (186 | ) | | | 2,706 | | | | 244 | | | | — | | | | — | | | | — | |
| Increase/(decrease) in debt securities in issue | | | 27,222 | | | | 59,735 | | | | (4,457 | ) | | | (1,794 | ) | | | 10,936 | | | | (803 | ) |
| (Decrease)/increase in other liabilities | | | (8,869 | ) | | | (1,036 | ) | | | 935 | | | | 32 | | | | (7 | ) | | | 14 | |
| Increase in derivative liabilities | | | 699,601 | | | | 83,466 | | | | 19,272 | | | | 182 | | | | 137 | | | | 42 | |
| (Decrease)/increase in settlement balances and short positions | | | (37,864 | ) | | | 8,073 | | | | 4,068 | | | | — | | | | — | | | | — | |
| Changes in operating liabilities | | | 601,738 | | | | 234,589 | | | | 83,153 | | | | (5,644 | ) | | | 15,743 | | | | (911 | ) |
| Total income taxes (paid)/received | | | (1,540 | ) | | | (2,442 | ) | | | (2,229 | ) | | | 119 | | | | 6 | | | | 154 | |
| Net cash (outflow)/inflow from operating activities | | | (75,338 | ) | | | 25,604 | | | | 17,441 | | | | (16,032 | ) | | | 18,353 | | | | 3,648 | |
Notes on the accountscontinued | Financial statements |
(a) Acquisition of ABN AMRO
Acquisitions and disposals
On 17 October 2007, the Group, through its subsidiary RFS Holdings B.V. (RFS), acquired 99% of the ordinary shares of ABN AMRO Holding N.V., the holding company of a major European banking group based in the Netherlands with subsidiaries that undertake commercial banking operations, investment banking and other related financial activities. During 2008, RFS acquired the remaining 1 % of the ordinary shares of ABN AMRO.| | | Group | |
| | | | 2010 £m | | | | 2009 £m | | | | 2008 £m | |
| Fair value given for businesses acquired | | | (210 | ) | | | (115 | ) | | | (1,810 | ) |
| Non-cash consideration | | | — | | | | — | | | | (17 | ) |
| Net outflow of cash in respect of purchases | | | (210 | ) | | | (115 | ) | | | (1,827 | ) |
| | | | | | | | | | | | | |
| Other assets sold | | | 4,539 | | | | 896 | | | | 739 | |
| Non-cash consideration | | | — | | | | — | | | | (103 | ) |
| (Loss)/profit on disposal | | | (107 | ) | | | (135 | ) | | | 943 | |
| Net inflow of cash in respect of disposals | | | 4,432 | | | | 761 | | | | 1,579 | |
| Dividends received from joint ventures | | | 7 | | | | 21 | | | | 89 | |
| Cash expenditure on intangible assets | | | (783 | ) | | | (562 | ) | | | 2,411 | |
| Net inflow | | | 3,446 | | | | 105 | | | | 2,252 | |
The provisional fair values of ABN AMRO’s assets and liabilities at the date of acquisition were finalised as follows:
| | | Pre-acquisition carrying amounts £m | | | Disposal groups(1) £m | | | Provisional fair value adjustments(2) £m | | | Amendments to provisional fair value adjustments £m | | | Recognised acquisition values(2) £m | |
| Cash and balances at central banks | | | 7,263 | | | | (186 | ) | | | — | | | | — | | | | 7,077 | |
| Loans and advances to banks | | | 120,120 | | | | (3,646 | ) | | | — | | | | — | | | | 116,474 | |
| Loans and advances to customers | | | 314,287 | | | | (26,158 | ) | | | (1,843 | ) | | | (699 | ) | | | 285,587 | |
| Treasury and other eligible bills and debt and equity securities | | | 166,018 | | | | (3,804 | ) | | | — | | | | — | | | | 162,214 | |
| Derivatives | | | 86,695 | | | | (322 | ) | | | — | | | | — | | | | 86,373 | |
| Intangible assets | | | 4,239 | | | | (3,522 | ) | | | 4,282 | | | | 788 | | | | 5,787 | |
| Property, plant and equipment | | | 2,062 | | | | (747 | ) | | | 175 | | | | (5 | ) | | | 1,485 | |
| Other assets | | | 32,710 | | | | (7 | ) | | | 1,357 | | | | (180 | ) | | | 33,880 | |
Assets of disposal groups(1) | | | 2,987 | | | | 38,392 | | | | 787 | | | | (98 | ) | | | 42,068 | |
| | | | | | | | | | | | | | | | | | | | | |
| Deposits by banks | | | (160,906 | ) | | | 2,808 | | | | (321 | ) | | | 322 | | | | (158,097 | ) |
| Customer accounts | | | (253,583 | ) | | | 13,786 | | | | (152 | ) | | | 2 | | | | (239,947 | ) |
| Debt securities in issue | | | (134,630 | ) | | | 5,937 | | | | 776 | | | | (551 | ) | | | (128,468 | ) |
| Settlement balances and short positions | | | (44,748 | ) | | | 36 | | | | — | | | | — | | | | (44,712 | ) |
| Derivatives | | | (85,491 | ) | | | 417 | | | | — | | | | — | | | | (85,074 | ) |
| Subordinated liabilities | | | (11,748 | ) | | | 868 | | | | 685 | | | | (61 | ) | | | (10,256 | ) |
| Other liabilities | | | (21,268 | ) | | | 271 | | | | (1,814 | ) | | | (114 | ) | | | (22,925 | ) |
| Liabilities of disposal groups (1) | | | (2,377 | ) | | | (24,123 | ) | | | – | | | | – | | | | (26,500 | ) |
| Net identifiable assets and liabilities | | | 21,630 | | | | – | | | | 3,932 | | | | (596 | ) | | | 24,966 | |
| Minority interests | | | | | | | | | | | | | | | | | | | (242 | ) |
| Goodwill on acquisition | | | | | | | | | | | | | | | | | | | 23,851 | |
| Consideration | | | | | | | | | | | | | | | | | | | 48,575 | |
| | | | | | | | | | | | | | | | | | | | | |
| Satisfied by: | | | | | | | | | | | | | | | | | | | | |
| Issue of 531 million ordinary shares of the company | | | | | | | | | | | | | | | | | | | 2,719 | |
| Cash | | | | | | | | | | | | | | | | | | | 45,786 | |
| Fees and expenses relating to the acquisition | | | | | | | | | | | | | | | | | | | 70 | |
| Consideration | | | | | | | | | | | | | | | | | | | 48,575 | |
| | | | | | | | | | | | | | | | | | | | | |
| Net cash: | | | | | | | | | | | | | | | | | | | | |
| Cash consideration | | | | | | | | | | | | | | | | | | | 45,856 | |
| Cash acquired | | | | | | | | | | | | | | | | | | | (60,093 | ) |
| | | | | | | | | | | | | | | | | | | | 14,237 | |
(1) | Banca Antonveneta SpA. and ABN AMRO’s asset management business were identified as disposal groups on the acquisition of ABN AMRO and sold during 2008. In addition, under the terms of the Consortium and Shareholders’ Agreement, consortium members other than the Group agreed to acquire, in due course, various ABN AMRO businesses including operations in Brazil (sold 1 Juy 2008), the commercial and retail businesses in the Netherlands, the private clients business and Interbanca. |
(2) | The initial accounting for the acquisition was determined provisionally at 31 December 2007 because of its complexity and the limited time available between the acquisition and the preparation of the 2007 financial statements. The principal adjustments, excluding reclassifications, on finalising fair values were: |
| (a) | The Group’s methodology for calculating the fair value of trading financial instruments produced values lower by £524 million than those recorded by ABN AMRO; |
| (b) | Following further work on identifying intangible assets, additional customer relationship assets and core deposit intangibles of £724 million have been recognised; |
| (c) | Net assets of the Netherlands pension scheme have been reduced by £250 million. |
| (d) | The fair value of private equity investments was reduced by £98 million based on additional evidence provided by disposals in 2008; |
| (e) | The liability for instruments issued by conduits should be increased by £366 million; |
No material change was required to the deferred tax effect of fair value adjustments.
It is estimated that the Group would haveGroup's reported total income of £37.2 billion and profit after tax of £7.7 billionresults from continuing operations for the year ended 31 December 2007 had all acquisitions occurred on 1 January 2007. These results would not have been materially affected by the finalisation of fair values.
(b) Other acquisitions2009 and disposals
| | | Group | |
| | | | 2008 £m | | | | 2007 £m | | | | 2006 £m | |
| Fair value given for businesses acquired | | | (1,810 | ) | | | (280 | ) | | | (21 | ) |
| Cash and cash equivalents acquired | | | — | | | | 5 | | | | — | |
| Non-cash consideration | | | (17 | ) | | | — | | | | — | |
| Net outflow of cash in respect of purchases | | | (1,827 | ) | | | (275 | ) | | | (21 | ) |
| | | | | | | | | | | | | |
| Cash and cash equivalents in businesses sold | | | — | | | | 21 | | | | 229 | |
| Other assets sold | | | 739 | | | | 16 | | | | 36 | |
| Non-cash consideration | | | (103 | ) | | | (2 | ) | | | (1 | ) |
| Profit on disposal | | | 943 | | | | 67 | | | | 44 | |
| Net inflow of cash in respect of disposals | | | 1,579 | | | | 102 | | | | 308 | |
| Dividends received from joint ventures | | | 89 | | | | 11 | | | | 29 | |
| Cash expenditure on intangible assets | | | 2,411 | | | | (435 | ) | | | (379 | ) |
| Net outflow | | | 2,252 | | | | (597 | ) | | | (63 | ) |
The Group’s reported result from continuing operations for the year2008 would not have been materially affected had all acquisitions occurred on 1 January 2008.2008 or 1 January 2009. The profit on disposal arisesin 2008 arose on the sales of Angel Trains, Tesco Personal Finance and the European Consumer Finance business during the year.Finance.
37 Interest received and paid
| | Group | | Company |
| | 2010 £m | 2009 £m | 2008 £m | | 2010 £m | 2009 £m | 2008 £m |
| Interest received | 23,571 | 36,396 | 52,393 | | 1,113 | 1,140 | 794 |
| Interest paid | (9,823) | (21,224) | (31,614) | | (712) | (866) | (1,325) |
| | 13,748 | 15,172 | 20,779 | | 401 | 274 | (531) |
| | | | | | | |
| | | | 2008 £m | | | | 2007 £m | | | | 2006 £m | | | | 2008 £m | | | | 2007 £m | | | | 2006 £m | |
| Interest received | | | 52,393 | | | | 31,552 | | | | 24,381 | | | | 794 | | | | 457 | | | | 594 | |
| Interest paid | | | (31,614 | ) | | | (18,407 | ) | | | (14,656 | ) | | | (1,325 | ) | | | (746 | ) | | | (632 | ) |
| | | | 20,779 | | | | 13,145 | | | | 9,725 | | | | (531 | ) | | | (289 | ) | | | (38 | ) |
Notes on the accountscontinued | Financial statements |
3638 Analysis of changes in financing during the year
| | | | | | | |
| | | Share capital, share premium, paid-in equity and merger reserve | | | | | | Share capital, share premium, paid-in equity and merger reserve | | | | |
| | | | 2008 £m | | | | 2007 £m | | | | 2008 £m | | | | 2007 £m | | | | 2008 £m | | | | 2007 £m | | | | 2008 £m | | | | 2007 £m | |
| At 1 January | | | 31,806 | | | | 24,178 | | | | 38,043 | | | | 27,654 | | | | 20,925 | | | | 13,297 | | | | 7,743 | | | | 8,194 | |
| Issue of ordinary shares | | | 49 | | | | 77 | | | | | | | | | | | | 49 | | | | 77 | | | | | | | | | |
| Issue of other equity securities | | | — | | | | 4,673 | | | | | | | | | | | | — | | | | 4,673 | | | | | | | | | |
| Placing and open offer | | | 19,741 | | | | — | | | | | | | | | | | | 19,741 | | | | | | | | | | | | | |
| Rights issue | | | 12,000 | | | | — | | | | | | | | | | | | 12,000 | | | | | | | | | | | | | |
| Net proceeds from issue of subordinated liabilities | | | | | | | | | | | 2,413 | | | | 1,018 | | | | | | | | | | | | | | | | — | |
| Repayment of subordinated liabilities | | | | | | | | | | | (1,727 | ) | | | (1,708 | ) | | | | | | | | | | | | | | | (469 | ) |
| Net cash inflow/(outflow) from financing | | | 31,790 | | | | 4,750 | | | | 686 | | | | (690 | ) | | | 31,790 | | | | 4,750 | | | | — | | | | (469 | ) |
| Acquisition of subsidiaries | | | — | | | | 2,719 | | | | — | | | | 10,256 | | | | — | | | | 2,719 | | | | — | | | | — | |
| Transfer to retained earnings | | | (14,273 | ) | | | — | | | | — | | | | — | | | | (14,273 | ) | | | — | | | | — | | | | — | |
| Currency translation and other adjustments | | | — | | | | 159 | | | | 10,425 | | | | 823 | | | | — | | | | 159 | | | | 2,571 | | | | 18 | |
| At 31 December | | | 49,323 | | | | 31,806 | | | | 49,154 | | | | 38,043 | | | | 38,442 | | | | 20,925 | | | | 10,314 | | | | 7,743 | |
37| | Group | | Company |
| | Share capital, share premium, paid-in equity and merger reserve | | Subordinated liabilities | | Share capital, share premium, paid-in equity and merger reserve | | Subordinated liabilities |
| | 2010 £m | 2009 £m | 2008 £m | | 2010 £m | 2009 £m | 2008 £m | | 2010 £m | 2009 £m | 2008 £m | | 2010 £m | 2009 £m | 2008 £m |
| At 1 January | 64,240 | 49,323 | 31,806 | | 37,652 | 49,154 | 38,043 | | 53,359 | 38,442 | 20,925 | | 8,762 | 10,314 | 7,743 |
| Issue of ordinary shares | 1 | — | 49 | | — | — | — | | 1 | — | 49 | | — | — | — |
Redemption of preference shares | 117 | (5,000) | — | | — | — | — | | 117 | (5,000) | — | | — | — | — |
| Placing and open offers | — | 5,274 | 19,741 | | — | — | — | | — | 5,274 | 19,741 | | — | — | — |
| Rights issue | — | — | 12,000 | | — | — | — | | — | — | 12,000 | | — | — | — |
| Issue of B shares | — | 25,101 | — | | — | — | — | | — | 12,801 | — | | — | — | — |
Redemption of paid-in equity | (132) | (308) | — | | — | — | — | | (132) | (308) | — | | — | — | — |
Cancellation of non- voting deferred shares | (27) | — | — | | — | — | — | | (27) | — | — | | — | — | — |
Issue of subordinated liabilities | — | — | — | | — | 2,309 | 2,413 | | — | — | — | | — | — | — |
Repayment of subordinated liabilities | — | — | — | | (1,588) | (5,145) | (1,727) | | — | — | — | | (98) | (458) | — |
Net cash (outflow)/inflow from financing | (41) | 25,067 | 31,790 | | (1,588) | (2,836) | 686 | | (41) | 12,767 | 31,790 | | (98) | (458) | — |
Investment in subsidiaries | — | — | — | | — | — | — | | — | 12,300 | — | | — | — | — |
Transfer to retained earnings | (12,252) | (10,150) | (14,273) | | — | — | — | | (12,252) | (10,150) | (14,273) | | — | — | — |
Other adjustments including foreign exchange (1) | 803 | — | — | | (9,011) | (8,666) | 10,425 | | 803 | — | — | | (616) | (1,094) | 2,571 |
| At 31 December | 52,750 | 64,240 | 49,323 | | 27,053 | 37,652 | 49,154 | | 41,869 | 53,359 | 38,442 | | 8,048 | 8,762 | 10,314 |
| (1) | The Group subordinated liabilities amount for 2010 includes £6.1 billion relating to the disposal of RFS Holdings minority interest. |
39 Analysis of cash and cash equivalents
| | | | | | | | Group | | Company |
| | | | 2008 £m | | | | 2007 £m | | | | 2006 £m | | | | 2008 £m | | | | 2007 £m | | | | 2006 £m | | 2010 £m | 2009 £m | 2008 £m | | 2010 £m | 2009 £m | 2008 £m |
| At 1 January | | | | | | | | | | | | | | | | | | | | | | | | | | | |
| — cash | | 52,796 | | | 28,378 | | | 25,476 | | | 5 | | | 11 | | | 30 | | |
| — cash equivalents | | 96,159 | | | 43,273 | | | 27,073 | | | 1,568 | | | 646 | | | 1,096 | | |
| - cash | | 95,330 | 72,425 | 52,796 | | — | — | 5 |
| - cash equivalents | | 48,856 | 62,500 | 96,159 | | 16,448 | 5,069 | 1,568 |
| | | 148,955 | | | 71,651 | | | 52,549 | | | 1,573 | | | 657 | | | 1,126 | | 144,186 | 134,925 | 148,955 | | 16,448 | 5,069 | 1,573 |
| Acquisition of subsidiaries | | — | | | 60,098 | | | — | | | — | | | — | | | — | | |
| Disposal of subsidiaries | | (3,171 | ) | | — | | | — | | | — | | | — | | | — | | (4,112) | — | (3,171) | | — | — |
| Net cash (outflow)/inflow | | (10,859 | ) | | 17,206 | | | 19,102 | | | 3,496 | | | 916 | | | (469 | ) | |
| Net cash inflow/(outflow) | | 12,456 | 9,261 | (10,859) | | (14,091) | 11,379 | 3,496 |
| At 31 December | | 134,925 | | | 148,955 | | | 71,651 | | | 5,069 | | | 1,573 | | | 657 | | 152,530 | 144,186 | 134,925 | | 2,357 | 16,448 | 5,069 |
| | | | | | | | | | | | | | | | | | | | | | | | | | | | | | |
| Comprising: | | | | | | | | | | | | | | | | | | | | | | | | | | | | | |
| Cash and balances at central banks | | 12,007 | | | 17,428 | | | 5,752 | | | — | | | — | | | — | | 56,590 | 51,811 | 12,007 | | — | — |
| Treasury bills and debt securities | | 15,623 | | | 6,818 | | | 1,596 | | | — | | | — | | | — | | 5,672 | 15,818 | 15,623 | | — | — |
| Loans and advances to banks | | 107,295 | | | 124,709 | | | 64,303 | | | 5,069 | | | 1,573 | | | 657 | | 90,268 | 76,557 | 107,295 | | 2,357 | 16,448 | 5,069 |
| Cash and cash equivalents | | 134,925 | | | 148,955 | | | 71,651 | | | 5,069 | | | 1,573 | | | 657 | | 152,530 | 144,186 | 134,925 | | 2,357 | 16,448 | 5,069 |
Certain subsidiary undertakings are required to maintain balances with the Bank of England which, at 31 December 2008,2010, amounted to £393£424 million (2007 — £439(2009 - £450 million; 2008 - £393 million). Certain subsidiary undertakings are required by law to maintain reserve balances with the Federal Reserve Bank in the US. Such reserve balances were nil at 31 December 2008 (2007 — US$1 million). ABN AMRO2010, 2009 and 2008. RBS NV had mandatory reserve deposits of €3 million€1 billion at 31 December 2010 (2009 - €6 billion; 2008 (2007 — €6 million)- €3 billion).
Notes on the accountscontinued | Financial statements |
40 Segmental analysis
(a) Divisions
The directors manage the Group primarily by class of business and present the segmental analysis on that basis. This includes the review of net interest income for each class of business - interest receivable and payable for all reportable segments is therefore presented net. Segments charge market prices for services rendered to other parts of the Group; funding charges between segments are determined by Group Treasury, having regard to commercial demands. The Group’s activitiessegment measure is operating profit/(loss) before tax, which differs from that reported previously in that it excludes fair value of own debt. Comparative data have been restated accordingly.
The Group's reportable segments are organisedon a divisional basis as follows:
Global MarketsUK Retail is focused on the provisionoffers a comprehensive range of debtbanking products and equity financing, risk management and transaction bankingrelated financial services to large businessesthe personal market. It serves customers through the RBS and financial institutionsNatWest networks of branches and ATMs in the United Kingdom, and aroundalso through telephone and internet channels.
UK Corporate is a leading provider of banking, finance, and risk management services to the world. Itscorporate and SME sector in the United Kingdom. It offers a full range of banking products and related financial services through a nationwide network of relationship managers, and also through telephone and internet channels. The product range includes asset finance through the Lombard brand.
Wealth provides private banking and investment services in the UK through Coutts & Co and Adam & Company; offshore banking through RBS International, NatWest Offshore and Isle of Man Bank; and international private banking through RBS Coutts.
Global Transaction Services (GTS) ranks among the top five global transaction services providers, offering global payments, cash and liquidity management, and trade finance and commercial card products and services. It includes the Group's corporate money transmission activities have been organised into two divisions, in the United Kingdom and the United States.
Ulster Bank is the leading retail and business bank in Northern Ireland and the third largest banking group on the island of Ireland. It provides a comprehensive range of financial services. The Retail Markets division which has a network of 236 branches, operates in the personal and financial planning sectors. The Corporate Markets division provides services to SME business customers, corporates and institutional markets.
US Retail & Commercial provides financial services primarily through the Citizens and Charter One brands. US Retail & Commercial is engaged in retail and corporate banking activities through its branch network in 12 states in the United States and through non-branch offices in other states.
Global Banking & Markets (GBM) and Global Transaction Services (GTS), in order best to serve the Group’s customers whose financial needs are global.
GBMis a leading banking partner to major corporations and financial institutions around the world, providing an extensive range of debt and equity financing, risk management and investment services to its customers.
GTS ranks among the top five global transaction services providers, offering global payments, cash and liquidity management, as well as trade finance, UK and international merchant acquiring and commercial card products and services. It includes the Group’s corporate money transmission activities in the United Kingdom and the United States.
Regional Markets The division is organised around the provision of retailalong six principal business lines: money markets; rates flow trading; currencies and commercial banking to customers in four regions: the United Kingdom, the United States, Europecommodities; equities; credit and the Middle Eastmortgage markets and Asia. This includes the provision of wealthportfolio management services both in the United Kingdom and internationally.origination.
UK Retail & Commercial Banking comprises retail, commercial and corporate banking, and wealth management services in the United Kingdom. It supplies financial services through both the Royal Bank and NatWest brands.
US Retail & Commercial Banking comprises Citizens which is engaged in retail and corporate banking activities through its branch network in 13 states in the United States and through non-branch offices in other states.
Citizens Financial Group provides financial services through the Citizens and Charter One brands.
Europe & Middle East Retail & Commercial Banking comprises Ulster Bank and the Group’s combined retail and commercial businesses in Europe and the Middle East.
Ulster Bank provides a comprehensive range of financial services across the island of Ireland. Its retail banking arm has a network of branches and operates in the personal, commercial and wealth management sectors, while its corporate markets operations provide services in the corporate and institutional markets.
Asia Retail & Commercial Banking holds prominent market positions in India, Pakistan, China and Taiwan, as well as presences in Hong Kong, Indonesia, Malaysia and Singapore. It provides financial services across four segments: affluent banking, cards and consumer finance, business banking and international wealth management, which offers private banking and investment services to clients in selected markets through the RBS Coutts brand.
RBS Insurance sells and underwrites retail and SMEprovides a wide range of general insurance over the telephone and internet, asproducts to consumers through a number of well as through brokers and partnerships. Itsknown brands include Direct Line, Churchill, Privilege, Green Flag and NIG.including; Direct Line, Churchill and Privilege sell generalPrivilege. It also provides insurance services for third party brands through its UKI Partnerships division. In the commercial sector, its NIG and Direct Line for Business operations provide insurance products for businesses via brokers or direct to the customer.respectively. Through its international division, RBS Insurance sells general insurance, mainly motor, in Spain, Germany and Italy. The IntermediaryIn addition to insurance services, RBS Insurance continues to provide support and Broker division sells general insurance productsreassurance to millions of UK motorists through independent brokers.its Green Flag breakdown recovery service and Tracker stolen vehicle recovery and telematics business.
Group ManufacturingCentral items comprises the Group’s worldwide manufacturing operations. It supports the Group’s customer-facing businesses and provides operational technology, customer support in telephony, account management, lending and money transmission, global purchasing, property and other services.
The Centre comprises groupGroup and corporate functions, such as capital raising,treasury, funding and finance, risk management, legal, communications and human resources. The Centre manages the Group’sGroup's capital resources and Group-wide regulatory projects and provides services to the operating divisions.
RFS Holdings minority interestNon-Core Division comprises those activities of ABN AMROmanages separately assets that are attributable to the other consortium members.
Share of shared assets comprises the Group’s share of the unallocated assets of ABN AMRO.
Segments charge market prices for services rendered to other parts of the Group with the exceptionintends to run off or dispose of. The division contains a range of Group Manufacturing and central items. The expenditure incurred by Group Manufacturing relates to costs principally in respect of the Group’s banking and insurance operations in the UK and Ireland. These costs reflect activities that are shared between the various customer-facing divisions. These shared costs and related assets and liabilities are not allocated to divisions in the day-to-day management of the businesses and asset portfolios primarily from the results below reflect this. Funding charges between segmentsGBM division, linked to proprietary trading, higher risk profile asset portfolios including excess risk concentrations, and other illiquid portfolios. It also includes a number of other portfolios and businesses, including regional markets businesses, that the Group has concluded are determined by Group Treasury, having regard to commercial demands. The results of each division before amortisation of purchased intangible assets, integration costs and net gain on sale of strategic investments and subsidiaries (‘Contribution’) are shown in the following table.no longer strategic.
Notes on the accountscontinued | Financial statements |
3840 Segmental analysis (continued) continued
| | | Group | |
| 2008 | | Net interest income £m | | | Non-interest income £m | | | Total £m | | | Operating expenses and insurance claims £m | | | Depreciation and amortisation £m | | | Impairment losses £m | | | Contribution £m | |
| Global Markets | | | | | | | | | | | | | | | | | | | | | |
| — Global Banking & Markets | | | 3,490 | | | | (6,010 | ) | | | (2,520 | ) | | | (3,833 | ) | | | (519 | ) | | | (3,643 | ) | | | (10,515 | ) |
| — Global Transaction Services | | | 909 | | | | 1,563 | | | | 2,472 | | | | (585 | ) | | | (9 | ) | | | (60 | ) | | | 1,818 | |
| Regional Markets | | | | | | | | | | | | | | | | | | | | | | | | | | | | |
| — UK Retail & Commercial Banking | | | 6,999 | | | | 3,999 | | | | 10,998 | | | | (2,942 | ) | | | (413 | ) | | | (1,964 | ) | | | 5,679 | |
| — US Retail & Commercial Banking | | | 2,106 | | | | 904 | | | | 3,010 | | | | (942 | ) | | | (144 | ) | | | (1,041 | ) | | | 883 | |
| — Europe & Middle East Retail & Commercial Banking | | | 1,087 | | | | 431 | | | | 1,518 | | | | (563 | ) | | | — | | | | (526 | ) | | | 429 | |
| — Asia Retail & Commercial Banking | | | 379 | | | | 402 | | | | 781 | | | | (475 | ) | | | (8 | ) | | | (171 | ) | | | 127 | |
| RBS Insurance | | | 647 | | | | 4,919 | | | | 5,566 | | | | (4,464 | ) | | | (40 | ) | | | (42 | ) | | | 1,020 | |
| Group Manufacturing | | | (202 | ) | | | (11 | ) | | | (213 | ) | | | (3,867 | ) | | | (713 | ) | | | — | | | | (4,793 | ) |
| Central Items | | | 524 | | | | (902 | ) | | | (378 | ) | | | (371 | ) | | | 55 | | | | 19 | | | | (675 | ) |
| Share of shared assets | | | (175 | ) | | | (18 | ) | | | (193 | ) | | | (62 | ) | | | (41 | ) | | | (4 | ) | | | (300 | ) |
| | | | 15,764 | | | | 5,277 | | | | 21,041 | | | | (18,104 | ) | | | (1,832 | ) | | | (7,432 | ) | | | (6,327 | ) |
| RFS Holdings minority interest | | | 2,911 | | | | 1,916 | | | | 4,827 | | | | (3,303 | ) | | | (843 | ) | | | (640 | ) | | | 41 | |
| | | | 18,675 | | | | 7,193 | | | | 25,868 | | | | (21,407 | ) | | | (2,675 | ) | | | (8,072 | ) | | | (6,286 | ) |
| Amortisation of intangibles | | | — | | | | — | | | | — | | | | — | | | | (443 | ) | | | — | | | | (443 | ) |
| Integration and restructuring costs | | | — | | | | — | | | | — | | | | (1,321 | ) | | (36 | ) | | | — | | | | (1,357 | ) |
| Goodwill and other intangibles write-downs | | | — | | | | — | | | | — | | | | (32,581 | ) | | | — | | | | — | | | | (32,581 | ) |
| | | | 18,675 | | | | 7,193 | | | | 25,868 | | | | (55,309 | ) | | | (3,154 | ) | | | (8,072 | ) | | | (40,667 | ) |
| 2007 | | | | | | | | | | | | | | | | | | | | | | | | | | | | |
| Global Markets | | | | | | | | | | | | | | | | | | | | | | | | | | | | |
| — Global Banking & Markets | | | 808 | | | | 6,011 | | | | 6,819 | | | | (2,613 | ) | | | (486 | ) | | | (67 | ) | | | 3,653 | |
| — Global Transaction Services | | | 595 | | | | 1,183 | | | | 1,778 | | | | (443 | ) | | | (6 | ) | | | (14 | ) | | | 1,315 | |
| Regional Markets | | | | | | | | | | | | | | | | | | | | | | | | | | | | |
| — UK Retail & Commercial Banking | | | 6,602 | | | | 4,504 | | | | 11,106 | | | | (3,173 | ) | | | (340 | ) | | | (1,368 | ) | | | 6,225 | |
| — US Retail & Commercial Banking | | | 1,935 | | | | 846 | | | | 2,781 | | | | (844 | ) | | | (118 | ) | | | (340 | ) | | | 1,479 | |
| — Europe & Middle East Retail & Commercial Banking | | | 958 | | | | 388 | | | | 1,346 | | | | (453 | ) | | | (6 | ) | | | (118 | ) | | | 769 | |
| — Asia Retail & Commercial Banking | | | 123 | | | | 232 | | | | 355 | | | | (235 | ) | | | (5 | ) | | | (24 | ) | | | 91 | |
| RBS Insurance | | | 611 | | | | 5,045 | | | | 5,656 | | | | (4,706 | ) | | | (45 | ) | | | — | | | | 905 | |
| Group Manufacturing | | | (192 | ) | | | (4 | ) | | | (196 | ) | | | (2,983 | ) | | | (594 | ) | | | — | | | | (3,773 | ) |
| Central Items | | | 69 | | | | (141 | ) | | | (72 | ) | | | (486 | ) | | | 8 | | | | (2 | ) | | | (552 | ) |
| Share of shared assets | | | 15 | | | | (54 | ) | | | (39 | ) | | | (37 | ) | | | — | | | | 3 | | | | (73 | ) |
| | | | 11,524 | | | | 18,010 | | | | 29,534 | | | | (15,973 | ) | | | (1,592 | ) | | | (1,930 | ) | | | 10,039 | |
| RFS Holdings minority interest | | | 545 | | | | 287 | | | | 832 | | | | (573 | ) | | | (58 | ) | | | (38 | ) | | | 163 | |
| | | | 12,069 | | | | 18,297 | | | | 30,366 | | | | (16,546 | ) | | | (1,650 | ) | | | (1,968 | ) | | | 10,202 | |
| Amortisation of intangibles | | | — | | | | — | | | | — | | | | (40 | ) | | | (222 | ) | | | — | | | | (262 | ) |
| Integration costs | | | — | | | | — | | | | — | | | | (48 | ) | | | (60 | ) | | | — | | | | (108 | ) |
| | | | 12,069 | | | | 18,297 | | | | 30,366 | | | | (16,634 | ) | | | (1,932 | ) | | | (1,968 | ) | | | 9,832 | |
| 2006 | | | | | | | | | | | | | | | | | | | | | | | | | | | | |
| Global Markets | | | | | | | | | | | | | | | | | | | | | | | | | | | | |
| — Global Banking & Markets | | | 1,028 | | | | 5,676 | | | | 6,704 | | | | (2,343 | ) | | | (465 | ) | | | (85 | ) | | | 3,811 | |
| — Global Transaction Services | | | 449 | | | | 1,081 | | | | 1,530 | | | | (334 | ) | | | (6 | ) | | | (4 | ) | | | 1,186 | |
| Regional Markets | | | | | | | | | | | | | | | | | | | | | | | | | | | | |
| — UK Retail & Commercial Banking | | | 6,350 | | | | 4,223 | | | | 10,573 | | | | (3,011 | ) | | | (347 | ) | | | (1,497 | ) | | | 5,718 | |
| — US Retail & Commercial Banking | | | 2,041 | | | | 949 | | | | 2,990 | | | | (910 | ) | | | (156 | ) | | | (180 | ) | | | 1,744 | |
| — Europe & Middle East Retail & Commercial Banking | | | 824 | | | | 320 | | | | 1,144 | | | | (360 | ) | | | (5 | ) | | | (104 | ) | | | 675 | |
| — Asia Retail & Commercial Banking | | | 52 | | | | 159 | | | | 211 | | | | (140 | ) | | | (5 | ) | | | 1 | | | | 67 | |
| RBS Insurance | | | 511 | | | | 5,168 | | | | 5,679 | | | | (4,669 | ) | | | (43 | ) | | | — | | | | 967 | |
| Group Manufacturing | | | (189 | ) | | | 9 | | | | (180 | ) | | | (2,784 | ) | | | (559 | ) | | | — | | | | (3,523 | ) |
| Central Items | | | (470 | ) | | | (179 | ) | | | (649 | ) | | | (591 | ) | | | 18 | | | | (9 | ) | | | (1,231 | ) |
| | | | 10,596 | | | | 17,406 | | | | 28,002 | | | | (15,142 | ) | | | (1,568 | ) | | | (1,878 | ) | | | 9,414 | |
| Amortisation of intangibles | | | — | | | | — | | | | — | | | | — | | | | (94 | ) | | | — | | | | (94 | ) |
| Integration costs | | | — | | | | — | | | | — | | | | (118 | ) | | | (16 | ) | | | — | | | | (134 | ) |
| | | | 10,596 | | | | 17,406 | | | | 28,002 | | | | (15,260 | ) | | | (1,678 | ) | | | (1,878 | ) | | | 9,186 | |
| | Group |
| | Net interest income | Non-interest income | Total income | Operating expenses and insurance claims | Depreciation and amortisation | Impairment losses | Operating profit/(loss) |
| 2010 | £m | £m | £m | £m | £m | £m | £m |
| UK Retail | 4,078 | 1,412 | 5,490 | (2,957) | (1) | (1,160) | 1,372 |
| UK Corporate | 2,572 | 1,323 | 3,895 | (1,498) | (173) | (761) | 1,463 |
| Wealth | 609 | 447 | 1,056 | (723) | (11) | (18) | 304 |
| Global Transaction Services | 974 | 1,587 | 2,561 | (1,459) | (5) | (9) | 1,088 |
| Ulster Bank | 761 | 214 | 975 | (573) | (2) | (1,161) | (761) |
| US Retail & Commercial | 1,917 | 1,029 | 2,946 | (2,024) | (99) | (517) | 306 |
| Global Banking & Markets | 1,215 | 6,697 | 7,912 | (4,281) | (116) | (151) | 3,364 |
| RBS Insurance | 366 | 4,003 | 4,369 | (4,641) | (23) | — | (295) |
| Central items | 25 | 400 | 425 | 1,007 | (852) | (3) | 577 |
| Core | 12,517 | 17,112 | 29,629 | (17,149) | (1,282) | (3,780) | 7,418 |
| Non-Core | 1,683 | 1,350 | 3,033 | (2,582) | (480) | (5,476) | (5,505) |
| | 14,200 | 18,462 | 32,662 | (19,731) | (1,762) | (9,256) | 1,913 |
| Reconciling items | | | | | | | |
| RFS Holdings minority interest | 9 | (151) | (142) | (9) | 1 | — | (150) |
| Fair value of own debt | — | 174 | 174 | — | — | — | 174 |
| Amortisation of purchased intangible assets | — | — | — | — | (369) | — | (369) |
| Integration and restructuring costs | — | — | — | (1,012) | (20) | — | (1,032) |
| Gain on redemption of own debt | — | 553 | 553 | — | — | — | 553 |
| Strategic disposals | — | 171 | 171 | — | — | — | 171 |
| Bonus tax | — | — | — | (99) | — | — | (99) |
| Asset Protection Scheme credit default swap - fair value changes | — | (1,550) | (1,550) | — | — | — | (1,550) |
| Write-down of goodwill and other intangible assets | — | — | — | (10) | — | — | (10) |
| | 14,209 | 17,659 | 31,868 | (20,861) | (2,150) | (9,256) | (399) |
| | | | | | | | |
| 2009 | | | | | | | |
| UK Retail | 3,452 | 1,629 | 5,081 | (3,170) | (3) | (1,679) | 229 |
| UK Corporate | 2,292 | 1,290 | 3,582 | (1,376) | (154) | (927) | 1,125 |
| Wealth | 663 | 446 | 1,109 | (645) | (11) | (33) | 420 |
| Global Transaction Services | 912 | 1,575 | 2,487 | (1,462) | (13) | (39) | 973 |
| Ulster Bank | 780 | 254 | 1,034 | (748) | (5) | (649) | (368) |
| US Retail & Commercial | 1,775 | 949 | 2,724 | (2,063) | (72) | (702) | (113) |
| Global Banking & Markets | 2,375 | 8,683 | 11,058 | (4,518) | (142) | (640) | 5,758 |
| RBS Insurance | 354 | 4,106 | 4,460 | (4,363) | (31) | (8) | 58 |
| Central items | (284) | 617 | 333 | 1,053 | (1,000) | (1) | 385 |
| Core | 12,319 | 19,549 | 31,868 | (17,292) | (1,431) | (4,678) | 8,467 |
| Non-Core | 1,248 | (3,549) | (2,301) | (2,593) | (442) | (9,221) | (14,557) |
| | 13,567 | 16,000 | 29,567 | (19,885) | (1,873) | (13,899) | (6,090) |
| Reconciling items | | | | | | | |
| RFS Holdings minority interest | (179) | (142) | (321) | (32) | (3) | — | (356) |
| Fair value of own debt | — | (142) | (142) | — | — | — | (142) |
| Amortisation of purchased intangible assets | — | — | — | — | (272) | — | (272) |
| Integration and restructuring costs | — | — | — | (1,268) | (18) | — | (1,286) |
| Gain on redemption of own debt | — | 3,790 | 3,790 | — | — | — | 3,790 |
| Strategic disposals | — | 132 | 132 | — | — | — | 132 |
| Bonus tax | — | — | — | (208) | — | — | (208) |
| Gains on pensions curtailment | — | — | — | 2,148 | — | — | 2,148 |
| Write-down of goodwill and other intangible assets | — | — | — | (363) | — | — | (363) |
| | 13,388 | 19,638 | 33,026 | (19,608) | (2,166) | (13,899) | (2,647) |
| | | | | | | | | | |
| Total revenue | | External £m | | | Inter segment £m | | | Total £m | | | External £m | | | Inter segment £m | | | Total £m | | | External £m | | | Inter segment £m | | | Total £m | |
| Global Markets | | | | | | | | | | | | | | | | | | | | | | | | | | | |
| — Global Banking & Markets | | | 10,324 | | | | 13,135 | | | | 23,459 | | | | 13,338 | | | | 9,544 | | | | 22,882 | | | | 11,246 | | | | 7,638 | | | | 18,884 | |
| — Global Transaction Services | | | 3,087 | | | | 80 | | | | 3,167 | | | | 2,959 | | | | 77 | | | | 3,036 | | | | 2,073 | | | | 4 | | | | 2,077 | |
| Regional Markets | | | | | | | | | | | | | | | | | | | | | | | | | | | | | | | | | | | | |
| — UK Retail & Commercial Banking | | | 18,690 | | | | 3,718 | | | | 22,408 | | | | 18,222 | | | | 3,820 | | | | 22,042 | | | | 16,207 | | | | 2,804 | | | | 19,011 | |
| — US Retail & Commercial Banking | | | 5,031 | | | | — | | | | 5,031 | | | | 5,184 | | | | — | | | | 5,184 | | | | 5,456 | | | | 2 | | | | 5,458 | |
| — Europe & Middle East Retail & Commercial Banking | | | 3,572 | | | | 738 | | | | 4,310 | | | | 2,940 | | | | 197 | | | | 3,137 | | | | 2,373 | | | | 196 | | | | 2,569 | |
| — Asia Retail & Commercial Banking | | | 823 | | | | 350 | | | | 1,173 | | | | 563 | | | | 330 | | | | 893 | | | | 218 | | | | 252 | | | | 470 | |
| RBS Insurance | | | 6,177 | | | | 33 | | | | 6,210 | | | | 6,333 | | | | 89 | | | | 6,422 | | | | 6,365 | | | | 82 | | | | 6,447 | |
| Group Manufacturing | | | 37 | | | | — | | | | 37 | | | | 44 | | | | 1 | | | | 45 | | | | 52 | | | | 5 | | | | 57 | |
| Central Items | | | 1,700 | | | | 13,405 | | | | 15,105 | | | | 1,650 | | | | 9,972 | | | | 11,622 | | | | 296 | | | | 7,985 | | | | 8,281 | |
| Share of shared assets | | | 257 | | | | — | | | | 257 | | | | 264 | | | | — | | | | 264 | | | | — | | | | — | | | | — | |
| | | | 49,698 | | | | 31,459 | | | | 81,157 | | | | 51,497 | | | | 24,030 | | | | 75,527 | | | | 44,286 | | | | 18,968 | | | | 63,254 | |
| RFS Holdings minority interest | | | 9,703 | | | | (24 | ) | | | 9,679 | | | | 1,534 | | | | (255 | ) | | | 1,279 | | | | — | | | | — | | | | — | |
| Eliminations | | | — | | | | (31,435 | ) | | | (31,435 | ) | | | — | | | | (23,775 | ) | | | (23,775 | ) | | | — | | | | (18,968 | ) | | | (18,968 | ) |
| | | | 59,401 | | | | — | | | | 59,401 | | | | 53,031 | | | | — | | | | 53,031 | | | | 44,286 | | | | — | | | | 44,286 | |
| | | | | | | | | | |
| Total income | | External £m | | | Inter segment £m | | | Total £m | | | External £m | | | Inter segment £m | | | Total £m | | | External £m | | | Inter segment £m | | | Total £m | |
| Global Markets | | | | | | | | | | | | | | | | | | | | | | | | | | | |
| — Global Banking & Markets | | | (99 | ) | | | (2,421 | ) | | | (2,520 | ) | | | 8,457 | | | | (1,638 | ) | | | 6,819 | | | | 8,375 | | | | (1,671 | ) | | | 6,704 | |
| — Global Transaction Services | | | 2,000 | | | | 472 | | | | 2,472 | | | | 2,134 | | | | (356 | ) | | | 1,778 | | | | 1,528 | | | | 2 | | | | 1,530 | |
| Regional Markets | | | | | | | | | | | | | | | | | | | | | | | | | | | | | | | | | | | | |
| — UK Retail & Commercial Banking | | | 12,445 | | | | (1,447 | ) | | | 10,998 | | | | 11,959 | | | | (853 | ) | | | 11,106 | | | | 11,495 | | | | (922 | ) | | | 10,573 | |
| — US Retail & Commercial Banking | | | 3,049 | | | | (39 | ) | | | 3,010 | | | | 2,837 | | | | (56 | ) | | | 2,781 | | | | 3,072 | | | | (82 | ) | | | 2,990 | |
| — Europe & Middle East Retail & Commercial Banking | | | 2,071 | | | | (553 | ) | | | 1,518 | | | | 1,823 | | | | (477 | ) | | | 1,346 | | | | 1,297 | | | | (153 | ) | | | 1,144 | |
| — Asia Retail & Commercial Banking | | | 434 | | | | 347 | | | | 781 | | | | 83 | | | | 272 | | | | 355 | | | | 1 | | | | 210 | | | | 211 | |
| RBS Insurance | | | 5,549 | | | | 17 | | | | 5,566 | | | | 5,649 | | | | 7 | | | | 5,656 | | | | 5,662 | | | | 17 | | | | 5,679 | |
| Group Manufacturing | | | (204 | ) | | | (9 | ) | | | (213 | ) | | | (192 | ) | | | (4 | ) | | | (196 | ) | | | (159 | ) | | | (21 | ) | | | (180 | ) |
| Central Items | | | (4,798 | ) | | | 4,420 | | | | (378 | ) | | | (3,576 | ) | | | 3,504 | | | | (72 | ) | | | (3,269 | ) | | | 2,620 | | | | (649 | ) |
| Share of shared assets | | | 56 | | | | (249 | ) | | | (193 | ) | | | (39 | ) | | | — | | | | (39 | ) | | | — | | | | — | | | | — | |
| | | | 20,503 | | | | 538 | | | | 21,041 | | | | 29,135 | | | | 399 | | | | 29,534 | | | | 28,002 | | | | — | | | | 28,002 | |
| RFS Holdings minority interest | | | 5,365 | | | | (538 | ) | | | 4,827 | | | | 1,231 | | | | (399 | ) | | | 832 | | | | — | | | | — | | | | — | |
| | | | 25,868 | | | | — | | | | 25,868 | | | | 30,366 | | | | — | | | | 30,366 | | | | 28,002 | | | | — | | | | 28,002 | |
Notes on the accountscontinued | Financial statements |
(1) | Segmental results for 2007 and 2006 have been restated to reflect transfers of businesses between segments in 2008. |
| | Group |
| 2008 | Net interest income £m | Non-interest income £m | Total income £m | Operating expenses and insurance claims £m | Depreciation and amortisation £m | Impairment losses £m | Operating profit/(loss) £m |
| UK Retail | 3,187 | 1,935 | 5,122 | (3,378) | (2) | (1,019) | 723 |
| UK Corporate | 2,448 | 1,289 | 3,737 | (1,487) | (150) | (319) | 1,781 |
| Wealth | 578 | 481 | 1,059 | (686) | (9) | (16) | 348 |
| Global Transaction Services | 937 | 1,494 | 2,431 | (1,372) | (3) | (54) | 1,002 |
| Ulster Bank | 708 | 331 | 1,039 | (715) | — | (106) | 218 |
| US Retail & Commercial | 1,726 | 861 | 2,587 | (1,471) | (151) | (437) | 528 |
| Global Banking & Markets | 2,326 | 31 | 2,357 | (3,736) | (252) | (522) | (2,153) |
| RBS Insurance | 496 | 3,934 | 4,430 | (3,767) | (37) | (42) | 584 |
| Central items | 1,710 | (2,073) | (363) | 1,179 | (685) | 19 | 150 |
| Core | 14,116 | 8,283 | 22,399 | (15,433) | (1,289) | (2,496) | 3,181 |
| Non-Core | 1,648 | (4,680) | (3,032) | (2,840) | (543) | (4,936) | (11,351) |
| | 15,764 | 3,603 | 19,367 | (18,273) | (1,832) | (7,432) | (8,170) |
| Reconciling items | | | | | | | |
| RFS Holdings minority interest | (282) | (29) | (311) | (100) | (66) | (7) | (484) |
| Fair value of own debt | — | 1,232 | 1,232 | — | — | — | 1,232 |
| Amortisation of purchased intangible assets | — | — | — | — | (443) | ��� | (443) |
| Integration and restructuring costs | — | — | — | (1,321) | (36) | — | (1,357) |
| Strategic disposals | — | 442 | 442 | — | — | — | 442 |
| Write-down of goodwill and other intangible assets | — | — | — | (16,911) | — | — | (16,911) |
| | 15,482 | 5,248 | 20,730 | (36,605) | (2,377) | (7,439) | (25,691) |
| | 2010 | | 2009 | | 2008 |
| Total income | External £m | Inter segment £m | Total £m | | External £m | Inter segment £m | Total £m | | External £m | Inter segment £m | Total £m |
| UK Retail | 5,513 | (23) | 5,490 | | 5,157 | (76) | 5,081 | | 5,499 | (377) | 5,122 |
| UK Corporate | 4,345 | (450) | 3,895 | | 4,422 | (840) | 3,582 | | 6,372 | (2,635) | 3,737 |
| Wealth | 562 | 494 | 1,056 | | 409 | 700 | 1,109 | | (761) | 1,820 | 1,059 |
| Global Transaction Services | 2,428 | 133 | 2,561 | | 2,438 | 49 | 2,487 | | 1,967 | 464 | 2,431 |
| Ulster Bank | 865 | 110 | 975 | | 1,003 | 31 | 1,034 | | 1,315 | (276) | 1,039 |
| US Retail & Commercial | 2,672 | 274 | 2,946 | | 2,380 | 344 | 2,724 | | 2,141 | 446 | 2,587 |
| Global Banking & Markets | 7,817 | 95 | 7,912 | | 10,174 | 884 | 11,058 | | 979 | 1,378 | 2,357 |
| RBS Insurance | 4,417 | (48) | 4,369 | | 4,475 | (15) | 4,460 | | 4,413 | 17 | 4,430 |
| Central items | (400) | 825 | 425 | | (1,577) | 1,910 | 333 | | (4,042) | 3,679 | (363) |
| Core | 28,219 | 1,410 | 29,629 | | 28,881 | 2,987 | 31,868 | | 17,883 | 4,516 | 22,399 |
| Non-Core | 4,451 | (1,418) | 3,033 | | 616 | (2,917) | (2,301) | | 1,620 | (4,652) | (3,032) |
| | 32,670 | (8) | 32,662 | | 29,497 | 70 | 29,567 | | 19,503 | (136) | 19,367 |
| Reconciling items | | | | | | | | | | | |
| RFS Holdings minority interest | (150) | 8 | (142) | | (251) | (70) | (321) | | (447) | 136 | (311) |
| Fair value of own debt | 174 | — | 174 | | (142) | — | (142) | | 1,232 | — | 1,232 |
| Gain on redemption of own debt | 553 | — | 553 | | 3,790 | — | 3,790 | | — | — | — |
| Strategic disposals | 171 | — | 171 | | 132 | — | 132 | | 442 | — | 442 |
| Asset Protection Scheme credit default swap - fair value changes | (1,550) | — | (1,550) | | — | — | — | | — | — | — |
| | 31,868 | — | 31,868 | | 33,026 | — | 33,026 | | 20,730 | — | 20,730 |
| | | | |
| | | | | | | |
| | | Assets £m | | | Liabilities £m | | | Cost to acquire fixed assets and intangible assets £m | | | Assets £m | | | Liabilities £m | | | Cost to acquire fixed assets and intangible assets £m | |
| Global Markets | | | | | | | | | | | | | | | | | | |
| — Global Banking & Markets | | | 1,672,158 | | | | 1,580,651 | | | | 3,105 | | | | 1,147,384 | | | | 1,043,060 | | | | 2,061 | |
| — Global Transaction Services | | | 23,962 | | | | 54,109 | | | | 4 | | | | 22,730 | | | | 58,905 | | | | 15 | |
| Regional Markets | | | | | | | | | | | | | | | | | | | | | | | | |
| — UK Retail & Commercial Banking | | | 249,385 | | | | 193,101 | | | | 1,447 | | | | 232,821 | | | | 196,674 | | | | 1,497 | |
| — US Retail & Commercial Banking | | | 103,940 | | | | 91,834 | | | | 204 | | | | 79,078 | | | | 67,814 | | | | 171 | |
| — Europe & Middle East Retail & Commercial Banking | | | 66,382 | | | | 48,397 | | | | 2 | | | | 56,087 | | | | 44,772 | | | | 35 | |
| — Asia Retail & Commercial Banking | | | 8,284 | | | | 15,700 | | | | 18 | | | | 7,562 | | | | 11,629 | | | | 14 | |
| RBS Insurance | | | 12,855 | | | | 9,086 | | | | 61 | | | | 12,459 | | | | 8,935 | | | | 92 | |
| Group Manufacturing | | | 6,105 | | | | 2,469 | | | | 1,235 | | | | 5,658 | | | | 2,139 | | | | 1,001 | |
| Central Items | | | 73,575 | | | | 156,984 | | | | — | | | | 4,065 | | | | 75,487 | | | | — | |
| Share of shared assets | | | 2,047 | | | | 2,047 | | | | — | | | | 27,222 | | | | 27,222 | | | | — | |
| | | | 2,218,693 | | | | 2,154,378 | | | | 6,076 | | | | 1,595,066 | | | | 1,536,637 | | | | 4,886 | |
| RFS Holdings minority interest | | | 182,959 | | | | 166,776 | | | | 174 | | | | 245,763 | | | | 212,766 | | | | 675 | |
| | | 2,401,652 | | | | 2,321,154 | | | | 6,250 | | | | 1,840,829 | | | | 1,749,403 | | | | 5,561 | |
38 Segmental analysis (continued)
| Owners’ equity | | | 2008 £m | | | | 2007 £m | |
| Global Markets | | | | | | | | |
| — Global Banking & Markets | | | 17,100 | | | | 9,076 | |
| — Global Transaction Services | | | 1,202 | | | | 567 | |
| Regional Markets | | | | | | | | |
| — UK Retail & Commercial Banking | | | 9,928 | | | | 8,696 | |
| — US Retail & Commercial Banking | | | 10,035 | | | | 10,865 | |
| — Europe & Middle East Retail & Commercial Banking | | | 1,894 | | | | 1,652 | |
| — Asia Retail & Commercial Banking | | | 396 | | | | 149 | |
| RBS Insurance | | | 3,048 | | | | 2,646 | |
| Group Manufacturing | | | 257 | | | | 149 | |
| Central Items | | | 15,019 | | | | 19,238 | |
| | | | 58,879 | | | | 53,038 | |
(1)Notes on the accountscontinued | Segmental results for 2007 have been restated to reflect transfers of businesses between segments in 2008.Financial statements |
40 Segmental analysis continued
| | 2010 | | 2009 | | 2008 |
| Total revenue | External £m | Inter segment £m | Total £m | | External £m | Inter segment £m | Total £m | | External £m | Inter segment £m | Total £m |
| UK Retail | 6,998 | 401 | 7,399 | | 7,156 | 599 | 7,755 | | 8,416 | 1,652 | 10,068 |
| UK Corporate | 4,347 | 132 | 4,479 | | 4,563 | 118 | 4,681 | | 8,309 | 225 | 8,534 |
| Wealth | 957 | 617 | 1,574 | | 813 | 820 | 1,633 | | 1,125 | 2,122 | 3,247 |
| Global Transaction Services | 2,850 | 85 | 2,935 | | 2,923 | 60 | 2,983 | | 2,937 | 81 | 3,018 |
| Ulster Bank | 1,386 | 134 | 1,520 | | 1,604 | 104 | 1,708 | | 2,762 | 748 | 3,510 |
| US Retail & Commercial | 3,660 | 286 | 3,946 | | 4,080 | 378 | 4,458 | | 4,200 | 475 | 4,675 |
| Global Banking & Markets | 9,999 | 7,195 | 17,194 | | 13,805 | 9,142 | 22,947 | | 10,702 | 11,078 | 21,780 |
| RBS Insurance | 4,918 | 10 | 4,928 | | 5,018 | 19 | 5,037 | | 5,040 | 33 | 5,073 |
| Central items | 2,953 | 8,549 | 11,502 | | 2,057 | 10,825 | 12,882 | | 350 | 13,388 | 13,738 |
| Core | 38,068 | 17,409 | 55,477 | | 42,019 | 22,065 | 64,084 | | 43,841 | 29,802 | 73,643 |
| Non-Core | 5,622 | 1,051 | 6,673 | | 3,358 | 1,292 | 4,650 | | 4,242 | 1,657 | 5,899 |
| | 43,690 | 18,460 | 62,150 | | 45,377 | 23,357 | 68,734 | | 48,083 | 31,459 | 79,542 |
| Reconciling items | | | | | | | | | | | |
| RFS Holdings minority interest | (141) | — | (141) | | (155) | — | (155) | | 425 | (11) | 414 |
| Fair value of own debt | 174 | — | 174 | | (142) | — | (142) | | 1,232 | — | 1,232 |
| Gain on redemption of own debt | 553 | — | 553 | | 3,790 | — | 3,790 | | — | — | — |
| Strategic disposals | 171 | — | 171 | | 132 | — | 132 | | 442 | — | 442 |
Asset Protection Scheme credit default swap - fair value changes | (1,550) | — | (1,550) | | — | — | — | | — | — | — |
| Eliminations | — | (18,460) | (18,460) | | — | (23,357) | (23,357) | | — | (31,448) | (31,448) |
| | 42,897 | — | 42,897 | | 49,002 | — | 49,002 | | 50,182 | — | 50,182 |
| | Group |
| | 2010 | | 2009 | | 2008 |
| | Assets £m | Liabilities £m | Cost to acquire fixed assets and intangible assets £m | | Assets £m | Liabilities £m | Cost to acquire fixed assets and intangible assets £m | | Assets £m | Liabilities £m | Cost to acquire fixed assets and intangible assets £m |
| UK Retail | 111,793 | 97,148 | — | | 110,987 | 91,755 | — | | 102,429 | 82,721 | 4 |
| UK Corporate | 114,550 | 101,738 | 381 | | 114,854 | 89,306 | 598 | | 120,990 | 84,076 | 1,418 |
| Wealth | 21,073 | 37,054 | 63 | | 17,952 | 36,273 | 11 | | 16,130 | 35,079 | 41 |
| Global Transaction Services | 25,221 | 78,032 | 22 | | 18,380 | 64,684 | 17 | | 22,162 | 54,259 | 7 |
| Ulster Bank | 40,081 | 34,481 | 101 | | 44,021 | 40,597 | — | | 49,107 | 47,672 | 1 |
| US Retail & Commercial | 71,173 | 66,088 | 197 | | 75,369 | 72,407 | 179 | | 88,673 | 89,254 | 204 |
| Global Banking & Markets | 802,578 | 774,753 | 852 | | 826,054 | 822,830 | 513 | | 1,395,032 | 1,456,138 | 880 |
| RBS Insurance | 12,555 | 8,195 | 50 | | 11,973 | 7,775 | 33 | | 11,018 | 7,510 | 61 |
| Central items | 99,728 | 140,086 | 632 | | 82,041 | 150,739 | 804 | | 70,217 | 157,331 | 1,235 |
| Core | 1,298,752 | 1,337,575 | 2,298 | | 1,301,631 | 1,376,366 | 2,155 | | 1,875,758 | 2,014,040 | 3,851 |
| Non-Core | 153,882 | 38,503 | 761 | | 220,850 | 66,152 | 3,259 | | 342,935 | 140,338 | 2,225 |
| | 1,452,634 | 1,376,078 | 3,059 | | 1,522,481 | 1,442,518 | 5,414 | | 2,218,693 | 2,154,378 | 6,076 |
| Reconciling item | | | | | | | | | | | |
| RFS Holdings minority interest | 942 | 647 | 76 | | 174,005 | 159,337 | 296 | | 182,959 | 166,776 | 174 |
| | 1,453,576 | 1,376,725 | 3,135 | | 1,696,486 | 1,601,855 | 5,710 | | 2,401,652 | 2,321,154 | 6,250 |
Notes on the accountscontinued | Financial statements |
Segmental analysis of goodwill is as follows:
| | UK Retail | UK Corporate | Wealth | Global Transaction Services | Ulster Bank | US Retail & Commercial | Global Banking & Markets | RBS Insurance | Non-Core | RFS Holdings minority interest | Total |
| | £m | £m | £m | £m | £m | £m | £m | £m | £m | £m | £m |
| At 1 January 2008 | 2,803 | 2,741 | 753 | 2,396 | 858 | 5,392 | 4,191 | 1,064 | 4,334 | 18.421 | 42,953 |
| Transfers to disposal groups | — | — | — | — | — | — | — | — | — | (3,692) | (3,692) |
Currency translation and other adjustments | — | — | 56 | 680 | 133 | 2,013 | 879 | 7 | 801 | 4,336 | 8,905 |
| Acquisitions | — | — | — | 35 | — | — | 147 | — | 342 | — | 524 |
| Disposals | — | — | — | — | — | — | — | — | (49) | (3,017) | (3,066) |
| Write-down of goodwill | | | | | | | | | | | |
| - continuing operations | — | (46) | (9) | (44) | (991) | (4,382) | (5,179) | (42) | (4,831) | — | (15,524) |
| - discontinued operations | — | — | — | — | — | — | — | — | — | (14,538) | (14,538) |
| At 1 January 2009 | 2,803 | 2,695 | 800 | 3,067 | — | 3,023 | 38 | 1,029 | 597 | 1,510 | 15,562 |
| Transfers to disposal groups | — | — | — | — | — | — | — | — | (238) | — | (238) |
Currency translation and other adjustments | — | — | (12) | (233) | — | (302) | (1) | (8) | (34) | (107) | (697) |
| Write-down of goodwill | — | — | — | — | — | — | — | (66) | (297) | — | (363) |
| At 1 January 2010 | 2,803 | 2,695 | 788 | 2,834 | — | 2,721 | 37 | 955 | 28 | 1,403 | 14,264 |
Currency translation and other adjustments | — | — | 25 | 24 | — | 122 | 4 | — | 1 | (40) | 136 |
| Disposals | (4) | — | — | (481) | — | — | — | — | (14) | (1,363) | (1,862) |
| Write-down of goodwill | — | — | (1) | — | — | — | — | (9) | — | — | (10) |
| At 31 December 2010 | 2,799 | 2,695 | 812 | 2,377 | — | 2,843 | 41 | 946 | 15 | — | 12,528 |
| | | Global Banking & Markets £m | | | Global Transaction Services £m | | | UK Retail & Commercial Banking £m | | | US Retail & Commercial Banking £m | | | Europe & Middle East Retail & Commercial Banking £m | | | Asia Retail & Commercial Banking £m | | | RBS Insurance £m | | | RFS Holdings minority interest £m | | | Total £m | |
| At 1 January 2007 | | | 2,281 | | | | 1,742 | | | | 6,172 | | | | 5,429 | | | | 903 | | | | 298 | | | | 1,064 | | | | — | | | | 17,889 | |
| Currency translation and other adjustments | | | 227 | | | | 24 | | | | — | | | | (103 | ) | | | 48 | | | | 34 | | | | — | | | | 957 | | | | 1,187 | |
| Acquisitions | | | 4,834 | | | | 865 | | | | — | | | | 66 | | | | 118 | | | | 570 | | | | — | | | | 17,464 | | | | 23,917 | |
| Goodwill written off | | | — | | | | (40 | ) | | | — | | | | — | | | | — | | | | — | | | | — | | | | — | | | | (40 | ) |
| At 1 January 2008 | | | 7,342 | | | | 2,591 | | | | 6,172 | | | | 5,392 | | | | 1,069 | | | | 902 | | | | 1,064 | | | | 18,421 | | | | 42,953 | |
| Transfers to disposal groups | | | — | | | | — | | | | — | | | | — | | | | — | | | | — | | | | — | | | | (3,692 | ) | | | (3,692 | ) |
| Currency translation and other adjustments | | | 1,475 | | | | 678 | | | | (2 | ) | | | 2,013 | | | | 173 | | | | 225 | | | | 7 | | | | 4,336 | | | | 8,905 | |
| Acquisitions | | | 448 | | | | 42 | | | | — | | | | — | | | | 6 | | | | 28 | | | | — | | | | — | | | | 524 | |
| Disposals | | | (2 | ) | | | — | | | | — | | | | — | | | | (47 | ) | | | — | | | | — | | | | (3,017 | ) | | | (3,066 | ) |
| Write-down of goodwill | | | (8,946 | ) | | | (44 | ) | | | (46 | ) | | | (4,382 | ) | | | (1,201 | ) | | | (863 | ) | | | (42 | ) | | | (14,538 | ) | | | (30,062 | ) |
| At 31 December 2008 | | | 317 | | | | 3,267 | | | | 6,124 | | | | 3,023 | | | | — | | | | 292 | | | | 1,029 | | | | 1,510 | | | | 15,562 | |
Notes on the accountscontinued | Financial statements |
40 Segmental analysis continued
(b) Geographical segments
The geographical analysesanalysis in the tables below havehas been compiled on the basis of location of office where the transactions are recorded.
| | | Group | | Group |
| | | UK | | | USA | | | Europe | | | Rest of the World | | | Total | | | Less: RFS Holdings minority interest | | | Group | | |
| 2008 | | | £m | | | | £m | | | | £m | | | | £m | | | | £m | | | | £m | | | | £m | | |
| 2010 | | UK £m | USA £m | Europe £m | Rest of the World £m | Total £m |
| Total revenue | | 23,748 | | | 8,518 | | | 21,112 | | | 6,023 | | | 59,401 | | | 9,679 | | | 49,722 | | 25,468 | 8,332 | 6,196 | 2,901 | 42,897 |
| | | | | | | | | | | | | | | | | | | | | | | | | | | | | | |
| Net interest income | | 9,853 | | | 2,790 | | | 5,018 | | | 1,014 | | | 18,675 | | | 2,911 | | | 15,764 | | 8,932 | 3,128 | 1,384 | 765 | 14,209 |
| Net fees and commissions | | 3,728 | | | 1,492 | | | 1,648 | | | 577 | | | 7,445 | | | 1,011 | | | 6,434 | | 3,272 | 1,557 | 591 | 562 | 5,982 |
| Income from trading activities | | (7,103 | ) | | (1,604 | ) | | (552 | ) | | 782 | | | (8,477 | ) | | 352 | | | (8,829 | ) | 2,106 | 1,963 | 197 | 251 | 4,517 |
| Other operating income | | 2,337 | | | 49 | | | (528 | ) | | 41 | | | 1,899 | | | (64 | ) | | 1,963 | | |
| Insurance premium income (net of reinsurers’ share) | | 5,190 | | | — | | | 1,136 | | | — | | | 6,326 | | | 617 | | | 5,709 | | |
| Other operating income/(loss) | | 1,376 | 232 | 836 | (412) | 2,032 |
| Insurance premium income (net of reinsurers' share) | | 4,809 | — | 319 | — | 5,128 |
| Total income | | 14,005 | | | 2,727 | | | 6,722 | | | 2,414 | | | 25,868 | | | 4,827 | | | 21,041 | | 20,495 | 6,880 | 3,327 | 1,166 | 31,868 |
| | | | | | | | | | | | | | | | | | | | | | | | | | | | | | |
| Operating (loss)/profit before tax | | (7,989 | ) | | (5,809 | ) | | (26,883 | ) | | 14 | | | (40,667 | ) | | (15,629 | ) | | (25,038 | ) | |
| | | | | | | | | | | | | | | | | | | | | | | | | | | | | | |
| Operating profit/(loss) before tax | | 862 | 2,091 | (2,450) | (902) | (399) |
| Total assets | | 1,304,714 | | | 607,511 | | | 368,290 | | | 121,137 | | | 2,401,652 | | | 182,959 | | | 2,218,693 | | 932,917 | 341,770 | 102,756 | 76,133 | 1,453,576 |
| | | | | | | | | | | | | | | | | | | | | | | | | | | | | | |
| Total liabilities | | 1,253,814 | | | 592,272 | | | 361,590 | | | 113,478 | | | 2,321,154 | | | 166,776 | | | 2,154,378 | | 860,932 | 323,529 | 119,946 | 72,318 | 1,376,725 |
| | | | | | | | | | | | | | | | | | | | | | | | | | | | | | |
| Net assets attributable to equity owners and minority interests | | 50,900 | | | 15,239 | | | 6,700 | | | 7,659 | | | 80,498 | | | 16,183 | | | 64,315 | | |
| | | | | | | | | | | | | | | | | | | | | | | | | | | | | | |
| Net assets attributable to equity owners and non-controlling interests | | 71,985 | 18,241 | (17,190) | 3,815 | 76,851 |
| Contingent liabilities and commitments | | 200,763 | | | 131,435 | | | 79,941 | | | 21,122 | | | 433,261 | | | 9,272 | | | 423,989 | | 134,983 | 98,429 | 71,025 | 9,894 | 314,331 |
| | | | | | | | | | | | | | | | | | | | | | | | | | | | | | |
| Cost to acquire property, plant and equipment and intangible assets | | 3,415 | | | 445 | | | 2,204 | | | 186 | | | 6,250 | | | 174 | | | 6,076 | | 1,283 | 355 | 1,388 | 109 | 3,135 |
| | | | | | | | | | | | | | | | | | | | | | | | | | | | | | |
| 2007 | | | | | | | | | | | | | | | | | | | | | | | | | | | | | |
| 2009 | | 2009 |
| Total revenue | | 33,743 | | | 8,570 | | | 8,140 | | | 2,578 | | | 53,031 | | | 1,678 | | | 51,353 | | 28,421 | 10,517 | 6,442 | 3,622 | 49,002 |
| | | | | | | | | | | | | | | | | | | | | | | | | | | | | | |
| Net interest income | | 8,350 | | | 2,054 | | | 1,510 | | | 155 | | | 12,069 | | | 545 | | | 11,524 | | 7,759 | 2,674 | 1,741 | 1,214 | 13,388 |
| Net fees and commissions | | 3,933 | | | 1,176 | | | 560 | | | 416 | | | 6,085 | | | 224 | | | 5,861 | | 3,640 | 1,586 | 316 | 406 | 5,948 |
| Income from trading activities | | 1,252 | | | (486 | ) | | 348 | | | 178 | | | 1,292 | | | (139 | ) | | 1,431 | | 131 | 2,396 | 584 | 650 | 3,761 |
| Other operating income | | 3,844 | | | 260 | | | 587 | | | 142 | | | 4,833 | | | 96 | | | 4,737 | | |
| Insurance premium income (net of reinsurers’ share) | | 5,562 | | | — | | | 525 | | | — | | | 6,087 | | | 106 | | | 5,981 | | |
| Other operating income/(loss) | | 6,015 | (37) | (977) | (338) | 4,663 |
| Insurance premium income (net of reinsurers' share) | | 4,879 | — | 387 | — | 5,266 |
| Total income | | 22,941 | | | 3,004 | | | 3,530 | | | 891 | | | 30,366 | | | 832 | | | 29,534 | | 22,424 | 6,619 | 2,051 | 1,932 | 33,026 |
| | | | | | | | | | | | | | | | | | | | | | | | | | | | | | |
| Operating profit before tax | | 7,761 | | | 719 | | | 1,136 | | | 216 | | | 9,832 | | | 163 | | | 9,669 | | |
| | | | | | | | | | | | | | | | | | | | | | | | | | | | | | |
| Operating profit/(loss) before tax | | 1,776 | (457) | (2,877) | (1,089) | (2,647) |
| Total assets | | 938,064 | | | 340,170 | | | 422,058 | | | 140,537 | | | 1,840,829 | | | 245,763 | | | 1,595,066 | | 949,765 | 338,649 | 320,008 | 88,064 | 1,696,486 |
| | | | | | | | | | | | | | | | | | | | | | | | | | | | | | |
| Total liabilities | | 902,340 | | | 326,499 | | | 392,362 | | | 128,202 | | | 1,749,403 | | | 212,766 | | | 1,536,637 | | 873,716 | 322,698 | 321,133 | 84,308 | 1,601,855 |
| | | | | | | | | | | | | | | | | | | | | | | | | | | | | | |
| Net assets attributable to equity owners and minority interests | | 35,724 | | | 13,671 | | | 29,696 | | | 12,335 | | | 91,426 | | | 32,997 | | | 58,429 | | |
| Net assets attributable to equity owners and non-controlling interests | | 76,049 | 15,951 | (1,125) | 3,756 | 94,631 |
| Contingent liabilities and commitments | | 197,637 | | | 95,547 | | | 82,316 | | | 24,599 | | | 400,099 | | | 21,000 | | | 379,099 | | 175,392 | 93,694 | 65,026 | 17,549 | 351,661 |
| Cost to acquire property, plant and equipment and intangible assets | | 3,305 | | | 238 | | | 1,793 | | | 225 | | | 5,561 | | | 675 | | | 4,886 | | 1,974 | 390 | 3,252 | 94 | 5,710 |
| 2008 | | | | | |
| Total revenue | 23,576 | 8,487 | 12,293 | 5,826 | 50,182 |
| | | | | | |
| Net interest income | 9,923 | 2,783 | 1,791 | 985 | 15,482 |
| Net fees and commissions | 3,687 | 1,494 | 735 | 495 | 6,411 |
| (Loss)/income from trading activities | (7,415) | (1,604) | (773) | 767 | (9,025) |
| Other operating income/(loss) | 2,589 | 45 | (464) | (17) | 2,153 |
| Insurance premium income (net of reinsurers' share) | 5,195 | — | 514 | — | 5,709 |
| Total income | 13,979 | 2,718 | 1,803 | 2,230 | 20,730 |
| | | | | | |
| Operating loss before tax | (8,036) | (5,806) | (11,784) | (65) | (25,691) |
| Total assets | 1,304,714 | 607,511 | 368,290 | 121,137 | 2,401,652 |
| Total liabilities | 1,253,814 | 592,272 | 361,590 | 113,478 | 2,321,154 |
| Net assets attributable to equity owners and non-controlling interests | 50,900 | 15,239 | 6,700 | 7,659 | 80,498 |
| Contingent liabilities and commitments | 200,763 | 131,435 | 79,941 | 21,122 | 433,261 |
| Cost to acquire property, plant and equipment and intangible assets | 3,415 | 445 | 2,204 | 186 | 6,250 |
Notes on the accountscontinued | Financial statements |
38 Segmental analysis (continued)| | | Group | |
| | | UK | | | USA | | | Europe | | | Rest of the World | | | Total | |
| 2006 | | | £m | | | | £m | | | | £m | | | | £m | | | | £m | |
| Total revenue | | | 29,162 | | | | 9,411 | | | | 4,683 | | | | 1,030 | | | | 44,286 | |
| Net interest income | | | 7,541 | | | | 2,278 | | | | 709 | | | | 68 | | | | 10,596 | |
| Net fees and commissions | | | 3,443 | | | | 1,245 | | | | 412 | | | | 94 | | | | 5,194 | |
| Income from trading activities | | | 1,585 | | | | 939 | | | | 108 | | | | 43 | | | | 2,675 | |
| Other operating income | | | 2,766 | | | | 295 | | | | 491 | | | | 12 | | | | 3,564 | |
| Insurance premium income (net of reinsurers’ share) | | | 5,604 | | | | — | | | | 369 | | | | — | | | | 5,973 | |
| Total income | | | 20,939 | | | | 4,757 | | | | 2,089 | | | | 217 | | | | 28,002 | |
| | | | | | | | | | | | | | | | | | | | | |
| Operating profit before tax | | | 6,038 | | | | 2,334 | | | | 785 | | | | 29 | | | | 9,186 | |
| | | | | | | | | | | | | | | | | | | | | |
| Total assets | | | 579,075 | | | | 197,421 | | | | 60,759 | | | | 19,577 | | | | 856,832 | |
| | | | | | | | | | | | | | | | | | | | | |
| Total liabilities | | | 557,605 | | | | 183,430 | | | | 56,662 | | | | 13,645 | | | | 811,342 | |
| | | | | | | | | | | | | | | | | | | | | |
| Net assets attributable to equity owners and minority interests | | | 21,470 | | | | 13,991 | | | | 4,097 | | | | 5,932 | | | | 45,490 | |
| | | | | | | | | | | | | | | | | | | | | |
| Contingent liabilities and commitments | | | 186,627 | | | | 57,873 | | | | 13,244 | | | | 7,159 | | | | 264,903 | |
| | | | | | | | | | | | | | | | | | | | | |
| Cost to acquire property, plant and equipment and intangible assets | | | 3,040 | | | | 254 | | | | 1,427 | | | | 19 | | | | 4,740 | |
39 Directors’41 Directors' and key management remuneration
| | | Group | |
| | | 2008 | | | 2007 | |
| Directors’ remuneration | | | £000 | | | | £000 | |
| Non-executive directors — emoluments | | | 1,408 | | | | 1,081 | |
| Chairman and executive directors — emoluments | | | 7,132 | | | | 16,461 | |
| — contributions and allowances in respect of defined contribution pension schemes | | | 3 | | | | 30 | |
| | | | 8,543 | | | | 17,572 | |
| — amounts receivable under long-term incentive plans | | | 646 | | | | 1,839 | |
| — gains on exercise of share options | | | 77 | | | | 1,474 | |
| | | | 9,266 | | | | 20,885 | |
| | Group |
| Directors' remuneration | 2010 £000 | 2009 £000 |
Non-executive directors - emoluments | 1,093 | 823 |
| Chairmen and executive directors | | |
| - emoluments | 5,243 | 4,971 |
| - contributions and allowances in respect of defined contribution pension schemes | 321 | — |
| | 6,657 | 5,794 |
| - amounts receivable under long-term incentive plans | 1,097 | 1,103 |
| | 7,754 | 6,897 |
Retirement benefits are accruing to one director (2007 — five) under defined benefit schemes. No directors (2007 — one) are accruing benefits under defined benefit schemes (2009 - one), one director is accruing benefits under defined contribution schemes.schemes (2009 - nil).
The executive directors may also participate in the company’scompany's executive share option and sharesave schemes and details of their interests in the company’scompany's shares arising from their participation are given on page 148.in the Directors' remuneration report. Details of the remuneration received by each director during the year and each director’sdirector's pension arrangements are also given on pages 147 to 152.in the Directors' remuneration report.
Compensation of key management
The aggregate remuneration of directors and other members of key management during the year was as follows:
| | | Group | | |
| | | 2008 | | | 2007 | | Group |
| | | | £000 | | | | £000 | | 2010 £000 | 2009 £000 |
| Short-term benefits | | 16,813 | | | 37,763 | | 35,654 | 29,292 |
| Post-employment benefits | | 13,174 | | | 10,051 | | (503) | 9,781 |
| Other long-term | | 496 | | | 708 | | |
| Termination benefits | | 345 | | | — | | |
| Share-based payments | | 2,078 | | | 5,165 | | 21,551 | 8,953 |
| | | 32,906 | | | 53,687 | | 56,702 | 48,026 |
42 Transactions with directors officers and otherskey management
(a) At 31 December 2010, amounts outstanding in relation to transactions, arrangements and agreements entered into by authorised institutions in the Group, as defined in UK legislation, were £3,603,075 in respect of loans to seven persons who were directors of the company at any time during the financial period.
(b) For the purposes of IAS 24 ‘Related Party Disclosures’, key management comprise directors of the company and members of the Group Management Committee. The captions in the Group's primary financial statements include the following amounts attributable, in aggregate, to key management: (a) | At 31 December 2008, the amounts outstanding in relation to transactions, arrangements and agreements entered into by authorised institutions in the Group, as defined in UK legislation, were £117,847 in respect of loans to 27 persons who were directors of the company (or persons connected with them) at any time during the financial period. |
(b) | For the purposes of IAS 24 ‘Related Party Disclosures’, key management comprise directors of the company and members of the Group Executive Management Committee. The captions in the Group’s primary financial statements include the following amounts attributable, in aggregate, to key management: |
| | | 2008 | | | 2007 | | |
| | | | £000 | | | | £000 | | 2010 £000 | 2009 £000 |
| Loans and advances to customers | | 4,217 | | | 2,023 | | 10,970 | 11,196 |
| Customer accounts | | 9,572 | | | 13,309 | | 10,641 | 11,713 |
Key management have banking relationships with Group entities which are entered into in the normal course of business and on substantially the same terms, including interest rates and security, as for comparable transactions with other persons of a similar standing or, where applicable, with other employees. These transactions did not involve more than the normal risk of repayment or present other unfavourable features.
Key management had no reportable transactions or balances with the company except for dividends..
43 Related parties
UK Government
On 1 December 2008, the UK Government through HM Treasury became the ultimate controlling party of The Royal Bank of Scotland Group plc. The UK Government's shareholding is managed by UK Financial Investments Limited, a company wholly owned by the UK Government. As a result, the UK Government and UK Government controlled bodies became related parties of the Group.
The Group enters into transactions with many of these bodies on an arms' length basis. The principal transactions during 2010 and 2009 were: the Asset Protection Scheme, Bank of England facilities and the issue of debt guaranteed by the UK Government described below.
In addition, the redemption of non-cumulative sterling preference shares and the placing and open offer in April 2009 was underwritten by HM Treasury and, in December 2009, B shares were issued to HM Treasury and a contingent capital agreement concluded with HM Treasury (see Note 29). Other transactions include the payment of: taxes including UK corporation tax and value added tax; national insurance contributions; local authority rates; and regulatory fees and levies; together with banking transactions such as loans and deposits undertaken in the normal course of banker-customer relationships. The volume and diversity of these transactions are such that disclosure of their amounts is impractical.
41 Related parties(a)Notes on the accountscontinued | In their roles as providers of finance, Group companies provide development and other types of capital support to businesses. These investments are made in the normal course of business and on arm’s-length terms. In some instances, the investment may extend to ownership or control over 20% or more of the voting rights of the investee company. However, these investments are not considered to give rise to transactions of a materiality requiring disclosure under IAS 24.Financial statements |
(b) | The Group recharges The Royal Bank of Scotland Group Pension Fund with the cost of administration services incurred by it. The amounts involved are not material to the Group. |
(c) | In accordance with IAS 24, transactions or balances between Group entities that have been eliminated on consolidation are not reported. |
(d) | The captions in the primary financial statements of the parent company include amounts attributable to subsidiaries. These amounts have been disclosed in aggregate in the relevant notes to the financial statements. |
(e) | On 1 December 2008, the UK Government through HM Treasury became the ultimate controlling party of The Royal Bank of Scotland Group plc. The UK Government’s shareholding is managed by UK Financial Investments Limited, a company wholly owned by the UK Government. As a result the UK Government and UK Government controlled bodies became related parties of the Group. The Group enters into transactions with many of these bodies on an arms' length basis. The volume and diversity of such transaction are such that disclosure of their amounts in the period 1 December 2008 to 31 December 2008 is impractical. |
43 Related parties continued
As at 31 December 2008 balances with the UK Government and UK Government controlled bodies were:
| | | 2010 | | 2009 | | 2008 |
| | | Central government (including the Bank of England) | | | Local
government | | | Banks, financial corporations and public corporations | | | 2008
Total | | Central government (including the Bank of England) | Local government | Banks, financial corporations and public corporations | Total | | Central government (including the Bank of England) | Local government | Banks, financial corporations and public corporations | Total | | Central government (including the Bank of England) | Local government | Banks, financial corporations and public corporations | Total |
| | | | £m | | | | £m | | | | £m | | | | £m | | £m | £m | £m | | £m | | £m | £m | £m |
| Assets | | | | | | | | | | | | | | | | | | | | | |
| Balances at central banks | | 393 | | | — | | | — | | | 393 | | 18,862 | — | 18,862 | | 16,617 | — | 16,617 | | 393 | — | 393 |
| Loans and advances to banks | | — | | | — | | | 1,081 | | | 1,081 | | — | 674 | | — | 664 | | — | 1,081 |
| Loans and advances to customers | | 5 | | | 721 | | | 468 | | | 1,194 | | 46 | 1,427 | 1,170 | 2,643 | | 53 | 1,231 | 340 | 1,624 | | 5 | 721 | 468 | 1,194 |
| Debt securities | | 21,628 | | | — | | | 113 | | | 21,741 | | 13,331 | — | 155 | 13,486 | | 19,681 | — | 100 | 19,781 | | 21,628 | — | 113 | 21,741 |
| Derivatives | | 1,286 | | | 64 | | | 17 | | | 1,367 | | 73 | 4 | 96 | 173 | | 204 | 62 | 7 | 273 | | 1,286 | 64 | 17 | 1,367 |
| Other | | 249 | | | — | | | — | | | 249 | | 494 | — | 494 | | 4,514 | — | 3 | 4,517 | | 249 | — | 249 |
| | | | | | | | | | | | | | | | | | | | | | |
| Liabilities | | | | | | | | | | | | | | | | | | | | | |
| Deposits by banks | | 26,541 | | | — | | | 633 | | | 27,174 | | 147 | — | 419 | 566 | | — | 436 | | 26,541 | — | 633 | 27,174 |
| Customer accounts | | 1,536 | | | 3,320 | | | 598 | | | 5,454 | | 935 | 5,002 | 641 | 6,578 | | 1,480 | 3,646 | 668 | 5,794 | | 1,536 | 3,320 | 598 | 5,454 |
| Derivatives | | 276 | | | 78 | | | 29 | | | 383 | | 207 | 23 | 920 | 1,150 | | 156 | 39 | 628 | 823 | | 276 | 78 | 29 | 383 |
| Other | | 176 | | | — | | | — | | | 176 | | 186 | — | 186 | | 118 | — | 118 | | 176 | — | 176 |
No impairment losses were recognised by the Group in 2010, 2009 or 2008 in respect of balances with UK Government and UK Government controlled bodies.
There were no balances between the company and the UK Government and UK Government controlled bodies at 31 December 2010, 2009 and 2008.
| (1) | In addition to UK Government’sGovernment's shareholding in the Group, the UK Government and UK Government controlled bodies may hold debt securities, subordinated liabilities and other liabilities or shares issued by the Group in the normal course of their business. It is not practicable to ascertain and disclose these amounts. |
| (2) | Certain of the liability balances are secured. |
Asset Protection Scheme
On 22 December 2009, the Group entered into an agreement (the Asset Protection Scheme (APS), with HM Treasury (HMT), acting on behalf of the UK Government, under which the Group purchased credit protection over a portfolio of specified assets and exposures (covered assets) from HMT. The portfolio of covered assets has a par value of £282 billion. The protection is subject to a first loss of £60 billion and covers 90% of subsequent losses. Once the first loss has been exhausted, losses and recoveries in respect of assets for which a trigger event - failure to pay, bankruptcy or restructuring - has occurred are included in the balance receivable under the APS. Receipts from HMT will, over time, amount to 90% of cumulative losses (net of 90% of cumulative recoveries) on the portfolio of covered assets less the first loss amount.
The Group has a right to terminate the APS at any time provided that the Financial Services Authority has confirmed in writing to HMT that it has no objection to the proposed termination. On termination the Group must pay HMT the higher of the regulatory capital relief received and £2.5 billion less premiums paid plus the aggregate of amounts received from the UK Government under the APS.
HMT has the right to appoint step-in managers to carry out any oversight, management or additional functions on behalf of HMT to ensure that the covered assets are managed and administered in compliance with the agreed terms and conditions.
This right is exercisable if certain step-in triggers occur. These include:
| losses on covered assets in total exceed 125% of the first loss amount or losses on an individual covered asset class exceed specified thresholds; |
251
| a breach of specified obligations in the APS rules or the accession agreement; |
| the Group has failed or is failing to comply with any of the conditions in the APS rules in relation to asset management, monitoring and reporting, and governance and oversight and such failure is persistent and material or it is evidence of a systematic problem; and |
| material or systematic data deficiencies in the information provided to HMT in accordance with the terms of APS. |
HMT may at any time elect to cease to exercise its step-in rights in whole or part when it is satisfied that the step-in triggers have been remedied.
In consideration for the protection provided by the APS, the Group paid a premium of £700 million during 2010 (2009 - £1,400 million). Quarterly premiums of £125 million are payable from 31 December 2011 and subsequently until the earlier of 2099 and the termination of the agreement.
Notes on the accountscontinued | Financial statements |
41 Related parties (continued)No impairment losses were recognised by the Group in 2008The APS is a single contract providing credit protection in respect of balancesa portfolio of financial assets. Under IFRS, credit protection is treated either as a financial guarantee contract or as a derivative financial instrument depending on the terms of the agreement and the nature of the protected assets and exposures. The Group has concluded, principally because the covered portfolio includes significant exposure in the form of derivatives, that the APS does not meet the criteria to be treated as a financial guarantee contract. The contract has been accounted for as a derivative financial instrument. It is recognised at fair value of £550 million (2009 - £1,400 million) and included within the Derivative asset balance sheet caption. Changes in fair value of £1,550 million (2009 - nil) were recognised in profit or loss within Income from trading activities. Details of the valuation methodology for the APS are set out in Note 12 Financial instruments on pages 261 and 262.
There is no change in the recognition and measurement of the covered assets as a result of the APS. Impairment provisions on covered assets measured at amortised cost are assessed and charged in accordance with UK Governmentthe Group’s accounting policy; held-for-trading assets, assets designated at fair value and UK Government controlled bodies.available-for-sale assets within the APS portfolio continue to be measured at fair value with no adjustments to reflect the protection provided by the APS. There is no change in how gains and losses on the covered assets are recognised in the income statement or in other comprehensive income.
The Group also participates in a number of schemes operated by the Bank of England and the UK Government and made available to eligible banks and building societies.
Bank of England facilities include:
| Open market operations —- these provide market participants with funding at market rates on a tender basis in the form of short and long-term repos on a wide range of collateral and outright purchases of high-quality bonds to enable them to meet the reserves that they must hold at the Bank of England. |
| US dollar repo operations — these commenced in September 2008 taking the form of an auction. Eligible collateral consists of securities routinely eligible in the Bank's short-term repo open market operations together with conventional US Treasuries. |
· | The special liquidity scheme —- this was launched in April 2008 to allow financial institutions to swap temporarily illiquid assets for treasury bills, with fees charged based on the spread between 3-month LIBOR and the 3-month gilt repo rate. The scheme will operate for up to three years after the end of the drawdown period (30 January 2009) at the Bank of England's discretion. |
As at 31 December 2008,2010, the Group’sGroup's utilisation of these facilities amounted to £16.1 billion (2009 - £21.4 billion; 2008 - £41.8 billion.billion).
Government credit guarantee scheme — this was announced
Announced in October 2008. The Government, in return2008, the scheme provides a guarantee on eligible new debt issued by qualifying institutions for a fee. The fee, (50payable to HM Treasury on guaranteed issues is based on a per annum rate of 50 basis points plus 100% of the bank’sinstitution's median five-year credit default swap (CDS) spread during the twelve months to 7 October 2008), guarantees new unsecured borrowing.July 2008.
As at 31 December 2008,2010, the Group had obtained funding from the Bank of England and issued debt guaranteed by the governmentGovernment totalling £41.5 billion (2009 - £51.5 billion; 2008 - £32.2 billion.billion).
| a) | In their roles as providers of finance, Group companies provide development and other types of capital support to businesses. These investments are made in the normal course of business and on arm's length terms. In some instances, the investment may extend to ownership or control over 20% or more of the voting rights of the investee company. However, these investments are not considered to give rise to transactions of a materiality requiring disclosure under IAS 24. |
| b) | The Group recharges The Royal Bank of Scotland Group Pension Fund with the cost of administration services incurred by it. The amounts involved are not material to the Group. |
| c) | In accordance with IAS 24, transactions or balances between Group entities that have been eliminated on consolidation are not reported. |
| d) | The captions in the primary financial statements of the parent company include amounts attributable to subsidiaries. These amounts have been disclosed in aggregate in the relevant notes to the financial statements. |
44 Post balance sheet events
There have been no significant events between the year end and the date of approval of these accounts which would require a change to or disclosure in the accounts.
Notes on the accountscontinued | Financial statements |
Additional45 Consolidating financial information
The Royal Bank of Scotland plc ('RBS plc') is a wholly owned subsidiary of The Royal Bank of Scotland Group plc ('RBSG plc') and is able to offer and sell certain securities in the US from time to time pursuant to a registration statement on Form F-3 filed with the SEC with a full and unconditional guarantee from RBSG plc.
RBS plc utilises an exception provided in Rule 3-10 of Regulation S-X, and therefore does not file its financial statements with the SEC. In accordance with the requirements to qualify for the exception, presented below is condensed consolidating financial information for:
| RBSG plc on a standalone basis as guarantor; |
| RBS plc on a standalone basis as issuer; |
| Non-guarantor subsidiaries of RBSG plc and RBS plc on a combined basis ('Subsidiaries'); |
| Consolidation adjustments; and |
| RBSG plc consolidated amounts ('RBSG Group'). |
Under IAS 27, RBSG plc and RBS plc account for investments in their subsidiary undertakings at cost less impairment. Rule 3-10 of Regulation S-X requires a company to account for its investments in subsidiary undertakings using the equity method, which would increase/(decrease) the results for the period of RBSG plc and RBS plc in the information below by £3,553 million and £(699) million for the year ended 31 December 2010 (£(1,169) million and £825 million for the year ended 31 December 2009; £(14,108) million and £(7,610) million for the year ended 31 December 2008). The net assets of RBSG plc and RBS plc in the information below would also be increased by £15,908 million and £9,466 million at 31 December 2010 (£12,154 million and £9,533 million at 31 December 2009; £14,721 million and £11,913 million at 31 December 2008).
Income statements
| | RBSG plc £m | RBS plc £m | Subsidiaries £m | Consolidation adjustments £m | RBSG Group £m |
| |
| Year ended 31 December 2010 |
| Net interest income | 426 | 3,980 | 10,058 | (255) | 14,209 |
| Non-interest income (excluding insurance net premium income) | (4,894) | 7,658 | 5,776 | 3,991 | 12,531 |
| Insurance net premium income | — | — | 5,128 | — | 5,128 |
| Total income | (4,468) | 11,638 | 20,962 | 3,736 | 31,868 |
| | | | | | |
| Operating expenses | (3) | (7,683) | (10,966) | 424 | (18,228) |
| Insurance net claims | — | — | (4,783) | — | (4,783) |
| Impairment losses | — | (3,571) | (6,634) | 949 | (9,256) |
| Operating (loss)/profit before tax | (4,471) | 384 | (1,421) | 5,109 | (399) |
| Tax (charge)/credit | (83) | (598) | 75 | (28) | (634) |
| Loss from continuing operations | (4,554) | (214) | (1,346) | 5,081 | (1,033) |
| Loss from discontinued operations, net of tax | — | — | (593) | (40) | (633) |
| Loss for the year | (4,554) | (214) | (1,939) | 5,041 | (1,666) |
| | | | | | |
| Year ended 31 December 2009 | | | | | |
| Net interest income | 313 | 3,776 | 9,715 | (416) | 13,388 |
| Non-interest income (excluding insurance net premium income) | (1,572) | 7,079 | 5,661 | 3,204 | 14,372 |
| Insurance net premium income | — | — | 5,266 | — | 5,266 |
| Total income | (1,259) | 10,855 | 20,642 | 2,788 | 33,026 |
| | | | | | |
| Operating expenses | (27) | (6,073) | (10,368) | (949) | (17,417) |
| Insurance net claims | — | — | (4,357) | — | (4,357) |
| Impairment losses | — | (5,924) | (8,010) | 35 | (13,899) |
| Operating loss before tax | (1,286) | (1,142) | (2,093) | 1,874 | (2,647) |
| Tax (charge)/credit | (217) | 602 | 504 | (460) | 429 |
| Loss from continuing operations | (1,503) | (540) | (1,589) | 1,414 | (2,218) |
| Loss from discontinued operations, net of tax | — | — | (105) | — | (105) |
| Loss for the year | (1,503) | (540) | (1,694) | 1,414 | (2,323) |
Notes on the accountscontinued | Financial statements |
| | RBSG plc £m | RBS plc £m | Subsidiaries £m | Consolidation adjustments £m | RBSG Group £m |
| |
| Year ended 31 December 2008 |
| Net interest income | (680) | 4,742 | 11,398 | 22 | 15,482 |
| Non-interest income (excluding insurance net premium income) | (9,311) | 1,379 | (3,772) | 11,243 | (461) |
| Insurance net premium income | — | — | 5,709 | — | 5,709 |
| Total income | (9,991) | 6,121 | 13,335 | 11,265 | 20,730 |
| | | | | | |
| Operating expenses | (26) | (6,487) | (26,020) | (2,532) | (35,065) |
| Insurance net claims | — | — | (3,917) | — | (3,917) |
| Impairment losses | — | (2,007) | (5,224) | (208) | (7,439) |
| Operating loss before tax | (10,017) | (2,373) | (21,826) | 8,525 | (25,691) |
| Tax | 415 | 1,064 | 1,565 | (877) | 2,167 |
| Loss from continuing operations | (9,602) | (1,309) | (20,261) | 7,648 | (23,524) |
| Loss from discontinued operations, net of tax | — | — | (11,018) | — | (11,018) |
| Loss for the year | (9,602) | (1,309) | (31,279) | 7,648 | (34,542) |
Balance sheets
| | RBSG plc £m | RBS plc £m | Subsidiaries £m | Consolidation adjustments £m | RBSG Group £m |
| |
| At 31 December 2010 |
| Assets | | | | | |
| Cash and balances at central banks | — | 44,921 | 12,093 | — | 57,014 |
| Loans and advances to banks | 19,535 | 100,965 | 343,198 | (363,180) | 100,518 |
| Loans and advances to customers | 6,689 | 349,179 | 340,881 | (141,489) | 555,260 |
| Debt securities | 1,454 | 189,208 | 106,684 | (79,866) | 217,480 |
| Equity shares | — | 1,016 | 21,982 | (800) | 22,198 |
| Investments in Group undertakings | 49,125 | 27,504 | 12,119 | (88,748) | — |
| Settlement balances | — | 3,529 | 8,068 | 8 | 11,605 |
| Derivatives | 1,475 | 432,812 | 35,230 | (42,440) | 427,077 |
| Intangible assets | — | 443 | 7,060 | 6,945 | 14,448 |
| Property, plant and equipment | — | 2,301 | 14,247 | (5) | 16,543 |
| Deferred tax | 2 | 794 | 5,161 | 416 | 6,373 |
| Prepayments, accrued income and other assets | 28 | 4,760 | 9,696 | (1,908) | 12,576 |
| Assets of disposals groups | — | 4,765 | 7,719 | — | 12,484 |
| Total assets | 78,308 | 1,162,197 | 924,138 | (711,067) | 1,453,576 |
| | | | | | |
| Liabilities | | | | | |
| Deposits by banks | — | 197,973 | 207,685 | (306,868) | 98,790 |
| Customer accounts | 1,029 | 295,358 | 392,733 | (178,427) | 510,693 |
| Debt securities in issue | 8,742 | 128,073 | 161,006 | (79,449) | 218,372 |
| Settlement balances | — | 3,343 | 7,648 | — | 10,991 |
| Short positions | — | 25,687 | 17,862 | (431) | 43,118 |
| Derivatives | 231 | 424,503 | 41,673 | (42,440) | 423,967 |
| Accruals, deferred income and other liabilities | 1,034 | 8,058 | 14,603 | (606) | 23,089 |
| Retirement benefit liabilities | — | 23 | 796 | 1,469 | 2,288 |
| Deferred tax | — | — | 2,415 | (273) | 2,142 |
| Insurance liabilities | — | — | 6,829 | (35) | 6,794 |
| Subordinated liabilities | 8,048 | 29,299 | 9,932 | (20,226) | 27,053 |
| Liabilities of disposal groups | — | 2,336 | 7,092 | — | 9,428 |
| Total liabilities | 19,084 | 1,114,653 | 870,274 | (627,286) | 1,376,725 |
| | | | | | |
| Non-controlling interests | — | — | 1,616 | 103 | 1,719 |
| Owners’ equity | 59,224 | 47,544 | 52,248 | (83,884) | 75,132 |
| Total equity | 59,224 | 47,544 | 53,864 | (83,781) | 76,851 |
| Total liabilities and equity | 78,308 | 1,162,197 | 924,138 | (711,067) | 1,453,576 |
Notes on the accountscontinued | Financial statements |
| | RBSG plc £m | RBS plc £m | Subsidiaries £m | Consolidation adjustments £m | RBSG Group £m |
| |
| At 31 December 2009 |
| Assets | | | | | |
| Cash and balances at central banks | — | 21,099 | 31,162 | — | 52,261 |
| Loans and advances to banks | 31,238 | 77,365 | 305,163 | (322,013) | 91,753 |
| Loans and advances to customers | 2,777 | 338,548 | 510,117 | (123,049) | 728,393 |
| Debt securities | 1,286 | 214,598 | 141,004 | (89,634) | 267,254 |
| Equity shares | — | 1,025 | 19,265 | (762) | 19,528 |
| Investments in Group undertakings | 64,766 | 29,385 | 12,282 | (106,433) | — |
| Settlement balances | 11 | 4,159 | 7,863 | — | 12,033 |
| Derivatives | 1,169 | 450,913 | 63,856 | (74,484) | 441,454 |
| Intangible assets | — | 210 | 10,986 | 6,651 | 17,847 |
| Property, plant and equipment | — | 2,447 | 16,945 | 5 | 19,397 |
| Deferred tax | 2 | 1,728 | 5,391 | (82) | 7,039 |
| Prepayments, accrued income and other assets | 43 | 9,988 | 12,780 | (1,826) | 20,985 |
| Assets of disposals groups | — | 7,150 | 11,392 | — | 18,542 |
| Total assets | 101,292 | 1,158,615 | 1,148,206 | (711,627) | 1,696,486 |
| | | | | | |
| Liabilities | | | | | |
| Deposits by banks | 93 | 188,548 | 203,497 | (249,994) | 142,144 |
| Customer accounts | 13,264 | 289,792 | 487,290 | (176,144) | 614,202 |
| Debt securities in issue | 11,788 | 129,814 | 212,737 | (86,771) | 267,568 |
| Settlement balances | — | 4,541 | 5,872 | — | 10,413 |
| Short positions | — | 23,811 | 19,799 | (3,147) | 40,463 |
| Derivatives | 446 | 430,005 | 68,174 | (74,484) | 424,141 |
| Accruals, deferred income and other liabilities | 1,357 | 9,949 | 21,025 | (2,004) | 30,327 |
| Retirement benefit liabilities | — | 16 | 1,057 | 1,890 | 2,963 |
| Deferred tax | — | — | 3,340 | (529) | 2,811 |
| Insurance liabilities | — | — | 10,281 | — | 10,281 |
| Subordinated liabilities | 8,762 | 30,513 | 18,428 | (20,051) | 37,652 |
| Liabilities of disposal groups | — | 6,108 | 12,782 | — | 18,890 |
| Total liabilities | 35,710 | 1,113,097 | 1,064,282 | (611,234) | 1,601,855 |
| | | | | | |
| Non-controlling interests | — | — | 2,166 | 14,729 | 16,895 |
| Owners’ equity | 65,582 | 45,518 | 81,758 | (115,122) | 77,736 |
| Total equity | 65,582 | 45,518 | 83,924 | (100,393) | 94,631 |
| Total liabilities and equity | 101,292 | 1,158,615 | 1,148,206 | (711,627) | 1,696,486 |
Notes on the accountscontinued | Financial statements |
| | RBSG plc £m | RBS plc £m | Subsidiaries £m | Consolidation adjustments £m | RBSG Group £m |
| |
| At 31 December 2008 |
| Assets | | | | | |
| Cash and balances at central banks | — | 3,714 | 8,686 | — | 12,400 |
| Loans and advances to banks | 27,031 | 91,717 | 222,172 | (202,723) | 138,197 |
| Loans and advances to customers | — | 327,040 | 596,306 | (48,624) | 874,722 |
| Debt securities | — | 159,698 | 151,004 | (43,153) | 267,549 |
| Equity shares | — | 1,020 | 26,063 | (753) | 26,330 |
| Investments in Group undertakings | 42,196 | 26,814 | 11,166 | (80,176) | — |
| Settlement balances | — | 5,335 | 12,497 | — | 17,832 |
| Derivatives | 1,168 | 938,505 | 187,009 | (134,123) | 992,559 |
| Intangible assets | — | 136 | 13,132 | 6,781 | 20,049 |
| Property, plant and equipment | — | 2,368 | 16,450 | 131 | 18,949 |
| Deferred tax | 3 | 1,323 | 4,745 | 1,011 | 7,082 |
| Prepayments, accrued income and other assets | 489 | 5,930 | 18,423 | (440) | 24,402 |
| Assets of disposals groups | — | — | 1,581 | — | 1,581 |
| Total assets | 70,887 | 1,563,600 | 1,269,234 | (502,069) | 2,401,652 |
| | | | | | |
| Liabilities | | | | | |
| Deposits by banks | 1,802 | 201,266 | 205,036 | (150,060) | 258,044 |
| Customer accounts | 26 | 229,266 | 496,037 | (85,817) | 639,512 |
| Debt securities in issue | 14,179 | 115,149 | 213,859 | (42,898) | 300,289 |
| Settlement balances | — | 5,534 | 6,207 | — | 11,741 |
| Short positions | — | 23,827 | 19,051 | (342) | 42,536, |
| Derivatives | 361 | 911,174 | 193,952 | (134,123) | 971,364 |
| Accruals, deferred income and other liabilities | 47 | 9,618 | 22,491 | (674) | 31,482 |
| Retirement benefit liabilities | — | 23 | 2,006 | 3 | 2,032 |
| Deferred tax | — | — | 2,892 | 1,273 | 4,165 |
| Insurance liabilities | — | — | 9,976 | — | 9,976 |
| Subordinated liabilities | 10,314 | 33,698 | 23,455 | (18,313) | 49,154 |
| Liabilities of disposal groups | — | — | 859 | — | 859 |
| Total liabilities | 26,729 | 1,529,555 | 1,195,821 | (430,951) | 2,321,154 |
| | | | | | |
| Non-controlling interests | — | — | 2,041 | 19,578 | 21,619 |
| Owners’ equity | 44,158 | 34,045 | 71,372 | (90,696) | 58,879 |
| Total equity | 44,158 | 34,045 | 73,413 | (71,118) | 80,498 |
| Total liabilities and equity | 70,887 | 1,563,600 | 1,269,234 | (502,069) | 2,401,652 |
Notes on the accountscontinued | Financial statements |
Cash flow statements
| | RBSG plc £m | RBS plc £m | Subsidiaries £m | Consolidation adjustments £m | RBSG Group £m |
| |
| Year ended 31 December 2010 |
| Net cash flows from operating activities | (9,038) | 29,444 | 6,381 | (7,496) | 19,291 |
| Net cash flows from investing activities | (1,878) | 5,646 | 362 | (779) | 3,351 |
| Net cash flows from financing activities | (3,180) | 252 | (13,133) | 1,681 | (14,380) |
| Effects of exchange rate changes on cash and cash equivalents | 5 | 321 | 761 | (1,005) | 82 |
| Net increase/(decrease) in cash and cash equivalents | (14,091) | 35,663 | (5,629) | (7,599) | 8,344 |
| Cash and cash equivalents at the beginning of the year | 16,448 | 78,716 | 174,913 | (125,891) | 144,186 |
| Cash and cash equivalents at the end of the year | 2,357 | 114,379 | 169,284 | (133,490) | 152,530 |
| | | | | | |
| Year ended 31 December 2009 | | | | | |
| Net cash flows from operating activities | 16,365 | 49,844 | 1,887 | (69,088) | (992) |
| Net cash flows from investing activities | (15,720) | (53,061) | 50,103 | 18,732 | 54 |
| Net cash flows from financing activities | 10,817 | 12,246 | 15,752 | (20,024) | 18,791 |
| Effects of exchange rate changes on cash and cash equivalents | (83) | (3,762) | (7,356) | 2,609 | (8,592) |
| Net increase in cash and cash equivalents | 11,379 | 5,267 | 60,386 | (67,771) | 9,261 |
| Cash and cash equivalents at the beginning of the year | 5,069 | 73,449 | 114,527 | (58,120) | 134,925 |
| Cash and cash equivalents at the end of the year | 16,448 | 78,716 | 174,913 | (125,891) | 144,186 |
| Year ended 31 December 2008 | | | | | |
| Net cash flows from operating activities | (16,032) | 29,425 | (100,181) | 11,450 | (75,338) |
| Net cash flows from investing activities | (9,649) | (54,131) | 63,614 | 17,163 | 16,997 |
| Net cash flows from financing activities | 28,416 | 8,057 | (9,659) | (11,712) | 15,102 |
| Effects of exchange rate changes on cash and cash equivalents | 761 | 12,849 | 23,452 | (7,853) | 29,209 |
| Net increase/(decrease) in cash and cash equivalents | 3,496 | (3,800) | (22,774) | 9,048 | (14,030) |
| Cash and cash equivalents at the beginning of the year | 1,573 | 77,249 | 137,301 | (67,168) | 148,955 |
| Cash and cash equivalents at the end of the year | 5,069 | 73,449 | 114,527 | (58,120) | 134,925 |
254Additional information | Contents |
| 333 | Financial Summarysummary |
254 | Amounts in accordance with IFRS |
263341 | Exchange rates |
264342 | Economic and monetary environment |
265343 | Supervision |
266344 | Regulatory reviewsdevelopments and developmentsreviews |
267345 | Description of property and equipment |
267345 | Major shareholders |
267345 | Material contracts |
272351 | FSA Listing Rules disclosureADR payment information |
| 352 | Risk factors |
Additional information continued | Additional information |
Financial summary
The Group’sGroup's financial statements are prepared in accordance with IFRS as issued by the IASB.IFRS. Selected data under IFRS for each of the five years ended 31 December 20082010 are presented on pages 254 to 262.
below. The dollar financial information included below has been converted from sterling at a rate of £1.00 to US$1.4619,1.5392, being the Noon Buying Rate on 3130 December 2008.
Amounts2010 (the last US business day in accordance with IFRS
| | | 2008 | | | 2008 | | | 2007 | | | 2006 | | | 2005 | | | 2004 | |
| Summary consolidated income statement — IFRS | | | $m | | | | £m | | | | £m | | | | £m | | | | £m | | | | £m | |
| Net interest income | | | 27,301 | | | | 18,675 | | | | 12,069 | | | | 10,596 | | | | 9,918 | | | | 9,071 | |
Non-interest income (1) | | | 10,515 | | | | 7,193 | | | | 18,297 | | | | 17,406 | | | | 15,984 | | | | 14,320 | |
| Total income | | | 37,816 | | | | 25,868 | | | | 30,366 | | | | 28,002 | | | | 25,902 | | | | 23,391 | |
Operating expenses (2, 3, 4, 5, 6) | | | 78,991 | | | | 54,033 | | | | 13,942 | | | | 12,480 | | | | 11,946 | | | | 10,362 | |
| (Loss)/profit before other operating charges and impairment losses | | | (41,175 | ) | | | (28,165 | ) | | | 16,424 | | | | 15,522 | | | | 13,956 | | | | 13,029 | |
| Insurance net claims | | | 6,476 | | | | 4,430 | | | | 4,624 | | | | 4,458 | | | | 4,313 | | | | 4,260 | |
| Impairment | | | 11,800 | | | | 8,072 | | | | 1,968 | | | | 1,878 | | | | 1,707 | | | | 1,485 | |
| Operating (loss)/profit before tax | | | (59,451 | ) | | | (40,667 | ) | | | 9,832 | | | | 9,186 | | | | 7,936 | | | | 7,284 | |
| Tax | | | (3,396 | ) | | | (2,323 | ) | | | 2,044 | | | | 2,689 | | | | 2,378 | | | | 1,995 | |
| (Loss)/profit from continuing operations | | | (56,055 | ) | | | (38,344 | ) | | | 7,788 | | | | 6,497 | | | | 5,558 | | | | 5,289 | |
| Profit/(loss) from discontinued operations, net of tax | | | 5,805 | | | | 3,971 | | | | (76 | ) | | | — | | | | — | | | | — | |
| (Loss)/profit for the year | | | (50,250 | ) | | | (34,373 | ) | | | 7,712 | | | | 6,497 | | | | 5,558 | | | | 5,289 | |
| | | | | | | | | | | | | | | | | | | | | | | | | |
| (Loss)/profit attributable to: | | | | | | | | | | | | | | | | | | | | | | | | |
| Minority interests | | | (15,835 | ) | | | (10,832 | ) | | | 163 | | | | 104 | | | | 57 | | | | 177 | |
| Other owners | | | 871 | | | | 596 | | | | 246 | | | | 191 | | | | 109 | | | | 256 | |
| Ordinary shareholders | | | (35,286 | ) | | | (24,137 | ) | | | 7,303 | | | | 6,202 | | | | 5,392 | | | | 4,856 | |
| Summary consolidated income statement | 2010 $m | 2010
£m | 2009 £m | 2008 £m | 2007 £m | 2006 £m |
| Net interest income | 21,870 | 14,209 | 13,388 | 15,482 | 11,550 | 10,596 |
Non-interest income (1,2,3) | 27,181 | 17,659 | 19,638 | 5,248 | 17,922 | 17,406 |
| Total income | 49,051 | 31,868 | 33,026 | 20,730 | 29,472 | 28,002 |
Operating expenses (4,5,6,7) | (28,056) | (18,228) | (17,417) | (35,065) | (13,383) | (12,480) |
| Profit/(loss) before other operating charges and impairment losses | 20,995 | 13,640 | 15,609 | (14,335) | 16,089 | 15,522 |
| Insurance net claims | (7,362) | (4,783) | (4,357) | (3,917) | (4,528) | (4,458) |
| Impairment losses | (14,247) | (9,256) | (13,899) | (7,439) | (1,925) | (1,878) |
| Operating (loss)/profit before tax | (614) | (399) | (2,647) | (25,691) | 9,636 | 9,186 |
| Tax (charge)/credit | (976) | (634) | 429 | 2,167 | (2,011) | (2,689) |
| (Loss)/profit from continuing operations | (1,590) | (1,033) | (2,218) | (23,524) | 7,625 | 6,497 |
| (Loss)/profit from discontinued operations, net of tax | (974) | (633) | (105) | (11,018) | 87 | — |
| (Loss)/profit for the year | (2,564) | (1,666) | (2,323) | (34,542) | 7,712 | 6,497 |
| | | | | | | |
| (Loss)/profit attributable to: | | | | | | |
| Non-controlling interests | (1,023) | (665) | 349 | (10,832) | 163 | 104 |
| Preference shareholders | 162 | 105 | 878 | 536 | 246 | 191 |
| Paid-in equity holders | 29 | 19 | 57 | 60 | — | — |
| Ordinary and B shareholders | (1,732) | (1,125) | (3,607) | (24,306) | 7,303 | 6,202 |
Notes:
| (1) | Includes gaingains on salestrategic disposals of strategic investment of £333£171 million in 2005.(2009 - £132 million; 2008 - £442 million). |
| (2) | Includes lossgain on saleredemption of subsidiariesown debt of £93£553 million in 2005.(2009 - £3,790 million). |
| (3) | Includes integration expenditurefair value of £1,050own debt of £174 million inprofit (2009 - £142 million loss; 2008 (2007 — £108 million; 2006 — £134 million; 2005 — £458 million; 2004 —£520 million)- £1,232 million profit). |
| (4) | Includes purchased intangibles amortisationintegration and restructuring costs of £919£1,032 million in(2009 - £1,286 million; 2008 (2007 — £234- £1,357 million; 2007 - £108 million; 2006 — £94 million; 2005 — £97 million; 2004 —£45- £134 million). |
| (5) | Includes restructuring expenditureamortisation of £307purchased intangible assets of £369 million in 2008.(2009 - £272 million; 2008 - £443 million; 2007 - £162 million; 2006 - £94 million). |
| (6) | Includes write-down of goodwill and other intangiblesintangible assets of £32,581£10 million (2009 - £363 million; 2008 - £16,911 million). |
| (7) | Includes gains on pensions curtailment of £2,148 million in 2008.2009. |
| | | 2008 | | | 2008 | | | 2007 | | | 2006 | | | 2005 | | | 2004 | |
| Summary consolidated balance sheet — IFRS | | | $m | | | | £m | | | | £m | | | | £m | | | | £m | | | | £m | |
Loans and advances (1) | | | 1,480,786 | | | | 1,012,919 | | | | 1,047,998 | | | | 549,499 | | | | 487,813 | | | | 408,324 | |
| Debt securities and equity shares | | | 429,622 | | | | 293,879 | | | | 347,682 | | | | 146,246 | | | | 135,804 | | | | 104,741 | |
Derivatives and settlement balances (2) | | | 1,477,091 | | | | 1,010,391 | | | | 293,991 | | | | 109,506 | | | | 89,470 | | | | 15,193 | |
Other assets (1) | | | 123,476 | | | | 84,463 | | | | 151,158 | | | | 51,581 | | | | 51,542 | | | | 51,575 | |
| Total assets | | | 3,510,975 | | | | 2,401,652 | | | | 1,840,829 | | | | 856,832 | | | | 764,629 | | | | 579,833 | |
| | | | | | | | | | | | | | | | | | | | | | | | | |
| Owners’ equity | | | 86,075 | | | | 58,879 | | | | 53,038 | | | | 40,227 | | | | 35,435 | | | | 33,905 | |
| Minority interests | | | 31,605 | | | | 21,619 | | | | 38,388 | | | | 5,263 | | | | 2,109 | | | | 3,492 | |
Subordinated liabilities (1) | | | 71,858 | | | | 49,154 | | | | 38,043 | | | | 27,654 | | | | 28,274 | | | | 20,366 | |
Deposits (1) | | | 1,312,137 | | | | 897,556 | | | | 994,657 | | | | 516,365 | | | | 453,274 | | | | 383,198 | |
Derivatives, settlement balances and short positions (2) | | | 1,499,385 | | | | 1,025,641 | | | | 363,073 | | | | 152,988 | | | | 128,228 | | | | 43,577 | |
Other liabilities (1) | | | 509,915 | | | | 348,803 | | | | 353,630 | | | | 114,335 | | | | 117,309 | | | | 95,295 | |
| Total liabilities and equity | | | 3,510,975 | | | | 2,401,652 | | | | 1,840,829 | | | | 856,832 | | | | 764,629 | | | | 579,833 | |
| Summary consolidated balance sheet | 2010
$m | 2010 £m | 2009 £m | 2008 £m | 2007
£m | 2006
£m |
| Loans and advances | 1,009,374 | 655,778 | 820,146 | 1,012,919 | 1,047,998 | 549,499 |
| Debt securities and equity shares | 368,912 | 239,678 | 286,782 | 293,879 | 347,682 | 146,246 |
| Derivatives and settlement balances | 675,219 | 438,682 | 453,487 | 1,010,391 | 293,991 | 109,506 |
| Other assets | 183,839 | 119,438 | 136,071 | 84,463 | 151,158 | 51,581 |
| Total assets | 2,237,344 | 1,453,576 | 1,696,486 | 2,401,652 | 1,840,829 | 856,832 |
| | | | | | | |
| Owners' equity | 115,643 | 75,132 | 77,736 | 58,879 | 53,038 | 40,227 |
| Non-controlling interests | 2,646 | 1,719 | 16,895 | 21,619 | 38,388 | 5,263 |
| Subordinated liabilities | 41,640 | 27,053 | 37,652 | 49,154 | 38,043 | 27,654 |
| Deposits | 938,116 | 609,483 | 756,346 | 897,556 | 994,657 | 516,365 |
| Derivatives, settlement balances and short positions | 735,855 | 478,076 | 475,017 | 1,025,641 | 363,073 | 152,988 |
| Other liabilities | 403,444 | 262,113 | 332,840 | 348,803 | 353,630 | 114,335 |
| Total liabilities and equity | 2,237,344 | 1,453,576 | 1,696,486 | 2,401,652 | 1,840,829 | 856,832 |
(1)Additional information continued | 2007 comparative data have been restated following finalisation of the ABN AMRO acquisition accounting.Additional information |
Financial summary continued
| Other financial data | 2010 | 2009 | 2008 | 2007 | 2006 |
(Loss)/earnings per ordinary and B share from continuing operations - pence (1) | (0.5p) | (6.3) | (146.2) | 64.0 | 54.4 |
Diluted (loss)/earnings per ordinary and B share from continuing operations - pence (1,2) | (0.5p) | (6.3) | (146.2) | 63.4 | 53.9 |
Dividends per ordinary share - pence | — | — | 19.3 | 27.0 | 21.6 |
Dividend payout ratio (3) | — | — | — | 43% | 45% |
| Share price per ordinary share at year end - £ | 0.39 | 0.29 | 0.49 | 3.72 | 5.56 |
Market capitalisation at year end - £bn | 42.8 | 31.4 | 19.5 | 44.4 | 62.8 |
| Net asset value per ordinary and B share - £ | 0.64 | 0.65 | 1.15 | 3.74 | 3.24 |
Return on average total assets (4) | (0.07%) | (0.18%) | (1.19%) | 0.65% | 0.74% |
Return on average ordinary and B shareholders' equity (5) | (0.7%) | (7.2%) | (50.1%) | 18.7% | 18.5% |
| Average owners' equity as a percentage of average total assets | 4.6% | 2.8% | 2.9% | 3.9% | 4.4% |
Risk asset ratio - Tier 1 | 12.9% | 14.1% | 10.0% | 7.3% | 7.5% |
Risk asset ratio - Total | 14.0% | 16.1% | 14.1% | 11.2% | 11.7% |
Ratio of earnings to combined fixed charges and preference share dividends (6,7) | | | | | |
- including interest on deposits | 0.94 | 0.75 | 0.05 | 1.45 | 1.62 |
- excluding interest on deposits | 0.38 | (0.30) | (7.80) | 5.73 | 6.12 |
Ratio of earnings to fixed charges only (6,7) | | | | | |
- including interest on deposits | 0.95 | 0.80 | 0.05 | 1.47 | 1.64 |
- excluding interest on deposits | 0.44 | (0.46) | (9.74) | 6.53 | 6.87 |
| (1) | The number of ordinary shares in issue in 2008, 2007 and 2006 were adjusted retrospectively for the bonus element of the rights issue completed in June 2008 and the capitalisation issue in September 2008. |
| (2) | 2007 to 2004 comparative amounts have been restated forNone of the netting of certain derivative asset and derivative liability balances with the London Clearing House. |
The per share data in the table below have been restated for the effect of the rights issue in June 2008 and the capitalisation issue in September 2008.| Other financial data based upon IFRS | | 2008 | | | 2007 | | | 2006 | | | 2005 | | | 2004 | |
| Earnings per ordinary share — pence | | | (145.7 | ) | | | 64.0 | | | | 54.4 | | | | 47.3 | | | | 43.9 | |
Diluted earnings per ordinary share — pence (1) | | | (145.7 | ) | | | 63.4 | | | | 53.9 | | | | 47.0 | | | | 43.5 | |
| Dividends per ordinary share — pence | | | 19.3 | | | | 27.0 | | | | 21.6 | | | | 17.0 | | | | 14.7 | |
Dividend payout ratio (2) | | | — | | | | 45% | | | | 46% | | | | 43% | | | | 38% | |
| Share price per ordinary share at year end — £ | | | 0.494 | | | | 3.72 | | | | 5.56 | | | | 4.90 | | | | 4.89 | |
| Market capitalisation at year end — £bn | | | 19.5 | | | | 44.4 | | | | 62.8 | | | | 56.1 | | | | 55.6 | |
| Net asset value per ordinary share — £ | | | 1.15 | | | | 3.74 | | | | 3.24 | | | | 2.83 | | | | 2.59 | |
Return on average total assets (3) | | | (1.18% | ) | | | 0.65% | | | | 0.74% | | | | 0.73% | | | | 0.94% | |
Return on average ordinary shareholders’ equity (4) | | | (50.0% | ) | | | 18.8% | | | | 18.5% | | | | 17.5% | | | | 18.3% | |
| Average owners’ equity as a percentage of average total assets | | | 2.9% | | | | 3.9% | | | | 4.4% | | | | 4.5% | | | | 5.9% | |
| Risk asset ratio — Tier 1 | | | 10.0% | | | | 7.3% | | | | 7.5% | | | | 7.6% | | | | 7.0% | |
| Risk asset ratio — Total | | | 14.1% | | | | 11.2% | | | | 11.7% | | | | 11.7% | | | | 11.7% | |
Ratio of earnings to combined fixed charges and preference share dividends (5) | | | | | | | | | | |
| — including interest on deposits | | | (0.29 | ) | | | 1.45 | | | | 1.62 | | | | 1.67 | | | | 1.88 | |
| — excluding interest on deposits | | | (11.96 | ) | | | 5.73 | | | | 6.12 | | | | 6.05 | | | | 7.43 | |
Ratio of earnings to fixed charges only (5) | | | | | | | | | | | | | | | | | | | | |
| — including interest on deposits | | | (0.30 | ) | | | 1.47 | | | | 1.64 | | | | 1.69 | | | | 1.94 | |
| — excluding interest on deposits | | | (14.71 | ) | | | 6.53 | | | | 6.87 | | | | 6.50 | | | | 9.70 | |
(1) | Noneconvertible securities had a dilutive effect in 2010, 2009 or 2008. All of the convertible preference shares had a dilutive effect in 2008. All the convertible preference shares had a dilutive effect in 2007 2006 and 20052006 and as such were included in the computation of diluted earnings per share. In 2004, $1,500 million of convertible preference shares was not included in the computation of diluted earnings per share as their effect was anti-dilutive. |
(2)(3) | Dividend payout ratio represents the interim dividend paid and current year final dividend proposed as a percentage of profit attributable to ordinary shareholders.and B shareholders before discontinued operations, integration and restructuring costs, amortisation of purchased intangible assets and net gain on sale of strategic investments and subsidiaries (net of tax). |
(3)(4) | Return on average total assets represents profit attributable to ordinary and B shareholders as a percentage of average total assets. |
(4)(5) | Return on average ordinary shareholders’and B shareholders' equity represents profit attributable to ordinary and B shareholders expressed as a percentage of average ordinary shareholders’and B shareholders' equity. |
(5)(6) | For this purpose, earnings consist of income before tax and minoritynon-controlling interests, plus fixed charges less the unremitted income of associated undertakings (share of profits less dividends received). Fixed charges consist of total interest expense, including or excluding interest on deposits and debt securities in issue, as appropriate, and the proportion of rental expense deemed representative of the interest factor (one third of total rental expenses). |
| (7) | The earnings for the years ended December 31, 2010, 2009 and 2008, were inadequate to cover total fixed charges and preference share dividends. The coverage deficiencies for total fixed charges and preference share dividends for the years ended December 31, 2010, 2009 and 2008 were £523 million, £3,582 million and £26,287 million, respectively. The coverage deficiencies for fixed charges only for the years ended December 31, 2010, 2009 and 2008 were £399 million, £2,647 million and £25,691 million, respectively. |
Additional information continued | Additional information |
Amounts in accordance with IFRS (continued)
Analysis of loans and advances to customers — IFRS
The following table analyses loans and advances to customers before provisions by remaining maturity, geographical area and type of customer.
| | | Within 1 year | | | After 1 but within 5 years | | | After 5 years | | | 2008 Total | | | 2007 | | | 2006 | | | 2005 | | | 2004 | |
| | | | £m | | | | £m | | | | £m | | | | £m | | | | £m | | | | £m | | | | £m | | | | £m | |
| UK | | | | | | | | | | | | | | | | | | | | | | | | | | | | | | | | |
| Central and local government | | | 2,760 | | | | 27 | | | | 304 | | | | 3,091 | | | | 3,135 | | | | 6,732 | | | | 3,340 | | | | 1,866 | |
| Manufacturing | | | 8,615 | | | | 4,552 | | | | 1,907 | | | | 15,074 | | | | 13,452 | | | | 11,051 | | | | 11,615 | | | | 6,292 | |
| Construction | | | 6,465 | | | | 2,482 | | | | 1,224 | | | | 10,171 | | | | 10,202 | | | | 8,251 | | | | 7,274 | | | | 5,024 | |
| Finance | | | 35,055 | | | | 3,547 | | | | 3,830 | | | | 42,432 | | | | 70,006 | | | | 25,017 | | | | 27,091 | | | | 24,638 | |
| Service industries and business activities | | | 25,763 | | | | 13,076 | | | | 19,799 | | | | 58,638 | | | | 53,965 | | | | 43,887 | | | | 40,687 | | | | 30,867 | |
| Agriculture, forestry and fishing | | | 1,361 | | | | 302 | | | | 1,309 | | | | 2,972 | | | | 2,473 | | | | 2,767 | | | | 2,645 | | | | 2,481 | |
| Property | | | 19,231 | | | | 15,251 | | | | 17,645 | | | | 52,127 | | | | 50,051 | | | | 39,296 | | | | 32,899 | | | | 26,448 | |
| Individuals — home mortgages | | | 19,005 | | | | 1,672 | | | | 60,290 | | | | 80,967 | | | | 73,916 | | | | 70,884 | | | | 65,286 | | | | 57,535 | |
| — other | | | 20,027 | | | | 3,337 | | | | 3,625 | | | | 26,989 | | | | 28,186 | | | | 27,922 | | | | 26,323 | | | | 26,459 | |
| Finance leases and instalment credit | | | 2,705 | | | | 6,666 | | | | 7,992 | | | | 17,363 | | | | 15,632 | | | | 14,218 | | | | 13,909 | | | | 13,044 | |
| Accrued interest | | | 2,348 | | | | 29 | | | | 86 | | | | 2,463 | | | | 2,344 | | | | 1,497 | | | | 1,250 | | | | — | |
| Total domestic | | | 143,335 | | | | 50,941 | | | | 118,011 | | | | 312,287 | | | | 323,362 | | | | 251,522 | | | | 232,319 | | | | 194,654 | |
| Overseas residents | | | 60,415 | | | | 36,570 | | | | 22,671 | | | | 119,656 | | | | 98,845 | | | | 69,242 | | | | 52,234 | | | | 48,183 | |
| Total UK offices | | | 203,750 | | | | 87,511 | | | | 140,682 | | | | 431,943 | | | | 422,207 | | | | 320,764 | | | | 284,553 | | | | 242,837 | |
| | | | | | | | | | | | | | | | | | | | | | | | | | | | | | | | | |
| Overseas | | | | | | | | | | | | | | | | | | | | | | | | | | | | | | | | |
| US | | | 38,706 | | | | 42,123 | | | | 45,448 | | | | 126,277 | | | | 135,059 | | | | 92,166 | | | | 90,606 | | | | 74,027 | |
| Rest of the World | | | 107,184 | | | | 66,794 | | | | 153,413 | | | | 327,391 | | | | 277,721 | | | | 57,896 | | | | 45,951 | | | | 34,555 | |
| Total Overseas offices | | | 145,890 | | | | 108,917 | | | | 198,861 | | | | 453,668 | | | | 412,780 | | | | 150,062 | | | | 136,557 | | | | 108,582 | |
| Loans and advances to customers — gross | | | 349,640 | | | | 196,428 | | | | 339,543 | | | | 885,611 | | | | 834,987 | | | | 470,826 | | | | 421,110 | | | | 351,419 | |
| Loan impairment provisions | | | | | | | | | | | | | | | (10,889 | ) | | | (6,449 | ) | | | (3,933 | ) | | | (3,884 | ) | | | (4,168 | ) |
| Loans and advances to customers — net | | | | | | | | | | | | | | | 874,722 | | | | 828,538 | | | | 466,893 | | | | 417,226 | | | | 347,251 | |
| | | | | | | | | | | | | | | | | | | | | | | | | | | | | | | | | |
| Fixed rate | | | 57,671 | | | | 46,487 | | | | 79,536 | | | | 183,693 | | | | 351,336 | | | | 115,240 | | | | 100,748 | | | | 101,227 | |
| Variable rate | | | 291,969 | | | | 149,941 | | | | 260,007 | | | | 701,918 | | | | 483,651 | | | | 355,586 | | | | 320,362 | | | | 250,192 | |
| Loans and advances to customers — gross | | | 349,640 | | | | 196,428 | | | | 339,543 | | | | 885,611 | | | | 834,987 | | | | 470,826 | | | | 421,110 | | | | 351,419 | |
Cross border exposures
Cross border exposures are defined as loans to banks and customers (including finance lease and instalment credit receivables) and other monetary assets, including non-local currency claims of overseas offices on local residents.| | Within 1 year £m | After 1 year but within 5 years £m | After 5 years £m | 2010 Total £m | 2009 £m | 2008 £m | 2007 £m | 2006 £m |
| UK | | | | | | | | |
| Central and local government | 2,421 | 3 | 1,495 | 3,919 | 3,174 | 3,091 | 3,135 | 6,732 |
| Finance | 32,902 | 3,223 | 2,850 | 38,975 | 36,283 | 42,432 | 70,006 | 25,017 |
| Residential mortgages | 2,833 | 3,430 | 94,894 | 101,157 | 92,583 | 80,967 | 73,916 | 70,884 |
| Personal lending | 14,747 | 4,525 | 3,964 | 23,236 | 25,254 | 26,989 | 28,186 | 27,922 |
| Property | 14,447 | 15,306 | 12,204 | 41,957 | 48,895 | 52,127 | 50,051 | 39,296 |
| Construction | 4,164 | 1,111 | 1,065 | 6,340 | 7,780 | 10,171 | 10,202 | 8,251 |
| Manufacturing | 5,717 | 2,059 | 1,335 | 9,111 | 11,432 | 15,074 | 13,452 | 11,051 |
| Service industries and business activities | 20,017 | 10,199 | 15,469 | 45,685 | 51,855 | 58,638 | 53,965 | 43,887 |
| Agriculture, forestry and fishing | 1,098 | 363 | 1,297 | 2,758 | 2,913 | 2,972 | 2,473 | 2,767 |
| Finance leases and instalment credit | 3,010 | 5,736 | 4,628 | 13,374 | 16,186 | 17,363 | 15,632 | 14,218 |
| Accrued interest | 500 | 9 | 49 | 558 | 992 | 2,463 | 2,344 | 1,497 |
| Total domestic | 101,856 | 45,964 | 139,250 | 287,070 | 297,347 | 312,287 | 323,362 | 251,522 |
| Overseas residents | 38,234 | 33,489 | 16,027 | 87,750 | 89,891 | 119,656 | 98,845 | 69,242 |
| Total UK offices | 140,090 | 79,453 | 155,277 | 374,820 | 387,238 | 431,943 | 422,207 | 320,764 |
| | | | | | | | | |
| Overseas | | | | | | | | |
| US | 34,754 | 28,778 | 27,221 | 90,753 | 93,569 | 126,277 | 135,059 | 92,166 |
| Rest of the World | 42,837 | 31,362 | 33,543 | 107,742 | 264,712 | 327,391 | 277,721 | 57,896 |
| Total Overseas offices | 77,591 | 60,140 | 60,764 | 198,495 | 358,281 | 453,668 | 412,780 | 150,062 |
Loans and advances to customers - gross | 217,681 | 139,593 | 216,041 | 573,315 | 745,519 | 885,611 | 834,987 | 470,826 |
| Loan impairment provisions | | | | (18,055) | (17,126) | (10,889) | (6,449) | (3,933) |
Loans and advances to customers - net | | | | 555,260 | 728,393 | 874,722 | 828,538 | 466,893 |
| | | | | | | | | |
| Fixed rate | 37,074 | 25,756 | 47,534 | 110,364 | 238,756 | 183,693 | 351,336 | 115,240 |
| Variable rate | 180,607 | 113,837 | 168,507 | 462,951 | 506,763 | 701,918 | 483,651 | 355,586 |
Loans and advances to customers - gross | 217,681 | 139,593 | 216,041 | 573,315 | 745,519 | 885,611 | 834,987 | 470,826 |
The Group monitors the geographical breakdown of these exposures based on the country of domicile of the borrower or guarantor of ultimate risk.
The table below sets out the Group’s cross border outstandings in excess of 0.75% of Group total assets (including acceptances), which totalled £2,401.7 billion at 31 December 2008 (2007 — £1,840.8 billion; 2006 — £856.8 billion). None of these countries has experienced repayment difficulties that have required refinancing of outstanding debt.
| | | 2008 | | | 2007 | | | 2006 | |
| | | | £m | | | | £m | | | | £m | |
| United States | | | 91,544 | | | | 91,653 | | | | 43,718 | |
| France | | | 58,251 | | | | 65,430 | | | | 18,136 | |
| Germany | | | 40,812 | | | | 51,123 | | | | 20,130 | |
| Spain | | | 36,441 | | | | 31,651 | | | | 9,341 | |
| Netherlands | | | 34,283 | | | | 27,707 | | | | 12,407 | |
| Republic of Ireland | | | 18,662 | | | | 17,736 | | | | 8,530 | |
| Cayman Islands | | | 18,126 | | | | 17,099 | | | | 9,063 | |
| Japan | | | * | | | | 31,922 | | | | 7,725 | |
| Italy | | | * | | | | 23,925 | | | | 7,506 | |
| Norway | | | * | | | | * | | | | 7,768 | |
| Switzerland | | | * | | | | * | | | | 7,262 | |
| China | | | * | | | | * | | | | 6,574 | |
335
*Additional information continued | Less than 0.75% of Group total assets.Additional information |
Loan impairment provisions
For a discussion of the factors considered in determining the amount of the provisions, see ‘Impairment’‘Risk elements in lending, provisions and reserves’ on page 78121 and ‘Critical accounting policies — Loan impairment provisions’policies’ on pages 169 and 170.
page 224. The following table shows the elements ofmovements in loan impairment provisions.
| | | IFRS | | |
| | | 2008 | | | 2007 | | | 2006 | | | 2005 | | | 2004 | | |
| | | | £m | | | | £m | | | | £m | | | | £m | | | | £m | | 2010 £m | 2009 £m | 2008 £m | 2007 £m | 2006 £m |
| Provisions at the beginning of the year | | | | | | | | | | | | | | | | | | | | | |
| Domestic | | 3,258 | | | 3,037 | | | 2,759 | | | 2,675 | | | 2,408 | | 6,670 | 4,474 | 3,258 | 3,037 | 2,759 |
| Foreign | | 3,194 | | | 898 | | | 1,128 | | | 1,470 | | | 1,477 | | 10,613 | 6,542 | 3,194 | 898 | 1,128 |
| | | | 6,452 | | | 3,935 | | | 3,887 | | | 4,145 | | | 3,885 | | 17,283 | 11,016 | 6,452 | 3,935 | 3,887 |
| Transfer to disposal groups | | | | | | | | | | | | | | | | | | | | | |
| Domestic | | — | | | — | | | — | | | — | | | — | | (25) | — |
| Foreign | | (767 | ) | | — | | | — | | | — | | | — | | (47) | (324) | (767) | — |
| | | | (767 | ) | | — | | | — | | | — | | | — | | (72) | (324) | (767) | — |
| Currency translation and other adjustments | | | | | | | | | | | | | | | | | | | | | |
| Domestic | | 107 | | | 5 | | | (17 | ) | | (7 | ) | | (8 | ) | (79) | (228) | 107 | 5 | (17) |
| Foreign | | 1,334 | | | 178 | | | (44 | ) | | 58 | | | (90 | ) | 122 | (302) | 1,334 | 178 | (44) |
| | | | 1,441 | | | 183 | | | (61 | ) | | 51 | | | (98 | ) | 43 | (530) | 1,441 | 183 | (61) |
| (Disposals)/acquisitions of businesses | | | | | | | | | | | | | | | | | | | | | |
| Domestic | | (108 | ) | | 10 | | | — | | | — | | | 2 | | — | — | (108) | 10 | — |
| Foreign | | (70 | ) | | 2,211 | | | — | | | — | | | 288 | | (2,172) | (65) | (70) | 2,211 | — |
| | | | (178 | ) | | 2,221 | | | — | | | — | | | 290 | | (2,172) | (65) | (178) | 2,221 | — |
| Amounts written-off | | | | | | | | | | | | | | | | | | | | | |
| Domestic | | (1,446 | ) | | (1,222 | ) | | (1,360 | ) | | (1,252 | ) | | (901 | ) | (2,252) | (2,895) | (1,446) | (1,222) | (1,360) |
| Foreign | | (1,702 | ) | | (789 | ) | | (481 | ) | | (788 | ) | | (548 | ) | (3,790) | (4,044) | (1,702) | (789) | (481) |
| | | | (3,148 | ) | | (2,011 | ) | | (1,841 | ) | | (2,040 | ) | | (1,449 | ) | (6,042) | (6,939) | (3,148) | (2,011) | (1,841) |
| Recoveries of amounts written-off in previous years | | | | | | | | | | | | | | | | | | | | | |
| Domestic | | 116 | | | 158 | | | 119 | | | 97 | | | 85 | | 151 | 175 | 116 | 158 | 119 |
| Foreign | | 203 | | | 184 | | | 96 | | | 75 | | | 59 | | 260 | 224 | 203 | 184 | 96 |
| | | | 319 | | | 342 | | | 215 | | | 172 | | | 144 | | 411 | 399 | 319 | 342 | 215 |
| Charged to income statement | | | | | | | | | | | | | | | | | | | | | |
Charged to income statement - continuing operations (1) | | |
| Domestic | | 3,948 | 5,370 | 2,701 | 1,395 | 1,663 |
| Foreign | | 5,196 | 7,720 | 3,777 | 508 | 214 |
| | | 9,144 | 13,090 | 6,478 | 1,903 | 1,877 |
| Charged to income statement - discontinued operations | | |
| Domestic | | 2,698 | | | 1,420 | | | 1,663 | | | 1,376 | | | 960 | | — | — | (3) | 25 | — |
| Foreign | | 4,393 | | | 526 | | | 214 | | | 327 | | | 442 | | 42 | 1,044 | 616 | 18 | — |
| | | | 7,091 | | | 1,946 | | | 1,877 | | | 1,703 | | | 1,402 | | 42 | 1,044 | 613 | 43 | — |
| Unwind of discount | | | | | | | | | | | | | | | | | | | | | |
| Domestic | | (151 | ) | | (150 | ) | | (127 | ) | | (130 | ) | | — | | (214) | (226) | (151) | (150) | (127) |
| Foreign | | (43 | ) | | (14 | ) | | (15 | ) | | (14 | ) | | — | | (241) | (182) | (43) | (14) | (15) |
| | | | (194 | ) | | (164 | ) | | (142 | ) | | (144 | ) | | — | | (455) | (408) | (194) | (164) | (142) |
Provisions at the end of the year (1) | | | | | | | | | | | | | | | | | | | | | |
Provisions at the end of the year (2) | | |
| Domestic | | 4,474 | | | 3,258 | | | 3,037 | | | 2,759 | | | 2,546 | | 8,199 | 6,670 | 4,474 | 3,258 | 3,037 |
| Foreign | | 6,542 | | | 3,194 | | | 898 | | | 1,128 | | | 1,628 | | 9,983 | 10,613 | 6,542 | 3,194 | 898 |
| | | | 11,016 | | | 6,452 | | | 3,935 | | | 3,887 | | | 4,174 | | |
| | | | | | | | | | | | | | | | | | | | | | 18,182 | 17,283 | 11,016 | 6,452 | 3,935 |
| Gross loans and advances to customers | | | | | | | | | | | | | | | | | | | | | |
| Domestic | | 312,287 | | | 323,362 | | | 251,522 | | | 232,319 | | | 194,654 | | 287,070 | 297,347 | 312,287 | 323,362 | 251,522 |
| Foreign | | 573,324 | | | 511,625 | | | 219,304 | | | 188,791 | | | 156,765 | | 286,245 | 448,172 | 573,324 | 511,625 | 219,304 |
| | | | 885,611 | | | 834,987 | | | 470,826 | | | 421,110 | | | 351,419 | | 573,315 | 745,519 | 885,611 | 834,987 | 470,826 |
| | | | | | | | | | | | | | | | | | | | | | |
Closing customer provisions as a % of gross loans and advances to customers (2)(3) | | | | | | | | | | | | | | | | | | | | | |
| Domestic | | 1.43 | % | | 1.01 | % | | 1.21 | % | | 1.19 | % | | 1.31 | % | 2.86% | 2.24% | 1.43% | 1.01% | 1.21% |
| Foreign | | 1.12 | % | | 0.62 | % | | 0.41 | % | | 0.60 | % | | 1.04 | % | 3.44% | 2.33% | 1.12% | 0.62% | 0.41% |
| Total | | | 1.23 | % | | 0.77 | % | | 0.84 | % | | 0.92 | % | | 1.19 | % | 3.15% | 2.30% | 1.23% | 0.77% | 0.84% |
| | | | | | | | | | | | | | | | | | | | | | |
| Customer charge to income statement as a % of gross loans and advances to customers | | | | | | | | | | | | | | | | | | | | | |
Customer charge to income statement as a % of gross loans and advances to customers (3) | | |
| Domestic | | 0.86 | % | | 0.44 | % | | 0.66 | % | | 0.59 | % | | 0.49 | % | 1.38% | 1.81% | 0.86% | 0.44% | 0.66% |
| Foreign | | 0.75 | % | | 0.10 | % | | 0.10 | % | | 0.17 | % | | 0.28 | % | 1.82% | 1.95% | 0.75% | 0.10% |
| Total | | | 0.79 | % | | 0.23 | % | | 0.40 | % | | 0.40 | % | | 0.40 | % | 1.60% | 1.89% | 0.79% | 0.23% | 0.40% |
| (1) | Includes release relating to loans and advances to banks of £13 million (2009 - £34 million charge; 2008 - £118 million charge; 2007 and 2006 - nil). |
| (2) | Includes closing provisions against loans and advances to banks of £127 million (2007 —(2009 - £157 million; 2008 - £127 million; 2007 - £3 million; 2006 —- £2 million; 2005 — £3 million; 2004 —£6 million). |
(2)(3) | ClosingFor the purpose of these ratios, closing customer provisions and customer charge exclude closing provisions against loans and advances to banks. |
Additional information continued | Additional information |
Amounts in accordance with IFRS (continued)
Loan impairment provisions (continued)
The following table shows additional information in respect of the loan impairment provisions.
| | 2010 £m | 2009 £m | 2008 £m | 2007 £m | 2006 £m |
| Loan impairment provisions at end of year | | | | | |
| Customers | 18,055 | 17,126 | 10,889 | 6,449 | 3,933 |
| Banks | 127 | 157 | 127 | 3 | 2 |
| | 18,182 | 17,283 | 11,016 | 6,452 | 3,935 |
| | | | | | |
| Average loans and advances to customers (gross) | 610,131 | 821,155 | 858,333 | 567,900 | 445,766 |
| | | | | | |
| As a % of average loans and advances to customers during the year | | | | | |
| Total customer provisions charged to income statement | 1.5% | 1.6% | 0.7% | 0.4% | 0.4% |
Amounts written-off (net of recoveries) - customers | 0.9% | 0.8% | 0.3% | 0.3% | 0.4% |
| | | IFRS | |
| | | 2008 | | | 2007 | | | 2006 | | | 2005 | | | 2004 | |
| | | | £m | | | | £m | | | | £m | | | | £m | | | | £m | |
| Loan impairment provisions at end of year: | | | | | | | | | | | | | | | | | | | | |
| – customers | | | 10,889 | | | | 6,449 | | | | 3,933 | | | | 3,884 | | | | | |
| – banks | | | 127 | | | | 3 | | | | 2 | | | | 3 | | | | | |
| Specific provisions | | | | | | | | | | | | | | | | | | | | |
| – customers | | | | | | | | | | | | | | | | | | | 3,607 | |
| – banks | | | | | | | | | | | | | | | | | | | 6 | |
| General provision | | | | | | | | | | | | | | | | | | | 561 | |
| | | | 11,016 | | | | 6,452 | | | | 3,935 | | | | 3,887 | | | | 4,174 | |
| | | | | | | | | | | | | | | | | | | | | |
| Average loans and advances to customers (gross) | | | 858,333 | | | | 567,900 | | | | 445,766 | | | | 402,473 | | | | 299,430 | |
| | | | | | | | | | | | | | | | | | | | | |
| As a % of average loans and advances to customers during the year: | | | | | | | | | | | | | | | | | | | | |
| Total customer provisions charged to income statement | | | 0.81 | % | | | 0.34 | % | | | 0.42 | % | | | 0.42 | % | | | 0.47 | % |
| | | | | | | | | | | | | | | | | | | | | |
| Amounts written-off (net of recoveries) – customers | | | 0.33 | % | | | 0.29 | % | | | 0.36 | % | | | 0.46 | % | | | 0.44 | % |
Analysis of closing customer loan impairment provisions
The following table analyses customer loan impairment provisions by geographical area and type of domestic customer.
| | | IFRS | | |
| | | | | | | | | | | | | | | | | 2010 | | 2009 | | 2008 | | 2007 | | 2006 |
| | | Closing provision | | | % of loans to total loans | | | Closing provision | | | % of loans to total loans | | | Closing provision | | | % of loans to total loans | | | Closing provision | | | % of loans to total loans | | | Closing provision | | | % of loans to total loans | | Closing provision | % of loans to total loans | | Closing provision | % of loans to total loans | | Closing provision | % of loans to total loans | | Closing provision | % of loans to total loans | | Closing provision | % of loans to total loans |
| | | | £m | | | % | | | | £m | | | % | | | | £m | | | % | | | | £m | | | % | | | | £m | | | % | | £m | % | | £m | % | | £m | % | | £m | % | | £m | % |
| Domestic | | | | | | | | | | | | | | | | | | | | | | | | | | | | | | | | | | | | | | | | | | | | | | | | | |
| Central and local government | | — | | | 0.3 | | | — | | | 0.4 | | | — | | | 1.4 | | | — | | | 0.8 | | | — | | | 0.6 | | — | 0.7 | | — | 0.4 | | — | 0.3 | | — | 0.4 | | — | 1.4 |
| Manufacturing | | 127 | | | 1.7 | | | 93 | | | 1.6 | | | 94 | | | 2.4 | | | 138 | | | 2.8 | | | 127 | | | 1.8 | | 100 | 1.6 | | 153 | 1.5 | | 127 | 1.7 | | 93 | 1.6 | | 94 | 2.4 |
| Construction | | 254 | | | 1.1 | | | 75 | | | 1.2 | | | 63 | | | 1.8 | | | 74 | | | 1.7 | | | 71 | | | 1.4 | | 605 | 1.1 | | 355 | 1.0 | | 254 | 1.1 | | 75 | 1.2 | | 63 | 1.8 |
| Finance | | 67 | | | 4.8 | | | 52 | | | 8.4 | | | 33 | | | 5.3 | | | 104 | | | 6.4 | | | 54 | | | 7.0 | | 98 | 6.8 | | 26 | 4.9 | | 67 | 4.8 | | 52 | 8.4 | | 33 | 5.3 |
| Service industries and business activities | | 778 | | | 6.6 | | | 562 | | | 6.5 | | | 647 | | | 9.3 | | | 647 | | | 9.7 | | | 516 | | | 8.8 | | 1,073 | 8.0 | | 962 | 7.0 | | 778 | 6.6 | | 562 | 6.5 | | 647 | 9.3 |
| Agriculture, forestry and fishing | | 19 | | | 0.3 | | | 21 | | | 0.3 | | | 25 | | | 0.6 | | | 26 | | | 0.6 | | | 23 | | | 0.7 | | 27 | 0.5 | | 20 | 0.4 | | 19 | 0.3 | | 21 | 0.3 | | 25 | 0.6 |
| Property | | 490 | | | 5.9 | | | 85 | | | 6.0 | | | 70 | | | 8.3 | | | 63 | | | 7.8 | | | 64 | | | 7.5 | | 2,071 | 7.3 | | 908 | 6.6 | | 490 | 5.9 | | 85 | 6.0 | | 70 | 8.3 |
| Individuals — home mortgages | | 36 | | | 9.1 | | | 36 | | | 8.8 | | | 37 | | | 15.1 | | | 36 | | | 15.5 | | | 32 | | | 16.4 | | |
| — other | | 2,235 | | | 3.0 | | | 2,054 | | | 3.4 | | | 1,826 | | | 5.9 | | | 1,513 | | | 6.3 | | | 1,277 | | | 7.5 | | |
| Residential mortgages | | 302 | 17.6 | | 196 | 12.4 | | 36 | 9.1 | | 36 | 8.8 | | 37 | 15.1 |
| Personal lending | | 2,504 | 4.1 | | 2,527 | 3.4 | | 2,235 | 3.0 | | 2,054 | 3.4 | | 1,826 | 5.9 |
| Finance leases and instalment credit | | 194 | | | 2.0 | | | 132 | | | 1.9 | | | 103 | | | 3.0 | | | 88 | | | 3.3 | | | 122 | | | 3.7 | | 435 | 2.3 | | 341 | 2.2 | | 194 | 2.0 | | 132 | 1.9 | | 103 | 3.0 |
| Accrued interest | | — | | | 0.3 | | | — | | | 0.3 | | | — | | | 0.3 | | | — | | | 0.3 | | | | | | | | | | — | 0.1 | | — | 0.1 | | — | 0.3 | | — | 0.3 | | — | 0.3 |
| Total domestic | | 4,200 | | | 35.1 | | | 3,110 | | | 38.8 | | | 2,898 | | | 53.4 | | | 2,689 | | | 55.2 | | | 2,286 | | | 55.4 | | 7,215 | 50.1 | | 5,488 | 39.9 | | 4,200 | 35.1 | | 3,110 | 38.8 | | 2,898 | 53.4 |
| Foreign | | 4,745 | | | 64.9 | | | 2,289 | | | 61.2 | | | 442 | | | 46.6 | | | 652 | | | 44.8 | | | 1,321 | | | 44.6 | | 8,190 | 49.9 | | 8,562 | 60.1 | | 4,745 | 64.9 | | 2,289 | 61.2 | | 442 | 46.6 |
| Impaired book provisions | | 8,945 | | | | 100.0 | | | 5,399 | | | | 100.0 | | | 3,340 | | | | 100.0 | | | 3,341 | | | | 100.0 | | | | | | | | 100.0 | | 15,405 | 100.0 | | 14,050 | 100.0 | | 8,945 | 100.0 | | 5,399 | 100.0 | | 3,340 | 100.0 |
| Latent book provisions | | 1,944 | | | | | | | 1,050 | | | | | | | 593 | | | | | | | 543 | | | | | | | | | | | | | | 2,650 | | | 3,076 | | | 1,944 | | | 1,050 | | | 593 | |
| Specific provisions | | | | | | | | | | | | | | | | | | | | | | | | | | | | | | | | | | 3,607 | | | | | | |
| General provision | | | | | | | | | | | | | | | | | | | | | | | | | | | | | | | | | | 561 | | | | | | |
| Total provisions | | | 10,889 | | | | | | | 6,449 | | | | | | | | 3,933 | | | | | | | 3,884 | | | | | | | 4,168 | | | | | | 18,055 | | | 17,126 | | | 10,889 | | | 6,449 | | | 3,933 | |
Additional information continued | Additional information |
Financial summarycontinued
Analysis of write-offs
The following table analyses amounts written-off by geographical area and type of domestic customer.
| | | IFRS | | |
| | | 2008 | | | 2007 | | | 2006 | | | 2005 | | | 2004 | | |
| | | | £m | | | | £m | | | | £m | | | | £m | | | | £m | | 2010 £m | 2009 £m | 2008 £m | 2007 £m | 2006 £m |
| Domestic | | | | | | | | | | | | | | | | | | | | | |
| Manufacturing | | 61 | | | 29 | | | 41 | | | 40 | | | 55 | | 94 | 217 | 61 | 29 | 41 |
| Construction | | 51 | | | 21 | | | 29 | | | 17 | | | 12 | | 110 | 243 | 51 | 21 | 29 |
| Finance | | 31 | | | 47 | | | 17 | | | 21 | | | 19 | | 6 | 105 | 31 | 47 | 17 |
| Service industries and business activities | | 299 | | | 190 | | | 212 | | | 176 | | | 163 | | 411 | 702 | 299 | 190 | 212 |
| Agriculture, forestry and fishing | | 5 | | | 4 | | | 5 | | | 4 | | | 9 | | 5 | 3 | 5 | 4 | 5 |
| Property | | 34 | | | 9 | | | 6 | | | 25 | | | 33 | | 395 | 320 | 34 | 9 | 6 |
| Individuals — home mortgages | | 1 | | | — | | | 5 | | | 4 | | | 4 | | |
| — others | | 938 | | | 909 | | | 1,021 | | | 950 | | | 516 | | |
| Residential mortgages | | 16 | 2 | 1 | — | 5 |
| Personal lending | | 1,148 | 1,188 | 938 | 909 | 1,021 |
| Finance leases and instalment credit | | 26 | | | 13 | | | 24 | | | 15 | | | 90 | | 67 | 115 | 26 | 13 | 24 |
| Total domestic | | 1,446 | | | 1,222 | | | 1,360 | | | 1,252 | | | 901 | | 2,252 | 2,895 | 1,446 | 1,222 | 1,360 |
| Foreign | | 1,702 | | | 789 | | | 481 | | | 788 | | | 548 | | 3,790 | 4,044 | 1,702 | 789 | 481 |
Total write-offs (1) | | | 3,148 | | | 2,011 | | | 1,841 | | | 2,040 | | | 1,449 | | |
| Total write-offs | | 6,042 | 6,939 | 3,148 | 2,011 | 1,841 |
(1) Excludes £2 million written-off in respect of loans and advances to banks in 2005.
Analysis of recoveries
The following table analyses recoveries of amounts written-off by geographical area and type of domestic customer.
| | | IFRS | | |
| | | 2008 | | | 2007 | | | 2006 | | | 2005 | | | 2004 | | |
| | | | £m | | | | £m | | | | £m | | | | £m | | | | £m | | 2010 £m | 2009 £m | 2008 £m | 2007 £m | 2006 £m |
| Domestic | | | | | | | | | | | | | | | | | | | | | |
| Manufacturing | | | 2 | | | | — | | | | — | | | | 1 | | | | 1 | | 2 | 1 | 2 | — |
| Construction | | | — | | | | — | | | | — | | | | 1 | | | | — | | 1 | — |
| Finance | | | 2 | | | | — | | | | — | | | | — | | | | 2 | | — | 2 | — |
| Service industries and business activities | | | 12 | | | | 7 | | | | 5 | | | | 2 | | | | 1 | | 7 | 13 | 12 | 7 | 5 |
| Property | | | — | | | | — | | | | 1 | | | | 2 | | | | — | | 4 | — | 1 |
| Individuals — home mortgages | | | — | | | | — | | | | — | | | | — | | | | 1 | | |
| — others | | | 96 | | | | 143 | | | | 101 | | | | 84 | | | | 78 | | |
| Residential mortgages | | 6 | 3 | — |
| Personal lending | | 128 | 99 | 96 | 143 | 101 |
| Finance leases and instalment credit | | | 4 | | | | 8 | | | | 12 | | | | 7 | | | | 2 | | 3 | 57 | 4 | 8 | 12 |
| Total domestic | | | 116 | | | | 158 | | | | 119 | | | | 97 | | | | 85 | | 151 | 175 | 116 | 158 | 119 |
| Foreign | | | 203 | | | | 184 | | | | 96 | | | | 75 | | | | 59 | | 260 | 224 | 203 | 184 | 96 |
| Total recoveries | | | 319 | | | | 342 | | | | 215 | | | | 172 | | | | 144 | | 411 | 399 | 319 | 342 | 215 |
Additional information continued | Additional information |
Amounts in accordance with IFRS (continued)
Risk elements in lending and potential problem loans
The Group’sGroup's loan control and review procedures do not include the classification of loans as non-accrual,impaired, accruing past due, restructured and potential problem loans, as defined by the SEC in the US.
The following table shows the estimated amount of loans that would be reported using the SEC’sSEC's classifications. The figures are stated before deducting the value of security held or related provisions.
IFRS require interest to be recognised on a financial asset (or a group of financial assets) after impairment at the rate of interest used to discount recoveries when measuring the impairment loss. Thus, interest on impaired financial assets is credited to profit or loss as the discount on expected recoveries unwinds. Despite this, such assets are not considered performing. All loans that have an impairment provision are classified as non-accrual. This is a change from practice in 2004 and earlier years where certain loans with provisions were classified as past due 90 days or potential problem loans (and interest accrued on them).| | 2010 £m | 2009 £m | 2008 £m | 2007 £m | 2006 £m |
Loans accounted for on an impaired basis (2) | | | | | |
| Domestic | 15,471 | 13,572 | 8,588 | 5,599 | 5,420 |
| Foreign | 20,230 | 21,453 | 10,891 | 4,763 | 812 |
| Total | 35,701 | 35,025 | 19,479 | 10,362 | 6,232 |
Accruing loans which are contractually overdue 90 days or more as to principal or interest (3) | | | | | |
| Domestic | 2,363 | 2,224 | 1,201 | 217 | 81 |
| Foreign | 534 | 1,000 | 581 | 152 | 24 |
| Total | 2,897 | 3,224 | 1,782 | 369 | 105 |
| Total risk elements in lending | 38,598 | 38,249 | 21,261 | 10,731 | 6,337 |
| | | | | | |
Potential problem loans (4) | | | | | |
| Domestic | 506 | 424 | 218 | 63 | 47 |
| Foreign | 127 | 585 | 8 | 608 | 5 |
| Total potential problem loans | 633 | 1,009 | 226 | 671 | 52 |
| | | | | | |
| Closing provisions for impairment as a % of total risk elements in lending | 47% | 46% | 52% | 60% | 62% |
Closing provisions for impairment as a % of total risk elements in lending and potential problem loans | 46% | 45% | 51% | 57% | 62% |
Risk elements in lending as a % of gross lending to customers excluding reverse repos (5) | 7.3% | 5.4% | 2.5% | 1.6% | 1.6% |
| | | IFRS | |
| | | 2008 | | | 2007 | | | 2006 | | | 2005 | | | 2004 | |
| | | | £m | | | | £m | | | | £m | | | | £m | | | | £m | |
Loans accounted for on a non-accrual basis (2): | | | | | | | | | | | | | | | | | | | | |
| Domestic | | | 8,588 | | | | 5,599 | | | | 5,420 | | | | 4,977 | | | | 3,658 | |
| Foreign | | | 10,891 | | | | 4,763 | | | | 812 | | | | 949 | | | | 1,075 | |
| Total | | | 19,479 | | | | 10,362 | | | | 6,232 | | | | 5,926 | | | | 4,733 | |
| Accruing loans which are contractually overdue | | | | | | | | | | | | | | | | | | | | |
| 90 days or more as to principal or interest (3): | | | | | | | | | | | | | | | | | | | | |
| Domestic | | | 1,201 | | | | 217 | | | | 81 | | | | 2 | | | | 634 | |
| Foreign | | | 581 | | | | 152 | | | | 24 | | | | 7 | | | | 79 | |
| Total | | | 1,782 | | | | 369 | | | | 105 | | | | 9 | | | | 713 | |
| Loans not included above which are classified as | | | | | | | | | | | | | | | | | | | | |
| ‘troubled debt restructurings’ by the SEC: | | | | | | | | | | | | | | | | | | | | |
| Domestic | | | — | | | | — | | | | — | | | | 2 | | | | 14 | |
| Foreign | | | — | | | | — | | | | — | | | | — | | | | 10 | |
| Total | | | — | | | | — | | | | — | | | | 2 | | | | 24 | |
| Total risk elements in lending | | | 21,261 | | | | 10,731 | | | | 6,337 | | | | 5,937 | | | | 5,470 | |
| | | | | | | | | | | | | | | | | | | | | |
| Potential problem loans (4) | | | | | | | | | | | | | | | | | | | | |
| Domestic | | | 218 | | | | 63 | | | | 47 | | | | 14 | | | | 173 | |
| Foreign | | | 8 | | | | 608 | | | | 5 | | | | 5 | | | | 107 | |
| Total potential problem loans | | | 226 | | | | 671 | | | | 52 | | | | 19 | | | | 280 | |
| Closing provisions for impairment as a % of total risk elements in lending | | | 52 | % | | | 60 | % | | | 62 | % | | | 65 | % | | | 76 | % |
| Closing provisions for impairment as a % of total risk elements in lending and potential problem loans | | | 51 | % | | | 57 | % | | | 62 | % | | | 65 | % | | | 72 | % |
| Risk elements in lending as a % of gross lending to customers excluding reverse repos | | | 2.51 | % | | | 1.55 | % | | | 1.55 | % | | | 1.60 | % | | | 1.83 | % |
| (1) | For the analysis above, ‘Domestic’'Domestic' consists of the United Kingdom domestic transactions of the Group. ‘Foreign’'Foreign' comprises the Group’sGroup's transactions conducted through offices outside the UK and through those offices in the UK specifically organised to service international banking transactions. |
| (2) | All loans against which an impairment provision is held are reported in the non-accrualimpaired category. |
| (3) | Loans where an impairment event has taken place but no impairment recognised. This category is used for fully collateralised non-revolving credit facilities. |
| (4) | Loans for which an impairment event has occurred but no impairment provision is necessary. This category is used for fully collateralised advances and revolving credit facilities where identification as 90 days overdue is not feasible. |
| (5) | Gross of provisions and excluding reverse repurchase agreements. Includes gross lending relating to disposal groups in 2010 and 2009. |
| | | IFRS | | 2010 £m | 2009 £m | 2008 £m | 2007 £m | 2006 £m |
| | | 2008 | | | 2007 | | | 2006 | | | 2005 | | | 2004 | | |
| | | | £m | | | | £m | | | | £m | | | | £m | | | | £m | | |
| Gross income not recognised but which would have been recognised under the original terms of non-accrual and restructured loans: | | | | | | | | | | | | | | | | | | | | | |
Gross income not recognised but which would have been recognised under the original terms of impaired loans | | |
| Domestic | | | 393 | | | | 390 | | | | 370 | | | | 334 | | | | 235 | | 579 | 625 | 393 | 390 | 370 |
| Foreign | | | 342 | | | | 155 | | | | 77 | | | | 62 | | | | 58 | | 830 | 1,032 | 338 | 64 | 77 |
| | | | 735 | | | | 545 | | | | 447 | | | | 396 | | | | 293 | | 1,409 | 1,657 | 731 | 454 | 447 |
| Interest on non-accrual and restructured loans included in net interest income: | | | | | | | | | | | | | | | | | | | | | |
| | | |
| Interest on impaired and restructured loans included in net interest income | | |
| Domestic | | | 150 | | | | 165 | | | | 142 | | | | 130 | | | | 58 | | 214 | 226 | 150 | 165 | 142 |
| Foreign | | | 43 | | | | 16 | | | | 15 | | | | 14 | | | | 7 | | 241 | 182 | 42 | 15 | 15 |
| | | | 193 | | | | 181 | | | | 157 | | | | 144 | | | | 65 | | 455 | 408 | 192 | 180 | 157 |
Additional information continued | Additional information |
Financial summarycontinued
Analysis of deposits —- product analysis
The following table showsanalyses the distribution of the Group’sGroup's deposits by type and geographical area.
| | | IFRS | |
| | | 2008 | | | 2007 | | | 2006 | |
| | | | £m | | | | £m | | | | £m | |
UK Domestic: | | | | | | | | | | | | |
| Demand deposits – interest-free | | | 43,376 | | | | 43,721 | | | | 39,149 | |
– interest-bearing | | | 107,159 | | | | 121,343 | | | | 118,315 | |
| Time deposits – savings | | | 88,434 | | | | 41,185 | | | | 31,656 | |
– other | | | 130,951 | | | | 207,263 | | | | 80,496 | |
| Overseas residents: | | | | | | | | | | | | |
| Demand deposits – interest-free | | | 907 | | | | 563 | | | | 573 | |
– interest-bearing | | | 16,320 | | | | 25,129 | | | | 37,729 | |
| Time deposits – savings | | | 1,819 | | | | 605 | | | | 1,122 | |
– other | | | 67,477 | | | | 87,437 | | | | 51,568 | |
| Total UK offices | | | 456,443 | | | | 527,246 | | | | 360,608 | |
| Overseas | | | | | | | | | | | | |
| Demand deposits – interest-free | | | 29,253 | | | | 27,959 | | | | 12,173 | |
| – interest-bearing | | | 92,354 | | | | 70,758 | | | | 27,441 | |
| Time deposits – savings | | | 68,014 | | | | 52,381 | | | | 19,049 | |
– other | | | 251,492 | | | | 316,313 | | | | 97,094 | |
| Total overseas offices | | | 441,113 | | | | 467,411 | | | | 155,757 | |
| Total deposits | | | 897,556 | | | | 994,657 | | | | 516,365 | |
| | | | | | | | | | | | | |
| Held-for-trading | | | 137,080 | | | | 125,917 | | | | 104,249 | |
| Designated as at fair value through profit or loss | | | 8,054 | | | | 7,505 | | | | 3,922 | |
| Amortised cost | | | 752,422 | | | | 861,235 | | | | 408,194 | |
| Total deposits | | | 897,556 | | | | 994,657 | | | | 516,365 | |
| | | | | | | | | | | | | |
| Overseas | | | | | | | | | | | | |
| US | | | 153,163 | | | | 152,324 | | | | 115,121 | |
| Rest of the World | | | 287,950 | | | | 315,087 | | | | 40,636 | |
| Total overseas offices | | | 441,113 | | | | 467,411 | | | | 155,757 | |
| | 2010 £m | 2009 £m | 2008 £m |
| UK | | | |
| Domestic | | | |
| Demand deposits | | | |
| - interest-free | 66,608 | 45,855 | 43,376 |
| - interest-bearing | 136,359 | 136,157 | 107,159 |
| Time deposits | | | |
| - savings | 70,774 | 67,450 | 88,434 |
| - other | 59,557 | 65,937 | 130,951 |
| Overseas residents | | | |
| Demand deposits | | | |
| - interest-free | 2,512 | 1,072 | 907 |
| - interest-bearing | 12,530 | 13,618 | 16,320 |
| Time deposits | | | |
| - savings | 1,512 | 1,288 | 1,819 |
| - other | 46,023 | 61,341 | 67,477 |
| Total UK offices | 395,875 | 392,718 | 456,443 |
| Overseas | | | |
| Demand deposits | | | |
| - interest-free | 29,919 | 36,458 | 29,253 |
| - interest-bearing | 43,890 | 91,482 | 92,354 |
| Time deposits | | | |
| - savings | 24,472 | 78,423 | 68,014 |
| - other | 115,327 | 157,265 | 251,492 |
| Total overseas offices | 213,608 | 363,628 | 441,113 |
| Total deposits | 609,483 | 756,346 | 897,556 |
| | | | |
| Held-for-trading | 116,189 | 106,477 | 137,080 |
| Designated as at fair value through profit or loss | 4,824 | 8,580 | 8,054 |
| Amortised cost | 488,470 | 641,289 | 752,422 |
| Total deposits | 609,483 | 756,346 | 897,556 |
| | | | |
| Overseas | | | |
| US | 135,642 | 126,075 | 153,163 |
| Rest of the World | 77,966 | 237,553 | 287,950 |
| Total overseas offices | 213,608 | 363,628 | 441,113 |
Short term borrowings
| | | IFRS | |
| | | 2008 | | | 2007 | | | 2006 | |
| | | | £m | | | | £m | | | | £m | |
| Commercial paper | | | | | | | | | | | | |
| Outstanding at year end | | | 78,581 | | | | 78,612 | | | | 12,675 | |
| Maximum outstanding at any month end during the year | | | 111,108 | | | | 81,187 | | | | 14,402 | |
| Approximate average amount during the year | | | 98,150 | | | | 32,498 | | | | 13,225 | |
| Approximate weighted average interest rate during the year | | | 3.3% | | | | 4.8% | | | | 4.9% | |
| Approximate weighted average interest rate at year end | | | 3.0% | | | | 5.5% | | | | 5.0% | |
| | | | | | | | | | | | | |
| Other short term borrowings | | | | | | | | | | | | |
| Outstanding at year end | | | 194,346 | | | | 280,526 | | | | 122,576 | |
| Maximum outstanding at any month end during the year | | | 395,132 | | | | 312,557 | | | | 130,867 | |
| Approximate average amount during the year | | | 299,513 | | | | 188,326 | | | | 112,008 | |
| Approximate weighted average interest rate during the year | | | 3.2% | | | | 4.6% | | | | 4.5% | |
| Approximate weighted average interest rate at year end | | | 2.5% | | | | 4.1% | | | | 4.5% | |
Average interest rates during the year are computed by dividing total interest expense by the average amount borrowed. Average interest rates at year end are average rates for a single day and as such may reflect one-day market distortions which may not be indicative of generally prevailing rates. Original maturities of commercial paper are not in excess of one year. ‘Other short-term borrowings’ consist principally of borrowings in the money markets included within ‘Deposits by banks’ and ‘Customer accounts’ in the financial statements, and generally have original maturities of one year or less.
The following table shows details of the Group’sGroup's certificates of deposit and other time deposits over $100,000 or equivalent by remaining maturity.
| | | Within 3 months | | | Over 3 months but within 6 months | | | Over 6 months but within 12 months | | | Over 12 months | | | 2008 Total | | |
| | | | £m | | | | £m | | | | £m | | | | £m | | | | £m | | |
2010 | | Within 3 months £m | Over 3 months but within 6 months £m | Over 6 months but within 12 months £m | Over 12 months £m | Total £m |
| UK based companies and branches | | | | | | | | | | | | | | | | | | | | | |
| Certificates of deposit | | 23,076 | | | 7,475 | | | 9,236 | | | 13 | | | 39,800 | | 3,325 | 1,784 | 1,894 | 247 | 7,250 |
| Other time deposits | | 62,623 | | | 7,665 | | | 5,939 | | | 12,359 | | | 88,586 | | 23,180 | 4,282 | 2,872 | 11,462 | 41,796 |
| | | | | | | | | | | | | | | | | | | | | | |
| Overseas based companies and branches | | | | | | | | | | | | | | | | | | | | | |
| Certificates of deposit | | 32,263 | | | 1,666 | | | 1,316 | | | — | | | 35,245 | | 14,120 | 7,423 | 4,192 | 377 | 26,112 |
| Other time deposits | | 111,542 | | | 13,498 | | | 7,983 | | | 15,641 | | | 148,664 | | 20,251 | 4,082 | 4,184 | 6,294 | 34,811 |
| | | | 229,504 | | | 30,304 | | | 24,474 | | | 28,013 | | | 312,295 | | 60,876 | 17,571 | 13,142 | 18,380 | 109,969 |
Additional information continued | Additional information |
Other contractual cash obligations
The table below summarises the Group’sGroup's other contractual cash obligations by payment date.
| | | Group | | |
| | | 0-3 months | | | 3-12 months | | | 1-3 years | | | 3-5 years | | | 5-10 years | | | 10-20 years | | |
| 2008 | | | £m | | | | £m | | | | £m | | | | £m | | | | £m | | | | £m | | |
| 2010 | | 0-3 months £m | 3-12 months £m | 1-3 years £m | 3-5 years £m | 5-10 years £m | 10-20 years £m |
| Operating leases | | 146 | | | 433 | | | 976 | | | 751 | | | 1,448 | | | 1,851 | | 132 | 365 | 837 | 678 | 1,178 | 1,714 |
| Contractual obligations to purchase goods or services | | 237 | | | 892 | | | 486 | | | 208 | | | 303 | | | 1 | | 71 | 212 | 111 | 3 | — |
| | | | 383 | | | 1,325 | | | 1,462 | | | 959 | | | 1,751 | | | 1,852 | | 203 | 577 | 948 | 681 | 1,178 | 1,714 |
| 2007 | | | | | | | | | | | | | | | | | | | | | | | | | |
| | | |
| 2009 | | |
| Operating leases | | 90 | | | 268 | | | 655 | | | 569 | | | 1,060 | | | 1,958 | | 140 | 339 | 965 | 726 | 1,219 | 1,836 |
| Contractual obligations to purchase goods or services | | 441 | | | 1,007 | | | 748 | | | 199 | | | 5 | | | 2 | | 180 | 300 | 168 | 16 | — | 1 |
| | | | 531 | | | 1,275 | | | 1,403 | | | 768 | | | 1,065 | | | 1,960 | | 320 | 639 | 1,133 | 742 | 1,219 | 1,837 |
The Group’sGroup's undrawn formal facilities, credit lines and other commitments to lend were £352,398£266,822 million (2007 — £332,811(2009 - £291,634 million). While the Group has given commitments to provide these funds, some facilities may be subject to certain conditions being met by the counterparty. The Group does not expect all facilities to be drawn, and some may lapse before drawdown.
Except as stated, the following tables show, for the dates or periods indicated, the Noon Buying Rate in New York for cable transfers in sterling as certified for customs purposes by the Federal Reserve Bank of New York.
| | February 2011 | January 2011 | December 2010 | November 2010 | October 2010 | September 2010 |
| US dollars per £1 |
| Noon Buying Rate | | | | | | |
| High | 1.6247 | 1.6042 | 1.5882 | 1.6291 | 1.6027 | 1.5851 |
| Low | 1.5986 | 1.5490 | 1.5361 | 1.5557 | 1.5681 | 1.5315 |
| | | | | | | |
| | | | 2010 | 2009 | 2008 | 2007 |
| Noon Buying Rate | | | | | | |
| Period end rate | | | 1.5392 | 1.6167 | 1.4619 | 1.9843 |
Average rate for the year (1) | | | 1.5415 | 1.5707 | 1.8424 | 2.0073 |
| | | | | | | |
Consolidation rate (2) | | | | | | |
| Period end rate | 1.5524 | 1.6222 | 1.4604 | 2.0043 |
| Average rate for the year | 1.5455 | 1.5657 | 1.8528 | 2.0015 |
| | March | | February | | | January | | | December | | | November | | | October | |
| US dollars per £1 | 2009 | | 2009 | | | 2009 | | | 2008 | | | 2008 | | | 2008 | |
| Noon Buying Rate | | | | | | | | | | | | | | | | |
| High | 1.4730 | | | 1.4936 | | | | 1.5254 | | | | 1.5457 | | | | 1.6156 | | | | 1.7804 | |
| Low | 1.3757 | | | 1.4224 | | | | 1.3658 | | | | 1.4395 | | | | 1.4789 | | | | 1.5472 | |
| | | | | | | | | | | | | | | | | | | | | | |
| | | | 2008 | | | 2007 | | | 2006 | | | 2005 | | | 2004 | |
| Noon Buying Rate | | | | | | | | | | | | | | | | | | | | | |
| Period end rate | | | | 1.4619 | | | | 1.9843 | | | | 1.9586 | | | | 1.7188 | | | | 1.9160 | |
Average rate for the period (1) | | | | 1.8424 | | | | 2.0073 | | | | 1.8582 | | | | 1.8147 | | | | 1.8356 | |
| | | | | | | | | | | | | | | | | | | | | | |
Consolidation rate (2) | | | | | | | | | | | | | | | | | | | | | |
| Period end rate | | | | 1.4604 | | | | 2.0043 | | | | 1.9651 | | | | 1.7214 | | | | 1.9346 | |
| Average rate for the period | | | | 1.8528 | | | | 2.0015 | | | | 1.8436 | | | | 1.8198 | | | | 1.8325 | |
| (1) | The average of the Noon Buying Rates on the last US business day of each month during the period.year. |
| (2) | The rates used by the Group for translating US dollars into sterling in the preparation of its financial statements. |
| (3) | On 24 April 2009,25 March 2011, the Noon Buying Rate was £1.00 = US$1.4697.1.6086. |
Additional information continued | Additional information |
Global recovery has continued in 2010, but the strength of the recovery remains unevenly spread. Although most developed countries have avoided a double-dip, they have been unable to find a firm footing from which to build a solid recovery. This reflects the burden of high levels of public and private sector debt, low consumer confidence and high levels of unemployment.
In the UK, the Group’s largest market, economic conditions improved in 2010. Total economic activity, as measured by gross domestic product (GDP), grew by 1.3 per cent in 2010. This followed a contraction of 4.9 per cent in 2009. However, a fall in activity in the final quarter of 2010 served as a timely reminder that, while conditions are generally improving, the recovery is fragile. The world economy entered its most difficult periodUK’s inflation rate increased sharply, reaching 3.7 per cent by the end of the year. Yet policy makers kept the main policy rate unchanged at 0.5 per cent throughout 2010, attributing the pick up in inflation to temporary factors such as rising commodity prices and an increase in VAT.
The recovery has helped many of our customers. Company trading profits grew for the first time since 2008. The unemployment rate levelled off at around 8 per cent, which is much higher than at the start of the recession, but still relatively low compared to the peak in other recessions. These factors supported commercial property prices, which were 6 per cent higher in December 2010 than they were a generationyear earlier, according to the International Property Databank. Most of those gains came in the first half of the year. The residential market was less robust; house prices fell in the second half of 2008. the year, dragging the year-on-year growth rate to -1 per cent in December 2010, according to the Nationwide index.
The failureUS economy registered the fastest growth amongst our principal markets. GDP grew by 2.8 per cent, following a contraction of 2.6 per cent in 2009. Despite this, the unemployment rate remained stubbornly high, which prompted a further loosening of monetary and fiscal policy. Inflationary pressures were generally subdued, but picked up somewhat towards the end of the year. Policy makers pledged to keep Fed funds rate exceptionally low for an extended period of time to provide a necessary support to the economic recovery.
In Ireland, hopes of a largerecovery in 2010 were dashed, as GDP contracted by an estimated 0.6 per cent. This followed a 7.6 per cent reduction in 2009. The Irish government requested a financial institutionrescue package of €85 billion in September coincided withNovember, equivalent to about half of Ireland’s GDP.
The general improvement in economic conditions must be viewed against a backdrop of financial market turbulence at various points in the near-seizure of already fragile interbank funding markets. Heightened risk aversion among investorsyear, most notably the sovereign debt crisis that affected the Eurozone periphery. This led to unprecedented volatility across global financial markets including equities, fixed incomea marked fall in risk appetite in Q2 2010 and, foreign exchange. Many assetagain, in Q4 2010. Equity prices tumbled, with global real estatefell in the banking sector and equity markets the worst hit, whilethere was a ‘flight to quality’ prompted an historic rally in government bond markets that, which pushed down long-term risk free interest rates towards all time lowson government debt in many developed economies.
The pronounced increase in commodity prices insome countries. This included the first half of 2008, together withUK, where the intensifying financial crisis led to a further sharp deterioration in private sector confidence in all major economies. Private spending weakened significantly. Softer demand conditions adversely affected prospects for profitability and employment. Policymakers responded aggressively. Since September, governments have either proposed or implemented measures that include the recapitalisation of the banking sector, tax cuts and/or new infrastructure spending. Central banks provided support through10-year gilt rate cuts and increased liquidity provision. Despite these supportive actions, the global economy remained on a downward trajectoryfell from more than 4 per cent at the beginningstart of 2009, with many industrialised economies2010, to less than 3 per cent in recession.
In theOctober. UK the Bank Rate fell from 5.5% at the beginning of 2008 to 1.0% in February 2009. The Bank of England remained cautious in the first half of 2008, lowering policy rates a modest 25bps twice. Mounting inflationary pressures were a major constraint, with the annual inflation rate climbing as high as 5.2% in September, the highest reading since the Bank of England’s operational independence in 1997, and some way above the official target of 2%. Before October, the Bank focused on liquidity measures to support the financial system. When it became cleargilt yields subsequently rose in the final quartermonths of 2008 that2010, in anticipation of interest rate rises in 2011.
The increase in risk aversion also caused some sharp currency movements. At one point the confidence inpound was 11 per cent down against the wider economy had fallen to levels consistent with a deep contraction, policy became more aggressive. The government assisted the recapitalisation of the banking sector, while the Bank of England reduced rates rapidly, from 5.0% in October to 1.0% in February 2009 and then to 0.5% in March 2009.
However, the economy had already gathered too much negative momentum to stop an official recession — GDP declined by 2.1 %dollar, but sterling rallied in the second half of 2008, and is widely expected2010, to fall further in 2009. One reason isend the year just slightly lower policy rates have failed to translate effectively into looser monetary conditions forthan where it started ($1.57 from $1.61). Sterling rose by 10 per cent against the private sector. Three-month sterling LIBOR, a key determinant of borrowing costs for households and firms, remained on average almost 100bps above the prevailing Bank Rate, well above its long-term average of 20bps. Sterling’s 17% depreciation on a trade-weighted basis did not deliver a significant offset to weakening domestic demand due to the difficult economic conditions prevailing in the UK’s main trading partners.
US policy rates also declined substantially in 2008, from 4.25% in January to effectively zero in December. With no room to cut interest rates further, the Federal Reserve has since started to target longer term market interest rates to directly lower the cost of funds for households and firms, for example by purchasing mortgage-backed securities and corporate commercial paper. More unorthodox policy measures are likely this year. Similar to the UK, monetary policy failed to gain much traction in the wider economy. Three-month US$ LIBOR averaged close to 100bps higher than the prevailing policy rate.
The US officially entered recession in December 2007 and, in spite of a fiscal stimuluseuro in the first half of the year, activity continuedbefore giving up most of these gains, to fall through 2008 and is forecast to decline markedly in 2009. The effects were acutely felt in employment, with US non-farm businesses shedding 2.6 million jobs inend the twelve months to December. The dollar’s 11% depreciation in 2007 helped to boost net exports, making trade the single biggest contributor to GDP growth in 2008. However, this support was fading in early 2009, due to slumping overseas demand.year at €1.17 (from €1.13).
The Eurozone started 2008 on a strong footing, with some member countries experiencing above-trendeconomic outlook
We expect the global recovery to be maintained, but to remain uneven. The pace of growth in the first quarter. However, for reasons that varied across countries, conditions worsened markedly throughoutmajor developed economies, including the remainder of the year,UK and the region officially entered recession in the second quarter. Growth in Germany, the region’s largest economyUS, is likely to remain sluggish by historic standards, and volatile. This reflects high levels of indebtedness, fiscal rebalancing and the world’s largest exporter, was hit hard by the slowdown in global trade. Many of the more peripheral economies, like Ireland and Spain, with higher debt levels were hit hard by the turbulence in creditexpectation that interest rates will gradually rise. Emerging markets, and falling asset prices. Economic activity in the entire region is forecast toespecially Asia, will continue to contractoutperform as they are less encumbered by balance sheet strains. Moreover, growth in 2009.
Policy in the Eurozone was on average less supportive than in the UK or the US, with the Repo Rate on hold at 4% in the first half of 2008. In July 2008, the ECB raised rates by 25bps to fend off the dangers of spiralling inflation. Official rates finally started to fall in October, when the ECB participated in a globally co-ordinated rate cut to calm investors’ fears amid intensifying strains in the global financial system. The euro’s strong appreciation against the dollar also reduced the competitiveness of the region’s exporters.
Initially, Asia Pacific appeared insulated from economic difficulties elsewhere ascountries like China and India continuedwill continue to grow strongly inbe underpinned by the first halfprocess of 2008. In fact, surging inflation reinforced concerns about overheating, and prompted a series of policy measures aimed at cooling monetary conditions. But this perception changed towards the end of 2008, when recession in the major industrialised countries highlighted the region’s exposure to a retrenchment in global trade. Growth forecasts have been cut substantially,‘catch-up’ with 2009 growth in China and India potentially falling to half its level from a year earlier. Increasing risk aversion of international investors also led to large capital outflows, putting downward pressure on floating currencies and local equity markets.industrial nations.
Exchange rates affect earnings and costs reported by the Group’s non-UK subsidiaries, and the value of non-sterling denominated assets and liabilities. Sterling weakened significantly during 2008, losing 28% against the dollar and 30% against the euro, respectively. These movements increase the sterling-value of non-sterling earnings, costs, assets and liabilities. As a result, the Group recognises translation benefits if it reports profits and/or has a positive net asset position denominated in foreign currency.
Additional information continued | Additional information |
United Kingdom
The UK Financial Services Authority (FSA) is the consolidated supervisor of the Group. As at 31 December 2008, 312010, 30 companies in the Group (excluding subsidiaries of ABN AMRO)RBS NV), spanning a range of financial services sectors (banking, insurance and investment business), were authorised to conduct financial activities regulated by the FSA.
The UK authorised banks in the Group include the Royal Bank, NatWest, Coutts & Co and Ulster Bank Limited. Wholesale activities, other than Group Treasury activities, are concentrated in the Group’sGroup's Global Banking & Markets divisionand UK Corporate divisions, and are undertaken under the names of the Royal Bank and NatWest. UK retail banking activities are managed by Regional Markets, RBS UK.the UK Retail division. The exception is Ulster Bank Limited, which is run as a separate division within the Group. Ulster Bank Group will movemoved to a single brand in the Republic of Ireland during 2010, with First Active merging with Ulster Bank. Ulster Bank Limited provides banking services in Northern Ireland while the banking service in the Republic of Ireland is provided by Ulster Bank Ireland Limited, which is primarily supervised by the Irish Financial Services Regulatory Authority.Central Bank of Ireland.
Investment management business is principally undertaken by companies in the Regional MarketsWealth Management division, including Coutts & Co, Adam & Company Investment Management Limited, and in the Global Banking & Markets division, through RBS Asset Management Limited.
General insurance business is principally undertaken by Direct Line Insurance plc and Churchill Insurance Company Limited. Life assurance business
The Group is principally undertaken by Royal Scottish Assurance plcsubject to extensive regulations that impose obligations on financial institutions to maintain appropriate policies, procedures and National Westminster Life Assurance Limited (in partnershipcontrols to ensure compliance with Aviva plc).the rules and regulations to which they are subject.
United States
The Group is both a bank holding company and a financial holding company within the meaning of the US Bank Holding Company Act of 1956. As such, it is subject to the regulation and supervision of the Board of Governors of the Federal Reserve System (the “Federal(“the Federal Reserve”). Among other things, the Group’sGroup's direct and indirect activities and investments in the United States are limited to those that are ‘financial'financial in nature’nature' or ‘incidental’'incidental' or ‘complementary’'complementary' to a financial activity, as determined by the Federal Reserve. The Group is also required to obtain the prior approval of the Federal Reserve before acquiring directly or indirectly, the ownership or control of more than 5% of any class of the voting shares of any US bank or holding company.
Under current Federal Reserve policy, the Group is required to act as a source of financial strength for its US bank subsidiaries. Among other things, this source of strength obligation could require the Group to inject capital into any of its US bank subsidiaries if any of them became undercapitalised.
Anti-money laundering, anti-terrorism and economic sanctions regulations are a major focus of the US government for financial institutions and are rigorously enforced by US government agencies.
The Group’sGroup's US bank and non-bank subsidiaries and the Royal Bank’sBank's US branches are also subject to supervision and regulation by a variety of other US regulatory agencies. RBS Citizens NA is supervised by the Office of the Comptroller of the Currency, which is charged with the regulation and supervision of nationally chartered banks. Citizens Bank of Pennsylvania is subject to the regulation and supervision of the US Federal Deposit Insurance Corporation and the Pennsylvania Department of Banking and Insurance. Citizens Financial Group is under the supervision of the Federal Reserve as a bank holding company. Citizens Bank of Pennsylvania is subject to the regulation and supervision of the Pennsylvania Department of Banking and the US Federal Deposit Insurance Corporation. The Royal Bank’sBank's New York branch is supervised by the New York State Banking Department, and its Connecticut branch is supervised by the Connecticut Department of Banking. Both branches are also subject to supervisory oversight by the Federal Reserve, through the Federal Reserve Bank of Boston.
The Group’s US insurance agencies are regulated by state insurance authorities. The Group’sGroup's US broker dealer, RBS Securities Inc. (RBSSI), formerly known as Greenwich Capital Markets, Inc., is subject to regulation and supervision by the US Securities and Exchange Commission (SEC) and the Financial Industry Regulatory Authority (FINRA) with respect to its securities activities. The futures activities of Greenwich Capital Markets, Inc.RBSSI are subject to regulation and oversight by the US Commodity Futures Trading Commission (CFTC) and the Chicago Board of Trade (CBOT). The Group's US commodities business, RBS Sempra Commodities isLLP and its subsidiaries, which was largely sold in 2010, are primarily regulated by the Federal Reserve Bank of Boston, the Federal Energy Regulatory Commission (FERC), the Commodity Futures Trading Commission (CFTC), the CME Group-owned exchanges, and CFTC.The Intercontinental Exchange.
The Group is subject to extensive regulations that impose obligations on financial institutions to maintain appropriate policies, procedures and controls to insure compliance with the rules and regulations to which they are subject, in particular to detect, prevent and report money laundering and terrorist financing and to ensure compliance with economic sanctions against designated foreign countries, nationals and others. Anti-money laundering, anti-terrorism and economic sanctions regulations have become a major focus of US government policy relating to financial institutions and are rigorously enforced by US government agencies.
Netherlands
The consolidated supervisor of ABN AMRORBS NV is the Dutch Central Bank, De Nederlandsche Bank (DNB). The DNB operates as prudential supervisor of banks, and insurance companies and pension funds, and also as part of the European System of Central Banks.
Other jurisdictions
The Group operates in over 50 countries through a network of branches, local banks and non-bank subsidiaries.subsidiaries and these activities are subject to supervision in most cases by a local regulator or central bank.
Additional information continued | Additional information |
Regulatory developments and reviewsThe Group works with domestic and international trade associations and proactively engages with regulators and other authorities such as the Basel Committee, the Committee of European Banking SupervisorsEU Commission, Governments and the EU Commissionregulators, in order to understand the implications of proposed regulatory change and to contribute to the development of regulatory policy.
The Group and its subsidiaries have co-operated fully with various regulatory reviews and developments in the UK and internationally, including enquiries or investigations into alleged or possible breaches of regulations.
United Kingdom
The Group successfully implemented the Markets in Financial Instruments Directive (MiFID) by the implementation date of 1 November 2007. MiFID established a comprehensive legislative framework at the European level, which is now implemented in the UK, for the establishment and conduct of investment firms, multilateral trading facilities and regulated markets.
FSA authorised firms must also comply with rules designed to reduce the scope for firms to be used for financial crime and in particular money laundering. Revised Joint Money Laundering Steering Group Guidance Notes were issued on 13 November 2007 to take into account the new Money Laundering Regulations 2007. These Regulations came into force on 15 December 2007 and implemented the EU’s Third Money Laundering Directive. Amongst their other provisions, the Regulations endorse a risk based approach to combating money laundering, while also prescribing ‘enhanced due diligence’ for non face to face customers, ‘politically exposed persons’ (PEPs) and correspondent banking. Whilst for all material purposes the Group is already compliant — these provisions having been anticipated in industry guidance for some time — internal processes are continually reviewed to ensure best practice standards are met. In particular, the Group has issued new internal policy guidelines based on the regulations and supporting industry guidance against which all divisions have undertaken a gap analysis as a basis for further action plans where necessary.
In the UK, the Group has actively engaged proactively with a varietylarge number of legislative and regulatory consultations. FinancialReflecting global developments, financial stability - notably bank prudential requirements and depositor protection have beenthe new regulatory framework - remains a key focus for the UK regulatory authorities.
The Group participatedhas continued to participate fully in the consultation processanalysis of the cause of the financial crisis and the development of potential policy and reform. A wide range of ideas and proposals, aimed at strengthening the resilience of the banking system and addressing perceived shortcomings in existing regulation, have been advanced and continue to be developed. With respect to prudential requirements, the Group provided detailed feedback on the FSA's consultations on Strengthening Capital Standards and its Discussion Paper on reviewing trading activities, to name but two. Other consultations included HM Treasury’s consultations on the structure of financial regulation and on the new bank levies.
The Group has actively engaged with, and contributed to, a number of inquiries regarding the future of banking. These included the Independent Banking Reform Bill. In addition,Commission, the OFT’s retail banking review and various Treasury Select Committee inquiries. It has contributed to debates on resolution frameworks, including possible mechanisms such as contingent capital and bail-in arrangements, and is participating in the FSA's pilot for the development of Recovery and Resolution Plans ("Living Wills"). It will be developing suitable Living Wills in line with forthcoming regulatory requirements.
The Group continueshas continued to comment on regulatoryplay an active role in the development of requirements impacting products and legal changes that impact its business.processes. Examples include the FSA’s review of mortgages (Mortgage Market Review) and of investment advice (Retail Distribution Review). With regard to payment cards, the Group worked closely with the Government (the Department forof Business EnterpriseInnovation and Regulatory Reform (BERR) transpositionSkills) and the industry to develop and implement appropriate measures to improve product features and transparency. With regard to the OFT’s review of Cash ISAs, the Group worked closely with the industry to agree a series of voluntary improvements to the product and switching process.
In 2010, the Consumer Credit Directive was transposed into national law and Consumer Law Review; HM Treasury’s Dormant Bankintroduced standardised disclosure requirements for all lenders of unsecured consumer credit. It is aimed at improving cross border lending and Building Society Accounts Bill; Lord Hunt’s Review of the Financial Ombudsman Servicepromoting responsible lending and the review of the Banking Codes and the FSA’s consultations on liquidity and regulatory capital.borrowing.
A review by the Competition Commission and the FSA into Payment Protection Insurance is ongoing, with the Competition Commission drafting the implementation order following finalisation of its remedies.
In July 2008, the Office of Fair Trading (OFT) published the results of its market study into personal current accounts and is now consulting on remedial action in the three key areas of transparency, complexity of charging structure and switching. The OFT is also continuing its inquiry into credit and debit card interchange fees.
UK regulated firms within the Group are members of the Financial Services Compensation Scheme (FSCS), which provides compensation to eligible customers of authorised financial services firms that are unable to meet their obligations. The FSCS is funded through annual levies chargeda contributor to UK regulated firms. These levies are apportioned between firms ondepositor confidence and financial stability and the basis of their shares ofGroup is supporting the FSCS tariff base: in increasing awareness amongst UK consumers. In addition, during 2010 RBS developed and implemented a new ‘single customer view’ systems capability, which provides tailored information to the caseFSCS in order to facilitate fast payment of deposit takers, this means that levies are determined by their share of protected deposits. As a result of FSCS involvement in a number of bank failures in 2008, there will be a significant impact on levies chargedcompensation to deposit takers, starting with those for 2008-09. These impacts are reflected in the accounts.depositors within seven days.
The FSA, in their 2008/092010/11 Business Plan, emphasised the continued focus on ‘Treatingthat they would be implementing a new intensive supervision strategy in relation to 'Treating Customers Fairly’ in line with their view that the area of greatest structural concern remains the retail market.Fairly' (TCF). The Group has undertakenimplemented TCF governance arrangements for all relevant businesses, and continues to undertake a process of continuous improvement of management information and root cause analysis of customer issues in order to ensure that it can demonstrate that it is consistentlyits continued commitment to treating customers fairly throughout the product lifecycle.
The Group also continues to co-operate with the Information Commissioner’s Office, the UK’s independent public body set up to promote access to officialuphold information rights in the public interest, promoting openness by public bodies and to protect personal information.data privacy for individuals. The Group continues to improve its processes in line with changing guidelines in order to meet information security requirements.
European UnionUnion/global developments
In the EU, the Group has also responded to a number of proposals for regulatory and legislative change, including proposed amendments to the Capital Requirements Directive and the establishment of Colleges of Supervisors to enhance cross border cooperation between supervisors. The Group also follows closely the work (and recommendations) of the G7G20, as well as international standard setters such as the Basel Committee on Banking Supervision. Of particular note were the discussions that took place throughout 2010 regarding proposals from the Basel Committee on Banking Supervision for an enhanced capital and G10.liquidity framework. The Group was closely involved in all aspects of the proposals on capital and liquidity, as well as on other related policy areas, such as countercyclical capital buffers and contingent capital, being developed separately.
Also notable in 2010 was significant work by the European Commission and the Committee of European Securities Regulators to review the Markets in Financial Instruments Directive in areas such as transparency, investor protection and a widening of the scope of the Directive. Additionally, proposals to revise legislation on market infrastructure, to encourage central clearing of derivative instruments, were put forward by the Commission. The Group provided input in all these areas.
Lastly, the EU has also overhauled its supervisory framework, creating a system of EU Supervisory Authorities and the European Systemic Risk Board. Powers of the authorities will include the supervision of national regulators, but also potentially direct supervision of selected financial institutions should it be required in specific circumstances.
Additional information continued | Additional information |
United States
In the US the Group also engagescontinues to engage constructively with regulators and other bodies on regulatory and legislative change and seeks to ensure proper implementation and compliance. Current issues include regulatory implementation of recently enacted US financial regulatory reform legislation,mortgage reform and student lending.
As previously disclosed by ABN AMRO, the United States Department of Justice has been conducting a criminal investigation into ABN AMRO’s dollar clearing activities, Office of Foreign Assets Control compliance procedures and other Bank Secrecy Act compliance matters. ABN AMRO has cooperated and continues to cooperate fully with the investigation. Prior to the acquisition by the Group, ABN AMRO had reached an agreement in principle with the Department of Justice that would resolve all presently known aspects of the ongoing investigation by way of a Deferred Prosecution Agreement in return for a settlement payment by ABN AMRO of US$500 million (accrued by ABN AMRO in its interim financial statements for the six months ended 30 June 2007). Negotiations are continuing to enable a written agreement to be concluded.
Sub-prime exposures
Certain of the Group’s subsidiaries have received requests for information from various US governmental agencies and self-regulatory organisations including in connection with sub-prime mortgages and securitisations, collateralised debt obligations and synthetic products related to sub-prime mortgages. In particular, during March 2008, the Group was advised by the SEC that it had commenced a non-public, formal investigation relating to the Group’s US sub-prime securities exposures and US residential mortgage exposures. The Group and its subsidiaries are cooperating with these various requests for information and investigations.
The outcome of these reviews is outside the Group’s control and it is not possible to predict the effect, if any, on the Group’s operations of future regulatory actions or policy changes.
Other jurisdictions
The Group is active in monitoring regulatory developments in each country in which it operates to ensureso that internal policies are sufficient to ensure the effective management of regulatory risk.risk.
The Group operates from a number of locations worldwide, principally in the UK. At 31 December 2008,2010, the Royal Bank and NatWest had 651647 and 1,6281,549 retail branches, respectively, in the UK. Ulster Bank has a foot print of 236 branches and First Active had aan extensive network of 295 branches and business centres inbanking offices across Northern Ireland and the Republic of Ireland. CitizensUS Retail & Commercial had 1,6061,525 retail banking offices (including in-store branches) covering Connecticut, Delaware, Illinois, Indiana, Massachusetts, Michigan, New Hampshire, New Jersey, New York, Ohio, Pennsylvania, Rhode Island and Vermont. A substantial majority of the UK branches are owned by the Royal Bank, NatWest and their subsidiaries or are held under leases with unexpired terms of over 50 years. The Group’sGroup's principal properties include its headquarters at Gogarburn, Edinburgh, its principal offices in London at 135 and 280 Bishopsgate and the Drummond House administration centre located at South Gyle, Edinburgh.
Total capital expenditure on premises (excluding investment properties), computers and other equipment in the year ended 31 December 2010 was £656 million (2009 - £1,215 million; 2008 was- £1,406 million (2007 — £1,792 million; 2006 — £1,140 million).
Details of major shareholders of the company’s ordinary and preferenceB shares are given on page 132.173.
In December 2008, The Solicitor for the Affairs of Her Majesty’sMajesty's Treasury (HM Treasury) acquired 22,854 million ordinary shares representing 57.92% of the company’scompany's issued ordinary share capital and in Aprilcapital. During 2009, HM Treasury acquired a further 16,791 million ordinary shares taking its shareholdingraising their holding to 70.33%70.3% of the company's enlarged issued ordinary share capital. The
In December 2009, HM Treasury acquired 51 billion B shares in the company representing the entire issued B share capital.
In 2010, the company converted certain non-cumulative convertible preference shares into ordinary shareholding of Legal & General Group plc decreased from 5.04%shares in December 2007the company. As a result, HM Treasury’s holding in the company’s ordinary shares reduced to below 3% in December 2008.67.8%.
Other than detailed above, there have been no significant changes in the percentage ownership of major shareholders of the company’scompany's ordinary, B and preference shares during the three years ended 2523 February 2009.2011. All shareholders within a class of the company’scompany's shares have the same voting rights.
At 2523 February 2009,2011, the directors of the company had options to purchase a total of 3,073,44510,455,306 ordinary shares of the company.
As at 31 December 2008,2010, almost all of the company’scompany's US$ denominated preference shares and American DepositaryDepository Shares representing ordinary shares were held by shareholders registered in the US. All other shares were predominantly held by shareholders registered outside the US.
The company and its subsidiaries are party to various contracts in the ordinary course of business. Material contracts include the following:
Consortium and Shareholders Agreement (CSA)
On 28 May 2007, Fortis Bank Nederland, the company, Santander and RFS Holdings entered into the CSA. Fortis Bank Nederland acceded to the CSA on 26 July 2007. On 3 October 2008, the Dutch State of the Netherlands acquired Fortis Bank Nederland. On 24 December 2008 the Dutch State of the Netherlands acceded to the CSA following its acquisition of the shares held by Fortis Bank Nederland in RFS Holdings pursuant to a Deed of Accession entered into between RFS Holdings, the company, Fortis Bank Nederland, Santander and the State ofDutch State. On 1 April 2010 the Netherlands.CSA was restated. The CSA governs the relationships amongst the parties thereto in relation to the acquisition by RFS Holdings of ABN AMRO.AMRO (now RBS Holdings N.V.). The CSA as restated details, inter alia, the funding of RFS Holdings in connection with the acquisition of ABN AMRO, the equity interests in RFS Holdings, the governance of RFS Holdings, both before and after the acquisition of ABN AMRO, the arrangements for the transfer of certain ABN AMRO businesses, assets and liabilities to the Dutch State of the Netherlands (previously Fortis Bank Nederland), the company and Santander, post-acquisition of ABN AMRO, further funding obligations of the Dutch State, of the Netherlands (previously Fortis Bank Nederland), the company and Santander after the acquisition of ABN AMRO where funding is required by regulatory authorities in connection with the ABN AMRO businesses, the allocation of Core Tier 1 capital, and the allocation of taxes and conduct of tax affairs.affairs and the steps that the Dutch State, the company and Santander expect to take to enable the company to become the sole shareholder of RFS Holdings.
Standby underwriting commitment letter
On 28 May 2007, the company and Merrill Lynch International entered into a standby underwriting commitment letter, pursuant to which Merrill Lynch International undertook to underwrite one or more issues by the company of securities eligible to be treated as part of its innovative or non-innovative Tier 1 capital and/or convertible securities convertible into Ordinary Shares, the proceeds of which would be used to finance part of the cash portion of consideration payable to ABN AMRO shareholders upon settlement of the offers for shares in ABN AMRO. The aggregate amount of Merrill Lynch International’s standby underwriting commitment was €6.2 billion. Pursuant to the letter, the company agreed to pay certain fees and expenses to Merrill Lynch International in consideration for its standby commitment.
Agreement with Bank of America for the sale of LaSalle
On 22 April 2007, ABN AMRO Bank and Bank of America entered into an agreement for the sale by ABN AMRO Bank to Bank of America of all of the outstanding shares of common stock of ABN AMRO North America Holding Company (ABN AMRO North America), a Delaware corporation whose subsidiaries include LaSalle. The consideration for the shares was US$21 billion, subject to a potential purchase price adjustment if ABN AMRO Bank’s estimate of the net income of ABN AMRO North America for the pre-closing period was less than a specified income threshold. The agreement also provided for approximately US$6 billion owed by ABN AMRO North America to other members of the ABN AMRO group to be converted into common stock of ABN AMRO North America. ABN AMRO Bank gave certain representations and warranties to Bank of America, including, inter alia, as to title to the shares, authority and capacity to enter into the agreement, financial statements, tax and employee benefits. The warranties given by ABN AMRO Bank were repeated on closing of the agreement. ABN AMRO Bank is liable to indemnify and hold harmless Bank of America for damages arising out of certain specified events, including breach of any covenant that survives closing.
Underwriting agreement
On 22 April 2008, the company, Goldman Sachs International, Merrill Lynch International, UBS and the Royal Bank entered into an underwriting agreement, pursuant to which Merrill Lynch International, Goldman Sachs International and UBS agreed to procure subscribers for, or failing which themselves to subscribe for, Ordinary Shares not taken up under the Rights Issue, in each case at the relevant issue price. Pursuant to the underwriting agreement, the company agreed to pay certain fees and expenses to Merrill Lynch International, Goldman Sachs International and UBS in consideration for their underwriting commitment. The company gave certain representations and warranties and indemnities to those persons defined as underwriters in the Underwriting Agreement. The liabilities of the company were uncapped as to time and amount.
Sale of Angel Trains
On 6 August 2008, the company completed the sale of Angel Trains Group to a consortium advised by Babcock & Brown for an enterprise value of £3.6 billion.
Sale of Tesco Personal Finance
On 28 July 2008, the company announced that it had agreed to sell its 50 per cent. shareholding in Tesco Personal Finance to its joint venture partner Tesco plc for a cash consideration of £950 million, subject to transaction adjustments. As part of this transaction, the Group will continue to provide certain commercial services to Tesco Personal Finance post-completion. The sale completed on 19 December 2008.
First Placing and Open Offer Agreement
Pursuant to a placing and open offer agreement effective as of 13 October 2008 entered into between the company, UBS, Merrill Lynch International and HM Treasury, (i) the company agreed to invite qualifying shareholders to apply to acquire new Shares at the issue price of 65.5 pence by way of the First Open Offer, (ii) UBS and Merrill Lynch International were appointed as joint sponsors, joint bookrunners and joint placing agents and agreed to use reasonable endeavours to procure placees to acquire the new Shares at not less than the issue price of 65.5 pence on such terms as agreed by HM Treasury on the basis that the new Shares placed were subject to clawback to the extent they were taken up under the Open Offer and (iii) HM Treasury agreed that, to the extent not placed or taken up under the First Open Offer and subject to the terms and conditions set out in the First Placing and Open Offer Agreement, HM Treasury would acquire such new Shares itself at the issue price of 65.5 pence.
In consideration of its services under the First Placing and Open Offer Agreement, HM Treasury was paid (i) a commission of 0.5 per cent. of the aggregate value of the new Shares at the issue price of 65.5 pence per new Share payable on Admission (as defined in the First Placing and Open Offer Agreement) and the second business day after the day on which the First Placing and Open Offer Agreement terminated and (ii) a further commission of 1 per cent. of the aggregate value of the new Shares acquired by placees (including HM Treasury) at the issue price of 65.5 pence per new Share payable on Admission (as defined in the First Placing and Open Offer Agreement). The company paid all legal and other costs and expenses of HM Treasury, those of UBS and Merrill Lynch International properly incurred and the costs and expenses of HM Treasury’s financial advisers incurred in connection with the First Placing and Open Offer and the Preference Share Issue.
The company also bore all costs and expenses relating to the First Placing and Open Offer and the Preference Share Issue, including (but not limited to) the fees and expenses of its professional advisers, the cost of preparation, advertising, printing and distribution of the First Placing and Open Offer prospectus and all other documents connected with the First Placing and Open Offer and the Preference Share Issue, the listing fees of the FSA, any charges by CREST and the fees of the London Stock Exchange and Euronext.
The company gave certain undertakings to HM Treasury in relation to such matters as mortgage lending, lending to SMEs and Board remuneration. These undertakings were aimed at ensuring that any state aid involved in the potential acquisition of new Shares and the company’s potential participation in the guarantee scheme to be promoted by HM Treasury as part of its support for the UK banking industry was compatible with the common market under EU law. These constraints will cease to apply when, broadly, it is determined that the company is no longer in receipt of state aid.
The undertakings the company gave to HM Treasury included the following:
· Additional information continued | no bonus will be awarded to any director for 2008 and any bonuses earned by directors in respect of 2009 will be paid in restricted shares, remuneration will seek to reward long term value creation and not encourage excessive risk taking (short term indicators will be taken into account only where fully consistent with long term value creation and not encouraging excessive risk taking) and Directors who are dismissed will receive a severance package which is reasonable and perceived as fair;Additional information |
· | to work with HM Treasury on the appointment of up to three new independent non-executive directors; |
Material contracts continued· | to maintain its SME and mortgage lending availability to at least 2007 levels until the end of 2011 with the active marketing of competitively priced loan products; |
· | to increase its support to shared equity projects until the end of 2009 in order to assist those in difficulties with their mortgage payments to stay in their homes, either through individual bank schemes or paid into a central fund run by industry; and |
· | to publish an annual report, for each year until 2011, on its lending to SMEs and establish transparent public reporting on both SME and mortgage lending as agreed with HM Treasury. |
In addition, the company agreed to limit its activities to the higher of: (i) the annual rate of growth of UK nominal GDP in the preceding year; and (ii) the average historical growth of the balance sheets in the UK banking sector during the period 1987-2007, unless there is evidence that the thresholds are exceeded for reasons unrelated to the provision of the aid. HM Treasury agreed, in certain circumstances, to consult with the company with a view to making submissions to the European Commission to obtain clarity as to the duration of the conditions and/or seek their disapplication.
Second Placing and Open Offer Agreement
Pursuant to a placing and open offer agreement dated 19 January 2009 entered into between the company, UBS, Merrill Lynch International and HM Treasury, (i) the company agreed to invite qualifying shareholders to apply to subscribe for new shares at the issue price of 31.75 pence per new share by way of the open offer,Second Open Offer, (ii) UBS and Merrill Lynch International were appointed as joint sponsors, joint bookrunners and joint placing agents and agreed to use reasonable endeavours to procure placees to subscribe for the new shares on such terms as may be agreed by the Companycompany and HM Treasury at not less than the issue price of 31.75 pence per new share on the basis that the new shares placed will be subject to clawback to the extent they are taken up under the open offerSecond Open Offer and (iii) HM Treasury agreed that, to the extent not placed or taken up under the open offerSecond Open Offer and subject to the terms and conditions set out in the Second Placing and Open Offer Agreement, HM Treasury willwould subscribe for such new shares itself at the issue price.price of 31.75 pence per new share.
Pursuant to the terms of the Second Placing and Open Offer Agreement, the aggregate proceeds of the Second Placing and Open Offer (net of expenses) were used in full to fund the redemption on Admission (as defined in the Second Placing and Open Offer Agreement) of the preference shares held by HM Treasury at 101 per cent.cent of their issue price (£5,050,000,000)5.05 billion) together with the accrued dividend on the preference shares (from and including 1 December 2008 to but excluding the dateDate of Admission)Admission (as defined in the Second Placing and Open Offer Agreement)) and the commissions payable to HM Treasury under the Second Placing and Open Offer Agreement.
In consideration of the provision of its services under the Second Placing and Open Offer Agreement, HM Treasury was paid (i) a commission of 0.5 per cent. of the aggregate value of the new shares at the issue price per new share payable on Admission and (ii) a further commission of 1 per cent. of the aggregate value of the new shares subscribed for by placees at the issue price per new share payable on Admission.
The company paid to each of HM Treasury, UBS and Merrill Lynch International all legal and other costs and expenses (properly incurred in the case of UBS and Merrill Lynch International) and those of HM Treasury’s financial advisers, incurred in connection with the Placing and Open Offer, the redemption of the preference shares or any arrangements referred to in the Second Placing and Open Offer Agreement.
The company also bore all costs and expenses relating to the Placing and Open Offer and the Preference Share Redemption, including (but not limited to) the fees and expenses of its professional advisers, the cost of preparation, advertising, printing and distribution of all documents connected with the Placing and Open Offer and the Preference Share Redemption, the listing fees of the FSA, any charges by CREST and the fees of the London Stock Exchange and Euronext.
On termination of appointment by UBS or Merrill Lynch International, the Second Placing and Open Offer Agreement will continue to be in force as between the non-terminating parties.
HM Treasury is entitled to novate its rights under the Second Placing and Open Offer Agreement to any entity that is owned, directly or indirectly, by HM Treasury.
The company has given certain representations and warranties and indemnities to each of HM Treasury, UBS and Merrill Lynch International under the Second Placing and Open Offer Agreement. The liabilities of the company are unlimited as to time and amount.
The company also gave HM Treasury the following undertakings:
· | to extend the lending commitments made to HM Treasury in the First Placing and Open Offer Agreement in respect of the UK mortgage and SME lending markets. These commitments will now also apply to the company’s lending to larger commercial and industrial companies in the United Kingdom; and |
· | a commitment to increase the level at which competitively priced lending is made available and actively marketed by the Group in the United Kingdom by £6 billion. |
RBS's commitments described above have been superseded by the Lending Commitments Letter pursuant to which RBS has agreed, among other things, to lend £16 billion above the amount RBS has budgeted to lend to UK businesses and £9 billion above the amount RBS has budgeted to lend to UK homeowners in the year commencing 1 March 2009, with a commitment to lend a similar levels in the year commencing 1 March 2010. Further information is set forth below.
Preference Share Subscription Agreement
Pursuant to a preference share subscription agreement effective as of 13 October 2008 between the company and HM Treasury, HM Treasury subscribed for, and the company allotted and issued to HM Treasury, the preference shares for a total consideration of £5 billion. The company and HM Treasury agreed that applications would be made to the UKLA for the preference shares to be admitted to the Official List and to the London Stock Exchange for the preference shares to be admitted to trading on the London Stock Exchange. Pursuant to the Preference Share Subscription Agreement, the company agreed to pay the costs and expenses of both parties in relation to the negotiation of the Preference Share Subscription Agreement and the subscription for, and allotment and issue of, the preference shares (including, without limitation, any stamp duty or stamp duty reserve tax). HM Treasury was entitled to novate its rights under the Preference Share Subscription Agreement to any entity that is owned, directly or indirectly, by HM Treasury.
The Preference Share Subscription Agreement was conditional on the First Placing and Open Offer Agreement becoming unconditional in accordance with its terms.
Subscription and Transfer Agreements
In connection with the First Placing and Open Offer, the company, Merrill Lynch International, UBS, Computershare and Encuentro Limited entered into several agreements dated 4 November 2008, in respect of the subscription and transfer of ordinary shares and redeemable preference shares in Encuentro Limited. Under the terms of these agreements:
· | the company and UBS and/or Merrill Lynch International agreed to acquire ordinary shares in Encuentro Limited and enter into put and call options in respect of the ordinary shares in Encuentro Limited subscribed for by UBS and/or Merrill Lynch that were exercisable if the Placing and Open Offer did not proceed; |
· | Merrill Lynch International or UBS, as applicable, agreed to apply monies received from qualifying shareholders, placees or HM Treasury under the First Placing and Open Offer to subscribe for redeemable preference shares in Encuentro Limited to an aggregate value equal to such monies, after deduction of the amount of certain commissions and expenses; and |
· | the company agreed to allot and issue the new shares to those persons entitled thereto in consideration of Merrill Lynch International or UBS, as applicable, transferring its holding of redeemable preference shares and ordinary shares in Encuentro Limited to the company. |
Accordingly, instead of receiving cash as consideration for the issue of the new shares, at the conclusion of the First Placing and Open Offer the company owned the entire issued ordinary and redeemable preference share capital of Encuentro Limited whose only assets were its cash reserves, which represented an amount equivalent to the net proceeds of the First Placing and Open Offer. The company was able to utilise this amount equivalent to the First Placing and Open Offer net proceeds by exercising its right of redemption over the redeemable preference shares it held in Encuentro Limited.
Qualifying shareholders were not party to these arrangements and so did not acquire any direct right against Merrill Lynch International, UBS and Computershare pursuant to these arrangements. The company was responsible for enforcing the other parties’ obligations thereunder.
Pre-accession Commitments Letter
On 26 February 2009, the Royal Bank entered into a deed poll in favour of HM Treasury, pursuant to which the Royal Bank gave a series of undertakings on behalf of each member of the Group, with immediate effect unless otherwise agreed, in relation to the provision of information and the management of the Proposed Assetsassets, commitments and exposures (the "Proposed Assets") in the period prior to the Royal Bank’sBank's proposed accession to and participation in the APS.UK Government's Asset Protection Scheme (APS).
The Royal Bank has undertakenundertook to HM Treasury, among other things, to:
| (i) | provide all such assistance and information and data as is reasonably requested which is pertinent to the implementation of the APS and the Royal Bank's potential participation in the APS; |
| (ii) | provide, as soon as practicable, an indicative list of the assets, commitments and exposures that the Royal Bank propose to include within the APS with a view to agreeing such list by 30 April 2009; |
(i) provide all such assistance and information and data as is reasonably requested which is pertinent to the implementation of the APS and the Royal Bank’s potential participation in the APS;| (iii) | provide, as promptly as practicable, information and data relating to the Proposed Assets reasonably requested for due diligence purposes and to provide certain other information concerning the Group's business and the financial performance and risk of the Proposed Assets; |
(ii) provide, as soon as practicable, an indicative list of the Proposed Assets with a view to agreeing such list by 30 April 2009;| (iv) | provide access to the Group's premises, books, records, senior executives, relevant personnel and professional advisers on reasonable terms; |
(iii) provide, as promptly as practicable, information and data relating to the Proposed Assets reasonably requested for due diligence purposes and to provide certain other information concerning the RBS Group’s business and the financial performance and risk of the Proposed Assets;| (v) | consult with HM Treasury regarding the management and operations of the Proposed Assets and to ensure that the management of the Proposed Assets is in accordance with usual business practices and also without regard to the possible benefits under the APS; |
(iv) provide access to the RBS Group’s premises, books, records, senior executives, relevant personnel and professional advisers on reasonable terms;| (vi) | develop and, subject to market conditions, implement a liability management plan which is designed to enable the Group to meet certain Core Tier 1 capital targets for 2009; and |
(v) consult with HM Treasury regarding the management and operations of the Proposed Assets and to ensure that the management of the Proposed Assets is in accordance with usual business practices and also without regard to the possible benefits under the APS;| (vii) | use best endeavours (giving regard to reasonable operational requirements) to maintain regular, adequate and effective monitoring, reporting, risk management and audit controls and procedures in order, among other things, to ensure that risks relating to key business processes which affect the Proposed Assets are identified, assessed and reported and are managed and mitigated appropriately. |
(vi) develop and, subject to market conditions, implement a liability management plan which is designed to enable the RBS Group to meet certain Core Tier 1 capital targets for 2009; and
(vii) use best endeavours (giving regard to reasonable operational requirements) to maintain regular, adequate and effective monitoring, reporting, risk management and audit controls and procedures in order, among other things, to ensure that risks relating to key business processes which affect the Proposed Assets are identified, assessed and reported and are managed and mitigated appropriately.
In addition, the Royal Bank has agreed in principle that, if and only if the Royal Bank accedes to the APS, it willwould not claim, and willwould disclaim, certain UK tax losses and allowances arising to members of the RBS Group in respect of any accounting period ending on or after 31 December 2008, provided that this undertaking willwould not apply in respect of any such tax benefits arising in the earlier of (a) the first accounting period beginning more than five years after the relevant accession date and (b) the first accounting period beginning after the relevant accession date in which the RBS Group becomes profitable.
The Royal Bank has acknowledged that HM Treasurycompany's commitments, described in this section have been superseded by the Scheme Rules and the FSA proposeAccession Agreement, (for details of the Accession Agreement, see below), with the exception of a commitment to commence a consultationinform the Department for Business, Innovation and Skills prior to making significant reductions in relationthe level of lending being made available to a Codecertain borrowers or counterparties, which will apply until 28 February 2011, in line with the duration of Remuneration Practice for banking institutions and has confirmed that it will comply with any such Code, and any other legal or regulatory requirements relating to remuneration policies, to which it becomes subject from time to time.the commitments under the Lending Commitments Letter described below.
Additional information continued | Additional information |
Lending Commitments Letter
On 26 February 2009, the Groupcompany entered into a deed poll in favour of certain UK Government departments under which it undertook to support lending to creditworthy borrowers in the UK in a commercial manner with effect from 1 March 2009. On 18 May 2009, the company entered into an amendment to this deed poll which took effect from 29 May 2009 and on 20 November 2009, the company executed a further amendment to this deed poll. This lending commitment iswas a pre-requisite to the Group’s proposedcompany's participation in the APS and other Government backed schemes, the objective of which iswas to reinforce the stability of the financial system and support the recovery of the economy.
Pursuant to this lending commitment, the Group hascompany agreed to increase its lending in the 12 months commencing 1 March 2009 from its UK banking operations to UK businesses by, in aggregate, £16 billion above the amount previously budgeted and to maintain in the 12 months commencing 1 March 2010 similar levels of lending to UK businesses as in the 12 months commencing 1 March 2009. Such additional lending is subject to the Group’s ordinary course pricing and other terms, and certain commercial, risk, credit and regulatory considerations.budgeted.
The Group hascompany also made a commitment to increase lending to homeowners, including first time buyers, in the United Kingdom. The Group has undertakencompany undertook to increase its residential mortgage lending by at least £9 billion above the amount previously budgeted in the 12 months commencing 1 March 2009 and to maintain in the 12 months commencing 1 March 2010 similar levels of residential mortgage2009.
Such additional lending as in the 12 months commencing 1 March 2009was subject to adjustment of the commitments by the UK Government departments from time to time.company's ordinary course pricing and other terms, and certain commercial, risk, credit and regulatory considerations.
The Group’scompany's compliance with its lending commitments will beis monitored by the UK Government, and is subject to a monthly reporting process to the UK Government.process.
The Group hascompany also made certain undertakings as regards marketing in support of its lending commitments and certain other matters relating to its business and residential lending practices and policies. The lending commitments made in the deed poll supersede the commitments given by the Groupcompany in the First Placing and Open Offer Agreement and the Second Placing and Open Offer Agreement.
TheseOn 23 March 2010, the company agreed with the UK government certain adjustments to the above lending commitments for the 2010 commitment period (the 12 month period commencing 1 March 2010), to reflect expected economic circumstances over the period. As part of the amended lending commitments, the company committed, among other things, to make available gross new facilities, drawn or undrawn, of £50 billion to UK businesses in the period 1 March 2010 to 28 February 2011. In addition, the company agreed with the UK government to make available £8 billion of net mortgage lending in the 2010 commitment period. This is a decrease of £1 billion on the net mortgage lending target that previously applied to the 2010 commitment period which ends on 28 February 2011, to reflect that the mortgage lending commitment for the 2009 commitment period was increased from £9 billion to £10 billion. In the Budget of 23 March 2011, the Chancellor of the Exchequer confirmed that RBS had met these lending commitments, providing £30 billion of gross new facilities to SMEs and £26.9 billion to larger businesses (a total of £56.9 billion) and delivering £9.4 billion of net mortgage lending.
B Share Acquisition and Contingent Capital Agreement
On 26 November 2009, the company and HM Treasury entered into the Acquisition and Contingent Capital Agreement pursuant to which HM Treasury subscribed for the initial B shares and the Dividend Access Share (the "Acquisitions") and agreed the terms of HM Treasury's subscription for an additional £8 billion in aggregate in the form of further B shares (the "Contingent B shares"), which will ceasebe issued on the same terms as the initial B shares. The Acquisitions were subject to the satisfaction of various conditions, including the company having obtained the approval of its shareholders in relation to the Acquisitions.
The company and HM Treasury further agreed the terms of the £8 billion Contingent Subscription of the Contingent B shares in the Acquisition and Contingent Capital Agreement. For a period of five years from 22 December 2009 or, if earlier, until the occurrence of a termination event or until the company decides (with FSA consent) to terminate such Contingent Subscription (the "Contingent Period"), if the Core Tier 1 ratio of the company falls below five per cent (and if certain other conditions are met) HM Treasury has committed to subscribe for the Contingent B shares in no fewer than two tranches of £6 billion and £2 billion (or such smaller amounts as the company and HM Treasury may agree). Any unused portion of the £8 billion may be subscribed in one or more further tranches.
The company may, subject to certain conditions, at any time terminate the Contingent Subscription in whole or in part, with the consent of the FSA. The company is required to pay an annual fee, for the Contingent Period, in relation to the Acquisitions and the Contingent Subscription of £320 million less four per cent per annum of the value of any B shares subscribed for under the Contingent Subscription. Such fee is payable in cash or, with HM Treasury's consent, by waiving certain UK tax reliefs that are treated as deferred tax assets or through a further issue of B shares to HM Treasury. The annual fee ceases to be payable on termination of the Contingent Subscription and if the company terminates the Contingent Subscription in part, the fee will reduce proportionately.
The company gave certain representations and warranties to HM Treasury on the date of the Acquisition and Contingent Capital Agreement, on the date the circular was posted to shareholders, on the first date on which all of the conditions precedent were satisfied, or waived, and on the date of the Acquisitions. The company has agreed to give such representations and warranties again on each date (if any) a Contingent Subscription is triggered and on each date (if any) on which B shares are issued pursuant to a Contingent Subscription.
The company agreed to reimburse HM Treasury for its expenses incurred in connection with the Acquisitions and agreed to do so in connection with the Contingent B shares, if the Contingent Subscription is exercised.
The company agreed to a number of undertakings, including with respect to: (i) restrictions on the payment of dividends or other distributions on, and the redemption of, certain securities; (ii) expectations regarding the repurchase of the B shares by the company; (iii) renegotiations of the terms of the Contingent Subscription as a result of future legislative or regulatory changes; (iv) negotiating in good faith to maintain the status of the B shares and Dividend Access Share as Core Tier 1 capital; and (v) restrictions in relation to the company's share premium account.
Additional information continued | Additional information |
Material contracts continued
HM Treasury has agreed to waive its statutory pre-emption rights arising out of the B shares and the Dividend Access Share in respect of any future issue of equity securities by the company other than B shares and has agreed to vote its B shares and the Dividend Access Share, as applicable, in favour of each special resolution to disapply its pre- emption rights under the B shares and/or the Dividend Access Share then held by HM Treasury every time they arise. The pre-emption rights arising out of the B shares and the Dividend Access Share have also been disapplied in the Articles of Association.
HM Treasury has agreed that it shall not be entitled to exercise its option to convert B shares into ordinary shares to the extent that it holds more than 75 per cent of the ordinary shares of the company or to the extent that the exercise of such option would result in it holding more than 75 per cent of the ordinary shares of the company.
HM Treasury has agreed that it shall not be entitled to vote the B shares or the Dividend Access Share to the extent that votes cast on such B shares and the Dividend Access Share, together with any other votes which HM Treasury is entitled to cast in respect of any other ordinary shares held by or on behalf of HM Treasury, would exceed 75 per cent of the total votes eligible to be cast on a resolution proposed at a general meeting of the company.
For as long as it is a substantial shareholder of the company (within the meaning of the UKLA's Listing Rules), HM Treasury has undertaken not to vote on related party transaction resolutions at general meetings and to direct that its affiliates do not so vote.
Accession Agreement and the UK Asset Protection Scheme Terms and Conditions
The company acceded to the APS through an accession agreement (the "Accession Agreement") entered into with HM Treasury, which became effective on 22 December 2009. Supplemental agreements were signed on 27 August 2010, 20 December 2010 and 10 February 2011. The Accession Agreement incorporates the terms and conditions of the APS set out in the document entitled ‘UK Asset Protection Scheme Terms and Conditions’ which is available on HM Treasury's website (the ‘Scheme Conditions’). The Accession Agreement which incorporates the Scheme Conditions is accounted for as a credit derivative and it tailors the APS to the company (by, amongst other things, setting applicable bank-specific thresholds and addressing a limited number of other bank-specific issues).
Under the APS, HM Treasury is liable to make payments to the company in respect of a pre-defined pool of assets and exposures (the "Covered Assets") in respect of which a specified failure to pay, bankruptcy or restructuring trigger occurs or is deemed to occur. Payments under the APS are intended to protect the company, over time, for 90% of the amount by which cumulative losses on the whole portfolio of Covered Assets (as reduced by cumulative recoveries on the portfolio) exceed a fixed first loss threshold of £60 billion. Cumulative losses (as reduced by cumulative recoveries) below the first loss threshold, and a 10% vertical slice of any cumulative losses (as reduced by cumulative recoveries) exceeding the first loss threshold, are for the account of the company.
Protection under the APS is, subject to various requirements under the Scheme Conditions, provided in respect of the Covered Assets on the company's consolidated balance sheet as at 31 December 2008 with an aggregate covered amount of £282 billion. Protection under the APS may be lost or limited in certain specified circumstances, including the failure of a Covered Asset to satisfy certain asset eligibility criteria set out in the Scheme Conditions.
During the life of the APS, the company will pay HM Treasury a non-refundable annual fee (payable in advance) of £700 million per annum for the first three years of the APS and £500 million per annum until the earlier of (i) the date of termination of the APS and (ii) 31 December 2099. The annual fee can, subject to HM Treasury's consent, be paid wholly or partly by means of the waiver of certain UK tax reliefs that are treated as deferred tax assets or funded by the issuance of additional B shares to HM Treasury.
The company has the right, in certain circumstances, to withdraw from the APS permanently all or part of a Covered Asset. In addition, the company contractually has the right to terminate the APS exercisable at any time provided that the FSA has confirmed in writing to HM Treasury that it has no objection to the proposed termination. An exit fee and, potentially, a refund of HM Treasury's net payments under the APS are payable by the company upon such termination. The Scheme Conditions also contain various provisions and restrictions on the management and administration of the Covered Assets and certain related assets. The company is obliged to manage such assets in accordance with the asset management objective, which is to maximise the expected net present value of such assets (discounted at an HM Treasury rate), including by minimising losses and potential losses and maximising recoveries and potential recoveries. The company also has monitoring and reporting obligations under the Scheme Conditions which are aimed at transparency in respect of the Covered Assets to enable HM Treasury to manage and assess its exposure under the APS. In addition, the company has to establish a separate governance structure for the purposes of the APS. Further, the Scheme Conditions and the Accession Agreement also contain requirements for the development of a remuneration policy for the Group does not participateand specific remuneration requirements for certain officers and employees of the company.
HM Treasury has the right to appoint one or more step-in managers to exercise extensive step-in rights in relation to all or some of the Covered Assets upon the occurrence of certain specified trigger events.
Certain Scheme Conditions are subject to modification at any time with retrospective effect at the discretion of HM Treasury without the company's consent. The modification rights arise broadly and subject to certain conditions where the operation, interpretation or application of such Scheme Conditions conflicts with any of the overriding general principles set out in the Scheme Conditions.
There are material restrictions on the form and substance of announcements or public statements (including any required by law or the rules of any securities exchange) made by the Group in relation to the APS or to HM Treasury in connection with the APS without HM Treasury's consent.
Additional information continued | Additional information |
In connection with its participation in the APS, the company has agreed to a number of behavioural commitments in respect of lending for businesses in the UK, personal current accounts in the UK as well as to develop and Credit Guarantee Scheme byimplement a capital optimisation exercise designed to increase the Group’s Core Tier 1 Junecapital.
The Tax Loss Waiver
On 26 November 2009, the company entered into three agreements (together comprising the Tax Loss Waiver) which provide the right, at the company’s option, subject to HM Treasury consent, to satisfy all or will reduce if it participatespart of the annual fee in only onerespect of the APS or Credit Guarantee Scheme priorthe Contingent Subscription arrangement, and the exit fee payable in connection with any termination of the Group’s participation in the APS (but not the refund of the net payments it has received from HM Treasury under the APS), by waiving the entitlement to 1 June 2009.certain UK tax reliefs that are treated as deferred tax assets. The Tax Loss Waiver contains undertakings designed to prevent the Group from engaging in arrangements which have a main purpose of reducing the net cost to the Group of any waiver of tax reliefs pursuant to the Tax Loss Waiver.
State Aid Commitment Deed
As a result of the State Aid granted to the company, it was required to work with HM Treasury to submit a State Aid restructuring plan to the European Commission, which has now been approved under the State Aid rules. The company has agreed a series of measures to be implemented over a four year period, which supplement the measures in the company's strategic plan.
The Group entered into a State Aid Commitment Deed with HM Treasury which provides that the Group will comply or procure compliance with these measures and behavioural commitments. The Group agreed to do all acts and things necessary to ensure HM Treasury's compliance with its obligations under any European Commission decision approving State Aid to the Group.
The State Aid Commitment Deed also provides that if the European Commission adopts a decision that the UK Government must recover any State Aid (a "Repayment Decision") and the recovery order of the Repayment Decision has not been annulled or suspended by the Court of First Instance or the European Court of Justice, then the Group must repay HM Treasury any aid ordered to be recovered under the Repayment Decision.
The State Aid Commitment Deed also provides for the Group's undertakings in respect of State Aid to be modified in certain limited circumstances. However, HM Treasury has undertaken that it will not, without the consent of the Group, agree modifications to the Group's undertakings with respect to State Aid which are significantly more onerous to the Group than those granted in order to obtain the State Aid approval.
State Aid Costs Reimbursement Deed
Under the State Aid Costs Reimbursement Deed, the Group has agreed to reimburse HM Treasury for fees, costs and expenses associated with the State Aid and State Aid approval.
Sale of RBS England and Wales and NatWest Scotland branch based business to Santander UK plc
On 4 August 2010, the Royal Bank, NatWest Plc and National Westminster Home Loans Limited entered into a Sale and Purchase Agreement with Santander UK plc pursuant to which the Royal Bank, NatWest Plc and National Westminster Home Loans Limited agreed to sell 311 Royal Bank of Scotland branded branches in England and Wales, seven NatWest branded branches in Scotland, the retail and SME customer accounts attached to these branches, the Direct SME business, and certain mid-corporate businesses and associated assets and liabilities to Santander UK plc for a premium of £350 million to net assets at closing. The consideration will be paid in cash and is subject to certain closing adjustments, including those relating to the performance of the business. The transaction is subject to regulatory, anti-trust and other conditions.
RBS Sempra Commodities JV sales
On 16 February 2010, the Group announced that RBS Sempra Commodities JV, a joint venture owned by the Royal Bank and Sempra Energy, had agreed to sell to J.P. Morgan Ventures Energy Corporation (JPMorgan) its metals, oils and European energy business lines. The Group announced completion of the transaction on 2 July 2010, for a total cash consideration of US$1.6 billion, post interim distributions of which the company's share is approximately 47 per cent.
On 20 September 2010, the Group announced that RBS Sempra Commodities JV had agreed to sell its Sempra Energy Solutions business line to Noble Americas Gas & Power Corp. for consideration of approximately US$317 million in cash, plus the assumption of approximately US$265 million in debt. The Group’s share of the consideration is approximately 51 per cent, or US$162 million. The transaction closed on 1 November 2010.
On 7 October 2010, the Group announced that RBS Sempra Commodities JV had agreed to sell substantial assets of its commodities trading North American Power and Gas business lines to JPMorgan. The transaction closed on 1 December 2010 and JPMorgan acquired these net assets for consideration of US$220 million in cash based on the 30 June 2010 balance sheet, of which the Group’s share is approximately 51 per cent, i.e. US$112 million. The value of the gross assets acquired by JPMorgan was US$6 billion (unaudited) as of 30 June 2010.
Additional information continued | Additional information |
With effectSale of Global Merchant Services business
On 6 August 2010, the Royal Bank, Citizens Financial Group, Inc., RBS Netherlands Holdings B.V., Ulster Bank Limited, Ulster Bank Ireland Limited, NatWest Plc and Ship Bidco Limited (a company representing Advent International (‘Advent’) and Bain Capital (‘Bain’) which has now changed its name to WorldPay (UK) Limited) entered into a Transfer Agreement pursuant to which the Royal Bank (either directly or through its group companies) sold 80.01 per cent of its Global Merchant Services business for an enterprise value of up to £2.025 billion. Approximately £1.45 billion (subject to customary post-closing adjustments) was received in cash on closing of the sale of the 80.01 per cent interest. Up to £200 million is receivable in the future if the returns realised by Advent and Bain exceed certain thresholds. The sale completed on 30 November 2010.
The Royal Bank, in its capacity as holder of a retained interest in the Global Merchant Services business, also entered into an Investment Agreement on 6 August 2010 (subsequently amended and restated on 29 November 2010) with Ship Bidco Limited (now WorldPay (UK) Limited), certain other acquisition vehicles, specified management and funds operated by Advent International and Bain Capital relating to the operations of the joint venture company which is the uppermost of the intermediate acquisition vehicles and the ultimate parent company of WorldPay (UK) Limited. The interests of the Royal Bank are insufficient to block major decisions of this joint venture company at the shareholder or board level.
Additional information continued | Additional information |
ADR payment information
Fees paid by ADR holders
The depositary collects its fees for delivery and surrender of ADSs directly from investors depositing shares or surrendering ADSs for the purpose of withdrawal or from intermediaries acting for them. The depositary collects fees for making distributions to investors by deducting those fees from the amounts distributed or by selling a portion of
distributable property to pay the fees.
The depository may collect its annual fee for depository services by deductions from cash distributions or by directly billing investors or by changing the book-entry system accounts of participants acting for them. The depository may generally refuse to provide fee-attracting services until its fees for those services are paid.
| Persons depositing or withdrawing shares must pay: | | For: |
| | | |
| $5.00 (or less) per 100 ADSs (or portion of 100 ADSs) | | ● | Issuance of ADSs, including issuances resulting from a distribution of shares or rights or other property. |
| | ● | Cancellation of ADSs for the purpose of withdrawal, including if the deposit agreement terminates. |
| | | |
| $0.02 (or less) per ADS | | ● | Any cash distribution to ADS registered holders. |
| | | |
| A fee equivalent to the fee that would be payable if securities distributed to you had been shares ad the shares had been deposited for issuance of ADSs | | ● | Distribution of securities distributed to holders of securities of deposited securities to ADS registered holders. |
| | | |
| Registration or transfer fees | | ● | Transfer and registration of shares on our share register to or from the name of the depository or its agent when you deposit or withdraw shares. |
| | | |
| Expenses of the depository | | ● | Cable, telex and facsimile transmissions (when expressly provided in the deposit agreement). |
| | | |
| | ● | Converting foreign currency to U.S. dollars. |
| | | |
| Taxes and other governmental charges the depositary or the custodian have to pay on any ADS or share underlying an ADS, for example, stock transfer taxes, stamp duty or withholding taxes | | ● | As necessary. |
| | | |
| Any charges incurred by the depository or its agents for servicing the deposited securities | | ● | As necessary. |
Fees payable by the depository to the issuer
Fees incurred in past annual Period
From 1 July 2008,January 2010 to 31 December 2010, the Group soldcompany received from the depository $300,000 for continuing annual stock exchange listing fees, standard out-of-pocket maintenance costs for the ADRs (consisting of the expenses of postage and envelopes for mailing annual and interim financial reports, printing and distributing dividend cheques, electronic filling of U.S. Federal tax information, mailing required tax forms, stationary, postage, facsimile, and telephone calls), any applicable performance indicators relating to Santander (athe ADR facility, underwriting fees and legal fees.
Fees to be paid in the future.
The bank of New York Mellon, as depository, has agreed to reimburse the Company for expenses they incur that are related partyto establishment and maintenance expenses of the ADS program.
The depository has agreed to reimburse the Company for its continuing annual stock exchange listing fees, the depository has also agreed to pay the standard out-of-pocket maintenance costs for the ADRs, which consist of the expenses of postage and envelopes for mailing annual and interim reports, printing and distributing dividend cheques, electronic filing of U.S. Federal tax information, mailing required tax forms, stationary, postage, facsimile, and telephone calls. It has also agreed to reimburse the Company annually for certain investor relationship programs of special investor relations promotional activities. In certain instances, the depository has agreed to provide additional payments to the Company based on any applicable performance indicators relating to the ADR facility. There are limits on the amount of expenses for which the depository will reimburse the Company, but the amount of reimbursement available to the Company id not necessarily tied to the amount of fees the depository collects from investors.
Additional information continued | Additional information |
Risk factors
Set out below are certain risk factors which could adversely affect the Group's future results and cause them to be materially different from expected results. The Group's results could also be affected by competition and other factors. The factors discussed in this report should not be regarded as a complete and comprehensive statement of all potential risks and uncertainties.
The company and its UK bank subsidiaries may face the risk of full nationalisation or other resolution procedures under the Banking Act 2009.
Under the Banking Act 2009 (the “Banking Act”), substantial powers have been granted to HM Treasury, the Bank of England and the FSA (together, the “Authorities”) as part of a special resolution regime (the “SRR”). These powers enable the Authorities to deal with UK banks, building societies and other institutions with permission to accept deposits pursuant to Part IV of the Financial Services and Markets Act 2000 (“FSMA”) (each, a “relevant entity”) where the conditions set out in the next paragraph headed “The SRR may be triggered prior to the insolvency of the company or its UK bank subsidiaries” are met. The SRR consists of three stabilisation options and two insolvency and administration procedures applicable to UK banks which may be commenced by the Authorities. The stabilisation options provide for: (i) transfer of all or part of the business of the relevant entity to a private sector purchaser; (ii) transfer of all or part of the business of the relevant entity to a “bridge bank” established by the Bank of England; and (iii) temporary public ownership (nationalisation) of the relevant entity or its UK-incorporated holding company. In each case, the Authorities have been granted wide powers under the Banking Act including powers to modify contractual arrangements in certain circumstances and powers for HM Treasury to disapply or modify laws (with possible retrospective effect) to enable the powers under the Banking Act to be used effectively. The following paragraphs of this risk factor headed “The company and its UK bank subsidiaries may face the risk of full nationalisation or other resolution procedures under the Banking Act 2009” set out some of the possible consequences of the exercise of those powers under the SRR.
The SRR may be triggered prior to the insolvency of the company or its UK bank subsidiaries.
The purpose of the stabilisation options is to address the situation where all or part of the business of a relevant entity has encountered, or is likely to encounter, financial difficulties. Accordingly, the stabilisation options may only be exercised if (a) the FSA is satisfied that a relevant entity such as the company’s UK banking subsidiaries, including the Royal Bank and NatWest, is failing, or is likely to fail, to satisfy the threshold conditions within the meaning of section 41(1) of the FSMA (which are the conditions that a relevant entity must satisfy in order to retain its authorisation to perform regulated activities), (b) following consultation with the other Authorities, the FSA determines that it is not reasonably likely that (ignoring the stabilisation options) action will be taken that will enable the relevant entity to satisfy those threshold conditions, and (c) the Authorities consider the exercise of the stabilisation options to be necessary, having regard to certain public interest considerations (such as the stability of the UK financial systems, public confidence in the UK banking systems and the protection of depositors). It is therefore possible that one of the stabilisation options could be exercised prior to the point at which any insolvency proceedings with respect to the relevant entity (such as the Royal Bank or NatWest) or the company could be initiated.
The stabilisation options may be exercised by means of powers to transfer property, rights or liabilities of a relevant entity and shares and other securities issued by a relevant entity. HM Treasury may also take the parent company of a relevant entity (such as the company) into temporary public ownership provided that certain conditions are met. Temporary public ownership is effected by way of a share transfer order and can be actioned irrespective of the financial condition of the parent company.
Various actions may be taken in relation to any securities issued by the company without the consent of the holders thereof.
If HM Treasury decides to take the company into temporary public ownership, it may take various actions in relation to any securities issued by the company (the “Securities”) without the consent of holders of the Securities, including (among other things):
| (i) | transferring the Securities free from any contractual, legislative or other restrictions on transfer; |
| (ii) | transferring the Securities free from any trust, liability or other encumbrance; |
| (iii) | extinguishing any rights to acquire Securities; |
| (iv) | delisting the Securities; |
| (v) | converting the Securities into another form or class (the scope of which power is unclear, although may include, for example, conversion of the Securities into equity securities); |
| (vi) | disapplying any termination or acceleration rights or events of default under the terms of the Securities which would be triggered by the transfer or certain related events; or |
| (vii) | where property is held on trust, removing or altering the terms of such trust. |
Where HM Treasury has made a share transfer order in respect of securities issued by the holding company of a relevant entity, HM Treasury may make an order providing for the property, rights or liabilities of the holding company or of any relevant entity in the holding company group to be transferred and where such property is held on trust, removing or altering the terms of such trust.
The taking of any such actions may adversely affect the rights of holders of the Securities, the price or value of their investment in the Securities and/or the ability of the company to satisfy its obligations under the Securities and/or contracts related to the Securities. Where the transfer powers are effected, HM Treasury is required to make certain compensation or resolution fund orders and holders of Securities may have a claim for compensation under one of the compensation schemes contemplated by the Banking Act if any action is taken in respect of the Securities (and if the relevant order provides for the amount of compensation payable to be determined by an independent valuer, then for the purposes of determining an amount of compensation, the FSA Listing Rules) its interests inindependent valuer must disregard actual or potential financial assistance provided by the European Consumer Finance businesses in Germany and Austria for €306 million.Bank of England or HM Treasury). However, there can be no assurance that compensation would be assessed to be payable or that holders of the Securities would recover any compensation promptly and/or equal to any loss actually incurred.
274Additional information continued | Additional information |
Risk factors continued
Contractual arrangements between the company, other companies within the Group and/or the bridge bank or private sector purchaser may be created, modified or cancelled.
If the company were taken into temporary public ownership and a partial transfer of its or any relevant entity’s business were effected, or if a relevant entity were made subject to the SRR and a partial transfer of its business to another entity were effected, the transfer may directly affect the company and/or its Group companies by creating, modifying or cancelling its or their contractual arrangements with a view to ensuring the provision of such services and facilities as are required to enable the bridge bank or private sector purchaser to operate the transferred business (or any part of it) effectively. For example, the transfer may (among other things) (i) require the company or Group companies to support and co-operate with the bridge bank or private sector purchaser; (ii) cancel or modify contracts or arrangements between the company or the transferred business and a Group company; or (iii) impose additional obligations on the company under new or existing contracts. There can be no assurance that the taking of any such actions would not adversely affect the ability of the company to satisfy its obligations under the issued Securities or related contracts.
A partial transfer of the company’s business may result in a deterioration of its creditworthiness.
If the company were taken into temporary public ownership and a partial transfer of its or any relevant entity’s business were effected, or if a relevant entity were made subject to the SRR and a partial transfer of its business to another entity was effected, the nature and mix of the assets and liabilities not transferred may adversely affect the company’s financial condition and increase the risk that the company may eventually become subject to administration or insolvency proceedings pursuant to the Banking Act. In such circumstances, holders of Securities may have a claim for compensation under one of the compensation schemes contemplated by the Banking Act, but there can be no assurance that compensation would be assessed to be payable or that such holders would recover any compensation promptly and/or equal to any loss actually incurred.
While the main provisions of the Banking (Special Provisions) Act 2008 were in force, which conferred certain transfer powers on HM Treasury, the UK Government took action under that Act in respect of a number of UK financial institutions, including, in extreme circumstances, full and partial nationalisation. There have been concerns in the market in recent years regarding the risks of such nationalisation in relation to the company and other UK banks. If economic conditions in the UK or globally were to deteriorate, or the events described in the following risk factors were to occur to such an extent that they had a materially adverse impact on the financial condition, perceived or actual credit quality, results of operations or business of any of the relevant entities in the Group, the UK Government may decide to take similar action in relation to the company under the Banking Act. Given the extent of the Authorities’ powers under the Banking Act, it is difficult to predict the effect that such actions might have on the Group and any securities issued by the company or Group companies. However, potential impacts may include full nationalisation of the company, the total loss of value in Securities issued by the company and the inability of the company to perform its obligations under the Securities.
If a relevant stabilisation option were effected in respect of the company or the stabilisation options were effected in respect of a relevant entity or its business within the Group, HM Treasury would be required to make certain compensation or resolution fund orders, which would depend on the stabilisation power adopted. For example, in the event that the Bank of England were to transfer some of the business of a relevant entity to a bridge bank, HM Treasury would have to make a resolution fund order including a third party compensation order pursuant to the Banking Act (Third Party Compensation Arrangements for Partial Property Transfers) Regulations 2009. However, there can be no assurance that compensation would be assessed to be payable or that holders of the Securities would recover any compensation promptly and/or equal to any loss actually incurred.
The Group’s businesses, earnings and financial condition have been and will continue to be affected by the global economy and instability in the global financial markets.
The performance of the Group has been and will continue to be influenced by the economic conditions of the countries in which it operates, particularly the UK, the US and other countries throughout Europe and Asia. The outlook for the global economy over the near to medium term remains challenging, particularly in the UK, the US and other European economies. In addition, the global financial system has yet to fully overcome the difficulties which first manifested themselves in August 2007 and financial markets conditions have not yet fully normalised. These conditions led to severe dislocation of financial markets around the world and unprecedented levels of illiquidity in 2008 and 2009, resulting in the development of significant problems at a number of the world’s largest corporate institutions operating across a wide range of industry sectors, many of which are the Group’s customers and counterparties in the ordinary course of its business. In response to this economic instability and market illiquidity, a number of governments, including the UK Government, the governments of the other EU member states and the US Government intervened in order to inject liquidity and capital into the financial system, and in some cases, to prevent the failure of these institutions.
Despite such measures, the volatility and disruption of the capital and credit markets have continued, with many forecasts predicting only modest levels of GDP growth in the near to medium term. Similar conditions are likely to exist in a number of the Group’s key markets, including those in the US and Europe, particularly Ireland. These conditions have exerted, and may continue to exert, downward pressure on asset prices and on availability of credit for financial institutions and upward pressure on the cost of credit for financial institutions, including the company, the Royal Bank, RBS Holdings N.V. and The Royal Bank of Scotland N.V., and will continue to impact the credit quality of the Group’s customers and counterparties. Such conditions, alone or in combination with regulatory changes or actions of other market participants, may cause the Group to incur losses or to experience further reductions in business activity, increased funding costs and funding pressures, lower prices of the ordinary shares, decreased asset values, additional write-downs and impairment charges and lower profitability.
Additional information continued | Additional information |
In particular, the performance of the Group may be affected by economic conditions impacting EU member states. For example, the financial problems recently experienced by the governments of certain EU member states (including Greece and Ireland) may lead to the issuance of significant volumes of debt by such member states and European Union entities, which may in turn reduce demand for debt issued by financial institutions and corporate borrowers. This, as well as credit rating downgrades experienced by such member states, could adversely affect the Group’s access to the debt capital markets and may increase the Group’s funding costs, which could have a material adverse impact on the Group’s earnings, cash flow and financial condition. In addition, EU member states in which the Group operates have agreed to provide financial assistance to certain member states, currently Greece and Ireland, and may be required to provide financial assistance to other EU member states in the future, which may in turn have a negative impact on the financial condition of those EU member states providing the assistance. The Group’s exposure to the economies of such member states, in particular Ireland, has resulted in the Group making significant provisions. Should the adverse economic conditions currently faced by such member states be replicated in other EU member states, the risks discussed above would be exacerbated.
In addition, the Group will continue to be exposed to the risk of loss if major corporate borrowers or counterparty financial institutions fail or are otherwise unable to meet their obligations. The Group is currently exposed to country concentration risk in the US, the UK and the rest of Europe and certain business sector concentration risk relating to personal and banking and financial institution exposures. The Group’s performance may also be affected by future recovery rates on assets and the historical assumptions underlying asset recovery rates, which (as has already occurred in certain instances) may no longer be accurate given the unprecedented market disruption and general economic instability. The precise nature of all the risks and uncertainties the Group faces as a result of current economic conditions cannot be predicted and many of these risks are outside the control of the Group.
The Group is subject to a variety of risks as a result of implementing the State Aid restructuring plan and is prohibited from making discretionary dividend or coupon payments on existing hybrid capital instruments (including preference shares and B shares) which may impair the Group’s ability to raise new Tier 1 capital.
The Group was required to obtain State Aid approval for the aid given to the Group by HM Treasury as part of the placing and open offer undertaken by the company in December 2008 (the “First Placing and Open Offer”), the issuance of £25.5 billion of B shares in the capital of the company (the “B shares”) which are, subject to certain terms and conditions, convertible into ordinary shares of the company to HM Treasury, a contingent commitment by HM Treasury to subscribe (the “Contingent Subscription”) for up to an additional £8 billion of B shares (the “Contingent B shares”) if certain conditions are met and the Group’s participation in the Asset Protection Scheme (the “APS”) (the “State Aid”). In that context, as part of the terms of the State Aid approval, the Group, together with HM Treasury, agreed the terms of a restructuring plan (the “State Aid restructuring plan”).
As part of the State Aid restructuring plan, there is a prohibition on the making of discretionary dividend (including preference shares and B shares) or coupon payments on existing hybrid capital instruments for a two-year period which commenced on 30 April 2010. These restrictions will prevent the company, the Royal Bank and other Group companies (other than companies in the RBS Holdings N.V. group, (which was renamed from ABN AMRO Holding N.V. on 1 April 2010) which are subject to different restrictions) from paying dividends on their preference shares and coupons on other Tier 1 securities, and the company from paying dividends on its ordinary shares, for the same duration, and it may impair the Group’s ability to raise new capital through the issuance of ordinary shares and other securities issued by the company.
The Group is subject to a variety of risks as a result of implementing the State Aid restructuring plan, including required asset disposals. In particular, the Group agreed to undertake a series of measures to be implemented over a four-year period from December 2009, which include disposing of RBS Insurance, the Group’s insurance division (subject to potentially maintaining a minority interest until the end of 2014). The company also agreed to divest its global card payment services business, Global Merchant Services (“GMS”), by the end of 2013, subject to the company retaining up to 20 per cent. of GMS if required by the purchaser, its interest in RBS Sempra Commodities LLP (“RBS Sempra Commodities”), the Group’s joint venture with Sempra Energy and a leading global commodities trader and the Royal Bank branch-based business in England and Wales and the NatWest branches in Scotland, along with the Direct small and medium-size enterprise (SME) customers and certain mid-corporate customers across the UK. The Group has progressed with certain of these disposals over the course of 2010. For further information, see “Material Contracts”. There is no assurance that the price that the Group receives or has received for any assets sold pursuant to the State Aid restructuring plan will be at a level the Group considers adequate or which it could obtain in circumstances in which the Group was not required to sell such assets in order to implement the State Aid restructuring plan or if such sale were not subject to the restrictions contained in the terms thereof. Further, if the Group fails to complete any of the required disposals within the agreed timeframes for such disposals, under the terms of the State Aid approval, a divestiture trustee may be empowered to conduct the disposals, with the mandate to complete the disposal at no minimum price.
Furthermore, if the Group is unable to comply with the terms of the State Aid approval, it could constitute a misuse of aid. In circumstances where the European Commission doubts that the Group is complying with the terms of the State Aid approval, it may open a formal investigation. At the conclusion of any such investigation, if the European Commission decided that there had been misuse of aid, it could issue a decision requiring HM Treasury to recover the misused aid which could have a material adverse impact on the Group.
Additional information continued | Additional information |
Risk factors continued
In implementing the State Aid restructuring plan, the Group will lose existing customers, deposits and other assets (both directly through the sale and potentially through the impact on the rest of the Group’s business arising from implementing the State Aid restructuring plan) and the potential for realising additional associated revenues and margins that it otherwise might have achieved in the absence of such disposals. Further, the loss of such revenues and related income may extend the time period over which the Group may pay any amounts owed to HM Treasury under the APS or otherwise. The implementation of the State Aid restructuring plan may also result in disruption to the retained business and give rise to significant strain on management, employee, operational and financial resources, impacting customers and employees and giving rise to separation costs which could be substantial.
The implementation of the State Aid restructuring plan may result in the emergence of one or more new viable competitors or a material strengthening of one or more of the Group’s existing competitors in the Group’s markets. The effect of this on the Group’s future competitive position, revenues and margins is uncertain and there could be an adverse effect on the Group’s operations and financial condition and its business generally.
If any or all of the risks described above, or any other currently unforeseen risks, materialise, there could be a materially adverse impact on the Group’s business, operations, financial condition, capital position and competitive position.
The Group’s ability to implement its strategic plan depends on the success of the Group’s refocus on its core strengths and its balance sheet reduction programme.
In light of the changed global economic outlook, the Group is engaged in a financial and core business restructuring which is focused on achieving appropriate risk-adjusted returns under these changed circumstances, reducing reliance on wholesale funding and lowering exposure to capital intensive businesses. A key part of this restructuring is the programme announced in February 2009 to run-down and sell the Group’s non-core assets and businesses and the continued review of the Group’s portfolio to identify further disposals of certain non-core assets and businesses. Assets identified for this purpose and allocated to the Group's Non-Core division totalled £252 billion, excluding derivatives, as at 31 December 2008. At 31 December 2010, this total had reduced to £137.9 billion, excluding derivatives, largely as a result of the progress made in business disposals and portfolio sales during the course of 2010. This balance sheet reduction programme continues alongside the disposals under the State Aid restructuring plan approved by the European Commission.
Because the ability to dispose of assets and the price achieved for such disposals will be dependent on prevailing economic and market conditions, which may remain challenging, there is no assurance that the Group will be able to sell or run-down (as applicable) those remaining businesses it is seeking to exit either on favourable economic terms to the Group or at all. Tax liabilities could arise on the disposal of assets. Furthermore, where transactions are entered into for the purpose of selling non-core assets and businesses, they may be subject to conditions precedent, including government and regulatory approvals and completion mechanics that in certain cases may entail consent from customers. There is no assurance that such conditions precedent will be satisfied, or consents and approvals obtained, in a timely manner or at all. There is consequently a risk that the Group may fail to complete such disposals by any agreed longstop date.
In addition, the Group may be liable for any deterioration in businesses being sold between the announcement of the disposal and its completion. In certain cases, the period between the announcement of a transaction and its completion may be lengthy and may span many months. Other risks that may arise out of the disposal of the Group’s assets include ongoing liabilities up to completion of the relevant transaction in respect of the assets and businesses disposed of, commercial and other risks associated with meeting covenants to the buyer during the period up to completion, the risk of employee and customer attrition in the period up to completion, substantive indemnity obligations in favour of the buyer, the risk of liability for breach of warranty, the need to continue to provide transitional service arrangements for potentially lengthy periods following completion of the relevant transaction to the businesses being transferred and redundancy and other transaction costs. Further, the Group may be required to enter into covenants agreeing not to compete in certain markets for specific periods of time. In addition, as noted above in the context of the State Aid restructuring plan and in the context of other disposals, the Group will lose existing customers, deposits and other assets (both directly through the sale and potentially through the impact on the rest of the Group’s business arising from implementing the restructuring plans) and the potential for realising additional associated revenues and margins that it otherwise might have achieved in the absence of such disposals.
Any of the above factors could negatively affect the Group's ability to implement its strategic plan and have a material adverse effect on the Group's business, results of operations, financial condition, capital ratios and liquidity and could result in a loss of value in the Securities.
Additional information continued | Additional information |
Lack of liquidity is a risk to the Group’s business and its ability to access sources of liquidity has been, and will continue to be, constrained.
Liquidity risk is the risk that a bank will be unable to meet its obligations, including funding commitments, as they fall due. This risk is inherent in banking operations and can be heightened by a number of enterprise specific factors, including an over-reliance on a particular source of wholesale funding (including, for example, short-term and overnight funding), changes in credit ratings or market-wide phenomena such as market dislocation and major disasters. During recent years, credit markets worldwide have experienced a severe reduction in liquidity and term-funding. During this time, the market perception of bank credit risk has changed significantly and banks that are deemed by the market to be riskier have issued debt at a premium to the cost of debt for banks that are perceived by the market as being safer. The uncertainty regarding the perception of credit risk across different banking groups also led to reductions in inter-bank lending, and hence, in common with many other banking groups, the Group’s access to traditional sources of liquidity has been, and may again be, restricted. In addition, in common with other banking groups, the Group has experienced pressures to increase the average maturity of its wholesale funding. An increase in the maturity of wholesale funding has the effect of increasing the Group’s overall cost of funding.
The Group’s liquidity management focuses on maintaining a diverse and appropriate funding strategy for its assets, controlling the mismatch of maturities and carefully monitoring its undrawn commitments and contingent liabilities. However, the Group’s ability to access sources of liquidity (for example, through the issue or sale of financial and other instruments or through the use of term loans) during recent periods of liquidity stress has been constrained to the point where it, in common with many other banking groups, has had to rely on shorter term and overnight funding with a consequent reduction in overall liquidity, and to increase its recourse to liquidity schemes provided by central banks. While money market conditions improved during the course of 2009 and 2010, with the Group seeing a material reduction of funding from central banks and the issuance of non-government guaranteed term debt, further tightening of credit markets could have a materially adverse impact on the Group. The Group, in common with other banking groups, may need to seek funds from alternative sources and potentially at higher costs than has previously been the case.
In addition, there is also a risk that corporate and financial institution counterparties with credit exposures may seek to reduce their credit exposures to banks, given current risk aversion trends. It is possible that credit market dislocation becomes so severe that overnight funding from non-government sources ceases to be available.
Like many banking groups, the Group relies on customer deposits to meet a considerable portion of its funding. Furthermore, as part of its ongoing strategy to improve its liquidity position, the Group is actively seeking to increase the proportion of its funding represented by customer deposits. However, such deposits are subject to fluctuation due to certain factors outside the Group’s control, such as a loss of confidence, increasing competitive pressures for retail customer deposits or the encouraged or mandated repatriation of deposits by foreign wholesale or central bank depositors, which could result in a significant outflow of deposits within a short period of time. There is currently heavy competition among UK banks for retail customer deposits, which has increased the cost of procuring new deposits and impacted the Group’s ability to grow its deposit base. An inability to grow, or any material decrease in, the Group’s deposits could, particularly if accompanied by one of the other factors described above, have a materially adverse impact on the Group’s ability to satisfy its liquidity needs unless corresponding actions were taken to improve the liquidity profile of other deposits or to reduce assets. Significant progress was made during the course of 2010 in reducing non-core asset levels. While the liquidity position of the Group may be materially adversely impacted if it is unable to achieve the run-off and sale of non-core and other assets and businesses as expected, the magnitude of this risk reduced during the course of 2010. Any significant delay in those plans may nevertheless require the Group to consider disposals of other assets not previously identified for disposal to achieve its funded balance sheet target level.
The Group has participated in governmental support schemes including the UK Government Credit Guarantee Scheme and the Special Liquidity Scheme. The Credit Guarantee Scheme closed for new issuance in February 2010 and the Special Liquidity Scheme closed for new transactions in January 2009. All of the Group’s financing under the United Kingdom Government Credit Guarantee Scheme and the Special Liquidity Scheme matures in 2011 and 2012. As at 31 December 2010, the total amount outstanding of debt instruments issued by RBS which benefit from the United Kingdom Government Credit Guarantee scheme was £41.5 billion. The Group expects to mitigate the impact of this refinancing concentration through a combination of seeking funds from alternative sources, the continuation of the Group’s balance sheet reduction programme and other reductions in the Group’s net wholesale funding requirement. However, there can be no assurance that such mitigation efforts will be successful.
There can be no assurance that the measures described above, alongside other available measures, will succeed in improving the funding and liquidity in the markets in which the Group operates, or that these measures, combined with any increased cost of any funding currently available in the market, will not lead to a further increase in the Group’s overall cost of funding or require the Group to consider disposals of other assets not previously identified for disposal to reduce its funding requirements, each of which could have a material adverse impact on the Group’s financial condition and results of operations or result in a loss of value in the Securities.
The financial performance of the Group has been materially affected by deteriorations in borrower credit quality and it may continue to be impacted by any further deteriorations, including as a result of prevailing economic and market conditions, and legal and regulatory developments.
Risks arising from changes in credit quality and the recoverability of loans and amounts due from counterparties are inherent in a wide range of the Group’s businesses. Whilst some economies stabilised over the course of the last two years, the Group may continue to see adverse changes in the credit quality of its borrowers and counterparties, for example as a result of their inability to refinance their debts, with increasing delinquencies, defaults and insolvencies across a range of sectors (such as the personal and financial institution sectors) and in a number of geographies (such as the UK, the US and the rest of Europe, particularly Ireland).
Additional information continued | Additional information |
Risk factors continued
The credit quality of the Group’s borrowers and counterparties is impacted by prevailing economic and market conditions, as well as by the legal and regulatory landscape in their respective markets, and if there is a further deterioration in economic and market conditions in one or more markets in which the Group operates or there are changes to the legal or regulatory landscapes in such markets, this could worsen the credit quality of the Group’s borrowers and counterparties and also impact the Group's ability to enforce contractual security rights.
In the United States during the last year there has been disruption in the ability of certain financial institutions to complete foreclosure proceedings in a timely manner (or at all), including as a result of interventions by certain states and local governments. This disruption has lengthened the time to complete foreclosures, increased the backlog of repossessed properties and, in certain cases, has resulted in the invalidation of purported foreclosures. In addition, a number of other financial institutions have experienced increased repurchase demands in respect of US mortgage loans or other related securities originated and sold. However, the Group has not experienced a significant volume of repurchase demands in respect of similar loans or related securities it originated or sold and has not ceased any of its US foreclosure activities.
The trends and risks affecting borrower credit quality have caused, and in the future may cause, the Group to experience further and accelerated impairment charges, increased repurchase demands, higher costs, additional write-downs and losses for the Group, and may result in a loss of value in the Securities.
The actual or perceived failure or worsening credit of the Group’s counterparties has adversely affected and could continue to adversely affect the Group.
The Group’s ability to engage in routine funding transactions has been and will continue to be adversely affected by the actual or perceived failure or worsening credit of its counterparties, including other financial institutions and corporate borrowers. The Group has exposure to many different industries and counterparties and routinely executes transactions with counterparties in the financial industry, including brokers and dealers, commercial banks, investment banks, mutual and hedge funds and other institutional clients. As a result, defaults by, or even the perceived creditworthiness of or concerns about, one or more corporate borrowers, financial institutions, sovereign counterparties or the financial services industry generally, have led to market-wide liquidity problems, losses and defaults and could lead to further losses being incurred by the Group or by other institutions. Many of these transactions expose the Group to credit risk in the event of default of the Group’s counterparty or client and the Group does have significant exposures to certain individual counterparties (including counterparties in certain weakened sectors and geographic markets, particularly the United States and Europe). In addition, the Group’s credit risk is exacerbated when the collateral it holds cannot be realised or is liquidated at prices not sufficient to recover the full amount of the loan or derivative exposure that is due to the Group, which is most likely to occur during periods of illiquidity and depressed asset valuations, such as those experienced in recent years. Any such losses could have an adverse effect on the Group’s results of operations and financial condition or result in a loss of value in the Securities.
The Group’s earnings and financial condition have been, and its future earnings and financial condition may continue to be, materially affected by depressed asset valuations resulting from poor market conditions.
Financial markets continue to be subject to significant stress conditions, where steep falls in perceived or actual asset values have been accompanied by a severe reduction in market liquidity, as exemplified by recent events affecting asset-backed collateralised debt obligations, residential mortgage-backed securities and the leveraged loan market. In dislocated markets, hedging and other risk management strategies have proven not to be as effective as they are in normal market conditions due in part to the decreasing credit quality of hedge counterparties, including monoline and other insurance companies and credit derivative product companies. Severe market events have resulted in the Group recording large write-downs on its credit market exposures in recent years. Any deterioration in economic and financial market conditions could lead to further impairment charges and write-downs. Moreover, market volatility and illiquidity (and the assumptions, judgements and estimates in relation to such matters that may change over time and may ultimately not turn out to be accurate) make it difficult to value certain of the Group’s exposures. Valuations in future periods, reflecting, among other things, then-prevailing market conditions and changes in the credit ratings of certain of the Group’s assets, may result in significant changes in the fair values of the Group’s exposures, even in respect of exposures, such as credit market exposures, for which the Group has previously recorded write-downs. In addition, the value ultimately realised by the Group may be materially different from the current or estimated fair value. Any of these factors could require the Group to recognise further significant write-downs in addition to those already recorded or realised or realise increased impairment charges, which may have a material adverse effect on its financial condition and its results of operations or result in a loss of value in the Securities.
Further information about the write-downs which the Group has incurred and the assets it has reclassified can be found in the Risk and balance sheet management section of the Business review.
The value or effectiveness of any credit protection that the Group has purchased from monoline and other insurers and other market counterparties (including credit derivative product companies) depends on the value of the underlying assets and the financial condition of the insurers and such counterparties.
The Group has credit exposure arising from over-the-counter derivative contracts, mainly credit default swaps (“CDSs”), which are carried at fair value. The fair value of these CDSs, as well as the Group’s exposure to the risk of default by the underlying counterparties, depends on the valuation and the perceived credit risk of the instrument against which protection has been bought. Since 2007, monoline and other insurers and other market counterparties (including credit derivative product companies) have been adversely affected by their exposure to residential mortgage linked and corporate credit products, whether synthetic or otherwise, and their actual and perceived creditworthiness has deteriorated rapidly, which may continue. If the financial condition of these counterparties or their actual or perceived creditworthiness deteriorates further, the Group may record further credit valuation adjustments on the credit protection bought from these counterparties under the CDSs in addition to those already recorded and such adjustments may have a material adverse impact on the Group’s financial condition and results of operations.
Additional information continued | Additional information |
Changes in interest rates, foreign exchange rates, credit spreads, bond, equity and commodity prices, basis, volatility and correlation risks and other market factors have significantly affected and will continue to affect the Group’s business and results of operations.
Some of the most significant market risks the Group faces are interest rate, foreign exchange, credit spread, bond, equity and commodity price and basis, volatility and correlation risks. Changes in interest rate levels, yield curves and spreads may affect the interest rate margin realised between lending and borrowing costs, the effect of which may be heightened during periods of liquidity stress, such as those experienced in recent years. Changes in currency rates, particularly in the sterling-US dollar and sterling-euro exchange rates, affect the value of assets, liabilities, income and expenses denominated in foreign currencies and the reported earnings of the company’s non-UK subsidiaries (principally Citizens Financial Group, Inc. (“Citizens”), The Royal Bank of Scotland N.V. (which was renamed from “ABN AMRO Bank N.V.” on 6 February 2010) (“RBS N.V.”) and RBS Securities Inc.) and may affect income from foreign exchange dealing. The company prepares its consolidated financial statements in sterling. Fluctuations in the exchange rates used to translate other currencies into sterling affect the company’s reported consolidated financial condition, results of operations and cash flows from year to year and those of the Group’s operations whose functional currency is not sterling.
The performance of financial markets may affect bond, equity and commodity prices and, therefore, cause changes in the value of the Group’s investment and trading portfolios. This has been the case during the period since August 2007, with market disruptions and volatility resulting in significant variations in the value of such portfolios. As part of its ongoing derivatives operations, the Group also faces significant basis, volatility and correlation risks for which materialisation is highly dependent on relative changes in the first order risks referred to above. While the Group has implemented risk management methods to mitigate and control these and other market risks to which it is exposed, it is difficult, particularly in the current environment, to predict with accuracy changes in economic or market conditions and to anticipate the effects that such changes could have on the Group’s financial performance and business operations.
The Group’s borrowing costs, its access to the debt capital markets and its liquidity depend significantly on its and the UK Government’s credit ratings.
The company, the Royal Bank and other Group members have been subject to a number of credit rating downgrades in the recent past. Any future reductions in the long-term or short-term credit ratings of the company or one of its principal subsidiaries (particularly the Royal Bank) would further increase its borrowing costs, require the Group to replace funding lost due to the downgrade, which may include the loss of customer deposits, and may also limit the Group’s access to capital and money markets and trigger additional collateral requirements in derivatives contracts and other secured funding arrangements. Furthermore, given the extent of the UK Government ownership and support provided to the Group through HM Treasury’s guarantee scheme (announced by the UK Government on 8 October 2008) (the “Credit Guarantee Scheme”), any downgrade in the UK Government’s credit ratings could materially adversely affect the credit ratings of Group companies and may have the effects noted above. Standard & Poor’s Credit Market Services Europe Limited reaffirmed the UK Government’s “AAA” rating with stable outlook on 26 October 2010 and Moody’s Investors Service Limited reaffirmed the UK Government’s “Aaa” rating on 7 May 2010. Fitch Ratings Limited reaffirmed the UK Government’s “AAA” rating with stable outlook on 31 July 2009 and Moody’s Investors Service Limited reiterated the UK Government’s stable outlook on 23 June 2010. Credit ratings of RBS N.V., Ulster Bank and Citizens are also important to the Group when competing in certain markets, such as over-the-counter derivatives. As a result, any further reductions in the company’s long-term or short-term credit ratings or those of its principal subsidiaries could adversely affect the Group’s access to liquidity and competitive position, increase its funding costs and have a material adverse impact on the Group’s earnings, cash flow and financial condition or result in a loss of value in the Securities.
The Group’s business performance could be adversely affected if its capital is not managed effectively or as a result of changes to capital adequacy and liquidity requirements.
Effective management of the Group’s capital is critical to its ability to operate its businesses, to grow organically and to pursue its strategy of returning to standalone strength. The Group is required by regulators in the UK, the US and other jurisdictions in which it undertakes regulated activities, to maintain adequate capital resources. The maintenance of adequate capital is also necessary for the Group’s financial flexibility in the face of continuing turbulence and uncertainty in the global economy. Accordingly, the purpose of the issuance of the £25.5 billion of B shares, the grant of the Contingent Subscription and the previous placing and open offers was to allow the Group to strengthen its capital position. The FSA’s liquidity policy statement issued in October 2009 states that UK regulated firms must hold sufficient eligible securities to survive a liquidity stress and that liquidity policy statement, together with the developments described below, has resulted in the Group holding a greater amount of government securities to ensure that it has adequate liquidity in times of financial stress.
On 17 December 2009, the Basel Committee on Banking Supervision (the “Basel Committee”) proposed a number of fundamental reforms to the regulatory capital framework in its consultative document entitled “Strengthening the resilience of the banking sector”. On 12 September 2010, the Group of Governors and Heads of Supervision, the oversight body of the Basel Committee, announced further details of the proposed substantial strengthening of existing capital requirements, and the reforms were endorsed by the G-20 leaders after the G-20 Summit in Seoul in November 2010. On 16 December 2010, the Basel Committee published the Basel III rules in documents entitled “Basel III: A global regulatory framework for more resilient banks and banking systems” (containing the reforms relating to capital) and “Basel III: International framework for liquidity risk measurement, standards and monitoring” (containing the reforms relating to liquidity).
Additional information continued | Additional information |
Risk factors continued
The Basel Committee's package of reforms includes increasing the minimum common equity requirement from 2% (before the application of regulatory adjustments) to 4.5% (after the application of stricter regulatory adjustments). The total Tier 1 capital requirement, which includes common equity and other qualifying financial instruments, will increase from 4% to 6%. The total capital requirement (which comprises Tier 1 capital and Tier 2 capital) remains at 8%. In addition, banks will be required to maintain, in the form of common equity (after the application of deductions), a capital conservation buffer of 2.5% to withstand future periods of stress, bringing the total common equity requirements to 7%. If there is excess credit growth in any given country resulting in a system-wide build up of risk, a countercyclical buffer within a range of 0% to 2.5% of common equity (or possibly other fully loss absorbing capital) is to be applied as an extension of the conservation buffer. In addition, a leverage ratio will be introduced, together with a liquidity coverage ratio and a net stable funding ratio. The liquidity coverage ratio is intended to promote resilience to potential liquidity stress scenarios lasting for a 30-day period. The net stable funding ratio is intended to limit over reliance on short-term wholesale funding and has been developed to provide a sustainable maturity structure of assets and liabilities. The Basel Committee is conducting further work on systemically important financial institutions and contingent capital in close coordination with the Financial Stability Board. The Basel Committee has stated that measures may include capital surcharges, contingent capital and bail-in debt (which could be introduced by statute, possibly impacting existing as well as future issues of debt and exposing them to the risk of conversion into equity and/or write-down of principal amount). Such measures would be in addition to proposals for the write-off of Tier 1 and Tier 2 debt (and its possible conversion into ordinary shares) if a bank becomes non-viable.
The Basel Committee is expected to complete by early to mid 2011 a methodology for identifying global systemically important financial institutions with a view to the Financial Stability Board and national authorities determining by mid-2011 those institutions to which the recommendations for global systemically important financial institutions will initially apply. In addition, by mid-2011, the Basel Committee is to complete a study of how much additional loss absorbency capacity global systemically important financial institutions should have and how much of such capacity could be provided by the various proposed instruments (which include contingent capital securities and bail-in debt).
The implementation of the Basel III reforms will begin on 1 January 2013, however the requirements are subject to a series of transitional arrangements and will be phased in over a period of time, to be fully effective by 2019.
To the extent the Group has estimated the indicative impact that Basel III reforms may have on its RWAs and capital ratios, such estimates are preliminary and subject to uncertainties and may change. In particular, the estimates assume mitigating actions will be taken by the Group (such as deleveraging of legacy positions and securitisations, including Non-Core, as well as other actions being taken to derisk market and counterparty exposures), which may not occur as anticipated, in a timely manner, or at all.
The Basel Committee changes and other future changes to capital adequacy and liquidity requirements in the UK and in other jurisdictions in which it operates, including the European Commission’s public consultation on further possible changes to the Capital Requirements Directive launched in February 2010, may require the Group to raise additional Tier 1 (including Core Tier 1) and Tier 2 capital by way of further issuances of securities, including in the form of ordinary shares or B shares and will result in existing Tier 1 and Tier 2 securities issued by the Group ceasing to count towards the Group’s regulatory capital, either at the same level as present or at all. The requirement to raise additional Core Tier 1 capital could have a number of negative consequences for the company and its shareholders, including impairing the company’s ability to pay dividends on or make other distributions in respect of ordinary shares and diluting the ownership of existing shareholders of the company. If the Group is unable to raise the requisite Tier 1 and Tier 2 capital, it may be required to further reduce the amount of its risk-weighted assets and engage in the disposal of core and other Non-Core businesses, which may not occur on a timely basis or achieve prices which would otherwise be attractive to the Group. In addition, pursuant to the State Aid approval, should the Group’s Core Tier 1 capital ratio decline to below 5 per cent. at any time before 31 December 2014, or should the Group fall short of its funded balance sheet target level (after adjustments) for 31 December 2013 by £30 billion or more, the Group will be required to reduce its risk-weighted assets by a further £60 billion in excess of its plan through further disposals of identifiable businesses and their associated assets. As provided in the Acquisition and Contingent Capital Agreement (as defined below), the Group will also be subject to restrictions on payments on its hybrid capital instruments should its Core Tier 1 ratio fall below 6 per cent. or if it would fall below 6 per cent. as a result of such payment.
As at 31 December 2010, the Group’s Tier 1 and Core Tier 1 capital ratios were 12.9 per cent and 10.7 per cent., respectively, calculated in accordance with FSA requirements. Any change that limits the Group’s ability to manage effectively its balance sheet and capital resources going forward (including, for example, reductions in profits and retained earnings as a result of write-downs or otherwise, increases in risk-weighted assets, delays in the disposal of certain assets or the inability to syndicate loans as a result of market conditions, a growth in unfunded pension exposures or otherwise) or to access funding sources, could have a material adverse impact on its financial condition and regulatory capital position or result in a loss of value in the securities.
Additional information continued | Additional information |
The value of certain financial instruments recorded at fair value is determined using financial models incorporating assumptions, judgements and estimates that may change over time or may ultimately not turn out to be accurate.
Under IFRS, the Group recognises at fair value: (i) financial instruments classified as “held-for-trading” or “designated as at fair value through profit or loss”; (ii) financial assets classified as “available-for-sale”; and (iii) derivatives. Generally, to establish the fair value of these instruments, the Group relies on quoted market prices or, where the market for a financial instrument is not sufficiently active, internal valuation models that utilise observable market data. In certain circumstances, the data for individual financial instruments or classes of financial instruments utilised by such valuation models may not be available or may become unavailable due to changes in market conditions, as has been the case during the recent financial crisis. In such circumstances, the Group’s internal valuation models require the Group to make assumptions, judgements and estimates to establish fair value. In common with other financial institutions, these internal valuation models are complex, and the assumptions, judgements and estimates the Group is required to make often relate to matters that are inherently uncertain, such as expected cash flows, the ability of borrowers to service debt, residential and commercial property price appreciation and depreciation, and relative levels of defaults and deficiencies. Such assumptions, judgements and estimates may need to be updated to reflect changing facts, trends and market conditions. The resulting change in the fair values of the financial instruments has had and could continue to have a material adverse effect on the Group’s earnings and financial condition.
Also, recent market volatility and illiquidity have challenged the factual bases of certain underlying assumptions and have made it difficult to value certain of the Group’s financial instruments. Valuations in future periods, reflecting prevailing market conditions, may result in further significant changes in the fair values of these instruments, which could have a material adverse effect on the Group’s results of operations and financial condition or result in a loss of value in the Securities.
The Group operates in markets that are highly competitive and consolidating. If the Group is unable to perform effectively, its business and results of operations will be adversely affected.
The consolidation that has taken place in recent years among banking institutions in the UK, the US and throughout Europe continues to change the competitive landscape for banks and other financial institutions. If financial markets continue to be volatile, more banks may be forced to consolidate. This consolidation, in combination with the introduction of new entrants into the US and UK markets from other European and Asian countries, could increase competitive pressures on the Group.
In addition, certain competitors may have access to lower cost funding and/or be able to attract retail deposits on more favourable terms than the Group and may have stronger multi-channel and more efficient operations as a result of greater historical investments. Furthermore, the Group’s competitors may be better able to attract and retain clients and key employees, which may have a negative impact on the Group’s relative performance and future prospects.
Furthermore, increased government ownership of, and involvement in, banks generally may have an impact on the competitive landscape in the major markets in which the Group operates. The effects of the substantial government shareholding and involvement in the banks may differ from jurisdiction to jurisdiction, and such involvement may cause the Group to experience stronger competition for corporate, institutional and retail clients and greater pressure on profit margins. Future disposals and restructurings by the Group and the compensation structure and restrictions imposed on the Group may also have an impact on its ability to compete effectively. Since the markets in which the Group operates are expected to remain highly competitive in all areas, these and other changes to the competitive landscape could adversely affect the Group’s business, margins, profitability, financial condition and prospects or result in a loss of value in the Securities.
Additional information continued | Additional information |
Risk factors continued
The Group could fail to attract or retain senior management, which may include members of the Board, or other key employees, and it may suffer if it does not maintain good employee relations.
The Group’s ability to implement its strategy depends on the ability and experience of its senior management, which may include directors, and other key employees. The loss of the services of certain key employees, particularly to competitors, could have an adverse impact on the Group’s business. The Group’s future success will also depend on its ability to attract, retain and remunerate highly skilled and qualified personnel competitively with its peers. This cannot be guaranteed, particularly in light of heightened regulatory oversight of banks and heightened scrutiny of, and (in some cases) restrictions placed upon, management and employee compensation arrangements, in particular those in receipt of Government funding (such as the Group). In connection with its accession to the APS, the Group agreed with HM Treasury that it will be at the leading edge of implementing the G-20 principles and to consult with UK Financial Investments Limited (“UKFI”) in connection with the Group’s remuneration policy and the Group made a commitment to HM Treasury to comply with the FSA Remuneration Code which came into force on 1 January 2010. On 1 January 2011, a revised FSA Remuneration Code came into effect to implement the requirements of the Capital Requirements Directive III. In addition, as a result of its accession to the APS, the Group also has reached agreement with HM Treasury in relation to remuneration arrangements for the executive directors of the Group and certain employees involved in the APS, including approval rights for the Asset Protection Agency on annual APS-related performance targets. The deferral and claw-back provisions implemented by the Group may impair the ability of the Group to attract and retain suitably qualified personnel in various parts of the Group’s businesses.
In recent years, the Group has altered certain of the pension benefits it offers to staff and some employees continue to participate in defined benefit arrangements. The following two changes have been made to the main defined benefit pension plans: (i) a yearly limit on the amount of any salary increase that will count for pension purposes; and (ii) a reduction in the severance lump sum for those who take an immediate undiscounted pension for redundancy.
In addition to the effects of such measures on the Group’s ability to retain senior management and other key employees, the marketplace for skilled personnel is becoming more competitive, which means the cost of hiring, training and retaining skilled personnel may continue to increase. The failure to attract or retain a sufficient number of appropriately skilled personnel could place the Group at a significant competitive disadvantage and prevent the Group from successfully implementing its strategy, which could have a material adverse effect on the Group’s financial condition and results of operations or result in a loss of value in the Securities.
In addition, certain of the Group’s employees in the UK, continental Europe and other jurisdictions in which the Group operates are represented by employee representative bodies, including trade unions. Engagement with its employees and such bodies is important to the Group and a breakdown of these relationships could adversely affect the Group’s business, reputation and results. As the Group implements cost-saving initiatives and disposes of, or runs-down, certain assets or businesses (including as part of its restructuring plans), it faces increased risk in this regard and there can be no assurance that the Group will be able to maintain good relations with its employees or employee representative bodies in respect of all matters. As a result, the Group may experience strikes or other industrial action from time to time, which could have an adverse effect on its business and results of operations and could cause damage to its reputation.
Additional information continued | Additional information |
Each of the Group’s businesses is subject to substantial regulation and oversight. Significant regulatory developments could have an adverse effect on how the Group conducts its business and on its results of operations and financial condition.
The Group is subject to financial services laws, regulations, corporate governance requirements, administrative actions and policies in each jurisdiction in which it operates. All of these are subject to change, particularly in the current regulatory and market environment, where there have been unprecedented levels of government intervention, changes to the regulations governing financial institutions and reviews of the industry, including nationalisations or injections of government capital in the US, the UK and other European countries. In recent years, there has also been increasing focus in the UK, US and other jurisdictions in which the Group operates on compliance with anti-bribery, anti-money laundering, anti-terrorism and other similar sanctions regimes.
As a result of the environment in which the Group operates, increasing regulatory focus in certain areas and ongoing and possible future changes in the financial services regulatory landscape (including requirements imposed by virtue of the Group’s participation in government or regulator-led initiatives), the Group expects to face greater regulation and scrutiny in the UK, the US and other countries in which it operates.
Although it is difficult to predict with certainty the effect that recent regulatory developments and heightened levels of public and regulatory scrutiny will have on the Group, the enactment of legislation and regulations in the UK, the other parts of Europe in which the Group operates and the US (such as the bank levy in the UK or the Dodd-Frank Wall Street Reform and Consumer Protection Act in the US) is likely to result in increased capital and liquidity requirements and changes in regulatory requirements relating to the calculation of capital and liquidity metrics or other prudential rules relating to capital adequacy frameworks, and may result in an increased number of regulatory investigations and actions. Any of these developments could have an adverse impact on how the Group conducts its business, applicable authorisations and licences, the products and services it offers, its reputation, the value of its assets, its funding costs and its results of operations and financial condition or result in a loss of value in its securities.
Areas in which, and examples of where, governmental policies, regulatory changes and increased public and regulatory scrutiny could have an adverse impact on the Group include, but are not limited to:
| the monetary, fiscal, interest rate and other policies of central banks and other governmental or regulatory bodies; |
| requirements to separate retail banking from investment banking, and restrictions on proprietary trading and similar activities within a commercial bank and/or a group which contains a commercial bank; |
| government-imposed requirements with respect to lending to the UK SME market and larger commercial and corporate markets and residential mortgage lending; |
| requirements to operate in a way that prioritises objectives other than shareholder value creation; |
| changes to financial reporting standards (including accounting standards), corporate governance requirements, corporate structures and conduct of business rules; |
| the imposition of restrictions on the Group’s ability to compensate its senior management and other employees; |
| regulations relating to, and enforcement of, anti-bribery, anti-money laundering, anti-terrorism or other similar sanctions regimes; |
| rules relating to foreign ownership, expropriation, nationalisation and confiscation of assets; |
| Financial calendarother requirements or policies affecting the Group’s profitability, such as the imposition of onerous compliance obligations, further restrictions on business growth or pricing, and the introduction of, and changes to, levies, fees or taxes applicable to the Group’s operations (such as the imposition of financial activities taxes and changes in tax rates that reduce the value of deferred tax assets); and |
274 | other unfavourable political, military or diplomatic developments producing social instability or legal uncertainty which, in turn, may affect demand for the Group’s products and services. |
For further information about certain investigations, supervisory matters and litigation matters to which the Group is subject, please refer to Note 34 to the Group’s financial statements.
The Group is and may be subject to litigation and regulatory investigations that may impact its business.
The Group’s operations are diverse and complex, and it operates in legal and regulatory environments that expose it to potentially significant litigation, regulatory investigation and other regulatory risk. As a result, the Group is, and may in the future be, involved in various disputes, legal proceedings and regulatory investigations in the UK, the EU, the US and other jurisdictions, including class action litigation, anti-money laundering charges and sanctions, compliance investigations and review by the European Commission under State Aid rules. Furthermore, the Group, like many other financial institutions, has come under greater regulatory scrutiny in recent years and expects that environment to continue for the foreseeable future, particularly as it relates to compliance with new and existing corporate governance, employee compensation, conduct of business, anti-money laundering and anti-terrorism laws and regulations, as well as the provisions of applicable sanctions programmes. Disputes, legal proceedings and regulatory investigations are subject to many uncertainties, and their outcomes are often difficult to predict, particularly in the early stages of a case or investigation. Adverse regulatory action or adverse judgments in litigation could result in restrictions or limitations on the Group’s operations or have a significant effect on the Group’s reputation or results of operations or result in a loss of value in the Securities.
Risk factors continued
The Group’s results have been and could be further materially adversely affected in the event of goodwill impairment.
The Group capitalises goodwill, which is calculated as the excess of the cost of an acquisition over the net fair value of the identifiable assets, liabilities and contingent liabilities acquired. Acquired goodwill is recognised initially at cost and subsequently at cost less any accumulated impairment losses. As required by IFRS, the Group tests goodwill for impairment annually or more frequently, at external reporting dates, when events or circumstances indicate that it might be impaired. An impairment test involves comparing the recoverable amount (the higher of the value in use and fair value less cost to sell) of an individual cash generating unit with its carrying value. The value in use and fair value of the Group’s cash generating units are affected by market conditions and the performance of the economies in which the Group operates. Where the Group is required to recognise a goodwill impairment, it is recorded in the Group’s income statement, although it has no effect on the Group’s regulatory capital position. For the year ended 31 December 2008, the Group recorded a £32.6 billion accounting write-down of goodwill and other intangibles principally relating to RBS Holdings N.V. (formerly ABN AMRO Holding N.V.) and NatWest goodwill allocated to non-core businesses. The Group recorded a write down of goodwill and other intangibles of £363 million for the year ended 31 December 2009 and £10 million for the year ended 31 December 2010.
The Group may be required to make further contributions to its pension schemes if the value of pension fund assets is not sufficient to cover potential obligations.
The Group maintains a number of defined benefit pension schemes for past and a number of current employees. Pensions risk is the risk that the assets of the Group’s various defined benefit pension schemes which are long term in nature do not fully match the timing and amount of the schemes’ liabilities as a result of which the Group is required or chooses to make additional contributions to the schemes. Pension scheme liabilities vary with changes to long-term interest rates, inflation, pensionable salaries and the longevity of scheme members as well as changes in applicable legislation. The scheme’s assets comprise investment portfolios that are held to meet projected liabilities to the scheme members. Risk arises from the schemes because the value of these asset portfolios’ returns from them and any additional future contributions to the schemes may be less than expected and because there may be greater than expected increases in the estimated value of the schemes’ liabilities. In these circumstances, the Group could be obliged, or may choose, to make additional contributions to the schemes, and during recent periods, the Group has voluntarily made such contributions to the schemes. Given the recent economic and financial market difficulties and the prospect that they may continue over the near and medium term, the Group may experience increasing pension deficits or be required or elect to make further contributions to its pension schemes and such deficits and contributions could be significant and have an adverse impact on the Group’s results of operations or financial condition or result in a loss of value in the Securities. A funding valuation of the Group’s major defined benefit pension plan, The Royal Bank of Scotland Group Pension Fund is currently being carried out with an effective date of 31 March 2010.
Operational risks are inherent in the Group’s operations.
The Group’s operations are dependent on the ability to process a very large number of transactions efficiently and accurately while complying with applicable laws and regulations where it does business. The Group has complex and geographically diverse operations and operational risk and losses can result from internal and external fraud, errors by employees or third parties, failure to document transactions properly or to obtain proper authorisation, failure to comply with applicable regulatory requirements and conduct of business rules (including those arising out of anti-bribery, anti-money laundering and anti-terrorism legislation, as well as the provisions of applicable sanctions programmes), equipment failures, business continuity and data security system failures, natural disasters or the inadequacy or failure of systems and controls, including those of the Group’s suppliers or counterparties. Although the Group has implemented risk controls and loss mitigation actions, and substantial resources are devoted to developing efficient procedures, to identify and rectify weaknesses in existing procedures and to train staff, it is not possible to be certain that such actions have been or will be effective in controlling each of the operational risks faced by the Group. Any weakness in these systems or controls, or any breaches or alleged breaches of such laws or regulations, could result in increased regulatory supervision, enforcement actions and other disciplinary action, and have an adverse impact on the Group’s business, applicable authorisations and licences, reputation, results of operations and the price of its securities. Notwithstanding anything contained in this risk factor, it should not be taken as implying that the company will be unable to comply with its obligations as a company with securities admitted to the Official List of the UK Listing Authority (the “Official List”) nor that it, or its relevant subsidiaries, will be unable to comply with its or their obligations as supervised firms regulated by the FSA.
The Group is exposed to the risk of changes in tax legislation and its interpretation and to increases in the rate of corporate and other taxes in the jurisdictions in which it operates.
The Group’s activities are subject to tax at various rates around the world computed in accordance with local legislation and practice. Action by governments to increase tax rates or to impose additional taxes or to restrict the tax reliefs currently available to the Group would reduce the Group’s profitability. Revisions to tax legislation or to its interpretation might also affect the Group’s results in the future. From January 2011, the UK Government increased the standard rate of value added tax from 17.5 per cent. to 20 per cent. and on 1 January 2011, the UK Government introduced the banking levy. These changes, together with any future changes, such as the possible introduction of a financial activities tax, could reduce the Group’s profitability.
Additional information continued | Additional information |
HM Treasury (or UKFI on its behalf) may be able to exercise a significant degree of influence over the Group.
UKFI manages HM Treasury’s shareholder relationship with the company. Although HM Treasury has indicated that it intends to respect the commercial decisions of the Group and that the Group will continue to have its own independent board of directors and management team determining its own strategy, should its current intentions change, HM Treasury's position as a majority shareholder (and UKFI’s position as manager of this shareholding) means that HM Treasury or UKFI may be able to exercise a significant degree of influence over, among other things, the election of directors and the appointment of senior management. In addition, as the provider of the APS, HM Treasury has a range of rights that other shareholders do not have. These include rights under the terms of the APS over the Group's remuneration policy and practice. The manner in which HM Treasury or UKFI exercises HM Treasury’s rights as majority shareholder or in which HM Treasury exercises its rights under the APS could give rise to conflict between the interests of HM Treasury and the interests of other shareholders. The Board has a duty to promote the success of the company for the benefit of its members as a whole.
The offer or sale by the UK Government of all or a portion of its stake in the company could affect the market price of the Securities and related securities.
The UK Government currently holds approximately 68 per cent. of the issued ordinary share capital of the company. On 22 December 2009, the company issued £25.5 billion of B shares to the UK Government. The B shares are convertible, at the option of the holder at any time, into ordinary shares. The UK Government has agreed that it shall not exercise the rights of conversion in respect of the B shares if and to the extent that following any such conversion it would hold more than 75 per cent. of the total issued shares in the company. The UK Government may sell all or a part of the ordinary shares that it owns at any time. Offers or sales by the UK Government of a substantial number of ordinary shares or securities convertible or exchangeable into ordinary shares, or an expectation that it may undertake such an offer or sale, could affect prevailing market prices for the Securities and related securities.
The Group’s insurance businesses are subject to inherent risks involving claims.
Future claims in the Group’s insurance business may be higher than expected as a result of changing trends in claims experience resulting from catastrophic weather conditions, demographic developments, changes in the nature and seriousness of claims made, changes in mortality, changes in the legal and compensatory landscape and other causes outside the Group’s control. These trends could affect the profitability of current and future insurance products and services. The Group reinsures some of the risks it has assumed and is accordingly exposed to the risk of loss should its reinsurers become unable or unwilling to pay claims made by the Group against them.
The Group’s operations have inherent reputational risk.
Reputational risk, meaning the risk to earnings and capital from negative public opinion, is inherent in the Group’s business. Negative public opinion can result from the actual or perceived manner in which the Group conducts its business activities, from the Group’s financial performance, from the level of direct and indirect government support or from actual or perceived practices in the banking and financial industry. Negative public opinion may adversely affect the Group’s ability to keep and attract customers and, in particular, corporate and retail depositors. The Group cannot ensure that it will be successful in avoiding damage to its business from reputational risk.
In the UK and in other jurisdictions, the Group is responsible for contributing to compensation schemes in respect of banks and other authorised financial services firms that are unable to meet their obligations to customers.
In the UK, the Financial Services Compensation Scheme (the “Compensation Scheme”) was established under the FSMA and is the UK’s statutory fund of last resort for customers of authorised financial services firms. The Compensation Scheme can pay compensation to customers if a firm is unable, or likely to be unable, to pay claims against it and may be required to make payments either in connection with the exercise of a stabilisation power or in exercise of the bank insolvency procedures under the Banking Act. The Compensation Scheme is funded by levies on firms authorised by the FSA, including the Group. In the event that the Compensation Scheme raises funds from the authorised firms, raises those funds more frequently or significantly increases the levies to be paid by such firms, the associated costs to the Group may have an adverse impact on its results of operations and financial condition. As at 31 December 2010, the Group had accrued £144.4 million for its share of Compensation Scheme management expenses levies for the 2010/2011 and 2011/2012 Compensation Scheme years.
In addition, to the extent that other jurisdictions where the Group operates have introduced or plan to introduce similar compensation, contributory or reimbursement schemes (such as in the United States with the Federal Deposit Insurance Corporation), the Group may make further provisions and may incur additional costs and liabilities, which may have an adverse impact on its financial condition and results of operations or result in a loss of value in the Securities.
The Group’s business and earnings may be adversely affected by geopolitical conditions.
The performance of the Group is significantly influenced by the geopolitical and economic conditions prevailing at any given time in the countries in which it operates, particularly the UK, the US and other countries in Europe and Asia. For example, the Group has a presence in countries where businesses could be exposed to the risk of business interruption and economic slowdown following the outbreak of a pandemic, or the risk of sovereign default following the assumption by governments of the obligations of private sector institutions. Similarly, the Group faces the heightened risk of trade barriers, exchange controls and other measures taken by sovereign governments which may impact a borrower’s ability to repay. Terrorist acts and threats and the response to them of governments in any of these countries could also adversely affect levels of economic activity and have an adverse effect upon the Group’s business.
Additional information continued | Additional information |
Risk factors continued
The restructuring plan for RBS Holdings N.V. is complex and may not realise the anticipated benefits for the Group.
In 2007, the Group acquired an interest, through RFS Holdings B.V., in ABN AMRO Holding N.V. (which was renamed RBS Holdings N.V. on 1 April 2010). The restructuring plan in place for the integration and separation of ABN AMRO Holding N.V. into and among the businesses and operations of the Consortium Members (RBSG, the Dutch State and Santander) is complex, involving substantial reorganisation of RBS Holdings N.V.’s operations and legal structure. The restructuring plan is being implemented and significant elements have been completed within the planned timescales and the integration of the Group’s businesses continues.
As part of this reorganisation, on 6 February 2010, the majority of the businesses of RBS Holdings N.V. acquired by the Dutch State were legally demerged from the RBS Holdings N.V. businesses acquired by the Group and were transferred into a newly established company, ABN AMRO Bank N.V. (formerly named ABN AMRO II N.V.). This company was transferred to ABN AMRO Group N.V., a company wholly owned by the Dutch State, on 1 April 2010. Certain assets and liabilities of RBS Holdings N.V. acquired by the Dutch State were not part of the transfer which occurred on 1 April 2010 and remain within ABN AMRO Bank N.V. (now The Royal Bank of Scotland N.V.). These will be transferred to the Dutch State as soon as possible. In addition, certain assets within RBS N.V. continue to be under shared ownership by the Consortium Members.
On 31 December 2010, the share capital of RFS Holdings B.V. was amended, such that approximately 98 per cent. of RFS Holdings B.V.’s issued share capital is now held by RBSG, with the remainder being held by Santander and the Dutch State. Ultimately it is expected that RFS Holdings B.V. will become a wholly-owned subsidiary of the company.
As the Group does not currently own 100 per cent. of RFS Holdings B.V. and as certain of the assets of RFS Holdings B.V. are owned indirectly by the Dutch State and Banco Santander S.A. (“Santander”), the Group may experience delays in implementing the planned integration of the businesses of RFS Holdings B.V. which are owned by the Group and such integration may place a strain on management, employee, operational and financial resources. Any such delays may also restrict the ability of the Group to realise the expected benefits of the acquisition. In addition, the Group may not realise the benefits of the acquisition or the restructuring when expected or to the extent projected. Any of these events may have an adverse impact on the Group’s financial condition and results of operations.
The recoverability and regulatory capital treatment of certain deferred tax assets recognised by the Group depends on the Group's ability to generate sufficient future taxable profits and there being no adverse changes to tax legislation, regulatory requirements or accounting standards.
In accordance with IFRS, the Group has recognised deferred tax assets on losses available to relieve future profits from tax only to the extent that it is probable that they will be recovered. The deferred tax assets are quantified on the basis of current tax legislation and accounting standards and are subject to change in respect of the future rates of tax or the rules for computing taxable profits and allowable losses. Failure to generate sufficient future taxable profits or changes in tax legislation or accounting standards may reduce the recoverable amount of the recognised deferred tax assets. In April 2011, the UK Government will commence a staged reduction in the rate of UK corporation tax from 28 per cent. to 23 per cent. over a four-year period. Such a change in the applicable tax rate would reduce the recoverable amount of the recognised deferred tax assets.
There is currently no restriction in respect of deferred tax assets recognised by the Group for regulatory purposes. Changes in regulatory capital rules may restrict the amount of deferred tax assets that can be recognised and such changes could lead to a reduction in the Group’s Core Tier 1 capital ratio. In particular, on 16 December 2010, the Basel Committee published the Basel III rules setting out certain changes to capital requirements (see the risk factor above headed “The Group’s business performance could be adversely affected if its capital is not managed effectively or as a result of changes to capital adequacy and liquidity requirements”). Those rules include a requirement that deferred tax assets which rely on future profitability of the Group to be realised may only receive limited recognition when calculating the common equity component of Tier 1 which therefore limits the amount of deferred tax assets which can count towards that component of Tier 1 capital. The implementation of the Basel III reforms will begin on 1 January 2013, however the restrictions on recognition of deferred tax assets within the common equity component of Tier 1 are subject to a phased-in deduction starting on 1 January 2014, to be fully effective by 1 January 2018.
The Group’s participation in the APS is costly and may not produce the benefits expected and the occurrence of associated risks may have a material adverse impact on the Group’s business, capital position, financial condition and results of operations.
On 22 December 2009, the Group acceded to the APS with HM Treasury acting on behalf of the United Kingdom Government. Under the APS, the Group purchased credit protection over a portfolio of specified assets and exposures of RBS and certain members of the Group from HM Treasury in return for an annual fee. If losses on assets covered by the APS exceed £60 billion (net of recoveries), HM Treasury will bear 90 per cent. of further losses. In the event of a further severe or prolonged economic downturn, which could result in extreme credit losses on the Group’s asset portfolio, the APS provides additional protection to the Group’s capital ratios and financial position.
The APS is a unique form of credit protection over a complex range of diversified assets and exposures (the “Covered Assets”) in a number of jurisdictions. Owing to the complexity, scale and unique nature of the APS and the uncertainty resulting from the recent economic recession, there may be unforeseen issues and risks that are relevant in the context of the Group’s participation in the APS and in the impact of the APS on the Group’s business, operations and financial condition. Such issues or risks may have a material adverse effect on the Group.
Moreover, the Group’s choice of assets or exposures to be covered by the APS was based on certain predictions and assumptions at the time of its accession to the APS. There is therefore a risk that the Covered Assets will not be those with the greatest future losses or with the greatest need for protection and the Group’s financial condition, income from operations and the value of any Securities may still suffer due to further impairments and credit write-downs.
Additional information continued | Additional information |
Notwithstanding the Group’s participation in the APS and the issue of the £25.5 billion of B Shares and, if required, the issue of the £8 billion of Contingent B Shares, the Group remains exposed to a substantial first loss amount of £60 billion (net of recoveries) in respect of the Covered Assets and for 10 per cent. of Covered Assets losses after the first loss amount. There is therefore no assurance that the Group’s participation in the APS and the issue of B Shares and, if required, the Contingent B Shares will achieve the Group’s goals of improving and maintaining the Group’s capital ratios in the event of further losses and improving market confidence in the Group. Moreover, the Group continues to carry the risk of losses, impairments and write-downs with respect to assets not covered by the APS.
Therefore, there can be no assurance that any regulatory capital benefits and the additional Core Tier 1 capital will be sufficient to maintain the Group’s capital ratios at the requisite levels in the event of further losses. If the Group is unable to improve its capital ratios sufficiently or to maintain its capital ratios in the event of further losses, its business, results of operations and financial condition will suffer, its credit ratings may fall, its ability to lend and access funding will be further limited and its cost of funding may increase. The occurrence of any or all of such events may cause the price of the Securities to decline substantially and may result in intervention by the Authorities, which could include full nationalisation or other resolution procedures under the Banking Act. In that case, any compensation payable to holders of the Securities would be subject to the provisions of the Banking Act and investors may receive no value for their Securities.
If the Group is unable to issue the Contingent B Shares to HM Treasury, it may have a material adverse impact on the Group’s capital position, liquidity, operating results and future prospects.
In the event that the Group’s Core Tier 1 capital ratio declines to below 5 per cent., HM Treasury is committed to subscribe for up to an additional £8 billion of Contingent B Shares if certain conditions are met. If such conditions are not met and are not waived by HM Treasury, and RBSG is unable to issue the Contingent B Shares, the Group will be required to find alternative methods for achieving the requisite capital ratios. Such methods could include an accelerated reduction in risk-weighted assets, disposals of certain businesses, increased issuance of Tier 1 capital securities, increased reliance on alternative government-supported liquidity schemes and other forms of government assistance. There can be no assurance that any of these alternative methods will be available or would be successful in increasing the Group’s capital ratios to the desired or requisite levels. If RBSG is unable to issue the Contingent B Shares, the Group’s business, results of operations, financial condition and capital position and ratios will suffer, its credit ratings may drop, its ability to lend and access funding will be further limited and its cost of funding may increase. The occurrence of any or all of such events may cause the price of the Securities to decline substantially and may result in intervention by the Authorities or other regulatory bodies in the other jurisdictions in which the Group operates, which could include full nationalisation, other resolution procedures under the Banking Act or revocation of permits and licences necessary to conduct the Group’s businesses. Any compensation payable to holders of Securities would be subject to the provisions of the Banking Act, and investors may receive no value for their Securities.
There are limits on APS coverage and uncovered exposures and risks may have a material adverse impact on the Group’s business, financial condition, capital position, liquidity and results of operations.
As a result of the significant volume, variety and complexity of assets and exposures and the resulting complexity of the APS documents, there is a risk that the Group may have included assets or exposures within the Covered Assets which are, or may later become, ineligible for protection under the APS, which would reduce the anticipated benefits to the Group of the APS. Further, there is no ability to nominate additional or alternative assets or exposures in place of any which may turn out not to be covered under the APS.
Protection under the APS may be limited or may cease to be available where (i) Covered Assets are not correctly or sufficiently logged or described, (ii) a Covered Asset is disposed of (in whole or in part) prior to a trigger event, (iii) the terms of the APS do not apply or are uncertain in their application, (iv) the terms of the protection itself potentially give rise to legal uncertainty, (v) certain criminal conduct has or may have occurred in respect of Covered Assets, (vi) a breach of bank secrecy, confidentiality, data protection or similar laws has occurred or may occur, (vii) certain of the extensive governance, asset management, audit and reporting obligations under the UK Asset Protection Scheme Terms and Conditions (the “Scheme Conditions”) are not complied with, (viii) the Group does not comply with the instructions of a step-in manager appointed by HM Treasury or (ix) HM Treasury seeks to appoint a step-in manager in respect of Covered Assets held within the RBS Holdings N.V. group (or in certain other jurisdictions) and it is not possible to obtain consent from the Dutch Central Bank (if required) to such step-in.
Additional information continued | Additional information |
Risk factors continued
The Group is subject to limitations on actions it can take in respect of the Covered Assets and certain related assets and to extensive governance, asset management, audit and reporting obligations under the Scheme Conditions. The Group’s compliance with the Scheme Conditions is dependent on its ability to (i) implement efficiently and accurately approval processes and reporting, governance and management systems in accordance with the Scheme Conditions and (ii) comply with applicable laws and regulations where it does business. Since the Group’s operational systems were not originally designed to facilitate compliance with these extensive continuing obligations, there is a risk that the Group will fail to comply with a number of these obligations. Where the Group is in breach of its continuing obligations under the Scheme Conditions or otherwise unable to provide or verify information as required under the APS, recovery of losses under the APS may be adversely impacted, may lead to an indemnity claim and HM Treasury may in addition have the right to exercise certain step-in rights, including the right to require the Group to appoint a step-in manager who may exercise oversight, direct management rights and certain other rights. The occurrence of the risks or circumstances referred to above may impact the enforceability and/or level of protection available to the Group and may materially reduce the protection anticipated by the Group for its stressed losses, in which case its business, results of operations and financial condition will suffer, its credit ratings may drop, its ability to lend and access funding will be further limited and its cost of funding may increase. The occurrence of any or all of such events may cause the price of the Securities to decline substantially and may result in intervention by the Authorities, which could include full nationalisation or other resolution procedures under the Banking Act. Any compensation payable to holders of Securities would be subject to the provisions of the Banking Act, and investors may receive no value for their Securities.
The extensive governance, asset management and information requirements under the Scheme Conditions and any changes or modifications to the Scheme Conditions may have a negative impact on the expected benefits of the Scheme and may have an adverse impact on the Group.
There are extensive governance, asset management and information requirements under the Scheme Conditions in relation to the Covered Assets, other assets and the operations of the Group and HM Treasury also has the right to require the appointment of one or more step-in managers to exercise certain step-in rights in certain circumstances. The step-in rights are extensive and include certain oversight, investigation, approval and other rights, the right to require the modification or replacement of any of the systems, controls, processes and practices of the Group and extensive rights in relation to the direct management and administration of the Covered Assets. Additionally pursuant to the Accession Agreement, HM Treasury has the right to require RBS to appoint one or more Special Advisers (“SOC Special Advisers”) to exercise oversight functions over certain assets in the APS. On 18 June 2010, the Asset Protection Agency required that RBS appoint SOC Special Advisers in relation to certain assets and business areas in order to provide additional support to the Senior Oversight Committee of RBS and there have been four such appointments to date granting certain oversight rights in relation to certain specified assets. The obligations of the Group and the rights of HM Treasury may, individually or in the aggregate, impact the way the Group runs its business and may serve to limit the Group’s operations with the result that the Group’s business, results of operations and financial condition will suffer. In addition, the market’s reaction to such controls and limitations may have an adverse impact on the price of the Securities.
HM Treasury may, following consultation with the Group, modify or replace certain of the Scheme Conditions in such a manner as it considers necessary (acting reasonably) in certain circumstances. Such modifications or replacements may be retrospective and may result in (i) a loss of or reduction in the protection expected by the Group under the APS, (ii) an increase in the risk weightings of the Covered Assets, (iii) a material increase in the continuing reporting obligations or asset management conditions applicable to the Group under the Scheme Conditions, (iv) a material increase in the costs of the APS and/or (v) restrictions or limitations on the Group’s operations. The consequences of any such modifications by HM Treasury are impossible to quantify and are difficult to predict and may have a material adverse effect on the Group’s financial condition and results of operations.
Any changes to the expected regulatory capital treatment of the APS, the B Shares and the Contingent B Shares may negatively impact the Group’s capital position.
One of the key objectives of the APS and the issuance of £25.5 billion of B Shares and, if required, the £8 billion Contingent B Shares was to improve capital ratios at a consolidated level for the Group and at an individual level for certain relevant Group members. The Group has entered and may in the future enter into further back-to-back arrangements with Group members holding assets or exposures to be covered by the APS in order to ensure the capital ratios of these entities are also improved by virtue of the APS. There is a risk that the interpretation of the relevant regulatory capital requirements by one or more of the relevant regulatory authorities may differ from that assumed by the Group, with the result that the anticipated improvement to the Group’s capital ratios will not be fully achieved.
There is a further risk that, given that the current regulatory capital requirements and the regulatory bodies governing these requirements are subject to unprecedented levels of review and scrutiny both globally and locally, the regulatory capital treatment may differ from that assumed by the Group in respect of the APS, the treatment of the B Share issuance or the back-to-back arrangement may also occur. If participation in the APS and the issuance of £25.5 billion of B Shares and, if required, the £8 billion Contingent B Shares are not sufficient to maintain the Group’s capital ratios, this could cause the Group’s business, results of operations and financial condition to suffer, its credit ratings to drop, its ability to lend and access to funding to be further limited and its cost of funding to increase. The occurrence of any or all of such events may cause the price of the Securities to decline substantially and may result in intervention by the Authorities, which could include full nationalisation or other resolution procedures under the Banking Act. Any compensation payable to holders of Securities would be subject to the provisions of the Banking Act and investors may receive no value for their Securities.
Additional information continued | Additional information |
The costs of the APS may be greater than the benefits received.
The costs of participating in the APS incurred by the Group to HM Treasury include, among others, a fee of £700 million per annum, payable in advance for each of the first three years of the APS and £500 million per annum thereafter until the earlier of (i) the date of termination of the APS and (ii) 31 December 2099.
The amounts that may be received under the APS (which amounts are difficult to quantify precisely) may be less than the costs of participation which are themselves also difficult to quantify. The aggregate effect of the joining, establishment, operational and exit costs and fees and expenses of, and associated with, the APS may significantly reduce or even eliminate the benefit to the Group of the APS.
Participation in the APS may result in greater tax liabilities for the Group and the loss of potential tax benefits.
The Group can opt (with the consent of HM Treasury) to satisfy the annual fee in respect of both the APS and the Contingent Subscription and any APS exit fee by waiving certain United Kingdom tax reliefs that are treated as deferred tax assets. The Group has not opted to do so to date, but if the Group so opts in the future, it is difficult to value accurately the cost to the Group, which depends on unascertainable factors including the extent of future losses, the extent to which the Group regains profitability and any changes in tax law.
In addition to suffering greater tax liabilities in future years as a result of the waiver of the right to certain United Kingdom tax reliefs that are treated as deferred tax assets (the “Tax Loss Waiver”), the Group may also be subject to further tax liabilities in the United Kingdom and overseas in connection with the APS and the associated intra-group arrangements which would not otherwise have arisen. The Tax Loss Waiver provides that the Group will not be permitted to enter into arrangements which have a main purpose of reducing the net cost of the Tax Loss Waiver. It is unclear precisely how these restrictions will apply, but it is possible that they may limit the operations and future post-tax profitability of the Group.
There are significant costs associated with termination of the Group’s participation in the APS.
In order to terminate the Group’s participation in the APS, the Group must have FSA approval and must pay an exit fee. The effect of the payment of the exit fee and potentially the refund of the net pay-outs it has received from HM Treasury under the APS may significantly reduce or even eliminate the anticipated further regulatory capital benefits to the Group of its participation in the APS and could have an adverse impact on the Group’s results of operation or result in a loss of value in the Securities. Alternatively, if the Group is unable to repay to HM Treasury in full the exit fee and potentially the net pay-outs it has received under the APS and, therefore, is unable to terminate its participation in the APS, the Group will be required under the Scheme Conditions to continue to pay the annual fee to HM Treasury until 31 December 2099, which could have an adverse impact on the Group’s results of operation or result in a loss of value in the Securities.
Under certain circumstances, the Group cannot be assured that assets of RBS Holdings N.V. (and certain other entities) will continue to be covered under the APS, either as a result of a withdrawal of such assets or as a result of a breach of the relevant obligations.
If HM Treasury seeks to exercise its right to appoint one or more step-in managers in relation to the management and administration of Covered Assets held by RBS Holdings N.V. or its wholly-owned subsidiaries, RBS Holdings N.V. will, in certain circumstances, need to seek consent from the Dutch Central Bank to allow it to comply with such step-in. If this consent is not obtained by the date (which will be no less than 10 business days after the notice from HM Treasury) on which the step-in rights must be effective, and other options to effect compliance are not possible (at all or because the costs involved prove prohibitive), those assets would need to be withdrawn by the Group from the APS where permissible under the Scheme Conditions or, otherwise, with HM Treasury consent. If the Group cannot withdraw such Covered Assets from the APS, it would be likely to lose protection in respect of these assets under the APS and/or may be liable under its indemnity to HM Treasury. If the Group loses cover under the APS in respect of any Covered Asset held by RBS Holdings N.V. or its wholly-owned subsidiaries, any losses incurred on such asset will continue to be borne fully by the Group and may have a material adverse impact on its financial condition, profitability and capital ratios. Similar issues apply in certain other jurisdictions but the relevant Covered Assets are of a lower quantum.
Additional information continued | Additional information |
Risk factors continued
Any conversion of the B Shares, in combination with any future purchase by HM Treasury of ordinary shares, would increase HM Treasury’s ownership interest in the company, and could result in the delisting of the company from the Official List.
On 22 December 2009, RBSG issued £25.5 billion of B Shares to HM Treasury. The B Shares are convertible, at the option of the holder at any time, into ordinary shares at an initial conversion price of £0.50 per ordinary share.
Although HM Treasury has agreed not to convert any B Shares it holds if, as a result of such conversion, it would hold more than 75 per cent. of the ordinary shares, if HM Treasury were to acquire additional ordinary shares otherwise than through the conversion of the B Shares, such additional acquisitions could significantly increase HM Treasury’s ownership interest in the company to above 75 per cent. of the company’s ordinary issued share capital, which would put the company in breach of the FSA’s Listing Rules requirement that at least 25 per cent. of its issued ordinary share capital must be in public hands. Although the company may apply to the FSA in its capacity as the competent authority under the FSMA for a waiver in such circumstances, there is no guarantee that such a waiver would be granted, the result of which could be the delisting of the company from the Official List and potentially other exchanges where its Securities are currently listed and traded.
Participation in the APS may give rise to litigation and regulatory risk.
In order to fulfil (or as a consequence of fulfilling) its disclosure obligations under the APS by disclosing certain information to HM Treasury (and, as a result of notices issued by it, the FSA), the Group may incur the risk of civil suits, criminal liability or regulatory actions. Adverse regulatory action or adverse judgments in litigation could have a significant effect on the Group’s reputation or results of operations or result in a loss of value in the Securities. Alternatively, in order to avoid the risk of such civil suits or regulatory actions or to avoid the risk of criminal liability, the Group may choose to or be required to remove Covered Assets from the APS so as not to be required to disclose such information to HM Treasury, with the result that such assets will not be protected by the APS. The effect of the removal of such Covered Assets will impact the level of protection available to the Group and may materially reduce the protection anticipated by the Group for its stressed losses, in which case its business, results of operations and financial condition will suffer.
Shareholder enquiriesinformation | Contents |
| 371 | Financial calendar |
276371 | Shareholder enquiries |
276372 | |
277373 | |
280376 | |
282377 | |
285380 | |
285380 | |
285389 | |
289389 | conduct |
289389 | |
290390 | Important addressesGlossary of terms |
290396 | |
| 399 | Important addresses |
| 399 | Principal offices |
Shareholder information continued | Shareholder information |
| Annual General Meeting | 319 April 20092011 at 1 pm2pm
|
| RBS Gogarburn Edinburgh International Conference Centre
The Exchange, Morrison Street,
|
| Edinburgh, EH12 1HQ |
| |
| | |
| Interim results | 75 August 20092011 |
Dividends
Payment dates:
| Payment dates | |
| Cumulative preference shares | 2931 May and 3130 December 20092011 |
| | |
| Non-cumulative preference shares | 31 March, 30 June, |
| 30 September and 31
|
30 December 20092011 |
Ex-dividend dates:
| Ex-dividend date | |
| Cumulative preference shares | 29 April 20094 May 2011 |
Record dates:
| |
| Record date | |
| Cumulative preference shares | 16 May 20092011 |
Shareholder enquiries
Shareholdings in the company may be checked by visiting the ‘Shareholder Services’ section of our website (www.rbs.com/shareholder). You will need the shareholder reference number printed on your share certificate or tax voucher to gain access to this information.
Dividend payments
The company pays its dividends in pounds sterling although shareholdersYou may choose to receive payment in US dollars or euros. Shareholders wishing to receive payment in either US dollars or euros should request an instruction form from the Company’salso check your shareholding by contacting our Registrar:
Computershare Investor Services PLC
The Pavilions
Bridgwater Road
Bristol BS99 6ZZ
Telephone: 0870+44 (0)870 702 0135
Fax: 0870+44 (0)870 703 6009
Email: web.queries@computershare.co.ukWeb: www.investorcentre.co.uk/contactus
Shareholders may also download an instruction form viaforms from the 'Shareholder Services' section of our website (www.rbs.com/shareholder). Completed instruction forms must be returned to the registrar no later than 15 working days before the relevant dividend payment date.
Braille and audio Annual Review and Summary Financial Statement
Shareholders requiring a Braille or audio version of the Annual Review and Summary Financial Statement should contact the Registrar on 0870+44 (0)870 702 0135.
ShareGift
The company is aware that shareholders who hold a small number of shares may be retaining these shares because dealing costs make it uneconomical to dispose of them. ShareGift, the charity share donation scheme is a free service operated by The Orr Mackintosh Foundation (registered charity 1052686) to enable shareholders to donate shares to charity.
Should you wish to donate your shares to charity in this way you should contact ShareGift for further information:
ShareGift, The Orr Mackintosh Foundation
17 Carlton House Terrace, London SW1Y 5AH
Tel: 020+44 (0)20 7930 3737
www.sharegift.org
Donating your shares in this way will not give rise to either a gain or a loss for UK capital gains tax purposes and you may be able to reclaim UK income tax on gifted shares. Further information can be obtained from HM Revenue & Customs.
Warning to shareholders —- boiler room scams
Over the last year,In recent years, many companies have become aware that their shareholders have received unsolicited phone calls or correspondence concerning investment matters. These are typically from overseas based ‘brokers’'brokers' who target UK shareholders, offering to sell them what often turn out to be worthless or high risk shares in US or UK investments. These operations are commonly known as ‘boiler rooms’'boiler rooms'. These ‘brokers’'brokers' can be very persistent and extremely persuasive, and a 2006 survey by the Financial Services Authority (FSA) has reported that the average amount lost by investors is around £20,000.
It is not just the novice investor that has been duped in this way; many of the victims had been successfully investing for several years. Shareholders are advised to be very wary of any unsolicited advice, offers to buy shares at a discount or offers of free company reports. If you receive any unsolicited investment advice:
| Makemake sure you get the correct name of the person and organisation; |
| Checkcheck that they are properly authorised by the FSA before getting involved by visitingvisiting; www.fsa.gov.uk/pages/register; |
| Reportreport the matter to the FSA either by calling 0845+44 (0)845 606 1234 or visiting www.moneymadeclear.fsa.gov.uk;(www.fsa.gov.uk/pages/consumerinformation); and |
| Ifif the calls persist, hang up. |
Shareholder information continued
If you deal with an unauthorised firm, you will not be eligible to receive payment under the Financial Services Compensation Scheme. The FSA can be contacted by completing an online form at www.fsa.gov.uk/(www.fsa.gov.uk/pages/doing/regulated/law/alerts/overseas.shtmlform.shtml)
Details of any share dealing facilities that the company endorses will be included in company mailings.
More detailed information on this or similar activity can be found on the FSA website www.moneymadeclear.fsa.gov.uk(www.fsa.gov.uk/pages/consumerinformation)
Shareholder information continued | Shareholder information |
Analyses of ordinary shareholders
| At 31 December 2010 | Shareholdings | Number of shares - millions | % |
| Individuals | 214,556 | 1,232.5 | 2.1 |
| Banks and nominee companies | 17,045 | 56,131.1 | 96.0 |
| Investment trusts | 163 | 20.4 | 0.1 |
| Insurance companies | 187 | 3.9 | — |
| Other companies | 1,442 | 631.5 | 1.1 |
| Pension trusts | 40 | 9.0 | — |
| Other corporate bodies | 103 | 429.7 | 0.7 |
| | 233,536 | 58,458.1 | 100.0 |
| | | | |
| Range of shareholdings: | | | |
1 - 1,000 | 75,288 | 32.5 | 0.1 |
1,001 - 10,000 | 127,607 | 472.5 | 0.8 |
10,001 - 100,000 | 28,847 | 655.8 | 1.1 |
100,001 - 1,000,000 | 1,113 | 309.7 | 0.5 |
1,000,001 - 10,000,000 | 466 | 1,568.2 | 2.7 |
| 10,000,001 and over | 215 | 55,419.4 | 94.8 |
| | 233,536 | 58,458.1 | 100.0 |
Shareholder information continued
For shareholders who held RBS ordinary shares at 31 March 1982, the market value of one ordinary share held was 103p. After adjusting for the following:
· | the 1 March 1985 rights issue; |
· | the 1 September 1989 capitalisation issue; |
· | the 12 July 2000 bonus issue of Additional Value Shares; |
· | the 8 May 2007 bonus issue; |
· | the 6 June 2008 rights issue; |
· | the 15 September 2008 capitalisation issue; and |
· | the basic entitlement under the 1 December 2008 open offer, |
the adjusted 31 March 1982 base value of one ordinary share held currently is 73p.
For shareholders who held NatWest ordinary shares at 31 March 1982, the market value of one ordinary share held was 76.3p for shareholders who accepted the basic terms of the RBS offer. This takes account of the following:
· | the August 1984 rights issue of NatWest ordinary shares; |
· | the June 1986 rights issue of NatWest ordinary shares; |
· | the June 1989 bonus issue of NatWest ordinary shares; |
· | the 12 July 2000 bonus issue of Additional Value Shares; |
· | the 8 May 2007 bonus issue; |
· | the 6 June 2008 rights issue; |
· | the 15 September 2008 capitalisation issue; and |
· | the basic entitlement under the 1 December 2008 open offer. |
The information set out above is intended as a general guide only and is based on current United Kingdom legislation and HM Revenue & Customs practice as at this date. This information deals only with the position of individual shareholders who are resident in the United Kingdom for tax purposes, who are the beneficial owners of their shares and who hold their shares as an investment. It does not deal with the position of shareholders other than individual shareholders, shareholders who are resident outside the United Kingdom for tax purposes or certain types of shareholders, such as dealers in securities.
| | | | Shareholdings | | | Number of shares — millions | | | % | |
| Individuals | | | | 195,459 | | | | 982.9 | | | | 2.5 | |
| Banks and nominee companies | | | | 28,242 | | | | 37,496.0 | | | | 95.0 | |
| Investment trusts | | | | 179 | | | | 7.0 | | | | — | |
| Insurance companies | | | | 283 | | | | 7.8 | | | | — | |
| Other companies | | | | 2,131 | | | | 893.6 | | | | 2.3 | |
| Pension trusts | | | | 46 | | | | 30.2 | | | | 0.1 | |
| Other corporate bodies | | | | 88 | | | | 38.5 | | | | 0.1 | |
| | | | | 226,428 | | | | 39,456.0 | | | | 100.0 | |
| | | | | | | | | | | | | | |
| Range of shareholdings: | | | | | | | | | | | | | |
| | 1 — 1,000 | | | | 75,566 | | | | 31.9 | | | | 0.1 | |
| | 1,001 — 10,000 | | | | 123,493 | | | | 441.6 | | | | 1.1 | |
| | 10,001 — 100,000 | | | | 25,347 | | | | 557.7 | | | | 1.4 | |
| | 100,001 — 1,000,000 | | | | 1,192 | | | | 385.8 | | | | 1.0 | |
| | 1,000,001 — 10,000,000 | | | | 613 | | | | 2,106.5 | | | | 5.3 | |
| 10,000,001 and over | | | | 217 | | | | 35,932.5 | | | | 91.1 | |
| | | | | | 226,428 | | | | 39,456.0 | | | | 100.0 | |
Trading market
Non-cumulative dollar preference shares
On 26 March 1997, 8 February 1999, 30 September 2004, 26 August 2004, 19 May 2005, 9 November 2005, 25 May 2006, 27 December 2006, 28 June 2007, 27 September 2007 and 4 October 2007, the company issued the following Series of American Depository Shares (ADSs) representing non-cumulative dollar preference shares of the company, in the United States, of which the following were outstanding at 31 December 2008:2010:
8,000,0006,255,408 Series F (“("Series F ADSs”ADSs") representing 8,000,0006,255,408 non-cumulative dollar preference shares, Series F;
12,000,0009,687,654 Series H (“("Series H ADSs”ADSs") representing 12,000,0009,687,654 non-cumulative dollar preference shares, Series H;
34,000,00030,027,877 Series L (“("Series L ADSs”ADSs") representing 34,000,00030,027,877 non-cumulative dollar preference shares, Series L;
37,000,00023,125,869 Series M (“Series M ADSs”) representing 37,000,00023,125,869 non-cumulative dollar preference shares, Series M;
40,000,00022,113,160 Series N (“("Series N ADSs”ADSs") representing 40,000,00022,113,160 non-cumulative dollar preference shares, Series N;
22,000,0009,883,307 Series P (“("Series P ADSs”ADSs") representing 22,000,0009,883,307 non-cumulative dollar preference shares, Series P;
27,000,00020,646,938 Series Q (“("Series Q ADSs”ADSs") representing 27,000,00020,646,938 non-cumulative dollar preference shares, Series Q;
26,000,00010,163,932 Series R (“("Series R ADSs”ADSs") representing 26,000,00010,163,932 non-cumulative dollar preference shares, Series R;
38,000,00026,449,040 Series S (“("Series S ADSs”ADSs") representing 38,000,00026,449,040 non-cumulative dollar preference shares, Series S;
64,000,00051,245,839 Series T (“("Series T ADSs”ADSs") representing 64,000,00051,245,839 non-cumulative dollar preference shares, Series T; and
15,00010,130 Series U (“("Series U ADSs”ADSs") representing 15,00010,130 non-cumulative dollar preference shares, Series U.
Each of the respective ADSs set out above represents the right to receive one corresponding preference share, and is evidenced by an American Depository Receipt (ADR) and is listed on the New York Stock Exchange, a subsidiary of NYSE Euronext (NYSE).
The ADRs evidencing the ADSs above were issued pursuant to Deposit Agreements, among the company, The Bank of New York, as depository, and all holders from time-to-time of ADRs issued thereunder. Currently, there is no non-United States trading market for any of the non- cumulative
non-cumulative dollar preference shares. All of the non-cumulative dollar preference shares are held by the depository, as custodian, in bearer form.
In May 2010, the Group redeemed certain subordinated debt securities and equity preference shares in exchange for cash or senior debt, resulting in the number of securities in issue reducing to the amounts shown above.
At 31 December 2008,2010, there were 10674 registered shareholders of Series F ADSs, 6842 registered shareholders of Series H ADSs, 3027 registered shareholders of Series L ADSs, 7 registered shareholders of Series M ADSs, 3922 registered shareholders of Series N ADSs, 5028 registered shareholders of Series P ADSs, 1514 registered shareholders of Series Q ADSs, 2 registered shareholders of Series R ADSs, 31 registered shareholdersshareholder of Series S ADSs, 2917 registered shareholders of Series T ADSs and 1 registered shareholder of Series U ADSs.
PROs
In August 2001, the company issued US$1.2 billion of perpetual regulatory tier one securities (PROs) in connection with a public offering in the United States. The PROs are listed on the NYSE.
ADSs representing ordinary shares
In October 2007, the company listed ADSs, each representing one ordinary share nominal value 25p each (or a right to receive one ordinary share), and evidenced by an ADR or uncertificated securities, on the NYSE. With effect from 7 November 2008, the ratio of one ADS representing one ordinary share changed to one ADS representing 20 ordinary shares. As of 31 December 2008, 12.92010, 14.5 million ADSs were outstanding. The ADSs were issued in connection with the company’scompany's bid for the outstanding share capital of ABN AMRO Holding N.V.N.V..
The ADSs described in the above paragraph were issued pursuant to a Deposit Agreement, among the company, The Bank of New York Mellon, as Depository,depository, and all owners and holders from time to time of ADSs issued thereunder. The ordinary shares of the company are listed and traded on the London Stock Exchange. All ordinary shares are deposited with the principal London office of The Bank of New York Mellon, as custodian for the Depository.depository.
Shareholder information continued | Shareholder information |
The following table shows, for the periods indicated, the high and low sales prices for each of the outstanding ADSs representing non-cumulative dollar preference shares and PROs, as reported on the NYSE composite tape:or NASDAQ.
Figures in US$ | | Series F ADSs | Series H ADSs | Series L ADSs | Series M ADSs | Series N ADSs | Series P ADSs | Series Q ADSs | Series R ADSs | Series S ADSs | Series T ADSs | Series U ADSs | PROs(1) |
| By month | | | | | | | | | | | | | |
| Feb 2011 | High | 23.70 | 22.75 | 18.93 | 17.82 | 17.80 | 17.57 | 18.25 | 17.34 | 17.95 | 19.41 | 77.50 | 92.13 |
| | Low | 22.22 | 21.10 | 17.54 | 16.42 | 16.16 | 15.96 | 16.89 | 15.93 | 16.55 | 18.04 | 72.00 | 87.37 |
| Jan 2011 | High | 22.32 | 21.61 | 18.00 | 16.36 | 16.11 | 16.07 | 16.95 | 16.14 | 16.60 | 17.90 | 72.00 | 86.89 |
| | Low | 21.85 | 20.70 | 17.40 | 15.03 | 14.99 | 14.95 | 15.30 | 14.98 | 15.13 | 16.47 | 65.50 | 83.75 |
| Dec 2010 | High | 23.15 | 22.72 | 18.24 | 15.98 | 16.01 | 16.01 | 16.20 | 16.00 | 16.01 | 17.06 | 67.50 | 89.09 |
| | Low | 21.19 | 20.35 | 16.60 | 14.70 | 14.55 | 14.57 | 15.03 | 14.56 | 14.84 | 16.16 | 66.52 | 86.13 |
| Nov 2010 | High | 23.58 | 23.15 | 18.85 | 17.13 | 17.14 | 17.14 | 17.62 | 17.09 | 17.42 | 18.64 | 78.25 | 97.06 |
| | Low | 21.85 | 21.24 | 16.91 | 14.80 | 14.70 | 14.47 | 15.30 | 14.40 | 14.95 | 16.33 | 66.00 | 92.17 |
| Oct 2010 | High | 23.97 | 23.71 | 19.47 | 17.75 | 17.73 | 17.77 | 17.91 | 17.75 | 17.73 | 18.48 | 77.75 | 96.99 |
| | Low | 23.44 | 23.16 | 18.81 | 15.65 | 15.72 | 15.61 | 16.42 | 15.60 | 16.02 | 17.19 | 74.00 | 94.69 |
| Sep 2010 | High | 23.97 | 23.85 | 19.88 | 16.80 | 16.83 | 16.71 | 17.59 | 16.68 | 17.39 | 18.44 | 75.00 | 95.10 |
| | Low | 22.81 | 21.50 | 17.45 | 13.54 | 13.47 | 13.32 | 14.09 | 13.27 | 13.89 | 15.04 | 66.00 | 86.50 |
| | | | | | | | | | | | | | |
| By quarter | | | | | | | | | | | | | |
| 2010: Q4 | High | 23.97 | 23.71 | 19.47 | 17.75 | 17.73 | 17.77 | 17.91 | 17.75 | 17.73 | 18.64 | 78.25 | 97.06 |
| | Low | 21.19 | 20.35 | 16.60 | 14.70 | 14.55 | 14.47 | 15.03 | 14.40 | 14.84 | 16.16 | 66.00 | 86.13 |
| 2010: Q3 | High | 23.97 | 23.85 | 19.88 | 16.80 | 16.83 | 16.71 | 17.59 | 16.68 | 17.39 | 18.44 | 75.00 | 95.10 |
| | Low | 20.73 | 17.14 | 14.12 | 10.95 | 10.91 | 10.75 | 11.24 | 10.80 | 10.99 | 11.90 | 56.50 | 75.25 |
| 2010: Q2 | High | 21.20 | 19.90 | 16.63 | 14.15 | 14.11 | 14.13 | 14.54 | 14.13 | 14.35 | 15.40 | 65.75 | 85.13 |
| | Low | 17.33 | 16.51 | 13.35 | 11.06 | 11.15 | 11.05 | 11.35 | 11.14 | 11.18 | 12.07 | 53.00 | 73.25 |
| 2010: Q1 | High | 20.51 | 19.58 | 16.61 | 14.23 | 13.95 | 14.07 | 14.21 | 13.92 | 14.12 | 14.94 | 66.00 | 84.75 |
| | Low | 16.57 | 15.10 | 13.67 | 11.35 | 11.23 | 11.15 | 11.68 | 11.02 | 11.65 | 12.56 | 54.00 | 67.13 |
| 2009: Q4 | High | 17.06 | 15.90 | 13.65 | 11.36 | 11.29 | 11.16 | 11.69 | 11.06 | 11.25 | 12.47 | 54.00 | 69.25 |
| | Low | 12.40 | 11.59 | 9.51 | 8.41 | 8.38 | 8.20 | 8.41 | 8.33 | 8.36 | 9.21 | 43.00 | 55.62 |
| 2009: Q3 | High | 18.30 | 16.46 | 13.14 | 14.07 | 14.11 | 13.91 | 15.15 | 13.63 | 14.45 | 16.48 | 57.50 | 55.63 |
| | Low | 12.50 | 10.79 | 9.00 | 9.26 | 9.14 | 9.10 | 9.69 | 8.94 | 9.50 | 10.66 | 39.00 | 50.25 |
| 2009: Q2 | High | 15.73 | 14.10 | 11.36 | 12.80 | 12.54 | 12.36 | 13.20 | 11.98 | 13.11 | 14.24 | 43.25 | 50.50 |
| | Low | 6.99 | 6.13 | 4.90 | 5.62 | 5.40 | 5.25 | 5.76 | 5.25 | 5.74 | 6.00 | 21.25 | 28.00 |
| 2009: Q1 | High | 14.19 | 12.99 | 10.89 | 12.25 | 11.75 | 11.50 | 12.18 | 11.30 | 11.84 | 13.51 | 43.96 | 56.03 |
| | Low | 3.00 | 2.77 | 2.21 | 2.63 | 2.55 | 2.43 | 2.64 | 2.37 | 2.58 | 2.78 | 8.98 | 20.00 |
| | | | | | | | | | | | | | |
| By year | | | | | | | | | | | | | |
| 2010 | High | 23.97 | 23.85 | 19.88 | 17.75 | 17.73 | 17.77 | 17.91 | 17.75 | 17.73 | 18.64 | 78.25 | 97.06 |
| | Low | 16.57 | 15.10 | 13.35 | 10.95 | 10.91 | 10.75 | 11.24 | 10.80 | 10.99 | 11.90 | 53.00 | 67.13 |
| 2009 | High | 18.30 | 16.46 | 13.65 | 14.07 | 14.11 | 13.91 | 15.15 | 13.63 | 14.45 | 16.48 | 57.50 | 69.25 |
| | Low | 3.00 | 2.77 | 2.21 | 2.63 | 2.55 | 2.43 | 2.64 | 2.37 | 2.58 | 2.78 | 8.98 | 20.00 |
| 2008 | High | 25.74 | 25.30 | 22.27 | 24.12 | 24.01 | 23.85 | 24.95 | 23.52 | 24.66 | 25.66 | 105.61 | 107.55 |
| | Low | 5.10 | 5.00 | 4.37 | 4.51 | 4.20 | 4.50 | 4.34 | 4.16 | 4.36 | 5.43 | 39.84 | 53.60 |
| 2007 | High | 26.50 | 25.85 | 24.75 | 25.99 | 25.75 | 25.83 | 26.91 | 25.50 | 25.20 | 25.48 | 107.98 | 122.07 |
| | Low | 23.60 | 22.70 | 17.90 | 19.68 | 19.50 | 19.25 | 20.71 | 18.96 | 20.26 | 22.61 | 98.34 | 100.49 |
| 2006 | High | 27.25 | 25.95 | 24.62 | 26.08 | 25.96 | 26.07 | 26.76 | — | — | — | — | 122.23 |
| | Low | 25.29 | 25.01 | 21.15 | 23.58 | 23.32 | 22.76 | 24.67 | — | — | — | — | 106.06 |
| | | Series F | Series H | Series L | Series M | Series N | Series P | Series Q | Series R | Series S | Series T | Series U | |
| Figures in US$ | | ADSs | ADSs | ADSs | ADSs | ADSs | ADSs | ADSs | ADSs | ADSs | ADSs | ADSs | PROs(1) |
| By month | | | | | | | | | | | | | |
| March 2009 | High | 7.35 | 6.31 | 5.97 | 6.00 | 5.85 | 6.00 | 6.18 | 6.00 | 6.00 | 6.34 | 22.50 | 28.00 |
| | Low | 3.00 | 2.77 | 2.21 | 2.63 | 2.55 | 2.43 | 2.64 | 2.37 | 2.58 | 2.78 | 10.50 | 21.00 |
| February 2009 | High | 5.78 | 5.25 | 4.37 | 4.53 | 4.68 | 4.51 | 4.80 | 4.45 | 4.67 | 5.75 | 16.45 | 30.13 |
| | Low | 3.59 | 3.25 | 2.64 | 2.70 | 2.73 | 2.80 | 2.88 | 2.55 | 2.95 | 3.02 | 8.98 | 20.00 |
| January 2009 | High | 14.19 | 12.99 | 10.89 | 12.25 | 11.75 | 11.50 | 12.18 | 11.30 | 11.84 | 13.51 | 43.96 | 56.03 |
| | Low | 3.35 | 3.17 | 2.51 | 2.73 | 2.80 | 2.68 | 3.00 | 2.67 | 2.94 | 3.80 | 12.49 | 25.00 |
| December 2008 | High | 11.33 | 10.55 | 8.80 | 9.45 | 9.29 | 8.97 | 9.74 | 8.97 | 9.55 | 11.07 | 48.92 | 56.25 |
| | Low | 8.51 | 8.03 | 6.67 | 7.05 | 7.19 | 6.95 | 7.47 | 6.96 | 7.32 | 8.42 | 39.84 | 53.60 |
| November 2008 | High | 13.34 | 13.40 | 10.37 | 10.84 | 11.30 | 10.71 | 11.34 | 10.32 | 11.15 | 12.36 | 52.91 | 69.74 |
| | Low | 8.60 | 6.75 | 5.50 | 6.00 | 6.48 | 5.70 | 5.64 | 5.50 | 6.00 | 6.40 | 46.89 | 55.25 |
| October 2008 | High | 14.10 | 12.78 | 10.94 | 11.36 | 11.70 | 11.10 | 12.20 | 11.16 | 11.98 | 13.09 | 74.78 | 84.10 |
| | Low | 5.10 | 5.00 | 4.37 | 4.51 | 4.20 | 4.50 | 4.34 | 4.16 | 4.36 | 5.43 | 44.62 | 68.63 |
| | | | | | | | | | | | | | |
| By quarter | | | | | | | | | | | | | |
| 2009: First quarter | High | 14.19 | 12.99 | 10.89 | 12.25 | 11.75 | 11.50 | 12.18 | 11.30 | 11.84 | 13.51 | 43.96 | 56.03 |
| | Low | 3.00 | 2.77 | 2.21 | 2.63 | 2.55 | 2.43 | 2.64 | 2.37 | 2.58 | 2.78 | 8.98 | 20.00 |
| 2008: Fourth quarter | High | 14.10 | 13.40 | 10.94 | 11.36 | 11.70 | 11.10 | 12.20 | 11.16 | 11.98 | 13.09 | 74.78 | 84.10 |
| | Low | 5.10 | 5.00 | 4.37 | 4.51 | 4.20 | 4.50 | 4.34 | 4.16 | 4.36 | 5.43 | 39.84 | 53.60 |
| 2008: Third quarter | High | 24.00 | 22.11 | 17.31 | 19.36 | 19.29 | 18.76 | 20.49 | 18.32 | 20.06 | 22.42 | 92.03 | 96.30 |
| | Low | 8.39 | 7.00 | 4.74 | 8.49 | 5.98 | 5.24 | 5.80 | 5.40 | 6.25 | 8.00 | 74.34 | 83.82 |
| 2008: Second quarter | High | 25.74 | 24.95 | 20.22 | 22.64 | 22.73 | 22.01 | 23.74 | 21.57 | 22.99 | 24.73 | 96.63 | 93.76 |
| | Low | 21.50 | 20.15 | 16.12 | 17.90 | 18.10 | 17.34 | 18.78 | 17.08 | 18.62 | 20.40 | 85.25 | 89.23 |
| 2008: First quarter | High | 25.59 | 25.30 | 22.27 | 24.12 | 24.01 | 23.85 | 24.95 | 23.52 | 24.66 | 25.66 | 105.61 | 107.55 |
| | Low | 24.50 | 24.00 | 18.05 | 20.60 | 19.78 | 20.05 | 21.80 | 19.79 | 20.77 | 23.95 | 86.13 | 93.76 |
| 2007: Fourth quarter | High | 25.85 | 25.50 | 21.34 | 23.23 | 23.10 | 22.89 | 24.80 | 22.54 | 24.11 | 25.48 | 107.98 | 109.95 |
| | Low | 23.60 | 22.70 | 17.90 | 19.68 | 19.50 | 19.25 | 20.71 | 18.96 | 20.26 | 22.61 | 98.34 | 100.49 |
| 2007: Third quarter | High | 26.23 | 25.60 | 22.23 | 24.60 | 24.30 | 24.14 | 25.88 | 23.55 | 25.20 | 25.10 | — | 112.88 |
| | Low | 25.25 | 24.95 | 20.30 | 22.22 | 21.98 | 21.76 | 23.49 | 21.20 | 22.77 | 24.95 | — | 104.94 |
| 2007: Second quarter | High | 26.50 | 25.78 | 24.36 | 25.88 | 25.67 | 25.78 | 26.40 | 25.35 | 25.00 | — | — | 118.15 |
| | Low | 25.39 | 25.10 | 21.80 | 24.10 | 23.81 | 23.51 | 24.95 | 23.30 | 24.75 | — | — | 110.17 |
| 2007: First quarter | High | 25.76 | 25.85 | 24.75 | 25.99 | 25.75 | 25.83 | 26.91 | 25.50 | — | — | — | 122.07 |
| | Low | 25.26 | 25.21 | 24.02 | 25.50 | 25.35 | 25.25 | 26.08 | 24.79 | — | — | — | 115.81 |
| | | | | | | | | | | | | | |
| By year | | | | | | | | | | | | | |
| 2008 | High | 25.74 | 25.30 | 22.27 | 24.12 | 24.01 | 23.85 | 24.95 | 23.52 | 24.66 | 25.66 | 105.61 | 107.55 |
| | Low | 5.10 | 5.00 | 4.37 | 4.51 | 4.20 | 4.50 | 4.34 | 4.16 | 4.36 | 5.43 | 39.84 | 53.60 |
| 2007 | High | 26.50 | 25.85 | 24.75 | 25.99 | 25.75 | 25.83 | 26.91 | 25.50 | 25.20 | 25.48 | 107.98 | 122.07 |
| | Low | 23.60 | 22.70 | 17.90 | 19.68 | 19.50 | 19.25 | 20.71 | 18.96 | 20.26 | 22.61 | 98.34 | 100.49 |
| 2006 | High | 27.25 | 25.95 | 24.62 | 26.08 | 25.96 | 26.07 | 26.76 | — | — | — | — | 122.23 |
| | Low | 25.29 | 25.01 | 21.15 | 23.58 | 23.32 | 22.76 | 24.67 | — | — | — | — | 106.06 |
| 2005 | High | 28.00 | 26.19 | 24.99 | 26.75 | 26.23 | 25.50 | — | — | — | — | — | 129.57 |
| | Low | 26.02 | 25.20 | 22.67 | 24.77 | 24.70 | 24.60 | — | — | — | — | — | 116.70 |
| 2004 | High | 28.45 | 25.87 | 24.68 | 26.16 | — | — | — | — | — | — | — | 125.14 |
| | Low | 25.65 | 24.45 | 23.51 | 25.13 | — | — | — | — | — | — | — | 110.58 |
| (1) | Price quoted as a % of US$1,000 nominal. |
Shareholder information continued
Shareholder information continued | Shareholder information |
Trading market continued
Ordinary shares
The following table shows, for the periods indicated, the high and low sales prices for the company’scompany's ordinary shares on the London Stock Exchange, as derived from the Daily Official List of the UK Listing AuthorityAuthority. Prices for 2008, 2007 and 2006 were restated for the effect of the rights issue in June 2008 and the capitalisation issue in September 2008.
| By month | | £ | | By quarter | | £ | | By year | | £ |
| March 2009 | High | 0.2660 | | 2009: First quarter | High | 0.5500 | | 2008 | High | 3.7054 |
| | Low | 0.1900 | | | Low | 0.1030 | | | Low | 0.4140 |
| February 2009 | High | 0.2900 | | 2008: Fourth quarter | High | 1.8620 | | 2007 | High | 6.0208 |
| | Low | 0.1810 | | | Low | 0.4140 | | | Low | 3.3265 |
| January 2009 | High | 0.5500 | | 2008: Third quarter | High | 2.4293 | | 2006 | High | 5.5770 |
| | Low | 0.1030 | | | Low | 1.6098 | | | Low | 4.6559 |
| December 2008 | High | 0.7010 | | 2008: Second quarter | High | 3.2156 | | 2005 | High | 5.1081 |
| | Low | 0.4140 | | | Low | 2.0707 | | | Low | 4.2456 |
| November 2008 | High | 0.6900 | | 2008: First quarter | High | 3.7054 | | 2004 | High | 4.9155 |
| | Low | 0.4170 | | | Low | 2.5540 | | | Low | 4.0865 |
| October 2008 | High | 1.8620 | | 2007: Fourth quarter | High | 4.7689 | | | | |
| | Low | 0.5680 | | | Low | 3.3265 | | | | |
| | | | | 2007: Third quarter | High | 5.3802 | | | | |
| | | | | | Low | 4.2581 | | | | |
| | | | | 2007: Second quarter | High | 5.7780 | | | | |
| | | | | | Low | 5.2169 | | | | |
| | | | | 2007: First quarter | High | 6.0208 | | | | |
| | | | | | Low | 5.4514 | | | | |
| By month | | £ | | By quarter | | £ | | By year | | £ |
| February 2011 | High | 0.4900 | | 2010: Q4 | High | 0.4949 | | 2010 | High | 0.5804 |
| | Low | 0.4239 | | | Low | 0.3759 | | | Low | 0.3125 |
| January 2011 | High | 0.4494 | | 2010: Q3 | High | 0.5210 | | 2009 | High | 0.5765 |
| | Low | 0.3950 | | | Low | 0.3896 | | | Low | 0.1030 |
| December 2010 | High | 0.4231 | | 2010: Q2 | High | 0.5804 | | 2008 | High | 3.7054 |
| | Low | 0.3782 | | | Low | 0.4143 | | | Low | 0.4140 |
| November 2010 | High | 0.4714 | | 2010: Q1 | High | 0.4560 | | 2007 | High | 6.0208 |
| | Low | 0.3759 | | | Low | 0.3125 | | | Low | 3.3265 |
| October 2010 | High | 0.4949 | | 2009: Q4 | High | 0.5055 | | 2006 | High | 5.5770 |
| | Low | 0.4455 | | | Low | 0.2841 | | | Low | 4.6559 |
| September 2010 | High | 0.5015 | | 2009: Q3 | High | 0.5765 | | | | |
| | Low | 0.4580 | | | Low | 0.3546 | | | | |
| | | | | 2009: Q2 | High | 0.4800 | | | | |
| | | | | | Low | 0.2510 | | | | |
| | | | | 2009: Q1 | High | 0.5500 | | | | |
| | | | | | Low | 0.1030 | | | | |
On 24 April 2009,25 March 2011, the closing price of the ordinary shares on the London Stock Exchange was £0.3330,£0.42, equivalent to $0.4894$0.66 per share translated at the Noon Buying Rate of $1.4697$1.6086 per £1.00 on 24 April 2009.25 March 2011.
ADSs
The following table shows, for the periods indicated, the high and low sales prices for the company’scompany's ordinary ADSs, as reported on the NYSE composite tape andtape. Prices for 2008 were restated for the effect of the rights issue in June 2008 and the capitalisation issue in September 2008.
| By month | | US$ | | By quarter | | US$ | | By year | | US$ |
| March 2009 | High | 7.69 | | 2009: First quarter | High | 16.70 | | 2008 | High | 149.05 |
| | Low | 5.13 | | | Low | 3.33 | | | Low | 12.20 |
| February 2009 | High | 7.83 | | 2008: Fourth quarter | High | 66.00 | | 2007 | High | 189.25 |
| | Low | 5.10 | | | Low | 12.20 | | | Low | 141.18 |
| January 2009 | High | 16.70 | | 2008: Third quarter | High | 93.85 | | | | |
| | Low | 3.33 | | | Low | 55.00 | | | | |
| December 2008 | High | 20.75 | | 2008: Second quarter | High | 129.96 | | | | |
| | Low | 12.66 | | | Low | 83.71 | | | | |
| November 2008 | High | 22.80 | | 2008: First quarter | High | 149.05 | | | | |
| | Low | 12.20 | | | Low | 105.18 | | | | |
| October 2008 | High | 66.00 | | 2007: Fourth quarter | High | 189.25 | | | | |
| | Low | 18.00 | | | Low | 141.18 | | | | |
| | | | | | | | | | | |
| | | | | | | | | | | |
| By month | | US$ | | By quarter | | US$ | | By year | | US$ |
| February 2011 | High | 15.83 | | 2010: Q4 | High | 15.67 | | 2010 | High | 17.30 |
| | Low | 13.73 | | | Low | 11.76 | | | Low | 9.89 |
| January 2011 | High | 14.31 | | 2010: Q3 | High | 16.68 | | 2009 | High | 18.95 |
| | Low | 12.40 | | | Low | 12.14 | | | Low | 3.33 |
| December 2010 | High | 13.39 | | 2010: Q2 | High | 17.30 | | 2008 | High | 149.05 |
| | Low | 11.91 | | | Low | 11.91 | | | Low | 12.20 |
| November 2010 | High | 15.42 | | 2010: Q1 | High | 13.61 | | | | |
| | Low | 11.76 | | | Low | 9.89 | | | | |
| October 2010 | High | 15.67 | | 2009: Q4 | High | 16.00 | | | | |
| | Low | 14.18 | | | Low | 9.17 | | | | |
| September 2010 | High | 15.61 | | 2009: Q3 | High | 18.95 | | | | |
| | Low | 14.03 | | | Low | 11.45 | | | | |
| | | | | 2009: Q2 | High | 14.85 | | | | |
| | | | | | Low | 7.35 | | | | |
| | | | | 2009: Q1 | High | 16.70 | | | | |
| | | | | | Low | 3.33 | | | | |
With effect from 7 November 2008, the ratio of one ADS representing one ordinary share changed to one ADS representing 20 ordinary shares. The prices in the table have beenfor 2008 were adjusted accordingly.
On 24 April 2009,25 March 2011, the closing price of the ordinary ADSs on the New York Stock Exchange was $9.99.$13.45.
Shareholder information continued | Shareholder information |
Dividend history
Preference and other non-equity dividends
| | 2010 | 2010 | 2009 | 2008 | 2007 | 2006 |
| Amount per share | $ | £ | £ | £ | £ | £ |
| Non-cumulative preference shares of US$0.01 | | | | | | |
- Series D (redeemed March 2006) (1) | — | — | — | — | — | 0.21 |
- Series E (redeemed January 2007) (1) | — | — | — | — | 0.04 | 1.10 |
- Series F (1) | 1.91 | 1.06 | 1.22 | 1.04 | 0.96 | 1.03 |
- Series G (redeemed January 2007) (1) | — | — | — | — | 0.04 | 1.00 |
- Series H (1) | 1.81 | 1.03 | 1.15 | 0.99 | 0.91 | 0.98 |
- Series I (redeemed March 2006) (1) | — | — | — | — | — | 0.20 |
- Series K (redeemed January 2007) (1) | — | — | — | — | 0.04 | 1.06 |
- Series L (1) | 1.44 | 0.86 | 0.92 | 0.78 | 0.72 | 0.78 |
- Series M (2) | 0.40 | 0.26 | 1.02 | 0.89 | 0.80 | 0.87 |
- Series N (2) | 0.40 | 0.26 | 1.01 | 0.88 | 0.79 | 0.86 |
- Series P (2) | 0.39 | 0.25 | 0.99 | 0.87 | 0.78 | 0.85 |
- Series Q (2) | 0.42 | 0.27 | 1.07 | 0.94 | 0.84 | 0.53 |
- Series R (2) | 0.38 | 0.25 | 0.97 | 0.85 | 0.77 | — |
- Series S (2) | 0.41 | 0.27 | 1.05 | 0.92 | 0.41 | — |
- Series T (2) | 0.45 | 0.29 | 1.15 | 1.01 | 0.23 | — |
- Series U (2) | 3,820 | 2,474 | 5,019 | 3,935 | — | — |
| Non-cumulative convertible preference shares of US$0.01 | | | | | | |
- Series 1 (1) | 91.18 | 34.93 | 60.33 | 49.66 | 45.58 | 50.26 |
| Non-cumulative preference shares of €0.01 | | | | | | |
- Series 1 (2) | — | — | 49.46 | 46.53 | 39.63 | 37.18 |
- Series 2 (2) | — | — | 46.00 | 41.79 | 35.52 | 36.22 |
- Series 3 (2) | — | — | 3,125 | 2,782 | — | — |
| Non-cumulative convertible preference shares of £0.01 | | | | | | |
- Series 1 (1) | 114.68 | 73.87 | 73.87 | 73.87 | 73.87 | 73.87 |
| Non-cumulative preference shares of £1 | | | | | | |
- Series 1 (2) | — | — | 81.62 | 80.73 | — | — |
- Series 2 (redeemed April 2009) (2) | — | — | 54.71 | — | — | — |
| | | | | | | | | | | | | |
| | | Subordinated liabilities | | | Equity | | | Subordinated liabilities | | | Equity | | | Subordinated liabilities | | | Equity | | | Subordinated liabilities | | | Equity | |
| Amount per share | | | $ | | | | £ | | | | $ | | | | £ | | | | £ | | | | £ | | | | £ | | | | £ | | | | £ | | | | £ | |
| Non-cumulative preference shares of US$0.01 | | | | | | | | | | | | | | | | | | | | | | | | | | | | | | | | | | | | | | | | |
| – Series D (redeemed March 2006) | | | — | | | | — | | | | | | | | | | | | — | | | | | | | | 0.21 | | | | | | | | 1.13 | | | | | |
| – Series E (redeemed January 2007) | | | — | | | | — | | | | | | | | | | | | 0.04 | | | | | | | | 1.10 | | | | | | | | 1.12 | | | | | |
| – Series F | | | 1.91 | | | | 1.04 | | | | | | | | | | | | 0.96 | | | | | | | | 1.03 | | | | | | | | 1.06 | | | | | |
| – Series G (redeemed January 2007) | | | — | | | | — | | | | | | | | | | | | 0.04 | | | | | | | | 1.00 | | | | | | | | 1.02 | | | | | |
| – Series H | | | 1.81 | | | | 0.99 | | | | | | | | | | | | 0.91 | | | | | | | | 0.98 | | | | | | | | 1.00 | | | | | |
| – Series I (redeemed March 2006) | | | — | | | | — | | | | | | | | | | | | — | | | | | | | | 0.20 | | | | | | | | 1.10 | | | | | |
| – Series J (redeemed November 2005) | | | — | | | | — | | | | | | | | | | | | — | | | | | | | | — | | | | | | | | 1.06 | | | | | |
| – Series K (redeemed January 2007) | | | — | | | | — | | | | | | | | | | | | 0.04 | | | | | | | | 1.06 | | | | | | | | 1.09 | | | | | |
| – Series L | | | 1.44 | | | | 0.78 | | | | | | | | | | | | 0.72 | | | | | | | | 0.78 | | | | | | | | 0.79 | | | | | |
| – Series M | | | | | | | | | | | 1.60 | | | | 0.89 | | | | | | | | 0.80 | | | | | | | | 0.87 | | | | | | | | 0.88 | |
| – Series N | | | | | | | | | | | 1.59 | | | | 0.88 | | | | | | | | 0.79 | | | | | | | | 0.86 | | | | | | | | 0.55 | |
| – Series P | | | | | | | | | | | 1.56 | | | | 0.87 | | | | | | | | 0.78 | | | | | | | | 0.85 | | | | | | | | 0.13 | |
| – Series Q | | | | | | | | | | | 1.69 | | | | 0.94 | | | | | | | | 0.84 | | | | | | | | 0.53 | | | | | | | | — | |
| – Series R | | | | | | | | | | | 1.53 | | | | 0.85 | | | | | | | | 0.77 | | | | | | | | — | | | | | | | | — | |
| – Series S | | | | | | | | | | | 1.65 | | | | 0.92 | | | | | | | | 0.41 | | | | | | | | — | | | | | | | | — | |
| – Series T | | | | | | | | | | | 1.81 | | | | 1.01 | | | | | | | | 0.23 | | | | | | | | — | | | | | | | | — | |
| – Series U | | | | | | | | | | | 7,555 | | | | 3,935 | | | | | | | | — | | | | | | | | — | | | | | | | | — | |
| Non-cumulative convertible preference shares of US$0.01 | | | | | | | | | | | | | | | | | | | | | | | | | | | | | | | | | | | | | | | | |
| – Series 1 | | | 91.18 | | | | 49.66 | | | | | | | | | | | | 45.58 | | | | | | | | 50.26 | | | | | | | | 50.33 | | | | | |
| – Series 2 (redeemed March 2005) | | | — | | | | — | | | | | | | | | | | | — | | | | | | | | — | | | | | | | | 11.60 | | | | | |
| – Series 3 (redeemed December 2005) | | | — | | | | — | | | | | | | | | | | | — | | | | | | | | — | | | | | | | | 43.03 | | | | | |
| Non-cumulative convertible preference shares of €0.01 | | | | | | | | | | | | | | | | | | | | | | | | | | | | | | | | | | | | | | | | |
| – Series 1 (redeemed March 2005) | | | — | | | | — | | | | | | | | | | | | — | | | | | | | | — | | | | | | | | 11.54 | | | | | |
| Non-cumulative preference shares of €0.01 | | | | | | | | | | | | | | | | | | | | | | | | | | | | | | | | | | | | | | | | |
| – Series 1 | | | | | | | | | | | 67.95 | | | | 46.53 | | | | | | | | 39.63 | | | | | | | | 37.18 | | | | | | | | 41.14 | |
| – Series 2 | | | | | | | | | | | 61.03 | | | | 41.79 | | | | | | | | 35.52 | | | | | | | | 36.22 | | | | | | | | — | |
| Non-cumulative convertible preference shares of £0.01 | | | | | | | | | | | | | | | | | | | | | | | | | | | | | | | | | | | | | | | | |
| – Series 1 | | | 107.88 | | | | 73.87 | | | | | | | | | | | | 73.87 | | | | | | | | 73.87 | | | | | | | | 73.87 | | | | | |
| (1) | UKClassified as subordinated liabilities.
GAAP
2004
|
Amount per share | £ |
Non-cumulative preference shares of US$0.01 | |
– Series D (redeemed March 2006) | 1.11 |
– Series E (redeemed January 2007) | 1.10 |
– Series F | 1.04 |
– Series G (redeemed January 2007) | 1.00 |
– Series H | 0.98 |
– Series I (redeemed March 2006) | 1.08 |
– Series J (redeemed November 2005) | 1.15 |
– Series K (redeemed January 2007) | 1.07 |
– Series L | 0.19 |
– Series M | 0.30 |
Non-cumulative convertible preference shares of US$0.01 | |
– Series 1 | 49.05 |
– Series 2 (redeemed March 2005) | 47.43 |
– Series 3 (redeemed December 2005) | 41.74 |
Non-cumulative convertible preference shares of €0.01 | |
– Series 1 (redeemed March 2005) | 44.19 |
Non-cumulative preference shares of €0.01 | |
– Series 1 | 3.45 |
Non-cumulative convertible preference shares of £0.01 | |
– Series 1 | 73.87 |
The Group has undertaken that, unless otherwise agreed with the European Commission, neither the company nor any of its direct or indirect subsidiaries (other than companies in the RBS Holdings N.V. group, which are subject to different restrictions) will pay external investors any dividends or coupons on existing hybrid capital instruments (including preference shares, B shares and upper and lower tier 2 instruments) from 30 April 2010 for a period of two years thereafter ("the Deferral period"), or exercise any call rights in relation to these capital instruments between 24 November 2009 and the end of the deferral period, unless there is a legal obligation to do so. Hybrid capital instruments issued after 24 November 2009 will generally not be subject to the restriction on dividend or coupon payments or call options. 280
For further information, see Note 7 on the accounts.Ordinary dividends
Ordinary dividends per share for prior years in the table below have beenwere restated for the effect of the rights issue in June 2008 and the capitalisation issue in September 2008.
| | | IFRS 2007 | | | IFRS 2006 | | | IFRS 2005 | | 2010 pence | 2009 pence | 2008 pence | 2007 pence | 2006 pence |
Amount per share and American Depository Shares (1) | | pence | | | pence | | | pence | |
Amount per ordinary share and American Depository Share (1) | | 2010 pence | 2009 pence | 2008 pence | 2007 pence | 2006 pence |
Interim | | | 8.5 | | | | 6.8 | | | | 5.4 | |
Final (2)(3) | | | 19.3 | | | | 18.5 | | | | 14.8 | | — | — | 19.3 | 18.5 |
| Total dividends on equity shares | | | 27.8 | | | | 25.3 | | | | 20.2 | | — | — | 27.8 | 25.3 |
| | UK GAAP
2004
| |
Amount per share and American Depository Shares (1)
| | pence | |
Interim | | | 4.7 | |
Final (2)
| | | 11.5 | |
Total dividends on equity shares | | | 16.2 | |
| (1) | Each American Depository Share represents 20 ordinary shares. The historical amounts listedAs discussed under Trading market, the American Depository Shares were issued in October 2007 and consequently did not receive any of the table applyabove dividends prior to the ordinary shares, as the American Depositary Shares were not issued until October 2007 as described above under Trading Market.final dividend in respect of 2007. |
| (2) | In 2008, the company issued new ordinary shares by way of a capitalisation issue rather than paying an interim dividend. |
| (3) | Final dividends for each year were proposed in the indicated year and paid in the following year. |
In September 2008, the company issued new ordinary shares by way of a capitalisation issue rather than paying an interim dividend.
In December 2008, the company issued Series 2 non-cumulative preference shares of £1 each to HM Treasury, with an attached condition that no dividend is paid to ordinary shareholders until those preference shares are no longer in issue, unless otherwise agreed by HM Treasury. The company has reached agreement with HM Treasury to replace the Series 2 non-cumulative preference shares held by HM Treasury with new ordinary shares. Following redemption, the dividend restriction on ordinary shares will be removed. However, it is currently the Board’s intention not to pay any ordinary dividends for 2009.
For further information, see Notes 7 andNote 8 on the accounts.
The following discussion summarises certain US federal and UK tax consequences of the acquisition, ownership and disposition of ordinary shares, non-cumulative dollar preference shares, ADSs representing ordinary shares (ordinary ADSs), ADSs representing non-cumulative dollar preference shares (preference ADSs) or PROs by a beneficial owner that is a citizen or resident of the United States or that otherwise will be subject to US federal income tax on a net income basis in respect of the ordinary shares, non-cumulative dollar preference shares, ordinary ADSs, preference ADSs or PROs (a US Holder). This summary assumes that a US Holder is holding ordinary shares, non-cumulative dollar preference shares, ordinary ADSs, preference ADSs or PROs, as applicable, as capital assets. This summary does not address the tax consequences to a US Holder (i) that is resident (or, in the case of an individual, ordinarily resident) in the UK for UK tax purposes, (ii) that carries on a trade, profession or (ii)vocation through a branch, agency or permanent establishment in the UK in connection with which their ordinary shares, non-cumulative preference shares, ordinary ADSs, preference ADSs or PROs, are held, used or acquired, or (iii) generally, that is a corporation which alone or together with one or more associated companies, controls, directly or indirectly, 10% or more of the voting stock of the company, nor does this summary address the tax consequences to US Holders subject to special rules, such as certain financial institutions, dealers or traders in securities who use a mark-to-market method of tax accounting, persons holding ordinary shares, non-cumulative dollar preference shares, ordinary ADSs, preference ADSs or PROs as part of a hedging transaction, straddle, wash sale, conversion transaction or integrated transaction or persons entering into a constructive sale with respect to such securities, persons whose functional currency for US federal income tax purposes is not the US dollar, entities classified as partnerships for US federal income tax purposes, tax-exempt entities or persons that own or are deemed to own 10% or more of the voting stock of the company.
The statements and practices set forth below regarding US and UK tax laws, including the US/UK double taxation convention relating to income and capital gains which entered into force on 31 March 2003 (the Treaty), and the US/UK double taxation convention relating to estate and gift taxes (the Estate TaxTaxation Treaty), are based on those laws and practices as in force and as applied in practice on the date of this report. This summary is not exhaustive of all possible tax considerations and holders are advised to satisfy themselves as to the overall tax consequences, including specifically the consequences under US federal, state, local and other laws, and possible changes in taxation law, of the acquisition, ownership and disposition of ordinary shares, non-cumulative dollar preference shares, ordinary ADSs, preference ADSs or PROs by consulting their own tax advisers.
The following discussion assumes that the company is not, and will not become, a passive foreign investment company (PFIC) —- see ‘Passive Foreign Investment Company Considerations’(PFIC) considerations’ on page 285.380.
Ordinary shares, preference shares, ordinary ADSs and preference ADSs
Taxation of dividends
For the purposes of the Treaty, the Estate TaxTaxation Treaty and the US Internal Revenue Code of 1986 as amended (the Code), US Holders of ordinary ADSs and preference ADSs should be treated as owners of the ordinary shares and the non-cumulative dollar preference shares underlying such ADSs.
The US Treasury has expressed concerns that parties to whom depositary receipts are released before shares are delivered to the depositary, or intermediaries, in the chain of ownership between US holders and the issuer of the security underlying the depositary receipts may be taking actions that are inconsistent with the claiming of foreign tax credits for US holders of depositary receipts. Such actions in connection with pre-release activity would also be inconsistent with the claiming of the reduced rate of US tax applicable to dividends received by certain non-corporate US holders. Accordingly, the availability of the reduced tax rate for dividends received by certain non-corporate US holders of ordinary ADSs could be affected by actions taken by such parties or intermediaries.
The company is not required to withhold UK tax at source from dividend payments it makes or from any amount (including any amounts in respect of accrued dividends) distributed by the company. US Holders who are not resident or ordinarily resident in the UK and who do not carry on a trade, profession or vocation in the UK through a branch, agency or permanent establishment in connection with which their ordinary shares, non-cumulative preference shares, ordinary ADSs or preference ADSs are held, used or acquired will not be subject to UK tax in respect of any dividends received on the relevant shares or ADSs.
Distributions by the company (other than certain pro rata distributions of ordinary shares or rights to receive such shares) will constitute foreign source dividend income for US federal income tax purposes to the extent paid out of the current or accumulated earnings and profits of the company, as determined for US federal income tax purposes. Because the company does not maintain calculations of its earnings and profits under US federal income tax principles, it is expected that distributions will be reported to US Holders as dividends. Payments will not be eligible for the dividends-received deduction generally allowed to corporate US holders.
Subject to applicable limitations that may vary depending upon a holder’sholder's individual circumstances, dividends paid to certain non- corporatenon-corporate US Holders in taxable years beginning before 1 January 20112013 will be taxable at a maximum tax rate of 15%. Non-corporate US Holders should consult their own tax advisers to determine whether they are subject to any special rules that limit their ability to be taxed at this favourable rate.
Shareholder information continued | Shareholder information |
Dividends will be included in a US Holder’sHolder's income on the date of the US Holder’sHolder's (or in the case of ADSs, the Depositary’s)depositary's) receipt of the dividend. The amount of any dividend income paid in pounds sterling or euros to be taken into income by a US Holder will be athe US dollar amount calculated by reference to the relevant exchange rate in effect on the date of such receipt regardless of whether the payment is in fact converted into US dollars. If the dividend is converted into US dollars on the date of receipt, the US Holder generally should not be required to recognise foreign currency gain or loss in respect of the dividend income. If the amount of such dividend is not converted into US dollars on the date of receipt, the US Holder may have foreign currency gain or loss.
Taxation of capital gains
A US Holder that is not resident (or, in the case of an individual, ordinarily resident) in the UK will not normally be liable for UK tax on capital gains realised on the disposition of an ordinary share, a non-cumulative dollar preference share, an ordinary ADS or a preference ADS unless at the time of the disposal, in the case of a corporate US Holder, such US Holder carries on a trade in the UK through a permanent establishment or, in the case of any other US Holder, such US Holder carries on a trade, profession or vocation in the UK through a UK branch or agency and, in each case, such ordinary share, non-cumulative dollar preference share, ordinary ADS or preference ADS is or has been used, held or acquired by or for the purposes of such trade (or profession or vocation), carried on through such permanent establishment, branch or agency. Special rules apply to individuals who are temporarily not resident or ordinarily resident in the UK.
Shareholder information continued
A US Holder will, upon the sale or other disposition of an ordinary share, a non-cumulative dollar preference share, an ordinary ADS or a preference ADS, or upon the redemption of a non-cumulative dollar preference share or preference ADS, generally recognise capital gain or loss for US federal income tax purposes (assuming that in the case of a redemption of a non-cumulative dollar preference share or a preference ADS, such US Holder does not own, and is not deemed to own, any ordinary shares or ordinary ADSs of the company) in an amount equal to the difference between the amount realised (excluding in the case of a redemption any amount treated as a dividend for US federal income tax purposes, which will be taxed accordingly) and the US Holder’sHolder's tax basis in such share or ADS. This capital gain or loss will be long-term capital gain or loss if the US Holder held the share or ADS so sold, disposed or redeemed for more than one year.
A US Holder who is liable for both UK and US tax on a gain recognised on the disposal of an ordinary share, a non-cumulative dollar preference share, an ordinary ADS or a preference ADS will generally be entitled, subject to certain limitations, to credit the UK tax against its US federal income tax liability in respect of such gain.
If a corporate US Holder is subject to UK corporation tax by reason of carrying on a trade in the UK through a permanent establishment and its non-cumulative dollar preference share or preference ADS is, or has been, used, held or acquired for the purposes of that permanent establishment, certain provisions introduced by the Finance (No. 2) Act 2005 will apply if the US Holder holds its non-cumulative dollar preference share or preference ADS for a ‘tax avoidance purpose’. If these provisions apply, dividends on the non-cumulative dollar preference share or preference ADS, as well as certain fair value credits and debits arising in respect of such share or ADS, will be brought within the charge to UK corporation tax on income and the UK tax position outlined in the preceding paragraphs will not apply in relation to such US Holder.
Estate and gift tax
Subject to the discussion of the Estate Tax Treaty in the nextfollowing paragraph, ordinary shares, non-cumulative dollar preference shares, ordinary ADSs or preference ADSs beneficially owned by an individual may be subject to UK inheritance tax (subject to exemptions and reliefs) on the death of the individual or in certain circumstances, if such shares or ADSs are the subject of a gift (including a transfer at less than market value) by such individual. (InheritanceInheritance tax is not generally chargeable on gifts to individuals made more than seven years before the death of the donor).donor. Ordinary shares, non-cumulative dollar preference shares, ordinary ADSs or preference ADSs held by the trustees of a settlement willmay also be subject to UK inheritance tax. Special rules apply to such settlements.
An ordinary share, a non-cumulative dollar preference share, an ordinary ADS or a preference ADS beneficially owned by an individual, whose domicile is determined to be the United States for purposes of the Estate Tax Treaty and who is not a national of the UK, will not be subject to UK inheritance tax on the individual’sindividual's death or on a lifetime transfer of such share or ADS, except in certain cases where the share or ADS (i) is comprised in a settlement (unless, at the time of the settlement, the settlor was domiciled in the United States and was not a national of the UK); (ii) is part of the business property of a UK permanent establishment of an enterprise; or (iii) pertains to a UK fixed base of an individual used for the performance of independent personal services. The Estate Tax Treaty generally provides a credit against US federal estate or gift tax liability for the amount of any tax paid in the UK in a case where the ordinary share, non-cumulative dollar preference share, ordinary ADS or preference ADS is subject to both UK inheritance tax and US federal estate or gift tax.
UK stamp duty and stamp duty reserve tax (SDRT)
The following is a summary of the UK stamp duty and SDRT consequences of transferring an ADS or ADR in registered form (otherwise than to the custodian on cancellation of the ADS) or of transferring an ordinary share or a non-cumulative dollar preference share. A transfer of a registered ADS or ADR executed and retained in the United States will not give rise to stamp duty and an agreement to transfer a registered ADS or ADR will not give rise to SDRT. Stamp duty or SDRT will normally be payable on or in respect of transfers of ordinary shares or non-cumulative dollar preference shares and accordingly any holder who acquires or intends to acquire ordinary shares or non-cumulative dollar preference shares is advised to consult its own tax advisers in relation to stamp duty and SDRT.
Shareholder information continued | Shareholder information |
Taxation for US Holders continued
PROs
United States
Payments of interest on a PRO (including any UK withholding tax, as to which see below) will constitute foreign source dividend income for US federal income tax purposes to the extent paid out of the current or accumulated earnings and profits of the company, as determined for US federal income tax purposes. Because the company does not maintain calculations of its earnings and profits under US federal income tax principles, it is expected that distributions will be reported to US Holders as dividends. Payments will not be eligible for the dividends-received deduction generally allowed to corporate US holders. A US Holder who is entitled under the Treaty to a refund of UK tax, if any, withheld on a payment will not be entitled to claim a foreign tax credit with respect to such tax.
Subject to applicable limitations that may vary depending upon a holder’sholder's individual circumstances, dividends paid to certain non- corporatenon-corporate US Holders in taxable years beginning before 1 January 20112013 will be taxable at a maximum tax rate of 15%. Non-corporate US Holders should consult their own tax advisers to determine whether they are subject to any special rules that limit their ability to be taxed at this favourable rate.
In addition, bills have been introduced in both the US House and the US Senate which would have denied the favourable tax rates described in the preceding paragraph for dividends paid in respect of certain securities, including securities such as PROs, where the issuer of the securities is allowed a deduction under the tax laws of a foreign country with respect to such dividend. The proposed legislation would have applied to dividends received after the date of its enactment. It is not possible to predict whether similar legislation might be reintroduced and enacted in the future. Non-corporate US Holders should consult their tax advisers with respect to the potential enactment of proposed legislation and its application in their particular circumstances.
A US Holder will, upon the sale, exchange or redemption of a PRO, generally recognise capital gain or loss for US federal income tax purposes (assuming that in the case of a redemption, such US Holder does not own, and is not deemed to own, any ordinary shares or ordinary ADSs of the company) in an amount equal to the difference between the amount realised (excluding any amount in respect of mandatory interest and any missed payments which are to be satisfied on a missed payment satisfaction date, which would be treated as ordinary income) and the US Holder’sHolder's tax basis in the PRO.
Shareholder information continued
A US Holder who is liable for both UK and US tax on gain recognised on the disposal of PROs will generally be entitled, subject to certain limitations, to credit the UK tax against its US federal income tax liability in respect of such gain.
United Kingdom
Taxation of payments on the PROs
Payments on the PROs will constitute interest rather than dividends for UK withholding tax purposes. However, the PROs will constitute ‘quoted eurobonds’'quoted eurobonds' within the meaning of section 987 of the Income Tax Act 2007 and therefore payments of interest will not be subject to withholding or deduction for or on account of UK taxationtax as long as the PROs remain at all times listed on a ‘recognised'recognised stock exchange’exchange' within the meaning of section 1005 of the Income Tax Act 2007.2007, such as the main market of the New York Stock Exchange. In all other cases, an amount must be withheld on account of UK income tax at the basic rate (currently 20%) subject to any direction to the contrary by HM Revenue & Customs under the Treaty and except that the withholding obligation is disapplied in respect ofdoes not apply to payments to persons who the company reasonably believes are within the charge to corporation tax or fall within various categories enjoying a special tax status (including charities and pension funds), or are partnerships consisting of such persons (unless HM Revenue & Customs directs otherwise). Where interest has been paid under deduction of UK withholding tax, US Holders may be able to recover the tax deducted under the Treaty.
Any paying agent or other person by or through whom interest is paid to, or by whom interest is received on behalf of an individual, may be required to provide information in relation to the payment and the individual concerned to HM Revenue & Customs. HM Revenue & Customs may communicate this information to the tax authorities of other jurisdictions.
HM Revenue & Customs confirmed at around the time of the issue of the PROs that interest payments would not be treated as distributions for UK tax purposes by reason of (i) the fact that interest may be deferred under the terms of issue; or (ii) the undated nature of the PROs, provided that at the time an interest payment is made, the PROs are not held by a company which is ‘associated’'associated' with the company or by a ‘funded company’'funded company'. A company will be associated with the company if, broadly speaking, it is part of the same group as the company. A company will be a ‘funded company’'funded company' for these purposes if there are arrangements involving that company being put in funds (directly or indirectly) by the company, or an entity associated with the company. In this respect, HM Revenue & Customs has confirmed that a company holding an interest in the PROs which incidentally has banking facilities with any company associated with the company will not be a ‘funded company’'funded company' by virtue of such facilities.
Interest on the PROs constitutes UK source income for UK tax purposes and, as such, may be subject to income tax by direct assessment even where paid without withholding. However, interest with a UK source received without deduction or withholding on account of UK tax will not be chargeable to UK tax in the hands of a US Holder unless, in the case of a corporate US Holder, such US Holder carries on a trade in the UK through a UK permanent establishment or in the case of other US Holders, such persons carry on a trade, profession or vocation in the UK through a UK branch or agency in each case in connection with which the interest is received or to which the PROs are attributable. There are also exemptions for interest received by certain categories of agents (such as some brokers and investment managers).
EU Directive on taxation of savings income
The European Union has adopted a directive regarding the taxation of savings income. The Directive requires member states of the European Union to provide to the tax authorities of other member states details of payments of interest and other similar income paid by a person to an individual or certain other persons resident in another member state, except that Belgium, Luxembourg and Austria may instead impose a withholding system for a transitional period unless during such period they elect otherwise.
Shareholder information continued | Shareholder information |
Disposal (including redemption)
A disposal (including redemption) of PROs by a non-corporate US Holder will not give rise to any liability to UK taxationtax on capital gains unless the US Holder carries on a trade (which for this purpose includes a profession or a vocation) in the UK through a branch or agency and the PROs are, or have been, held or acquired for the purposes of that trade, carried on through such branch or agency.
A transfer of PROs by a US Holder will not give rise to a charge to UK tax on accrued but unpaid interest payments, unless the US Holder is an individual or other non-corporate taxpayer and at any time in the relevant year of assessment or accounting period carries on a trade, profession or vocation in the UK through a branch or agency to which the PROs are attributable.
Annual tax charges
Corporate US Holders of PROs may be subject to annual UK tax charges (or relief) by reference to fluctuations in exchange rates and in respect of profits, gains and losses arising from the PROs, but only if such corporate US Holders carry on a trade profession or vocation in the UK through a UK permanent establishment to which the PROs are attributable.
Inheritance tax
In relation to PROs held through DTC (or any other clearing system), the UK inheritance tax position is not free from doubt in respect of a lifetime transfer, or death of, a US Holder who is not domiciled nor deemed to be domiciled in the UK for inheritance tax purposes; HM Revenue & Customs is known to consider that the situs of securities held in this manner is not necessarily determined by the place where the securities are registered. In appropriate circumstances, there may be a charge to UK inheritance tax as a result of a lifetime transfer at less than market value by, or on the death of, such US Holder. Inheritance tax is not generally chargeable on gifts to individuals made more than seven years before the death of the donor. However, exemption from, or a reduction of, any such UK tax liability may be available under the Estate Tax Treaty (see below). US Holders should consult their professional advisers in relation to such potential liability.
PROs beneficially owned by an individual, whose domicile is determined to be the United States for the purposes of the Estate Tax Treaty and who is not a national of the UK, will not be subject to UK inheritance tax on the individual’sindividual's death or on a lifetime transfer of the PRO, except in certain cases where the PRO (i) is comprised in a settlement (unless, at the time of the settlement, the settlor was domiciled in the United States and was not a national of the UK); (ii) is part of the business property of a UK permanent establishment of an enterprise; or (iii) pertains to a UK fixed base of an individual used for the performance of independent personal services. The Estate Tax Treaty generally provides a credit against US federal estate or gift tax liability for the amount of any tax paid in the UK in a case where the PRO is subject to both UK inheritance tax and US federal estate or gift tax.
Stamp duty and SDRT
No stamp duty, SDRT or similar tax is imposed in the UK on the issue, transfer or redemption of the PROs.
Passive Foreign Investment Company (PFIC) considerations A foreign corporation will be a PFIC in any taxable year in which, after taking into account the income and assets of the corporation and certain subsidiaries pursuant to applicable ‘look-through rules’'look-through rules', either (i) at least 75% of its gross income is ‘passive income’'passive income' or (ii) at least 50% of the average value of its assets is attributable to assets which produce passive income or are held for the production of passive income. The company does not believe that it was as a PFIC for its 20082010 taxable year. Although interest income is generally passive income, a special rule allows banks to treat their banking business income as non-passive. To qualify for this rule, a bank must satisfy certain requirements regarding its licensing and activities. The company believes that it currently meets these requirements. The company’scompany's possible status as a PFIC must be determined annually, however, and may be subject to change if the company fails to qualify under this special rule for any year in which a US Holder holds ordinary shares, non-cumulative dollar preference shares, ordinary ADSs, preference ADSs or PROs. If the company were to be treated as a PFIC in any year during which a US Holder holds ordinary shares, non-cumulative dollar preference shares, ordinary ADSs, preference ADSs or PROs, US Holders would generally be subject to adverse US federal income tax consequences. Holders should consult their own tax advisers as to the potential application of the PFIC rules to the ownership and disposition of the company’scompany's ordinary shares, non-cumulative dollar preference shares, ordinary ADSs, preference ADSs or PROs.
Information reporting
For taxable years beginning after 18 March 2010, new legislation requires certain US Holders who are individuals to report information relating to interests held in stock of a non-US person, subject to certain exceptions (including an exception for stock held in custodial accounts maintained by a US financial institution). US Holders are urged to consult their tax advisers regarding the effect, if any, of this legislation on the acquisition, ownership and disposition of ordinary shares, non-cumulative dollar preference shares, ordinary ADSs, preference ADSs or PROs.
The company has been advised that there are currently no UK laws, decrees or regulations which would prevent the import or export of capital, including the availability of cash or cash equivalents for use by the Group, or the remittance of dividends, interest or other payments to non-UK resident holders of the company’scompany's securities.
There are no restrictions under the Articles of Association of the company or under UK law, as currently in effect, which limit the right of non-UK resident owners to hold or, when entitled to vote, freely to vote the company’scompany's securities.
The company’s Memorandum and Articles of Association as in effect at the date of this annual report are registered with the Registrar of Companies of Scotland.
The following information is a summary of certain terms of the company’s Memorandum of Association (the “Memorandum”) and Articles of Association (the “Articles”) as in effect at the date of this Annual Report and certain relevant provisions of the Companies Act 1985, as amended (the “ 1985 Act”) and the Companies Act 2006 (the “2006 Act”) where appropriate and as relevant to the holders of any class of share. The current Articles were last amendedadopted on 3 28 April 2009.2010. The amendmentsArticles were updated primarily to reflect the coming into force of the remaining provisions of the 2006 Act and the implementation of the Shareholder Rights Directive in the UK. A further amendment was made to the Articles were designedat a General Meeting held on 28 April 2010 in relation to vary the class rightsprice at which certain classes of HM Treasury in its capacity as the holder of non-cumulative sterling preference shares may be purchased.
Shareholder information continued | Shareholder information |
The following summary description is qualified in its entirety by reference to the terms and provisions of the Memorandum and Articles.Articles (and, in the case of the summary description of the non-cumulative preference shares, the B Shares and the Dividend Access Share, by reference to the terms of issue of those shares determined by the Directors pursuant to the Articles prior to allotment). The Memorandum and Articles are registered with the Registrar of Companies of Scotland. Holders of any class of share are encouraged to read the full Memorandum and Articles, which have been filed as an exhibit to this annual report on Form 20-F.
The company was incorporated and registered in Scotland under the Companies Act 1948 as a limited company on 25 March 1968 under the name National and Commercial Banking Group Limited. On 3 September 1979 the name was changed to The Royal Bank of Scotland Group Limited and on 10 March 1982, it changed its name to its present name and was registered under the Companies Acts 1948 to 1980 as a public company with limited liability. The company is registered under Company No. SC 45551.
Purpose and objects
The Memorandum provides, amongst other things, that its objects are to carry on2006 Act greatly reduces the business of banking in all or any of its aspects and to carry on the businessconstitutional significance of a holdingcompany’s memorandum of association and provides that a memorandum of association will record only the names of the subscribers and the number of shares each subscriber has agreed to take in the company. The 2006 Act further states that, unless a company’s articles provide otherwise, a company’s objects are set out in full inunrestricted and abolishes the need for companies to have objects clauses. The company removed its objects clause 4together with all other provisions of its memorandum of association which by virtue of the Memorandum.2006 Act were treated as forming part of the company’s articles. The articles of association contain an express statement regarding the limited liability of the shareholders.
Directors
At each annual general meeting of the company, any Director appointed since the last annual general meeting and any Directors who were not appointed at one of the preceedingpreceding two annual general meetings shall retire from office and may offer themselves for re-election by the members. Directors who have attained the age of 16 may be appointed to or remain on the Board if that appointment is or was made or approved by the company in a general meeting.
Directors may be appointed by the company by ordinary resolution or by the Board. A director appointed by the Board holds office only until the next annual general meeting, whereupon he will be eligible for re-election. Unless and until otherwise determined by ordinary resolution, the directors (other than alternate directors) shall be not more than twenty five. There is no stipulation in the Articles regarding a minimum number of directors; under the 2006 Act, and in the absence of express provision, the minimum number is two.
Directors’ interests
A director shall not vote at a meeting of the Board or a committee of the Board on any resolution of the Board concerning a matter in which he has an interest (otherwise than by virtue of his interest in shares, debentures or other securities of, or otherwise in or through, the company) which (together with any interest of any person connected with him) is, to his knowledge, material unless his interests arises only because the resolution relates to one or more of the following matters:
| i. | (i) the giving of any security or indemnity to him pursuant to the Articles or in respect of money lent, or obligations incurred, by him at the request of, or for the benefit of, the company or any of its subsidiary undertakings; |
| ii. | (ii) the giving of any security or indemnity to a third party in respect of a debt or obligation of the company or any of its subsidiary undertakings for which he has assumed responsibility (in whole or in part) under a guarantee or indemnity or by the giving of security; |
| iii. | (iii) a proposal concerning an offer of shares, debentures or other securities of the company, or any of its subsidiary undertakings, for subscription or purchase, in which offer he is, or may be, entitled to participate as a holder of securities or in the underwriting or sub-underwriting of which he is to participate; |
(iv) any proposal concerning any other body corporate in which he is interested, directly or indirectly, whether as an officer or shareholder or otherwise, provided that he is not the holder of shares representing one per cent or more of any class of the equity share capital of such body corporate;
(v) any proposal concerning the adoption, modification or operation of a pension fund or retirement, death or disability benefits scheme or employees’ share scheme which relates both to directors and employees of the company or a subsidiary of the company and does not provide any privilege or advantage in respect of any director which it does not accord to the employees to which the fund or scheme relates; 285
(vi) a contract or arrangement for the benefit of the employees of the company or any of its subsidiary undertakings which does not accord him any privilege or advantage not generally accorded to the employees to whom the contract or arrangement relates; and
Shareholder information continued
| iv. | any proposal concerning any other body corporate in which he is interested, directly or indirectly, whether as an officer or shareholder or otherwise, provided that he is not the holder of shares representing one per cent or more of any class of the equity share capital of such body corporate; |
| v. | any proposal concerning the adoption, modification or operation of a pension fund or retirement, death or disability benefits scheme or employees’ share scheme which relates both to directors and employees of the company or a subsidiary of the company and does not provide any privilege or advantage in respect of any director which it does not accord to the employees to which the fund or scheme relates; |
| vi. | a contract or arrangement for the benefit of the employees of the company or any of its subsidiary undertakings which does not accord him any privilege or advantage not generally accorded to the employees to whom the contract or arrangement relates; and |
| vii. | a proposal concerning any insurance which the company proposes to purchase and/or maintain for the benefit of any directors or for persons who include directors of the company. |
Under the 2006 Act, from 1 October 2008 a director must avoid a situation where he has, or can have, a direct or indirect interest that conflicts, or possibly may conflict, with the company’s interests. The 2006 Act allows directors of public companies, where appropriate, to authorise conflicts and potential conflicts where the articles of association contain a provision to this effect. The 2006 Act also allows the articles of association to contain other provisions for dealing with directors’ conflicts of interest to avoid a breach of duty.
Clause 10092 of the Articles, to take effect from 1 October 2008, gives the directors authority to authorise any matter which would or might otherwise constitute or give rise to a breach of the duty of a director under the 2006 Act to avoid a situation in which he has, or can have, a direct or indirect interest that conflicts, or possibly may conflict with the company.
Authorisation of any matter pursuant to Clause 10092 must be approved in accordance with normal board procedures by directors who have no interest in the matter being considered. In taking the decision, the directors must act in a way they consider, in good faith, will be most likely to promote the company’s success.
Shareholder information continued | Shareholder information |
Any authorisation of a matter may be given on or subject to such conditions or limitations as the directors determine, whether at the time of authorisation or subsequently, including providing for the exclusion of the interested directors from the receipt of information or participation in discussion relating to the matter authorised by the directors and providing that interested directors in receipt of confidential information from a third party are not obliged to disclose such information to the company or use the information in relation to the company’s affairs. Any authorization may be terminated by the directors at any time.
A director is not, except as otherwise agreed by him, accountable to the company for any benefit which he, or a person connected with him, derives from any matter authorised by the directors and any contract, transaction or arrangement relating to such matter is not liable to be avoided on the grounds of such benefit.
Directors’ power to allot securities
In line with market practice, the Articles provide that the authority to allot shares and the disapplication of pre-emption rights will not be set out in the Articles, but subject to resolutions passed at the company’s annual general meeting to obtain these authorities on an annual basis.
Borrowing powers
The directors may exercise all the powers of the company to borrow money and to mortgage or charge its undertaking, property and uncalled capital and to issue debentures and other securities, whether outright or as collateral security for any debt, guarantee, liability or obligation of the company, or of any third party.
Qualifying shareholding
Directors are not required to hold any shares of the company by way of qualification.
Classes of shares
The company has issued and outstanding the following 3five general classes of shares, namely ordinary shares, preference shares, and non-voting deferred shares, B Shares and a Dividend Access Share, to which the provisions set forth below apply. In addition, the company has authorized as part of its share capital Additional Value Shares (“AVSs”). All of the issued AVSs were converted into non-voting deferred shares in December 2003. The terms of those AVSs are set out in Schedule 4 to the Articles. The terms of the issued B Shares (designated Series 1 Class B Shares) and the Dividend Access Share (designated a Series 1 Dividend Access Share) were determined by the directors pursuant to the Articles prior to the time of allotment, and apply as if they were set out in the Articles.
Dividends
General
Subject to the provisions of the 19852006 Act and clause 133Clause 123 of the Articles, the company may, by ordinary resolution, declare dividends on ordinary shares save that no dividend shall be payable except out of profits available for distribution, or in excess of the amount recommended by the Board or in contravention of the special rights attaching to any share. Any dividend which has remained unclaimed for 12 years from the date of declaration shall be forfeited and shall revert to the company.
The company may cease sending dividend warrants and cheques by post or otherwise to a member if such instruments have been returned undelivered to, or left uncashed by, that member on at least two consecutive occasions, or, following one such occasion, reasonable enquiries have failed to establish any new address or account of the registered holder. The company may resume sending warrants and cheques if the holder requests such recommencement in writing.
Preference shares
Each cumulative preference share confers the right to a fixed cumulative preferential dividend payable half-yearly. Each non-cumulative preference share confers the right to a preferential dividend (not exceeding a specified amount) payable in the currency of the relevant share. The rate of such dividend and the date of payment thereof, together with the terms and conditions of the dividend, are as may be determined by the directors prior to allotment. Cumulative preference share dividends are paid in priority to any dividend on any other class of share.
The non-cumulative preference shares rank for dividend after the cumulative preference shares but rank pari passu with each other and any shares expressed to rank, in terms of participation in the profits of the company, in some or all respects pari passu therewith and otherwise in priority to dividends payable on the ordinary shares and any other share capital in the company.
The directors may resolve prior to the issue and allotment of any series of non-cumulative preference shares that full dividends in respect of a particular dividend payment date will not be declared and paid if, (i) in its sole and absolute discretion, the directors resolve prior to the relevant dividend payment date that such dividend (or part thereof) shall not be paid and/or (ii) in the opinion of the directors, payment of a dividend would cause a breach of the UK Financial Services Authority’sAuthority ’ s capital adequacy requirements applicable to the company or its subsidiaries, or subject to the next following paragraph, insufficient distributable profits of the company are available to cover the payment in full of all dividends after having paid any dividends payable on any of the cumulative preference shares.
Shareholder information continued
If dividends will be paid but, in the opinion of the directors, insufficient distributable profits of the company are available to cover the payment in full of dividends after having paid any dividends payable on any of the cumulative preference shares, dividends will be declared by the directors, pro rata on the non-cumulative preference shares to the extent of the available distributable profits.
The non-cumulative preference shares will carry no further rights to participate in the profits of the company and if, and to the extent, any dividend or part of any dividend is on any occasion not paid for any of the reasons described above, holders of non-cumulative preference shares will have no claim in respect of such non-payment.
If any dividend is not payable for the reasons described in clause (ii) of the third paragraph of this subsection, the directors may pay a special dividend not exceeding US$0.01, £0.01£ 0.01 or €0.01€ 0.01 (depending on the currency of the relevant preference share) per share.
Shareholder information continued | Shareholder information |
If the dividend payable on any series of non-cumulative preference shares on the most recent payment date is not paid in full, or if a sum is not set aside to provide for such payment in full, in either case for the reasons set forth in clause (ii) of the third paragraph of this subsection, no dividends may be declared on any other share capital of the company and no sum may be set aside for the payment of a dividend on any other share capital (in each case other than the cumulative preference shares), unless, on the date of declaration, an amount equal to the dividend payable in respect of the then current dividend period for such series of non-cumulative preference shares is set aside for payment in full on the next dividend payment date.
If any dividend payable on the non-cumulative preference shares is not paid in full or if a sum is not set aside to provide for such payment in full (in either case for the reasons set forth in clause (ii) of the third paragraph of this subsection), the company may not redeem or purchase or otherwise acquire any other share capital of the company and may not set aside any sum nor establish any sinking fund for its redemption, purchase or other such acquisition, until such time as dividends have been declared and paid in full in respect of successive dividend periods together aggregating not less than twelve months.
The non-payment of any dividend (in full or in part) by reason of the exercise of the directors’ discretion referred to in clause (i) of the third paragraph of this subsection, shall not prevent or restrict (a) the declaration and payment of dividends on any other series of non-cumulative preference shares or on any non-cumulative preference shares expressed to rank pari passu with the non-cumulative preference shares, (b) the setting aside of sums for the payment of such dividends, (c) except as set forth in the following paragraph, the redemption, purchase or other acquisition of shares in the company by the company, or (d) except as set forth in the following paragraph, the setting aside of sums, or the establishment of sinking funds, for any such redemption, purchase or other acquisition by the company.
If dividends are not declared and paid in full on any series of non-cumulative preference shares as a result of the directors’ discretion referred to in clause (i) of the third paragraph of this subsection, then the company may not redeem, purchase or otherwise acquire for any consideration any share capital ranking after such preference shares, and may not set aside any sum nor establish any sinking fund for the redemption, purchase or other acquisition thereof, until such time as the company has declared and paid in full dividends on such series of non-cumulative preference shares in respect of successive dividend periods together aggregating no less than twelve months. In addition, no dividend may be declared or paid on any of the company’s share capital ranking after such preference shares until the dividend in respect of a particular dividend payment date payable on the preference shares to which the directors’ discretion in clause (i) of the third paragraph of this subsection applies has been declared and paid in full.
Non-voting deferred shares
The holders of non-voting deferred shares are not entitled to the payment of any dividend or other distribution.
B Shares
Prior to the occurrence of a Trigger Event (as defined below) in respect of any Series 1 Class B Shares, those Series 1 Class B Shares rank equally with the holders of ordinary shares in respect of any cash dividends, and each Series 1 Class B Share will entitle its holder to the same cash dividend as is (or may, at the election of a holder of the ordinary share, be) payable to the holder of one ordinary share, as adjusted from time to time to reflect any consolidation, reclassification or subdivision in relation to the ordinary shares.
If a Trigger Event has occurred in respect of any Series 1 Class B Shares, the Series 1 Class B Shares in respect of which the Trigger Event has occurred will rank pari passu with the holders of the ordinary shares in respect of any dividends paid on the ordinary shares. Each Series 1 Class B Share will entitle its holder to the same dividend as is (or may, at the election of a holder of an ordinary share, be) payable to the holder of one (as adjusted from time to time) ordinary share. If a bonus issue of fully paid ordinary shares is made to holders of ordinary shares in lieu of a dividend, a holder of a Series 1 Class B Share in respect of which the Trigger Event has occurred will be entitled to receive the same number of ordinary shares as is payable to the holder of one (as adjusted from time to time) ordinary share, save that if the issue of such ordinary share(s) to such holder would result in it holding directly or indirectly more than 75% of the total issued ordinary shares, then such holder will instead receive further Series 1 Class B Shares of the same value.
A Trigger Event occurs in relation to the Series 1 Class B Shares in issue at the relevant time, if the daily volume weighted average price of the company’s ordinary shares on the London Stock Exchange equals or exceeds £0.65 per ordinary share (subject to adjustment) for 20 or more complete dealing days in any period of 30 consecutive dealing days.
Dividend Access Share
Subject to the discretions, limitations and qualifications described in this subsection, non-cumulative dividends on the Series 1 Dividend Access Share will be payable from 22 December 2009 in respect of the period up to and including the Series 1 Class B Dividend Stop Date (if any).
The company will pay dividends on the Series 1 Dividend Access Share when, as and if declared by its board of directors or a duly authorised committee of such board of directors (the ‘‘board of directors’’). Subject to the discretions, limitations and qualifications described in this section, the Series 1 Dividend Access Share will entitle the holder to receive out of the distributable profits of the company a non-cumulative dividend at the rate described below (the ‘‘Dividend Access Share Dividend’’), in priority to the payment of any dividend to the holders of any class of ordinary share or Class B Share and pari passu in such regard with the holder of any other dividend access share then in issue.
The board of directors may in its sole and absolute discretion resolve that no Dividend Access Share Dividend shall be paid on a Dividend Access Share Dividend payment date.
Shareholder information continued | Shareholder information |
The board of directors will, by 31 October in each financial year of the company, decide whether or not to pay an interim dividend on the ordinary shares or make an interim Ordinary Share Bonus Issue in that financial year. If it is decided that an interim dividend on the ordinary shares or an interim Ordinary Share Bonus Issue is to be paid or made in any financial year, the corresponding semi-annual (hereinafter referred to as ‘‘first semi-annual’’) Dividend Access Share Dividend or Bonus Issue on the Series 1 Dividend Access Share in the same financial year will be paid or made at the time set out below. The record date for any first semi-annual Dividend Access Share Dividend or Bonus Issue on the Series 1 Dividend Access Share will be the same as the record date for any interim dividend on the ordinary shares or interim Ordinary Share Bonus Issue in the relevant financial year or otherwise will be three business days before 31 October in each year. If paid or made, the first semi-annual Dividend Access Share Dividend or Bonus Issue on the Series 1 Dividend Access Share in a financial year will be paid or made on the same date that the corresponding interim dividend on the ordinary shares is paid or interim Ordinary Share Bonus Issue is made. If it is decided that no such interim dividend on the ordinary shares or interim Ordinary Share Bonus Issue will be paid or made in a financial year, the first semi-annual Dividend Access Share Dividend or Bonus Issue on the Series 1 Dividend Access Share in such financial year will, if to be paid or made, be so paid or made on 31 October in such financial year (commencing in 2010).
The board of directors will, by 31 May in each financial year of the company, decide whether or not to recommend a dividend on the ordinary shares or make an Ordinary Share Bonus Issue which is expressed to be a final dividend for the immediately preceding financial year. If it is decided that such a dividend on the ordinary shares or Ordinary Share Bonus Issue is to be recommended and is subsequently approved by shareholders, the corresponding semi-annual (hereinafter referred to as ‘‘second semi-annual’’) Dividend Access Share Dividend or Bonus Issue on the Series 1 Dividend Access Share expressed to be for the corresponding period will be paid at the time set out below. The record date for any second semi-annual Dividend Access Share Dividend or Bonus Issue on the Series 1 Dividend Access Share will be the same as the record date for any final dividend on the ordinary shares or final Ordinary Share Bonus Issue for the relevant financial year or otherwise will be three business days before 31 May in each year. If paid or made, the second semi-annual Dividend Access Share Dividend or Bonus Issue on the Series 1 Dividend Access Share in a financial year will be paid or made on the same date that the corresponding final dividend on the ordinary shares is paid or final Ordinary Share Bonus Issue is made. If it is decided that no such final dividend on the ordinary shares or Ordinary Share Bonus Issue will be paid or made in any year (the ‘‘current year’’) for the immediately preceding financial year, any second semi-annual Dividend Access Share Dividend or Bonus Issue on the Series 1 Dividend Access Share expressed to be for the corresponding period will, if to be paid or made, be so paid or made on 31 May in the current year (commencing in 2010).
Any first semi-annual Dividend Access Share Dividend or second semi-annual Dividend Access Share Dividend will only be paid if (to the extent legally required) profits are available for distribution and are permitted by law to be distributed.
If paid or made, the first semi-annual Dividend Access Share Dividend on the Series 1 Dividend Access Share will be equivalent to (A) the greater of:
(i) 7% of the Reference Amount multiplied by the actual number of days in the period from (but excluding) the immediately preceding Relevant Date (or, if none, 22 December 2009), to (and including) the current Relevant Date (or, if there has occurred prior to such current Relevant Date a Series 1 Class B Dividend Stop Date in respect of any Series 1 Class B Shares, then in respect of those Series 1 Class B Shares, to (and including) such earlier Series 1 Class B Dividend Stop Date), divided by 365 (or 366 in a leap year)
(ii) if a cash dividend or cash dividends on the ordinary shares or Ordinary Share Bonus Issue(s) is/are paid or made in the period from (but excluding) the immediately preceding Relevant Date (or, if none, 22 December 2009) to (and including) the current Relevant Date (or, if there has occurred prior to such current Relevant Date a Series 1 Class B Dividend Stop Date in respect of any Series 1 Class B Shares, then in respect of those Series 1 Class B Shares, to (and including) such earlier Series 1 Class B Dividend Stop Date), 250% (as adjusted from time to time as described in the terms of issue of the Series 1 Dividend Access Share, the ‘‘Participation Rate’’) of the aggregate fair market value (as defined in the terms of issue of the Series 1 Dividend Access Share) of such cash dividend or cash dividends or Ordinary Share Bonus Issue per ordinary share multiplied by the then Reference Series 1 Class B Shares Number. Where a dividend in cash is announced which may at the election of a shareholder or shareholders be satisfied by the issue or delivery of ordinary shares in an Ordinary Share Bonus Issue, or where an Ordinary Share Bonus Issue is announced which may at the election of a shareholder or shareholders be satisfied by the payment of cash, then the fair market value of such dividend or Ordinary Share Bonus Issue will be deemed to be the amount of the dividend in cash or of the payment in cash (as the case may be)
less (B) the fair market value (as defined in the terms of issue of the Series 1 Dividend Access Share) of the aggregate amount of any dividend or distribution paid or made on the Series 1 Class B Shares and/or on any ordinary shares issued on conversion of the B Shares (regardless of who holds such Series 1 Class B Shares or ordinary shares at the relevant time) in the period from (but excluding) the immediately preceding Relevant Date (or, if none, 22 December 2009) to (and including) the current Relevant Date (or, if there has occurred prior to such current Relevant Date a Series 1 Class B Dividend Stop Date in respect of any Series 1 Class B Shares, then in respect of those Series 1 Class B Shares to (and including) such earlier Series 1 Class B Dividend Stop Date), provided that the first semi-annual Dividend Access Share Dividend will never be less than zero.
Shareholder information continued | Shareholder information |
If paid or made, the second semi-annual Dividend Access Share Dividend on the Series 1 Dividend Access Share will be equivalent to (A) the greater of:
(i) 7% of the Reference Amount multiplied by the actual number of days in the period from (but excluding) the Relevant Date falling on (or nearest to) one year prior to the current Relevant Date (or, if none, 22 December 2009) to (and including) the current Relevant Date (or, if there has occurred prior to such current Relevant Date a Series 1 Class B Dividend Stop Date in respect of any Series 1 Class B Shares, then in respect of those Series 1 Class B Shares, to (and including) such earlier Series 1 Class B Dividend Stop Date) divided by 365 (or 366 in a leap year) and
(ii) if a cash dividend or cash dividends on the ordinary shares or Ordinary Share Bonus Issue(s) is/are paid or made in the period from (but excluding) the Relevant Date falling on (or nearest to) one year prior to the current Relevant Date (or, if none, 22 December 2009) to (and including) the current Relevant Date (or, if there has occurred prior to such current Relevant Date a Series 1 Class B Dividend Stop Date in respect of any Series 1 Class B Shares, then in respect of those Series 1 Class B Shares, to (and including) such earlier Series 1 Class B Dividend Stop Date) the Participation Rate of the aggregate fair market value of such cash dividend(s) or Ordinary Share Bonus Issue(s) per ordinary share multiplied by the then Reference Series 1 Class B Shares Number. Where a dividend in cash is announced which may at the election of a shareholder or shareholders be satisfied by the issue or delivery of ordinary shares in an Ordinary Share Bonus Issue, or where an Ordinary Share Bonus Issue is announced which may at the election of a shareholder or shareholders be satisfied by the payment of cash, then the fair market value of such dividend or Ordinary Share Bonus Issue will be deemed to be the amount of the dividend in cash or of the payment in cash (as the case may be)
less (B) the fair market value of the aggregate amount of any dividend or distribution paid or made on the Series 1 Class B Shares and/or on any ordinary shares issued on conversion of the Series 1 Class B Shares (regardless of who holds such Series 1 Class B Shares or ordinary shares at the relevant time) in the period from (but excluding) the Relevant Date falling on (or nearest to) one year prior to the current Relevant Date (or, if none, 22 December 2009) to (and including) the current Relevant Date (or, if there has occurred prior to such current Relevant Date a Series 1 Class B Dividend Stop Date in respect of any Series 1 Class B Shares, then in respect of those Series 1 Class B Shares to (and including) such earlier Series 1 Class B Dividend Stop Date) and less the fair market value of the immediately preceding first semi-annual Dividend Access Share Dividend or Bonus Issue paid or made (if any), provided that the second semi-annual Dividend Access Share Dividend will never be less than zero.
If the Participation Rate is adjusted during the course of a financial year, the amount of the semi-annual Dividend Access Share Dividend in such financial year, if determined by reference to the Participation Rate, will itself be adjusted in such manner as the Independent Financial Adviser (acting as an expert) considers appropriate to take account of the date(s) on which the adjustment(s) to the Participation Rate become effective. A written opinion of the Independent Financial Adviser will be conclusive and binding on all parties, save in the case of manifest error.
In the event of a change in the frequency of dividend payments on the ordinary shares such that they are not paid semi-annually consistent with the payment of Dividend Access Share Dividends on the Series 1 Dividend Access Share, the company will make such changes to the Dividend Access Share Dividend payment arrangements described above as, following consultation with the Independent Financial Adviser (acting as an expert), it determines are fair and reasonable to take account of such changed frequency.
Non-cumulative dividends on the Series 1 Dividend Access Share will be payable in respect of the period up to and including the Series 1 Class B Dividend Stop Date (if any). After the Series 1 Class B Dividend Stop Date (if any), the right of the holder of the Series 1 Dividend Access Share to Dividend Access Share Dividends in respect of any Series 1 Class B Shares in issue during each of the 30 consecutive dealing days during which the Trigger Event occurs will cease, but this is without prejudice to the right to Dividend Access Share Dividends in respect of any Series 1 Class B Shares not in issue on each such day.
Bonus Issue of Series 1 Class B Shares on the Series 1 Dividend Access Share
If the board of directors decides to pay a Dividend Access Share Dividend and either (i) no dividend has been paid on the ordinary shares and/or distribution made thereon in respect of the corresponding period, or (ii) a dividend has been paid and/or a distribution has been made on the ordinary shares otherwise than in cash in respect of the corresponding period, the board of directors may in its discretion determine that such Dividend Access Share Dividend will be paid in whole or in part by the company issuing Series 1 Class B Shares, credited as fully paid, to the holder of the Series 1 Dividend Access Share. The number of such further Series 1 Class B Shares to be issued to the holder will be such number of Series 1 Class B Shares as is certified by an Independent Financial Adviser (acting as an expert) to be as nearly as possible equal to (but not greater than) the cash amount (disregarding any tax credit) of such semi-annual Dividend Access Share Dividend or part thereof otherwise payable to such holder of the Series 1 Dividend Access Share, based on the fair market value of a Series 1 Class B Share at the time of such determination. A written opinion of such Independent Financial Adviser will be conclusive and binding on all parties, save in the case of manifest error. The additional Series 1 Class B Shares will rank pari passu in all respects with the fully paid Series 1 Class B Shares then in issue save only as regards participation in the relevant dividend.
Shareholder information continued | Shareholder information |
Restrictions following non-payment of dividend
If any Dividend Access Share Dividend is not declared and paid in full in cash or otherwise, the company:
(i) may not, and will procure that no subsidiary undertaking of the company will, declare or pay dividends or other distributions on any Parity Securities (whether in cash or otherwise, and whether payable on the same date as the relevant Dividend Access Share Dividend or subsequently) or make any Ordinary Share Bonus Issue (whether to be made on the same date as the relevant Dividend Access Share Dividend or subsequently), and the company may not, and will procure that no subsidiary undertaking of the company shall, set aside any sum for the payment of these dividends or distributions; and
(ii) may not, and will procure that no subsidiary undertaking of the company will, redeem, purchase or otherwise acquire (whether on the same date as the relevant Dividend Access Share Dividend is payable or subsequently) for any consideration any of its Parity Securities or any depository or other receipts or certificates representing Parity Securities (other than any such purchases or acquisitions which are made in connection with any Employee Share Scheme (as defined in the terms of issue of the Series 1 Dividend Access Share)) and (save as aforesaid) the company may not, and will procure that no subsidiary undertaking of the company shall, set aside any sum or establish any sinking fund (whether on the same date as the relevant Dividend Access Share Dividend is payable or subsequently) for the redemption, purchase or other acquisition of Parity Securities or any depositary or other receipts or certificates representing Parity Securities, in each case until such time as Dividend Access Share Dividends are no longer payable or payment of Dividend Access Share Dividends in cash or otherwise has resumed in full, as the case may be.
Definitions in relation to this Dividend Access Share subsection
“Bonus Issue” means a bonus issue of Series 1 Class B Shares to the holder of the Series 1 Dividend Access Share.
“Independent Financial Adviser” means an independent financial institution appointed by the company and approved by HM Treasury.
“Ordinary Share Bonus Issue” means a bonus issue of fully paid ordinary shares to holders of ordinary shares in lieu of a dividend.
“Parity Securities” means ordinary shares, Series 1 Class B Shares and any other securities of the company or its subsidiary undertakings which rank pari passu with the ordinary shares, and/or Series 1 Class B Shares on a return of capital on a winding up, either issued by the company or issued by a subsidiary undertaking of the company with terms attached which benefit from a guarantee or support agreement entered into by the company which ranks pari passu with the ordinary shares, and/or Series 1 Class B Shares on a return of capital on a winding up.
‘‘Reference Amount’’ means £25,500,000,000 plus the aggregate Relevant Amount of any further Series 1 Class B Shares issued by the company to HM Treasury after 22 December 2009 and before the record date for the relevant Dividend Access Share Dividend, less the aggregate Relevant Amount of any Series 1 Class B Shares which were in issue during the 30 consecutive dealing days during which a Series 1 Class B
Dividend Trigger Event occurred. “Reference Series 1 Class B Shares Number” means the Reference Amount divided by the Relevant Amount.
“Relevant Amount” means £0.50 (subject to adjustment from time to time to reflect any consolidation, redesignation or subdivision in relation to the Series 1 Class B Shares) per Series 1 Class B Share.
“Relevant Date” means in respect of any semi-annual Dividend Access Share Dividend or Bonus Issue, the date on which the company pays or makes the same or (subject to adjustment for a change to the company’s accounting reference date), if the same is not paid or made, means 31 October of the relevant year in the case of a first semi-annual Dividend Access Share Dividend or Bonus Issue, and 31 May of the relevant year in the case of a second semi-annual Dividend Access Share Dividend or Bonus Issue.
“Series 1 Class B Dividend Stop Date” means the date falling 20 days after the Series 1 Class B Dividend Trigger Event.
“Series 1 Class B Dividend Trigger Event” means, in relation to the Series 1 Class B Shares in issue at the relevant time, the daily volume weighted average price of the company’s ordinary shares on the London Stock Exchange equals or exceeds £0.65 per ordinary share (subject to adjustment) for 20 or more complete dealing days in any period of 30 consecutive dealing days.
Distribution of assets on liquidation
Cumulative preference shares
In the event of a return of capital on a winding-up or otherwise, the holders of cumulative preference shares are entitled to receive out of thet he surplus assets of the company available for distribution amongst the members (i) in priority to the holders of the non-cumulative preference shares and any other shares ranking pari passu therewith, the arrears of any fixed dividends including the amount of any dividend due for a payment after the date of commencement of any winding-up or liquidation but which is payable in respect of a half-year period ending on or before such date and (ii) pari passu with the holders of the non-cumulative preference shares and any other shares ranking pari passu therewith, the amount paid up or credited as paid up on such shares together with any premium.
Non-cumulative preference shares
Each non-cumulative preference share will confer on a winding up or liquidation (except (unless otherwise provided by the terms of issue) a redemption or purchase by the company of any shares in the capital of the company), the right to receive out of surplus assets of the company available for distribution amongst the members after payment of the arrears (if any) of the cumulative dividend on the cumulative preference shares and in priority to the holders of the ordinary shares, repayment of the amount paid up or credited as paid up on the non-cumulative preference shares together with any premium paid on issue pari passu with the holders of the cumulative preference shares and together with an amount equal to accrued and unpaid dividends.
Shareholder information continued | Shareholder information |
Non-voting deferred shares
On a winding-up or other return of capital of the company, holders of non-voting deferred shares are entitled only to payment of the amounts paid up on the non-voting deferred shares, after repayment to the holders of ordinary shares of the nominal amount paid up on the ordinary shares held by them and payment of £100,000£ 100,000 on each ordinary share.
B Shares
On a winding-up, holders of the Series 1 Class B Shares will rank equally with the holders of the ordinary shares, the Series 1 Dividend Access Share and any other class of shares or securities of the company which rank equally with the Series 1 Class B Shares, the Series 1 Dividend Access Share or the ordinary shares on a winding-up or liquidation, and junior to all other shareholders and all creditors of the company. For these purposes, on a winding-up each holder of a Series 1 Class B Share will be deemed to hold one (as adjusted from time to time) ordinary share of the company for every Series 1 Class B Share held at the date of the commencement of such winding-up, and will be entitled to receive out of the surplus assets of the company remaining after payment of all prior-ranking claims, a sum equal to that payable to a holder of one (as adjusted) ordinary share in such event.
Dividend Access Share
On a winding-up, the holder of the Series 1 Dividend Access Share will ran k equally with the holders of the ordinary shares, the Series 1 Class B Shares and any other class of shares or securities of the company which rank equally with the Series 1 Dividend Access Share, the Series 1 Class B Shares or the ordinary shares on a winding-up or liquidation, and junior to all other shareholders and all creditors of the company. For these purposes, on a winding-up the holder of the Series 1 Dividend Access Share will be deemed to hold one (as adjusted from time to time) ordinary share of the company, and will be entitled to receive out of the surplus assets of the company remaining after payment of all prior-ranking claims, a sum equal to that payable to a holder of one (as adjusted) ordinary share in such event.
General
On a winding-up of the company, the liquidator may, with the authority of any extraordinary resolution and any other sanction required by the Insolvency Act 1986 and subject to the rights attaching to any class of shares after payment of all liabilities, including the payment to holders of preference shares, divide amongst the members in specie or kind the whole or any part of the assets of the company or vest the whole or any part of the assets in trustees upon such trusts for the benefit of the members and may determine the scope and terms of those trusts. No member shall be compelled to accept any assets on which there is a liability.
Voting Rights
General
Subject to any rights or restrictions as to voting attaching to any shares or class of shares, on a show of hands every member who is present in person or by proxy at a general meeting shall have one vote (except that a proxy who is appointed by more than one member has one vote for and one vote against if the proxy has been instructed by one or more members to vote for the resolution and by one or more members to vote against the resolution) and on a poll every member present in person or by proxy shall have one vote for each 25 pence in nominal amount of shares held by him. No member shall, unless the directors otherwise determine, be entitled to vote at a general meeting or at a separate meeting of the holders of shares in the capital of the company, either in person or by proxy, in respect of any share held by him unless all monies presently payable by him in respect of that share have been paid.
Shareholder information continued
a general meeting does not have a casting vote in the event of an equality of votes, as this is not permitted under the 2006 Act. The quorum required for a meeting of members is not less than five members present in person and entitled to vote. If a meeting is adjourned because of the lack of a quorum, the members present in person or by proxy and entitled to vote will constitute a quorum at the adjourned meeting.
Meetings are convened upon written notice of not less than 21 days in respect of annual general meetings of members and not less than 14 days in respect of other meetings of members.members subject to certain conditions. An adjourned meeting may be called at shorter notice than applied to the original meeting, but where a meeting is adjourned for lack of quorum only if the adjourned meeting is held at least ten days after the original meeting and does not include any new business.
Cumulative preference shares
At a general meeting of the company, every holder of a cumulative preference share who is present in person or by proxy shall be entitled to one vote on a show of hands and, on a poll, every person who is present in person or by proxy shall have one vote for each 25 pence in nominal amount of shares held. No member shall be entitled to vote any share in person or by proxy unless all moneys owed in respect of that share have been paid.
Non-cumulative preference shares
Holders of non-cumulative preference shares are not entitled to attend or vote at any general meeting unless the business of the meeting includes the consideration of a resolution for the winding-up of the company or any resolution directly varying or abrogating the rights attached to any such shares and then in such case only to speak to and vote upon any such resolution.
However, holders have the right to vote in respect of any matter when the dividend payable on their shares has not been declared in full for such number of dividend periods as the directors shall determine prior to the allotment thereof.
Whenever a holder is entitled to vote at a general meeting, on a show of hands every shareholder who is present in person has one vote and, on a poll, every such holder who is present in person or by proxy shall have such number of votes as may be determined by the directors prior to allotment.
Non-voting deferred shares
The holders of non-voting deferred shares are not entitled to receive notice of or to attend or vote at any general meeting of the company or otherwise receive any shareholder communication.
B Shares
Holders of the Series 1 Class B Shares are not entitled to attend or vote at any general meeting unless the business of the meeting includes the consideration of a resolution for the winding-up of the company or any resolution varying or abrogating the rights attached to any such shares and then in such case only to speak to and vote upon any such resolution. If entitled to vote, each holder is entitled on a poll to two votes for each Series 1 Class B Share held.
Shareholder information continued | Shareholder information |
Dividend Access Share
The holder of the Series 1 Dividend Access Share is not entitled to attend or vote at any general meeting unless the business of the meeting includes the consideration of a resolution for the winding-up of the company or any resolution varying or abrogating the rights attached to such share and then in such case only to speak to and vote upon any such resolution. If entitled to vote, the holder is entitled on a poll to one vote.
Redemption
Except as set forth in the following paragraph, unless the directors determine, prior to allotment of any particular series of non-cumulative preference shares, that such series shall be non-redeemable, the preference shares will be redeemable at the option of the company on any date (a “Redemption Date”) which (subject to certain exceptions described in the terms of such shares) falls no earlier than such date (if any) as may be fixed by the directors, prior to allotment of such shares. Except as set forth in the following paragraph, onOn redemption, there shall be paid on each non-cumulative preference share the aggregate of its nominal amount together with any premium paid on issue, where applicable a redemption premium and accruals of dividend.
Series 2 of the non-cumulative sterling preference shares may be redeemed at any time provided that the redemption is financed wholly by the proceeds of the issue of new ordinary shares pursuant to the placing and open offer agreement dated 19 January 2009 betweenIf the company wishes to issue redeemable shares, the Directors are authorised to determine the terms and HM Treasury. In such case, on redemption, there shall be paid on each non-cumulative sterling preference share the aggregatemanner of 101 per cent of its liquidation preference amount and any dividend accrued thereon. redemption.
Purchase
General
SubjectUnder the 2006 Act a company requires shareholder authority to the 1985 Act, the company may, by special resolution, reduce its share capital, any capital redemption reserve and any share premium account or other undistributable reserve and may also, subject to the 1985 Act, the requirements of the London Stock Exchange and the rights attached to any class of shares, purchase its own shares, (including redeemable shares).
Non-cumulative preferenceconsolidate and sub-divide its shares and convertible preference shares
Subject to the 1985 Act, the company may purchase anyreduce its share capital. Whenever non-cumulative preference shares and convertible preference shares upon such terms asare issued in the directors shall determine provided that, wherefuture the shares being purchased are listedArticles have no restriction on the London Stock Exchange, themaximum purchase price payable exclusiveby the company unless such restriction is expressly applied by the directors in relation to an issuance of expenses and accrued dividends, shall not exceed (a) in the case of a purchase in the open market, or by tender, the average of the closing middle market quotations of such shares for the 10 dealing days preceding the date of the purchase of (if higher), in the case of a purchase in the open market only, the market price on the date of purchase provided that such market price is not more than 105 per cent of such average and (b) in the case of a purchase by private treaty, 120 per cent of the closing middle market quotation of such shares for the last dealing day preceding the date of purchase; but so that this proviso shall not apply to any purchase of such shares made in the ordinary course of a business of dealing in securities. Upon the purchase of any such shares, the nominal amount of such shares shall thereafter be divided into, and reclassified as, ordinarynon-cumulative preference shares.
Conversion rights
Convertible preference shares carry the right to convert into ordinary shares if they have not been the subject of a notice of redemption from the company, on or before a specified date determined by the directors. The right to convert will be exercisable by service of a conversion notice on the company within a specified period. The company will use reasonable endeavours to arrange the sale, on behalf of convertible preference shareholders who have submitted a conversion notice, of the ordinary shares which result from such conversion and to pay to them the proceeds of such sale so that they receive net proceeds equal to the nominal value of the convertible preference shares which were the subject of the conversion notice and any premium at which such shares were issued, provided that ordinary shares will not be sold at below a benchmark price (as determined prior to the issue of the relevant convertible preference shares by the directors).
B Shares
The B Shares are convertible into Ordinary Shares at HM Treasury’s option at an initial conversion price of £0.50 per share, subject to adjustment. In December 2003, following the payment of aggregate dividends of £1 in respect of each AVS, all issued and outstanding AVSs were de-listed from the Official List and from trading on the London Stock Exchange’s market for listed securities and converted into non-voting deferred shares of £0.01 each.
Changes in share capital and variation of rights
Subject to the provisions of the 19852006 Act and without prejudice to any rights attached to any existing shares or class of shares, any share may be issued with such rights or restrictions as the company may by ordinary resolution determine or, subject to and in default of such determination, as the Board shall determine. Subject to the provisions of the 19852006 Act, the company may issue shares which are, or at the option of the company or the holder are liable, to be redeemed. Subject to the provisions of the 19852006 Act and the Articles, unissued shares are at the disposal of the Board.
The company may by ordinary resolution: increase its share capital; consolidate and divide all or any of its share capital into shares of larger amount than its existing shares; subject to the provisions of the 19852006 Act, subdivide its shares, or any of them, into shares of smaller amount than is fixed by
the Memorandum; or cancel any shares which have not been taken or agreed to be taken by any person and diminish the amount of its share capital by the amount of the shares so cancelled.
Subject to the provisions of the 19852006 Act, if at any time the capital of the company is divided into different classes of shares, the rights attached to any class of shares may (unless further conditions are provided by the terms of issue of the shares of that class) be varied or abrogated, whether or not the company is being wound up, either with the consent in writing of the holders of three-quarters in-nominal value of the issued shares of the class or with the sanction of an extraordinary resolution passed at a separate general meeting of holders of the shares of the class (but not otherwise).
To any such separate general meeting the provision of the Articles relating to general meetingsmeeting s will apply, save that:
| (i) | if at any adjourned meeting of such holders a quorum as defined above is not present, two people who hold shares of the class, or their proxies.(i) if at any adjourned meeting of such holders a quorum as defined above is not present, two people who hold shares of the class, or their proxies, are a quorum; and |
| (ii) | any such holder present in person or by proxy may demand a poll. |
(ii) any such holder present in person or by proxy may demand a poll
The rights attaching to any class of shares having preferential rights are not, unless otherwise expressly provided by the terms of issue thereof, deemed to be varied by the creation or issue of further shares ranking, as regards participation in thet he profits or assets of the company, pari passu therewith, but in no respect in priority thereto.
Disclosure of interests in shares
The 2006 Act gives the company the power to require persons who it believes to be, or have been within the previous three years, interested in its shares, to disclose prescribed particulars of those interests. Failure to supply the information or supplying a statement which is materially false may lead to the Board imposing restrictions upon the relevant shares. The restrictions available are the suspension of voting or other rights conferred by membership in relation to meetings of the company in respect of the relevant shares and, additionally, in the case of a shareholding representing at least 0.25 per cent of the class of shares concerned, the withholding of payment of dividends on, and the restriction of transfers of, the relevant shares.
Shareholder information continued | Shareholder information |
Limitations on rights to own share
There are no limitations imposed by UK law or the Memorandum and Articles on the right of non-residents or foreign persons to hold or vote the company's shares other than the limitations that would generally apply to all of the company's shareholders.
Members resident abroad
Members with registered addresses outside the United Kingdom are not entitled to receive notices from the company unless they have given the company an address within the United Kingdom at which such notices may be served.
Sending notices and other documents to shareholders
The company may communicate with members by electronic and/or website communications. A member whose registered address is not within the United Kingdom shall not be entitled to receive any notice from the Company unless he gives the Company a postal address within the United Kingdom at which notices may be given to him.
Incorporation and registration
The company was incorporated and registered in Scotland under the Companies Act 1948 as a limited company on 25 March 1968 under the name National and Commercial Banking Group Limited.Limited, and changed its name to The Royal Bank of Scotland Group Limited on 3 September 1979. On 10 March 1982 it changed its name to its present name and was registeredre-registered under the Companies Acts 1948 to 1980 as a public company with limited liability. The company is registered under Company No. SC 45551.
SC45551.
Documents concerning the company may be inspected at 36 St Andrew Square, Edinburgh, EH2 2YB.
Executive directors’ service contracts and copies of directors’ indemnities granted by the company in terms of section 309C236 of the Companies Act 19852006 may be inspected at the company’s office at Gogarburn, Edinburgh, EH12 1HQ (telephone 0131 626 4114).
In addition, we file reports and other information with the SEC. You can read and copy these reports and other information at the SEC’s Public Reference Room at 100 F Street, N.E., Room 1580, Washington, D.C. 20549. You can call the SEC at 1-800-SEC-0330 for further information on the Public Reference Room or contact the offices of The New York Stock Exchange, on which certain of our securities are listed, at 20 Broad Street, New York, New York 10005. The SEC also maintains a website at www.sec.gov which contains in electronic form each of the reports and other information that we have filed electronically with the SEC.
Shareholder information continued | Shareholder information |
Glossary of terms
Adjustable rate mortgage (ARM) - in the US a variable-rate mortgage. ARMs include: hybrid ARMs which typically have a fixed-rate period followed by an adjustable-rate period; interest-only ARMs where interest only is payable for a specified number of years, typically for three to ten years; and payment-option ARMs that allow the borrower to choose periodically between various payment options.
Alt-A (Alternative A-paper) are mortgage loans with a higher credit quality than sub-prime loans but with features that disqualify the borrower from a traditional prime loan. Alt-A lending characteristics include limited documentation; high loan-to-value ratio; secured on non-owner occupied properties; and debt-to-income ratio above normal limits.
Arrears are the aggregate of contractual payments due on a debt that have not been met by the borrower. A loan or other financial asset is said to be 'in arrears' when payments have not been made.
Asset-backed commercial paper (ABCP) - a form of asset-backed security generally issued by a commercial paper conduit.
Asset-backed securities (ABS) are securities that represent interests in specific portfolios of assets. They are issued by a special purpose entity following a securitisation. The underlying portfolios commonly comprise residential or commercial mortgages but can include any class of asset that yields predictable cash flows. Payments on the securities depend primarily on the cash flows generated by the assets in the underlying pool and other rights designed to assure timely payment, such as guarantees or other credit enhancements. Collateralised bond obligations, collateralised debt obligations, collateralised loan obligations, commercial mortgage backed securities and residential mortgage backed securities are all types of ABS.
Assets under management are assets managed by the Group on behalf of clients.
Collateralised bond obligations (CBOs) are asset-backed securities for which the underlying asset portfolios are bonds, some of which may be sub-investment grade.
Collateralised debt obligations (CDOs) are asset-backed securities for which the underlying asset portfolios are debt obligations: either bonds (collateralised bond obligations) or loans (collateralised loan obligations) or both. The credit exposure underlying synthetic CDOs derives from credit default swaps. The CDOs issued by an individual vehicle are usually divided in different tranches: senior tranches (rated AAA), mezzanine tranches (AA to BB), and equity tranches (unrated). Losses are borne first by the equity securities, next by the junior securities, and finally by the senior securities; junior tranches offer higher coupons (interest payments) to compensate for their increased risk.
Collateralised debt obligation squared (CDO-squared) is a type of collateralised debt obligation where the underlying asset portfolio includes tranches of other CDOs.
Collateralised loan obligations (CLOs) are asset-backed securities for which the underlying asset portfolios are loans, often leveraged loans.
Collectively assessed loan impairment provisions - impairment loss provisions in respect of impaired loans, such as credit cards or personal loans, that are below individual assessment thresholds. Such provisions are established on a portfolio basis, taking account of the level of arrears, security, past loss experience, credit scores and defaults based on portfolio trends.
Commercial mortgage backed securities (CMBS) are asset-backed securities for which the underlying asset portfolios are loans secured on commercial real estate.
Commercial paper (CP) comprises unsecured obligations issued by a corporate or a bank directly or secured obligations (asset-backed CP), often issued through a commercial paper conduit, to fund working capital. Maturities typically range from 2 to 270 days. However, the depth and reliability of some CP markets means that issuers can repeatedly roll over CP issuance and effectively achieve longer term funding. Commercial paper is issued in a wide range of denominations and can be either discounted or interest-bearing.
Commercial paper conduit is a special purpose entity that issues commercial paper and uses the proceeds to purchase or fund a pool of assets. The commercial paper is secured on the assets and is redeemed either by further commercial paper issuance, repayment of assets or liquidity drawings.
Commercial real estate - freehold and leasehold properties used for business activities. Commercial real estate includes office buildings, industrial property, medical centres, hotels, retail stores, shopping centres, agricultural land and buildings, warehouses, garages etc.
Constant proportion portfolio insurance notes (CPPI notes)- CPPI is the name given to a trading strategy that is designed to ensure that a fixed minimum return is achieved either at all times or more typically, at a set date in the future. Essentially the strategy involves continuously re- balancing the portfolio of investments during the term of the product between performance assets and safe assets using a pre-set formula. CPPI notes provide investors with a return linked to a CPPI portfolio.
Contractual maturity is the date in the terms of a financial instrument on which the last payment or receipt under the contract is due for settlement.
Core Tier 1 capital - called-up share capital and eligible reserves plus equity non-controlling interests, less intangible assets and other regulatory deductions.
Core Tier 1 capital ratio - core Tier 1 capital as a percentage of risk-weighted assets.
Cost:income ratio - operating expenses as a percentage of total income.
Shareholder information continued
Shareholder information continued | Shareholder information |
Important addressesCovered mortgage bonds are debt securities backed by a portfolio of mortgages that is segregated from the issuer's other assets solely for the benefit of the holders of the covered bonds
Credit default swap (CDS) is a contract where the protection seller receives premium or interest-related payments in return for contracting to make payments to the protection buyer upon a defined credit event in relation to a reference financial asset or portfolio of financial assets. Credit events usually include bankruptcy, payment default and rating downgrades.
Credit derivative product company (CDPC) is a special purpose entity that sells credit protection under credit default swaps or certain approved forms of insurance policies. Sometimes they can also buy credit protection. CDPCs are similar to monoline insurers. However, unlike monoline insurers, they are not regulated as insurers.
Credit derivatives are contractual agreements that provide protection against a credit event on one or more reference entities or financial assets. The nature of a credit event is established by the protection buyer and protection seller at the inception of a transaction, and such events include bankruptcy, insolvency or failure to meet payment obligations when due. The buyer of the credit derivative pays a periodic fee in return for a payment by the protection seller upon the occurrence, if any, of a credit event. Credit derivatives include credit default swaps, total return swaps and credit swap options.
Credit enhancements - are techniques that improve the credit standing of financial obligations; generally those issued by an SPE in a securitisation. External credit enhancements include financial guarantees and letters of credit from third-party providers. Internal enhancements include excess spread - the difference between the interest rate received on the underlying portfolio and the coupon on the issued securities; and over-collateralisation - on securitisation, the value of the underlying portfolio is greater than the securities issued.
Credit risk assets - loans and advances (including overdraft facilities), instalment credit, finance lease receivables and other traded instruments across all customer types.
Credit risk spread - is the difference between the coupon on a debt instrument and the benchmark or the risk-free interest rate for the instrument's maturity structure. It is the premium over the risk-free rate required by the market for the credit quality of an individual debt instrument.
Credit valuation adjustments - are adjustments to the fair values of derivative assets to reflect the creditworthiness of the counterparty.
Currency swap - an arrangement in which two parties exchange specific principal amounts of different currencies at inception and subsequently interest payments on the principal amounts. Often, one party will pay a fixed interest rate, while the other will pay a floating exchange rate (though there are also fixed-fixed and floating-floating arrangements). At the maturity of the swap, the principal amounts are usually re-exchanged.
Customer accounts - comprise money deposited with the Group by counterparties other than banks and classified as liabilities. They include demand, savings and time deposits; securities sold under repurchase agreements; and other short term deposits. Deposits received from banks are classified as deposits by banks.
Debt restructuring - see Renegotiated loans.
Debt securities are transferable instruments creating or acknowledging indebtedness. They include debentures, bonds, certificates of deposit, notes and commercial paper. The holder of a debt security is typically entitled to the payment of principal and interest, together with other contractual rights under the terms of the issue, such as the right to receive certain information. Debt securities are generally issued for a fixed term and redeemable by the issuer at the end of that term. Debt securities can be secured or unsecured.
Debt securities in issue comprise unsubordinated debt securities issued by the Group. They include commercial paper, certificates of deposit, bonds and medium-term notes.
Deferred tax asset - income taxes recoverable in future periods as a result of deductible temporary differences - temporary differences between the accounting and tax base of an asset or liability that will result in tax deductible amounts in future periods - and the carry-forward of tax losses and unused tax credits.
Deferred tax liability - income taxes payable in future periods as a result of taxable temporary differences (temporary differences between the accounting and tax base of an asset or liability that will result in taxable amounts in future periods).
Defined benefit obligation - the present value of expected future payments required to settle the obligations of a defined benefit plan resulting from employee service.
Defined benefit plan - pension or other post-retirement benefit plan other than a defined contribution plan.
Defined contribution plan - pension or other post-retirement benefit plan where the employer's obligation is limited to its contributions to the fund.
Delinquency - a debt or other financial obligation is considered delinquent when one or more contractual payments are overdue. Delinquency is usually defined in terms of days past due. Delinquent and in arrears are synonymous.
Deposits by banks - comprise money deposited with the Group by banks and recorded as liabilities. They include money-market deposits, securities sold under repurchase agreements, federal funds purchased and other short term deposits. Deposits received from customers are recorded as customer accounts.
Derivative - a contract or agreement whose value changes with changes in an underlying index such as interest rates, foreign exchange rates, share prices or indices and which requires no initial investment or an initial investment that is smaller than would be required for other types of contracts with a similar response to market factors. The principal types of derivatives are: swaps, forwards, futures and options.
Shareholder enquiriesRegistrarComputershare Investor Services PLC391
The Pavilions
Bridgwater RoadBristol BS99 6ZZ
Telephone: 0870 702 0135
Facsimile: 0870 703 6009
Email: web.queries@computershare.co.uk
Shareholder information continued | Shareholder information |
Glossary of terms continued
Discontinued operation - is a component of the Group that either has been disposed of or is classified as held for sale. A discontinued operation is either: a separate major line of business or geographical area of operations or part of a single co-ordinated plan to dispose of a separate major line of business or geographical area of operations; or a subsidiary acquired exclusively with a view to resale.
Exposure at default (EAD) - an estimate of the expected level of utilisation of a credit facility at the time of a borrower's default. The EAD may be higher than the current utilisation (e.g. in the case where further drawings may be made under a revolving credit facility prior to default) but will not typically exceed the total facility limit.
Fannie Mae (Federal National Mortgage Association) - is a US Government Sponsored Enterprise. It buys mortgages, principally issued by banks, on the secondary market, pools them, and sells them as residential mortgage-backed securities to investors on the open market. Its obligations are not explicitly guaranteed by the full faith and credit of the US Government.
Federal Home Loan Mortgage Corporation - see Freddie Mac.
Federal National Mortgage Association - see Fannie Mae.
FICO score - a FICO score is calculated using proprietary software developed by the Fair Isaac Corporation in the US from a consumer's credit profile. The scores range between 300 and 850 and are used in credit decisions made by banks and other providers of credit.
First/second lien- a lien is a charge such as a mortgage held by one party, over property owned by a second party, as security for payment of some debt, obligation, or duty owed by that second party. The holder of a first lien takes precedence over all other encumbrances on that property i.e. second and subsequent liens.
Forbearance - is the term generally applied to an agreement, principally in relation to secured loans with retail customers experiencing temporary financial difficulty, to a payment moratorium, to reduced repayments or to roll up arrears. Forbearance loans are a subset of Renegotiated loans.
Forward contract - a contract to buy (or sell) a specified amount of a physical or financial commodity, at an agreed price, at an agreed future date.
Freddie Mac (Federal Home Loan Mortgage Corporation) - is a US Government Sponsored Enterprise. It buys mortgages, principally issued by thrifts, on the secondary market, pools them, and sells them as residential mortgage-backed securities to investors on the open market. Its obligations are not explicitly guaranteed by the full faith and credit of the US Government.
Futures contract -is a contract which provides for the future delivery (or acceptance of delivery) of some type of financial instrument or commodity under terms established at the outset. Futures differ from forward contracts in that they are traded on recognised exchanges and rarely result in actual delivery; most contracts are closed out prior to maturity by acquisition of an offsetting position.
G10 - the Group of Ten comprises the eleven industrial countries (Belgium, Canada, France, Germany, Italy, Japan, the Netherlands, Sweden, Switzerland, the United Kingdom and the United States) that have agreed to participate in the IMF's General Arrangements to Borrow.
Ginnie Mae (Government National Mortgage Association) - is a US Government Agency that guarantees investors the timely payment of principal and interest on mortgage-backed securities for which the underlying asset portfolios comprise federally insured or guaranteed loans - mainly loans insured by the Federal Housing Administration or guaranteed by the Department of Veterans Affairs. Ginnie Mae obligations are fully and explicitly guaranteed as to the timely payment of principal and interest by the full faith and credit of the US Government.
Government Sponsored Enterprises (GSEs) - are a group of financial services corporations created by the US Congress. Their function is to improve the efficiency of capital markets and to overcome statutory and other market imperfections which otherwise prevent funds from moving easily from suppliers of funds to areas of high loan demand. They include Fannie Mae and Freddie Mac.
Gross yield - is the interest rate earned on average interest-earning assets i.e. interest income divided by average interest-earning assets.
Guaranteed mortgages- are mortgages that are guaranteed by a government or government agency. In the US, government loan guarantee programmes are offered by the Federal Housing Administration, the Department of Veterans Affairs and the Department of Agriculture's Rural Housing Service. In the Netherlands, the Gemeentegarantie programme is run partly by the central government and partly by the municipalities.
Home equity loan - is a type of loan in which the borrower uses the equity in their home as collateral. A home equity loan creates a charge against the borrower's house.
Impaired loans - comprise all loans for which an impairment provision has been established; for collectively assessed loans, impairment loss provisions are not allocated to individual loans and the entire portfolio is included in impaired loans.
Impairment allowance - see Loan impairment provisions.
Impairment losses - for impaired financial assets measured at amortised cost, impairment losses - the difference between carrying value and the present value of estimated future cash flows discounted at the asset's original effective interest rate - are recognised in profit or loss and the carrying amount of the financial asset reduced by establishing a provision (allowance). For impaired available-for-sale financial assets, the cumulative loss that had been recognised directly in equity is removed from equity and recognised in profit or loss as an impairment loss.
Shareholder information continued | Shareholder information |
Individually assessed loan impairment provisions - impairment loss provisions for individually significant impaired loans assessed on a case-by-case basis, taking into account the financial condition of the counterparty and any guarantor and the realisable value of any collateral held.
International Accounting Standards Board (IASB) - is the independent standard-setting body of the IASC Foundation. Its members are responsible for the development and publication of International Financial Reporting Standards (IFRS) and for approving Interpretations of IFRS as developed by the International Financial Reporting Interpretations Committee (IFRIC).
Interest rate swap- a contract under which two counterparties agree to exchange periodic interest payments on a predetermined monetary principal, the notional amount.
Interest spread - is the difference between the gross yield and the interest rate paid on average interest-bearing liabilities.
Investment grade - generally represents a risk profile similar to a rating of BBB-/Baa3 or better, as defined by independent rating agencies.
Latent loss provisions - loan impairment provisions held against impairments in the performing loan portfolio that have been incurred as a result of events occurring before the balance sheet date but which have not been identified as impaired at the balance sheet date. The Group has developed methodologies to estimate latent loss provisions that reflect historical loss experience (adjusted for current economic and credit conditions) and the period between an impairment occurring and a loan being identified and reported as impaired.
Leveraged loans - funding (leveraged finance) provided to a business resulting in an overall level of debt that exceeds that which would be considered usual for the business or for the industry in which it operates. Leveraged finance is commonly employed to achieve a specific, often temporary, objective: to make an acquisition, to effect a buy-out or to repurchase shares.
Liquidity enhancements - make funds available to ensure that the issuer of securities, usually a commercial paper conduit, can redeem the securities at maturity. They typically take the form of a committed facility from a third-party bank.
Loan impairment provisions - are established to recognise incurred impairment losses on a portfolio of loans classified as loans and receivables and carried at amortised cost. It has three components: individually assessed loan impairment provisions, collectively assessed loan impairment provisions and latent loss provisions.
Loan-to-value ratio - the amount of a secured loan as a percentage of the appraised value of the security e.g. the outstanding amount of a mortgage loan as a percentage of the property's value.
Loss given default (LGD) - the economic loss that may occur in the event of default i.e. the actual loss - that part of the exposure that is not expected to be recovered - plus any costs of recovery.
Master netting agreement - is an agreement between two counterparties that have multiple derivative contracts with each other that provides for the net settlement of all contracts through a single payment, in a single currency, in the event of default on, or termination of, any one contract.
Medium term notes (MTNs) - are debt securities usually with a maturity of five to ten years, but the term may be less than one year or as long as 50 years. They can be issued on a fixed or floating coupon basis or with an exotic coupon; with a fixed maturity date (non-callable) or with embedded call or put options or early repayment triggers. MTNs are most generally issued as senior, unsecured debt.
Monoline insurers - are entities that specialise in providing credit protection against the notional and interest cash flows due to the holders of debt instruments in the event of default. This protection is typically in the form of derivatives such as credit default swaps.
Mortgage-backed securities - are asset-backed securities for which the underlying asset portfolios are loans secured on property. See Residential mortgage backed securities and Commercial mortgage backed securities.
Mortgage servicing rights - are the rights of a mortgage servicer to collect mortgage payments and forward them, after deducting a fee, to the mortgage lender.
Mortgage vintage - the year in which a mortgage loan was made to the customer.
Negative equity mortgages - mortgages where the value of the property mortgaged is less than the outstanding balance on the loan.
Net interest income - is the difference between interest receivable on financial assets classified as loans and receivables or available-for-sale and interest payable on financial liabilities carried at amortised cost.
Net interest margin - is net interest income as a percentage of average interest-earning assets.
Net principal exposure - is the carrying value of a financial asset after taking account of credit protection purchased but excluding the effect of any counterparty credit valuation adjustment to that protection.
Shareholder information continued | Shareholder information |
Glossary of terms continued
Non-conforming mortgages - mortgage loans that do not meet the requirements for sale to US Government agencies or US Government sponsored enterprises. These requirements include limits on loan-to-value ratios, loan terms, loan amounts, borrower creditworthiness and other requirements.
Option - an option is a contract that gives the holder the right but not the obligation to buy (or sell) a specified amount of the underlying physical or financial commodity, at a specific price, at an agreed date or over an agreed period. Options can be exchange-traded or traded over-the-counter.
Past due - a financial asset such as a loan is past due when the counterparty has failed to make a payment when contractually due.
Potential problem loans - are loans other than impaired loans, accruing loans which are contractually overdue 90 days or more as to principal or interest and troubled debt restructurings where known information about possible credit problems of the borrower causes management to have serious doubts about the borrower's ability to meet the loan's repayment terms.
Prime - prime mortgage loans generally have low default risk and are made to borrowers with good credit records and a monthly income that is at least three to four times greater than their monthly housing expense (mortgage payments plus taxes and other debt payments). These borrowers provide full documentation and generally have reliable payment histories.
Private equity investments - are equity investments in operating companies not quoted on a public exchange. Capital for private equity investment is raised from retail or institutional investors and used to fund investment strategies such as leveraged buyouts, venture capital, growth capital, distressed investments and mezzanine capital.
Probability of default (PD) - the likelihood that a customer will fail to make full and timely repayment of credit obligations over a one year time horizon.
Regular way purchase or sale - is a purchase or sale of a financial asset under a contract whose terms require delivery of the asset within the time frame established generally by regulation or convention in the marketplace concerned.
Renegotiated loans - loans are generally renegotiated either as part of the ongoing banking relationship with a creditworthy customer or in response to a borrower's financial difficulties. In the latter case, renegotiation encompasses not only revisions to the terms of a loan such as a maturity extension, a payment moratorium, a concessionary rate of interest but also the restructuring of all or part of the exposure including debt forgiveness or a debt for equity swap. Loans renegotiated as part of the ongoing banking relationship with a creditworthy customer, are treated as new loans.
Repurchase agreement (Repo) - see Sale and repurchase agreements.
Residential mortgage backed securities (RMBS) - are asset-backed securities for which the underlying asset portfolios are residential mortgages.
Restructured loans - see Renegotiated loans.
Retail loans - are loans made to individuals rather than institutions. The loans may be for car purchases, home purchases, medical care, home repair, holidays and other consumer uses.
Reverse repurchase agreement (Reverse repo) - see Sale and repurchase agreements.
Risk asset ratio (RAR) - total regulatory capital as a percentage of risk-weighted assets.
Risk elements in lending (REIL) - comprise impaired loans, accruing loans which are contractually overdue 90 days or more as to principal or interest and troubled debt restructurings.
Risk-weighted assets - assets adjusted for their associated risks using weightings established in accordance with the Basel Capital Accord as implemented by the FSA. Certain assets are not weighted but deducted from capital.
Sale and repurchase agreements - in a sale and repurchase agreement one party, the seller, sells a financial asset to another party, the buyer, at the same time the seller agrees to reacquire, and the buyer to resell, the asset at a later date. From the seller's perspective such agreements are repurchase agreements (repos) and from the buyer's reverse repurchase agreements (reverse repos).
Securitisation - is a process by which assets or cash flows are transformed into transferable securities. The underlying assets or cash flows are transferred by the originator or an intermediary, typically an investment bank, to a special purpose entity which issues securities to investors. Asset securitisations involve issuing debt securities (asset-backed securities) that are backed by the cash flows of income-generating assets (ranging from credit card receivables to residential mortgage loans). Liability securitisations typically involve issuing bonds that assume the risk of a potential insurance liability (ranging from a catastrophic natural event to an unexpected claims level on a certain product type).
Shareholder information continued | Shareholder information |
Special purpose entity (SPE) - is an entity created by a sponsor, typically a major bank, finance company, investment bank or insurance company. An SPE can take the form of a corporation, trust, partnership, corporation or a limited liability company. Its operations are typically limited for example in a securitisation to the acquisition and financing of specific assets or liabilities.
Structured Investment Vehicle (SIV) - is a limited-purpose operating company that undertakes arbitrage activities by purchasing highly rated medium and long-term, fixed-income assets and funding itself with short-term, highly rated commercial paper and medium-term notes.
Structured notes - are securities that pay a return linked to the value or level of a specified asset or index. Structured notes can be linked to equities, interest rates, funds, commodities and foreign currency.
Student loan related assets - are assets that are referenced to underlying student loans.
Subordinated liabilities - are liabilities which, in the event of insolvency or liquidation of the issuer, are subordinated to the claims of depositors and other creditors of the issuer.
Sub-prime - sub-prime mortgage loans are designed for customers with one or more high risk characteristics, such as: unreliable or poor payment histories; loan-to-value ratio of greater than 80%; high debt-to-income ratio; the loan is not secured on the borrower's primary residence; or a history of delinquencies or late payments on the loan.
Super senior CDO - is the most senior class of instrument issued by a CDO vehicle. They benefit from the subordination of all other instruments, including AAA rated securities, issued by the CDO vehicle.
Tier 1 capital - core Tier 1 capital plus other Tier 1 securities in issue, less material holdings in financial companies.
Tier 1 capital ratio - Tier 1 capital as a percentage of risk-weighted assets.
Tier 2 capital - qualifying subordinated debt and other Tier 2 securities in issue, eligible collective impairment allowances, unrealised available-for-sale equity gains and revaluation reserves less certain regulatory deductions.
US Government National Mortgage Association - see Ginnie Mae.
Unaudited - unaudited financial information is information that has not been subjected to the audit procedures undertaken by the Group's auditors to enable them to express an opinion on the Group's financial statements.
VaR - is a technique that produces estimates of the potential change in the market value of a portfolio over a specified time horizon at given confidence levels.
Wrapped security - a wrapped security is a debt security where the holder benefits from credit protection provided by a third party, typically a financial guarantor or monoline insurer.
Write down - a reduction in the carrying value of an asset to record a decline in its fair value or value in use.
Shareholder information continued | Shareholder information |
Index
| | | | | |
| Accounting | | | Corporate governance | |
| Accounting developments | 227 | | Compliance with the Combined Code | 175 |
| Accounting policies | 216 | | The Board and its committees | 175 |
| Critical accounting policies | 224 | | | |
| | | | Credit market exposures | 23 |
| Approval of accounts | 211 | | | |
| | | | Debt securities in issue | |
| Asset-backed securities | 144 | | Business review | 131 |
| | | | Consolidated | 241 |
| Asset Protection Scheme | 161 | | Parent company | 245 |
| | | | | |
| Audit Committee report | 179 | | Deposits | |
| | | | Customer accounts | 241 |
| Auditors | | | Deposits from banks | 241 |
| Auditor’s remuneration | 237 | | | |
| Independent auditor’s report | 208 | | Derivatives | 270 |
| | | | | |
| Available-for-sale financial assets | | | Description of business | 5 |
| Accounting policies | 221 | | | |
| Notes on the accounts | 241 | | Directors | |
| | | | Attendance at Board and committee meetings | 178 |
| Average balance sheet | 13 | | Biographies | 166 |
| | | | Interests in shares | 205 |
| Balance sheet | | | Remuneration | 199 |
| Business review | 54 | | Remuneration policy | 191 |
| Consolidated | 211 | | Report of the directors | 170 |
| Parent company | 211 | | Service contracts | 197 |
| | | | | |
| Bank levy | 309 | | Dividends | |
| | | | History | 376 |
| Board Risk Committee report | 185 | | Notes on the accounts | 238, 239 |
| | | | | |
| Business divestments | | | Earnings per share | 240 |
| Business review | 6 | | | |
| Notes on the accounts | 282 | | Employees | |
| | | | Business review | 27 |
| Capital adequacy | | | Costs | 230 |
| Capital ratios | 58, 66 | | Headcount | 231 |
| Capital resources | 58, 67 | | Report of the directors | 171 |
| Notes on the accounts | 306 | | | |
| | | Financial instruments | |
| Cash flow statement | | | Accounting policies | 220 |
| Business review | 57 | Critical accounting policies | 225 |
| Consolidated | 215 | | Notes on the accounts | 241 |
| Notes on the accounts | 315, 316, 317 | | | |
| Parent company | 215 | Financial statements | |
| | | | Balance sheets | 54, 211 |
| Central functions/items | 6, 48, 318 | | Cash flow statements | 57, 215 |
| | | | Income statement | 9, 209 |
| Charitable contributions | 174 | | Statement of changes in equity | 212 |
| | | | Statement of comprehensive income | 210 |
| Contingent liabilities and commitments | 307 | | | |
| | | | Financial Services Compensation Scheme | 308 |
Shareholder information continued | Shareholder information |
| Financial summary | | | Net interest income | |
| Five year financial summary | 333 | | Business review | 12 |
| | | | Notes on the accounts | 228 |
| Forward-looking statements | 4 | | | |
| | | | Non-Core | 6, 49, 318 |
| Global Banking & Markets | 5, 42, 318 | | | |
| | | | Non-interest income | |
| Global Transaction Services | 5, 35, 318 | | Business review | 17 |
| | | | Notes on the account | 229 |
| Glossary of terms | 390 | | | |
| | | | Operating expenses | |
| Going concern | | | Business review | 19 |
| Report of the directors | 172 | | Notes on the accounts | 230 |
| | | | | |
| Goodwill | | | Pensions | |
| Accounting policy | 218 | | Accounting policy | 217 |
| Notes on the accounts | 276, 322 | | Critical accounting policies | 225 |
| | | Directors’ pension arrangements | 203 |
| Impairment | | | Notes on the accounts | 233 |
| Accounting policy | 221 | | Pension risk | 143 |
| Business review | 22 | | | |
| Critical accounting policies | 224 | | Post balance sheet events | 173, 326 |
| Notes on the accounts | 269 | | |
| | | | Presentation of information | 2 |
| Income statement | | | |
| Business review | 9 | | Principal subsidiaries | 275 |
| Consolidated | 209 | | |
| Parent company | 239 | | Property, plant and equipment | |
| | | | Accounting policy | 218 |
| Insurance claims | | | Notes on the accounts | 279 |
| Accounting policy | 219 | | | |
| Critical accounting policies | 226 | | Provisions | |
| Notes on the accounts | 285 | | Accounting policy | 220 |
| | | | Notes on the accounts | 269 |
| Insurance premium income | | | | |
| Accounting policy | 219 | | Regulatory reviews and developments | 344 |
| Notes on the accounts | 226 | | | |
| | | | Related parties | 324 |
| Intangible assets | | | | |
| Accounting policy | 218 | | Remuneration Committee | |
| Goodwill | 322 | | Directors’ remuneration report | 189 |
| Notes on the accounts | 276 | | Letter from the Chair of the Remuneration Committee | 187 |
| | | | | |
| Internal control | 183 | | Risk and balance sheet management | |
| | | Capital | 66 |
| Investigations | 310 | | Credit risk | 86 |
| | | | Equity risk | 85 |
| Litigation | 309 | Funding and liquidity risk | 74 |
| | | | Insurance risk | 139 |
| Loans and advances | | Interest rate risk | 83 |
| Loans and advances to banks | 241 | Market risk | 133 |
| Loans and advances to customers | 241 | Operational risk | 139 |
| | | Other risk exposures | 144 |
| Material contracts | 345 | | Pension risk | 143 |
| | | | Regulatory risk | 142 |
| | | | Reputation risk | 143 |
| | | | Structural foreign currency exposures | 84 |
Shareholder information continued | Shareholder information |
Index continued | | | | |
| Risk factors | 7, 352 | | Subordinated liabilities | |
| | | | Consolidated | 290 |
| Risk-weighted assets | 26, 58, 66, 69 | | Parent company | 290 |
| | | | | |
| Securitisations | | | Summary of Group results | 333 |
| Notes on the accounts | 305 | | | |
| Other risk exposures | 157 | | Supervision | 343 |
| | | | | |
| Segmental reporting | | | Tax | |
| Business review | 25 | | Accounting policy | 220 |
| Description of business | 5 | | Business review | 24 |
| Notes on the accounts | 318 | | Critical accounting policies | 226 |
| | | Notes on the accounts | 238 |
| Share-based payments | | | Notes on the accounts - deferred tax | 283 |
| Accounting policy | 224 | | | |
| Notes on the accounts | 231 | | UK Corporate | 5, 31, 318 |
| | | | | |
| Share capital | | | UK Retail | 5, 28, 318 |
| Additional information | 373 | | | |
| Notes on the accounts | 299 | | Ulster Bank | 5, 37, 318 |
| | | | | |
| Shareholder information | | | US Retail & Commercial | 5, 40, 318 |
| Analysis of shareholders | 372 | | | |
| Annual General Meeting | 371 | | Wealth | 5, 33, 318 |
| Shareholder enquiries | 371 | | | |
| | | Value-at-risk (VaR) | 133 |
| Short-term borrowings | 76 | | |
| | | | | |
| Statement of changes in equity | | | | |
| Consolidated | 212 | | | |
| Parent company | 212 | | | |
| | | | | |
| Statement of comprehensive income | | | | |
| Consolidated | 210 | | | |
| Parent company | 239 | | | |
| | | | | |
| Statement of directors’ responsibilities | 206 | | | |
| | | | | |
Shareholder information continued | Shareholder information |
Important addresses Shareholder enquiries Registrar Computershare Investor Services PLC The Pavilions Bridgwater Road Bristol BS99 6ZZ Telephone: +44 (0)870 702 0135 Facsimile: +44 (0)870 703 6009 Website: www.investorcentre.co.uk/contactus ADR Depositary Bank BNY Mellon Shareowner Services PO Box 358516 Pittsburgh, PA 15252-8516 Telephone: 866 241 9317+1 888 269 2377 (US callers) Telephone: +1 201 680 6825 (International) Email: shrrelations@bnymellon.com Website: www.bnymellon.com/shareowner The Royal Bank of Scotland Group plc PO Box 1000 Business House F
Gogarburn Edinburgh EH12 1HQ Telephone: 0131+44 (0)131 556 8555 Facsimile: 0131+44 (0)131 626 3081 Investor Relations 280 Bishopsgate London EC2M 4RB Telephone: +44 (0)207 672 1758 Facsimile: +44 (0)207 672 1801 Email: investor.relations@rbs.com Registered office 36 St Andrew Square Edinburgh EH2 2YB Telephone: 0131+44 (0)131 556 8555 Registered in Scotland No. 45551 Website www.rbs.com | |
The Royal Bank of Scotland Group plc PO Box 1000 Gogarburn Edinburgh EH12 1HQ Telephone: 0131+44 (0)131 626 0000
The Royal Bank of Scotland plc PO Box 1000 Gogarburn Edinburgh EH12 1HQ 280 Bishopsgate London EC2M 4RB
National Westminster Bank Plc 135 Bishopsgate London EC2M 3UR
Citizens Citizens Financial Group, Inc. One Citizens Plaza Providence Rhode Island 02903 USA
Ulster Bank 11-16 Donegall Square East Belfast BT1 5UB George’sGeorge's Quay Dublin 2
RBS Insurance Direct Line House 3 Edridge Road Croydon Surrey CR9 1AG Churchill Court Westmoreland Road Bromley Kent BR1 1DP
RBS Greenwich CapitalHoldings USA Inc. 600 Steamboat RoadWashington Blvd Greenwich Connecticut 06830Stamford CT
06901 USA
Coutts Group 440 Strand London WC2R 0QS
Shareholder information continued
The Royal Bank of Scotland International Limited Royal Bank House 71 Bath Street St Helier Jersey Channel Islands JE4 8PJ NatWest Offshore 23/25 Broad Street St Helier Jersey Channel Islands JE4 8QJOYX
ABN AMRO HoldingRBS Holdings N.V.
Gustav Mahlerlaan 10 Amsterdam 1082 PP Amsterdam The Netherlands
Exhibit Number | | Description | | | | 1.1 | | Memorandum and Articles of Association of The Royal Bank of Scotland Group plc | | | | 2.1 | | Form of Deposit Agreement among The Royal Bank of Scotland Group plc, The Bank of New York as Depositary, and all Owners and Holders from time to time of American Depositary Receipts issued thereunder, incorporated by reference to Exhibit 1 to the Registration Statement on Form F-6 (Registration No. 333-144756) (filed on 20 July 2007) | | | | 2.2 | | Form of American Depositary Receipt for ordinary shares of the par value of £0.25 each incorporated by reference to Exhibit A of Exhibit 1 to the Registration Statement on Form F-6 (Registration No. 333-144756) (filed on 20 July 2007) | | | | 2.3 | | Letter dated May 12, 2008 from The Bank of New York Mellon as Depository to The Royal Bank of Scotland Group plc relating to the Prerelease of American Depository Receipts, incorporated by reference to Exhibit 2.3 to the Group’s Annual Report on Form 20-F for the fiscal year ended 31 December 2007 (File No. 1-10306)
| | | | 4.1 | | Service agreement for Stephen Hester | | | | 4.2 | | Service agreement amendment for Stephen Hester | | | | 4.3** | | Service contract for Gordon Pell | | | | 4.4** | | Service contract for Guy Whittaker | | | | 4.5*** | | Form of Deed of Indemnity for Directors | | | | 4.6 | | Consortium and Shareholders' Agreement, dated 28 May 2007, among The Royal Bank of Scotland Group plc, Banco Santander Central Hispano, S.A., Fortis N.V., Fortis SA/NV and RFS Holdings B.V. incorporated by reference to Exhibit 10.1 to the Registration Statement on Form F-4 (Registration No. 333-144752) (filed on July 20, 2007) | | | | 4.7 | | Supplemental Consortium and Shareholders' Agreement dated 17 September 2007, supplementing the Consortium and Shareholders' Agreement dated 28 May 2007, among The Royal Bank of Scotland Group plc, Banco Santander, S.A., Fortis N.V., Fortis SA/NV and RFS Holdings B.V. incorporated by reference to Exhibit 99.(A)(5)(XXVI) to Amendment No. 9 to the Tender Offer Statement on Schedule TO filed on 18 September 2007 |
4.8 | | Amendment Agreement dated August 2008, relating to the Consortium and Shareholders' Agreement dated 28 May 2007, among The Royal Bank of Scotland Group plc, Banco Santander, S.A., Fortis N.V., Fortis SA/NV and, by accession, Fortis Nederland (Holding) N.V., and RFS Holdings B.V. (as supplemented and amended by a Supplemental Consortium and Shareholders’ Agreement dated 17 September 2007) | | | | 4.9 | | Deed of Accession dated December 2008 among The Royal Bank of Scotland Group plc, Banco Santander, S.A., Fortis Bank Nederland (Holding) N.V., The State of the Netherlands and RFS Holdings B.V. | | | | 4.10 | | Letter dated 28 May 2007 from Merrill Lynch International to The Royal Bank of Scotland plc incorporated by reference to Exhibit 10.3 to the Registration Statement on Form F-4 (Registration No. 333-144752) (filed on July 20, 2007) | | | | 4.11 | | Purchase and Sale Agreement dated 22 April 2007 among ABN Amro Bank N.V. and Bank of America Corporation incorporated by reference to the Form 6-K filed by ABN Amro Holdings N.V. (Registration No. 001-14624) (filed on April 24, 2007) | | | | 4.12 | | Underwriting Agreement dated 22 April 2008 among The Royal Bank of Scotland Group plc, Goldman Sachs International, Merrill Lynch International, UBS Limited and The Royal Bank of Scotland plc | | | | 4.13 | | Share Purchase Agreement dated 13 June 2008 among The Royal Bank of Scotland Group plc and Willow Bidco Limited | | | | 4.14 | | Share Purchase Agreement dated 28 July 2008 among The Royal Bank of Scotland Group plc and Tesco plc relating to the sale and purchase of part of the issued share capital of Tesco Personal Finance Group Limited |
Exhibit Number | | Description |
| | | 4.15 | | Placing and Open Offer Agreement dated 13 October 2008 among The Royal Bank of Scotland Group plc, UBS Limited, Merrill Lynch International and The Commissioners of Her Majesty’s Treasury | | | | 4.16 | | Preference Share Acquisition Agreement dated 13 October 2008 among The Commissioners of Her Majesty’s Treasury, The Royal Bank of Scotland Group plc and UBS Limited | | | | 4.17 | | Amendment Agreement dated 13 October 2008 among The Royal Bank of Scotland Group plc, UBS Limited, Merrill Lynch International and The Commissioners of Her Majesty’s Treasury | | | | 4.18 | | First Subscription and Transfer Agreement dated 4 November 2008 among UBS Limited, Merrill Lynch International, Encuentro Limited and The Royal Bank of Scotland Group plc | | | | 4.19 | | Second Subscription and Transfer Agreement dated 4 November 2008 among UBS Limited, Merrill Lynch International, Encuentro Limited and The Royal Bank of Scotland Group plc | | | | 4.20 | | Amendment Deed dated 28 November 2009 among UBS Limited, Merrill Lynch International, Encuentro Limited and The Royal Bank of Scotland Group plc | | | | 4.21 | | Second Placing and Open Offer Agreement dated 19 January 2009 among The Royal Bank of Scotland Group plc, UBS Limited, Merrill Lynch International and The Commissioners of Her Majesty’s Treasury | | | | 4.22 | | Pre-accession Commitments Deed poll dated 26 February 2009 by The Royal Bank of Scotland plc | | | | 4.23* | | Lending Commitments Deed poll dated 26 February 2009 by The Royal Bank of Scotland plc | | | | 7.1 | | Explanation of ratio calculations | | | | 8.1 | | Principal subsidiaries of The Royal Bank of Scotland Group plc |
12.1 | | CEO certification required by Rule 13a-14(a) | | | | 12.2 | | CFO certification required by Rule 13a-14(a) | | | | 13.1 | | Certification required by Rule 13a-14(b) | | | | 15.1 | | Consent of independent registered public accounting firm |
* | Confidential treatment has been requested. Confidential materials have been redacted and separately filed with the SEC.
|
** | Previously filed and incorporated by reference to Exhibits 4.4 and 4.6, respectively to the Group’s Annual Report on Form 20-F for the fiscal year ended 31 December 2005 (file No. 1-10306).
|
*** | Previously filed and incorporated by reference to Exhibit 4.11 to the Group’s Annual Report on Form 20-F for the fiscal year ended 31 December 2006 (File No. 1-10306) except that the sentence “PROVIDED THAT this Indemnity is given subject to the provisions of Section 309A Company Act 1985” has been replaced with “PROVIDED THAT this Indemnity is given subject to the provisions of Section 234 Companies Act 2001”.
|
The registrant hereby certifies that it meets all of the requirements for filing on Form 20-F and that it has duly caused and authorized the undersigned to sign this annual report on its behalf.
The Royal Bank of Scotland Group plc
Registrant
/s/ Guy Robert Whittaker
Guy Robert Whittaker
Group Finance Director
29 April 2009
Exhibit Index
Exhibit Number | | Description | | | | | 1.1 | | Memorandum and Articles of Association of The Royal Bank of Scotland Group plc | | | | | 2.1 † | | Form of Deposit Agreementagreement among The Royal Bank of Scotland Group plc, The Bank of New York as Depositary, and all Owners and Holders from time to time of American Depositary Receipts issued thereunder incorporated by reference to Exhibit 1 to the Registration Statement on Form F-6 (Registration No. 333-144756) (filed on 20 July 2007) | | | | | 2.2 ‡ | | Form of American Depositary Receipt for ordinary shares of the par value of £0.25 each incorporated by reference to Exhibit A of Exhibit 1 to the Registration Statement on Form F-6 (Registration No. 333-144756) (filed on 20 July 2007) | | 2.3 § | | | 2.3 | | Letter dated May 12, 2008 from The Bank of New York Mellon as Depository to The Royal Bank of Scotland Group plc relating to the Prerelease of American Depository Receipts incorporated by reference | | 2.4 | | Neither The Royal Bank of Scotland Group plc nor The Royal Bank of Scotland plc is party to Exhibit 2.3any single instrument relating to long-term debt pursuant to which a total amount of securities exceeding 10% of the Group’s total assets (on a consolidated basis) is authorised to be issued. Each of The Royal Bank of Scotland Group plc and The Royal Bank of Scotland plc hereby agrees to furnish to the Group’s Annual Report on Form 20-FSecurities and Exchange Commission (the “Commission”), upon its request, a copy of any instrument defining the rights of holders of its long-term debt or the rights of holders of the long-term debt of any of its subsidiaries for which consolidated or unconsolidated financial statements are required to be filed with the fiscal year ended 31 December 2007 (File No. 1-10306)Commission. | | | | 4.14.1* | | Service agreement for Stephen Hester | | | | 4.24.2* | | Service agreement amendment for Stephen Hester | | | | 4.3**4.3§§ | | Service contractagreement for Gordon Pell | | | Bruce Van Saun | 4.4** | | Service contract for Guy Whittaker | | | | 4.5*** | | Form of Deed of Indemnity for Directors | | | | 4.6 | | Consortium and Shareholders' Agreement, dated 28 May 2007, among The Royal Bank of Scotland Group plc, Banco Santander Central Hispano, S.A., Fortis N.V., Fortis SA/NV and RFS Holdings B.V. incorporated by reference to Exhibit 10.1 to the Registration Statement on Form F-4 (Registration No. 333-144752) (filed on July 20, 2007) | | | | 4.7 | | Supplemental Consortium and Shareholders' Agreement dated 17 September 2007, supplementing the Consortium and Shareholders' Agreement dated 28 May 2007, among The Royal Bank of Scotland Group plc, Banco Santander, S.A., Fortis N.V., Fortis SA/NV and RFS Holdings B.V. incorporated by reference to Exhibit 99.(A)(5)(XXVI) to Amendment No. 9 to the Tender Offer Statement on Schedule TO filed on 18 September 2007 |
4.84.5* | | Amendment Agreement dated August 2008, relating to the Consortium and Shareholders'Shareholders’ Agreement dated 28 May 2007, among The Royal Bank of Scotland Group plc, Banco Santander, S.A., Fortis N.V., Fortis SA/NV and, by accession, Fortis Nederland (Holding) N.V., and RFS Holdings B.V. (as supplemented and amended by a Supplemental Consortium and Shareholders’ Agreement dated 17 September 2007) | | | | 4.94.6* | | Deed of Accession dated December 2008 among The Royal Bank of Scotland Group plc, Banco Santander, S.A., Fortis Bank Nederland (Holding) N.V., The State of the Netherlands and RFS Holdings B.V. | | | | 4.10 | | Letter dated 28 May 2007 from Merrill Lynch International to The Royal Bank of Scotland plc incorporated by reference to Exhibit 10.3 to the Registration Statement on Form F-4 (Registration No. 333-144752) (filed on July 20, 2007) | | | | 4.11 | | Purchase and Sale Agreement dated 22 April 2007 among ABN Amro Bank N.V. and Bank of America Corporation incorporated by reference to the Form 6-K filed by ABN Amro Holdings N.V. (Registration No. 001-14624) (filed on April 24, 2007) | | | | 4.12 | | Underwriting Agreement dated 22 April 2008 among The Royal Bank of Scotland Group plc, Goldman Sachs International, Merrill Lynch International, UBS Limited and The Royal Bank of Scotland plc | | | | 4.13 | | Share Purchase Agreement dated 13 June 2008 among The Royal Bank of Scotland Group plc and Willow Bidco Limited | | | | 4.14 | | Share Purchase Agreement dated 28 July 2008 among The Royal Bank of Scotland Group plc and Tesco plc relating to the sale and purchase of part of the issued share capital of Tesco Personal Finance Group Limited |
Exhibit Number | | Description |
| | | 4.15 | | Placing and Open Offer Agreement dated 13 October 2008 among The Royal Bank of Scotland Group plc, UBS Limited, Merrill Lynch International and The Commissioners of Her Majesty’s Treasury | | | | 4.16 | | Preference Share Acquisition Agreement dated 13 October 2008 among The Commissioners of Her Majesty’s Treasury, The Royal Bank of Scotland Group plc and UBS Limited | | | | 4.17 | | Amendment Agreement dated 13 October 2008 among The Royal Bank of Scotland Group plc, UBS Limited, Merrill Lynch International and The Commissioners of Her Majesty’s Treasury | | | | 4.18 | | First Subscription and Transfer Agreement dated 4 November 2008 among UBS Limited, Merrill Lynch International, Encuentro Limited and The Royal Bank of Scotland Group plc | | | | 4.19 | | Second Subscription and Transfer Agreement dated 4 November 2008 among UBS Limited, Merrill Lynch International, Encuentro Limited and The Royal Bank of Scotland Group plc | | | | 4.20 | | Amendment Deed dated 28 November 2009 among UBS Limited, Merrill Lynch International, Encuentro Limited and The Royal Bank of Scotland Group plc | | | | 4.214.7* | | Second Placing and Open Offer Agreement dated 19 January 2009 among The Royal Bank of Scotland Group plc, UBS Limited, Merrill Lynch International and The Commissioners of Her Majesty’s Treasury | | | | 4.224.8* | | Pre-accession Commitments Deed poll dated 26 February 2009 by The Royal Bank of Scotland plc | | | | 4.23*4.9 ‡‡ *** | | Lending Commitments Deed poll dated 26 February 2009 by The Royal Bank of Scotland plc | 4.10 §§ | | Acquisition and contingent capital agreement dated 26 November 2009 among The Royal Bank of Scotland Group plc and The Commissioners of Her Majesty’s Treasury | 4.11*** §§ | | Accession Agreement dated 26 November 2009 among The Commissioners of Her Majesty’s Treasury, The Royal Bank of Scotland plc and The Royal Bank of Scotland Group plc relating to the UK Asset Protection Scheme |
4.12 §§ | | Agreements to forego Tax reliefs dated 26 November 2009 among The Commissioners of Her Majesty’s Treasury, The Commissioners for Her Majesty’s Revenue and Customs, The Royal Bank of Scotland plc, The Royal Bank of Scotland Group plc and ABN AMRO Bank N.V. in connection with an Exit Fee payable under an Accession Agreement relating to the UK Asset Protection Scheme | 4.13 §§ | | Agreements to forego Tax reliefs dated 26 November 2009 among The Commissioners of Her Majesty’s Treasury, The Commissioners for Her Majesty’s Revenue and Customs, The Royal Bank of Scotland plc, The Royal Bank of Scotland Group plc and ABN AMRO Bank N.V. in connection with an Acquisition and Contingent Capital Agreement | 4.14 §§ | | Agreements to forego Tax reliefs dated 26 November 2009 among The Commissioners of Her Majesty’s Treasury, The Commissioners for Her Majesty’s Revenue and Customs, The Royal Bank of Scotland plc, The Royal Bank of Scotland Group plc and ABN AMRO Bank N.V. in connection with an Accession Agreement relating to the UK Asset Protection Scheme | 4.15*** §§ | | State Aid Commitment Deed dated 26 November 2009 among The Commissioners of Her Majesty’s Treasury and The Royal Bank of Scotland Group plc | 4.16*** §§ | | State Aid Cost Reimbursement Deed dated 26 November 2009 among The Commissioners of Her Majesty’s Treasury and The Royal Bank of Scotland Group plc | 4.17 §§ | | Amendment to the Lending Commitments Deed poll dated 23 March 2010 by The Royal Bank of Scotland plc | 4.18*** §§ | | Restated Consortium and Shareholders’ Agreement dated 1 April 2010, among The Royal Bank of Scotland Group plc, Banco Santander, S.A., The State of the Netherlands and RFS Holdings B.V. | 4.19 §§ | | UK Asset Protection Scheme Terms and Conditions | | 4.20++ | | Purchase and Sale Agreement dated 16 February 2010 in connection with the sale by RBS Sempra Commodities JV, a joint venture owned by the Royal Bank and Sempra Energy, of its metals, oils and European energy business lines | | 4.21*** | | Amendment to the Purchase and Sale Agreement dated 30 June 2010 | | 4.22*** | | Sale and Purchase Agreement dated 4 August 2010 among The Royal Bank of Scotland plc, National Westminster Bank plc, National Westminster Home Loans Limited and Santander UK plc | | 4.23*** | | Transfer Agreement dated 6 August 2010 among the Bank and Ship Bidco Limited. | | 4.24 | | First Supplement to UK Asset Protection Scheme dated 27 August 2010 | | 4.25*** | | Second Supplement to UK Asset Protection Scheme dated 20 December 2010 | | 4.26 | | Third Supplement to UK Asset Protection Scheme dated 10 February 2011 | | 4.27***++ | | Purchase and Sale Agreement dated 20 September 2010 in connection with the sale by RBS Sempra Commodities JV of its Sempra Energy Solutions business line by and among Noble Americas Gas & Power Corp., RBS Sempra Commodities LLP, Sempra Energy and The Royal Bank of Scotland plc | | 4.28***++ | | Transfer Agreement dated 7 October 2010 in connection with the sale by RBS Sempra Commodities JV of its commodities trading North American Power and Gas business by and among J.P. Morgan Ventures Energy Corporation, RBS Sempra Commodities LLP, Sempra Energy Trading LLC, Sempra Energy and The Royal Bank of Scotland plc |
| 4.29*** | | Amendment Agreement dated 29 November 2010 among The Royal Bank of Scotland plc, Worldpay (UK) Limited, Worldpay Ecommerce Limited and Ship US Bidco, Inc. |
| 4.30*** | | Amended and Restated Investment Agreement relating to Ship Luxco Holding & Cy. S.C.A. dated 29 November 2010 | | 7.1 | | Explanation of ratio calculations | | | | | 8.1 | | Principal subsidiaries of The Royal Bank of Scotland Group plc |
| 12.1 | | CEO certification required by Rule 13a-14(a) | | | | | 12.2 | | CFO certification required by Rule 13a-14(a) | | | | | 13.1 | | Certification required by Rule 13a-14(b) | | | 13a-14(a) | | 15.1 | | Consent of independent registered public accounting firm |
*† | Confidential treatment has been requested. Confidential materials have been redacted and separately filed with the SEC.
|
** | Previously filed and incorporated by reference to Exhibits 4.4 and 4.6, respectivelyExhibit 1 to the Group’sRegistration Statement on Form F-6 (Registration No. 333-144756) (filed on 20 July 2007) |
| ‡ | Previously filed and incorporated by reference to Exhibit A of Exhibit 1 to the Registration Statement on Form F-6 (Registration No. 333-144756) (filed on 20 July 2007) |
| § | Previously filed and incorporated by reference to Exhibit 2.3 to the Group’s Annual Report on Form 20-F for the fiscal year ended 31 December 20052007 (File No. 1-10306) |
| * | Previously filed and incorporated by reference to Exhibit 4.1, 4.2, 4.8, 4.9, 4.21 and 4.22 respectively to the Group’s Annual Report on Form 20-F for the fiscal year ended 31 December 2008 (file No. 1-10306). |
*** | Previously filed and incorporated by reference to Exhibit 4.11 to the Group’sGroup’s Annual Report on Form 20-F for the fiscal year ended 31 December 2006 (File(file No. 1-10306) except that the sentence “PROVIDED“PROVIDED THAT this Indemnity is given subject to the provisions of Section 309A Company Act 1985”1985” has been replaced with “PROVIDED THAT this Indemnity is given subject to the provisions of Section 234 CompaniesCompany Act 2001”2001”. |
| *** | Confidential treatment has been requested. Confidential materials have been redacted and separately filed with the SEC. |
| ‡‡ | Previously filed and incorporated by reference to Exhibit 4.3 to the Group’s Annual Report on Form 20-F/A for the fiscal year ended 31 December 2008 (File No. 1-10306) |
| §§ | Previously filed and incorporated by reference to Exhibit 4.19, 4.21, 4.22, 4.23, 4.24, 4.25, 4.26, 4.27 and 4.28 to the Group’s Annual Report on Form 20-F for the fiscal year ended 31 December 2009 (File No. 1-10306) |
| ++ | The exhibits and schedules to this agreement has not been filed, but the table of contents (that is included in the agreement) briefly identifies the contents of such omitted exhibits and schedules. The Royal Bank of Scotland Group plc hereby agrees to furnish to the Securities and Exchange Commission, upon its request, a copy of any such omitted exhibits and schedules. |
SIGNATURE
The registrant hereby certifies that it meets all of the requirements for filing on Form 20-F and that it has duly caused and authorized the undersigned to sign this annual report on its behalf.
The Royal Bank of Scotland Group plc Registrant
/s/ Bruce Van Saun Bruce Van Saun Group Finance Director March 31, 2011
|