This Annual Report contains statements that constitute forward-looking statements within the meaning of Section 27A of the Securities Act of 1933, as amended (the “Securities Act”), Section 21E of the Securities Exchange Act of 1934 (the “Exchange Act”), as amended, and the safe harbor provisions of the Private Securities Litigation Reform Act of 1995. The forward-looking statements in this Annual Report can be identified, in some instances, by the use of words such as “will,” “shall,” “target,” “expect,” “aim,” “hope,” “anticipate,” “should,” “may,” “might,” “assume,” “estimate,” “plan,” “intend,” “believe” and similar language or other formulations of a similar meaning or, in each case, the negative thereofformulations thereof. Other forward-looking statements can be identified in the context in which the statements are made or by the forward-looking nature of discussions of strategy, plans or intentions. These statements appear in a number of places in this Annual Report including, without limitation, certain statements made in “Item 3. Key Information—Risk Factors,” “Item 4. Information on the Company,” “Item 5. Operating and Financial Review and Prospects” and “Item 11. Quantitative and Qualitative Disclosures About Market Risk” and include statements regarding our intent, belief or current expectations with respect to, among other things:
| · | the effect on our results of operations of competition in telecommunications markets; |
| · | trends affecting our business financial condition, |
| · | acquisitions, investments or |
| · | our capital expenditures plan; |
| · | our estimated availability of funds; |
| · | our ability to repay debt with estimated future cash flows; |
| · | our shareholder remuneration policies; |
| · | supervision and regulation of the telecommunications sectors where we have significant operations; |
| · | our strategic partnerships; and |
| · | the potential for growth and competition in current and anticipated areas of our business. |
Such forward-looking statements are not guarantees of future performance and involve numerous risks and uncertainties, and actual results may differ materially from those anticipated in the forward-looking statements as a result of various factors. The risks and uncertainties involved in our businessbusinesses that could affect the matters referred to in such forward-looking statements include but are not limited to:
| · | changes in general economic, business or political conditions in the domestic or international markets in which we operate or have material investments that may affect demand for our services; |
| · |
| · | existing or worsening conditions in the international financial markets; |
| · | the impact of current, pending or future legislation and regulation in countries where we operate, as well as any failure to renew or obtain the necessary licenses, authorizations and concessions to carry out our operations and the impact of limitations in spectrum capacity; |
| · | compliance with anti-corruption laws and regulations and economic sanctions programs; |
| · | customers’ perceptions of services offered by us; |
| · | the actions of existing and potential competitors in each of our markets as well as the potential effects of technological changes; |
| · | failure of suppliers to provide necessary equipment and services on a timely basis; |
| · | the impact of unanticipated network |
| · | the effect of reports suggesting that |
| · | the impact of impairment charges on our goodwill and assets as a result of changes in the regulatory, business or political environment; |
| · | potential liability resulting from our internet access and hosting services arising from illegal or illicit use of the internet, including the inappropriate dissemination or modification of consumer data; and |
| · | the outcome of pending |
Readers are cautioned not to place undue reliance on those forward-looking statements, which speak only as of the date of this Annual Report. We do not undertake noany obligation to release publicly the result ofupdate any revisions to these forward-looking statements whichthat may be made to reflect events or circumstances after the date of this Annual Report including, without limitation, changes in our business or acquisition strategy or planned capital expenditures, or to reflect the occurrence of unanticipated events.
Our ordinary shares, nominal value €1.001.00 euro per share, are currently listed on each of the Madrid, Barcelona, Bilbao and Valencia stock exchanges (collectively, the “Spanish Stock Exchanges”) and are quoted through the Automated Quotation System under the symbol “TEF.” They are also listed on various foreign stock exchanges such as the London and Buenos Aires stock exchanges. American Depositary Shares (“ADSs”ADSs”), each representing the right to receive one ordinary share, are listed on the New York Stock Exchange and on the Lima Stock Exchange. ADSs are evidenced by American Depositary Receipts (“ADRs”ADRs”) issued under a Deposit Agreement with Citibank, N.A., as Depositary. During 2011 our shares were delisted from the Tokyo Stock Exchange, and our BDRs were delisted from the Sao Paulo Stock Exchange.
As used herein, “Telefó“Telefónica,” “Telefó“Telefónica Group,” “Group”“Group”, the “Company” and terms such as “we,“we,” “us”“us” and “our”“our” mean Telefónica, S.A. and its consolidated subsidiaries, unless the context requires otherwise.
As used herein, “Atento”“Atento” means Atento, Holding, Inversiones y Teleservicios, S.A. and its consolidated subsidiaries, unless the context requires otherwise.
Below are definitions of certain technical terms used in this Annual Report:
“Final client accesses”means accesses provided directly to our business are as follows:residential and corporate clients.
“Fixed telephony accesses”includes public switched telephone network, or PSTN, lines (including public use telephony), and integrated services digital network, or ISDN, lines and circuits. For purposes of calculating our number of
“MVNO”means mobile virtual network operator, which is a mobile operator that is not entitled to use spectrum for the provision of mobile services. Consequently, an MVNO must subscribe to an access agreement with a mobile network operator in order to provide mobile access to their customers. An MVNO pays such mobile network operator for using the infrastructure to facilitate coverage to their customers.
“VoIP”means voice over Internet protocol.
“Wholesale accesses”means accesses we provide to our competitors, who then sell services over such accesses to their residential and corporate clients.
“Wholesale ADSL”means accesses of broad band or fiber that we provide to our competitors, who then sell services over such accesses to their residential and corporate clients.
In this Annual Report we make certain comparisons in local currency or on a “constant euro basis” or “excluding foreign exchange rate effects” in order to present an analysis of the development of our results of operations from year-to-year without the effects of currency fluctuations. To make comparisons on a local currency basis, we compare financial items in the relevant local currency for the periods indicated as recorded in the relevant local currency for such periods. To make comparisons on a “constant euro basis” or “excluding foreign exchange rate effects,” we convert the relevant financial item into euro using the prior year’s average euro to relevant local currency exchange rate. In addition, we present certain financial information excluding the effects of Venezuela being considered a hyperinflationary economy in 2009, 20102012, 2013 and 20112014 by eliminating all adjustments made as a result of such consideration.
In this Annual Report, references to “US“U.S. dollars,” “dollars” or “$,” are to United States dollars, references to “pounds sterling,” “sterling” or “£” are to British pounds sterling, references to “reais” refer to Brazilian reais and references to “euro”, “euros” or “€” are to the single currency of the participating member states in the Third Stage of the European Economic and Monetary Union pursuant to the treaty establishing the European Community, as amended from time to time.
Our consolidated financial statements as of December 31, 20102013 and 2011,2014, and for the years ended December 31, 2009, 20102012, 2013 and 20112014 included elsewhere in this Annual Report including the notes thereto (the “Consolidated Financial Statements”), are prepared in conformity with International Financial Reporting Standards (“IFRS”) as issued by the International Accounting Standards Board (“IASB”).
Item 1. | Identity of Directors, Senior Management and Advisors |
Not applicable.
Not applicable.
Not applicable.
| Offer Statistics and Expected Timetable |
Not applicable.
| Key Information |
The following table presents certain selected consolidated financial data. It is to be read in conjunction with “Item 5. Operating and Financial Review and Prospects” and the Consolidated Financial Statements. The consolidated income statement and cash flow data for the years ended December 31, 2009, 20102012, 2013 and 20112014 and the consolidated statement of financial position data as of December 31, 20102013 and 20112014 set forth below are derived from, and are qualified in their entirety by reference to the Consolidated Financial Statements. The consolidated income statement and cash flow data for the years ended December 31, 20072010 and 20082011 and the consolidated statement of financial position data as of December 31, 2007, 20082010, 2011 and 20092012 set forth below are derived from Telefónica, S.A.’s consolidated financial statements for such years, which are not included herein.
Our Consolidated Financial Statements have been prepared in accordance with IFRS as issued by the IASB.
The basis of presentation and principles of consolidation areis described in detail in NotesNote 2 and 3(q), respectively, to our Consolidated Financial Statements.
As of or for the year ended December 31, | ||||||||||||||||||||
2007 | 2008 | 2009 | 2010 | 2011 | ||||||||||||||||
| (in millions of euro, except share and per share data) | ||||||||||||||||||||
Revenues | 56,441 | 57,946 | 56,731 | 60,737 | 62,837 | |||||||||||||||
Other income | 4,264 | 1,865 | 1,645 | 5,869 | 2,107 | |||||||||||||||
Supplies | (17,907 | ) | (17,818 | ) | (16,717 | ) | (17,606 | ) | (18,256 | ) | ||||||||||
Personnel expenses | (7,893 | ) | (6,762 | ) | (6,775 | ) | (8,409 | ) | (11,080 | ) | ||||||||||
Other expenses | (12,081 | ) | (12,312 | ) | (12,281 | ) | (14,814 | ) | (15,398 | ) | ||||||||||
Depreciation and amortization | (9,436 | ) | (9,046 | ) | (8,956 | ) | (9,303 | ) | (10,146 | ) | ||||||||||
Operating income | 13,388 | 13,873 | 13,647 | 16,474 | 10,064 | |||||||||||||||
Share of profit (loss) of associates | 140 | (161 | ) | 47 | 76 | (635 | ) | |||||||||||||
Net finance expense | (2,851 | ) | (2,821 | ) | (2,767 | ) | (2,537 | ) | (2,782 | ) | ||||||||||
Net exchange differences | 7 | 24 | (540 | ) | (112 | ) | (159 | ) | ||||||||||||
| Net financial expense | (2,844 | ) | (2,797 | ) | (3,307 | ) | (2,649 | ) | (2,941 | ) | ||||||||||
| Profit before tax from continuing operations | 10,684 | 10,915 | 10,387 | 13,901 | 6,488 | |||||||||||||||
Corporate income tax | (1,565 | ) | (3,089 | ) | (2,450 | ) | (3,829 | ) | (301 | ) | ||||||||||
| Profit for the year from continuing operations | 9,119 | 7,826 | 7,937 | 10,072 | 6,187 | |||||||||||||||
| Profit after taxes from discontinued operations | — | — | — | — | — | |||||||||||||||
Profit for the year | 9,119 | 7,826 | 7,937 | 10,072 | 6,187 | |||||||||||||||
Non-controlling interests | (213 | ) | (234 | ) | (161 | ) | 95 | (784 | ) | |||||||||||
| Profit for the year attributable to equity holders of the parent | 8,906 | 7,592 | 7,776 | 10,167 | 5,403 | |||||||||||||||
| Weighted average number of shares (thousands) | 4,758,707 | 4,645,852 | 4,552,656 | 4,522,228 | 4,511,165 | |||||||||||||||
| Basic and diluted earnings per share from continuing operations attributable to equity holders (euro)(1) | 1.87 | 1.63 | 1.71 | 2.25 | 1.20 | |||||||||||||||
| Basic and diluted earnings per share attributable to equity holders of the parent (euro)(1) | 1.87 | 1.63 | 1.71 | 2.25 | 1.20 | |||||||||||||||
Earnings per ADS (euro)(1)(2) | 1.87 | 1.63 | 1.71 | 2.25 | 1.20 | |||||||||||||||
| Weighted average number of ADS (thousands)(2) | 4,758,707 | 4,645,852 | 4,552,656 | 4,522,228 | 4,511,165 | |||||||||||||||
Cash dividends per ordinary share (euro) | 0.65 | 0.90 | 1.00 | 1.30 | 1.52 | |||||||||||||||
| Consolidated Statement of Financial Position Data | ||||||||||||||||||||
Cash and cash equivalents | 5,065 | 4,277 | 9,113 | 4,220 | 4,135 | |||||||||||||||
Property, plant and equipment | 32,460 | 30,545 | 31,999 | 35,797 | 35,463 | |||||||||||||||
Total assets | 105,873 | 99,896 | 108,141 | 129,775 | 129,623 | |||||||||||||||
Non-current liabilities | 58,044 | 55,202 | 56,931 | 64,599 | 69,662 | |||||||||||||||
Equity (net) | 22,855 | 19,562 | 24,274 | 31,684 | 27,383 | |||||||||||||||
Capital stock | 4,773 | 4,705 | 4,564 | 4,564 | 4,564 | |||||||||||||||
Consolidated Cash Flow Data | ||||||||||||||||||||
Net cash from operating activities | 15,551 | 16,366 | 16,148 | 16,672 | 17,483 | |||||||||||||||
Net cash used in investing activities | (4,592 | ) | (9,101 | ) | (9,300 | ) | (15,861 | ) | (12,497 | ) | ||||||||||
Net cash used in financing activities | (9,425 | ) | (7,765 | ) | (2,281 | ) | (5,248 | ) | (4,912 | ) | ||||||||||
11
| Millions of euros | 2010 | 2011 | 2012 | 2013 | 2014 |
| Revenues | 60,737 | 62,837 | 62,356 | 57,061 | 50,377 |
| Other income | 5,869 | 2,107 | 2,323 | 1,693 | 1,707 |
| Supplies | (17,606) | (18,256) | (18,074) | (17,041) | (15,182) |
| Personnel expenses | (8,409) | (11,080) | (8,569) | (7,208) | (7,098) |
| Other expenses | (14,814) | (15,398) | (16,805) | (15,428) | (14,289) |
| Depreciation and amortization | (9,303) | (10,146) | (10,433) | (9,627) | (8,548) |
| OPERATING INCOME | 16,474 | 10,064 | 10,798 | 9,450 | 6,967 |
| Share of (loss) profit of associates | 76 | (635) | (1,275) | (304) | (510) |
| Net finance expense | (2,537) | (2,782) | (3,062) | (2,696) | (2,519) |
| Net exchange differences | (112) | (159) | (597) | (170) | (303) |
| Net financial expense | (2,649) | (2,941) | (3,659) | (2,866) | (2,822) |
| PROFIT BEFORE TAX FROM CONTINUING OPERATIONS | 13,901 | 6,488 | 5,864 | 6,280 | 3,635 |
| Corporate income tax | (3,829) | (301) | (1,461) | (1,311) | (383) |
| PROFIT FOR THE YEAR FROM CONTINUING OPERATIONS | 10,072 | 6,187 | 4,403 | 4,969 | 3,252 |
| Profit after taxes from discontinued operations | − | − | − | − | − |
| PROFIT FOR THE YEAR | 10,072 | 6,187 | 4,403 | 4,969 | 3,252 |
| Non-controlling interests | 95 | (784) | (475) | (376) | (251) |
| PROFIT FOR THE YEAR ATTRIBUTABLE TO EQUITY HOLDERS OF THE PARENT | 10,167 | 5,403 | 3,928 | 4,593 | 3,001 |
| Weighted average number of shares (thousands)(1) | 4,705,217 | 4,693,707 | 4,603,539 | 4,627,912 | 4,606,389 |
| Basic and diluted earnings per share from continuing operations attributable to equity holders of the parent (euro)(1) | 2.16 | 1.15 | 0.85 | 0.99 | 0.61 |
| Basic and diluted earnings per share attributable to equity holders of the parent (euro)(1) | 2.16 | 1.15 | 0.85 | 0.99 | 0.61 |
| Earnings per ADS (euro)(1)(2) | 2.16 | 1.15 | 0.85 | 0.99 | 0.61 |
| Weighted average number of ADS (thousands)(1)(2) | 4,705,217 | 4,693,707 | 4,603,539 | 4,627,912 | 4,606,389 |
| Cash dividends per ordinary share (euro) | 1.30 | 1.52 | 0.82 | 0.35 | 0.75 |
| Consolidated Statement of Financial Position Data | |||||
| Cash and cash equivalents | 4,220 | 4,135 | 9,847 | 9,977 | 6,529 |
| Property, plant and equipment | 35,802 | 35,469 | 35,021 | 31,040 | 33,343 |
| Total assets | 129,775 | 129,623 | 129,773 | 118,862 | 122,299 |
| Non-current liabilities | 64,599 | 69,662 | 70,601 | 62,236 | 62,311 |
| Equity (net) | 31,684 | 27,383 | 27,661 | 27,482 | 30,289 |
| Capital stock | 4,564 | 4,564 | 4,551 | 4,551 | 4,657 |
| Consolidated Cash Flow Data | |||||
| Net cash from operating activities | 16,672 | 17,483 | 15,213 | 14,344 | 12,193 |
| Net cash used in investing activities | (15,861) | (12,497) | (7,877) | (9,900) | (9,968) |
| Net cash used in financing activities | (5,248) | (4,912) | (1,243) | (2,685) | (4,041) |
| (1) | The per share and per ADS computations for all periods presented have been presented using the weighted average number of shares and ADSs, respectively, outstanding for each period, and have been adjusted to reflect the stock dividends which occurred during the periods presented, as if these had occurred at the beginning of the earliest period |
| (2) | Until January 20, 2011, each ADS represented the right to receive three ordinary shares. Since January 21, 2011, each ADS represents the right to receive one ordinary share. The above figures have been restated accordingly. Figures do not include any charges of the ADS Depositary. |
Exchange Rate Information
As used in this Annual Report, the term “Noon Buying Rate” refers to the rate of exchange for euro, expressed in U.S. dollars per euro, in the City of New York for cable transfers payable in foreign currencies as certified by the Federal Reserve Bank of New York for customs purposes. The Noon Buying Rate certified by the New York Federal Reserve Bank for the euro on March 23, 2012February 20, 2015 was $1.3263 = €1.00.$1.1372= 1.00 euro. The following tables describe, for the periods and dates indicated, information concerning the Noon Buying Rate for the euro. Amounts are expressed in U.S. dollars per €1.00.1.00 euro.
Noon Buying Rate | ||||||||||||||||
Year ended December 31, | Period end | Average (1) | High | Low | ||||||||||||
2007 | 1.4603 | 1.3797 | 1.4862 | 1.2904 | ||||||||||||
2008 | 1.3919 | 1.4698 | 1.6010 | 1.2446 | ||||||||||||
2009 | 1.4332 | 1.3955 | 1.5100 | 1.2547 | ||||||||||||
2010 | 1.3269 | 1.3261 | 1.4536 | 1.1959 | ||||||||||||
2011 | 1.2973 | 1.4002 | 1.3875 | 1.2926 | ||||||||||||
2012 (through March 23, 2012) | 1.3263 | 1.3105 | 1.3463 | 1.2682 | ||||||||||||
| Noon Buying Rate | ||||
| Year ended December 31, | Period end | Average (1) | High | Low |
| 2010 | 1.3269 | 1.3218 | 1.4536 | 1.1959 |
| 2011 | 1.2973 | 1.4002 | 1.4875 | 1.2926 |
| 2012 | 1.3186 | 1.2909 | 1.3463 | 1.2062 |
| 2013 | 1.3779 | 1.3303 | 1.3816 | 1.2774 |
| 2014 | 1.2101 | 1.3155 | 1.3816 | 1.2447 |
| 2015 (through February 20, 2015) | 1.1372 | 1.1516 | 1.2015 | 1.1279 |
Source: Federal Reserve Bank of New York.
| (1) | The average of the Noon Buying Rates for the euro on the last day reported of each month during the relevant period. |
Noon Buying Rate | ||||||||
Month ended | High | Low | ||||||
September 30, 2011 | 1.4283 | 1.3446 | ||||||
October 31, 2011 | 1.4172 | 1.3281 | ||||||
November 30, 2011 | 1.3803 | 1.3244 | ||||||
December 31, 2011 | 1.3487 | 1.2926 | ||||||
January 31, 2012 | 1.3192 | 1.2682 | ||||||
February 29, 2012 | 1.3463 | 1.3087 | ||||||
March 31, 2012 (through March 23, 2012) | 1.3320 | 1.3025 | ||||||
| Noon Buying Rate | ||
| Month ended | High | Low |
| August 31, 2014 | 1.3436 | 1.3150 |
| September 30, 2014 | 1.3136 | 1.2628 |
| October 31, 2014 | 1.2812 | 1.2517 |
| November 30, 2014 | 1.2554 | 1.2394 |
| December 31, 2014 | 1.2504 | 1.2101 |
| January 31, 2015 | 1.2015 | 1.1279 |
| February 28, 2015 (through February 20, 2015) | 1.1462 | 1.1300 |
Monetary policy within the member states of the euro zone is set by the European Central Bank. The European Central Bank has set the objective of containing inflation and will adjust interest rates in line with this policy without taking account of other economic variables such as the rate of unemployment. It has further declared that it will not set an exchange rate target for the euro.
Our ordinary shares are quoted on the Spanish stock exchangesStock Exchanges in euro. Currency fluctuations may affect the dollar equivalent of the euro price of our shares listed on the Spanish stock exchangesStock Exchanges and, as a result, the market price of our ADSs, which are listed on the New York Stock Exchange. Currency fluctuations may also affect the dollar amounts received by holders of ADSs on conversion by the depositary of any cash dividends paid in euro on the underlying shares.
Our consolidated results are affected by fluctuations between the euro and the currencies in which the revenues and expenses of some of our consolidated subsidiaries are denominated and recorded (principally the Brazilian real, the pound sterling, the Venezuelan Bolivar fuerte (see Note 2 to our Consolidated Financial Statements), the Argentine peso, the Chilean peso, the Czech koruna (crown), the Peruvian nuevo sol, the Chilean peso, the Colombian peso, the Mexican peso and the Colombian peso)Venezuelan bolívar fuerte). See Note 3 (b) to our Consolidated Financial Statements for information on the exchange rate translation methodology we used in preparing our consolidated financial information.
Not applicable.
Not applicable.
Group-related risks
Worsening of the economic and political environment could negatively affect Telefónica’s business.
Telefónica’s international presence enables the diversification of its activities across countries and regions, but it is affected by various legislations, as well as the political and economic environments of the countries in which it operates. Any adverse developments or even uncertainties in this regard, including exchange-rate or sovereign-risk fluctuations, may adversely affect the business, financial position, cash flows and/or the performance of some or all of the Group’s financial indicators.
With respect to the other information containedeconomic environment, the Telefónica Group’s business is impacted by overall economic conditions in this Annual Report,each of the countries in which it operates. Economic conditions may adversely affect the level of demand of existing and prospective investors should carefully considercustomers, as they may no longer deem critical the risks described below before making any investment decision. The risks described below are notservices offered by the only ones that we face. Additional risks not currently known to us or that we currently deem immaterial may also impair our businessGroup. Factors such as high debt levels, ongoing restructuring of the banking sector, the implementation of pending structural reforms and resultscontinued fiscal austerity measures could hinder more dynamic growth in Europe and, in turn, the consumption and volume of operations. Ourdemand for the Group's services, which could materially adversely affect the Group’s business, financial condition, results of operations and cash flow couldflows.
The soft economic recovery in Europe together with low inflation rates, and the risk of deflation, has led and may still lead to monetary and fiscal easing from key players, with a view to creating a relatively benign scenario for Europe. In this region, the Telefónica Group generated 23.9% of its total revenues in Spain, 14.0% in the United Kingdom and 11.0% in Germany in 2014.
In addition, the Group’s business may be materially adversely affected by anyother possible effects from the economic crisis, including possible insolvency of key customers and suppliers.
In Latin America, the most important challenge is the exchange-rate risk in Venezuela and Argentina, given the negative impact that a depreciation in their currencies could have on cash flows from both countries. International financial conditions may be unfavorable and may lead to potential periods of volatility linked to the evolution of the developed financial markets (especially long-term interest rates in the United States affected by the U.S. Federal Reserve’s intervention that are not discounted in the market), an economic slowdown in Asia (a key region for Latin America) and slow progress with structural reforms projects in the majority of these risks,countries limiting potential for higher growth rates. Among the most significant macroeconomic risk factors in the region are the high inflation rates, negative economic growth and investors could lose all or parthigh internal and external funding needs in Venezuela. These funding needs are significant and are affected by the recent fall in oil prices, which is the main and almost sole source of their investment.foreign currency in the country. These factors are affecting Venezuela’s competitiveness and may result in a currency
In relation to the political environment, the Group’s investments and operations and investments are located in Latin America and we are therefore exposedcould be affected by a series of risks related to risks inherent in operating and investing in Latin America.
“Country risk” factors include the following:
| · | government regulation or administrative |
| · | abrupt exchange-rate fluctuations may occur mainly due to high levels of inflation and both fiscal and external deficits with the resulting exchange-rate overvaluation. This movement could lead to strong exchange-rate depreciation in the context of a floating exchange rate regime, a significant devaluation off the back of abandoning fixed exchange rates regimes or the introduction of varying degrees of restrictions on capital movement. For example, in Venezuela, the official U.S. dollar to bolívar fuerte exchange rate is established by the Central Bank of Venezuela and the Minister of Finance, with an alternative market for attracting foreign currency through the Complementary System for Administration of Foreign Currency (Sistema Complementario de Administración de Divisas or “SICAD”) regular and selective auctions. In February 2015, a new Exchange Rate Agreement was established, including the regulations for the Foreign Exchange Marginal System (SIMADI), and the Central Bank of Venezuela published on February 18, 2015 a weighted average exchange rate equal to 172.1 bolívares to the U.S. dollar for the markets referred to in chapters II and IV of such Exchange Rate Agreement. Additionally, the acquisition or use of foreign currencies by Venezuelan or Argentinean companies (in some cases) to pay foreign debt or dividends is subject to the pre-authorization of the relevant authorities. Also, the Argentinean peso, despite its recent stability, continues to be under the threat of a sustained accelerated depreciation |
| · | governments may expropriate or nationalize assets, make adverse tax decisions or increase their participation in the economy and in companies; |
| · | economic-financial downturns, political instability and civil disturbances may negatively affect the Telefónica Group’s operations in such countries; and |
| · |
The Group's financial condition and results of operations may be adversely affected if we doit does not effectively manage ourits exposure to foreign currency exchange rate,rates, interest raterates or financial investment risks.
To illustrate the sensitivity of market riskfinancial expenses to a change in the normal course of our business, including, above all, the impact of changesshort-term interest rates at December 31, 2014: (i) a 100 basis points increase in interest rates in all currencies in which Telefónica has a financial position at that date would lead
to an increase in financial expenses of 111 million euros, (ii) whereas a 100 basis points decrease in interest rates in all currencies except the euro, the U.S. dollar and the pound sterling (these to zero rates in order to avoid negative rates), would lead to a reduction in financial expenses of 68 million euros. These calculations were made using the same balance position in each currency and same balance position equivalent at such date and bearing in mind the derivative financial instruments arranged.
According to the Group's calculations, the impact on results and specifically changes in the value of a 10% depreciation of Latin American currencies against the U.S. dollar and a 10% depreciation of the rest of the currencies against the euro would result in exchange rates. We uselosses of 76 million euros, primarily due to the weakening of the Venezuelan bolivar and the Argentinean peso. These calculations were made using the same balance position in each currency with an impact on profit or loss at such date, including derivative instruments in place. For the year ended December 31, 2014, 22.8% of the Telefónica Group's operating income before depreciation and amortization (OIBDA) was concentrated in Telefónica Brazil, 26.2% in Telefónica Hispanoamérica and 11.2% in the Telefónica United Kingdom.
The Telefónica Group uses a variety of strategies to manage this risk,these risks, mainly through the use of financial derivatives, which themselves are suceptiblealso expose us to risks,risk, including counterparty risk. OurFurthermore, the Group’s risk management strategies may not achieve theirthe desired effect, which could adversely affect ourthe Group’s business, financial condition, and results of operations.operations and cash flows.
Existing or worsening conditions in the international financial markets may limit ourthe Group's ability to finance, and consequently, the ability to carry out ourits business plan.
The operation,performance, expansion and upgradingimprovement of ourthe Telefónica Group's networks, the development and distribution of ourthe Telefónica Group's services as well asand products, the development and implementation of the Company's strategic plan, the development and implementation of new technologies or license awardthe renewal processes,of licenses as well as expansion of our business in countries where we operate may require a substantial amount of financing.
In 2013 the Telefónica Group issued bonds mainly (i) in euro totaling 3,250 million euros with an average coupon of 3.690%; (ii) in dollars totaling 2,000 million U.S. dollars with an average coupon of 3.709%; and (iii) in Swiss Francs totaling 225 million Swiss francs with an annual coupon of 2.595%. The Telefónica Group also issued undated deeply subordinated securities in euros totaling 1,750 million euros with an average coupon of 6.902%; and in sterling pounds totaling 600 million sterling pounds with a coupon of 6.750%. In 2014 the Telefónica Group issued bonds mainly in the European market with a maturity of eight years totaling 1,250 million euros with an annual coupon of 2.242%, and bonds with a fifteen-year maturity totaling 800 million euros with an annual coupon of 2.932%. In addition, if our credit ratings were downgraded, our capacity to raise capitalthe Telefónica Group issued undated deeply subordinated securities in 2014 totaling 2,600 million euros with an average coupon of 5.075%.
Despite having its gross debt maturities profile covered for more than two years, obtaining financing on the international capital markets could also be impaired,restricted, in terms of access and cost. Although following recent downgradescost, if Telefónica's credit ratings are revised downwards, either due to lower solvency or operating performance, or as a result of a downgrade in our long-term debt wethe rating for Spanish sovereign risk by rating agencies. Any of these situations could have successfully tappeda negative impact on the capital markets in several instances, we can give no assurance regarding ourGroup's ability to raise capital in the international capital markets on a timely basis or at all, or at interest rates acceptable to us.meet its debt maturities.
Moreover, market conditions maycould make it more difficultharder to renew our unused bilateralexisting undrawn credit facilities, 24%lines, 8% of which, as ofat December 31, 2011 are2014, were scheduled to mature prior to December 31, 2012. Finally,2015.
In addition, the currentimpact of the sovereign debt crisis and the rating downgrades in certain Eurozone countries should be taken into account. Any deterioration in the sovereign debt markets, doubts about developments in European projects (such as implementation of the banking union project, the results of the elections in Europe, including Spain among others, or progress towards fiscal integration), as well as further credit restrictions by the banking sector could have an adverse effect on the Telefónica Group's ability to access funding and/or liquidity, which could have a significant adverse effect on the Group's businesses, financial situation may also make it more difficultposition, results of operations and costly for us to raise additional equity capital.cash flows.
Risks Relating to Ourthe Group’s Industry
In this regards, the relevant markets. While we pursueTelefónica Group pursues its license renewals toin the extent provided byterms referred in their respective contractual terms, weconditions, though it cannot guarantee that weit will always complete this process successfully or onunder the most beneficial terms for us.the Group. In many cases we must satisfycomplying with certain obligations is required, including, among others, minimum specified quality, standards, service and coverage conditionsstandards and capital investment thresholds in order to qualify for renewal.investment. Failure to comply with these obligations could result in the imposition of fines, revision of the contractual terms, or even the revocation or forfeiture of the license, authorization or concession.
Regulation of spectrum and government concessions
In Europe, the amendments by the EU Parliament to the Commission’s proposal on the “Digital Single Market” (the “DSM”) package of measures are currently being discussed by the European Council. The “DSM” measures include important measures affecting, inter alia, spectrum regulation. Although these measures are not yet final, they could have significant implications as they include new provisions on secondary markets, criteria to apply at auctions, renewals and terms of licenses, etc.
In addition, the main allocation criteria for the 700 MHz band of “Digital Dividend II” (the second spectrum allocation process from television operators to electronic communications services) will be defined in the coming years. This could require new cash outflows ahead of the Group’s previously anticipated schedule (it is expected that the spectrum will be available between 2018 and 2021).
Nevertheless, Germany will be the first country in Europe to award spectrum in the 700 MHz band. On January 29, 2015, the German regulator (“BNetzA”) published respective final decisions on the spectrum allocation proceedings and on the auction conditions of the 700 MHz and 1500 MHz bands. The auction will also include the spectrum corresponding to GSM licenses – the entire 900 MHz band and most of the 1800 MHz band (which will expire at the end of 2016) –. Interested bidders may submit applications by March 6, 2015. The auction (Simultaneous Multi-Round Auction) will take place in the second quarter of 2015.
On July 4, 2014, BNetzA adopted a decision concerning the frequency aspects of the Telefónica Deutschland Holding AG merger with E-Plus Mobilfunk GmbH & Co KG (“E-Plus”). BNetzA has instructed Telefónica Deutschland (the surviving entity after the merger takes place) to anticipate the termination of its rights of use in the 900 / 1800 MHz bands by December 31, 2015, (instead of December 31, 2016), if Telefónica Deutschland does not reacquire these frequencies at the above-mentioned auction proceeding. Both Telefónica Deutschland and E-Plus have legally challenged this BNetzA decisionon August 4, 2014. The German regulator also announced that, once the auction of spectrum mentioned above is over, it will perform a frequency distribution analysis, and determine whether any additional action is needed, particularly in the area of the 2GHz spectrum band granted to Telefonica Deutschland.
In addition, and within the framework of the conditions imposed by the European Commission in connection with the merger, the surviving entity of the merger is obliged to offer up to 2x10 MHz in the 2600 MHz as well as up to 2x10 MHz in the 2100 MHz spectrum band to one potential new mobile network operator. This offer is open to any potential new mobile network operator that had declared a respective interest by December 31, 2014 and to the operator with whom Telefónica Deutschland has signed the network access agreement (Drillisch Group).
On December 26, 2014, the Spanish Government adopted a law in which it delayed, to a maximum period ended on April 1, 2015, the effective delivery of the frequencies in the 800 MHz spectrum which are part of the "Digital Dividend" (the spectrum allocation process from television operators to electronic communications services), and which were expected to be delivered on January 1, 2015 to the already awarded mobile operators. The license term has been extended accordingly to April 24, 2031.
In the United Kingdom a significant increase in the annual license fees charged for the use of the spectrum in 900 MHz and 1800 MHz bands has been proposed by the regulator (the Office of Communications (“Ofcom”)). The outcome of it remains uncertain. Separately, the United Kingdom Government announced recently an agreement with the United Kingdom mobile operators, including Telefonica United Kingdom, under which the mobile operators would accept a 90% geographic coverage obligation for voice and text services. Given the agreement, Ofcom has agreed to consider the impact of the geographic coverage obligation on its valuation of annual fees for 900 MHz and 1800 MHz spectrum. This is expected to delay Ofcom’s decision.In addition, on November 7, 2014, Ofcom released a public consultation on the award of 2.3 GHz and 3.4 GHz bands that is expected to take place in late 2015 or early 2016.
In Latin America, spectrum auctions are expected to take place implying potential cash outflows to obtain additional spectrum or to meet the coverage requirements associated with these licenses. Specifically, the procedures expected to take place in 2015 are:
| · | Peru:The government announced plans to auction the 700 MHz spectrum band in the first half of 2015 (three blocks of 2x15 MHz have been defined). |
| · | Costa Rica: Costa Rica’s government has communicated its intention to auction spectrum in the 1800 MHz and AWS bands during 2015. |
| · | Mexico: The Federal Institute of Telecommunications (Instituto Federal de Telecomunicaciones) (“IFT”) published its Annual Program for Frequency Use and Development 2015. The program specifies IFT’s intention to award Advanced Wireless Services “AWS” concessions during the course of 2015. |
Further to the above, certain administrations may not have announced their intention to release new spectrum and may do so during the year. The above does not include processes announced via general statements by administrations, which involve bands not key to Telefónica’s needs. Telefónica may also seek to acquire spectrum on the secondary market should opportunities arise.
In Argentina, on December 1, 2014, the Secretary of Communication through Resolution 85/2014 officially awarded Telefónica Argentina the block 1710-1720/2110-2120 for a period of 15 years, and the 700 MHz block (703-713/758-768 MHz) is expected to be officially transferred to Telefónica Argentina during 2015.
In the state of São Paulo, Telefónica Brasil provides local and national long-distance Commuted Fixed Telephony Service (CFTS) under the public regime, through a concession agreement, which will be in force until 2025. In this regard, in June 27, 2014, as established in the concession agreement, the National Telecommunications Agency (Agência Nacional de Telecomunicações) (“ANATEL”) issued a public consultation for the revision of the concession agreement. Such public
consultation revising the concession agreement ended on December 26, 2014 and allowed contributions on certain topics such as service universalization, rates and fees and quality of services, among others. Definitive conditions will be published in 2015.
Additionally, in Colombia the Information and Communication Technologies (“ITC”) Ministry issued a Resolution on March 27, 2014 to renew 850 MHz/1900 MHz licenses for 10 additional years. The reversion of assets and the liquidation of the concession contract will be discussed until May 2015, taking into consideration the terms of the contract, and the Constitutional Court’s review of Law 422 of 1998, which established the reversion of only the radio-electric frequencies.
In Peru, an application for partial renewal of the concessions for the provision of the fixed-line service for another five years has been issued, although assurance has been given by the “Ministry of Transport and Communications” (Ministerio de Transportes y Comunicaciones) in previous renewals, that the concession will remain in force until November 2027. Also, a new law has been enacted establishing mobile virtual network operator (MVNOs) and Rural Mobile Infrastructure Operators (RMIOs) in the Peruvian market.
In Mexico, in light of the constitutional reform resulting from the “Pact for Mexico” political initiative, it is expected that a publicly-owned wholesale network, which will offer wholesale services in the 700 MHz band, will be created. As of today, the funding and the marketing model of this project have not yet been determined.
Telefónica Móviles Chile, S.A. was awarded spectrum on the 700 MHz (2x10 MHz) band in March 2014. A third party provider opposed this allocation of spectrum on the basis that it would exceed the limit spectrum of 60 MHz established by a judgment of the Supreme Court of January 27, 2009. This cap was established for the AWS auction held in 2009, but not for subsequent auctions (2600 MHz and 700 MHz). In a judgment on December 31, 2014, the court of appeals rejected the third party claim. Consequently, the regulator is in a position to adopt a Decree awarding the concession to Telefónica.
The consolidated investment in spectrum acquisitions and renewals in 2014 amounted to 1,294.2 million euros.
The Company’s failure to obtain sufficient or appropriate spectrum capacity in the jurisdictions discussed above or any others in which it operates or its inability to assume the related costs, could have an adverse impact on its ability to launch and provide new services and on the Company’s ability to maintain the quality of existing services, which may adversely affect the Group’s business, financial condition, results of operations and cash flows.
Regulation of wholesale and retail charges
In terms of roaming, the regulated “Eurotariffs” were reduced on July 1, 2014 (in the wholesale market, the price of data was reduced by 67%, the price of call by 50%; and in the retail market, the price of data was reduced by 55%, the price of outgoing voice call by 21%, the price of incoming voice call by 28% and the price of outgoing texts by 25%), as per the regulation approved in 2012. The structural roaming solutions which could lead to a price decrease in the intra-European Union roaming services also took effect in July 2014. Furthermore, the package of DSM measures mentioned above, which is under discussion, also includes a proposal to eliminate European Union roaming charges as of a yet to be determined date. However, the European Parliament proposed the “end of roaming” by December 15, 2015 in a proposal known as “Roaming Like at Home”.
The decreases in wholesale mobile network termination rates (“MTR”) in Europe are also noteworthy. In the United Kingdom, wholesale MTRs have been reduced to 0.845 ppm (pence/minute) from April 1, 2014 (representing a 0.3% reduction compared to the previous rates). In a consultation document published in June 2014, Ofcom has proposed a further reduction to 0.545 ppm, from April 1, 2015.
In Germany, on September 3, 2014, the BNetzA adopted a proposal to reduce MTRs. The new prices will gradually decrease to 0.0172 euro/minute from December 1, 2014, and in a second stage, from 0.0172 euro/minute to 0.0166 euro/minute from December 1, 2015 until the end of November 2016. The European Commission has requested that the German regulator withdraw or amend its latest decision on mobile termination rates, in force as at the date of this Annual Report. There is a risk that the European Commission will initiate infringement proceedings against Germany, and rates may be further reduced.
In Spain, the National Regulatory & Competition Authority (Comisión Nacional de los Mercados y la Competencia) has adopted a final decision on the third round analysis of the wholesale market for fixed call termination. From November 1,
2014, a symmetric fixed termination rate (“FTR”) of 0.0817 euro cents/minute applies, based on pure bottom-up long run incremental costs (“BU-LRIC”) meaning that billing must be entirely conducted on a “per second” basis, without a peak/off-peak differentiation. The decision therefore eliminates the asymmetry in FTRs that existed since 2006 when alternative network operators were allowed to charge up to 30% above Telefónica’s per minute local FTR. It also brings forth an important reduction in average termination prices for Telefónica (by 80%) in comparison to the former applicable tariffs.
In Latin America, there are also moves to review MTRs leading to these being reduced. Thus, for example, developments in Mexico are among the most relevant, where the IFT has declared the América Móvil Group a preponderant operator in the telecommunications market. As a result, on March 26, 2014, it introduced, among others, special regulations on asymmetric interconnection rates. In that sense, the Federal Telecommunications and Broadcasting law, effective as of August 13, 2014, imposed several obligations on the preponderant operator, which are quite extensive and, in principle, potentially significantly beneficial to Telefónica’s competitive position, particularly with regards to the measures imposed on preponderant operators (to the extent they nominally retain such qualification). With regards to MTR, Telefónica México filed an administrative appeal against the 2011 resolutions of the Federal Telecommunications Commission of México (Cofetel) regarding mobile network termination rates (representing a 61% reduction compared to the previous rates). As of the date of this Annual Report, no ruling has been made on this appeal. Recently, IFT determined the mobile termination rates for 2012, and Telefónica México filed an injunction against this rate. Once these appeals have been concluded, the rates applied may be further reduced retroactively. As of the date of this Annual Report, IFT has not approved the termination rates for 2013, 2014 or 2015 for Telefónica México.
In Brazil, at the end of 2012, ANATEL launched the “Plano Geral de Metas de Competição” (“PGMC”) regarding fixed-mobile rate adjustment reductions until February 2016 and amending the previous reduction conditions (75% of the 2013 rate in 2014 and 50% of the 2013 rate in 2015). In order to complement reductions and approach the cost of the services according to a financial cost model, on July 7, 2014, ANATEL published reference values for MTR taking effect from 2016 to 2019. Such reductions are approximately 44% per year. Furthermore, there are several legislative initiatives that aim to abolish the basic fee of fixed-telephony service. “Price protection” practices (reimbursement of differences in prices of a product to customers if this falls within a relative short period of time) may also have a negative impact in Telefónica Brasil, in both economic and image terms.
In Chile, a tariff decree was issued to set fixed-line termination charges for the 2014-2019 periods. The new tariff entered into effect on May 8, 2014 and applies a reduction of 37% in prices against those charged for the period prior to such tariff. A tariff decree has been issued for mobile networks covering the 2014-2019 five-year period. Such tariff decree entered into effect on January 25, 2014 and implies a reduction of 74.7% with respect to the previous rates. After a review by the general comptroller (Contraloría General) an additional 1.7% reduction was approved on May 27, 2014.
In Ecuador the rate-related risks relate to a reduction in rural and urban telephony charges, a reimbursement of top-up balances, as well as rounding to the nearest minute.
The implementation of the Enabling Act (Ley Habilitante) in Venezuela also confers full powers to the President to implement price control measures. Under this Act, in January 2014, an organic fair price law was issued, which caps the revenue of related enterprises at 30% of their operating costs. In relation to MTRs with the national operator of reference (Compañía Anónima Nacional Teléfonos de Venezuela) (“CANTV”), these have been reduced by 6% compared to the previous rates. In November 2014, near the end of the term allowing the enactment of laws autonomously granted to the President of the Republic, new important decree-laws were enacted, in particular, the Reform of the Law on Foreign Investment, in which, among other things, new requirements for the return of foreign investment were established; the Reform of the Antitrust Law, which was predominantly aimed at enhancing monopoly control regulation and increasing penalties for infringement; and the Reform of the Exchange Crimes Law, which increased economic sanctions.
In Colombia, on us,December 30, 2014, the Colombian regulator (“CRC”) enacted Resolution 4660 establishing a gradual reduction for MTRs. The glide path initiates in 2015 in 32.88 Colombian pesos per minute representing a decrease of 41.7% and then descends approximately 42.2% in 2016 and 42.2% in 2017 (each such reduction being as compared to the previous year). This regulatory measure also imposes asymmetric MTRs to the dominant provider (the América Móvil Group), imposing the final rate established in the glide path from 2015 to 2017. The CRC also regulated the charges for national roaming and the SMS termination rates, setting a reduction of 41.5% in 2015, 39.6% in 2016 and 43.3% in 2017 (each such reduction being as compared to the previous year).
Regulation of universal services
Further to its formal obligation to review the scope of the Universal Service Directive (the set of basic electronic communication services whose provision is guaranteed to any user requesting it, regardless of its location, with a specified quality at an affordable price), the European Commission is expected to undertake a public consultation in the months following the date of this Annual Report, which if significant,may include both the potential inclusion of broadband in its scope and a possible reduction of some of the current universal service obligations. Depending on the terms that will be set forth in the new regulation, implementation at a local level could lead to higher costs for both the universal service provider and the operators forced to finance the universal service.
The last Plano Geral de Metas de Universalização (“PGMU”) was published in Brazil on June 30, 2011 and applies to the 2011-2015 period. This sets goals for public phones, low cost fixed-lines and coverage density in rural and poor areas with 2.5GHz/450 MHz. Also according to such PGMU, the assets assigned to the provision of the services described in the public concession agreement are considered reversible assets. In 2014, ANATEL issued a public consultation with its proposals for the 2015-2020 period universalization targets. The agency’s proposal focuses on reducing the distance between public telephones and backhaul’s expansion.
Regulation of fiber networks
In December 2014, the Spanish National Regulatory & Competition Authority (Comisión Nacional de los Mercados y la Competencia) has conducted a public consultation on the regulatory obligations for broadband market regulation in Spain. As a result of this consultation,the new regulation that will apply to NGN (Next Generation Networks) could be approved in the fourth quarter of 2015 and will last for at least three years. This could increase Telefónica's regulatory obligations in Spain and the ability of other operators to compete in such market.
In Colombia, the regulatory authority CRC published a regulatory project for transmission capacity between municipalities through fiber networks or connectivity to impose open network and elements access through a mandatory offer for those enterprises that have overcapacity and have some unused installed network elements. This project will be discussed in the first half of 2015.
Regulations on privacy
In Europe, a new Data Protection Regulation is undergoing the European legislative process which, as the date of this Annual Report, is not expected to end before mid-2015. This could lead to certain critical provisions laid down in the current draft of the regulation (presently under debate) being worded in such a way that stops or hinders Telefónica from launching some services, that focus on the processing of personal data.
In Brazil, triggered by the approval of Civil Rights Framework for Internet Governance, which provides certain generic rules about data protection, the Ministry of Justice could in the near future, adopt the final version of the Draft Personal Data Protection Act. This could lead to a greater number of obligations for operators in relation to the collection of personal data of telecom services users and further restrictions on the treatment of such data.
Regulation of functional separation
The principles established in Europe’s common regulatory framework, adopted in 2009 and transposed in the national legislation of each Member State in which Telefónica operates could result in lossgreater regulatory pressure on the local competitive environment. Specifically, this framework supports the possibility of national regulators (in specific cases and under exceptional conditions) forcing operators with significant market sharepower and harmvertically-integrated operators to ourseparate their wholesale and retail businesses at a functional level. They would therefore be required to offer equal wholesale terms to third-party operators that acquire these products.
Regulation of network neutrality
In Europe, national regulators are seeking to strengthen their supervision of operators with regard to the blocking of access, discrimination of applications or Internet service quality. The European Parliament and the Council are simultaneously debating the draft of the European DSM Regulation proposed by the European Commission that, among other things, deals with the principle of network neutrality. The regulation of network neutrality could directly affect
possible future business models of Telefónica and may affect the network management or differentiation of characteristics and quality of Internet access service.
Telefónica is present in countries where net neutrality has already been ruled, such as Chile, Colombia, Peru and more recently Brazil, but this remains a live issue and with varying degrees of development in other countries where it operates. In Germany, the Economy Minister withdrew a draft law that it published on June 20, 2013, to regulate net neutrality, especially with regard to the blocking and discrimination of content and Internet services. It plans to submit a new draft after the EU has settled on a position on net neutrality within the DSM approach, which might occur in early 2015. In addition, one German region (Bundesland of Thuringia) has passed a new law (which applies only in such region) with the aim that broadcasting and tele-media may not be blocked, limited or treated differently from other data traffic.
If changes to regulation such as those described above, or otherwise, occur in the various jurisdictions where the Telefónica Group operates, it could have a material adverse effect on its business, financial performancecondition, results of operations and future growth.cash flows.
For further information regarding the matters discussed above and other aspectsa detailed description of these regulations see Appendix VII of the regulatory environmentsConsolidated Financial Statements “Key Regulatory Issues and Concessions and Licenses Held by the Telefónica Group”.
The Telefónica Group is exposed to risks in relation to compliance with anti-corruption laws and regulations and economic sanctions programs.
The Telefónica Group is required to comply with the laws and regulations of various jurisdictions where it conducts operations. In particular, the Group’s international operations are subject to the U.S. Foreign Corrupt Practices Act of 1977 (“FCPA”) and the United Kingdom Bribery Act of 2010 (the “Bribery Act”), and economic sanction programs, including those administered by the United Nations, the European Union and the United States, including the U.S. Treasury Department’s Office of Foreign Assets Control (“OFAC”). The FCPA prohibits providing anything of value to foreign officials for the purposes of obtaining or retaining business or securing any improper business advantage. As part of the Telefónica Group’s business, it may deal with entities, the employees of which our businesses operate, see “Item 4. Informationare considered foreign officials for purposes of the FCPA. In addition, economic sanctions programs restrict the Group’s business dealings with certain sanctioned countries, individuals and entities.
Although the Group has internal policies and procedures designed to ensure compliance with applicable anti-corruption laws and sanctions regulations, there can be no assurance that such policies and procedures will be sufficient or that the Group’s employees, directors, officers, partners, agents and service providers will not take actions in violation of the Group’s policies and procedures (or otherwise in violation of the relevant anti-corruption laws and sanctions regulations) for which the Group or they may be ultimately held responsible. Violations of anti-corruption laws and sanctions regulations could have a material adverse effect on the Company—Business Overview—Regulation.”Group’s business, reputation, results of operations and financial condition.
Customers' perceptions of the assistance and services offered are critical to operating in highlyhighly-competitive markets. The ability to predict and respond to the changing needs and demands of customers affects the Company's competitive marketsposition relative to other technology sector companies, and its ability to extract the industry in which we operate is subjectvalue generated during this process of transformation. Failure to do so adequately could have an adverse impact on the Group's business, financial condition, results of operations and cash flows.
Company may not be able to adequately foresee and respond to technological changes and sector trends.
In a sector characterized by rapid technological change, it is essential to be able to offer the products and services demanded by the market and consider the impacts of changes which requires usin the life cycle of technical assets, secure margins and select the right investments to continuously adapt to such changes and to upgrade our existing networks.make.
Failure to do so effectivelyadequately could have an adverse impact on ourthe Group's business, financial condition, results of operations and financial condition. See “Item 4. Information on the Company—Business Overview—Competition.”cash flows.
New products and technologies arise constantly, while theand their development of existing products and technologies can render obsolete the products and services we offerthe Telefónica Group offers and the technologies we use.technology it uses. This can force us to investmentmeans that Telefónica must invest in the development of new products, technology and services so that weit can continue to compete effectively with current or future competitors. Such investments can reducecompetitors, and which may result in the decrease of the Group's profits and revenue margins we obtain.margins. In this respect, margins from traditional voice and data business are shrinking, while new sources of revenues are arisingderiving from mobile Internet.Internet and connectivity services that are being launched. Research and development costs amounted to 1,111 million euros and 1,046 million euros in 2014 and 2013, respectively; representing an increase of 6.2% from 1,046 million euros in 2013. These expenses represented 2.2% and 1.8% of the Group's consolidated revenue, respectively. These figures have been calculated using the guidelines established in the Organization for Economic Cooperation and Development (OECD) manual. One technology that telecommunications operators, including usTelefónica (in Spain and Latin America), are focused on is the new FTTx-type network, which offers broadband access using optical fiber with superior services, such as highInternet speed Internet andof up to 100MB or HD television services. However, significantsubstantial investment is required to deploy these networks, which entails fully or partially substituting the copper wireloop access with fiber optic cables. Currently, minimalfiber. While an increasing demand for the capabilities offered by these new networks to end users could make it difficult to quantifyexists, the high level of the investments requires a continuous analysis of the return on investmentinvestment.
The explosion of the digital market and justifyentry of new players in communications market, such as MVNOs, Internet companies or device manufacturers, may cause the high investment. In addition, manyloss of these networks upgrade tasksvalue of certain assets, and affect the Group’s ability to offer new products or services are not entirely under our controlgenerate income. Therefore, it is necessary to update the business model, encouraging the pursuit of incomes and may be affected by applicable regulations.
The existence of telecommunications services and products, we like other companiescritical suppliers in the industry we depend uponsupply chain, especially in areas such as network infrastructure, information systems or handsets, with a high concentration in a small number of major suppliers, for essential productsposes risks that may affect the Company’s operations, and services, mainlymay cause legal contingencies or damages to the Company's image in the event that inappropriate practices are produced by a participant in the supply chain.
As of December 31, 2014, the Telefónica Group depended on six handset suppliers and 11 network infrastructure and mobile handsets.suppliers, which together accounted for 80% of the awarded contracts for the year then ended. These suppliers may, among other things, extend delivery times, raise prices and limit supply due to their own shortagesstock shortfalls and business requirements.
If these suppliers fail to deliver products and services to the Telefónica Group on a timely basis, it could jeopardize our network deployment and expansion plans, which in some cases could adversely affect ourthe Telefónica Group's ability to satisfy ourits license terms and requirements, andor otherwise have a material,an adverse effectimpact on our businesses,the Group's business, financial condition, results of operations and financial condition.cash flows.
Unanticipated network interruptions as a result of system failures, whether accidental or otherwise, including those due to network, hardware or software, failures,stealing of infrastructure elements or cyber-attacks, which affect the quality of or cause an interruption in ourthe Telefónica Group's service, could result inlead to customer dissatisfaction, reduced revenues and traffic, and costly repairs, penalties or other measures
imposed by regulatory authorities and could harm ourthe Telefónica Group's image and reputation. We attempt
Telefónica attempts to mitigate these risks through a number of measures, including backup systems and protective systems such as firewalls, virus scanners and buildingother physical and logical security. However, these measures are not effective under all circumstancesalways effective. Although the Telefónica Group has insurance policies to cover these types of incidents, and cannot avert every action or event that could damage or disrupt our technical infrastructure. Although we carry business interruption insurance, our insurance policythe claims and loss in revenue caused by service interruptions to date have been covered by these policies, these policies may not provide coverage in amountsbe sufficient to compensate us for any losses we may incur.cover all possible monetary losses.
The mobiletelecommunications industry may be harmedaffected by concerns stemming from actual or perceived health risks associated with radio frequency emissions.the possible effects of electromagnetic fields, emitted by mobile devices and base stations, may have on human health.
The adoption of new measures by governments or anyadministrations or other regulatory interventions in this respect, and any future assessment on the adverse impact of which could materially and adverselyelectromagnetic fields on health, may negatively affect ourthe business, financial conditions, results of operations and financial condition.cash flows of the Telefónica Group.
Although the recognition of impairments of tangible,property, plant and equipment, intangible assets and financial assets resultresults in a non-cash charge on the income statement, such charge wouldit could adversely affect ourthe results of the Telefónica Group’s operations. In this respect, the Telefónica Group has experienced impairments on certain of its investments, affecting its results of operations in the year in which they were experienced. For example, with respect to the investment in Telco, S.p.A. (“Telco”), value adjustments were made in fiscal years 2013 and 2014 with a negative impact of 267 million euros and 464 million euros, respectively.
The Telefónica Group's networks carry and store large volumes of confidential, personal and corporate data, and its Internet access and hosting services may lead to claims for illegal or illicit use of the Internet.
The Telefónica Group's networks carry and store large volumes of confidential, personal and business data, through both voice and data traffic. The Telefónica Group stores increasing quantities and types of customer data in both business and consumer segments. Despite its best efforts to prevent it, the Telefónica Group may be found liable for any loss, transfer, or inappropriate modification of the customer data or general public data stored on its servers or transmitted through its networks, any of which could involve many people and have an impact on the Group's reputation, or lead to legal claims and liabilities that are difficult to measure in advance.
In addition, the Telefónica Group’s Internet access and hosting servers could lead to claims for illegal or unlawful use of the Internet. Telefónica, like other telecommunications providers, may be held liable for any loss, transfer or inappropriate modification of the customer data stored on its servers or carried by its networks.
In most countries in which the Telefónica Group operates, the provision of its Internet access and hosting services (including the operation of websites with shelf-generated content) are regulated under a limited liability regime applicable to the content that it makes available to the public as a technical service provider, particularly content protected by copyright or similar laws. However, regulatory changes have been introduced imposing additional obligations on access providers (such as blocking access to a website) as part of the struggle against some illegal or illicit uses of the Internet, notably in Europe.
Any of the foregoing could have an adverse impact on the business, financial position, results of operations and consequently, our ability to achieve our growth targets. For example, we have faced several corrections regardingcash flows of the value of certain of our assets that have impacted our results of operations for the year in which the corrections were made. In 2011, an impairment loss was recognized on our stake in Telco, S.p.A., which, among other effects, resulted in a negative impact of €620 million, reducing the value of our stake in Telecom Italia, S.p.A. This value is evaluated at each reporting date for indications of impairment losses.Group.
Telefónica and antitrustTelefónica Group companies are party to lawsuits, tax claims and other legal proceedings in the ordinary course of our business,their businesses, the finalfinancial outcome of which is generally uncertain.unpredictable. An adverse outcome in, or any settlement of,in these or other proceedings that may be assertedcould result in the futuresignificant costs and may have a material adverse effect on ourthe Group's business, financial condition, results of operations, reputation and cash flow.flows. In particular, regarding tax and antitrust claims, the Telefónica Group has open judicial procedures in Peru concerning the clearance of previous years' income tax, for which a contentious-administrative appeal is currently pending, as well as in Brazil, with CADE’s (Conselho Administrativo de Defesa Ecônomica) resolution with regard to the acquisition of a 50% stake in Vivo and with certain open tax procedures, primarily relating to the CIMS (a Brazilian tax on telecommunication services). Further details on these matters are provided in Notes 21 and 17 of the Consolidated Financial Statements.
| Information on the Company |
Overview
Telefónica, S.A., is a corporation duly organized and existing under the laws of the Kingdom of Spain, incorporated on April 19, 1924. We are:
| · | a diversified telecommunications group which provides a comprehensive range of services through one of the world’s largest and most modern telecommunications networks; |
| · | focused on providing telecommunications services; and |
| · | present principally in Europe and Latin America. |
The following significant events occurred in 2011:2014:
| · | On |
The exchange rate of 6.3 bolívares per U.S. dollar was used in the translation of the financial information of Venezuelan subsidiaries for the entirety of 2013.
During 2014, by virtue of certain Exchange Agreements the allocations conducted through the Complementary System for Administration of Foreign Currency (SICAD I), to which Telefónica Venezuela had access for imports, were expanded and, in addition, a new exchange mechanism with a more widespread use was put in place, called SICAD II.
The exchange rates resulting in the last allocations of SICAD I and SICAD II before December 31, 2014 were 12.0 and 49.988 bolívares per U.S. dollar, respectively.
In the absence of SICAD I auctions since mid-October 2014, and the lack of expectations of new auctions close to 2014 year-end, in a macroeconomic context aggravated by the fall of the oil price, the Company has decided to take as a reference the rate resulting in the allocations conducted through SICAD II for translating the financial statements of the Venezuelan subsidiaries. The Company considers that it is the most representative among the available official exchange rates at 2014 year-end for the monetary translation of the accounting figures of transactions, cash flows and balances.
The main impacts of using this new exchange rate in the Telefónica Group’s consolidated financial statements as of December 31, 2014 were as follows:
| - | A decrease in |
| - | As part of the decrease mentioned in the preceding paragraph, the value in euros of the net financial assets denominated in bolívares decreased by approximately 2,700 million euros, as per the balance as of December 31, 2014. |
| - | The results from the Telefónica’s subsidiaries in Venezuela have been translated at the new exchange rate. This implied a reduction in operating income before depreciation and amortization (OIBDA) and profit of the year of, approximately, 1,730 and 660 million euros, respectively. |
| · | On January 28, 2014, after obtaining the relevant regulatory approval, the sale of Telefónica Czech Republic, a.s. ("Telefónica Czech Republic") was completed. As a result of the sale, Telefónica held a 4.9% stake in Telefónica Czech Republic, which it subsequently sold in October 2014 for 160 million euros. |
| · | On |
Within this framework, Telefónica created the role of the Chief Commercial Digital Officer, who is responsible for fostering revenue growth. On the cost side, the Company strengthened the role of the Chief Global Resources Officer. Both Officers report directly to the Chief Operating Officer (COO), as do the local business CEOs for Spain, Brazil, Germany and the United Kingdom, in addition to the Latin American Unit, which now excludes Brazil.
| · | On February 27, 2014, the Board of Directors of Telefónica agreed to determine the amount of the 2014 dividend at 0.75 euro per share, payable in two tranches: |
- 0.40 euro per share in cash in the second quarter of 2015.
-0.35 euro per share by means of a "scrip dividend" in the fourth quarter of 2014.
| · | On May 6, 2014, Telefónica submitted a |
| · | On May 7, 2014, Telefónica paid a dividend of 0.40 euro per share in cash (dividend distribution charged against 2014 net income) corresponding to the second tranche of the 2013 dividend which |
| · | On May 30, 2014, Telefónica's Annual General Shareholders' Meeting took place on second call with the attendance, present or represented, of 54.81% of the share capital. In this meeting, all the resolutions submitted by the Board of Directors for deliberation and approval were approved by majority of votes. |
| · | On June 2, 2014, Telefónica's subsidiary Telefónica de Contenidos, S.A.U. ("Telefónica Contenidos") executed a share purchase agreement with PRISA in connection with PRISA’s stake in DTS. The price agreed amounts to 750 million euros, subject to customary adjustments at closing. The closing of this purchase agreement is subject to obtaining the relevant authorization of the competition authorities and to the approval of a representative panel of the banks financing PRISA. |
| · | On July 2, 2014, Telefónica Deutschland received the EU Commission's conditional clearance to acquire the E-Plus Group from the Dutch telecommunication corporation Koninklijke KPN N.V. In connection with such |
conditional clearance, on June 25, 2014, Telefónica Deutschland signed an agreement with the Drillisch Group according to which the latter agreed to acquire, in addition to the agreed capacity to provide services to its existing customers through Telefónica Deutschland's or the E-Plus Group’s networks, 20% of the capacity of all mobile networks that belong to Telefónica Deutschland after the acquisition of the E-Plus Group. The 20% capacity will be reached gradually over a 5-year period. In addition, the Drillisch Group will have the right to acquire up to an additional 10% of capacity of the aforementioned mobile networks.
Telefónica Deutschland will grant the Drillisch Group, through a Mobile Bitstream Access model, access to the future joint network of Telefónica Deutschland and the E-Plus Group, as well as to the existing and future technology developments on that network, which the Drillisch Group will be able to offer to its customers. Final clearance for the acquisition was given on August 29, 2014. On October 1, 2014, Telefónica Deutschland completed the acquisition of E-Plus, following its execution of a capital increase intended to fund such acquisition. Telefónica maintains a stake of 62.1% in Telefónica Deutschland, which now includes 100% of the E-Plus Group, while the Dutch company Koninklijke KPN N.V. holds a 20.5% stake, and the rest is free float.
| · | On July 4, 2014, Telefónica de Contenidos acquired 22% of the share capital of DTS owned by Mediaset España Comunicación, S.A. ("Mediaset") for consideration of 295 million euros. |
A payment of 30 million euros has been agreed as consideration for the waiver of Mediaset's pre-emptive rights relating the stake held by PRISA in DTS. Pursuant to the agreement, Mediaset will receive (i) 10 million euros in the event that Telefónica de Contenidos closes the acquisition of the 56% stake of DTS held by PRISA and, in that case, (ii) up to 30 million euros depending on the evolution of the Pay-TV customers in Spain of the Telefónica Group during the four years following the closing of such acquisition.
| · | On July 7, 2014, Telefónica reached an agreement with Reti Televisive Italiane S.p.A. ("RTI") for the acquisition by Telefónica of an 11.11% stake of the capital of a newly created company, which will consolidate the Pay-TV business of the Mediaset Group in Italy, currently commercialized under the name of "Mediaset Premium". The purchase price is 100 million euros. |
| · | On July |
| · | On September |
The final closing of the operation is subject to obtaining the relevant regulatory authorizations (including telecommunication and anti-trust approval). On December 22, 2014, ANATEL approved the acquisition of GVT, although the resolution about the acquisition by Vivendi, S.A. of the 1,110 million of ordinary shares of Telecom Italia is still pending. As of the date of this Annual Report, CADE continues to analyze the process.
| · | On September 30, 2014, Telefónica |
With this acquisition, Telefónica Brasil, S.A. has reached its goal of ensuring the necessary spectrum for its medium- and long-term expansion of the 4G service in order to meet the growing demand for mobile access to high-speed Internet.
| · | On October 10, 2014, the |
| · | The free-of-charge allotment rights derived from the capital increase were allotted to Telefónica |
| · | On October 27, 2014, following a report of the Nominating, Compensation and Corporate Governance Committee, the Board of Directors of Telefónica approved, with regard to the first cycle (2014-2017) of the long-term incentive plan (which consists in the granting of shares of Telefónica to Telefónica Group executives (including executive directors of Telefónica) as approved by the Annual General Shareholders Meeting held on May 30, 2014, (which determined the maximum possible number of shares to be received by the executive directors of Telefónica at the end of the first cycle of the plan)), the amount of theoretical shares to be assigned to the other executives, and the maximum possible number of shares to be received by them, in the event of fulfilment of the relevant co-investment requirement, and of the achievement of the maximum total shareholder return (TSR) established in the plan. |
| · | On November 10, 2014, Telefónica, through its 100% subsidiary, Telefónica Internacional, S.A.U., sold 597,844,100 shares of China Unicom (Hong Kong) Limited ("China Unicom") as further described under "—Strategic Partnerships—China United Network Communications Group Co., Ltd. (China Unicom)", below. |
| · | On December 9, 2014, the Company announced that, on December 3, 2014, the free-of-charge allotment rights trading period for the free-of-charge capital increase related to Telefónica’s Flexible Dividend had ended. The holders of 15.8% of the free-of-charge allotment rights accepted the purchase commitment assumed by Telefónica, S.A. The gross amount paid by Telefónica, S.A. for these rights amounted to 241,542,822.19 euros. The company waived the rights thus acquired, which were amortized. |
The holders of 84.2% of the free-of-charge allotment rights were entitled, therefore, to receive new shares of Telefónica, S.A. Nevertheless, the Company waived the free-of-charge allotment rights that corresponded to its treasury shares at the record date (November 18, 2014). Therefore, the final number of ordinary shares with a nominal value of one (1) euro issued in the media and contact center segments throughcapital increase was 106,179,744 (2.3% of the Company’s share capital as of that date), totaling 106,179,744 euros. As a result, the share capital of Telefónica, de Contenidos and Atento, respectively.S.A. after the capital increase, as registered on December 9, 2014 with the Commercial Registry of Madrid, was 4,657,204,330 euros (4,657,204,330 shares).
Lima.
Business areas
On February 26, 2014, the Board of Directors of Telefónica, S.A. approved the implementation of a new organizational structure focused on clients and which incorporates the digital offering as the main focus of commercial policies. The structure gives greater visibility to local operators, bringing them closer to the corporate decision-making center, simplifying the Group’s global structure and strengthening the cross-cutting areas to improve flexibility and agility in decision making.
Due to the implementation of this new organizational structure, from the beginning of 2014, the new organizational structure has been composed of Telefónica Spain, Telefónica Brazil, Telefónica Germany, Telefónica United Kingdom and Telefónica Hispanoamérica (comprised of our consolidated subsidiaries in Argentina, Chile, Peru, Colombia, Mexico, Venezuela & Central America, Ecuador and Uruguay). All business that is not specifically included in these new segments is part of “Other companies and eliminations”. As a result, the Group’s segment results have been revised for the 2013 and 2012 fiscal years to reflect this new organization. Because this is an intragroup change, Telefónica’s consolidated results for 2013 and 2012 are not affected.
Additionally, as a result of management integrations undertaken in Peru, Argentina and Chile, the revenue breakdown has been reclassified, allocating “inter-company” eliminations within fixed and mobile businesses.
Segment reporting takes into account the impact of the purchase price allocation to assets acquired and the liabilities assumed from the companies included in each segment. The assets and liabilities presented in each segment are those managed by the heads of each segment, irrespective of their legal structure.
The Group manages borrowing activities and taxes centrally. Therefore, it does not disclose the related assets, liabilities, revenue and expenses by reportable segments. In addition, revenue and expenses arising from intra-group invoicing for the use of the trademark and management services have been eliminated from the operating results of each Group segment. These adjustments have no impact on the Group’s consolidated results.
The following chart shows the organizational structure of the principal subsidiaries of the Telefónica Group at December 31, 2011,2014, including their jurisdictions of incorporation and our ownership interest. For further detail, see Exhibit 8.1 to this Annual Report.
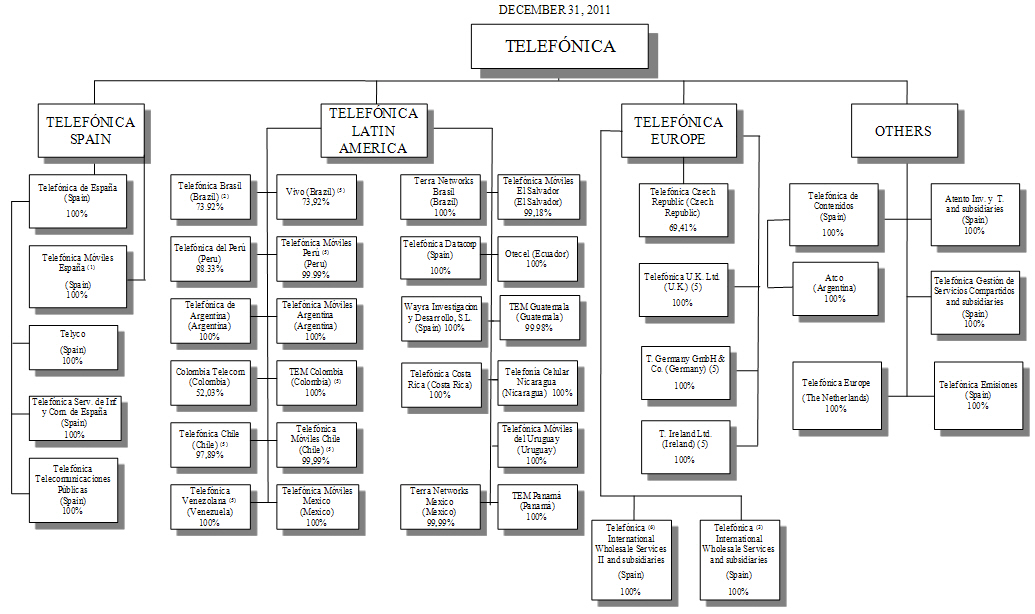
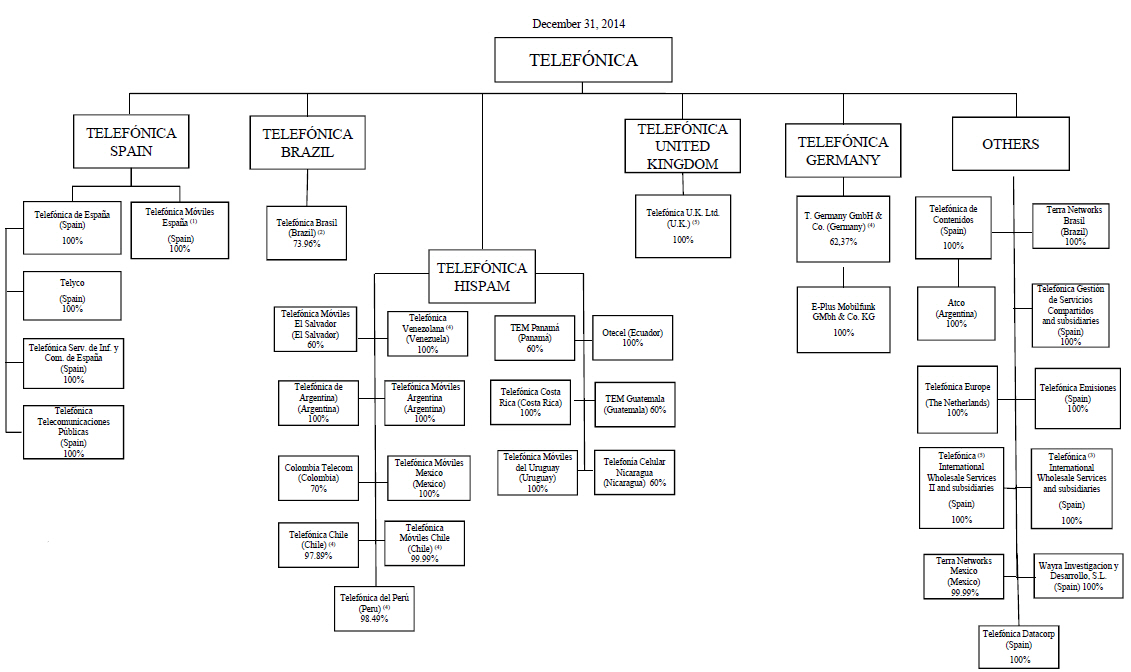
| (1) | Ownership in Telefónica Móviles España, S.A.U. is held directly by Telefónica, S.A. |
| (2) | Representing a 91.76% |
| (3) | Ownership in Telefónica International Wholesale Services, S.L. is held 92.51% by Telefónica, S.A. and 7.49% by Telefónica Datacorp, S.A.U. |
| (4) |
| Companies held indirectly. |
| Ownership in TIWS II is held directly by Telefónica, S.A. |
Telefónica, S.A., the parent company of the Telefónica Group, also operates as a holding company with the following objectives:
| · | coordinate the Group’s activities; |
| · | allocate resources efficiently among the Group; |
| · | provide managerial guidelines for the Group; |
| · | manage the Group’s portfolio of businesses; |
| · | foster cohesion within the Group; and |
| · | foster synergies among the Group’s subsidiaries. |
Our principal executive offices are located at Distrito Telefónica, Ronda de la Comunicación, s/n, 28050 Madrid, Spain, and our registered offices are located at Gran Vía, 28, 28013 Madrid, Spain. Our telephone number is +34 900 111 004.
Capital Expenditures and Divestitures
Our principal capital expenditures during the three years ended December 31, 20112014, consisted of additions to property, plant and equipment and additions to intangible assets, including spectrum. In 2011, 20102014, 2013 and 2009,2012, we made capital expenditures of €10,2249,448 million €10,844euros, 9,395 million euros and €7,2579,458 million euros, respectively.
Year ended December 31, 20112014
Capital expenditures in 2011 declined 5.7%2014 increased 0.6% compared with 2010.to 2013. Capital expenditures in 2011 include2014 included the cost of spectrum mainly in Brazil, Argentina, Venezuela, Colombia and Panama, amounting to 1,294 million euros.
Investment by Telefónica Spain in 2014 amounted to 1,732 million euros. Fiber optic was rolled out rapidly, and by year-end 2014 Telefónica Spain had created more than 10 million “fiber-to-the-house” (“FTTH”) facilities in Spain, Brazil, Costa Rica and Colombia, amounting to €1,296 million. In Spain there were significantincreasing its investments in LTE networks. Investment by Telefónica United Kingdom in 2014 amounted to 755 million euros, mainly due to greater LTE coverage – an estimated 58% of the fixed line business, including investmentsoutdoor population - and a network capacity ramped up to cope with denser 3G and 4G traffic. Investment at Telefónica Germany in broadband2014 amounted to continue849 million euros, focusing on its LTE roll-out strategy, securing 61% coverage in 2014. Investment at Telefónica Brazil in 2014 amounted to 2,933 million euros, mainly due to the localizedfact that the mobile segment featured a continuation of LTE roll-outs in 2014, improving network capacity, systems and applications. Investment in the fixed-line network was used to expand roll-out of fiber optics, TVoptic, larger volumes of IPTV customers and data services for large corporate customers, as well asprojects. Investment by Telefónica Hispanoamérica in 2014 amounted to 2,842 million euros mainly focused on LTE roll-outs in practically all operations in the maintenanceregion. Investment was also allocated to the densification of the traditional business. Investment in3G network, optimization of fixed-mobile convergence systems, the mobile business was principally directed toward improving third generation (3G) network capability. Investments in Latin America were focused mainly on the mobile business, mostly in the expansioncontinuation of coverage and on 3G and GSM network capacity. In theultra broad band (UBB) roll-out for fixed line business, network and plantbroadband by speed upgrades and investment in broadband accounted for the bulk of the investment. Investment in Europe continued to be focused on improving capacitynetwork digitalization, television and coverage of the mobile networks in the United Kingdom and Germany as well as the broadband business, primarily in the Czech Republic and Germany.digital initiatives.
Year ended December 31, 20102013
Investment by Telefónica Spain in 2010 compared with €7,2572013 amounted to 1,529 million in 2009, mainlyeuros, reflecting a high level of investment efficiency, as a result of the acquisitionimprovements in quality indexes, the reduction of complaints and enhanced efficiency in IT. At the end of the year, there was an acceleration in the rollout of fiber optic, and a boost of LTE deployment. Investment by Telefónica United Kingdom amounted to 1,385 million euros mainly due to spectrum investment (719 million euros). Investment by Telefónica Germany amounted to 666 million euros, focusing its efforts on network quality while accelerating investment in Germany (€1,379 million)LTE network deployment. Investment by Telefónica Brazil amounted to 2,127 million euros mainly due to the expansion and Mexico (€1,237 million)improvement of the mobile networks, both 3G and 4G, as well as the rollout of its fiber network. Investment by Telefónica Hispanoamérica in 2013 amounted to 3,118 million euros, mainly in the mobile
business and centered primarily on overlay projects and expansion of the coverage, quality and density of 3G networks, as well as the minimum roll-out of LTE (Colombia and Chile), the development of platforms to underpin new VASs, and the full consolidation in the fourth quarteroptimization of 2010 of Vivo. Excluding such spectrum acquisitions, capital expenditures growth would have been 13.4%. Our investments in Spain were directed toward further developinginfrastructure and systems developments focusing on self-management. In the fixed broadbandline business, with a selective roll-outfunds continued to be earmarked for rolling out UBB through speed upgrades in ADSL, fiber (FTTx) and VDSL in Argentina and Chile, as well as the installation of fiber optics, Imageniofixed-mobile convergence systems (Colombia, Chile and data services for large corporate customers and expanding mobile third generation, or 3G, offerings. In Latin America, capital expenditures were directed toward the transformation of the fixed telephony business and continuing to expand coverage and capacity of 3G and GSM networks in our mobile telephony business. In Europe, capital expenditures were directed toward improving the capacity and coverage of our mobile networks and greater investments in the ADSL business.Peru).
Year ended December 31, 20092012
Financial Investments and Divestitures
Our principal financial investment in 20112014 was the extensionacquisition of our strategic partnership agreement with China Unicom,E-Plus, which extension was executedcompleted on January 23, 2011. Telefónica acquiredOctober 1, 2014, through itsour subsidiary Telefónica Internacional, S.A.U.,Deutschland for a numbertotal purchase price of China Unicom shares for consideration totaling $5017,463 million euros. Our principal divestures in the aggregate (€358 million at each acquisition date) from third parties during the nine months following the execution of the extension. Following2014 were the completion of the transaction,sales of Telefónica holds,Czech Republic, a.s. on January 28, 2014, Telefónica Ireland, Ltd on July 2, 2014, and the sale of shares representing approximately 2.5% of the share capital of China Unicom for approximately 687 million euros.
There were no significant financial investments in 2013. Our principal divestures in 2013 were the sale of 40.00% of our investment, through Telefónica Internacional, S.A.U.Centroamérica de Inversiones, S.L., approximately 9.57%in Guatemala, Salvador, Nicaragua and Panama for 500 million U.S. dollars (equivalent to 377 million euros on the date of China Unicom’s votingexecution of the sale) with no impact in the results of the Group given our continued control over the company after the transaction; the agreement to sell 65.9% of our investment in Telefónica Czech Republic, a.s. for 306 Czech crown per share capital.(approximately 2,467 million euros at the date of the agreement), resulting in a capital loss of 176 million euros and the agreement to sell our stake in Telefónica Ireland, Ltd for 850 million euros.
Public Takeover Offers
Not applicable.applicable
Recent Developments
The principal events that have occurred since December 31, 20112014, are set forth below:
| · | On January 23, 2015 Telefónica and Hutchison Whampoa Group agreed to enter into exclusive negotiations for the potential acquisition by the latter of Telefonica UK limited (Telefónica’s business in the UK (“O2 UK”)) for an indicative price in cash (firm value) of 10.25 billion pounds (approximately 13.5 billion euros); composed of (i) an initial amount of 9.25 billion pounds (approximately 12.2 billion euros) which would be paid at closing and (ii) an additional deferred payment of 1.0 billion pounds (approximately 1.3 billion euros) to be paid once the cumulative cash flow of the combined company in the United Kingdom has reached an agreed threshold. |
The exclusivity period will last a specified period, allowing Telefónica de Contenidos, S.A.U., a Telefónica wholly-owned company, reached an agreement with Abertis Telecom, S.A.and Hutchison Whampoa Group to sell the 13.23% stake of Hispasat S.A. owned by Telefónica de Contenidos, S.A.U. in exchange for €124 million to be received in cash upon the closing of the transaction. The closing of the transaction is subject, among other conditions, to the approval of the Council of Ministers.negotiate definitive agreements, while Hutchison Whampoa Group completes its due diligence.
For information related to our significant financing transactions completed in 20112014 and through the date of this Annual Report, see “Item 5. Operating and Financial Review and Prospects – Prospects—Liquidity and Capital Resources – Resources—Anticipated Sources of Liquidity.”Liquidity”.
On February 26, 2014, the Board of Directors of Telefónica, S.A. approved the implementation of a new organizational structure forfocused on clients and which incorporates the Telefónica group. This newdigital offering as the main focus of commercial policies. The structure which we expectgives greater visibility to become fully operationallocal operators, bringing them closer to the corporate decision-making center, simplifying the Group’s global structure and strengthening cross-cutting areas to improve flexibility and agility in 2012, is organized as follows:decision making.

| · |
| · |
| o |
| o |
| o |
| o | Capture the opportunity in the business segment. |
| · |
| o |
| o |
| o |
| o | Reduce legacy cost, especially legacy network costs. |
In addition, Telefónica maintains an industrial alliance with China Unicom. Furthermore, in order to potentially unlock the value of Telefónica's scale, the "Partners" program was created in 2011, and now includes five operators (Bouygues, Etisalat, Sunrise, Megafon and O2 CZ). The Telefónica Partners Program is an initiative that makes available to selected operators and under commercial terms a host of services that allows partners to leverage on Telefónica’s scale and to cooperate on key business topics (digital services, roaming, services to multinationals, procurement, devices, etc.).
Moreover Telefónica’s portfolio was restructured in 2014 through the acquisition of E-Plus by Telefónica Deutschland to form the leading operator in Germany in terms of number of wireless customers. Telefónica is also in the process of acquiring GVT through Telefónica Brazil, subject to regulatory approval, and negotiating the sale of its business in the United Kingdom.
Other information
Non-controlling interests can be divided into two groups. Firstly, subsidiaries listed in a regulated market, such as Telefónica Brasil or Telefónica Deutschland, where minority shareholdings are widely dispersed and in respect of which Telefónica protects minority interests by complying with the regulations of the related market. Secondly, subsidiaries with a main minority shareholder, with whom agreements are entered into in order to guarantee the protection of such shareholder’s rights and, in certain cases (such as Colombia Telecomunicaciones) where there are also specific commitments resulting from corporate transactions (see Note 21.b of the Consolidated Financial Statements).
The Telefónica Group’s Spanish companies have adapted their internal processes and payment schedules to the provisions of Law 15/2010 (amended by Law 31/2014) and Royal Decree-Law 4/2013, amending Law 3/2004, which establishes measures against late payment in commercial transactions. Engagement conditions with commercial suppliers in 2014 included payment periods of up to 60 days, according to the terms agreed between the parties. For efficiency purposes, the Telefónica Group’s companies in Spain have agreed payment schedules with suppliers, whereby payments are made on set days of each month. Payments to Spanish suppliers in 2014 and 2013 surpassing the established legal limit were the result of circumstances or incidents beyond the payment policies, mainly the delay in issuing invoices (legal obligation of the supplier), the closing of agreements with suppliers over the delivery of goods or the rendering of services, or occasional processing issues. According to such criteria, the average payment period to suppliers of the Telefónica Group’s companies in Spain in 2014, according to our best estimates, amounted to 51 days.
The Company has a governance system, which applies to Telefónica’s entire structure. Pursuant to the Company’s commitment to its shareholders, the Board of Directors, supported by its Committees, manages the Company’s business in accordance with the corporate governance rules laid down primarily in the Corporate By-laws, in the Regulation of the General Shareholders' Meeting, and in the Regulation of the Board of Directors. See “Item 16G. Corporate Governance – Significant Differences in Corporate Governance Practices – Corporate governance guidelines.”
Telefónica’s Board of Directors consists of 18 directors and is responsible for overseeing and controlling the Company’s activity. It has sole powers regarding general strategy and policies on corporate governance, corporate social responsibility, remuneration of the Board and senior management, shareholder remuneration, and strategic investments.
In order to strengthen the corporate governance of the Company, the Board of Directors of Telefónica, S.A. has eight committees (including the Executive Commission) which are charged with examining and overseeing areas of particular relevance. Pursuant to its regulation, the Board also confers responsibility for day-to-day management of the businesses to Telefónica’s executive bodies (primarily through the Executive Committee) and management team.
Financial Results
2014 highlights
The Group's total accesses rose 5.5% during 2014 to 341 million at December 31, 2014, including the additional accesses it gained following the purchase of the E-Plus Group in Germany. Excluding the E-Plus Group accesses from 2014 results and accesses from Telefónica Czech Republic and Telefónica Ireland from 2013 results, the increase would have been 2.0%. There was high commercial activity focus on high value customers which resulted in the growth of the contract mobile segment (“smartphones” and LTE), fiber and Pay-TV. The volume of fiber accesses also grew, reaching 1.8 million at December 31, 2014. Notably, accesses in Telefónica Hispanoamérica (39% of the Group's total), increased by 2.5%, and accesses in Telefónica Brazil (28% of the Group's total) increased by 3.0% in 2014.
The evolution of foreign exchange rates impacted negatively our 2014 consolidated financial results, in particular the depreciation of the Argentine peso, Brazilian real and the implicit depreciation of the Venezuelan bolivar.
In its 2014 consolidated financial statements, Telefónica used the exchange rate of the Venezuelan bolívar set at the previously denominated SICAD II, (set at 49.988 Venezuelan bolívar fuerte per U.S. dollar in the last auction), for the purpose of translating the transactions, cash flows and balances related to the investments in Venezuela. The Company has decided to take such exchange rate as a reference, as it considers it to be the most representative among the available exchange rates as of such date, for the monetary translation of the accounting figures of cash flows and balances.
Accordingly, we estimate that the foreign exchange rate effect and the hyperinflations in Venezuela reduce our revenues and OIBDA in 2014 by 12.1 percentage points and 13.1 percentage points, respectively.
Revenues totaled 50,377 million euros in 2014, down 11.7% compared to 2013, mainly affected by exchange rate differences and the effect of hyperinflation in Venezuela, which reduced year-on-year growth by 12.1 percentage points. Additionally, this decrease was also affected by changes in the composition of the Group (-2.1 p.p.), in particular the sales of Telefónica Czech Republic and Telefónica Ireland and by the acquisition of the E-Plus Group. Excluding these impacts, revenues would have increased by 2.6% year-on-year mainly due to the performance of Telefónica Hispanoamérica, where revenues from mobile data and digital services increased. In order to make comparisons excluding the impact of changes to the scope of consolidation caused by the sales of Telefónica Czech Republic and Telefónica Ireland and the acquisition of the E-Plus Group in 2014, we have excluded the contribution of such entities to revenues in both 2013 and 2014.
The structure of revenues reflects the Company's business diversification. Despite the impact of exchange rates mentioned above, the segments that were the largest contributors to our revenues in 2014 were Telefónica Hispanoamérica, representing 26.1% (-3.4 p.p. compared to 2013), Telefónica Spain, representing 23.9% (+1.2 p.p. compared to 2013), Telefónica Brazil, representing 22.3% (+0.9 p.p. compared to 2013), Telefónica United Kingdom, representing 14.0% (+2.3 p.p. compared to 2013) and Telefónica Germany, representing 11.0% (+2.3 p.p. compared to 2013).
OIBDA reached 15,515 million euros for the year ended December 31, 2014, a fall of 18.7%, mainly due to:
| · | the effect of exchange rates and |
| · |
At December 31, | Percent Change | |||||||||||||||||||
2009 | 2010 | 2011 | 2009 vs. 2010 | 2010 vs. 2011 | ||||||||||||||||
| (in thousands) | ||||||||||||||||||||
Fixed telephony accesses(1) | 40,606.0 | 41,355.7 | 40,119.20 | 1.8 | % | (3.0 | )% | |||||||||||||
Internet and data accesses | 15,082.5 | 18,611.4 | 19,134.2 | 23.4 | % | 2.8 | % | |||||||||||||
Narrowband accesses | 1,427.5 | 1,314.1 | 909.2 | (7.9 | )% | (30.8 | )% | |||||||||||||
Broadband accesses(2) | 13,492.6 | 17,129.6 | 18,066.3 | 27.0 | % | 5.5 | % | |||||||||||||
Other accesses(3) | 162.4 | 167.8 | 158.7 | 3.3 | % | (5.4 | )% | |||||||||||||
Mobile accesses | 202,332.5 | 220,240.5 | 238,748.6 | 8.9 | % | 8.4 | % | |||||||||||||
Pre-pay accesses | 142,806.6 | 151,273.9 | 162,246.9 | 5.9 | % | 7.3 | % | |||||||||||||
Contract accesses | 59,525.9 | 68,966.6 | 76,501.7 | 15.9 | % | 10.9 | % | |||||||||||||
Pay TV accesses(4) | 2,489.2 | 2,787.4 | 3,309.9 | 12.0 | % | 18.7 | % | |||||||||||||
| Final clients accesses | 260,510.2 | 282,994.9 | 301,311.8 | 8.6 | % | 6.5 | % | |||||||||||||
| Unbundled local loop accesses | 2,206.0 | 2,529.2 | 2,928.7 | 14.7 | % | 15.8 | % | |||||||||||||
Shared UL accesses | 447.7 | 264.0 | 205.0 | (41.0 | )% | (22.3 | )% | |||||||||||||
Full UL accesses | 1,758.3 | 2,265.3 | 2,723.7 | 28.8 | % | 20.2 | % | |||||||||||||
| Wholesale ADSL accesses(5) | 463.4 | 687.4 | 849.3 | 48.3 | % | 23.6 | % | |||||||||||||
Other accesses(6) | 1,426.0 | 1,420.7 | 1,518.0 | (0.4 | )% | 6.8 | % | |||||||||||||
Wholesale accesses | 4,095.3 | 4,637.4 | 5,296.0 | 13.2 | % | 14.2 | % | |||||||||||||
Total accesses | 264,605.5 | 287,632.3 | 306,607.8 | 8.7 | % | 6.6 | % | |||||||||||||

Year ended December 31 | Percent Change | |||||||||||||||||||||||||||||||||||||||
2009 | 2010 | 2011 | 2009 vs. 2010 | 2010 vs. 2011 | ||||||||||||||||||||||||||||||||||||
Total | % of revenues | Total | % of revenues | Total | % of revenues | Total | % | Total | % | |||||||||||||||||||||||||||||||
| (in millions of euro, except percentages) | ||||||||||||||||||||||||||||||||||||||||
Revenues | 56,731 | 100.0 | % | 60,737 | 100.0 | % | 62,837 | 100.0 | % | 4,006 | 7.1 | % | 2,100 | 3.5 | % | |||||||||||||||||||||||||
Other income | 1,645 | 2.9 | % | 5,869 | 9.7 | % | 2,107 | 3.4 | % | 4,224 | 256.7 | % | (3,762 | ) | (64.1 | )% | ||||||||||||||||||||||||
Supplies | (16,717 | ) | (29.5 | )% | (17,606 | ) | (29.0 | )% | (18,256 | ) | (29.1 | )% | (889 | ) | 5.3 | % | (650 | ) | 3.7 | % | ||||||||||||||||||||
| Personnel expenses | (6,775 | ) | (11.9 | )% | (8,409 | ) | (13.8 | )% | (11,080 | ) | (17.6 | )% | (1,633 | ) | 24.1 | % | (2,671 | ) | 31.8 | % | ||||||||||||||||||||
Other expenses | (12,281 | ) | (21.6 | )% | (14,814 | ) | (24.4 | )% | (15,398 | ) | (24.5 | )% | (2,532 | ) | 20.6 | % | (585 | ) | 3.9 | % | ||||||||||||||||||||
| Operating income before depreciation and amortization (OIBDA)(1) | 22,603 | 39.8 | % | 25,777 | 42.4 | % | 20,210 | 32.2 | % | 3,175 | 14.0 | % | (5,567 | ) | (21.6 | )% | ||||||||||||||||||||||||
| Depreciation and amortization | (8,956 | ) | (15.8 | )% | (9,303 | ) | (15.3 | )% | (10,146 | ) | (16.1 | )% | (347 | ) | 3.9 | % | (843 | ) | 9.1 | % | ||||||||||||||||||||
| Operating income | 13,647 | 24.1 | % | 16,474 | 27.1 | % | 10,064 | 16.0 | % | 2,827 | 20.7 | % | (6,410 | ) | (38.9 | )% | ||||||||||||||||||||||||
| Share of profit (loss) of associates | 47 | 0.1 | % | 76 | 0.1 | % | (635 | ) | (1.0 | )% | 28 | 59.8 | % | (711 | ) | (940.3 | )% | |||||||||||||||||||||||
| Net financial expense | (3,307 | ) | (5.8 | )% | (2,649 | ) | (4.4 | )% | (2,941 | ) | (4.7 | )% | 658 | (19.9 | )% | (292 | ) | 11.0 | % | |||||||||||||||||||||
| Corporate income tax | (2,450 | ) | (4.3 | )% | (3,829 | ) | (6.3 | )% | (301 | ) | (0.5 | )% | (1,378 | ) | 56.2 | % | 3,527 | (92.1 | )% | |||||||||||||||||||||
| Profit for the year from continuing operations | 7,937 | 14.0 | % | 10,072 | 16.6 | % | 6,187 | 9.8 | % | 2,135 | 26.9 | % | (3,885 | ) | (38.6 | )% | ||||||||||||||||||||||||
| Profit after taxes from discontinued operations | - | - | - | - | - | - | - | - | - | - | ||||||||||||||||||||||||||||||
| Profit for the year | 7,937 | 14.0 | % | 10,072 | 16.6 | % | 6,187 | 9.8 | % | 2,135 | 26.9 | % | (3,885 | ) | (38.6 | )% | ||||||||||||||||||||||||
| Non-controlling interests | (161 | ) | (0.3 | )% | 95 | 0.2 | % | (784 | ) | (1.2 | )% | 256 | (158.9 | )% | (879 | ) | (925.5 | )% | ||||||||||||||||||||||
| Profit for the year attributable to equity holders of the parent | 7,776 | 13.7 | % | 10,167 | 16.7 | % | 5,403 | 8.6 | % | 2,392 | 30.8 | % | (4,765 | ) | (46.9 | )% | ||||||||||||||||||||||||
| · |
| · |
| · |
reported terms.
The below table shows the evolution of accesses over the past three years.
| ACCESSES | |||||
| Thousands of accesses | 2012 | 2013 | 2014 | %Var 12/13 | %Var 13/14 |
| Fixed telephony accesses (1) (2) (3) | 40,002.6 | 39,338.5 | 36,830.0 | (1.7%) | (6.4%) |
| Internet and data accesses | 19,402.6 | 19,102.0 | 18,151.7 | (1.5%) | (5.0%) |
| Narrowband | 653.2 | 510.8 | 373.1 | (21.8%) | (27.0%) |
| Broadband (4) | 18,596.2 | 18,447.8 | 17,668.5 | (0.8%) | (4.2%) |
| Other (5) | 153.1 | 143.4 | 110.1 | (6.3%) | (23.3%) |
| Mobile accesses | 247,346.9 | 254,717.2 | 274,458.0 | 3.0% | 7.8% |
| Prepay (6) (7) | 165,821.9 | 165,557.0 | 175,720.4 | (0.2%) | 6.1% |
| Contract | 81,525.0 | 89,160.3 | 98,737.6 | 9.4% | 10.7% |
| Pay-TV (8) | 3,336.2 | 3,602.2 | 5,087.2 | 8.0% | 41.2% |
| Unbundled loops | 3,308.8 | 3,833.4 | 4,087.3 | 15.9% | 6.6% |
| Shared ULL | 183.5 | 130.6 | 94.1 | (28.9%) | (27.9%) |
| Full ULL | 3,125.3 | 3,702.9 | 3,993.3 | 18.5% | 7.8% |
| Wholesale ADSL | 845.4 | 866.9 | 750.1 | 2.5% | (13.5%) |
| Other | 1,577.1 | 1,658.2 | 1,684.1 | 5.1% | 1.6% |
| Final Clients Accesses | 310,088.3 | 316,759.9 | 334,526.9 | 2.2% | 5.6% |
| Wholesale Accesses | 5,731.3 | 6,358.5 | 6,521.6 | 10.9% | 2.6% |
| Total Accesses | 315,819.6 | 323,118.4 | 341,048.5 | 2.3% | 5.5% |
Notes: - Telefónica Czech Republic accesses are de-consolidated from the first quarter of 2014, Telefónica Ireland accesses are de-consolidated from the third quarter of 2014 and E-Plus accesses are consolidated from the fourth quarter of 2014. | |||||
| - Telefónica Spain mobile accesses include since 2013 the accesses of Tuenti; in 2012 they have been restated with the same criteria. | |||||
| (1) RTB (includes public use telephony) x1; Basic Access RDSI x1; Primarily Access RDSI; Digital Access 2/6 x30. Includes internal use. Includes "fixed wireless" voice accesses. Includes Voice over IP and Naked DSL. | |||||
| (2) In the first quarter of 2014, 45 thousands inactive "fixed wireless" accesses were disconnected in Mexico. | |||||
| (3) In the second quarter of 2014, fixed clients includes 50 thousands additional fixed wireless clients in Peru. | |||||
| (4) Includes DSL, satellite, optic fiber, cable modem and broadband circuits. | |||||
| (5) Rest of retail non broadband circuits. | |||||
| (6) In the first quarter of 2014, 1.9 million inactive accesses were disconnected in Mexico. | |||||
| (7) In the fourth quarter 2014, 1.8 million inactive accesses were disconnected in Central America. | |||||
| (8) In the second quarter of 2014, Pay-TV accesses includes 131 thousand "TV Mini" clients in Spain. | |||||
The chart below shows the evolution of accesses by region over the past three years.
Accesses by region (millions)
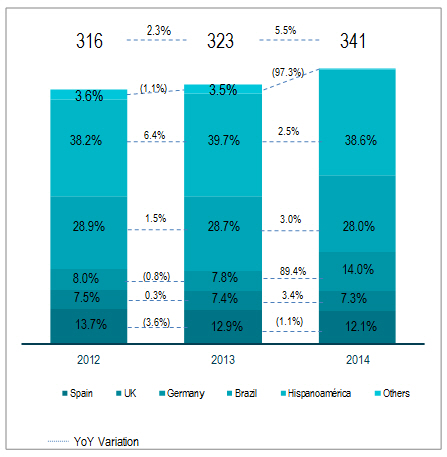
The Group’s strategy is based on capturing growth in its markets, especially on attracting high-value customers.
Mobile accesses totaled 274.5 million in 2014, increasing 7.8% compared to 2013 (a 2.2% increase excluding accesses from the E-Plus Group in 2014 and from Telefónica Czech Republic and in Telefónica Ireland in 2013), driven by the E-Plus Group acquisition and strong growth in the contract segment (+10.7%), which represented 36% of total mobile accesses in 2014 (+1 p.p. year-on-year). Notably, Telefónica Spain has increased its contract segment in 2014 in 77 thousand new accesses (excluding the impact of the disconnection of 569 thousand inactive M2M accesses in the first three months of 2014), a positive number for the first time since 2011.
Smartphone accesses maintained a strong growth rate (up 39.0% at December 31, 2014 compared to December 31, 2013), totaling 90.4 million accesses and reaching a penetration rate over total accesses of 35% (+8 p.p. year-on-year), reflecting the Company’s strategic focus on the growth of its data services.
Fixed broadband accesses stood at 17.7 million at December 31, 2014, a decrease of 4.2% year-on-year (+0.8% excluding accesses from Telefónica Czech Republic in 2013). Fiber accesses stood at 1.8 million at December 31, 2014 (a 111.8% increase compared to December 31, 2013).
TV accesses totaled 5.1 million at December 31, 2014, up 41.2% year-on-year (47.6% excluding accesses from Telefónica Czech Republic in 2013). Net adds (new additions to the customer base), excluding accesses from Telefónica Czech Republic, reached 1.6 million in the year.
Telefónica’s customer base includes the consumer and business segments, and therefore is not affected by customer concentration risk.
The below table shows our consolidated results of operations for the past three years.
| Year ended December 31 | Percent Change | |||||||||||||
| 2012 | 2013 | 2014 | 2013 vs 2012 | 2014 vs 2013 | ||||||||||
| Millions of Euros | Total | % of revenues | Total | % of revenues | Total | % of revenues | Total | % | Total | % | ||||
| Revenues | 62,356 | 100.0% | 57,061 | 100.0% | 50,377 | 100.0% | (5,295) | (8.5%) | (6,684) | (11.7%) | ||||
| Other income | 2,323 | 3.7% | 1,693 | 3.0% | 1,707 | (3.4%) | (630) | (27.1%) | 14 | 0.9% | ||||
| Supplies | (18,074) | (29.0%) | (17,041) | (29.9%) | (15,182) | (30.1%) | 1,033 | (5.7%) | 1,859 | (10.9%) | ||||
| Personnel expenses | (8,569) | (13.7%) | (7,208) | (12.6%) | (7,098) | (14.1%) | 1,361 | (15.9%) | 110 | (1.5%) | ||||
| Other expenses | (16,805) | (27.0%) | (15,428) | (27.0%) | (14,289) | (28.4%) | 1,377 | (8.2%) | 1,139 | (7.4%) | ||||
| Operating income before depreciation and amortization (OIBDA) | 21,231 | 34.0% | 19,077 | 33.4% | 15,515 | 30.8% | (2,154) | (10.1%) | (3,562) | (18.7%) | ||||
| Depreciation and amortization | (10,433) | (16.7%) | (9,627) | (16.9%) | (8,548) | (17.0%) | 806 | (7.7%) | 1,079 | (11.2%) | ||||
| Operating income | 10,798 | 17.3% | 9,450 | 16.6% | 6,967 | 13.8% | (1,348) | (12.5%) | (2,483) | (26.3%) | ||||
| Share of loss of investments accounted for by the equity method | (1,275) | (2.0%) | (304) | (0.5%) | (510) | (1.0%) | 971 | (76.2%) | (206) | 68.2% | ||||
| Net financial expense | (3,659) | (5.9%) | (2,866) | (5.0%) | (2,822) | (5.6%) | 793 | (21.7%) | 44 | (1.6%) | ||||
| Corporate income tax | (1,461) | (2.3%) | (1,311) | (2.3%) | (383) | (0.8%) | 150 | (10.3%) | 928 | (70.8%) | ||||
| Profit for the year | 4,403 | 7.1% | 4,969 | 8.7% | 3,252 | 6.5% | 566 | 12.9% | (1,717) | (34.6%) | ||||
| Non-controlling interests | (475) | (0.8%) | (376) | (0.7%) | (251) | (0.5%) | 99 | (20.8%) | 125 | (33.2%) | ||||
| Profit for the year attributable to equity holders of the parent | 3,928 | 6.3% | 4,593 | 8.0% | 3,001 | 6.0% | 665 | 16.9% | (1,592) | (34.7%) | ||||
Year ended December 31, 2014 compared with year ended December 31, 2013
The evolution of foreign exchange rates impacted negatively in 2014 financial results, in particular the depreciation of the Argentine peso, Brazilian real and the implicit depreciation of the Venezuelan bolívar.
In the comparison below2014 consolidated financial statements, Telefónica will use the exchange rate of our resultsthe Venezuelan bolívar set at the previously denominated SICAD II (set at 49.988 Venezuelan bolívar fuerte per dollar in the last auction), for the purpose of operations, we have provided certain comparisons at constanttranslating the transactions, cash flows and balances related to the investments in Venezuela. The Company has decided to take such exchange rate as a reference, as it considers it to be the most representative among the available exchange rates in order to present an analysisas of such date, for the monetary translation of the developmentaccounting figures of our results of operations from year-to-year withoutcash flows and balances.
Accordingly, we estimate that the effects of currency fluctuations. To make such comparisons, we have converted into euro certain financial items for the relevant year using the prior year’s average exchange rate. We refer to such comparisons as being made “excluding foreign exchange rate effects.”affect and hyperinflation in Venezuela, reduce revenue and OIBDA in 2014 by 12.1 percentage points and 13.1 percentage points, respectively.
Year-on-year comparisons of the Group’s earnings have also been affected by the acquisition and consolidation of the results of the E-Plus Group since October 1, 2014 and the sale and deconsolidation of the results of Telefónica Czech Republic (deconsolidated as of January, 2014) and Telefónica Ireland (deconsolidated as of July, 2014). Overall, these changes to the scope of consolidation explain 2.1 percentage points of the year-on-year decrease in revenues and 3.5 percentage points of the year-on-year decrease in OIBDA.
Revenues totaled 50,377 million euros in 2014, decreasing 11.7% compared to 2013, mainly affected by exchange rate differences and the effect of hyperinflation in Venezuela, which caused a 12.1 percentage points reduction in year-on-year growth. Additionally, revenues were also make certain comparisons on a local currency basis. Toaffected by changes to the scope of consolidation (-2.1 p.p.), chiefly the sales of Telefónica Czech Republic and Telefónica Ireland and the acquisition of E-Plus. Excluding these impacts, revenues would have increased by 2.6% year-on-year mainly due to the performance of Telefónica Hispanoamérica, where revenues from mobile data and digital services increased. In order to make comparisons excluding the impact of changes to the scope of consolidation caused by the sales of Telefónica Czech Republic and Telefónica Ireland and the acquisition of the E-Plus Group, we have excluded the contribution of such entities to revenues in both 2013 and 2014.
The structure of revenues reflects Telefónica’s business diversification. Despite the impact of exchange rates, as mentioned above, Telefónica Hispanoamércia was the largest contributor to our revenues in 2014, representing 26.1% (-3.4 p.p. compared to 2013). The other segments showed a positive evolution compared to 2013: Telefónica Spain, representing 23.9% (+1.2 p.p. compared to 2013), Telefónica Brazil, representing 22.3% (+0.9 p.p. compared to 2013), Telefónica United Kingdom, representing 14.0% (+2.3 p.p. compared to 2013) and Telefónica Germany, representing 11.0% (+2.3 p.p. compared to 2013).
Mobile data revenues fell by 5.2% in reported terms affected mainly by exchange rate differences and the effect of hyperinflation in Venezuela. Excluding exchange rate differences and the effect of hyperinflation in Venezuela (which accounted for 14.3 p.p. of the year-on-year fall) and changes to the scope of consolidation (which accounted for 0.5 p.p. of the year-on-year fall), revenues from mobile data would have increased by 9.9%. Mobile data revenues accounted for 41% of mobile service revenues in such year, up 3.1 percentage points compared to 2013. Revenue from non-SMS data showed a solid growth of 6.7% in reported terms (+23.9% excluding the impact of exchange rate differences and the effect of hyperinflation in Venezuela (+16.8 p.p.) and changes to the scope of consolidation (-0.1 p.p.)), and accounted for 73% of total data revenue during the year in reported terms (+8.1 p.p. year-on-year).
Other income in 2014 mainly included own work capitalized in our fixed assets, profit from the sale of other assets, and the sale of non-strategic towers of Telefónica Spain, Telefónica Brazil and Telefónica Hispanoamérica.
In 2014, other income increased mainly due to the sale of non-strategic towers (with an impact on a local currency basis, we compare financial itemsOIBDA of 196 million euros), primarily in Telefónica Spain (191 million euros), extraordinary sales of real estate in Telefónica Spain (41 million euros) and recognition of capital gains on the sale of assets belonging to the fixed business in Telefónica United Kingdom once the conditions stipulated in the relevant local currency for the periods indicated as recorded in the relevant local currency for such periods.sales agreement had been met (49 million euros).
Other income in 2013 consisted mainly of the sale of non-strategic towers of Telefónica Brazil, Telefónica Hispanoamérica and Telefónica Spain (113 million euros in other income and 111 million euros in OIBDA), capital gains on the sale of assets belonging to the fixed business of Telefónica United Kingdom (83 million euros) and capital gains on the assets sale of Telefónica Germany (76 million euros), capital gains on the sale of Hispasat (21 million euros).
Percent Change | ||||||||||||||||||||||||||||||||||||||||
Year ended December 31, | 2009 vs. 2010 | 2010 vs. 2011 | ||||||||||||||||||||||||||||||||||||||
2009 | % | 2010 | % | 2011 | % | Reported | Excl. FX(1) | Reported | Excl. FX(1) | |||||||||||||||||||||||||||||||
| (in millions of euro, except percentages) | ||||||||||||||||||||||||||||||||||||||||
Revenues | 56,731 | 60,737 | 62,837 | 7.1 | % | 4.9 | % | 3.5 | % | 4.2 | % | |||||||||||||||||||||||||||||
| Telefónica Spain | 19,703 | 34.7 | % | 18,711 | 30.8 | % | 17,284 | 27.5 | % | (5.0 | )% | (5.0 | )% | (7.6 | )% | (7.6 | )% | |||||||||||||||||||||||
| Telefónica Europe | 13,954 | 24.6 | % | 15,724 | 25.9 | % | 15,524 | 24.7 | % | 12.7 | % | 10.1 | % | (1.3 | )% | (1.0 | )% | |||||||||||||||||||||||
| Telefónica Latin America | 22,709 | 40.0 | % | 25,756 | 42.4 | % | 29,237 | 46.5 | % | 13.4 | % | 10.0 | % | 13.5 | % | 15.1 | % | |||||||||||||||||||||||
OIBDA | 22,603 | 25,777 | 20,210 | 14.0 | % | 13.0 | % | (21.6 | )% | (21.2 | )% | |||||||||||||||||||||||||||||
| Telefónica Spain | 9,757 | 43.2 | % | 8,520 | 33.1 | % | 5,072 | 25.1 | % | (12.7 | )% | (12.7 | )% | (40.5 | )% | (40.5 | )% | |||||||||||||||||||||||
| Telefónica Europe | 3,999 | 17.7 | % | 4,080 | 15.8 | % | 4,233 | 20.9 | % | 2.0 | % | (0.6 | )% | 3.8 | % | 3.7 | % | |||||||||||||||||||||||
| Telefónica Latin America | 9,041 | 40.0 | % | 13,713 | 53.2 | % | 10,941 | 54.1 | % | 51.7 | % | 50.6 | % | (20.2 | )% | (19.4 | )% | |||||||||||||||||||||||
| OIBDA Margin | 39.8% | 42.4% | 32.2% | |||||||||||||||||||||||||||||||||||||
| Telefónica Spain | 49.5% | 45.5% | 29.3% | |||||||||||||||||||||||||||||||||||||
| Telefónica Europe | 28.7% | 25.9% | 27.3% | |||||||||||||||||||||||||||||||||||||
| Telefónica Latin America | 39.8% | 53.2% | 37.4% | |||||||||||||||||||||||||||||||||||||
| Operating income | 13,647 | 16,474 | 10,064 | 20.7 | % | 22.4 | % | (38.9 | )% | (38.1 | )% | |||||||||||||||||||||||||||||
| Telefónica Spain | 7,617 | 55.8 | % | 6,511 | 39.5 | % | 2,984 | 29.7 | % | (14.5 | )% | (14.5 | )% | (54.2 | )% | (54.2 | )% | |||||||||||||||||||||||
| Telefónica Europe | 1,011 | 7.4 | % | 879 | 5.3 | % | 1,116 | 11.1 | % | (13.1 | )% | (16.8 | )% | 27.0 | % | 26.5 | % | |||||||||||||||||||||||
| Telefónica Latin America | 5,341 | 39.1 | % | 9,759 | 59.2 | % | 6,157 | 61.2 | % | 82.7 | % | 88.0 | % | (36.9 | )% | (35.5 | )% | |||||||||||||||||||||||
Net Results | 7,776 | 10,167 | 5,403 | |||||||||||||||||||||||||||||||||||||
| · | exchange rate differences and the |
| · | changes to the scope of consolidation (-1.4 p.p.) caused by the sales of Telefónica Czech Republic and Telefónica Ireland and the acquisition of the E-Plus Group; |
| · | impact of the sale agreements of Telefónica Ireland and Telefónica Czech Republic (-0.5 p.p.) in 2013; and |
| · | the recognition in 2014 of expenditures mainly on the global restructuring program, in accordance with the simplification initiatives the Group is implementing to meet its targets, totaling 652 million euros (670 million euros excluding exchange rate effects), accounting for 1.7 percentage points. |
Excluding these impacts, total expenses would have increased by 3.9% in 2014 compared to 2013, mainly due to higher commercial expenditures and outlays on networks and systems.
| · | Supplies amounted to 15,182 million euros in 2014, down 10.9% against 2013, mainly due to exchange rate differences and the effect of hyperinflation in Venezuela, which decreased supplies expenses by 8.6 percentage points. The year-on-year change was also affected by changes to the scope of consolidation (due to the sales of Telefónica Czech Republic and Telefónica Ireland and from the acquisition of the E-Plus Group, resulting in |
a 1.9 percentage points decrease. Excluding these effects, supplies expenses would have fallen by 0.5% as the result of lower mobile interconnection costs, which more than offset the higher equipment costs of handsets and TV content.
| · | Personnel expenses totaled 7,098 million euros in 2014, down 1.5% compared to 2013, mainly affected by exchange rate differences and the effect of hyperinflation in Venezuela, (-12.1 p.p.) and changes to the scope of consolidation (-2.4 p.p.) which were mostly offset by the expenditures on the global restructuring program, in accordance with the the simplification initiatives the Group is implementing to meet its targets (+8.1 p.p.). Excluding these impacts, personnel costs rose by 5.2% in 2014 compared to 2013 due to higher prices in some countries. |
The average headcount in 2014 was 120,497 employees, down 7.2% compared to 2013 due mainly to the changes in the scope of consolidation (-2.2% excluding changes to the scope of consolidation).
| · | Other expenses amounted to 14,289 million euros in 2014, down 7.4% as compared to 2013 mainly caused by exchange rate differences and the effect of hyperinflation in Venezuela (-13.9 p.p.). The year-on-year variation was also affected by the impact of value adjustments in the sales of Telefónica Ireland and Telefónica Czech Republic (-1.2 p.p.), changes to the scope of consolidation by the sales of Telefónica Czech Republic and Telefónica Ireland and the acquisition of the E-Plus Group (-0.5 p.p.) and the recognition of integration costs in Telefónica Germany (+0.6 p.p.). Excluding these impacts, other expenses would have increased by 8.1% due to higher commercial costs, higher network costs produced by larger volumes of data traffic and greater outlays on modernization of the network. |
OIBDA reached 15,515 million euros for the year ended December 31, 2014, a fall of 18.7%, mainly due to:
| · | the effect of exchange rates and hyperinflation in Venezuela (-13.1 p.p.); |
| · | changes to the scope of consolidation (-3.5 p.p.) following the exclusion of Telefónica Czech Republic and Telefónica Ireland and the inclusion of the E-Plus Group; |
| · | recognition in 2014 of expenditure mainly on the global restructuring program, in accordance with the simplification initiatives the Group is implementing to meet its targets, totaling 652 million euros (670 million euros at the exchange rate used to calculate 2013 results), accounting a decrease of 3.5 percentage points; |
| · | the impact of the sale of companies in 2013, chiefly the sale agreements for Telefónica Ireland (16 million euros) and Telefónica Czech Republic (176 million euros) (+1 p.p.), and the sale of Hispasat (21 million euros; -0.1 p.p); and |
| · | a higher sale value of non-strategic towers in 2014 compared to 2013 (196 million euros in 2014, mainly in Telefónica Spain (191 million euros), and 111 million euros in 2013, mainly in Telefónica Spain (70 million euros), Telefónica Brazil (29 million euros) and Telefónica Hispanoamérica (11 million euros, in Mexico, Chile and Colombia)). This effect accounts for 0.5 percentage points of OIBDA growth. |
Excluding these effects, OIBDA in 2014 would have increased by 0.2% compared to 2013. The OIBDA margin was 30.8% for 2014, down 2.6 percentage points year-on-year in reported terms.
By region, Telefónica Spain contributed most to the Group's consolidated OIBDA, accounting for 36.6% of the total (+3.3 p.p. compared to 2013), Telefónica Hispanoamérica accounted for 26.2% (-2.8 p.p. compared to 2013), Telefónica Brazil accounted for 22.8% (+2.2 p.p. compared to 2013), Telefónica United Kingdom accounted for 11.2% (+2.7 p.p. compared to 2013) and Telefónica Germany accounted for 4.7% (-2.1 p.p. compared to 2013).
Depreciation and amortization amounted to 8,548 million euros in 2014, a decline of 11.2% compared to 2013, due to lower depreciation of fixed assets, mainly in Brazil. The total depreciation and amortization charges arising from purchase price allocation processes amounted to 708 million euros for the year (-17.3% year-on-year).
Operating income (OI) in 2014 totaled 6,967 million euros, down 26.3% compared to 2013, mainly affected by exchange rate differences and the effect of hyperinflation (-18.8 p.p.), recognition in 2014 of expenditure mainly on
the global restructuring program, in accordance with the simplification initiatives the Group is implementing to meet its targets (-7.1 p.p.), changes to the scope of consolidation (-4.9 p.p.), consisting of the sale of Telefónica Czech Republic and Telefónica Ireland and the acquisition of the E-Plus Group, and additionally affected by the value adjustment of companies in 2013 (+1.7 p.p.). Additionally, the year-on-year variation was affected by higher sales of non-strategic towers in 2014 as compared to 2013 (+0.9 p.p.). Excluding these effects, operating income would have increased by 1.9% year-on-year.
The share of profit (loss) of investments accounted for by the equity method for the year was a loss of 510 million euros (a loss of 304 million euros in 2013), mainly due to valuation adjustments of Telco, S.p.A. at Telecom Italia, S.p.A. This, along with the contribution to the year's results, had a negative impact of 464 million euros (a loss of 267 million euros in 2013).
Net financial expense amounted to 2,822 million euros in 2014 (-1.6% year-on-year), and includes 293 million euros due to net negative foreign exchange differences primarily as a result of the Company’s decision to adopt the SICAD II exchange rate of the Venezuelan bolivar. Excluding this effect, net financial expenses would have fallen 8.2% year-on-year, mainly due to a 9.1% reduction in the average debt, placing the effective cost of debt in 2014 was 5.40%, 6 basis points higher than in 2013. The greater weight of debt in Latin America currencies and repayment and maturity of cheap debt in euros increases the average cost in 47 basis points, while lower rates in Latin America and Europe reduce it in 41 basis points.
Corporate income tax totaled 383 million euros in 2014 on a pre-tax income of 3,635 million euros, implying an effective tax rate of 10.5%, 10.3 percentage points lower year-on-year. This was mainly due to the effect of a review of deferred taxes in Brazil following a change to legislation during the second quarter of 2014, and to a larger recognition of tax credits in Colombia.
Profit attributable to non-controlling interests reduced net profit by 251 million euros in 2014, 33.2% less than in 2013, mainly due to the effect of a review of deferred taxes in Brazil following a change to legislation in 2014, and to a larger recognition of tax credits.
As a result of the foregoing, consolidated net profit for 2014 was 3,001 million euros (down by 34.7% year-on-year).
Year ended December 31, 2013 compared with year ended December 31, 2012
The main metrics in the income statement were negatively affected in 2013 by exchange rate fluctuations, mainly due to the devaluation of the Venezuelan bolivar and the depreciations of the Brazilian reais and the Argentine peso against the euro. Exchange rates reduced year-on-year revenue and OIBDA growth in 2013 by 7.5 percentage points.
In addition, the Telefónica Group deconsolidated the results from the Atento Group as of the end of November 2012 (following the disposal of the Atento Group during the fourth quarter of 2012), therefore affecting year-on-year comparisons of Telefónica’s reported financial results.
Revenues in 2013 totaled 57,061 million euros, decreasing 8.5% in reported terms, mainly affected by the exchange rate differences and the effect of hyperinflation in Venezuela which reduced year-on-year growth by 7.5 percentage points. Additionally, revenues were affected by changes in the consolidation perimeter especially the deconsolidation of the Atento group (-1.7 p.p.). Excluding these impacts, revenue in 2013 would have increased by 0.7% year-on-year.
The structure of revenues reflects the Company’s diversification and despite the above-mentioned exchange rate impact, Telefónica Hispanoamérica accounted for 29.5% of total revenues in 2013 (+2.7 p.p. compared with 2012). Telefónica United Kingdom accounted for 11.7% (+0.4 p.p. compared with 2012), Telefónica Brazil accounted for 21.4% of the total (-0.4 p.p. compared with 2012) and Telefónica Spain accounted for 22.7% (-1.3 p.p. compared with 2012).
Mobile data revenues decreased 0.7% in reported terms. Excluding the impact of exchange rate differences and the effect of the hyperinflation in Venezuela, mobile data revenues would have increased 9.3%. These revenues accounted for 37% of mobile service revenues in 2013, a 3 percentage points growth compared with 2012. Especially noteworthy is the growth in non-SMS data revenues (+11.2% in reported terms and +22.2% excluding the impact of exchange rate
differences and the effect of hyperinflation in Venezuela), which accounted for 64% of total data revenues in the year in reported terms (+7 p.p. year-on-year).
Other income: mainly includes own work capitalized in our fixed assets, the profit from the sale of other assets, and the disposal of non-strategic towers of Telefónica Brazil, Telefónica Hispanoamérica and Telefónica Spain. The lower level of sales of non-strategic towers compared to 2012 is the main driver for the decrease in other income, decreasing to 1,693 million euros in 2013 from 2,323 million euros in 2012.
Other income in 2013 consisted mainly of the sale of non-strategic towers in Telefónica Brazil, Telefónica Hispanoamérica and Telefónica Spain (113 million euros in other income and 111 million euros in OIBDA), the capital gain from the disposal of the assets of the fixed business of Telefónica United Kingdom (83 million euros), the capital gain from the sale of assets in Telefónica Germany (76 million euros) and the capital gain from the sale of the stake in Hispasat (21 million euros).
In 2012 other income was mainly comprised of income from the sale of non-strategic towers in Telefónica Brazil, Telefónica Hispanoamérica and Telefónica Spain (659 million euros in other income and 643 million euros in OIBDA), the gain from the sale of applications (39 million euros), and the capital gains from the sale of the Atento group (61 million euros), of Rumbo (27 million euros) and the partial sale of Hispasat (26 million euros).
Total expenses, which include supplies, personnel expenses and other expenses (primarily external services and taxes) amounted to 39,678 million euros in 2013. This represented an 8.7% decrease year-on-year in reported terms, which was primarily due to:
| · | exchange rate differences and the effect of hyperinflation in Venezuela (-7.3 p.p.); |
| · | changes in the consolidation perimeter caused by the disposal of Atento and Rumbo (-1.9 p.p.); |
| · | value adjustments and loss on sale of companies in 2013 and 2012: |
| · | the impact of losses on the sale of companies in 2013, (totaling 192 million euros), primarily from the sale agreements to Telefónica Ireland and Telefónica Czech Republic (+0.4 p.p.); |
| · | the impact of value adjustments and loss on sale of companies in 2012, which totaled an amount of 624 million euros, primarily from the sale of part of our stake in China Unicom and a value adjustment of Telefónica Ireland (-1.4 p.p.); and |
| · | a contractual change in the commercial model for selling handsets in Chile as a result of which we began from September 2012, to record all of the costs of handsets sold immediately rather than capitalizing such costs and depreciating them over the life of the contract (+0.4 p.p.). |
Excluding the aforementioned items, total expenses grew 1.2% in 2013 compared with 2012, mainly as a result of the greater commercial activity in Telefónica Brazil and Telefónica Hispanoamérica, focused on capturing high-value customers.
| · | Supplies stood at 17,041 million euros in 2013, falling 5.7% with respect to 2012, affected to a large degree by exchange rate differences and the effect of hyperinflation in Venezuela, which reduced this item by 7.3 percentage points. Additionally, the year-on-year change is affected by changes in the consolidation perimeter (-1.4 p.p.) and by the contractual change in the commercial model for selling handsets in Chile discussed above (+0.9 p.p.). Excluding both effects, expenses grew 2%, as a result of the greater commercial activity in Telefónica Brazil and Telefónica Hispanoamérica, both in the mobile segment, due to an increase in the weighting of smartphone sales, and in the fixed business, mainly Pay-TV, which offset the decline in equipment costs of operators in Europe and the lower termination costs at the group level. |
| · | Personnel expenses totaled 7,208 million euros and fell by 15.9% with respect to 2012, mainly affected by the exchange rate differences and the effect of hyperinflation in Venezuela (-6.2 p.p.) and changes in the consolidation perimeter (-13.6 p.p.). Excluding both effects personnel expenses increased by 4% due to the negative impact of inflation in certain Latin American countries, which more than offset declines reported by Telefónica Spain, Telefónica Czech Republic and Telefónica United Kingdom due to savings from workforce restructuring |
programs. This item also reflects restructuring expenses amounting to 156 million euros in 2013 compared to 67 million euros in 2012.
The average headcount in 2013 was 129,893 employees, 3.9% lower than the average in 2012, excluding the impact of the deconsolidation of Atento.
| · | Other expenses amounted to 15,428 million euros, falling 8.2%, mainly affected by the impact of exchange rate differences and the effect of hyperinflation in Venezuela (-8 p.p.). In addition, it was also affected by the above-mentioned value adjustment in companies in 2012 and 2013 (-2.6 p.p.), expenses associated with the sale of non-strategic towers (-0.1 p.p.) and changes in the consolidation perimeter (+3.5 p.p.). Excluding these effects this item fell 1.1%, explained by the lower costs of operators in Europe, mainly in commercial expenses, systems and networks, due to the efficiency measures carried out especially in Telefónica Spain, which involved simplification of processes, distribution channels and call centers redefinition, internalization of activities, savings from the restructuring plan and temporary cancelation of the corporate contribution to pension plans. |
OIBDA reached 19,077 million euros, showing a decline of 10.1%, mainly affected by:
| · | exchange rate differences and the effect of hyperinflation in Venezuela (-7.5 p.p.); |
| · | the lower amount of non-strategic towers sold in 2013 compared to 2012 (-2.5 p.p.); |
| · | changes in the consolidation perimeter mainly caused by the disposal of Atento (-1.0 p.p.); |
| · | the contractual change in the commercial model for selling handsets in Chile (-0.8 p.p.); |
| · | value adjustments and loss on sale of companies in 2013 and 2012: |
| · | the impact of the sale of companies mainly the disposal of Telefónica Ireland and Telefónica Czech Republic in 2013 (-1.3 p.p.); and |
| · | the impact of value adjustments and loss on sale of companies in 2012 totaled 624 million euros, primarily from the sale of part of our stake in China Unicom and a value adjustment of Telefónica Ireland (+2.9 p.p.). |
Excluding the aforementioned items, OIBDA for 2013 would have been stable versus the prior year. OIBDA margin was 33.4% in 2013, down 0.6 percentage points year-on-year in reported terms.
By region, Telefónica Spain, accounted for 33.2% of consolidated OIBDA in 2013 (+1 p.p. compared to 2012), while Telefónica Hispanoamérica accounted for 29.0% (+0.8 p.p. compared to 2012) and Telefónica Brazil accounted for 20.7% (-3.7 p.p. compared to 2012).
Depreciation and amortization in 2013 (9,627 million euros) registered a year-on-year drop of 7.7%, mainly due to the exchange rate effects and the sale of the Atento Group, Telefónica Ireland and Telefónica Czech Republic. The depreciation and amortization charges arising from purchase price allocation processes amounted to 856 million euros during 2013 (-11.1% year-on-year).
Operating income in 2013 totaled 9,450 million euros, decreasing 12.5% year-on-year, mainly affected by exchange rate differences and the effect of hyperinflation in Venezuela (-9.6 p.p.). Additionally the year-on-year change was due to the lower amount of non-strategic towers sold in 2013 as compared to 2012 (-4.9 p.p.), changes in the consolidation perimeter (-1.5 p.p.), the contractual change in the commercial model for selling handsets in Chile in 2012 (-0.9 p.p.), sales of companies (-0.1 p.p.) and the value adjustment of companies in 2013 and 2012 (+4.9 p.p.). Excluding these impacts operating income would have fallen 0.5% year-on-year.
Share of profit (loss) of investments accounted for by the equity method was a loss of 304 million euros in 2013 compared with a loss of 1,275 million euros in 2012 and was affected by adjustments to the value of the stake of Telco, S.p.A. in Telecom Italia, S.p.A and the contribution to results in the year, resulting in a negative impact on “Share of loss of investments accounted for by the equity method” of 267 million euros and 1,277 million euros, respectively.
Net financial expense amounted to 2,866 million euros in 2013, 21.7% lower than in 2012, of which 111 million euros were due to net negative foreign exchange differences. Excluding this effect, net financial expenses fell 11.8% year-on-year, mainly due to an 11.4% reduction in the average debt. The effective cost of debt in 2013 excluding exchange rate differences was 5.34%, 3 basis points below 2012, with savings from management improvements over the gross cost of debt in euros offsetting the impact on the effective cost from the fact that most of the reduction has been in euros (with below average costs).
Corporate income tax in 2013 stood at 1,311 million euros, on a pre-tax income of 6,280 million euros, implying an effective tax rate of 20.9%, 4.0 percentage points lower year-on-year. This is mainly due to the recognition in 2012 of the tax assessments in Spain.
Profit attributable to non-controlling interests reduced 2013 net profit by 376 million euros and was down 20.7% year-on-year, mainly as a result of the lower profit attributed to minority interests in Telefónica Brazil, affected by the exchange rate.
As a result of the performance of the above items, profit for the period in 2013 was 4,593 million euros (16.9% higher year-on-year).
Segment results
Some of the figures in the table below are compared at a constant exchange rate in order to analyze yearly performance excluding the effect of exchange rate variation. For certain of the financial results discussed below, comparison has been made using the previous year’s average exchange rate to convert the figure and by excluding the consideration of Venezuela as a hyperinflationary economy. In these cases a comment of “excluding foreign exchange rate effect” or “excluding foreign exchange rate effect and the consideration of Venezuela as a hyperinflationary economy” (or similar wording) has been indicated.
Some figures discussed further below have been compared in local currency (LC), taking the financial magnitudes in the relevant local currency as they were registered in the corresponding periods.
| % YoY 12/13 | % YoY 13/14 | |||||||||||
| Millions of euros | 2012 | % Total | 2013 | % Total | 2014 | % Total | Reported | Ex fx (*) | Reported | Ex fx (*) | ||
| Revenues | 62,356 | 57,061 | 50,377 | (8.5%) | (1.0%) | (11.7%) | 0.4% | |||||
| Telefonica Spain | 14,996 | 24.0% | 12,959 | 22.7% | 12,023 | 23.9% | (13.6%) | (13.6%) | (7.2%) | (7.2%) | ||
| Telefonica United Kingdom | 7,042 | 11.3% | 6,692 | 11.7% | 7,062 | 14.0% | (5.0%) | (0.5%) | 5.5% | 0.2% | ||
| Telefonica Germany | 5,213 | 8.4% | 4,914 | 8.6% | 5,522 | 11.0% | (5.7%) | (5.7%) | 12.4% | 12.4% | ||
| Telefonica Brazil | 13,618 | 21.8% | 12,217 | 21.4% | 11,231 | 22.3% | (10.3%) | 2.2% | (8.1%) | 0.5% | ||
| Telefonica Hispanoamérica | 16,741 | 26.8% | 16,855 | 29.5% | 13,155 | 26.1% | 0.7% | 16.1% | (22.0%) | 14.6% | ||
| OIBDA | 21,231 | 19,077 | 15,515 | (10.1%) | (2.6%) | (18.7%) | (5.7%) | |||||
| Telefonica Spain | 6,815 | 32.1% | 6,340 | 33.2% | 5,671 | 36.6% | (7.0%) | (7.0%) | (10.6%) | (10.6%) | ||
| Telefonica United Kingdom | 1,602 | 7.5% | 1,637 | 8.6% | 1,744 | 11.2% | 2.2% | 7.0% | 6.5% | 1.1% | ||
| Telefonica Germany | 1,351 | 6.4% | 1,308 | 6.9% | 733 | 4.7% | (3.2%) | (3.2%) | (44.0%) | (44.0%) | ||
| Telefonica Brazil | 5,161 | 24.3% | 3,940 | 20.7% | 3,543 | 22.8% | (23.7%) | (13.0%) | (10.1%) | (1.7%) | ||
| Telefonica Hispanoamérica | 5,983 | 28.2% | 5,531 | 29.0% | 4,068 | 26.2% | (7.6%) | 8.6% | (26.5%) | 14.2% | ||
| OIBDA Margin | 34.0% | 33.4% | 30.8% | |||||||||
| Telefonica Spain | 45.4% | 48.9% | 47.2% | |||||||||
| Telefonica United Kingdom | 22.7% | 24.5% | 24.7% | |||||||||
| Telefonica Germany | 25.9% | 26.6% | 13.3% | |||||||||
| Telefonica Brazil | 37.9% | 32.3% | 31.5% | |||||||||
| Telefonica Hispanoamérica | 35.7% | 32.8% | 30.9% | |||||||||
| Operating Income (OI) | 10,798 | 9,450 | 6,967 | (12.5%) | (2.8%) | (26.3%) | (7.5%) | |||||
| Telefonica Spain | 4,752 | 44.0% | 4,437 | 46.9% | 3,866 | 55.5% | (6.6%) | (6.6%) | (12.9%) | (12.9%) | ||
| Telefonica United Kingdom | 607 | 5.6% | 621 | 6.6% | 623 | 8.9% | 2.3% | 7.2% | 0.3% | (4.7%) | ||
| Telefonica Germany | 118 | 1.1% | 77 | 0.8% | (693) | (9.9%) | (35.4%) | (35.4%) | n.m. | n.m. | ||
| Telefonica Brazil | 2,843 | 26.3% | 1,831 | 19.4% | 1,781 | 25.6% | (35.6%) | (26.6%) | (2.7%) | 6.3% | ||
| Telefonica Hispanoamérica | 3,221 | 29.8% | 3,007 | 31.8% | 2,034 | 29.2% | (6.6%) | 16.8% | (32.4%) | 20.9% | ||
| Profit for the year attributable to equity holders of the parent | 3,928 | 4,593 | 3,001 | |||||||||
| (*) Excludes exchange rate effects and hyperinflation in Venezuela. | ||||||||||||
Revenues and OIBDA Contributioncontribution by Country

country
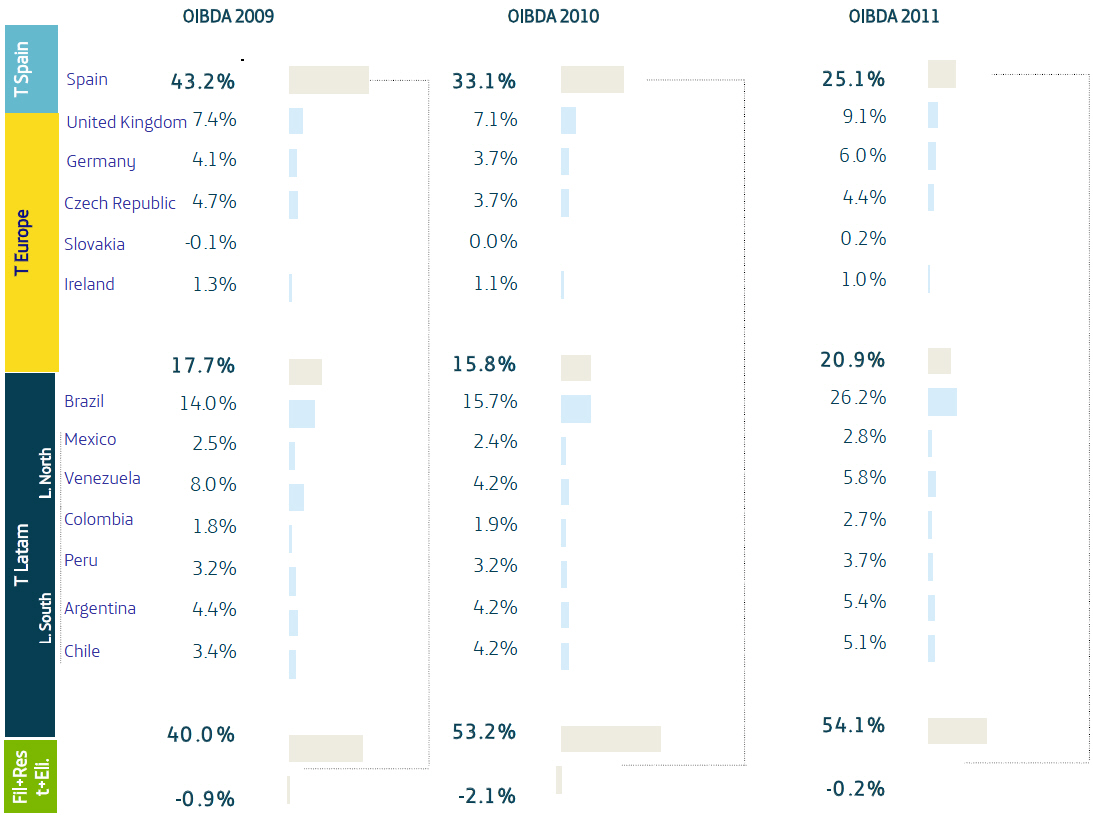
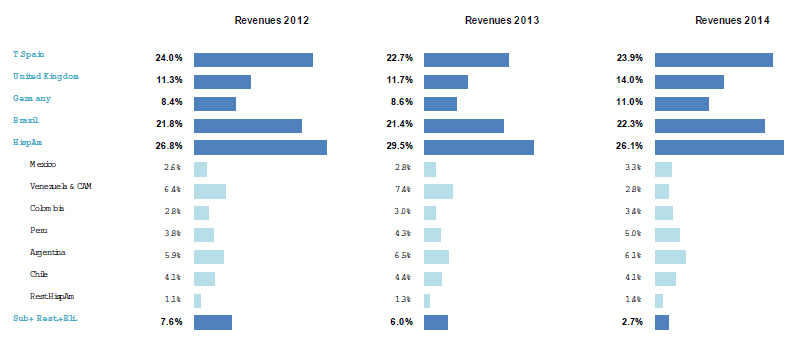
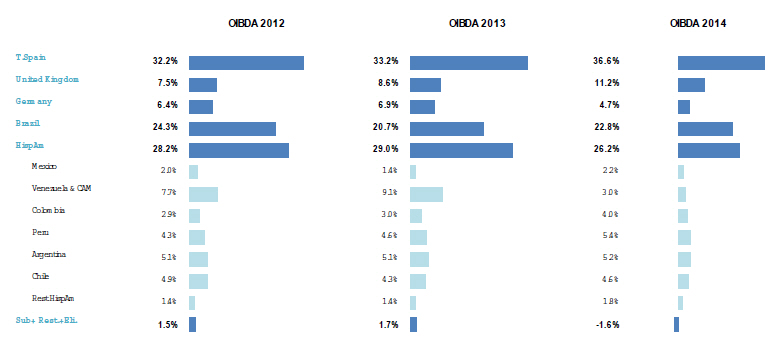
As the preceding tables illustrate,charts show, the Telefónica Group is highly diversified geographically, withhas high geographic diversification. During the Europe (including Spain)periods covered by such charts, Telefónica Spain and Latin America regions contributing similar proportions of overall revenues in 2011. Spain andTelefónica Brazil are the largest single contributors to Group revenue and OIBDA, on a country-by-country basis, followed by the United Kingdom, Germany, Argentina, Peru, Mexico and Venezuela Argentina and Chile. Central America.
Together, these countries accounted for 83%91.1% of OIBDA and 82%88.3% of Group revenuerevenues in 2011 (72%2014 (89.5% of OIBDA and 81%85.4% of revenuerevenues in 20102013 and 84%89.5% of OIBDA and 82%84.3% of revenuerevenues in 2009)2012, respectively). As a result, most of the information detailed below relates to operations in these regions.
Beginning in 2013 we present figures of Venezuela and Central America together, and figures for previous years have been revised accordingly.
Contribution to Growth by Country


At December 31, | Percent Change | |||||||||||||||||||
2009 | 2010 | 2011 | 2009 vs. 2010 | 2010 vs. 2011 | ||||||||||||||||
| (in thousands) | ||||||||||||||||||||
Fixed telephony accesses(1) | 24,578.3 | 24,403.6 | 23,960.7 | (0.7 | )% | (1.8 | )% | |||||||||||||
Internet and data accesses | 7,605.2 | 8,235.1 | 8,885.9 | 8.3 | % | 7.9 | % | |||||||||||||
Narrowband accesses(2) | 1,070.6 | 674.8 | 389.4 | (37.0 | )% | (42.3 | )% | |||||||||||||
Broadband accesses(3)(4) | 6,426.8 | 7,442.3 | 8,385.9 | 15.8 | % | 12.7 | % | |||||||||||||
Other accesses(5) | 107.8 | 118.0 | 110.6 | 9.5 | % | (6.3 | )% | |||||||||||||
Mobile accesses | 134,698.9 | 149,255.4 | 166,297.9 | 10.8 | % | 11.4 | % | |||||||||||||
Pre-pay accesses | 111,503.6 | 119,359.1 | 131,087.2 | 7.0 | % | 9.8 | % | |||||||||||||
Contract accesses | 23,195.4 | 29,896.3 | 35,210.7 | 28.9 | % | 17.8 | % | |||||||||||||
Pay TV accesses(6) | 1,648.6 | 1,792.7 | 2,257.7 | 8.7 | % | 25.9 | % | |||||||||||||
Final clients accesses | 168,531.1 | 183,686.9 | 201,402.2 | 9.0 | % | 9.6 | % | |||||||||||||
Wholesale accesses | 56.1 | 55.9 | 50.9 | (0.4 | )% | (9.0 | )% | |||||||||||||
Total accesses | 168,587.2 | 183,742.8 | 201,453.0 | 9.0 | % | 9.6 | % | |||||||||||||
Market Share Mobile Business(1) | ||||||||||||
At December 31, | ||||||||||||
2009 | 2010 | 2011 | ||||||||||
Brazil | 29.7 | % | 29.7 | % | 29.5 | % | ||||||
Argentina | 33.0 | % | 31.0 | % | 29.8 | % | ||||||
Chile | 42.8 | % | 41.4 | % | 39.1 | % | ||||||
Peru | 63.2 | % | 63.4 | % | 61.4 | % | ||||||
Colombia | 21.3 | % | 22.4 | % | 22.4 | % | ||||||
Venezuela | 36.9 | % | 32.7 | % | 32.7 | % | ||||||
Mexico | 20.9 | % | 21.5 | % | 21.1 | % | ||||||
Central America | 22.4 | % | 22.5 | % | 21.7 | % | ||||||
Ecuador | 28.4 | % | 28.2 | % | 28.4 | % | ||||||
Uruguay | 39.3 | % | 38.5 | % | 38.0 | % | ||||||
Market Share Internet and Data Business(1) | ||||||||||||
At December 31, | ||||||||||||
2009 | 2010 | 2011 | ||||||||||
Brazil | 23.2 | % | 24.8 | % | 21.9 | % | ||||||
Argentina | 32.0 | % | 31.9 | % | 31.1 | % | ||||||
Chile | 46.1 | % | 45.5 | % | 43.0 | % | ||||||
Peru | 93.9 | % | 91.2 | % | 90.1 | % | ||||||
Colombia | 18.9 | % | 20.8 | % | 18.1 | % | ||||||
Percent Change | ||||||||||||||||||||||||||||
Year ended December 31, | 2009 vs. 2010 | 2010 vs. 2011 | ||||||||||||||||||||||||||
2009 | 2010 | 2011 | Reported | Excl. FX(1) | Reported | Excl. FX(1) | ||||||||||||||||||||||
| (in millions of euro, except percentages) | ||||||||||||||||||||||||||||
Revenues | 22,709 | 25,756 | 29,237 | 13.4 | % | 10.0 | % | 13.5 | % | 15.1 | % | |||||||||||||||||
OIBDA | 9,041 | 13,713 | 10,941 | 51.7 | % | 50.6 | % | (20.2 | )% | (19.4 | )% | |||||||||||||||||
OIBDA margin | 39.8 | % | 53.2 | % | 37.4 | % | 13.4 p. | p. | 14.5 p. | p. | (15.8) p. | p. | (16.0) p. | p. | ||||||||||||||
| Depreciation and amortization | (3,700 | ) | (3,954 | ) | (4,783 | ) | 6.9 | % | (4.0 | )% | 21.0 | % | 21.1 | % | ||||||||||||||
Operating income | 5,341 | 9,759 | 6,157 | 82.7 | % | 88.0 | % | (36.9 | )% | (35.5 | )% | |||||||||||||||||
At December 31, | Percent Change | |||||||||||||||||||
2009 | 2010 | 2011 | 2009 vs. 2010 | 2010 vs. 2011 | ||||||||||||||||
| (in thousands) | ||||||||||||||||||||
Fixed telephony accesses(1) | 11,253.8 | 11,292.6 | 10,977.4 | 0.3 | % | (2.8 | )% | |||||||||||||
Internet and data accesses | 3,440.2 | 3,848.2 | 3,942.6 | 11.9 | % | 2.5 | % | |||||||||||||
Narrowband accesses | 723.1 | 446.2 | 214.5 | (38.3 | )% | (51.9 | )% | |||||||||||||
Broadband accesses(2) | 2,638.4 | 3,319.2 | 3,648.0 | 25.8 | % | 9.9 | % | |||||||||||||
Other accesses(3) | 78.7 | 82.8 | 80.0 | 5.2 | % | (3.3 | )% | |||||||||||||
Mobile accesses | 51,744.4 | 60,292.5 | 71,553.6 | 16.5 | % | 18.7 | % | |||||||||||||
Pre-pay accesses | 41,960.7 | 47,658.6 | 55,438.1 | 13.6 | % | 16.3 | % | |||||||||||||
Contract accesses | 9,783.7 | 12,633.9 | 16,115.5 | 29.1 | % | 27.6 | % | |||||||||||||
Pay TV accesses(4) | 487.2 | 486.3 | 698.6 | (0.2 | )% | 43.7 | % | |||||||||||||
Final clients accesses | 66,925.7 | 75,919.6 | 87,172.1 | 13.4 | % | 14.8 | % | |||||||||||||
Wholesale accesses | 34.2 | 33.9 | 28.0 | (0.9 | )% | (17.3 | )% | |||||||||||||
Total accesses | 66,959.8 | 75,953.5 | 87,200.1 | 13.4 | % | 14.8 | % | |||||||||||||
Year ended December 31, | Percent Change | |||||||||||||||||||||||||||
2009 | 2010 | 2011 | 2009 vs. 2010 | 2010 vs. 2011 | ||||||||||||||||||||||||
Euro | Local Currency | Euro | Local Currency | |||||||||||||||||||||||||
| (in millions of euro, except percentages) | ||||||||||||||||||||||||||||
Revenues | 8,376 | 11,119 | 14,326 | 32.8 | % | 12.1 | % | 28.8 | % | 28.7 | % | |||||||||||||||||
Mobile business | 3,036 | 4,959 | 8,437 | 63.4 | % | 37.9 | % | n.c. | n.c. | |||||||||||||||||||
Service revenues | 2,792 | 4,649 | 8,014 | 66.5 | % | 40.3 | % | n.c. | n.c. | |||||||||||||||||||
Fixed telephony business | 5,766 | 6,843 | 5,890 | 18.7 | % | 0.2 | % | n.c. | n.c. | |||||||||||||||||||
OIBDA | 3,139 | 4,074 | 5,302 | 29.8 | % | 9.6 | % | 30.2 | % | 30.0 | % | |||||||||||||||||
OIBDA Margin | 37.5 | % | 36.6 | % | 37.0 | % | (0.9) p. | p. | (0.9) p. | p. | 0.4 p. | p. | 0.4 p. | p. | ||||||||||||||
CAPEX | 1,228 | 1,797 | 2,468 | 46.4 | % | 23.6 | % | 37.4 | % | 37.2 | % | |||||||||||||||||
| OpCF (OIBDA – CAPEX) | 1,911 | 2,277 | 2,834 | 19.1 | % | 0.6 | % | 24.5 | % | 24.3 | % | |||||||||||||||||
Year ended December 31, | Percent Change (local currency) | ||||||||||||||||||
2009 | 2010 | 2011 | 2009 vs. 2010 | 2010 vs. 2011 | |||||||||||||||
Traffic (millions of minutes) | 52,134 | 77,463 | 92,081 | 48.6 | % | n.c. | |||||||||||||
ARPU (in euro) | 9.9 | 11.0 | 10.2 | (6.0 | )% | n.c. | |||||||||||||
addition of all countries’ contributions shown in the chart equals the total Group revenues increase in 2014 (+0.4% in 2014), excluding the impact of exchange rate differences and the effect of hyperinflation in Venezuela.
At December 31, | Percent Change | |||||||||||||||||||
2009 | 2010 | 2011 | 2009 vs. 2010 | 2010 vs. 2011 | ||||||||||||||||
| (in thousands) | ||||||||||||||||||||
Fixed telephony accesses(1) | 4,607.7 | 4,621.5 | 4,611.0 | 0.3 | % | (0.2 | )% | |||||||||||||
| Fixed wireless accesses | 36.2 | 35.5 | 38.2 | (1.9 | )% | 7.6 | % | |||||||||||||
Internet and data accesses | 1,351.0 | 1,505.4 | 1,630.7 | 11.4 | % | 8.3 | % | |||||||||||||
Narrowband accesses | 112.7 | 65.7 | 35.7 | (41.7 | )% | (45.7 | )% | |||||||||||||
Broadband accesses(2) | 1,238.3 | 1,439.7 | 1,595.1 | 16.3 | % | 10.8 | % | |||||||||||||
Mobile accesses | 15,931.9 | 16,148.9 | 16,766.7 | 1.4 | % | 3.8 | % | |||||||||||||
Pre-pay accesses | 10,736.8 | 10,370.4 | 10,581.3 | (3.4 | )% | 2.0 | % | |||||||||||||
Contract accesses | 5,195.2 | 5,778.5 | 6,185.4 | 11.2 | % | 7.0 | % | |||||||||||||
Final clients accesses | 21,890.7 | 22,275.8 | 23,008.4 | 1.8 | % | 3.3 | % | |||||||||||||
Wholesale accesses | 9.3 | 13.0 | 13.9 | 39.8 | % | 7.0 | % | |||||||||||||
Total accesses | 21,900.0 | 22,288.8 | 23,002.3 | 1.8 | % | 3.3 | % | |||||||||||||
Year ended December 31, | Percent Change | |||||||||||||||||||||||||||
2009 | 2010 | 2011 | 2009 vs. 2010 | 2010 vs. 2011 | ||||||||||||||||||||||||
Euro | Local Currency | Euro | Local Currency | |||||||||||||||||||||||||
| (in millions of euro, except percentages) | ||||||||||||||||||||||||||||
Revenues | 2,609 | 3,073 | 3,174 | 17.8 | % | 17.9 | % | 3.3 | % | 14.5 | % | |||||||||||||||||
Mobile business | 1,643 | 1,979 | 2,039 | 20.4 | % | 20.6 | % | 3.0 | % | 14.2 | % | |||||||||||||||||
Service revenues | 1,522 | 1,845 | 1,880 | 21.2 | % | 21.4 | % | 1.9 | % | 12.9 | % | |||||||||||||||||
Fixed telephony business | 1,047 | 1,187 | 1,237 | 13.3 | % | 13.5 | % | 4.3 | % | 15.6 | % | |||||||||||||||||
OIBDA | 986 | 1,082 | 1,085 | 9.7 | % | 9.8 | % | 0.2 | % | 11.1 | % | |||||||||||||||||
OIBDA Margin | 36.8 | % | 34.3 | % | 33.4 | % | (2.5) p. | p. | (2.5) p. | p. | (0.9) p. | p. | (0.9) p. | p. | ||||||||||||||
CAPEX | 319 | 398 | 449 | 25.1 | % | 25.2 | % | 12.6 | % | 24.9 | % | |||||||||||||||||
| OpCF (OIBDA – CAPEX) | 668 | 684 | 636 | 2.4 | % | 2.5 | % | (7.0 | )% | 3.1 | % | |||||||||||||||||
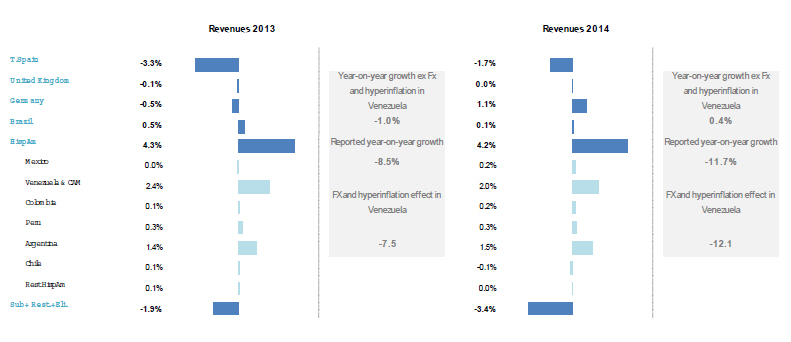
Year ended December 31, | Percent Change (local currency) | |||||||||||||||||||
2009 | 2010 | 2011 | 2009 vs. 2010 | 2010 vs. 2011 | ||||||||||||||||
Traffic (millions of minutes) | 15,562 | 17,550 | 18,788 | 12.8 | % | 7.1 | % | |||||||||||||
ARPU (in euro) | 8.6 | 9.2 | 9.7 | 6.7 | % | 17.3 | % | |||||||||||||
At December 31, | Percent Change | |||||||||||||||||||
2009 | 2010 | 2011 | 2009 vs. 2010 | 2010 vs. 2011 | ||||||||||||||||
| (in thousands) | ||||||||||||||||||||
Mobile accesses | 10,531.4 | 9,514.7 | 9,438.7 | (9.7 | )% | (0.8 | )% | |||||||||||||
Pre-pay accesses | 9,891.1 | 8,740.3 | 8,570.9 | (11.6 | )% | (1.9 | )% | |||||||||||||
Contract accesses | 640.3 | 774.4 | 867.8 | 20.9 | % | 12.1 | % | |||||||||||||
Fixed wireless accesses | 1,214.3 | 966.2 | 883.4 | (20.4 | )% | (8.6 | )% | |||||||||||||
Pay TV accesses | 62.8 | 69.3 | 114.3 | 10.4 | % | 65.0 | % | |||||||||||||
Total accesses | 11,808.5 | 10,550.2 | 10,436.4 | (10.7 | )% | (1.1 | )% | |||||||||||||
Year ended December 31, | Percent Change | |||||||||||||||||||||||||||
2009 | 2010 | 2011 | 2009 vs. 2010 | 2010 vs. 2011 | ||||||||||||||||||||||||
Euro | Local Currency | Euro | Local Currency | |||||||||||||||||||||||||
| (in millions of euro, except percentages) | ||||||||||||||||||||||||||||
Revenues | 3,773 | 2,318 | 2,688 | (38.6 | )% | 15.0 | % | 15.9 | % | 11.2 | % | |||||||||||||||||
Service revenues | 2,841 | 2,073 | 2,435 | (27.0 | )% | 21.3 | % | 17.5 | % | 12.8 | % | |||||||||||||||||
OIBDA | 1,818 | 1,087 | 1,177 | (40.2 | )% | 10.4 | % | 8.2 | % | 4.4 | % | |||||||||||||||||
OIBDA Margin | 48.2 | % | 46.9 | % | 43.8 | % | (1.3) p. | p. | (1.3) p. | p. | (3.1) p. | p. | (3.1) p. | p. | ||||||||||||||
CAPEX | 423 | 293 | 372 | (30.7 | )% | 18.7 | % | 26.9 | % | 0.9 | % | |||||||||||||||||
| OpCF (OIBDA – CAPEX) | 1,395 | 794 | 805 | (43.1 | )% | 7.7 | % | 1.3 | % | 5.6 | % | |||||||||||||||||
Year ended December 31, | Percent Change (local currency) | |||||||||||||||||||
2009 | 2010 | 2011 | 2009 vs. 2010 | 2010 vs. 2011 | ||||||||||||||||
Traffic (millions of minutes) | 14,951 | 14,195 | 14,529 | (5.1 | )% | 2.4 | % | |||||||||||||
ARPU (in euro) | 21.2 | 14.3 | 16.7 | 26.3 | % | 24.8 | % | |||||||||||||
At December 31, | Percent Change | |||||||||||||||||||
2009 | 2010 | 2011 | 2009 vs. 2010 | 2010 vs. 2011 | ||||||||||||||||
| (in thousands) | ||||||||||||||||||||
Fixed telephony accesses(1) | 2,028.0 | 1,939.3 | 1,848.1 | (4.4 | )% | (4.7 | )% | |||||||||||||
Internet and data accesses | 807.2 | 836.0 | 887.4 | 3.6 | % | 6.1 | % | |||||||||||||
Narrowband accesses | 15.9 | 6.6 | 5.8 | (58.5 | )% | (12.3 | )% | |||||||||||||
Broadband accesses(2) | 783.2 | 821.5 | 878.1 | 4.9 | % | 6.9 | % | |||||||||||||
Other accesses(3) | 8.1 | 7.9 | 3.5 | (2.5 | )% | (55.9 | )% | |||||||||||||
Mobile accesses | 7,524.7 | 8,794.0 | 9,548.1 | 16.9 | % | 8.6 | % | |||||||||||||
Pre-pay accesses | 5,435.9 | 6,179.3 | 6,732.7 | 13.7 | % | 9.0 | % | |||||||||||||
Contract accesses | 2,088.8 | 2,614.7 | 2,815.4 | 25.2 | % | 7.7 | % | |||||||||||||
Pay TV accesses | 285.1 | 341.2 | 390.8 | 19.7 | % | 14.5 | % | |||||||||||||
Final clients accesses | 10,645.0 | 11,910.5 | 12,674.4 | 11.9 | % | 6.4 | % | |||||||||||||
Wholesale accesses | 8.9 | 5.3 | 5.2 | (40.4 | )% | (2.2 | )% | |||||||||||||
Total accesses | 10,653.8 | 11,915.8 | 12,679.6 | 11.8 | % | 6.4 | % | |||||||||||||
Year ended December 31, | Percent Change | |||||||||||||||||||||||||||
2009 | 2010 | 2011 | 2009 vs. 2010 | 2010 vs. 2011 | ||||||||||||||||||||||||
Euro | Local Currency | Euro | Local Currency | |||||||||||||||||||||||||
| (in millions of euro, except percentages) | ||||||||||||||||||||||||||||
Revenues | 1,831 | 2,197 | 2,310 | 20.0 | % | 4.3 | % | 5.2 | % | 4.8 | % | |||||||||||||||||
Mobile business | 1,010 | 1,266 | 1,399 | 25.4 | % | 9.0 | % | 10.5 | % | 10.1 | % | |||||||||||||||||
Service revenues | 918 | 1,175 | 1,283 | 28.0 | % | 11.2 | % | 9.2 | % | 8.9 | % | |||||||||||||||||
Fixed telephony business | 893 | 1,038 | 1,037 | 16.3 | % | 1.1 | % | (0.1 | )% | (0.4 | )% | |||||||||||||||||
OIBDA | 763 | 1,092 | 1,035 | 43.2 | % | 24.5 | % | (5.2 | )% | (5.5 | )% | |||||||||||||||||
OIBDA Margin | 41.7 | % | 49.7 | % | 44.8 | % | 8.0 p. | p. | 8.0 p. | p. | (4.9) p. | p. | (4.9) p. | p. | ||||||||||||||
CAPEX | 347 | 516 | 529 | 48.8 | % | 29.3 | % | 2.4 | % | 2.1 | % | |||||||||||||||||
| OpCF (OIBDA – CAPEX) | 416 | 576 | 507 | 38.5 | % | 20.4 | % | (12.0 | )% | (12.3 | )% | |||||||||||||||||
Year ended December 31, | Percent Change (local currency) | |||||||||||||||||||
2009 | 2010 | 2011 | 2009 vs. 2010 | 2010 vs. 2011 | ||||||||||||||||
Traffic (millions of minutes) | 10,521 | 11,791 | 12,218 | 12.1 | % | 3.6 | % | |||||||||||||
ARPU (in euro) | 10.7 | 12.1 | 11.6 | (1.8 | )% | (4.1 | )% | |||||||||||||
At December 31 | Percent Change | |||||||||||||||||||
2009 | 2010 | 2011 | 2009 vs. 2010 | 2010 vs. 2011 | ||||||||||||||||
| (in thousands) | ||||||||||||||||||||
Mobile accesses | 17,400.5 | 19,661.6 | 19,742.4 | 13.0 | % | 0.4 | % | |||||||||||||
Pre-pay accesses | 16,328.3 | 18,061.3 | 18,149.8 | 10.6 | % | 0.5 | % | |||||||||||||
Contract accesses | 1,072.1 | 1,600.2 | 1,592.6 | 49.3 | % | (0.5 | )% | |||||||||||||
Fixed wireless | 334.3 | 565.5 | 745.3 | 69.2 | % | 31.8 | % | |||||||||||||
Total accesses | 17,734.8 | 20,227.1 | 20,487.7 | 14.1 | % | 1.3 | % | |||||||||||||
Year ended December 31, | Percent Change | |||||||||||||||||||||||||||
2009 | 2010 | 2011 | 2009 vs. 2010 | 2010 vs. 2011 | ||||||||||||||||||||||||
Euro | Local Currency | Euro | Local Currency | |||||||||||||||||||||||||
| (in millions of euro, except percentages) | ||||||||||||||||||||||||||||
Revenues | 1,552 | 1,832 | 1,557 | 18.0 | % | 5.0 | % | (15.0 | )% | (12.3 | )% | |||||||||||||||||
Service revenues | 1,412 | 1,651 | 1,387 | 16.9 | % | 4.1 | % | (16.0 | )% | (13.3 | )% | |||||||||||||||||
OIBDA | 564 | 623 | 572 | 10.5 | % | (1.7 | )% | (8.2 | )% | (5.2 | )% | |||||||||||||||||
OIBDA Margin | 36.3 | % | 34.0 | % | 36.7 | % | (2.3) p. | p. | (2.3) p. | p. | 2.7 p. | p. | 2.7 p. | p. | ||||||||||||||
CAPEX | 251 | 1,580 | 471 | n.s. | n.s. | (70.2 | )% | (69.2 | )% | |||||||||||||||||||
| OpCF (OIBDA – CAPEX) | 313 | (957 | ) | 101 | c.s. | c.s. | c.s. | c.s. | ||||||||||||||||||||
At December 31, | Percent Change | |||||||||||||||||||
2009 | 2010 | 2011 | 2009 vs. 2010 | 2010 vs. 2011 | ||||||||||||||||
| (in thousands) | ||||||||||||||||||||
Fixed telephony accesses(1) | 2,971.2 | 2,871.2 | 2,848.4 | (3.4 | )% | (0.8 | )% | |||||||||||||
| Fixed wireless | 582.7 | 537.8 | 444.6 | (7.7 | )% | (17.3 | )% | |||||||||||||
Internet and data accesses | 800.6 | 885.4 | 1,120.4 | 10.6 | % | 26.5 | % | |||||||||||||
Narrowband accesses | 16.9 | 15.4 | 9.4 | (8.9 | )% | (38.7 | )% | |||||||||||||
Broadband accesses(2) | 768.0 | 850.8 | 1,090.6 | 10.8 | % | 28.2 | % | |||||||||||||
Other accesses(3) | 15.6 | 19.2 | 20.4 | 23.1 | % | 6.1 | % | |||||||||||||
Mobile accesses | 11,458.2 | 12,507.1 | 13,998.3 | 9.2 | % | 11.9 | % | |||||||||||||
Pre-pay accesses | 10,214.2 | 10,104.4 | 11,079.6 | (1.1 | )% | 9.7 | % | |||||||||||||
Contract accesses | 1,244.1 | 2,402.7 | 2,918.7 | 93.1 | % | 21.5 | % | |||||||||||||
Pay TV accesses | 686.3 | 690.6 | 799.0 | 0.6 | % | 15.7 | % | |||||||||||||
Final clients accesses | 15,916.3 | 16,954.3 | 18,766.1 | 6.5 | % | 10.7 | % | |||||||||||||
Wholesale accesses | 0.5 | 0.5 | 0.4 | n.a. | (3.7 | )% | ||||||||||||||
Total accesses | 15,916.8 | 16,954.8 | 18,766.6 | 6.5 | % | 10.7 | % | |||||||||||||
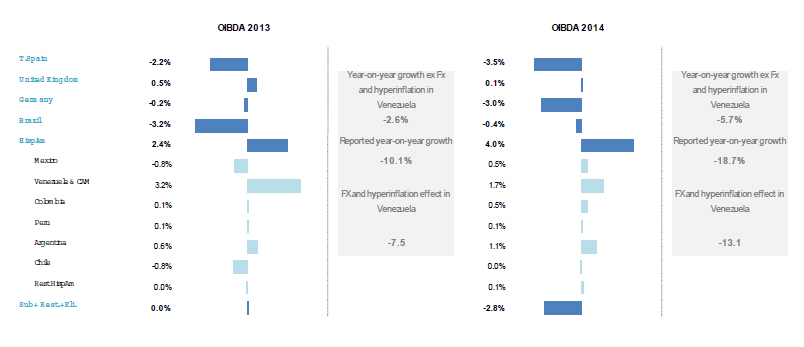
Year ended December 31, | Percent Change | |||||||||||||||||||||||||||
2009 | 2010 | 2011 | 2009 vs. 2010 | 2010 vs. 2011 | ||||||||||||||||||||||||
Euro | Local Currency | Euro | Local Currency | |||||||||||||||||||||||||
| (in millions of euro, except percentages) | ||||||||||||||||||||||||||||
Revenues | 1,716 | 1,960 | 2,030 | 14.2 | % | 2.0 | % | 3.6 | % | 6.1 | % | |||||||||||||||||
Mobile business | 840 | 1,001 | 1,088 | 19.2 | % | 6.4 | % | 8.7 | % | 11.3 | % | |||||||||||||||||
Service revenues | 695 | 854 | 923 | 22.9 | % | 9.7 | % | 8.1 | % | 10.6 | % | |||||||||||||||||
Fixed telephony business | 1,006 | 1,097 | 1,069 | 9.0 | % | (2.6) | % | (2.5 | )% | (0.2 | )% | |||||||||||||||||
OIBDA | 712 | 812 | 751 | 14.0 | % | 1.8 | % | (7.6 | )% | (5.3 | )% | |||||||||||||||||
OIBDA Margin | 41.5 | % | 41.4 | % | 37.0 | % | (0.1) p. | p. | (0.1) p. | p. | (4.4) p. | p. | (4.4) p. | p. | ||||||||||||||
CAPEX | 271 | 295 | 302 | 8.9 | % | (2.7 | )% | 2.3 | % | 4.8 | % | |||||||||||||||||
| OpCF (OIBDA – CAPEX) | 442 | 517 | 449 | 17.1 | % | 4.6 | % | (13.2 | )% | (11.1 | )% | |||||||||||||||||
At December 31, | Percent Change | |||||||||||||||||||
2009 | 2010 | 2011 | 2009 vs. 2010 | 2010 vs. 2011 | ||||||||||||||||
| (in thousands) | ||||||||||||||||||||
Fixed telephony accesses(1) | 1,639.8 | 1,586.9 | 1,480.6 | (3.2 | )% | (6.7 | )% | |||||||||||||
Internet and data accesses | 428.4 | 553.6 | 620.3 | 29.2 | % | 12.0 | % | |||||||||||||
Narrowband accesses | 5.9 | 5.6 | 7.9 | (5.1 | )% | 41.5 | % | |||||||||||||
Broadband accesses(2) | 420.3 | 548.0 | 612.3 | 30.4 | % | 11.7 | % | |||||||||||||
Other accesses(3) | 2.2 | 0.0 | 0.0 | n.a. | n.a. | |||||||||||||||
Mobile accesses | 8,964.6 | 10,004.5 | 11,391.1 | 11.6 | % | 13.9 | % | |||||||||||||
Pre-pay accesses | 7,203.2 | 7,679.1 | 8,626.8 | 6.6 | % | 12.3 | % | |||||||||||||
Contract accesses | 1,761.4 | 2,325.5 | 2,764.2 | 32.0 | % | 18.9 | % | |||||||||||||
Pay TV accesses | 127.2 | 205.3 | 255.0 | 61.4 | % | 24.2 | % | |||||||||||||
Final clients accesses | 11,159.9 | 12,350.3 | 13,746.9 | 10.7 | % | 11.3 | % | |||||||||||||
Wholesale accesses | 3.3 | 3.3 | 3.3 | n.a. | n.a. | |||||||||||||||
Total accesses | 11,163.2 | 12,353.6 | 13,750.2 | 10.7 | % | 11.3 | % | |||||||||||||
Year ended December 31, | Percent Change | |||||||||||||||||||||||||||
2009 | 2010 | 2011 | 2009 vs. 2010 | 2010 vs. 2011 | ||||||||||||||||||||||||
Euro | Local Currency | Euro | Local Currency | |||||||||||||||||||||||||
| (in millions of euro, except percentages) | ||||||||||||||||||||||||||||
Revenues | 1,269 | 1,529 | 1,561 | 20.5 | % | 1.3 | % | 2.1 | % | 4.5 | % | |||||||||||||||||
Mobile business | 685 | 872 | 916 | 27.4 | % | 7.1 | % | 5.0 | % | 7.5 | % | |||||||||||||||||
Service revenues | 647 | 814 | 851 | 25.8 | % | 5.7 | % | 4.5 | % | 6.9 | % | |||||||||||||||||
Fixed telephony business | 615 | 700 | 682 | 14.0 | % | (4.2 | )% | (2.7 | )% | (0.4 | )% | |||||||||||||||||
OIBDA | 397 | 484 | 540 | 22.1 | % | 2.6 | % | 11.5 | % | 14.2 | % | |||||||||||||||||
OIBDA Margin | 31.3 | % | 31.7 | % | 34.6 | % | 0.4 p. | p. | 0.4 p. | p. | 2.9 p. | p. | 2.9 p. | p. | ||||||||||||||
CAPEX | 316 | 334 | 405 | 5.9 | % | (11.0 | )% | 21.2 | % | 24.1 | % | |||||||||||||||||
| OpCF (OIBDA – CAPEX) | 81 | 150 | 135 | 84.9 | % | 55.4 | % | (9.9 | )% | (7.8 | )% | |||||||||||||||||
At December 31, | Percent Change | |||||||||||||||||||
2009 | 2010 | 2011 | 2009 vs. 2010 | 2010 vs. 2011 | ||||||||||||||||
| (in thousands) | ||||||||||||||||||||
Fixed telephony accesses(1) | 14,200.1 | 13,279.7 | 12,305.4 | (6.5 | )% | (7.3 | )% | |||||||||||||
Free ADSL | 14.7 | 38.1 | 34.4 | 159.2 | % | (9.6 | )% | |||||||||||||
Internet and data accesses | 5,722.5 | 5,879.8 | 5,710.9 | 2.7 | % | (2.9 | )% | |||||||||||||
Narrowband accesses | 219.5 | 136.1 | 84.4 | (38.0 | )% | (38.0 | )% | |||||||||||||
Broadband accesses(2) | 5,476.8 | 5,722.3 | 5,608.6 | 4.5 | % | (2.0 | )% | |||||||||||||
Other accesses(3) | 26.2 | 21.4 | 17.9 | (18.3 | )% | (16.6 | )% | |||||||||||||
Mobile accesses | 23,538.6 | 24,309.6 | 24,174.3 | 3.3 | % | (0.6 | )% | |||||||||||||
Pre-pay accesses | 8,204.5 | 7,919.8 | 7,359.4 | (3.5 | )% | (7.1 | )% | |||||||||||||
Contract accesses | 15,334.1 | 16,389.7 | 16,814.9 | 6.9 | % | 2.6 | % | |||||||||||||
Pay TV accesses | 703.0 | 788.2 | 833.2 | 12.1 | % | 5.7 | % | |||||||||||||
Final clients accesses | 44,164.2 | 44,257.4 | 43,023.8 | 0.2 | % | (2.8 | )% | |||||||||||||
AMLT(4) | 97.4 | 294.5 | 440.6 | n.s. | 49.6 | % | ||||||||||||||
Rented Bundles | 2,153.8 | 2,477.1 | 2,881.1 | 15.0 | % | 16.3 | % | |||||||||||||
Shared UL accesses | 447.7 | 264.0 | 205.0 | (41.0 | )% | (22.3 | )% | |||||||||||||
| Unbundled local loop accesses(5) | 1,706.1 | 2,213.1 | 2,676.1 | 29.7 | % | 20.9 | % | |||||||||||||
Wholesale ADSL | 359.0 | 561.3 | 709.6 | 56.4 | % | 26.4 | % | |||||||||||||
Other accesses(6) | 3.7 | 0.9 | 0.6 | (75.7 | )% | (29.2 | )% | |||||||||||||
Wholesale accesses | 2,614.0 | 3,333.8 | 4,031.9 | 27.5 | % | 20.9 | % | |||||||||||||
Total accesses | 46,778.2 | 47,591.2 | 47,055.7 | 1.7 | % | (1.1 | )% | |||||||||||||
| Market Share Mobile Business(1) | ||||||||||||
At December 31, | ||||||||||||
2009 | 2010 | 2011 | ||||||||||
Spain | 42.5 | % | 41.4 | % | 39.6 | % | ||||||
| Market Share Internet and Data Business(1) | ||||||||||||
At December 31, | ||||||||||||
| 2009 | 2010 | 2011 | ||||||||||
Spain | 55.6 | % | 53.4 | % | 49.7 | % | ||||||
Year ended December 31, | Percent Change | |||||||||||||||||||
2009 | 2010 | 2011 | 2009 vs. 2010 | 2010 vs. 2011 | ||||||||||||||||
| (in millions of euro, except percentages) | ||||||||||||||||||||
Revenues | 19,703 | 18,711 | 17,284 | (5.0 | )% | (7.6 | )% | |||||||||||||
Mobile business | 8,965 | 8,550 | 7,747 | (4.6 | )% | (9.4 | )% | |||||||||||||
Service revenues | 7,828 | 7,270 | 6,548 | (7.1 | )% | (9.9 | )% | |||||||||||||
Fixed telephony business | 12,167 | 11,397 | 10,631 | (6.3 | )% | (6.7 | )% | |||||||||||||
OIBDA | 9,757 | 8,520 | 5,072 | (12.7 | )% | (40.5 | )% | |||||||||||||
OIBDA Margin | 49.5 | % | 45.5 | % | 29.3 | % | (4.0 | ) p.p. | (16.2 | ) p.p. | ||||||||||
CAPEX | 1,863 | 2,021 | 2,914 | 8.4 | % | 44.2 | % | |||||||||||||
OpCF (OIBDA – CAPEX) | 7,894 | 6,499 | 2,158 | (17.7 | )% | (66.8 | )% | |||||||||||||
As of or for the year ended December 31, | Percent Change | |||||||||||||||||||
2009 | 2010 | 2011 | 2009 vs. 2010 | 2010 vs. 2011 | ||||||||||||||||
Traffic (millions of minutes) | 42,039 | 41,700 | 39,909 | (0.8 | )% | (4.3 | )% | |||||||||||||
ARPU (in euro) | 27.5 | 25.4 | 22.9 | (7.3 | )% | (10.2 | )% | |||||||||||||
| Pre-pay | 12.6 | 11.4 | 9.3 | (9.1 | )% | (18.7 | )% | |||||||||||||
| Contract | 36.5 | 32.6 | 29.1 | (10.7 | )% | (10.8 | )% | |||||||||||||
| APRU data (in euro) | 5.4 | 5.5 | 6.0 | 1.6 | % | 9.9 | % | |||||||||||||
| % of non-P2P SMS revenues over data revenues | 60.6 | % | 66.6 | % | 74.6 | % | 6.0 p. | p. | 7.9 p. | p. | ||||||||||
| Evolution of competitive position | |||||
| Mobile Market Share (1) | |||||
| Telefónica | 2012 | 2013 | 2014 | ||
| Spain | 36.2% | 33.9% | 31.2% | ||
| United Kingdom | 26.6% | 26.5% | 26.9% | ||
| Germany (2) | 16.7% | 16.9% | 36.9% | ||
| Brazil | 29.1% | 28.6% | 28.4% | ||
| Argentina | 29.7% | 31.4% | 31.3% | ||
| Chile | 38.8% | 38.7% | 39.4% | ||
| Peru | 60.0% | 59.7% | 55.2% | ||
| Colombia | 21.6% | 24.0% | 23.5% | ||
| Venezuela | 32.9% | 32.0% | 33.7% | ||
| Mexico | 19.2% | 18.5% | 20.8% | ||
| Central America | 29,7% | 31.8% | 31.5% | ||
| Ecuador | 29.3% | 32.6% | 27.9% | ||
| Uruguay | 37.4% | 35.8% | 34.4% | ||
| (1) Company estimation. | |||||
| (2)Germany in 2014 includes E-Plus. | |||||
At December 31, | Percent Change | |||||||||||||||||||
2009 | 2010 | 2011 | 2009 vs. 2010 | 2010 vs. 2011 | ||||||||||||||||
| (in thousands) | ||||||||||||||||||||
Fixed telephony accesses(1) | 1,827.5 | 3,672.4 | 3,853.1 | 101.0 | % | 4.9 | % | |||||||||||||
Internet and data accesses | 1,754.7 | 4,496.4 | 4,537.4 | 156.2 | % | 0.9 | % | |||||||||||||
Narrowband accesses | 137.3 | 503.2 | 435.4 | n.s. | (13.5 | )% | ||||||||||||||
Broadband accesses | 1,589.1 | 3,964.9 | 4,071.8 | 149.5 | % | 2.7 | % | |||||||||||||
Other accesses(2) | 28.3 | 28.3 | 30.3 | 0.0 | % | 6.9 | % | |||||||||||||
Mobile accesses | 44,095.0 | 46,675.5 | 48,276.4 | 5.9 | % | 3.4 | % | |||||||||||||
Pre-pay accesses | 23,098.5 | 23,994.9 | 23,800.3 | 3.9 | % | (0.8 | )% | |||||||||||||
Contract accesses | 20,996.5 | 22,680.6 | 24,476.1 | 8.0 | % | 7.9 | % | |||||||||||||
Pay TV accesses | 137.6 | 206.4 | 219.0 | 50.0 | % | 6.1 | % | |||||||||||||
Final clients accesses | 47,814.9 | 55,050.6 | 56,885.9 | 15.1 | % | 3.3 | % | |||||||||||||
Wholesale accesses(3) | 1,425.2 | 1,247.7 | 1,213.2 | (12.5 | )% | (2.8 | )% | |||||||||||||
Total accesses | 49,240.1 | 56,298.3 | 58,099.1 | 14.3 | % | 3.2 | % | |||||||||||||
| Evolution of competitive position | |||||
| DSL Market Share (1) | |||||
| Telefónica | 2012 | 2013 | 2014 | ||
| Spain | 48.8% | 47.4% | 45.1% | ||
| Brazil | 18.8% | 16.3% | 16.4% | ||
| Argentina | 30.9% | 30.5% | 30.3% | ||
| Chile | 41.2% | 40.2% | 39.8% | ||
| Colombia | 18.1% | 18.7% | 18.8% | ||
| (1) Company estimation. | |||||
Segments Discussion
| Market Share Mobile Business(1) | ||||||||||||
At December 31, | ||||||||||||
2009 | 2010 | 2011 | ||||||||||
United Kingdom | 26.2 | % | 26.6 | % | 26.6 | % | ||||||
Germany | 14.6 | % | 15.7 | % | 16.1 | % | ||||||
Czech Republic | 39.2 | % | 38.5 | % | 38.0 | % | ||||||
Ireland | 32.3 | % | 32.0 | % | 33.2 | % | ||||||
Slovakia | 9.8 | % | 14.7 | % | 18.3 | % | ||||||
| ACCESSES | |||||
| Thousands of accesses | 2012 | 2013 | 2014 | %YoY 12/13 | %YoY 13/14 |
| Fixed telephony accesses (1) | 11,723.0 | 11,089.8 | 10,447.8 | (5.4%) | (5.8%) |
| Naked ADSL | 25.0 | 22.8 | 21.3 | (9.1%) | (6.6%) |
| Internet and data accesses | 5,779.3 | 5,899.0 | 5,928.7 | 2.1% | 0.5% |
| Narrowband | 54.0 | 38.5 | 30.9 | (28.7%) | (19.6%) |
| Broadband (2) | 5,709.3 | 5,846.8 | 5,885.9 | 2.4% | 0.7% |
| Other (3) | 16.0 | 13.7 | 11.9 | (14.2%) | (13.7%) |
| Mobile accesses | 20,608.7 | 19,002.1 | 17,575.4 | (7.8%) | (7.5%) |
| Prepay | 5,180.5 | 4,262.7 | 3,328.1 | (17.7%) | (21.9%) |
| Contract (4) | 15,428.2 | 14,739.3 | 14,247.3 | (4.5%) | (3.3%) |
| Pay-TV (5) | 710.7 | 672.7 | 1,884.7 | (5.4%) | 180.2% |
| WLR (6) | 481.2 | 525.8 | 570.6 | 9.3% | 8.5% |
| Unbundled loops | 3,262.0 | 3,787.1 | 4,087.3 | 16.1% | 7.9% |
| Shared ULL | 183.5 | 130.6 | 94.1 | (28.9%) | (27.9%) |
| Full ULL (7) | 3,078.5 | 3,656.5 | 3,993.3 | 18.8% | 9.2% |
| Wholesale ADSL | 652.3 | 676.8 | 707.8 | 3.8% | 4.6% |
| Other (8) | 0.5 | 0.4 | 0.3 | (23.9%) | (28.5%) |
| Final Clients Accesses | 38,821.7 | 36,663.6 | 35,836.7 | (5.6%) | (2.3%) |
| Wholesale Accesses | 4,396.0 | 4,990.1 | 5,366.0 | 13.5% | 7.5% |
| Total Accesses | 43,217.8 | 41,653.6 | 41,202.7 | (3.6%) | (1.1%) |
| Notes: | |||||
| (1) PSTN (including public use telephony) x1; ISDN basic access x1; ISDN primary access; 2/6 digital access x30. Company’s accesses for internal use included. Includes VoIP and Naked ADSL. | |||||
| (2) Includes ADSL, satellite, optical fiber, cable modem and broadband circuits. | |||||
| (3) Leased lines. | |||||
| (4) In the first quarter of 2014, 569 thousand M2M inactive accesses were disconnected. | |||||
| (5) Since the second quarter of 2014, Pay-TV accesses include 131 thousand “TV Mini” customers. | |||||
| (6) Wholesale Line Rental. | |||||
(7) Includes naked shared loops. (8) Wholesale circuits. | |||||
By the end of 2014 the Company became a leader of the Pay-TV market with 1.9 million customers (almost three times higher than in 2013), more than 1 million 100 Mb fiber customers (doubling the figure for 2013) and a mobile contract base showing positive net adds at year-end for the first time since 2011 (excluding the disconnection of 569 thousand M2M accesses during the first quarter of the year).
Telefónica Europe represented 24.7% of consolidated revenues and 20.9% of consolidated OBIDA in 2011. It contributed 0.6 percentage pointsSpain improved its commercial offer throughout the year, offering extra value to the Group’s OIBDA growth excluding foreign exchange rate effects, with customer. Notably, it launched “Movistar Fusión TV” in April as part of the convergent “Fusión” portfolio, increased the volume of its mobile data and the flexibility to purchase content bundles during the third quarter and launched “Movistar Series” in December, an “a 1.1 percentage point contribution from Germany. In terms of revenues, however, Telefónica Europe was responsiblela carta” and multiscreen TV service offering certain TV series, for 7 euros a 0.3 percentage point reduction in overall growth due to 2011 declines in revenuesmonth (including VAT), just one day after their premiers in the United Kingdom,States. In addition, it improved its mobile-only contract offering by launching the Czech Republicnew “VIVE” portfolio in October, which was renewed in February 2015, increasing data volume and Ireland, which countries were impacted considerably by interconnection price cuts.
introducing new value-added services.
49
Percent Change | ||||||||||||||||||||||||||||
Year ended December 31, | 2009 vs. 2010 | 2010 vs. 2011 | ||||||||||||||||||||||||||
2009 | 2010 | 2011 | Reported | Excl. FX(1) | Reported | Excl. FX(1) | ||||||||||||||||||||||
| (in millions of euro, except percentages) | ||||||||||||||||||||||||||||
Revenues | 13,954 | 15,724 | 15,524 | 12.7 | % | 10.1 | % | (1.3 | )% | (1.0 | )% | |||||||||||||||||
OIBDA | 3,999 | 4,080 | 4,233 | 2.0 | % | (0.6 | )% | 3.8 | % | 3.7 | % | |||||||||||||||||
Margin OIBDA | 28.7 | % | 25.9 | % | 27.3 | % | (2.7) p. | p. | (2.6) p. | p. | 1.3 p. | p. | 1.2 p. | p. | ||||||||||||||
| Depreciation and amortization | (2,988 | ) | (3,201 | ) | (3,117 | ) | 7.1 | % | 4.4 | % | (2.6 | )% | (2.5 | )% | ||||||||||||||
Operating income | 1,011 | 879 | 1,116 | (13.1 | )% | (16.8 | )% | 27.0 | % | 26.5 | % | |||||||||||||||||
By year-end, fiber accesses totaled 1.3 million (more than doubling the figure for 2013) and accounted for 22% of total data revenues. Total data revenues increased 10.9%the broadband customer base, and represented 42% of mobile service revenues (an increase of 6 percentage pointscustomers with 100 Mb fiber speed, who have higher ARPU (currently a 10 euros price premium) and lower churn (0.5 times) compared with 2010).DSL customers, exceeded one million.
The intense pace of fiber deployment reached 10.3 million premises passed at the end of the year.
Total mobile accesses stood at 17.6 million, down 8% compared with year-end 2013, affected by the disconnection of 569 thousand inactive M2M mobile contract accesses in the first quarter of the year.
The contract base added 77 thousand net additions in 2014 (excluding the impact of the disconnection of 569 thousand inactive M2M mobile contract accesses), growing for the first time since 2011 (+0.5% year-on-year), mainly driven by churn reduction (-0.2 p.p. year-on-year), with a lower loss of customers due to portability (-30% year-on-year), and the growth of gross additions (+10% year-on-year).
Smartphone penetration stood at 61% of the mobile voice base (+10 p.p. compared to year-end 2013) and significantly boosted data traffic growth to 28% year-on-year in 2014. LTE network rollout continued to progress well and coverage reached 58% of the population at the end of 2014.
| CONSOLIDATED RESULTS | |||||
| Millions of euros | |||||
| TELEFÓNICA SPAIN | 2012 | 2013 | 2014 | %YoY 12/13 | %YoY 13/14 |
| Revenues | 14,996 | 12,959 | 12,023 | (13.6%) | (7.2%) |
| Wireless Business | 6,464 | 5,121 | 4,556 | (20.8%) | (11.0%) |
| Mobile service revenues | 5,453 | 4,580 | 3,888 | (16.0%) | (15.1%) |
| Wireline Business | 9,541 | 8,861 | 8,543 | (7.1%) | (3.6%) |
| OIBDA | 6,815 | 6,340 | 5,671 | (7.0%) | (10.6%) |
| OIBDA Margin | 45.4% | 48.9% | 47.2% | 3.5 p.p. | (1.8 p.p.) |
| Depreciation and amortization | (2,063) | (1,903) | (1,805) | (7.7%) | (5.1%) |
| Operating Income (OI) | 4,752 | 4,437 | 3,866 | (6.6%) | (12.9%) |
| CapEx | 1,692 | 1,529 | 1,732 | (9.6%) | 13.3% |
| OpCF (OIBDA-CapEx) | 5,123 | 4,811 | 3,939 | (6.1%) | (18.1%) |
2014 Results
Revenues totaled 12,023 million euros in 20112014 (-7.2% year-on-year).We consider revenue breakdown to €11,509 million. In 2010 expenses were impacted by restructuring expenses, mainly relatedbe increasingly less relevant given the high penetration level of our convergent offer. However, we continue to personnel reorganization. Supplies expenses decreased mainlyreport revenue separately for information purposes. Fixed business revenues fell 3.6% year-on-year in 2014, due to lower interconnection costsaccess and voice revenues, partially offset by higher broadband and new services revenues, mainly TV and IT. Mobile business revenues fell 11.0% year-on-year in the year, offsetting the increased volume of smartphone sales. Personnel expenses decreased, impacted by personnel restructuring expenses accrued in 2010. Other expenses decreased mainly2014 due to lower customer care expenses.
Mobile ARPU is becoming less representative of the Group’s business performance, owing to its significant dependence on the allocation of revenue in convergent offers. In 2014 mobile ARPU declined by 10.1% year-on-year, impacted by lower prices in the new tariff portfolio.
| TELEFÓNICA SPAIN | 2012 | 2013 | 2014 | %YoY 12/13 | %YoY 13/14 |
| Voice Traffic (Million minutes) | 36,382 | 34,428 | 35,600 | (5.4%) | 3.4% |
| ARPU (EUR) (1) | 20.6 | 17.7 | 15.9 | (14.3%) | (10.1%) |
| Prepay | 8.8 | 7.3 | 6.2 | (17.8%) | (14.5%) |
| Contract (2) | 28.6 | 24.0 | 20.6 | (16.2%) | (14.2%) |
| Data ARPU (EUR) (1) | 6.5 | 6.8 | 7.0 | 4.4% | 3.6% |
| % non-SMS over data revenues | 85.2% | 92.1% | 95.0% | 7.0 p.p. | 2.8 p.p. |
| Notes: | |||||
| (1) Impacted by the disconnection of 569 thousand inactive M2M accesses in the first quarter of 2014. | |||||
| (2) Excludes M2M. | |||||
Total expenses, which include supplies, personnel expenses and other expenses (mainly subcontract expenses and others) but do not include depreciation and amortization expenses, amounted to 6,987 million euros in 2014, down 1.1% year-on-year, reflecting the control of costs and the transformation efficiency initiatives implemented several years ago. The breakdown by components is as follows:
| · | Supplies (2,592 million euros) increased 4.2% year-on-year in 2014, mainly reflecting higher spending on handsets and TV content. |
| · | Personnel expenses(2,139 million euros) increased 1.2% year-on-year in 2014, primarily due to the end of the redundancy program in 2013 and the Company’s contribution to its pension plan in July 2014, following its temporary freeze from April 2013 to July 2014. At December 31, 2014, Telefónica Spain’s headcount totaled 30,020 employees compared to 29,764 at December 31, 2013. |
| · | Other expenses (2,256 million euros) fell by 8.5% year-on-year in 2014, reflecting the savings resulting from the simplification processes, redefinition of distribution channels and in-sourcing of activities, which more than offset the expenses related to the increased commercial effort in advertising and handset sales. |
OIBDA amounted to 5,671 million euros in 2014 (-10.6% year-on-year), affected by the drop in revenues despite the higher commercial effort by Telefónica Europe’s total expenses increased partially in 2010 compared with 2009, dueSpain to operating expenses related tocapture the consolidation of HanseNetgrowth and non-recurring restructuring expenses related to personal reorganizationvalue opportunity in the second halfmarket. Excluding the sale of non-strategic towers for 70 million euros in 2013 and 191 million in 2014, OIBDA fell 12.6% year-on-year in 2014.
2013 Results
In 2013 revenues stood at 12,959 million euros (-13.6% year-on-year), partly affected by the year.
At December 31, | Percent Change | |||||||||||||||||||
2009 | 2010 | 2011 | 2009 vs. 2010 | 2010 vs. 2011 | ||||||||||||||||
| (in thousands) | ||||||||||||||||||||
Fixed telephony accesses(1) | 0.0 | 86.7 | 216.1 | n.a. | n.s. | |||||||||||||||
Internet and data accesses | 591.5 | 671.6 | 620.3 | 13.5 | % | (7.6 | )% | |||||||||||||
Broadband accesses | 591.5 | 671.6 | 620.3 | 13.5 | % | (7.6 | )% | |||||||||||||
| Mobile accesses | 21,299.3 | 22,211.5 | 22,167.5 | 4.3 | % | (0.2 | )% | |||||||||||||
Pre-pay accesses | 11,740.3 | 11,712.3 | 11,227.3 | (0.2 | )% | (4.1 | )% | |||||||||||||
Contract accesses | 9,558.9 | 10,499.2 | 10,940.3 | 9.8 | % | 4.2 | % | |||||||||||||
Final clients accesses | 21,890.8 | 22,969.8 | 23,003.9 | 4.9 | % | 0.1 | % | |||||||||||||
Wholesale accesses (2) | 0.0 | 0.0 | 26.7 | n.a. | n.a. | |||||||||||||||
Total accesses | 21,890.8 | 22,969.8 | 23,030.7 | 4.9 | % | 0.3 | % | |||||||||||||
| Excluding handset sales, revenues in 2013 amounted to 12,417 million euros (-11.2% year-on-year). Excluding the impact of regulation (which imposed interconnection and |
| Revenues from the fixed business fell 7.1% year-on-year in 2013, due to lower access and voice revenues, primarily driven by |
| · | Mobile revenues fell by 20.8% year-on-year in 2013. Mobile service revenue declined by 16.0% year-on-year in 2013 explained by ARPU decline. |
51
Year ended December 31, | Percent Change | |||||||||||||||||||||||||||
2009 | 2010 | 2011 | 2009 vs. 2010 | 2010 vs. 2011 | ||||||||||||||||||||||||
Euro | Local Currency | Euro | Local Currency | |||||||||||||||||||||||||
| (in millions of euro, except percentages) | ||||||||||||||||||||||||||||
Revenues | 6,512 | 7,201 | 6,926 | 10.6 | % | 6.5 | % | (3.8 | )% | (2.7 | )% | |||||||||||||||||
Service revenues | 5,936 | 6,513 | 6,198 | 9.7 | % | 5.6 | % | (4.8 | )% | (3.7 | )% | |||||||||||||||||
OIBDA | 1,680 | 1,830 | 1,836 | 9.0 | % | 4.9 | % | 0.3 | % | 1.5 | % | |||||||||||||||||
OIBDA Margin | 25.8 | % | 25.4 | % | 26.5 | % | (0.4 | ) p.p. | (0.4 | ) p.p. | 1.1 p. | p. | 1.1 p. | p. | ||||||||||||||
CAPEX | 602 | 717 | 732 | 19.1 | % | 14.7 | % | 2.0 | % | 3.3 | % | |||||||||||||||||
| OpCF (OIBDA �� CAPEX) | 1,078 | 1,113 | 1,104 | 3.3 | % | (0.5 | )% | (0.8 | )% | 0.3 | % | |||||||||||||||||
| · | Telefónica Spain revenue reduction is mainly due to ARPU reductions across services reflecting lower prices of the renewed portfolio and lower customers consumption, and also, as a consequence of declines in accesses (-4% year-on-year), as a consequence of the high competitive pressure in the market. |
Total ARPU decreased 6.6%expenses, or 3.5% excluding the interconnection price cuts. Voice ARPU decreased 14.6% (or decreased 9.2% excluding interconnection price cuts) becausewhich include supplies, personnel expenses and other expenses (mainly subcontract expenses and others) but do not include depreciation and amortization expenses, amounted to 7,064 million euros in 2013, 18.2% less than in 2012, mainly due to a reduction in commercial costs, mainly as a result of the migrationelimination of traffichandset subsidies and other savings arising from minutes bundles, the various efficiency improvement programs. The breakdown by components is as follows:
| · | Supplies declined 23.9% year-on-year in 2013 to 2,486 million euros, mainly due to lower handset costs as a consequence of the new commercial policy and lower mobile interconnection costs. |
| · | Personnel expenses amounted to 2,113 million euros in 2013, down 6.1% year-on-year as a result of the savings derived from the redundancy program and from the temporary removal of Telefónica Spain’s contribution to the pension plan beginning in April 2013. At December 31, 2013, Telefónica Spain’s headcount totaled 29,764 employees, compared to 31,434 at December 31, 2012. |
| · | Other expenses amounted to 2,464 million euros in 2013, down by 20.9% compared to 2012 due to lower commercial expenses and the savings from Telefónica Spain’s simplification process, as well as the redefinition of the distribution channel and call centers and the in-sourcing of activities. |
OIBDA stood at 6,340 million euros in 2013, showing a year-on-year decline of 7.0%. The OIBDA decrease is explained by the revenue decrease, partially offset by costs reduction, especially the continued reduction in rates amid stiff competitioncommercial costs after the handset subsidy removal policy, and other savings arising from several efficiency programs (such as simplification of processes, distribution channel and call centers redefinition, internalization of activities, savings from the adverse macroeconomic climate. Data ARPU growth held steady at 5.1%, with more than 80%restructuring personnel plan and temporary cancelation of contract customers with data tariffs opting for limited data usage.the corporate contribution to pension plans).
As of or for the year ended December 31, | Percent Change (local currency) | |||||||||||||||||||
2009 | 2010 | 2011 | 2009 vs. 2010 | 2010 vs. 2011 | ||||||||||||||||
Traffic (millions of minutes) | 53,856 | 58,143 | 52,250 | 8.0 | % | (10.1 | )% | |||||||||||||
ARPU (in euro) | 24.7 | 25.1 | 23.2 | (2.1 | )% | (6.6 | )% | |||||||||||||
Pre-pay | 12.3 | 11.8 | 10.3 | (8.2 | )% | (11.4 | )% | |||||||||||||
Contract | 40.8 | 40.6 | 37.1 | (4.2 | )% | (7.6 | )% | |||||||||||||
| ARPU data (in euro) | 9.3 | 10.1 | 10.5 | 5.3 | % | 5.1 | % | |||||||||||||
| % of non-P2P SMS revenues over data revenues | 27.4 | % | 32.8 | % | 40.5 | % | 5.4 p. | p. | 7.7 p. | p. | ||||||||||
| ACCESSES | |||||
| Thousands of accesses | 2012 | 2013 | 2014 | %YoY 12/13 | %YoY 13/14 |
| Fixed telephony accesses (1) | 377.4 | 208.2 | 228.0 | (44.8%) | 9.5% |
| Internet and data accesses | 560.1 | 14.8 | 19.2 | (97.4%) | 29.8% |
| Broadband | 560.1 | 14.8 | 19.2 | (97.4%) | 29.8% |
| Mobile accesses | 22,864.2 | 23,649.0 | 24,479.1 | 3.4% | 3.5% |
| Prepay | 10,962.9 | 10,764.7 | 10,761.2 | (1.8%) | (0.0%) |
| Contract | 11,901.3 | 12,884.3 | 13,717.9 | 8.3% | 6.5% |
| Final Clients Accesses | 23,801.7 | 23,872.0 | 24,726.4 | 0.3% | 3.6% |
| Wholesale Accesses (2) | 40.5 | 31.6 | - | (22.1%) | - |
| Total Accesses | 23,842.2 | 23,903.6 | 24,726.4 | 0.3% | 3.4% |
| Notes: | |||||
| (1) PSTN (including public use telephony) x1; ISDN basic access x1; ISDN primary access; 2/6 digital access x30. Company’s accesses for internal use included. Includes VoIP and Naked ADSL. | |||||
| (2) From the first quarter of 2014, the company stopped offering a wholesale service. | |||||
52
At December 31, | Percent Change | |||||||||||||||||||
2009 | 2010 | 2011 | 2009 vs. 2010 | 2010 vs. 2011 | ||||||||||||||||
| (in thousands) | ||||||||||||||||||||
Fixed telephony accesses(1) | 0.0 | 1,916.4 | 2,055.1 | n.a. | 7.2 | % | ||||||||||||||
Internet and data accesses | 285.1 | 2,914.7 | 2,922.3 | n.s. | 0.3 | % | ||||||||||||||
Narrowband accesses | 0.0 | 385.7 | 334.6 | n.a. | (13.2 | )% | ||||||||||||||
Broadband accesses | 285.1 | 2,529.1 | 2,587.7 | n.s. | 2.3 | % | ||||||||||||||
Mobile accesses | 15,507.4 | 17,049.2 | 18,380.1 | 9.9 | % | 7.8 | % | |||||||||||||
Pre-pay accesses | 7,807.0 | 8,795.2 | 9,144.5 | 12.7 | % | 4.0 | % | |||||||||||||
Contract accesses | 7,700.4 | 8,254.0 | 9,235.7 | 7.2 | % | 11.9 | % | |||||||||||||
Pay TV accesses | 0.0 | 77.2 | 83.3 | n.a. | 7.9 | % | ||||||||||||||
Final clients accesses | 15,792.5 | 21,957.5 | 23,440.9 | 39.0 | % | 6.8 | % | |||||||||||||
Wholesale accesses(2) | 1,316.8 | 1,116.5 | 1,042.4 | (15.2 | )% | (6.6 | )% | |||||||||||||
Total accesses | 17,109.3 | 23,074.0 | 24,483.2 | 34.9 | % | 6.1 | % | |||||||||||||
Telefónica Germany performed welland the Hutchison Whampoa Group agreed to commence exclusive negotiations for a possible Whampoa Group purchase of O2 UK on January 23, 2015.
Total accesses were 24.7 million at year-end 2014 (+3.4% year-on-year). Mobile accesses increased by 3.5% year-on-year to 24.5 million by year-end 2014, boosted by the continued expansion of contract customers and a stable pre-pay segment. In this way, the proportion of contract customers rose 2 percentage points year-on-year to account for 56% of total mobile accesses. Contract net additions totaled 0.8 million customers in 2011, bolstering its competitive position2014 as a result of good performance, despite fierce competition. Contract customer churn improved by 0.1 percentage points year-on-year in 2014 to 1.0%. Smartphone penetration (as a percentage of mobile internet data tariff over total mobile customers) rose by 3 percentage points with respect to year-end, to 52%.
Telefónica United Kingdom continues the German market with a higher market share and seizing commercial momentum with its “O2 Blue” rates, its “MyHandy” offer, activity with partners and progress toward unlocking the valuedeployment of its data business.
Year ended December 31, | Percent Change | |||||||||||||||||||
2009 | 2010 | 2011 | 2009 vs. 2010 | 2010 vs. 2011 | ||||||||||||||||
| (in millions of euro, except percentages) | ||||||||||||||||||||
Revenues | 3,746 | 4,826 | 5,035 | 28.9 | % | 4.3 | % | |||||||||||||
Service revenues | 2,861 | 2,932 | 2,946 | 2.5 | % | 0.5 | % | |||||||||||||
OIBDA | 918 | 944 | 1,219 | 2.8 | % | 29.1 | % | |||||||||||||
OIBDA Margin | 24.5 | % | 19.6 | % | 24.2 | % | (4.9) p. | p. | 4.7 p. | p. | ||||||||||
CAPEX | 796 | 2,057 | 558 | n. | a. | (72.9 | )% | |||||||||||||
| OpCF (OIBDA – CAPEX) | 122 | (1,113 | ) | 662 | c. | s. | (159.5 | )% | ||||||||||||
| CONSOLIDATED RESULTS | |||||||
| Millions of euros | %YoY 12/13 | %YoY 13/14 | |||||
| TELEFÓNICA UNITED KINGDOM | 2012 | 2013 | 2014 | € | LC | € | LC |
| Revenues | 7,042 | 6,692 | 7,062 | (5.0%) | (0.5%) | 5.5% | 0.2% |
| Mobile service revenues | 6,060 | 5,461 | 5,397 | (9.9%) | (5.7%) | (1.2%) | (6.2%) |
| OIBDA | 1,602 | 1,637 | 1,744 | 2.2% | 7.0% | 6.5% | 1.1% |
| OIBDA Margin | 22.7% | 24.5% | 24.7% | 1.7 p.p. | 1.7 p.p. | 0.2 p.p. | 0.2 p.p. |
| Depreciation and amortization | (995) | (1,016) | (1,121) | 2.1% | 6.9% | 10.3% | 4.7% |
| Operating Income (OI) | 607 | 621 | 623 | 2.3% | 7.2% | 0.3% | (4.7%) |
| CapEx | 748 | 1,385 | 755 | 85.3% | 94.0% | (45.5%) | (48.3%) |
| OpCF (OIBDA-CapEx) | 854 | 252 | 989 | (70.5%) | (69.1%) | n.m. | n.m. |
2014 Results
| · | Mobile service revenues reached 5,397 million euros, down 1.2% year-on-year in reported terms (-6.2% excluding foreign exchange rate effects) negatively affected by the “Refresh” model, mobile termination rate cuts and roaming regulation. Excluding the impacts of, mobile termination rate cuts, (+0.4 p.p.), roaming regulation (+0.5 p.p.) and the new commercial model “Refresh” (+6.5 p.p.), mobile service revenues would have increased by 1.3% year-on-year as a result of the growth in mobile accesses and price stabilization. The “Refresh” model translates into more revenue from handset sales (even where the number of units sold are not increased), since handset sales are fully recognized upfront. |
| · | Non-SMS data revenues rose 23.9% year-on-year (+17.6% year-on-year excluding foreign exchange rate effects), accounting for 57.9% of data revenues (+8.0 p.p. year-on-year). |
| · | Data revenue recorded an increase of 1.5% year-on-year in 2014. Data revenue in 2014 accounted for 57% of mobile service revenue, 4 percentage points more than 2013. |
ARPU fell by 3.9% year-on-year in 2011 to €5,035 million. Revenues for 2010 included2014 (-8.8% excluding the resultseffect of HanseNet from mid-February 2010, while 2011 revenues included such results forforeign exchange rates), adversely affected by the full year.“Refresh” model. Excluding this impact, revenuesthe effect of regulation and the “Refresh” model (+7.2 p.p.), ARPU would have decreased by 1.6% year-on-year. Voice ARPU fell 12.5% in reported terms (-16.9% excluding the effect of foreign exchange rates). Data ARPU increased by 1.6% during 2011.3.6% in reported terms (-1.6% year-on-year excluding the effect of foreign exchange rates).
| TELEFÓNICA UNITED KINGDOM | 2012 | 2013 | 2014 | %YoY LC 12/13 | %YoY LC 13/14 |
| Voice Traffic (Million minutes) | 48,250 | 48,479 | 49,096 | 0.5% | 1.3% |
| ARPU (EUR) | 22.5 | 19.6 | 18.8 | (8.8%) | (8.8%) |
| Prepay | 9.6 | 7.7 | 7.3 | (16.0%) | (9.3%) |
| Contract (1) | 40.3 | 35.0 | 33.1 | (9.1%) | (10.1%) |
| Data ARPU (EUR) | 11.4 | 10.4 | 10.8 | (4.5%) | (1.6%) |
| % non-SMS over data revenues | 46.8% | 50.0% | 57.9% | 3.2 p.p. | 8.0 p.p. |
| Notes: | |||||
| (1) Excludes M2M. | |||||
Mobile services revenues performed well, especially at the end of 2011, impactedvoice traffic in 2014 remained stable compared to 2013, while data traffic increased by the interconnection price cut. Excluding this effect, mobile services increased 7.1%72%, driven by growth in the customer base and trends in ARPU. Non-P2P SMS data revenue growth of 49% was a key driver of revenues, leveraging the increasinghigher penetration of smartphones and the adoption of limited use data rates.
As of or for the year ended December 31, | Percent Change | |||||||||||||||||||
2009 | 2010 | 2011 | 2009 vs. 2010 | 2010 vs. 2011 | ||||||||||||||||
Traffic (millions of minutes) | 23,257 | 25,543 | 27,993 | 9.8 | % | 9.6 | % | |||||||||||||
ARPU (in euro) | 15.6 | 14.8 | 13.6 | (5.5 | )% | (7.8 | )% | |||||||||||||
| Pre-pay | 5.7 | 6.1 | 5.7 | 7.8 | % | (7.0 | )% | |||||||||||||
Contract | 26.1 | 23.8 | 21.9 | (8.8 | )% | (8.4 | )% | |||||||||||||
APRU data (in euro) | 4.7 | 5.0 | 5.6 | 6.1 | % | 13.2 | % | |||||||||||||
| % of non-P2P SMS revenues over data revenues | 36.7 | % | 41.9 | % | 50.4 | % | 5.2 p. | p. | 8.5 p. | p. | ||||||||||
usage per customer.
54
At December 31, | Percent Change | |||||||||||||||||||
2009 | 2010 | 2011 | 2009 vs. 2010 | 2010 vs. 2011 | ||||||||||||||||
| (in thousands) | ||||||||||||||||||||
Fixed telephony accesses(1) | 1,770.6 | 1,669.2 | 1,581.9 | (5.7 | )% | (5.2 | )% | |||||||||||||
Free ADSL accesses | 62.1 | 163.7 | 237.4 | 163.6 | % | 45.0 | % | |||||||||||||
VOIP accesses | 16.9 | 38.6 | 52.1 | 128.4 | % | 35.0 | % | |||||||||||||
Internet and data accesses | 848.7 | 898.8 | 970.6 | 5.9 | % | 8.0 | % | |||||||||||||
Narrowband accesses | 137.3 | 117.5 | 100.7 | (14.4 | )% | (14.3 | )% | |||||||||||||
Broadband accesses | 683.1 | 753.0 | 839.6 | 10.2 | % | 11.5 | % | |||||||||||||
Other accesses (2) | 28.3 | 28.3 | 30.3 | 0.0 | % | 6.9 | % | |||||||||||||
| Mobile accesses | 4,944.6 | 4,838.6 | 4,941.7 | (2.1 | )% | 2.1 | % | |||||||||||||
Pre-pay accesses | 2,130.2 | 1,975.0 | 1,892.4 | (7.3 | )% | (4.2 | )% | |||||||||||||
Contract accesses | 2,814.4 | 2,863.6 | 3,049.3 | 1.7 | % | 6.5 | % | |||||||||||||
Pay TV accesses | 137.6 | 129.2 | 135.6 | (6.1 | )% | 5.0 | % | |||||||||||||
Final clients accesses | 7,701.5 | 7,535.8 | 7.629.8 | (2.2 | )% | 1.2 | % | |||||||||||||
Wholesale accesses | 108.4 | 131.2 | 144.1 | 21.0 | % | 9.8 | % | |||||||||||||
Total accesses | 7,810.0 | 7,667.0 | 7,773.9 | (1.8 | )% | 1.4 | % | |||||||||||||
Supplies increased by 3.4% year-on-year in 2014 in reported terms to 3,520 million euros, impacted by the foreign exchange rate (+5.2 p.p.). Excluding this impact, supplies would have decreased by 1.8%, mainly due to lower interconnection costs. |
Personnel expenses were down by 15.3% year-on-year in 2014, amounting to 460 million euros, impacted by the exchange rate (+4.3 p.p.). Excluding this impact, personnel costs would have been down by 19.6%, as a result of the outsourcing of the customer service facility. Personnel expenses were also affected by restructuring costs (5 million euros in 2014 and 48 million euros in 2013). |
| · | Other expenses were 1,521 million euros in 2014, a 16.1% year-on-year increase in reported terms, with an exchange rate impact of 5.9 percentage points. Excluding this impact, other expenses would have increased by 10.3% as a result of the outsourcing of the customer service facility. |
At December 31, | Percent Change | |||||||||||||||||||
2009 | 2010 | 2011 | 2009 vs. 2010 | 2010 vs. 2011 | ||||||||||||||||
| (in thousands) | ||||||||||||||||||||
Mobile accesses | 552.9 | 880.4 | 1,164.1 | 59.2 | % | 32.2 | % | |||||||||||||
Pre-pay accesses | 357.2 | 545.9 | 666.1 | 52.8 | % | 22.0 | % | |||||||||||||
Contract accesses | 195.6 | 334.5 | 498.0 | 71.0 | % | 48.9 | % | |||||||||||||
Total accesses | 552.9 | 880.4 | 1,164.1 | 59.2 | % | 32.2 | % | |||||||||||||
2013 Results
Total revenues amounted 6,692 million euros in mobile and2013, down 5.0% year-on-year in reported terms (-0.5% excluding exchange rate differences) reflecting the disposal of the fixed broadband accesses. Access growthconsumer business as well as the “Refresh” model contribution (+5.8 p.p. in 2013). The “Refresh” model translates into more revenue from handset sales (even where the number of units sold do not increase), since handset sales are fully recognized upfront.
| · | Mobile service revenues in 2013 totaled 5,461 million euros, a decrease of 9.9% year-on-year in reported terms (-5.7% excluding the impact of exchange rate differences) negatively affected by the “Refresh” model, mobile termination rate cuts and roaming regulation. Excluding the impact of mobile termination rate cuts (+2.4 p.p.) and roaming regulation (+0.6 p.p.), as well as the impact of the “Refresh” model (+1.3 p.p.), the mobile service revenues would have decreased 1.3% year-on-year due to the pressure on ARPU. |
| · | Non-SMS data revenues grew 0.8% year-on-year (+5.5% year-on-year excluding exchange rate differences) accounting for 50% of data revenues in 2013 (+3 p.p. year-on-year). |
| · | The decline of SMS volumes led data revenue to decline 1.2% year-on-year in 2013. In 2013, data revenues accounted for 53% of mobile service revenues, an increase of 2 percentage points compared to the previous year. |
| · | ARPU fell 12.9% year-on-year (-8.8% year-on-year excluding the impact of the exchange rate differences) negatively impacted by the “Refresh” model, as well as mobile termination rate cuts and roaming regulation. Excluding the impact of regulation, ARPU would have decreased by 5.5% year-on-year. Voice ARPU fell 17.1% in reported terms (-13.2% excluding exchange rate differences and -8.4% excluding additionally the effect of regulations). Data ARPU fell 8.8% in reported terms (-4.5% excluding exchange rate differences). |
Mobile voice traffic remained strongrelatively stable with respect to the previous year.
Total expenses amounted to 5,256 million euros in Slovakia, above all2013, decreasing 6.1% year-on-year in reported terms, (affected by the contract segment.foreign exchange rate difference in -4.4 p.p.). Excluding this effect, total expenses would have decreased 1.7% year-on-year. The breakdown by components is as follows:
| · | Supplies amounted to 3,403 million euros, decreasing 5.8% year-on-year affected by foreign exchange rate differences (-4.4 p.p.). Excluding this effect, supplies would have decreased 1.4% mainly due to the reduction of interconnection costs. |
55
Year ended December 31, | Percent Change | |||||||||||||||||||
2009 (1) | 2010 (1) | 2011 (1) | 2009 vs. 2010 | 2010 vs. 2011 | ||||||||||||||||
| (in millions of euro, except percentages) | ||||||||||||||||||||
Revenues | 2,260 | 2,197 | 2,130 | (2.8 | )% | (3.0 | )% | |||||||||||||
Service revenues | 1,123 | 1,078 | 995 | (4.0 | )% | (7.7 | )% | |||||||||||||
OIBDA | 1,053 | 953 | 931 | (9.5 | )% | (2.3 | )% | |||||||||||||
OIBDA Margin | 46.6 | % | 43.4 | % | 43.7 | % | (3.2) p. | p. | 0.3 p. | p. | ||||||||||
CAPEX | 245 | 224 | 229 | (8.8 | )% | 2.1 | % | |||||||||||||
| OpCF (OIBDA – CAPEX) | 807 | 729 | 702 | (9.7 | )% | (3.7 | )% | |||||||||||||
| · | Personnel expenses amounted to 543 million euros in 2013, a decrease of 1.6% in reported terms, affected by foreign exchange rate differences (-4.6 p.p.). Excluding this effect, personnel expenses would have increased by 3.0%, affected by 48 million euros of restructuring expenses. |
| · | Other expenses were 1,310 million euros and decreased by 8.7% in reported terms, affected by foreign exchange rate differences (-4.3 p.p.). Excluding this effect these costs would have decreased 4.4%, due to lower commissions and benefits of the “Refresh” model. |
TELEFÓNICA GERMANY
| ACCESSES | |||||
| Thousands of accesses | 2012 | 2013 | 2014 | %YoY 12/13 | %YoY 13/14 |
| Fixed telephony accesses (1) | 2,249.0 | 2,124.9 | 2,036.4 | (5.5%) | (4.2%) |
| Internet and data accesses | 2,678.9 | 2,516.1 | 2,387.0 | (6.1%) | (5.1%) |
| Narrowband | 302.6 | 271.7 | 243.2 | (10.2%) | (10.5%) |
| Broadband | 2,376.3 | 2,244.3 | 2,143.8 | (5.6%) | (4.5%) |
| Mobile accesses | 19,299.9 | 19,401.0 | 42,124.9 | 0.5% | 117.1% |
| Prepay | 9,191.3 | 9,114.9 | 23,350.7 | (0.8%) | 156.2% |
| Contract | 10,108.5 | 10,286.1 | 18,774.1 | 1.8% | 82.5% |
| Final Clients Accesses (2) | 24,284.9 | 24,042.0 | 46,548.3 | (1.0%) | 93.6% |
| Wholesale Accesses | 1,087.9 | 1,125.0 | 1,113.3 | 3.4% | (1.0%) |
| Total Accesses | 25,372.8 | 25,166.9 | 47,661.5 | (0.8%) | 89.4% |
| Notes: | |||||
| (1) PSTN (including public use telephony) x1; ISDN basic access x1; ISDN primary access; 2/6 digital access x30. Company’s accesses for internal use included. Includes VoIP and Naked ADSL. | |||||
(2) 2012 includes 57.2 thousand of Pay-TV accesses.
The results of the E-Plus Group have been fully consolidated with Telefónica Germany since October 1, 2014 (once the acquisition was completed, following its announcement in 2013). As a result, mobile accesses reached 42.1 million at the end of 2014, up by 117% year-on-year, making us the largest operator on the German market in terms of mobile customers according to the Company’s estimates. At the date of consolidation, the E-Plus Group accounted for 22.6 million accesses.
The German market remained competitive in 2014, with pressure on commercial expenses and Slovakia declined 3%focus on bundled voice and data tariffs, oriented to €2,130 million in 2011. In Slovakia, growthcapture higher-value customers and develop the current base of customers by increasing their consumption. Bundle offers were also brought on to the market by our main competitors in the customer base led to higher revenues in 2011.second half of 2014.
Contract mobile customers grew by 83% year-on-year, impacted by efficiency initiatives, salesthe incorporation of non-strategic assets and wide margins in Slovakia, which resulted in a smaller decline in OIBDA as compared with revenues for the year.
At December 31, | Percent Change | |||||||||||||||||||
2009 | 2010 | 2011 | 2009 vs. 2010 | 2010 vs. 2011 | ||||||||||||||||
| (in thousands) | ||||||||||||||||||||
Internet and data accesses | - | 11.2 | 24.2 | n. | a. | n. | s. | |||||||||||||
Broadband accesses | - | 11.2 | 24.2 | n. | a. | n. | s. | |||||||||||||
Mobile accesses | 1,714.3 | 1,695.8 | 1.622.9 | (1.1 | )% | (4.3 | )% | |||||||||||||
Pre-pay accesses | 1,022.5 | 966.5 | 870.1 | (5.5 | )% | (10.0 | )% | |||||||||||||
Contract accesses | 691.8 | 729.4 | 752.9 | 5.4 | % | 3.2 | % | |||||||||||||
Total accesses | 1,714.3 | 1,707.1 | 1,647.2 | (0.4 | )% | (3.5 | )% | |||||||||||||
base. Smartphone penetration reached 29% in 2014, with a considerable volume of LTE customers.
Year ended December 31, | Percent Change | |||||||||||||||||||
2009 | 2010 | 2011 | 2009 vs. 2010 | 2010 vs. 2011 | ||||||||||||||||
| (in millions of euro, except percentages) | ||||||||||||||||||||
| Revenues | 905 | 848 | 723 | (6.3 | )% | (14.7 | )% | |||||||||||||
Service revenues | 842 | 779 | 677 | (7.5 | )% | (13.1 | )% | |||||||||||||
OIBDA | 302 | 275 | 206 | (9.0 | )% | (25.0 | )% | |||||||||||||
OIBDA Margin | 33.4 | % | 32.4 | % | 28.5 | % | (1.0 | ) p.p. | (3.9 | ) p.p. | ||||||||||
CAPEX | 63 | 60 | 61 | (4.1 | )% | 1.4 | % | |||||||||||||
| OpCF (OIBDA – CAPEX) | 239 | 214 | 145 | (10.3 | )% | (32.5 | )% | |||||||||||||
| CONSOLIDATED RESULTS | |||||
| Millions of euros | |||||
| TELEFÓNICA GERMANY | 2012 | 2013 | 2014 | %YoY 12/13 | %YoY 13/14 |
| Revenues | 5,213 | 4,914 | 5,522 | (5.7%) | 12.4% |
| Wireless Business | 3,845 | 3,673 | 4,375 | (4.5%) | 19.1% |
| Mobile service revenues | 3,152 | 2,989 | 3,580 | (5.2%) | 19.8% |
| Wireline Business | 1,363 | 1,235 | 1,138 | (9.4%) | (7.8%) |
| OIBDA | 1,351 | 1,308 | 733 | (3.2%) | (44.0%) |
| OIBDA Margin | 25.9% | 26.6% | 13.3% | 0.7 p.p. | (13.4 p.p.) |
| Depreciation and amortization | (1,233) | (1,231) | (1,426) | (0.1%) | 15.7% |
| Operating Income (OI) | 118 | 77 | (693) | (35.4%) | n.m. |
| CapEx | 609 | 666 | 849 | 9.4% | 27.5% |
| OpCF (OIBDA-CapEx) | 743 | 642 | (116) | (13.5%) | n.m. |
Total revenues amounted to 5,522 million euros in 2014, up by 12.4% due mainly to the consolidation of the E-Plus Group since October 1, 2014, and offset in part by the lower service revenues during the rest of the year.
| · | Mobile service revenues totaled 3,580 million euros in 2014, up by 19.8% year-on-year due mainly to the consolidation of the E-Plus Group since October 1, 2014 and offset in part by the lower voice and SMS revenues during the rest of the year. Telefónica Germany continued to focus on data revenues, which increased 24.3% and accounted for 50.1% of mobile service revenues. Non-P2P SMS data revenues accounted for 71% of the total data revenues (+4.7 p.p. year-on-year), increasing 33% year-on-year. |
| · | Fixed telephony revenues fell by 7.8% year-on-year in 2014 to stand at 1,138 million euros. The main reason for this was a decline in fixed broadband customers (partially mitigated by VDSL growth) and transit business revenues, impacting slightly on the margin. |
ARPU was negatively affected by the consolidation of the E-Plus Group and decreased by 7.1% year-on-year in 2014, reducing its year-on-year decline compared to 2013, due to the smaller proportional impact of migration to new tariffs, and the various actions undertaken with respect to the Telefónica Ireland’sGermany’s customer base in order to boost income and data leverage.
| TELEFÓNICA GERMANY | 2012 | 2013 | 2014 | %YoY 12/13 | %YoY 13/14 |
| Voice Traffic (Million minutes) | 29,519 | 30,152 | 41,186 | 2.1% | 36.6% |
| ARPU (EUR) | 13.8 | 12.7 | 11.8 | (7.9%) | (7.1%) |
| Prepay | 5.5 | 5.1 | 5.4 | (6.8%) | 4.5% |
| Contract (1) | 21.5 | 19.6 | 18.4 | (9.0%) | (5.9%) |
| Data ARPU (EUR) | 6.2 | 6.2 | 5.9 | 0.7% | (3.9%) |
| % non-SMS over data revenues | 56.7% | 66.5% | 71.2% | 9.8 p.p. | 4.7 p.p. |
| Notes: | |||||
| (1) Excludes M2M. | |||||
Total expenses were 4,895 million euros in 2014, up by 29.7% year-on-year due mainly to the consolidation of the E-Plus Group since October 1, 2014. Telefónica Germany recorded a 409 million euros provision for the restructuring process resulting from the integration of the E-Plus Group. The breakdown by component is as follows:
| · | Supplies stood at 2,144 million euros, up by 9.5% year-on-year due mainly to the consolidation of the E-Plus Group since October 1, 2014. There were lower interconnection costs arising from a decrease in SMS volumes and lower interconnection rates, partially offset by higher handset purchases (mainly towards the end of the year). |
| · | Personnel expenses amounted to 828 million euros during the year, up by 97.7% due mainly to the consolidation of the E-Plus Group since October 1, 2014. In addition, personnel expenses were impacted by the recognition of an expenditure of 321 million euros, related to the provision for the restructuring process resulting from the integration of the E-Plus Group. |
| · | Other expenses amounted to 1,923 million euros during the year, up by 37.5% mainly impacted by the change of perimeter and the recognition of an expenditure of 87 million euros related to the provision for the restructuring process resulting from the integration of the E-Plus Group. Excluding these impacts, other expenses would have been impacted by higher commercial costs. |
OIBDA fell 44% year-on-year to stand at 733 million euros in 2014. OIBDA was impacted by the recognition of an expenditure of 409 million euros related to the provision for the restructuring process resulting from integration of the E-Plus Group.
2013 Results
Revenues totaled 4,914 million euros in 2013, down 5.7% year-on-year. This decline is partly attributable to the reduction in termination rates. Excluding this impact, revenues would have fallen 3.5% in 2013, with ongoing headwinds coming from customer base repositioning and the acceleration of declines in SMS volumes. Handset revenues decreased 14.7%by 1.4% year-on-year in 2011,2013 mainly due to the increasing share of attractive affordable handsets in the market, including selective bundle offers of selected smartphones with high value mobile data tariffs.
| · | Mobile service revenues stood at 2,989 million euros in 2013, a year-on-year decrease of 5.2%. Excluding the impact of the reduction in termination rates, mobile service revenues would have fallen by 1.5% year-on-year in 2013, mainly as a result of the increase in tariff renewals in the customer base and the lower volume of SMS traffic, which were not offset by the growth in data revenues. Telefónica Germany continued to monetize its data revenues with an increase in non-P2P SMS data revenue of 21.7% during the year, accounting for 67% of total data revenue (+10 p.p. year-on-year). As a result, mobile data revenues in 2013 increased 3.7% year-on-year to account for 48% of mobile service revenues (+4 p.p. year-on-year). |
| · | Fixed telephony revenues decreased 9.4% year-on-year in 2013, to 1,235 million euros despite the increasing adoption of VDSL. This is mainly the result of the decline in DSL customer base (mitigated by an increasing uptake of VDSL) and a further reduction of revenues from the low margin voice transit business. |
ARPU decreased by 7.9% year-on-year in 2013, mainly as a result of the reduction in mobile termination rates. Excluding this impact, ARPU would have declined by 4.3% in 2013 on the back of tariff migrations, acceleration of the decrease in SMS volumes and an increasing share of discounted online channel activities, which was partly offset by the increasing demand for mobile data services.
Voice ARPU decreased by 14.9% year-on-year in 2013, mainly as a result of regulatory changes (lower roaming and interconnection rates) and the migration of customer to current tariffs. Data ARPU grew 0.7% year-on-year, as a result of the increased penetration of mobile broadband, despite the negative impact of lower SMS volumes.
Mobile voice traffic showed year-on-year growth of 2.1%, derived from the growth in the contract customer base.
Total expenses amounted to 3,775 million euros in 2013, decreasing 3.8% year-on-year. The breakdown by component is as follows:
| · | Supplies amounted to 1,958 million euros, decreasing 8.1% year-on-year, mainly driven by a reduction in interconnection expenses. |
| · | Personnel expenses amounted to 419 million euros, decreasing 9.9% year-on-year as a result of an accumulation of activities at the end of 2012. |
| · | Other expenses stood at 1,398 million euros in 2013, increasing by 5.4% year-on-year, due mainly to the higher commercial cost incurred in retention and advertising activities. |
OIBDA stood at 1,308 million euros in 2013, registering a decline of 3.2% due to the pressure in revenues, the higher commercial costs and certain handset promotions, offset in part by the capital gains obtained from asset sales totaling 76 million euros (46 million euros of fiber assets and 30 million euros of the related hosting business, Telefónica Online Services).
TELEFÓNICA BRAZIL
| ACCESSES | |||||
| Thousands of accesses | 2012 | 2013 | 2014 | %YoY 12/13 | %YoY 13/14 |
| Fixed telephony accesses (1) | 10,642.7 | 10,747.8 | 10,743.4 | 1.0% | (0.0%) |
| Internet and data accesses | 3,964.3 | 4,102.0 | 4,082.6 | 3.5% | (0.5%) |
| Narrowband | 137.9 | 92.1 | 73.7 | (33.2%) | (19.9%) |
| Broadband (2) | 3,748.4 | 3,936.7 | 3,939.8 | 5.0% | 0.1% |
| Other (3) | 78.1 | 73.2 | 69.0 | (6.2%) | (5.8%) |
| Mobile accesses | 76,137.3 | 77,240.2 | 79,932.1 | 1.4% | 3.5% |
| Prepay | 57,335.1 | 53,551.9 | 51,582.4 | (6.6%) | (3.7%) |
| Contract | 18,802.2 | 23,688.3 | 28,349.7 | 26.0% | 19.7% |
| Pay-TV | 601.2 | 640.1 | 770.6 | 6.5% | 20.4% |
| Final Clients Accesses | 91,345.4 | 92,730.0 | 95,528.6 | 1.5% | 3.0% |
| Wholesale Accesses | 24.4 | 18.8 | 25.9 | (22.8%) | 37.5% |
| Total Accesses | 91,369.8 | 92,748.9 | 95,554.5 | 1.5% | 3.0% |
| Notes: | |||||
| (1) PSTN (including public use telephony) x1; ISDN basic access x1; ISDN primary access; 2/6 digital access x30. Company’s accesses for internal use included. Voice fixed wireless accesses included. | |||||
| (2) Includes ADSL, optical fiber, cable modem and broadband circuits. | |||||
| (3) Retail circuits other than broadband. | |||||
During 2014, Telefonica Brazil strengthened its leadership in the high-value mobile segments, both in contract and LTE, driven by improvements in its networks and continuous innovation of its commercial offers. With respect to the fixed business, it made progress in its transformation process, speeding up deployment of the fiber network and increasing the number of TV accesses.
In the mobile segment, Telefonica Brazil captured more than 50% of the new contract customers on the market according to Anatel and achieved a market share of 38.9% as of December 2014 according to Anatel. Contract plans were simplified throughout the year offering larger volumes of data, minutes and SMS in exchange for higher levels of ARPU.
In its fixed business, the company has maintained its strategic focus on fiber deployment, with 4.1 million premises passed with fiber and 375 thousand homes connected, and also on increasing Pay-TV accesses (up 20.4% year-on-year).
CONSOLIDATED RESULTS | |||||||
| Millions of euros | %YoY 12/13 | %YoY 13/14 | |||||
| TELEFÓNICA BRAZIL | 2012 | 2013 | 2014 | € | LC | € | LC |
| Revenues | 13,618 | 12,217 | 11,231 | (10.3%) | 2.2% | (8.1%) | 0.5% |
| Wireless Business | 8,573 | 8,092 | 7,618 | (5.6%) | 7.5% | (5.9%) | 2.9% |
| Mobile service revenues | 8,167 | 7,608 | 7,228 | (6.8%) | 6.1% | (5.0%) | 3.8% |
| Wireline Business | 5,045 | 4,125 | 3,613 | (18.2%) | (6.8%) | (12.4%) | (4.2%) |
| OIBDA | 5,161 | 3,940 | 3,543 | (23.7%) | (13.0%) | (10.1%) | (1.7%) |
| OIBDA Margin | 37.9% | 32.3% | 31.5% | (5.6 p.p.) | (5.6 p.p.) | (0.7 p.p.) | (0.7 p.p.) |
| Depreciation and amortization | (2,318) | (2,109) | (1,762) | (9.0%) | 3.7% | (16.5%) | (8.7%) |
| Operating Income (OI) | 2,843 | 1,831 | 1,781 | (35.6%) | (26.6%) | (2.7%) | 6.3% |
| CapEx | 2,444 | 2,127 | 2,933 | (13.0%) | (0.9%) | 37.9% | 50.7% |
| OpCF (OIBDA-CapEx) | 2,717 | 1,813 | 610 | (33.3%) | (24.0%) | (66.4%) | (63.2%) |
2014 Results
Revenues in 2014 totaled 11,231 million euros, an 8.1% year-on-year fall in reported terms. Excluding the effect of exchange rate differences, revenues would have grown by 0.5% year-on-year, mainly due to the positive performance of the mobile business (up 2.9% year-on-year), which offset the decline in fixed telephony revenues (down 4.2% year-on-year).
| · | Revenues from the mobile business totaled 7,618 million euros in 2014, falling by 5.9%. Excluding the effect of exchange rate differences, revenues from the mobile business would have increased by 2.9% due to the positive evolution of service revenues (up 3.8% year-on-year) as a result of the good performance of outbound revenues, which in turn increased as a result of an increase in the customer base and the increased proportion of data revenues. This trend was partially offset by falling handset sales (an 11.9% decline year-on-year) and lower inbound revenues affected by lower interconnection tariffs. |
| · | Fixed telephony revenues totaled 3,613 million euros, down by 12.4%, although excluding the effect of exchange rates the decrease would have been 4.2%. This decrease was mainly due to the reduction of the fixed-mobile retail rate and the fixed by mobile substitution, bringing down our fixed telephony revenues despite a stable fixed customer base and greater minutes packages. This trend was partially offset by the increase of the broadband and new services revenues that grew 4.0% helped by the increase of accesses connected with fiber, with a higher ARPU, and the growth of the Pay-TV accesses. |
The mobile ARPU decreased 8.8% year-on-year in reported terms. Excluding the effect of exchange rate differences, it would have decreased 0.6% year-on-year as a consequence of the negative impact of the reduction in the mobile termination rates. We believe the better quality of the clients’ base is reflected in an increase of the outbound ARPU and a 16.0% growth of the data ARPU.
| TELEFÓNICA BRAZIL | 2012 | 2013 | 2014 | %YoY 12/13 | %YoY 13/14 |
| Voice Traffic (Million minutes) | 113,955 | 115,698 | 127,412 | 1.5% | 10.1% |
| ARPU (EUR) | 8.9 | 8.0 | 7.3 | 2.3% | (0.6%) |
| Prepay | 5.0 | 4.5 | 3.9 | 1.5% | (4.3%) |
| Contract (1) | 23.1 | 18.8 | 15.7 | (7.3%) | (8.7%) |
| Data ARPU (EUR) | 2.4 | 2.5 | 2.6 | 18.9% | 16.0% |
| % non-SMS over data revenues | 62.0% | 67.0% | 77.4% | 5.0 p.p. | 10.4 p.p. |
| Notes: | |||||
| (1) Excludes M2M. | |||||
Total expenses totaled 7,949 million euros in 2014, falling 7.3% in reported terms, with an impact of 8.6 percentage points due to the exchange rate effect. Excluding this impact, total expenses would have increased by 1.3%. The breakdown by component is as follows:
| · | Supplies (2,680 million euros) were down by 14.3% in 2014, with an impact of 8 percentage points due to the exchange rate effect. Excluding this impact, supply costs would have fallen by 6.3% due to lower interconnection expenditure associated with regulatory changes and lower handset costs. |
| · | Personnel expenses (976 million euros) were down by 5.8% in 2014, with an impact of 8.8 percentage points due to the exchange rate effect. Excluding this impact and the recognition in 2014 of expenditure on the global restructuring program, in accordance with the simplification initiatives the Group is implementing to meet its |
targets (+7.2 p.p.), personnel costs would have been down by 4.2% as a result of the staff restructuring programs and voluntary redundancies in 2013, which had an impact of 51 million euros in 2013.
| · | Other expenses (4,292 million euros) were down by 2.7% in 2014, with an impact of 9.1 percentage points due to the exchange rate effect. Excluding this effect, other operating expenses would have increased by 6.4%, driven by higher commercial and fiber acquisition costs, higher network deployment and fixed/mobile system improvement costs. |
OIBDA stood at 3,543 million euros in 2014, a fall of 10.1% (down 1.7% excluding exchange rates effects). This decrease was mainly due to exchange rate effects and, to a lesser extent, expenses incurred as a result of the recognition in 2014 of expenditure on the global restructuring program, in accordance with the simplification initiatives the Group is implementing to meet its targets (totaling 68 million euros and mainly accruing during the fourth quarter of 2014), the lower gains derived from the sale of non-strategic towers in 2014 (1 million euros) compared to 2013 (29 million euros), higher personnel costs, increased networks costs, higher handsets and customer service costs, due in part to the higher business volumes. Excluding the effect of exchange rate differences, the sale of non-strategic towers and the expenses incurred as a result of Telefónica’s global restructuring program, OIBDA would have increased by 0.9%, a 0.1 percentage points improvement on the margin compared to 2013.
The OIBDA margin stood at 31.5% in reported terms for 2014.
2013 Results
Revenues totaled 12,217 million euros, 10.3% less than 2012. Excluding the effect of exchange rate differences, revenues increased 2.2% year-on-year, mainly due to the strong performance of the mobile business (up 7.5% year-on-year), offsetting the decline in fixed revenues (down 6.8% year-on-year).
| · | 2013 wireless business revenues amounted to 8,092 million euros, down 5.6%. Excluding the effect of exchange rate differences, however, they would have grown 7.5%, boosted by handset sales revenues (up 35.4% year-on-year). This increase was due to the higher weight of smartphone sales and the growth of service revenues (up 6.1% year-on-year) as a result of the growth in outgoing service revenues, which was attributable to the growth of the customer base and the greater weighting of data revenues; all of which was partially offset by a reduction in mobile termination rates, which had an adverse impact on incoming revenues. |
| · | Revenues from the fixed business amounted to 4,125 million euros, down 18.2%. Excluding the effect of exchange rate differences, they would have decreased by 6.8%, affected by the reduction in the fixed-mobile retail tariff as well as by intense competition in the fixed broadband and Pay-TV businesses. |
Mobile ARPU decreased 10.5% year-on-year in reported terms. Excluding the effect of exchange rate differences, it would have increased 2.3% year-on-year as a consequence of a better quality of the customer base, partially offset by the negative impact of the reduction in the mobile termination rates.
Total expenses, which include supplies, personnel expenses and other expenses (mainly subcontract expenses and others) but do not include depreciation and amortization expenses, amounted to 8,575 million euros in 2013, 6.5% less than in 2012 in reported terms and 6.5% higher than in 2012 in local currency. The breakdown by components is as follows:
| · | Supplies amounted to 3,128 million euros, increasing 1.6% year-on-year in reported terms and 15.8% in local currency, mainly due to higher content costs and higher site lease costs for the deployment of towers and due to our sale and leaseback of towers; |
| · | Personnel expenses amounted to 1,036 million euros in 2013, down 7.2% year-on-year in reported terms and increasing 5.7% in local currency affected by personnel restructuring costs (51 million euros); and |
| · | Other expenses amounted to 4,411 million euros, a decrease of 11.4% compared to 2012 in reported terms, with an increase of 0.9% in local currency mainly due to expenses related to customer service, associated with higher commercial activity. |
OIBDA totaled 3,940 million euros in 2013, down 23.7% in reported terms (-13.0% excluding the effect of exchange rate differences). This performance was mainly due to the lower gains derived from the sale of non-strategic towers in 2013 (29 million euros) compared to 2012 (445 million euros). Excluding the impact of the sale of non-strategic towers and the impact of exchange rate differences, OIBDA would have decreased by 5.5%, losing 2.6 percentage points of margin with respect to 2012.
OIBDA margin stood at 32.3% in reported terms for 2013.
TELEFÓNICA HISPANOAMÉRICA
| ACCESSES | |||||
| Thousands of accesses | 2012 | 2013 | 2014 | %YoY 12/13 | %YoY 13/14 |
| Fixed telephony accesses (1) (2) (3) | 13,510.7 | 13,778.5 | 13,374.4 | 2.0% | (2.9%) |
| Internet and data accesses | 4,768.2 | 5,137.7 | 5,433.8 | 7.8% | 5.8% |
| Narrowband | 71.2 | 33.4 | 25.2 | (53.1%) | (24.5%) |
| Broadband (4) | 4,667.0 | 5,074.9 | 5,379.4 | 8.7% | 6.0% |
| Other (5) | 30.0 | 29.4 | 29.2 | (1.9%) | (0.6%) |
| Mobile accesses | 100,458.2 | 107,266.9 | 110,346.5 | 6.8% | 2.9% |
| Prepay (6)(7) | 79,806.4 | 84,524.1 | 86,698.0 | 5.9% | 2.6% |
| Contract | 20,651.8 | 22,742.7 | 23,648.5 | 10.1% | 4.0% |
| Pay-TV | 1,825.7 | 2,133.5 | 2,431.9 | 16.9% | 14.0% |
| Final Clients Accesses | 120,562.6 | 128,316.6 | 131,586.6 | 6.4% | 2.5% |
| Wholesale Accesses | 22.7 | 22.7 | 16.4 | 0.2% | n.m. |
| Total Accesses T. Hispanoamérica | 120,585.3 | 128,339.3 | 131,603.0 | 6.4% | 2.5% |
| Notes: | |||||
| (1) PSTN (including public use telephony) x1; ISDN basic access x1; ISDN primary access; 2/6 Digital Access x30. Company’s accesses for internal use included. Voice fixed wireless accesses included. | |||||
| (2) In the first quarter of 2014, 45 thousand fixed wireless inactive accesses were disconnected in Mexico. | |||||
| (3) In 2014, fixed telephony accesses include 50 thousand “fixed wireless” additional customers in Peru. | |||||
| (4) Includes ADSL, optical fiber, cable modem and broadband circuits. | |||||
| (5) Retail circuits other than broadband. | |||||
(6) In the first quarter of 2014, 1.9 million inactive accesses were disconnected in Mexico. (7) In the fourth quarter of 2014, 1.8 million inactive accesses were disconnected in Central America. | |||||
Total accesses closed at 131.6 million at year-end (+2.5% year-on-year).
Regarding commercial operations in mobile business:
Mobile accesses totaled 110.3 million (+2.9% year-on-year) thanks to strong contract segment growth, which expanded by 4.0% year-on-year. Growth was particularly strong in Ecuador (+13.4% year-on-year), Peru (+13.6% year-on-year) and Chile (+4.5% year-on-year). In the pre-pay segment (+2.6% year-on-year), growth was driven mainly by Colombia (+8.7% year-on-year), Mexico (+7.1% year-on-year) and Peru (+3.7% year-on-year), despite disconnection of 1.9 million inactive accesses in Mexico and 1.8 million inactive accesses in Central America, as well as more restrictive criteria for customer registration in certain countries in the region.
Total net adds amounted 3.1 million in 2014, with a year-on-year increase in customer additions during the year (+4%) and strong commercial activity in Mexico and Chile. Annual churn stood at 3.4% in 2014, affected by the disconnection of inactive accesses and more restrictive criteria for prepay customer registration.
Growth of smartphones (+32% year-on-year) continued to be the main driver of accesses growth, with a penetration over mobile accesses of 26% (+6 p.p. year-on-year), and an increase in pre-pay customers (+2.6%). Penetration of
smartphones was particularly successful in Mexico (+11 p.p.), Venezuela and Central America (+9 p.p.), Colombia (+5 p.p.) and Chile (+5 p.p.).
Total ARPU grew by 10.6% during the year, due to increases in voice traffic (+16.0%) as a result of higher volumes of minutes by customer (+5.4%), and increased data traffic (+65.3%), both of which are mainly attributable to the higher penetration of smartphones and larger average consumption per access.
Regarding the fixed business:
Traditional business accesses stood at 13.4 million, with a decrease of 2.9% year-on-year, affected by the erosion of traditional business in the region, including access losses in Venezuela and Central America (-9.7% year-on-year), Chile (-4.6% year-on-year), Peru (-3.1% year-on-year) and Argentina (-2.2% year-on-year). On the other hand, Colombia did not show signs of such erosion and achieved an increase in customers in 2014 (+1% year-on-year).
Broadband accesses totaled 5.4 million at year-end 2014 (+6% year-on-year), after reaching net adds of 0.3 million accesses during 2014, in line with the commercial activity and churn in 2013. The penetration by fixed broadband accesses over traditional business accesses was 40% (+3 p.p. year-on-year). The mix of accesses focused on higher speeds, and accesses with speeds in excess of 4 Mb accounted for 49.9% (+12 p.p. year-on-year).
Pay-TV accesses accounted 2.4 million (+14% year-on-year) after net adds of 0.3 million accesses, with an improvement in all the countries of the region that offer the service. Growth was particularly positive in Venezuela and Central America (+21% year-on-year), Colombia (+19.7% year-on-year) and Chile (+19.5% year-on-year).
| CONSOLIDATED RESULTS | |||||||
| Millions of euros | %YoY 12/13 | %YoY 13/14 | |||||
| TELEFÓNICA HISPANOAMÉRICA | 2012 | 2013 | 2014 | € | LC(*) | € | LC(*) |
| Revenues | 16,741 | 16,855 | 13,155 | 0.7% | 16.1% | (22.0%) | 14.6% |
| Wireless Business | 12,724 | 13,020 | 9,578 | 2.3% | 19.1% | (25.7%) | 16.5% |
| Mobile service revenues | 11,470 | 11,510 | 8,454 | 0.4% | 15.9% | (25.7%) | 17.5% |
| Wireline Business | 4,424 | 4,272 | 3,604 | (3.4%) | 7.6% | (10.1%) | 8.4% |
| OIBDA | 5,983 | 5,531 | 4,068 | (7.6%) | 8.6% | (26.5%) | 14.2% |
| OIBDA Margin | 35.7% | 32.8% | 30.9% | (2.9 p.p.) | (2.3 p.p.) | (1.9 p.p.) | (0.1 p.p.) |
| Depreciation and amortization | (2,762) | (2,524) | (2,034) | (8.6%) | (2.0%) | (19.4%) | 5.3% |
| Operating Income (OI) | 3,221 | 3,007 | 2,034 | (6.6%) | 16.8% | (32.4%) | 20.9% |
| CapEx | 2,988 | 3,118 | 2,842 | 4.3% | 21.3% | (8.8%) | 42.5% |
| OpCF (OIBDA-CapEx) | 2,995 | 2,413 | 1,226 | (19.4%) | 4.1% | (49.2%) | (24.1%) |
| Note: | |||||||
| (*) Excludes the effect of hyperinflation in Venezuela. | |||||||
2014 Results
Revenues amounted to 13,155 million euros in the year 2014, falling 22% year-on-year in reported terms, mainly due to the effect of exchange rates and hyperinflation in Venezuela (-36.1 p.p.). Excluding these effects, revenues would have increased by 14.6% year-on-year, thanks to a good performance of the fixed and mobile data revenues, as well as the mobile voice revenues, in both cases due to the increase in our customer base, higher usage per customer and higher data penetration, despite the negative impact of interconnection tariffs (which subtracted 1.6 p.p. from year-on-year growth).
| · | Mobile service revenues decreased by 25.7% in reported terms, mainly due to the effect of exchange rates and hyperinflation in Venezuela (-43.2 p.p.) and the negative impact of interconnection tariffs (-2.4 p.p.). Excluding these effects, service revenues would have increased by 17.5% year-on-year. Below is additional information by country: |
| · | In Argentina, mobile service revenues were down by 19.8% in reported terms. Excluding the effect of exchange rates they would have been up by 19.3% as a result of the good performance of voice and data revenues, despite the negative impact of certain billing changes implemented (which implied the billing by seconds after the first thirty seconds of the call), and the greater use and penetration of data. |
| · | In Peru, mobile service revenues increased by 7.8% in reported terms. Excluding the effect of exchange rates they would have increased by 13.4%. Growth was mainly driven by the higher customer base and the increase of data scale (non-SMS data revenues were up 42.7% in the year), following the launch of LTE, helping to increase average revenue per customer. |
| · | In Mexico, mobile revenues increased by 5.4% in reported terms. Excluding the effect of exchange rates they would have increased by 10%, as a result of to the new interconnection scenario which led to competitive offers that have driven up customers' voice and data consumption. |
| · | In Venezuela and Central America, mobile service revenues were down by 65.1% in reported terms. Excluding the effect of exchange rates and hyperinflation in Venezuela they would have increased by 36.8%, mainly due to 25% price increases for all services as of July in Venezuela, and the expansion of mobile data services leveraged in non-SMS data revenues growth (+68%), which accounted for 76% of data revenues (+12 p.p. year-on-year). |
| · | Data revenues in the segment were down by 24.4%, due to the effect of exchange rates and hyperinflation in Venezuela. Revenues would have been up by 23% excluding these effects, mainly due to the growth of non-SMS data revenues (+43.4%), which accounted for 74% of data revenues (+11 p.p. year-on-year). |
| · | Fixed business revenues decreased by 10.1% in reported terms in the year, due to the effects of exchange rates (-18.5 p.p.). Excluding this effect, fixed revenues would have increased by 8.4% year-on-year in 2014, driven by broadband and new services revenues (-2.6% year-on-year in reported terms, +16.2% excluding exchange rate effects). The revenues from broadband and new services, accounted for 60% of fixed revenues (+5 p.p. year-on-year). The acceleration of growth in fixed revenues was particularly notable in Argentina, where there was a substantial increase in access and voice revenues (due to higher ARPU). |
Total expenses stood at 9,342 million euros in 2014, down by 19.2% in reported terms, as a result mainly of the exchange rate effect and hyperinflation in Venezuela (-33.8 p.p.), which was partially offset by a provision of 99 million euros relating to the recognition in 2014 of expenditure on the global restructuring program, in accordance with the simplification initiatives the Group is implementing to meet its targets. Excluding these effects, total expenses would have increased by 14.1%. Below is additional information by country:
| · | Argentina: expenses stood at 2,294 million euros, a decrease of 15.9% in reported terms. Excluding the effect of exchange rates, expenses would have grown by 25.1% due to general price increases, although the company continues to make an effort to contain costs and mitigate the effects of high inflation. |
| · | Peru: expenses stood at 1,718 million euros, up by 5.9% in reported terms. Excluding the effect of exchange rates, expenses would have been up by 11.4% due to higher commercial costs driven from the pressure of competition on the Peruvian market. |
| · | Venezuela and Central America: expenses stood at 975 million euros, down by 61.3% in reported terms. Excluding the effect of exchange rates and hyperinflation in Venezuela, expenses would have increased by 36.7%, mainly due to higher prices in general, and the effect of greater expenditure in U.S. dollars for provided services and equipment purchases, being affected by the negative impact of the currency depreciation in Venezuela. |
By component, variation is explained by:
| · | Supplies (3,841 million euros) fell by 22.9% in 2014 in reported terms. Excluding the effect of exchange rates and hyperinflation in Venezuela (-27.6 p.p.), expenses would have grown by 4.7%. The increase is due to handsets costs caused by sales of high-end equipment which more than offset lower mobile termination rates in Chile, Colombia, Peru and Mexico. |
| · | Personnel expenses (1,525 million euros) were down by 12.7% in reported terms, but would have been up by 27.6% excluding the negative impact of 39.5 percentage points caused by the effect of exchange rates and hyperinflation in Venezuela. The increase in these costs is due to a general rise of inflation in certain countries in the region. The recognition of expenditures relating to the global restructuring program, in accordance with the simplification initiatives that the Group is implementing to meet its targets, added 6.3 percentage points to the variation. |
| · | Other expenses (3,976 million euros) fell by 17.7% in reported terms. Excluding the effect of exchange rates and hyperinflation in Venezuela (+38.2 p.p.) and sales of non-strategic towers in 2013 (-0.1 p.p.), these expenses increased by 21.1%, mainly due to higher voice and data traffic and higher sales campaigns costs. |
This broughtOIBDA to 4,068 million euros in 2014, down by 26.5% in reported terms, due to:
| · | Exchange rate differences and hyperinflation in Venezuela (-40.1 p.p.). |
| · | Recognition of the global restructuring program costs (99 million euros; -2 p.p.), in accordance with the simplification initiatives the Group is implementing to meet its targets. |
| · | The non-strategic towers sales (4 million euros in 2014 and 11 million euros in 2013; -0.1 p.p.). |
Excluding these impacts, OIBDA would have increased by 16.4%.
The OIBDA margin stood at 30.9% for the year, down by 1.9 percentage points year-on-year in reported terms, although excluding the effect of exchange rates and hyperinflation in Venezuela, the impact of global restructuring program, in accordance with the simplification initiatives the Group is implementing to meet its targets, and sales of non-strategic towers, it would have been up by 0.5 percentage points. The increase was due to a higher margin in all countries in the region, with the exception of Venezuela and Uruguay, and particularly good margin performances in Mexico, Colombia and Chile.
2013 Results
Revenues in 2013 amounted to 16,855 million euros in 2013, with a 0.7% year-on-year growth in reported terms, mainly due to exchange rate differences and the effect of hyperinflation in Venezuela. Excluding these factors, which reduced growth by 15.2 percentage points, growth would have been 16.1%. This performance reflects the positive performance of mobile service revenues, which rose by 15.9% in the year excluding the impact of exchange rates differences and the effect of hyperinflation in Venezuela (decrease 0.4% in reported terms), due to the good performance of data revenue and despite the negative impact of changes in regulations. The main countries that explained this deviation were:
| · | InArgentina, mobile service revenues fell by 2.1% in reported terms, although excluding the effect of exchange rates these would have increased by 21.2% year-on-year as a result of growth of the higher customer base as well as the and higher consumption level, principally data. In this way, data revenues were up by 5.7% in reported terms, although stripping out the effect of exchange rates they would have increased by 30.8% year-on-year in 2013. These accounted for 48% of service revenues (+3 p.p. year-on-year). This increase was mainly due to higher non-SMS data revenue (60.8% year-on-year, accounting for 49% of mobile data revenues (+9 p.p. year-on-year). |
| · | In Peru, mobile service revenues were up by 4.8% in reported terms, although excluding the effect of exchange rates they would have increased by 10.8% year-on-year in 2013 despite the negative impact of regulatory changes affecting fixed-mobile calls. Excluding the negative impact of the regulatory changes, the revenues would have grown 13.4% year-on-year in 2013. This increase was principally driven by data revenues, up by 28.4% in reported terms and up 35.8% year-on-year, excluding the effect of exchange rates. Additionally, these revenues continue to represent a growth opportunity as a result of the solid increase in non-SMS data revenues, up by 65% year-on-year and accounting for 81% of mobile data revenues in the year (+14 p.p. year-on-year). |
| · | In Venezuela and Central America, mobile service revenues increased by 4.4% in reported terms, although excluding the effect of exchange rates and hyperinflation in Venezuela, these would have increased by 34.6% year-on-year, due to the boost of mobile data services and the growth of voice traffic. Data revenues accounted for 29.9% of mobile service revenues. This evolution is boosted by the strong increase in non-SMS data revenue (+56.1% year-on-year), accounting for 64% of data revenues (+7 p.p. year-on-year). |
| · | The mobile service revenue growth was driven by the expansion of data in the region, reflected 42.8% in 2013 in non-SMS data revenues, excluding exchange rate differences and the effect of hyperinflation in Venezuela |
(17% in reported terms). Voice revenues dropped 5.2% year-on-year in reported terms but were up 11.6% year-on-year without exchange rate differences and the impact of hyperinflation in Venezuela, due to the sharp increase in traffic.
| · | Revenues from handset sales amounted to 1,510 million euros and fell 20.3% in reported terms, mainly as a result of the impact of exchange rate differences and the effect of hyperinflation in Venezuela. Excluding these effects, growth would have been 47.4%, growing in all countries in the region as result of the growth in smartphones. |
| · | Revenues from the fixed business fell 3.4% in reported terms, affected by exchange rate differences and the effect of hyperinflation in Venezuela. Excluding this effect, revenues from the fixed business increased 7.6% year-on-year. |
Total expenses, which include supplies, personnel expenses and other expenses (mainly subcontract expenses and others) but do not include depreciation and amortization expenses, stood at 11,562 million euros in 2013, growing 3.3% in reported terms, affected by:
| · | Exchange rate differences and the effect of hyperinflation in Venezuela (-14.3 p.p.); |
| · | The sale of non-strategic towers (-0.1 p.p.);and |
| · | Contractual changes in the commercial model for selling handsets in Chile (+1.5 p.p.). |
Excluding these effects, total expenses would have grown 16.2%. The change in total expenses is explained by:
| · | Argentina: expenses stood at 2,728 million euros, up by 2% year-on-year in reported terms. Excluding the effect of exchange rates, costs would have grown by 26.3% due to general price increases, although the company continues to make an effort to contain costs mitigating the effects of the high inflation. |
| · | Peru: expenses stood at 1,621 million euros, up by 3.5% year-on-year in reported terms. Excluding the effect of exchange rates, expenses would have grown by 9.5%. Excluding the effect of exchange rates and the sale of non-strategic towers, expenses would have increased by 10.0% due to higher commercial costs related to high-value customers, higher content costs, increased personnel costs due to profit-sharing (employees receive a percentage of the net profit) and larger tax costs, due to the 1% tax on profits from the TV and broad band businesses. |
| · | Venezuela and Central America: expenses stood at 2,520 million euros, up by 4.0% year-on-year in reported terms. Excluding the effect of exchange rates and hyperinflation in Venezuela, expenses would have increased by 33.6%, mainly due to the general price level, as well as due to the effect of the greater expenditure in U.S. dollars for services rendered and handset purchases, impacted by the impact of the depreciation of the Venezuelan bolívar. |
The breakdown by components explaining the 16.2% variation is as follows:
| · | Supplies increased to 4,983 million euros, an increase of 8.3% year-on-year in reported terms affected by the exchange rate differences and the effect of hyperinflation in Venezuela (-14.6 p.p.) and contractual changes in the commercial model for selling handsets in Chile (+3.6 p.p.). Excluding both effects, supply cost would have grown by 19%. The decline of MTR expenses (net of exchange rate differences and the effect of hyperinflation in Venezuela) did not offset the growth in costs, due to the greater commercial activity in the mobile business, with a higher weight of smartphone sales, and at the fixed business, with higher content costs associated with the sharp rise in Pay-TV accesses, and increased expenses associated with the provision of data services. |
| · | Personnel expenses stood at 1,746 million euros (+1.1% year-on-year in reported terms) growing 17.2% excluding the impact of exchange rates differences and the effect of hyperinflation in Venezuela. This year-on-year growth is mainly due to the impact of inflation in some countries in the segment. |
| · | Other expenses were 4,834 million euros, declining 0.7% in reported terms, affected by the exchange rate differences and the effect of hyperinflation in Venezuela (-13.3 p.p.) and the sale of non-strategic towers (-0.2 p.p.). |
Excluding both effects, other expenses grew 13.0%, due to the higher sales commissions and customer service expenses associated with increased commercial activity.
OIBDA stood at 5,531 million in 2013, showing a reported year-on-year decline of 7.6%, affected by:
| · | Exchange rate differences and the effect of hyperinflation in Venezuela (-16.1 p.p.). |
| · | Contractual changes in the commercial model for selling handsets in Chile (-2.8 p.p.). |
| · | The sale of non-strategic towers (-2.1 p.p.). |
Excluding the aforementioned items, OIBDA growth would have been 14.3%.
The OIBDA margin stood at 32.8% for the full year, down 2.9 percentage points year-on-year in reported terms; primarily due to the impactnegative evolution of interconnection price cuts on mobile service revenues. ARPU declined amid effortsthe exchange rates and lower sales of non-strategic towers in 2013 (11 million euros compared to optimize usage.139 million euros in 2012).
67
Our Servicesservices and Productsproducts
Mobile business
| · | Mobile voice |
| · | Value added |
| · | Mobile data and Internet |
| · | Wholesale |
| · | Corporate |
| · | Roaming: Roaming |
| · | Fixed |
| · | Trunking and |
The principal services we offerTelefónica offers in ourits fixed businesses in Spain, Europe and Latin America are:
| · | Traditional fixed telecommunication |
| · | Internet and broadband multimedia |
| · | Data and business-solutions |
and consultancy services, including network management, or CGP; and desktop services and system integration and professional services.
| · | Wholesale services for telecommunication |
Digital services
The main highlights in services developed by Telefónica Digital in 2014 are:
| · | Video/TV services: IPTV services (Internet protocol), over-the-top network television services, and cable and satellite TV. In certain markets, advanced Pay-TV services are offered, such as high-definition TV (HDTV), Multiroom (allowing clients to watch different TV channels in different rooms) and Digital Video Recording (DVR). |
| · | M2M: Includes both M2M connectivity services and end-to-end products in different countries including in-house developments, as the "smart" M2M solution, which enables "smart" meter communications services. |
| · | e-Health services or telecare: These services allow tele-assistance through connectivity services to chronic patients, and other eHealth services. |
| · | Financial services and other payment services: These services allow customers to make transfers, payments and mobile recharges among other transactions through prepay accounts or bank accounts. |
| · | Security services: Includes services such as the "Latch" applications, which allow consumers to remotely switch their digital services on and off. |
| · | Cloud computing services: These services include the Instant Servers services, Telefónica's new global public cloud service for corporate clients. This entails high-performance virtual servers that are optimized for mobile and corporate applications (both fixed and mobile). |
| · | Advertising: Includes advertising products based on SMS and IT Technologies such as SMS campaigns or bulk SMS sales to corporations, mobile portals and any other advertising related activities. |
| · | Big Data: Includes the product "Smart Steps" which helps retailers, municipalities and public security bodies to understand the influx of people. Anonymous mobile data network and aggregates are used to calculate the influx of people in an area. |
| · | Future Communications: Includes “TU Go”, Movistar´ s exclusive application that lets clients have the same number on all their devices and communicate among such devices via Wi-Fi. |
Sales and Marketing
Our sales and marketing strategy is aimed toward reinforcing our market position, generating brand awareness, promoting customer growth and achieving customer satisfaction. We use a variety of marketing initiatives and programs, including those that focus on customer value, with in-depth market segmentation; programs to promote customer loyalty; pricing initiatives aimed toward stimulating usage, including segmented packages and innovative tariff options; and initiatives that are responsive to the latest market trends, including those aimed toward boosting demand for our mobile Internet and mobile broadband offerings. In connection with these and our other sales and marketing initiatives, we market our products through a broad range of channels, including television, radio,
billboards, telemarketing, direct mail and Internet advertising. We also sponsor a variety of local cultural and sporting events in order to enhance our brand recognition.
Competition
The telecommunications industry is competitive and consumers generally have a choice of mobile and fixed line operators from which to select services. We are a global telecommunications services provider and face significant competition in most of the markets in which we operate. In Europe, our largest competitor is Vodafone and in Latin America, our largest competitor is América Móvil. Newer competitors, including handset manufacturers, MVNOs, internet companies and software providers, are also entering the market and offering integrated communications services.
We compete in our markets on the basis of the price of our services; the quality and range of featuresfeatures; the added value we offer with our service; additional services associated with those main services; the reliability of our network infrastructure and its technological attributes; and the desirability of our offerings, including bundled offerings of one type of service with another and, in the case of the mobile industry, in some of the markets offerings that include subsidized handsets.
To compete effectively with our competitors, we need to successfully market our products and services and to anticipate and respond to various competitive factors affecting the relevant markets, such as the introduction of new products and services, different pricing strategies and changes in consumer preferences. See “Risk Factors – Risks Relating to ourby the Group’s Industry – We operateThe Group operates in a highly competitive marketsregulated industry which requires government concessions for the provision of a large part of its services and the industry inuse of spectrum, which we operate is subject to rapid technological changes, which requires us to continually adapt to such changesa scarce and to upgrade our existing networks.”costly resource.
Strategic Partnerships
China Unicom
Since 2005, we have had a stake in China Unicom and its predecessor company. On September 6, 2009 we entered into a strategic alliance agreement with China Unicom, which provides, among other areas for cooperation, joint procurement of infrastructure and client equipment, common development of mobile service platforms, joint provisions of service to multinational customers, roaming, research and development, sharing of best practices and technical, operational and management know-how, joint development of strategic initiatives in the area of network evolution, joint participation in international alliances and exchanges of senior management. In furtherance of this strategic alliance we entered into a subscription agreement with China Unicom, pursuant to which we increased our voting interest in the share capital of China Unicom to 8.06% and China Unicom obtained 0.87% voting interest in our share capital in October 2009.
Pursuant to the strategic alliance agreement mentioned above, China Unicom has agreed to use its best endeavors to maintain a listing of all the issued ordinary shares of China Unicom on the Hong Kong Stock Exchange. For so long as the strategic alliance agreement with us is in effect, China Unicom shall not (i) offer, issue or sell any significant number of its ordinary shares (including treasury shares), or any securities convertible into or other rights to subscribe for or purchase a significant number of China Unicom’s ordinary shares (including treasury shares), to any current major competitor of Telefónica or (ii) make any significant investment, directly or indirectly, in any current major competitor of Telefónica. We made similar undertakings.
The initial term of the strategic alliance agreement between us and China Unicom terminatesterminated on September 6, 2012 and it is subject to automatic annual renewal,renewals, subject to either party’s right to terminate on six months’ notice. Also, the strategic alliance agreement may be terminated by China Unicom if our shareholding in China Unicom drops below 5% of its issued share capital or if China Unicom’s shareholding in us drops below 0.5% of our issued share capital. In addition, the strategic alliance agreement is subject to termination in the event either party is in default and automatically terminates on a change in control of China Unicom.
On January 28, 2011, China Unicom completed its acquisition of 21,827,499 Telefónica shares, representing approximately 1.37% of our voting share capital.shares.
On June 10, 2012, Telefónica, S.A. through its 100% subsidiary, Telefónica Internacional, S.A.U., and China United Network Communications Group Company Limited ("Unicom Parent") through a 100% owned subsidiary, signed an agreement for the acquisition by this last company of 1,073,777,121 shares of China Unicom-Hong Kong-Limited, owned by Telefónica, equivalent to 4.56% of the issued share capital of China Unicom.
On July 21, 2012 the aforementioned agreement was complemented by a Supplemental Agreement which determined the acquisition of the shares at a price of HK$10.02 per share, for a total amount of HK$10,759,246,752.42 (approximately 1,142 million euros). The transaction was completed on July 30, 2012.
On November 10, 2014, Telefónica, through its 100% subsidiary, Telefónica Internacional, S.A.U., sold 597,844,100 shares of China Unicom, representing 2.5% of the share capital of the company, by means of a block trade, at a price of HK$11.14 per share, for a total amount of HK$6,660 million, approximately 687 million euros at the exchange rate as at the date of the sale.
Further to the sale, Telefónica maintains its commitment to the strategic alliance with China Unicom.
As of the date of this Annual Report, Telefónica, through its wholly-owned subsidiary, Telefónica Internacional, has acquired 282,063,000 ordinary shares of China Unicom through several transactions executed in the period between January 23, 2011 and September 7, 2011, investing an aggregate amount equivalent to approximately 500 million U.S. dollars (equivalent to €358 million). Telefónica’snica's shareholding in China Unicom amounts to 9.6%2.51% of its capital stock asstock. Furthermore, Mr. César Alierta, chairman of Telefónica, S.A. is a member of the dateBoard of this Annual Report. In addition, at our General Shareholders’ Meeting on May 18, 2011Directors of China Unicom while Mr. Chang Xiaobing, a nominee proposed bychairman of China Unicom, was appointed asis a member of ourthe Board of Directors.Directors of Telefónica.
Telecom Italia
Through a series of transactions from 2007 throughto 2009, weTelefónica acquired an indirect holding of 10.49% in the voting shares of Telecom Italia (7.21% of the dividend rights) through ourits holdings in Telco.
On June 16, 2014, the three Italian shareholders of Telco requested the initiation of the process of "demerger" (spin off) of the company, as provided in their shareholders agreement. Implementation of the demerger, approved by the General Meeting of Shareholders of Telco held on July 9, 2014, remains subject to obtaining the required anti-trust and telecommunications approvals (including those from Brazil and Argentina). Once the aforementioned approvals are obtained, this decision will be implemented by transferring all the current stake of Telco in Telecom Italia to four newly created companies. The share capital of each of these companies will belong in its entirety to each of the shareholders of Telco and each of these companies will receive a number of shares of Telecom Italia proportional to the current economic stake in Telco of each respective shareholder.
The application process of the aforementioned anti-trust and telecommunications approvals (including those in Brazil and Argentina) to proceed to the "demerger" (spin off) of Telco started, once the corresponding corporate documents were entered into in Italy. On December 22, 2014, Anatel gave its approval to the spin off, though CADE and Argentina are still analyzing the process.
Furthermore, on July 24, 2014, Telefónica issued 750 million euros bonds mandatorily exchangeable into ordinary shares of Telecom Italia maturing on July 24, 2017, representing, as of that date, 6.5% of its current voting share capital. The bonds may be exchanged in advance of the transfer of the shares, except under certain circumstances where the company may opt to redeem the bonds in cash. As a result of this transaction, Telefónica, after the Telco demerger and the later transfer of the underlying shares of the bonds, will reduce its stake in Telecom Italia which will be between 8.3% and 9.4% in Telecom Italia current voting share capital.
It is also significant that, within the framework of the GVT transaction (see "Item 4. Information on the Company—History and Development of the Company”) on September 18, 2014, Vivendi, S.A. will acquire from Telefónica 1,110 million ordinary shares in Telecom Italia representing 8.3% of Telecom Italia’s voting share capital (equivalent to 5.7% of its total share capital), in exchange for 4.5% of Vivendi, S.A.'s capital in Telefónica Brasil, S.A., after its combination with GVT (which represents all of the voting shares and 0.7% of the preferred shares to be received by Vivendi S.A. in connection with the GVT transaction). The final closing of the operation is subject to obtaining the relevant regulatory authorizations (including telecommunication and anti-trust approval).
The Telecom Italia group is principally engaged in the communications sector and, particularly, in telephone and data services on fixed lines for final and wholesale customers, in the development of fiber optic networks for wholesale customers in the provision of broadband services and Internet services, in domestic and international mobile telecommunications (especially in Brazil), in the television sector using both analog and digital terrestrial technology and in the office products sector. Telecom Italia operates primarily in Europe, the Mediterranean basin and in South America.
For more information, please see “Item 4. Information on the Company —History and Development of the Company—Recent Developments,” “Item 5. Operating and Financial Review and Prospects —Operating Results—Significant Factors Affecting the Comparability of our Results of Operations in the Period Under Review” and “Item 10. Additional Information—Material Contracts.” Telco, through which we hold our stake in Telecom Italia, is included in our Consolidated Financial Statements using the equity method.
Regulation
Licenses and Concessions
Please see Appendix VIVII to our Consolidated Financial Statements.
Seasonality
Our main business is not significantly affected by seasonal trends.
Patents
Our business is not materially dependent upon the ownership of patents, commercial or financial contracts or new manufacturing processes.
Disclosure Pursuant to Section 219 of the Iran Threat Reduction and Syria Human Rights Act
Section 219 of the Iran Threat Reduction and Syria Human Rights Act of 2012 added Section 13(r) to the Exchange Act. Section 13(r) requires an issuer to disclose in its annual or quarterly reports filed with the SEC whether the issuer or any of its affiliates has knowingly engaged in certain activities, transactions or dealings with the Government of Iran, relating to Iran or with designated natural persons or entities involved in terrorism or the proliferation of weapons of mass destruction during the period covered by the annual or quarterly report. Disclosure is required even when the activities were conducted outside the United States by non-U.S. entities and even when such activities were conducted in compliance with applicable law.
The following information is disclosed pursuant to Section 13(r). None of these activities involved U.S. affiliates of Telefónica.
Roaming Agreements
Various of our subsidiaries have entered into roaming agreements with Iranian telecommunication companies, certain of which are or may be owned or controlled by the government of Iran. Pursuant to such roaming agreements our subsidiaries’ customers are able to roam in the particular Iranian network (outbound roaming) and customers of such Iranian operators are able to roam in our relevant subsidiary’s network (inbound roaming). For outbound roaming, our subsidiaries pay the relevant Iranian operator roaming fees for use of its network by our customers, and for inbound roaming the Iranian operator pays the relevant subsidiary roaming fees for use of its network by its customers.
Our subsidiaries were party to the following roaming agreements with Iranian telecommunication companies in 2014:
| (1) | Telefónica Móviles España (“TME”), our Spanish directly wholly-owned subsidiary, has respective roaming agreements with (i) Mobile Telecommunication Company of Iran (“MTCI”), (ii) MTN Irancell (“Irancell”), (iii) Taliya (“Taliya”) and (iv) Telecomunications Kish Co. (“TKC”). |
During 2014, TME recorded the following revenues related to these roaming agreements: (i) 20,337.27 euros from MTCI, (ii) 3,290.74 euros from Irancell, (iii) none from Taliya and (iv) none from TKC.
TME also holds a Roaming Hub agreement through its 55% directly-owned subsidiary, Link2One, a.e.i.e. (“L2O”). Under this agreement, L2O provides a roaming hub service to Irancell enabling the latter to maintain a relationship with other members of the hub. Some members of the hub are also entities of the Telefónica Group. Under this roaming hub service, for 2014, L2O has billed Irancell 114,428.69 euros.
| (2) | Telefónica Germany GmbH & Co. OHG (“TG”), our German 62.37% indirectly-owned subsidiary, has a roaming agreement with MTCI. TG recorded 156,966.00 euros in roaming revenues under this agreement in 2014. |
| (3) | Telefónica Brasil (“TB”), our Brazilian 73.96% indirectly owned subsidiary, has a roaming agreement with Irancell. TB recorded 0.90 U.S. dollars in roaming revenues under this agreement in 2014. |
| (4) | Telefónica UK Ltd (“TUK”), our English directly wholly-owned subsidiary, has a roaming agreement with Irancell. TUK recorded 1,558.34 euros in roaming revenues under this agreement in 2013. |
| (5) | Pegaso Comunicaciones y Sistemas, S.A. de C.V. (“PCS”), our Mexican directly wholly-owned subsidiary, has a roaming agreement with Irancell. PCS recorded no revenues under this agreement in 2014. |
| (6) | Telefónica Argentina, S.A. and Telefónica Móviles Argentina, S.A. (together TA), our Argentinean directly wholly-owned subsidiaries, have a roaming agreement with Irancell. TA recorded 43.96 U.S. dollars in roaming revenues under this agreement in 2014. |
| (7) | Telefónica Celular de Nicaragua, S.A. (“TCN”), our Nicaraguan 60% indirectly-owned subsidiary, has a roaming agreement with Irancell. TCN recorded no revenues under this agreement in 2014. |
| (8) | E-Plus Mobilfunk GmbH& Co. KG (“E-Plus”), our German 100% indirectly-owned subsidiary, has respective roaming agreements with MTCI, Irancell and Taliya. During 2014, E-Plus recorded the following revenues related to these roaming agreements: 1,415 euros from Irancell and none from Taliya. |
The net profit recorded by our subsidiaries pursuant to these agreements did not exceed the related revenues recorded thereunder.
The purpose of all of these agreements is to provide our customers with coverage in areas where we do not own networks. For that purpose, we intend to continue maintaining these agreements.
International Carrier Agreement
Telefónica de España has an international carrier agreement with Telecommunication Company of Iran (“TCI”).
Pursuant to this agreement, both companies interconnect their networks to allow international exchange of telephone traffic. Telefónica de España recorded 10,594 euros in revenues under this agreement in 2014. The net profit recorded by Telefónica de España pursuant to this agreement did not exceed such revenues.
The purpose of this agreement is to allow exchange of international telephone traffic. Consequently, we intend to continue maintaining this agreement.
See “—History and Development of the Company” and “—Business Overview.”
Our central headquarters for the Telefónica Group are located in “Distrito Telefónica,” in Madrid, Spain.
Fixed Networks
We own fixed networks in Spain, Latin America and Europe, having an incumbent role in Spain, Argentina (the greater Buenos Aires metropolitan area and the southern portion of the country), Brazil (São Paulo), Chile, Peru Colombia and the Czech Republic.Colombia.
Following market trends, competitive environments, evolution of technologies and new multimedia and broadband services demanded by our customers, we have upgraded our networks in recent years in the following manners:
| · | progressive introduction of broadband access technologies over copper: ADSL, ADSL2+, VDSL2, etc., increasing the bandwidth capacity provided to our broadband clients several times in the last |
| · | introduction of fiber access technologies (xPON) across different deployment scenarios: fiber to the home (FTTH), fiber to the building (FTTB), fiber to the curb (FTTC), fiber to the node (FTTN), etc., increasing the access speed up to 100 Mbps; |
| · | service support based on powerful Internet Protocol/ Multiprotocol Label Switching (IP/MPLS) backbones, providing full connectivity to the rest of the network layers, such as access and control, to support services for business and customer market segments (fixed and mobile); |
| · | migration of the legacy time division multiplexing (TDM) switching networks (PSTN and ISDN) to new generation network (NGN) over all-IP packet networks; |
| · | migration from legacy transport technologies, such as asynchronous transfer mode (ATM), frame relay (FR), low-rate leased lines, plesiochronous digital hierarchy (PDH) and synchronous digital hierarchy (SDH), to the new generation of optical transport ones, such as dense wavelength division multiplexing (DWDM), coarse wavelength division multiplexing (CWDM) and new |
| · | introduction of IMS (Internet Multimedia Subsystem) in many countries to simplify the control of the network and ease the deployment of new services over the all-IP converged network; |
| · | empowerment of the intelligence of the network to better manage its use, to avoid saturations and frauds and to identify new business opportunities; |
| · | convergence of fixed and mobile networks, services and support systems from both technological and operational points of view; and |
| · | deployment of new services such as |
Mobile Networks
We operate mobile networks in Spain, the United Kingdom, Germany, Ireland, the Czech Republic, Slovakia, Brazil, Argentina, Venezuela, Chile, Peru, Colombia, Mexico, Guatemala, Panama, El Salvador, Nicaragua, Costa Rica, Ecuador and Uruguay.
We use a number of mobile technologies in the countries in which we operate, namely: GSM and UMTS in Spain, the United Kingdom, Ireland, Germany, Czech Republic, Slovakia and Latin America; CDMA 1Xand LTE in other countries in Latin America (such as,Germany, Spain, the United Kingdom, Brazil, VenezuelaChile, Colombia, Peru, Mexico and Colombia) and, in the Czech Republic (CDMA 450 MHz).Uruguay. We continue the work of upgrading our mobile networks in line with market trends, the demand of new services from customers and the evolution of technologies. The main steps we are currently taking include:
| · |
| · | deployment of new services such as mobile television and distribution services for next generation music, video and games; |
| · | exploration of the adequacy of new technologies such as HSPA and LTE to provide mobile accesses with increased bandwidth, in particular: |
| HSPA: |
| LTE: together with main vendors and sharing experience with other operators, we have extensively analyzed the opportunities that LTE will bring, as 4G mobile technology is used to complement current network technology by creating higher capacity at lower relative cost by user/traffic |
| convergence of fixed and mobile networks, services and support systems from both technological and operational points of view. |
Satellite communications
The services provided using satellite platforms include television contribution signal to feed cable and IPTV head ends, DTH television, VSAT mainly for telephony and Internet access in rural areas, emergency solutions, corporate communications and international communications.
Submarine cables
We are one of the world’s largest submarine cable operators. We participate in approximately 25 international underwater cable systems (nine of which are moored in Spain) and own eleven domestic fiber optic cables.
There are submarine cable connections between Spain and Africa, America, Asia and Europe, respectively, which are jointly owned by us with other telecom operators. The SAM-1 cable, which we own, has a length of approximately 22,000 kilometers underwater and 3,000 kilometers terrestrial and links different countries such as the United States, Puerto Rico, Ecuador, Guatemala, Peru, Chile, Brazil, Argentina and Colombia.
The principal services using the capacity of submarine cables are voice circuits, Internet and dedicated circuits for international traffic and for corporations and business customers.
Not applicable.
Presentation of Financial Information
The information in this section should be read in conjunction with our Consolidated Financial Statements and the notes thereto, included elsewhere in this Annual Report. Our Consolidated Financial Statements have been prepared in accordance with IFRS as issued by the IASB.
On February 26, 2014, the Board of Directors of Telefónica, S.A. approved the implementation of a new organizational structure focused on clients and which incorporates the digital offering as the main focus for commercial policies. The structure gives greater visibility to local operators, bringing them closer to the corporate decision-making center, simplifying the Group’s global structure and strengthening the cross-cutting areas to improve flexibility and agility in decision making.
Due to the implementation of this new organizational structure, from the beginning of 2014, the new organizational structure is composed of Telefónica Spain, Telefónica EuropeUnited Kingdom, Telefónica Germany, Telefónica Brazil and Telefónica LatinHispanoamérica (comprised of Argentina, Chile, Peru, Colombia, Mexico, Venezuela & Central America, eachEcuador and Uruguay). All that is not specifically included in these new segments is part of which oversees“Other companies and eliminations”. As a result, the integratedGroup’s segment results have been revised for the year 2012 and 2013 to reflect the above-mentioned new organization. Because this is an intragroup change, Telefónica’s consolidated results for 2012 and 2013 are not affected.
Additionally, as a result of management integrations undertaken in Peru, Argentina and Chile, the revenue breakdown has been reclassified, allocating “inter-company” eliminations within fixed and mobile telephone and other businesses in its region. These three business areas form the basis of our segment reporting in our Consolidated Financial Statements.businesses.
Non-GAAP financial information
Operating income before depreciation and amortization
Operating income before depreciation and amortization, or OIBDA, is calculated by excluding depreciation and amortization expenses from our operating income in order to eliminate the impact of generally long-term capital investments that cannot be significantly influenced by our management in the short term.short-term. Our management believes that OIBDA is meaningful for investors because it provides an analysis of our operating results and our segment profitability using the same measure used by our management. OIBDA also allows us to compare our results with those of other companies in the telecommunications sector without considering their asset structure. We use OIBDA to track our business evolution and establish operational and strategic targets. OIBDA is also a measure commonly reported and
widely used by analysts, investors and other interested parties in the telecommunications industry. OIBDA is not an explicit measure of financial performance under IFRS and may not be comparable to other similarly titled measures for other companies. OIBDA should not be considered an alternative to operating income as an indicator of our operating performance, or an alternative to cash flows from operating activities as a measure of our liquidity.
The following table provides a reconciliation of our OIBDA to operating income for the periods indicated.
Year ended December 31, | ||||||||||||
2009 | 2010 | 2011 | ||||||||||
| (in millions of euro) | ||||||||||||
Operating income before depreciation and amortization | 22,603 | 25,777 | 20,210 | |||||||||
Depreciation and amortization expense | (8,956 | ) | (9,303 | ) | (10,146 | ) | ||||||
Operating income | 13,647 | 16,474 | 10,064 | |||||||||
77
| Year ended December 31, | |||
| Millions of euros | 2012 | 2013 | 2014 |
| Operating income before depreciation and amortization | 21,231 | 19,077 | 15,515 |
| Depreciation and amortization expense | (10,433) | (9,627) | (8,548) |
| Operating income | 10,798 | 9,450 | 6,967 |
The following tables provide a reconciliation of OIBDA to operating income for us and each of our business areas for the periods indicated.
Year ended December 31, 2011 | ||||||||||||||||||||
Telefónica Spain | Telefónica Latin America | Telefónica Europe | Others and Eliminations | Total | ||||||||||||||||
| (in millions of euro) | ||||||||||||||||||||
| Operating income before depreciation and amortization | 5,072 | 10,941 | 4,233 | (36 | ) | 20,210 | ||||||||||||||
| Depreciation and amortization expense | (2,088 | ) | (4,783 | ) | (3,117 | ) | (158 | ) | (10,146 | ) | ||||||||||
Operating income | 2,984 | 6,158 | 1,116 | (194 | ) | 10,064 | ||||||||||||||
Year ended December 31, 2010(1) | |||||||||||||||||||||||||||
Telefónica Spain | Telefónica Latin America | Telefónica Europe | Others and Eliminations | Total | |||||||||||||||||||||||
| (in millions of euro) | |||||||||||||||||||||||||||
| 2014 | 2014 | ||||||||||||||||||||||||||
| Millions of euros | Telefónica Spain | Telefónica United Kingdom | Telefónica Germany | Telefónica Brazil | Telefónica Hispano américa | Other companies and eliminations | Total Group | ||||||||||||||||||||
| Operating income before depreciation and amortization | 8,520 | 13,713 | 4,080 | (536 | ) | 25,777 | 5,671 | 1,744 | 733 | 3,543 | 4,068 | (244) | 15,515 | ||||||||||||||
| Depreciation and amortization expense | (2,009 | ) | (3,954 | ) | (3,201 | ) | (139 | ) | (9,303 | ) | (1,805) | (1,121) | (1,426) | (1,762) | (2,034) | (400) | (8,548) | ||||||||||
Operating income | 6,511 | 9,759 | 879 | (675 | ) | 16,474 | 3,866 | 623 | (693) | 1,781 | 2,034 | (644) | 6,967 | ||||||||||||||
| 2013 | |||||||
| Millions of euros | Telefónica Spain | Telefónica United Kingdom | Telefónica Germany | Telefónica Brazil | Telefónica Hispano américa | Other companies and eliminations | Total Group |
| Operating income before depreciation and amortization | 6,340 | 1,637 | 1,308 | 3,940 | 5,531 | 321 | 19,077 |
| Depreciation and amortization expense | (1,903) | (1,016) | (1,231) | (2,109) | (2,524) | (844) | (9,627) |
| Operating income | 4,437 | 621 | 77 | 1,831 | 3,007 | (523) | 9,450 |
Year ended December 31, 2009(1) | ||||||||||||||||||||
Telefónica Spain | Telefónica Latin America | Telefónica Europe | Others and Eliminations | Total | ||||||||||||||||
| (in millions of euro) | ||||||||||||||||||||
| Operating income before depreciation and amortization | 9,757 | 9,041 | 3,999 | (194 | ) | 22,603 | ||||||||||||||
| Depreciation and amortization expense | (2,140 | ) | (3,700 | ) | (2,988 | ) | (128 | ) | (8,956 | ) | ||||||||||
Operating income | 7,617 | 5,341 | 1,011 | (322 | ) | 13,647 | ||||||||||||||
| 2012 | |||||||
| Millions of euros | Telefónica Spain | Telefónica United Kingdom | Telefónica Germany | Telefónica Brazil | Telefónica Hispano américa | Other companies and eliminations | Total Group |
| Operating income before depreciation and amortization | 6,815 | 1,602 | 1,351 | 5,161 | 5,983 | 319 | 21,231 |
| Depreciation and amortization expense | (2,063) | (995) | (1,233) | (2,318) | (2,762) | (1,062) | (10,433) |
| Operating income | 4,752 | 607 | 118 | 2,843 | 3,221 | (743) | 10,798 |
Net financial debt and net debt
We calculate net financial debt by deducting the positive mark-to-market value of derivatives with a maturity beyond one year from the relevant balance sheet date and other interest-bearing assets (each of which are components of non-current financial assets and trade and other receivables in our consolidated statement of financial position), current financial assets and cash and cash equivalents from the sum of (i) current and non-current interest-bearing debt (which includes the negative mark-to-market value of derivatives with a maturity beyond one year) and (ii) other payables (a component of current and non-current trade and other payables in our consolidated statement of financial position). We calculate net debt by adding to net financial debt those commitments related to financial guarantees, not considered as net financial debt, and those related to workforce reduction.employee benefits. We believe that net financial debt and net debt are meaningful for investors because they provide an analysis of our solvency using the same measures used by our management. We use net financial debt and net debt to calculate internally certain solvency and leverage ratios used by management. Neither net debt nor net financial debt as calculated by us should be considered an alternative to gross financial debt (the sum of current and non-current interest-bearing debt) as a measure of our liquidity.
The following table provides a reconciliation of our net financial debt and net debt to gross financial debt at the dates indicated:
As of December 31, | ||||||||||||
2009 | 2010 | 2011 | ||||||||||
| (in millions of euro) | ||||||||||||
Non-current interest-bearing debt | 47,607 | 51,356 | 55,659 | |||||||||
Current interest-bearing debt | 9,184 | 9,744 | 10,652 | |||||||||
Gross financial debt | 56,791 | 61,100 | 66,311 | |||||||||
Other non-current payables | 515 | 1,718 | 1,583 | |||||||||
| Other current payables (deferred payment for the acquisition of Brasilcel) | — | 1,977 | — | |||||||||
Non-current financial assets(1) | (2,736 | ) | (3,408 | ) | (4,830 | ) | ||||||
Current financial assets | (1,906 | ) | (1,574 | ) | (2,625 | ) | ||||||
Cash and cash equivalents | (9,113 | ) | (4,220 | ) | (4,135 | ) | ||||||
Net financial debt | 43,551 | 55,593 | 56,304 | |||||||||
Commitments related to financial guarantees | 71 | — | — | |||||||||
Net commitments related to workforce reduction | 2,261 | 1,710 | 1,810 | |||||||||
Net debt | 45,883 | 57,303 | 58,114 | |||||||||
| Millions of euros | 12/31/2014 | 12/31/2013 | 12/31/2012 |
| Non-current interest-bearing debt | 50,688 | 51,172 | 56,608 |
| Current interest-bearing debt | 9,094 | 9,527 | 10,245 |
| Gross financial debt | 59,782 | 60,699 | 66,853 |
| Non-current trade and other payables | 1,276 | 1,145 | 1,639 |
| Current trade and other payables | 210 | 99 | 145 |
| Non-current financial assets | (6,267) | (4,468) | (5,605) |
| Trade and other receivables | (453) | − | − |
| Current financial assets | (2,932) | (2,117) | (1,926) |
| Cash and cash equivalents | (6,529) | (9,977) | (9,847) |
| Net financial debt | 45,087 | 45,381 | 51,259 |
| Net commitments related to employee benefits | 1,976 | 2,270 | 2,036 |
| Net debt | 47,063 | 47,651 | 53,295 |
Significant Factors Affecting the Comparability of our Results of Operations in the Periods Under Review
Please see “Comparative information and main changes in the consolidation scope” in Note 2 to our Consolidated Financial Statements.
Significant Changes in Accounting Policies
Please see Note 3(s)3(n) to our Consolidated Financial Statements.
Critical Accounting Policies and Estimates
The preparation of financial statements in conformity with IFRS requires management to make estimates and assumptions that affect the amounts reflected in the Consolidated Financial Statements and accompanying notes. We base our estimates on historical experience, where applicable, and other assumptions that we believe are reasonable under the circumstances. Actual results may differ from those estimates under different assumptions or conditions.
We consider an accounting estimate to be critical if:
| · | it requires us to make assumptions because information was not available at the time or it included matters that were highly uncertain at the time we were making our estimate; and |
| · | changes in the estimate or different estimates that we could have selected may have had a material impact on our financial condition, |
The various policies that are important to the portrayal of our financial condition, results of operations and cash flows include:
| · | accounting for long-lived assets, including goodwill; |
| · | deferred taxes; |
| · | provisions; |
| · | revenue recognition; and |
| · |
Accounting for long-lived assets, including goodwill
Property, plant and equipment and intangible assets, other than goodwill, are recorded at acquisition cost. If such assets are acquired in a business combination, the acquisition cost is the estimated fair value of the acquired property, plant and equipment or intangible assets. Property, plant and equipment and intangible assets with definite useful lives are depreciated or amortized on a straight-line basis over their estimated useful lives.
Intangible assets with indefinite useful lives are not amortized, but are, instead, subject to an impairment test on a yearly basis and whenever there is an indication that such assets may be impaired.
Accounting for long-lived assets and intangible assets involves the use of estimates for determining: (a) the fair value at the acquisition date in the case of such assets acquired in a business combination, and (b) the useful lives of the assets over which they are to be depreciated or amortized. We believe that the estimates we make to determine an asset’s useful life are “critical accounting estimates” because they require our management to make estimates about technological evolution and competitive uses of assets.
When an impairment in the carrying amount of an asset occurs, non-scheduled write-downs are made. We perform impairment tests of identifiable intangible and long-lived assets whenever there is reason to believe that the carrying value may exceed the recoverable amount, which is the higher of the asset’s fair value less costs to sell and its value in use. Furthermore, previously recognized impairment losses may be reversed when changes in the estimates used to determine the asset’s recoverable amount indicate that an impairment loss recognized in prior periods no longer exists or may have decreased.
The determination of whether the impairment of long-lived and intangible assets is necessary involves the use of significant estimates and judgment that includes, but is not limited to, the analysis of the cause of potential impairment in value, the timing of such potential impairment and an estimate of the amount of the impairment, which requires the estimation of the future expected cash flows, discount rates and the fair value of the assets.
Specifically, management has to make certain assumptions in respect of uncertain matters, such as growth in revenues, changes in market prices, operating margins, and technology developments and obsolescence, discontinuance of services and other changes in circumstances that indicate the need to perform an impairment test. Management’s estimates about technology and its future development require significant judgment because the timing and nature of technological advances are difficult to predict.
Goodwill arises when the cost of a business combination exceeds the acquirer’s interest in the net fair value of the identifiable assets acquired and liabilities and contingent liabilities assumed.assumed at the acquisition date. Goodwill is not amortized, but is, instead, subject to an impairment test on a yearly basis and whenever there is an indication that the goodwill may be impaired.
Non-scheduled write-downs of goodwill are made when an impairment in the carrying amount of goodwill occurs. We review, on a regular basis, the performance of our cash-generating units. We compare the carrying amount of the cash-generating unit to which the goodwill has been allocated with its recoverable amount. The determination of the recoverable amount of the cash-generating unit involves extensive use of estimates and significant management judgment is involved. Methods commonly used by us for valuations include discounted cash flow methods.
A significant change in the facts and circumstances that we relied upon in making our estimates may have a material impact on our operating results and financial condition.
Deferred taxes
Management assesses the recoverability of deferred tax assets on the basis of estimates of our future taxable profit. The recoverability of deferred tax assets ultimately depends on our ability to generate sufficient taxable profit during the periods in which the deferred tax assets are utilized. In making this assessment, our management considers the scheduled reversal of deferred tax liabilities, projected taxable profit and tax planning strategies.
This assessment is carried out on the basis of internal projections, which are updated to reflect our most recent operating trends. In accordance with applicable accounting standards, a deferred tax asset must be recognized for all deductible temporary differences and for the carry-forward of unused tax credits and unused tax losses to the extent that it is probable that taxable profit will be available against which the deductible temporary difference can be utilized. Our current and deferred income taxes are impacted by events and transactions arising in the normal course of business as well as in connection with special and non-recurring items. Assessment of the appropriate amount and classification of income taxes is dependent on several factors, including estimates of the timing and realization of deferred tax assets and the timing of income tax payments. Actual collections and payments may materially differ from these estimates as a result of changes in tax laws as well as unanticipated future transactions impacting our income tax balances.
Provisions
Provisions are recorded when, at the end of the period, we have a present obligation as a result of past events, whose settlement requires an outflow of resources that is considered probable and can be measured reliably. This obligation may be legal or constructive, arising from, but not limited to, regulation, contracts, common practice or public commitments, which have created a valid expectation for third parties that we will assume certain responsibilities. The amount recorded is the best estimation performed by the management in respect of the expenditure that will be required to settle the obligations, considering all the information available at the closing date, including the advice of external experts, such as legal advisors or consultants.
If we are unable to reliably measure the obligation, no provision is recorded and information is then presented in the notes to the Consolidated Financial Statements.
Because of the inherent uncertainties in this estimation, actual expenditures may be different from the originally estimated amount recognized.
Revenue recognition
Connection fees
Revenues from connection fees originated when customers connect to our network are deferred over the average expected length of the customer relationship.
The expected customer relationship period is estimated based on recent historical experience of customer churn rates. Significant changes in our estimations may result in differences in the amount and timing of revenues recognized.
Multiple-element arrangements
Arrangements involving the delivery of bundled products or services are assessed to determine whether it is necessary to separate the arrangement into individual component deliverables, each with its own revenue recognition criteria.
Additionally, a significant change in the facts and circumstances upon which we based our fair value estimates may have an impact on the allocation of revenues among the different deliverables identified and, consequently, on future revenues.
Exchange rate used to remeasure the financial statements of our Venezuelan subsidiaries
As of December 31, 2014, there are multiple exchange mechanisms and published exchange rates potentially available to remeasure BsF-denominated items and transactions in the financial statements of the Group’s Venezuelan subsidiaries.
We review, on a regular basis, the economic conditions in Venezuela and the specific circumstances of our Venezuelan operations. Assessment of the exchange rate that better reflects the economics of Telefónica’s business activities in Venezuela relies on several factors and is performed considering all the information available at the closing date, involving the use of estimates, where significant management judgment is required.
Because of the inherent uncertainties in the estimations required to determine the appropriate exchange rate for the conversion of BsF-denominated financial statements, actual cash flows denominated in such currency may differ from the amounts originally recognized on the basis of our estimations, as a result of changes in currency laws or changes in exchange mechanisms or published exchange rates that may have a material impact on the conversion rate to be used for our Venezuelan subsidiaries’ financial statements, affecting the net monetary position of assets (liabilities) denominated in BsF.
Operating Environment
Our results of operations are dependent, to a large extent, on the level of demand for our services in the countries in which we operate. Demand for services in those countries is affected by the performance of their respective economies, including changes inparticularly household private consumption, but also gross domestic product, or GDP, inflation, or CPI, external accounts and unemployment rates.
During 2014, global activity picked up and recent developments suggest that this process may consolidate along 2015. The European Union is showing signs of turning the corner from recession to recovery due to the improvement of internal demand, especially in Spain and in the United Kingdom.
In Latin America, economic growth in 2015 is expected to be higher than in 2014, although the growth rates are expected to be significantly lower than those achieved before the recession. Moreover, commodity prices, especially oil, are expected to pose downward risks to the external accounts balances and to activity growth in the region. Additionally, a faster monetary normalization in the United States could have an impact on inward external flows, making financing conditions in Latin American countries more stringent, which would affect household private consumption negatively.
Operating environment by country
Spain
In 2011,2014, Spanish GDP grewexpanded by 0.7% (Spanish National Institute of Statistics estimates)1.2% (according to Consensus Economics Forecast (“CFe”), an independent research firm), compared with a positive average annual growth rate of 3.6% in the period 1998 through 2008 and a contraction on average of 1.8%1.3% in 2009 and 2010. 2009-2013.
This performance was explained by a contractionpositive evolution of internal demand, thoughwith household consumption grew at 0.1%increasing 2.0% according to Consensus Forecast’s (an independent research firm) estimates (“CFe”)CFe in 20112014 compared with ana negative annual rate of -1.7%-2.0% during 2009-102009-13 and compared with average growth of 3.6% during the period 1998 through 2008.
Investment contractedgrew at an annual rate of 4.4%0.8% (CFe) during 20112014, after a 11.3%8.2% decline on average in 2009 and 2010,2009-13, compared with average annual growth of 5.6% during the period 1998 through 2008. Inflation averaged 3.2%was -1.0% in 2011,2014, compared with 1.9% on average0.3% and 3.0% in 20092013 and 2010 and -0.3% in 2009. Despite the higher average annual inflation rate, prices in 2011 experienced a high degree of volatility throughout the year, reaching a minimum of 2.4% in December having reached a maximum of 3.8% in April. 2012, respectively.
The current account deficitsurplus for 2011 reached 4.0%2014 was 0.4% of GDP (CFe), compared with 4.6%1.5% of GDP in 20102013 and 5.2% of GDP-3.1% on average in 2009. 2009 through 2012.
The unemployment rate reached 22.85%24.6% at the end of 2011,2014, higher than the average ratesrate of 20.3%21.2% in 2010 and 18.8%2009-12, but less than the 26.1% reached in 2009.2013.
United Kingdom
In 2011,2014, the British economy, measured in terms of GDP, grew by 0.9%3.0% compared with a growth rate of 1.7% in 2013 and 0.7% in 2012.
Fixed capital investment increased by 8.1% in 2014, compared with an increase of 3.2% in 2013. Private consumption grew by 2.4%, compared with a growth rate of 2.1%1.6% and 1.1% in 20102013 and a negative growth rate of 4.4% in 2009. Fixed capital investment decreased by 1.9% (CFe), compared with a growth of 3.1% in 2010 and a contraction of 13.4% in 2009. Private consumption fell by 0.9% (CFe), compared with a 1.2% growth rate in 2010 after falling at an annual rate of 3.5% in 2009. 2012, respectively.
The CPI increased by an average0.5% in 2014, compared with 2.0% in 2013 and 2.7% in 2012. It is the lowest CPI figure since August 2000.
Germany
In 2011,2014, the German economy grew 3.0%1.4%, after growing 3.7%0.1% in 20102013 and contracting 5.1%0.4% in 2009. Growth2012.
The economic growth recovery in 20112014 was mainly due to an expansion in fixed income investmenta positive contribution of 6.5% (CFe) in such year, and the positiveinternal demand, which offset the negative contribution of the external sector to GDP growth (exports increased 11.6%just 3.5% while imports grew 11%)4.5%, CFe). Because of this,
In December 2014 the current account balance declined to 5.2%CPI rate reached 0.2% year-on-year (compared with 1.4% in 2011, from 5.7% of GDP2013 and 2.0% in 2010. Inflation averaged 2.3% in 2011, compared with 1.1% in 20102012), and 0.3% in 2009. At the end of 2011, inflation stood at 2.1%. At the end of 2011, the unemployment rate stood at 6.6 %, compared with an average of 7.7% in 2010 and 8.1% in 2009. In 2011, 546,250 jobs were created, compared with the 188,500 jobs created in 2010 and the 18,250 created in 2009, according to Bundesbank.
Brazil
Brazilian GDP increased more than 2%approximately 0.2% in 2011,2014 (CFe), following an increaseincreases of 7.5%2.5% in 20102013 and a contraction of 0.3%1.0% in 2009. Investment increased more than 4% in 2011, compared with an increase of 21.3% in 2010 and following a decrease of 6.7% in 2009 (Source:2012, according to the Brazilian Geography and Statistics Institute). Institute. Investments contracted by approximately 6.4% in 2014, after an increase of 5.2% in 2013. Household consumption growth decelerated to approximately 1.5% in 2014, from 2.6% in 2013.
Inflation, as measured by the CPI, increased to 6.5%by 6.4% in 2014 (above the inflation target established by the Brazilian Central Bank of 4.5%), but within its range of tolerance), compared withto 5.9% in 20102013 and 4.3%5.8% in 2009.2012. Due to increasing inflation, the basic interest rate, the SELIC,Special Clearance and Escrow System rate (Selic rate), was increasedraised from 10.75%10% at the end of 2013 to 11% in 2011. 11.75% at the end of 2014.
The current account deficit reached $52.690.9 billion U.S. dollars in 2011,2014, compared with $47.3to 81.4 billion U.S. dollars in 20102013 and $24.354.2 billion U.S. dollars in 2009. This2012. The deficit observed in 20112014 was partially financed by capital inflows, such as foreign direct investments, of $66.762.4 billion U.S. dollars, and portfolio investments, of 25.1 billion. As a consequence, international26.5 billion U.S. dollars. International reserves rosedecreased by $63.41.7 billion U.S. dollars in 2011,2014, to a record level of $352 billion. Despite374.1 billion U.S. dollars.
With the improvement inworsening of most domestic economic data, especially those regarding government accounts, the deterioration of worldwide economic circumstances led to an increase in country risk.risk increased. The J.P. Morgan Emerging Markets Bond Index Plus (EMBI + Brazil) ended 2011 at 233 basis points, from 189reached 259 basis points at the end of 2010 and 1922014, down from 224 basis points at the end of 2009. As2013 and 142 basis points at the risk increased and the global economic environment became more challenging, the exchange rate halted its appreciatory trend.end of 2012.
The Brazilian real continued to depreciate in 2014. The Brazilian real depreciated against the U.S. dollar by 7.7 %13.4% in 2011,2014, reaching an exchange rate of R$1.882.66 reais per $1.001 U.S. dollar on December 31, 2011, from R$1.672014, compared to 2.34 reais per $1.001 U.S. dollar on December 31, 20102013 and R$1.74to 2.04 reais per $1.00 at the end of 2009.1 U.S. dollar on December 31, 2012.
Mexico
Mexico’s real GDP grewincreased by 3.9%an estimated 2.3% in 2014 (CFe), compared with a 1.7% and 3.7% growth in 2011, after growing 5.4% in 20102013 and after contracting 6.1% in 2009. 2012, respectively.
Inflation, as measured by the CPI, was 3.82% at4.1% year-on-year in December 20112014 compared with 4.15% at4.0% in December 2010,2013, above the central bank’sMexican Central Bank’s target of 3% but insideand also outside its tolerance range of 2% to 4%. Despite
During 2014, aggregate demand in Mexico has continued to show the stabilizing trend that began in 2010, following the harsh economic downturn suffered in 2009, during 2011 the aggregate demand in Mexico has shown a stabilizing trend that began in 2010. Indeed, exports have2009. Exports increased by more than 7%5.5%, private consumption increased by almost 4.5%2.2% and investment increased by 7.5%2.0% compared with 2010. 2013.
The current account balance posted a deficit of $1025.2 billion U.S. dollars in 2011,2014 –according to CFe- compared with $5.726.5 billion U.S. dollars in 2010. These external imbalances were well financed by capital inflows2013 (1.9% and international reserves held by the central bank reached $143 billion in 2011 (amounting to 12.6%2.1% of GDP)GDP, respectively). At
On December 31, 2011,2014, the exchange rate relative to the
U.S. dollar was 13.9414.83 Mexican pesos to the U.S. dollar (compared with the minimum of 11.65 Mexican pesos to the U.S. dollar reached in July 2011)(13.08 and 12.87 on December 31, 2013 and 2012 respectively).
Venezuela
Consumption fell 2.5% year-on-year on average in the first three quarters of 2014 (compared to an increase of 4.4% in 2013 and 6.9% in 2012). PrivateDespite the higher inflation, public consumption increased 3.7%grew only by 0.8% (compared withto growth of 3.3% in 2013 and 6.3% in 2012) while the private sector contracted by 3.3% (compared to a positive growth of 4.7% in 2013 and 7.0% in 2012) and investments declined by 17.9% (compared to a decrease of 1.9%-9.0% in 20102013 and a positive growth of 23.3% in 2012).
Additionally exports declined by 9.5% (compared to a decrease of 2.9%-8.6% in 2009) despite high inflation, mainly2013 and positive growth of 4.9% in 2012), and imports contracted by 19.0% (compared to a decrease of 10.6% in 2013 and positive growth of 26.8% in 2012). During 2014, exports were negatively impacted by the downfall of oil prices and oil production, but imports decreased to a larger extent due to the high expansioneconomic crisis that the country is facing. As a result, the current account surplus was higher in public consumption. In 2011, investment showed2014 than in 2013, reaching 9.9 billion U.S. dollars in the first nine months of 2014, compared with 4.9 billion U.S. dollars in the first nine months of 2013.
Also, the capital account deficit reached 7.5 billion U.S. dollars in the first nine months of 2014, compared with a 12.5% growth (growthdeficit of 1.0%5.9 billion U.S. dollars in 2010 and a decreasethe same period of 19.1% in 2009), public consumption grew 6.0% (growth2013. This performance diminished the Venezuelan Central Bank’s stock of 2.1% in 2010 and 1.5% in 2009), exports increased 5.9% (decreaseinternational reserves to 22.06 billion U.S. dollars at the end of 12.9% in 2010 and 13.7% in 2009), and imports increased 13.4% (decreaseSeptember 2014 compared with 21.48 billion U.S. dollars at the end of 2.9% in 2010 and 19.6% in 2009). December 2013.
In terms of inflation, the national CPI rosereached 63.6% year-on-year in November 2014 (compared to 27.6%56.2% year-on-year in 2011, 27.2%December 2013 and 20.1% year-on-year in 2010 and 25.1% in 2009.December 2012). Venezuela continues to havestill has the highest inflation rate in Latin America.
The unemployment rate reached 8.2%5.9% as of November of 2014, compared to 5.6% at the end of 2011, 8.7%2013 and 5.9% at the end of 2010 and 7.9% at the end of 2009. The external accounts experienced a positive impact as a result of the recovery of oil prices, with the current account surplus increasing to $31.5 billion in 2011, in comparison with $14.4 billion in 2010 and $8.6 billion in 2009. Additionally, the capital account deficit reached $32.6 billion in 2011, compared with deficits of $18.6 billion in 2010 and $14.0 billion in 2009. This performance generated a reduction in the central bank’s stock of international reserves to $29.9 billion at the end of 2011 (Source: Central Bank of Venezuela).2012.
Chile
Chilean GDP expanded moderately at an estimated rate of 1.9% (CFe), the lowest since the recession of 2009 and 3.4 percent points under the average annual growth rate for the 2010-2013 period (5.3%). Private consumption slowed down and grew by an estimated 6.3% (CFe)1.8% compared with 5.6% in 2011,2013 and 6.0% in 2012. Investment, in turn, is estimated to have contracted for the highest annual growthfirst time since 2009. As most emerging economies, Chile faced headwinds from the international financial markets tightening, the decreasing commodity prices (especially copper prices) and the emerging/advanced capital flows reallocation. Domestically, a persistent slack of confidence and decreasing expectations also weighed negatively on expenditure decisions.
The labor market was substantially resilient to the economic underperformance and the unemployment rate increased from an average of 6.0% in fourteen years. A continuing strong post-earthquake output recovery was2013 to 6.5% in 2014 -CFe- (among the main driver oflowest unemployment rates in the annual outcome, offsettinglast decade). Nominal wages rose at increasing rates during the year; in part, to compensate the loss of dynamism brought about by worsening global economic conditions. The unemployment rate decreased from 8.1% in 2010purchasing power due to 7.1% in 2011 progressing closer to full employment levels. the higher inflation.
Inflation, measured by consumer price index (CPI), rose to 4.4%CPI, reached 4.6% in 20112014 compared with 3.0% in 20102013 and -1.7%1.5% in 2009. CPI inflation surpassed2012. Inflation gained momentum as the monetary policy target range (3% -/+1%) fueled bylocal currency depreciated at a faster pace, as supply shocks temporally hit prices of certain food items and as additional or higher specific taxes rates were applied to alcoholic beverages, cigarettes, sodas and new cars, among other items. While the fall in international oil and food prices and the emergence of demanddecreased inflation pressures due to the outperformance of the economy. The Central Bank key interest rate was increased from 3.25% at December 2010 to 5.25% at June 2011 and remained unchanged the rest of the year. The Fiscal balance reached a surplus of 1.2% of GDP, compared with 0.4% and 4.4% GDP deficits in 2010 and 2009, respectively. Foreign direct investment net inflows accumulated $9.0 billion in 2011, increasing from $6.4 billion in 2010 and $4.8 billion in 2009. The trade balance surplus diminished from $15.9 billion in 2010 to $10.6 billion in 2011 mainly because of copper price decreases in the last part of the year. year, general and core inflation closed 2014 well above the Central Bank’s monetary policy target range (between 2% and 4%).
The Chilean Central Bank reduced its interest key rate 25 basis points six times during the year in response to less dynamic economic activity and falling expectations. The Monetary Policy Rate closed at 3.00% in 2014. The fiscal deficit reached 1.5% of GDP, compared to a deficit of 0.6% in 2013 and a surplus of 0.6% in 2012. The trade balance surplus increased from 2.2 billion U.S. dollars in 2013 to 8.6 billion U.S. dollars in 2014 due to a fall in imports caused by the economy’s slowdown.
At the end of 20112014, the nominal Chilean Peso to US Dollar exchange rate was $521.5,607.4 Chilean Pesos per U.S. dollar, reflecting a year endyear-over-year Chilean Peso depreciation of 11.3%; however the local currency appreciated from an average of $510.3 in 2010 to an average of $483.7 in 2011. Throughout the year the16.0%. The exchange rate performance in 2014 was mainly tracked turbulencesexplained by the opposing policy decisions adopted in the international financial markets.United States and Chile, with the former being expected to raise interest rates in the short term and the latter loosening its monetary policy stance. The decrease in copper prices also contributed to the Chilean Peso depreciation, although the impact of copper prices was less significant than in other times.
In 2014 a tax reform which aims to increase annual taxation by 3 percent points of GDP was approved. These additional resources will be used mainly to finance the upcoming educational reform (1.5% of GDP), to improve the scope of current social policies (0.5% of GDP) and to close the structural fiscal gap (1% of GDP). The reform introduces substantial changes to the Chilean tax system, including two alternative methods for computing shareholder-level income taxation, additional corporate tax rate increases, important amendments to the thin capitalization rules, and other substantial modifications.
Argentina
Argentina’s GDP grewdecreased by 7.6%an estimated 1.1% in 20112014 (CFe). This data is similar, butmuch lower tothan the average annual growth rates of approximately 8.5% achieved from 2003 through 2008. 2008, and 5.3% from 2009 to 2012.
The Argentine peso depreciated 7.7%29.8% relative to the U.S. dollar, closing at 4.298.46 Argentine pesos per U.S. dollar at the end of 20112014 compared with 3.986.51 Argentine pesos per U.S. dollar at the end of 20102013 and 3.814.91 Argentine pesos per U.S. dollar at the end of 2009. 2012.
The official CPI increased 9.5%23.9% in 20112014 (compared with 10.9%11.0% in 20102013 and 7.7%10.8 % in 2009)2012).
The expected current account balance showed a surplusdeficit of $1.35.2 billion U.S. dollars in 2011 (CFe), which2014 is €1.6 billion and €9.8 billion lower compared with 2010 and 2009, respectively.the highest deficit in the last decade. The trade balance contributed significantly to this result, sinceeven when exports decreased less than imports increased 30.8 %, more thanduring the 23.7year (7.3 % increase in exports over the same period. and 8.3% respectively).
Economic conditions affected the unemployment positively,rate negatively, which decreasedincreased to 7.1 % at the end of 20117.7% in 2014 from 7.3% at the end of 20107.1% in 2013 and 8.4% at the end of 2009.7.2% in 2012.
Colombia
According to CFe, the balance of payments registered a current account deficit of $6,828 million, 2.7%16.3 billion U.S. dollars, 4.2% of GDP, YTD as of September 2011, compared with 3.1% and 2.1%3.2% of GDP in 20102013, and 2009, respectively. The current account deficit in 2011 was mainly financed through higher private external debt, foreign direct investment (FDI) inflows and portfolio investment. This resulted in a financial account surplus of $10,640 million (4.2%3.1% of GDP YTD asin 2012.
Amid expectations of September 2011). Despite FDI inflowswithdrawal of monetary stimulus by the Federal Reserve in the United States and better economic outlooks for the Colombian economy (stronger economic growtha continuous and the investment grade recovery),sharply decrease in oil prices, the Colombian peso depreciated 1.5%23.0% during 20112014 against the U.S. dollar (closing the year at 1,942.72,455.3 Colombian pesos per one USU.S. dollar) primarily as a consequence of the high volatility in international markets and global economic uncertainty. .
The inflation rate was 3.7% year-on-year at the end of 2011,2013, compared with 3.2%1.9% and 2.0%2.4% at the end of 20102013 and 2009,2012, respectively.
Peru
Consumer prices, as measured by the CPI, increased by 4.7%3.2% in 2011 2.7 percentage points2014, slightly over the center and beyond the range of the central bank’sPeruvian Central Bank’s target (between 1% and 3%), compared with 2.1%2.9% in 20102013 and 0.3%2.6% in 2009. 2012. Inflation gained momentum affected by climate changes and currency depreciation.
The Peruvian Central Bank cut its interest key rate by 50 basis points to 3.5%, and the reserve requirement deposits rate, from 15% to 9.5%, showing an explicit easing bias.
Due to a positive fiscal impulse, the government budget is likely to post a small deficit was approximately 2% GDP in 2011,for 2014, compared with a fiscal deficitsurplus of 0.6%0.9% in 20102013 and 1.9%around 2.0% in 2009. 2012.
In the foreign exchange market, the Peruvian nuevo sol appreciated 4.2%Nuevo Sol weakened 6.4 % against the U.S. dollar in 2011,2014, reaching 2,6962.98 Peruvian nuevo solNuevo Sol per U.S. dollar at the end of the year, compared with a depreciation of 9.6% in 2013 and an appreciation of 2.9%5.4% against the U.S. dollar in 20102012. The large commercial deficit and 8% in 2009. Long termslower financial capital inflows boostedlead to a reduction of international net reserves, reaching US$ 48.962.3 billion U.S. dollars compared with US$ 44.1to 65.7 billion U.S. dollars in 20102013 and US$ 33.164.0 billion U.S. dollars in 2009. 2012.
Country risk, measured by the J.P. Morgan Emerging Markets Bond Index (EMBIG Peru), rose 6020 basis points to 217162 basis points, in 2011, due to turmoil in European debt and financial markets.2014. Long-term sovereign debt is currently investment grade rated by Fitch, Standard and Poor’s and Moody’s rating agencies.
Exchange Rate Fluctuations
We publish our Consolidated Financial Statements in euro.euros. Because a substantial portion of our assets, liabilities, revenues and profitexpenses are denominated in currencies other than the euro, we are exposed to fluctuations in the values of these currencies against the euro. Currency fluctuations have had and may continue to have a material impact on our financial condition, results of operations and cash flows.
We estimate that in 20112014 variations in currencies and hyperinflation in Venezuela decreased our collection and paymentcash flows and cash balance by approximately €1691,616 million euros and decreased our consolidated revenues by approximately 0.7%12.1%. Currency fluctuations can also have a significant impact on our statement of financial position, particularly equity attributable to equity holders of the parent, when translating the financial statements of subsidiaries located outside the euro zoneEurozone into euro. For example, in 20112014 equity attributable to equity holders of the parent decreased by €8972,857 million euros due to the translation of the financial statements of our foreign subsidiaries, principally due to the depreciation of the Venezuelan bolívar fuerte and the Argentine peso, partially offset by the appreciation of the pound sterling and Brazilian real relative to the euro.
We estimate that in 20102013 variations in currencies and hyperinflation in Venezuela decreased our collection and paymentcash flows and cash balance by approximately €4631,468 million euros and increaseddecreased our consolidated revenues by approximately 2.2% including the devaluation in the Venezuelan bolivar. Currency fluctuations can also have a significant impact on our statement of financial position, particularly7.5%. In 2013 equity attributable to equity holders of the parent when translating the financial statements of subsidiaries located outside the euro zone into euro. For example, in 2010 equity attributable to equity holders of the parent increaseddecreased by €4305,691 million euros due to the translation of the financial statements of our foreign subsidiaries, principally due to the appreciationdepreciation of the Brazilian real, the Venezuelan bolívar fuerte and the pound sterlingArgentine peso, relative to the euro, and the effect of the devaluation in Venezuela.euro.
We estimate that in 20092012 variations in currencies increasedand hyperinflation in Venezuela decreased our collection and paymentcash flows and cash balance by approximately €269382 million euros and decreasedincreased our consolidated revenues by approximately 3.1%0.1%. Currency fluctuations can also have a significant impact on our statement of financial position, particularly equity attributable to equity
The exchange rate of 6.3 bolivars per U.S. dollar was used in the translation of the financial information of Venezuelan subsidiaries for the whole year 2013.
During 2014, by virtue of certain Exchange Agreements the allocations conducted through the Complementary System for Administration of Foreign Currency (SICAD I), to which Telefónica Venezuela had access for imports, were expanded and, in addition, a new exchange mechanism with a more widespread use was put in place, called SICAD II.
The exchange rates resulting in the last allocations of SICAD I and SICAD II before December 31, 2014 were 12.0 and 49.988 bolívares per U.S. dollar, respectively.
In the absence of auctions since mid-October 2014, and the effectlack of expectations of new auctions close to 2014 year-end, in a macroeconomic context aggravated by the fall of the devaluationoil price, the Company has decided to take as a reference the rate resulting in Venezuela.the allocations conducted through SICAD II for translating the financial statements of the Venezuelan subsidiaries. The Company considers that it is the most representative among the available official exchange rates at 2014 year-end for the monetary translation of the accounting figures of transactions, cash flows and balances.
The main impacts of using this new exchange rate in the Telefónica Group’s consolidated financial statements as of December 31, 2014 were as follows:
| · | A decrease in equity, within the caption “Translation differences”, of approximately 2,950 million euros (see Note 12.f of the Consolidated Financial Statements) as a combined result of the translation to euros at the new exchange rate partially offset by the impact in equity of the inflation adjustment for the period. |
| · | As part of the decrease mentioned in the preceding paragraph, the value in euros of the net financial assets denominated in bolívares decreased by approximately 2,700 million euros, as per the balance as of December 31, 2014. |
| · | The results from the Telefónica’s subsidiaries in Venezuela have been translated at the new exchange rate. This implied a reduction in operating income before depreciation and amortization (OIBDA) and profit for the year of, approximately, 1,730 and 660 million euros, respectively. |
The table below sets forth the average exchange rates against the euro of the U.S. dollar and the key currencies that impacted our consolidated results of operations for the periods indicated. Positive percentage changes represent a decline in the value of the applicable currency relative to the euro, and negative percentage changes represent increases in the value of the applicable currency relative to the euro.
2009(1) Average | 2010(1) Average | 2011(1) Average | % change 2009 to 2010 Average | % change 2010 to 2011 Average | ||||||||||||||||
Pound Sterling | 0.89 | 0.86 | 0.87 | (3.37 | )% | 1.16 | % | |||||||||||||
U.S. Dollar | 1.39 | 1.32 | 1.40 | (5.04 | )% | 6.06 | % | |||||||||||||
Brazilian Real | 2.76 | 2.33 | 2.33 | (15.58 | )% | 0.00 | % | |||||||||||||
Argentine Peso | 5.17 | 5.18 | 5.74 | 0.19 | % | 10.81 | % | |||||||||||||
Peruvian Nuevo Sol | 4.18 | 3.74 | 3.83 | (10.53 | )% | 2.41 | % | |||||||||||||
Chilean Peso | 775.80 | 674.36 | 672.25 | (13.08 | )% | (0.31 | )% | |||||||||||||
Mexican Peso | 18.78 | 16.71 | 17.25 | (11.02 | )% | 3.23 | % | |||||||||||||
Venezuelan Bolivar fuerte (2) | 3.10 | 5.75 | 5.56 | 85.48 | % | (3.30 | )% | |||||||||||||
Czech Crown | 26.44 | 25.29 | 24.59 | (4.35 | )% | (2.77 | )% | |||||||||||||
Colombian Peso | 2,985.07 | 2,509.22 | 2,568.67 | (15.94 | )% | 2.37 | % | |||||||||||||
Guatemalan Quetzal | 11.33 | 10.66 | 10.83 | (5.91 | )% | 1.59 | % | |||||||||||||
| 2012(1) | 2013(1) | 2014(1) | % change 2012 to 2013 | % change 2013 to 2014 | |
| Average | Average | Average | Average | Average | |
| Pound Sterling | 0.81 | 0.85 | 0.81 | 4.94% | (4.71)% |
| U.S. Dollar | 1.29 | 1.33 | 1.33 | 3.10% | − |
| Brazilian Real | 2.50 | 2.85 | 3.12 | 14.00% | 9.47% |
| Argentine Peso | 5.84 | 7.23 | 10.75 | 23.80% | 48.69% |
| Peruvian Nuevo Sol | 3.39 | 3.58 | 3.77 | 5.60% | 5.31% |
| Chilean Peso | 624.59 | 656.25 | 756.71 | 5.07% | 15.31% |
| Mexican Peso | 16.90 | 16.93 | 17.65 | 0.18% | 4.25% |
| Venezuelan Bolívar Fuerte (2) | 5.67 | 8.69 | 60.69 | 53.26% | n.m. |
| Czech Crown | 25.14 | 25.99 | 27.53 | 3.38% | 5.93% |
| Colombian Peso | 2,308.54 | 2,478.69 | 2,650.03 | 7.37% | 6.91% |
| Guatemalan Quetzal | 10.06 | 10.43 | 10.25 | 3.68% | (1.73)% |
Source: Central treasury bank of the respective countries.
| (1) | These exchange rates are used to convert the income statements of our subsidiaries from local currency to euro. |
| (2) |
We describe certain risks relating to exchange rate fluctuations in “Item 3. Key Information—Risk Factors,” and we describe our policy with respect to limiting our exposure to short-term fluctuations in exchange rates under “Item 11. Quantitative and Qualitative Disclosures About Market Risk.”
Group Results of Operations
Please see Item 4.B “Business“Item 4. Information on the Company — Business Overview — Group Results of Operations.”
Cash Flow Analysis
The table below sets forth consolidated cash flow information for the periods indicated. Positive figures refer to cash inflows and those in parenthesis refer to cash outflows.
Year ended December 31, | |||||||||||||||
2009 | 2010 | 2011 | |||||||||||||
| IFRS | (in millions of euro) | ||||||||||||||
| (millions of euros) | 2012 | 2013 | 2014 | ||||||||||||
Net cash from operating activities | 16,148 | 16,672 | 17,483 | 15,213 | 14,344 | 12,193 | |||||||||
Net cash used in investing activities | (9,300 | ) | (15,861 | ) | (12,497 | ) | (7,877) | (9,900) | (9,968) | ||||||
Net cash used in financing activities | (2,281 | ) | (5,248 | ) | (4,912 | ) | (1,243) | (2,685) | (4,041) | ||||||
For a discussion of our cash flows for the years ended December 31, 2009, 20102012, 2013 and 2011,2014, please see Note 2320 to our Consolidated Financial Statements.
Anticipated Uses of Funds
Our principal liquidity and capital resource requirements consist of the following:
| · | costs and expenses relating to the operation of our business; |
| · | debt service requirements relating to our existing and future debt; |
| · | capital expenditures for existing and new operations; |
| · | acquisitions of new licenses or other operators or companies engaged in complementary or related businesses; |
| · | dividend, other shareholder remuneration, and pre-retirement |
We also have liquidity requirements related to the costs and expenses relating to the operation of our business, financial investments, our payment of dividends, shareholder remuneration and pre-retirement payment commitments and financial and real estate investments.commitments. In 2011, with respect to these items, we had the following principal2014 cash expenditures: €6,852expenditures consisted principally of: 3,382 million euros in connection with theshareholder remuneration (in connection with payment of dividends on Telefónica S.A. shares €3,560and the acquisition of Telefónica treasury shares), 1,346 million euros principally in connection with net financial investments and net real estate investments, €807789 million principallyeuros in connection with commitments under pre-retirement plans and €386 million in connection with the acquisition of Telefónica treasury shares.plans.
We also have liquidity requirements related to debt service requirements in connection with our existing and future debt. At December 31, 2011,2014, we had gross financial debt of €66,31159,782 million euros compared with €61,10060,699 million euros at December 31, 2010.2013. For the amortization schedule of our consolidated gross financial debt at December 31, 20112014 and a further description of financing activity in 2011,2014, see “—Anticipated Sources of Liquidity” below. Our net financial debt increaseddecreased to €56,30445,087 million euros at December 31, 20112014, compared with €55,59345,381 million euros at December 31, 2010.2013 (excluding the implicit devaluation of the Venezuelan bolívar our net financial debt would have decreased by 2,635 million euros). The decrease in net financial debt was mainly explained by our 2014 cash flow generation before spectrum payments of 4,748 million euros, the issue of equity instruments for a total amount of 4,699 million euros of Telefónica Deutschland (including the portion subscribed by Telefónica Deutschland’s minority shareholders in the capital increase) and proceeds of 3,981 million euros from disposals (relating to the sale of Telefónica Czech Republic and a 2.5% stake in China Unicom). In contrast, factors contributing to increased debt in 2014 include net financial investments (4,949 million
euros), 3,382 million euros as remuneration of equity instruments (including the purchase of treasury stock), spectrum payments (932 million euros), the payment of labor commitments mainly associated with early retirements (789 million euros) and other factors that increased debt by 741 million euros. For a reconciliation of net financial debt to gross financial debt (the sum of current and non-current interest-bearing liabilities), see “—Presentation of Financial Information—Non-GAAP financial information—Net financial debt and net debt.”debt”.
For a discussion of our liquidity risk management policy, see Note 16 to our Consolidated Financial Statements.
Anticipated Sources of Liquidity
Cash flows from operations are our primary source of cash funding for existing operations, capital expenditures, interest obligations and principal payments. We also rely on external borrowings, including a variety of short- and medium-term financial instruments, principally bonds and debentures, undated deeply subordinated securities and borrowings from financial institutions. Cash and cash equivalents are mainly held in euroeuros and euro-denominated instruments. We believe that, in addition to internal generation of funds, our medium-term note program, our euro commercial paper program, our corporate domestic promissory note program and available lines of credit will provide us with substantial flexibility for our future capital requirements as existing debt is retired. As of the date of this Annual Report, our management believes that our working capital is sufficient to meet our present requirements.
Financing
The following table shows the amortization schedule of our consolidated gross financial debt at December 31, 2011,2014 as stated in euro using the European Central Bank buying rate for euro on such date.euro. We may have exchange rate financial derivatives as instruments assigned to the underlying debt instruments. In 2011,2014, the average cost of net debt, which we measure as net financial expense divided by our average net debt was 5.22%, which, adjustingadjusted for
exchange rate differences, fell to below 5% (4.91%)was 5.40%. The table below includes the fair value of those derivatives classified as financial liabilities (negative mark-to-market) under IFRS (€313(401 million euros classified as a current financial liability and €2,1363,231 million euros as a non-current financial liability). ItThe table does not include the fair value of derivatives classified as financial assets (positive mark-to-market) under IFRS (€385(813 million euros classified as current financial assets and €4,2945,499 million euros as non-current financial assets). For a further description of the liquidity risk faced by us,we face, see Note 16 to our Consolidated Financial Statements, and for a description of our financial liabilities, see Note 13 to our Consolidated Financial Statements.
AMORTIZATION SCHEDULE FOR THE YEAR ENDED DECEMBER 31, | ||||||||||||||||||||||||||||
2012 | 2013 | 2014 | 2015 | 2016 | Subsequent | Total | ||||||||||||||||||||||
| Non-convertible euro and foreign currency debentures and bonds | 2,824 | 5,203 | 4,933 | 3,860 | 6,590 | 15,012 | 38,422 | |||||||||||||||||||||
| Promissory notes and commercial paper | 1,832 | — | — | — | — | — | 1,832 | |||||||||||||||||||||
| Other marketable debt securities | — | — | — | — | — | 1,985 | 1,985 | |||||||||||||||||||||
| Loans and other payables (principal and interest accrued) | 5,683 | 2,314 | 2,746 | 4,384 | 2,774 | 3,722 | 21,623 | |||||||||||||||||||||
Derivative financial liabilities | 313 | 92 | 126 | 289 | 191 | 1,438 | 2,449 | |||||||||||||||||||||
Total (*) | 10,652 | 7,609 | 7,805 | 8,533 | 9,555 | 22,157 | 66,311 | |||||||||||||||||||||
| Millions of euros | |||||||||
| Current | Non-current | ||||||||
| Maturity | 2015 | 2016 | 2017 | 2018 | 2019 | Subsequent years | Non-current total | Total | |
| Debentures and bonds | 4,601 | 6,722 | 6,392 | 4,834 | 3,465 | 18,214 | 39,627 | 44,228 | |
| Promissory notes & commercial paper | 502 | − | − | − | − | − | − | 502 | |
| Other marketable debt securities | − | − | − | − | − | − | − | − | |
| Total Issues | 5,103 | 6,722 | 6,392 | 4,834 | 3,465 | 18,214 | 39,627 | 44,730 | |
| Loans and other payables | 3,590 | 1,533 | 3,205 | 761 | 849 | 1,482 | 7,830 | 11,420 | |
| Other financial liabilities | 401 | 152 | 347 | 477 | 357 | 1,898 | 3,231 | 3,632 | |
| TOTAL | 9,094 | 8,407 | 9,944 | 6,072 | 4,671 | 21,594 | 50,688 | 59,782 | |
- Estimated future interest payments as of December 31, 2014 on our interest-bearing debt (not included above) are as follows: 2,215 million euros in 2015, 1,960 million euros in 2016, 1,671 million euros in 2017, 1,279 million euros in 2018, 1,077 million euros in 2019 and 6,586 million euros in subsequent years. With respect to floating rate debt, we estimate future interest payments as the forward rates derived from yield curves quoted for the different currencies on December 31, 2014.
During 2011,2014, we obtained external financing in the form of borrowings of approximately €11,50014,740 million (excludingeuros. The financing under short-term commercial paper programs)activity in 2014 was mainly focused on completing the financing for the acquisition of E-Plus (via the issue of a 1,500 million euro bond mandatorily convertible into Telefónica shares and the execution of a capital increase by Telefónica Deutschland), mainly in connection with pre-financingstrengthening the 2011liquidity position, actively managing the cost of debt and partsmoothing the debt maturity profile for the following years. Therefore, as of the 2012December 31, 2014, we believe we maintain an adequate liquidity position to accommodate 2015 and 20132016 debt maturities.
In addition, in 2011, certain of our Latin American companies raised funds in financial markets in an aggregate principal amount equivalent to approximately €2,600 million, primarily: (a) on September 20, 2011, Vivo, S.A. arranged long-term financing with Banco Nacional de Desenvolvimento Econômico e Social (BNDES) in an amount of 3,000 million Brazilian reais (outstanding balance at December 31,2011 was 1,004 million Brazilian reais, equivalent to €414 million); and (b) on November 22, 2011, Telefónica Móviles Chile issued five-year notes in an aggregate principal amount of approximately €165 million, structured into two tranches, the first, in the amount of 66,000 million Chilean pesos (approximately €98 million), with an annual interest rate of 6.30%, and the second, in
| · | On February 19, 2015, Telefónica, S.A. signed a 2,500 million euros syndicated credit facility maturing in 2020 with two twelve month extension options requiring mutual agreement of the parties (which could extend the maturity to as late as 2022). This agreement entered into effect on February 26, 2015 and allowed us to cancel in advance the syndicated loan facility of Telefónica Europe, B.V. dated |
Our borrowing requirements are not significantly affected by seasonal trends.
Availability of funds
At December 31, 2014, Telefónica has funds available amounting to 19,414 million euros, which includes: undrawn lines of credit for an amount of 11,545 million euros (10,618 million euros maturing in more than 12 months); cash and cash equivalent and current financial assets other than those in Venezuela (367 million euros) and Telefónica’s participation in Telco’s bond (principal amount of 1,225 million euros) totalling 7,869 million euros.
For a description of our liquidity and undrawn lines of credit available at December 31, 2014, see Notes 12 and 13 to our Consolidated Financial Statements, and for a discussion of our liquidity risk management and our capital management, see Note 16 to our Consolidated Financial Statements.
Telefónica, S.A. is the parent company of the Telefónica Group and receives funding from its subsidiaries in the form of dividends and loans. Consequently, restrictions on the ability of the Group’s subsidiaries to transfer funds to Telefónica, S.A. in the form of cash dividends, loans or advances, capital repatriation and other forms would negatively affect our liquidity and thus our business.
Certain Latin American economies, such as Argentina and Venezuela, have experienced shortages in foreign currency reserves and their respective governments have adopted restrictions on the ability to transfer funds out of the country and convert local currencies into U.S. dollars. This may limit our ability to repatriate funds out of certain subsidiaries from such countries. However, regarding repatriation of funds to Spain, in 2014 we have received 1,118 million euros from our Latin American subsidiaries, of which 961 million euros was from dividends and 157 million euros was from other items.
Credit Ratings
Our ability to use external sources of financing will depend in large part on our credit ratings. We believe that we are well-positioned to raise capital in financial markets. However, negative conditions in the financial markets or a downgrade of any of the ratings of our debt or the Kingdom of Spain’s debt by any of Fitch, Moody’s JCR and/or Standard & Poor’s may increase the cost of our future borrowings or may make it more difficult to access the public debt markets. In connection with the credit rating agencies’ review of our debt ratings, the rating agencies may give considerable weight to general macroeconomic and political conditions (including sovereign credit rating prospects), the performance of our businesses in countries where we operate, our financial and shareholder remuneration policy, our acquisitionM&A policy, our ability to integrate acquisitionsacquired companies and our ability to refinance debt.
Intragroup Loans
We lend funds to our operating subsidiaries, directly or through holding companies that head our different lines of business. At December 31, 2011,2014, we had loans outstanding totaling €4,3437,433 million (€5,424euros (9,806 million euros at December 31, 2010)2013) to companies in the Telefónica Group (including subsidiaries located in Latin American countries). These funds are derived from retained cash flows, loans, bonds, issuances of undated deeply subordinated securities and other sources (such as asset disposals).
Telefónica remains firmly committed to technological innovation as an essential tool for achieving competitive advantages, anticipatingtrying to anticipate market trends and differentiating its products. By introducing new technologies and developing new products and business processes, we seek to become a more effective, efficient and customer-oriented Group.
Telefónica has developed an open innovation model for the management of technological innovation to boost the application of technical research in the development of new commercial products and services. Telefónica focuses on certain applied research and development (R&D) priorities that are aligned with its strategy. Open innovation initiatives driving this model include the creation of a venture capital fund and involvement in business collaboration forums, among others. The model also usespromotes the use of knowledge developed at technology centers, universities and start-ups, among other sources, and encourages innovation in conjunction with other agents (e.g. customers, universities, public administrations, suppliers, content providers and other companies), making them “technological partners.” Within this open innovation strategy, the Open Future program was reinforced during 2014. This program is designed to connect entrepreneurs, startups, investors and public and private organizations from all over the world with a view to fostering innovation and developing viable projects.
Telefónica believes it cannot rely solely on acquired technology to differentiate its products from those of its competitors and to improve its market positioning. It is also important to encourage R&D initiatives in an effort to achieve this differentiation and make inroads intoin other innovation activities. The Group'sGroup’s R&D policy is geared towards:
| · | developing new products and services in order to |
| · | boosting customer loyalty; |
| · |
| · | enhancing innovation management; |
| · | improving business practices; |
| · | increasing the quality of infrastructure services to improve customer service and reduce costs; |
| · | promoting global products; |
| · | supporting open innovation; and |
| · | creating value from the technology generated. |
In 2011,2014, the technological innovation projects undertaken focused on sustainable innovation, process efficiency, creation of new revenuesrevenue streams, customer satisfaction, consolidation of operations in new markets and technological leadership.
Technical innovation activities are a key part of Telefónicanica’s strategy of creating value through broadbandlatest-generation network communications and services, the IP network, mobile networks and new generation networks (fiber optic).services.
In 2011,2014, projects were undertaken to promote greater access to information technology, new services focused on new Internetinternet business models, advanced user interfaces, mobile televisionTV distribution, multimedia content and other broadband services.added-value services leveraging on the potential of the new infrastructures. These initiatives, among others, were undertaken based on our objective of rapidly identifying emerging technologies that could have a relevant impact on our businesses and pilot testing these technologies in new services, applications and platform prototypes.
Most of our R&D activities are carried out by Telefónica Investigación y Desarrollo, S.A.U. (Telefónica I+D), a wholly ownedwholly-owned subsidiary, which focuses on providing solutions to our variousworks mainly for the lines of business. In its operations, Telefónica I+D receives the assistance of other companies and universities. Telefónica I+D’s mission is centered on enhancing the Company’s competitive positioning by leveraging technological innovation and product development. Telefónica I+D undertakes experimental and applied research and new product development with the overriding goal of broadening the range of services offered and reducing operating costs. It also provides technical assistance to the Group’s operations in Latin America and Europe.
Telefónica I+D'sD’s technological innovation activities focus on the followingtwo big areas:
| · | Telefónica I+D’s works on new networks, primarily in collaboration with Telefónica’s Global Resources team. These activities are related to radio access technologies and fiber; network virtualization technologies, in line with the technology trend known as software defined networks (SDN); and network optimization and zero touch developments making networks more flexible and moldable and able to adapt dynamically to new digital consumer and service requirements. |
| · | R&D activities to develop new products and services are conducted as part of the digital services strategy. These activities include the following: |
| o | Natural P2P communication of the future, using the Internet, Web 2.0 and |
| Video and multimedia services (combining text, audio, images and video) offering |
| Advanced solutions in emerging ITC |
| M2M (machine-to-machine) service management associated with energy efficiency and |
| Making use of user communication profiles to |
In 2014, Telefónica in collaboration with the Chilean government launched a new R&D center in Chile, with focus on Internet of Things and Big Data, in the field of Smart Cities, Smart Industry and Smart Agro.
At December 31, 2011,2014, Telefónica I+D had 653652 employees and collaborated with skilled professionals from over 80 companies and more than 50 universities.(689 employees in 2013).
During 2014, Telefónica filed 27 new patent applications, all of them registered 95 patents in 2011,through the Spanish Patent and Trademark Office (OEPM), of which 5725 are European applications (EP) and 2 are International applications (PCT). Additionally 2 utility models were registered with the Spanish patent office and 38 with patent offices in the European Union, the United States and with other international patent offices.filed, also through OEPM.
As a multinational telecommunications company that operates in regulated markets, we areTelefónica is subject to different laws and regulations in each of the jurisdictions in which we provideit provides services. We expect the regulatory landscape to continue to change in Europe as a consequence of the revised regulations resulting from the implementation of the review of the common regulatory framework currently in place in the European Union. In addition, weAmong other developments, Telefónica may also face pressure from regulatory initiatives in some European countries regarding tariffs, the reform of rights of spectrum use and allocation, issues related to the quality of service, and the regulatory treatment of new broadband infrastructure deployments.
However, we believe we areTelefónica believes that it is in a strong competitive position in most of the markets where we operate, enabling usit operates, which it expects to help enable it to continue taking advantage of the growth opportunities that arise in these markets, such as by boosting both fixed and mobile broadband services and by furthering the development of services beyond connectivity, information technology services and related businesses.
In this respect,2014, Telefónica took a further step towards its transformation into a leading digital telecommunications company, in a sector which we believe still offers excellent growth potential. Digital capacities were boosted, new products were developed, and new business models were set up. This was achieved as a result of a transformation drive implemented throughout the Company.
2013 marked a turning point with the launch of a multinational program, “Be More”, focused on transformation and growth and the deleveraging of our business in Ireland, Czech Republic and 40% of Central America. This program aims to take advantage of our customer insight, the capture of future Business to Business (B2B) opportunities, further data monetization of our services and reinforcing our video business. In addition, we will seek to leadsimplify our operating model and increase investments in fiber and LTE, transforming the industry by anticipating trendsIT in our operating business. In 2014, we made progress in the transformation process of Telefónica, simplifying the Company and building the bases for a new digital environment.organization, simplifying operations, making provisions for a leaner staffing at a number of group operators and making key changes to our structure.
The pace of addition of high-value customers was stepped up in 2014, with more than 21 million new smartphones, 1.5 million new Pay-TV accesses and 927 new fiber accesses. We believe these figures indicate a restructuring in September 2011 with the aimgrowing generalization of reinforcing our growth, actively participatingusage-intensive data and content services.
Intense commercial activity in the digital world and capturing opportunities afforded byarea of high-value services was attributable mainly to greater investment, which allowed us to double the size of our scale and industrial alliances. This new organization gave riseFTTH network to two cross-cutting areas, Telefónica Digital and Telefónica Global Resources, in addition to14.7 million premises passed, securing LTE coverage of 41% of the Telefónica Europe and Telefónica Latin America segments. We expect this structure to bolster Telefónica’s placeoutdoor population in the digital world, enabling itregions where we operate, thereby increasing the number of LTE base stations to tap growth opportunities arisingmore than 20 thousand in this environment, drive innovation, strengthen the product and services portfolio and maximize advantages afforded by its global customer2014 (2.2X compared to 2013).
Telefónica United Kingdom continued to work on the deployment of its LTE network, reaching 58% outdoor coverage at year-end, keeping the focus on offering a positive network experience and generate sustainable growth, backedan exclusive content proposition to 4G customers. The operator is still migrating its high-value customers to LTE, with a view to boosting the network experience and customer satisfaction. Telefónica United Kingdom continues to deliver a good commercial performance with its "Refresh" offer, helping improve the market distribution dynamics towards more efficient channels.
On August 29, 2014 the Company was given the green light from the European Commission to purchase the E-Plus Group, and the transaction was completed on October 1, 2014. The E-Plus Group has been part of Telefónica Deutschland since that date. The new company is intent on becoming Germany's leading digital telecommunications company, and aims to secure synergies of more than 5 billion euros of present value, mainly produced by the Global Corporation.network, customer service, overheads and new opportunities for generating income.
Telefónica Germany continued to perform well in 2014, mainly in the mobile contract segment, thanks to a strategy focusing on data monetization. This performance was achieved against a more competitive backdrop with growing demand for LTE offers and terminals. Year-on-year revenue stabilized, and mobile revenue rose again year-on-year.
As part of the transformation process, embarked by the Group, a significant provision was recorded for E-Plus in connection with the planned downsizing of its staffing, which aims to lay the foundations for future growth.
In Spain, followingBrazil, we consolidated the commercial re-positioning carried out at the end of 2011, Telefónica expects to continue to intensify its commercial commitment to offering quality services, increasing the effectiveness of its sales channels and further improving the quality and features of its networks to increase customer satisfaction through targeted commercial offerings that are aimed toward ensuring the best response to their communications’ needs. In this respect, we expect to continue to boost innovation to offer the best products and services, drive the mobile and fixed broadband growth and bundling services to provide the best integrated communications solutionsleadership in the higher-value mobile segments, maintaining our dominance of the market. Efficiency will continue to play a very important roleThe Company was awarded one of the three blocks of radioelectric spectrum for LTE auctioned in all areasthe 700 MHz band (2x10 MHz) on September 30, 2014, for the minimum reserve price of management, both in commercial and operational areas, including systems, networks and processes. We will focus on our customers and their satisfaction, and we expect to see savings derived from the 2011 restructuring plan, while continuing to remain committed to ensuringblock (approximately 619 million euros). This gave Telefónica Spain remains a desirable placeBrazil the spectrum it needed to work.expand the 4G services in the medium and long term, and accelerate adoption of data (in 2014, data revenue accounted for 34.3% of the total).
In Latin America, our strategythe fixed business, fiber deployment was key, with 14.7 million premises passed by December 2014, and the number of connected homes gradually rose to 1.8 million.
On September 19, 2014 the Company entered into an agreement with Vivendi to purchase GVT, with a view to creating an integrated operator with national coverage focused on higher-value customers to give a major boost to the Company's market positioning. The purchase is based on a regional model that captures growth and efficiency of scale without losing sight ofpending approval by the local management of the client. The mobile business will continue to play a fundamental role as an engine of regional growth. That is why we will continue to workregulator.
Strong commercial activity by Telefónica Hispanoamérica, along with robust investment to improve the capacityservice quality, continued to drive steady year-on-year growth of revenue and coverage of our networks, adapting our distribution channel to enhance the quality of our offerings bothOIBDA, especially in voiceMexico, Colombia and data in order to keep and attract high-value customers. Regarding the fixed telephony business, we will encourage the increase of broadband speed and expand the supply of bundled services. Meanwhile, we expect to further advance efficiency, in operational and commercial terms, and attempt to achieve further synergies by implementing global, regional and local projects.
In summary, in the context of intense competition and regulatory pressure on pricing, Telefónica aims to continue strengthening its business model to make it more efficient and capture the synergies arising from the integrated approach of businesses, processes and technologies, while focusing even more on the client.client and staying ahead of trends in the new digital world.
We have commitments that could require us to make material payments in the future. These commitments are not included in our consolidated statement of financial position at December 31, 20112014 although they are described in the notes to our Consolidated Financial Statements. For additional detail regardingsummary of our off-balance sheet commitments, see Note 21(b) and Note 16 to our Consolidated Financial Statements.
The following table describes our contractual obligations and commitments with definitive payment terms which may require significant cash outlays in the future. The amounts payable (including accrued interest payments) are as of December 31, 2011.2014. For additional information, see our Consolidated Financial Statements.
| Payments Due by Period | |||||
| Millions of euros | Total | Less than 1 year | 1-3 years | 3-5 years | More than 5 years |
| Financial liabilities (1)(2) | 59,782 | 9,094 | 18,351 | 10,743 | 21,594 |
| Operating lease obligations (3) | 10,197 | 1,643 | 2,669 | 2,068 | 3,817 |
| Purchase and other contractual obligations(4) | 9,037 | 4,295 | 2,071 | 961 | 1,710 |
| Other liabilities (5) | 3,828 | 574 | 3,254 | − | − |
| Total | 82,844 | 15,606 | 26,345 | 13,772 | 27,121 |
Payments Due by Period | ||||||||||||||||||||
Total | Less than 1 year | 1-3 years | 3-5 years | More than 5 Years | ||||||||||||||||
| (in millions of euro) | ||||||||||||||||||||
| Financial liabilities (1)(2) | 66,311 | 10,652 | 15,414 | 18,088 | 22,157 | |||||||||||||||
| Operating lease obligations (3) | 9,613 | 1,543 | 2,591 | 2,114 | 3,365 | |||||||||||||||
| Purchase and other contractual obligations(4) | 2,568 | 1,473 | 737 | 345 | 13 | |||||||||||||||
| Other liabilities (5) | 2,869 | 696 | 2,173 | — | — | |||||||||||||||
| Total | 81,361 | 14,364 | 20,915 | 20,547 | 25,535 | |||||||||||||||
| (1) | Capital (finance) lease obligations are not calculated separately and are instead included as part of our long-term debt obligations. |
| (2) |
| (3) | This item includes definitive payments (non-cancellable without penalty cost). Our operating lease obligations have in some cases extension options conditioned on the applicable law of each country. Accordingly, we have included only those amounts that represent the initial contract period. At December 31, 2014, the present value of future payments for operating leases was approximately 7,966 million euros (1,715 million euros in Telefónica Brazil, 1,640 million euros in Telefónica Hispanoamérica, 930 million euros in Telefónica Spain, 710 million euros in Telefónica United Kingdom, 2,837 million euros in Telefónica Germany and 134 million euros in other companies). For a more detailed information about payments due under this item, see Note 19 to our Consolidated Financial Statements. |
| (4) | This item includes definitive payments (non-cancellable without penalty cost) due for agreements to purchase goods (such as network equipment) and services. |
| (5) | “Other liabilities” include: (a) long-term obligations that require us to make cash payments, excluding financial debt obligations included in the table under “Financial Liabilities” above and (b) other provisions. Because of the nature of the risks covered by “Other liabilities” such as other provisions, it is not possible to determine a reliable schedule of potential payments, if any. For details of the composition of other provisions, see Note 15 to our Consolidated Financial Statements. |
In addition, at December 31, 2011,2014, we had shortshort-term and long termlong-term employee benefits provisions amounting to €807574 million euros and €4,9993,254 million respectively.euros, respectively (see Note 15 to our Consolidated Financial Statements).
For details of the composition of, and changes in, our debt, see “—Liquidity and Capital Resources—Anticipated Sources of Liquidity” and Note 13 to our Consolidated Financial Statements.
During 2011,2014, our Board of Directors met 14 times. At March 29, 2012February 27, 2015, our Board of Directors had met three times during 2012.2015. At March 29, 2012,February 27, 2015, our directors, their respective positions on our Board and the year they were appointed to such positions were as follows:
Name | Age | First Appointed | Current Term Ends | |||||||||
| Chairman | ||||||||||||
Mr. César Alierta Izuel(1) | 66 | 1997 | 2012 | |||||||||
| Vice-chairmen | ||||||||||||
Mr. Isidro Fainé Casas(1)(2) | 69 | 1994 | 2016 | |||||||||
Mr. José María Abril Pérez (1)(3)(5)(8) | 60 | 2007 | 2013 | |||||||||
Members (vocales) | ||||||||||||
Mr. Julio Linares López(1)(8) | 66 | 2005 | 2016 | |||||||||
Mr. Ignacio Moreno Martínez (3) | 54 | 2011 | 2012 | |||||||||
| Mr. José Fernando de Almansa Moreno-Barreda(5)(6)(9) | 63 | 2003 | 2013 | |||||||||
Mr. Jose María Álvarez –Pallete López | 48 | 2006 | 2012 | |||||||||
Mr. David Arculus (5)(6) | 65 | 2006 | 2016 | |||||||||
Ms. Eva Castillo Sanz (6)(9)(11) | 49 | 2008 | 2013 | |||||||||
| Mr. Carlos Colomer Casellas(1)(8)(10)(11) | 67 | 2001 | 2016 | |||||||||
Mr. Peter Erskine(1)(8)(9)(10) | 60 | 2006 | 2016 | |||||||||
| Mr. Alfonso Ferrari Herrero (1)(4)(5)(6)(7)(9)(10)(11) | 70 | 2001 | 2016 | |||||||||
Mr. Luiz Fernando Furlán(5) | 65 | 2008 | 2013 | |||||||||
| Mr. Gonzalo Hinojosa Fernández de Angulo (1)(4)(5)(7)(9)(10)(11) | 66 | 2002 | 2012 | |||||||||
| Mr. Pablo Isla Álvarez de Tejera(6)(7)(10)(11) | 48 | 2002 | 2012 | |||||||||
| Mr. Antonio Massanell Lavilla(2)(4)(7)(8)(11) | 57 | 1995 | 2016 | |||||||||
| Mr. Francisco Javier de Paz Mancho (1)(5)(6)(7) | 53 | 2007 | 2013 | |||||||||
| Mr. Chang Xiaobing (12) | 54 | 2011 | 2016 |
| Name | Age | First Appointed | Current Term Ends |
| Chairman | |||
| Mr. César Alierta Izuel(1) | 69 | 1997 | 2017 |
| Vice-chairmen | |||
| Mr. Isidro Fainé Casas(1)(2) | 72 | 1994 | 2016 |
| Mr. José María Abril Pérez (1)(3)(7) | 62 | 2007 | 2018 |
| Mr. Julio Linares López (5)(7)(8) | 69 | 2005 | 2016 |
Members (vocales) | |||
| Mr. José María Álvarez-Pallete López (1) | 51 | 2006 | 2017 |
| Mr. José Fernando de Almansa Moreno -Barreda(5)(6)(8) | 66 | 2003 | 2018 |
| Ms. Eva Castillo Sanz (6)(8)(10) | 52 | 2008 | 2018 |
| Mr. Carlos Colomer Casellas(1)(4)(7)(9)(10) | 70 | 2001 | 2016 |
| Mr. Peter Erskine(1)(7)(8)(9) | 63 | 2006 | 2016 |
| Mr. Santiago Fernández Valbuena | 56 | 2012 | 2018 |
| Mr. Alfonso Ferrari Herrero (1)(4)(5)(6)(8)(9)(10) | 73 | 2001 | 2016 |
| Mr. Luiz Fernando Furlán | 68 | 2008 | 2018 |
| Mr. Gonzalo Hinojosa Fernández de Angulo (1)(4)(5)(6)(8)(9)(10) | 69 | 2002 | 2017 |
| Mr. Pablo Isla Álvarez de Tejera(9) | 51 | 2002 | 2017 |
| Mr. Antonio Massanell Lavilla(2)(4)(5)(7)(10) | 60 | 1995 | 2016 |
| Mr. Ignacio Moreno Martínez (3)(4)(6)(10) | 57 | 2011 | 2017 |
| Mr. Francisco Javier de Paz Mancho (1)(5)(6)(10) | 56 | 2007 | 2018 |
| Mr. Chang Xiaobing (11) | 57 | 2011 | 2016 |
| (1) | Member of the Executive Commission of the Board of Directors. |
| (2) | Nominated by Fundación Bancaria Caja de Ahorros y Pensiones de Barcelona (“La Caixa”). |
| (3) | Nominated by Banco Bilbao Vizcaya Argentaria, S.A. (“BBVA”). |
| (4) | Member of the Audit and Control Committee of the Board of Directors. |
| (5) | Member of the |
| (6) | Member of the Regulation Committee. |
| (7) |
| Member of the Innovation Committee. |
| Member of the Strategy Committee. |
| Member of the Nominating, Compensation and Corporate Governance Committee. |
| Member of the Service Quality and Customer Service Committee. |
| Nominated by China Unicom (Hong Kong) |
Board Committees
At March 29, 2012,February 27, 2015, the committees of our Board of Directors and members thereof are as follows:
Executive Commission
Our Board of Directors has expressly delegated all of its authority and power to the Executive Commission except as prohibited by the Spanish corporate law,Corporation Act, under our Articles of Association, or under our Board Regulations. This commission is made up of fewer directors and meets more frequently than our Board of Directors. The members of the Executive Commission are Mr. César Alierta Izuel, Mr. Isidro Fainé Casas, Mr. José María Abril Pérez, Mr. Julio LinaresJosé María Álvarez-Pallete López, Mr. Carlos Colomer Casellas, Mr. Peter Erskine, Mr. Alfonso Ferrari Herrero, Mr. Gonzalo Hinojosa Fernández de Angulo, Mr. Francisco Javier de Paz Mancho and Mr. Ramiro Sánchez de Lerín García-Ovies, as secretary.
Audit and Control Committee
The Audit and Control Committee functions are regulated by our bylaws and our Board Regulations. The Audit and Control Committee has the primary objective of providing support to our Board of Directors in its supervisory and oversight functions, specifically having the following responsibilities:
| · | to report, through its chairman, to our shareholders at the general shareholders’ meeting regarding matters raised therein by the shareholders relating to the functions and matters of competence of the committee; |
| · | to propose to our Board of Directors to submit to our general meeting of shareholders the appointment of our auditors referred to in Article 264 of the Spanish Corporation |
| · | to supervise the effectiveness of the Company's internal control system, the internal audit and the risk management systems as well as to discuss with our auditors any significant weaknesses in the internal control system detected during the audit; |
| · | to supervise the preparation and submission of regulated financial information; |
| · | to establish and maintain the necessary relations with the auditors to receive, for review by the Committee, information on all matters that may put their independence at risk, and any other matters related to the process of auditing our accounts, as well as to receive information and maintain communication with our auditors as required by laws relating to the audit process and with respect to technical regulations on auditing. In any event, the Audit and Control Committee must receive annually written confirmation from our auditors of their independence vis-à-vis the entity or entities directly or indirectly related thereto, as well as information regarding additional services of any kind provided to such entities by our auditors, or by the persons or entities related thereto, pursuant to Law 19/1988, of July 12, on Auditing of Financial Statements; and |
| · | to issue on an annual basis, prior to the issuance of the audit report, a report stating an opinion regarding the independence of our auditors. This report must in all cases include an opinion on the provision of the additional services referred to in the immediately preceding paragraph. |
The Audit and Control Committee meets at least once per quarter and as many times as considered necessary. During 2011,2014, the Audit and Control Committee met 11eleven times and, as of the date of this Annual Report, had met threetwo times in 2012.2015. The members of the Audit and Control Committee are Mr. Carlos Colomer Casellas (chairman), Mr. Gonzalo Hinojosa Fernández de Angulo, (chairman), Mr. Antonio Massanell Lavilla, and Mr. Alfonso Ferrari Herrero.Herrero and Mr. Ignacio Moreno Martínez. Our Board of Directors has determined that Mr. Antonio Masanell Lavilla meets the requirements of an “audit committee financial expert” as such term is defined by the SEC.
Nominating, Compensation and Corporate Governance Committee
The Nominating, Compensation and Corporate Governance Committee is responsible for, among other things, reporting to our Board of Directors with respect to proposals for the appointment, re-election and removal of directors, members of the Executive Committee and the other committees of our Board of Directors and top members of our management and management of our subsidiaries. In addition, the Nominating, Compensation and Corporate Governance Committee is responsible for proposing to the Board of Directors, within the framework established in the bylaws, the compensation for the directors and reviewing it periodically to ensure that it is in keeping with the tasks performed by them, as provided in Article 35 of the Board Regulations, to propose to the Board of Directors, within the framework established in the bylaws, the extent and amount of the compensation, rights and remuneration of a financial nature, of the Chairman,chairman, the executive directors and the senior executive officers of Telefónica, including the basic terms of their contracts, for purposes of contractual implementation thereof and to supervise compliance with Telefónica’s internal rules of conduct and the corporate governance rules thereof in effect from time to time.
The members of the Nominating, Compensation and Corporate Governance Committee are Mr. Alfonso Ferrari Herrero (chairman), Mr. Carlos Colomer Casellas, Mr. Peter Erskine, Mr. Gonzalo Hinojosa Fernández de Angulo and Mr. Pablo Isla Álvarez de Tejera. During 2011,2014, the Nominating, Compensation and Corporate Governance Committee met eighteleven times, and as of the date of this Annual Report, it had met three times in 2012.
Regulation Committee
The Regulation Committee’s main objective is to monitor the main regulatory matters which affect us. Another responsibility of the Regulation Committee is to act as a communication and information channel between our management team and our Board of Directors concerning regulatory matters. The members of the Regulation Committee are Mr. Pablo Isla ÁlvarezGonzalo Hinojosa Fernández de TejeraAngulo (chairman), Mr. José Fernando de Almansa Moreno-Barreda, Mr. David Arculus, Ms. Eva Castillo Sanz, Mr. Alfonso Ferrari Herrero, Mr. Ignacio Moreno Martínez and Mr. Francisco Javier de Paz Mancho.
During 2011,2014, the Regulation Committee met sixfive times, and as of the date of this Annual Report, it had met onceone time in 2012.2015.
Service Quality and Customer Service Committee
The Service Quality and Customer Service Committee is responsible for monitoring and reviewing the standards of quality of the main services we provide. The Service Quality and Customer Service Committee acts as an information channel between our senior management team and our Board of Directors. The members of the Service Quality and Customer Service Committee are Mr. Antonio Massanell Lavilla (chairman), Ms. Eva Castillo Sanz, Mr. Carlos Colomer Casellas, Mr. Alfonso Ferrari Herrero, Mr. Gonzalo Hinojosa Fernández de Angulo, Mr. Ignacio Moreno Martínez and Mr. Pablo Isla ÁlvarezJavier de Tejera.Paz Mancho. During 20112014 the Service Quality and Customer Service Committee met fourtwo times, and as of the date of this Annual Report, it had met one time in 2015.
Institutional Affairs Committee
The Institutional Affairs Committee is responsible for reviewing, reporting and proposing to the Board of Directors the principles that are to govern the Group’s Sponsorship and Patronage Policy, to monitor such policy, and to individually approve sponsorships or patronages the amount or importance of which exceed the limit set by the Board and which require its approval. The Committee is responsible for promoting the development of the Telefónica Group’s Corporate Reputation and Responsibility project and its institutional affairs. The members of the Institutional Affairs Committee are Mr. Julio Linares López (chairman), Mr. José Fernando de Almansa Moreno-Barreda, Mr. Alfonso Ferrari Herrero, Mr. Gonzalo Hinojosa Fernández de Angulo, Mr. Antonio Massanell Lavilla and Mr. Francisco Javier de Paz Mancho. During 2014, the International Affairs Committee met six times, and as of the date of this Annual Report it had met oncetwo times in 2012.2015.
Innovation Committee
The Innovation Committee is responsible for advising and assisting in all matters regarding innovation. Its main object is to examine, analyze and periodically monitor the Group’s innovation projects, provide guidance and help ensure the implementation and development of innovation initiatives across the Group. The members of the Innovation Committee are Mr. Carlos Colomer Casellas (chairman), Mr. José María Abril Pérez, Mr. Antonio Massanell Lavilla, Mr. Peter ErskineJulio Linares López and Mr. Julio Linares López.Peter Erskine. During 2011,2014, the Innovation Committee met 11five times, and as of the date of this Annual Report, it had met twicetwo times in 2012.2015.
Strategy Committee
Without prejudice to any other tasks that the Board of Directors may assign thereto, the primary duty of the Strategy Committee is to support the Board of Directors in the analysis and implementation of the global strategy policy of the Telefónica Group. The members of the Strategy Committee are Mr. Peter Erskine (chairman), Mr. José Fernando de Almansa Moreno-Barreda, Ms. Eva Castillo Sanz, Mr. Alfonso Ferrari Herrero, Mr. Julio Linares López and Mr. Gonzalo Hinojosa Fernández de Angulo. The Strategy Committee met tenfive times during 2011,2014, and as of the date of this Annual Report, had met twicetwo times in 2012.2015.
Biographies of Directors
Mr. César Alierta Izuel serves as our Executive Chairman and Chairman of our Board of Directors. Mr. Alierta began his career in 1970 as general manager of the capital markets division at Banco Urquijo, S.A. in Madrid, where he worked until 1985. Subsequently, he founded and served as chairmanChairman of Beta Capital Sociedad de Valores, S.A. which he combined as from 1991 with his post as chairmanChairman of the Spanish Financial Analysts’ Association (Instituto (Instituto Español de Analistas Financieros)Financieros). Between 1996 and 2000, he was directorDirector and chairmanChairman of Tabacalera, S.A. At that time Tabacalera, S.A. changed its name into Altadis, S.A. (following its merger with the French Group, Seita-Société Nationale D’Éxplotation Industrielle des Tabacs et Allumettes) and he became directorDirector and chairmanChairman of Altadis, S.A. He has also been a member of the boardBoard of directorsDirectors of the Madrid Stock Exchange (Bolsa de Madrid), Plus Ultra Compañía de Seguros y Reaseguros, S.A. and of Iberia, S.A. OnIn January 1997, Mr. Alierta was appointed as a directorDirector of Telefónica and on July 26, 2000, he was appointed as our Executive Chairman. Mr. Alierta is director of Telecom Italia since November 8, 2007 andDirector of China Unicom (Hong Kong) Limited since October 15, 2008, and
of International Consolidated Airlines Group (IAG) since September 2010. Also, he is Trustee of Fundación Bancaria Caja de Ahorros y Pensión (“La Caixa”). Mr. Alierta has been a Director of Telecom Italia
from November 8, 2007, to December 13, 2013. Mr. Alierta holds a lawLaw degree from the University of Zaragoza and an MBA from Columbia University (New York) and is currently a member of the Columbia Business School Board of Overseers, and Chairman of the Social Board of the UNED (National Long Distance Spanish University).
Mr. Isidro Fainé Casas serves as Vice-Chairman of our Board of Directors. For over 40 years, Mr. Fainé has worked in several financial institutions, including amongst others: Banco Atlántico, S.A., (1964), Banco de Asunción (Paraguay) (1969), BancoBanca Riva y García, S.A. (1973), Banca Jover, S.A. (1974), and Banco Unión, S.A. (1978). Mr. Fainé is currently chairmanChairman of Fundación Bancaria Caja de Ahorros y Pensiones de Barcelona (“laLa Caixa”) of Caixa Bank, S.A., of Criteria Caixaholding, S.A., and of Confederación Españolathe Spanish Confederation of Savings Banks (CECA). He is also the Chairman of the Board of trustees of the Caixa d’ Estalvis I Pensiones de Cajas de Ahorros; vice-chairmanBarcelona “La Caixa” Banking Foundation; First Deputy Chairman of Abertis Infraestructuras, S.A. and of Sociedad General de Aguas de Barcelona, S.A. (AGBAR); and second vice-chairman of Repsol YPF, S.A. Heof the European Savings Banks Group (ESGB) and Deputy Chairman of the World Savings Banks Institute (WSBI). Furthermore, he is also a member of the boardBoards of directorsDirectors of Banco Portugués de Investimento, S.A. (BPI), and a non-executive director of the Bank of East Asia.Asia and of Suez Environnement Company. He is currently the Chairman of the Spanish Confederation of Executives (CEDE), the Spanish Chapter of the Club of Rome and the Círculo Financiero. He is also a member of the Business Council for Competitiveness (CEC). Mr. Fainé holds a doctorateDoctorate degree in economics,Economics, a diplomaDiploma in Alta Dirección (Senior Management)Senior Management from IESE Business School (Instituto de Estudios Superiores de la Empresa) and an ISMP certificate in business administrationBusiness Administration from Harvard University. He is a member of the Royal Academy of Economics and Finance (Real Academia de Ciencias Económicas y Financieras).and of the Royal Academy of Doctorate Holders.
Mr. José María Abril Pérez serves as Vice-Chairman of our Board of Directors. From 1975 to 1982 he served as financial managerFinancial Manager of Sociedad Anónima de Alimentación (SAAL). Since then, and until he joined the Banco Bilbao Vizcaya Argentaria Group (BBVA), he was financial managerFinancial Manager of Sancel-Scott Ibérica, S.A. In 1985 he joined Banco Bilbao, S.A. as managing directorManaging Director of Investment Corporate Banking. From January to April 1993, he was appointed executive coordinatorExecutive Coordinator of Banco Español de Crédito, S.A. In 1998, he became general managerGeneral Manager of the Industrial Group of BBVA.BBV. In 1999, he was appointed member of the executive committeeExecutive Committee of the BBVABBV Group. He has also been a member of the boardBoard of directorsDirectors of Repsol, S.A., Iberia, S.A., Corporación IBV, and Corporación IBV.Vice-Chairman of Bolsas y Mercados Españoles, S.A. In 2002 he became managing directorManaging Director of the Wholesale and Investment Banking Division and a member of the executive committeeExecutive Committee of BBVA,Banco Bilbao Vizcaya Argentaria, S.A., and he is now in early retirement. Until July 2007, he was vice president of Bolsas y Mercados Españoles, S.A. He is currently a member of the board of directors of Advancell, S.A. He holds a degree in economicsEconomics from the University of Deusto (Bilbao, Spain) and he has been professor atof such universityUniversity for nine years.
Mr. Julio Linares López serves as a directorVice-Chairman of our Board of Directors since September 2012 and ashad been our Chief Operating Officer sincefrom December 19, 2007.2007 to September 2012. He is also a member of the Advisory Committee of Telefónica Hispanoamérica and Telefónica España. In May 1970, he joined our Research and Development Center, where he held several positions until he was appointed head of our Technology Department in 1984. In April 1990, he was appointed General Manager of Telefónica Investigación y Desarrollo,Research and Development, S.A. In December 1994, he became deputy general managerDeputy General Manager of the Marketing and Services Development department in the commercial area and subsequently, deputy general managerDeputy General Manager for Corporate Marketing. In July 1997, he was appointed chief executive officerChief Executive Officer of Telefónica Multimedia S.A. and chairmanChairman of Telefónica Cable and Producciones Multitemáticas, S.A. in the Telefónica multimedia business. In May 1998 he was appointed General Manager of Strategy and Technology in Telefónica, S.A. In January 2000, he was appointed executive chairmanExecutive Chairman of Telefónica de España, S.A., a position which he held until December 2005, when he was appointed our managing directorManaging Director for Coordination, Business Development and Synergies. Mr. Linares was a Director of Telecom Italia until December 13, 2013. He is currently member of the boardGSM Association Board and Executive Committee, and is Chairman of directorsthe Strategic Committee. He is a Trustee of the Mobile World Capital Barcelona Foundation, of the Telefónica Foundation and of the executive committeeCEDE-Confederación Española de Directivos and Ejecutivos Foundation. He is also a member of Telecom Italiathe Association Management Board for Managerial Progress and member of the Social Council of the Complutense University ofin Madrid. Mr. Linares holds a degree in telecommunications engineeringTelecommunications Engineering from the Polytechnic University of Madrid (Universidad Politécnica de Madrid).
Mr. José María Álvarez-Pallete López serves as a directorDirector of our Board of Directors and, since September 2012 as our Chief Operating Officer. From September 11, 2011, to September 2012, he served as Chairman of Telefónica Europe. He began his career at Arthur Young Auditors in 1987. In 1988, he joined Benito & Monjardín/Kidder, Peabody & Co., where he held various positions in the research and corporate finance departments. In 1995, he joined Compañía Valenciana de Cementos Portland, S.A. (Cemex) as head of the Investor Relations and StudiesAnalysis department. In 1996 he was promoted to chief financial officerChief Financial Officer of Cemex Group in Spain, and in 1998, to chief administrationChief Administration and financial officerFinancial Officer of Cemex in Indonesia, headquartered in Jakarta, and he was appointed member of the Board of Cemex Asia, Ltd. In February 1999 he joined the Telefónica Group as general managerGeneral Manager of Finance for Telefónica International, S.A. In September of the same year he was promoted to chief financial officerChief Financial Officer of Telefónica. In July 2002, he was appointed chairman
Chairman and chief executive officerChief Executive Officer of Telefónica Internacional, S.A., in July 2006 general managerGeneral Manager of Telefónica Latinoamérica,Latin America, and in March 2009, Chairman of Telefónica Latinoamérica.Latin America. Mr. Álvarez-Pallete holds a degree in economicsEconomics from the Complutense University ofin Madrid. He also studied economicsEconomics at the Université Libre de Belgique and holds an International Management Program from the Pan-American Institute of Executive Business Administration (IPADE) and an advance research degreea Diplome of Advanced Studies (DEA) from the department of financefinancial economics and accounting of the Complutense University of Madrid.
Ms. Eva Castillo Sanz serves as a directorDirector of our Board of Directors. Ms. Castillo began her career at the Spanish broker Beta Capital Sociedad de Valores, S.A., where she worked for five years. After that, she worked for another five years for Goldman Sachs International in London in the International Equities department.Equity Markets Department. In 1997, Ms. Castillo joined Merrill Lynch as head of Equity Markets for Spain and Portugal. In 1999, she was promoted to Country Manager for Spain and Portugal and in 2000 she became chief executive officerChief Executive Officer of Merrill Lynch Capital Markets Spain. After that, Ms. Castillo was appointed chief operating officerChief Operating Officer for EMEA Equity Markets. In October 2003, she was appointed head of Global Markets & Investment Banking in Spain and Portugal, as well as president of Merrill Lynch Spain. Until December 2009, she headed Global Wealth Management business operations in Europe, the Middle East and Africa, including Merrill Lynch Bank (Suisse) and the International Trust and Wealth Structuring business. She was a member of the Merrill Lynch EMEA Executive Committee, the Global Wealth Management Executive and Operating Committees. Ms. Castillo was Chairwoman of Telefónica Europe and a member of Telefónica’s Executive Committee from September 2012 to February 2014. Currently, Ms. Castillo is currently directorthe Chairperson of Old Mutual, plc.the Supervisory Board of Telefónica Deutschland Holding AG, member of the Board of Directors of Bankia, S.A., of Visa Europea and of the Telefónica Foundation. She is also a member of the Board of the Comillas-ICAI Foundation and member of the Board of Entreculturas Foundation. Ms. Castillo holds degrees in business, economicsBusiness and lawLaw (ICADE – E3) from the Universidad Pontificia de Comillas of Madrid.
Mr. Carlos Colomer Casellas serves as a directorDirector of our Board of Directors. Mr. Colomer began his career in 1970 as marketing vice-chairmanMarketing Vice-Chairman of Henry Colomer, S.A. In 1980, he was appointed chairmanChairman and general managerGeneral Manager of Henry Colomer, S.A. and Haugron Cientifical, S.A. In 1986, he was also appointed presidentPresident of Revlon for Europe. In 1989, he became chairmanChairman of Revlon International and in 1990, he was appointed executive vice-presidentExecutive Vice-President and chief operating officerChief Operating Officer of Revlon Inc. in New York. In 2000, he was appointed chairmanChairman and chief executive officerChief Executive Officer of The Colomer Group. HeCurrently, he is also chairmanChairman of Ahorro Bursátil, S.A. SICAV, and Inversiones Mobiliarias Urquiola, S.A. SICAV.SICAV, Haugron Holdings S.L, MDF Family Partners and Abertis Infraestructuras S.A. Mr. Colomer has a degree in economicsEconomics from the University of Barcelona and an MBA from IESE Business School (Instituto de Estudios Superiores de la Empresa).School.
Mr. Peter Erskine serves as a directorDirector of our Board of Directors. He began his career in the field of marketing and trade mark management in Polycell and in Colgate Palmolive. He worked for several years at the Mars Group, serving as vice-chairmanVice-Chairman for Europe of Mars Electronics. In 1990 he was appointed vice-presidentVice-Chairman of Marketing and Sales of Unitel. From 1993 to 1998, he held a number of senior positions, including directorDirector of British Telecom (BT) Mobile and presidentPresident and chief executive officerChief Executive Officer of Concert. In 1998 he became managing directorManaging Director of BT Cellnet. Subsequently, in 2001 he became chief executive officerChief Executive Officer and a directorDirector of the boardBoard of directorsDirectors of Telefónica Europe, Plc. In 2006 he became executive chairmanExecutive Chairman of Telefónica Europe, Plc (until December 31, 2007, after which he became a non-executiveNon-Executive Director) and from July 2006 until December 2007 he served as general managerGeneral Manager of the business unit Telefónica Europe. In 2008, he joined the Telecom Advisory Boards of Apax Partners and MacQuarie European Infrastructure Fund, and become a member of the Strategy Advisory Committee of Henley Management Centre. In January 2009 he joined the Board of Ladbrokes Plc.
as a non executive director,Non-Executive Director, becoming chairmanChairman in May 2009. Currently, he is also Chairman of the Advisory Board of Henley Management Centre, and a member of the advisory boardCouncil of Henley Management Centre.Reading University. In 1973, he received a degree in psychologyPsychology from Liverpool University.
Mr. Santiago Fernández Valbuena is Chief Strategy Officer (CSO) and Chairman of Fonditel since February 2014. He is also a member of the Board of Telefónica S.A. and Deputy Chairman of Telefônica do Brasil. He has been Chairman & CEO of Telefónica Latin America (2011-2014), Chief Finance and Strategy Officer (2010-2011) and Chief Financial and Corporate Development Officer (2002-2010). Throughout this period he was also responsible (not continuously) for Procurement, IT, HR, Internal Audit and Subsidiaries (Atento, Endemol). From 1997 to 2002 he was CEO of Fonditel, the pension fund manager for Telefónica. Since 2008 he serves as Independent Director at Ferrovial S.A. and member of its Audit Committee. Before joining Telefónica he was Managing Director at Société Générale de Valores and Head of Equities at Beta Capital in Madrid. He holds a degree in Economics from the Complutense University of Madrid, a PhD and a Master’s degree in Economics from Northeastern University in Boston. He has been a Professor of Applied Economics at Complutense University in Madrid and the Universidad de Murcia and has lectured at Instituto de Empresa (IE Business School) in Madrid.
Mr. Alfonso Ferrari Herrero serves as a directorDirector of our Board of Directors. From 1968 to 1969 he was assistantAssistant to the financial managerFinancial Manager of Hidroeléctrica del Cantábrico, S.A. From 1969 to 1985, he worked in Banco Urquijo, S.A. holding several positions as analyst, managerAnalyst, Manager of Industrial Investments and as a representative in several subsidiaries of Banco Urquijo, S.A. in his capacity as member of the boardBoard of directors.Directors. From 1985 to 1996 he was a member of the boardBoard of directorsDirectors and managerManager of the Corporate Finance of Beta Capital Sociedad de Valores, S.A., of which Mr. Ferrari was a co-founder. From 1996 until 2000 served as chairmanChairman and chief operating officerChief Operating Officer of Beta Capital, S.A. Currently, he is a Director of Telefónica del Perú, S.A.A., and a Deputy Director of Telefónica Chile, S.A. He has a doctorate in industrial engineeringIndustrial Engineering from the Industrial Engineers Technical School of the Polytechnic University of Madrid (Escuela Técnica Superior de Ingenieros Industriales de la Universidad Politécnica de Madrid) and holds an MBA from Harvard University.
Mr. Luiz Fernando Furlán serves as a directorDirector of our Board of Directors. He is currently Chairman of the Board of Directors of Amazonas Sustainability Foundation and member of Global Ocean Commission. He is also a member of the Board of Directors of Telefónica Brasil, S.A., BRF-Brasil Foods, S.A. (BRAZIL), AGCO Corporation (USA), and a member of the Advisory/Consultive Board of Abertis Infraestructuras, S.A. (Spain). Throughout his career he has been a member of the board of directors of several companies in Brazil and abroad such as Chairman of Sadia, S.A., Embraco,Co-Chairman of BRF-Brasil Foods, S.A. (Brasmotor Group-Brazil) and Panamco (Pan American Beverages, Inc. – USA). He was also, member of the consulting boardBoard of IBM in Latin AmericaRedecard, S.A., and member of ABN Amro Bank in Brazil, as well as chairmanthe Advisory/ Consultive Board of Brazilian Chicken Exporters Association (ABEF), Brazilian Association of Public Owned Companies (ABRASCA)Panasonic (Japan) and of Mercosur European Union Business Forum (MEBF). He also was vice-president of São Paulo Entrepreneurs Association (FIESP)Wal-Mart (USA). From 2003 to 2007 he was Minister of Development, Industry and Foreign Trade of Brazil. Currently he is chairman of the board of directors of BRF-Brasil Foods, S.A. and of Amazonas Sustainability Foundation and member of the board of directors of Amil Participações S.A. and of AGCO Corporation, and member of the Advisory/Consultive Board of Panasonic (Japan), McLarty & Associates (USA) and Wal-Mart Stores Inc. (USA). He holds a degree in chemical engineeringChemical Engineering from the Industrial Engineering Faculty of São Paulo and in business administrationBusiness Administration from University of Santana (São Paulo), with specialization in financial administration from Fundação Getúlio Vargas (São Paulo).
Mr. Gonzalo Hinojosa Fernández de Angulo serves as a directorDirector of our Board of Directors.Directors and of Telefónica del Perú, S.A.A. He began his career in 1966 in Cortefiel, S.A. and served in several management positions since then. From 1976 to 1985 Mr. Hinojosa was general managerGeneral Manager of Cortefiel, S.A. and from 1985 until 2005 he served as chief executive officerChief Executive Officer of Cortefiel Group, a post which he combined with his appointment as chairmanChairman from 1998 until 2006. From 1991 through 2002, he served as a directorDirector of Banco Central Hispano Americano, S.A. and as a directorDirector of Portland Valderribas, S.A. He has also served as a directorDirector of Altadis, S.A. (1998-2007) and of Dinamia Capital Privado, S.A., SCR. Mr. Hinojosa has a degree in industrial engineeringIndustrial Engineering from the Industrial Engineers Technical School of the Polytechnic University of Madrid (Escuela Técnica Superior de Ingenieros Industriales de la Universidad Politécnica de Madrid).
Mr. Pablo Isla Álvarez de Tejera serves as a directorDirector of our Board of Directors. Mr. Isla began his career in 1989 as Governmenta State’s Attorney (Abogadoabogado del Estadoestado), and heholding the first position of his class. He joined the Body of GovernmentState’s Attorneys that year in the first position of the candidates, forand was assigned to the Spanish Ministry of Transportation, Tourism and Communications. In 1991 he moved to the General Management of the Legal Services of the Spanish Government (Dirección General del Servicio Jurídico del Estado). From 1992 to 1996, Mr. Isla served as general managerGeneral Manager of the Legal Services Department of Banco Popular, S.A. In 1996, he was appointed general managerGeneral Manager of the National Heritage Department of the Treasury Department of Spain (Ministerio de Economía y Hacienda). He also served as General Secretary of Banco Popular Español, S.A. from 1998 to 2000. In July 2000, Mr. Isla was appointed chairmanChairman of the board of Grupo Altadis and co-chairmanCo-Chairman of thesuch company. In June 2005, Mr. Isla was appointed the deputy chairmanDeputy Chairman and chief executive officerChief Executive Officer of Inditex, S.A..S.A. Since 2011, Mr. Isla has been the ChaimanChairman of Inditex, S.A. Mr. Isla has a degree in lawLaw from the Complutense University of Madrid.
Mr. Antonio Massanell Lavilla serves as a directorDirector of our Board of Directors. In 1971 he joined the Caja de Ahorros y Pensiones de Barcelona (“laLa Caixa”), where he held several posts and in 1990, he was appointed assistant managerAssistant Manager and secretarySecretary of the Steering Committee, and from 1999 to June 2011 he served as executive general assistant manager.Executive General Assistant Manager. In the same year, he was appointed member of the board of directorsDirectors of Sociedad Española de Medios de Pago, S.A. From 1992 to 1994, Mr. Massanell served as Chairman of the Steering Committee of Sistema 6000 de la Confederación Española de Cajas de Ahorros, and directorDirector of Visa Spain (1995-1998), Director of Autema (1991-2003), Director of Inmobiliaria Colonial Real Estate (1992-2003), Director of Baqueira Beret (1998-2006) and, Director of Occidental Hotels Management, B.V.
(2003-2007)., Chairman of Port Aventura Entertainment, S.A. (2009-2012), Director of e-la Caixa, S.A. Director of Caixa Capital Risc, S.G.E.C.R, S.A. and Director of Serveis Informátics “La Caixa”, S.A. Mr. Massanell is currently general managerDeputy Chairman of Caixa Bank since June 2014. He is also the Chairman of Barcelona Digital Centre Tecnológic (former Fundación Barcelona Digital) and Non-Executive Chairman of Cecabank. He is also a member of the boardsBoards of directorsDirectors of e-la Caixa,Banco Portugués de Investimento, S.A. (BPI), Boursorama, S.A., Caixa Capital Risc, S.G.E.C.R.SAREB (Sociedad de Gestión de Activos Inmobiliarios procedentes de la Reestructuración Bancaria), S.A.,and Mediterránea Beach & Golf Community, S.A. and Serveis Informátics “La Caixa,” S.A. He is also chairman of Port Aventura Entertainment, S.A. and Barcelona Digital Centre Tecnológic (former Fundació Barcelona Digital). Mr. Antonio Massanell Lavilla holds a degree in economicsEconomics from the University of Barcelona.
Mr. Ignacio Moreno Martínez serves as a directorDirector on our Board of Directors. Previous posts include Headhead of Corporate Banking and Private Equity at Banco de Vizcaya, Banco Santander de Negocios, and Mercapital. He also served as Deputy General Manager of Corporate and Institutional Banking at Corporación Bancaria de España, S.A. – Argentaria, CEOChief Executive Officer of Desarrollo Urbanístico Chamartín, S.A., and Chairman of Argentaria Bolsa, Sociedad de Valores. In addition, he also served as General Manager of the Chairman’s Office at Banco Bilbao Vizcaya Argentaria, S.A., and CEOChairman Executive Officer of Vista Capital Expansión, S.A., SGECR – Private Equity and Chairman Executive Officer of N+1 Private Equity. Mr. Moreno is currently CEOChief Executive Officer of N+1 Private Equity.Equity and Non-Executive Chairman of Metrovacesa, S.A. Mr. Moreno holds a degree in Economics and Business Studies from the University of Bilbao, and a Master’s degree in Marketing and Sales Management from the Instituto de Empresa and an MBA from INSEAD.
Mr. Francisco Javier De Paz Mancho serves as a directorDirector of our Board of Directors. From 1990 to 1993, he was General Secretarygeneral secretary of the Spanish Consumers Association (Unión de Consumidores de España, UCE, UCE)). From 1993 to 1996, he served as general managerGeneral Manager of Internal Trade of the Spanish Ministry of Tourism and Commerce. From 1994 to 1996, he was chairmanChairman of the Observatory of Trading of the Spanish Ministry of Tourism and Commerce (Observatorio de la Distribución Comercial del Ministerio de Comercio y Turismo)Turismo); from 1996 to 2004, he was corporate strategy managerCorporate Strategy Manager of the Panrico Donuts Group. From 1998 to 2004, he served as directorDirector of Mutua de Accidentes de Zaragoza (MAZ) and of the Panrico Group. From 2004 to 2006, he was directorDirector of Tunel de Cadí, S.A.C. and from 2003 to 2004, he served as chairmanChairman of the Patronal Pan y Bollería Marca (COE). From 2004 to 2007, he was chairmanChairman of the National Company MERCASA. He has also been a member of the boardBoard of directorsDirectors of Altadis, S.A., and of the Economic and Social Board and its permanent commission. From July 2006, he has been a member of the Executive Committee of the Chambers Board (Consejo Superior de Cámaras). Currently, he is director of Telefónica de Argentina, S.A. and Telefónica Brasil, S.A. He is also Chairman of Telefónica Gestión de Servicios Compartidos España, S.A.U. Mr. de Paz has a diploma in publicityPublicity and informationInformation and followedundertook studies in law.Law. He followedcompleted a Programa de Alta Dirección de Empresas from the IESE Business School (Instituto de Estudios Superiores de la Empresa, University of Navarra).
Mr. Chang Xiaobing serves as a directorDirector of our Board of Directors. Prior to joining China United Telecommunications Corporation, Mr. Chang served as Deputy Director of the Nanjing Municipal Posts and Telecommunications Bureau of Jiangsu Province, Deputy Director General of the Directorate General of Telecommunications of the Ministry of Posts and Telecommunications, and Deputy Director General and Director Generaldirector general of the Department of Telecommunications Administration of the former Ministry of Information Industry, as well as Vice Presidentvice president of China Telecommunications Corporation. Mr. Chang became the Chairman of China United Telecommunications Corporation in November 2004. He was appointed in December 2004 as an Executive Director, Chairman and Chief Executive Officer of China Unicom (Hong Kong) Limited. In December 2008, China United Telecommunications Corporation changed its company name to China United Network Communications Group Company Limited ("Unicom Group"). He serves as the Chairman of Unicom Group, China United Network Communications Limited ("A Share Company") and China United Network Communications Corporation Limited ("CUCL"), respectively. Mr. Chang graduated in 1982 from the Nanjing Institute of Posts and Telecommunications with a bachelor's degree in telecommunications engineeringTelecommunications Engineering and received a master's degree in business administrationBusiness Administration from Tsinghua University in 2001. He received a doctor's degreedoctorate in business administrationBusiness Administration from the Hong Kong Polytechnic University in 2005.
Executive Officers/Management Team
At March 29, 2012,February 27, 2015, our executive management team consisted of the following individuals:
Name | Position | Appointed | Age | Position | Appointed | Age | |||||
Mr. César Alierta Izuel | Chairman of the Board of Directors and Chief Executive Officer | 2000 | 66 | Chairman of the Board of Directors and Chief Executive Officer | 2000 | 69 | |||||
Mr. Julio Linares López | Chief Operating Officer | 2007 | 66 | ||||||||
Mr. José María Álvarez –Pallete López | Chairman of Telefónica Europe | 2011 | 48 | ||||||||
| Mr. José María Álvarez -Pallete López | Chief Operating Officer | 2012 | 51 | ||||||||
| Mr. Santiago Fernández Valbuena | Chief Strategy Officer | 2011 | 56 | ||||||||
Mr. Guillermo Ansaldo Lutz | General Manager of Global Resources | 2011 | 50 | Chief Global Resources Officer | 2011 | 53 | |||||
Mr. Matthew Key | Chairman of Telefónica Digital | 2011 | 49 | ||||||||
Mr. Santiago Fernández Valbuena | Chaiman of Telefónica Latin América | 2002 | 54 | ||||||||
Mr. Luis Abril Pérez | Technical General Secretary to the Chairman | 2002 | 64 | ||||||||
| Mr. Ramiro Sánchez de Lerín Garcia-Ovies | General Legal Secretary and Secretary to the Board | 2005 | 60 | ||||||||
| Mr. Angel Vilá Boix | Chief Financial and Corporate Development Officer | 2011 | 50 | ||||||||
| Mr. Eduardo Navarro de Carvalho | Chief Commercial Digital Officer | 2012 | 52 | ||||||||
| Mr. Ignacio Cuesta | General Manager of Internal Audit | 2012 | 52 | ||||||||
Name | Position | Appointed | Age | |||
Mr. Calixto Ríos Pérez | General Manager of Internal Audit | 2002 | 67 | |||
Mr. Ángel Vilá Voix | General Manager of Finance and Corporate Development | 2011 | 47 | |||
Mr. Ramiro Sánchez de Lerín García-Ovies | General Legal Secretary and Secretary to the Board | 2003 | 57 |
Biographies of the Executive Officers and Senior Management
We present below the biographies of our executive officers and senior management who do not also serve on our Board of Directors.
Mr. Guillermo Ansaldo Lutz serves as General Manager ofChief Global Resources Officer (CGRO) of Telefónica Global Resources operating unit since September 2011, and he is also member of the Executive Committee of Telefónica. From 1989 to 2000 he worked for McKinsey & Company holding different positions in Spain and Argentina. In 1995, he was appointed partner of McKinsey & Company in Argentina. From 2000 to 2004 he was the chief executive officerChief Executive Officer of Telefónica de Argentina, S.A. and since April 2005, he held the position of chief executive officerChief Executive Officer of Telefónica de España, S.A. From December 2007 to September 2011 he was Chairman and CEOChief Executive Officer of Telefónica de España. He holds a degree in industrial engineeringIndustrial Engineering from the Universidad de Buenos Aires and an MBA from The Amos Tuck School of Business Administration, Dartmouth College.
Mr. Ramiro Sánchez de Lerín García-Ovies serves as our General Secretary and Secretary to our Board of Directors. He is also a member of the Executive Committee. He began his career in Arthur Andersen, first working for its audit department and later for its tax department. In 1982, he became a GovernmentState’s Attorney (Abogadoabogado del Estadoestado) and started working for the local tax authorities in Madrid (Delegación de Hacienda de Madrid). Afterwards he was assigned to the State Secretariat for the European Communities and later to the Foreign Affairs Ministry. He has been general secretaryGeneral Secretary and secretarySecretary of the Boardboard of Elosúa, S.A., Tabacalera, S.A., Altadis, S.A. and Xfera Móviles, S.A. He has also held teaching positions in Instituto Católico de Administración y Dirección de Empresas (ICADE), Instituto de Empresa and Escuela de Hacienda Pública.
Mr. Ángel Vilá Boix serves as our General Manager for Financeis Chief Financial and Corporate Development Officer (CF&CDO) and is a member of the Executive Committee atof the Telefónica S.A.Group. He joined Telefónica in 1997 as Group Controller, moving on to become CFO of Telefónica Latinoamérica. In 2000 he was appointed Group Head of Corporate Development, in charge of corporate M&A transactions. Mr. Vilá is currently Vice Chairman of the Board of Directors of Telco SpA (Italy), and Board member of Telefónica Germany. He previously served on the Boards of BBVA, Endemol, Digital Plus, Atento, Telefónica Contenidos, Telefónica Czech Republic, CTC Chile, Indra SSI, Terra Lycos and the Advisory panel of Macquarie MEIF funds. He is a Patron in the Telefónica Foundation. Prior to joining Telefónica, he held positions at Citigroup, McKinsey&Co, Ferrovial and Planeta. Mr. Vilá joined Telefónica in 1997 as Group Controller, moving on to become CFO of Telefónica Internacional, where he led the Telebras privatization team. In 2000, he was appointed Group Head of Corporate Development. He is member of the Boards of Directors of Telco SpA and Digital+. He previously served on the Boards of BBVA and Endemol, and on the Advisory panel of Macquarie MEIF funds. He graduated in Industrial Engineering from Universitat Politècnica de Catalunya and holds aan MBA from Columbia University (New York).
Mr. Eduardo Navarro de Carvalho is Chief Commercial Digital Officer at Telefónica S.A and member of the Executive Committee. He joined Telefónica in 1999, and since then he has been responsible for Strategy and Alliances for Telefónica Group from 2010 to February 2014, responsible for Strategy and Regulatory Affairs for Telefónica Latin America from 2005 to 2009, and for Telefónica Brasil from 1999 to 2004. Previously, he worked for five years as a Consultant in Mckinsey & Company, focused on Infrastructure and Telecommunications Projects in several countries and
also worked as Steel Works Manager in the Group ARBED in Brazil. He is a graduate in Metallurgical Engineering from the Federal University of Minas Gerais, Brazil.
Mr. Ignacio Cuesta is the Chief Audit Executive of the Telefónica Group since January 2013. He joined the Telefónica International financial department in January 1995 as Manager. In 1999 he joined Telefónica, S.A., working in the corporate finance department for the next ten years. In 2001, he was appointed Deputy Chief Financial Officer of Telefónica’s Corporation in charge of several areas as accounting, financial planning and taxes among others. In October 2009 he was appointed Telefónica Latin America Chief Financial Officer, working in that role for the next three years. Previously he had worked as a Financial Auditor for an audit firm and as internal auditor and as Chief Consolidation Accounting Officer for the multinational Pedro Domecq. From 2004 to 2009, he was nominated member of the Standard Advisory Committee of the Spanish Institute of Accounting and Auditing and member of the Accounting Experts Group of the CNMV. He holds a degree in Economics.
Please see Note 21(f) and Appendix II to our Consolidated Financial Statements.Statements for information on the compensation paid to members of our Board of Directors and Executive Officers/Senior Management Team during the year 2014.
Incentive Plans
Please see Note 2019 to our Consolidated Financial Statements.
Please see “—Directors and Senior Management” above.
Please see “ Headcount and employee benefits”Headcount” in Note 1918 to our Consolidated Financial Statements.
At March 29, 2012,February 27, 2015, the following members of our Board of Directors beneficially owned directly or indirectly an aggregate of 7,188,5217,447,503 shares, representing approximately 0.158%0.160% of our capital stock.
| ||||||||||||||||||||||||||||||||||||||||||||||||||||||||||||||||||||||||||||||
At March 29, 2012,February 27, 2015, members of our executive management team (excluding members of our Board of Directors listed above) beneficially owned an aggregate of 1,435,241720,009 of our shares, representing approximately 0.030.02 % of our capital stock.
None of our directors or executive officers beneficially owned shares representing one percent or more of our share capital at March 29, 2012.February 27, 2015.
None of our directors and executive officers held options in respect of shares representing one percent or more of our share capital at March 29, 2012.February 27, 2015.
Please see “Share-based payment plans” in Note 19 to our Consolidated Financial Statements.
General
At March 29, 2012,February 27, 2015, we had 4,563,996,4854,657,204,330 shares outstanding, each having a nominal value of €1.001.00 euro per share. All outstanding shares have the same rights.
At March 29, 2012,February 27, 2015, according to information provided to us or to the Spanish National Securities Commission (Comisión Nacional de Mercado de Valores or the CNMV,“CNMV”), beneficial owners of 3% or more of our voting stock were as follows:
Name of Beneficial Owner | Number of Shares | Percent | ||
Banco Bilbao Vizcaya Argentaria, S.A.(1) | 258,217,137 | 5.657% | ||
Caja de Ahorros y Pensiones de Barcelona (“la Caixa”)(2) | 246,898,917 | 5.410% | ||
Blackrock, Inc.(3) | 177,257,649 | 3.88% |
| Name of Beneficial Owner | Number of Shares | Percent | |
| Direct | Indirect | ||
| Banco Bilbao Vizcaya Argentaria, S.A.(1) | 291,194,876 | 13,132 | 6.25% |
| Fundación Bancaria Caixa d Estalvis i Pensions de Barcelona (“La Caixa”)(2) | - | 244,647,885 | 5.25% |
| Blackrock, Inc.(3) | - | 177,257,649 | 3.81% |
| (1) | Based on the information provided by Banco Bilbao Vizcaya Argentaria, S.A. as at December 31, |
| (2) | Based on information provided by Fundación Bancaria Caja de Ahorros y Pensiones de Barcelona, “la Caixa” as at December 31, |
| (3) | According to notification sent to the 2010. |
To the extent that our shares are represented by account in the book-entry form, we do not keep a shareholder registry and our ownership structure cannot be known precisely. Based on the information available to us there is no individual or corporation that directly or indirectly through one or more intermediaries may exercise any type of control over us. Nevertheless, we have certain shareholders whose holdings are considered material.
Ownership Limitations
There are no limitations with respect to the ownership of our assets or share capital except those related to assets derived from the application of the reciprocity principle. Article 6 of the General Telecommunications Law, or the GTL, provides for the application of the reciprocity principle under existing international treaties or agreements signed and ratified by Spain. The Spanish government, upon request, may authorize exceptions to the reciprocity principle contained in the GTL.
During 20112014 and through the date of this Annual Report, none of our directors nor any member of our management team has been involved in any related party transactions with us.
Our Board of Directors’ Regulations grant the Board of Directors the exclusive power to authorize any transactions with major shareholders or with our directors. Prior to authorizing any such transaction, our Board will receive an opinion from the Nominating, Compensation and Corporate Governance Committee addressing the fairness of the transaction to our shareholders and us. Any of our directors that may have an interest in the proposed transaction must abstain from voting on the proposed transaction.
Related Party Transactions with Significant Shareholders
Two of our major shareholders are financial institutions.institutions (see “—Major Shareholders—General” above). We have entered into related party transactions with both companies within our ordinary course of business, and always on arm’s length terms. During 2011,2014, the executed transactions were generally loans, capital markets or derivative transactions provided to us by these financial institutions and agreements for us to provide telecommunications and broadband services to such institutions.
Intra-Group Loans
We are the parent company of the Telefónica Group and operate through our subsidiaries and affiliated companies. We coordinate group policies, including financial policy and, in some cases, actual financial management is conducted by us. Most of the transactions we perform with other members of the Telefónica Group relate to financing transactions, including covering their needs for funds and providing interest rate and exchange rate hedges.
At December 31, 2011,2014, as recorded in our parent company accounts, we loaned a total of €4,3437,433 million (€5,424euros (9,806 million euros at December 31, 2010)2013) to companies of the Telefónica Group while companies of the Telefónica Group and their associates loaned us a total of €51,84851,680 million (€50,320euros (49,895 million euros at December 31, 2010)2013), of which €10,0488,437 million (€10,063euros (6,875 million euros at December 31, 2010)2013) was loaned to us by Telefónica Europe, B.V. and €32,07837,157 million (€29,424euros (35,930 million euros at December 31, 2010)2013) was loaned to us by Telefónica Emisiones S.A.U., our financing subsidiaries devoted to raising funds in the capital markets, €7,3801,912 million (€9,011euros (3,635 million euros at December 31, 2010)2013) was loaned to us by Telefónica Finanzas, S.A.U., our subsidiary in charge of financial support for Telefónica Group companies and €2,3323,913 million (€1,812euros (3,455 million euros at December 31, 2010)2013) was loaned by us to Telfisa Global, B.V., our financing subsidiary charged with centralizing and managing the cash pooling of our subsidiaries in Latin America, Europe and the United States.
With respect to the balances with associated companies, the line item “Non-current financial assets” on the consolidated statement of financial position at December 31, 2011,2014, includes “Loans to Associates” amounting to €68516 million (€647euros (1,281 million euros at December 31, 2010)2013).
Not applicable.
Consolidated Financial Statements
Please see Item 18.
Legal Proceedings
Telefónica and its group companies are party to several legal proceedings which are currently in progress in the courts of law and the arbitration bodies of the various countries in which we are present.
Based on the advice of our legal counsel, we believe it is reasonable to assume that these legal proceedings will not materially affect our financial positioncondition or solvency, regardless of the outcome.
We highlight the following unresolved legal proceedings or those underway in 2011:
Cancellation of the UMTS license granted to Quam GMBH in Germany
In December 2004, the GermanyGerman Telecommunications Market Regulator revoked the UMTS license granted in 2000 to Quam GmbH ("Quam"), in which Telefónica has a stake. After obtaining a suspension of the revocation order, on January 16, 2006, Quam GmbH filed a suit against the order with the German courts. This claim sought two objectives: 1) to overturn the revocation order issued by the German Telecommunications Market Regulator, and 2) if this failed, to be reimbursed for the total or partial payment of the original amount paid for the license.license, 8,400 million euros.
This claim was rejected by the Cologne Administrative Court. Quam GmbH appealed the decision before the Supreme Administrative Court of North Rhine-Westphalia, which also rejected its appeal.
Finally, Quam GmbH filed a new appealclaim in third instance before the Federal Supreme courtCourt for Administrative Cases, which appeal was also rejectednot admitted for processing.
Quam appealed this decision on August 14, 2009. On August 17, 2011. Finally, in2011, after the oral hearing, the Federal Administrative Court rejected Quam's appeal at third instance.
In October 2011, Quam GmbH submittedfiled a constitutional complaint before the German Federal Constitutional Court that it(Karlsruhe), which is still pending resolution.
Appeal against the European Commission ruling of July 4, 2007 against Telefónica de España’s broadband pricing policy
On February 22, 2006, we were sent a statement of objections, initiating disciplinary proceedings for conduct that goes against Article 82 of EC Treaty rules. Subsequently, on July 9, 2007, Telefónica was notified of the decision issued by the European Commission issued a decision,(the "EC") imposing a fine of €152 million on usTelefónica, S.A. and Telefónica de España.a, S.A.U. ("Telefónica de España") a fine of approximately 152 million euros for breach of the former Article 82 of the Treaty Establishing the European Community for not charging equitable prices to whole and retail broadband access services. The ruling charged us withcourt ruled in favor of the EC accusing Telefónica of applying a margin squeeze between the prices weit charged competitors to provide regional and national wholesale broadband services and ourits retail broadband prices using ADSL technology frombetween September 2001 toand December 2006.
On September 10, 2007, weTelefónica and Telefónica de España both filed appealsan appeal to overturn the decision before the General Court of First Instance of the European Community.Union. The Kingdom of Spain, as an interested party, also lodged an appeal to overturn the decision. Meanwhile, France Telecom and the Spanish Association of Bank Users (AUSBANC) filed requests to intervene, to which we have submitted our comments.the General Court admitted.
A hearing was held on May 23, 2011. 2011, at which Telefónica presented its case. On March 29, 2012, the General Court rejected the appeal by Telefónica and Telefónica de España, confirming the sanction imposed by the EC. On June 13, 2012, an appeal against this ruling was lodged before the European Union Court of Justice.
On September 26, 2013, the Attorney General presented its conclusions to the court which alluded to a possible breach of the EU has upheldprinciple of non-discrimination with respect to the decisionsanction and a defective application of the EC. Telefónica will lodge an appeal withprinciple of full jurisdiction by the General Court, requesting to return the lawsuit to the instance.
On July 10, 2014 the European Union Court of Justice dismissed the appeal, maintaining the fine imposed for its annulment.abuse of dominant position (margin squeeze) on wholesale prices charged by Telefónica and Telefónica de España for broadband access in Spain. This ended the appeal process.
The fine was satisfied by Telefónica de España, as indicated in Note 15 to our Consolidated Financial Statements.
Appeal against the decision by Agencia Nacional de Telecomunicações (ANATEL) regarding the inclusion of interconnection and network usage revenues in the Fundo de Universalização de Serviços de Telecomunicações (FUST).
At the same time, TelespTelefónica Brasil and Telefónica Empresas, S.A., together with other fixed linewireline operators through ABRAFIX (Associação Brasileira de Concessionárias de Serviço Telefonico Fixo Comutado) appealed ANATEL’sANATEL's decision of December 16, 2005, also obtaining injunctions.the precautionary measures requested. On June 21, 2007, Federal Regional Court No.no. 1 ruled that it was not appropriate to include the interconnection and network usage revenues and expense in FUSTthe FUST's taxable income and rejected the retroactive application of ANATEL’sANATEL's decision. ANATEL filed an appeal to overturn this ruling on April 29, 2008, before Brasilia Federal Regional Court No.no. 1. This appeal
No further action has been taken since then. The amount of the claim is pending resolution.quantified at 1% of the interconnection revenues.
Public civil procedure by the São Paulo government against TelespTelefónica Brasil for alleged repeatedreiterated malfunctioning in the services provided by Telesp requestingTelefónica Brasil and request of compensation for damages to the customers affected.affected
In April 2010, a ruling against the Telefónica Group was issued in first instance. The full impact of this proceeding will onlynot be known inuntil there is a final ruling, and the calculationtotal amount of persons affected by and enforcementparty to the proceeding is known. At that moment, the amount of the award by affected consumers.
contained in the sale and purchase agreement of Portugal Telecom's ownership interest in Brasilcel, N.V., a joint venture in which both were venturers and which was the owner of the Brazilian company Vivo.
On January 23, 2013, the EC passed a ruling on the formal proceedings. The ruling imposed a fine on Telefónica of 67 million euros, as the EC ruled that Telefónica and Portugal Telecom committed an infraction of Article 101 of the Treaty on the Functioning of the European Union (“TFUE”) for having entered into the agreement set forth in Clause Nine of the sale and purchase agreement referred to above.
On April 9, 2013, Telefónica filed an appeal for annulment of this ruling with the European Union General Court. On August 6, 2013, the General Court notified Telefónica of the response issued by the EC, in which the EC reaffirmed the main arguments of its ruling and, specially, that Clause Nine includes a competition restriction. On September 30, 2013, Telefónica filed its reply. On December 18, 2013, the European Commission filed its appeal.
Judicial appeals against the decisions by the Conselho Administrativo de Defesa Econômica (CADE) regarding the acquisition by Telefónica, S.A. of stakes in Portugal Telecom and Telco
On December 4, 2013, the Brazilian Antitrust Regulator, CADE announced, the two following decisions:
| 1. | To approve, with the restrictions mentioned below, the acquisition by Telefónica of the entire participation held by Portugal Telecom, SGPS S.A. and PT Móveis - Serviços de Telecomunicações, SGPS, S.A., (the "PT Companies") in Brasilcel, N.V., which controlled the Brazilian mobile company, Vivo Participações, S.A. ("Vivo"): |
| (a) | The entry of a new shareholder in Vivo, sharing the control of Vivo with Telefónica in conditions identical to those that were applicable to the PT Companies when they had a participation in Brasilcel N.V., or |
| (b) | That Telefónica ceases to have any direct or indirect financial interest in TIM Participações S.A. |
| 2. | To impose on Telefónica a fine of 15 million Brazilian Reals, for having allegedly breached the spirit and the goal of the agreement signed between Telefónica and CADE (as a condition to the approval of Telefónica's original acquisition of an interest in Telecom Italia, S.p.A. in 2007), due to the subscription of non-voting shares of Telco in recent capital increases. This decision also requires Telefónica to divest such non-voting shares of Telco. |
The fine imposed by CADE on Telefónica relates to the agreement reached on September 24, 2013, between Telefónica and the other shareholders of Telco (which holds 22.4% of the voting share capital of Telecom Italia, S.p.A.) whereby Telefónica subscribed and paid out a share capital increase in Telco, through a cash contribution of 324 million euros, in exchange for non-voting shares in Telco. As a result of this capital increase, the interest held by Telefónica in the voting share capital of Telco remained unchanged (46.18%), although its interest in the total share capital of Telco stands at 66%.
On July 9, 2014, Telefónica filed a judicial appeal against both decisions, requesting they be overturned citing numerous procedural improprieties (the rulings were issued before Telefónica presented its allegations) and a clear lack of legal grounds. At the same time, it requested the decisions be rendered null as CADE has not provided any proof that Telefónica's actions undermine competition or infringe on applicable legislation. In this respect, the decision regarding the acquisition by Telefónica of PT Companies' indirect stake in Vivo Participações, S.A. was issued three years after the deal was approved by the Brazilian telecommunications regulator (“ANATEL”). The transaction was completed - prior approval by the CADE was not required at the time - immediately after ANATEL's approval on September 27, 2010.
Tax proceedings
Also in 2012, in Spain the tax inspections for all taxes for the years 2005 to 2007 were completed, with the Company signing consent forms for an income tax payment of 135 million euros that was paid and non-consent form for the items which the Company contests. The tax assessment for which a non-consent form was signed did not require payment of any tax because it only proposed a reduction in unused tax loss carryforwards. An appeal was filed with the Large Taxpayers Central Office of the Spanish State Tax Agency requesting this tax assessment be reversed, although no decision on the appeal has been issued as of the date of preparation of this Annual Report.
In July 2013, new inspections of various companies in the 24/90 Tax Group, of which Telefónica, S.A. is the parent were initiated. The taxes and periods subject to review are corporate income tax for the years 2008 to 2011, VAT, tax withholdings and payments on account in respect of personal income tax, tax on investment income, property tax and non-resident income tax for the second half of 2009 and the years 2010 and 2011. It is not expected that these inspections in progress will result in the need to recognize any additional liabilities in the Telefónica Group's consolidated financial statements.
Meanwhile, Telefónica Brasil has a number of appeals ongoing regarding the ICMS (a tax (VAT-like taxsimilar to VAT, levied on telecommunications services).
To date the payment ofmost significant issues have focused on the requirement to collect the ICMS on penalties charged to customers for non-compliance, Internet advertising services, that areand complementary or supplementaryadditional services to the basic telecommunication services. As of the date of this annual report, Telefónica has challenged every resolution resulting from a legal or administrative proceeding regarding this claim.telecommunications services such as value-added services and modem rental.
All related procedures are being contested in all instances (administrative and court proceedings). The aggregate amount of these proceedings includingassessments, updated to take into account interest, penaltiesfines and other items, is approximately 9,700 million reais (3,010 million euros). No provisions have been set aside for these matters, as the risk of them giving rise to liabilities is not probable. Telefónica Brasil has obtained independent expert reports supporting its position, i.e. that the aforesaid services are not subject to the ICMS.
Regarding the Group’s main tax litigation in Peru, on March 20, 2013, notification was received of a first instance court decision upholding Telefónica Peru’s arguments in three of the datefive objections filed by the authorities and appealed against in higher courts regarding corporate income tax in 2000/2001, which accounted for more than 75% of the total litigation amount (the objections related respectively to the provision for insolvency, interest on borrowing and leases of space for public telephones). The company also obtained a precautionary measure in this annual report was approximately €1,077 million.regard amounting to 1,413 million Peruvian soles (391 million euros). Court proceedings are also ongoing concerning the possible offsetting of recoverable balances in 1998 and 1999, and the interest and penalties to be applied. Both the tax authorities and the company have appealed against the decision in the court of second instance.
The years open for review by the tax court in a matter initiated by taxinspection authorities in 2005 relating to income tax payments for the 2000main applicable taxes vary from one consolidated company to another, based on each country’s tax legislation, taking into account their respective statute-of-limitations periods. In Spain, following the tax audit completed in 2012, the corporation tax from 2008 onwards and 2001 tax years. The dispute relatesall other applicable taxes from 2009 onwards are open to inspection with respect to the deductibility of certain expenses (such as financial expenses, provision for bad debts, leases and personnel expenses) and the tax neutralitymain companies of the restructuring process carried out by Telefónica del Perú, S.A.A. in January, 2000.Spanish tax group.
In the other countries in which the Telefónica del Perú, S.A.A. filedGroup has a legal action insignificant presence, the years open for inspection by the relevant court, seekingauthorities are generally as follows:
| • | The last ten years in Germany; |
| • | The last seven years in United Kingdom and Argentina; |
| • | The last five years in Brazil, Mexico, Uruguay, Colombia and the Netherlands; |
| • | The last four years in Venezuela, Peru, Guatemala and Costa Rica; and |
| • | The last three years in Chile, Ecuador, Nicaragua, El Salvador, the United States and Panama. |
The tax inspection of the open years is not expected to reversegive rise to additional material liabilities for the administrative resolution, as the Company believes that this ruling has no reasonable basis. However, pursuant to an enforcement resolution issued by the Peruvian tax authority (SUNAT) Telefónica del Perú has paid approximately € 38 million. An appeal has been filed against the said resolution in order to get the money back until a final decision on the merits is released.Group.
For more information on legal proceedings related to tax matters, see Note 17 to our Consolidated Financial Statements.
Dividend information and shareholders’ return
Dividend background
The table below sets forth the annual dividends declared per share and the year to which such dividends correspond. Generally, the dividend for a given year is paid in two tranches, one in the second-half of the relevant year and the other during the first half of the following year.
Year ended December 31, | Dividends per share | |
| (euro) | ||
2011(1) | 1.60 | |
2010 | 1.40 | |
2009 | 1.15 | |
2008 | 1.00 | |
2007 | 0.75 |
| Year ended December 31, | Dividends per share (euro) |
2014 (1) | 0.75 |
2013 (2) | 0.75 |
2012 (3) | − |
2011 (4) | 1.60 |
| 2010 | 1.40 |
| 2009 | 1.15 |
| (1) | Company’s shareholder remuneration in 2014 consists of paying a dividend of 0.75 euros per share. A scrip dividend of up to 0.35 euros was paid in November 2014, consisting of the assignment of free allotment rights with an irrevocable purchase commitment by the Company, and a subsequent capital increase by means of the issue of new shares to fulfill said allotments. The second tranche of the dividend of 0.40 euros per share will be paid in cash in the second quarter of 2015. |
| (2) | A cash dividend of |
| (3) | As of July 25, 2012, the Board of Directors cancelled the dividend and share buyback program corresponding to 2012 (including November 2012 and May 2013 cash and scrip payments, respectively). |
| (4) | A cash dividend of 0.77 euros per share was paid on November 7, 2011, charged against unrestricted reserves. A cash dividend of |
Payments of any future dividends will be dependent on our results of operations,the Group’s earnings, cash generation, solvency, liquidity, flexibility to make strategic investments, and capital resourcesshareholder and market conditionsinvestor expectations at the time, all of which may be influenced by a variety of factors. See “Cautionary Statement Regarding Forward-Looking Statements.”
Treasury shares and share buyback program
We held the following Telefónica, S.A. shares ashave performed, and may consider performing, transactions with treasury shares atand financial instruments or contracts that confer the dates indicated:right to acquire treasury shares or assets whose underlying is Company shares.
Number of shares | Acquisition price (euro per share) | Trading price(1) (euro per share) | Market value(2) (in millions of euro) | Percentage of our capital stock(3) | ||||||||||||||||
| Treasury shares at December 31, 2011 | 84,209,364 | 15.68 | 13.39 | 1,127 | 1,84508 | % | ||||||||||||||
| Treasury shares at December 31, 2010 | 55,204,942 | 17.01 | 16.97 | 937 | 1.20957 | % | ||||||||||||||
| Treasury shares at December 31, 2009 | 6,329,530 | 16.81 | 19.52 | 124 | 0.13868 | % | ||||||||||||||
| undertaking treasury share acquisitions approved by the Board of |
| honoring previous legitimate commitments assumed; |
| covering requirements for shares to allocate to employees and management under stock |
| · | ||||
| acquired), thereby improving earnings per share. |
Statements.
General
Our ordinary shares, nominal value €1.001.00 euro each, are currently listed on each of the Madrid, Barcelona, Bilbao and Valencia stock exchanges and are quoted through the Automated Quotation System under the symbol “TEF.” They are also listed on various foreign exchanges such as the London and Buenos Aires stock exchanges. Our ADSs are listed on the New York Stock Exchange and the Lima Stock Exchange.
The table below sets forth, for the periods indicated, the reported high and low quoted closing prices, as adjusted for all stock splits, for our shares on the Madrid Stock Exchange, which is the principal Spanish market for our shares, and our ADSs on the New York Stock Exchange:
Per Share (in euro) | Per ADS (in dollars)(1) | |||||||||||||||
High | Low | High | Low | |||||||||||||
Year ended December 31, 2007 | 23.260 | 15.200 | 34.37 | 20.15 | ||||||||||||
Year ended December 31, 2008 | 22.780 | 12.730 | 33.97 | 15.88 | ||||||||||||
Year ended December 31, 2009 | 19.750 | 13.690 | 29.69 | 17.24 | ||||||||||||
Year ended December 31, 2010 | 19.820 | 14.875 | 28.55 | 17.81 | ||||||||||||
Year ended December 31, 2011 | 18.655 | 12.690 | 27.08 | 16.58 | ||||||||||||
Quarter ended March 31, 2010 | 19.820 | 16.440 | 28.55 | 22.53 | ||||||||||||
Quarter ended June 30, 2010 | 18.090 | 14.875 | 24.72 | 17.81 | ||||||||||||
Quarter ended September 30, 2010 | 18.410 | 15.090 | 24.91 | 19.05 | ||||||||||||
Quarter ended December 31, 2010 | 19.595 | 16.390 | 27.56 | 21.33 | ||||||||||||
Quarter ended March 31, 2011 | 18.655 | 16.580 | 25.74 | 21.61 | ||||||||||||
Quarter ended June 30, 2011 | 18.230 | 16.020 | 27.08 | 22.63 | ||||||||||||
Quarter ended September 30, 2011 | 16.985 | 12.690 | 24.79 | 17.80 | ||||||||||||
Quarter ended December 31, 2011 | 15.830 | 12.835 | 22.54 | 16.61 | ||||||||||||
Month ended September 30, 2011 | 14.590 | 12.690 | 20.70 | 17.80 | ||||||||||||
Month ended October 31, 2011 | 15.830 | 14.070 | 22.54 | 18.38 | ||||||||||||
Month ended November 30, 2011 | 15.180 | 12.865 | 20.63 | 17.00 | ||||||||||||
Month ended December 31, 2011 | 14.115 | 12.835 | 18.85 | 16.61 | ||||||||||||
Month ended January 31, 2012 | 13.710 | 13.005 | 17.73 | 16.58 | ||||||||||||
Month ended February 29, 2012 | 13.495 | 12.810 | 17.76 | 16.95 | ||||||||||||
| Month ended March 31, 2012 (through March 28, 2012) | 13.010 | 12.300 | 17.27 | 16.31 | ||||||||||||
| Per Share | Per ADS | |||
| (in euro) | (in dollars)(1) | |||
| High | Low | High | Low | |
| Year ended December 31, 2010 | 19.820 | 14.875 | 28.55 | 17.81 |
| Year ended December 31, 2011 | 18.655 | 12.690 | 27.08 | 16.61 |
| Year ended December 31, 2012 | 13.710 | 8.630 | 17.76 | 10.25 |
| Year ended December 31, 2013 | 13.105 | 9.492 | 18.02 | 12.43 |
| Year ended December 31, 2014 | 13.370 | 10.865 | 17.40 | 13.99 |
| Quarter ended March 31, 2013 | 11.500 | 9.492 | 14.96 | 12.43 |
| Quarter ended June 30, 2013 | 11.350 | 9.613 | 14.86 | 12.60 |
| Quarter ended September 30, 2013 | 11.545 | 9.718 | 15.59 | 12.60 |
| Quarter ended December 31, 2013 | 13.105 | 11.265 | 18.02 | 15.45 |
| Quarter ended March 31, 2014 | 12.515 | 10.865 | 16.90 | 14.96 |
| Quarter ended June 30, 2014 | 12.850 | 11.480 | 17.40 | 15.79 |
| Quarter ended September 30, 2014 | 12.705 | 11.590 | 17.28 | 15.34 |
| Quarter ended December 31, 2014 | 13.370 | 10.965 | 16.39 | 13.99 |
| Month ended August 31, 2014 | 12.135 | 11.590 | 16.15 | 15.39 |
| Month ended September 30, 2014 | 12.390 | 11.910 | 16.02 | 15.34 |
| Month ended October 31, 2014 | 12.200 | 10.965 | 15.30 | 13.99 |
| Month ended November 30, 2014 | 12.880 | 11.810 | 16.00 | 14.70 |
| Month ended December 31, 2014 | 13.370 | 11.875 | 16.39 | 14.21 |
| Month ended January 31, 2015 | 13.380 | 11.355 | 15.19 | 13.45 |
| Month ended February 28, 2015 (through 25, 2015) | 13.800 | 12.950 | 15.64 | 14.61 |
(1) The closing prices prior to January 21, 2011 reflect the adjustment for the ratio change.
Until January 21, 2011, each ADS represented the right to receive three ordinary shares. As of January 21, 2011, the ADS-to-Share RatioADS-to-ordinary share ratio was changed, so that each ADS now represents the right to receive one ordinary share. The closing prices prior to January 21, 2011 reflect the adjustment for the ratio change.
On March 28, 2012,February 25, 2015, the closing price of our shares on the Automated Quotation System of the Spanish stock exchangesStock Exchanges was €12.30013.80 euro per share, equal to $16.31315.69 dollars at the Noon Buying Rate on March 23, 2012February 20, 2015 for cable transfers in euro as certified for customs purposes by the Federal Reserve Bank of New York on that date.
Our ADSs are listed on the New York Stock Exchange under the symbol “TEF.”“TEF”. Citibank, N.A. is the Depositary issuing ADSs in form of certificated ADSs (American Depositary Receipts, or ADRs) or uncertificated ADSs pursuant to the deposit agreement dated as of November 13, 1996, as amended as of December 3, 1999 and as further amended as of June 23, 2000 and as of March 9, 2007 among Telefónica, the Depositary and the holders from time to time of ADSs (the “Deposit Agreement”).
At December 31, 2011, approximately 252,954,3312014, 169,855,242 of our shares were held in the form of ADSs by 870762 holders of record, including Cede & Co., the nominee of The Depository Trust Company.Company (“DTC”). The number of ADSs outstanding
was 54,648,327184,990,503 at December 31, 2010. (163,944,981 taking into account the ADS-to-Share ratio effective January 21, 2011).2013.
Spanish Securities Market Legislation
The Spanish Securities Markets Act (Ley(Ley del Mercado de Valores,, or the LMV), enacted in 1988 and further amended, regulates the primary and secondary securities markets in Spain by establishing principles for their organization and operation, rules governing the activities of persons and institutions operating in these markets and a system for their supervision. This legislation and the regulation implementing it (mainly, as far as private issuers are concerned, the Royal Decree 1310/2005, of November 4, in relation to the issuance of securities and its admission to listing in official secondary markets, and Royal Decree 1362/2007, of October 19, concerning the transparency requirements in relation to information about issuers whose securities are admitted to trading on a regulated market):
| · | establishes an independent regulatory authority, the CNMV, to supervise the securities markets; |
| · | establishes the rules for surveillance, supervision and sanction provided for the representation of transferable securities by book entries or by certificate; |
| · | establishes a framework for the issuance of securities; |
| · | establishes a framework for trading activities; |
| · | establishes the disclosure obligations of issuers, particularly the obligation to file annual audited financial statements and to make public quarterly financial information; |
| · | establishes the framework for tender offers; |
| · | establishes the code of conduct for all market participants; and |
| · | regulates market abuse infringements. |
On March 11, 2005, Royal Decree Law 5/2005 was approved, modifying the LMV in order to implement the Directive 2003/71/EC of the European Parliament and of the Council on the prospectus to be published when securities are offered to the public or admitted to trading. The Directive: (i) harmonizes the requirements for the process of approval of the prospectuses in order to grant to the issuer a single passport for such document, valid throughout the European Union; (ii) incorporates the application of the country of origin principle by which the prospectus will be approved by the Member States of the European
Union where the issuer has its registered office but it also introduces as a new matter the possibility that in certain circumstances, such as issues with high minimum denominations (€1,000(1,000 euros or more), the issuer may designate the relevant European Union competent authority for prospectus approval.
Subsequently, Royal Decree 1310/2005 partially developed the LMV in relation to the admission to trading of securities in the official secondary markets, the sales or subscription public offers and the prospectus required to those effects.
Royal Decree 1333/2005 developed the LMV in relation to market abuse, implementing Directive 2003/6/EC of the European Parliament and of the Council, relating insider dealing and market manipulation practices (“market abuse”).
On April 12, 2007, Law 6/2007 was approved, modifying the LMV in order to implement the Directive 2004/25/EC of the European Parliament and of the Council relating to public tender offers and the Directive 2004/109/EC relating to the transparency of issuers. Law 6/2007 intends: (i) to encourage an efficient market for corporate control, while protecting the rights of minority shareholders of listed companies and (ii) to enforce transparency in financial markets.
In relation to public tender offers, Law 6/2007 (i) establishes the cases in which a company must launch a takeover bid over the whole share capital of the relevant company; (ii) establishes that takeover bids shall be launched
once a specific stake on the share capital of the company has been reached; (iii) adds new obligations for the board of directors of the target companies of the takeover bid in terms of defensive measures against the takeover bid; (iii)and (iv) regulates the squeeze-out and sell-out procedure when a 90% of the share capital is held following a takeover bid. Royal Decree 1066/2007 completes the regulation currently in place for takeover bids in Spain.
Regarding transparency of issuers whose shares are accepted to trading on an official market, Law 6/2007 (i) modifies the reporting requirements of the periodic financial information of listed companies and issuers of listed securities; (ii) establishes a new disclosure regime for significant shareholders; (iii) adds new information and disclosure requirements for issuers of listed securities; (iv) establishes a civil liability procedure of the issuer and board of directors in connection with the financial information disclosed by issuers of securities; and (v) confers new supervisory powers upon the CNMV with respect to the review of accounting information.
On December 19, 2007, Law 47/2007 was approved, modifying the LMV in order to implement the Directive 2004/39/EC of the European Parliament and of the Council, on Markets in Financial Instruments (MiFID); the Directive 2006/73/EC of the European Parliament and of the Council on organizational requirements and operating conditions regarding the Market in Financial Instruments Directive, and the Directive 2006/49/EC of the European Parliament and of the Council on the capital adequacy of investment firms and credit institutions. Its principal aim is to establish a general legal framework for financial markets in the European Union, in particular with regard to financial services, as well as to ensure appropriate transparency for investors through a regular flow of the relevant information concerning security issuers. Amongst other things, the new regime (i) establishes new multilateral trading facilities for listing shares apart from the stock markets; (ii) reinforces the measures for the protection of investors; (iii) establishes new organizational requirements for investment firms; (iv) implements new supervisory powers for CNMV, establishing cooperation mechanisms amongst national supervisory authorities.
On July 4, 2009, Law 3/2009, regarding structural modifications on Spanish Corporations (Ley(Ley 3/2009, de 3 de abril, sobre modificaciones estructurales de las sociedades mercantiles)mercantiles) came into force, modifying the maximum threshold established in the Spanish Corporation Act (Ley de Sociedades de Capital para la mejora del gobierno corporativo) as to the number of treasury shares held by listed companies and their subsidiaries from 5% up to 10% of their total capital outstanding.
On August 1, 2011, Law 25/2001, partially reforming the Spanish Corporation Act and transposing Directive 2007/36/EC of the European Parliament and of the Council of July 11 July relating to the exercise of certain rights shareholders in listed companies (Ley(Ley 25/2001, de 1 de agosto, de reforma parcial de la Ley de Sociedades de Capital y de incorporación de la Directiva 2007/36/CE, del Parlamento Europeo y del Consejo, de 11 de Julio, sobre el ejercicio de determinados derechos de los accionistas de las sociedades cotizadas.)cotizadas) was approved.
In December 2012, Royal Decree 1698/2012, amending regulations regarding prospectus and transparency requirements due on securities issues by the transposition of Directive 2010/73/EU of the European Parliament and of the Council of November 24, 2010, by amending Directive 2003/71/EC on the prospectus to be published when securities are
offered to the public or admitted to trading and Directive 2004/109/EC on the harmonization of transparency requirements in relation to information about issuers whose securities are admitted to trading on a regulated market, pursues essentially the reduction of administrative burdens related to the publication of a prospectus for the public offering of securities and admission to trading on markets within the European Union.
On March 20, 2013, ECC/461/2013 regulation was approved. This regulation establishes the content and structure of the annual report on corporate governance, the annual compensation report and other information mechanisms for public listed companies, the savings bank and other entities that issue securities admitted to trading on regulated securities markets. The aforementioned regulation was amended by Order ECC/2515/2013, of December 26, which develops article 86.2 of the LMV.
On June 12, 2013 Circular 5/2013 of the National Securities Market Commission (CNMV), was approved. This regulation establishes the templates of the annual report on corporate governance for public listed companies, savings banks and other entities that issue securities admitted to trading on regulated markets. This regulation is applicable to annual reports on corporate governance to be submitted from January 1, 2014 onwards.
On June 12, 2013, Circular 4/2013 of the CNMV was approved. This regulation establishes the templates of the annual report on director´s compensation for public listed companies and members of the board of directors and the supervisory board of savings banks that issue securities admitted to trading on regulated securities markets. This regulation is applicable to the compensation report for the year 2013 onwards and will be put to a vote by the next ordinary general shareholders’ meeting on a consultative basis and as a separate item on the agenda.
On December 3, 2014, Law 31/2014, amending the Spanish Corporation Act was enacted. The new law introduces changes in matters related to general shareholders’ meetings, and shareholders rights. It also, modifies the legal status of members of the Board of Directors, including their compensation, practices and composition, and sets forth new rules on the composition of Board Committees. Law 31/2014 entered into force on December 24, 2014, although certain specific provisions affecting listed companies will not be effective until after the first general shareholders’ meeting held by such companies in 2015, in which companies will have to amend their bylaws to bring them in line with the new provisions of Law 31/2014.
Securities Trading in Spain
The Spanish securities market for equity securities consists of four stock exchanges located in Madrid, Bilbao, Barcelona and Valencia and the Automated Quotation System, or Mercado Continuo.Continuo. During 2009, the Automated Quotation System accounted for the majority of the total trading volume of equity securities on the Spanish stock exchanges.Stock Exchanges.
Automated Quotation System
The Automated Quotation System links the four Spanish stock exchanges,Stock Exchanges, providing those securities listed on it with a uniform continuous market that eliminates certain of the differences among the local exchanges. The principal features of the system are the computerized matching of buy and sell orders at the time of entry of the order. Each order is executed as soon as a matching order is entered, but can be modified or canceled until executed. The activity of the market can be continuously monitored by investors and brokers. The Automated Quotation System is operated and regulated by Sociedad de Bolsas, S.A., a corporation owned by the companies that manage the local exchanges. All trades on the Automated Quotation System must be placed through a brokerage firm, an official stock broker or a dealer firm that is a member of a Spanish stock exchange.Stock Exchange. Beginning January 1, 2000, Spanish banks were allowed to become members of the Spanish stock exchangeStock Exchanges and, therefore, can trade through the Automated Quotation System.
In a pre-opening session held from 8:30 a.m. to 9:00 a.m. each trading day, an opening price is established for each security traded on the Automated Quotation System based on a real-time auction. The regime concerning opening prices was changed by an internal rule issued by the Sociedad de Bolsas. Pursuant to such rule, each stock in the continuous market is assigned a static and a dynamic range within which its price can fluctuate. The price of a stock may rise or fall within its static range (which is published once a month and is calculated according to the stock’s average historic price volatility) above or below its opening price (which shall be the closing price of the previous session). When the stock trades outside of this range, the trading of the stock is suspended for 5 minutes, during which an auction takes place. After this auction, the price of the stock can once again rise or fall within its static range above or below its last auction price (which will be considered as the new static price before triggering another auction). Furthermore, the price of a stock
cannot rise or fall by more than its dynamic price range (which is fixed and published once a month and is calculated according to the stock’s average intra-day volatility), from the last price at which it has traded. If the price variation exceeds the stock’s dynamic range, a five minute auction is triggered. Between 5:30 p.m. and 5:35 p.m. a closing price is established for each security through an auction system similar to the one held for the pre-opening early in the morning.
Trading hours for block trades are also from 9:00 a.m. to 5:30 p.m. Between 5:30 p.m. and 8:00 p.m., certain trades may occur outside the computerized matching system without prior authorization from Sociedad de Bolsas, S.A. at a price within the range of 5% above the higher of the average price and closing price for the day and 5% below the lower of the average price and closing price for the day if there are no outstanding bids or offers, respectively, on the system matching or bettering the terms of the proposed off-system transaction and, if, among other things, the trade involves more than €300,000300,000 euros and more than 20% of the average daily trading volume of the stock during the preceding three months. These trades must also relate to individual orders from the same person or entity and be reported to the Sociedad de Bolsas, S.A. before 8:00 p.m. At any time trades may take place (with the prior authorization of the Sociedad de Bolsas, S.A.) at any price if:
| · | the trade involves more than |
| · | the transaction derives from a merger or spin-off process, or from the reorganization of a group of companies; |
| · | the transaction is executed for the purposes of settling a litigation or completing a complex group of contracts; or |
| · | Sociedad de Bolsas, S.A. finds other justifiable cause. |
Information with respect to the computerized trades between 9:00 a.m. and 5:30 p.m. is made public immediately, and information with respect to trades outside the computerized matching system is reported to Sociedad de Bolsas, S.A. by the end of the trading day and published in the Boletín de Cotización and in the computer system by the beginning of the next trading day.
Clearance and settlement system
The Sociedad de Gestión de los Sistemas de Registro,, Compensación y Liquidación de Valores S.A.U., formerly Iberclear, was created by the Ley 44/2002 de Medidas de Reforma del Sistema Financiero,, enacted on November 22, 2002 to increase the efficiency of the Spanish financial markets. Such law introduced a new article, 44-bis to the LMV which established the framework for the constitution of Sociedad de Gestión de los Sistemas de Registro, Compensación y Liquidación de Valores S.A.U.S.A.U.
Iberclear is regulated by the Spanish Securities Act and where appropriate by Royal Decree 505/1987 of April 3, 1987, Royal Decree 166/1992 of February 14, 1992, and by any other related regulation. This company, which is a wholly owned subsidiary of Bolsas y Mercados Españoles, Sociedad Holding de Mercados y Sistemas Financieros, S.A. (Bolsas(Bolsas y Mercados Españoles)oles), has the following functions:
| · | bookkeeping of securities represented by means of book entries admitted to trading in the stock markets or in the public debt book entry market; |
| · | managing the clearance and settlement system for the brokerage transactions in the stock markets and at the public debt book entry market; and |
| · | providing technical and operational services directly linked to the registry, clearance and settlement of securities, or any other service required by Iberclear to be integrated with any other registry, clearance, and settlement systems. |
Iberclear will provide the CNMV, the Bank of Spain and the Ministry of Economy with the information that these entities may request regarding the registry clearance and settlement performed within the systems managed by Iberclear.
Transactions carried out on the Spanish stock exchangesStock Exchanges are cleared and settled through Iberclear.
Only members of the system are entitled to use Iberclear, and membership is restricted to authorized broker members of the Spanish stock exchanges,Stock Exchanges, the Bank of Spain (when an agreement, approved by the Spanish Ministry of Economy and Finance, is reached with Iberclear) and, with the approval of the CNMV, other brokers not members of the Spanish stock exchanges,Stock Exchanges, banks, savings banks and foreign settlement and clearing systems. The clearance and settlement system and its members are responsible for maintaining records of purchases and sales under the book-entry system. Shares of listed Spanish companies are held in book-entry form. Iberclear, which manages the clearance and settlement system, maintains a registry reflecting the number of shares held by each of its member entities (each, an entidad participante) as well as the amount of such shares held on behalf of beneficial owners. Each member entity, in turn, maintains a registry of the owners of such shares. Spanish law considers the legal owner of the shares to be the member entity appearing in the records of Iberclear as holding the relevant shares in its own name or the investor appearing in the records of the member entity as holding the shares.
The settlement of any transactions must be made three business days following the date on which the transaction was carried out.
Obtaining legal title to shares of a company listed on a Spanish stock exchangeStock Exchange requires the participation of a Spanish official stockbroker, broker-dealer or other entity authorized under Spanish law to record the transfer of shares. To evidence title to shares, at the owner’s request, the relevant member entity must issue a certificate of ownership. In the event the owner is a member entity, Iberclear is in charge of the issuance of the certificate with respect to the shares held in the member entity’s name.
Brokerage commissions are not regulated. Brokers’ fees, to the extent charged, will apply upon transfer of title of shares from the Depositary to a holder of ADRs in exchange for such ADSs, and upon any later sale of such shares by such holder. Transfers of ADSs do not require the participation of an official stockbroker. The Deposit Agreement provides that holders depositing shares with the Depositary in exchange for ADSs or withdrawing shares in exchange for ADSs will pay the fees of the official stockbroker or other person or entity authorized under Spanish law applicable both to such holder and to the Depositary.
Not applicable.
Please see “—Offer and Listing Details” above.
Not applicable.
Not applicable.
Not applicable.
Not applicable.
The following summary describes certain material considerations concerning our capital stock and briefly describes certain provisions of our bylaws and Spanish law.
Corporate Objectives
Article 45 of Title I of our bylaws sets forth our corporate purposes:
| · | The provision and operation of all kinds of public or private telecommunications services and, for such purpose, the design, installation, maintenance, repair, improvement, acquisition, disposition, interconnection, management, administration of, and any other activity not included in the preceding enumeration with respect to, all kinds of telecommunications networks, lines, satellites, equipment, systems and technical infrastructure whether now existing or to be created in the future, including the premises in which any and all of the foregoing items are located; |
| · | the provision and operation of all kinds of services that are ancillary or supplemental to or result from telecommunications services; |
| · | the research and development, promotion and application of all kinds of component principles, equipment and systems directly or indirectly used for telecommunications; |
| · | manufacturing and production activities and, in general, all other forms of industrial activity in connection with telecommunications; and |
| · | acquisition, disposition and, in general, all other forms of commercial activity in connection with telecommunications. |
Director Qualification
In order to be elected as a director, a person must have held a number of our shares representing a nominal value of no less than €3,0003,000 euros for at least three years prior to his or her election. These shares may not be transferred so long as such person remains a director. This requirement does not apply to any person who, at the time of his or her appointment, has either a labor or professional relationship with the company or is expressly exempted from such requirement by a vote of at least 85% of the Board of Directors.
Interested Transactions
When a director or persons related to him or her has an interest in a transaction with us or with any of the companies of our Group, such transaction (if unrelated to the ordinary course of our business or if not performed on an arm’s length basis involving consideration that is significant to the Company and otherwise) must be presented to the Nominating, Compensation and Corporate Governance Committee. Such committee shall assess the transaction from the point of view of equal treatment of shareholders and the arm’s length basis of the transaction and shall be included in the Annual Corporate Governance Report and in the periodic information of the Company upon the terms set forth in applicable laws and regulations. The performance of such transactions requires the authorization of our Board of Directors, after the favorable report of the committee. The interested director must refrain from participating in votes that affect such transaction.
Significant Differences in Corporate Governance Practices
Corporate governance guidelines
Description of Our Capital Stock
Description of share capital
At March 29, 2012,February 27, 2015, our issued share capital consisted of 4,563,996,4854,657,204,330 ordinary registered shares with a nominal value of €1.001.00 euro each.
Our shareholders have delegated to the Board of Directors the authority to issue up to 2,281,998,242 new shares.shares (equal to half of Telefónica’s share capital on May 18, 2011, the date of the authorization). The Board of Directors is authorized to exclude preemptive rights, in whole or in part, pursuant to the applicable provisions of the Spanish Corporation Law.Act. The Board’s authorization to issue new shares expires on May 18, 2016.
Meetings and voting rights
We hold our ordinary general shareholders’ meeting during the first six months of each fiscal year on a date fixed by the Board of Directors. Extraordinary general shareholders’ meetings may be called, from time to time, at the discretion of our Board of Directors or upon the request of shareholders representing 5%3% of our paid-in share capital. The minimum percentage required to exercise this right was recently lowered from 5% to 3% by Law 31/2014.
We publish notices of all ordinary and extraordinary general shareholders’ meetings in the Official Gazette of the Commercial Registry or in one of the more widely circulated newspapers, on the website of the Spanish Securities and Exchange Commission (Comisión Nacional del Mercado de Valores (the “CNMV”)), and on our web site in due time pursuant to the Spanish Corporation Act, being on a general basis at least one month before the relevant meeting. Furthermore, the Board of Directors may publish notices in other media, if deemed appropriate in order to give broader publicity toensure the public and effective dissemination of the notice meeting.
Each share of Telefónica, S.A. entitles the holder to one vote. However, only registered holders of shares representing a nominal value of at least €300300 euros (which currently equals at least 300 shares) are entitled to attend a general shareholders’ meeting. Holders of shares representing a nominal value of less than €300300 euros (less than 300 shares), may aggregate their shares by proxy and selectjointly appoint a representative that isproxy-holder (which needs not be a shareholdershareholder) to attend a general shareholders’ meeting or delegate his or her voting rights by proxy to a shareholder who has the right to attend the shareholders’ meeting.
However, under our bylaws, the maximum number of votes that a shareholder may cast is capped at 10% of our total outstanding voting capital. In determining the maximum number of votes that each shareholder may cast, only the shares held by such shareholder are counted, disregarding those that correspond to other shareholders who have appointed such shareholder as his or her proxy, in spite of applying the limit individually to each of the represented shareholders. This cap will also apply to the maximum number of votes that may be collectively or individually cast by two or more shareholder companies belonging to the same group of entities, as well as to the maximum number of votes that may be cast by an individual or corporate shareholder and the entity or entities that are shareholders themselves and which are directly or indirectly controlled by that individual or corporate shareholder. Moreover, in accordance with the Spanish Corporation Act, such cap would become ineffective where the bidder reaches, as a consequence of a tender offer, a percentage equal to or greater than 70% of the share capital carrying voting rights, unless the bidder (or those acting in concert with the bidder) is not subject to equivalent neutralization measures or has not adopted them.
In addition, according to Article 34 of Spanish Royal Decree-Law 6/2000 of June 23 on urgent measures to improve competition in the goods and services markets, individuals and legal entities directly and indirectly holding more than 3% of the total share capital or voting rights of two or more principal operator companies in Spain in, among other markets, the fixed-line and mobile-line telephony markets, may not exercise their voting rights in excess of 3% of the total in more than one company, except with the prior authorization of the Spanish National Markets and Competition Commission (Comisión Nacional de los Mercados o la Competencia (the “CNMC”)). Principal operators are defined as one of the five operators with the largest market share in the corresponding market (“Principal Operators”). In addition, no individual or
legal entity is allowed to appoint, directly or indirectly, members of the management body of more than one Principal Operator in, among others, the fixed-line or mobile-line telephony markets, except with the prior authorization of the CNMC. Additionally, individuals or legal entities considered Principal Operators are not allowed to exercise more than 3% of the voting rights of another Principal Operator nor to appoint, directly or indirectly, members of the management body of any Principal Operator, except, in both cases, with the prior authorization of the CNMC. Telefónica is considered a Principal Operator for the purposes of Article 34 of Royal Decree-Law 6/2000 of June 23 in the Spanish fixed-line and mobile-line telephony markets.
Any share may be voted by proxy. Proxies mustThe proxies may be granted in writing or electronically and are valid only for a single meeting.meeting, unless the proxy-holder is the granting shareholder’s spouse, ascendant or descendant, or holds a general power of attorney granted in a public instrument with powers to manage all of the assets held by the shareholder granting the proxy in Spain. Under the Deposit Agreement relating to our ADSs, the Depositary accepts voting instructions from holders of ADSs. The Depositary executes such instructions to the extent permitted by law and by the terms governing the shares and ADSs. The Depositary or its nominee, as the case may be, will be entitled to vote by proxy the shares underlying the relevant ADSs.
Only holders of record five days prior to the day on which a general meeting of shareholders is scheduled to be held may attend and vote at the meeting. Under the deposit agreement for our ADSs, our depositary accepts voting instructions from holders of ADSs. The depositary executes such instructions
According to the extent permittedSpanish Corporation Act, as amended by law and byLaw 31/2014, the terms governing the shares. The depositary or its nominee, whichever is applicable,general shareholders’ meeting will be entitled to vote by proxyquorate on first call if the shares represented by the ADSs.
However, if the agenda of the meeting includes resolutions on the amendment of the bylaws, including an increase or reduction of share capital, the transformation, merger, split-off, the en bloc assignment of assets and liabilities, the migration of the registered office abroad, the issuance of debentures or the exclusion or limitation of pre-emptive rights, the required quorum on first call must be met by the attendance of shareholders representing at least 50% of the subscribed share capital carrying voting rights (each a quorum for“Special Resolution”). On second call, the attendance of 25% of the subscribed share capital carrying voting rights will suffice.
As a general meeting of shareholders. If a quorum is not presentrule, resolutions at the firstgeneral shareholder’s meeting will be passed by a simple majority of votes cast at such meeting (i.e., provided that the votes for outnumber the votes against the relevant resolution).
In contrast, in order to approve any Special Resolution, if the capital present or represented at the general shareholders’ meeting exceeds 50% of the subscribed share capital carrying voting rights, the favorable vote of the absolute majority (that is, if the votes in favor exceed 50% of the votes corresponding to capital present and represented at the shareholders’ meeting) will be required. If, on second call, thenshareholders representing 25% or more of the subscribed share capital carrying voting rights are present or represented but fail to reach the 50% threshold, the favorable vote of at least two-thirds of the share capital present or represented at the meeting canwill be heldrequired.
Preemptive Rights
Pursuant to the Spanish Corporation Act, shareholders have preemptive rights to subscribe for any new shares in capital increases with issuances of new shares with a charge to monetary contributions and in issuances of debentures convertible into shares. Such rights may be excluded (partially or totally) under special circumstances by virtue of a resolution passed at a general shareholders’ meeting in accordance with Articles 308, 504 and 506 of the Spanish Corporation Act, or by the Board of Directors, if previously authorized at a general shareholders’ meeting in accordance with Article 506 of the Spanish Corporation Act (for capital increases) and Articles 417 and 511 (for issuances of debentures convertible into shares). Such preemptive rights will not be available in the event of an increase in capital to meet the requirements of a convertible bond issue or a merger or demerger of another entity into Telefónica or of all or part of the assets split from another company, in which shares are issued as consideration or, in general, when the increase is carried out as consideration in exchange for non-cash contributions. Such rights are transferable, may be traded on the Automated Quotation System and may be of value to existing shareholders because new shares may be offered for subscription at prices lower than prevailing market prices.
Form and Transfer
Ordinary shares are in book-entry form and are indivisible. Joint holders must nominate one person to exercise their rights as shareholders, though joint holders are jointly and severally liable for all obligations arising from their status as shareholders. Sociedad de Gestión de los Sistemas de Registro, Compensación y Liquidación de Valores, S.A. Unipersonal (“Iberclear”), which manages the clearance and settlement system of the Spanish Stock Exchanges, maintains the central registry of ordinary shares reflecting the number of shareholders present atordinary shares held by each of its participant entities (entidades participantes) as well as the meeting on second call, they are deemed to constitutenumber of such shares held by registered legal owners. Each participant entity in turn maintains a quorum.register of the owners of such shares.
Reporting Requirements
According to Royal Decree 1362/2007 of October 19 on the disclosure of significant stakes in listed companies (“Royal Decree 1362/2007”), the acquisition or disposition of shares of Telefónica must be reported within four trading days of the acquisition or disposition to Telefónica and the CNMV, where:
| · |
| · |
The reporting requirements apply not only to the acquisition or transfer of shares, but also when, without an acquisition or transfer of shares, the proportion of voting rights of an individual or legal entity reaches, exceeds or falls below the threshold that triggers the obligation to report as a consequence of a change in the total number of voting rights of Telefónica on the basis of the information reported to the CNMV and disclosed by it, in accordance with Royal Decree 1362/2007.
Regardless of the actual ownership of the shares, any individual or legal entity with a right to acquire, transfer or exercise voting rights granted by the shares, and any individual or legal entity who owns, acquires or transfers, whether directly or indirectly, other securities or financial instruments which grant a right to acquire shares carrying voting rights (such as transferable securities, options, futures, swaps, forwards and other derivative contracts), will also have an obligation to notify the company and the CNMV of the holding of a significant stake in accordance with the above-mentioned regulations.
Stricter disclosure obligations apply if the person obligated to disclose has residency in a country considered a tax haven by the Spanish authorities, a zero-taxation country or territory or a country or territory that does not share information with the Spanish authorities, in which cases the initial threshold for disclosure is reduced to 1% (and successive multiples of 1%).
Our directors must report to us and the CNMV the percentage and number of voting rights in Telefónica held by them at the time of becoming or ceasing to be a member of the Board of Directors. Furthermore, all members of the Board must report any change in the percentage of voting rights they hold, regardless of the amount, as a result of any acquisition or disposition of our shares or voting rights, or financial instruments which carry a right to acquire or dispose of shares which have voting rights attached, including any stock-based compensation that they may receive pursuant to any of our compensation plans. Members of our senior management must also report any stock-based compensation that they may receive pursuant to any of our compensation plans or any subsequent amendment to such plans. Royal Decree 1362/2007 refers to the definition given by Royal Decree 1333/2005 of November 11, which develops the Spanish Securities Market Act, regarding market abuse, which defines senior management (directivos) as those “high-level employees in positions of responsibility with regular access to insider information (información privilegiada) related,
directly or indirectly, to the issuer and that, furthermore, are empowered to adopt management decisions affecting the future development and business perspectives of the issuer”.
In addition, pursuant to Royal Decree 1333/2005 of November 11 (implementing European Directive 2004/72/EC), any member of our Board and our senior management, or any parties closely related to any of them, as such terms are defined therein, must report to the CNMV any transactions carried out with respect to our shares or derivatives or other financial instruments relating to our shares within five business days of such transaction. The notification of the transaction must include particulars of, among others, the type of transaction, the date of the transaction and the market in which the transactions were carried out, the number of shares traded and the price paid.
These disclosure obligations are primarily regulated by Royal Decree 1362/2007, which contains a more detailed set of rules on this legal framework (including, inter alia, rules determining the persons subject to disclosure obligations, the different types of situations triggering disclosure and corresponding exceptions, specific attribution and aggregation rules, the deadlines to notify the transactions, triggering disclosure obligations and incorporation of notices submitted to the CNMV’s public registry).
Disclosure of Net Short Positions
In accordance with Regulation (EU) No. 236/2012 of the European Parliament and of the European Council of March 14, 2012 on short selling and certain aspects of credit default swaps (as further supplemented by several delegated regulations regulating technical aspects necessary for its effective enforceability and to ensure compliance with its provisions), net short positions on shares listed on the Spanish Stock Exchanges equal to, or in excess of, 0.2% of the relevant issuer’s share capital and any increases or reductions thereof by 0.1% are required to be disclosed to the CNMV by no later than the first trading day following the transaction. If the net short position reaches 0.5%, and also at every 0.1% above that, the CNMV will disclose the net short position to the public.
Notification is mandatory even if the same position has been already notified to the CNMV in compliance with reporting requirements previously in force in Spain.
The information to be disclosed is set out in Table 1 of Annex I of Delegated Regulation 826/2012, according to the format approved as Annex II of this Regulation. The information will be published, where appropriate, on a web page operated or supervised by the corresponding authority.
Moreover, pursuant to Regulation (EU) No. 236/2012, where the CNMV considers that (i) there are adverse events or developments that constitute a serious threat to financial stability or to market confidence (serious financial, monetary or budgetary problems, which may lead to financial instability, unusual volatility causing significant downward spirals in any financial instrument, etc.); and (ii) the measure is necessary and will not be disproportionately detrimental to the efficiency of financial markets in view of the advantages sought, it may, following consultation with the European Securities and Market Authority (“ESMA”), take any one or more of the following measures:
| · | impose additional notification obligations by either (a) reducing the thresholds for the notification of net short positions in relation to one or several specific financial instruments; and/or (b) requesting the parties involved in the lending of a specific financial instrument to notify any change in the fees requested for such lending; and |
| · |
In addition, according to Regulation (EU) No. 236/2012, where the price of a financial instrument has fallen significantly during a single day in relation to the closing price on the previous trading day (10% or more in the case of a liquid share), the CNMV may prohibit or restrict short selling of financial instruments for a period not exceeding the end of the trading day following the trading day on which the fall in price occurs.
Finally, Regulation (EU) No. 236/2012 also vests powers to ESMA in order to take measures similar to the ones described above in exceptional circumstances, when the purpose of these measures is to deal with a threat affecting several EU member states and the competent authorities of these member states have not taken adequate measures to address it.
Shareholder Agreements
Article 531 et seq. of the Spanish Corporation Act require parties to disclose those shareholders’ agreements in respect of Spanish listed companies that affect the exercise of voting rights at a general shareholders’ meeting or contain restrictions or conditions on the transferability of shares or bonds that are convertible or exchangeable into shares. If any shareholders enter into such agreements with respect to Telefónica’s shares, they must disclose the execution, amendment or extension of such agreements to Telefónica and the CNMV (together with the relevant clauses of said agreements) and file such agreements with the appropriate Commercial Registry. Failure to comply with these disclosure obligations renders any such shareholders’ agreement unenforceable and constitutes a violation of the Spanish Securities Market Act.
Acquisition of Own Shares
Pursuant to Spanish corporate law, we may only repurchase our own shares within certain limits and in compliance with the following requirements:
| · | the repurchase must be authorized by the general shareholders’ meeting by a resolution establishing the maximum number of |
| · |
For these purposes, net worth means the amount resulting from the application of the criteria used to draw up the financial statements, subtracting the amount of profits directly imputed to that net worth, and adding the amount of share capital subscribed but not called and the share capital par and issue premiums recorded in our accounts as liabilities. In addition:
| · | the aggregate par value of the shares directly or indirectly repurchased, together with the aggregate par value of the shares already held by us and our subsidiaries, must not exceed 10% of our share capital; and |
| · | the shares repurchased must be fully paid and must be free of |
Regulation (EU) No. 596/2014 of April 16, repealing, among others, Directive 2003/6/EC of the European Parliament and the European Council of January 28, on insider dealing and market manipulation establishes rules in order to ensure the integrity of European Community financial markets and to enhance investor confidence in those markets. This regulation maintains an exemption from the market manipulation rules regarding share buy-back programs by companies listed on a quorum is present onstock exchange in an EU Member State. Commission Regulation (EC) No. 2273/2003, of December 22, implemented the first call, these special resolutionsaforementioned directive with regard to exemptions for buy-back programs. Article 5 of this Regulation states that in order to benefit from the exemption, a buy-back program must comply with certain requirements established under such Regulation and the sole purpose of the buy-back program must be adoptedto reduce the share capital of an issuer (in value or in number of shares) or to meet obligations arising from either of the following:
| · | debt financial instruments exchangeable into equity instruments; or |
| · | employee share option programs or other allocations of shares to employees of the issuer or an associated company. |
In addition, on December 19, 2007, the CNMV issued Circular 3/2007 setting out the requirements to be met by liquidity contracts entered into by issuers with financial institutions for the affirmative votemanagement of shareholders representingits treasury shares to constitute an accepted market practice and, therefore, be able to rely on a majoritysafe harbor for the purposes of our present subscribed voting capital.market abuse regulations.
If an acquisition or series of acquisitions of shares of Telefónica reaches or exceeds or causes Telefónica’s and its affiliates’ holdings to reach or exceed 1% of Telefónica’s voting shares, Telefónica must notify its final holding of treasury stock to the CNMV. If such threshold is reached as a quorumresult of a series of acquisitions, such reporting obligation will only arise after the closing of the acquisition which, taken together with all acquisitions made since the last of any such notifications, causes the Telefónica’s and its affiliates holdings to exceed, 1% of Telefónica’s voting shares. Sales and other dispositions of Telefónica’s treasury stock will not be deducted in the calculation of such threshold. This requirement also applies if the stock is acquired by a majority-owned subsidiary of Telefónica.
Moreover, pursuant to Spanish corporate law, the audited financial statements of a company must include a reference regarding any treasury shares.
At December 31, 2014, we held 128,227,971 shares of treasury stock, representing 2.75332% of our capital stock. At December 31, 2013, we held 29,411,832 shares of treasury stock, representing 0.64627% of our capital stock. As a part of our shareholders’ remuneration policy, we have implemented various share buyback programs since 2003. For further description about our shareholders’ return, see “Item 8. Financial Information—Dividend Information and Share Buyback Programs.”
At our annual general shareholders meeting held on May 30, 2014, our shareholders extended their prior authorization to the Board of Directors to acquire our shares for an additional five years from the date of such meeting. The authorization also applies to companies under our control. Pursuant to the authorization, the aggregate nominal value of our shares held by us or any of our subsidiaries cannot exceed the limit established by applicable laws (which is, as of the date of this Annual Report, 10% of our outstanding capital).
Change of Control Provisions
Certain antitrust regulations may delay, defer or prevent a change of control of Telefónica or any of its subsidiaries in the event of a merger, acquisition or corporate restructuring. In Spain, the application of both Spanish and European antitrust regulations requires that prior notice of domestic or cross-border merger transactions be given in order to obtain a “non-opposition” ruling from antitrust authorities.
Tender Offers
Tender offers are governed in Spain by the Spanish Securities Markets Act (as amended by Law 6/2007 of April 12) and Royal Decree 1066/2007, of July 27, which have implemented Directive 2004/25/EC of the European Parliament and of the European Council of April 21. Tender offers in Spain may qualify as either mandatory or voluntary offers.
Mandatory public tender offers must be launched for all the shares of the target company or other securities that might directly or indirectly give the right to subscription thereto or acquisition thereof (including convertible and exchangeable bonds) at an equitable price and not subject to any conditions when any person acquires control of a Spanish company listed on the Spanish Stock Exchanges, whether such control is obtained:
| · | by means of the acquisition of shares or other securities that directly or indirectly give voting rights in such company; |
| · | through agreements with shareholders or other holders of said securities; or |
| · | as a result of other situations of equivalent effect as provided in the regulations (i.e., indirect control acquired through mergers, share capital decreases, target’s treasury stock variations or securities exchange or conversion, etc.). |
A person is deemed to have obtained the control of a target company, individually or jointly with concerted parties, whenever:
| · | it acquires, directly or indirectly, a percentage of voting rights equal to or greater than 30%; or |
| · | it has acquired a percentage of less than 30% of the voting rights and appoints, in the 24 months following the date of acquisition of said percentage, a number of directors that, together with those already appointed, if any, represent more than one-half of the members of the target company’s board of directors. Regulations also set forth certain situations where directors are deemed to have been appointed by the bidder or persons acting in concert therewith unless evidence to the contrary is provided. |
Notwithstanding the above, Spanish regulations establish certain exceptional situations where control is obtained but no mandatory tender offer is required, including, among others:
| · | subject to the CNMV’s approval, |
| − | acquisitions or other transactions resulting from the conversion or capitalization of credits into shares of listed companies, the financial feasibility of which is subject to serious and imminent danger, even if the company is not undergoing bankruptcy proceedings, provided that such transactions are intended to ensure the company’s financial recovery in the long term; or |
| − | in the event of a merger, provided that those acquiring control did not vote in favor of the merger at the relevant general shareholders’ meeting of the offeree company and provided also that it can be shown that the primary purpose of the transaction is not the takeover but an industrial or corporate purpose; and |
| · | when control has been obtained after a voluntary bid for all of the securities, if either the bid has been made at an equitable price or has been accepted by holders of securities representing at least 50% of the voting rights to which the bid was directed. |
For the purposes of calculating the percentages of voting rights acquired, the regulations establish the following rules:
| · | percentages of voting rights corresponding to (i) companies belonging to the same group of the bidder; (ii) members of the board of directors of the bidder or of companies of its group; (iii) persons acting for the account of or in concert with the bidder (a concert party shall be deemed to exist when two or more persons collaborate under an agreement, be it express or implied, oral or written, in order to obtain control of the offeree company); (iv) voting rights exercised freely and over an extended period by the bidder under proxy granted by the actual holders or owners of such rights in the absence of specific instructions with respect thereto; and (v) shares held by a nominee, such nominee being understood as a third party whom the bidder totally or partially covers against the risks inherent in acquisitions or transfers of the shares or the possession thereof, will be deemed to be held by the bidder (including the voting rights attaching to shares that constitute the underlying asset or the subject matter of financial contracts or swaps when such contracts or swaps cover, in whole or in part, against the risks inherent in ownership of the securities and have, as a result, an effect similar to that of holding shares through a nominee); |
| · | both the voting rights arising from the ownership of shares and those enjoyed under a usufruct or pledge or upon any other title of a contractual nature will be counted towards establishing the number of voting rights held; |
| · | the percentage of voting rights shall be calculated based on the entire number of shares carrying voting rights, even if the exercise of such rights has been suspended; voting rights attached to treasury shares shall be excluded; and non-voting shares shall be taken into consideration only when they carry voting rights pursuant to applicable law; and |
| · | acquisitions of securities or other financial instruments giving the right to the subscription, conversion, exchange or acquisition of shares which carry voting rights will not result in the obligation to launch a tender offer either until such subscription, conversion, exchange or acquisition occurs. |
Notwithstanding the foregoing, upon the terms established in the regulations, the CNMV will conditionally dispense with the obligation to launch a mandatory bid when another person or entity, individually or jointly in concert, directly or indirectly holds an equal or greater voting percentage than the potential bidder in the target company.
The price of the mandatory tender offer is deemed equitable when it is at least equal to the highest price paid or agreed by the bidder or by any person acting in concert therewith for the meetingsame securities during the 12 months prior to the announcement of the tender offer. When the mandatory tender offer must be made without the bidder having previously acquired the shares over the above-mentioned 12-month period, the equitable price shall not be less than the price calculated in accordance with other rules set forth in the regulations. In any case, the CNMV may change the price so calculated in certain circumstances (extraordinary events affecting the price, evidence of market manipulation, etc.).
Mandatory offers must be launched within one month from the acquisition of the control of the target company.
Voluntary tender offers may be launched when a mandatory offer is not present afterrequired. Voluntary offers are subject to the first call, upon a second callsame rules established for mandatory offers except for the meeting, 25%following:
| · | they might be subject to certain conditions (such as amendments to the bylaws or adoption of certain resolutions by the target company, acceptance of the offer by a minimum number of securities, approval of the offer by the shareholders’ meeting of the bidder and any other deemed by the CNMV to be in accordance with law), provided that such conditions can be met before the end of the acceptance period of the offer; and |
| · | they may be launched at any price, regardless of whether it is lower than the above-mentioned “equitable price”. However, if they are not launched at an equitable price and if the tender offer shares representing at least 50% of the voting rights are tendered in the offer (excluding voting rights already held by the bidder and those belonging to shareholders who entered into an agreement with the bidder regarding the tender offer), the bidder may become obliged to launch a mandatory tender offer. |
In any case, by virtue of our subscribed voting capital will constitutean amendment to the Spanish Securities Market Act operated by Law 1/2012, of June 22, the price in a quorum. When shareholders representing less than 50%voluntary tender offer must be the higher of (i) the equitable price and (ii) the price resulting from an independent valuation report, and must at least consist of cash as an alternative if certain circumstances have occurred during the two years prior to the announcement of the subscribed voting capital areoffer (basically, the trading price for the shares being affected by price manipulation practices, market or share prices being affected by natural disasters, force majeure, or other exceptional events, or the target company being subject to expropriation or confiscation resulting in attendance, these special resolutions musta significant impairment of the company’s real value).
Spanish regulations on tender offers set forth further provisions, including:
| · | subject to shareholder approval within 18 months from the date of announcement of the tender offer, the board of directors of a target company will be exempt from the rule prohibiting frustrating action against a foreign bidder whose board of directors is not subject to an equivalent passivity rule; |
| · | defensive measures included in a listed company’s bylaws and transfer and voting restrictions included in agreements among a listed company’s shareholders will remain in place whenever the company is the target of a tender offer, unless the shareholders resolve otherwise (in which case any shareholders whose rights are diluted or otherwise adversely affected will be entitled to compensation at the target company’s expense); and |
| · | squeeze-out and sell-out rights will apply provided that following a tender offer for all the target’s share capital, the bidder holds securities representing at least 90% of the target company’s voting capital and the tender offer has been accepted by the holders of securities representing at least 90% of the voting rights other than those held by or attributable to the bidder previously to the offer. |
Payment of Taxes
Holders of ordinary shares will be adopted by a vote of two-thirds of those shareholders present.responsible for any taxes or other governmental charges payable on their ordinary shares, including any taxes payable on transfer. The paying agent or the transfer agent, as the case may be, may, and upon instruction from Telefónica, will:
| · | refuse to effect any registration of transfer of such ordinary shares or any split-up or combination thereof until such payment is made; or |
| · | withhold or deduct from any distributions on such ordinary shares or sell for the account of the holder thereof any part or all of such ordinary shares (after attempting by reasonable means to notify such holder prior to such sale), and apply, after deduction for its reasonable expenses incurred in connection therewith, the net proceeds of any such sale to payment of such tax or other governmental charge. The holder of such ordinary shares will remain liable for any deficiency. |
Dividends
Shareholders vote on final dividend distributions at the shareholders’ meeting. Distributable profits are equal to:
net profits for the year; plus
profits carried forward from previous years; plus
distributable reserves; minus
losses carried forward from previous years; minus
amounts allocated to reserves as required by law or by our bylaws.
The amount of distributable profits is based on our unconsolidated financial statements prepared in accordance with Spanish GAAP, which differ from the Consolidated Financial Statements prepared in accordance with IFRS included elsewhere in this Annual Report.
The Board of Directors can approve interim dividend payments without a prior shareholder vote on the issue. However, under those circumstances, the dividend is limited to distributable net profits of the current year and is subject to certain legal requirements.
Unclaimed dividends revert to us five years from their date of payment.
Registration and transfers
Our shares are in registered book-entry form. Transfers executed through stock exchange systems are implemented pursuant to the stock exchange clearing and settlement procedures carried out by the Spanish clearing institution. Transfers executed outside of stock exchange systems, that is, over the counter, are implemented pursuant to the general legal regime for book-entry transfer, including registration by the Spanish clearing institution.
There are no restrictions with respect to the transfer of our shares.
Liquidation rights
Under Spanish law, upon our liquidation, the shareholders would be entitled to receive, on a pro rata basis, any assets remaining after the payment of our debts and taxes and liquidation expenses.
Material Contracts Related to Our Investment in Telecom Italia
On April 28, 2007, we, together with a group of Italian investors (the “Italian Investors”), including Assicurazioni Generali S.p.A. (“Generali”), Sintonia S.A. (“Sintonia”), Intesa Sanpaolo S.p.A. (“Intesa Sanpaolo”) and Mediobanca S.p.A. (“Mediobanca”), entered into a co-investment agreement, (the “Co-Investment Agreement”), to establish the terms and conditions for our participation in what is now Telco.Telco, S.p.A (“Telco”). Through Telco, on October 23, 2007, we and the Italian Investors purchased the entire share capital of Olimpia S.p.A., or Olimpia, which held approximately 18% of the ordinary share capital of Telecom Italia.Italia, S.p.A. (“Telecom Italia”). As of the date of this Annual Report, the Italian Investors hold a total of 53.8%34% of Telco’s share capital and we hold the remaining 46.2%66%.
In addition to Telco’s participation in Telecom Italia’s ordinary share capital through its interest in Olimpia, pursuant to the Co-Investment Agreement, on October 25, 2007, Generali and Mediobanca contributed to Telco ordinary shares of Telecom Italia they held onat that date. These shares in the aggregate amounted to 5.6% of Telecom Italia’s ordinary share capital and brought Telco’s direct and indirect participation in Telecom Italia’s ordinary share capital to approximately 23.6%.
On April 28, 2007, we and the Italian Investors also entered into a shareholders’ agreement, (the “Shareholders’ Agreement”), which establishes, among other things, the principles of corporate governance of Telco and Olimpia, respectively, the principles related to the transfer of Telco’s shares and any Olimpia shares or Telecom Italia shares directly or indirectly owned by Telco and the principles of designation, among the parties, of candidates to be included in a common list for the appointment of directors of Telecom Italia pursuant to the voting list mechanism provided for by Telecom Italia’s by-laws.
On November 19, 2007, the parties to the Shareholders’ Agreement amended the Shareholders’ Agreement as well as the bylaws of Telco to include the specific limitations imposed by ANATEL as initially posted on its website on October 23, 2007, and subsequently published on November 5, 2007, as ANATEL’s “Ato” No. 68,276 dated October 31, 2007. We refer to such agreement as the Amendment to the Shareholders’ Agreement.
Pursuant to the Shareholders’ Agreement, we entered into an option agreement (the “Option Agreement”), with Telco on November 6, 2007, which provides that, in the event that a decision to dispose, directly or indirectly, in any form or manner (including through measures with equivalent effect, such as mergers and demergers of Telco or Olimpia) or encumber Telecom Italia shares or Olimpia shares or any rights attached thereto, including but not limited to voting rights, is taken by the board of directors of Telco by a simple majority resolution according to the procedure specifically provided for by the Shareholders’ Agreement and we are a dissenting party, then we will have the right, to be exercised within 30 days of such decision being taken, to buy from Telco the Telecom Italia shares or the Olimpia shares, as the case may be, at the same price and conditions offered by the third party offering to acquire such shares of Telecom Italia shares or Olimpia shares.Olimpia.
On December 10, 2007, an agreement was reached to merge Olimpia into Telco, as a result of which Telco’s entire stake in the voting shares of Telecom Italia (23.6%) became a direct stake. In March 2008, Telco acquired 121.5 million additional shares of Telecom Italia, equivalent to 0.9% of its share capital, bringing its total direct interest to 24.5% of Telecom ItaliaItalia’s voting shares.
On October 28, 2009, Sintonia requested, pursuant to the Shareholders Agreement, the non-proportional de-merger of Telco, with the withdrawal of its pro rata share of the assets and liabilities of Telco (comprised of Telecom Italia shares held by Telco representing approximately 2.1% of Telecom Italia’s share capital). The terms of Sintonia’s exit were approved on November 26, 2009, and the transaction closed on December 22, 2009. Upon Sintonia’s exit, Telco’s interest in Telecom Italia was reduced to 22.45% of Telecom Italia’s share capital. At the
same time, our stake in Telco increased from 42.3% to 46.2%, thereby allowing us to maintain our indirect interest in Telecom Italia at 10.5% of Telecom Italia’s voting rights (7.2% of the dividend rights).
On October 28, 2009, Telco investors, other than Sintonia, entered into an agreement (the “Renewal Agreement”), through which they agreed (i) not to request the non-proportional de-merger of Telco with the withdrawal of their corresponding share of Telecom Italia shares held by Telco at that time (as was previously done by Sintonia) and (ii) to extend and modify the Shareholders Agreement for an additional term of three years until April 27, 2013 (effective as of April 28, 2010) substantially on the same terms and conditions, except to provide (a) that the right of Telco’s investors to request the non-proportional de-merger of Telco willwould only be exercisable in the period between October 1, 2012 and
October 28, 2012, and (b) for an early withdrawal right period exercisable between April 1, 2011 and April 28, 2011. On the same date and in connection with the Renewal Agreement, separately, we entered into an Amendment Deed to the Call Option Agreement with Telco (i) to extend the term of the Option Agreement to coincide with the expiration date of the Renewal Agreement and (ii) to exempt certain transactions regarding the Telecom Italia shares, namely those related to the exercise of de-merger and early withdrawal rights pursuant to the Renewal Agreement.
In line with the commitments assumed by Telco shareholders, on December 22, 2009, the rest of Telco’s financing needs with respect to debt maturities were met with a bridge loan granted by shareholders, including ourselves, Intesa Sanpaolo and Mediobanca for approximately €902902 million euros, and a bank bridge loan granted by Intesa Sanpaolo and Mediobanca for the remaining €398 million.398 million euros.
On January 11, 2010, Telco arranged a €1,3001,300 million euros loan with Intesa Sanpaolo, Mediobanca, Société Générale, S.p.A. and Unicredito, S.p.A., maturing on May 31, 2012, part of which is secured with the Telecom Italia shares held by Telco. The lending banks have granted Telco shareholders, including ourselves, a call option on the Telecom Italia shares that they may be entitled to receive as a result of the potential execution of the pledge.
The financing from the bridge loans described above was cancelled with the proceeds of a bond issuance subscribed by Telco’s shareholders, on a pro rata basis in accordance with their interests in Telco, on February 19, 2010, for an aggregate principal amount of €1,300 million.1,300 million euros. Our subscription amounted to an aggregate principal amount of €600 million.600 million euros.
On October 6, 2010, Telefónica, Intesa Sanpaolo, Mediobanca, and Generali (collectively, the “Existing Shareholders”), Telco, certain companies controlled by Telefónica, Telecom Italia and certain companies controlled by Telecom Italia entered into a “compromiso” (the “Compromiso”“Compromiso”) in order to terminate certain administrative and judicial proceedings in Argentina related to the Telco investment in Telecom Italia. The Compromiso was required in order for the Argentine authorities to approve the Telco investment in Telecom Italia and it was accepted by the competent Argentine authorities on October 13, 2010. Pursuant to a deed of amendment dated December 10, 2010 (the “2010 Amendment Deed”), the Existing Shareholders implemented the Compromiso by inserting an additional clause into the Shareholders’ Agreement (with such amendments and integrations from time to time agreed, the “Prior Shareholders’ Agreement”) related to the governance of Telco and Telecom Italia with respect to the operations of Telecom Italia, Telefónica and their respective group companies which offer telecommunications, Internet, data, radio, media and substitute services in Argentina.
On February 29, 2012, the Existing Shareholders entered into a renewal agreement (the “Second Renewal Agreement”) in which the parties agreed to terminate, effective the date of the Second Renewal Agreement, the Prior Shareholders’ Agreement and enter into a new shareholders agreement for a period of three years on the same terms and conditions set out in the original Shareholders’ Agreement dated as of April 28, 2007, between the Existing Shareholders and Sintonia S.A., as subsequently amended and supplemented in 2007, 2009, 2010 and pursuant to the 2010 Amendment Agreement, subject to the amendments and integrations set forth therein (the “New Shareholders’ Agreement”). Further, on February 29, 2012, the call option granted to Telefónica to purchase shares of Telecom Italia held by Telco pursuant to the Prior Shareholders’ Agreement was extended to February 28, 2015, pursuant to an amendment deed to the Option Agreement (the “Telefónica Option Amendment Deed”) entered into between Telefónica and Telco.
In addition, on February 29, 2012, the Existing Shareholders undertook to take actions to ensure the refinancing of Telco’s financial indebtedness through appropriate financial instruments, contractual agreements and/or corporate transactions in proportion to their respective shareholdings of Telco.
On May 31, 2012, Telefónica, Assicurazioni Generali, S.p.A. (for its own account and in the name and on behalf of the following Generali’s subsidiaries, Generali Vie, S.A. Alleanza Toro, S.p.A. Generali Italia, S.p.A. (now incorporating INA Assitalia S.p.A.) Generali Lebensversicherung AG), Intesa Sanpaolo, S.p.A., Mediobanca – Banca di Credito Finanziario, S.p.A. (together the “Shareholders”) and Intesa Sanpaolo, S.p.A., Mediobanca – Banca di Credito Finanziario, S.p.A., Unicredit, S.p.A., Société Générale, HSBC Bank (together the “2012 Lenders”) entered into a Pledged Shares Option Agreement (the “2012 Pledged Shares Option Agreement”) providing, among other things, for the right of the Shareholders to call and acquire from the 2012 Lenders at the terms and conditions referred to therein, any Telecom Italia. ordinary shares that would have been appropriated by the 2012 Lenders in case of enforcement of the pledge (the
“2012 Share Pledge”) created under and pursuant to the share pledge agreement entered into on May 31, 2012, between Telco as pledgor, and the 2012 Lenders, as secured creditors.
• On September 24, 2013, Telefónica and the remaining shareholders of the Italian company Telco. (which holds a capital stake of 22.4% of the voting share capital of Telecom Italia) reached an agreement by virtue of which:
− Telefónica subscribed for and paid out a capital increase in Telco, through the contribution of 324 million euros in cash, receiving in return non-voting shares of Telco. As a result of this capital increase, the interest held by Telefónica in the voting share capital of Telco remained unchanged (i.e. 46.18%), although its interest in the total share capital of Telco. has increased to 66%. The current governance structure at Telco remained unaffected, including the obligation by Telefónica of abstaining from participating or influencing in any decisions which could affect the markets in which both, Telefónica and Telecom Italia, are present.
− Subject to receiving any required anti-trust and telecommunications approvals (including in Brazil and Argentina), Telefónica will subscribe for and pay out a second capital increase in Telco, through the contribution of 117 million euros in cash and will receive in return non-voting shares of Telco. As a result of this second capital increase, the interest of Telefónica in the voting share capital of Telco. will remain unchanged (i.e. 46.18%), although its interest in the total share capital will be then increased to 70%.
− Starting from January 1, 2014, subject to receiving any required anti-trust and telecommunications approvals (including in Brazil and Argentina), Telefónica may convert all or a portion of its non-voting shares in Telco into voting shares in Telco, representing no more than 64.9% of the voting share capital of Telco.
− The Italian shareholders of Telco have granted Telefónica a call option to acquire all of their shares in Telco, whose exercise is subject to receiving any required anti-trust and telecommunications approvals (including in Brazil and Argentina). The call option may be exercised by Telefónica starting from January 1, 2014, while the Shareholders Agreement remains in effect, except (i) between June 1, 2014, and June 30, 2014, and between January 15, 2015, and February 15, 2015, and (ii) during certain periods, if the Italian shareholders of Telco request the demerger of such company.
As of the date of this Annual Report, the approvals that are necessary for the implementation of the transactions contemplated in the agreement dated September 24, 2013 and subscribed between Telefónica and the remaining shareholders of the Italian company Telco S.p.A. have not yet been obtained.
• On December 4, 2013, the Brazilian Antitrust Regulator, Conselho Administrativo de Defesa Econômica (CADE) announced, the two following decisions:
1. To approve, with the restrictions mentioned below, the acquisition by Telefónica of the entire participation held by Portugal Telecom, SGPS S.A., and PT Móveis - Serviços de Telecomunicações, SGPS, S.A., (the “PT Companies”) in Brasilcel N.V., which controlled the Brazilian mobile company, Vivo Participações S.A.
Such transaction was approved by ANATEL and the closing (which did not require CADES’s prior approval at the time), occurred immediately after such ANATEL’s approval, on September 27, 2010.
The above-mentioned decision was granted by CADE conditional on:
(a) The entry of a new shareholder in Vivo, sharing with Telefónica the control of Vivo in conditions identical to those that were applicable to the PT Companies when they had a participation in Brasilcel N.V., or
(b) That Telefónica ceases to have any direct or indirect financial interest in TIM Participações S.A.
2. To impose on Telefónica a fine of 15 million Brazilian Reais, for having allegedly breached the spirit and the goal of the agreement signed between Telefónica and CADE (as a condition to the approval of Telefónica´s original acquisition of an interest in Telecom Italia in 2007), due to the subscription of non-voting shares of Telco on a recent capital increases. This decision also requires Telefónica to divest such non-voting shares of Telco.
The timing for the accomplishment of the conditions and obligations imposed by CADE on both decisions was classified by CADE as confidential and reserved information.
• On December 13, 2013, Telefónica, S.A. announced, in relation to the two decisions adopted by CADE on its December 4, 2013 session that the Company considered that the remedies imposed were unreasonable and therefore, initiated the appropriate legal actions (see “Item 8. Financial Information—Legal proceedings”).
In line with such course of action, and to reinforce our strong commitment with the previous obligations undertaken by Telefónica to remain separate from Telecom Italia´s Brazilian businesses, Telefónica, S.A., highlighted in the aforementioned announcement, that Mr. César Alierta Izuel and Mr. Julio Linares López have decided to resign, with immediate effect, from their positions as Directors of Telecom Italia; and Mr. Julio Linares has decided to resign, with immediate effect, from his position in the slate submitted by Telco. for the potential re-election of the Board of Directors of Telecom Italia in the Shareholders Meeting of the aforementioned company, called for December 20, 2013.
For the same reasons, Telefónica, S.A., indicated that, without prejudice of any of the rights recognized in Telco Shareholder`s Agreement, has decided for the time being not to avail of its right to appoint two Directors in the Board of Directors of Telecom Italia.
On November 27, 2013, the Shareholders and the 2012 Lenders entered into certain contractual arrangements pursuant to which the 2012 Share Pledge was released and the 2012 Pledged Shares Option Agreement was terminated.
On November 27, 2013, a new pledged shares option agreement (the “2013 Pledged Shares Option Agreement”) was entered into between, inter alias, the Shareholders and Intesa Sanpaolo, S.p.A. and Mediobanca - Banca di Credito Finanziario S.p.A. (the “2013 Lenders”) to establish the terms and conditions which would govern the Shareholders’ call option (the “2013 Call Option”) to acquire from the 2013 Lenders at the terms and conditions referred to therein, any Telecom Italia ordinary shares (the “2013 Pledged Shares”) that would have been appropriated by the 2013 Lenders in case of enforcement of the pledge (the “2013 Share Pledge”) created under and pursuant to the share pledge agreement entered into on November 27, 2013 between Telco and 2013 Lenders as security for the obligations of Telco under the new facility agreement entered into between Telco and the 2013 Lenders on October 4, 2013 (the “New Banking Facility Agreement”).
On June 16, 2014, the three Italian shareholders of Telco requested the initiation of a "demerger" process (spin off) of the company, as provided in the shareholder’s agreement. Implementation of the demerger, which was approved by the general shareholder’s meeting held on July 9, 2014, remains subject to obtaining the required anti-trust and telecommunications approvals (including those in Brazil and Argentina). Once the aforementioned approvals are obtained, this decision will be implemented by transferring the current stake of Telco in Telecom Italia to four newly created companies. The share capital of each of these companies will belong in its entirety to each of the shareholders of Telco and each of these companies will receive a number of shares of Telecom Italia proportional to the current economic stake in Telco of each respective shareholder.
The application process of the aforementioned anti-trust and telecommunications approvals (including those in Brazil and Argentina), to proceed to the "demerger" (spin off) of Telco started, once the corresponding corporate documents were entered into in Italy. On December 22, 2014, ANATEL approved the “demerger” (spin off), although CADE (Conselho Administrativo de Defesa Ecônomica do Brasil) and CNDC (Comisión Nacional de Defensa de la Competencia of Argentina) have not rendered any decision yet.
Furthermore, on July 24, 2014, Telefónica issued 750 million euros bonds mandatorily exchangeable into ordinary shares of Telecom Italia maturing on July 24, 2017, representing, as of that date, 6.5% of its voting share capital. The bonds may be exchanged into shares in advance of the maturity date, except under certain circumstances where the company may opt to redeem the bonds in cash.
Within the framework of the proposed GVT transaction (see “—Agreement for the Acquisition of Global Village Telecom, S.A. and its holding company GVT Participações, S.A.” below), Vivendi, S.A. will acquire from Telefónica 1,110 million ordinary shares in Telecom Italia representing 8.3% of Telecom Italia’s voting share capital (equivalent to 5.7% of its total share capital), in exchange for 4.5% of Vivendi, S.A.'s capital in Telefónica Brasil, S.A., after its combination with GVT (which represents all of the voting shares and 0.7% of the preferred shares to be received by Vivendi S.A. in connection with the GVT transaction). The final closing of the operation is subject to obtaining the relevant regulatory authorizations (including telecommunication and anti-trust approval).
Material Contract Related to Our Investment in China Unicom
On September 6, 2009, Telefónica and China Unicom entered into a subscription agreement, or (the Subscription Agreement,“Subscription Agreement”), pursuant to which each party conditionally agreed to invest the equivalent of $11 billion U.S. dollars in the other party through the acquisition of shares in the other party. Moreover, both parties entered into a strategic alliance agreement which provides for, among other areas for cooperation, joint procurement of infrastructure and client equipment, common development of mobile service platforms, joint provisions of service to multinational customers, roaming, research and development, sharing of best practices and technical, operational and management know-how, joint development of strategic initiatives in the area of network evolution, joint participation in international alliances and exchanges of senior management.
On October 21, 2009, the mutual share exchange pursuant to the Subscription Agreement was implemented through the subscription by Telefónica Internacional of 693,912,264 newly issued shares of China Unicom and a contribution in kind to China Unicom of 40,730,735 shares of Telefónica.
Following the completion of the transaction, we increased our share of China Unicom’s voting share capital from 5.38% to 8.06% and obtained the right to appoint a member to its board of directors, while China Unicom became owner of approximately 0.87% of our voting share capital at that date. Subsequently, after a capital reduction carried out by China Unicom, we reached a shareholding equivalent to 8.37% of the company’s voting share capital.
Under the Subscription Agreement, we agreed with China Unicom that for a period of one year from completion of the acquisition of the mutual share exchange, we shall not, directly or indirectly, sell, transfer or dispose of any of the China Unicom shares held, directly or indirectly, by us or any of our subsidiaries (save for the transfer of such shares to any member of the Telefónica group). China Unicom has made an analogous undertaking with respect to its participation in our share capital.
In addition, subject to Telefónica or any of its subsidiaries holding in aggregate, directly or indirectly, not less than 5% of the issued share capital of China Unicom from time to time and to the extent not prohibited under applicable law, the articles of association of China Unicom and the Hong Kong Listing Rules, we shall be entitled to nominate one representative to the Board of Directors of China Unicom.
Finally, with effect from completion, and for so long as the strategic alliance agreement is in effect, China Unicom shall not (i) offer, issue or sell any significant number of its ordinary shares (including those held in treasury by the company itself, if any), or any securities convertible into or other rights to subscribe for or purchase a significant number of China Unicom’s ordinary shares (including those held in treasury by the company itself, if any), to any of our current major competitors or (ii) make any significant investment, directly or indirectly, in any of our current major competitors. We have made similar undertakings.
The strategic alliance agreement between the parties terminates on the third anniversary and automatically renews thereafter for one year terms, subject to either party’s right to terminate on six month’smonths’ notice. Also, the strategic alliance agreement may be terminated by China Unicom if we sell our shares in China Unicom causing us to own less than 5% of the issued share capital of China Unicom or by us if China Unicom sells our shares and ceases to own at least 0.5% of our issued share capital. In addition, the strategic alliance agreement is subject to termination in the event either party is in default and automatically terminates on a change in control of China Unicom.
On January 23, 2011, Telefónica and China Unicom entered into an extension to their already existing strategic alliance agreement (the “Enhanced Strategic Alliance Agreement”) in which both companies agreed to strengthen and deepen their strategic cooperation in certain business areas and through which, upon the terms and conditions set out thereof, each party agreed to invest the equivalent of $500500 million U.S. dollars in ordinary shares of the other party toward the alliance. Furthermore, we have agreed to propose the appointment of a director nominated by China Unicom. Following completion of the transaction, we will own approximately a 9.6% of China Unicom’s voting share capital.
Pursuant to the Enhanced Strategic Alliance Agreement, and as of the date of this Annual Report, Telefónica, through its wholly-owned subsidiary, Telefónica Internacional has acquired 282,063,000 ordinary shares of China Unicom through several transactions executed in the period between January 25, 2011 and September 7, 2011, investing an aggregate amount equivalent to approximately 500 million U.S. dollars (equivalent to €358 million)358 million euros).
Additionally, on January 28, 2011, China Unicom acquired 21,827,499 Telefónica shares at the agreed price of €17.1617.16 euros per share, giving it ownership of 1.37% of the Company’s capital (the arithmetic average of the closing price
of Telefónica shares as quoted on the Madrid Stock Exchange for the thirty consecutive trading days ending on January 14, 2011), which represents a total price of $500 million.500 million U.S. dollars. In recognition of China Unicom’s stake in Telefónica, the Company nominated Mr. Chang Xiaobing, who was designated by China Unicom, to the Board of Directors at the General Shareholders’ Meeting held on May 18, 2011.
At December 31, 2011, Telefónica’s shareholding in China Unicom amounted to 9.6% of its capital stock.
Since their strategic alliance agreement signed in September 2009, Telefónica and China Unicom have made significant progress in various areas of cooperation. In this respect, we believe that this new agreement will enhance this alliance and deepen cooperation between the two companies in the areas of procurement, mobile service platforms, service to MNCs,multinational customers, wholesale carriers, roaming technology/R&D, international business development, cooperation and sharing of best practices.
On June 10, 2012, Telefónica, S.A. through its 100% subsidiary, Telefónica Internacional, S.A.U., and China United Network Communications Group Company Limited ("Unicom Parent") through a 100% owned subsidiary, signed an agreement for the acquisition by this last company of 1,073,777,121 shares of China Unicom -Hong Kong- Limited, owned by Telefónica, equivalent to 4.56% of the issued share capital.
On July 21, 2012, the aforementioned agreement was complemented by a Supplemental Agreement which determined the acquisition of the shares at a price of HK$10.02 per share, for a total amount of HK$10,759,246,752.42 (approximately 1,142 million euros). The transaction was completed on July 30, 2012 after obtaining the relevant regulatory authorizations.
On November 10, 2014, Telefónica, though its 100% subsidiary Telefónica Internacional, S.A.U., sold 597,844,100 shares of China Unicom (Hong Kong) Limited (representing 2.5% of the share capital of that company), through a block trade process, at a price of HK$ 11.14 per share, for a total amount of HK$ 6,660 million, approximately 687 million euros at the exchange rate as at the date of the sale.
Further to the sale, Telefónica maintains its commitment to the strategic alliance with China Unicom.
As of the date of this Annual Report, Telefónica’s shareholding in China Unicom amounts to 2.51% of its capital stock and Mr. César Alierta, chairman of Telefónica, S.A. is a member of the Board of Directors of China Unicom.
Material Contract related to the sale of Customer Relationship Management (CRM) business, Atento
As a result of the sale agreement of Atento by Telefónica, announced on October 12, 2012 and ratified on December 12, 2012, both companies signed a Master Service Agreement which regulates Atento’s relationship with the Telefónica Group as a service provider for a period of nine years.
By virtue of this agreement, Atento became Telefónica’s preferred Contact Center and Customer Relationship Management (CRM) service provider, stipulating annual commitments in terms of turnover which updates in line with inflation and deflation that vary from country to country, pursuant to the volume of services Atento has been providing to the entire Group.
In the case of an eventual failure to meet the annual turnover commitments that could result in compensation, which would be calculated based on the difference between the actual amount of turnover and the predetermined commitment, applying a percentage based on the Contract Center’s business margin to the final calculation.
Lastly, the Master Agreement sets forth a reciprocal arrangement, whereby Atento assumes similar commitments to subscribe its telecommunications services to Telefónica.
Agreement for the acquisition of Vivo (PT)E-Plus
Telefónica, S.A. and its German listed subsidiary Telefónica Deutschland Holding AG (hereinafter, “Telefónica Deutschland”) on July, 23, 2013 entered into an agreement (amended on August 26, 2013) with the Dutch company Koninklijke KPN NV (hereinafter, “KPN”) under which Telefónica Deutschland committed itself to acquire the shares of the German subsidiary of KPN, E-Plus Mobilfunk GmbH & Co. KG (hereinafter, “E-Plus”), receiving KPN, as consideration, 24.9% of Telefónica Deutschland and 3,700 million euros.
Telefónica committed to subsequently acquire from KPN, 4.4% of Telefónica Deutschland for a total amount of 1,300 million euros, consequently, after the aforementioned acquisition, KPN’s stake in Telefónica Deutschland will be reduced to 20.5%.
Telefónica also committed to subscribe the proportional corresponding share in the capital increase approved by Telefónica Deutschland in the Extraordinary General Meeting held on February, 11, 2014, to finance the cash consideration of the transaction.
On October 1, 2014, Telefónica Deutschland completed the acquisition of E-Plus, following its execution of a capital increase intended to fund such acquisition. Telefónica owns a 62.37% stake in Telefónica Deutschland, which currently owns 100% of the share capital of E-Plus, while KPN holds a 20.5% stake and the rest is free float.
Agreement for the Acquisition of Global Village Telecom, S.A. and its holding company GVT Participações, S.A. (“GVT”)
On July 28, 2010, weSeptember 19, 2014, Telefónica, S.A. signed an agreement with Portugal TelecomVivendi S.A. for the acquisition by Telefónica Brasil, S.A. of GVT for a cash consideration of 4,663 million euros, and a payment in shares representing 12.00% of the 50% of the capital stock of Brasilcel owned by Portugal Telecom. Brasilcel owned approximately 60% of the total share capital of Vivo Participaceos,Telefónica Brasil, S.A., after its combination with GVT.
As part of the agreement, Vivendi S.A. will acquire from Telefónica 1,110 million ordinary shares in Telecom Italia currently representing 8.3% of Telecom Italia’s voting share capital (equivalent to 5.7% of its total share capital), in exchange for 4.5% of Vivendi, S.A.'s capital in Telefónica Brasil, S.A., after its combination with GVT (which represents all of the voting shares and 0.7% of the preferred shares to be received by Vivendi S.A. under the agreement referred to above).
The acquisition price of suchcash payment for this transaction is expected to be financed via a capital stock was €7,500 million, €4,500 million ofincrease by Telefónica Brasil S.A., which was paid at theTelefónica S.A. intends to subscribe in proportion to its current stake in Telefónica Brasil, S.A. and intends to fund, in turn, via a capital increase.
The final closing of the transaction on September 27, 2010, €1,000operation is subject to obtaining the relevant regulatory authorizations (including telecommunication and anti-trust approval). On December 22, 2014, ANATEL approved the acquisition of GVT, although the resolution about the acquisition by Vivendi, S.A. of the 1,110 million of which was paid on December 30, 2010, and the remaining €2,000 millionordinary shares of which was paid on October 31, 2011. Upon closingTelecom Italia is still pending. As of the transaction,date of this Annual Report, CADE continues to analyze the respective subscription and shareholders agreements entered into by Telefónica and Portugal Telecom in 2002 relating to their joint venture in Brazil were terminated.process.
Exchange Controls and Other Limitations Affecting Security Holders
Ownership limitations
There are no limitations with respect to the ownership of our assets or share capital except those derived from the application of the reciprocity principle as described above.
Trading by us in our own shares or shares of companies under our control
Other restrictions on acquisitions of shares
For information on reporting requirements concerning acquisitions by us or our affiliatesand other restrictions “applicable to the acquisition of our shares see “—“—Memorandum and Articles of Association—Description of Our Capital Stock-Reporting requirements” and “—Trading by us in our own shares or shares of companies under our control” above.
Dividend and Liquidation Rights
According to Spanish law and our bylaws, dividends may only be paid out of profits or distributable reserves if the value of our net worth is not, and as a result of such distribution would not be, less than our capital stock. Pursuant to Spanish law, we are required to reserve 10% of our fiscal year net income until the amount in our legal reserve reaches 20% of our capital. Our legal reserve is currently at 20%.
Dividends payable by us to non-residents of Spain ordinarily are subject to a Spanish withholding tax. For the tax implications of dividends to U.S. Holders (as defined below), see “—Taxation.”
Upon our liquidation, our shareholders would be entitled to receive pro rata any assets remaining after the payment of our debts and taxes and expenses of such liquidation. Any change in the rights of shareholders to receive dividends and payment upon liquidation would require an amendment to our bylaws by resolution adopted by a general meeting of shareholders. If there were more than one class of shares, such amendment would also require the approval of each class of shareholders affected by the amendment.
Preemptive Rights and Increases of Share Capital
Pursuant to the Spanish Corporations Law, shareholders have preemptive rights to subscribe for any new shares and for bonds convertible into shares. Such rights may not be available under special circumstances if waived by a resolution passed at a general meeting of shareholders in accordance with Article 308 of the Spanish Corporations Law, or the Board of Directors, if authorized (Article 506 of the Spanish Corporation Law)Act). Further, such rights, in any event, will not be available in the event of an increase in capital to meet the requirements of a convertible bond issue or a merger in which shares are issued as consideration. Such rights:
| · | are transferable; |
| · | may be traded on the Automated Quotation System; and |
| · | may be of value to existing shareholders because new shares may be offered for subscription at prices lower than prevailing market prices. |
Absent an exemption from registration, shares issuable upon exercise of rights must be registered under the Securities Act of 1933 in order to be offered to holders of ADRs. If we decided not to register the shares, the rights would not be distributed to holders of ADRs. Pursuant to the Deposit Agreement, however, holders of ADRs are entitled to receive their proportionate share of the proceeds, if any, from sale by the Depositary of any rights accruing to holders of ADRs.
The following is a general summary of the material Spanish and U.S. federal income tax consequences to U.S. Holders (as defined below) of the ownership and disposition of shares or ADSs. This summary is based upon Spanish and U.S. tax laws (including the U.S. Internal Revenue Code of 1986, as amended (the “Code”), final, temporary and proposed U.S. Treasury regulations, rulings, judicial decisions and administrative pronouncements), and the Convention Between the United States of America and the Kingdom of Spain for the Avoidance of Double Taxation and the Prevention of Fiscal Evasion with Respect to Taxes on Income, signed February 22, 1990 (the “Treaty”), all as of the date hereof and all of which are subject to change or changes in interpretation, possibly with retroactive effect. In addition, the summary is based in part on representations of the Depositary and assumes that each obligation provided for in or otherwise contemplated by the Deposit Agreement or any other related agreements will be performed in accordance with its terms.
As used herein, the term “U.S. Holder” means a beneficial owner of one or more shares or ADSs:
| (a) | that is, for U.S. federal income tax purposes, one of the following: |
| i. | a citizen or individual resident of the United States, |
| ii. | a corporation (or other entity taxable as a corporation) created or organized in or under the laws of the United States or any state therein or the District of Columbia, or |
| iii. | an estate or trust the income of which is subject to U.S. federal income taxation regardless of its source; |
| (b) | who is entitled to the benefits of the Treaty; |
| (c) | who holds the shares or ADSs as capital assets for U.S. federal income tax purposes; |
| (d) | who owns, directly, indirectly or by attribution, less than 10% of the share capital or voting stock of Telefónica; and |
| (e) | whose holding is not attributable to a fixed base or permanent establishment in Spain. |
This summary does not address all of the tax considerations, including the potential application of the provisions of the Code known as the Medicare contribution tax, that may apply to holders that are subject to special tax rules, such as certain U.S. expatriates, insurance companies, tax-exempt organizations, certain financial institutions, persons subject to the alternative minimum tax, dealers and certain traders in securities, persons holding shares or ADSs as part of a straddle, hedging, conversion or integrated transaction, persons who acquired their shares or ADSs pursuant to the exercise of employee stock options or otherwise as compensation, persons owning shares or ADSs in connection with a trade or business outside of the U.S., partnerships or other entities classified as partnerships for U.S. federal income tax purposes or persons whose functional currency is not the U.S. dollar. Such holders may be subject to U.S. federal income tax consequences different from those set forth below.
If a partnership holds shares or ADSs, the tax treatment of a partner generally will depend upon the status of the partner and the activities of the partnership. A partner in a partnership that holds shares or ADSs is urged to consult its own tax advisor regarding the specific tax consequences of owning and disposing of the shares or ADSs.
For purposes of the Treaty and U.S. federal income tax, U.S. Holders of ADSs will generally be treated as owners of the underlying shares represented by such ADSs. Accordingly, no gain or loss will be recognized if a U.S. Holder exchanges ADSs for the underlying shares represented by those ADSs.
The U.S. Treasury has expressed concerns that parties to whom American depositary receipts are released before shares are delivered to the depositary, or intermediaries in the chain of ownership between holders and the issuer of the security underlying the American depositary receipts, may be taking actions that are inconsistent with the claiming of foreign tax credits by U.S. holders of American depositary receipts. Such actions would also be inconsistent with the claiming of the reduced raterates of tax applicable to dividends received by certain non-corporate U.S. Holders. Accordingly, the availability of foreign tax credits to U.S. Holders of ADSs and the reduced tax raterates for dividends received by certain non-corporate U.S. Holders of ADSs, each as described below, could be affected by actions taken by such parties or intermediaries.
This discussion assumes that Telefónica is not, and will not become, a passive foreign investment company (“PFIC”), as discussed below under “—U.S. Federal Income Tax Considerations—Passive foreign investment company rules.”
U.S. Holders of shares or ADSs should consult their own tax advisors concerning the specific Spanish and U.S. federal, state and local tax consequences of the ownership and disposition of shares or ADSs in light of their particular situations as well as any consequences arising under the laws of any other taxing jurisdiction. In particular, U.S. Holders are urged to consult their own tax advisors concerning their eligibility for benefits under the Treaty.
Spanish Tax Considerations
Taxation of dividends
Under Spanish law, dividends paid by Telefónica to U.S. Holders of ordinary shares or ADSs are subject to Spanish Non-Resident Income Tax, withheld at source, as of January 1, 2012, at a rate of 21%20% for 2015 and at a rate of 19% as from January 1, 2016 (21% for 2014). For these purposes, upon distribution of the dividend, Telefónica or its paying agent will withhold an amount equal to the tax due according to the rules set forth above (i.e., applying the general withholding tax rate of 21%).above.
However, under the Treaty, if you are a U.S. Holder, you are entitled to a reduced withholding tax rate of 15%.
To benefit from the Treaty-reduced rate of 15%, you must provide to Telefónica through its paying agent in Spain, before the tenth day following the end of the month in which the dividends were payable, a certificate from the U.S.
Internal Revenue Service (“IRS”) stating that, to the best knowledge of the IRS, such U.S. Holders are residents of the United States within the meaning of the Treaty and entitled to its benefits.
If thethis certificate referred to in the above paragraph is not provided within said term,this period, you may afterwards obtain a refund of the amount withheld in excess of the rate provided for in the Treaty.Treaty by following the procedures described in the next section.
Spanish Refund Procedure
According to Spanish Regulations on Non-Resident Income Tax, approved by Royal Decree 1776/2004 dated July 30, 2004, as amended, a refund for the amount withheld in excess of the Treaty-reduced rate can be obtained from the relevant Spanish tax authorities. To pursue the refund claim, if you are a U.S. Holder, you are required to file:
| · | the corresponding Spanish tax |
| · | the certificate referred to in the preceding section, and |
| · | evidence of the Spanish Non-Resident Income Tax that was withheld with respect to you. |
The refund claim must be filed within four years from the date in which the withheld tax was collected by the Spanish tax authorities.
U.S. Holders are urged to consult their own tax advisors regarding refund procedures and any U.S. tax implications thereof.
Taxation of capital gains
Spanish wealth tax
Individual U.S. Holders who hold shares or ADSs located in Spain are subject to the Spanish Wealth Tax (Impuesto sobre el Patrimonio) (Spanish Law 19/1991), which imposes tax on property located in Spain on the last day of any year.
The Spanish tax authorities may take the view that all shares of Spanish corporations and all ADSs representing such shares are located in Spain for Spanish tax purposes. If such a view were to prevail, non-residents of Spain who held shares or ADSs on the last day of any year would be subject to the Spanish wealth tax for such year on the average market value of such shares or ADSs during the last quarter of such year.
Non-residents of Spain who held shares, ADSs, or other assets or rights located in Spain according to Spanish wealth tax law, on the last day of the year whose combined value exceeds 700,000 euros would be subject to the Spanish wealth tax on that excess amount at marginal rates varying between 0.2% and 2.5%, and would be obliged to file the corresponding wealth tax return.
Inheritance and gift tax
Transfers of shares or ADSs on death and by gift to individuals are subject to Spanish inheritance and gift taxes (Impuesto sobre Sucesiones y Donaciones), respectively, if the transferee is a resident of Spain for tax purposes, or if the shares or ADSs are located in Spain at the time of death, regardless of the residence of the heir or beneficiary. In this
regard, the Spanish tax authorities may determine that all shares of Spanish corporations and all ADSs representing such shares are located in Spain for Spanish tax purposes. The state applicable tax rate, after applying relevant personal, family and wealth factors, generally ranges between 7.65% and 81.6% for individuals. Notwithstanding the above, certain autonomous communities have used their right to establish their own tax rates and deductions and to control the management and settlement of such taxes.
Gifts granted to corporations non-resident in Spain are subject to Spanish Non-Resident Income Tax at a 21% tax rate of 20% for 2015 and at a rate of 19% as from January 1, 2016 (21% for 2014) on the fair market value of the shares as a capital gain. If the donee is a United States resident corporation, the exclusions available under the Treaty described in the section “—Taxation of Capital Gains” above will be applicable.
Expenses of Transfer
Transfers of shares or ADSs will be exempt from any transfer tax (Impuesto sobre Transmisiones Patrimoniales) or value added tax. Additionally, no stamp tax will be levied on such transfers.
U.S. Federal Income Tax Considerations
Taxation of dividends
Distributions received by a U.S. Holder on shares or ADSs, including the amount of any Spanish taxes withheld therefrom, other than certain pro rata distributions of shares to all shareholders (including ADS holders), will constitute foreign sourceforeign-source dividend income to the extent paid out of Telefónica’s current or accumulated earnings and profits (as determined for U.S. federal income tax purposes). Because Telefónica does not maintain calculations of its earnings and profits under U.S. federal income tax principles, it is expected that distributions generally will be reported to U.S. Holders as dividends. The amount of dividend income paid in euroseuro that a U.S. Holder will be required to include in income will equal the U.S. dollar value of the distributed euros,euro, calculated by reference to the exchange rate in effect
on the date the payment is received by the Depositary (in the case of ADSs) or by the U.S. Holder (in the case of shares), regardless of whether the payment is converted into U.S. dollars on the date of receipt. If the dividend is converted tointo U.S. dollars on the date of receipt, a U.S. Holder will generally not be required to recognize foreign currency gain or loss in respect of the dividend income. A U.S. Holder may have foreign currency gain or loss if the dividend is converted into U.S. dollars after the date of its receipt. Gain or loss that a U.S. Holder realizes on a sale or other disposition of euroseuro will be U.S.-source ordinary income or loss. Corporate U.S. Holders will not be entitled to claim the dividends-received deduction with respect to dividends paid by Telefónica. Subject to applicable limitations and the discussion above regarding concerns expressed by the U.S. Treasury, dividends received by certain non-corporate U.S. Holders in taxable years beginning before January 1, 2013 will be taxable at a maximum rate of 15%.rates applicable to long-term capital gains. Non-corporate U.S. Holders should consult their own tax advisors to determine whether they are subject to any special rules that limit their ability to be taxed at thisthese favorable rate.rates.
Spanish income taxes withheld from dividends on shares or ADSs at a rate not exceeding the rate provided in the Treaty will be creditable against a U.S. Holder’s U.S. federal income tax liability, subject to applicable restrictions and limitations that may vary depending upon the U.S. Holder’s circumstances and the discussion above regarding concerns expressed by the U.S. Treasury. Spanish taxes withheld in excess of the rate applicable under the Treaty will not be eligible for credit against a U.S. Holder’s federal income tax liability. See “Spanish Tax Considerations—Taxation of dividends” above for a discussion of how to obtain the applicable treaty rate. Instead of claiming a credit, a U.S. Holder may elect to deduct foreign taxes (including the Spanish taxes) in computing its taxable income, subject to generally applicable limitations. An election to deduct foreign taxes (instead of claiming foreign tax credits) applies to all taxes paid or accrued in the taxable year to foreign countries and possessions of the United States. The limitations on foreign taxes eligible for credit are calculated separately with respect to specific classes of income. The rules governing foreign tax credits are complex. Therefore, U.S. Holders should consult their own tax advisors regarding the availability of foreign tax credits in their particular circumstances.
Taxation upon sale or other disposition of shares or ADSs
A U.S. Holder will generally recognize U.S. source capital gain or loss on the sale or other disposition of shares or ADSs. Any such gain or loss will be long-term capital gain or loss if the U.S. Holder has held such shares or ADSs for more than one year. The amount of the U.S. Holder’s gain or loss will be equal to the difference between such U.S. Holder’s tax basis in the shares or ADSs sold or otherwise disposed of and the amount realized on the sale or other disposition, as determined in U.S. dollars.
As discussed under “Spanish Tax Considerations—Taxation of capital gains” above, gain realized by a U.S. Holder on the sale or other disposition of shares or ADSs will be exempt from Spanish tax on capital gains under the Treaty. If a U.S. Holder is eligible for the exemption from Spanish tax on capital gains but does not follow appropriate procedures for obtaining the exemption, such holder will not be entitled to credit the amount of Spanish tax on capital gains paid against its U.S. federal income tax liability. U.S. Holders should consult their own tax advisors regarding the potential Spanish tax consequences of a sale or other disposition of shares or ADSs and the procedures available for an exemption from such tax.
Passive foreign investment company rules
Telefónica believes that it was not a PFIC for U.S. federal income tax purposes for its 20112014 taxable year. However, because PFIC status depends upon the composition of a company’s income and assets and the market value of its assets (including, among others, less than 25% owned equity investments) from time to time, there can be no assurance that Telefónica will not be considered a PFIC for any taxable year. If Telefónica were treated as a PFIC for any taxable year during which a U.S. Holder heldowned a share or ADS, certain adverse tax consequences could apply to the U.S. Holder.
If Telefónica were treated as a PFIC for any taxable year during which a U.S. Holder heldowned a share or ADS, gain recognized by a U.S. Holder on a sale or other disposition of such share or ADS would be allocated ratably over the U.S. Holder’s holding period for the share or ADS. The amounts allocated to the taxable year of the sale or other disposition and to any year before Telefónica became a PFIC would be taxed as ordinary income. The amount allocated to each other taxable year would be subject to tax at the highest rate in effect for individuals or corporations, as appropriate, and an interest charge would be imposed on the resulting tax liability. The same treatment would
apply to any distribution in respect of shares or ADSs to the extent it exceeds 125% of the average of the annual distributions on shares or ADSs received by the U.S. Holder during the preceding three years or the U.S. Holder’s holding period, whichever is shorter. Certain elections may be available that would result in alternative treatments (such as mark-to-market treatment) of the shares or ADSs.
In addition, if Telefónica were treated as a PFIC in a taxable year in which it pays a dividend or in the prior taxable year, the favorable dividend raterates discussed above with respect to dividends paid to certain non-corporate U.S. Holders would not apply.
If weTelefónica were a PFIC for any taxable year during which a U.S. Holder heldowned our shares or ADSs, suchthe U.S. Holder maywill generally be required to file a report containing such information as theIRS Form 8621 with its annual U.S. Treasury may require.federal income tax return.
Information reporting and backup withholding
Payments of dividends and sales proceeds that are made within the United States or through certain U.S.-related financial intermediaries generally are subject to information reporting and may be subject to backup withholding unless the U.S. Holder is ana corporation or other exempt recipient or, in the case of backup withholding, the U.S. Holder provides a correct taxpayer identification number and certifies that it is not subject to backup withholding. The amount of any backup withholding from a payment to a U.S. Holder will be allowed as a credit against the U.S. Holder’s U.S. federal income tax liability and may entitle such U.S. Holder to a refund, provided that the required information is timely furnished to the IRS.
Certain U.S. Holders who are individuals or are controlled by individuals,and certain specified entities, may be required to report information relating to stock of a non-U.S. person, subject to certain exceptions (including an exception for stock held through a U.S. financial institution). U.S. Holders are urged to consult their tax advisers regarding the effect,application, if any, of this legislation onto their ownership and disposition of shares or ADSs.
Not Applicable.
Not Applicable.
Where You Can Find More Information
We file Annual Reports on Form 20-F and furnish periodic reports on Form 6-K to the SEC. You may read and copy any of these reports at the SEC’s public reference room in Washington, D.C. Please call the SEC at 1-800-SEC-0330 for further information on the public reference rooms. Our SEC filings are also available to the public from commercial document retrieval services. Some of our SEC filings are also available at the website maintained by the SEC at “http://www.sec.gov.”
Our ADSs are listed on the New York Stock Exchange under the symbol “TEF.” You may inspect any periodic reports and other information filed with or furnished to the SEC by us at the offices of the New York Stock Exchange, 20 Broad Street, New York, New York 10005.
As a foreign private issuer, we are exempt from the rules under the Exchange Act which prescribe the furnishing and content of proxy statements, and our officers, directors and principal shareholders are exempt from the reporting and “short-swing” profit recovery provisions contained in Section 16 of the Exchange Act.
We are subject to the informational requirements of the Spanish securities commission and the Spanish stock exchanges,Stock Exchanges, and we file reports and other information relating to our business, financial condition and other matters with the Spanish securities commission and the Spanish stock exchanges.Stock Exchanges. You may read such reports, statements and other information, including the annual and biannual financial statements, at the public reference facilities maintained
in Madrid and Barcelona. Some of our Spanish securities commission filings are also available at the website maintained by the Spanish securities commissionCNMV at http://www.cnmv.es.
We have appointed Citibank, N.A. to act as Depositary for the Telefónica ADSs. Citibank will, as provided in the Deposit Agreement, arrange for the mailing of summaries in English of such reports and communications to all record holders of the ADSs of Telefónica. Any record holder of Telefónica ADSs may read such reports and communications or summaries thereof at Citibank’s office located at 388 Greenwich Street, 14th Floor, New York, New York 10013.
Not applicable.
We are exposed to various financial market risks as a result of: (i) our ordinary business activity, (ii) debt incurred to finance our business, (iii) our investments in companies, and (iv) other financial instruments related to the above commitments.
The main market risks affecting us are as follows:
| a) | Exchange rate risk |
| Exchange rate risk arises primarily from (i) our international presence, through our investments and businesses in countries that use currencies other than the euro (primarily in Latin America, but also in the United |
| b) | Interest rate risk |
| Interest rate risk arises primarily from changes in interest rates affecting (i) financial expenses on floating rate debt (or short-term debt likely to be renewed), due to changes in interest rates and (ii) the value of long-term liabilities at fixed interest rates. |
| c) | Share price risk |
| Share price risk arises primarily from changes in the value of our equity investments that may be bought, sold or otherwise involved in transactions, from changes in the value of derivatives associated with such investments, from changes in the value of our treasury shares and from equity derivatives. |
We are also exposed to liquidity risk if a mismatch arises between our financing needs (including operating and financial expense, investment, debt redemptions and dividend commitments) and our sources of finance (including revenues, divestments, credit lines from financial institutions and capital market transactions). The cost of financing could also be affected by movements in credit spreads (over benchmark rates) demanded by lenders.
Finally, we are exposed to “country risk” (which overlaps with market and liquidity risks). This refers to the possible decline in the value of assets, cash flows generated or cash flows returned to the parent company as a result of political, economic or social instability in the countries where we operate, especially in Latin America.
We seek to actively manage these risks through the use of derivatives (primarily on exchange rates, interest rates and share prices) and by incurring debt in local currencies, where appropriate, with a view to stabilizing cash flows, our income statement and, to a lesser extent, part of the value of our investments. In this way, we attempt to protect our solvency, facilitate financial planning and take advantage of investment opportunities.
We manage our exchange rate risk and interest rate risk in terms of net debt and net financial debt as calculated by us. We believe that these parameters are more appropriate to understanding our debt position. Net debt and net financial debt take into account the impact of our cash balance and cash equivalents including derivatives positions
with a positive value linked to liabilities. Neither net debt nor net financial debt as calculated by us should be considered an alternative to gross financial debt (the sum of current and non-current interest-bearing debt) as a measure of our liquidity. For a more detailed description on reconciliation of net debt and net financial debt to gross financial debt, see “Item 5. Operating and Financial Review and Prospects—Presentation of Financial Information—Non-GAAP financial information—Net financial debt and net debt.”
For a more detailed description on quantitative and qualitative disclosures about market risks see Note 16 to our Consolidated Financial Statements.
The Depositary of our ADR program is Citibank, N.A., and the address of its principal executive office is 388 Greenwich Street, 14th Floor, New York, New York 10013.
Our ADSs are listed on the New York Stock Exchange under the symbol “TEF.”
Until January 21, 2011, each ADS represented the right to receive three ordinary shares of capital stock of €1.001.00 euros nominal value each, of Telefónica, S.A. Citibank, in its capacity as Depositary, effected a ratio change on the Telefónica, S.A.’s ADR program so that each ADS now represents the right to receive one ordinary share. The effective date of the ratio change was January 21, 2011. The Depositary issues ADSs in the form of certificated ADSs (American Depositary Receipts, or ADRs) or uncertificated ADSs pursuant to the Deposit Agreement.
Under the terms of the Deposit Agreement, as of the date of this Annual Report, an ADS holder may have to pay to the followingDepositary the services fees tospecified in the Depositary.table below:
Category | Depositary Actions | Associated Fee / By Whom Paid | ||
| (a) Depositing or substituting the underlying shares | Issuance of ADSs upon the deposit of shares | Up to | ||
| (b) Receiving or distributing dividends | Distribution of cash dividends or other cash distributions; distribution of share dividends or other free share distributions; distribution of securities other than ADSs or rights to purchase additional ADSs | Up to | ||
| (c) Selling or exercising rights | Distribution or sale of securities | Up to | ||
| (d) Withdrawing an underlying security | Acceptance of ADSs surrendered for withdrawal of deposited securities | Up to | ||
| (e) Transferring, splitting or grouping receipts | Transfers | Up to |
| (f) General depositary services, particularly those charged on an annual basis | Other services performed by the Depositary in administering the ADSs | Up to | ||
| (g) Expenses of the Depositary | Certain fees and expenses incurred by the depositary bank and certain taxes and governmental charges in connection with: · compliance with foreign exchange control regulations or any law or regulation relating to foreign investment; · the Depositary or its custodian’s compliance with applicable law, rule or regulation; · stock transfer or other taxes and other governmental charges; · cable, telex, facsimile transmission/delivery; · expenses of the Depositary in connection with the conversion of foreign currency into U.S. dollars (which are paid out of such foreign currency); · any other charge payable by Depositary or its agents. | Expenses payable at the sole discretion of the Depositary (billed or deducted from cash distributions to person holding ADSs on applicable record date established by the Depositary) |
| (1) | In the case of ADSs issued by the Depositary into |
| (2) | For ADSs held through DTC, the Depositary fees for distributions other than cash and the Depositary service fee are charged by the Depositary to the DTC Participants in accordance with the procedures and practices prescribed by DTC from time to time and the DTC Participants in turn charge the amount of such fees to the beneficial owners for whom they hold ADSs. |
The Depositary has agreed to reimburse or pay on behalf of Telefónica, S.A,S.A., certain reasonable expenses related to our ADS program and incurred by us in connection with the program (such as NYSE listing fees, legal and accounting fees incurred with preparation of Form 20-F and ongoing SEC compliance and listing requirements, distribution of proxy materials, investor relations expenses, etc)etc.). The Depositary has covered all such expenses incurred by us during 20112014 for an amount of $5.9 million.7 million dollars. The amounts the Depositary reimbursed or paid are not perforce related to the fees collected by the depositary from ADS holders.
As part of its service to us, the Depositary has agreed to waive certain expenses for the standard costs associated with the administration of our ADS program for the year ended December 31, 2011.2014.
None.
Not applicable.
Disclosure Controls and Procedures
Our Chief Executive Officer and our Chief Financial Officer, after evaluating the effectiveness of our disclosure controls and procedures (as defined in Rule 13a-15(e) under the Securities Exchange Act of 1934)Act) as of the end of the period covered by this Form 20-F, have concluded that, as of such date, our disclosure controls and procedures were effective.
Management’s Annual Report on Internal Control over Financial Reporting
The management of Telefónica is responsible for establishing and maintaining adequate internal control over financial reporting as defined in Rule 13a–15(f) under the Securities Exchange Act of 1934.Act. Telefónica’s internal control system is designed to provide reasonable assurance as to the reliability of financial reporting and the preparation of the published financial statements under generally accepted accounting principles.
Any internal control system, no matter how well designed, has inherent limitations, including the possibility of human error and the circumvention or overriding of the controls and procedures, which may not prevent or detect misstatements.
Telefónica management assessed the effectiveness of Telefónica’s internal control over financial reporting as of December 31, 2011.2014. In making this assessment, it used the criteria set forth by the Committee of Sponsoring Organizations of the Treadway Commission (COSO)(COSO 2013 framework) in Internal Control – Integrated Framework. Based on its assessment and those criteria, Telefónica management believes that at December 31, 2011,2014, Telefónica’s internal control over financial reporting is effective.
Report of the Independent Registered Public Accounting Firm
Telefónica’s independent registered public accounting firm, Ernst & Young, S.L., has issued a report on the effectiveness of the company’s internal control over financial reporting. The report is included on page F-1.1.F-2.
Changes in Internal Control Over Financial Reporting
There were no changes in our internal control over financial reporting during the period covered by this Annual Report that have materially affected, or are reasonably likely to materially affect, our internal control over financial reporting.
Our Board of Directors has determined that Mr. Antonio Massanell Lavilla meets the requirements of an “audit committee financial expert” as such term is defined by the SEC.
The standards set forth in the Telefónica Business Principles which apply to all Telefónica Group employees. In March 2008,cover ethical issues such as honesty and trust, respect for the law, integrity and the respect of human rights, as well as how these ethical principles should be implemented in our relationships with our stakeholders: employees, customers, shareholders, suppliers and the communities we decided to modify such Business Principles in order to gather in them all componentswork in. Issues covered, amongst other, are professional development, health and safety, communications and advertising, corporate governance, risk management, conflicts of the code of ethics definition in Section 406 of Sarbanes-Oxley Act, and consequently our code of ethics for senior officers was replaced by the Telefónica Business Principles. These Principles were further modified on October 8, 2010 in order to include a new principle ofinterest, environmental protection, privacy and data protection. A copy of theprotection, etc.
The Telefónica Business Principles is filedare available and open to consultation for employees on the Telefónica Intranet site as an Exhibit to this Annual Report.well as for the general public on the Telefónica external website (www.telefonica.com/en/about_telefonica/html/strategy/principactua.shtml). For more information, please see “Item 16G. Corporate Governance—Governance - Code of Ethics.”
No amendments were made to the Telefónica Business Principles in 2014, nor were there any waivers granted.
Please see Note 21(d) to our Consolidated Financial Statements.
The Audit and Control Committee’s Pre-Approval Policies and Procedures
The engagement of any service rendered by our external auditor or any of its affiliates must always have the prior approval of our Audit and Control Committee. Such Committee has developed a Pre-approval Policy regarding the engagement of professional services by our external auditor, in accordance with the Spanish Audit Law and the Sarbanes-Oxley Act. This Policy establishes the obligation to obtain prior approval from our Audit and Control Committee for any service to be rendered by our external auditor to Telefónica or any of its subsidiaries.
This Policy sets forth restrictions on engaging our external auditor for the performance of non-audit services, according to which the engagement of our external auditor for the provision of such services is only permitted when there is no other firm available to provide the needed services at a comparable cost and with a similar level of quality. Moreover, this Policy prohibits the engagement of our external auditor for the provision of certain type of services that would be considered as “prohibited services.”
In addition, the Audit and Control Committee oversees the total amount of fees paid to our external auditor for the provision of non-audit services in order to assure that such fees do not exceed a certain percentage of the total amount of fees paid for the provision of audit services.
Not applicable.
The number of shares of treasury stock at December 31, 20112014, amounted to 84,209,364 (55,204,942128,227,971 (29,411,832 at December 31, 2010)2013). These treasury shares are directly owned by Telefónica, S.A., except for one share held by Telefónica Móviles Argentina, S.A.
Year ended December 31, 2011 | |||||||||||||
Period of Fiscal Year | Total Number of Shares Purchased | Average Price Paid per Share (euro) | Total Number of Shares (or Units) Purchased as Part of Publicly Announced Plans or Programs(1) | ||||||||||
January 1 to January 31 | 750,000 | 16.80 | 219,776 | ||||||||||
February 1 to February 28 | — | — | — | ||||||||||
March 1 to March 31 | 2,250,000 | 17.56 | 399,572 | ||||||||||
April 1 to April 30 | 3,027,577 | 17.90 | 194,977 | ||||||||||
May 1 to May 31 | 1,800,000 | 16.86 | 207,957 | ||||||||||
June 1 to June 30 | 6,167,704 | 14.75 | 1,685,009 | ||||||||||
July 1 to July 31 | 5,988,123 | 14.84 | 1,201,509 | ||||||||||
August 1 to August 31 | 13,407,065 | 14.00 | 254,376 | ||||||||||
September 1 to September 30 | 4,090,530 | 13.67 | — | ||||||||||
October 1 to October 31 | 6,010,626 | 15.23 | — | ||||||||||
November 1 to November 30 | 7,488,327 | 14.98 | — | ||||||||||
December 1 to December 31 | 5,000,000 | 13.45 | — | ||||||||||
Total | 55,979,952 | 14.85 | 4,163,176 | ||||||||||
| Year ended December 31, 2014 | |||||
| Period of Fiscal Year | Total Number of Shares Purchased | Average Price Paid per Share (euro) | Total Number of Shares (or Units) Purchased as Part of Publicly Announced Plans or Programs(1) | ||
| January 1 to January 31 | 10,914,199 | 11.88 | 0 | ||
| February 1 to February 28 | 14,402,765 | 11.23 | 0 | ||
| March 1 to March 31 | 15,056,983 | 11.15 | 0 | ||
| April 1 to April 30 | 5,304,169 | 11.66 | 125,080 | ||
| May 1 to May 31 | 6,097,563 | 12.01 | 0 | ||
| June 1 to June 30 | 3,150,000 | 12.33 | 0 | ||
| July 1 to July 31 | 7,250,000 | 12.25 | 4,097 | ||
| August 1 to August 31 | 9,147,736 | 11.86 | 0 | ||
| September 1 to September 30 | 6,800,000 | 11.61 | 0 | ||
| October 1 to October 31 | 5,950,000 | 11.38 | 0 | ||
| November 1 to November 30 | 2,800,000 | 11.97 | 0 | ||
| December 1 to December 31 | 13,850,000 | 11.93 | 0 | ||
| Total | 100,723,415 | 11.67 | 129,177 |
| (1) |
For a more detailed description of our plans or programs, see “Item 8. Financial Information—Dividend Information and Shareholders’ Return”, “Item 11. Quantitative and Qualitative Disclosures About Market Risk—Share Price Risk.” and “Item 6. Directors, Senior Management and Employees—Incentive Plans.”Note 19 to our Consolidated Financial Statements.
During the years ended December 31, 20102013 and 20112014 and through the date of this Annual Report, the principal independent accountant engaged to audit our financial statements, Ernst & Young, S.L., has not resigned, indicated that it has declined to stand for re-election after the completion of its current audit or been dismissed. For each of the years ended December 31, 20102013 and 2011,2014, Ernst & Young, S.L. has not expressed reliance on another accountant or accounting firm in its report on our audited annual accounts for such periods.
Significant Differences in Corporate Governance Practices
Corporate governance guidelines
In Spain, companies with securities listed on a Spanish stock exchangeStock Exchange are expected to follow the ContheSpanish Corporate Governance Code published in May 2006,by the CNMV, which contains corporate governance and shareholder disclosure recommendations. It combines and substitutes the former Spanish Corporate Governance Codes: the Olivencia Code of Good Governance and the Aldama Report. Spanish listed companies are required by law to publish an Annual Report on Corporate Governance and alsoa Report on the Compensation Policy of the Board of Directors. Additionally, Spanish listed companies are required to publish their corporate governance information on their websites. We base our corporate governance procedures on the recommendations of the Conthe Code. As part of our corporate governance procedures, we have adopted regulations for our Board of Directors that govern, among other things, director qualification standards, responsibilities, compensation, access to management information, the Board of Directors’ purpose and each of our Board Committee’s purpose and responsibilities. Moreover, we have a Regulation of the General Shareholders’ Meeting that aims to reinforce its transparency, providing shareholders with a framework guaranteeing and facilitating exercise of their rights. The Annual Report on Corporate Governance published by us provides a detailed explanation of our corporate governance procedures and explains the role and duties of our Board of Directors and Board Committees. Our Annual Report on Corporate Governance isand the Report on the Compensation Policy of the Board of Directors of Telefónica, S.A. are available on our website at www.telefonica.com. None of the information contained on our website is incorporated in this Annual Report.
Committees
We have had an Audit and Control Committee since 1997. Our Audit and Control Committee is composed of threefive non-executive directors, all of whom are deemed Rule 10A-3 independent by our Board of Directors. The functions, composition and competencies of this Committee are regulated by the Board of Directors’ Regulations and are similar to those required by the New York Stock Exchange. The Audit and Control Committee shall consist of not less than three nor more than five directors appointed by our Board of Directors. All Committee members shall be external directors. When appointing such members, our Board of Directors shall take into account the appointees’ knowledge and experience in matters of accounting, auditing and risk management.
We have had a Nominating, Compensation and Corporate Governance Committee since 1997, which is composed of five external directors. The functions, composition and competencies of this Committee are regulated by the Board of Directors’ Regulations and are very similar to those required by the NYSE. The Nominating, Compensation and Corporate Governance Committee shall consist of not less than three nor more than five directors appointed by the Board of Directors. All members of the Committee must be external directors and the majority thereof must be independent. The Chairmanchairman of the Nominating, Compensation and Corporate Governance Committee, who shall in all events be an independent director, shall be appointed from among its members.
Additionally we have a Human Resources and Corporate Reputation and Responsibility Committee, a Regulation Committee, a Service Quality and Customer Service Committee, an InternationalInstitutional Affairs Committee, an Innovation Committee and a Strategy Committee. The functions, composition and competencies are regulated by the Board of Directors’ Regulations.
Independence of the Board
As of the date of this Annual Report, we have 18 directors, out of which eight have been deemed independent by our Board of Directors attending to the director’s classification contained in the Conthe Corporate Governance Code. A significant majority of our current directors, 15, are non-executive directors. We, in accordance with the Conthe Code, assess the independence of our directors. Among other things, independent directors: (i) shall not be, past employees or executive directors of any of the Group companies, unless three or five years have elapsed,, respectively, (ii) shall not receive any payment or other form of compensation from us or our group on top of their directors’ fees, unless the amount involved is not significant, (iii) shall not be partners, now or on the past three years, in the external auditor or in the firm responsible for the audit report, (iv) shall not be executive directors or senior officers of another company where one of our executive directors or senior officers is an external director, (v) shall not have material business dealings with us or any other company in our group, (vi) shall not be spouses, nor partners maintaining an analogous affective relationship, nor close relative of any of our executive directors or senior officers and (vii) shall not stand in any of the situations listed in (i), (v) or (vi) above in relation to a significant shareholder or a shareholder with board representation.
The classification of each director shall be explained by the Board of Directors to the shareholders at the general shareholders’ meetingGeneral Shareholders’ Meeting at which the appointment thereof must be made or ratified. Furthermore, such classification shall be reviewed annually by our Board of Directors after verification by the Nominating, Compensation and Corporate Governance Committee, and reported in the Annual Corporate Governance Report.
Internal Audit Function
We have an Internal Audit Department responsible for internal audit matters and for ensuring the efficiency of the internal audit control process of our different units. This Internal Audit Department reports directly to the Audit and Control Committee, thus supporting the adequate performance of all its functions.
Non-Executive Director Meetings
Pursuant to the NYSE listing standards, non-executive directors of U.S.-listed companies must meet on a regular basis without management present and the company must disclose a method for any interested parties to communicate directly with the non-executive directors. As a group, our non-executive directors do not meet formally without management present. Nevertheless, every committeeeach of the Board of DirectorsAudit and Control Committee, the Nominating, Compensation and Corporate Governance Committee, the Institutional Affairs Committee, and the Innovation Committee is composed exclusively of non-executive directors, (other than the Innovation Committee, which includes Julio Linares, one of our executive directors), thus giving each of these committees, the chance to analyze and discuss any matter related to our management, within its respective area of responsibility.
In addition, since May 2013, we have a lead independent director who acts as “Coordinating Independent Director”, who our By-laws grant the right to have a say on key elements of governance structure that most companies in Spain and around the world, reserve to the Board of Directors.
According to our By-laws (Art. 32) the independent director who acts as “Coordinating Independent Director”, will:
| a) | Coordinate the work of the External Directors and echo the concerns of such Directors. |
| b) | Request the Chairman of the Board of Directors to call a meeting of the Board when appropriate in accordance with the rules of corporate governance. |
| c) | Request the inclusion of certain matters in the agenda of the meetings of the Board of Directors. |
| d) | Oversee the evaluation by the Board of Directors of the Chairman thereof. |
Whistleblowing
We have procedures in place that allow any employee to anonymously and confidentially report instances of fraud, alterations of financial information or specific risks to Telefónica and its subsidiaries.
Code of Ethics
The NYSE listing standards require U.S. companies to adopt a code of business conduct and ethics for directors, officers and employees, and promptly disclose any waivers of the code for directors or executive officers. In 2004 we adopted, as required by the Sarbanes-Oxley Act, a code of ethics that applied to our principal executive officer, principal financial officer and to our senior financial officers. In December 2006, we adopted a code of business conduct and ethics, the “Telefónica Business Principles,” which apply to all Telefónica Group employees. OnIn March 2008, we decided to modify such Business Principles in order to incorporate within them all components of the code of ethics definition in Section 406 of Sarbanes Oxley Act, and consequently our code of ethics for senior officers was replaced by such Business Principles. These Principles were further modified on October 8, 2010 in order to include a new principle of privacy and data protection.
We also have an Internal Code of Conduct for securities markets issues to prevent insider trading misconduct and to control possible conflicts of interest. In addition, the Regulations of the Board of Directors set out in detail our directors’ main obligations relating to conflicts of interest concerning business opportunities, misappropriation of our assets, confidentiality and non-competition.
We have responded to Item 18 in lieu of responding to this Item.
Please see pages F-1.1F-4 through F-162.F-157.
Exhibit Number | Description | |
| 1.1 | Amended and Restated bylaws (English translation) | |
| 4.1 | Shareholders’ Agreement dated as of April 28, 2007 among Telefónica S.A., Assicurazioni Generali S.p.A., Sintonia S.A., Intesa Sanpaolo S.p.A., Mediobanca S.p.A.* | |
| 4.2 | Co-investment Agreement dated as of April 28, 2007 among Telefónica S.A., Assicurazioni Generali S.p.A., Sintonia S.A., Intesa Sanpaolo S.p.A., Mediobanca S.p.A.* | |
| 4.3 | Call Option Agreement, dated November 6, 2007, between Telefónica, S.A. and Telco** | |
| 4.4 | Amendment to the Shareholders’ Agreement and Bylaws, dated November 19, 2007 among Telefónica S.A., Generali, Sintonia S.A., Intesa Sanpaolo S.p.A. and Mediobanca S.p.A.** | |
| 4.5 | Renewal Agreement, dated October 28, 2009, by and among Telefónica S.A., Assicurazioni Generali S.p.A. (on its own behalf and on behalf of its subsidiaries Generali Vie S.A., Alleanza Toro S.p.A., INA Assitalia S.p.A., Generali Lebensversicherung A.G.), Intesa Sanpaolo S.p.A. and Mediobanca S.p.A. | |
| 4.6 | Amendment Deed to the Call Option, dated October 28, 2009, by and between Telefónica S.A. and Telco S.p.A. | |
| 4.7 | Subscription Agreement, dated September 6, 2009 between Telefónica, S.A. and China Unicom (Hong Kong) Limited**** | |
| 4.8 | Enhanced Strategic Alliance Agreement dated January 23, 2011 between Telefónica, S.A. and China Unicom (Hong Kong) | |
| 4.9 | Amendment | |
| 4.10 | Second Renewal Agreement, dated February 29, 2012, by and among Telefónica S.A., Assicurazioni Generali S.p.A. (on its own behalf and on behalf of its subsidiaries Generali Vie S.A., Alleanza Toro S.p.A., INA Assitalia S.p.A. and Generali Lebensversicherung AG), Intesa Sanpaolo S.p.A. and Mediobanca S.p.A. | |
| 4.11 | Amendment Deed to Call Option Agreement, dated February 29, 2012, between Telefónica and | |
| Share Purchase Agreement for the Sale and Purchase of Shares in China Unicom (Hong Kong) Limited, dated June 10, 2012 and Supplemental Agreement, dated July 21, 2012, between Telefónica, Internacional S.A.U. and a 100% owned subsidiary of China United Network Communications Group Company Limited******** | ||
| 4.13 | Agreement for the Sale and Purchase of Customer Relationship Management business, Atento, dated October 11, 2012******** | |
| 4.14 | Share Purchase Agreement entered into between Koninkijke KPN N.V., Telefónica S.A. and Telefonica Deutschland Holding AG, dated July 23, 2013 (1)********* | |
| 4.15 | First Amendment Agreement to the Share Purchase Agreement entered into between Koninkijke KPN N.V., Telefónica S.A. and Telefonica Deutchsland Holding AG, dated July 23, 2013, dated August 26, 2013.********* | |
| 4.16 | Stock Purchase Agreement and Other Covenants, dated September 18, 2014, by and among Virendi, S.A., Société d’Investissements et de Gestion 72 S.A. and Société d’Investissements et de Gestion 108 SAS, as the sellers, Telefónica Brasil S.A., as purchaser, GVT Participações S.A., as target, Global Village Telecom S.A. and Telefónica, S.A.(1) | |
| 4.17 | Long Term Incentive Plan Terms | |
| 8.1 | Subsidiaries of Telefónica (see Note 1 to the Consolidated Financial Statements and Appendix | |
| 12.1 | Certification of César Alierta Izuel, Chief Executive Officer of Telefónica, pursuant to Section 302 of the Sarbanes-Oxley Act of 2002 | |
| 12.2 | Certification of Miguel Escrig Meliá, Chief Financial Officer of Telefónica, pursuant to Section 302 of the Sarbanes-Oxley Act of 2002 | |
| 13.1 | Certification pursuant to 18 U.S.C. Section 1350, as adopted pursuant to Section 906 of the Sarbanes-Oxley Act of 2002 | |
| 15.1 | Consent of Independent Registered Public Accounting Firm |
| * | Incorporated by reference to Telefónica’s |
| Incorporated by reference to Telefónica’s Schedule 13D/A filed on November 26, 2007. |
| *** | Incorporated by reference to Telefónica’s Schedule 13D/A filed on November 23, 2009. |
| **** | Incorporated by reference to Telefónica’s Schedule 13D/A filed on September 17, 2009. |
| ***** | Incorporated by reference to Telefónica’s Schedule 13D filed on February 8, 2011. |
| ****** | Incorporated by reference to Telefónica’s Schedule 13 D/A filed on March 12, 2012. |
| ******* | Incorporated by reference to Telefónica’s Schedule 13 D/A filed on June 13, 2012 and Schedule 13 D/A filed on August 1, 2012, respectively. |
| ******** | Incorporatedby reference to Telefónica’s Annual Report on Form 20-F for the fiscal year ended December 31, 2012. |
| ********* | Incorporated by reference to Telefónica’s Annual Report on Form 20-F for the fiscal year ended December 31, |
| (1) | Confidential treatment has been requested with respect to |
We agree to furnish to the SEC upon request, copies of the instruments defining the rights of the holders of our long-term debt and of our subsidiaries’ long-term debt.
SIGNATURES
The registrant hereby certifies that it meets all of the requirements for filing on Form 20-F and has duly caused and authorized the undersigned to sign this Annual Report on its behalf.
| TELEFÓNICA, S.A. | ||||
| By: | /s/ César Alierta Izuel | |||
| Name: | César Alierta Izuel | |||
| Title: | Chief Executive Officer | |||
| TELEFÓNICA, S.A. | ||||
| By: | /s/ Miguel Escrig Meliá | |||
| Name: | Miguel Escrig Meliá | |||
| Title: | Chief Financial Officer | |||
Date: March 29, 2012
February 27, 2015
Telefónica, S.A. and subsidiaries composing the Telefónica Group.
REPORT OF INDEPENDENT REGISTERED PUBLIC ACCOUNTING FIRM
The Board of Directors and Shareholders of
Telefónica, S.A.
We have audited Telefónica, S.A.’s internal control over financial reporting as of December 31, 2011,2014, based on criteria established in Internal Control—Integrated Framework issued by the Committee of Sponsoring Organizations of the Treadway Commission (2013 framework) (the COSO criteria). Telefónica, S.A.’s management is responsible for maintaining effective internal control over financial reporting, and for its assessment of the effectiveness of internal control over financial reporting included in the accompanying Annual Report on Internal Control over Financial Reporting. Our responsibility is to express an opinion on Telefónica, S.A.’s internal control over financial reporting based on our audit.
We conducted our audit in accordance with the standards of the Public Company Accounting Oversight Board (United States). Those standards require that we plan and perform the audit to obtain reasonable assurance about whether effective internal control over financial reporting was maintained in all material respects. Our audit included obtaining an understanding of internal control over financial reporting, assessing the risk that a material weakness exists, testing and evaluating the design and operating effectiveness of internal control based on the assessed risk, and performing such other procedures as we considered necessary in the circumstances. We believe that our audit provides a reasonable basis for our opinion.
A company’s internal control over financial reporting is a process designed to provide reasonable assurance regarding the reliability of financial reporting and the preparation of financial statements for external purposes in accordance with generally accepted accounting principles. A company’s internal control over financial reporting includes those policies and procedures that (1) pertain to the maintenance of records that, in reasonable detail, accurately and fairly reflect the transactions and dispositions of the assets of the company; (2) provide reasonable assurance that transactions are recorded as necessary to permit preparation of financial statements in accordance with generally accepted accounting principles, and that receipts and expenditures of the company are being made only in accordance with authorizations of management and directors of the company; and (3) provide reasonable assurance regarding prevention or timely detection of unauthorized acquisition, use, or disposition of the company’s assets that could have a material effect on the financial statements.
Because of its inherent limitations, internal control over financial reporting may not prevent or detect misstatements. Also, projections of any evaluation of effectiveness to future periods are subject to the risk that controls may become inadequate because of changes in conditions, or that the degree of compliance with the policies or procedures may deteriorate.
In our opinion, Telefónica, S.A. maintained, in all material respects, effective internal control over financial reporting as of December 31, 2011,2014, based on the COSO criteria.
We also have audited, in accordance with the standards of the Public Company Accounting Oversight Board (United States), the consolidated statements of financial position of Telefónica, S.A. and subsidiaries as of December 31, 20112014 and 2010,2013, and the related consolidated statements of income, comprehensive income, changes in equity, and cash flows for each of the three years in the period ended December 31, 20112014 and our report dated March 28, 2012February 27, 2015 expressed an unqualified opinion thereon.
ERNST & YOUNG, S.L.
| /s/ Ignacio Viota del Corte Ignacio Viota del Corte | |
Madrid, Spain
REPORT OF INDEPENDENT REGISTERED PUBLIC ACCOUNTING FIRM
The Board of Directors and Shareholders of
Telefónica, S.A.
We have audited the accompanying consolidated statements of financial position of Telefónica, S.A. and subsidiaries as of December 31, 20112014 and 2010,2013, and the related consolidated statements of income, comprehensive income, changes in equity, and cash flows for each of the three years in the period ended December 31, 2011.2014. These consolidated financial statements are the responsibility of Telefónica, S.A.’s Directors. Our responsibility is to express an opinion on these financial statements based on our audits.
We conducted our audits in accordance with the standards of the Public Company Accounting Oversight Board (United States). Those standards require that we plan and perform the audit to obtain reasonable assurance about whether the financial statements are free of material misstatement. An audit includes examining, on a test basis, evidence supporting the amounts and disclosures in the financial statements. An audit also includes assessing the accounting principles used and significant estimates made by management, as well as evaluating the overall financial statement presentation. We believe that our audits provide a reasonable basis for our opinion.
In our opinion, the financial statements referred to above present fairly, in all material respects, the consolidated financial position of Telefónica, S.A. and subsidiaries as of December 31, 20112014 and 2010,2013, and the consolidated results of their operations and their cash flows for each of the three years in the period ended December 31, 2011,2014, in conformity with International Financial Reporting Standards as issued by the International Accounting Standards Board.
We also have audited, in accordance with the standards of the Public Company Accounting Oversight Board (United States), Telefónica S.A.’s internal control over financial reporting as of December 31, 2011,2014, based on criteria established in Internal Control-Integrated Framework issued by the Committee of Sponsoring Organizations of the Treadway Commission (2013 framework) and our report dated March 28, 2012February 27, 2015 expressed an unqualified opinion thereon.
ERNST & YOUNG, S.L.
| /s/ Ignacio Viota del Corte Ignacio Viota del Corte | |
Madrid, Spain
| ASSETS | NOTE | 2011 | 2010 | ||||||
| A) NON-CURRENT ASSETS | 108,800 | 108,721 | |||||||
| Intangible assets | (Note 6) | 24,064 | 25,026 | ||||||
| Goodwill | (Note 7) | 29,107 | 29,582 | ||||||
| Property, plant and equipment | (Note 8) | 35,463 | 35,797 | ||||||
| Investment properties | 6 | 5 | |||||||
| Investments in associates | (Note 9) | 5,065 | 5,212 | ||||||
| Non-current financial assets | (Note 13) | 8,678 | 7,406 | ||||||
| Deferred tax assets | (Note 17) | 6,417 | 5,693 | ||||||
| B) CURRENT ASSETS | 20,823 | 21,054 | |||||||
| Inventories | 1,164 | 1,028 | |||||||
| Trade and other receivables | (Note 11) | 11,331 | 12,426 | ||||||
| Current financial assets | (Note 13) | 2,625 | 1,574 | ||||||
| Tax receivables | (Note 17) | 1,567 | 1,331 | ||||||
| Cash and cash equivalents | (Note 13) | 4,135 | 4,220 | ||||||
| Non-current assets held for sale | 1 | 475 | |||||||
| TOTAL ASSETS (A+B) | 129,623 | 129,775 | |||||||
| EQUITY AND LIABILITIES | NOTE | 2011 | 2010 | ||||||
| A) EQUITY | 27,383 | 31,684 | |||||||
| Equity attributable to equity holders of the parent | 21,636 | 24,452 | |||||||
| Non-controlling interests | (Note 12) | 5,747 | 7,232 | ||||||
| B) NON-CURRENT LIABILITIES | 69,662 | 64,599 | |||||||
| Non-current interest-bearing debt | (Note 13) | 55,659 | 51,356 | ||||||
| Non-current trade and other payables | (Note 14) | 2,092 | 2,304 | ||||||
| Deferred tax liabilities | (Note 17) | 4,739 | 6,074 | ||||||
| Non-current provisions | (Note 15) | 7,172 | 4,865 | ||||||
| C) CURRENT LIABILITIES | 32,578 | 33,492 | |||||||
| Current interest-bearing debt | (Note 13) | 10,652 | 9,744 | ||||||
| Current trade and other payables | (Note 14) | 17,855 | 19,251 | ||||||
| Current tax payables | (Note 17) | 2,568 | 2,822 | ||||||
| Current provisions | (Note 15) | 1,503 | 1,675 | ||||||
| TOTAL EQUITY AND LIABILITIES (A+B+C) | 129,623 | 129,775 | |||||||
| INCOME STATEMENT | NOTE | 2011 | 2010 | 2009 | |||||||||
| Revenues | (Note 19) | 62,837 | 60,737 | 56,731 | |||||||||
| Other income | (Note 19) | 2,107 | 5,869 | 1,645 | |||||||||
| Supplies | (18,256 | ) | (17,606 | ) | (16,717 | ) | |||||||
| Personnel expenses | (11,080 | ) | (8,409 | ) | (6,775 | ) | |||||||
| Other expenses | (Note 19) | (15,398 | ) | (14,814 | ) | (12,281 | ) | ||||||
| Depreciation and amortization | (Note 19) | (10,146 | ) | (9,303 | ) | (8,956 | ) | ||||||
| OPERATING INCOME | 10,064 | 16,474 | 13,647 | ||||||||||
| Share of (loss) profit of associates | (Note 9) | (635 | ) | 76 | 47 | ||||||||
| Finance income | 827 | 792 | 814 | ||||||||||
| Exchange gains | 2,795 | 3,508 | 3,085 | ||||||||||
| Finance costs | (3,609 | ) | (3,329 | ) | (3,581 | ) | |||||||
| Exchange losses | (2,954 | ) | (3,620 | ) | (3,625 | ) | |||||||
| Net financial expense | (Note 16) | (2,941 | ) | (2,649 | ) | (3,307 | ) | ||||||
| PROFIT BEFORE TAX FROM CONTINUING OPERATIONS | 6,488 | 13,901 | 10,387 | ||||||||||
| Corporate income tax | (Note 17) | (301 | ) | (3,829 | ) | (2,450 | ) | ||||||
| PROFIT FOR THE YEAR FROM CONTINUING OPERATIONS | 6,187 | 10,072 | 7,937 | ||||||||||
| Profit after taxes from discontinued operations | (Note 18) | - | - | - | |||||||||
| PROFIT FOR THE YEAR | 6,187 | 10,072 | 7,937 | ||||||||||
| Non-controlling interests | (Note 12) | (784 | ) | 95 | (161 | ) | |||||||
| PROFIT FOR THE YEAR ATTRIBUTABLE TO EQUITY HOLDERS OF THE PARENT | 5,403 | 10,167 | 7,776 | ||||||||||
| Basic and diluted earnings per share from continuing operations attributable to equity holders of the parent (euros) | (Note 19) | 1.20 | 2.25 | 1.71 | |||||||||
| Basic and diluted earnings per share attributable to equity holders of the parent (euros) | (Note 19) | 1.20 | 2.25 | 1.71 | |||||||||
| Consolidated Statements of financial position | |||
| Millions of euros | NOTE | 2014 | 2013 |
| ASSETS | |||
| A) NON-CURRENT ASSETS | 99,435 | 89,597 | |
| Intangible assets | (Note 6) | 22,353 | 18,548 |
| Goodwill | (Note 7) | 25,111 | 23,434 |
| Property, plant and equipment | (Note 8) | 33,343 | 31,040 |
| Investments accounted for by the equity method | (Note 9) | 788 | 2,424 |
| Non-current financial assets | (Note 13) | 10,973 | 7,775 |
| Deferred tax assets | (Note 17) | 6,867 | 6,376 |
| B) CURRENT ASSETS | 22,864 | 29,265 | |
| Inventories | 934 | 985 | |
| Trade and other receivables | (Note 11) | 10,606 | 9,640 |
| Tax receivables | (Note 17) | 1,749 | 1,664 |
| Current financial assets | (Note 13) | 2,932 | 2,117 |
| Cash and cash equivalents | (Note 13) | 6,529 | 9,977 |
| Non-current assets held for sale | (Note 2) | 114 | 4,882 |
| TOTAL ASSETS (A+B) | 122,299 | 118,862 | |
| NOTE | 2014 | 2013 | |
| EQUITY AND LIABILITIES | |||
| A) EQUITY | 30,289 | 27,482 | |
| Equity attributable to equity holders of the parent and other holders of equity instruments | (Note 12) | 21,115 | 21,185 |
| Equity attributable to non-controlling interests | (Note 12) | 9,174 | 6,297 |
| B) NON-CURRENT LIABILITIES | 62,311 | 62,236 | |
| Non-current interest-bearing debt | (Note 13) | 50,688 | 51,172 |
| Non-current trade and other payables | (Note 14) | 2,377 | 1,701 |
| Deferred tax liabilities | (Note 17) | 2,566 | 3,063 |
| Non-current provisions | (Note 15) | 6,680 | 6,300 |
| C) CURRENT LIABILITIES | 29,699 | 29,144 | |
| Current interest-bearing debt | (Note 13) | 9,094 | 9,527 |
| Current trade and other payables | (Note 14) | 16,943 | 15,221 |
| Current tax payables | (Note 17) | 2,026 | 2,203 |
| Current provisions | (Note 15) | 1,595 | 1,271 |
| Liabilities associated with non-current assets held for sale | (Note 2) | 41 | 922 |
| TOTAL EQUITY AND LIABILITIES (A+B+C) | 122,299 | 118,862 | |
| The accompanying Notes 1 to 23 and Appendices I to VII are an integral part of these consolidated statements of financial position. | |||
| Consolidated income statements | ||||
| Millions of euros | NOTES | 2014 | 2013 | 2012 |
| INCOME STATEMENTS | ||||
| Revenues | (Note 18) | 50,377 | 57,061 | 62,356 |
| Other income | (Note 18) | 1,707 | 1,693 | 2,323 |
| Supplies | (15,182) | (17,041) | (18,074) | |
| Personnel expenses | (7,098) | (7,208) | (8,569) | |
| Other expenses | (Note 18) | (14,289) | (15,428) | (16,805) |
| Depreciation and amortization | (Note 18) | (8,548) | (9,627) | (10,433) |
| OPERATING INCOME | 6,967 | 9,450 | 10,798 | |
| Share of loss of investments accounted for by the equity method | (Note 9) | (510) | (304) | (1,275) |
| Finance income | 992 | 933 | 963 | |
| Exchange gains | 4,110 | 3,323 | 2,382 | |
| Finance costs | (3,511) | (3,629) | (4,025) | |
| Exchange losses | (4,413) | (3,493) | (2,979) | |
| Net financial expense | (Note 16) | (2,822) | (2,866) | (3,659) |
| PROFIT BEFORE TAX | 3,635 | 6,280 | 5,864 | |
| Corporate income tax | (Note 17) | (383) | (1,311) | (1,461) |
| PROFIT FOR THE YEAR | 3,252 | 4,969 | 4,403 | |
| Non-controlling interests | (Note 12) | (251) | (376) | (475) |
| PROFIT FOR THE YEAR ATTRIBUTABLE TO EQUITY HOLDERS OF THE PARENT | 3,001 | 4,593 | 3,928 | |
| Basic and diluted earnings per share attributable to equity holders of the parent (euros) | (Note 18) | 0.61 | 0.99 | 0.85 |
| The accompanying Notes 1 to 23 and Appendices I to VII are an integral part of these consolidated income statements. | ||||
| CONSOLIDATED STATEMENT OF COMPREHENSIVE INCOME | Year ended December 31 | |||||||||||
| (MILLIONS OF EUROS) | 2011 | 2010 | 2009 | |||||||||
| Profit for the year | 6,187 | 10,072 | 7,937 | |||||||||
| Other comprehensive income (loss) | ||||||||||||
| (Losses) gains on measurement of available-for-sale investments | (13 | ) | (61 | ) | 638 | |||||||
| Reclassification of losses (gains) included in the income statement | 3 | 202 | (4 | ) | ||||||||
| Income tax impact | 3 | (57 | ) | (105 | ) | |||||||
| (7 | ) | 84 | 529 | |||||||||
| Losses on hedges | (921 | ) | (291 | ) | (794 | ) | ||||||
| Reclassification of losses (gains) included in the income statement | 210 | 73 | (77 | ) | ||||||||
| Income tax impact | 217 | 62 | 262 | |||||||||
| (494 | ) | (156 | ) | (609 | ) | |||||||
| Translation differences | (1,265 | ) | 820 | 1,982 | ||||||||
| Actuarial gains (losses) and impact of limit on assets for defined benefit pension plans (Note 15) | (85 | ) | (94 | ) | (189 | ) | ||||||
| Income tax impact | 28 | 35 | 53 | |||||||||
| (57 | ) | (59 | ) | (136 | ) | |||||||
| Share of income (loss) recognized directly in equity of associates and others | 58 | (84 | ) | 233 | ||||||||
| Reclassification of (gains) losses included in the income statement | - | - | - | |||||||||
| Income tax impact | (9 | ) | 23 | 2 | ||||||||
| 49 | (61 | ) | 235 | |||||||||
| Total other comprehensive income (loss) | (1,774 | ) | 628 | 2,001 | ||||||||
| Total comprehensive income recognized in the year | 4,413 | 10,700 | 9,938 | |||||||||
| Attributable to: | ||||||||||||
| Equity holders of the parent | 4,002 | 10,409 | 9,418 | |||||||||
| Non-controlling interests | 411 | 291 | 520 | |||||||||
| 4,413 | 10,700 | 9,938 | ||||||||||
F-5
| Consolidated statements of comprehensive income | 2014 | 2013 | 2012 |
| Millions of euros | |||
| Profit for the year | 3,252 | 4,969 | 4,403 |
| Other comprehensive income (loss) | |||
| (Losses) gains on measurement of available-for-sale investments | (45) | 32 | (49) |
| Income tax impact | 7 | (10) | 4 |
| Reclassification of losses included in the income statement | − | 51 | 46 |
| Income tax impact | − | (15) | (3) |
| (38) | 58 | (2) | |
| (Losses) gains on hedges | (507) | 831 | (1,414) |
| Income tax impact | 127 | (247) | 376 |
| Reclassification of losses included in the income statement (Note 16) | 163 | 121 | 173 |
| Income tax impact | (49) | (36) | (5) |
| (266) | 669 | (870) | |
| Share of losses recognized directly in equity of associates and others | (27) | (29) | (27) |
| Income tax impact | 3 | 4 | 9 |
| Reclassification of losses included in the income statement | 103 | 1 | 4 |
| Income tax impact | (24) | − | − |
| 55 | (24) | (14) | |
| Translation differences | (2,810) | (6,454) | (1,862) |
| Total other comprehensive loss recognized in the period (Items that may be reclassified subsequently to profit or loss) | (3,059) | (5,751) | (2,748) |
| Actuarial losses and impact of limit on assets for defined benefit pension plans | (173) | (49) | (154) |
| Income tax impact | 38 | 1 | 39 |
| (135) | (48) | (115) | |
| Total other comprehensive loss recognized in the period (Items that will not be reclassified subsequently to profit or loss) | (135) | (48) | (115) |
| Total comprehensive income (loss) recognized in the year | 58 | (830) | 1,540 |
| Attributable to: | |||
| Equity holders of the parent and other holders of equity instruments | (258) | (434) | 1,652 |
| Non-controlling interests | 316 | (396) | (112) |
| 58 | (830) | 1,540 | |
| The accompanying Notes 1 to 23 and Appendices I to VII are an integral part of these consolidated statements of comprehensive income. | |||
| CONSOLIDATED STATEMENTS OF CHANGES IN EQUITY | Attributable to equity holders of the parent and other holders of equity instruments | Non-controlling interests (Note 12) | Total equity | |||||||||||||||||||||||
| Millions of euros | Share capital | Share premium | Treasury Shares | Other equity instruments | Legal reserve | Retained earnings | Available-for-sale investments | Hedges | Equity of associates and others | Translation differences | Total | |||||||||||||||
| Financial position at December 31, 2013 | 4,551 | 460 | (544) | 2,466 | 984 | 22,517 | 94 | (37) | (31) | (9,275) | 21,185 | 6,297 | 27,482 | |||||||||||||
| Profit for the year | − | − | − | − | − | 3,001 | − | − | − | − | 3,001 | 251 | 3,252 | |||||||||||||
| Other comprehensive loss | − | − | − | − | − | (121) | (39) | (297) | 55 | (2,857) | (3,259) | 65 | (3,194) | |||||||||||||
| Total comprehensive income | − | − | − | − | − | 2,880 | (39) | (297) | 55 | (2,857) | (258) | 316 | 58 | |||||||||||||
| Dividends distribution (Note 12) | 106 | − | − | − | − | (2,138) | − | − | − | − | (2,032) | (406) | (2,438) | |||||||||||||
Net movement in treasury shares | − | − | (1,042) | − | − | (113) | − | − | − | − | (1,155) | − | (1,155) | |||||||||||||
| Acquisitions and disposals of non-controlling interests and business combinations (Note 5) | − | − | − | − | − | (307) | − | − | − | − | (307) | 2,965 | 2,658 | |||||||||||||
| Undated Deeply Subordinated Securities and notes mandatorily convertible (Note 12) | − | − | − | 3,885 | − | (129) | − | − | − | − | 3,756 | − | 3,756 | |||||||||||||
| Other movements | − | − | − | − | − | (74) | − | − | − | − | (74) | 2 | (72) | |||||||||||||
| Financial position at December 31, 2014 | 4,657 | 460 | (1,586) | 6,351 | 984 | 22,636 | 55 | (334) | 24 | (12,132) | 21,115 | 9,174 | 30,289 | |||||||||||||
| Financial position at December 31, 2012 | 4,551 | 460 | (788) | − | 984 | 19,569 | 36 | (715) | (7) | (3,629) | 20,461 | 7,200 | 27,661 | |||||||||||||
| Profit for the year | − | − | − | − | − | 4,593 | − | − | − | − | 4,593 | 376 | 4,969 | |||||||||||||
| Other comprehensive loss | − | − | − | − | − | (48) | 58 | 678 | (24) | (5,691) | (5,027) | (772) | (5,799) | |||||||||||||
| Total comprehensive loss | − | − | − | − | − | 4,545 | 58 | 678 | (24) | (5,691) | (434) | (396) | (830) | |||||||||||||
| Dividends distribution (Note 12) | − | − | − | − | − | (1,588) | − | − | − | − | (1,588) | (739) | (2,327) | |||||||||||||
| Net movement in treasury shares | − | − | 244 | − | − | (92) | − | − | − | − | 152 | − | 152 | |||||||||||||
| Acquisitions and disposals of non-controlling interests and business combinations (Note 5) | − | − | − | − | − | 66 | − | − | − | 45 | 111 | 238 | 349 | |||||||||||||
| Undated Deeply Subordinated Securities (Note 12) | − | − | − | 2,466 | − | − | − | − | − | − | 2,466 | − | 2,466 | |||||||||||||
| Other movements | − | − | − | − | − | 17 | − | − | − | − | 17 | (6) | 11 | |||||||||||||
| Financial position at December 31, 2013 | 4,551 | 460 | (544) | 2,466 | 984 | 22,517 | 94 | (37) | (31) | (9,275) | 21,185 | 6,297 | 27,482 | |||||||||||||
| Financial position at December 31, 2011 | 4,564 | 460 | (1,782) | − | 984 | 19,374 | 38 | 154 | 7 | (2,163) | 21,636 | 5,747 | 27,383 | |||||||||||||
| Profit for the year | − | − | − | − | − | 3,928 | − | − | − | − | 3,928 | 475 | 4,403 | |||||||||||||
| Other comprehensive loss | − | − | − | − | − | (112) | (2) | (870) | (14) | (1,278) | (2,276) | (587) | (2,863) | |||||||||||||
| Total comprehensive income | − | − | − | − | − | 3,816 | (2) | (870) | (14) | (1,278) | 1,652 | (112) | 1,540 | |||||||||||||
| Dividends distribution (Note 12) | 71 | − | − | − | − | (2,907) | − | − | − | − | (2,836) | (442) | (3,278) | |||||||||||||
| Net movement in treasury shares | − | − | (327) | − | − | (299) | − | − | − | − | (626) | − | (626) | |||||||||||||
| Acquisitions and disposals of non-controlling interests and business combinations (Note 5) | − | − | − | − | − | 1,170 | − | 1 | − | (188) | 983 | 1,800 | 2,783 | |||||||||||||
| Capital reduction | (84) | − | 1,321 | − | − | (1,237) | − | − | − | − | − | − | − | |||||||||||||
| Other movements | − | − | − | − | − | (348) | − | − | − | − | (348) | 207 | (141) | |||||||||||||
| Financial position at December 31, 2012 | 4,551 | 460 | (788) | − | 984 | 19,569 | 36 | (715) | (7) | (3,629) | 20,461 | 7,200 | 27,661 | |||||||||||||
| The accompanying Notes 1 to 23 and Appendices I to VII are an integral part of these consolidated statements of changes in equity. | ||||||||||||||||||||||||||
| Consolidated statements of cash flows | ||||
| Millions of euros | NOTES | 2014 | 2013 | 2012 |
| Cash flows from operating activities | ||||
| Cash received from customers | 61,522 | 69,149 | 75,962 | |
| Cash paid to suppliers and employees | (45,612) | (50,584) | (55,858) | |
| Dividends received | 48 | 49 | 85 | |
| Net interest and other financial expenses paid | (2,578) | (2,464) | (2,952) | |
| Taxes paid | (1,187) | (1,806) | (2,024) | |
| Net cash from operating activities | (Note 20) | 12,193 | 14,344 | 15,213 |
| Cash flows from investing activities | ||||
| Proceeds on disposals of property, plant and equipment and intangible assets | 340 | 561 | 939 | |
| Payments on investments in property, plant and equipment and intangible assets | (9,205) | (9,674) | (9,481) | |
| Proceeds on disposals of companies, net of cash and cash equivalents disposed | 3,615 | 260 | 1,823 | |
| Payments on investments in companies, net of cash and cash equivalents acquired | (5,020) | (398) | (37) | |
| Proceeds on financial investments not included under cash equivalents | 302 | 50 | 30 | |
| Payments on financial investments not included under cash equivalents | (247) | (386) | (834) | |
| Proceeds (payments) on placements of cash surpluses not included under cash equivalents | 217 | (314) | (318) | |
| Government grants received | 30 | 1 | 1 | |
| Net cash used in investing activities | (Note 20) | (9,968) | (9,900) | (7,877) |
| Cash flows from financing activities | ||||
| Dividends paid | (Note 12) | (2,328) | (2,182) | (3,273) |
| Transactions with equity holders | (427) | 65 | 656 | |
| Operations with other equity holders | (Note 12) | 3,713 | 2,466 | − |
| Proceeds on issue of debentures and bonds, and other debts | (Note 13) | 4,453 | 5,634 | 8,090 |
| Proceeds on loans, borrowings and promissory notes | 4,290 | 3,231 | 6,002 | |
| Cancellation of debentures and bonds, and other debts | (Note 13) | (5,116) | (5,667) | (4,317) |
| Repayments of loans, borrowings and promissory notes | (8,604) | (6,232) | (8,401) | |
| Payments on financed spectrum licenses | (22) | − | − | |
| Net cash used in financing activities | (Note 20) | (4,041) | (2,685) | (1,243) |
| Effect of changes in exchange rates | (1,616) | (1,468) | (382) | |
| Effect of changes in consolidation methods | (16) | (161) | 1 | |
| Net increase (decrease) in cash and cash equivalents during the year | (3,448) | 130 | 5,712 | |
| CASH AND CASH EQUIVALENTS AT JANUARY 1 | 9,977 | 9,847 | 4,135 | |
| CASH AND CASH EQUIVALENTS AT DECEMBER 31 | (Note 13) | 6,529 | 9,977 | 9,847 |
| RECONCILIATION OF CASH AND CASH EQUIVALENTS WITH THE STATEMENT OF FINANCIAL POSITION | ||||
| BALANCE AT JANUARY 1 | 9,977 | 9,847 | 4,135 | |
| Cash on hand and at banks | 7,834 | 7,973 | 3,411 | |
| Other cash equivalents | 2,143 | 1,874 | 724 | |
| BALANCE AT DECEMBER 31 | (Note 13) | 6,529 | 9,977 | 9,847 |
| Cash on hand and at banks | 4,912 | 7,834 | 7,973 | |
| Other cash equivalents | 1,617 | 2,143 | 1,874 |
| The accompanying Notes 1 to |
| cash flows. |
| CONSOLIDATED STATEMENT OF CHANGES IN EQUITY (MILLIONS OF EUROS) | Attributable to equity holders of the parent | Non-controlling interests(Note 12) | Total equity | |||||||||||||||||||||||||||||||||||||||||||||||||
| Share capital | Share premium | Legal reserve | Revaluation reserve | Treasury shares | Retained earnings | Available-for-sale investments | Hedges | Equity of associates | Translation differences | Total | ||||||||||||||||||||||||||||||||||||||||||
| Financial position at December 31, 2010 | 4,564 | 460 | 984 | 141 | (1,376 | ) | 19,971 | 45 | 648 | (42 | ) | (943 | ) | 24,452 | 7,232 | 31,684 | ||||||||||||||||||||||||||||||||||||
| Profit for the year | - | - | - | - | 5,403 | - | - | - | - | 5,403 | 784 | 6,187 | ||||||||||||||||||||||||||||||||||||||||
| Other comprehensive income (loss) | - | - | - | - | (52 | ) | (7 | ) | (494 | ) | 49 | (897 | ) | (1,401 | ) | (373 | ) | (1,774 | ) | |||||||||||||||||||||||||||||||||
| Total comprehensive income | - | - | - | - | 5,351 | (7 | ) | (494 | ) | 49 | (897 | ) | 4,002 | 411 | 4,413 | |||||||||||||||||||||||||||||||||||||
| Dividends paid (Note 12) | - | - | - | - | (6,852 | ) | - | - | - | - | (6,852 | ) | (876 | ) | (7,728 | ) | ||||||||||||||||||||||||||||||||||||
| Net movement in treasury shares | - | - | - | - | (777 | ) | - | - | - | - | - | (777 | ) | - | (777 | ) | ||||||||||||||||||||||||||||||||||||
| Acquisitions and disposals of non-controlling interests and business combinations (Note 5) | - | - | - | - | 984 | - | - | - | (323 | ) | 661 | (1,200 | ) | (539 | ) | |||||||||||||||||||||||||||||||||||||
| Other movements | - | - | - | (15 | ) | 371 | (206 | ) | - | - | - | - | 150 | 180 | 330 | |||||||||||||||||||||||||||||||||||||
| Financial position at December 31, 2011 | 4,564 | 460 | 984 | 126 | (1,782 | ) | 19,248 | 38 | 154 | 7 | (2,163 | ) | 21,636 | 5,747 | 27,383 | �� | ||||||||||||||||||||||||||||||||||||
| Financial position at December 31, 2009 | 4,564 | 460 | 984 | 157 | (527 | ) | 16,685 | (39 | ) | 804 | 19 | (1,373 | ) | 21,734 | 2,540 | 24,274 | ||||||||||||||||||||||||||||||||||||
| Profit for the year | - | - | - | - | 10,167 | - | - | - | - | 10,167 | (95 | ) | 10,072 | |||||||||||||||||||||||||||||||||||||||
| Other comprehensive income (loss) | - | - | - | - | - | (55 | ) | 84 | (156 | ) | (61 | ) | 430 | 242 | 386 | 628 | ||||||||||||||||||||||||||||||||||||
| Total comprehensive income | - | - | - | - | - | 10,112 | 84 | (156 | ) | (61 | ) | 430 | 10,409 | 291 | 10,700 | |||||||||||||||||||||||||||||||||||||
| Dividends paid (Note 12) | - | - | - | - | - | (5,872 | ) | - | - | - | (5,872 | ) | (440 | ) | (6,312 | ) | ||||||||||||||||||||||||||||||||||||
| Net movement in treasury shares | - | - | - | - | (849 | ) | - | - | - | - | - | (849 | ) | - | (849 | ) | ||||||||||||||||||||||||||||||||||||
| Acquisitions and disposals of non-controlling interests and business combinations (Note 5) | - | - | - | - | - | - | - | - | - | - | - | 4,307 | 4,307 | |||||||||||||||||||||||||||||||||||||||
| Other movements | - | - | - | (16 | ) | - | (954 | ) | - | - | - | - | (970 | ) | 534 | (436 | ) | |||||||||||||||||||||||||||||||||||
| Financial position at December 31, 2010 | 4,564 | 460 | 984 | 141 | (1,376 | ) | 19,971 | 45 | 648 | (42 | ) | (943 | ) | 24,452 | 7,232 | 31,684 | ||||||||||||||||||||||||||||||||||||
| Financial position at December 31, 2008 | 4,705 | 460 | 984 | 172 | (2,179 | ) | 16,069 | (566 | ) | 1,413 | (216 | ) | (3,611 | ) | 17,231 | 2,331 | 19,562 | |||||||||||||||||||||||||||||||||||
| Profit for the year | - | - | - | - | - | 7,776 | - | - | - | - | 7,776 | 161 | 7,937 | |||||||||||||||||||||||||||||||||||||||
| Other comprehensive income (loss) | - | - | - | - | - | (136 | ) | 527 | (609 | ) | 235 | 1,625 | 1,642 | 359 | 2,001 | |||||||||||||||||||||||||||||||||||||
| Total comprehensive income | 7,640 | 527 | (609 | ) | 235 | 1,625 | 9,418 | 520 | 9,938 | |||||||||||||||||||||||||||||||||||||||||||
| Dividends paid (Note 12) | - | - | - | - | - | (4,557 | ) | - | - | - | - | (4,557 | ) | (295 | ) | (4,852 | ) | |||||||||||||||||||||||||||||||||||
| Hyperinflation restatement to 01/01/09 (Note 2) | 613 | 613 | - | 613 | ||||||||||||||||||||||||||||||||||||||||||||||||
| Net movement in treasury shares | - | - | - | - | (656 | ) | - | - | - | - | - | (656 | ) | - | (656 | ) | ||||||||||||||||||||||||||||||||||||
| Acquisitions and disposals of non-controlling interests | - | - | - | - | - | - | - | - | - | - | - | (122 | ) | (122 | ) | |||||||||||||||||||||||||||||||||||||
| Capital reduction (Note 12) | (141 | ) | - | - | - | 2,308 | (2,167 | ) | - | - | - | - | - | - | - | |||||||||||||||||||||||||||||||||||||
| Other movements | - | - | - | (15 | ) | - | (300 | ) | - | - | - | - | (315 | ) | 106 | (209 | ) | |||||||||||||||||||||||||||||||||||
| Financial position at December 31, 2009 | 4,564 | 460 | 984 | 157 | (527 | ) | 16,685 | (39 | ) | 804 | 19 | (1,373 | ) | 21,734 | 2,540 | 24,274 | ||||||||||||||||||||||||||||||||||||
| NOTE | 2011 | 2010 | 2009 | ||||||||||
| Cash flows from operating activities | |||||||||||||
| Cash received from customers | 77,222 | 72,867 | 67,358 | ||||||||||
| Cash paid to suppliers and employees | (55,769 | ) | (51,561 | ) | (46,198 | ) | |||||||
| Dividends received | 82 | 136 | 100 | ||||||||||
| Net interest and other financial expenses paid | (2,093 | ) | (2,154 | ) | (2,170 | ) | |||||||
| Taxes paid | (1,959 | ) | (2,616 | ) | (2,942 | ) | |||||||
| Net cash from operating activities | (Note 23) | 17,483 | 16,672 | 16,148 | |||||||||
| Cash flows from investing activities | |||||||||||||
| Proceeds on disposals of property, plant and equipment and intangible assets | 811 | 315 | 242 | ||||||||||
| Payments on investments in property, plant and equipment and intangible assets | (9,085 | ) | (8,944 | ) | (7,593 | ) | |||||||
| Proceeds on disposals of companies, net of cash and cash equivalents disposed | 4 | 552 | 34 | ||||||||||
| Payments on investments in companies, net of cash and cash equivalents acquired | (2,948 | ) | (5,744 | ) | (48 | ) | |||||||
| Proceeds on financial investments not included under cash equivalents | 23 | 173 | 6 | ||||||||||
| Payments made on financial investments not included under cash equivalents | (669 | ) | (1,599 | ) | (1,411 | ) | |||||||
| Payments from cash surpluses not included under cash equivalents | (646 | ) | (621 | ) | (548 | ) | |||||||
| Government grants received | 13 | 7 | 18 | ||||||||||
| Net cash used in investing activities | (Note 23) | (12,497 | ) | (15,861 | ) | (9,300 | ) | ||||||
| Cash flows from financing activities | |||||||||||||
| Dividends paid | (Note 12) | (7,567 | ) | (6,249 | ) | (4,838 | ) | ||||||
| Transactions with equity holders | (399 | ) | (883 | ) | (947 | ) | |||||||
| Proceeds on issue of debentures and bonds | (Note 13) | 4,582 | 6,131 | 8,617 | |||||||||
| Proceeds on loans, borrowings and promissory notes | 4,387 | 9,189 | 2,330 | ||||||||||
| Cancellation of debentures and bonds | (Note 13) | (3,235 | ) | (5,482 | ) | (1,949 | ) | ||||||
| Repayments of loans, borrowings and promissory notes | (2,680 | ) | (7,954 | ) | (5,494 | ) | |||||||
| Net cash used in financing activities | (Note 23) | (4,912 | ) | (5,248 | ) | (2,281 | ) | ||||||
| Effect of foreign exchange rate changes on collections and payments | (169 | ) | (463 | ) | 269 | ||||||||
| Effect of changes in consolidation methods | 10 | 7 | - | ||||||||||
| Net (decrease) increase in cash and cash equivalents during the year | (85 | ) | (4,893 | ) | 4,836 | ||||||||
| CASH AND CASH EQUIVALENTS AT JANUARY 1 | 4,220 | 9,113 | 4,277 | ||||||||||
| CASH AND CASH EQUIVALENTS AT DECEMBER 31 | (Note 13) | 4,135 | 4,220 | 9,113 | |||||||||
| RECONCILIATION OF CASH AND CASH EQUIVALENTS WITH THE STATEMENT OF FINANCIAL POSITION | |||||||||||||
| BALANCE AT JANUARY 1 | 4,220 | 9,113 | 4,277 | ||||||||||
| Cash on hand and at banks | 3,226 | 3,830 | 3,236 | ||||||||||
| Other cash equivalents | 994 | 5,283 | 1,041 | ||||||||||
| BALANCE AT DECEMBER 31 | (Note 13) | 4,135 | 4,220 | 9,113 | |||||||||
| Cash on hand and at banks | 3,411 | 3,226 | 3,830 | ||||||||||
| Other cash equivalents | 724 | 994 | 5,283 | ||||||||||
subsidiaries composing the Telefónica Group
Telefónica, S.A. and its subsidiaries and investees (the(“Telefónica”, “the Company”, the “Telefónica Group” or "the Group”) make up an integrated and diversified telecommunications group of companies operating mainly in the telecommunications, mediaEurope and contact center industries.Latin America. The Group’s activity is centered around services of wireline and wireless telephony, broadband, internet, data traffic, Pay TV and other digital services.
The parent company of the Group is Telefónica, S.A. (“Telefónica” or “the Company”), a public limited company incorporated on April 19, 1924 for an indefinite period. Its registered office is at calle Gran Vía 28, Madrid (Spain).
Appendix VVI lists the subsidiaries, associates and investees in whichmain companies composing the Telefónica Group, has direct or indirect holdings, their corporate purpose, country, functional currency, share capital, the Telefónica Group’s effective shareholding and their method of consolidation.
In addition, certain wireline and wireless telephony services are provided under regulated rate and price systems.
The accompanying consolidated financial statements were prepared from the accounting records of Telefónica, S.A. and of each of the companies comprising the Telefónica Group, whose individual
separate financial statements were prepared in accordance with the generally accepted accounting principles prevailing in the various countries in which they are located, and for purposes of these consolidated financial statements are presented in accordance with the International Financial Reporting Standards (IFRS) as issued by the International Accounting Standards Board (IASB), which for the purposes of the Telefónica Group are not different from those adopted by the European Union, to give a true and fair view of the consolidated equity and financial position at December 31, 2011,2014, and of the consolidated results of operations, changes in consolidated equity and the consolidated cash flows obtained and used in the year then ended. The figures in these consolidated financial statements are expressed in millions of euros, unless otherwise indicated, and therefore may be rounded. The euro is the Group’s reporting currency.
The accompanying consolidated financial statements for the year ended December 31, 20112014 were preparedapproved by the Company’s Board of Directors at its meeting on February 22, 201223, 2015 for submission for approval at the General Shareholders’ Meeting, which is expected to occur without modification.
Note 3 contains a detailed description of the most significant accounting policies used to prepare these consolidated financial statements.
Materiality criteria
These consolidated financial statements do not include any information or disclosures that, not requiring presentation due to their qualitative significance, have been determined as immaterial or of no relevance pursuant to the concepts of materiality or relevance defined in the IFRS conceptual framework, insofar as the Telefónica Group consolidated financial statements, taken as a whole, are concerned.
Comparative information and main changes in the consolidation scope
For comparative purposes, the accompanying consolidated financial statements for 20112014 include the consolidated statement of financial position at December 31, 2010figures for 2013, and in the consolidated income statement, the consolidated statement of comprehensive income, the consolidated statement of changes in equity and the consolidated statement of cash flows, and the notes thereto for the year then ended, December 31, 2010 and 2009.
The main events and changes in the consolidation scope affecting comparability of the consolidated information for 20112014 and 20102013 (see Appendix I for a more detailed explanation of the changes in consolidation scope in 2010 and the main transactions in 2009)scope) are as follows:
On March 25, 2011February 8, 2013, the Boards of Directors of each of the subsidiaries controlled by Telefónica, Vivo Participações and Telesp, approved the terms and conditions of a merger and restructuring process whereby all shares of Vivo Participações that were not owned by Telesp were exchanged for Telesp shares, at a rate of 1.55 new Telesp shares for each Vivo Participações share. These shares then became the property of Telesp, whereby Vivo Participações then became a wholly owned subsidiary of Telesp. The restructuring processVenezuelan bolivar was approved by the shareholders of Vivo Participações at the Extraordinary General Shareholders’ Meeting held on April 27, 2011 and by the shareholders of Telesp at the Extraordinary General Shareholders’ Meeting held on the same date, following authorization by Anatel the Brazilian telecommunications regulator.
The Group has recognizedexchange rate of 6.3 bolivars per U.S. dollar was used in the costtranslation of the 2011 Redundancy Plan, per Company estimates, under “Personnel expenses”financial information of Venezuelan subsidiaries for the whole year 2013.
During 2014, by virtue of certain Exchange Agreements the allocations conducted through the Complementary System for Administration of Foreign Currency (SICAD I), to which Telefónica Venezuela had access for imports, were expanded and, in addition, a new exchange mechanism with a more widespread use was put in place, called SICAD II.
The exchange rates resulting in the accompanying consolidated income statement in an amountlast allocations of 2,671 million euros (see Note 15).SICAD I and SICAD II before December 31, 2014 were 12 and 49.988 bolívares per U.S. dollar, respectively.
The main impacts of using this transaction are explainednew exchange rate in Note 5.the Telefónica Group’s consolidated financial statements as of December 31, 2014 were as follows:
| · | As part of the decrease mentioned in the preceding paragraph, the value in euros of the net financial assets denominated in bolivars decreased by approximately 2,700 million euros, as per the balance as of December 31, 2014. |
| · | The results from the Telefónica’s subsidiaries in Venezuela have been translated at the new exchange rate. This implies a reduction in Operating income before depreciation and amortization (OIBDA) and profit for the year of, approximately, 1,730 and 660 million euros, respectively. |
b) Acquisition of E-Plus
Telefónica finalized the amount of 275 million euros, which was ultimately reduced by 40 million euros upon completionE-Plus Mobilfunk GmbH &Co KG (E-Plus) purchase on October 1, 2014, once the approval of the transaction (Note 5).European Commission was obtained and the share capital increase by Telefónica Deutschland Holding, A.G. to finance the operation was completed.
Telefónica, S.A.’s shareholding in Telco, S.p.A., (holding company of our investment in Telecom Italia, S.p.A.), previously accounted for using the equity method (see Note 9), was classified as an available-for-sale financial asset under “Non-current financial assets” (see Note 13), as of December 31, 2014, as it was considered that Telefónica ceased to have significant influence in its indirect stake in Telecom Italia, S.p.A.
The impact of this reclassification, together with the contribution of Telco, S.p.A. to results for the year, led to a negative impact of 464 million euros in 2014 under the heading “Share of loss of investments accounted for by the equity method”.
In 2013, the negative impact of Telco, S.p.A. on January 8, 2010,“Share of loss of investments accounted for by the two main factorsequity method” was 267 million euros.
d) Sale of ownership interest in Telefónica Czech Republic, a.s.
On November 5, 2013 Telefónica reached an agreement to consider with respectsell 65.9% of Telefónica Czech Republic, a.s. to PPF Group N.V.I. for an equivalent of approximately 2,467 million euros in cash at the date of the agreement.
As a result of the transaction, a loss was recognized for the 176 million-euro adjustment to the value of the assets assigned to Telefónica Group’s 2010Czech Republic, under "Other expenses" in the consolidated income statement for 2013 (see Note 18).
Consolidated assets and liabilities subject to this transaction were classified under “Non-current assets held for sale” and “Liabilities associated with non-current assets held for sale”, respectively, in the consolidated statement of financial statements were:position at December 31, 2013. Their composition is as follows:
| Millions of euros | |
| Non-current assets | |
| Current assets | 412 |
| Non-current liabilities | 280 |
| Current liabilities | 436 |
The transaction was completed in January 2014, once the pertinent regulatory authorization was obtained, and the entity was removed from the consolidation scope as of January 1, 2014. The impact to Equity attributable to non-controlling interests is a 666 million euros decrease (see Note 12.h).
Subsequent to this transaction, Telefónica held a 4.9% stake in the company, which in turn was sold in October 2014 for 160 million euros.
e) Sale of ownership interest in Telefónica Ireland, Ltd.
In June 2013 Telefónica reached an agreement with Hutchison Whampoa Group for the sale of Telefónica’s 100% participation in Telefónica Ireland, Ltd. for 850 million euros, including an initial cash consideration of 780 million euros to be paid at the closing of the transaction, and an additional deferred payment of 70 million euros to be settled based on the completion of agreed financial objectives.
Consolidated assets and liabilities subject to this transaction have been classified under “Non-current assets held for sale” and “Liabilities associated with non-current assets held for sale”, respectively, in the consolidated statement of financial position at December 31, 2013. Their composition is as follows:
| Millions of euros | |
| Non-current assets | |
| Current assets | 191 |
| Non-current liabilities | 35 |
| Current liabilities | 171 |
Note 3. Accounting policies
Accordingly, only the most significant accounting policies used in preparing the accompanying consolidated financial statements, in light of the nature of the Group’s activities, are set out below, as follows:well as the accounting policies applied where IFRSs permit a policy choice, and those that are specific to the sector in which the Group operates.
a) Hyperinflationary economies
b) Translation methodology
c) Goodwill
| After initial recognition, goodwill is carried at cost, less any accumulated impairment losses. Goodwill |
The potential impairment loss is determined by assessing the recoverable amount of the cash generating unit (or group of cash-generatingcash generating units) to which the goodwill relates when originated. If this recoverable amount is less thanallocated from the carrying amount, an irreversible impairment loss is recognized in income (see Note 3 f).acquisition date.
d) Intangible assets
Intangible assets are statedcarried at acquisition or production cost, less any accumulated amortization or any accumulated impairment losses.
| · | Expenditures incurred in developing new products to be available for sale or use within the Group’s own network, and whose future economic viability is reasonably certain (“Development costs”), are amortized on a straight-line basis over the period during which the related development project is expected to generate economic benefits, upon its completion. |
| · | Licenses granted to the Telefónica Group by various public authorities to provide telecommunications services and the value allocated to licenses held by certain companies at the time they were included in the Telefónica Group (“Service concession arrangements and licenses”) are amortized on a straight-line basis over the duration of related licenses from the moment commercial operation begins. |
| · | The allocation of acquisition costs attributable to customers acquired in business combinations, as well as the acquisition value of this type of assets in a third-party transaction for consideration (“Customer base”) are amortized on a straight-line basis over the estimated period of the customer relationship. |
| · | Software is amortized on a straight-line basis over its useful life, generally estimated to be between two and five years. |
| e) | Property, plant and equipment |
Property, plant and equipment is statedcarried at cost less any accumulated depreciation and any accumulated impairment in value. Land is not depreciated.
Cost includes, external and internal costs comprising warehouse materials used,among others, direct labor used in installation work and the allocable portion of the indirect costs required for the related investment.asset. The latter two items are recorded as revenuesrevenue under “Other income - Ownthe concept “Own work capitalized.” Cost includes, where appropriate, the initial estimate of decommissioning, retirement and site reconditioning costs when the Group is under obligation to incur such costs due to the usecapitalized” of the asset.line item “Other income”.
Interest and other financial expenses incurred and directly attributable to the acquisition or construction of qualifying assets are capitalized. Qualifying assets atfor the Telefónica Group are those assets that require a period of at least 18 months to bring the assets to the condition necessary for their intended use or sale.
The Group’s subsidiaries depreciate their property, plant and equipment, from the time they can be placed in service, amortizing the cost of the assets, net of their residual values once they are in full working condition using theon a straight-line method based onbasis over the assets’ estimated useful lives, which are calculated in accordance with technical studies whichthat are revised periodically based onin light of technological advances and the rate of dismantling, as follows:
Years of estimated | |
useful life | |
| Buildings | 25 – 40 |
| Plant and machinery | 10 – 15 |
| Telephone installations, networks and subscriber equipment | 5 – 20 |
| Furniture, tools and other items | 2 – 10 |
f) Impairment of non-current assets
Non-current assets, including property, plant and equipment, goodwill and intangible assets are evaluatedassessed at each reporting date for indicationsindicators of impairment losses.impairment. Wherever such indicationsindicators exist, or in the case of assets which are subject to an annual impairment test, recoverable amount is estimated. An asset’s recoverable amount is the higher of fair value less costs to sell and value in use. In assessing value in use, the estimated future cash flows deriving from the use of the asset or its cash generating unit, as applicable, are discounted to their present value using a pre-tax discount rate that reflects current market assessments of the time value of money and the risks specific to the asset. When the carrying amount of an asset
The Group bases the calculation of impairment on the business plans of the various cash generating units to which the assets are allocated. TheseThe projected cash flows, based on strategic business plans, generally cover a period of three to five years. For periods afterStarting with the term of the strategic plan,sixth year, an expected constant or decreasing growth rate is applied to the projections based on these plans. The growth rates used in 2011 and 2010 are as follows:applied.
| Rates | 2011 | 2010 |
| Businesses in Spain | 0.51%-0.59% | 0.91%-1.10% |
| Businesses in Latin America | 1.75%-2.58% | 1.66%-2.56% |
| Businesses in Europe | 0.96%-1.07% | 1.28%-1.46% |
g) Lease agreements
| Rates | 2011 | 2010 |
| Businesses in Spain | 7.5%-14.8% | 7.8%-8.6% |
| Businesses in Latin America | 7.3%-17.8% | 7.2%-17.3% |
| Businesses in Europe | 5.9%-11.2% | 6.3%-10.9% |
The determination of whether an arrangement is, or contains a lease is based on the substance of the agreement and requires an assessment of whether the fulfillmentfulfilment of the arrangement is dependent on the use of a specific asset and the agreement conveys a right to the Telefónica Group to the use of the asset.
Leases where the lessor does not transfer substantially all the risks and benefits of ownership of the asset are classified as operating leases. Operating lease payments are recognized as an expense in the income statement on a straight-line basis over the lease term.
Leases are classified as finance leases when the terms of the lease transfer substantially all the risks and rewards incidental to ownership of the leased item to the Group. These are classified at the inception of the lease, in accordance with its nature and the associated liability, at the lower of the present value of the minimum lease payments or the fair value of the leased property. Lease payments are apportioned between finance costs and reduction of the principal of lease liability so as to achieve a constant rate of interest on the remaining balance of the liability. Finance costs are reflected in the income statement over the lease term.
The Telefónica Group’s investments in companies over which it exercises significant influence but does not control or jointly control with third parties are accounted for using the equity method. The Group evaluatesassesses whether it exerciseshas significant influence not only on the basis of its ownership percentage ownership but also on the existence of qualitative factors such representation on the board of directors of the investee, its participation in decision-making processes, interchange of managerial personnel and access to technical information. The carrying amount of investments in associates includes related goodwill and the consolidated income statement reflects the share of profit or loss from operations of the associate. If the associate recognizes any gains or losses directly in equity, the Group also recognizes the corresponding portion of these gains or losses directly in its own equity.
The Group assesses rights and obligations agreed to by the existence of indicators of impairment of the investment in each associate at each reporting dateparties to a joint arrangement and, when relevant, other facts and circumstances in order to recognize any required valuation adjustments. To do so,determine whether the recoverable value of the investment asjoint arrangement in which it is involved is a whole is determined as described in Note 3.f.joint venture or a joint operation.
i) Financial assets and liabilities
Financial investments
All normalregular way purchases and sales of financial assets are recognized in the statement of financial position on the trade date, i.e. the date that the Company commits to purchase or sell the asset. The Telefónica Group classifies its financial instruments into four categories for initial recognition purposes: financial assets at fair value through profit or loss, loans and receivables, held-to-maturity investments and available-for-sale financial assets. When appropriate, the Company re-evaluates the designation at each financial year end.
Financial assets which the Group intends to hold for an unspecifiedindefinite period of time and could be sold at any time in response to meet specificneeds for liquidity requirements or in response to interest-rate movementschanges in market conditions are classified as available-for-sale.available-for-sale. These investments are recorded under “Non-currentpresented as non-current assets,” unless it is probable and feasible that they will be sold within 12 months. Financial assets in this category are measured at fair value. Gains or losses arising from changes in fair value are recognized in equity at each financial year end until the investment is derecognized or determined to be impaired, at which time the cumulative gain or loss previously reported in equity is recognized in profit or loss. Dividends from available-for-sale investments are recognized in the income statement when the Group has the right to receive the dividend. Fair value is determined in accordance with the following criteria:
Derivative financial instruments are initially recognized at fair value, normally equivalent to cost. Their carrying amounts are subsequently remeasured at fair value. Derivatives are carried as assets when the fair value is positive and as liabilities when the fair value is negative. They are classified as current or non-current depending on whether they fall due within less than or
hedge accounting
j) Inventories
Materials stored for use in investment projects and inventories for consumption and replacement are valued at the lower of weighted average cost and net realizable value.
k) Pensions and losses accumulated in equity become part of the cost of the inventories acquired.other employee obligations
Provisions required to cover the accrued liability for defined-benefit pension plans are determined using “the projected unit credit” actuarial valuation method. The calculation is based on demographic and financial assumptions for eachdetermined at a country consideringlevel, and in consideration of the macroeconomic environment. The discount rates are determined based on high quality market yield curves. Plan assets are measured at fair value. Actuarial gains and losses on post-employment defined-benefit plans are recognized immediately in equity.
Provisions for post-employment benefits (e.g. early retirement or other) are calculated individually based on the terms agreed with the employees. In some cases, these may require actuarial valuations based on both demographic and financial assumptions.
l) Revenue and expenses are recognized on the income statement based on an accruals basis; i.e. when the goods or services represented by them take place, regardless of when actual payment or collection occurs.
The Telefónica Group revenues are derived principally obtains revenues from providing the following telecommunications services: traffic, connection fees, regular (normally monthly) network usage fees, interconnection, network and equipment leasing,
handset sales and other digital services such as payPay TV and value-added services (e.g. text(text or data messaging) andmessages, among others) or maintenance. Products and services may be sold separately or bundled in promotional packages (bundled).packages.
Revenues from calls carried on Telefónica’s networks (traffic) entail an initial call establishment fee plus a variable call rate, based on call length, distance and type of service. Both wireline and wireless traffic is recognized as revenue as service is provided. For prepaid calls, the amount of unused traffic generates a deferred revenue recognizedpresented in “Trade and other payables” on the statement of financial position. Prepaid cards generally expire within 12 months and any deferred revenue from prepaid traffic is takenrecognized directly toin the income statement when the card expires as the Group has no obligation to provide service after thisexpiry date.
Connection fees arising when customers connect to the Group’s network are deferred and taken torecognized in the income statement throughout the average estimated customer relationship period, which varies by type of service. All related costs, except those related to network enlargement expenses,expansion, as well as administrative expenses and overhead, are recognized in the income statement as incurred.
Interconnection revenues from wireline-wireless and wireless-wireline calls and other customer services are recognized in the period in which the calls are made.
Revenues from handset and equipment sales are recognized once the sale is considered complete, i.e., generally when delivered to the end customer.
As connection or initial activation fees, or upfront non-refundable fees, cannot beare not separately identifiable as elements in these types of packages, any revenues received from the customer for these items are allocated to the remaining elements. However,Additionally, when allocating the package revenue to the elements, amounts contingent upon delivery of undelivered elements are not allocated to delivered elements.
All expenses related to mixedbundled promotional packages are taken torecognized in the income statement as incurred.
m) Use of estimates
The key assumptions concerning the future and other relevant sources of uncertainty in estimates at the reporting date that could have a significant impact on the consolidated financial statements within the next financial year are discussed below.
A significant change in the facts and circumstances on which these estimates and related judgments are based could have a material impact on the Group’s results and financial position. Accordingly, sensitivity analyses are disclosed for the most relevant situations (see notes 7 and 15).
Property, plant and equipment, intangible assets and goodwill
The accounting treatment of investments in property, plant and equipment and intangible assets entails the use of estimates to determine the useful life for depreciation and amortization purposes and to assess fair value at their acquisition dates for assets acquired in business combinations.
Determining useful life requires making estimates in connection with future technological developments and alternative uses for assets. There is a significant element of judgment involved in making technological development assumptions, since the timing and scope of future technological advances are difficult to predict.
The decision to recognize an impairment loss involves developing estimates that include, among others, an analysis of the timing and amountcauses of the potential impairment, as well as analysis of the reasons for the potential loss.its timing and expected amount. Furthermore, additional factors, such as technological obsolescence, the suspension of certain services and other circumstantial changes, which highlight the need to evaluate a possible impairment, are taken into account.
The Telefónica Group evaluates its cash-generating units’ performance regularly to identify potential goodwill impairments. Determining the recoverable amount of the cash-generating units to which goodwill is allocated also entails the use of assumptions and estimates and requires a significant element of judgment.
Deferred income taxes
The Group assesses the recoverability of deferred tax assets based on estimates of future earnings. The ability to recover these taxesSuch recoverability ultimately depends ultimately on the Group’s ability to generate taxable earnings over the period for which the deferred tax assets remain deductible. This analysis is based on the estimated schedule for reversing deferred tax liabilities, as well as estimates of taxable earnings, which are sourced from internal projections andthat are continuously updated to reflect the latest trends.
The recognition of tax assets and liabilities depends on a series of factors, including estimates as to the timing and realization of deferred tax assets and the projected tax payment schedule. Actual Group company income tax receipts and payments could differ from the estimates made by the Group as a result of changes in tax legislation or unforeseen transactions that could affect tax balances.
Provisions
Given the uncertainties inherent in the estimates used to determine the amount of provisions, actual outflows of resources may differ from the amounts recognized originally on the basis of the estimates.
Revenue recognition
Connection fees
Connection fees generated when customers connect to the Group’s network are deferred and recognized as revenue over the average estimated customer relationship period.
The estimate of the average estimated customer relationship period is based on the recent history of customer churn. Potential changes in estimates could lead to changes in both the amount and timing of the future recognition of revenues.
Bundled offers
Bundled offers that combine different elements are assessed to determine whether it is necessary to separate the different identifiable components and apply the corresponding revenue recognition policy to each element. Total package revenue is allocated among the identified elements based on their respective fair values.
Determining fair values for each identified element requires estimates that are complex due to the nature of the business.
A change in estimates of fair values could affect the apportionment of revenue among the elements and, as a result, the date of recognition of revenues.
Exchange rate used to translate the financial statements of our Venezuelan subsidiaries
We review, on a regular basis, the same financial year-end aseconomic conditions in Venezuela and the parent company’s individual financial statements and are prepared using the same accounting policies. In the casespecific circumstances of Group companies whose accounting and valuation methods differed from thoseour Venezuelan operations. Assessment of the Telefónica Group, adjustments were made on consolidation in order to presentexchange rate that best reflects the consolidated financial statements on a uniform basis.economics of Telefónica’s business activities in
Due to inherent uncertainties in the estimates required to determine the appropriate exchange rate for the conversion of BsF-denominated financial statements, actual cash flows denominated in such currency may differ from the amounts currently recognized on the basis of our estimates, as a result of changes in currency laws or changes in exchange mechanisms or published exchange rates that may have a material impact on the conversion rate used for our Venezuelan subsidiaries’ financial statements, affecting the net monetary position of assets (liabilities) denominated in BsF.
n) New IFRS and interpretations of the IFRS Interpretations Committee (IFRIC)
The accounting policies applied in the preparation of the consolidated financial statements for the year ended December 31, 20112014 are consistent with those used in the preparation of the Group’s consolidated annual financial statements for the year ended December 31, 2010,2013, except for the application of new standards, amendments to standards and interpretations published by the International Accounting Standards Board (IASB)IASB and the IFRS Interpretations Committee (IFRIC),IFRIC, and adopted by the European Union, effective as of January 1, 2011,2014, noted below:
| · | IAS 32 Offsetting Financial Assets and Financial Liabilities - |
| · | IFRIC Interpretation 21 Levies (IFRIC 21) |
IFRIC 21 clarifies that an entity recognizes a new revised definition ofliability for a “related party.”levy when the activity that triggers payment, as identified by the relevant legislation, occurs. For a levy that is triggered upon reaching a minimum threshold, the interpretation clarifies that no liability should be anticipated before the specified minimum threshold is reached. The adoption of this standardIFRIC 21 did not have a material financial impact in the Group’s consolidated financial position or results.
| · | IAS 39 Novation of Derivatives and Continuation of Hedge Accounting – Amendments to IAS 39 |
These amendments provide relief from discontinuing hedge accounting when novation (that was not contemplated on the original hedging documentation) of a derivative designated as a hedging instrument meets certain criteria: the novation is made pursuant to laws or regulations, a clearing counterparty becomes the new counterparty to each of the original parties and changes to the terms of the derivative are limited to those necessary to change the counterparty. The application of these amendments has had no impact on the Group’s consolidated financial position or results.
| · | Recoverable Amount Disclosures for Non-Financial Assets – Amendments to IAS 36 Impairment of Assets |
These amendments remove the unintended consequences of IFRS 13 Fair Value Measurement on the disclosures includedrequired under IAS 36. Under the amendments, recoverable amount is required to be disclosed only when an impairment loss has been recognized or reversed during the period. Accordingly, these amendments have been considered while making disclosures for impairment of non-financial assets in the Group’sthese consolidated financial statements.
These improvements establish a seriesamendments provide an exception to the consolidation requirement for entities that meet the definition of amendmentsan investment entity under IFRS 10. The exception to current IFRS withconsolidation requires investment entities to account for subsidiaries –as well as investments in associates and joint ventures – at fair value through profit or loss. This amendment is not relevant to the aim of removing inconsistencies and clarifying wording. These amendments have had no impact on the results or financial positionGroup, since none of the Group.entities in the Group qualifies to be an investment entity under IFRS 10.
New standards and IFRIC interpretations issued but not effecteffective as of December 31, 20112014
At the date of preparationauthorization for issue of the accompanying consolidated financial statements, the following IFRS, amendments and IFRIC interpretations had been published,issued by the IASB, but their application was not mandatory:
| Standards and amendments | Mandatory application: annual periods beginning on or after | |
Amendments to IAS 19 | Defined Benefit Plans: Employee Contributions | July 1, 2014 |
| Improvements to IFRS | ||
Improvements to IFRS 2011-2013 | July 1, 2014 | |
Improvements to IFRS 2012-2014 | January 1, | |
IFRS | Regulatory Deferral Accounts | January 1, |
Amendments to IFRS 11 | Accounting for Acquisitions of Interests in Joint | January 1, |
Amendments to IAS 16 and IAS 38 | Clarification of | January 1, |
Amendments to IAS 16 and IAS 41 | Agriculture: Bearer Plants | January 1, |
Amendments to IFRS 10 and IAS | Sale or Contribution of Assets between an Investor and its Associate or Joint Venture | January 1, |
Amendments to IAS | Disclosure Initiative | January 1, |
Amendments to IFRS 10, IFRS 12 and IAS 28 | Investment Entities: Applying the Consolidation Exception | January 1, |
IFRS 15 | Revenues from Contracts with Customers | January 1, 2017 |
IFRS 9 | Financial instruments | January 1, 2018 |
Amendments to IFRS 7 | ||
Disclosures - Transition to IFRS 9 | January 1, | |
| 2018 | ||
Based on the analyses made to date, the Group estimates that theirthe adoption of most of these standards, amendments and improvements will not have a significant impact on the consolidated financial statements in the initial period of application. However, IFRS 15 is likely to have an impact in the timing and amount of revenue recognition in connection with certain bundled revenue transactions, The Group is currently assessing the impact of the application of this standard. Also, the changes introduced by IFRS 9 will affect financial instruments and transactions with financial assetsinstruments carried out on or after January 1, 2015.2018.
Note 4. Segment information
On February 26, 2014, the Board of Directors of Telefónica, S.A. approved the implementation of a new organizational structure completely focused on clients and which incorporates the digital offering as the main focus for commercial policies. The structure gives greater visibility to local operators, bringing them closer to the corporate decision-making center, simplifying the Group’s global structure and strengthening the transverse areas to improve flexibility and agility in decision making.
As a result of this management model,organization, the Group had three large business areas in 2011:new structure is made up of the following segments: Telefónica Spain, Telefónica EuropeBrazil, Telefónica Germany, Telefónica UK and Telefónica LatinHispanoamérica (formed by the Group’s operators in Argentina, Chile, Peru, Colombia, Mexico, Venezuela and Central America, Ecuador and Uruguay). These segments include all information relating to wireline, wireless, cable, internet, television businesses and other digital services in accordance with each overseeinglocation. "Other companies and eliminations" includes the integrated business. This formscompanies belonging to the basis of the segment reporting in these consolidated financial statements.
The Telefónica Group is also involvedGroup’s segment information of years before 2014 were revised in the media and contact center businesses through investments in Telefónica de Contenidos and Atento, included under “Other and eliminations” together with the consolidation adjustments and the remaining Group companies.accompanying consolidated financial statements to reflect this new organization.
The Group manages borrowing activities and taxes centrally. Therefore, it does not disclose the related assets, liabilities, revenue and expenses by reportable segments. In addition, revenue and expenses arising from intra-group invoicing for the use of the trademark and management services have been eliminated from the operating results of each Group segment. These adjustments have no impact on the Group’s consolidated results.
Inter-segment transactions are carried out at market prices.
Telefónica uses operating income before depreciation and amortization (OIBDA) to track the performance of the business and to establish operating and strategic targets. OIBDA is calculated by excluding depreciation and amortization from operating income to eliminate the impact of investments in fixed assets that cannot be directly controlled by management in the short term. Therefore, it is considered to be more important for investors as it provides a gauge of segment operating performance and profitability using the same measures utilized by management. This metric also allows for comparisons with other companies in the telecommunications sector without consideration of their asset structure.
OIBDA is a commonly reported measure and is widely used among analysts, investors and other interested parties in the telecommunications industry, although not a measure explicitly defined in IFRS, and therefore, may not be comparable to similar indicators used by other companies. OIBDA should not be considered as an alternative to operating income as a measurement of our consolidated operating results or as an alternative to consolidated cash flows from operating activities as a measurement of our liquidity.
F-19
Key segment information for these segments is as follows:
| 2014 | |||||||
| Millions of euros | Telefónica Spain | Telefónica UK | Telefónica Germany | Telefónica Brazil | Telefónica Hispanoamérica | Other and eliminations | Total Group |
| Revenues | 12,023 | 7,062 | 5,522 | 11,231 | 13,155 | 1,384 | 50,377 |
| External revenues | 11,832 | 7,021 | 5,500 | 11,200 | 13,013 | 1,811 | 50,377 |
| Inter-segment revenues | 191 | 41 | 22 | 31 | 142 | (427) | − |
| Other operating income and expenses | (6,352) | (5,318) | (4,789) | (7,688) | (9,087) | (1,628) | (34,862) |
| OIBDA | 5,671 | 1,744 | 733 | 3,543 | 4,068 | (244) | 15,515 |
| Depreciation and amortization | (1,805) | (1,121) | (1,426) | (1,762) | (2,034) | (400) | (8,548) |
| Operating income | 3,866 | 623 | (693) | 1,781 | 2,034 | (644) | 6,967 |
| Capital expenditures | 1,732 | 755 | 849 | 2,933 | 2,842 | 337 | 9,448 |
| Investments accounted for by the equity method | 2 | 2 | − | 3 | 2 | 779 | 788 |
| Fixed assets | 14,057 | 11,173 | 16,703 | 21,795 | 14,922 | 2,157 | 80,807 |
| Total allocated assets | 18,520 | 14,105 | 21,186 | 28,570 | 21,800 | 18,118 | 122,299 |
| Total allocated liabilities | 9,599 | 4,740 | 6,645 | 8,898 | 14,480 | 47,648 | 92,010 |
| 2011 | ||||||||||||||||||||
| Millions of euros | Telefónica Spain | Telefónica Latin America | Telefónica Europe | Other and eliminations | Total Group | |||||||||||||||
| Revenues | 17,284 | 29,237 | 15,524 | 792 | 62,837 | |||||||||||||||
| External revenues | 16,941 | 29,138 | 15,212 | 1,546 | 62,837 | |||||||||||||||
| Inter-segment revenues | 343 | 99 | 312 | (754 | ) | - | ||||||||||||||
| Other operating income and expenses | (12,212 | ) | (18,296 | ) | (11,291 | ) | (828 | ) | (42,627 | ) | ||||||||||
| OIBDA | 5,072 | 10,941 | 4,233 | (36 | ) | 20,210 | ||||||||||||||
| Depreciation and amortization | (2,088 | ) | (4,783 | ) | (3,117 | ) | (158 | ) | (10,146 | ) | ||||||||||
| OPERATING INCOME | 2,984 | 6,158 | 1,116 | (194 | ) | 10,064 | ||||||||||||||
| CAPITAL EXPENDITURE | 2,914 | 5,299 | 1,705 | 306 | 10,224 | |||||||||||||||
| INVESTMENTS IN ASSOCIATES | 1 | 3 | - | 5,061 | 5,065 | |||||||||||||||
| FIXED ASSETS | 15,070 | 43,890 | 28,133 | 1,541 | 88,634 | |||||||||||||||
| TOTAL ALLOCATED ASSETS | 21,428 | 62,923 | 35,247 | 10,025 | 129,626 | |||||||||||||||
| TOTAL ALLOCATED LIABILITIES | 12,768 | 27,289 | 9,754 | 52,429 | 102,243 | |||||||||||||||
2010 (revised1) | |||||||||||||||||||||||||||
2013 (*) | 2013 (*) | ||||||||||||||||||||||||||
| Millions of euros | Telefónica Spain | Telefónica Latin America | Telefónica Europe | Other and eliminations | Total Group | Telefónica Spain | Telefónica UK | Telefónica Germany | Telefónica Brazil | Telefónica Hispanoamérica | Other and eliminations | Total Group | |||||||||||||||
| Revenues | 18,711 | 25,756 | 15,724 | 546 | 60,737 | 12,959 | 6,692 | 4,914 | 12,217 | 16,855 | 3,424 | 57,061 | |||||||||||||||
| External revenues | 18,301 | 25,618 | 15,407 | 1,411 | 60,737 | 12,734 | 6,652 | 4,876 | 12,186 | 16,736 | 3,877 | 57,061 | |||||||||||||||
| Inter-segment revenues | 410 | 138 | 317 | (865 | ) | - | 225 | 40 | 38 | 31 | 119 | (453) | − | ||||||||||||||
| Other operating income and expenses | (10,191 | ) | (12,043 | ) | (11,644 | ) | (1,082 | ) | (34,960 | ) | (6,619) | (5,055) | (3,606) | (8,277) | (11,324) | (3,103) | (37,984) | ||||||||||
| OIBDA | 8,520 | 13,713 | 4,080 | (536 | ) | 25,777 | 6,340 | 1,637 | 1,308 | 3,940 | 5,531 | 321 | 19,077 | ||||||||||||||
| Depreciation and amortization | (2,009 | ) | (3,954 | ) | (3,201 | ) | (139 | ) | (9,303 | ) | (1,903) | (1,016) | (1,231) | (2,109) | (2,524) | (844) | (9,627) | ||||||||||
| OPERATING INCOME | 6,511 | 9,759 | 879 | (675 | ) | 16,474 | |||||||||||||||||||||
| CAPITAL EXPENDITURE | 2,021 | 5,455 | 3,152 | 216 | 10,844 | ||||||||||||||||||||||
| INVESTMENTS IN ASSOCIATES | 1 | 71 | - | 5,140 | 5,212 | ||||||||||||||||||||||
| FIXED ASSETS | 14,179 | 45,459 | 29,329 | 1,438 | 90,405 | ||||||||||||||||||||||
| TOTAL ALLOCATED ASSETS | 23,291 | 64,963 | 36,199 | 5,322 | 129,775 | ||||||||||||||||||||||
| TOTAL ALLOCATED LIABILITIES | 11,021 | 29,093 | 10,333 | 47,644 | 98,091 | ||||||||||||||||||||||
| Operating income | 4,437 | 621 | 77 | 1,831 | 3,007 | (523) | 9,450 | ||||||||||||||||||||
| Capital expenditures | 1,529 | 1,385 | 666 | 2,127 | 3,118 | 570 | 9,395 | ||||||||||||||||||||
| Investments accounted for by the equity method | 6 | 11 | − | 2 | 1 | 2,404 | 2,424 | ||||||||||||||||||||
| Fixed assets | 14,191 | 10,781 | 9,143 | 20,648 | 16,071 | 2,188 | 73,022 | ||||||||||||||||||||
| Total allocated assets | 18,895 | 13,144 | 11,682 | 27,324 | 24,432 | 23,385 | 118,862 | ||||||||||||||||||||
| Total allocated liabilities | 9,258 | 4,051 | 3,213 | 8,294 | 16,177 | 50,387 | 91,380 | ||||||||||||||||||||
2009 (revised1) | |||||||||||||||||||||||||||
2012 (*) | 2012 (*) | ||||||||||||||||||||||||||
| Millions of euros | Telefónica Spain | Telefónica Latin America | Telefónica Europe | Other and eliminations | Total Group | Telefónica Spain | Telefónica UK | Telefónica Germany | Telefónica Brazil | Telefónica Hispanoamérica | Other and eliminations | Total Group | |||||||||||||||
| Revenues | 19,703 | 22,709 | 13,954 | 365 | 56,731 | 14,996 | 7,042 | 5,213 | 13,618 | 16,741 | 4,746 | 62,356 | |||||||||||||||
| External revenues | 19,354 | 22,600 | 13,653 | 1,124 | 56,731 | 14,725 | 6,922 | 5,186 | 13,585 | 16,638 | 5,300 | 62,356 | |||||||||||||||
| Inter-segment revenues | 349 | 109 | 301 | (759 | ) | - | 271 | 120 | 27 | 33 | 103 | (554) | − | ||||||||||||||
| Other operating income and expenses | (9,946 | ) | (13,668 | ) | (9,955 | ) | (559 | ) | (34,128 | ) | (8,181) | (5,440) | (3,862) | (8,457) | (10,758) | (4,427) | (41,125) | ||||||||||
| OIBDA | 9,757 | 9,041 | 3,999 | (194 | ) | 22,603 | 6,815 | 1,602 | 1,351 | 5,161 | 5,983 | 319 | 21,231 | ||||||||||||||
| Depreciation and amortization | (2,140 | ) | (3,700 | ) | (2,988 | ) | (128 | ) | (8,956 | ) | (2,063) | (995) | (1,233) | (2,318) | (2,762) | (1,062) | (10,433) | ||||||||||
| OPERATING INCOME | 7,617 | 5,341 | 1,011 | (322 | ) | 13,647 | |||||||||||||||||||||
| CAPITAL EXPENDITURE | 1,863 | 3,377 | 1,801 | 216 | 7,257 | ||||||||||||||||||||||
| INVESTMENTS IN ASSOCIATES | 3 | 152 | - | 4,781 | 4,936 | ||||||||||||||||||||||
| FIXED ASSETS | 14,082 | 24,441 | 27,537 | 1,351 | 67,411 | ||||||||||||||||||||||
| TOTAL ALLOCATED ASSETS | 26,156 | 42,336 | 32,994 | 6,655 | 108,141 | ||||||||||||||||||||||
| TOTAL ALLOCATED LIABILITIES | 13,363 | 22,614 | 6,769 | 41,121 | 83,867 | ||||||||||||||||||||||
| Operating income | 4,752 | 607 | 118 | 2,843 | 3,221 | (743) | 10,798 | ||||||||||||||||||||
| Capital expenditures | 1,692 | 748 | 609 | 2,444 | 2,988 | 977 | 9,458 | ||||||||||||||||||||
| Investments accounted for by the equity method | 4 | − | 1 | 2 | 2,461 | 2,468 | |||||||||||||||||||||
| Fixed assets | 14,618 | 10,636 | 9,713 | 24,743 | 17,327 | 8,025 | 85,062 | ||||||||||||||||||||
| Total allocated assets | 19,848 | 13,451 | 11,701 | 33,926 | 26,793 | 24,054 | 129,773 | ||||||||||||||||||||
| Total allocated liabilities | 10,623 | 3,161 | 2,718 | 10,212 | 17,811 | 57,587 | 102,112 | ||||||||||||||||||||
The composition of segment revenues, detailed by the main countries in which the Group operates, is as follows:
| Millions of euros | ||||||||||||||||||||||||||||||||||||||||||||||||
| 2011 | 2010 (revised1) | 2009 (revised1) | ||||||||||||||||||||||||||||||||||||||||||||||
| Country | Fixed | Mobile | Other and eliminations | Total | Fixed | Mobile | Other and eliminations | Total | Fixed | Mobile | Other and eliminations | Total | ||||||||||||||||||||||||||||||||||||
| Spain | 10,631 | 7,747 | (1,094 | ) | 17,284 | 11,397 | 8,550 | (1,236 | ) | 18,711 | 12,167 | 8,965 | (1,429 | ) | 19,703 | |||||||||||||||||||||||||||||||||
| Latin America | 29,237 | 25,756 | 22,709 | |||||||||||||||||||||||||||||||||||||||||||||
| Brazil | 5,890 | 8,436 | (1,799 | ) | 14,326 | 6,843 | 4,959 | (683 | ) | 11,119 | 5,766 | 3,036 | (426 | ) | 8,376 | |||||||||||||||||||||||||||||||||
| Argentina | 1,237 | 2,039 | (102 | ) | 3,174 | 1,187 | 1,979 | (93 | ) | 3,073 | 1,047 | 1,643 | (81 | ) | 2,609 | |||||||||||||||||||||||||||||||||
| Chile | 1,037 | 1,399 | (126 | ) | 2,310 | 1,038 | 1,266 | (107 | ) | 2,197 | 893 | 1,010 | (72 | ) | 1,831 | |||||||||||||||||||||||||||||||||
| Peru | 1,069 | 1,088 | (127 | ) | 2,030 | 1,097 | 1,001 | (138 | ) | 1,960 | 1,006 | 840 | (130 | ) | 1,716 | |||||||||||||||||||||||||||||||||
| Colombia | 682 | 916 | (37 | ) | 1,561 | 700 | 872 | (43 | ) | 1,529 | 615 | 685 | (31 | ) | 1,269 | |||||||||||||||||||||||||||||||||
| Mexico | N/A | 1,557 | N/A | 1,557 | N/A | 1,832 | - | 1,832 | N/A | 1,552 | - | 1,552 | ||||||||||||||||||||||||||||||||||||
| Venezuela | N/A | 2,688 | N/A | 2,688 | N/A | 2,318 | - | 2,318 | N/A | 3,773 | - | 3,773 | ||||||||||||||||||||||||||||||||||||
| Remaining operators and inter-segment eliminations | 1,591 | 1,728 | 1,583 | |||||||||||||||||||||||||||||||||||||||||||||
| Europe | 15,524 | 15,724 | 13,954 | |||||||||||||||||||||||||||||||||||||||||||||
| UK | 164 | 6,762 | - | 6,926 | 134 | 7,067 | - | 7,201 | 70 | 6,442 | - | 6,512 | ||||||||||||||||||||||||||||||||||||
| Germany | 1,426 | 3,609 | - | 5,035 | 1,412 | 3,414 | - | 4,826 | 558 | 3,188 | - | 3,746 | ||||||||||||||||||||||||||||||||||||
| Czech Republic | 913 | 1,217 | - | 2,130 | 960 | 1,237 | - | 2,197 | 1,015 | 1,248 | (3 | ) | 2,260 | |||||||||||||||||||||||||||||||||||
| Ireland | 12 | 711 | N/A | 723 | 4 | 844 | - | 848 | 1 | 904 | - | 905 | ||||||||||||||||||||||||||||||||||||
| Remaining operators and inter-segment eliminations | 710 | 652 | 531 | |||||||||||||||||||||||||||||||||||||||||||||
| Other and inter-segment eliminations | 792 | 546 | 365 | |||||||||||||||||||||||||||||||||||||||||||||
| Total Group | 62,837 | 60,737 | 56,731 | |||||||||||||||||||||||||||||||||||||||||||||
| Millions of euros | 2014 | 2013 | 2012 | |||||||||||||||||||||
| Country | Fixed | Mobile | Other and elims. | Total | Fixed | Mobile | Other and elims. | Total | Fixed | Mobile | Other and elims. | Total | ||||||||||||
| Spain | 8,543 | 4,556 | (1,076) | 12,023 | 8,861 | 5,121 | (1,023) | 12,959 | 9,541 | 6,464 | (1,009) | 14,996 | ||||||||||||
| UK | − | 7,062 | − | 7,062 | − | 6,692 | − | 6,692 | 242 | 6,800 | − | 7,042 | ||||||||||||
| Germany | 1,138 | 4,375 | 9 | 5,522 | 1,235 | 3,673 | 6 | 4,914 | 1,363 | 3,845 | 5 | 5,213 | ||||||||||||
| Brazil | 3,613 | 7,618 | − | 11,231 | 4,125 | 8,092 | − | 12,217 | 5,045 | 8,573 | − | 13,618 | ||||||||||||
| Hispanoamérica | 3,604 | 9,578 | (27) | 13,155 | 4,272 | 13,020 | (437) | 16,855 | 4,424 | 12,724 | (407) | 16,741 | ||||||||||||
| Argentina | 1,055 | 2,008 | − | 3,063 | 1,247 | 2,434 | − | 3,681 | 1,274 | 2,423 | − | 3,697 | ||||||||||||
| Chile | 842 | 1,247 | − | 2,089 | 988 | 1,495 | − | 2,483 | 1,045 | 1,524 | − | 2,569 | ||||||||||||
| Peru | 1,077 | 1,427 | − | 2,504 | 1,121 | 1,333 | − | 2,454 | 1,135 | 1,265 | − | 2,400 | ||||||||||||
| Colombia | 629 | 1,090 | − | 1,719 | 652 | 1,053 | − | 1,705 | 695 | 1,070 | − | 1,765 | ||||||||||||
| Mexico | − | 1,649 | − | 1,649 | − | 1,580 | − | 1,580 | − | 1,596 | − | 1,596 | ||||||||||||
| Venezuela and Central America | − | 1,420 | − | 1,420 | − | 4,228 | − | 4,228 | − | 4,009 | − | 4,009 | ||||||||||||
| Remaining operators and segment eliminations | 1 | 737 | (27) | 711 | 264 | 897 | (437) | 724 | 275 | 837 | (407) | 705 | ||||||||||||
Other and inter-segment eliminations (1) | 1,384 | 3,424 | 4,746 | |||||||||||||||||||||
| Total Group | 50,377 | 57,061 | 62,356 | |||||||||||||||||||||
Note: In some operating business of Telefónica Hispanoamérica segment, the breakdown of revenues is presented allocating intercompany eliminations to fixed and mobile businesses. Therefore, the comparative information for the years 2013 and 2012 has been revised. (1) "Other and inter-segment eliminations" included in 2013 revenues in Czech Republic amounted to 1,818 million euros (2,010 million euros in 2012) and revenues in Ireland amounted to 556 million euros (629 million euros in 2012). | ||||||||||||||||||||||||
| 2011 | ||||||||||||||||
| Millions of euros | Telefónica Latin America | Telefónica Europe | Other and eliminations | Total Group | ||||||||||||
| Revenues | 28,941 | 32,074 | 1,822 | 62,837 | ||||||||||||
| External revenues | 28,831 | 31,891 | 2,115 | 62,837 | ||||||||||||
| Inter-segment revenues | 110 | 183 | (293 | ) | - | |||||||||||
| Other operating income and expenses | (18,057 | ) | (22,803 | ) | (1,767 | ) | (42,627 | ) | ||||||||
| OIBDA | 10,884 | 9,271 | 55 | 20,210 | ||||||||||||
| Depreciation and amortization | (4,770 | ) | (5,076 | ) | (300 | ) | (10,146 | ) | ||||||||
| OPERATING INCOME | 6,114 | 4,195 | (245 | ) | 10,064 | |||||||||||
| CAPITAL EXPENDITURE | 5,263 | 4,515 | 446 | 10,224 | ||||||||||||
| INVESTMENTS IN ASSOCIATES | 3 | 1 | 5,061 | 5,065 | ||||||||||||
| FIXED ASSETS | 43,716 | 42,584 | 2,334 | 88,634 | ||||||||||||
| TOTAL ALLOCATED ASSETS | 65,475 | 55,738 | 8,410 | 129,623 | ||||||||||||
| TOTAL ALLOCATED LIABILITIES | 27,124 | 21,910 | 53,206 | 102,240 | ||||||||||||
Business combinations
Acquisition of Acens Technologies, S.L.E-Plus
On June 7, 2011, theJuly 23, 2013 Telefónica, Group formalized the acquisition ofS.A. and its listed German subsidiary Telefónica Deutschland Holding, A.G. (Telefónica Deutschland) signed a contract (subsequently amended until a final version was produced on September 30, 2014) with Koninklijke KPN, N.V. (hereinafter, KPN), whereby Telefónica Deutschland undertook to buy up 100% of Acens Technologies, S.L., a leader in hosting/housing in Spain for small- and medium-sized enterprises.
In accordanceaddition, in the context of this transaction, Telefónica, S.A. entered into an agreement with IFRS 3,KPN to buy a 4.4% stake of Telefonica Deutschland for 1,300 million euros, and a call option agreement that will entitle Telefónica, S.A. to acquire an additional stake of up to 2.9% in this company, such right being exercisable on the Group optedfirst anniversary of the closing date at a strike price of up to record at fair value the non-controlling interests of Vivo Participaçoes, S.A. corresponding to non-voting shares, determining such fair value based on a discounted cash flows valuation determined in accordance with the company's business plans.510 million euros.
On July 2, 2014 the European Commission issued conditional authorization for Telefónica proceededDeutschland to recognize and valuepurchase E-Plus. Final authorization by the identifiable assetsEuropean Commission for the purchase of E-Plus was obtained on August 29, 2014.
On October 1, 2014, following the share capital increase by Telefónica Deutschland to finance the purchase of E-Plus, the latter was finally acquired and liabilities assumed at the date ofby Telefónica Deutschland. Telefónica then purchased a 4.4% stake in Telefónica Deutschland from KPN, thereby reducing KPN's stake in Telefónica Deutschland to 20.5%. The Telefónica Group considerers these two transactions together, as a single acquisition.
The fair value of the ordinary shares of Telefonica Deutschland delivered to KPN as part of payment was calculated on the basis of their opening price at the date of closing of the operation (October 1, 2014). As a result of the difference between the fair value and the carrying amount of Telefónica Deutschland’s net assets, the dilution of the Group’s percentage stake had an adverse effect on “Equity attributable to the parent company” in the amount of 307 million euros, under “Retained earnings”.
The following table sets out the consideration paid, the fair values of the assets and liabilities identified at the time of purchase, and the goodwill generated. At the time these consolidated financial statements were drawn up, the purchase price allocation process had not been completed, and thus changes may be made to the fair values of the assets and liabilities, particularly the licenses was determined throughfor the use of spectrum, for which there are certain pending regulatory analyses (see Appendix VII). In addition, the Multi-periodfinal adjustment to the cash consideration, based on the determination of working capital and net debt as established in the aforementioned share purchase agreement, has not yet been completed.
| Million euros | |
| Cash payment | 4,936 |
| Fair value of the T. Deutschland shares purchased by KPN | 2,527 |
| Consideration paid | 7,463 |
| Intangible assets | 4,328 |
| Customer relationships | 2,718 |
| Frequency usage rights | 1,342 |
| Other intangible assets | 268 |
| Property, plant and equipment | 1,931 |
| Inventories | 21 |
| Trade and other receivables | 677 |
| Other financial assets | 19 |
| Other non-financial assets | 93 |
| Cash and cash equivalents | 396 |
| Deferred revenue | (220) |
| Provisions | (254) |
| Interest-bearing debt | (505) |
| Current trade and other payables | (709) |
| Fair value of net assets | 5,777 |
| Goodwill (Note 7) | 1,686 |
Frequency usage rights were valued using the Greenfield method, which consists of the valuation of a hypothetical newly created company that starts its business with no assets except the asset being measured. The cash flows attributable to the build-up and operation of the company are determined and discounted to the present value.
Customer relationships were valued using the MEEM (“Multiple Excess Earnings Method (MEEM)Method”), which is based on acalculating the discounted cash flows analysis ofreflecting the estimated future economic benefits attributable to the licenses, net of the elimination of charges related to contributing assets involved in the generation of such cash flows and excluding cash flows attributable to the customer base.
The objectivedetail of the analysis of useful lives is to estimate a survival curve that predicts future customer churn of our current customer base. The so-called “Iowa curves” were considered to approximate the survival curve of customers.
| Brasilcel, N.V. | ||||||||
| Millions of euros | Carrying amount | Fair value | ||||||
| Intangible assets | 3,466 | 8,401 | ||||||
| Goodwill | 932 | N/A | ||||||
| Property, plant and equipment | 2,586 | 2,586 | ||||||
| Other non-current assets | 1,921 | 1,953 | ||||||
| Other current assets | 3,101 | 3,101 | ||||||
| Financial liabilities | (1,913 | ) | (1,913 | ) | ||||
| Deferred tax liabilities | (828 | ) | (2,506 | ) | ||||
| Other liabilities and current liabilities | (3,046 | ) | (3,203 | ) | ||||
| Value of net assets | 6,219 | 8,419 | ||||||
| Purchase consideration cost | 18,408 | |||||||
| Goodwill (Note 7) | - | 9,989 | ||||||
| Millions of euros | Gross amount | Impairment | Preliminary fair value |
| Trade receivables | 797 | (164) | 633 |
| Other receivables | 44 | - | 44 |
| Total trade and other receivables | 841 | (164) | 677 |
full consolidation method. Had the acquisition occurred on January 1, 2010,2014, the Telefónica Group’sGroup’s revenues and operating income excluding the impact of the related depreciationprofit for the year would have beenreached approximately 2,400 million52,640 and 890 million euros higher, respectively.
Transactions with non-controlling interests
2014
No material transactions with non-controlling interests were carried out that were significant for the Group in 2014, except for those detailed above regarding the E-Plus acquisition.
2013
Sale of 40% of the stake in Telefónica’s subsidiaries in Guatemala, El Salvador, Nicaragua and Panama
In April 2013 Telefónica reached an agreement with Corporación Multi Inversiones to sell 40% of Telefónica’s stake in its subsidiaries in Guatemala, El Salvador, Nicaragua and Panama, through Telefónica Centroamérica Inversiones, S.L.
The complete carrying amounts, fair values, goodwill and purchase consideration costclosing of the identifiable assets acquired andtransaction was on August 2, 2013, upon the liabilities assumed in this transaction atfulfillment of the sale conditions. The value of the sale amounted to 500 million U.S. dollars (equivalent to 377 million euros on the date control was obtained are as follows:
| HanseNet | ||||||||
| Millions of euros | Carrying amount | Fair value | ||||||
| Intangible assets | 277 | 309 | ||||||
| Goodwill | 461 | N/A | ||||||
| Property, plant and equipment | 514 | 531 | ||||||
| Other assets | 191 | 235 | ||||||
| Financial liabilities | (657 | ) | (665 | ) | ||||
| Deferred tax liabilities | - | (101 | ) | |||||
| Other liabilities and current liabilities | (303 | ) | (356 | ) | ||||
| Value of net assets | 483 | (47 | ) | |||||
| Purchase consideration cost | - | 235 | ||||||
| Goodwill (Note 7) | - | 282 | ||||||
The contributions to the Telefónica Group’s revenues and operating income excluding the impact of the related depreciation from the consolidation of HanseNet in 2010 amounted to 786 million and 77 million euros, respectively.
Public offering of shares in Telefónica Deutschland Holding, A.G.
On October 29, 2012, the public offering of shares of the subsidiary Telefónica Deutschland Holding, A.G. was finalized, corresponding to 23.17% of the capital of that company.
Note 6. Intangible assets
The composition of and movements in net intangible assets in 20112014 and 20102013 are as follows:
| Millions of euros | ||||||||||||||||||||||||||||||||||||||||||||||||||||||
Balance at 12/31/10 | Transfers and other | Inclusion of Companies | ||||||||||||||||||||||||||||||||||||||||||||||||||||
| Translation | Exclusion of Companies | Balance at 12/31/11 | ||||||||||||||||||||||||||||||||||||||||||||||||||||
| Additions | Amortization | Disposals | differences and hyperinflation adjustments | |||||||||||||||||||||||||||||||||||||||||||||||||||
| Development costs | 206 | 106 | (68 | ) | - | (34 | ) | (1 | ) | - | - | 209 | ||||||||||||||||||||||||||||||||||||||||||
| Millions of euros | Balance at 12/31/2013 | Additions | Amortization | Disposals | Transfers and others | Translation differences and hyperinflation adjustments | Inclusion of companies | Exclusion of companies | Balance at 12/31/2014 | |||||||||||||||||||||||||||||||||||||||||||||
| Service concession arrangements and licenses | 14,566 | 503 | (1,041 | ) | (8 | ) | 1,387 | (643 | ) | - | - | 14,764 | 12,034 | 1,294 | (1,154) | − | 31 | 58 | 1,342 | − | 13,605 | |||||||||||||||||||||||||||||||||
| Software | 3,526 | 1,249 | (1,588 | ) | (2 | ) | 610 | (63 | ) | - | - | 3,732 | 3,044 | 665 | (1,432) | (5) | 632 | (143) | 144 | − | 2,905 | |||||||||||||||||||||||||||||||||
| Customer base | 3,143 | - | (595 | ) | - | 1 | (73 | ) | 26 | - | 2,502 | 1,022 | − | (349) | − | (47) | 22 | 2,718 | − | 3,366 | ||||||||||||||||||||||||||||||||||
| Other intangible assets | 2,172 | 26 | (184 | ) | (4 | ) | (41 | ) | (53 | ) | - | - | 1,916 | 1,487 | 40 | (256) | (4) | 12 | 30 | 121 | − | 1,430 | ||||||||||||||||||||||||||||||||
| Prepayments on intangible assets | 1,413 | 953 | - | - | (1,422 | ) | (3 | ) | - | - | 941 | |||||||||||||||||||||||||||||||||||||||||||
| Net intangible assets | 25,026 | 2,837 | (3,476 | ) | (14 | ) | 501 | (836 | ) | 26 | - | 24,064 | ||||||||||||||||||||||||||||||||||||||||||
| Intangible assets in process | 961 | 389 | − | − | (314) | 8 | 3 | − | 1,047 | |||||||||||||||||||||||||||||||||||||||||||||
| Total intangible assets | 18,548 | 2,388 | (3,191) | (9) | 314 | (25) | 4,328 | − | 22,353 | |||||||||||||||||||||||||||||||||||||||||||||
| Millions of euros | ||||||||||||||||||||||||||||||||||||||||||||||||||||||
| Translation | ||||||||||||||||||||||||||||||||||||||||||||||||||||||
Balance at 12/31/09 | Additions | Amortization | Disposals | Transfers and other | differences and hyperinflation adjustment | Inclusion of Companies | Exclusion of Companies | Balance at 12/31/10 | ||||||||||||||||||||||||||||||||||||||||||||||
| Development costs | 162 | 104 | (55 | ) | - | (18 | ) | 2 | 11 | - | 206 | |||||||||||||||||||||||||||||||||||||||||||
| Millions of euros | Balance at 12/31/2012 | Additions | Amortization | Disposals | Transfers and others | Translation differences and hyperinflation adjustments | Inclusion of companies | Exclusion of companies | Balance at 12/31/2013 | |||||||||||||||||||||||||||||||||||||||||||||
| Service concession arrangements and licenses | 8,842 | 1,237 | (836 | ) | - | 61 | 623 | 4,639 | - | 14,566 | 13,545 | 1,223 | (1,116) | − | (406) | (1,212) | − | − | 12,034 | |||||||||||||||||||||||||||||||||||
| Software | 2,948 | 945 | (1,381 | ) | - | 558 | 134 | 322 | - | 3,526 | 3,529 | 717 | (1,701) | (8) | 709 | (202) | − | − | 3,044 | |||||||||||||||||||||||||||||||||||
| Customer base | 2,681 | - | (563 | ) | - | (141 | ) | 134 | 1,032 | - | 3,143 | 1,932 | 1 | (415) | − | (360) | (136) | − | − | 1,022 | ||||||||||||||||||||||||||||||||||
| Other intangible assets | 1,139 | 41 | (309 | ) | (18 | ) | 166 | 50 | 1,103 | - | 2,172 | 1,839 | 66 | (216) | (8) | (86) | (108) | − | − | 1,487 | ||||||||||||||||||||||||||||||||||
| Prepayments on intangible assets | 74 | 1,638 | - | - | (324 | ) | 5 | 20 | - | 1,413 | ||||||||||||||||||||||||||||||||||||||||||||
| Net intangible assets | 15,846 | 3,965 | (3,144 | ) | (18 | ) | 302 | 948 | 7,127 | - | 25,026 | |||||||||||||||||||||||||||||||||||||||||||
| Intangible assets in process | 1,233 | 302 | − | (2) | (561) | (11) | − | − | 961 | |||||||||||||||||||||||||||||||||||||||||||||
| Total intangible assets | 22,078 | 2,309 | (3,448) | (18) | (704) | (1,669) | − | − | 18,548 | |||||||||||||||||||||||||||||||||||||||||||||
The gross cost, accumulated amortization and impairment losses of intangible assets at December 31, 20112014 and 20102013 are as follows:
| Balance at December 31, 2011 | ||||||||||||||||||||
| Gross cost | Accumulated amortization | Impairment losses | Net intangible assets | |||||||||||||||||
| Balance at 12/31/2014 | ||||||||||||||||||||
| Millions of euros | Gross cost | Accumulated amortization | Impairment losses | Net intangible assets | Gross cost | Accumulated amortization | Impairment losses | Intangible assets | ||||||||||||
| Development costs | ||||||||||||||||||||
| Service concession arrangements and licenses | 22,297 | (8,692) | − | 13,605 | ||||||||||||||||
| Software | 15,081 | (11,326 | ) | (23 | ) | 3,732 | 14,168 | (11,260) | (3) | 2,905 | ||||||||||
| Customer base | 6,181 | (3,679 | ) | - | 2,502 | 5,974 | (2,606) | (2) | 3,366 | |||||||||||
| Other intangible assets | 3,358 | (1,437 | ) | (5 | ) | 1,916 | 3,647 | (2,212) | (5) | 1,430 | ||||||||||
| Prepayments on intangible assets | 941 | - | - | 941 | ||||||||||||||||
| Net intangible assets | 47,576 | (23,484 | ) | (28 | ) | 24,064 | ||||||||||||||
| Intangible assets in process | 1,046 | − | 1 | 1,047 | ||||||||||||||||
| Intangible assets | 47,132 | (24,770) | (9) | 22,353 | ||||||||||||||||
| Balance at December 31, 2010 | ||||||||||||||||||||
| Gross cost | Accumulated amortization | Impairment losses | Net | |||||||||||||||||
| intangible | ||||||||||||||||||||
| Balance at 12/31/2013 | Balance at 12/31/2013 | |||||||||||||||||||
| Millions of euros | Gross cost | Accumulated amortization | Impairment losses | assets | Gross cost | Accumulated amortization | Impairment losses | Intangible assets | ||||||||||||
| Development costs | 206 | |||||||||||||||||||
| Service concession arrangements and licenses | 14,566 | 19,763 | (7,729) | − | 12,034 | |||||||||||||||
| Software | 13,724 | (10,172 | ) | (26 | ) | 3,526 | 14,320 | (11,259) | (17) | 3,044 | ||||||||||
| Customer base | 6,481 | (3,338 | ) | - | 3,143 | 4,257 | (3,235) | − | 1,022 | |||||||||||
| Other intangible assets | 3,445 | (1,269 | ) | (4 | ) | 2,172 | 3,433 | (1,938) | (8) | 1,487 | ||||||||||
| Prepayments on intangible assets | 1,413 | - | - | 1,413 | ||||||||||||||||
| Net intangible assets | 46,730 | (21,674 | ) | (30 | ) | 25,026 | ||||||||||||||
| Intangible assets in process | 962 | − | (1) | 961 | ||||||||||||||||
| Intangible assets | 42,735 | (24,161) | (26) | 18,548 | ||||||||||||||||
Outstanding among “Additions” in 2014 is the acquisition by Telefónica Brasil of a LTE block in the 700 MHz band, for 889 million euros. Additions in 2014 include also LTE licenses acquired by the Telefonica operating companies in Argentina, Colombia, Panama, Venezuela and Nicaragua, for 405 million euros.
"Additions" in 2013 include Telefónica UK Ltd.’s acquisition of two 10 MHz blocks in the 800 MHz spectrum band for 719 million euros.
The spectrum licenses in Spainthe 800 MHz and 900 MHz acquired by Telefónica Móviles España in 2011 for 842 million euros (of which 793 million euros are recognized under “Intangible assets in process” as prepayments ontheir availability will begin in 2015.
The net balance of “Transfers and others” for 2013 primarily includes the reclassification to “Non-current assets held for sale” of the intangible assets as the licenses had not yet started), the acquisition of spectrum in band H (1.9 GHz/2.1GHz) in Brazil for 349 million euros, the acquisition of spectrum licenses in Costa Rica for 68 million euros and the acquisition of software.
Details of the principal concessions and licenses with which the Group operates are provided in Appendix VI.
“Other intangible assets” includes the amounts allocated to trademarks acquired in business combinations, of 2,2922,119 million euros and 2,3391,951 million euros at December 31, 20112014 and 2010 (1,4492013, respectively (1,133 million euros and 1,5861,071 million euros, respectively, net of the related accumulated amortization), respectively..
Note 7. Goodwill
The movement in this heading assigned to each Group segment was the following:
| Millions of euros | ||||||||||||||||||||||||
| 2011 | Balance at 12/31/10 | Acquisitions | Disposals | Transfers | Translation differences and hyperinflation adjustments | Balance at 12/31/11 | ||||||||||||||||||
| Telefónica Spain | 3,280 | 52 | - | - | - | 3,332 | ||||||||||||||||||
| Telefónica Latin America | 15,672 | - | - | (2 | ) | (626 | ) | 15,044 | ||||||||||||||||
| Telefónica Europe | 10,421 | - | (3 | ) | 2 | 110 | 10,530 | |||||||||||||||||
| Other | 209 | - | - | - | (8 | ) | 201 | |||||||||||||||||
| Total | 29,582 | 52 | (3 | ) | - | (524 | ) | 29,107 | ||||||||||||||||
| 2014 | |||||
| Millions of euros | Balance at 12/31/13 | Acquisitions | Transfers | Translation differences and hyperinflation adjustments | Balance at 12/31/14 |
| Telefónica Spain | 3,332 | − | − | − | 3,332 |
| Telefónica Brazil | 8,392 | − | − | 15 | 8,407 |
| Telefónica Germany | 2,779 | 1,686 | (4) | − | 4,461 |
| Telefónica United Kingdom | 4,948 | − | − | 348 | 5,296 |
| Telefonica Hispanoamérica | 3,748 | − | − | (383) | 3,365 |
| Others | 235 | 1 | − | 14 | 250 |
| Total | 23,434 | 1,687 | (4) | (6) | 25,111 |
| 2013 | |||||
| Millions of euros | Balance at 12/31/12 | Acquisitions | Transfers | Translation differences and hyperinflation adjustments | Balance at 12/31/13 |
| Telefónica Spain | 3,332 | − | − | − | 3,332 |
| Telefónica Brazil | 10,056 | − | − | (1,664) | 8,392 |
| Telefónica Germany | 2,779 | − | − | − | 2,779 |
| Telefónica United Kingdom | 5,055 | − | − | (107) | 4,948 |
| Telefónica Hispanoamérica | 4,210 | − | − | (462) | 3,748 |
| Others | 2,531 | 2 | (2,089) | (209) | 235 |
| Total | 27,963 | 2 | (2,089) | (2,442) | 23,434 |
| Millions of euros | ||||||||||||||||||||||||
| 2010 | Balance at 12/31/09 | Acquisitions | Disposals | Transfers | Translation differences and hyperinflation adjustments | Balance at 12/31/10 | ||||||||||||||||||
| Telefónica Spain | 3,238 | 42 | - | - | - | 3,280 | ||||||||||||||||||
| Telefónica Latin America | 6,320 | 9,201 | - | (350 | ) | 501 | 15,672 | |||||||||||||||||
| Telefónica Europe | 9,810 | 397 | (37 | ) | - | 251 | 10,421 | |||||||||||||||||
| Other | 198 | - | - | - | 11 | 209 | ||||||||||||||||||
| Total | 19,566 | 9,640 | (37 | ) | (350 | ) | 763 | 29,582 | ||||||||||||||||
| 12/31/2014 | 12/31/2013 | |
| Telefónica Spain | 3,332 | 3,332 |
| Telefónica Brazil | 8,407 | 8,392 |
| Telefónica Germany | 4,461 | 2,779 |
| Telefónica United Kingdom | 5,296 | 4,948 |
| Telefónica Hispanoamérica | 3,365 | 3,748 |
| Chile | 978 | 996 |
| Peru | 788 | 738 |
| Mexico | 558 | 554 |
| Argentina | 349 | 403 |
| Others Telefónica Hispanoamérica | 692 | 1,057 |
| Others | 250 | 235 |
| TOTAL | 25,111 | 23,434 |
Main assumptions used in calculating value in use
Value in use is calculated for the various countriesCGUs based on the approved business plans and taking into account certain variables such as the OIBDA margin and the CAPEX ratio for non-current assets, expressed as a percentage of revenue, and discount and perpetuity growth rates. Following is a description of the principal variables considered for each CGU with significant goodwill (Brazil, Spain, Germany and United Kingdom).
OIBDA margin and long-term Capital Expenditure (CapEx)
The values obtained as described in the preceding paragraphs are compared with available data of our competitors in the geographical markets in which the Group operates, combinedoperates. This analysis has identified that the OIBDA margin determined for the operations in Spain, Germany and United Kingdom is in line with the hyperinflationary adjustmentaverage for European peers, which stands at approximately 33%. With respect to the ratio of CapEx over revenues, over the term of the strategic plan, the Group’s European operators invest at a percentage of revenue that lies at the bottom end of the range for peers in Venezuela, ledthe region. The OIBDA margin for Brazil is in line with the average for peers in emerging markets of approximately 36%. Over the term of the strategic plan, the Group’s operator in Brazil invests a percentage located in the lower range estimated as the average for its peers.
Discount rate
The discount rate, applied to measure free cash flow, is the weighted average cost of capital (WACC), determined by the weighted average cost of equity and debt according the finance structure established for each CGU.
This rate is calculated using the capital asset pricing model (CAPM), which takes into account the asset’s systemic risk, and the impact of risks on cash flows not generated internally, such as country risk, business-specific credit risk, currency risk and price risk specific to the financial asset. The data used in these calculations are obtained from independent and renowned external information sources.
The discount rates applied to the cash flow projections in 2014 and 2013 are as follows:
| Discount rate in local currency | 2014 | 2013 |
| Spain | 6.1% | 6.3% |
| Brazil | 10.9% | 11.6% |
| United Kingdom | 6.2% | 6.1% |
| Germany | 5.5% | 5.3% |
The main variation relates to Brazil, where a combination of a reduction in the systemic risk and an improvement in the terms of financing in U.S. dollars has contributed to the decrease in the discount rate.
Perpetuity growth rate
In all cases, impairment tests are performed using the projected cash flows estimated according to the strategic plans over a five-year period. Cash flow projections as from the sixth year are calculated using an expected constant growth rate, taking as the perpetuity growth rate consensus estimates among analysts for each business and country, based on the maturity of the industry depending on technology and the degree of development of each country. Each indicator is compared to the forecasted long-term GDP growth of each country and growth data from external sources, adjusted for any specific characteristics of the business.
The perpetuity growth rates applied to the cash flow projections in 2014 and 2013 are as follows:
Perpetuity growth rate in local currency | 2014 | 2013 |
| Spain | 0.8% | 0.8% |
| Brazil | 4.8% | 5.0% |
| United Kingdom | 1.0% | 1.0% |
| Germany | 1.2% | 1.1% |
In the case of Brazil, although the perpetuity growth rate in nominal terms is above 3%, it is in line with the Brazilian Central Bank’s medium-term inflation target (4.5%, within a range of ±2 p.p.) and is below the analyst consensus forecasted near-term inflation rates of the Strategic Plan (approximately 5%-6%). Stripping out the difference in inflation between Brazil and the Eurozone, the equivalent rate in euros would be below 3% in both years.
Sensitivity to changes in assumptions
The Group carries out a sensitivity analysis of the impairment test by considering reasonable changes in the main assumptions used in such test. For each CGU with significant goodwill (Brazil, Spain, Germany and United Kingdom) the following maximum increases or decreases, expressed in percentage points (p.p.) were assumed:
Changes in key assumptions, In percentage points (p.p.) | Germany Spain United Kingdom | Brazil |
| Financial variables | ||
| Discount rate | +/- 0.5 | +/- 1 |
| Perpetuity growth rates | +/- 0.25 | +/- 0.5 |
| Operating variables | ||
| OIBDA Margin | +/- 2 | +/- 2 |
| Ratio of CAPEX/Revenues | +/- 1 | +/- 1 |
The sensitivity analysis performed at year-end 2014 indicates that there are no significant risks arising from reasonably possible changes in the financial and operating variables, considered individually. In other words, the Company considers that within the above ranges, reasonably wide, no impairment losses would be recognized over the carrying amounts of the CGUs with significant goodwill identified.
Note 8. Property, plant and equipment
The composition of and movement in the items comprising net “Property, plant and equipment” in 20112014 and 20102013 were the following:
| Millions of euros | |||||||||||||||||||||||||||||||||||||||||||||
Balance at 12/31/10 | Translation | Inclusion of Companies | Exclusion of Companies | Balance at 12/31/11 | |||||||||||||||||||||||||||||||||||||||||
| Additions | Depreciation | Disposals | Transfers and other | differences and hyperinflation adjustments | |||||||||||||||||||||||||||||||||||||||||
| Millions of euros | Balance at 12/31/13 | Additions | Depreciation | Disposals | Transfers and others | Translation differences and hyperinflation adjustments | Inclusion of companies | Exclusion of companies | Balance at 12/31/14 | ||||||||||||||||||||||||||||||||||||
| Land and buildings | 6,152 | 252 | (569 | ) | (125 | ) | 381 | (98 | ) | - | - | 5,993 | 5,234 | 70 | (468) | (43) | 360 | (131) | 43 | − | 5,065 | ||||||||||||||||||||||||
| Plant and machinery | 24,206 | 2,015 | (5,398 | ) | (53 | ) | 3,274 | (335 | ) | 3 | (4 | ) | 23,708 | 21,246 | 1,290 | (4,349) | (22) | 4,756 | (814) | 1,712 | − | 23,819 | |||||||||||||||||||||||
| Furniture, tools and other items | 1,947 | 348 | (703 | ) | (3 | ) | 234 | (22 | ) | 12 | (3 | ) | 1,810 | 1,328 | 178 | (540) | (25) | 382 | (20) | 8 | − | 1,311 | |||||||||||||||||||||||
| Total PP&E in service | 32,305 | 2,615 | (6,670 | ) | (181 | ) | 3,889 | (455 | ) | 15 | (7 | ) | 31,511 | ||||||||||||||||||||||||||||||||
| PP&E in progress | 3,259 | 4,574 | - | (4 | ) | (4,122 | ) | 7 | - | - | 3,714 | 3,232 | 5,522 | − | (9) | (5,616) | (149) | 168 | − | 3,148 | |||||||||||||||||||||||||
| Advance payments on PP&E | 8 | 9 | - | - | (5 | ) | - | - | - | 12 | |||||||||||||||||||||||||||||||||||
| Installation materials | 225 | 189 | - | (2 | ) | (176 | ) | (10 | ) | - | - | 226 | |||||||||||||||||||||||||||||||||
| Net PP&E | 35,797 | 7,387 | (6,670 | ) | (187 | ) | (414 | ) | (458 | ) | 15 | (7 | ) | 35,463 | |||||||||||||||||||||||||||||||
| Total PP&E | 31,040 | 7,060 | (5,357) | (99) | (118) | (1,114) | 1,931 | − | 33,343 | ||||||||||||||||||||||||||||||||||||
| Millions of euros | |||||||||||||||||||||||||||||||||||||||||||||
Balance at 12/31/09 | Translation | Inclusion of Companies | Exclusion of Companies | Balance at 12/31/10 | |||||||||||||||||||||||||||||||||||||||||
| Additions | Depreciation | Disposals | Transfers and other | differences and hyperinflation adjustments | |||||||||||||||||||||||||||||||||||||||||
| Millions of euros | Balance at 12/31/12 | Additions | Depreciation | Disposals | Transfers and others | Translation differences and hyperinflation adjustments | Inclusion of companies | Exclusion of companies | Balance at 12/31/13 | ||||||||||||||||||||||||||||||||||||
| Land and buildings | 6,092 | 61 | (538 | ) | (40 | ) | 180 | 332 | 87 | (22 | ) | 6,152 | 6,049 | 51 | (598) | (50) | 119 | (337) | − | 5,234 | |||||||||||||||||||||||||
| Plant and machinery | 21,391 | 1,447 | (4,869 | ) | (57 | ) | 3,750 | 1,198 | 1,390 | (44 | ) | 24,206 | 23,213 | 1,565 | (4,860) | (67) | 3,059 | (1,663) | − | (1) | 21,246 | ||||||||||||||||||||||||
| Furniture, tools and other items | 1,660 | 448 | (752 | ) | - | 339 | 77 | 178 | (3 | ) | 1,947 | 2,007 | 174 | (721) | (27) | 13 | (114) | − | (4) | 1,328 | |||||||||||||||||||||||||
| Total PP&E in service | 29,143 | 1,956 | (6,159 | ) | (97 | ) | 4,269 | 1,607 | 1,655 | (69 | ) | 32,305 | |||||||||||||||||||||||||||||||||
| PP&E in progress | 2,619 | 4,781 | - | (3 | ) | (4,370 | ) | 139 | 100 | (7 | ) | 3,259 | 3,752 | 5,296 | − | (8) | (5,426) | (382) | − | 3,232 | |||||||||||||||||||||||||
| Advance payments on PP&E | 10 | 3 | - | - | (5 | ) | - | - | - | 8 | |||||||||||||||||||||||||||||||||||
| Installation materials | 227 | 139 | - | (16 | ) | (143 | ) | 18 | - | - | 225 | ||||||||||||||||||||||||||||||||||
| Net PP&E | 31,999 | 6,879 | (6,159 | ) | (116 | ) | (249 | ) | 1,764 | 1,755 | (76 | ) | 35,797 | ||||||||||||||||||||||||||||||||
| Total PP&E | 35,021 | 7,086 | (6,179) | (152) | (2,235) | (2,496) | − | (5) | 31,040 | ||||||||||||||||||||||||||||||||||||
The gross cost, accumulated depreciation and impairment losses of property, plant and equipment at December 31, 20112014 and 20102013 are as follows:
| Balance at December 31, 2011 | ||||||||||||||||||||
| Gross cost | Accumulated depreciation | Impairment losses | Net PP&E | |||||||||||||||||
| Balance at December 31, 2014 | Balance at December 31, 2014 | |||||||||||||||||||
| Millions of euros | Gross cost | Accumulated depreciation | Impairment losses | PP&E | ||||||||||||||||
| Land and buildings | 12,522 | (6,526 | ) | (3 | ) | 5,993 | 11,493 | (6,427) | (1) | 5,065 | ||||||||||
| Plant and machinery | 100,692 | (76,961 | ) | (23 | ) | 23,708 | 92,061 | (68,183) | (59) | 23,819 | ||||||||||
| Furniture, tools and other items | 7,463 | (5,571 | ) | (82 | ) | 1,810 | 6,487 | (5,165) | (11) | 1,311 | ||||||||||
| Total PP&E in service | 120,677 | (89,058 | ) | (108 | ) | 31,511 | ||||||||||||||
| PP&E in progress | 3,714 | - | - | 3,714 | 3,160 | − | (12) | 3,148 | ||||||||||||
| Advance payments on PP&E | 12 | - | - | 12 | ||||||||||||||||
| Installation materials | 248 | - | (22 | ) | 226 | |||||||||||||||
| Net PP&E | 124,651 | (89,058 | ) | (130 | ) | 35,463 | ||||||||||||||
| Total PP&E | 113,201 | (79,775) | (83) | 33,343 | ||||||||||||||||
| Balance at December 31, 2010 | ||||||||||||||||
| Gross cost | Accumulated depreciation | Impairment losses | Net PP&E | |||||||||||||
| Land and buildings | 12,372 | (6,216 | ) | (4 | ) | 6,152 | ||||||||||
| Plant and machinery | 100,496 | (76,266 | ) | (24 | ) | 24,206 | ||||||||||
| Furniture, tools and other items | 7,406 | (5,367 | ) | (92 | ) | 1,947 | ||||||||||
| Total PP&E in service | 120,274 | (87,849 | ) | (120 | ) | 32,305 | ||||||||||
| PP&E in progress | 3,259 | - | - | 3,259 | ||||||||||||
| Advance payments on PP&E | 8 | - | - | 8 | ||||||||||||
| Installation materials | 256 | - | (31 | ) | 225 | |||||||||||
| Net PP&E | 123,797 | (87,849 | ) | (151 | ) | 35,797 | ||||||||||
| Balance at December 31, 2013 | ||||
| Millions of euros | Gross cost | Accumulated depreciation | Impairment losses | PP&E |
| Land and buildings | 11,633 | (6,398) | (1) | 5,234 |
| Plant and machinery | 90,723 | (69,420) | (57) | 21,246 |
| Furniture, tools and other items | 6,487 | (5,148) | (11) | 1,328 |
| PP&E in progress | 3,255 | − | (23) | 3,232 |
| Total PP&E | 112,098 | (80,966) | (92) | 31,040 |
“Additions”Inclusion of companies” in 2014 corresponds to the acquisition of E-Plus (see Note 5).
Investment by Telefónica Spain amountin property, plant and equipment in 2014 and 2013 amounted to 1,4111,500 and 1,182 million euros, respectively. Fiber optic was rolled out rapidly, and by year-end 2014 Telefónica Spain reached more than 10 million premises passed in 2011, comparedSpain, and had invested more in LTE networks.
Investment by Telefónica UK in 2014 and 2013 amounted to 1,500617 and 593 million euros, in 2010. Significant investmentsrespectively. The increased investment in the wireline business include thoseUK was due to greater LTE coverage, which outdoor extends to the areas where 58% of the population is concentrated, and a network capacity ramped up to cope with denser 3G and 4G traffic.
Investment by Telefónica Germany in broadband2014 and 2013 amounted to continue with656 and 524 million euros, respectively. The operator continues to focus on its LTE roll-out strategy, securing 61% coverage in 2014. Telefónica Germany consolidated E-Plus as of October , 2014 (see Note 5).
Investment by Telefónica Brazil in 2014 and 2013 amounted to 1,798 and 1,674 million euros, respectively. The mobile segment featured a continuation of LTE roll-outs in 2014, improving network capacity, systems and applications. Investment in the localizedfixed line network was used to expand roll-out of fiber optics, TVoptic, larger volumes of IPTV customers and data services for large corporate customers, as well as the maintenance of the traditional business. Investment in the wireless business mainly went to improving third generation (3G) network capacity.projects.
Investment by Telefónica Latin America’s investmentsHispanoamérica in 20112014 and 20102013 amounted to 4,401 million euros2,282 and 3,9482,742 million euros, respectively. InvestmentHigher levels of investment mainly focused on LTE roll-outs in 2011 focused mainly on the wireless business, mostlypractically all operations in the expansionregion. Investment was also allocated to the densification of coverage and onthe 3G and GSM network, capacity, and onoptimization of fixed-mobile convergence systems, the wireline business, network and plantcontinuation of ultra broad band (UBB) roll-out for fixed broadband by speed upgrades and investment in broadband accounted fornetwork digitalization, television and digital initiatives.
“Disposals” mainly include the bulkimpact of the investment. Customer related investments were also made in bothdisposal by the wireline and wireless businesses.
The impact of the monetary adjustments due to hyperinflation in Venezuela. The effect of exchange rates on movements in the yearVenezuela is included in the column corresponding to such movement.under “Translation differences and hyperinflation adjustments”.
Telefónica Group companies have purchased insurance policies to reasonably cover the possible risks to which their property, plant and equipment used in operations are subject, with suitable limits and coverage. In addition, as part of its commercial activities and network roll-out, the Group maintains several property acquisition commitments. The timing of scheduled payments in this regard is disclosed in Note 19.18.
Property, plant and equipment deriving from finance leases amounted to 648419 million euros at December 31, 2011 (7872014 (463 million euros at December 31, 2010)2013). The most significant finance leases are disclosed in Note 22.
The breakdown of amounts related to associates and joint ventures recognized in the consolidated statements of financial position and income statements related to associates is as follows:
| Millions of euros | ||||||||
| Description | 12/31/11 | 12/31/10 | ||||||
| Investments in associates | 5,065 | 5,212 | ||||||
| Long-term loans to associates (Note 13) | 3 | 604 | ||||||
| Short-term loans to associates | 682 | 43 | ||||||
| Receivables from associates for current operations (Note 11) | 69 | 84 | ||||||
| Loans granted by associates (Note 14) | 347 | 147 | ||||||
| Payables to associates for current operations (Note 14) | 93 | 46 | ||||||
| Revenue from operations with associates | 578 | 518 | ||||||
| Work performed by associates and other operating expenses | 617 | 906 | ||||||
| Share of (loss) profit of associates | (635 | ) | 76 | |||||
| Millions of euros | ||
| 12/31/14 | 12/31/13 | |
| Investments accounted for by the equity method | 788 | 2,424 |
| Loans to associates and joint ventures | 16 | 1,281 |
| Receivables from associates and joint ventures for current operations (Note 11) | 43 | 85 |
| Financial debt, associates and joint ventures | 21 | 20 |
| Payables to associates and joint ventures (Note 14) | 724 | 578 |
| Millions of euros | |||
| 2014 | 2013 | 2012 | |
| Share of (loss) of investments accounted for by the equity method | (510) | (304) | (1,275) |
| Revenue from operations with associates and joint ventures | 472 | 524 | 535 |
| Expenses from operations with associates and joint ventures | 503 | 552 | 634 |
| Financial income with associates and joint ventures | 49 | 38 | 32 |
| Financial expenses with associates and joint ventures | 16 | 10 | 4 |
The breakdown ofGroup has entered into factoring agreements in 2014 through the main associates and key financial highlights for the last 12-month periods available at the time of preparation of these consolidated financial statements are as follows:
| December 31, 2011 | Millions of euros | |||||||||||||||||||||||||||
| COMPANY | % holding | Total assets | Total liabilities | Operating income | Profit (loss) for the year | Carrying amount | Market value | |||||||||||||||||||||
| Telco, S.p.A. (Italy) (*) | 46.18 | % | 5,410 | 3,300 | - | (1,126 | ) | 1,453 | N/A | |||||||||||||||||||
| DTS Distribuidora de Televisión Digital, S.A. (Spain) | 22.00 | % | 1,423 | 458 | 908 | 50 | 473 | N/A | ||||||||||||||||||||
| China Unicom (Hong Kong) Limited | 9.57 | % | 53,332 | 27,961 | 22,466 | 539 | 3,031 | 3,665 | ||||||||||||||||||||
| Other | 108 | |||||||||||||||||||||||||||
| TOTAL | 5,065 | |||||||||||||||||||||||||||
| December 31, 2010 | Millions of euros | |||||||||||||||||||||||||||
| COMPANY | % holding | Total assets | Total liabilities | Operating income | Profit (loss) for the year | Carrying amount | Market value | |||||||||||||||||||||
| Telco, S.p.A. (Italy) (*) | 46.18 | % | 6,554 | 3,356 | - | 63 | 2,055 | N/A | ||||||||||||||||||||
| DTS Distribuidora de Televisión Digital, S.A. (Spain) | 22.00 | % | 1,497 | 497 | 1,085 | 169 | 488 | N/A | ||||||||||||||||||||
| China Unicom (Hong Kong) Limited | 8.37 | % | 47,494 | 24,238 | 18,604 | 388 | 2,499 | 2,112 | ||||||||||||||||||||
| Other | 170 | |||||||||||||||||||||||||||
| TOTAL | 5,212 | |||||||||||||||||||||||||||
The detail of the movement in investments in associates in 20112014 and 20102013 was the following:
| Investments | accounted for by the equity method | Millions of euros | ||
| Balance at 12/31/ | 2,468 | |||
| 363 | ||||
| Disposals | ||||
| Translation differences and other comprehensive income | (121) | |||
| Income (loss) | (304) | |||
| Dividends | ||||
| Transfers and other | ||||
| Balance at 12/31/ | 2,424 | |||
| 382 | ||||
| Disposals | ||||
| Translation differences and other comprehensive income | (20) | |||
| Income (loss) | ||||
| Dividends | ||||
| Transfers and other | ||||
| Balance at 12/31/ | 788 | |||
In July 2014 Telefónica officially purchased a further 22% of the agreement to extend the strategic partnership (see Note 2). The amount for 2010 includes the disposalshare capital of 472 million euros due to the deconsolidation of Portugal Telecom, as well as the addition of 488 million euros for the 22% stake in DTS Distribuidora de Televisión Digital, S.A. for 295 million euros. A payment of 30 million euros was also agreed in return for a waiver by Mediaset of preferential purchase rights to the stake held by Promotora de Informaciones, S.A. in this company (see Note 21).
On June 16, 2014 the three Italian shareholders who, together with Telefónica, S.A., form the shareholder structure of Telco, S.p.A., requested that a demerger process be initiated for this company in accordance with that established in the Shareholders’ Agreement. The implementation of this demerger process, approved at the Telco, S.p.A. General Shareholders’ Meeting on July 9, 2014, is subject to prior approval by the competition and telecommunication authorities where necessary, including those in Brazil and Argentina (see Note 21).
At a meeting on December 22, 2014, the Brazilian telecommunications regulator (ANATEL) approved the demerger on condition of suspension of Telefónica’s voting rights in Telecom Italia, S.p.A. and its subsidiaries, among certain other measures. Telefónica has agreed with the aforementioned suspension of voting rights and has offered the presentation of a formal statement to ANATEL in this regard. Therefore, on the same date Telefónica ceased to have significant influence through its indirect holding in Telecom Italia, S.p.A. and reclassified this investment as an available-for-sale financial asset (see Note 13). The quoted price of Telecom Italia, S.p.A. shares at the reference date was 0.89 euros per share. The impact of the value adjustment of the stake in Telco, S.p.A., together with its contribution to results for the year, led to a negative impact of 464 million euros in 2014 “Share of loss of investments accounted for by the equity method” (see Note 2).
As a result of the classification of the investment in Telco, S.p.A. as an available-for-sale financial asset, the bond of this company subscribed by Telefónica, S.A. (see Note 13), which amounted to 1,307 million euros at December 31, 2014, including principal and interest (1,258 million euros at December 31, 2013), was excluded from the breakdown of amounts related to associates and joint ventures at 2014 year end in the table above.
In 2013 Telefónica and the other Telco, S.p.A. shareholders established an agreement whereby Telefónica increased its ownership interest in Telco, S.p.A. through a cash contribution of 324 million euros. Likewise, in 2013 a valuation adjustment was recognized in respect of the stake held by Telco, S.p.A. in Telecom Italia, S.p.A. which, together with the contribution to results for the year, led to a negative impact of 267 million euros in 2013 under the heading “Share of loss of investments accounted for by the equity method” (see Note 2).
The year 2011 reflects the impactbreakdown of the adjustment mademain investments accounted for by Telco, S.p.A. to the value of its stake in Telecom Italia which, coupled with the impact of operational synergies considered in the investmentequity method and its contribution to profitkey financial highlights for the year, resulted in a negative impact on “Sharelast 12-month period available at the time of (loss) profitpreparation of associates” of 620 million euros.
| Millions of euros | 2010 | 2009 | ||||||
| Current assets | - | 1,170 | ||||||
| Non-current assets | - | 5,617 | ||||||
| Current liabilities | - | 1,170 | ||||||
| Non-current liabilities | - | 1,505 | ||||||
| Operating revenue | 2,583 | (*) | 2,743 | |||||
| Operating expenses | 1,896 | (*) | 2,046 | |||||
| December 31, 2014 | ||||||
| Millions of euros | ||||||
| COMPANY | % holding | Total assets | Total liabilities | Operating revenue | Profit (loss) for the year | Carrying amount |
| DTS Distribuidora de Televisión Digital, S.A. (Spain) | 44% | 1,265 | 622 | 1,168 | (210) | 703 |
| Other | 85 | |||||
| TOTAL | 788 | |||||
| December 31, 2013 | ||||||
| Millions of euros | ||||||
| COMPANY | % holding | Total assets | Total liabilities | Operating revenue | Profit (loss) for the year | Carrying amount |
| Telco, S.p.A. (Italy) (Note 21.b) | 66% | 3,001 | 2,416 | − | (474) | 390 |
| DTS Distribuidora de Televisión Digital, S.A. (Spain) | 22% | 1,381 | 528 | 1,166 | (74) | 434 |
| China Unicom (Hong Kong) Limited | 5.01% | 61,320 | 35,389 | 34,775 | 1,227 | 1,539 |
| Other | 61 | |||||
| TOTAL | 2,424 | |||||
Note 10. Related parties
Significant shareholders
All of these transactions were carried out at market prices.
| Millions of euros | ||
| 2014 | BBVA | La Caixa |
| Finance costs | 26 | 2 |
| Receipt of services | 8 | 59 |
| Other expenses | 3 | − |
| Total costs | 37 | 61 |
| Finance income | 14 | 19 |
Dividends received(1) | 14 | N/A |
| Services rendered | 61 | 95 |
| Sale of goods | 5 | 2 |
| Other income | 3 | − |
| Total revenue | 97 | 116 |
| Finance arrangements: loans and capital contributions (borrower) | 417 | 31 |
| Guarantees | 529 | 75 |
| Commitments | 32 | 67 |
| Finance arrangements: loans and capital contributions (lender) | 1,107 | 1,173 |
Dividends(2) | 194 | 98 |
| Other operations (factoring operations) | 112 | − |
(1) At December 31, 2014, Telefónica holds a 0.72% stake in the share capital of Banco Bilbao Vizcaya Argentaria, S.A. (BBVA) and subsidiaries comprising the consolidated group:(see Note 13.a).
(2) The shares received by la Caixa for the scrip dividend paid on December 2014 should be considered in addition to the amount included in this file.
| Millions of euros | ||
| 2013 | BBVA | La Caixa |
| Finance costs | 45 | 2 |
| Receipt of services | 19 | 57 |
| Other expenses | 1 | − |
| Total costs | 65 | 59 |
| Finance income | 35 | 8 |
| Dividends received | 14 | N/A |
| Services rendered | 68 | 78 |
| Sale of goods | 5 | 3 |
| Other income | 2 | − |
| Total revenue | 124 | 89 |
| Finance arrangements: loans and capital contributions (borrower) | 399 | 214 |
| Guarantees | 452 | 134 |
| Commitments | 32 | 69 |
| Commitments/guarantees canceled | 69 | − |
| Finance arrangements: loans and capital contributions (lender) | 1,626 | 1,671 |
| Financial lease contracts (lessee) | 5 | − |
| Amortization or cancellation of credits and lease contracts (lessee) | 13 | − |
| Dividends | 108 | 89 |
| Other operations (factoring operations) | 210 | − |
In addition, the nominal value of derivatives held with BBVA and la Caixa in 2014 amounted to 24,266 and 1,221 million euros, respectively (13,352 million euros held with BBVA and 1,200 million euros held with la Caixa in 2013). As explained in Derivatives policy in Note 16, this figure is inflated by the use in some cases of several levels of derivatives applied to the nominal value of a single underlying.
The most significant balances and transactions with associates and joint ventures and their contributions to the consolidated statement of financial position and income statement are detailed in Note 9.
During the financial year to which these accompanying consolidated annual financial statements refer, the Directors and senior executives did not perform any transactions with Telefónica, S.A. or any Telefónica Group company other than those in the Group’s normal trading activity and business.
Compensation and other benefits paid to members of the Board of Directors and senior executives as well as the detail of the equity interests and positions or duties held by the directors in companies engaging in an activity that is identical, similar or complementary to that of the Company are detailed in Note 2121.f and Appendix II of these consolidated financial statements.
An agreement has also been signed through which Abertis Tower, S.A.U. leases certain space in the aforesaid infrastructures for Telefónica Móviles España, S.A.U. to install its communications equipment.
Note 11. Trade and other receivables
The breakdown of this consolidated statement of financial position heading at December 31, 20112014 and 20102013 is as follows:
| Balance at | Balance at | |||||||||
| Millions of euros | 12/31/11 | 12/31/10 | Balance at 12/31/2014 | Balance at 12/31/2013 | ||||||
| Trade receivables | 12,282 | 13,002 | ||||||||
| Receivables from associates (Note 9) | 69 | 84 | ||||||||
| Trade receivables billed | 9,172 | 8,184 | ||||||||
| Trade receivables unbilled | 2,529 | 2,258 | ||||||||
| Impairment of trade receivables | (2,757) | (2,598) | ||||||||
| Receivables from associates and joint ventures (Note 9) | 43 | 85 | ||||||||
| Other receivables | 918 | 1,182 | 540 | 571 | ||||||
| Allowance uncollectibles | (3,135 | ) | (3,098 | ) | ||||||
| Short-term prepayments | 1,197 | 1,256 | 1,079 | 1,140 | ||||||
| Total | 11,331 | 12,426 | 10,606 | 9,640 | ||||||
Public-sector net trade receivables in the countries in which the Group operates at December 31, 20112014 and 20102013 amounted to 779437 million euros and 696577 million euros, respectively.
The breakdownmovement in impairment of trade receivables at December 31, 2011in 2014 and 2010 is as follows:
| Millions of euros | 12/31/11 | 12/31/10 | ||||||
| Trade receivables billed | 9,168 | 9,420 | ||||||
| Trade receivables unbilled | 3,114 | 3,582 | ||||||
| Total | 12,282 | 13,002 | ||||||
| Millions of euros | |||||
| Impairment | 3,196 | ||||
| Allowances | 674 | ||||
| Amounts applied | (809) | ||||
| Translation differences and other | (463) | ||||
| Impairment provision at December 31, 2013 | |||||
| Allowances | |||||
| Amounts applied | (801) | ||||
| Inclusion of companies | |||||
| Translation differences and other | − | ||||
| Impairment | 2,757 | ||||
The balance of trade receivables billed net of impairment losses at December 31, 20112014 amounted to 6,0336,415 million euros (6,322(5,586 million euros at December 31, 2010)2013), of which 3,4004,162 million euros were not yet due (3,852(3,056 million euros at December 31, 2010)2013).
Note 12. Equity
a) Share capital and share premium
At December 31, 2011,2014, Telefónica, S.A.’s share capital amounted to 4,563,996,4854,657,204,330 euros and consisted of 4,563,996,4854,657,204,330 fully paid ordinary shares of a single series, par value of 1 euro, all recorded by the book-entry system and traded on the Spanish electronic trading system (“Continuous Market”), where they form part of the Ibex 35“Ibex 35” Index, on the four Spanish Stock Exchanges (Madrid, Barcelona, Valencia and Bilbao) and listed on the London and Buenos Aires Stock Exchanges, and on the New York London, Buenos Aires and Lima Stock Exchanges.Exchanges, through American Depositary Shares (‘ADSs’).
On December 9, 2014, the deed of a share capital increase of 106,179,744 euros was executed, during which 106,179,744 ordinary shares with a par value of 1 euro each were issued, with a charge to reserves, as part of the scrip dividend shareholder remuneration deal. Share capital amounts to 4,657,204,330 euros subsequent to this increase.
With respect to authorizations given regarding share capital, on May 18, 2011, authorization was given at the Annual Shareholders’ Meeting of Telefónica, S.A. for the Board of Directors, at its discretion and in accordance with the Company’s needs, to increase the Company’s capital, at oneonce or several times, within a maximum period of five years from that date, under the terms of Section 297.1.b) of the Corporate Enterprises Act up to a maximum increase of 2,281,998,242.50 euros, equivalent to half of Telefónica, S.A.’s share capital at that date, by issuing and placing new shares, be they ordinary, preferred, redeemable, non-voting or of any other type permitted by the Law, -withwith a fixed or without a premium-variable premium, and, in all cases, in exchange for cash, and expressly considering the possibility that the new shares may not be fully subscribed. The Board of Directors was also empowered to exclude, partially or fully, pre-emptive subscription rights under the terms of Section 506 of the Spanish Enterprises Act.
In addition, at the May 30, 2014 Shareholders’ Meeting, authorization was given for the Board of Directors to issue debentures, bonds, notes and other fixed-income securities and hybrid instruments, including preferred shares at one or several times within a maximum period of five years from that date. These securities may be in the form of debentures, bonds, promissory notes or any other kind of fixed-income security, or debt instruments of similar category or hybrid instruments whatever may be the forms admitted in law, plain or, in the case of debentures, bonds and hybrid instruments convertible into shares of the Company and/or exchangeable for shares of any of the Group companies, or any other company. This delegation also includes warrants or other similar securities that might give the right to directly or indirectly subscribe or acquire shares of the Company, whether newly issued or outstanding, and which may be paid for by physical delivery or by offset. The aggregated amount of the issuance(s) of securities approved under this delegation of powers may not exceed, at any given time, the sum of 25,000 million or the equivalent in another currency. For promissory notes, the outstanding balance of promissory notes issued under this authorization will be calculated for purposes of the aforementioned limit. Also for purposes of the foregoing limit, in the case of warrants, the sum of the premiums and exercise prices of the warrants for each issuance that is approved under this delegation shall be taken into account.
Proposed distribution of profit attributable to equity holders of the parent
Telefónica, S.A. generated 4,9102,604 million euros of profit in 2011.2014.
| Millions of euros | ||||
| Goodwill reserve | 2 | |||
| Voluntary reserves | 812 | |||
| Interim dividend | 1,790 | |||
| Total | 2,604 | |||
b) Dividends
Dividends paiddistribution in 20112014 and capital increase
In accordance with Article 277 of the Corporate Enterprises Act, the following table presents the mandatory statement of accounts prepared to confirm the existence of sufficient liquidity to pay the dividend at the date of its approval.
| Liquidity statement | Millions of euros | |||
| Income from January 1 through March 31, | 3,177 | |||
| Mandatory appropriation to reserves | - | |||
| Distributable income | ||||
| 3,177 | ||||
| Proposed interim dividend (maximum amount) | 1,820 | |||
| Cash position | ||||
| Funds available for | distribution: | |||
| Cash and cash equivalents | 4,135 | |||
| Unused credit facilities | 4,397 | |||
| Proposed interim dividend (maximum amount) | ||||
| Difference | 6,712 | |||
The Telefónica Group manages its liquidity risks (see Note 16) in order to have cash available for the following year.
At its meeting held on June 23, 2009,November 14, 2014, the Company’sExecutive Commission of Telefonica, S.A.’s Board of Directors agreed to carry out the execution of the increase in paid-up capital, related to the shareholders compensation by means of a scrip dividend, approved by the Annual General Shareholder´s Meeting held on May 30, 2014.
Thus, each shareholder received one free allotment right for each Telefónica share held. Such free allotment rights were traded on the Continuous Market in Spain during a period of fifteen calendar days. Once this trading period ended, the shareholders of 15.8% of the free-of-charge allotment rights accepted the irrevocable purchase commitment assumed by Telefónica, S.A. Cash payment to these shareholders was made on December 8, 2014, representing an impact in equity of 242 million euros.
The shareholders of 84.2% of the free-of-charge allotment rights were entitled, therefore, to receive new shares of Telefónica, S.A. Nevertheless, Telefónica, S.A. has waived the subscription of new shares corresponding to its treasury shares, so the final number of shares issued in the capital increase was 106,179,744 shares with a nominal value of 1 euro each.
Dividends distribution in 2013
At its meeting of May 31, 2013, Telefónica, S.A.’s Board of Directors resolved to pay a dividend chargedwith a charge to unrestricted reserves forof a fixed gross amount of 0.500.35 euros per outstanding share carrying dividend rights. This dividend was paid in full on November 11, 2009,6, 2013, and the total amount paid was 2,2801,588 million euros.
Dividends distribution in 2012 and capital increase
Approval was given at the General Shareholders’ Meeting of May 14, 2012 to pay a gross 0.53 euros dividend per share outstanding with a charge to unrestricted reserves. The dividend was paid on May 18, 2012 and the total amount paid was 2,346 million euros.
In addition, in May 2009approval was given to pay a scrip dividend consisting of the assignment of free allotment rights with an interim dividend against 2009 profitirrevocable purchase obligation on the Company, and a subsequent capital increase by means of a gross 0.50 euros per share was paid, entailing a total paymentthe issue of 2,277new shares to fulfill said allotments.
At the close of the trading period for these rights, the holders of 37.68% of the Company’s shares had accepted the Company’s irrevocable commitment to buy. These rights were repurchased and cancelled by the Company for the amount of 490 million euros.
Therefore, holders of 62.32% of free subscription rights were entitled to receive new Telefónica shares. However, Telefónica, S.A. waived the subscription of new shares corresponding to treasury shares, so the final number of shares issued in the bonus issue was 71,237,464 shares with a nominal value of 1 euro each.
c) Other equity instruments
Undated deeply subordinated securities
Issued in 2014
The Sixth-Year Non-Call Securities will accrue a fixed coupon at a rate of 5% annually as from the issuance date up to March 31, 2020 (not inclusive). From March 31, 2020 (inclusive) onwards, the Sixth-Year Non-Call Securities will accrue a fixed coupon equal to the applicable 6 year euro swap rate plus a margin of: (i) 3.804% per year as from March 31, 2020 up to March 31, 2024 (not inclusive); (ii) 4.054% per year as from March 31, 2024 up to March 31, 2040 (not inclusive); and (iii) 4.804% per year as from March 31, 2040.
The Tenth-Year Non-Call Securities will accrue a fixed coupon at a rate of 5.875% annually as from the issuance date up to March 31, 2024 (not inclusive). From March 31, 2024 (inclusive) onwards, the Tenth-Year Non-Call Securities will accrue a fixed coupon equal to the applicable 10 year euro swap rate plus a margin of: (i) 4.301% per year as from March 31, 2024 up to March 31, 2044 (not inclusive); (ii) 5.051% per year as from March 31, 2044.
| · | On December 4, 2014, Telefónica Europe, B.V. issued undated deeply subordinated reset rate guaranteed securities in an aggregate principal amount of 850 million euros and subject to a call option exercisable by Telefónica Europe, B.V. starting on the fifth anniversary of the issuance date. The Securities will accrue a fixed coupon at a rate of 4.20% annually as from the issuance date up to December 4, 2019 (not inclusive). From December 4, 2019 (inclusive) onwards, the Securities will accrue a fixed coupon equal to the applicable 5 year swap rate plus a margin of: (i) 3.806% per year as from December 4, 2019 up to December 4, 2024 (not inclusive); (ii) 4.056% per year as from December 4, 2024 up to December 4, 2039 (not inclusive); and (iii) 4.806% per year as from December 4, 2039. |
Issued in 2013
| · | On September 18, 2013, Telefónica Europe, B.V. issued undated deeply subordinated reset rate guaranteed securities in an aggregate principal amount of 1,750 million euros. This issue entails two tranches: one of them subject to a call option exercisable by Telefónica Europe, B.V. starting on the fifth anniversary of the issuance date in an aggregate principal amount of 1,125 million euros (the “Five-Year Non-Call Securities”), and the other |
subject to a call option exercisable by Telefónica Europe, B.V. starting on the eighth anniversary of the issuance date in an aggregate principal amount of 625 million euros (the “Eight-Year Non-Call Securities”). In both tranches there is an early redemption option for the issuer.
The Five-Year Non-Call Securities will accrue a fixed coupon at a rate of 6.5% annually as from the issuance date (inclusive) up to September 18, 2018. From September 18, 2018 (inclusive) onwards, the Five-Year Non-Call Securities will accrue a fixed coupon equal to the applicable 5 year swap rate plus a margin of: (i) 5.038% per year as from September 18, 2018 up to September 18, 2023 (not inclusive); (ii) 5.288% per year as from September 18, 2023 up to September 18, 2038 (not inclusive); and (iii) 6.038% per year as from September 18, 2038 (inclusive).
The Eight-Year Non-Call Securities will accrue a fixed coupon at a rate of 7.625% annually as from the issuance date (inclusive) up to September 18, 2021. From September 18, 2021 (inclusive) onwards, the Eight-Year Non-Call Securities will accrue a fixed coupon equal to the applicable 8 year swap rate plus a margin of: (i) 5.586% per year as from September 18, 2021 up to September 18, 2023 (not inclusive); (ii) 5.836% per year as from September 18, 2023 up to September 18, 2041 (not inclusive); and (iii) 6.586% per year as from September 18, 2041 (inclusive).
| · | On November 26, 2013, Telefónica Europe, B.V. issued undated deeply subordinated reset rate guaranteed securities, with the subordinated guarantee of Telefónica, S.A., for an aggregate principal amount of 600 million pounds sterling (equivalent to 716 million euros at the closing date) and subject to a call option exercisable by Telefónica Europe, B.V. starting on the seventh anniversary of the issuance date. The securities will accrue a coupon at a rate of 6.75% annually as from the issuance date (inclusive) up to November 26, 2020. From November 26, 2020 (inclusive), the securities will accrue a fixed coupon equal to the applicable five years swap rate resettable every five years plus a margin of: (i) 4.458% per year as from November 26, 2020 up to November 26, 2025 (not inclusive); (ii) 4.708% per year as from November 26, 2025 up to November 26, 2040 (not inclusive); and (iii) 5.458% per year as from November 26, 2040 (inclusive). |
In all issuances of subordinated perpetual instruments in 2014 and 2013, the issuer has an option to defer the payment of coupons; holders of these securities cannot call for payment.
As the repayment of principal and the payment of coupons depend solely on Telefónica’s decision, these subordinated perpetual instruments are equity instruments and are presented under “Other equity instruments” in the accompanying consolidated statement of changes in equity.
The payment of the coupons related to the undated deeply subordinated securities issued in 2013 in an aggregate amount, net of tax effects, of 129 million euros, with negative impact on “Retained earnings” in the consolidated statements of changes in equity, was recorded in September 2014.
Notes mandatorily convertible into shares of Telefonica, S.A.
On September 24, 2014, Telefónica Participaciones, S.A.U., issued 1,500 million euros of notes mandatorily convertible into new and/or existing shares of Telefónica, S.A. at a nominal fixed interest rate of 4.9%, due on September 25, 2017, guaranteed by Telefónica, S.A. The notes could be converted at the option of the noteholders or the issuer at any time from the 41st day after the issue date up to the 25th trading day prior to the maturity date. The minimum conversion price of the notes will be equal to 11.9 euros per share and the maximum conversion price will be equal to 14.5775 euros per share, resulting in a premium equal to 22.5% over the minimum conversion price.
These notes mandatorily convertible are compound instruments that have been split into its two components: a debt component amounting 215 million euros, corresponding to the present value of the coupons; and an equity component, for the remaining amount, due to the issuer option to convert the treasury shares to a fix ratio, included in the heading “other equity instruments”.
d) Legal reserve
According to the consolidated text of the Corporate Enterprises Act, companies must transfer 10% of profit for the year to a legal reserve until this reserve reaches at least 20% of share capital. The legal reserve can be used to increase capital by the amount exceeding 10% of the increased share capital amount. Except for this purpose, until the legal reserve
exceeds the limit of 20% of share capital, it can only be used to offset losses, if there are no other reserves available. At December 31, 2011,2014, the Company had duly set aside this reserve.reserve, amounting to 984 million euros.
e) Retained earnings
These reserves include undistributed profits of companies comprising the consolidated Group less interim dividends paid against profit for the year, actuarial gains and losses, the impact of the asset ceiling on defined-benefit plans and the payment of coupons related to subordinated securities, if applicable.
In addition, these reserves include revaluation reserves and reserve for cancelled share capital. These reserves are regulated by some restrictions for their distribution.
Revaluation reserves
The balance of “Revaluation reserves” arose as a result of the revaluation made pursuant to Royal Decree-Law 7/1996 dated June 7.
The capital gain will be deemed to have been realized in respect of the portion on which the depreciation has been recorded for accounting purposes or when the revalued assets have been transferred or derecognized. In this respect, an amount of 158 million euros was reclassified to “Retained earnings" in 2014 (7 million euros in 2011 (162013 and 10 million euros in 2010 and 15 million euros in 2009)2012), corresponding to revaluation reserves subsequently considered unrestricted was reclassifiedunrestricted. At December, 31 2014 this reserve amounts to “Retained earnings.”101 million euros.
f) Translation differences |
The breakdown of the accumulated contribution of translation differences at December 31 is as follows:
| Millions of euros | 2011 | 2010 | 2009 | |||||||||
| Telefónica Latin America | (550 | ) | 1,208 | 1,052 | ||||||||
| Telefónica Europe | (2,071 | ) | (2,363 | ) | (2,524 | ) | ||||||
| Other adjustments and intra-group eliminations | 458 | 212 | 99 | |||||||||
| Total Telefónica Group | (2,163 | ) | (943 | ) | (1,373 | ) | ||||||
| Millions of euros | 2014 | 2013 | 2012 |
| Brazilian real | (5,552) | (5,556) | (2,395) |
| Venezuelan bolivar | (2,923) | 27 | 645 |
| Pound sterling | (1,901) | (2,455) | (2,251) |
| Other currencies | (1,756) | (1,291) | 372 |
| Total Group | (12,132) | (9,275) | (3,629) |
The translation differences movement in 2014 is mainly due to the impact of translating the financial statements of the Group’s subsidiaries in Venezuela to SICAD II (see Note 2).
g) Treasury share instruments
At December 31, 2011, 20102014, 2013 and 2009,2012, Telefónica Group companies held the following shares in the Telefónica, S.A. parent company:
| Euros per share | |||||
| Number of shares | Acquisition price | Trading price | Market value* | % | |
| Treasury shares at 12/31/14 | 128,227,971 | 11.68 | 11.92 | 1,528 | 2.75332% |
| Treasury shares at 12/31/13 | 29,411,832 | 11.69 | 11.84 | 348 | 0.64627% |
| Treasury shares at 12/31/12 | 47,847,810 | 10.57 | 10.19 | 488 | 1.05136% |
| (*) Millions of euros | |||||
| Euros per share | ||||||||||||||||||||
| Number of shares | Acquisition price | Trading price | Market value Millions of euros | % | ||||||||||||||||
| Treasury shares at 12/31/11 | 84,209,364 | 15.68 | 13.39 | 1,127 | 1.84508 | % | ||||||||||||||
| Treasury shares at 12/31/10 | 55,204,942 | 17.01 | 16.97 | 937 | 1.20957 | % | ||||||||||||||
| Treasury shares at 12/31/09 | 6,329,530 | 16.81 | 19.52 | 124 | 0.13868 | % | ||||||||||||||
Telefónica, S.A. directly owns all treasury shares in the Group except for one share that is held by Telefónica Móviles Argentina, S.A. (16,896 treasury shares held by Telefónica Móviles Argentina, S.A. at December 31, 2010).2014.
In 2009, 20102014, 2013 and 20112012 the following transactions involving treasury shares were carried out:
| Number of shares | ||||
| Treasury shares at 12/31/11 | 84,209,364 | |||
| Acquisitions | 126,489,372 | |||
| Disposals | ||||
| Employee share option plan | (2,071,606) | |||
| Capital reduction | (84,209,363) | |||
| Treasury shares at 12/31/12 | 47,847,810 | |||
| Acquisitions | 113,154,549 | |||
| Disposals | (131,590,527) | |||
| Treasury shares at 12/31/13 | 29,411,832 | |||
| Acquisitions | 100,723,415 | |||
| Disposals | (129,177) | |||
| Employee share option plan | (1,778,099) | |||
| Treasury shares at 12/31/14 | 128,227,971 | |||
Treasury shares solddisposed of in 20112014, 2013 and 20102012 amounted to 4451 million euros, 1,423 million euros and 14801 million euros, respectively.
The amountmain disposal of treasury shares in 2011 included 371 million euros related2014 are mainly due to the strategic alliance with China Unicom (see Note 2).
The main sales of 2,446,104 treasury shares were added, corresponding to two derivative financial instruments arranged by the Company to meet its obligations to deliver treasury shares to managers and executives. A net 2,900,189 shares (33 million euros) were finally delivered.in 2013 are as follows:
| · | An agreement was reached with qualified and professional investors on March 26, 2013 whereby the Company disposed of all the treasury shares it held (90,067,896 shares) at a price of 10.80 euros per share. |
| · | On September 24, 2013 Telefónica, S.A. acquired from the remaining shareholders of Telco, S.p.A. 23.8% of the non-convertible bonds issued by Telco, S.p.A. (Note 13.a). The payment of this transaction consisted of the transmission of 39,021,411 treasury shares of the Company (see Note 13.a). |
At the date of authorization for issue of these consolidated financial statements,December 31, 2014, Telefónica held 23476 million call options on treasury shares subject to physical settlement (optionsdelivery at a fixed price (134 and 178 million options on 190 million, 160 million and 150 million treasury shares at December 31, 2011, 20102013 and 2009,2012, respectively), which are presented as a reduction in equity under the caption “Treasury shares”. They are valued at the amount of premium paid, and upon maturity if the call options are exercised the premium is reclassified as treasury shares together with the price paid. If they are not exercised upon maturity their value is recognized directly in equity.
The Company also has a derivative financial instrument subject to net settlement on approximately 26a notional equivalent to 32 million Telefónica shares, subject to net settlement, recognized under “Current interest-bearing debt” in the accompanying consolidated statement of financial position.position (derivative over 30 million equivalent shares in 2013 recognized under “Current interest-bearing debt” and derivative over 28 million equivalent shares in 2012 recognized under “Current financial assets”).
h) Equity attributable to non-controlling interests
“Non-controllingEquity attributable to non-controlling interests” represents the share of non-controlling interests in the equity and profitincome or loss for the year of fully consolidated Group companies. The movements in this heading inof the 2011, 20102014, 2013 and 20092012 consolidated statement of financial position are as follows:
| Millions of euros | Balance at 12/31/10 | Capital contributions and inclusion of companies | Profit/(loss) for the year | Change in translation differences | Acquisitions of non-controlling interests and exclusion of companies | Dividends paid | Other movements | Balance at 12/31/11 | ||||||||||||||||||||||||
| Telefónica Czech Republic, a.s. | 1,033 | - | 95 | (25 | ) | - | (161 | ) | (2 | ) | 940 | |||||||||||||||||||||
| Telefónica Chile, S.A. | 23 | - | 2 | (1 | ) | - | (3 | ) | - | 21 | ||||||||||||||||||||||
| Telefónica Brasil, S.A. | 6,136 | - | 864 | (345 | ) | (539 | ) | (710 | ) | (661 | ) | 4,745 | ||||||||||||||||||||
Fonditel Entidad Gestora de Fondos de Pensiones, S.A. | 22 | - | 2 | - | - | (1 | ) | - | 23 | |||||||||||||||||||||||
| Iberbanda, S.A. | 2 | - | (4 | ) | - | 2 | - | - | - | |||||||||||||||||||||||
Colombia Telecomunicaciones, S.A., ESP | - | - | (175 | ) | - | - | - | 175 | ||||||||||||||||||||||||
| Other | 16 | - | - | 3 | (2 | ) | (1 | ) | 2 | 18 | ||||||||||||||||||||||
| Total | 7,232 | - | 784 | (368 | ) | (539 | ) | (876 | ) | (486 | ) | 5,747 | ||||||||||||||||||||
| Millions of euros | Balance at 12/31/09 | Capital contributions and inclusion of companies | Profit/(loss) for the year | Change in translation differences | Acquisitions of non-controlling interests and exclusion of companies | Dividends paid | Other movements | Balance at 12/31/10 | ||||||||||||||||||||||||
| Telefónica Czech Republic, a.s. | 1,044 | - | 88 | 57 | - | (156 | ) | - | 1,033 | |||||||||||||||||||||||
| Telefónica Chile, S.A. | 22 | - | 3 | 3 | - | (1 | ) | (4 | ) | 23 | ||||||||||||||||||||||
| Telesp Participaçoes, S.A. | 542 | - | 131 | 69 | - | (105 | ) | (7 | ) | 630 | ||||||||||||||||||||||
| Brasilcel (Holdings) | 885 | 4,304 | 224 | 258 | - | (171 | ) | 6 | 5,506 | |||||||||||||||||||||||
Fonditel Entidad Gestora de Fondos de Pensiones, S.A. | 23 | - | 2 | - | - | (3 | ) | - | 22 | |||||||||||||||||||||||
| Iberbanda, S.A. | 6 | - | (4 | ) | - | - | - | - | 2 | |||||||||||||||||||||||
Colombia Telecomunicaciones, S.A., ESP | - | - | (540 | ) | - | - | - | 540 | - | |||||||||||||||||||||||
| Other | 18 | 6 | 1 | 3 | (3 | ) | (4 | ) | (5 | ) | 16 | |||||||||||||||||||||
| Total | 2,540 | 4,310 | (95 | ) | 390 | (3 | ) | (440 | ) | 530 | 7,232 | |||||||||||||||||||||
| Millions of euros | Balance at 12/31/08 | Capital contributions and inclusion of companies | Profit/(loss) for the year | Change in translation differences | Acquisitions of non-controlling interests and exclusion of companies | Dividends paid | Other movements | Balance at 12/31/09 | ||||||||||||||||||||||||
| Telefónica Czech Republic, a.s. | 1,095 | - | 114 | 21 | - | (186 | ) | - | 1,044 | |||||||||||||||||||||||
| Telefónica Chile, S.A. | 23 | 1 | 1 | 6 | (8 | ) | (1 | ) | - | 22 | ||||||||||||||||||||||
| Telesp Participaçoes, S.A. | 385 | - | 101 | 118 | - | (64 | ) | 2 | 542 | |||||||||||||||||||||||
| Brasilcel (Holdings) | 774 | - | 46 | 214 | (108 | ) | (41 | ) | - | 885 | ||||||||||||||||||||||
Fonditel Entidad Gestora de Fondos de Pensiones, S.A. | 20 | - | 3 | - | - | - | - | 23 | ||||||||||||||||||||||||
| Iberbanda, S.A. | 9 | - | (3 | ) | - | - | - | - | 6 | |||||||||||||||||||||||
Colombia Telecomunicaciones, S.A., ESP | - | - | (104 | ) | - | - | - | 104 | - | |||||||||||||||||||||||
| Other | 25 | - | 3 | (2 | ) | (7 | ) | (3 | ) | 2 | 18 | |||||||||||||||||||||
| Total | 2,331 | 1 | 161 | 357 | (123 | ) | (295 | ) | 108 | 2,540 | ||||||||||||||||||||||
| Millions of euros | Balance at 12/31/13 | Sales of non-controlling interests and inclusion of companies | Acquisitions of non-controlling interests and exclusion of companies | Dividends distribution | Profit/(loss) for the year | Change in translation differences | Other movements | Balance at 12/31/14 | ||||||||
| Telefónica Czech Republic, a.s. | 666 | − | (666) | − | − | − | − | − | ||||||||
| Telefónica Brasil, S.A. | 3,491 | − | − | (269) | 423 | (5) | 16 | 3,656 | ||||||||
| Telefónica Deutschland Holding, A.G. | 1,962 | 3,615 | − | (122) | (277) | − | (12) | 5,166 | ||||||||
| Colombia Telecomunicaciones, S.A., ESP | (165) | − | − | − | 91 | 7 | 17 | (50) | ||||||||
| Telefónica Centroamericana Inversiones, S.L. | 283 | 6 | − | (14) | 9 | 41 | 1 | 326 | ||||||||
| Other | 60 | 10 | − | (1) | 5 | 4 | (2) | 76 | ||||||||
| Total | 6,297 | 3,631 | (666) | (406) | 251 | 47 | 20 | 9,174 |
| Millions of euros | Balance at 12/31/12 | Sales of non-controlling interests and inclusion of companies | Acquisitions of non-controlling interests and exclusion of companies | Dividends distribution | Profit/(loss) for the year | Change in translation differences | Other movements | Balance at 12/31/13 | ||||||||
| Telefónica Czech Republic, a.s. | 813 | − | (46) | (100) | 63 | (64) | − | 666 | ||||||||
| Telefónica Brasil, S.A. | 4,373 | − | − | (522) | 335 | (694) | (1) | 3,491 | ||||||||
| Telefónica Deutschland Holding, A.G. | 2,084 | − | − | (117) | (1) | (1) | (3) | 1,962 | ||||||||
| Colombia Telecomunicaciones, S.A., ESP | (139) | − | − | − | (37) | 21 | (10) | (165) | ||||||||
| Telefónica Centroamericana Inversiones, S.L. | − | 283 | − | − | 11 | (12) | 1 | 283 | ||||||||
| Other | 69 | 1 | − | − | 5 | (13) | (2) | 60 | ||||||||
| Total | 7,200 | 284 | (46) | (739) | 376 | (763) | (15) | 6,297 |
| Millions of euros | Balance at 12/31/11 | Sales of non-controlling interests and inclusion of companies | Acquisitions of non-controlling interests and exclusion of companies | Dividends distribution | Profit/(loss) for the year | Change in translation differences | Other movements | Balance at 12/31/12 | ||||||||
| Telefónica Czech Republic, a.s. | 940 | − | (113) | (107) | 66 | 27 | − | 813 | ||||||||
| Telefónica Brasil, S.A. | 4,745 | − | (12) | (331) | 454 | (478) | (5) | 4,373 | ||||||||
| Telefónica Deutschland Holding, A.G. | − | 2,043 | − | − | 41 | − | − | 2,084 | ||||||||
| Colombia Telecomunicaciones, S.A., ESP | − | − | (116) | − | (93) | (138) | 208 | (139) | ||||||||
| Other | 62 | − | (2) | (4) | 7 | 5 | 1 | 69 | ||||||||
| Total | 5,747 | 2,043 | (243) | (442) | 475 | (584) | 204 | 7,200 |
Revenues, OIBDA, capital expenditure and the main items of the statement of financial position for the main companies of the Telefónica Group with non-controlling interests, Telefónica Brazil and Telefónica Germany, are included in the Note 4.
2014
In 2014, “Sales of non-controlling interests and inclusion of companies” reflects the effect of the capital increase in Telefónica Deutschland Holding, A.G. for the acquisition of E-Plus, and the changes in the investment percentages related to the same operation, amounting to 3,615 million euros (see Notes 2 and 5). The removal of Telefónica Czech Republic, a.s. from the scope of consolidation is also significant (see Note 2).
In 2013, “Sales of non-controlling interests and inclusion of companies” reflects the effect of the sale of 40% of the investment through Telefónica Centroamérica Inversiones, S.L. in 2011 includes the exchangeGuatemala, El Salvador, Nicaragua and Panama, with an impact of Telesp shares for Vivo Participações shares, which resulted in a net decrease of 661283 million euros (see Note 5), included under “Other movements.”.
In 2012, “Sales of non-controlling interests and exclusioninclusion of companies” reflects the effect of the public offering of shares in Telefónica Deutschland Holding, A.G. This share offering, which totaled 23.17% of capital, entailed non-controlling interests of 2,043 million euros. The heading also includes the impact of the tender offer forcorporate reorganization agreement in the voting sharesfixed and mobile businesses in Colombia, with an impact of Vivo Participaçoes, S.A. held by non-controlling interests representing, approximately, 3.8% of its capital stock. After its execution, Telefónica acquired an additional 2.7% of the Brazilian company’s capital stock for 539116 million euros for a total stake of 62.3% (Note(see Note 5).
1.- Financial assets
The breakdown of financial assets of the Telefónica Group at December 31, 20112014 and 20102013 is as follows:
December 31, 2014
| Fair value through profit or loss | Measurement hierarchy | |||||||||||||||||||||
| Millions of euros | Held for trading | Fair value option | Available-for-sale | Hedges | Level 1 (Quoted prices) | Level 2 (Other directly observable market inputs) | Level 3 (Inputs not based on observable market data) | Held-to-maturity investments | Rest of financial assets at amortized cost | Total carrying amount | Total fair value | |||||||||||
| Non-current financial assets | 2,453 | 245 | 1,875 | 3,046 | 1,492 | 6,114 | 13 | 137 | 3,217 | 10,973 | 10,981 | |||||||||||
| Investments | − | − | 1,278 | − | 1,170 | 108 | − | − | − | 1,278 | 1,278 | |||||||||||
| Long-term credits | − | 245 | 597 | − | 84 | 745 | 13 | 47 | 2,248 | 3,137 | 2,643 | |||||||||||
| Deposits and guarantees | − | − | − | − | − | − | − | 90 | 1,471 | 1,561 | 1,561 | |||||||||||
| Derivative instruments | 2,453 | − | − | 3,046 | 238 | 5,261 | − | − | − | 5,499 | 5,499 | |||||||||||
| Impairment losses | − | − | − | − | − | − | − | − | (502) | (502) | − | |||||||||||
| Current financial assets | 500 | 97 | 63 | 571 | 423 | 808 | − | 9 | 8,221 | 9,461 | 9,454 | |||||||||||
| Financial investments | 500 | 97 | 63 | 571 | 423 | 808 | − | 9 | 1,692 | 2,932 | 2,925 | |||||||||||
| Cash and cash equivalents | − | − | − | − | − | − | − | − | 6,529 | 6,529 | 6,529 | |||||||||||
| Total financial assets | 2,953 | 342 | 1,938 | 3,617 | 1,915 | 6,922 | 13 | 146 | 11,438 | 20,434 | 20,435 | |||||||||||
| December 31, 2011 | ||||||||||||||||||||||||||||||||||||||||||||
Fair value through profit or loss | Measurement hierarchy | |||||||||||||||||||||||||||||||||||||||||||
| Millions of euros | Held for trading | Fair value option | Available-for-sale | Hedges | Level 1 (Quoted prices) | Level 2 (Other directly observable market inputs) | Level 3 (Inputs not based on observable market data) | Amortized cost | Held-to-maturity investments | Total carrying amount | Total fair value | |||||||||||||||||||||||||||||||||
| Non-current financial assets | 1,574 | 273 | 1,310 | 2,720 | 1,521 | 4,355 | 1 | 2,798 | 3 | 8,678 | 8,673 | |||||||||||||||||||||||||||||||||
| Investments | - | - | 680 | - | 588 | 91 | 1 | - | - | 680 | 680 | |||||||||||||||||||||||||||||||||
| Long-term credits | - | 273 | 630 | - | 894 | 9 | - | 1,322 | 3 | 2,228 | 2,223 | |||||||||||||||||||||||||||||||||
| Deposits and guarantees | - | - | - | - | - | - | - | 1,875 | - | 1,875 | 1,476 | |||||||||||||||||||||||||||||||||
| Derivative instruments | 1,574 | - | - | 2,720 | 39 | 4,255 | - | - | - | 4,294 | 4,294 | |||||||||||||||||||||||||||||||||
| Impairment losses | - | - | - | - | - | - | - | (399 | ) | - | (399 | ) | - | |||||||||||||||||||||||||||||||
| Current financial assets | 165 | 171 | 518 | 225 | 668 | 367 | 44 | 5,024 | 657 | 6,760 | 6,760 | |||||||||||||||||||||||||||||||||
| Financial investments | 165 | 171 | 518 | 225 | 668 | 367 | 44 | 889 | 657 | 2,625 | 2,625 | |||||||||||||||||||||||||||||||||
| Cash and cash equivalents | - | - | - | - | - | - | - | 4,135 | - | 4,135 | 4,135 | |||||||||||||||||||||||||||||||||
| Total financial assets | 1,739 | 444 | 1,828 | 2,945 | 2,189 | 4,722 | 45 | 7,822 | 660 | 15,438 | 15,433 | |||||||||||||||||||||||||||||||||
F-47
December 31, 2013
| December 31, 2010 | ||||||||||||||||||||||||||||||||||||||||||||||||||||||||||||||||||
Fair value through profit or loss | Measurement hierarchy | Fair value through profit or loss | Measurement hierarchy | |||||||||||||||||||||||||||||||||||||||||||||||||||||||||||||||
| Millions of euros | Held for trading | Fair value option | Available-for-sale | Hedges | Level 1 (Quoted prices) | Level 2 (Other directly observable market inputs) | Level 3 (Inputs not based on observable market data) | Amortized cost | Held-to-maturity investments | Total carrying amount | Total fair value | Held for trading | Fair value option | Available-for-sale | Hedges | Level 1 (Quoted prices) | Level 2 (Other directly observable market inputs) | Level 3 (Inputs not based on observable market data) | Held-to-maturity investments | Rest of financial assets at amortized cost | Total carrying amount | Total fair value | ||||||||||||||||||||||||||||||||||||||||||||
| Non-current financial assets | 948 | 211 | 1,194 | 1,630 | 1,321 | 2,660 | 2 | 3,423 | - | 7,406 | 7,325 | 1,462 | 356 | 1,101 | 1,205 | 746 | 3,378 | − | 36 | 3,615 | 7,775 | 7,775 | ||||||||||||||||||||||||||||||||||||||||||||
| Investments | - | - | 597 | - | 482 | 113 | 2 | - | - | 597 | 597 | − | − | 550 | − | 433 | 117 | − | − | − | 550 | 550 | ||||||||||||||||||||||||||||||||||||||||||||
| Long-term credits | 12 | 211 | 597 | - | 816 | 4 | - | 2,118 | - | 2,938 | 2,838 | − | 356 | 551 | − | 171 | 736 | − | 7 | 2,562 | 3,476 | 3,127 | ||||||||||||||||||||||||||||||||||||||||||||
| Deposits and guarantees | - | - | - | - | - | - | - | 1,680 | - | 1,680 | 1,324 | − | − | − | − | − | − | − | 29 | 1,403 | 1,432 | 1,431 | ||||||||||||||||||||||||||||||||||||||||||||
| Derivative instruments | 936 | - | - | 1,630 | 23 | 2,543 | - | - | - | 2,566 | 2,566 | 1,462 | − | − | 1,205 | 142 | 2,525 | − | − | − | 2,667 | 2,667 | ||||||||||||||||||||||||||||||||||||||||||||
| Impairment losses | - | - | - | - | - | - | - | (375 | ) | - | (375 | ) | - | − | − | − | − | − | − | − | − | (350) | (350) | − | ||||||||||||||||||||||||||||||||||||||||||
| Current financial assets | 272 | 160 | 309 | 201 | 554 | 363 | 25 | 4,604 | 248 | 5,794 | 5,794 | 548 | 146 | 54 | 125 | 327 | 546 | − | 727 | 10,494 | 12,094 | 12,094 | ||||||||||||||||||||||||||||||||||||||||||||
| Financial investments | 272 | 160 | �� | 309 | 201 | 554 | 363 | 25 | 384 | 248 | 1,574 | 1,574 | 548 | 146 | 54 | 125 | 327 | 546 | − | 727 | 517 | 2,117 | 2,117 | |||||||||||||||||||||||||||||||||||||||||||
| Cash and cash equivalents | - | - | - | - | - | - | - | 4,220 | - | 4,220 | 4,220 | − | − | − | − | − | − | − | − | 9,977 | 9,977 | 9,977 | ||||||||||||||||||||||||||||||||||||||||||||
| Total financial assets | 1,220 | 371 | 1,503 | 1,831 | 1,875 | 3,023 | 27 | 8,027 | 248 | 13,200 | 13,119 | 2,010 | 502 | 1,155 | 1,330 | 1,073 | 3,924 | − | 763 | 14,109 | 19,869 | 19,869 | ||||||||||||||||||||||||||||||||||||||||||||
The calculation of the fair values of the Telefónica Group’s debt instruments required an estimate, for each currency and counterparty, of a credit spread curve using the prices of the Group’s bonds and credit derivatives.
Derivatives are measured using the valuation techniques and models normally used in the market, based on money-market curves and volatility prices available in the market.
| a) Non-current financial assets |
The movement in items composing “Non-current financial assets” in 2014 and the related impairment losses at December 31, 2011 and 2010 are2013 is as follows:
| Millions of euros | Millions of euros | Investments | Long-term credits | Deposits and guarantees | Derivative financial assets | Impairment provision | Total | |||||||||||||||||||||||
| Investments | Long-term credits and prepayments | Deposits and guarantees | Derivative financial assets | Impairment losses | Total | |||||||||||||||||||||||||
| Balance at 12/31/09 | 654 | 1,940 | 1,496 | 2,411 | (513 | ) | 5,988 | |||||||||||||||||||||||
| Acquisitions | 51 | 1,465 | 339 | 62 | (79 | ) | 1,838 | |||||||||||||||||||||||
| Disposals | (1 | ) | (748 | ) | (112 | ) | (389 | ) | 243 | (1,007 | ) | |||||||||||||||||||
| Inclusion of companies | 8 | 205 | 203 | 34 | (7 | ) | 443 | |||||||||||||||||||||||
| Translation differences | 13 | 99 | (186 | ) | 16 | 39 | (19 | ) | ||||||||||||||||||||||
| Fair value adjustments | (128 | ) | 60 | 34 | 444 | - | 410 | |||||||||||||||||||||||
| Transfers | - | (83 | ) | (94 | ) | (12 | ) | (58 | ) | (247 | ) | |||||||||||||||||||
| Balance at 12/31/10 | 597 | 2,938 | 1,680 | 2,566 | (375 | ) | 7,406 | |||||||||||||||||||||||
| Balance at 12/31/12 | 586 | 2,940 | 1,986 | 4,213 | (386) | 9,339 | ||||||||||||||||||||||||
| Acquisitions | - | 936 | 425 | 224 | (11 | ) | 1,574 | 10 | 1,269 | 158 | 188 | (4) | 1,621 | |||||||||||||||||
| Disposals | (12 | ) | (873 | ) | (207 | ) | - | 1 | (1,091 | ) | (106) | (462) | (61) | − | 1 | (628) | ||||||||||||||
| Translation differences | (1 | ) | (45 | ) | (53 | ) | 34 | 1 | (64 | ) | (12) | (111) | (285) | 73 | 29 | (306) | ||||||||||||||
| Fair value adjustments | (160 | ) | 18 | 2 | 1,721 | - | 1,581 | 80 | (85) | 38 | (1,459) | − | (1,426) | |||||||||||||||||
| Transfers | 256 | (746 | ) | 28 | (251 | ) | (15 | ) | (728 | ) | (8) | (75) | (404) | (348) | 10 | (825) | ||||||||||||||
| Balance at 12/31/11 | 680 | 2,228 | 1,875 | 4,294 | (399 | ) | 8,678 | |||||||||||||||||||||||
| Balance at 12/31/13 | 550 | 3,476 | 1,432 | 2,667 | (350) | 7,775 | ||||||||||||||||||||||||
| Acquisitions | 58 | 916 | 161 | 423 | (5) | 1,553 | ||||||||||||||||||||||||
| Disposals | (21) | (451) | (148) | (16) | 6 | (630) | ||||||||||||||||||||||||
| Translation differences | (5) | 18 | (25) | 124 | 5 | 117 | ||||||||||||||||||||||||
| Fair value adjustments | (113) | 35 | 103 | 2,538 | − | 2,563 | ||||||||||||||||||||||||
| Transfers and others | 809 | (857) | 38 | (237) | (158) | (405) | ||||||||||||||||||||||||
| Balance at 12/31/14 | 1,278 | 3,137 | 1,561 | 5,499 | (502) | 10,973 | ||||||||||||||||||||||||
Investments
“Investments” includes the fair value of investments in companies where Telefónica does not exercise significant control and for which there is no specific disposal plan infor the short term (see Note 3.i).
At December 31, 2014 the Telefónica Group'sGroup’s shareholding in China (Hong Kong) Limited is 2.51%, valued at 662 million euros. At the same date, the stake in Telco, S.p.A. is 66% (see Note 21.b) amounting to a book value of 73 million euros.
Additionally, the Group’s shareholding in Banco Bilbao Vizcaya Argentaria, S.A. (BBVA) since 2000 of 326amounts to 347 million euros (418(383 million euros at December 31, 2010)2013), representing 0.90%0.72% of its share capital. In 2011, the Telefónica Group adjusted the value of its investment in BBVA by 80 million euros. In 2010, the Telefónica Group transferred 191 million euros of the value of the holding in BBVA, up to its fair value, from equity to net financial expenses.capital at December 31, 2014.
| Millions of euros | 12/31/2014 | 12/31/2013 |
| Long-term loans to associates | - | 1,225 |
| Long-term trade receivables | 825 | 444 |
| Long-term prepayments | 338 | 154 |
| Long-term receivables for indirect taxes | 112 | 121 |
| Other long-term credits | 1,862 | 1,532 |
| Total | 3,137 | 3,476 |
“Other long-term credits” includes mainly the investmentlong-term financial assets of the net level premium reserves of the Group’s insurance companies, primarily insubsidiary Seguros de Vida y Pensiones Antares, S.A., fundamentally fixed-income securities, amounting to 894816 million euros and 931795 million euros at December 31, 20112014 and 2010, respectively,2013, respectively. These assets are mainly intended to cover the obligations from the defined benefit plans of Telefónica de España (ITP and Survival), though they do not qualify as “plan assets” under IAS 19 (see Note 15).
“Other long-term prepaymentscredits” in 2014 includes the deferred account receivable generated from the sale of 149Telefónica Czech Republic, a.s. (see Note 2), in the amount of 217 million euros. This same item amounts to 86 million euros on a current basis. The sale agreement contemplates a payment schedule that extends to January 2018.
In 2013, Telefónica acquired 23.8% of the non-convertible bonds of Telco, S.p.A. from this company’s other shareholders, through the transfer of 39,021,411 treasury shares (see Note 12.g). This transaction is recognized under “Long-term credits” for 417 million euros. At December 31, 2013, Telefónica, S.A. had subscribed Telco, S.p.A. bonds totaling 1,225 million euros, transferred to short term in 2014 (see Note 9).
Additionally, “Acquisitions” in 2013 included the purchase of exchangeable bond into Telecom Italia, S.p.A. shares for a nominal amount of 103 million euros, which was cancelled in 2014.
Impairment provision for long-term credits amounted to 502 and 167350 million euros at December 31, 20112014 and 2010, respectively. At December 2010 the amounts included the long-term credit with Telco, S.p.A. in an amount of 600 million euros, which has been classified as short term in 2011.
This heading in the accompanying consolidated statement of financial position at December 31, 2011 and 2010 includes mainly the following items:
On July 9, 2014, each of the Telco shareholders, among which Telefónica is one of them, executed with Telco a shareholders loan agreement with a maturity date no later than April 30, 2015. The aggregate amount of shareholders loans made available pursuant to such loans is up to 2,550 million euros (1,683 million euros corresponding to Telefónica, S.A. according to its stake in Telco), which will enable Telco to repay in full all amounts due by Telco under its banking debt and the subordinated bond. As of December 31, 2014 there was no outstanding amount under these loans. |
| · | Short-term investments in financial instruments recognized at fair value to cover commitments undertaken by the Group’s insurance companies, amounting to |
| Derivative financial assets with a short-term maturity or not used to hedge non-current items in the consolidated statement of financial position, |
| Short-term deposits and guarantees |
| Current investments of cash surpluses which, given their characteristics, have not been classified as “Cash and cash equivalents.” |
Current financial assets that are highly liquid and have maturitiesmaturity periods of three months or less from the date contracted, and present an insignificant risk of value changes, are recorded under “Cash and cash equivalents” on the accompanying consolidated statement of financial position.
2.- Financial liabilities |
The compositionbreakdown of this headingfinancial liabilities at December 31, 20112014 and 2010the corresponding maturities schedule is as follows:
| Millions of euros | Balance at 12/31/11 | Balance at 12/31/10 | ||||||
| Issues | 42,239 | 39,692 | ||||||
| Interest-bearing debt | 24,072 | 21,408 | ||||||
| Total | 66,311 | 61,100 | ||||||
| Total non-current | 55,659 | 51,356 | ||||||
| Total current | 10,652 | 9,744 | ||||||
| Millions of euros | ||||||||
| Current | Non-current | |||||||
| Maturity | 2015 | 2016 | 2017 | 2018 | 2019 | Subsequent years | Non-current total | Total |
| Debentures and bonds | 4,601 | 6,722 | 6,392 | 4,834 | 3,465 | 18,214 | 39,627 | 44,228 |
| Promissory notes & commercial paper | 502 | − | − | − | − | − | − | 502 |
| Other marketable debt securities | − | − | − | − | − | − | − | − |
| Total Issues | 5,103 | 6,722 | 6,392 | 4,834 | 3,465 | 18,214 | 39,627 | 44,730 |
| Loans and other payables | 3,590 | 1,533 | 3,205 | 761 | 849 | 1,482 | 7,830 | 11,420 |
| Other financial liabilities (Note 16) | 401 | 152 | 347 | 477 | 357 | 1,898 | 3,231 | 3,632 |
| TOTAL | 9,094 | 8,407 | 9,944 | 6,072 | 4,671 | 21,594 | 50,688 | 59,782 |
The maturity profileestimate of future payments for interest on these financial liabilities at December 31, 20112014 is as follows: 2,215 million euros in 2015, 1,960 million euros in 2016, 1,671 million euros in 2017, 1,279 million euros in 2018, 1,077 million euros in 2019 and 6,586 million euros in years after 2019. For floating rate financing, the Group mainly estimates future interest using the forward curve of the various currencies at December 31, 2014.
The amounts shown in this table take into account the fair value of derivatives classified as financial liabilities (i.e., those with a negative mark-to-market) and exclude the fair value of derivatives classified as current financial assets, for 813 million euros, and those classified as non-current, for 5,499 million euros (i.e., those with a positive mark-to-market).
| Maturity | ||||||||||||||||||||||||||||
| (Millions of euros) | 2012 | 2013 | 2014 | 2015 | 2016 | Subsequent years | Total | |||||||||||||||||||||
| Debentures and bonds | 2,824 | 5,203 | 4,933 | 3,860 | 6,590 | 15,012 | 38,422 | |||||||||||||||||||||
| Promissory notes & commercial paper | 1,832 | - | - | - | - | - | 1,832 | |||||||||||||||||||||
| Other marketable debt securities | - | - | - | - | - | 1,985 | 1,985 | |||||||||||||||||||||
| Loans and other payables | 5,683 | 2,314 | 2,746 | 4,384 | 2,774 | 3,722 | 21,623 | |||||||||||||||||||||
| Derivative financial liabilities | 313 | 92 | 126 | 289 | 191 | 1,438 | 2,449 | |||||||||||||||||||||
| TOTAL | 10,652 | 7,609 | 7,805 | 8,533 | 9,555 | 22,157 | 66,311 | |||||||||||||||||||||
The composition of these financial liabilities, by category, at December 31, 20112014 and 20102013 is as follows:
| December 31, 2014 | |||||||||
| Fair value through profit or loss | Measurement hierarchy | ||||||||
| Millions of euros | Held for trading | Fair value option | Hedges | Level 1 (Quoted prices) | Level 2 (Other directly observable market inputs) | Level 3 (Inputs not based on observable market data) | Liabilities at amortized cost | Total carrying amount | Total fair value |
| Issues | − | − | − | − | − | − | 44,730 | 44,730 | 49,434 |
| Loans, other payables and other financial liabilities | 2,562 | − | 1,070 | 105 | 3,527 | − | 11,420 | 15,052 | 15,212 |
| Total financial liabilities | 2,562 | − | 1,070 | 105 | 3,527 | − | 56,150 | 59,782 | 64,646 |
| December 31, 2011 | ||||||||||||||||||||||||||||||||||||
| Fair value through profit or loss | Measurement hierarchy | |||||||||||||||||||||||||||||||||||
| Millions of euros | Held for trading | Fair value option | Hedges | Level 1 (Quoted prices) | Level 2 (Other directly observable market inputs) | Level 3 (Inputs not based on observable market data) | Liabilities at amortized cost | Total carrying amount | Total fair value | |||||||||||||||||||||||||||
| Issues | - | - | - | - | - | - | 42,239 | 42,239 | 42,203 | |||||||||||||||||||||||||||
| Interest-bearing debt | 1,246 | - | 1,203 | 78 | 2,371 | - | 21,623 | 24,072 | 21,961 | |||||||||||||||||||||||||||
| Total financial liabilities | 1,246 | - | 1,203 | 78 | 2,371 | - | 63,862 | 66,311 | 64,164 | |||||||||||||||||||||||||||
| December 31, 2010 | |||||||||||||||||||||||||||||||||||||||||||||
| December 31, 2013 | December 31, 2013 | ||||||||||||||||||||||||||||||||||||||||||||
| Fair value through profit or loss | Measurement hierarchy | Fair value through profit or loss | Measurement hierarchy | ||||||||||||||||||||||||||||||||||||||||||
| Millions of euros | Held for trading | Fair value option | Hedges | Level 1 (Quoted prices) | Level 2 (Other directly observable market inputs) | Level 3 (Inputs not based on observable market data) | Liabilities at amortized cost | Total carrying amount | Total fair value | Held for trading | Fair value option | Hedges | Level 1 (Quoted prices) | Level 2 (Other directly observable market inputs) | Level 3 (Inputs not based on observable market data) | Liabilities at amortized cost | Total carrying amount | Total fair value | |||||||||||||||||||||||||||
| Issues | - | - | - | - | - | - | 39,692 | 39,692 | 39,127 | − | 43,418 | 46,120 | |||||||||||||||||||||||||||||||||
| Interest-bearing debt | 695 | - | 806 | 210 | 1,291 | - | 19,907 | 21,408 | 19,777 | ||||||||||||||||||||||||||||||||||||
| Loans, other payables and other financial liabilities | 1,315 | − | 1,631 | 111 | 2,835 | − | 14,335 | 17,281 | 17,401 | ||||||||||||||||||||||||||||||||||||
| Total financial liabilities | 695 | - | 806 | 210 | 1,291 | - | 59,599 | 61,100 | 58,904 | 1,315 | − | 1,631 | 111 | 2,835 | − | 57,753 | 60,699 | 63,521 | |||||||||||||||||||||||||||
The calculation of the fair values of the Telefónica Group’s debt instruments required an estimate, for each currency and subsidiary, of the credit spread curve using the prices of the Group’s bonds and credit derivatives.
Part of the amount owed by the Telefónica Group includes restatements to amortized cost at December 31, 2014 and 2013 as a result of fair value interest rate and exchange rate hedges.
a) Issues
The movement in issues of debentures, bonds and other marketable debt securities in 20112014 and 20102013 is as follows:
| Millions of euros | Domestic currency issues | Foreign currency issues | Short-term promissory notes and commercial paper | Other non Current Marketable debt securities | Total | Debenture and bond issues | Short-term promissory notes and commercial paper | Other non-Current Marketable debt securities | Total | |||||||||||||||
| Balance at 12/31/09 | 17,575 | 15,387 | 873 | 2,008 | 35,843 | |||||||||||||||||||
| Balance at 12/31/12 | 44,142 | 1,128 | 59 | 45,329 | ||||||||||||||||||||
| New issues | 2,392 | 3,879 | 1,102 | - | 7,373 | 5,634 | 195 | − | 5,829 | |||||||||||||||
| Redemptions, conversions and exchanges | (1,269 | ) | (3,634 | ) | (311 | ) | - | (5,214 | ) | (5,667) | (45) | − | (5,712) | |||||||||||
| Changes in consolidation scope | - | 317 | - | - | 317 | |||||||||||||||||||
| Revaluation and other movements | 96 | 1,250 | 64 | (37 | ) | 1,373 | (2,029) | 1 | − | (2,028) | ||||||||||||||
| Balance at 12/31/10 | 18,794 | 17,199 | 1,728 | 1,971 | 39,692 | |||||||||||||||||||
| Balance at 12/31/13 | 42,080 | 1,279 | 59 | 43,418 | ||||||||||||||||||||
| New issues | 2,300 | 2,283 | 166 | - | 4,749 | 4,453 | 27 | − | 4,480 | |||||||||||||||
| Redemptions, conversions and exchanges | (2,250 | ) | (985 | ) | (66 | ) | - | (3,301 | ) | (5,057) | (805) | (59) | (5,921) | |||||||||||
| Changes in consolidation scope | - | - | - | - | - | |||||||||||||||||||
| Revaluation and other movements | 641 | 439 | 5 | 14 | 1,099 | 2,751 | 2 | − | 2,753 | |||||||||||||||
| Balance at 12/31/11 | 19,485 | 18,936 | 1,833 | 1,985 | 42,239 | |||||||||||||||||||
| Balance at 12/31/14 | 44,228 | 502 | − | 44,730 | ||||||||||||||||||||
Debentures and bonds
Telefónica, S.A. has a full and unconditional guarantee on issues made by Telefónica Emisiones, S.A.U., Telefónica Finanzas México, S.A. de C.V., Telefónica Europe, B.V. and Telefónica Europe, B.V.Participaciones, S.A.U., all of which are, directly or indirectly, wholly ownedwholly-owned subsidiaries of Telefónica, S.A.
| · |
| · |
Other long-term marketable debt securities
| Balance at 12/31/11 | Balance at 12/31/10 | |||||||||||||||||||||||
| Current | Non-current | Current | Non-current | |||||||||||||||||||||
| Total | Total | |||||||||||||||||||||||
| Loans and other payables | 5,683 | 15,940 | 21,623 | 3,664 | 16,243 | 19,907 | ||||||||||||||||||
| Derivative financial liabilities (Note 16) | 313 | 2,136 | 2,449 | 323 | 1,178 | 1,501 | ||||||||||||||||||
| Total | 5,996 | 18,076 | 24,072 | 3,987 | 17,421 | 21,408 | ||||||||||||||||||
b) Interest-bearing debt
The average interest rate on outstanding loans and other payables at December 31, 20112014 was 4.04% (2.56%2.88% (3.43% in 2010)2013). This percentage does not include the impact of hedges arranged by the Group.
The main financing transactions included under “Interest-bearing debt” outstanding at December 31, 20112014 and 20102013 and their nominal amounts are provided in Appendix IV.V.
Interest-bearing debt arranged or repaid in 2011 and 20102014 mainly includes the following:
| · | On |
| · | On February |
| · | On |
| · | On June |
| · |
| · |
| · | During 2014, Telefónica, |
| · | During 2014, Telefónica, S.A. drew down an aggregate principal amount of |
At December 31, 2011,2014, the Telefónica Group had total unused credit facilitiespresented availabilities of financing from variousdifferent sources amounting to approximately 10,11911,545 million euros (approximately 11,000(13,197 million euros at December 31, 2010), which included 2,000 million euros related to the undrawn amount of the loan to acquire Brasilcel, N.V.2013).
Loans by currency
The breakdown of loans“Loans and other payables” by currency at December 31, 20112014 and 2010,2013, along with the equivalent value of foreign-currency loans in euros, is as follows:
| Outstanding balance (in millions) | ||||||||||||||||
| Currency | Euros | |||||||||||||||
| Currency | 12/31/11 | 12/31/10 | 12/31/11 | 12/31/10 | ||||||||||||
| Euros | 13,099 | 11,778 | 13,099 | 11,778 | ||||||||||||
| US dollars | 2,520 | 2,580 | 1,947 | 1,931 | ||||||||||||
| Brazilian reais | 4,014 | 3,633 | 1,545 | 1,632 | ||||||||||||
| Argentine pesos | 764 | 1,080 | 137 | 203 | ||||||||||||
| Colombian pesos | 9,035,173 | 8,176,727 | 3,594 | 3,197 | ||||||||||||
| Yen | 14,916 | 16,882 | 149 | 155 | ||||||||||||
| Chilean peso | 106,284 | 54,886 | 158 | 88 | ||||||||||||
| New soles | 853 | 948 | 245 | 253 | ||||||||||||
| Pounds sterling | 552 | 557 | 661 | 648 | ||||||||||||
| Czech crown | 49 | 131 | 2 | 5 | ||||||||||||
| Other currencies | 86 | 17 | ||||||||||||||
| Total Group | N/A | N/A | 21,623 | 19,907 | ||||||||||||
| Outstanding balance (in millions) | ||||
| Currency | Euros | |||
| Currency | 12/31/14 | 12/31/13 | 12/31/14 | 12/31/13 |
| Euro | 5,077 | 7,918 | 5,077 | 7,918 |
| US dollar | 3,683 | 3,622 | 3,033 | 2,626 |
| Brazilian Real | 3,010 | 3,667 | 933 | 1,135 |
| Colombian Peso | 5,592,388 | 5,377,545 | 1,925 | 2,024 |
| Pounds Sterling | 140 | 189 | 180 | 227 |
| Other currencies | 272 | 405 | ||
| Total Group | 11,420 | 14,335 | ||
The composition of “Trade and other payables” is as follows:
| Millions of euros | 12/31/2014 | 12/31/2013 | ||||||||||||||||||
| 12/31/11 | 12/31/10 | Non-current | Current | Non-current | Current | |||||||||||||||
| Millions of euros | Non-current | Current | Non-current | Current | ||||||||||||||||
| Trade payables | - | 8,888 | - | 9,038 | − | 8,770 | − | 8,144 | ||||||||||||
| Advances received on orders | - | 77 | - | 83 | ||||||||||||||||
| Other payables | 1,620 | 6,684 | 1,761 | 8,162 | 1,500 | 6,008 | 1,324 | 5,146 | ||||||||||||
| Deferred income | 472 | 1,766 | 543 | 1,775 | ||||||||||||||||
| Payable to associates (Note 9) | - | 440 | - | 193 | ||||||||||||||||
| Deferred revenue | 877 | 1,441 | 377 | 1,353 | ||||||||||||||||
Payable to associates and joint ventures (Note 9) | − | 724 | − | 578 | ||||||||||||||||
| Total | 2,092 | 17,855 | 2,304 | 19,251 | 2,377 | 16,943 | 1,701 | 15,221 | ||||||||||||
“Deferred income”revenue” principally includes the amount of connectiondeferred revenue from sales of prepaid cards, from handsets transferred to the distributor, rights of use on the cable network, activation fees not yet recognized in the income statement customerand loyalty programs, and advance payments received on prepay contracts.campaigns.
The detail of current “Other payables” at December 31, 20112014 and 20102013 is as follows:
| Millions of euros | Balance at 12/31/11 | Balance at 12/31/10 | Balance at 12/31/2014 | Balance at 12/31/2013 | ||||||
| Dividends payable by Group companies | 241 | 199 | ||||||||
| Dividends pending payment to non-controlling interests | 231 | 228 | ||||||||
| Payables to suppliers of property, plant and equipment | 4,393 | 4,455 | 3,890 | 3,248 | ||||||
| Short term debt for spectrum acquisition | 272 | 211 | ||||||||
| Accrued employee benefits | 728 | 780 | 821 | 745 | ||||||
| Deferred payment for Brasilcel, N.V. (Note 5) | - | 1,977 | ||||||||
| Advances received on orders | 216 | 126 | ||||||||
| Other non-financial non-trade payables | 1,322 | 751 | 578 | 588 | ||||||
| Total | 6,684 | 8,162 | 6,008 | 5,146 | ||||||
Information on deferred paymentsaverage payment period to suppliers of Spanish companies (Third additional provision, "Information requirement" of Law 15/2010 of July 5th)
The Telefónica Group’s Spanish companies have adapted their internal processes and payment schedules to the provisions of Law 15/2010 (amended by Law 31/2014) and Royal Decree-Law 4/2013, amending Law 3/2004, which establishes measures against late paymentspayment in commercial transactions. To this end contractualEngagement conditions with commercial suppliers in 2011 have2014 included payment periods equalof up to or inferior60 days, according to 85 days, as established in the regulation.terms agreed between the parties.
For efficiency purposes and in line with general business practice, the Telefónica Group’s companies in Spain have definedagreed payment schedules with providers,suppliers, whereby most of the payments are made on set days which, for the main companies, occur three times aof each month. Invoices falling due between two payment days are settled on the following payment date in the schedule.
Payments to Spanish suppliers in 20112014 and 2013 surpassing the established legal limit were the resultsresult of circumstances or incidents beyond the payment policies, which includemainly the delay in issuing invoices (legal obligation of the supplier), the closing of agreements with suppliers over the delivery of goods or the rendering of services, or occasional processing issues.
Information on contracts entered into afterof payments to commercial suppliers that exceed the maximum period established in the Spanish Law 15/2010 took effect that surpassed the established legal limit per the law is as follows:
| 2011 | 2014 | 2013 | ||||||||||
| Millions of euros | Amount | % | Amount | % | Amount | % | ||||||
| Payments within allowable period | 8,361 | 95.2 | 5,408 | 95.0 | 5,897 | 94.0 | ||||||
| Other | 425 | 4.8 | 277 | 5.0 | 375 | 6.0 | ||||||
| Total payments to commercial suppliers | 8,786 | 100.0 | 5,685 | 100.0 | 6,272 | 100.0 | ||||||
| Weighted average days past due | 38 | 28 | 35 | |||||||||
Deferrals at year-end that exceed the limit (*) | 27 | 11 | 17 | |||||||||
| (*) |
At the date of authorization for issue of these consolidated financial statements, the Group had processedmade the outstanding payments, except forin exceptional cases where an agreement with suppliers was being negotiated.
According to such criteria, the average payment period to suppliers of the Telefónica Group’s companies in Spain in 2014, according to our best estimates, amounted to 51 days.
The amounts of provisions in 20112014 and 20102013 are as follows:
| 12/31/11 | 12/31/10 | |||||||||||||||||||||||
| Millions of euros | Current | Non-current | Total | Current | Non-current | Total | ||||||||||||||||||
| Employee benefits: | 807 | 4,999 | 5,806 | 916 | 2,974 | 3,890 | ||||||||||||||||||
| - Termination plans | 790 | 3,908 | 4,698 | 898 | 1,858 | 2,756 | ||||||||||||||||||
| - Post-employment defined benefit plans | - | 799 | 799 | - | 829 | 829 | ||||||||||||||||||
| - Other benefits | 17 | 292 | 309 | 18 | 287 | 305 | ||||||||||||||||||
| Other provisions | 696 | 2,173 | 2,869 | 759 | 1,891 | 2,650 | ||||||||||||||||||
| Total | 1,503 | 7,172 | 8,675 | 1,675 | 4,865 | 6,540 | ||||||||||||||||||
| 12/31/2014 | 12/31/2013 | |||||
| Millions of euros | Current | Non-current | Total | Current | Non-current | Total |
| Employee benefits | 1,021 | 3,426 | 4,447 | 763 | 3,722 | 4,485 |
| Termination plans | 956 | 2,430 | 3,386 | 703 | 2,762 | 3,465 |
| Post-employment defined benefit plans | − | 872 | 872 | − | 799 | 799 |
| Other benefits | 65 | 124 | 189 | 60 | 161 | 221 |
| Other provisions | 574 | 3,254 | 3,828 | 508 | 2,578 | 3,086 |
| Total | 1,595 | 6,680 | 8,275 | 1,271 | 6,300 | 7,571 |
The Group made a provision in 2014 amounting to 652 million euros for employee restructuring costs and other non-recurring costs, with the aim of enchanting the Company’s future efficiency (adjusting the structure to reduce complexity and gain agility in execution).
Termination plans
The movement in provisions for post-employment plans in 2014 and 2013 is as follows:
| Millions of euros | |
| Provisions for post-employment plans at 12/31/12 | |
| Additions | 68 |
| Retirements/amount applied | (688) |
| Transfers | (4) |
| Translation differences and accretion | (62) |
| Provisions for post-employment plans at 12/31/13 | 3,465 |
| Additions | 525 |
| Retirements/amount applied | (733) |
| Transfers | (14) |
| Inclusion of companies | 12 |
| Translation differences and accretion | 131 |
| Provisions for post-employment plans at 12/31/14 | 3,386 |
Telefónica Germany
Within the context of transformation of Telefónica Deutschland following the purchase of E-Plus (see Note 5) in a bid to increase profitability by securing operational synergies, an employee restructuring plan is being carried out in respect of which a provision of 321 million euros was recorded in 2014. The plan is expected to reduce 1,600 of the approximately 9,100 current full-time positions of Telefonica Deutschland in the period from 2015-2018.
Telefónica Spain
In the last few years, the Telefónica Group has carried out early retirement plans in order to adapt its cost structure to the prevailing environment in the markets where it operates, making certain strategic decisions relating to its size and organization.
The companies bound by these commitments calculated provisions required at 20112014 and 20102013 year-end using actuarial assumptions pursuant to current legislation, including the PERM/F- 2000 C mortality tables and a variablehigh quality credit market based interest rate based on market yield curves.
The movement indiscount rate used for these provisions for post employmentat December 31, 2014, was 0.97%, with an average length of the plans in 2011 and 2010 is as follows:of 3.9 years.
Post-employment defined benefit plans | ||||
The Group has a number of defined-benefit plans in the countries where it operates. The following tables present the main data of these plans:
| 12/31/11 | Spain | Europe | Latin America | ||||||||||||||||||||||||||||||||
| 12/31/2014 | 12/31/2014 | ||||||||||||||||||||||||||||||||||
| Millions of euros | ITP | Survival | UK | Germany | Brazil | Other | Total | Spain | United Kingdom | Germany | Brazil | Hispano américa | Others | Total | |||||||||||||||||||||
| Obligation | 412 | 242 | 976 | 55 | 298 | 18 | 2,001 | 593 | 1,529 | 201 | 239 | 37 | 11 | 2,610 | |||||||||||||||||||||
| Assets | - | - | (971 | ) | (79 | ) | (235 | ) | (7 | ) | (1,292 | ) | − | (1,567) | (112) | (145) | − | (11) | (1,835) | ||||||||||||||||
| Net provision before asset ceiling | 412 | 242 | 5 | (24 | ) | 63 | 11 | 709 | 593 | (38) | 89 | 94 | 37 | − | 775 | ||||||||||||||||||||
| Asset ceiling | - | - | - | 17 | 51 | - | 68 | − | 42 | − | 3 | 45 | |||||||||||||||||||||||
| Net provision | 412 | 242 | 5 | 2 | 127 | 11 | 799 | 593 | 9 | 89 | 141 | 37 | 3 | 872 | |||||||||||||||||||||
| Net assets | - | - | - | 9 | 13 | - | 22 | − | 47 | − | 5 | − | 52 | ||||||||||||||||||||||
| 12/31/10 | Spain | Europe | Latin America | ||||||||||||||||||||||||||||||||
| 12/31/2013 | 12/31/2013 | ||||||||||||||||||||||||||||||||||
| Millions of euros | ITP | Survival | UK | Germany | Brazil | Other | Total | Spain | United Kingdom | Germany | Brazil | Hispano américa | Others | Total | |||||||||||||||||||||
| Obligation | 424 | 208 | 918 | 57 | 272 | 13 | 1,892 | 567 | 1,251 | 93 | 211 | 93 | 9 | 2,224 | |||||||||||||||||||||
| Assets | - | - | (838 | ) | (63 | ) | (250 | ) | (5 | ) | (1,156 | ) | − | (1,236) | (91) | (146) | − | (6) | (1,479) | ||||||||||||||||
| Net provision before asset ceiling | 424 | 208 | 80 | (6 | ) | 22 | 8 | 736 | 567 | 15 | 2 | 65 | 93 | 3 | 745 | ||||||||||||||||||||
| Asset ceiling | - | - | - | 9 | 71 | - | 80 | − | 3 | 45 | − | 48 | |||||||||||||||||||||||
| Net provision | 424 | 208 | 80 | 3 | 106 | 8 | 829 | 567 | 15 | 5 | 116 | 93 | 3 | 799 | |||||||||||||||||||||
| Net assets | - | - | - | - | 13 | - | 13 | − | 6 | − | 6 | ||||||||||||||||||||||||
The movement in the present value of obligations in 20112014 and 20102013 is as follows:
| Spain | Europe | Latin America | |||||||||||||||||||||||||||||||||
| Millions of euros | ITP | Survival | UK | Germany | Brazil | Other | Total | Spain | United Kingdom | Germany | Brazil | Hispano américa | Other | Total | |||||||||||||||||||||
| Present value of obligation at 12/31/09 | 451 | 191 | 922 | 37 | 159 | 11 | 1,771 | ||||||||||||||||||||||||||||
| Present value of obligation at 12/31/12 | 654 | 1,139 | 81 | 298 | 76 | 9 | 2,257 | ||||||||||||||||||||||||||||
| Translation differences | - | - | 31 | - | 26 | - | 57 | − | (21) | − | (43) | (39) | − | (103) | |||||||||||||||||||||
| Current service cost | - | 8 | 29 | 2 | 4 | - | 43 | 2 | 4 | 3 | 44 | − | 56 | ||||||||||||||||||||||
| Past service cost | - | - | (35 | ) | - | - | - | (35 | ) | − | (4) | − | (4) | ||||||||||||||||||||||
| Interest cost | 15 | 7 | 55 | 2 | 23 | 1 | 103 | 12 | 49 | 3 | 24 | 6 | − | 94 | |||||||||||||||||||||
| Actuarial losses and gains | 8 | 9 | - | 16 | 2 | 1 | 36 | (49) | 106 | 7 | (58) | 22 | − | 28 | |||||||||||||||||||||
| Benefits paid | (50 | ) | (7 | ) | (14 | ) | - | (11 | ) | - | (82 | ) | (52) | (22) | (1) | (13) | (16) | − | (104) | ||||||||||||||||
| Plan curtailments | - | - | 1 | - | - | - | 1 | ||||||||||||||||||||||||||||
| Inclusion of companies | - | - | - | - | 69 | - | 69 | ||||||||||||||||||||||||||||
| Exclusion of companies | - | - | (71 | ) | - | - | - | (71 | ) | ||||||||||||||||||||||||||
| Present value of obligation at 12/31/10 | 424 | 208 | 918 | 57 | 272 | 13 | 1,892 | ||||||||||||||||||||||||||||
| Present value of obligation at 12/31/13 | 567 | 1,251 | 93 | 211 | 93 | 9 | 2,224 | ||||||||||||||||||||||||||||
| Translation differences | - | - | 29 | - | (26 | ) | 1 | 4 | − | 95 | − | (1) | (68) | 1 | 27 | ||||||||||||||||||||
| Current service cost | - | 9 | 25 | 3 | 4 | 1 | 42 | 3 | − | 4 | 1 | 11 | − | 19 | |||||||||||||||||||||
| Past service cost | - | - | - | - | - | - | - | ||||||||||||||||||||||||||||
| Interest cost | 13 | 7 | 51 | 2 | 26 | 2 | 101 | 15 | 58 | 4 | 23 | 2 | − | 102 | |||||||||||||||||||||
| Actuarial losses and gains | 23 | 26 | (27 | ) | (7 | ) | 38 | 2 | 55 | 59 | 147 | 47 | 19 | 4 | 1 | 277 | |||||||||||||||||||
| Benefits paid | (48 | ) | (8 | ) | (20 | ) | - | (16 | ) | - | (92 | ) | (51) | (22) | (2) | (14) | (5) | − | (94) | ||||||||||||||||
| Plan curtailments | - | - | - | - | - | (1 | ) | (1 | ) | ||||||||||||||||||||||||||
| Present value of obligation at 12/31/11 | 412 | 242 | 976 | 55 | 298 | 18 | 2,001 | ||||||||||||||||||||||||||||
| Inclusion of companies | − | 55 | − | 55 | |||||||||||||||||||||||||||||||
| Present value of obligation at 12/31/14 | 593 | 1,529 | 201 | 239 | 37 | 11 | 2,610 | ||||||||||||||||||||||||||||
Movements in the fair value of plan assets in 20112014 and 20102013 are as follows:
| Millions of euros | United Kingdom | Germany | Brazil | Other | Total |
| Fair value of plan assets at 12/31/12 | 1,191 | 76 | 225 | 6 | 1,498 |
| Translation differences | (27) | − | (32) | − | (59) |
| Expected return on plan assets | 54 | 2 | 18 | − | 74 |
| Actuarial losses and gains | (19) | − | (57) | − | (76) |
| Company contributions | 59 | 14 | 3 | − | 76 |
| Benefits paid | (22) | (1) | (11) | − | (34) |
| Fair value of plan assets at 12/31/13 | 1,236 | 91 | 146 | 6 | 1,479 |
| Translation differences | 95 | − | − | 2 | 97 |
| Expected return on plan assets | 59 | 4 | 17 | 1 | 81 |
| Actuarial losses and gains | 118 | (1) | (6) | 1 | 112 |
| Company contributions | 81 | 9 | − | 1 | 91 |
| Benefits paid | (22) | (2) | (12) | − | (36) |
| Inclusion of companies | − | 11 | − | − | 11 |
| Fair value of plan assets at 12/31/14 | 1,567 | 112 | 145 | 11 | 1,835 |
| Europe | Latin America | |||||||||||||||||||
| Millions of euros | UK | Germany | Brazil | Other | Total | |||||||||||||||
| Fair value of plan assets at 12/31/09 | 744 | 58 | 116 | - | 918 | |||||||||||||||
| Translation differences | 23 | - | 25 | 1 | 49 | |||||||||||||||
| Expected return on plan assets | 54 | 2 | 23 | 1 | 80 | |||||||||||||||
| Actuarial losses and gains | (4 | ) | (5 | ) | 4 | - | (5 | ) | ||||||||||||
| Company contributions | 76 | 8 | 4 | 3 | 91 | |||||||||||||||
| Employee contributions | 1 | - | - | - | 1 | |||||||||||||||
| Benefits paid | (14 | ) | - | (11 | ) | - | (25 | ) | ||||||||||||
| Inclusion of companies | - | - | 89 | - | 89 | |||||||||||||||
| Exclusion of companies | (42 | ) | - | - | - | (42 | ) | |||||||||||||
| Fair value of plan assets at 12/31/10 | 838 | 63 | 250 | 5 | 1,156 | |||||||||||||||
| Translation differences | 29 | - | (21 | ) | 1 | 9 | ||||||||||||||
| Expected return on plan assets | 48 | 3 | 23 | - | 74 | |||||||||||||||
| Actuarial losses and gains | (13 | ) | (3 | ) | (5 | ) | - | (21 | ) | |||||||||||
| Company contributions | 89 | 16 | 3 | 1 | 109 | |||||||||||||||
| Employee contributions | - | - | - | - | - | |||||||||||||||
| Benefits paid | (20 | ) | - | (15 | ) | - | (35 | ) | ||||||||||||
| Fair value of plan assets at 12/31/11 | 971 | 79 | 235 | 7 | 1,292 | |||||||||||||||
| Millions of euros | 2011 | 2010 | 2009 | |||||||||
| Spain | (48 | ) | (17 | ) | 1 | |||||||
| Europe | 14 | (6 | ) | (184 | ) | |||||||
| Latin America | (51 | ) | (71 | ) | (6 | ) | ||||||
| Total | (85 | ) | (94 | ) | (189 | ) | ||||||
The Group’s principal defined-benefit plans are:
| a) | ITP (Spain) |
The amount for this provision totaled 412326 million euros at December 31, 2011 (4242014 (334 million euros at December 31, 2010)2013).
| b) |
Serving employees who did not join the defined pension plan are still entitled to receive survivorship benefits at the age of 65.
The amount for this provision totaled 242267 million euros at December 31, 2011 (2082014 (233 million euros at December 31, 2010)2013).
The main actuarial assumptionsdiscount rate used in valuingfor these plans are as follows:
| Survival | ITP | |||
| 12/31/11 | 12/31/10 | 12/31/11 | 12/31/10 | |
| Discount rate | 0.787%-2.521% | 0.682%-3.417% | 0.787%-2.521% | 0.682%-3.417% |
| Expected rate of salary increase | 2.50% | 2.50% | - | - |
| Mortality tables | PERM/F-2000C Combined with OM77 | PERM/F-2000C Combined with OM77 | 92% PERM 2000C/100% PERF 2000 C | 92% PERM 2000C/100% PERF 2000 C |
| Employees | 2011 | 2010 |
| UK | 4,590 | 4,617 |
| Germany | 5,979 | 5,839 |
The main actuarial assumptions used in valuing these plans are as follows:
| 12/31/11 | 12/31/10 | |||
| UK | Germany | UK | Germany | |
| Nominal rate of salary increase | 4.0% | 3.5% | 4.5% | 1% |
| Nominal rate of pension payment increase | 2.9% | 1.0%-4.0% | 3.5% | 2.0%-4.0% |
| Discount rate | 4.9% | 5.3% | 5.6% | 6.1% |
| Expected inflation | 3.0% | 2% | 3.5% | 2.0%-4.0% |
| Expected return on plan assets | ||||
| - Shares | 7.0% | N/A | 7.5% | N/A |
| - UK government bonds | - | N/A | - | N/A |
| - Other bonds | 4.9% | N/A | 5.2% | N/A |
| - Rest of assets | 3.0% | 4%-4.25% | 4.2% | 4.10%-4.25% |
| Mortality tables | Pna00mc0.5 underpin | Prf. Klaus Heubeck (RT 2005 G) | Pna00mcfl0.5 | Prf. Klaus Heubeck (RT 2005 G) |
| Survival | ITP | |||
| 12/31/2014 | 12/31/2013 | 12/31/2014 | 12/31/2013 | |
| Discount rate | 0.494%-2.011% | 0.683%-3.286% | 0.494%-2.011% | 0.683%-3.286% |
| Expected rate of salary increase | 0% - 0.5% | 0.00% | − | − |
| Mortality tables | PERM/F-2000C - OM77 | PERM/F-2000C - OM77 | 90% PERM 2000C/98% PERF 2000 C | 90% PERM 2000C/98% PERF 2000 C |
-100 b.p. | +100 b.p. | ||
| Impact on value | Impact on income statement | Impact on value | Impact on income statement |
| -146 | -94 | 134 | 89 |
| Variations of less than -100bp are considered for terms of less than five years to prevent negative rates. | |||
A 100 b.p. increase in the discount rate would reduce the value of the liabilities by 134 million euros and have a positive impact on income statement of 89 million euros before tax. However, a 100 b.p. decrease in the discount rate would increase the value of the liabilities by 146 million euros and have a negative impact on income statement of 94 million euros before tax.
The Telefónica Brasil (formerly Telecomunicações de São Paulo, S.A.)Group actively manages this position and has arranged a derivatives portfolio to minimize the impact of changes in the discount rate (see Note 16).
Telefónica UK Pension Plan
The Telefónica UK Pension Plan provides pension benefits to the various companies of the Telefónica Group in UK coming from the O2 Group. The Plan is comprised of defined contribution and defined benefit sections. The defined
benefit sections were closed to future accrual with effect from February 28, 2013. The companies continued to provide retirement benefits through the defined contribution sections of the Plan.
The number of beneficiaries of these plans at December 31, 2014 and 2013 are 4,563 and 4,572 respectively. At December 31, 2014, the weighted average duration of the Plan was 23 years.
The main actuarial assumptions used in valuing the Plan are as follows:
| 12/31/2014 | 12/31/2013 | |
| Nominal rate of pension payment increase | 3.05% | 3.25% |
| Discount rate | 3.70% | 4.50% |
| Expected inflation | 3.20% | 3.40% |
| Mortality tables | 95% S2NA, CMI 2014 1% | S1NA_L, CMI 2013 1% |
Fair value of Plan assets is as follows:
| Millions of euros | 12/31/2014 | 12/31/2013 |
| Shares | 328 | 259 |
| Bonds | 1,205 | 977 |
| Cash equivalents | 34 | - |
| Total | 1,567 | 1,236 |
At December 31, 2014, reasonably possible changes to one of the following actuarial assumptions, holding other assumptions constant, would have affected the defined benefit obligation by the amounts shown below:
| Millions of euros | Increase in defined benefit obligation |
| Discount rate (0.25% decrease) | 90 |
| Expected inflation (0.25% increase) | 78 |
| Life expectancy (1 year longer) | 36 |
Telefónica Brazil pension plans
Telefónica Brazil and its subsidiaries had various pension plan, medical insurance and life insurance obligations with employees.
The main actuarial assumptions used in valuing these plans are as follows:
| 12/31/11 | 12/31/10 | 12/31/2014 | 12/31/2013 | |
| Discount rate | 9.73% | 10.25% | 11.17% - 11.31% | 10.77% |
| Nominal rate of salary increase | 6.54%-7.20% | 6.54% - 7.20% | 6.69% | 6.18% |
| Expected inflation | 4.50% | 5.00% | 5.00% | 4.50% |
| Cost of health insurance | 7.64% | 8.15% | 8.15% | 7.64% |
| Expected return on plan assets | 11.07%-12.08% | 10.70% - 11.60% | ||
| Mortality tables | AT 2000 M/F | AT 2000 M/F | AT 2000 M/F | |
In addition, Telefónica Brasil,Brazil, along with other companies resulting from the privatization of Telebrás (Telecomunicações Brasileiras, S.A.) in 1998, adhered to PBS-A, a non-contribution defined benefit plan managed by Fundação Sistel de Seguridade Social, whose beneficiaries are employees that retired prior to January 31, 2000. At December 31, 2011,2014 net plan assets amounted to 668999 million Brazilian reais equivalent to 275 million euros (579(918 million Brazilian reais at December 31, 2010,2013), equivalent to 260310 million euros)euros (284 million euros at December 31, 2013). This plan does not have an impact on the consolidated statement of financial position, given that recovery of the assets is not foreseeable.
The valuations used to determine the value of obligations and plan assets, where appropriate, were performed as of December 31, 20112014 by external and internal actuaries. The projected unit credit method was used in all cases.
Other provisions
The movement in “Other provisions” in 20112014 and 20102013 is as follows:
| Millions of euros | ||||
| Other provisions at December 31, | 3,392 | |||
| Additions and accretion | 968 | |||
| Retirements/amount applied | ||||
| (735) | ||||
| Translation differences and other | (539) | |||
| Other provisions at December 31, | 3,086 | |||
| Additions and accretion | 1,149 | |||
| Retirements/amount applied | ||||
| 197 | ||||
| Translation differences and other | ||||
| Other provisions at December 31, | 3,828 |
With respect to the European Commission Decision of July 4, 2007 concerning Telefónica Spain's broadband pricing policy, on July 10, 2014 the European Union Court of Justice dismissed the appeal submitted by Telefónica, S.A. and Telefónica de España, maintained the fine and terminated the appeal (see Note 21). Consequently the Group paid a fine of 152 million euros and 58 million euros of interest. Provision for this item totaled 205 million euros at December 31, 2013.
In addition to the employee restructuring plan in Telefonica Deutschland described above, this company made a provision of 87 million euros in 2014, primarily to cover the costs linked to the cancellation of certain contracts as a result of the integration with E-Plus (see Note 5).
“Other provisions” includes the amount recorded in 2007 in relation to the 188 million euro fine imposed on Telefónica de España, S.A.U. by the EC anti-trust authorities.
| · | Provisions for disputes regarding federal, state and municipal taxes totaling approximately 813 million euros (735 million euros at December 31, 2013). |
| · | Provisions for labor-related contingencies of approximately 315 million euros (307 million euros at December 31, 2013), which basically relate to claims filed by former and outsourced employees. |
| · | Civil claims by private consumers and consumer associations regarding services rendered, and other legal proceedings related with normal operations. Certain administrative proceedings are also in progress concerning disputes about obligations established in sector regulations. The amount accrued for these matters totals approximately 373 million euros (303 million euros at December 31, 2013). |
Given the nature of the risks covered by these provisions, it is not possible to determine a reliable schedule of potential payments, if any.
The Telefónica Group is exposed to various financial market risks as a result of: (i) its ordinary business activity, (ii) debt incurred to finance its business, (iii) its investments in companies, and (iv) other financial instruments related to the above commitments.
The main market risks affecting Group companies are as follows:
Exchange rate risk |
Exchange rate risk arises primarily fromfrom: (i) Telefónica’s international presence, through its investments and businesses in countries that use currencies other than the euro (primarily in Latin America, but also in the United Kingdom and the Czech Republic)Kingdom), and (ii) debt denominated in currencies other than that of the country where the business is conducted or the home country of the company incurring such debt.
| Interest rate risk |
Interest rate risk arises primarily fromin connection with changes in interest rates affectingaffecting: (i) financial expenses on floating rate debt (or short-term debt likely to be renewed), due to changes in interest rates and (ii) the value of long-term liabilities at fixed interest rates.
| Share price risk |
Share price risk arises primarily from changes in the value of the equity investments that(that may be bought, sold or otherwise involved in transactions,transactions), from changes in the value of derivatives associated with such investments, from changes in the value of treasury shares and from equity derivatives.
Other risks
The Telefónica Group is also exposed to liquidity risk if a mismatch arises between its financing needs (including operating and financial expense, investment, debt redemptions and dividend commitments) and its sources of finance (including revenues, divestments, credit lines from financial institutions and capital market transactions). The cost of finance could also be affected by movements in the credit spreads (over benchmark rates) demanded by lenders.
Finally, the Telefónica Group is exposed to “country risk”country risk (which overlaps with market and liquidity risks). This refers to the possible decline in the value of assets, cash flows generated or cash flows returned to the parent company as a result of political, economic or social instability in the countries where the Telefónica Group operates, especially in Latin America.
Risk management
The Telefónica Group actively manages these risks through the use of derivatives (primarily on exchange rates, interest rates and share prices) and by incurring debt in local currencies, where appropriate, with a view to stabilizing cash flows, the income statement and investments. In this way, it attempts to protect the Telefónica Group’s solvency, facilitate financial planning and take advantage of investment opportunities.
The Telefónica Group manages its exchange rate risk and interest rate risk in terms of net debt and net financial debt as calculated by them. The Telefónica Group believes that these parameters are more appropriate to understanding its debt position. Net debt and net financial debt take into account the impact of the Group’s cash balance and cash equivalents including derivatives positions with a positive value linked to liabilities. Neither net debt nor net financial debt as calculated by the Telefónica Group should be considered an alternative to gross financial debt (the sum of current and non-current interest-bearing debt) as a measure of liquidity.
For a more detailed description on reconciliation of net debt and net financial debt to gross financial debt, see Note 2.
Exchange rate risk
The fundamental objective of the exchange rate risk management policy is that, in event of depreciation in foreign currencies relative to the euro, any potential losses in the value of the cash flows generated by the businesses in such currencies, caused by depreciation in exchange rates of a foreign currency relative to the euro, are offset (to some extent) by savings from the reduction in the euro value of debt denominated in such currencies. This objective is also reflected on the decrease of the sensitivity to exchange rate variations of the net debt to OIBDA ratio, in order to protect the Group solvency. The degree of exchange rate hedging employed varies depending on the type of investment. For transactions of purchase or sale of business in currencies other than euro, additional hedges can be made on the estimate prices of the transactions or on estimated cash flows and OIBDA.
At December 31, 2011,2014, net debt in Latin American currencies was equivalent to approximately 7,9538,379 million euros. However, the Latin American currencies in which this debt is denominated is not distributed in proportion to the cash flows
generated in each currency. The future effectiveness of the strategy described above as a hedge of exchange rate risks therefore depends on which currencies depreciate relative to the euro.
The Telefónica Group also manages exchange rate risk by seeking to minimize the negative impact of any remaining exchange rate exposure on the income statement, regardless of whether there are open positions. Such open position exposure can arise for any of three reasons: (i) a thin market for local derivatives or difficulty in sourcing local currency finance which makes it impossible to arrange a low-cost hedge (as in Argentina and Venezuela), (ii) financing through intra-group loans, where the accounting treatment of exchange rate risk is different from that for financing through capital contributions, and (iii) as the result of a deliberate policy decision, to avoid the high cost of hedges that are not warranted by expectations or high risk of depreciation.
The following table illustrates the sensitivity of income lossforeign currency gains and losses and of equity to changes in exchange rates, where: a) to calculatein calculating the impact on the income statement, the exchange rate position affecting the income statement at the end of 20112014 was considered constant during 2012; and2015; b) to calculatein calculating the impact on equity, only monetary items have been considered, namely debt and derivatives such as hedges of net investmentsinvestment and loans to subsidiaries associated withrelated to the investment, whose compositionbreakdown is considered constant in 20122015 and identical to that existing at the end of 2011.2014. In both cases, Latin American currencies are assumed to depreciate against the US dollar and the rest of the currencies against the euro by 10%.
Millions of euros Currency | Change | Impact on the consolidated income statement | Impact on consolidated equity |
| All currencies vs. EUR | 10% | 112 | (180) |
| USD vs. EUR | 10% | 15 | 32 |
| European currencies vs. EUR | 10% | 1 | (353) |
| Latin American currencies vs. USD | 10% | 96 | 141 |
| All currencies vs. EUR | (10)% | (112) | 180 |
| USD vs. EUR | (10)% | (15) | (32) |
| European currencies vs. EUR | (10)% | (1) | 353 |
| Latin American currencies vs. USD | (10)% | (96) | (141) |
| Millions of euros | |||
| Currency | Change | Impact on the consolidated income statement | Impact on consolidated equity |
| All currencies vs EUR | 10% | 76 | (284) |
| USD vs EUR | 10% | 2 | (107) |
| European currencies vs EUR | 10% | 1 | (230) |
| Latin American currencies vs USD | 10% | 73 | 53 |
| All currencies vs EUR | (10)% | (76) | 284 |
| USD vs EUR | (10)% | (2) | 107 |
| European currencies vs EUR | (10)% | (1) | 230 |
| Latin American currencies vs USD | (10)% | (73) | (53) |
The exchange position of the Venezuelan bolivar affects the estimates made by the Group of the net asset value of the foreign currency position related to investments in Venezuela, the negative impact of which on the 2014 financial statements amounted to 271 million euros.
The Group’s monetary position in Venezuela at December 31, 20112014 is a net debtorcreditor position of 1,42812,404 million Venezuelan bolivars (equivalent to approximately 257204 million euros). However, itIt had ana debtor position until July; nevertheless the average exposure in 2014 has been a creditor position, in 2011, leadingwhich led to a higher financial expense in the amount of 2111 million euros.
Interest rate risk
The Telefónica Group’s financial expenses are exposed to changes in interest rates. In 2011,2014, the rates applied to the largest amount of short-term debt were mainly based on the Euribor, the Czech crown Pribor, the Brazilian SELIC, the US dollar and pound sterling Libor, the Mexican UDI and the Colombian UVR. In nominal terms, at December 31, 2011, 66%2014, 70% of the Telefónica Group’snica’s net debt (or 70% of long-term net debt) was atpegged to fixed interest rates fixed for a period longergreater than one year, compared to 65%71% of net debt (70%(74% of long-term net debt) in 2010.2013. Of the remaining 30% (net debt at floating rates or at fixed rates maturing in less thanunder one year), the interest rate on 1510 percentage points was set forhad interest rates collared in a period of more thanover one year (5%(or 3% of long-term debt), compared to 18while at December 31, 2013 this was the case for 11 percentage points onof net debt at floating rates or with fixed rates maturing in less thanwithin one year (7%(3% of long-term net debt) at December 31, 2010. This decrease in 2011 from 2010 is due to our decision to cancel or not renew an amount equivalent to 692 million euros of caps and floors in euros, US dollars and pounds sterling, following the policy implemented in 2009 in anticipation of a fall in interest rates..
In addition, early retirement liabilities were discounted to present value over the year, based on the curve on the swap rate markets.for instruments with very high credit quality. The decrease in interest rates has increased the market value of these liabilities. However, this increase was nearly completely offset by the increase in the value of the hedges on these positions.
Net financial expenses rose 11%expense amounted to 2,9412,822 million euros in 2011 from 2,6492014 (-1.6% year-on-year), and includes 293 million euros in 2010,due to net negative foreign exchange differences primarily as a result of the Company’s decision to adopt the SICAD II exchange rate of the Venezuelan bolivar. Excluding this effect, net financial expenses fell 8.2% year-on-year, mainly due to a 9.1% reduction in the 12.7% increase in average debt, placing the effective cost of debt over the last twelve months at 5.40%, 6 basis points higher than in 2011. Stripping out exchange-rate effects (and includingDecember 2013. The greater weight of debt in Latin America currencies and repayment and maturity of cheap debt in euros increases the impact of monetary correction), net financial expense for 2011 totaled 2,764 million euros, a 10% increase fromaverage cost in 47 basis points, while the 2,502 million euros obtainedlowest rates in 2010, below the 12.7% increaseLatin America and Europe reduce it in average debt mentioned previously.41 basis points.
To illustrate the sensitivity of financial expenses to variability in short-term interest rates, a 100 basis points increase in interest rates in all currencies in which Telefónica has financial positions at December 31, 20112014 has been assumed, and a 100 basis points decrease in interest rates in all currencies except those currencies with low interest rates, in order to avoid negative rates (euro, pound sterling and the US dollar, to avoid negative rates. Thedollar) and a constant position equivalent to that prevailing at the end of 2011 has also been assumed.2014.
To illustrate the sensitivity of equity to variability in interest rates, a 100 basis pointspoint increase in interest rates in all currencies and terms of the curve, in all curve periods where there is awhich Telefónica holds financial positionpositions at December 31, 2011, and2014 was assumed, as well as a 100 basis pointspoint decrease in all currencies and terms (except those below 1% in all periods, have been assumed. In addition, onlyorder to avoid negative rates). Cash flow hedge positions with cash flow hedges have beenwere also considered given thatas they are mostlyfundamentally the only positions where the changechanges in fairmarket value due to interest rate movements is recordedinterest-rate fluctuations are recognized in equity.
Millions of euros Change in basis points (bp) (*) | Impact on consolidated income statement | Impact on consolidated equity | ||
| Millions of euros | Millions of euros | |||
| Change in basis points (bp) | Impact on consolidated income statement | Impact on consolidated equity | ||
| +100bp | (141) | 779 | (111) | 370 |
| -100bp | 147 | 849 | 68 | (113) |
| (*) Impact on results of 100bp change in all currencies, except the pound sterling and the US dollar. | ||||
Share price risk
The Telefónica Group is exposed to changes in the value of equity investments that may be bought, sold or otherwise involved in transactions, from changes in the value of derivatives associated with such investments, from convertible or exchangeable instruments issued by Telefónica Group, from treasury shares and from equity derivatives.
According to the Telefónica, S.A. share option plan, Performance Share Plan (PSP) and the Performance & Investment Plan (PIP)Share-based payments plans (see Note 20)19) the shares to be delivered to employees under such plan may be either the parent company treasury shares, acquired by them or any of its Group companies; or newly-issued shares. The possibility of delivering shares to beneficiaries of the plan in the future, in accordance with relative total shareholders’ return, implies a risk since there could be an obligation to hand over a maximum number of shares at the end of each phase, whose acquisition (in the event of acquisition in the market) in the future could imply a higher cash outflow than required on the start date of each phase if the share price is above the corresponding price on the phase start date. In the event that new shares are issued for delivery to the beneficiaries of the plan, there would be a dilutive effect for ordinary shareholders as a result of the higher number of shares delivered under such plan outstanding.
In 2014 a new long-term incentive Plan consisting of the delivery of shares of Telefónica, S.A. aimed at members of the Executives of Telefónica Group was launched denominated Performance Share Plan (PIP). Furthermore 2014 Ordinary General Shareholders’ Meeting approved a Global incentive Telefónica, S.A. shares purchase Plan for the Employees of the Telefónica Group.
To reduce the risk associated with variations in share price under these plans, Telefónica has acquiredcould acquire instruments that replicate the risk profile of some of the shares deliverable under the planthese plans as explainedit was done in Note 20.
In addition, the Group may use part of the treasury shares of Telefónica, S.A. held at December 31, 20112014 to cover shares deliverable under the PSPPIP or the PIP.Global Employee Share Plan. The net asset value of the treasury shares could increase or decrease depending on variations in Telefónica, S.A.’s share price.
Liquidity risk
The Telefónica Group seeks to match the schedule for its debt maturity payments to its capacity to generate cash flows to meet these maturities, while allowing for some flexibility. In practice, this has been translated into two key principles:
| 1. | The Telefónica Group’s average maturity of net financial debt is intended to stay above 6 years, or be restored above that threshold in a reasonable period of time if it eventually falls below it. This principle is considered as a guideline when managing debt and access to credit markets, but not a rigid requirement. When calculating the average maturity for the net financial debt and part of the undrawn credit lines can be considered as offsetting the shorter debt maturities, and extension options on some financing facilities may be considered as exercised, for calculation purposes. |
| 2. | The Telefónica Group must be able to pay all commitments over the next 12 months without accessing new borrowing or |
At December 31, 2011,2014, gross financial debt scheduled maturitiesto mature in 20122015 amounted to approximately 10,3338,491 million euros (including(which includes the net position of derivative financial instruments), which isinstruments and certain current payables). These maturities are lower than the amount of funds available, calculated as the sum of: a) cash and cash equivalents and current financial assets other than those in Venezuela (367 million euros) and cash at December 31, 2011 (6,434Telefónica’s participation in Telco’s bond (principal amount of 1,225 million euros excluding derivative financial instruments),euros) totalling 7,869 million euros; b) annual cash generation projected for 2012;2015, and c) undrawn credit facilities arranged with banks whose original maturity is over one year (an aggregate of more than 7,72410,618 million euros at December 31, 2011)2014), providing flexibility to the Telefónica Group with regard to accessing capital or credit markets in the next 12 months. For a further description of the Telefónica Group’s liquidity and capital resources in 2012,2014, see Note 13.2 Financial Liabilities and Appendix III.V.
Country risk
The Telefónica Group managed or mitigated country risk by pursuing two lines of action (in addition to its normal business practices):
| 1. | Partly matching assets to liabilities (those not guaranteed by the parent company) in the Telefónica Group’s Latin American companies such that any potential asset impairment would be accompanied by a reduction in liabilities; and |
| 2. | Repatriating funds generated in Latin America that are not required for the pursuit of new, profitable business development opportunities in the region. |
Regarding the first point, at December 31, 2011,2014, the Telefónica Group’s Latin American companies had net financial debt not guaranteed by the parent company of 6,5645,049 million euros, which represents 11.7%10.7% of consolidated net financial debt. Nevertheless, in certain countries, such as Venezuela, there is a net cash balance (instead of a net liability balance).
Regarding the repatriation of funds to Spain, it received 3,1391,118 million euros from the Group’s Latin America companies have been received in 2011,2014, of which 2,379961 million euros waswere from dividends 402and 157 million euros from intra-group loans (payments of interest and repayments of principal), 112 million euros from financial investments, 28 million euros from capital reductions and 219 million euros fromwere for other items. These amounts were equally offset by additional amounts invested in Mexico (65 million euros). As a result of the foregoing, net funds repatriated to Spain from the Group’s Latin America companies amounted to the equivalent of 3,074 million euros at December 31, 2011.
In this regard, it is worth noting that since February 2003, Venezuela has had an exchange control mechanism in place, managed as indicated above by the Currency Administration Commission (CADIVI)Centro Nacional de Comercio Exterior (CENCOEX). The body has issued a number of regulations (“providencias”) governing the modalities of currency sales in Venezuela at official exchange rates. Foreign companies which are duly registered as foreign investors are entitled to request approval to acquire currencies at the official exchange rate by the CADIVI,CENCOEX, in line with regulation number 029,056, article 2, section c) "Remittance of earnings, profits, income, interest and dividends from international investment."investment” Telefónica Venezolana, C.A. (formerly Telcel, C.A.), a Telefónica Group subsidiary in Venezuela, obtained the aforementioned requested approval on 295 million Venezuelan bolivars in 2006, 473 million Venezuelan bolivars in 2007 and 785 million Venezuelan Bolivars in 2008. At December 31, 2011,2014, payment of two dividends agreed by the company in the amount of 5,882 million Venezuelan bolivars is pending approval by the CADIVI.CENCOEX.
Credit risk
The Telefónica Group trades in derivatives with creditworthy counterparties. Therefore, Telefónica, S.A. generally trades with credit entities withwhose “senior debt” ratings are of at least “A.”“A” or in case of Spanish entities in line with the credit rating of Kingdom of Spain. In Spain, where most of the Group’s derivatives portfolio is held, there are netting agreements with financial institutions, with debtor or creditor positions offset in case of bankruptcy, limiting the risk to the net position. In addition, since Lehman went bankrupt, the credit ratings of rating agencies have proved to be less effective as a credit risk management tool. Therefore, the 5-year CDS (Credit Default Swap) of credit institutions has been added. This way, the CDS of all the counterparties with which Telefónica, S.A. operates is monitored at all times in order to assess the maximum allowable CDS for operating at any given time. Transactions are generally only carried out with counterparties whose CDS is below the threshold.
For other subsidiaries, particularly those in Latin America, assuming a stable sovereign rating provides a ceiling which is below “A,”“A”, trades are with local financial entities whose rating by local standards is considered to be of high creditworthiness.
Meanwhile, with credit risk arising from cash and cash equivalents, the Telefónica Group places its cash surpluses in high quality and highly liquid money-market assets. These placements are regulated by a general framework, revised annually. Counterparties are chosen according to criteria of liquidity, solvency and diversification based on the conditions of the market and countries where the Group operates. The general framework sets: (i) the maximum amounts to be invested by counterparty based on its rating (long-term debt rating); (ii) the maximum tenor of the investment, set at 180 days; and (iii) the instruments in which the surpluses may be invested (money-market instruments).
The Telefónica Group considers managing commercial credit risk management as cruciala key element to meetingachieve its sustainable business and customer base growth targets in a manner that is consistent with its risk-management policy.
Telefónica Corporate Risk Management Policy. This is basedmanagement approach relies on continuousthe active monitoring of the risk assumed and the resources necessary to optimizegrant the adequate risk-reward ratiobalance in its operations. Particular attention is given tothe operations and the separation between the risk ownership areas and risk management areas.
Customer-financing products and those clientsdebtors that could cause a material impact on the Group'sGroup’s consolidated financial statements for which, depending on the segment and type of relation, hedging instruments or collateral may be requiredare subject to specific management practices to mitigate exposure to credit risk.risk, according to the segment and risk profile of the customer.
The Telefónica Group’s maximum exposure to credit risk is initially represented by the carrying amounts of the financial assets (Notes 10, 11 and 13) and the guarantees given by the Telefónica Group.
Several Telefónica Group companies provide operating guarantees granted by external counterparties, which are offered during their normal commercial activity, in bids for licenses, permits and concessions, and spectrum acquisitions. At December 31, 2011,2014, these guarantees amounted to approximately 2,5454,401 million euros (see Note 21.e).euros.
Capital management
Telefónica’s corporate finance department, which is in charge of Telefónica’s capital management, takes into consideration several factors when determiningfor the evaluation of the Telefónica’s capital structure, with the aim of ensuring sustainability ofmaintaining the businesssolvency and maximizing thecreating value to the shareholders.
These general principles are refined by other considerations and the application of specific variables, such as country risk in the broadest sense, or the volatility in cash flow generation that are considered, when determiningevaluating the Telefónica Group’s financial structure.structure and its different areas.
Derivatives policy
At December 31, 2011,2014, the nominal value of outstanding derivatives with external counterparties amounted to 178,641193,152 million equivalent, a 17% increase from December 31, 2013 (164,487 million euros equivalent, a 27% increase from 140,272 million euros equivalent at December 31, 2010.equivalent). This figure is inflated by the use in some cases of several levels of derivatives applied to the nominal value of a single underlying liability. For example, a foreign currency loan can be hedged into floating rate, and then each interest rate period can be fixed using a fixed rate hedge, or FRA (forward rate agreement). Even using such techniques to reduce the position, it is still necessary to take extreme care in the use of derivatives to avoid potential problems arising through error or a failure to understand the real position and its associated risks.
1) Derivatives based on a clearly identified underlying.
Telefónica’s derivatives policy emphasizes the following points:
Acceptable underlyings include assets and liabilities, profits, revenues and cash flows in either a company’s functional currency or another currency. These flows can be contractual (debt and interest payments, settlement of foreign currency payables, etc.), reasonably certain or foreseeable (property, plant, and equipment(PP&E purchases, future debt issues, commercial paper programs, etc.). The acceptability of an underlying asset in the above cases does not depend on whether it complies with accounting rules requirements for hedge accounting, as is required in the case of certain intragroup transactions, for instance. Parent company investments in subsidiaries with functional currencies other than the euro also qualify as acceptable underlying assets.
Economic hedges, which are hedges with a designated underlying asset and which in certain circumstances offset fluctuations in the underlying asset value, do not always meet the requirements and effectiveness tests laid down by accounting standards for treatment as hedges. The decision to maintain positions that cease to qualify as effective or fail to meet other requirements will depend on the marginal impact on the income statement and how far this might compromise the goal of a stable income statement. In any event, the variations are recognized in the income statement.
| 2) Matching of the underlying to one side of the derivative. |
This matching basically applies to foreign currency debt and derivatives hedging foreign currency payments by Telefónica Group subsidiaries. The aim is to eliminate the risk arising from changes in foreign currency interest rates. Nonetheless, even when the aim is to achieve perfect hedging for all cash flows, the lack of liquidity in certain markets, especially in Latin American currencies, has meant that historically there have been mismatches between the terms of the hedges and those of the debts they are meant to hedge. The Telefónica Group intends to reduce these mismatches, provided that doing so does not involve disproportionate costs. In this regard, if adjustment does prove too costly, the financial timing of the underlying asset in foreign currency will be modified in order to minimize interest rate risk in foreign currency.
In certain cases, the timing of the underlying as defined for derivative purposes may not be exactly the same as the timing of the contractual underlying.
3) Matching the company contracting the derivative and the company that owns the underlying. |
Generally, the aim is to ensure that the hedging derivative and the hedged asset or liability belong to the same company. Sometimes, however, the holding companies (Telefónica, S.A. and Telefónica Internacional, S.A.) have arranged hedges on behalf of a subsidiary that owns the underlying asset. The main reasons for separating the hedge and the underlying asset were possible differences in the legal validity of local and international hedges (as a result of unforeseen legal changes) and the different credit ratings of the counterparties (of the Telefónica Group companies as well as those of the banks).
| 4) Ability to measure the derivative’s fair value using the valuation systems available to the Telefónica Group. |
| The Telefónica Group uses a number of tools to measure and manage risks in derivatives and debt. The main ones are Kondor+, licensed by Reuters, which is widely used by financial institutions, and MBRM specialist financial calculator libraries. |
| 5) Sale of options only when there is an underlying exposure. |
Telefónica considers the sale of options when: i) there is an underlying exposure (on the consolidated statement of financial position or associated with a highly probable cash outflow) that would offset the potential loss for the year if the counterparty exercised the option, or ii) the option is part of a structure in which another derivative offsets any loss. The sale of options is also permitted in option structures where, at the moment they are taken out, the net premium is either positive or zero.
For instance, it would be possible to sell short-term options on interest rate swaps that entitle the counterparty to receive a certain fixed interest rate, below the level prevailing at the time the option was sold. This would mean that if rates fell and the counterparty exercised its option, the Group would swap part of its debt from floating rate to a lower fixed rate, having received a premium.
The main risks that may qualify for hedge accounting are as follows:
| · | Variations in market interest rates (either money-market rates, credit spreads or both) that affect the value of the underlying asset or the measurement of the cash |
| · | Variations in exchange rates that change the value of the underlying asset in the company’s functional currency and affect the measurement of the cash flow in the functional |
| · | Variations in the volatility of any financial variable, asset or liability that affect either the valuation or the measurement of cash flows on debt or investments with embedded options, whether or not these options are |
| · | Variations in the valuation of any financial asset, particularly shares of companies included in the portfolio of “Available-for-sale financial assets”. |
Regarding the underlying:
| · | Hedges can cover all or part of the value of the |
| · | The risk to be hedged can be for the whole period of the transaction or for only part of the |
| · | The underlying may be a highly probable future transaction, or a contractual underlying (loan, foreign currency payment, investment, financial asset, etc.) or a combination of both that defines an underlying with a longer term. |
This may on occasion mean that the hedging instruments have longer terms than the related contractual underlying. This happens when the Group enters into long-term swaps, caps or collars to protect ourselves against interest rate rises that may raise the financial expense of its promissory notes, commercial paper and some floating rate loans which mature earlier than their hedges. These floating rate financing programs are highly likely to be renewed and Telefónica commits
to this by defining the underlying asset in a more general way as a floating rate financing program whose term coincides with the maturity of the hedge.
Hedges can be of three types:
| · | Fair value hedges. |
| · | Cash flow hedges. Such hedges can be set at any value of the risk to be hedged (interest rates, exchange rates, etc.) or for a defined range (interest rates between 2% and 4%, above 4%, etc.). In this last case, the hedging instrument used is options and only the intrinsic value of the option is recognized as an effective hedge. |
| · | Hedges of net investment in consolidated foreign subsidiaries. Generally such hedges are arranged by the parent company and the other Telefónica holding companies. Wherever possible, these hedges are implemented through real debt in foreign currency. Often, however, this is not always possible as many Latin American currencies are non-convertible, making it impossible for non-resident companies to issue local currency investment. |
Hedges can comprise a combination of different derivatives.
Management of accounting hedges is not static, and the hedging relationship may change before maturity. Hedging relationships may change to allow appropriate management that serves the Group’s stated principles of stabilizing cash flows, stabilizing net financial income/expense and protecting share capital. The designation of hedges may therefore be cancelled, before maturity, because of a change in the underlying, a change in perceived risk on the underlying or a change in market view.view. Derivatives included in these hedges may be reassigned to new hedges where they meet the effectiveness test and the new hedge is well documented.documented. To gauge the efficiency of transactions defined as accounting hedges, the Group analyzes the extent to which the changes in the fair value or in the cash flows attributable to the hedged item would offset the changes in fair value or cash flows attributable to the hedged risk using a linear regression model. both prospectively and retrospectively.
The main guiding principles for risk management are establishedlaid down by Telefónica’s Finance Department and implemented by company financial officers (who are responsible for balancing the interests of each company and those of the Telefónica Group). The Corporate Finance Department may allow exceptions to this policy where these can be justified, normally when the market is too thin for the volume of transactions required or on clearly limited and small risks.risks. New companies joining the Telefónica Group as a result of mergers or acquisitions may also need time to adapt.
The breakdown of the financial results recognized in 2011, 20102014, 2013 and 20092012 is as follows:
| (Millions of euros) | 2011 | 2010 | 2009 | ||||||||||||
| Millions of euros | 2014 | 2013 | 2012 | ||||||||||||
| Interest income | 586 | 454 | 528 | 553 | 613 | 557 | |||||||||
| Dividends received | 42 | 40 | 45 | 5 | 11 | 28 | |||||||||
| Other financial income | 181 | 266 | 151 | 228 | 203 | 276 | |||||||||
| Subtotal | 786 | 827 | 861 | ||||||||||||
| Changes in fair value of financial assets at fair value through profit or loss | 1,004 | (427) | 648 | ||||||||||||
| Changes in fair value of financial liabilities at fair value through profit or loss | (1,059) | 388 | (550) | ||||||||||||
| Transfer from equity to profit and loss from cash flow hedges | (163) | (121) | (173) | ||||||||||||
| Transfer from equity to profit and loss from available-for-sale assets and others | − | (52) | (50) | ||||||||||||
| Gain/(loss) on fair value hedges | 865 | (935) | 198 | ||||||||||||
| (Loss)/gain on adjustment to items hedged by fair value hedges | (796) | 961 | (145) | ||||||||||||
| Subtotal | (149) | (186) | (72) | ||||||||||||
| Interest expenses | (2,671 | ) | (2,514 | ) | (3,036 | ) | (2,556) | (2,898) | (3,094) | ||||||
| Ineffective portion of cash flow hedges | 1 | (16 | ) | (17 | ) | − | 1 | ||||||||
| Accretion of provisions and other liabilities | (106 | ) | (145 | ) | (254 | ) | (400) | (201) | (469) | ||||||
| Changes in fair value of financial assets at fair value through profit or loss | 573 | 25 | 124 | ||||||||||||
| Changes in fair value of financial liabilities at fair value through profit or loss | (808 | ) | (39 | ) | (132 | ) | |||||||||
| Transfer from equity to profit and loss from cash flow hedges | (210 | ) | (73 | ) | 77 | ||||||||||
| Transfer from equity to profit and loss from available-for-sale assets | (3 | ) | (202 | ) | 4 | ||||||||||
| Gain/(loss) on fair value hedges | 908 | 168 | (427 | ) | |||||||||||
| (Loss)/gain on adjustment to items hedged by fair value hedges | (747 | ) | (211 | ) | 439 | ||||||||||
| Other expenses | (528 | ) | (290 | ) | (269 | ) | |||||||||
| Net finance costs excluding foreign exchange differences | (2,782 | ) | (2,537 | ) | (2,767 | ) | |||||||||
| Other financial expenses | (200) | (238) | (289) | ||||||||||||
| Subtotal | (3,156) | (3,337) | (3,851) | ||||||||||||
| Net finance costs excluding foreign exchange differences and hyperinflationary adjustments | (2,519) | (2,696) | (3,062) | ||||||||||||
The breakdown of Telefónica’s derivatives at December 31, 2011,2014, their fair value at year-end and the expected maturity schedule is as set forth in the table below:
| 2014 | ||||||
| Millions of euros | Fair value (**) | Notional amount Maturities (*) | ||||
| Derivatives | 2015 | 2016 | 2017 | Subsequent years | Total | |
| Interest rate hedges | (482) | (1,384) | 1,877 | 292 | (3,502) | (2,717) |
| Cash flow hedges | 648 | (1,050) | 706 | 460 | 3,265 | 3,381 |
| Fair value hedges | (1,130) | (334) | 1,171 | (168) | (6,767) | (6,098) |
| Exchange rate hedges | (966) | 7,784 | 3,141 | 913 | 3,799 | 15,637 |
| Cash flow hedges | (964) | 7,992 | 3,141 | 913 | 3,799 | 15,845 |
| Fair value hedges | (2) | (208) | (208) | |||
| Interest and exchange rate hedges | (890) | (538) | 422 | 64 | 1,495 | 1,443 |
| Cash flow hedges | (592) | (373) | 465 | 167 | 2,675 | 2,934 |
| Fair value hedges | (298) | (165) | (43) | (103) | (1,180) | (1,491) |
| Net investment hedges | (121) | (1,436) | (750) | (60) | (2,246) | |
| Other derivatives | (221) | 7,957 | 51 | (1,183) | (1,437) | 5,388 |
| Interest rate | 34 | 7,893 | 452 | (325) | (1,557) | 6,463 |
| Exchange rate | (145) | 91 | (401) | (108) | 120 | (298) |
| Others | (110) | (27) | (750) | (777) | ||
| (*) For interest rate hedges, the positive amount is in terms of fixed “payment.” For foreign currency hedges, a positive amount means payment in functional vs. foreign currency. | ||||||
| (**) Positive amounts indicate payables. | ||||||
| (***)The fair value of the Telefónica Group derivatives amounted to a positive MTM (accounts receivable) of 2,680 million euros. | ||||||
The breakdown of Telefónica’s derivatives at December 31, 2013, their fair value at year-end and the expected maturity schedule are as set forth in the table below:
| Millions of euros | Fair value: at 12/31/11 (**) | Maturity (notional amount) (*) | ||||
| Derivatives | 2012 | 2013 | 2014 | Subsequent years | Total | |
| Interest rate hedges | (81) | (1,785) | 668 | (825) | 8,217 | 6,275 |
| Cash flow hedges | 866 | (1,118) | 1,086 | (350) | 11,380 | 10,998 |
| Fair value hedges | (947) | (667) | (418) | (475) | (3,163) | (4,723) |
| Exchange rate hedges | (962) | 328 | 339 | 77 | 6,702 | 7,446 |
| Cash flow hedges | (932) | 340 | 230 | 1 | 6,519 | 7,090 |
| Fair value hedges | (30) | (12) | 109 | 76 | 183 | 356 |
| Interest and exchange rate hedges | (618) | (76) | 1,110 | (45) | 2,547 | 3,536 |
| Cash flow hedges | (597) | (31) | 1,158 | 66 | 2,098 | 3,291 |
| Fair value hedges | (21) | (45) | (48) | (111) | 449 | 245 |
| Hedge of net investment in foreign operations | (81) | (1,427) | (160) | (280) | (1,313) | (3,180) |
| Derivatives not designated as hedges | (488) | 9,375 | (480) | (144) | (1,516) | 7,235 |
| Interest rate | (230) | 8,038 | (579) | (144) | (2,404) | 4,911 |
| Exchange rate | (255) | 1,338 | 99 | - | 888 | 2,325 |
| Interest and exchange rate | (3) | (1) | - | - | - | (1) |
| Millions of euros | Fair value: at 12/31/10 (**) | Maturity (notional amount) (*) | ||||
| Derivatives | 2011 | 2012 | 2013 | Subsequent years | Total | |
| Interest rate hedges | (355) | (5,850) | 60 | (2,083) | 7,202 | (671) |
| Cash flow hedges | 266 | (3,504) | 556 | (438) | 8,487 | 5,101 |
| Fair value hedges | (621) | (2,346) | (496) | (1,645) | (1,285) | (5,772) |
| Exchange rate hedges | (405) | 1,329 | 113 | 579 | 4,323 | 6,344 |
| Cash flow hedges | (404) | 1,206 | 113 | 579 | 4,323 | 6,221 |
| Fair value hedges | (1) | 123 | - | - | - | 123 |
| Interest and exchange rate hedges | (31) | 253 | 272 | 1,162 | 2,595 | 4,282 |
| Cash flow hedges | (87) | 191 | 246 | 1,148 | 2,252 | 3,837 |
| Fair value hedges | 56 | 62 | 26 | 14 | 343 | 445 |
| Hedge of net investment in foreign operations | (234) | (2,221) | (118) | (160) | (1,030) | (3,529) |
| Derivatives not designated as hedges | (411) | 4,839 | 318 | (289) | (428) | 4,440 |
| Interest rate | (245) | 4,231 | 426 | (427) | (1,316) | 2,914 |
| Exchange rate | (168) | 528 | (107) | 138 | 888 | 1,447 |
| Interest and exchange rate | 2 | 80 | (1) | - | - | 79 |
| 2013 | ||||||
| Millions of euros | Fair value (**) | Notional amount Maturities (*) | ||||
| Derivatives | 2014 | 2015 | 2016 | Subsequent years | Total | |
| Interest rate hedges | 456 | (4,266) | 1,934 | 845 | (2,079) | (3,566) |
| Cash flow hedges | 758 | (3,462) | 2,099 | (96) | 8,143 | 6,684 |
| Fair value hedges | (302) | (804) | (165) | 941 | (10,222) | (10,250) |
| Exchange rate hedges | 355 | (467) | 1,551 | 3,128 | 4,709 | 8,921 |
| Cash flow hedges | 357 | (330) | 1,551 | 3,128 | 4,709 | 9,058 |
| Fair value hedges | (2) | (137) | (137) | |||
| Interest and exchange rate hedges | (233) | (468) | (321) | 465 | 1,923 | 1,599 |
| Cash flow hedges | (58) | (383) | (200) | 566 | 2,779 | 2,762 |
| Fair value hedges | (175) | (85) | (121) | (101) | (856) | (1,163) |
| Net investment hedges | (277) | (1,992) | (162) | (1,151) | (60) | (3,365) |
| Other derivatives | (434) | 1,918 | (63) | (710) | (1,928) | (783) |
| Interest rate | (359) | 2,353 | (141) | (710) | (1,941) | (439) |
| Exchange rate | (75) | (435) | 78 | 13 | (344) | |
| Others | − | |||||
| (*) For interest rate hedges, the positive amount is in terms of fixed “payment.” For foreign currency hedges, a positive amount means payment in functional vs. foreign currency. | ||||||
| (**) Positive amounts indicate payables. | ||||||
A list of derivative products entered into at December 31, 2011 and 20102014 is provided in Appendix III.IV.
Note 17. Income tax matters
Consolidated tax group in Spain
Pursuant to a Ministerial Order dated December 27, 1989, since 1990 Telefónica, S.A. has filedfiles consolidated tax returns in Spain for certain Group companies. The consolidated tax group comprised 4849 and 51 companies in 2011 (462014 and 2013, respectively.
Amendment to the Spanish Corporate Income Tax Law
Spanish Law 27/2014 of 27 November on Corporate Income Tax stipulates a reduction of the current tax rate for financial year ending in 2010)2014 (30%). It has been set at 28% for financial year ending in 2015, and at 25% for financial year ending in 2016 and following years.
In addition, although a limit is established to offset tax loss carryforwards at 60% for 2016 and at 70% for 2017 and subsequent years, the time limit to offset them, which was 18 years, is removed.
These 2014 consolidated financial statements include the effect of the lower rate on the deferred tax assets and liabilities of companies forming part of the tax group in Spain. The net effect is an income tax expense amounting to 50 million euros.
Deferred taxes
The movements in deferred taxes in 2011the Telefónica Group in 2014 and 20102013 are as follows:
| Millions of euros | ||||
| Deferred tax assets | Deferred tax liabilities | |||
| Balance at December 31, 2010 | 5,693 | 6,074 | ||
| Millions of euros | Deferred tax assets | Deferred tax liabilities | ||
| Balance at December 31, 2013 | 6,376 | 3,063 | ||
| Additions | 2,162 | 779 | 1,763 | 408 |
| Disposals | (1,326) | (1,688) | (1,152) | (1,009) |
| Transfers | 48 | (145) | (132) | 58 |
| Translation differences and hyperinflation adjustments | (163) | (302) | 3 | 22 |
| Company movements and others | 3 | 21 | 9 | 24 |
| Balance at December 31, 2011 | 6,417 | 4,739 | ||
| Balance at December 31, 2014 | 6,867 | 2,566 | ||
| Millions of euros | Deferred tax assets | Deferred tax liabilities |
| Balance at December 31, 2012 | 7,308 | 4,788 |
| Additions | 1,662 | 614 |
| Disposals | (1,007) | (691) |
| Transfers | (1,442) | (1,516) |
| Translation differences and hyperinflation adjustments | (156) | (149) |
| Company movements and others | 11 | 17 |
| Balance at December 31, 2013 | 6,376 | 3,063 |
“Additions” of deferred tax assets in 2014 includes the impact of the Law 12,973/14, resulting from the conversion of Interim Measure 627/13, published in Brazil on May 13, 2014. As a result of the entry into force of this new law, the tax effects were revisited for certain assets arising from the business combination of Telesp and Vivo Participaçoes and, therefore, the Telefónica Group revised the deferred tax assets associated with such assets. The impact on “Corporate income tax” in the consolidated income statement for 2014 is a reduction in the expense of 394 million euros.
“Additions” in 2014 includes among others, the tax effect of the 70% limitation on assets depreciation in Spain of 118 million euros in 2014 and 128 million euros in 2013, the adjustment of the value of the investment of Telefónica, S.A in Telco, S.p.A. of 108 million euros (108 million euros in 2013), and 189 million euros due to the impact of the application of the rate resulting in the allocations
| Millions of euros | ||||||||
| Deferred tax assets | Deferred tax liabilities | |||||||
| Balance at December 31, 2009 | 5,971 | 3,082 | ||||||
| Additions | 1,221 | 586 | ||||||
| Disposals | (2,270 | ) | (421 | ) | ||||
| Transfers | (16 | ) | 365 | |||||
| Translation differences and hyperinflation adjustments | 207 | 312 | ||||||
| Company movements and others | 580 | 2,150 | ||||||
| Balance at December 31, 2010 | 5,693 | 6,074 | ||||||
Also, Colombia Telecom, which generated in 2014 taxable profit, recognized tax credits for loss carryforwards and temporary differences, chiefly from the finance lease agreement with PARAPAT (see Note 22) in the amount of 1,032 million Colombian pesos (roughly 390 million euros, of which 126 million euros correspond to tax credits for loss carryforwards and 264 million euros correspond to temporary differences).
In 2014 the Group recorded 64 million euros of tax credits for tax deductions, mainly for R+D in Spain (146 million euros in 2013).
“Additions” of deferred tax assets in 2011 include2013 mainly included the taxpositive impact of the labor force reduction planrecognition of tax credits for Telefónicatax losses carryforwards at several Group companies in Spain, (see Note 15).Germany and Brazil of 547 million euros. In 2014 the recognition of tax credits for tax losses carryforwards from prior years amounted to 255 million euros, which includes 126 million euros recognized in Colombia Telecom commented before.
“Disposals” of deferred tax assets include the impact of the Group’s labor force reduction plans, carried outamounting to 207 million euros in 2014 and which were recorded186 million euros in previous years.2013.
The movements in Octoberdeferred tax assets, recognized directly in theequity in 2014 amount of 1,288to 95 million euros (see Note 2)of “additions” and 26 million euros of “disposals” (38 million euros of “additions” and 225 million euros of “disposals” in 2013). The movements in deferred tax liabilities, recognized directly in equity in 2014 amount to 32 million euros of “additions” and 73 million euros of “disposals” (7 million euros of “additions” and 1 million euros of “disposals” in 2013).
Expected realization of deferred tax assets and liabilities
In the majority of cases, realization of the Group’s deferred tax assets and liabilities depends on the future activities carried out by the different companies, on tax regulations in the different countries in which these companies operate, and on the strategic decisions affecting the companies. In this regard, the expected realization is based on a series of assumptions that may be altered as the corresponding situations continue to develop. Under the assumptions made, the estimated realization of deferred tax assets and liabilities recognized in the consolidated statement of financial position at December 31, 20112014 is as follows:
| 12/31/11 | Total | Less than 1 year | More than 1 year | |||
| 12/31/2014 | Total | Less than 1 year | More than 1 year | |||
| Deferred tax assets | 6,417 | 1,094 | 5,323 | 6,867 | 1,239 | 5,628 |
| Deferred tax liabilities | 4,739 | 777 | 3,962 | 2,566 | 269 | 2,297 |
Deferred tax assets
Deferred tax assets in the accompanying consolidated statementstatements of financial position include the tax loss carryforwards, unused tax credits recognized (deductions) and deductible temporary differences recognized at the end of the reporting period.
Tax credits for loss carryforwards
The availabletax group in Spain had unused tax loss carryforwards at December 31, 2014 amounting to 9,940 million euros. The estimated schedule is the following:
| Total | Less than 1 year | More than 1 year | |
| Tax loss carryforwards | 9,940 | - | 9,940 |
In 2012, subsequent to the inspection by the tax authorities, the tax group in Spain reevaluated its tax credits based on the business plans of the companies in the tax group and the best estimate of taxable income, over a period of time that is in line with the state of the various markets in which they operate. As a result, a reduction of 458 million euros in “Corporate income tax" was recognized in 2012. In 2013, the tax credits of the tax group in Spain were reevaluated using the same criteria as in the prior year, resulting in a reduction in “Corporate income tax" of 190 million euros.
Total tax loss carryforwards in Spain at December 31, 2011 atin the main Group companies amounted to 4,933 million euros (4,575 million euros for companies belonging to the tax group).
Recognized tax credits in the consolidated statement of financial position atarising from the Latin American subsidiaries at December 31, 20112014 amounted to 323280 million euros. Total unrecognized tax credits for tax loss carryforwards in Latin America amount to 422 million euros.
Deductions
The Grouptax group has recognized an amount of 191246 million euros of unused tax credits, generated primarily from export activity,deductions in the consolidated statement of financial position at December 31, 2011.2014, generated primarily from export activity, double taxation and donations to non-profit organizations.
Temporary differences
| Millions of euros | ||||||||||||||||||
| 2011 | 2010 | |||||||||||||||||
| Deferred tax | Deferred tax | Deferred tax | Deferred tax | |||||||||||||||
| assets | liabilities | assets | liabilities | |||||||||||||||
| Millions of euros | 12/31/2014 | 12/31/2013 | ||||||||||||||||
| Goodwill and intangible assets | 792 | 1,239 | ||||||||||||||||
| Property, plant and equipment | 283 | 753 | 273 | 467 | 793 | 651 | ||||||||||||
| Intangible assets | 268 | 2,211 | 265 | 4,522 | ||||||||||||||
| Personnel commitments | 1,546 | - | 956 | - | 969 | 1,238 | ||||||||||||
| Provisions | 1,267 | 158 | 1,172 | 81 | 1,381 | 1,017 | ||||||||||||
| Investments in subsidiaries, associates and joint ventures | 614 | 975 | 443 | 532 | ||||||||||||||
| Investments in subsidiaries, associates and other shareholdings | 867 | 869 | ||||||||||||||||
| Inventories and receivables | 436 | 203 | ||||||||||||||||
| Other | 757 | 642 | 873 | 472 | 1,746 | 1,035 | ||||||||||||
| Total | 4,735 | 4,739 | 3,982 | 6,074 | ||||||||||||||
| Total deferred tax assets for temporary differences | 6,984 | 6,252 | ||||||||||||||||
| Millions of euros | 12/31/2014 | 12/31/2013 |
| Goodwill and intangible assets | 1,550 | 1,659 |
| Property, plant and equipment | 1,395 | 1,304 |
| Personnel commitments | 25 | − |
| Provisions | 28 | 15 |
| Investments in subsidiaries, associates and other shareholdings | 1,366 | 1,653 |
| Inventories and receivables | 89 | 26 |
| Other | 771 | 282 |
| Total deferred tax liabilities for temporary differences | 5,224 | 4,939 |
Deferred tax assets and liabilities are offset if a legally enforceable right exists to set off current tax assets against current tax liabilities and the deferred taxes relate to the same taxable entity and the same taxation authority. At December 31, 2014, deferred tax assets and liabilities amounting to 2,658 million euros were offset, affected by the inclusion of E-Plus in the scope of consolidation (1,876 million euros at December 31, 2013).
The heading "Other” includes, among others, the difference between the accounting and tax values created by the value of financial derivatives at year end (see Note 16) and deferred tax assets in relation with the finance lease of handsets.
Tax payables and receivables
Current tax payables and receivables at December 31, 20112014 and 20102013 are as follows:
| Millions of euros | ||||||||||
| Balance at | Balance at | |||||||||
| 12/31/11 | 12/31/10 | |||||||||
| Taxes payable: | ||||||||||
| Millions of euros | Balance at 12/31/2014 | Balance at 12/31/2013 | ||||||||
| Taxes payable | ||||||||||
| Tax withholdings | 163 | 124 | 126 | 103 | ||||||
| Indirect taxes | 1,018 | 1,164 | 1,012 | 896 | ||||||
| Social security | 187 | 228 | 168 | 152 | ||||||
| Current income taxes payable | 611 | 695 | 335 | 575 | ||||||
| Other | 589 | 611 | 385 | 477 | ||||||
| Total | 2,568 | 2,822 | 2,026 | 2,203 | ||||||
| Millions of euros | ||||||||
| Balance at | Balance at | |||||||
| 12/31/11 | 12/31/10 | |||||||
| Tax receivables: | ||||||||
| Indirect tax | 772 | 775 | ||||||
| Current income taxes receivable | 569 | 338 | ||||||
| Other | 226 | 218 | ||||||
| Total | 1,567 | 1,331 | ||||||
F-78
| Millions of euros | Balance at 12/31/2014 | Balance at 12/31/2013 |
| Tax receivables | ||
| Indirect tax | 595 | 620 |
| Current income taxes receivable | 953 | 870 |
| Other | 201 | 174 |
| Total | 1,749 | 1,664 |
Reconciliation of book profit before taxes to taxable income
The reconciliation between accountingbook profit before tax and the income tax expense for 2011, 20102014, 2013 and 20092012 is as follows:
| Millions of euros | ||||||||||||
| 2011 | 2010 | 2009 | ||||||||||
| Accounting profit before tax | 6,488 | 13,901 | 10,387 | |||||||||
| Tax expense at prevailing statutory rate (30%) | 1,946 | 4,170 | 3,116 | |||||||||
| Effect of statutory rate in other countries | (19 | ) | (52 | ) | (20 | ) | ||||||
| Variation in tax expense from new taxes | 11 | 10 | (15 | ) | ||||||||
| Permanent differences | (22 | ) | (69 | ) | (402 | ) | ||||||
| Changes in deferred tax charge due to changes in tax rate | (26 | ) | (21 | ) | - | |||||||
| Capitalization of tax deduction and tax relief | (97 | ) | (112 | ) | (143 | ) | ||||||
| Use of loss carryforwards | (200 | ) | (134 | ) | (5 | ) | ||||||
| Increase / (Decrease) in tax expense arising from temporary differences | (1,344 | ) | (42 | ) | (82 | ) | ||||||
| Other | 52 | 79 | 1 | |||||||||
| Income tax expense | 301 | 3,829 | 2,450 | |||||||||
| Breakdown of current/deferred tax expense | ||||||||||||
| Current tax expense | 1,557 | 2,455 | 3,848 | |||||||||
| Deferred tax benefit | (1,256 | ) | 1,374 | (1,398 | ) | |||||||
| Total income tax expense | 301 | 3,829 | 2,450 | |||||||||
| Millions of euros | 2014 | 2013 | 2012 |
| Accounting profit before tax | 3,635 | 6,280 | 5,864 |
| Tax expense at prevailing statutory rate | 1,046 | 1,935 | 1,903 |
| Permanent differences | 317 | (124) | 307 |
| Changes in deferred tax charge due to changes in tax rates | 89 | (21) | (27) |
| Capitalization of tax deduction and tax relief | (74) | (146) | (81) |
| Use/ Capitalization of loss carryforwards | (255) | (547) | (404) |
| Increase / (Decrease) in tax expense arising from temporary differences | (792) | 95 | (297) |
| Other | 52 | 119 | 60 |
| Income tax expense | 383 | 1,311 | 1,461 |
| Breakdown of current/deferred tax expense | |||
| Current tax expense | 1,480 | 2,221 | 1,726 |
| Deferred tax benefit | (1,097) | (910) | (265) |
| Total income tax expense | 383 | 1,311 | 1,461 |
Tax inspections and tax-related lawsuits
| a) | Tax inspections |
In April 2007, Telefónica filed an administrative appeal beforeDecember 2012 the National Court of Justice requestingissued a ruling on the annulment oftax inspection for the settlement as well asyears 2001 to 2004, accepting the inclusion of other concepts in its favor not contemplated in the inspection. In the process, it was requested that the execution of the settlements and penalties appealed be suspended by providing the appropriate guarantees. On February 22, 2010, Telefónica received the notification of the rulingtax losses incurred by the National Court of Justice dated February 4, 2010,Group in which it partially accepted the Company’s allegations, annulling the imposition of sanctions. On May 18, 2010, the National Court of Justice accepted Telefónica, S.A.'s appeal and ruled on April 5, 2010 to refer the caserelation to the Supreme Court.transfer of certain interests in TeleSudeste, Telefónica Móviles México and Lycos as tax deductible and rejecting the other allegations. On June 4, 2010,December 28, 2012, the tax authoritiesCompany filed an appeal before the Supreme Court against one of the rulings of the National Court of Justice partially accepting Telefónica’s allegations. In January 2011, Telefónica submitted a brief of opposition against that appeal beforewith the Supreme Court.
| b) | Tax deductibility of financial goodwill (Article 12.5) |
Spain added a new Article 12.5 to its Corporate Income Tax Law, which came into force on January 1, 2002. The article regulated the deductibility of tax amortization of financial goodwill arising from the acquisition of non-Spanish companies, which could be amortized over 20 years at 5% per annum.
The Telefónica Group has been amortizing for tax purposes financial goodwill from its investments in O2, Cesky Telecom, BellSouth and Coltel (all predating December 21, 2007) with a cumulative positive impact on consolidated income tax expense from 2004 to 2014 of 795 million euros.
On December 20, 2007 the European Commission challenged the Spanish law, on the grounds that this tax benefit constituted State aid. On October 28, 2009 the Commission issued a First Decision ruling that Article 12.5 constituted State aid, although it upheld the legitimacy of operations carried out prior to publication of the commencement of the investigation procedure in the EU's Official Journal.
On January 12, 2011 the Commission issued a Second Decision ruling that, in the case of acquisitions in non-European Union countries up to May 21, 2011, the system established in the original version of Article 12.5 could still be applied, provided certain conditions were fulfilled.
After the proceedings initiated on July 17, 2013, on October 15, 2014 the Commission declared that the Binding Consultation in connection with financial goodwill on indirect acquisitions also constituted State aid and cast doubt on the applicability of the principle of legitimate expectations acknowledged in the two previous Decisions, now disallowing it for indirect acquisitions.
On November 7, 2014 the European Union General Court issued two rulings overturning the First and Second European Union Decisions, as it has considered that the system permitting amortization of goodwill in Spain did not constitute State aid because it had not been proven that the action taken by the Spanish authorities was selective. The European Commission submitted an appeal against both rulings to the EU's Court of Justice.
Telefónica Brasil
Telefónica Brasil has a number of appeals underwayongoing regarding the ICMS –similar(a tax similar to VAT-VAT, levied on telecommunications services.services). There is a dispute with the Brazilian tax authorities over which services should be subject to settlement of this tax. In 2014 the tax authorities embarked upon a new round of inspections in this regard.
To date the most cases,significant issues have focused on the authorities require the collection ofrequirement to collect the ICMS on penalties charged to customers for non-compliance, Internet advertising services, and complementary or auxiliaryadditional services to basethe basic telecommunications service. To date, all theservices such as value-added services and modem rental.
All related procedures are being contested in all instances (administrative and judicial)court proceedings). The aggregate amount of these assessments, updated to take into account interests,interest, fines and other items, is approximately 1,0779,700 million euros.Brazilian reais (3,010 million euros). No provisions have been set aside for these matters, as the risk of them giving rise to liabilities is not probable. Telefónica Brasil has obtained independent expert reports supporting its position, i.e. that the aforesaid services are not subject to the ICMS.
Regarding the Group’s main tax litigation in Peru, on March 20, 2013, notification was notifiedreceived of a first instance court decision upholding Telefónica Peru’s arguments in three of the decisionfive objections filed by the authorities and appealed against in higher courts regarding corporate income tax in 2000/2001, which accounted for more than 75% of the total litigation amount (the objections related respectively to the provision for insolvency, interest on borrowing and leases of space for public telephones). The company also obtained a precautionary measure in this regard amounting to 1,413 million Peruvian soles (391 million euros). Court proceedings are also ongoing concerning the possible offsetting of recoverable balances in 1998 and 1999, and the interest and penalties to be applied. Both the tax court concludingauthorities and the administrative instancecompany have appealed against the decision in the matter regardingcourt of second instance.
In parallel to the aforementioned court proceedings, the tax authorities proceeded to collect tax dues relating to the corporate income tax for 2000the years 2000-2001 and 2001 and the respective payments on account noted by the tax authorities in 2005, confirming the reservations of the National Tax Administration (SUNAT) regarding (i) financial charges, (ii) provisionscorporate income tax in respect of the year 2000, considering the recoverable balances for doubtful collectibles, (iii) lease expenses (TPI), (iv) non-divestment reorganization1998 and (v) overhead.1999. There were successive reductions to the sums
claimed in the two cases following appeals submitted various appeals at the judicial level, petitioning the courts to overturn the decision, considering that it was based on insufficient legal grounds.by Telefónica del Perú has paid 38 million euros, in compliance with a collection enforcement rule established in order to havePeru against the settlements and the precautionary measure commented above, up until the company payfinally paid out 286 million Peruvian soles (80 million euros) in 2012 and 2013 pending the related rulings, whereby the estimated claim amount untilwould be 1,581 million Peruvian soles (437 million euros) if the outcome was unfavorable. No further action was taken in connection with these administrative procedures in 2014, and therefore they are still pending with the Tax Court (administrative phase). An appeal may be submitted against an adverse outcome, and an application may be made for a definitive resolution of the matter is reached.suspension injunction.
Years open for inspection
The years open for review by the tax inspection authorities for the main applicable taxes vary from one consolidated company to another, based on each country’s tax legislation, taking into account their respective statute-of-limitations periods. In Spain, as a result offollowing the tax audit completed in 2012, the corporation tax from 2008 onwards and all other applicable taxes from 2009 onwards are open to inspection with respect to the main companies of the Spanish tax group are open to inspection for all years from 2005.group.
In the other countries in which the Telefónica Group has a significant presence, the years open for inspection by the relevant authorities are generally as follows:
| · | The last ten years in Germany. |
| · | The last seven years in |
| · | The last five years in Brazil, Mexico, Uruguay, Colombia and the |
| · | The last four years in Venezuela, |
| · | The last three years in Chile, Ecuador, Nicaragua, El Salvador, the |
The tax auditinspection of the open years is not expected to give rise to additional material liabilities for the Group.
The breakdown of “Revenues” is as follows:
| Millions of euros | 2011 | 2010 | 2009 | 2014 | 2013 | 2012 | |||||||||
| Rendering of services | 58,415 | 56,434 | 52,498 | 46,007 | 52,386 | 57,810 | |||||||||
| Net sales | 4,422 | 4,303 | 4,233 | 4,370 | 4,675 | 4,546 | |||||||||
| Total | 62,837 | 60,737 | 56,731 | 50,377 | 57,061 | 62,356 | |||||||||
Other income
The breakdown of “Other income” is as follows:
| Millions of euros | 2014 | 2013 | 2012 | ||||||||||||
| Own work capitalized | 774 | 794 | 822 | ||||||||||||
| Gain on disposal of companies | 5 | 63 | 123 | ||||||||||||
| Gain on disposal of other assets | 367 | 336 | 802 | ||||||||||||
| Government grants | 36 | 42 | 51 | ||||||||||||
| Other operating income | 525 | 458 | 525 | ||||||||||||
| Total | 1,707 | 1,693 | 2,323 | ||||||||||||
| Millions of euros | |||||||||||||||
| 2011 | 2010 | 2009 | |||||||||||||
| Ancillary income | 445 | 882 | 584 | ||||||||||||
| Own work capitalized | 739 | 737 | 720 | ||||||||||||
| Government grants | 62 | 66 | 54 | ||||||||||||
| Gain on disposal of assets | 861 | 4,184 | 287 | ||||||||||||
| Total | 2,107 | 5,869 | 1,645 | ||||||||||||
Other expenses
The breakdown of “Other expenses” in 2011, 20102014, 2013 and 20092012 is as follows:
| Millions of euros | 2011 | 2010 | 2009 | 2014 | 2013 | 2012 | |||||||||
| Leases | 1,033 | 1,083 | 1,068 | 1,039 | 947 | 1,159 | |||||||||
| Advertising | 1,457 | 1,419 | 1,123 | 1,226 | 1,290 | 1,528 | |||||||||
| Other external services | 10,529 | 9,726 | 7,729 | 9,811 | 10,590 | 10,800 | |||||||||
| Taxes other than income tax | 1,328 | 1,279 | 1,203 | 1,094 | 1,335 | 1,436 | |||||||||
| Other operating expenses | 190 | 453 | 203 | ||||||||||||
| Change in trade provisions | 818 | 853 | 874 | 693 | 701 | 777 | |||||||||
| Losses on disposal of fixed assets and changes in provisions for fixed assets | 43 | 1 | 81 | 58 | 277 | 706 | |||||||||
| Other operating expenses | 368 | 288 | 399 | ||||||||||||
| Total | 15,398 | 14,814 | 12,281 | 14,289 | 15,428 | 16,805 | |||||||||
In 2010,2013, “Losses on disposal of fixed assets and changes in provisions for fixed assets” mainly includes the Group approved firm commitmentsvalue adjustment on assets allocated to Telefónica Czech Republic amounting to 176 million euros (see Note 2). This heading in connection with2012 mainly included the Telefónica Foundation’s social welfare projects, in order to provide it with adequate financing to enable it to carry out its forecast short and medium-term plans, inimpact of the amountwrite-offs of 400 million euros. These commitments were partially met with the contribution of certain properties in 2011customer portfolio allocated to the foundation, generating a gain of 40business in Ireland for 113 million euros. Outstanding commitments ateuros and the end of the year amounted to 259related allocated goodwill for 414 million euros.
Estimated payment schedule
The estimated payment schedule in millions of euros for the next few years on operating leases and purchase and other contractual commitments is(non-cancellable without penalty cost) are as follows:
| 12/31/11 | Total | Less than 1 year | 1 to 3 years | 3 to 5 years | Over 5 years |
| Operating lease obligations | 9,613 | 1,543 | 2,591 | 2,114 | 3,365 |
| Purchase and other contractual obligations | 2,568 | 1,473 | 737 | 345 | 13 |
| 12/31/2014 | Total | Less than 1 year | 1 to 3 years | 3 to 5 years | More than 5 years |
| Telefónica Brazil | 3,077 | 399 | 744 | 623 | 1,311 |
| Telefónica Germany | 2,976 | 549 | 816 | 580 | 1,031 |
| Telefónica Hispanoamérica | 2,222 | 380 | 609 | 481 | 752 |
| Telefónica Spain | 975 | 153 | 242 | 198 | 382 |
| Telefónica United Kingdom | 801 | 127 | 206 | 162 | 306 |
| Others | 146 | 35 | 52 | 24 | 35 |
| Operating lease obligations | 10,197 | 1,643 | 2,669 | 2,068 | 3,817 |
| Purchase and other contractual obligations | 9,037 | 4,295 | 2,071 | 961 | 1,710 |
At December 31, 2014, the present value of future payments for Telefónica Group operating leases was 7,966 million euros (1,715 million euros in Telefónica Brazil, 2,837 million euros in Telefónica Germany, 1,640 million euros in Telefónica Hispanoamérica, 930 million euros in Telefónica Spain, 710 million euros in Telefónica United Kingdom and 134 million euros in other companies classified as “Others” on the table above).
The main finance lease transactions are described in Note 22.
Headcount and employee benefits
The table below presents the breakdown of the Telefónica Group’s average number of employees in 2011, 20102014, 2013 and 2009,2012, together with total headcount at December 31 each year. The employees shown for each subgroup include the Telefónica Group companies with similar activities in accordance with the segment reporting.
| 2011 | 2010 | 2009 | ||||||||||||||||||||||
| Average | Year-end | Average | Year-end | Average | Year-end | |||||||||||||||||||
| Telefónica Spain | 35,168 | 33,929 | 35,313 | 35,379 | 35,318 | 35,338 | ||||||||||||||||||
| Telefónica Latin America | 60,589 | 61,527 | 55,164 | 60,909 | 50,709 | 51,606 | ||||||||||||||||||
| Telefónica Europe | 26,715 | 26,085 | 26,517 | 25,968 | 28,249 | 27,023 | ||||||||||||||||||
| Subsidiaries and other companies | 163,673 | 169,486 | 152,053 | 162,850 | 140,875 | 143,459 | ||||||||||||||||||
| Total | 286,145 | 291,027 | �� | 269,047 | 285,106 | 255,151 | 257,426 | |||||||||||||||||
| 2014 | 2013 | 2012 | ||||
| Average | Year-end | Average | Year-end | Average | Year-end | |
| Telefónica Spain | 29,840 | 30,020 | 30,551 | 29,764 | 31,979 | 31,332 |
| Telefónica United Kingdom | 7,404 | 7,436 | 9,413 | 7,432 | 11,341 | 10,986 |
| Telefónica Germany | 6,596 | 10,848 | 5,655 | 5,572 | 5,592 | 5,638 |
| Telefónica Brazil | 18,337 | 18,419 | 18,930 | 18,388 | 20,008 | 19,481 |
| Telefónica Hispanoamérica | 38,098 | 38,104 | 38,733 | 38,638 | 38,303 | 38,771 |
| Other companies | 20,222 | 18,873 | 26,611 | 26,936 | 165,375 | 26,978 |
| Total | 120,497 | 123,700 | 129,893 | 126,730 | 272,598 | 133,186 |
The Group consolidates E-Plus from October 1, 2014 (see Note 5). The number of employees shownof the E-Plus Group at that date was 5,033.
Employees corresponding to the business in Telefónica Ireland and Telefónica Czech Republic are included in the table above corresponds toaverage headcount until the consolidated companies. It is worth highlightingdate they were removed from the largeconsolidation scope (see Note 2). The average number of employees atin 2014, 2013 and 2012 corresponding to these companies was 753, 6,820 and 7,502.
Employees corresponding to the various companiesAtento business are included in the average headcount until the date of the sale in December 2012. The average number of employees in 2012 corresponding to the Atento Group performing contact center activities, whose average and year-end headcount for 2011 were 152,197 and 156,734, respectively.companies sold was 137,454.
Of the final headcount at December 31, 2011,2014, approximately 53.5%37.8% are women (51.5% and 51.8%(38.2% at December 31, 2010 and December 31, 2009, respectively)2013).
Depreciation and amortization
The breakdown of “Depreciation and amortization” on the consolidated income statement is as follows:
| Millions of euros | 2011 | 2010 | 2009 | 2014 | 2013 | 2012 |
| Depreciation of property, plant and equipment | 6,670 | 6,159 | 6,095 | 5,357 | 6,179 | 6,931 |
| Amortization of intangible assets | 3,476 | 3,144 | 2,861 | 3,191 | 3,448 | 3,502 |
| Total | 10,146 | 9,303 | 8,956 | 8,548 | 9,627 | 10,433 |
Earnings per share
Basic earnings per share amounts are calculated by dividing (a) the profit for the year attributable to equity holders of the parent, adjusted for the net coupon corresponding to the undated deeply subordinated securities and for the interest cost accrued in the period in relation to the debt component of the mandatorily convertible notes of the parent company issued in 2014 (see note 12) by (b) the weighted average number of ordinary shares outstanding during the year plus the weighted average number of ordinary shares that would be issued upon the conversion of the said mandatorily convertible notes from the date of their issuance.
Diluted earnings per share amounts are calculated by dividing the net profit for the year attributable to ordinary equity holders of the parent, adjusted as described above, by the weighted average number of ordinary shares outstanding duringadjusted as described in the year.
Both basic and diluted earnings per share attributable to equity holders of the parent are calculated based on the following data:
| Millions of euros | ||||||||||||
| 2011 | 2010 | 2009 | ||||||||||
| Profit attributable to ordinary equity holders of the parent from continuing operations | 5,403 | 10,167 | 7,776 | |||||||||
| Profit attributable to ordinary equity holders of the parent from discontinued operations | - | - | - | |||||||||
| Total profit attributable to equity holders of the parent for basic earnings | 5,403 | 10,167 | 7,776 | |||||||||
| Adjustment for dilutive effects of the conversion of potential ordinary shares | - | - | - | |||||||||
| Total profit attributable to equity holders of the parent for diluted earnings | 5,403 | 10,167 | 7,776 | |||||||||
| Millions of euros | 2014 | 2013 | 2012 |
| Profit attributable to ordinary equity holders of the parent | 3,001 | 4,593 | 3,928 |
| Adjustment for the net coupon corresponding to undated deeply subordinated securities | (187) | (27) | − |
| Adjustment for the financial expense of the debt component of the mandatorily convertible notes | − | − | − |
| Total profit attributable to ordinary equity holders of the parent for basic and diluted earnings per share | 2,814 | 4,566 | 3,928 |
| Thousands | ||||||||||||
| Number of shares | 2011 | 2010 | 2009 | |||||||||
| Weighted average number of ordinary shares (excluding treasury shares) for basic earnings per share | 4,511,165 | 4,522,228 | 4,552,656 | |||||||||
| Telefónica, S.A. share option plan. | 1,675 | 6,017 | 7,908 | |||||||||
| Weighted average number of ordinary shares (excluding treasury shares) outstanding for diluted earnings per share | 4,512,840 | 4,528,245 | 4,560,564 | |||||||||
| Thousands | |||
| Number of shares | 2014 | 2013 (*) | 2012 (*) |
| Weighted average number of ordinary shares (excluding treasury shares) for basic earnings per share | 4,573,586 | 4,627,912 | 4,603,539 |
| Adjustment for mandatorily convertible notes | 32,803 | − | − |
| Adjusted number of shares (excluding treasury shares) for basic earnings per share | 4,606,389 | 4,627,912 | 4,603,539 |
| Telefónica, S.A. share option plans | 11,407 | 4,816 | 1,998 |
| Weighted average number of ordinary shares (excluding treasury shares) outstanding for diluted earnings per share | 4,617,796 | 4,632,728 | 4,605,537 |
(*) Restated data due to the scrip dividend.
Basic and diluted earnings per share attributable to equity holders of the parent broken down by continuing and discontinued operations are as follows:
| Continuing operations | Discontinued operations | Total | |||||||||||||||||||||||||||||||||||||
| Figures in euros | 2011 | 2010 | 2009 | 2011 | 2010 | 2009 | 2011 | 2010 | 2009 | 2014 | 2013 (*) | 2012 (*) | |||||||||||||||||||||||||||
| Basic earnings per share | 1.20 | 2.25 | 1.71 | - | - | - | 1.20 | 2.25 | 1.71 | 0.61 | 0.99 | 0.85 | |||||||||||||||||||||||||||
| Diluted earnings per share | 1.20 | 2.25 | 1.71 | - | - | - | 1.20 | 2.25 | 1.71 | 0.61 | 0.99 | 0.85 | |||||||||||||||||||||||||||
| (*) Restated data due to the scrip dividend. | (*) Restated data due to the scrip dividend. | ||||||||||||||||||||||||||||||||||||||
Note 19. Share-based payment plans
The main share-based payment plans in place in the 2012-2014 period are as follows:
a) Long-term incentive plan based on Telefónica, S.A. shares: "Performance and Investment Plan 2011-2016"
At the General Shareholders’ Meeting held on May 18, 2011, a long-term share-based incentive plan called “Performance and Investment Plan” was approved for Telefónica Group directors and executive officers. This plan took effect following completion of the Performance Share Plan (see section c) below).
Under this plan, a certain number of shares of Telefónica, S.A. are delivered to plan participants selected by the Company who decide to participate on compliance with stated requirements and conditions.
The plan lasts five years and is divided into three independent phases.
The first phase expired on June 30, 2014. The maximum number of shares assigned to this phase of the plan was 5,545,628 shares assigned on July 1, 2011, with a fair value of 8.28 euros per share. Delivery of shares was not required at the end of the phase according to the general conditions of the plan; therefore, managers did not receive any shares.
Regarding the second and third allocations of shares under this plan, the maximum number of shares assigned (including the amount of co-investment) and the number of shares outstanding at December 31, 2014 is as follows:
| Phase / assignment date | No. of shares assigned | Outstanding shares at 12/31/14 | Unit fair value | End date |
2nd phase July 1, 2012 | 7,347,282 | 6,007,909 | 5.87 | June 30, 2015 |
3rd phase July 1, 2013 | 7,020,473 | 6,494,041 | 6.40 | June 30, 2016 |
b) Long-term incentive plan based on Telefónica, S.A. shares: "Performance and Investment Plan 2014-2019"
The main plansTelefónica, S.A. General Shareholders’ Meeting on May 30, 2014 approved a new instalment of the long-term share-based incentive “Performance and Investment Plan” for certain senior executives and members of the Group’s management team, operational on completion of the first “Performance and Investment Plan”.
Like its predecessor, the term of the new plan is a total of five years divided into three phases.
The initial share allocation took place on October 1, 2014, and the second and third allocations are scheduled for October 1 in force2015 and 2016.
The maximum number of shares allocated under the Plan (including the amount of co-investment) and the number of shares outstanding at the end of 2011December 31, 2014 are as follows:set out below:
| Phase / assignment date | No. of shares assigned | Outstanding shares at 12/31/14 | Unit fair value | End date |
| 1st phase / October 1, 2014 | 6,927,953 | 6,918,686 | 6.82 | September 30, 2017 |
| c) Telefónica, S.A. share plan: “Performance Share Plan” (PSP) (2006-2013) |
At the General Shareholders’ Meeting of Telefónica, S.A. on June 21, 2006, its shareholders approved the introduction of a long-term incentive plan for managers and senior executives of Telefónica, S.A. and other Telefónica Group companies. Under this plan, selected participants who met the qualifying requirements were given a certain number of Telefónica, S.A. shares as a form of variable compensation.
The Plan was initially intended to lastterm of the plan is seven years. It isyears divided into five phases, each three years long, beginning on July 1 (the “Start Date”)phases.
The fifth and endinglast phase expired on June 30, three years later (the “End Date”). At the start of each phase the2013. The maximum number of shares assigned to be awarded to Plan beneficiaries is determined based on their success in meeting targets set. Thethis phase of the plan was 5,025,657 shares are delivered, assuming targets are met, at the End Date of each phase. Each phase is independent from the others. The first started on July 1, 2006 (with shares delivered on July 1, 2009) and the fifth phaseassigned on July 1, 2010, (with any shares to be delivered from July 1, 2013).
| No. of shares | Unit fair value | End date | |
1st phase July 1, 2006 | 6,530,615 | 6.43 | June 30, 2009 |
| No. of shares | Unit fair value | End date | |
2nd phase July 1, 2007 | 5,556,234 | 7.70 | June 30, 2010 |
| No. of shares | Unit fair value | End date | |
3rd phase July 1, 2008 | 5,286,980 | 8.39 | June 30, 2011 |
| No. of shares assigned | Outstanding shares at 12/31/11 | Unit fair value | End date | |
| 4th phase July 1, 2009 | 6,356,597 | 5,407,401 | 8.41 | June 30, 2012 |
| 5th phase July 1, 2010 | 5,025,657 | 4,684,289 | 9.08 | June 30, 2013 |
| d) Telefónica, S.A. global share plan: “Global Employee Share |
The plan’s share holding period came to an end in December 2014. More than 21,000 employees on the scheme were rewarded with a total of 1,778,099 shares from Telefónica, valued at approximately 20 million euros at the time they were delivered with effect in equity.
Likewise, the Telefónica, S.A. Ordinary General Shareholders’ Meeting on May 30, 2014 approved a new voluntary plan for incentivized purchases of shares freefor the employees of charge.the Group, which at the date of preparation of these consolidated financial statements is pending to be implemented.
Note 20. Cash flow analysis
Net cash from operating activities
In 2014, the Telefónica Group obtained operating cash flow (operating revenue less payments to suppliers for expenses and employee benefits expenses) totaling 15,910 million euros, 14.30% less than the 18,565 million euros generated in 2013.
Net cash flow from operating activities decreased from 14,344 million euros in 2013 to 12,193 million euros in 2014, down 15.0%, after a decrease of 5.7% from 2012 (15,213 million euros) to 2013.
The initial duration ofmain items included in the plan is intended to be two years. Employees subscribed tonet flow from operations are the plan can acquire Telefónica, S.A. shares through monthly installments of up to 100 euros (or the local currency equivalent), up to a maximum of 1,200 euros over a twelve-month period of (acquisition period). The delivery of shares will occur, where applicable, when the plan is consolidated, as of September 1, 2012, subject to a number of conditions:following:
| Cash received from customers decreased by 11.03% to 61,522 million euros (from 69,149 million euros in 2013). Driven by the revenues evolution in Brazil and Spain, mainly due to the ARPU decrease and lower accesses, partially offset by the increase in the sale of handsets. Active management of collection assets and monetization of revenues on financed sales also helped maintain the levels observed during the previous period. The |
In 2013, the Telefónica Group obtained operating cash flow (operating revenue less payments to suppliers for expenses and employee benefits expenses) totaling 18,565 million euros, 7.7% less than the 20,104 million euros generated in 2012.
The main items included in the net flow from operations are the following:
| · | Cash received from customers decreased by 9.0% to 69,149 million euros (from 75,962 million euros in 2012). The |
| Phase | No. of shares assigned | Unit fair value | End date |
1st phase July 1, 2011 | 5,545,628 | 8.28 | June 30, 2014 |
| · | Tax payments amounted to 1,806 million euros in 2013, 10.8% lower than those made in 2012 (2,024 million euros). The main reason for this decrease was the reduction in profit, since the non-recurring payments in 2012 of 246 million euros arising from the settlement of tax assessments raised on inspection and court decisions affecting the consolidated tax Group and the return of 284 million euros in 2013 were offset by higher payments on account in Spain in 2013 due to the latest legislative amendments. |
Net cash used in investing activities
Net cash used in investing activities increased by 0.7% in 2014 to 9,968 million euros from 9,900 million euros in 2013, mainly due to the increase in the proceeds on disposal of companies, net of cash and cash equivalents, and the increase in the amount of payments made on financial investments not included under cash equivalents.
| · | Payments on investments in property, plant and equipment and intangible assets totaled 9,205 million euros in 2014, 4.8% lower than 2013 (9,674 million euros). This decrease has been |
| · | During 2014, the payment on investments in companies, net of cash and cash equivalents acquired amounted to 5,020 million euros, mainly due to the acquisition of E-Plus (see Note 5) and the acquisition of a 22% stake in Distribuidora de Televisión Digital, S.A. (see Note 9). |
| · | During 2014, proceeds on financial investments not included under cash equivalents, amounted to 302 million euros, mainly due to the sale of Telecom Italia´s bond for a nominal amount of 103 million euros, plus interest. |
| · | Payments on financial investments not included under cash equivalents totaled 247 million euros for 2014, mainly reflected legal deposits, financial investments by Telefónica insurance companies and options on equity instruments. |
| · | In 2014, net cash flows in respect of cash surpluses not included under cash equivalents amounted to 217 million euros, up 531 million from 2013, mainly due to the exchange rate effect in Venezuela. |
Net cash used in investing activities increased by 25.7% in 2013 to 9,900 million euros from 7,877 million euros in 2012, mainly due to the decrease in the proceeds on disposal of companies, net of cash and cash equivalents, and the decrease in the amount of payments made on financial investments not included under cash equivalents.
| · | Payments on investments in property, plant and equipment and intangible assets totaled 9,674 million euros in 2013, 2.0% higher than 2012 (9,481 million euros). This increase was due to higher purchases of spectrum licenses in Brazil and the United Kingdom, amounting to 531 and 669 million euros, respectively. |
| · | Proceeds on disposals of property, plant and equipment and intangible assets amounted to 561 million euros in 2013, a decrease of 40.3% mainly due to a reduction in the disposal of non-strategic assets (205 million euros). |
| · | During the year, proceeds on disposals of companies, net of cash and cash equivalents, amounted to 260 million euros. The most significant divestment was the sale of Hispasat, which entailed a net collection of 123 million euros. |
| · | During 2013, the payment on investments in companies, net of cash and cash equivalent acquired amounted to 398 million euros, mainly due to the share capital increase in Telco, S.p.A. (324 million euros, see Note 9). |
| · | Payments on financial investments not included under cash equivalents totaled 386 million euros for 2013, and mainly reflected the acquisition of a Telecom Italia, S.p.A. bond for 103 million euros, as well as legal deposits, financial investments by Telefónica insurance companies and options on equity instruments. |
| · | In 2013, net cash flows in respect of cash surpluses not included under cash equivalents amounted to 314 million euros, in line with the 318 million euros recorded in 2012. Net investments in 2011 amounted to 646 million euros. |
Net cash used in financing activities
In 2014, net cash used in financing activities has been negative of 4,041 million euros in comparation with a negative amount 2,685 million euros in 2013, primarily due to the increase of repayments of loans, borrowings and promissory notes, as a consequence of prepayments.
| · | Dividends payments are related mainly to the dividends paid by Telefónica, S.A. as well as payments to non-controlling interests of Telefónica Brasil, S.A. (187 million euros) and Telefonica Deutchland Holding, A.G. (122 million euros). |
| · | Transactions with shareholders amounted to 427 million euros in 2014 (65 million in 2013). In 2014 the share capital increase by the non-controlling interests in Telefónica Deutschland amounted to 814 million euros received, offset by to net payments for transactions with Telefónica, S.A. treasury shares. In 2013 the proceeds received from the sale of 40% of the assets in Guatemala, Nicaragua, El Salvador and Panama in 2013 (377 million euros) offset by operations with Telefónica, S.A.’s treasury shares as in 2013 there were two relevant share transactions (see Note 12). |
| · | The proceeds on operations with other equity holders amounted to 3,713 million euros in 2014, and include the amount related to the issuances of undated deeply subordinated securities of 1,000, 750 and 850 million euros and the issuance of notes mandatorily convertible into shares of Telefónica, S.A. amounting to 1,285 million euros (see Note 12). It also includes the payment of the coupon related to the two issuances of undated deeply subordinated securities issued in 2013 amounting to 172 million euros. |
| · | In 2014, proceeds from new issues on bonds totaled 4,453 million euros, 21% lower than the 2013 proceeds (5,634 million euros), mainly issued under the London Stock Exchange’s EMTN program (equivalent to 2,550 million euros) of Telefónica Emisiones, S.A.U. and under the SHELF program (500 million dollars, equivalent to 368 million euros). Additionally, it includes the issue mandatorily convertible into Telecom Italia, S.p.A. shares amounting to 750 million euros, and the bond issue by Telefónica Deutschland Holding, A.G. amounting to 500 million euros. The cancellation of debentures and bonds amounted to 5,116 million euros, in line with 2013 and related to the maturity of bonds. |
| · | In 2014, proceeds on loans, borrowings and promissory notes amounted to 4,290 million euros mainly related to borrowings proceeds of 2,000 million euros in Telefónica, S.A. (see Appendix V). |
| · | In 2014, repayment of loans, borrowings and promissory notes amounted to 8,604 million euros (6,232 million euros in 2013) mainly related to prepayments of loans and the maturity of 2,000 million euros of Tranche A2, 1,672 million euros of Tranche A3 and 923 million euros of Tranche D2 of the syndicated loan of Telefónica, S.A. and 801 million euros of Tranche D1 of the syndicated loan of Telefónica Europe, B.V. |
In 2013, net cash used in financing activities was negative of 2,685 million euros in comparation with a negative amount, 1,243 million euros in 2012, primarily due to the decrease of the proceeds coming from loans, borrowings and promissory notes, as a consequence of a higher activity in the financial markets in previous periods.
| · | Transactions with shareholders amounted to 65 million euros in 2013 (656 million in 2012). The year 2013 mainly reflected the sale of 40% of the assets in Guatemala, Nicaragua, El Salvador and Panama which brought in net proceeds of 377 million euros, partially offset by the shares acquired from non-controlling interests mainly by Telefónica Czech Republic (61 million euros), and net payments for transactions with Telefónica, S.A. treasury shares. The year 2012 mainly reflected the public share offer of Telefónica Deutschland that brought in net proceeds |
of 1,429 million euros, which offset by the shares acquired from non-controlling interests mainly by Telefónica Czech Republic, entailed a total payment of 99 million euros and net payments for transaccions with Telefónica, S.A. treasury shares stood at 590 million euros.
| · | The proceeds on operations with other equity holders amounted to 2,466 million euros in 2013, and included the amount related to the two issuances of undated deeply subordinated securities of 1,750 and 716 million euros, respectively (see Note 12). |
| · | In 2013, proceeds from new issues on bonds totaled 5,634 million euros, 30.4% lower than the 2012 proceeds (8,090 million euros), mainly made under the London Stock Exchange’s EMTN program (3,432 million euros equivalents) of Telefónica Emisiones. The cancellation of debentures and bonds amounted to 5,667 million euros, a 31.3% increase compared to 2012, related to the maturity of bonds. |
| · | In 2013, repayment of loans, borrowings and promissory notes amounted to 6,232 million euros (8,041 million euros in 2012) and were mainly related to the maturity of Tranche A1 of the syndicated loan signed by Telefónica, S.A. on July 28, 2010 (1,000 million euros), and also to the reduction of the outstanding principal of Tranche B of the same syndicated loan by 3,000 million euros. |
Note 21. Other information
a) Litigation and arbitration
Telefónica and its group companies are party to several lawsuits orlegal proceedings thatwhich are currently in progress in the courts of law courts and administrative andthe arbitration bodies of the various countries in which the Telefónica Group iswe are present.
The contingencies arising from the litigation and commitments described below were evaluated (see Note 3.m) when the consolidated financial statements for the year ended December 31, 2014 were prepared. The provisions recorded in respect of the outcome.commitments taken as a whole are not material.
Cancellation of the UMTS license granted to Quam GMBH in Germany.Germany
In December 2004, the German Telecommunications Market Regulator revoked the UMTS license granted in 2000 to Quam GmbH ("Quam"), in which Telefónica has a stake. After obtaining a suspension of the revocation order, on January 16, 2006, Quam GmbH filed a suit against the order with the German courts. This claim sought two objectives: 1) to overturn the revocation order issued by the German Telecommunications Market Regulator, and 2) if this failed, to be reimbursed for the total or partial payment of the original amount paid for the license; i.e.license, 8,400 million euros.
This claim was rejected by the Cologne Administrative Court. Quam GmbH appealed the decision before the Supreme Administrative Court of North Rhine-Westphalia, which also rejected its appeal.
Quam GmbH appealed this decision on August 14, 2009. On August 17, 2011, after the oral hearing, the Federal Administrative Court rejected Quam GMBH’sQuam’s appeal at third instance.
In October 2011, Quam GmbH filed a constitutional complaint forbefore the German Federal Constitutional Court ((Karlsruhe), which is still pending.
Appeal against the European Commission rulingRuling of July 4, 2007 against Telefónica de España’s broadband pricing policy.policy
On July 9, 2007, Telefónica was notified of the decisionDecision issued by the European Commission (“EC”(the "EC") imposing on Telefónica, S.A. and Telefónica de España, S.A.U. ("Telefónica de España") a fine of approximately 152 million euros for breach of the former articleArticle 82 of ECthe Treaty rules byEstablishing the European Community for not charging unfairequitable prices betweento whole and retail broadband access services. The ruling chargedcourt ruled in favor of the EC accusing Telefónica withof applying a margin squeeze between the prices it charged competitors to provide regional and national wholesale broadband services and its retail broadband prices using ADSL technology between September 2001 and December 2006.
On September 10, 2007, Telefónica, S.A. and Telefónica de España filed an appeal to overturn the decision before the General Court of the European Union. The Kingdom of Spain, as an interested party, also lodged an appeal to overturn the decision. Meanwhile, France Telecom and the Spanish Association of Bank Users (AUSBANC) filed requests to intervene, which the General Court admitted.
In October 2007, Telefónica, S.A. presented a guarantee for an indefinite period of time to secure the principal and interest.
A hearing was held on May 23, 2011, at which Telefónica presented its case. AOn March 29, 2012, the General Court ruled rejecting the appeal by Telefónica and Telefónica de España, confirming the sanction imposed by the EC. On June 13, 2012, an appeal against this ruling has yet to be issued aswas lodged before the European Court of December 31, 2011.Justice.
On July 10, 2014, the European Union Court of Justice dismissed the appeal, maintaining the fine imposed for abuse of dominant position (margin squeeze) on wholesale prices charged by Telefónica and Telefónica de España, for broadband access in Spain. This ended the appeal process.
The fine was satisfied by Telefónica de España, as indicated in Note 15.
Appeal against the decisionDecision by Agencia Nacional de Telecomunicações (ANATEL) regarding the inclusion of interconnection and network usage revenues in the Fundo de Universalização de Serviços de Telecomunicações (FUST).("FUST")
Vivo Group operators, together with other wirelesscellular operators, appealed ANATEL’s decisionDecision of December 16, 2005, to include interconnection and network usage revenues and expenses in the calculation of the amounts payable into the Fund for Universal Access to Telecommunications
Services (Fundo de Universalização de Serviços de Telecomunicações or FUST for its initials in Portuguese) –a(“FUST”) – a fund to paywhich pays for the obligations to provide universal service-service - with retroactive application from 2000.2000. On March 13, 2006, the Brasilia Regional Federal Court granted a precautionary measure which stopped the application of ANATEL’s Decision. On March 6, 2007, a ruling in favor of the wireless operators was issued, stating that it was not appropriate to include the revenues received by transfer from other operators in the taxable income for the FUST’s calculation and rejecting the retroactive application of ANATEL’s decision.Decision. ANATEL filed an appeal to overturn this decision with Brasilia Regional Federal Court no. 1. This appeal is pending resolution.
At the same time, Telefónica BrasilBrazil and Telefónica Empresas, S.A., together with other wireline operators through ABRAFIX (the Associação Brasileira de Concessionárias de Serviço Telefonico Fixo Comutado) (ABRAFIX) appealed ANATEL’s decisionDecision of December 16, 2005, also obtaining injunctions.the precautionary measures requested. On June 21, 2007, Federal Regional Court no. 1 ruled that it was not appropriate to include the interconnection and network usage revenues and expense in the FUST’s taxable income and rejected the retroactive application of ANATEL’s decision. ANATEL filed an appeal to overturn this ruling on April 29, 2008 before Brasilia Federal Regional Court no. 1.
No further action has been taken since then. The amount of the claim is quantified at 1% of the interconnection revenues.
Public civil procedure by the SaoSão Paulo government against Telefónica BrasilBrazil for alleged reiterated malfunctioning in the services provided by Telefónica BrasilBrazil and request of compensation for damages to the customers affected
This proceeding was filed by the Public Ministry of the State of SaoSão Paulo for alleged reiterated malfunctioning in the services provided by Telefónica Brasil,Brazil, seeking compensation for damages to the customers affected.affected. A general claim is filed by the Public Ministry of the State of SaoSão Paulo, for 1,000 million Brazilian reais (approximately 448370 million euros), calculated on the company’s revenue base over the last five years.
In April 2010, a ruling in first instance convictingagainst the Telefónica Group was issued.issued, there will not be a precision of its effects until there is a final ruling, and the total amount of persons affected and party in the procedure is known. At that moment, the amount of the indemnity will be established, ranging between 1,000 million reais and 60 million reais (approximately, between 370 million euros and 22 million euros), depending on the number of parties. On May 5, 2010, Telefónica BasilBrazil filed an appeal before the Sao PaoloSão Paulo Court of Justice, suspending the effect of the ruling. No further action has been taken since then.
On January 23, 2013, the EC passed a ruling on the formal proceedings. The ruling imposed a fine on Telefónica of 67 million euros, as the EC ruled that Telefónica and Portugal Telecom committed an infraction as stipulated in Article 101 of the Treaty on the Functioning of the European Union for information fromhaving entered into the agreement set forth in Clause Nine of the sale and purchase agreement of Portugal Telecom’s ownership interest of Brasilcel, N.V.
On April 9, 2013, Telefónica filed an appeal for annulment of this ruling with the European Union General Court. On August 6, 2013, the General Court notified Telefónica of the response issued by the European Commission, onin which the EC reaffirmed the main arguments of its ruling and, specially, that Clause Nine is a competition restriction. On September 24, 2011,30, 2013, Telefónica received a list of charges fromfiled its reply. On December 18, 2013, the European Commission. On January 13, 2012, it presentedCommission filed its response to the charges.appeal.
Judicial appeals against the decisions by the Conselho Administrativo de Defesa Econômica (CADE) regarding the acquisition by Telefónica, S.A. of stakes in Portugal Telecom, SGPS S.A. and Telco, S.p.A.
On December 4, 2013, the Brazilian Antitrust Regulator, CADE, announced the two following decisions:
| o | The entry of a new shareholder in Vivo, sharing the control of Vivo with Telefónica in conditions identical to those that were applicable to the PT Companies when they had a participation in Brasilcel N.V., or |
| o | That Telefónica ceases to have any direct or indirect financial interest in TIM Participações S.A. |
| § | To impose on Telefónica a fine of 15 million Brazilian reais, for having allegedly breached the spirit and the goal of the agreement signed between Telefónica and CADE (as a condition to the approval of Telefónica's original acquisition of an interest in Telecom Italia, S.p.A. in 2007), due to the subscription of non-voting shares of Telco on a recent capital increases. This decision also requires Telefónica to divest such non-voting shares of Telco. |
The fine imposed by CADE on Telefónica, S.A. relates to the agreement reached on September 24, 2013, between Telefónica and the other shareholders of the Italian company Telco (which holds a 22.4% stake with voting rights of Telecom Italia, S.p.A.) whereby Telefónica subscribed and paid out a share capital increase in Telco, through a cash contribution of 324 million euros, in exchange for shares with non-voting rights in Telco. As a result of this capital increase, the interest held by Telefónica in the voting share capital of Telco remained unchanged (46.18%), although its interest in the total share capital of Telco stands at 66%.
On July 9, 2014, Telefónica filed a judicial appeal against both decisions, requesting they be overturned citing numerous procedural improprieties (the rulings were issued before Telefónica presented its allegations) and a clear lack of legal grounds. At the same time, it requested the decisions be rendered null as CADE has not provided any proof that Telefónica's actions undermine competition or infringe on applicable legislation. In this respect, the decision regarding the acquisition by Telefónica of PT Companies' indirect stake in Vivo Participações, S.A. was issued three years after the deal was approved by the Brazilian telecommunications regulator (“ANATEL”). The transaction was completed - prior approval by the CADE was not required at the time - immediately after ANATEL's approval on September 27, 2010.
b) Commitments
Telefónica Internacional, S.A.U. as strategic partner of Colombia Telecomunicaciones, S.A. ESP.ESP
Pursuant to the termsamendment nº 1 of the Framework Investment Agreement signedexecuted on April 18, 2006March 30, 2012, after the closing of the merger between Telefónica Internacional, S.A.U., the Colombian government and Colombia Telecomunicaciones, S.A. ESP shareholdersand Telefónica Móviles Colombia, S.A., the Colombian Government may, at any time, offer to Telefónica all or part of the shares it holds in the company, the latter being obliged to acquire them, (directly or via one of its subsidiaries) provided that any of the following circumstances becomes applicable: (i) Colombia Telecomunicaciones, S.A. ESP fails to meet its payment obligations under the terms of the ”Contrato de Explotación”, of two accumulated bi-monthly installments of the consideration fees; (ii) the increase in EBITDA is less than 5.75% in the measurement periods, and provided that during the twelve (12) months following the ordinary shareholders’ meetings during which the measurement was made, at least one of the following occurs: 1) Colombia Telecomunicaciones S.A. ESP makes capital investments (CAPEX) exceeding 12.5% of its revenues for services; 2) Colombia Telecomunicaciones S.A. ESP has paid a brand fee or any other type of payment to the Strategic Partner for the use of its brands; or 3) orders and/or pays dividends with the favorable vote of the Strategic Partner.
From January 1, 2013, the Colombian Government can require Telefónica to vote in favor of the register of the shares of Colombia Telecomunicaciones, S.A. ESP may offer, from April 28, 2006, at any timein the National Securities and Issuer’s Registry and in a single package,the Colombia Stock Exchange.
In addition, if Telefónica decides to dispose or transfer of all the shares they holdor part of its shareholding in Colombia Telecomunicaciones, S.A. ESP to third parties, Telefónica Internacional, S.A.U., who shallcommits that(i) the acquirer or transferee will be obliged to adhere to the Framework Investment Agreement; and (ii) that the acquirer or transferee will be obliged to present an offer to purchase all of the shares in Colombia Telecomunicaciones, S.A. ESP held by the Colombian Government at the same price and under the same terms and conditions negotiated with Telefónica, through the legally-established procedure for disposal of shares held by public entities.
Lastly, in 2015, the Colombian Government will be entitled to subscribe or acquire, them, directlyat no cost or via onecompensation, a number of shares necessary to bring its subsidiaries.aggregate holding in Colombia Telecomunicaciones S.A. ESP up to 3%, depending on the compound growth in EBITDA between 2011 and 2014, the impact of this commitment not being relevant to the consolidated financial statements of the Company. To enforce this right of the nation, the parties will have three months since ordinary shareholders meeting approving the 2014 accounts, is held in 2015.
Atento
As a result of the sale agreement of Atento by Telefónica, announced on October 12, 2012 and ratified on December 12, 2012, both companies have signed a Master Service Agreement which regulates Atento’s relationship with the Telefónica Group as a service provider for a period of nine years.
By virtue of this Agreement, Atento become Telefónica’s preferred Contact Centre and Customer Relationship Management (CRM) service provider, stipulating annual commitments in terms of turnover which updates in line with inflation and deflation that vary from country to country, pursuant to the volume of services Atento has been providing to the entire Group.
In the case of an eventual failure to meet the annual turnover commitments that could result in a compensation, which would be calculated based on the difference between the actual amount of turnover and the predetermined commitment, applying a percentage based on the Contract Centre’s business margin to the final calculation.
Lastly, the Master Agreement sets forth a reciprocal arrangement, whereby Atento assumes similar commitments to subscribe its telecommunications services to Telefónica.
Share purchase Agreement for the acquisition of Distribuidora de Televisión, S.A. (DTS).
On June 2, 2014, Telefónica de Contenidos, S.A.U. ("Telefónica Contenidos") executed a share purchase agreement, jointly and severally guaranteed by Telefónica, S.A., with Promotora de Informaciones, S.A. for the acquisition of a 56% of the share capital of Distribuidora de Televisión Digital, S.A. (DTS) for amount of 750 million euros. The sale/closing of this purchase priceagreement is subject to obtaining the relevant authorization of the competition authorities.
Moreover, on July 4, 2014, Telefónica de Contenidos acquired 22% of the share capital of DTS owned by Mediaset España Comunicación, S.A. ("Mediaset") for an amount of 295 million euros. Furthermore, a payment of an amount of 30 million euros was satisfied as consideration for the waiver of Mediaset's pre-emptive rights relating the stake held by PRISA in DTS referred in the paragraph above.
Pursuant to the agreement, Mediaset will receive an amount of 10 million euros in the event that Telefónica de Contenidos closes the acquisition of the 56% stake of DTS held by PRISA and, in that case, an amount of up to 30 million euros depending on the evolution of the Pay-TV customers in Spain of the Telefónica Group during the 4 years following the closing of such acquisition.
Agreement with the shareholders of Telco, S.p.A.
On June 16, 2014, the three Italian shareholders of Telco requested the initiation of the process of "demerger" (spin off) of the company, as provided in the shareholders’ agreement. Implementation of the demerger, approved by the General Meeting of Shareholders of Telco, S.p.A. held on July 9, 2014, remains subject to obtaining the required anti-trust and telecommunications approvals (including those from Brazil and Argentina). Once the aforementioned approvals are obtained, this decision will be implemented by transferring all the current stake of Telco, S.p.A. in Telecom Italia to four newly created companies. The share capital of each shareof these companies will be determined based onbelong in its entirety to each of the shareholders of Telco, S.p.A. and each of these companies will receive a per share valuationnumber of shares of Telecom Italia, S.p.A. (“Telecom Italia”) proportional to the current economic stake in Telco, S.p.A. of each share offered for sale by an independent investment bank designated by agreement between the two parties.
The application process of the aforementioned anti-trust and telecommunications approvals (including those in Brazil and Argentina), to proceed to the "demerger" (spin off) of Telco started, once the corresponding corporate documents were entered into in Italy. On December 22, 2014, ANATEL (Brazilian Telecommunications Regulator) approved the “demerger” (spin off) subject to compliance with certain obligations (see Note 9), although CADE (Brazilian Conselho Administrativo de Defesa Econômica) and CNDC (Comisión Nacional de Defensa de la Competencia of Argentina) have not rendered any decision yet.
Furthermore, on July 24, 2014, Telefónica Group had provided guaranteesissued 750 million euros bonds mandatorily exchangeable into ordinary shares of Telecom Italia maturing on July 24, 2017, representing, as of that date, 6.5% of its current voting share capital. The bonds may be exchanged in advance of the transfer of the shares, except under certain circumstances where the Company may opt to redeem the bonds in cash.
It is also significant that, within the framework of the GVT transaction and its holding company GVT Participações, SA, Vivendi, S.A. will acquire 1,110 million ordinary shares owned by Telefonica in Telecom Italia.
Agreement for the ItalianAcquisition of Global Village Telecom, S.A. and its holding company Ipse 2000 S.p.A. (holderGVT Participações, S.A.
On September 19, 2014, Telefónica, S.A. signed an agreement with Vivendi S.A. for the acquisition by Telefónica Brasil, S.A. of Global Village Telecom, S.A. and its holding company GVT Participações, S.A. (jointly “GVT”) for a UMTS licensecash consideration of 4,663 million euros, and a payment in Italy and in which the Company has a stake through Solivella B.V.) to ensure the amounts payable to the Italian government in connection with the grantshares representing 12.0% of the license. In November 2010, the lastshare capital of Telefónica Brasil, S.A., after its combination with GVT.
As part of the 10 monthly payments scheduled was paid. Therefore,agreement, Vivendi, S.A. will acquire from Telefónica 1,110 million ordinary shares in Telecom Italia currently representing 8.3% of Telecom Italia’s voting share capital (equivalent to 5.7% of its total share capital), in exchange for 4.5% of Vivendi, S.A.'s capital in Telefónica Brasil, S.A., after its combination with GVT (which represents all of the guarantee expired on that day. Pending wasvoting shares and 0.7% of the release letterpreferred shares to be issuedreceived by Vivendi S.A. under the Italian government, which is finally issued. There are no other risks or commitments relatedagreement referred to this matter.above).
The cash payment for this transaction is expected to be financed via a capital increase by Telefónica Móviles EspañBrasil S.A., which Telefónica S.A. intends to subscribe in proportion to its current stake in Telefónica Brasil, S.A. and intends to fund, in turn, via a S.A.U.capital increase.
The final closing of the operation is subject to obtaining the relevant regulatory authorizations (including telecommunication and anti-trust approval). On December 22, 2014, ANATEL approved the acquisition of GVT,subject to compliance with certain obligations (see Appendix VII), although the resolution about the acquisition by Vivendi, S.A. of the 1,110 million of ordinary shares of Telecom Italia is still pending. Meanwhile, CADE continues to analyze the process.
c) Environmental matters
Telefónica Móviles Españhas an integrated Green ICT and Environment strategy with three common goals. The first concerns environmental risk management, the second the promoting of internal eco-efficiency, and the third the unlocking of business opportunities to offer end-to-end telecommunications services that support a S.A.U. has won the concessions for the private use of public radioelectric spectrum in the 800 MHz, 900 MHz and 2.6 GHz bands, all until December 31, 2030. The total amount these concessions is 842 million euros, of which 441 million euros has already been paid, leaving an outstanding amount to be paid by June 1, 2012, of 401 million euros.
The Group has launched various projects aimed at improving current systemsan Environmental Policy covering all its companies, as well as a Global Environmental Management System to reduceensure compliance with local environmental laws and continuously improve management processes. The Climate Change and Energy Efficiency Corporate Office is also responsible for rolling out processes to boost energy efficiency and shrink the environmental impact of its existing installations, with project costs being added to the cost of the installation to which the project relates.Group’s carbon footprint.
| d) | Auditors’ fees |
The expenses accrued in respect of the fees for services rendered to the various member firms of the Ernst & YoungEY international organization, toof which Ernst & Young, S.L. (the auditors of the Telefónica Group) belongs,forms part, amounted to 27.9321.30 million euros and 27.7122.72 million euros in 20112014 and 2010,2013, respectively.
The detail of these amounts is as follows:
| Millions of euros | ||||||||
| 2011 | 2010 | |||||||
| Audit services (1) | 26.29 | 25.75 | ||||||
| Audit-related services (2) | 1.64 | 1.92 | ||||||
| Tax services (3) | - | 0.03 | ||||||
| All other services (4) | - | 0.01 | ||||||
| TOTAL | 27.93 | 27.71 | ||||||
| Millions of euros | 2014 | 2013 |
| Audit services (1) | 20.02 | 21.25 |
| Audit-related services (2) | 1.28 | 1.47 |
| Total | 21.30 | 22.72 |
| (1) Audit services: services included under this heading are mainly the audit of the annual and reviews of interim financial statements, work to comply with the requirements of the Sarbanes-Oxley Act (Section 404) and the review of the 20-F report to be filed with the US Securities and Exchange Commission (SEC). | ||
| (2) Audit-related services: This heading mainly includes services related to the review of the information required by regulatory authorities, agreed financial reporting procedures not requested by legal or regulatory bodies and the review of corporate responsibility reports. | ||
The expenses accrued in respect of the fees for services rendered to other auditors in 20112014 and 20102013 amounted to 32.4147.07 million euros and 28.1043.86 million euros, respectively, as follows:
| Millions of euros | ||||||||||
| 2011 | 2010 | |||||||||
| Millions of euros | 2014 | 2013 | ||||||||
| Audit services | 0.68 | 0.75 | 1.17 | 1.11 | ||||||
| Audit-related services | 0.76 | 1.26 | 1.18 | 0.36 | ||||||
| Tax services: | 6.37 | 7.29 | ||||||||
| Tax services | 7.29 | 7.59 | ||||||||
| All other services (consulting, advisory, etc.) | 24.60 | 18.80 | 37.43 | 34.80 | ||||||
| TOTAL | 32.41 | 28.10 | ||||||||
| Total | 47.07 | 43.86 | ||||||||
e) Trade and other guarantees
The Company is required to issue trade guarantees and deposits for concession and spectrum tender bids (see Note 16) and in the ordinary course of its business. No significant additional liabilities in the accompanying consolidated financial statements are expected to arise from guarantees and deposits issued.
Board of Directors’ compensation
The compensation of Telefónica S.A.’smembers of the Board of Directors is governed by Article 2835 of the Bylaws, which states that the compensation amount that the Company may pay to all of its Directors as remuneration and attendance fees shall be fixed by the shareholders at the General Shareholders’ Meeting, which amount shall remain unchanged until and unless the shareholders decide to modify it.Meeting. The Board of Directors shall determine the exact amount to be paid within such limit and the distribution thereof among the Directors.directors. This compensation, as laid downestablished in said article of the Bylaws, is compatible with other professional or employment compensation accruing to the Directors by reason of any executive or advisory duties that they perform for the Company, other than the supervision and collective decision-making duties inherent in their capacity as Directors.
Accordingly, the shareholders, at the Annual General Shareholders Meeting held on April 11, 2003, shareholders set the maximum gross annual amount to be paid to the Board of Directors at 6 million euros. This includeseuros, including a fixed payment and fees for attending meetings of the Board of Director’s advisoryAdvisory or controlControl Committees. Total compensation paid to Telefónica, S.A.’snica’s Directors for discharging their duties in 20112014 amounted to 4,549,5013,486,935 euros in fixed compensation.
The compensation paid toof Telefónica, S.A. directors in their capacity as members of the Board of Directors, the Executive CommitteeCommission and/or the advisoryAdvisory and controlControl Committees consists of a fixed amount payable monthly, plusand fees for attending the meetings of the Board’s advisoryAdvisory or control committees. Board membersControl Committees. Executive Directors other than the Chairman do not receive any amounts for their directorships, but only the corresponding amounts for discharging their executive duties as stipulated in their respective contracts.
The following tabletables below presents the fixed amounts established in 2014 for membership to the Telefónica, S.A.nica’s Board of Directors, Executive Commission and Advisory or Control Committees and the advisoryattendance fees of the Advisory or controlControl Committees:
| (Amounts in euros) | |||
| Position | Board of Directors | Executive Commission | Advisory or Control Committees |
| Chairman | 300,000 | 100,000 | 28,000 |
| Vice Chairman | 250,000 | 100,000 | - |
| Board member: | |||
| Executive | - | - | - |
| Proprietary | 150,000 | 100,000 | 14,000 |
| Independent | 150,000 | 100,000 | 14,000 |
| Other external | 150,000 | 100,000 | 14,000 |
Amounts in euros Position | Board of Directors | Executive Committee | Advisory or Control Committees (*) |
| Chairman | 240,000 | 80,000 | 22,400 |
| Vice Chairman | 200,000 | 80,000 | − |
| Executive | − | − | − |
| Proprietary | 120,000 | 80,000 | 11,200 |
| Independent | 120,000 | 80,000 | 11,200 |
| Other external | 120,000 | 80,000 | 11,200 |
(*) In addition, the amounts paid for attendance atto each of the Advisory or Control Committee’s meetings is 1,2501,000 euros.
Individual breakdown
| Director | Wage/ Compensation1 | Fixed Payment Board Committees2 | Attendance fees3 | Short-term Variable Compensation4 | Other items5 | TOTAL | ||||||||||||||||||
| Executive | ||||||||||||||||||||||||
| Mr. César Alierta Izuel | 2,530,800 | 100,000 | -- | 4,015,440 | 265,300 | 6,911,540 | ||||||||||||||||||
| Mr. Julio Linares López | 1,973,100 | -- | -- | 3,011,580 | 126,084 | 5,110,764 | ||||||||||||||||||
| Mr. José María Álvarez-Pallete López | 316,000 | -- | -- | -- | 21,570 | 337,570 | ||||||||||||||||||
| Proprietary | ||||||||||||||||||||||||
| Mr. Isidro Fainé Casas | 250,000 | 100,000 | -- | -- | 10,000 | 360,000 | ||||||||||||||||||
| Mr. Vitalino Nafría Aznar | 250,000 | 56,000 | 26,250 | -- | -- | 332,250 | ||||||||||||||||||
| Mr. José María Abril Pérez | 150,000 | 122,167 | 13,750 | -- | -- | 285,917 | ||||||||||||||||||
| Mr. Antonio Massanell Lavilla | 150,000 | 70,000 | 32,500 | -- | 10,000 | 262,500 | ||||||||||||||||||
| Mr. Chang Xiaobing | 87,500 | -- | -- | -- | -- | 87,500 | ||||||||||||||||||
| Independent | ||||||||||||||||||||||||
| Mr. David Arculus | 150,000 | 28,000 | 11,250 | -- | -- | 189,250 | ||||||||||||||||||
| Ms. Eva Castillo Sanz | 150,000 | 42,000 | 25,000 | -- | -- | 217,000 | ||||||||||||||||||
| Mr. Carlos Colomer Casellas | 150,000 | 156,000 | 21,250 | -- | 130,000 | 457,250 | ||||||||||||||||||
| Mr. Alfonso Ferrari Herrero | 150,000 | 212,000 | 58,750 | -- | 132,500 | 553,250 | ||||||||||||||||||
| Mr. Luiz Fernando Furlán | 150,000 | 14,000 | 5,000 | -- | -- | 169,000 | ||||||||||||||||||
| Mr. Gonzalo Hinojosa Fernández de Angulo | 150,000 | 198,000 | 48,750 | -- | 133,750 | 530,500 | ||||||||||||||||||
| Mr. Pablo Isla Álvarez de Tejera | 150,000 | 75,833 | 13,750 | -- | -- | 239,583 | ||||||||||||||||||
| Mr. Javier de Paz Mancho | 150,000 | 156,000 | 11,250 | -- | 120,000 | 437,250 | ||||||||||||||||||
| Other external | ||||||||||||||||||||||||
| Mr. Fernando de Almansa Moreno-Barreda | 150,000 | 56,000 | 25,000 | -- | 10,000 | 241,000 | ||||||||||||||||||
| Mr. Peter Erskine | 150,000 | 156,000 | 27,500 | -- | 3,750 | 337,250 | ||||||||||||||||||
F-96
Note 22. Finance leases
The principal finance leases at the Telefónica Group are as follows:
a) Finance lease agreement at Colombia Telecomunicaciones, S.A. ESP
The Group, through its subsidiary Colombia Telecomunicaciones, S.A., ESP, has a finance lease agreement with Patrimonio Autónomo Receptor de Activos de la Empresa Nacional de Telecomunicaciones (PARAPAT), the consortium which owns the telecommunications assets and manages the pension funds for the entities which were predecessors to Colombia Telecomunicaciones, S.A. ESP, and which regulated the operation of assets, goods and rights relating with the provision of telecommunications services by the company, in exchange for financial consideration.
This agreement includes the transfer of these assets and rights to Colombia Telecomunicaciones, S.A. ESP once the last installment of the consideration has been paid in line with the payment schedule:
| Millions of euros | Present value | Revaluation | Pending payment |
| Within one year | 167 | − | 167 |
| From one to five years | 608 | 87 | 695 |
| More than five years | 596 | 1,412 | 2,008 |
| Total | 1,371 | 1,499 | 2,870 |
The net amount of property, plant and equipment recorded under the terms of this lease was 247 million euros at December 31, 2014.
b) Future minimum lease payment commitments in relation to finance leases at Telefónica Germany companies
The payment schedule of finance leases of Telefónica Germany at December 31, 2014, is as follows:
| Millions of euros | Present value | Revaluation | Pending payment |
| Within one year | 374 | 21 | 395 |
| From one to five years | 197 | 6 | 203 |
| More than five years | − | − | − |
| Total | 571 | 27 | 598 |
At December 31, 2014 there are net assets under these leases amounting to 64 million euros recognized under property, plant and equipment.
Additionally, the company acts as a lessor in financial leases related to those described above. The minimum lease payment receivables are scheduled as follows:
| Millions of euros | Present value | Revaluation | Pending receivables |
| Within one year | 223 | 3 | 226 |
| From one to five years | 99 | 1 | 100 |
| More than five years | − | − | − |
| Total | 322 | 4 | 326 |
| Impairment provision | (36) | − | − |
| Total present value after impairment provision | 286 | 4 | − |
Note 23. Events after the reporting period
The following events regarding the Telefónica Group took place between December 31, 2014 and the date of authorization for issue of the accompanying consolidated financial statements:
Financing
On January 9, 2015, Telefónica Europe, B.V. made an early repayment for 844 million US dollars (695 million euros) of its bilateral loan on supplies signed on August 28, 2012 and originally scheduled to mature on October 31, 2023. This loan was guaranteed by Telefónica, S.A.
On January 15, 2015, Telefónica Emisiones, S.A.U. redeemed 1,250 million US dollars (1,068 million euros) of its notes, issued on July 6, 2009. The notes were guaranteed by Telefónica, S.A.
On January 30, 2015, the 375 and 100 million euros loan facilities arranged between Telefónica Finanzas, S.A.U. and the European Investment Bank (EIB) matured as scheduled. These loans were guaranteed by Telefónica, S.A.
On February 19, 2015, Telefónica, S.A. signed a 2,500 million euros syndicated credit facility maturing in 2020, with two twelve month extension options requiring mutual agreement of the parties (which could extend the maturity to as late as 2022). This agreement entered into effect on February 26, 2015 and allowed us to cancel in advance the syndicated loan facility of Telefónica Europe, B.V. dated on March 2, 2012 with two tranches of 756 million euros and 1,469 million pounds sterling originally scheduled to mature in 2017. On the same date, Telefónica S.A. signed an amendment to its 3,000 million euros syndicated credit facility arranged on February 18, 2014 maturing in 2019 in which the parties mutually agreed two twelve month extension options (which could extend the maturity to as late as 2021).
Exclusive negotiations with Hutchison Whampoa Group
On January 23, 2015 Telefónica and Hutchison Whampoa Group agreed to enter into exclusive negotiations for the potential acquisition by the latter of Telefónica’s subsidiary in the United Kingdom (O2 UK) for an indicative price in cash (firm value) of 10.25 billion pounds (approximately 13.5 billion euros); composed of (i) an initial amount of 9.25 billion pounds (approximately 12.2 billion euros) which would be paid at closing and (ii) an additional deferred payment of 1.0 billion pounds (approximately 1.3 billion euros) to be paid once the cumulative cash flow of the combined company in the UK has reached an agreed threshold.
The exclusivity period will last several weeks, allowing Telefónica and Hutchison Whampoa Group to negotiate definitive agreements, while Hutchison Whampoa Group completes its due diligence over Telefónica’s subsidiary in the United Kingdom (O2 UK).
Appendix I: Changes in the consolidation scope
2014
Telefónica Germany
When the approval of the European Commission had been obtained and the share capital increase by Telefónica Deutschland Holding, A.G. to finance the operation had been completed, Telefónica finalized the E-Plus Mobilfunk GmbH &Co KG (E-Plus) purchase on October 1, 2014.
Following the acquisition of E-Plus, the Telefónica Group’s stake in Telefónica Deutschland Holding, A.G. fell from 76.83% to 62.1% (increased to 62.37% at December 31, 2014). The Group consolidates E-Plus from October 1, 2014 using the full consolidation method (see Note 5).
Telefónica Hispanoamérica
Telefónica Investigación y Desarrollo Chile, S.p.A. was incorporated on May 23, 2014. Telefónica Móviles Chile, S.A. holds 100% of the shares. This company is included in the scope of consolidation using the full consolidation method.
Other companies
In June 2013 Telefónica reached an agreement to sell its entire stake in the share capital of Telefónica Ireland, Ltd. The transaction was completed on June 15, 2014, after authorization had been obtained from the competition authorities (see Note 2). Telefónica Ireland was deconsolidated as of July 1, 2014.
On November 5, 2013, Telefónica also signed an agreement to sell 65.9% of the share capital of Telefónica Czech Republic, a.s. to PPF Group N.V.I. The transaction was completed on January 28, 2014, after proper authorization had been obtained, and the company was deconsolidated as of January 1, 2014.
In the consolidated statement of financial position at December 31, 2013, consolidated assets and liabilities subject to the two transactions were classified under “Non-current assets held for sale” and “Liabilities associated with non-current assets held for sale”, respectively (see Note 2).
On February 6, 2014, Telefónica, S.A. drew up an agreement with CaixaBank (through its Finconsum subsidiary) to incorporate Telefónica Consumer Finance, E.F.C., S.A. with a 50% stake, included in the scope of consolidation using the equity method.
On February 11, 2014, Telefónica Digital España, S.L.U. took up a 49% stake in Healthcommunity, S.L. It was included in the scope of consolidation using the equity method.
On March 27, 2014, Telefónica Digital España, S.L.U. purchased 100% of the shares of EYEOS, S.L., and this was included in the scope of consolidation using the equity method.
On April 4, 2014, Telefónica Digital Ltd. purchased a 30% stake in Axonix Ltd., and took control of the company through the shareholders' agreement and designation of a majority of members of the board. It was included in the scope of consolidation using the full consolidation method.
On July 4, 2014, Telefónica de Contenidos, S.A.U. officially purchased a 22% stake in Distribuidora de Televisión Digital, S.A. (DTS), owned by Mediaset España Comunicación, S.A. (Mediaset). This brought the stake held by Telefónica Contenidos, S.A.U. in DTS to 44%, and it is still included in the scope of consolidation using the equity method (see Note 9).
On October 31, 2014 the subsidiary of Telefónica Europe, B.V., Telefónica Finance USA L.L.C., was dissolved, and was removed from the scope of consolidation.
In November 2014 Telefónica, through its subsidiary Telefónica Internacional, S.A.U., sold off a 2.5% stake in China Unicom (Hong Kong) Limited for 687 million euros at the exchange rate of the date of the transaction (see Note 9). The
remainder of Telefónica's China Unicom (Hong Kong) Limited investment (equivalent to 2.51% of its share capital) was reclassified as an available-for-sale financial asset (see Note 13).
At a meeting on December 22, 2014, the Brazilian telecommunications regulator (ANATEL) approved the demerger of Telco, S.p.A on condition of suspension of Telefónica’s voting rights in Telecom Italia, S.p.A. and its subsidiaries, among certain other measures. Telefónica has agreed with the aforementioned suspension of voting rights and has offered the presentation of a formal statement to ANATEL in this regard. Therefore, on the same date Telefónica ceased to have significant influence through its indirect holding in Telecom Italia, S.p.A. and reclassified this investment as an available-for-sale financial asset (see Note 9).
2013
Telefónica Spain
In October, Telefónica Remesas, S.A. was liquidated and removed from the consolidation scope.
In November 2013, Telefónica Móviles España, S.A.U. acquired the remaining shares it did not previously hold in Tuenti Technologies, S.L., thereby obtaining a 100% stake. The Group continued to consolidate this company using the full consolidation method.
Telefónica Germany
The sale of Telefónica Germany Online Services GmbH was recognized on October 31, 2013, which generated a gain of 30 million euros. This company, which had been fully consolidated, was removed from the consolidation scope.
Telefónica Hispanoamérica
On August 2, 2013 Telefónica completed the sale of 40% of its subsidiaries in Guatemala, El Salvador, Nicaragua and Panama to Corporación Multi Inversiones. The sale was executed by means of the creation of a new company, Telefónica Centroamérica Inversiones, S.L., to which Telefónica contributed its stakes in the subsidiaries in Guatemala, Panama, El Salvador and Nicaragua in exchange for a 60% stake in this company (Note 5). The Group consolidates this company using the full consolidation method.
Other companies
In April, Telefónica de Contenidos, S.A.U. completed the sale of its remaining stake in Hispasat, S.A., i.e. 19,359 shares, to Eutelsat Services & Beteiligungen, GmbH for a total of 56 million euros.
On September 24, 2013, Telefónica and the other shareholders of the Italian company Telco, S.p.A. reached an agreement whereby Telefónica, S.A. subscribed and paid out a share capital increase in Telco, S.p.A., through a cash contribution of 324 million euros, in exchange for shares without voting rights in Telco, S.p.A. As a result of this capital increase, the interest held by Telefónica in the voting share capital of Telco, S.p.A. remained unchanged, although its interest in the total share capital of Telco, S.p.A. grew to 66%. Telco, S.p.A. remained included in the consolidation scope using the equity method.
In September 2013, the company Ecosistema Virtual Para la Promoción del Comercio, S.L. was incorporated, in which Telefónica Digital España, S.L. holds a 33% interest. The other shareholders are, with equal stakes, Banco Santander, S.A. and Caixa Card 1 Establecimiento Financiero de Crédito, S.A.U.
In 2013, the companies Telefónica On the Spot Soluciones Digitales, S.A. de C.V. (Mexico) and Telefónica On The Spot Services Soluciones Digitales Perú, S.A.C. were incorporated, which are wholly-owned by Telefónica On the Spot Services.
In 2013, the companies Telefónica Learning Services Chile SpA, Telefónica Learning Services Chile Capacitación, Ltda., Telefónica Learning Services Colombia SAS, Telefónica Learning Services Perú, SAC and Telefónica Serviços de Ensino, Ltda. (Brasil) were incorporated, which are solely owned by Telefónica Learning Services.
In 2013, Telefónica Global Solutions Panama, S.A. (wholly-owned by TIWS América, S.A.) and Telefónica Global Solutions, Singapore PTE. LTD. (wholly-owned by TIWS II, S.L.) were incorporated.
In 2013, the company Estrella Soluciones Prácticas, S.A. was incorporated through the spin-off of Telefónica Móviles Soluciones y Aplicaciones, S.A. The sale of Estrella Soluciones Prácticas, S.A. to Amdocs Chile SpA was formalized in December, whereby it was removed from the consolidation scope.
F-101 |
Appendix II: Board of Director’s Compensation
TELEFÓNICA, S.A.
(Euros)
| Director | Wage / Compen-sation1 | Fixed payment2 | Attendance fees3 | Short term variable compen-sation4 | Fixed payments Board Committees5 | Other items6 | Total |
| Mr. César Alierta Izuel | 2,230,800 | 240,000 | - | 3,050,000 | 80,000 | 155,110 | 5,755,910 |
| Mr. Isidro Fainé Casas | - | 200,000 | - | - | 80,000 | 8,000 | 288,000 |
| Mr. José María Abril Pérez | - | 200,000 | 3,000 | - | 91,200 | - | 294,200 |
| Mr. Julio Linares López | - | 200,000 | 16,000 | - | 45,733 | - | 261,733 |
| Mr. José María Alvarez-Pallete López | 1,923,100 | - | - | 2,900,000 | - | 128,415 | 4,951,515 |
| Mr. Fernando de Almansa Moreno-Barreda | - | 120,000 | 14,000 | - | 33,600 | 8,000 | 175,600 |
Ms. Eva Castillo Sanz7 | 1,264,000 | - | - | 1,463,712 | - | 53,554 | 2,781,266 |
| Mr. Carlos Colomer Casellas | - | 120,000 | 24,000 | - | 147,200 | 8,000 | 299,200 |
| Mr. Peter Erskine | - | 120,000 | 17,000 | - | 124,800 | - | 261,800 |
| Mr. Santiago Fernández Valbuena | - | - | - | - | - | - | - |
| Mr. Alfonso Ferrari Herrero | - | 120,000 | 35,000 | - | 158,400 | 8,000 | 321,400 |
| Mr. Luiz Fernando Furlán | - | 120,000 | - | - | - | - | 120,000 |
| Mr. Gonzalo Hinojosa Fernández de Angulo | - | 120,000 | 30,000 | - | 158,400 | 8,000 | 316,400 |
| Mr. Pablo Isla Álvarez de Tejera | - | 120,000 | 6,000 | - | 22,400 | - | 148,400 |
| Mr. Antonio Massanell Lavilla | - | 120,000 | 13,000 | - | 56,000 | 8,000 | 197,000 |
| Mr. Ignacio Moreno Martínez | - | 120,000 | 15,000 | - | 33,600 | - | 168,600 |
| Mr. Javier de Paz Mancho | - | 120,000 | 9,000 | - | 113,600 | - | 242,600 |
| Mr. Chang Xiaobing | - | 120,000 | - | - | - | - | 120,000 |
1 Wage: Non-variable compensation accrued by the Director for discharging executive duties.
2 Fixed Payment: Cash compensation with a predefined payment frequency, accruable or not over time and accrued by the Director for membership to the Board of Directors, irrespective of affective attendance by the Director at Board Meetings.
3 Attendance fees: Amounts payable for attendance to meetings of the Advisory or Control Committees.
4 Short-term variable compensation (bonus): Variable amount linked to the performance or achievement of individual or group objectives (quantitative or qualitative) for a period equal to or up to a year, corresponding to 2013 and paid in 2014. Concerning the bonus referred to 2014, to be paid during 2015, the Executive Directors will perceive the following amounts: Mr. Vitalino NafríCésar Alierta Izuel, 4,027,486 euros and Mr. José María Aznar tendered his resignationÁlvarez-Pallete López, 3,471,965 euros. In January 2015, Ms. Eva Castillo received variable remuneration of 1,200,000 euros corresponding to fiscal year 2014.
5 Fixed Payment Board Committees: Cash compensation with a predefined payment frequency, accruable or not over time and accrued by the Director for membership to the Executive Committee or Advisory or Control Committees of Telefónica, S.A., irrespective of effective attendance to meetings of said Committees.
6 Other items: Includes, inter alia, amounts paid for membership of the Regional Advisory Committees in Spain (Valencia, Andalusia and Catalonia) and other “in- kind compensation” (such as general medical insurance and dental coverage), paid by Telefónica, S.A.
7 On February 26, 2014, Ms. Eva Castillo Sanz ceased to hold office as Chair of Telefónica Europe, although she continued to fulfill duties at the Telefónica Group other than those inherent in her capacity as Director onthrough December 14, 2011. Appointed to replace him31, 2014. The table above setting forth the total remuneration received by the methoddirectors during the fiscal year includes the remuneration received by Ms Eva Castillo Sanz through December 31, 2014. After that date, Ms. Eva Castillo Sanz stopped performing any duties other than those inherent in her capacity as Director, and received 2,405,000 euros in January 2015 as compensation for the aforementioned termination, and the sum of co-option862,475 euros in settlement of her participation in the “Performance & Investment Plan” (equal to the value of the Telefónica, S.A. shares to which she was Mr. Ignacio Moreno Martínez, which did not receive any compensationentitled for participating in this respect in 2011.such plan), for the two cycles covering 2012-2015 and 2013-2016.
TELEFÓNICA, S.A. ADVISORY OR CONTROL COMMITEES
(Euros)
| Director | Audit and Control | Nomination, Compensation and Corporate Governance | Regulation | Service Quality and Customer Service | Innovation | Strategy | Institutional Affairs | TOTAL 2014 |
| Mr. César Alierta Izuel | - | - | - | - | - | - | - | - |
| Mr. Isidro Fainé Casas | - | - | - | - | - | - | - | - |
| Mr. José María Abril Pérez | - | - | - | - | 14,200 | - | - | 14,200 |
| Mr. Julio Linares López | - | - | - | - | 17,133 | 16,200 | 28,400 | 61,733 |
| Mr. José María Álvarez-Pallete López | - | - | - | - | - | - | - | - |
| Mr. José Fernando de Almansa Moreno-Barreda | - | - | 15,200 | - | - | 16,200 | 16,200 | 47,600 |
| Ms. Eva Castillo Sanz | - | - | - | - | - | - | - | - |
| Mr. Carlos Colomer Casellas | 33,400 | 18,200 | - | 12,200 | 27,400 | - | - | 91,200 |
| Mr. Peter Erskine | - | 19,200 | - | - | 15,200 | 27,400 | - | 61,800 |
| Mr. Santiago Fernández Valbuena | - | - | - | - | - | - | - | - |
| Mr. Alfonso Ferrari Herrero | 21,200 | 31,400 | 15,200 | 12,200 | - | 16,200 | 17,200 | 113,400 |
| Mr. Luiz Fernando Furlán | - | - | - | - | - | - | - | - |
| Mr. Gonzalo Hinojosa Fernández de Angulo | 20,200 | 19,200 | 26,400 | 12,200 | - | 15,200 | 15,200 | 108,400 |
| Mr. Pablo Isla Álvarez de Tejera | - | 17,200 | 11,200 | - | - | - | - | 28,400 |
| Mr. Antonio Massanell Lavilla | 21,200 | - | - | 23,400 | 12,200 | - | 12,200 | 69,000 |
| Mr. Ignacio Moreno Martínez | 22,200 | - | 14,200 | 12,200 | - | - | - | 48,600 |
| Mr. Francisco Javier de Paz Mancho | - | - | 14,200 | 12,200 | - | - | 16,200 | 42,600 |
| Mr. Chang Xiaobing | - | - | - | - | - | - | - | - |
F-103
| Amounts in euros | ||||||||||||||||||||||||||||||||||||
| Board Members | Audit and Control | Nomination, Compensation and Corporate Governance | Human Resources and Corporate Reputation and Responsibility | Regulation | Service Quality and Customer Service | International Affairs | Innovation | Strategy | TOTAL | |||||||||||||||||||||||||||
| Mr. César Alierta Izuel | - | - | - | - | - | - | - | - | - | |||||||||||||||||||||||||||
| Mr. Isidro Fainé Casas | - | - | - | - | - | - | - | - | - | |||||||||||||||||||||||||||
| Mr. Vitalino Manuel Nafría Aznar | 26,500 | - | 16,500 | 21,500 | - | 17,750 | - | - | 82,250 | |||||||||||||||||||||||||||
| Mr. Julio Linares López | - | - | - | - | - | - | - | - | ||||||||||||||||||||||||||||
| Mr. José María Abril Pérez | - | - | - | - | - | 20,250 | 15,667 | - | 35,917 | |||||||||||||||||||||||||||
| Mr. José Fernando de Almansa Moreno-Barreda | - | - | - | 21,500 | - | 34,250 | - | 25,250 | 81,000 | |||||||||||||||||||||||||||
| Mr. José María Álvarez-Pallete López | - | - | - | - | - | - | - | - | - | |||||||||||||||||||||||||||
| Mr. David Arculus | - | - | - | 20,250 | - | 19,000 | - | 39,250 | ||||||||||||||||||||||||||||
| Ms. Eva Castillo Sanz | - | - | - | 21,500 | 20,250 | - | - | 25,250 | 67,000 | |||||||||||||||||||||||||||
| Mr. Carlos Colomer Casellas | - | 17,750 | - | - | 17,750 | - | 41,750 | - | 77,250 | |||||||||||||||||||||||||||
| Mr. Peter Erskine | - | 20,250 | - | - | - | - | 24,000 | 39,250 | 83,500 | |||||||||||||||||||||||||||
| Mr. Alfonso Ferrari Herrero | 27,750 | 38,000 | 17,750 | 21,500 | 20,250 | 20,250 | - | 25,250 | 170,750 | |||||||||||||||||||||||||||
| Mr. Luiz Fernando Furlán | - | - | - | - | - | 19,000 | - | - | 19,000 | |||||||||||||||||||||||||||
| Mr. Gonzalo Hinojosa Fernández de Angulo | 40,500 | 22,750 | 19,000 | - | 20,250 | 20,250 | - | 24,000 | 146,750 | |||||||||||||||||||||||||||
| Mr. Pablo Isla Álvarez de Tejera | - | 20,250 | 14,000 | 35,500 | 14,000 | - | 5,833 | - | 89,583 | |||||||||||||||||||||||||||
| Mr. Antonio Massanell Lavilla | 25,250 | - | 16,500 | - | 34,250 | - | 26,500 | - | 102,500 | |||||||||||||||||||||||||||
| Mr. Francisco Javier de Paz Mancho | - | - | 33,000 | 16,500 | - | 17,750 | - | - | 67,250 | |||||||||||||||||||||||||||
| Mr. Chang Xiaobing | - | - | - | - | - | - | - | - | - | |||||||||||||||||||||||||||
| TOTAL | 120,000 | 119,000 | 116,750 | 158,250 | 126,750 | 168,500 | 113,750 | 139,000 | 1,062,000 | |||||||||||||||||||||||||||
| Director | Wage/ Compensation1 | Attendance fees2 | Short-term variable compensation3 | Other items4 | TOTAL | |||||||||||||||
| Executive | ||||||||||||||||||||
| Mr. José María Álvarez-Pallete López | 961,709 | -- | 1,140,138 | 57,553 | 2,159,400 | |||||||||||||||
| Proprietary | ||||||||||||||||||||
| Mr. Vitalino Nafría Aznar | 16,737 | -- | -- | 16,737 | ||||||||||||||||
| Independent | ||||||||||||||||||||
| Mr. David Arculus | 86,456 | -- | -- | 86,456 | ||||||||||||||||
| Ms. Eva Castillo Sanz | 240,847 | -- | -- | 240,847 | ||||||||||||||||
| Mr. Alfonso Ferrari Herrero | 297,275 | -- | -- | 297,275 | ||||||||||||||||
| Mr. Luiz Fernando Furlán | 299,406 | -- | -- | 299,406 | ||||||||||||||||
| Mr. Javier de Paz Mancho | 840,667 | -- | -- | 840,667 | ||||||||||||||||
| Other external | ||||||||||||||||||||
| Fernando de Almansa Moreno-Barreda | 436,214 | -- | -- | 436,214 | ||||||||||||||||
| Mr. Peter Erskine | 86,456 | -- | -- | 86,456 | ||||||||||||||||
(Euros)
Wage / Compen-sation | Fixed payment | Attendance fees3 | Short term variable compen-sation4 | Fixed payments Board | Other items6 | Total |
| Mr. César Alierta Izuel | - | - | - | - | - | - | - |
| Mr. Isidro Fainé Casas | - | - | - | - | - | - | - |
| Mr. José María Abril Pérez | - | - | - | - | - | - | - |
| Mr. Julio Linares López | - | - | - | - | - | 200,000 | 200,000 |
| Mr. José María Álvarez-Pallete López | - | - | - | - | - | - | - |
| Mr. José Fernando de Almansa Moreno-Barreda | - | 162,557 | - | - | - | 120,000 | 282,557 |
| Ms. Eva Castillo Sanz | - | 3,876 | - | - | - | - | 3,876 |
| Mr. Carlos Colomer Casellas | - | - | - | - | - | 10,000 | 10,000 |
| Mr. Peter Erskine | - | - | - | - | - | 151,056 | 151,056 |
| Mr. Santiago Fernández Valbuena (*) | 1,177,811 | - | - | 1,318,677 | - | 260,799 | 2,757,287 |
| Mr. Alfonso Ferrari Herrero | - | 69,628 | - | - | - | 120,000 | 189,628 |
| Mr. Luiz Fernando Furlán | - | 94,455 | - | - | - | 140,000 | 234,455 |
| Mr. Gonzalo Hinojosa Fernández de Angulo | - | 21,895 | - | - | - | 60,000 | 81,895 |
| Mr. Pablo Isla Álvarez de Tejera | - | - | - | - | - | - | - |
| Mr. Antonio Massanell Lavilla | - | - | - | - | - | 10,000 | 10,000 |
| Mr. Ignacio Moreno Martínez | - | - | - | - | - | - | - |
| Mr. Francisco Javier de Paz Mancho | - | 128,383 | - | - | - | 120,000 | 248,383 |
| Mr. Chang Xiaobing | - | - | - | - | - | - | - |
2 Fixed Payment: Cash compensation with a predefined payment frequency, accruable or not over time and accrued by the Director for membership to the Board of Directors, irrespective of affective attendance by the Director at Board Meetings of any Telefónica Group company.
3 Attendance fees: Amounts payable for attendance to meetings of the Board of Directors or similar bodies of any Telefónica Group company.
4 Short-term variable compensation (bonus): Variable amount linked to the performance or achievement of individual or group objectives (quantitative or qualitative) for a period equal to or up to a year, corresponding to 2013 and paid in 2014. Concerning the bonus referred to 2014, the amount that will be perceived by the Executive Director Mr. Santiago Fernández Valbuena is 1,417,613 euros.
5 Fixed Payment Board Committees: Cash compensation with a predefined payment frequency, accruable or not over time and accrued by the Director for membership to the Executive Committee or Advisory or Control Committees of Telefónica, S.A., irrespective of effective attendance to meetings of said Committees.
6 Other items: Includes, inter alia, amounts paid for membership of Regional and Business Advisory Committees (Europe –from June 2014 is the Advisory Committee of Spain-, Latam and Digital-removed in June 2014) and other “in- kind compensation” (such as general medical insurance and dental coverage), paid by any Telefónica Group Company.
(*) It is hereby stated for the record that Executive Director Mr. Santiago Fernández Valbuena collects his remuneration in Brazilian reais, and accordingly, the stated amount of his remuneration may vary, depending on the exchange rate applicable at any particular time.
F-104 |
| Director (Executive) | Contributions to pension plans | Contribution to the Pension Plan for Senior Executives1 | Compensation in kind2 | ||
| Mr. César Alierta Izuel | 8,402 | 1,014,791 | 57,955 | ||
| Mr. Julio Linares López | 9,468 | 555,033 | 83,923 | ||
| Mr. José María Álvarez-Pallete López | 7,574 | 355,563 | 17,346 |
(Euros)
| Director | |
| Mr. César Alierta Izuel | |
| Mr. José María | 550,436 |
| Ms. Eva Castillo Sanz | 393,796 |
| Mr. Santiago Fernández Valbuena | 935,010 |
| Director | Contributions to Pension Plans | Contributions to Benefits Plan1 |
| Mr. César Alierta Izuel | 8,402 | 1,014,791 |
| Mr. José María Álvarez-Pallete López | 9,468 | 540,968 |
| Ms. Eva Castillo Sanz | 8,402 | 385,394 |
| Mr. Santiago Fernández Valbuena | 109,167 | 825,843 |
1 Contributions to the Pension Plan for Executives set up in 2006, funded exclusively by the Company to complement the existing Pension Plan. It entails defined contributions equivalent to a certain percentage of the Director´s fixed remuneration in accordance with their professional category within the Telefónica Group´s organization.
It is also stated for the record that in February 2015, the golden parachute provisions included in the four-year contract of the Executive Chairman, Mr. César Alierta Izuel, were replaced by an extraordinary one-time contribution of 35.5 million euros to a benefit plan, as part of the company’s policy of reducing indemnity provisions, in line with best corporate governance practices. After this extraordinary contribution, Telefónica, S.A. will not contribute any additional annual amounts to the Benefit Plan for Officers with respect to Mr. Alierta Izuel. Such contribution would be received by Mr. Alierta Izuel in the same instances established in the Benefit Plan for Officers (plan de previsión social de directivos or PPSD) applicable to the other officers.
Life insurance premiums paid in 2014 are as follows:
LIFE INSURANCE PREMIUMS
(Euros)
| Director | |
| Mr. César Alierta Izuel | |
| Mr. José María | 19,935 |
| Ms. Eva Castillo Sanz | 9,667 |
| Mr. Santiago Fernández Valbuena | 8,050 |
F-105
| Regarding share-based payment plans (those exclusively for Executive Directors), there were two long-term variable compensation plans in place in 2014: The first Plan is the so-called “Performance & Investment Plan“ (“PIP”), approved at the General Shareholders’ Meeting of May 18, 2011 whose first phase began in 2011 and ended in July 2014, second phase began in 2012 and will end in July 2015, and third phase began in 2013 and will end in July 2016. It is hereby stated that regarding the first phase of this Plan (2011-2014), the general terms for the delivery of shares were not met. Therefore, no shares were delivered to Executive Directors. The FIRST PIP- Second phase / 2012-2015
It is further stated for the record that, as of December 31, 2014, a maximum of 149,787 shares and 162,500 shares had been allocated to Ms. Eva Castillo Sanz for her participation in the Performance & Investment Plan, for the two cycles of 2012-2015 and 2013-2016, respectively, and that, as stated above, in January 2015, she received 862,475 euros (equivalent to the value of shares of Telefónica S.A. that corresponded for her participation in this Plan) in settlement of her participation in the aforementioned plan. The second plan, called as well “Performance & Investment Plan“ (“PIP”), approved at the General Shareholders’ Meeting of May 30, 2014 whose first phase began in 2014 and will end in October 2017, second phase will begin in 2015 and will end in October 2018, and third phase will begin 2016 and will end in October 2019. It is hereby stated that the number of shares assigned and the maximum possible number of shares to be received by the Directors of Telefónica SECOND PIP- First phase / 2014-2017
* Maximum possible number of shares to be received if the co-investment requirement and maximum target TSR are met. In addition, to reinforce Telefónica’ s status as a global employer, with a common remuneration culture throughout the Company, to encourage all Group employees to take an equity interest, and to motivate employees and boost their loyalty, at the Company’s General Shareholders’ Meeting of May 18, 2011, shareholders approved Under this plan, employees that meet the qualifying requirements are offered the possibility of acquiring Telefónica, S.A. shares, for a period of up to 12 months (the acquisition period), with this company assuming the obligation of giving participants a certain number of shares free of charge. The maximum sum each employee can assign to this plan is 1,200 euros, while the minimum is 300 euros. Employees who remain at the Telefónica Group and retain their shares for an additional year after the acquisition period (the consolidation period) will be entitled to receive one free share per share acquired and retained until the end of the consolidation period. The It should be noted that the external Directors do not receive and did not receive in In addition, the Company does not grant and did not grant in Senior executives’ compensation Meanwhile, the In addition, the contributions by the Telefónica Group in The number of shares assigned at the beginning of the phase to the Executives considered Senior Executives of the Company in the second phase (2012-2015) is 294,136 shares and 322,520 shares in the third phase (2013-2016). Regarding the second “Performance and Investment Plan” (“PIP”) composed of three phases (2014-2017; 2015-2018; 2016-2019) approved at the General Shareholders’ Meeting of May 30, 2014, the number of shares assigned at the beginning of the phase to the Executives considered Senior Executives of the Company in the first phase (2014-2017) is 356,624 shares. Finally, regarding the “Global Employee Share Plan” (“GESP”) (2012-2014), the Executives taking part and contributing the maximum (i.e. 100 euros a month, over 12 months), have acquired a total of F-108 Appendix III: Debentures and bonds The detail and key features of outstanding debentures and bonds at December 31, 2014 are as follows (in millions of euros):
F-109
F-110
F-111
The main debentures and bonds issued by the Group in
The detail of the type of financial instruments arranged by the Group (notional amount) by currency and interest rates at December 31,
The table below is an extract of the previous table that shows the sensitivity to interest rates originated by our position on interest rate swaps categorized into instruments entered into for trading purposes and instruments entered into for purposes other than trading at December 31,
Foreign exchange and interest rate options, by maturity,
Cash flows receivable or payable on derivative financial instruments to be settled via the swap of nominals, categorized by currency of collection/payment, along with contractual maturities are as follows:
The main financing transactions
The table below lists the main companies comprising the Telefónica Group at December 31, Included for each company are the company name, corporate purpose, country, functional currency, share capital (in
Telefónica, S.A.
As a digital telecommunications operator, the Telefónica Group is subject to sector-specific telecommunications regulations, general competition law and a variety of other regulations, including privacy and security, which can have a direct and material effect on the Group’s business areas. The extent to which regulations apply to the Telefónica Group depends largely on the nature of our activities in a particular country, with traditional fixed telephony services and fixed broadband usually subject to stricter regulations. In In this section it is described the legislative framework and the recent legislative key developments in the most relevant countries and regions in which the Group has significant interests. Many of the legislative changes and the adoption of regulatory measures by sectorial regulators, which are described in this section, are in the approval process and therefore have not concluded. Electronic Communication Regulation in the European Union The European Union’s legal framework for electronic communications services was developed with the aim of promoting competition and improving the harmonized functioning of the European market for electronic communications networks and services. The European Union’s legal framework was last modified in 2009, in response to market and technological and changes in the industry. Rules promulgated pursuant to the European Union’s Legal framework define user’s rights and focus on access to networks, interconnection, privacy, data security, and protection and preservation of universal access, among other things. Recent EU measures have supplemented the EU framework with regulations focused on relevant markets international roaming, spectrum, next generation fixed networks and call termination rates for fixed and mobile networks. In each Member State a national regulatory authority, or NRAs, is responsible for enforcing national telecommunications laws incorporating the EU framework. NRAs are subject to the supervision of the European Commission, which formally and informally influences their decisions in order to ensure harmonized application of the EU framework throughout the European Union. In particular, the European Commission has identified certain markets (relevant markets) that are susceptible of ex-ante regulation. These markets have to be analyzed by NRAs in order to see whether there are participants with significant market power (SMP). In these instances, NRAs are instructed to impose at least one obligation relating to price control, transparency, non-discrimination, accounting separation or access obligations on market participants with SMP. Companies may challenge the decisions of their national regulatory authorities before their domestic courts. Such legal proceedings may lead to a decision by the European Court of Justice or ECJ, which is the ultimate authority on the correct application of EU legislation. EU competition law The European Union’s competition rules have the force of law in all EU Member States and are, therefore applicable to the Telefónica Group’s operations in those countries. The Treaty of Rome prohibits "concerted practices" and all agreements between entities that may affect trade between Member States and which restrict or are intended to restrict, competition within the internal market. The Treaty also prohibits any abuse of a dominant competitive position within the common market of the EU, or any substantial part of it, that may affect trade between Member States. The EU Merger Regulation requires that all mergers, acquisitions and joint ventures involving participants meeting certain turnover thresholds be submitted to the EU Commission for review, rather than to the national competition authorities. Under the amended EU Merger Regulation, market concentrations will be prohibited if they significantly impede effective competition in the EU common market. The European Commission and the office of the European Competition Commissioner are granted the authority to apply the EU competition framework. Similar competition rules are set forth in each EU Member State, with the corresponding national competition authorities overseeing compliance with these regulations. All the European countries in which the Telefónica Group operates and referred to below are Member States of the European Union. Recent developments Currently, the regulatory debate in the European Union is focused on the completion of the European Digital Single Market with a special attention on the harmonization of regulatory This effort was started by the European Commission’s September 2013 adoption of the “Connected Continent” Regulation proposal package, which covers the above-mentioned issues and is under discussion. The outcome of this process is still uncertain. Of special importance to Also, as part of this effort, the European Commission adopted, in 2013, a new Recommendation intended to create a more favorable environment in Europe for fiber investment. This Recommendation provides more pricing flexibility for fiber at wholesale (by departing from the cost-orientation pricing), at the expense of stricter measures on the replicability of fiber based access services. In addition, the Commission is now bound to ensure copper price stability (around 9 euros on average for ULL on real terms). Additionally, EU legislator approved in 2014 a regulation that includes measures to reduce the cost of NGA roll-outs including sharing of ducts from utilities and smother permitting processes. These proposals have to be approved by the EU legislator in 2015. Also, during 2013, the European Union adopted its cyber security strategy, comprising a number of measures, among which is a new proposed Directive on Network and Information Security. The intention is to guarantee a reliable and trusted Information Society across the EU, where Internet providers are also subject to security requirements. This Directive is expected to be finally adopted in the EU during 2015. Again at this stage, the outcome is largely uncertain. In January 2012, the European Commission proposed to replace Directive 95/46/EC on the protection of personal data by a General Data Protection Regulation that would apply to those providers who processes personal data of European citizens. The draft Regulation has been approved by the Committee on Civil Liberties, Justice and Home Affairs of the European Parliament (LIBE) in October 2013, prior to a vote in the European Parliament. The approval of that Regulation will have an impact on Telefónica’s privacy obligations related to its activities as a telecommunications operator and as a provider of digital services. The Regulation aims to provide European citizens with a high level of protection of their privacy, and it will affect the ability and methods to process and use the personal data of its customers. The outcome of this debate is currently uncertain. The European Union is also discussing a future Directive for Payment Services that might have influence on the type of financial obligations that could affect to services provided by companies such as Telefónica, in the area of premium rate services or mobile wallets. In June 2012, the Commission approved the International Roaming Regulation (Roaming III), which replaces previous Roaming regulations (Roaming I and II). This Roaming III Regulation contains, for the first time, structural measures to impulse competition in the market for international roaming, so that, from July 1, 2014, customers could, if they wish, sign a roaming agreement with another operator apart from their domestic mobile services without changing the phone number, terminal or SIM card to change countries. The proposal also would entitle mobile operators to use other operators’ networks in other Member States at regulated wholesale prices, thereby encouraging more operators to compete on the roaming market. To cover the period until such structural measures are fully effective and competition pushes prices down, the proposal gradually reduces the limits of retail and wholesale prices for voice, text (SMS) and data. The price cuts have been implemented by operators on July 1, 2014.
This regulation may, however, change again depending on the outcome of the Legislative process related to the Digital Single Market package. The EU Parliament has proposed that roaming prices are around home prices (“Roam like at home” proposal). On February 14, 2012 the European Parliament and the Council adopted Decision 243/2012/EU which settles a multiannual program policy spectrum for the following four years. The Radio Spectrum Policy Program, amongst others, will identify 1200MHz spectrum for wireless data traffic, explore new approaches in spectrum licensing, identify long term spectrum needs and finally will look for additional harmonized bands for mobile broadband. Finally, in its Digital Agenda, the EU has set some objectives for broadband development: of the speed up to 30 Mbps for all European citizens by 2020 and 50% of European households connected to 100Mbps by 2020. Spain General regulatory framework The legal framework for the regulation of the telecommunications sector in Spain is governed by the Telecommunications Law (9/2014) of May 9. The bill reduces administrative burdens to boost networks deployments, as well as the adoption of complementary measures for boosting investment in telecommunications sector. The Market and Competition National Commission, or CNMC, created by the Law 3/2013, assumed in 2013 its role as telecommunications and audiovisual service regulator in Spain. This new organism is also the competition authority in Spain and the national regulatory authority for transport, postal services and energy. Licenses The main licenses and concessions to use spectrum are shown in the table at the end of this Annex. Market analysis Following, obligations imposed by the national regulator in the most relevant markets -in which Telefónica is deemed to have SMP are detailed. Fixed markets Retail access to the fixed-location public telephone network, retail market for calls in a fixed location and retail market for rental lines In this market, the National regulatory authority had made a third round of market analysis, applying a final resolution dated on December 13, 2012, concluding that Telefónica de España is an SMP in retail access to fixed-location public telephone network services, for clients with an identification number not associated to a specific business plan, such as a reference market which can be regulated ex ante. As an operator with SMP, Telefónica de España is subject to certain specific obligations and restrictions. Wholesale fixed call origination market In December 2008, the National regulatory authority concluded that Telefónica de España is an operator with SMP in this market and requested that Telefónica de España offer wholesale service to assist other operators in offering IP telephony services and provide information of migration to Next Generation Networks. Fixed call termination market on individual networks In October 2014, the CNMC carried out a market analysis in terminated fixed networks, and concluded that every single provider, including Telefónica de España, are dominants in terminating fixed networks and, as a consequence, are obliged to provide the terminating service applying cost-orientation and non-discrimination obligations to the rest of operators, according to a purely incremental costs model. Subsequently, the CNMC reduces the terminating fixed network tariff by 85%, on average. Noticeably, this decision implied the overcome of interconnection asymmetry (terminating fixed networks prices of alternative operators to Telefónica previously were 30% higher than the prices of Telefónica). Finally in fixed call termination market on IP networks, Telefónica de España is required to submit an “Interconnection Reference Offer” (OIR). Mobile market Mobile voice call termination In May 2012, the ANR adopted a measure establishing the wholesale price at 0.0109 €/minute, as from July 2013. The CNMC has not yet approved a new analysis on wholesale market mobile voice call termination. Wholesale (physical) to network infrastructure access In January 2009, the National regulatory authority concluded that Telefónica de España is an operator with SMP in the wholesale (physical) network infrastructures access market, and imposed the following obligations: access to full and shared unbundled access to copper loops, sub-loops and ducts, cost oriented tariffs and accounting separation, transparency and non-discrimination obligations including an Unbundling Reference Offer and a Ducts Reference Offer. In December 2014, CNMC has conducted a public consultation exercise and propose a new action plan based on market analysis, with a view to proposing the maintenance previous agreements and obligations, imposing on Telefónica de España the obligation on virtual unbundled access to fiber adopting pricing rules that makes possible the economic replicability of its retails offerings, strengthening local access networks. This proposal may be modified, in the final decision, which is expected for the last quarter of 2015. Wholesale prices for local loop unbundling were increased from 8.32 to 8.60 €/month by the National regulatory authority, in July 2013. Wholesale broadband access In January 2009, the CNMC concluded that Telefónica de España has significant market power in the wholesale broadband access market and is therefore required to provide other operators with wholesale broadband access services up to 30 Mbps in copper and fiber infrastructures. The NRA also required Telefónica de España to publish a wholesale broadband access reference offer, provide cost-oriented rates and accounting separation, to avoid discrimination in network access and to report broadband retail changes in services prior to offering them in the market. On November 16, 2010, the National regulatory authority approved a new wholesale broadband offer (known as the new broadband Ethernet service or NEBA) which will allow alternative operators to provide retail services more independently from Telefónica retail offers up to 30Mbps. In May 2013, the National regulatory authority proposed a reduction in wholesale broadband prices, although the European Commission considered the proposal incompatible with European law, due to the methodology used to determine the prices. Taking into account the European Commission’s comments, the CNMC has adopted a decision on January 30, 2014, reducing the prices 18%. In December 2014, CNMC has carried out a consultation about a new proposal of market analysis that eliminates the 30Mbps limit and incorporates the need of applying different regulation on a geographical basis for the residential clients segment, so that Telefónica will no longer be obliged to offer wholesale broadband services access (bitstream) in that areas of greater competition. In that sense, Telefónica de España will be only obliged to offer its wholesalebroadband access services (bitstream) for the residential segment, in no-competitive areas. In this case, the wholesale service offered over the telephone copper network would have cost-oriented prices, unlike the fiber network service offered, which is subject only to the fulfilment of economic replicability criterion. For the business segment, the consultation proposes to oblige Telefónica de España to offer its wholesale broadband access services throughout the national territory. This proposal may be modified, in the final decision, which is expected for the last quarter of 2015. Universal service obligations According to the General Telecommunications Law, Universal service is set of defined services whose aims are to ensure that all Spanish citizens have access to certain basic telecommunications services, regardless of their geographic location, with a minimum quality level and at accessible prices. Telefónica de España was designated the operator responsible for the provision of the connection to the public electronic Contribution to RTVE funding mechanism In August 2009, the Radio and Television Corporation Finance Law “(Ley de Financiación de la Corporación de Radio y Television Española)” was approved establishing that: (i) telecommunication operators, which operate nationwide or at least in more than one region, have to make a fixed annual provision of 0.9% of the invoiced operating income of the year (excluding the revenues of the wholesale reference market) and, (ii) on the other hand, the concessionaire companies and providers of TV services In Spain, self-settlement of the contributions made has been appealed by Telefónica España and Telefónica Móviles España as well as, the Royal Decree 1004/2010, which approves the Regulation developing the abovementioned law. In the European level there were two ongoing processes with regards to this issue. In July 2013, the EC withdrew its appeal before the Luxembourg Court, shortly after it ruled on similar tax legislation in France, where the Luxembourg Court ruled that the tax imposed by France on telecommunications companies was compatible with European regulation. With this decision, the tax measure will remain unchanged unless the Spanish Collaboration agreements In July 2013, Telefónica de España signed an agreement with Vodafone España S.A.U and France Telecom S.A.U for the use of fiber infrastructure in buildings. This agreement, together with the agreement signed with Jazz Telecom S.A.U in 2012, aimed the deployment of fiber networks in Spain. Once, an operator has reached a concrete building would be able to use the infrastructures deployed previously by other operators. Under CNMC Resolution of June 18, 2014, Infrastructure Sharing Agreement between Telefónica de España, Vodafone España and France Telecom shall have the same prices structure that was agreed before between Telefónica de España and Jazz Telecom, solving in this manner the dispute between Vodafone España and France Telecom. United Kingdom General regulatory framework The EU Regulatory Framework was implemented in the United Kingdom by the Communications Act in 2003. The Act designates the Office of Communications or Ofcom, as the NRA responsible for the regulation of electronic communications networks and services. The Office of Communications, or Ofcom, is designated as the NRA responsible for the regulation of electronic communications networks and services. Market reviews Following a market review, mobile termination rates for the four national mobile communications operators (Vodafone, Telefónica United Kingdom, EE and H3G) are subject to controls based on the pure long-run incremental cost (pure LRIC) approach. The present mobile wholesale termination rate is 0.845ppm. Ofcom proposes to reduce that to 0.545ppm from April 1, 2015. Licenses The main licenses and concessions to use spectrum are shown in the table at the end of this Annex. Following a direction from the Government, Ofcom has also proposed to raise the annual license fee for the use of spectrum The European Union legislative framework was implemented in Germany at the end of June 2004, by the approval of Telecommunications Act (Telekommunikationsgesetz). The national regulatory authority responsible for regulation of electronic communication networks and services is the Bundesnetzagentur, or BNetzA. Following the adaptation of the 2009 EU Telecom Package, the Telecom Act was repeatedly amended and the last modifications entered into force in August 2013. Transition periods existed for some of them. Worth mentioning are the rules, concerning the free-of-charge-waiting-loop and some of the rules concerning the change of the provider. Acquisition of E-Plus On August 29, 2014, the European Commision granted the final authorization for the acquisition of E-Plus. In the course of the merger clearance process, Telefónica Licenses The main licenses and concessions to use spectrum are shown in the table at the end of this Annex. On January 29, 2015, the BNetzA published respective final decisions on the spectrum allocation proceedings and on the auction conditions of the bands 700 MHz and 1500 MHz. The auction will also include the spectrum corresponding to GSM In Market reviews Mobile termination rates (MTR) Since 2006, Telefónica Deutschland has subsequently challenged decisions adopted by BNetzA on mobile termination rates. Some appeals are pending at the Constitutional Court. BNetzA bases some of its calculations on benchmarks, others in its new internally-developed cost model, while the On September On August 13, 2013 BNetzA issued the final resolution on Telekom’s fixed termination rates (FTRs), applicable from December 2012 to November 2013. Local FTRs were reduced by approximately 20%. At the end of November 2013 BNetzA issued a regulatory order for all alternative fixed network operators (ANOs) including Telefónica Deutschland. In addition to the obligations of the former regulatory order, the ANOs have to file a proposal for their local FTRs and BNetzA has to approve such FTRs. The local FTR will be set at the same level as the Telekom FTR. BNetzA issued a preliminary approval for Telefónica Deutschland´s FTR at the end of February 2014. Telefónica Deutschland’s rates were approved for the time period from November 20, 2013 until November 30, 2014. Also in these decisions, BNetzA has based its calculations on an approach which takes account of common costs, disregarding the “Pure LRIC” approach which is recommended by the EU Commission and which does not take account of such common costs. In its latest proposal to further reduce FTR, BNetzA has preliminary set Telekom FTR at 0.0024 euro/minute from December 1, 2014 until November 30, 2016. The proposal has been notified to the EU Commission and is currently subject to a “Phase II” in-depth investigation. Relevant cooperation agreements Since On November 5, 2014, the Federal Cartel Office adopted a decision where concluded that there were no grounds for action. In the proceeding for the regulatory clearance of the cooperation the Federal Network Agency (Bundesnetzagentur) published a draft decision on December 17, 2013 by which the proceeding shall be terminated without any remedies. The draft decision was publicly consulted in Brazil General legislative framework The delivery of telecommunications services in Brazil is subject to regulation under the regulatory framework provided in the General Telecommunications Law enacted in July 1997. The National Agency for Telecommunications, (Agência Nacional de Telecomunicações or ANATEL), is the principal regulatory authority for the Brazilian telecommunications sector. Licenses The main licenses and concessions to use spectrum are shown in the table at the end of this Annex. In Brazil, concessions are awarded for providing services under the public system, In the state of São Paulo, Telefónica On June 30, 2011, the company reviewed its concession agreement and entered into new contracts for local and long distance services, with new conditions imposed on the company, amongst them, to change the basis of calculation of the biannual concession fees. Every two years, during the agreement’s new 20-year period, fixed line concession companies will have to pay a renewal fee which will correspond to 2% of the revenue of the previous year. The first payment of this biennial fee occurred on April 30, 2007, based on 2006 revenue, the second payment occurred on April 30, 2009, based on 2008 revenue, the third payment occurred on April 30, 2011, based on 2009 revenue and the fourth payment occurred on April 30, 2013, based on 2012 revenue. The next payment is scheduled for 2015 based on 2014 revenue. Brazilian Government also published Decree No. 7512 related to the General Plan for the Universalization (PGMU III). It sets new targets for Telefone de Uso Público (public pay phones) density in rural and poor areas and goals related to popular fixed line service (AICE). There were two Public Consultations undergoing, the Public Consultation No. 26 aimed to revise the fixed line concession agreement and Public Consultation No. 25 aimed to revise the General Universalization Commitment Plan, which were launched by ANATEL on June 27, 2014. Definitive rules regarding this issue will be published in 2015. In the remaining states of Brazil, Vivo Telefónica Radiofrequencies authorizations, for its turn, are granted for a limited period of time (maximum of 15 years, renewable once). The most important radiofrequencies authorizations held by Telefónica are those associated with the exploitation of mobile services and are described in the licenses section. In In relation to the acquisition of GVT as described in Note 21 of these Consolidated Financial Statements, according to Brazilian law, the transaction must be approved by Brazilian regulators ANATEL and CADE. On December 22, 2014, ANATEL approved the transaction and imposed certain obligations to Telefónica Telefónica understands that the obligations imposed do not compromise the terms of the GVT acquisition or its value. Interconnection, tariffs and prices Interconnection among public networks is mandatory in Brazil. Parties can freely negotiate the terms and conditions about technical points, economic discounts and rights/obligations, of the interconnection agreements. For Interconnection rates for fixed network operator identified as operator with Significant Market Power (Res. 588/2012) the rate is homologated by ANATEL; the rates for the use of mobile operators networks (Res. 438/2006), may be agreed between the parties. However, if the parties fail to reach a consensus, particularly regarding charges to fixed operators (Res. 576/2011) ANATEL imposes the rates to be used. In general, operators shall maintain public offers of interconnection conditions. On November 8, 2012, ANATEL published the General Plan of Competition Goals (PGMC), which, in general, provides ex-ante obligations for telecommunications providers that identify SMP operators in the various relevant markets identified as critical for the development of competition in the telecommunications industry. The ex-ante obligations include measures of price transparency and market conditions and specific rules for composition of conflicts between agents, such as: (i) mandatory submission and approval of offerings of reference in the wholesale market and warranty service requests from other players that correspond to 20% of the physical network of the SMP companies, (ii) transparency measures as the creation of a Data Base and Wholesale Supervisor Entity, (iii) specifically for providers acting in the mobile termination market (interconnection): full billing between undertakings with SMP, and Bill & Keep decreasing between SMP and non-SMP (80/20% between 2013 and 2014, 60/40% in 2015 and full billing from 2016). The Telefónica Group, including VIVO, has been identified as an operator with SPM in the following markets: (i) fixed network infrastructure access for data transmission in copper pairs or coaxial cables at speeds up to 10 Mbps in the region of São Paulo,
In this regard, ANATEL published its ACT 7272 and 7310, in August 2014 establishing the new VU-M values for 2014 and 2015 applicable to providers with SMP. These are the values applicable to VIVO (in Brazilian reais):
Pursuant to applicable laws, reductions of VU-M must be reflected in VC1 (retail price paid by users for local fixed-mobile calls) and VC2 and VC3 (retail price paid by users for national long distance fixed-mobile calls). Accordingly and as a consequence of the new V-UM in Act 7272 and 7310, on February 24, 2014, ANATEL published its Act 1742 establishing the new VCs for 2014: approximately 0.07388 Brazilian reais less than the previous VC1s in Region III (as Telefónica only offers local fix telephony services in that region); and approximately 0.10901 Brazilian reais less than the previous VC2 and VC3. The amounts of the VC here mentioned are net of tax. In December 2013, ANATEL issued Resolution No. 629 which establishes terms and conditions to execute Conduct Adjustment Terms (Termo de Ajustamento de Condutas) aimed at suspending administrative proceedings in course, if license holders assume certain obligations to fully comply with regulations and provide compensations and awards to users. On March 7, 2014, ANATEL issued the Resolution No. 632 which approved the Regulation of Users Rights of Telecommunications Services, which improves transparency in consumer relations and expands the rights of those who use fixed and mobile telephony, broadband and Pay-TV. This Resolution No. 632 has among other novelties, simplified the cancellation of a telecommunications service, granted more transparency on the services offered and simplified the way to contest the invoices. The deadline to submit comments to ANATEL’s Public Consultation No. 47/2014 aimed to modify the General Plan of Competition Targets – PGMC, approved by the Resolution No. 600, of November 8, 2012, ended last January 2, 2015. The Proposal for amendment of Art.42 of Appendix I of the PGMC is aimed to maintenance of the bill and keep system. Competition law Brazilian competition regulation is based on Law No. 12529 of November 30, 2011. The Administrative Council for Economic Defense, or CADE, is the agency in charge of enforcing the competition rules. The new antitrust law establishes a pre-merger notification regime for concentration transactions, with new turnover thresholds (one participant with gross revenue of BLR750 million in Brazil and other participant with gross revenue of BRL75 million in Brazil) and maximum time length for merger review procedure (240 days, extendable to 330 days). Resolution No. 10, of October 29, 2014 (in force as of January 4), established some additional interpretation about the filling triggers provided in the Law in what regards vertical and horizontal “partnerships agreements” subject to antitrust clearance. Mexico General regulatory framework In Mexico, the provision of all telecommunication services is governed by the Constitution, Federal Telecommunication and Broadcasting Law was published on July 14, 2014 and came into force 30 naturaldays of its publication.The Constitution was amended in June 2013 on telecommunications matters; the Federal Telecommunications Institute (IFT) is created as an autonomous body responsible for the regulation, promotion and supervision of the use, development and exploitation of radio spectrum, networks and the provision of broadcasting services and telecommunications. By virtue of the Constitution amendment, the Federal Communication Institute will be in charge of regulating the dominant operators or with SMP. IFT as the Mexican national authority in communications and broadcasting sector, is the organ responsible for regulating those operators which have SMP in communications and broadcasting markets, after the abovementioned constitutional amendments. As a result of the above mentioned constitutional reforms, IFT has declared the “América Móvil Group” a preponderant operator in the telecommunications market and as a result of that, it introduced, among other, special regulations on asymmetric interconnection rates. Licenses Derived from a corporate restructuring carried out in Mexico, authorized by the Federal Institute for Telecommunications, dated on December 19, 2013 Baja Celular Mexicana, S.A. de C.V.; Celular de Telefonía, S.A. de C.V.; Telefónica Celular del Norte, S.A. de C.V. and Movitel del Noroeste, S.A. de C.V. have ceded in favor of Pegaso PCS, S.A. de C.V. (Pegaso PCS) the rights and obligations of the concession titles. Likewise, on January 31, 2014 the merger between Pegaso Comunicaciones y Sistemas, S.A. de C.V. and Pegaso PCS was formalized, surviving the latter. Once the merger takes effect, Pegaso PCS will acquire the ownership of the rights and obligations of the concession titles of Pegasus Communications and Sistemas. The main licenses and concessions to use spectrum are shown in the table at the end of this Annex. Additionally, other concessions are held in México. Two of those licenses are hold, in order to install, operate and explore two public communication networks, being Pegaso PCS the concessionaire (July 28, 2010, and July 23, 2008). The Secretary of Communications and Transports (SCT) also granted the following licenses to Grupo de Telecomunicaciones Mexicanas (which is invested by Telefónica) (GTM): concessions to install, operate and explore a long distance public communication network, local and international (July 6, 2003); Modification the concession to provide fixed and public telephone services throughout the country (March 28, 2006); concession in order to provide DTH services (January 19, 2011) and the rights for transmission of communication by signals associated with satellites; in Ka Band (August 6, 2012); and, finally, a concession in order to exploit broadcasting and reception rights, by signal associated with two foreign satellites -WILDBLUE 1 and ANIK F2- (August 6, 2012). Prices and tariffs Tariffs charged to customers are not regulated. They are set by mobile operating companies and must be registered with IFT, in order to be enforced. Since January 1, 2015, no charge can be made for national long distance services. Interconnection Mexican telecommunications regulations obligate all telecommunications network concessionaires to execute interconnection agreements. However, should the parties fail to agree, IFT must fix the unresolved issues, including tariffs. Throughout 2011, the extinct COFETEL issued several resolutions as a result of different interconnection disputes submitted by several operators. In such resolutions, COFETEL determined a mobile termination charge (“MTC”) for Telefónica México, as well as for other mobile operators, leading to a 61 % cut to previous rates. Telefónica México has appealed on an administrative basis such resolutions from COFETEL, and such appeals are still pending to be resolved. Recently, IFT determined the mobile termination rates for 2012 and Telefónica México filed an injunction against this rate. Once these trials have been concluded, the rates applied may be further reduced retroactively, IFT has not approved yet the termination rates for 2013, 2014 and 2015 for Telefónica Mexico. Moreover, the declaration of the Preponderant Economic Agent in the telecoms market is expected to lead to asymmetric regulatory measures. Thus, in August 2014, the Preponderant was obligated not to charge for terminating calls on its network, i.e. it was imposed the rate of $ 0.00 for the termination service. On December 29, 2014, the IFT published the rates that will be used to resolve interconnection disputes between concessionaires. On the other hand, with regard to the Preponderant economic agent, the IFT published rates relating to origination and transit services. The Company’s competitive position may benefit to a greater or lesser extent depending on the scope of these measures. Furthermore, on June 21, 2012, CIADI Secretary-General declared admissible the international arbitration presented by Telefónica, S.A. against Mexican United States. Telefónica, S.A. formulated their lawsuit memorial, on September 20, 2013, by virtue of which claim for damages incurred as a consequence of the resolutions, issued by different Mexican regulatory and administrative bodies, of mobile termination rates. Mexican United States answered on February 28, 2014. Foreign ownership/restrictions on transfer of ownership Since the amendments to the Constitution published in June 2013 foreign investment (FDI) up to one hundred percent in telecommunications is allowed. Competition law The new Federal Law of Economic Competition was published in the Official Gazette on May 23, 2014. The IFT must issue the “Regulatory Provisions of the Federal Law of Economic Competition for telecommunications and broadcasting. Venezuela Licenses The main licenses and concessions to use spectrum are shown in the table at the end of this Annex. The band spectrum in 2500-2690 MHz and 1710-2170 MHz, for LTE (Long Term Evolution) mobile services was awarded. The expiration of this license will take place on December 15, 2029, and on November 28, 2022, respectively. The respective bandwidth spectrum concession contracts were signed, one for band AWS 10+10 MHz, and the other for two bands in the 2600 MHz bandwidth. It is worth mentioning that not only did Telefónica obtain the permission to use the 4G spectrum, but it also got an expiration date extension of the general habilitation from 2025 to 2029. Prices and rates In accordance with the last reform of the Organic Law of Telecommunications (2011), the system for fixing the prices for telecommunication services remains the same, consisting of simply notifying them to CONATEL, except for fees for basic telephony services (local, national and international long distance) and those for services provided under universal obligations that are established by the government. However, the regulatory entity may, considering CONATEL’s opinion, fix the prices for any telecommunication services for “public interest reasons”. The amendment does not define the term "public interest reasons". In the framework of the Enabling Act in force in Venezuela until November 2014, in January 2014 an Organic Law on Fair Prices was published, limiting to natural and legal persons of public and private law, nationals or foreigners, who develop economic activities in Venezuela, the profit margin of the sales prices of goods and services set to a maximum of 30% of its operating costs. This Fair Prices Act was amended on November 19, 2014, unchanged, however, the ends referred to above. CONATEL published an Administrative Order under which values are set for the Determination of Interconnection Fees for use of Mobile Telephony Services. The objective of this regulation is to establish a reference for values and a criteria to determine interconnection fees in mobile phone use on the basis of a model of long run incremental costs with breakdown of the network elements by CONATEL, who should intervene setting such fees solely in those cases where there are conflicts between operators relating to such fees, and consensus is not reached within the period specified in the interconnection legislation. Mobile termination rates in relation to national operator have been reduced approximately 6% compared to the previous rates. Likewise, on August 6, 2014, a new providence was published, with which new standards for the provision of services for international long distance telephony and fees applicable for delivering calls to networks fixed and mobile telephony in Venezuela were set. With this regulation, they aim to establish the fees that an operator providing the international long distance services should pay for calls originating in a foreign network and delivered on networks, either fixed or mobile, in Venezuela when the subscriber originating the call is not directly served on his network. Competition law The Antimonopoly Law Decree published on November 18,2014, reformed the "Law for the Promotion and Protection of Free Competition” of 1992, now including principles of Justice and Democratization as well as the promotion and protection of public enterprises, associative forms of state and communal, as provided in the “Plan de la Patria” (plan of the country). Some changes to highlight are the modification of the basis for calculating penalties which now must be calculated on the value of the annual gross income of the offender. Chile General regulatory framework The General Telecommunications Law No. 18168 of 1982, as amended, establishes the legal framework for the provision of telecommunications services in Chile. The main regulatory authority in Chile is the Under-Secretary of Telecommunications, or SUBTEL. An emergency alert system was enabled for mobile networks (2G, 3G) to inform the population in cases of disaster. The system using 4G technology will be implemented in March 2014. On February 13, 2014, the new Regulation on Telecommunications Services, which will come into force on June 14, 2014, except certain specific obligations that must be met by the service providers prior to that date, was published. This Regulation replaces the existing to date and regulate a number of new services as Internet, Pay TV, etc. In May 2014 law No. 20750 that allows the introduction of DTT was published in the Official Journal. The main provisions set an extensible deadline of 5 years for the blackout analog; it sets that the concessions of free-to-air broadcasting could be nationwide, regional, local and European coverage; it also sets the entering of “Granted Retransmission” when the requirements of digital coverage for the 85% of the total population in service area and “must carry” of, at less 4 regional channels (whenever is technologically feasible, and the service area remains equal) is fulfilled. Football matches of Chile National Soccer Team will be broadcast by free-to-air channels. On July 26, 2014, SUBTEL published in Official Journal the call for a public consultation referred to the Digital Broadcasting TV Plan. They present the decree that approves the plan was forwarded to the “Contraloría General de la República” for its discussion. Different organizations that grouped cable and TV operators have appealed against the “Contraloría General de la República”. Moreover, the Congress of Chile approved a draft project that forbids contracts granting exclusivity in the use of pipelines and internals installations needed for the provision of telecommunications facilities for the buildings and condominiums. Additionally, the project regulates the use of the facilities that connect with the internal network and provide access for buildings. Licenses The main licenses and concessions to use spectrum are shown in the table at the end of this Annex. Additionally, Telefónica Chile has been granted licenses of public local phone services and Voice Over Internet Protocol services. Telefónica Empresas Chile has a license for providing TV Services. Telefónica Larga Distancia holds long distance concessions and to install and operate the national fiber optic network. In November 2013, TMCH initiated the partial commercialization of 4G services, and in March 2014 the total of the commercialization will have to be implemented. 2.6 GHz concession obliges TMCH to provide a wholesale service to Mobile Virtual Operators, for what the latter had to published a completely Facilities Offer (including prices), available in non-discriminatory terms. In March 2014, it was published in the Official Journal the Exempt Resolution No. 758/2014 of the Department of Telecommunications, which assigns to TMCH a service concession for transmitting data on 713-748 MHz and 768-803 MHz frequency bands. TMCH has awarded a block of frequencies at a national level of 2x10 MHz through a bidding procedure, with an approximated cost of 5,780,000 U.S. dollars. In addition of providing the data transmission service, additional obligations are set, like provide wholesale services to OMV, provide national roaming wholesale services, provide data transmission wholesale service, provide services to determined routes, locations and municipal and supported schools. Prices and tariffs Public Telecommunication Services Prices and prices for Intermediate Telecommunication Services are freely established by operators, unless there is an express resolution by Chile´s Competition Court on existing conditions in the market that confirms that there is not enough for granting a free prices regime. In January, 2009, by No. 2 Report, Chile´s Competition Court (from this moment onwards the TDLC), decreed free tariffs for the “Fixed Phone Service”, “Local Measured Service”, “Charges for Connection Service” and “Public Telephony Service”. Nevertheless, it did not change, for all fixed phone companies, the currently prices of local loop services, and minor provisions for phone services, including: closure of the line and line restoration, release of access for national long-distance service, international services, complementary services, detailed SLM service and free visit and diagnosis, between others. Furthermore, tariff regulation remained at the same terms for unbundled network services for all fixed service companies. Additionally, maximum prices for interconnection services (access charges for network use, mainly) are subject to tariff regulation for all operators, being set by stipulated procedures. Under national Telecommunication Law, the structure, level and indexing of maximum tariffs that can be charged are set by a Supreme Decree issued by Transports, Economy, Development and Tourism Ministry (hereinafter, “The Ministries”). The Ministries set maximum tariffs under efficient operator model basis. Maximum tariffs for telephony services are set every five years by the Ministry of Transport and Telecommunications and the Ministry of Economy. Interconnection Interconnection is obligatory for all license holders with the same type of public telecommunications services and between telephony public services and intermediate services that provide long distance services. The same requirement applies to holders of those intermediate service licenses, who are required to interconnect their networks to the local telephone network. A “calling party pays” tariff structure was implemented on February 23, 1999. Under this tariff structure, local telephone companies pay mobile telephone companies an access charge for calls placed from fixed networks to mobile networks. Local telephone companies may pass this interconnection charge on to their customers. Every five years, SUBTEL sets the applicable tariffs for services provided through the interconnected networks. The Tariff Decree for the period 2014-2019, for mobile telephony networks was approved by the Ministries on January 16, 2014 and is enforceable since January 25, 2014. The new prices imply a reduction of 76.4% as regards the previous ones. The Tariff Decree that will be implemented during the next five year period 2014-2019, was adopted by SUBTEL on May 5, 2014, and will enter into force, involving a retroactive effect, from May 8, 2014. New tariffs imply a preliminary reduction of 37% from the previous. Nowadays, the Tariff Decree is under review by “Contraloría General de la Republica”. Competition law The principal regulation concerning competition in Chile is Decree No. 211 of 1973, whose current text was established in Law Decree Nº 1 of 2005 (Ministry of Economía, Fomento y Reconstrucción). The Competition Tribunal deals with infringements of competition law. Through General Instruction No. 2 (“IG2”) of December 18, 2012, the Competition Tribunal imposed that mobile phone companies cannot commercialize plans with a different price for the on-net and off-net calls, as of the effective date of the mobile Tariff Decree over access charges (on January 25, 2014). In addition, fixed and mobile service packages with discounts are authorized as of the in-service date of the LTE concession (on March 28, 2014). The TuVes Company, which provides Pay TV services, brought an appeal against IG2 before the Supreme Court, which issued a judgment on December 17, 2013 by virtue of which fixed-mobile convergent offers with a multiservice discount cannot be commercialized permanently. This affected our commercial offer focused on convergent products (Fusion and others), and as a result, possible commercial and operational solutions are being analyzed. Argentina General regulatory framework The basic legal framework for the provision of telecommunications services in Argentina is set forth in the National Telecommunications Law (No. 19798) of 1972 and in the specific regulations governing each type of telecommunications service, which has been modified by Law “Argentina Digital” No. 27078. This new legal framework, issued on January 7, 2015, (the new telecommunications law 'Argentina Digital') entered into force on January 7, 2015, and will regulate information and communication technology (ICT) as Public interest services, replaces the previous telecoms law of 1972, creates a new NRA, sets net neutrality provisions and allows telecommunications licensees to provide (non-satellite) broadcasting services (previously banned by the Media Law), and set a new license system. The following regulatory authorities oversee the Argentine telecommunications industry:
Telefónica Móviles Prices and tariffs Additionally, the “Argentina Digital” legal framework establish that providers of telephone services Also, the guidelines set forth in article 26 of Decree No. 1185/90 continue in effect for operators with significant market power. These guidelines establish information obligations with which operators must comply with respect to tariffs and On the other hand, on October 15, 2012, came into force the resolution SC 45/2012 of Tariffs charged to customers for mobile services are currently not regulated in Argentina. Interconnection The Colombia General regulatory framework In Licenses The main licenses and concessions to use spectrum are shown in the table at the end of this Annex. Additionally, Colombia Telecomunicaciones subjected itself to the General Entitled Regime of approval that is set out in law No. 1341 2009, on November 8, 2011, which allows Colombia Telecomunicaciones to continue providing the network and communications services, like added-value services, carrier national services and mobile services, amongst others.In relation to mobile services, the company Regarding the licenses for the provision of mobile voice services awarded in 1994, and their amendment agreements, by virtue of which allow the usage of spectrum over 850 MHz (25 MHz) and 1900 MHz (15 MHZ) bands, given for a 10 years period and extended in 2004 for another equal period, the company decided to opt to the general habilitation regime, modifying registry before the ITC Ministry and requesting the renewal of the permits for the use of spectrum according to the article 68 of law No. 1341 of 2009, and the Decree No. 2044 of 2013, in which it has been determined the requirements and formalities in order to be able to obtain the renewal and some criteria for establish the renewal conditions. Resolution No. 597 of March 27, 2014 set the conditions the usage of spectrum over 850 and 1900 MHz renewal. Regarding the reversion of assets the Company and the Colombian Government had been acting within the contractual relationship, in the understanding that such reversion only applies to the scarce resource that was assigned (the spectrum), on the basis of with the legal framework issued by the national Congress, integrated by laws 422 of 1998 and 1341 of 2009. Notwithstanding, the Constitutional Court declared possible in a conditional way article 4 of the No. 422 /1998 Law and article 68 of No. 1341/2009 Law, related to the reversion of assets by Sentence C-555 of 2013, to interpret that concessional contracts subscribed before the entry into force of these legislation, shall respect “the reversion” clause 33 concluded “at the expiration of the concession term, the elements and assets directly affected by it will become National property, without imposing any compensation obligation”. Constitutional Court Ruling C-555 was issued in February 2014. According to Court´s Opinion, in case of application, reversion includes wireless telecommunications spectrum band, as well as other assets and network related to the rendering of the service as laid down in sections 14 and 15 of Decree No. 1900 of 1990; or, if such reversion is not possible, its economic equivalence. Upon termination of the Agreements, and during the liquidation of the respective contracts, the Court decision leaves to the parties the understanding of the contractual conditions for the application of the reversion that will take place in May 2015. In Interconnection Mobile and fixed operators in Colombia have the right to interconnect to other operators’ networks. Before the intervention of regulatory authorities, operators must attempt direct negotiations. Interconnection must assure compliance with the objectives of non-discriminatory treatment, transparency, prices based on costs plus a reasonable profit and promotion of competition termination rates are regulated by CRC Resolutions No. 1763 and 3136 of 2011, No. 3534 of 2012 and No. 4660 of 2014, and in particular resolutions No. 4002 and 4050 of 2012, that apply to dominant operator. Additionally, CRC Resolution No. 3101 of 2011 adopted a unique interconnection regime, which promotes competition and guarantees access to networks and networks elements to other providers of telecommunications, content and apps. In 2011,
During 2013, the Constitutional Court Ruling issued national roaming price regulation, extending the application of the objective value set for mobile termination rates to this service and imposing a value of 25.63 Colombian pesos per Mbyte for 2013, 19.36 Colombian pesos for 2014 and 13.09 Colombian pesos for 2015. The Resolution No. 4660 of 2014 established a different value for new entrant operators which obtained Prices and tariffs The Technologies of Regulation in quality and users’ protection During 2013 the Commission established rules to protect users in matters such as international roaming services, and ordered providers to automatically compensate users, as of January 2014, for the blocking, suspension or disconnection of fixed services. For mobile services, the Commission ordered the automatic compensation (via minutes) for dropped calls. During 2014, the Commission established the removal of minimum stay terms for mobile services, and the selling of terminals and services by separated agreements from the In terms of quality, the obligations to facilitate monitoring and controls are highlighted, which were imposed in Television services The Company pays the National Television Authority a periodic consideration for the license obtained in 2007 to offer television services, initially set as 10% of the gross revenues of the company for television services, reduced to 7% in 2010. Since 2012, it is based on a fixed value of 1,874.32 Colombian pesos per user, updated yearly to the consumer gross price index (IPC) and the number of registered users. Competition law The Colombian Competition Law is incorporated in the Peru General regulatory framework The provision of telecommunications services in Peru is governed by the Telecommunications Law and related regulations. In July 2012, the Peruvian Congress approved the Law of Promotion of the Broad Band and Construction of the National Fiber Optic Backbone, Law No. 29904. This Law declares of public necessity: (i) the construction of the National Fiber Optic Backbone which will be entitled to the government to make possible the connectivity by the broad band, and; ii) the access and use of the infrastructure associated with the public services of energy and hydrocarbon to facilitate the display of the telecommunication network for the provision of the broad band. In addition, Law No. 29904 implies that operators of electric, transport and hydrocarbon infrastructure projects will have to install fiber optic that will be entitled to the State and will be given in concession to other telecommunication operators. Also establishes that a percentage of the capacity of the National Fiber Optic Backbone will be reserved for the Government to satisfy its necessities. In November 2013, secondary legislation for developing Law No. 29904 was approved. On December 23, 2013 “Consorcio TV Azteca – Tendai” was awarded with the National Fiber Optic Backbone project. Licenses The main licenses and concessions to use spectrum are shown in the table at the end of this Annex. Additionally, Telefónica del Perú, 2027. In December 2013, Telefónica del Perú, S.A.A. submitted to the Transport and Communications Ministry an application to renew its concessions to provide nationwide fixed telecommunications services, for five years more. The aforementioned proceeding is still pending. Additionally, Telefónica del Perú, S.A.A. has five mobile services concessions. This concession where before entitled to Telefónica Móviles, Although the cable distribution broadcasting service concessions have expired, they Prices and tariffs Tariffs for fixed telephony services must be approved by On October 17, 2013, OSIPTEL fixed in 0.0025 per second 0.1478 per minute the Interconnection Mobile service providers are Competition The general competition framework in Peru is based on the Legislative Decree No. 1034. This Law it is applied, in the telecommunication sector, by OSIPTEL. Law No. 30083 was approved in September 2013, which seeks to strengthen competition in the public mobile market service by introducing mobile virtual network operators (MVNOs) and mobile rural infrastructure operators (MRIO). Mobile network operators must allow MVNOs access (when requested) to their elements and network services for a fee and should provide Ecuador General legislative framework On December 17, 2014 the National Assembly approved the new Telecommunications Act. The mentioned law was referred to the Executive for the Veto, and was sanctioned in February 2015. Finally, on February 18, 2015, the referred Telecommunication Act was published in the Official Journal and came into force on the same day. The National Secretary of Telecommunications and the National Counsel of Telecommunications are the authorities enabled with respect to the regulations, and the Superintendence of Telecommunications with respect to the control of the application of such regulation. Nonetheless, when the new Organic Law of Telecommunications comes into force, there will be a single regulatory and control body: the Agency for the Regulation and Control of Telecommunications. Licenses The main licenses and concessions to use spectrum are shown in the table at the end of this Annex. In addition, on February 18, 2015, Telefónica Ecuador reached an agreement with the Ecuadorian government to purchase 2x25 MHz of spectrum in 1900 MHz band. Otecel Prices and rates The retail prices of voice services and Short Message Service (SMS) are regulated through established tariff ceilings that are incorporated in the Concession Agreement. The wholesale prices are not regulated; however, at the end of 2014 CONATEL (National Council of Telecommunications) issued the Rules of Procedure of Mobile Virtual Network Operators, and the Rules of Procedure of National Automatic Roaming which allow the intervention of the regulator in setting wholesale prices for MVNOs and the National Automatic Roaming, but this discretion has not been implemented yet. Interconnection There is free negotiation between the parties, but if there is not agreement, the SENATEL (National Secretary of Telecommunications) is able to issue a rule of interconnection, and set interconnection charges. This action has been happening. Likewise, it is important to mention that at this time there is the asymmetric interconnection charges for operators Advanced Field Service. Competition Law The Antitrust Law was issued in 2011, which sets regulations about the prohibited practices of abuse of market power, collusive and unfair competition, procedures for investigating such practices, and the respective penalties. The Superintendence of Control of Market Power is the control authority, for this reason it can investigate and punish the prohibited practices. Also, it has been established a Regulation Board that has certain regulatory powers. Main concessions and licenses held by the Telefónica Group Below it is included a list of concessions and licenses to use spectrum for mobile services in each country.
Besides the spectrum assets included in ANNEX 1
| |||||||||||||||||||||||||||||||||||||||||||||||||||||||||||||||||||||||||||||||||||||||||||||||||||||||||||||||||||||||||||||||||||||||||||||||||||||||||||||||||||||||||||||||||||||||||||||||||||||||||||||||||||||||||||||||||||||||||||||||||||||||||||||||||||||||||||||||||||||||||||||||||||||||||||||||||||||||||||||||||||||||||||||||||||||||||||||||||||||||||||||||||||||||||||||||||||||||||||||||||||||||||||||||||||||||||||||||||||||||||||||||||||||||||||||||||||||||||||||||||||||||||||||||||||||||||||||||||||||||||||||||||||||||||||||||||||||||||||||||||||||||||||||||||||||||||||||||||||||||||||||||||||||||||||||||||||||||||||||||||||||||||||||||||||||||||||||||||||||||||||||||||||||||||||||||||||||||||||||||||||||||||||||||||||||||||||||||||||||||||||||||||||||||||||||||||||||||||||||||||||||||||||||||||||||||||||||||||||||||||||||||||||||||||||||||||||||||||||||||||||||||||||||||||||||||||||||||||||||||||||||||||||||||||||||||||||||||||||||||||||||||||||||||||||||||||||||||||||||||