

UNITED STATES
SECURITIES AND EXCHANGE COMMISSION
Washington, D.C. 20549
FORM 20-F
| o | REGISTRATION STATEMENT PURSUANT TO SECTION 12(b) OR 12(g) OF THE SECURITIES EXCHANGE ACT OF 1934 |
OR
| ANNUAL REPORT PURSUANT TO SECTION 13 OR 15(d) OF THE SECURITIES EXCHANGE ACT OF 1934 For the fiscal year ended December 31, |
OR
| o | TRANSITION REPORT PURSUANT TO SECTION 13 OR 15(d) OF THE SECURITIES EXCHANGE ACT OF 1934 |
OR
| o | SHELL COMPANY REPORT PURSUANT TO SECTION 13 OR 15(d) OF THE SECURITIES EXCHANGE ACT OF 1934 |
Commission file number: 001-16125
(Exact name of Registrant as specified in its charter)
ASE Technology Holding Co., Ltd.
Advanced Semiconductor Engineering, Inc.
(Translation of Registrant’s Name into English)
REPUBLIC OF CHINA
(Jurisdiction of Incorporation or Organization)
26 Chin Third Road
Nantze Export Processing Zone
Nantze, Kaohsiung, Taiwan
Republic of China
(Address of Principal Executive Offices)
Joseph Tung
Room 1901, No. 333, Section 1 Keelung Rd.
Taipei, Taiwan, 110
Republic of China
Tel: 886-2-6636-5678
Fax: 882-2-2757-6121
Email: ir@aseglobal.com
(Name,Email:ir@aseglobal.com
(Name, Telephone, Email and/or Facsimile number and Address of Company Contact Person)
Securities registered or to be registered pursuant to Section 12(b) of the Act:
| Title of Each Class | Name of Each Exchange on which Registered |
| Common Shares, par value NT$10.00 each | The New York Stock Exchange* |
*Traded in the form of American Depositary Receipts evidencing American Depositary Shares (the “ADSs”), each
representing fivetwo common shares of Advanced Semiconductor Engineering, Inc. ASE Technology Holding Co., Ltd.
Securities registered or to be registered pursuant to Section 12(g) of the Act:
None
Securities for which there is a reporting obligation pursuant to Section 15(d) of the Act:
None
Indicate the number of outstanding shares of each of the issuer’s classes of capital or common stock as of the close of the period covered by the annual report:
7,909,741,8964,321,629,382 Common Shares, par value NT$10 each**
Indicate by check mark if the registrant is a well-known seasoned issuer, as defined in Rule 405 of the Securities Act.
Yes ☒ No ☐
If this report is an annual or transition report, indicate by check mark if the registrant is not required to file reports pursuant to Section 13 or 15(d) of the Securities Exchange Act of 1934.
Yes ☐ No ☒
Indicate by check mark whether the Registrant (1) has filed all reports required to be filed by Section 13 or 15(d) of the Securities Exchange Act of 1934 during the preceding 12 months (or for such shorter period that the Registrant was required to file such reports) and (2) has been subject to such filing requirements for the past 90 days.
Yes ☒ No ☐
Indicate by check mark whether the registrant has submitted electronically and posted on its corporate Web site, if any, every Interactive Data File required to be submitted and posted pursuant to Rule 405 of Regulation S-T (§232.405 of this chapter) during the preceding 12 months (or for such shorter period that the registrant was required to submit and post such files).
Yes ☒ No ☐
Indicate by check mark whether the registrant is a large accelerated filer, an accelerated filer, or a non-accelerated filer.filer, or an emerging growth company. See definition of “large accelerated filer,” “accelerated filer,” and large accelerated filer”l “emerging growth company” in Rule 12b-2 of the Exchange Act. (Check one):
| Large accelerated filer ☒ | Accelerated filer ☐ | Non-accelerated filer ☐ | Emerging growth company ☐ |
Indicate by check mark which basis of accounting the registrant has used to prepare the financial statements included in this filing:
| U.S. GAAP ☐ | International Financial Reporting Standards as issued by the International Accounting Standards Board ☒ | Other ☐ |
If “Other” has been checked in response to the previous question, indicate by check mark which financial statement item the registrant has elected to follow:
Item 17 ☐ Item 18 ☐
If this is an annual report, indicate by check mark whether the registrant is a shell company (as defined in Rule 12b-2 of the Exchange Act).
Yes ☐ No ☒
** As a result of the exercise of employee stock options subsequent to December 31, 2015,2018, as of MarchJanuary 31, 2016,2019, we had 7,918,272,8964,322,321,982 shares outstanding.
Page
| SUBSIDIARY INFORMATION | |
| Item 11. Quantitative and Qualitative Disclosures about Market Risk | |
| Item 12. Description of Securities Other Than Equity Securities |
i
ii
Unless the context otherwise requires, references in this annual report to:
| · | “ |
| · | “2016 Bonds” are to RMB500.0 million 4.250% Guaranteed Bonds due September 20, 2016, issued by Anstock Limited; |
| · | “2018 Convertible Bonds” are to US$400.0 million Zero Coupon Convertible Bonds due September 5, 2018, issued by the Company; |
| · | “2018 NTD-linked Convertible Bonds” are to US$200.0 million NTD-linked Zero Coupon Convertible Bonds due March 27, 2018, issued by the Company; |
| · | “ |
| · | “ASE Chung Li” are to ASE (Chung Li) Inc., a company previously incorporated under the laws of the |
| · | “ASE Electronics” are to ASE Electronics Inc., a company incorporated under the laws of the |
| · | “ASE Japan” are to ASE Japan Co. Ltd., a company incorporated under the laws of Japan; |
| · | “ASE Korea” are to ASE (Korea) Inc., a company incorporated under the laws of the Republic of Korea; |
| · | “ASE Material” are to ASE Material Inc., a company previously incorporated under the laws of the |
| · | “ASE Shanghai” are to ASE (Shanghai) Inc., a company incorporated under the laws of the |
| · | “ASE Test” are to ASE Test Limited, a company incorporated under the laws of Singapore; |
| · | “ASE |
| · | “ASE Test Taiwan” are to ASE Test, Inc., a company incorporated under the laws of the |
| · | “ASEEE” are to ASE Embedded Electronics Inc., a company incorporated under the laws of the R.O.C.; |
| · | “ASEH,” the “Company,” “ASE Technology Holding,” “we,” “us” or “our” are to ASE Technology Holding Co., Ltd. and, unless the context requires otherwise, its subsidiaries; |
| · | “ASEKS” are to ASE (KunShan) Inc., a company incorporated under the laws of the |
| · | “ASEN” are to Suzhou ASEN Semiconductors Co., Ltd., a company incorporated under the laws of the |
| · | “ASESH AT” are to ASE Assembly & Test (Shanghai) Limited, formerly known as Global Advanced Packaging Technology Limited, or GAPT, a company incorporated under the laws of the |
1
| · | “ASEWH” are to ASE (Weihai), Inc., a company incorporated under the laws of the |
1
| · | “Deposit Agreement” are to deposit agreement dated September 29, 2000 among Citibank, N.A., as depositary, holders and beneficial owners of ADSs and us, which was filed as an exhibit to our registration statement on post-effective amendment No. 2 to Form F-6 on September 16, 2003, and its two amendments, which were filed as an exhibit to our registration statement on post-effective amendment No. 1 to Form F-6 on April 3, 2006 and our registration statement on post-effective amendment No. 2 to Form F-6 on October 25, 2006; |
| · | “EEMS Test Singapore” are to EEMS Test Singapore Pte. Ltd., a company incorporated under the laws of Singapore, which changed its name to ASE Singapore II Pte. Ltd. and was subsequently merged into ASE Singapore Pte. Ltd. on January 1, 2011; |
| · | “Exchange Act” are to the U.S. Securities Exchange Act of 1934, as amended; |
| · | “FSC” are to the Financial Supervisory Commission of the Republic of China; |
| · | “Green Bonds” are to US$300.0 million 2.125% Guaranteed Bonds due July 24, 2017, offered by Anstock II Limited, our wholly owned subsidiary incorporated in the Cayman Islands; |
| · | “Hung Ching” are to Hung Ching Development & Construction Co. Ltd., a company incorporated under the laws of the |
| · | “IFRS” are to International Financial Reporting Standards, International Accounting Standards and Interpretations as issued by the International Accounting Standards Board; |
| · | “ISE Labs” are to ISE Labs, Inc., a corporation incorporated under the laws of the State of California; |
| · | “Initial SPIL Tender Offer” are to ASE’s offer to purchase 779,000,000 common shares (including common shares represented by outstanding American depositary shares) of SPIL through concurrent tender offers in the |
| · | “Joint Share Exchange Agreement” are to the joint share exchange agreement entered into between ASE and SPIL on June 30, 2016; |
| · | “Korea” or “South Korea” are to the Republic of Korea; |
| · | “Mainland Investors Regulations” are to the Regulations Governing Securities Investment and Futures Trading in Taiwan by Mainland Area Investors; |
| · | “MOEAIC” are to Investment Commission, the |
| · | “NYSE” are to New York Stock Exchange; |
| · | “PowerASE” are to PowerASE Technology, Inc., a company incorporated under the laws of the |
| · | “ |
| · | “P.R.C.” are to the People’s Republic of China and excludes Taiwan, Macau and Hong Kong; |
2
| · | “ |
| · | “QDII” are to qualified domestic institutional investors; |
| · | “Republic of China”, the |
| · | “ |
| · | “SEC” are to the Securities and Exchange Commission of the U.S.; |
| · | “Second SPIL Tender Offer” are to ASE’s offer to purchase 770,000,000 common shares (including common shares represented by outstanding American depositary shares) of SPIL through concurrent tender offers in the |
2
| · | “Securities Act” are to the U.S. Securities Act of 1933, as amended; |
| · | “Share Exchange” is the statutory share exchange pursuant to the laws of the Republic of China, through which ASEH will (i) acquire all issued shares of ASE in exchange for shares of ASEH using the share exchange ratio as described in “Item 10. Additional information—Material Contract”, and (ii) acquire all issued shares of SPIL using the cash consideration as described in “Item 10. Additional information—Material Contract.” |
| · | “SiP” are to system-in-package; |
| · | “SPIL” are to Siliconware Precision Industries Co., |
| · | “SPIL Acquisition” are to ASEH’s effort to effect an acquisition of 100% of the common shares and American depositary shares of SPIL pursuant to the Joint Share Exchange Agreement; |
| · | “Taiwan-IFRS” are to the Regulations Governing the Preparation of Financial Reports by Securities Issuers, the IFRS as well as related guidance translated by Accounting Research and Development Foundation and endorsed by the FSC; |
| · | “Tessera” are to Tessera, Inc., a company that filed a suit against the Company and its U.S. subsidiary, ASE (U.S.) Inc.; |
| · | “TWSE” are to Taiwan Stock Exchange; |
| · | “UGJQ” are to Universal Global Technology (Shanghai) Co., Ltd., a company incorporated under the laws of the |
| · | “UGKS” are to Universal Global Technology (Kunshan) Co. Ltd., a company incorporated under the laws of the |
| · | “UGTW” are to Universal Global Scientific Industrial Co. Ltd., a company incorporated under the laws of the |
| · | “Universal |
| · | “Universal Scientific Industrial Shanghai” are to Universal Scientific Industrial (Shanghai) Co., Ltd., a company incorporated under the laws of the |
| · | “U.S.” refers to United States of America; |
3
| · | “U.S. GAAP” are to accounting principles generally accepted in the U.S.; |
| · | “USI Inc.” are to USI Inc., a company incorporated under the laws of the |
| · | “USI Mexico” are to Universal Scientific Industrial De Mexico S.A. DE C.V., a company incorporated under the laws of Mexico; |
| · | “USISZ” are to |
| · | “Wuxi Tongzhi” are to Wuxi Tongzhi Microelectronics Co., Ltd., a company incorporated under the laws of the |
3
We publish our financial statements in New Taiwan dollars, the lawful currency of the ROC.R.O.C. In this annual report, references to “United States dollars,” “U.S. dollars” and “US$” are to the currency of the United States; references to “New Taiwan dollars,” “NT dollars” and “NT$” are to the currency of the ROC;R.O.C.; references to “RMB” are to the currency of the PRC;P.R.C.; references to “JP¥” are to the currency of Japan; references to “MYR” are to the currency of Malaysia; references to “SGD” are to the currency of Republic of Singapore; references to “KRW” are to the currency of Republic of Korea; and references to “EUR” are to the currency of the European Union. Unless otherwise noted, all translations from NT dollars to U.S. dollars were made at the exchange rate as set forth in the H.10 weekly statistical release of the Federal Reserve System of the United States (the “Federal Reserve Board”) as of December 31, 2015,2018, which was NT$32.79=30.61=US$1.00, and all translations from RMB to U.S. dollars were made at the exchange rate as set forth in the H.10 weekly statistical release of the Federal Reserve Board as of December 31, 2015,2018, which was RMB6.4778=RMB6.8755=US$1.00. All amounts translated into U.S. dollars in this annual report are provided solely for your convenience and no representation is made that the NT dollar, RMB or U.S. dollar amounts referred to herein could have been or could be converted into U.S. dollars or NT dollars/RMB, as the case may be, at any particular rate or at all. On April 22, 2016,19, 2019, the exchange rate between NT dollars and U.S. dollars as set forth in the H.10 weekly statistical release by the Federal Reserve Board was NT$32.36=30.82=US$1.00. On April 22, 2016,19, 2019, the exchange rate between RMB and U.S. dollars as set forth in the H.10 weekly statistical release by the Federal Reserve Board was RMB6.5004 =US$RMB6.7032=US$1.00.
4
SPECIAL NOTE REGARDING FORWARD-LOOKING STATEMENTS
This annual report on Form 20-F contains “forward-looking statements” within the meaning of Section 27A of the Securities Act and Section 21E of the Exchange Act. Although these forward-looking statements, which may include statements regarding our future results of operations, financial condition or business prospects, are based on our own information and information from other sources we believe to be reliable, you should not place undue reliance on these forward-looking statements, which apply only as of the date of this annual report. The words “anticipate,” “believe,” “estimate,” “expect,” “intend,” “plan” and similar expressions, as they relate to us, are intended to identify these forward-looking statements in this annual report. Our actual results of operations, financial condition or business prospects may differ materially from those expressed or implied in these forward-looking statements for a variety of reasons, including risks associated with cyclicality and market conditions in the semiconductor or electronics industry; changes in our regulatory environment, including our ability to comply with new or stricter environmental regulations and to resolve environmental liabilities; demand for the outsourced semiconductor packaging, testing and electronic manufacturing services we offer and for such outsourced services generally; the highly competitive semiconductor or manufacturing industry we are involved in; our ability to introduce new technologies in order to remain competitive; international business activities; our business strategy; our future expansion plans and capital expenditures; the uncertainties as to whether we can complete the acquisition of 100% of SPIL shares not otherwise owned by ASE; the strained relationship between the ROCR.O.C. and the PRC;P.R.C.; general economic and political conditions; the recent global economic crisis; possible disruptions in commercial activities caused by natural or human-induced disasters; fluctuations in foreign currency exchange rates; and other factors. For a discussion of these risks and other factors, see “Item 3. Key Information—Risk Factors.”
5
Item 1. Identity of Directors, Senior Management and Advisers
Not applicable.
Item 2. Offer Statistics and Expected Timetable
Not applicable.
The following tables present selected consolidated financial data for ASEH as of and for the year ended December 31, 2018, and ASE as of and for the years ended December 31, 2014, 2015, 2016 and 2017.
The selected consolidated statements of comprehensive income data and cash flow data for the years ended December 31, 2013, 20142016, 2017 and 2015,2018, and the selected consolidated balance sheet data as of December 31, 20142017 and 20152018 set forth below are derived from our audited consolidated financial statements included in this annual report and should be read in conjunction with, and are qualified in their entirety by reference to, these consolidated financial statements, including the notes thereto. The selected consolidated statements of comprehensive income data and cash flow data for the year ended December 31, 20122014 and 2015 and the selected consolidated balance sheet data as of December 31, 20122014, 2015 and 20132016 set forth below are derived from our audited consolidated financial statements not included herein.
Our consolidated financial statements have been prepared and presented in accordance with IFRS. Until and including our consolidated financial statements included in our annual report on Form 20-F for the year ended December 31, 2012, we prepared our consolidated financial statements in accordance with ROC GAAP with reconciliations to U.S. GAAP.
We adopted IFRS for certain filings with the SEC, starting from the filing of our annual report on Form 20-F for the year ended December 31, 2013. Historical financial results as of and for the year ended December 31, 2012 included herein have been adjusted and presented in accordance with IFRS, which differs from the results included in our annual report on Form 20-F for the year ended December 31, 2012. Meanwhile, as required by the FSC, we adopted Taiwan-IFRS for reporting of our annual and interim consolidated financial statements in the ROC beginning on January 1, 2013. Taiwan-IFRS differs from IFRS in certain respects, including, but not limited to the extent that any new or amended standards or interpretations applicable under IFRS may not be timely endorsed by the FSC. See “Item 3. Key Information—Risk Factors—Risks Relating to Our Business—Our adoption of new financial reporting standards, effective January 1, 2013, may have material impact on our financial statements thereafter” for more information.
Following our adoption of IFRS for SEC filing purposes, pursuant to the rule amendments adopted by the SEC that became effective on March 4, 2008, we were no longer required to reconcile our consolidated financial statements with U.S. GAAP. Historical selected
ASEH was formed pursuant to the consummation of the Share Exchange on April 30, 2018. ASE is ASEH’s predecessor entity; therefore, the financial and operational results of ASEH for periods before the Share Exchange were prepared under the assumption that ASEH owned 100% shareholdings of ASE. The related assets and liabilities in ASEH’s financial data, asbefore the date of andincorporation, was recognized based on the carrying amounts of those in ASE’s financial data. The financial data of ASEH for 2018 consists the year ended December 31, 2011 derived from our consolidated financial statements prepared in accordance with ROC GAAP have not been included below.results of:
| As of and for the Year Ended December 31, | ||||||||||||||||||||
| IFRS | 2012 | 2013 | 2014 | 2015 | ||||||||||||||||
| NT$ | NT$ | NT$ | NT$ | US$ | ||||||||||||||||
| (in millions, except earnings per share and per ADS data) | ||||||||||||||||||||
| Statement of Comprehensive Income Data: | ||||||||||||||||||||
| Operating revenues | 193,972.4 | 219,862.4 | 256,591.4 | 283,302.5 | 8,639.9 | |||||||||||||||
| Operating costs | (157,342.7 | ) | (177,040.4 | ) | (203,002.9 | ) | (233,167.3 | ) | (7,110.9 | ) | ||||||||||
| Gross profit | 36,629.7 | 42,822.0 | 53,588.5 | 50,135.2 | 1,529.0 | |||||||||||||||
| Operating expenses | (18,922.6 | ) | (20,760.4 | ) | (23,942.7 | ) | (25,250.6 | ) | (770.1 | ) | ||||||||||
| Other operating income and expenses, net | 83.2 | (1,348.2 | ) | 228.7 | (251.5 | ) | (7.6 | ) | ||||||||||||
| Profit from operations | 17,790.3 | 20,713.4 | 29,874.5 | 24,633.1 | 751.3 | |||||||||||||||
| Non-operating income (expense), net | (1,181.6 | ) | (1,343.6 | ) | (1,339.4 | ) | 660.1 | 20.1 | ||||||||||||
| · | ASE Technology Holding Co., Ltd. and SPIL for the period from April 30, 2018 through December 31, 2018; and |
| · | ASE, the predecessor entity of ASEH for the twelve months ended December 31, 2018. |
6
| As of and for the Year Ended December 31, | ||||||||||||||||||||
| IFRS | 2012 | 2013 | 2014 | 2015 | ||||||||||||||||
| NT$ | NT$ | NT$ | NT$ | US$ | ||||||||||||||||
| (in millions, except earnings per share and per ADS data) | ||||||||||||||||||||
| Profit before income tax | 16,608.7 | 19,369.8 | 28,535.1 | 25,293.2 | 771.4 | |||||||||||||||
| Income tax expense | (2,960.4 | ) | (3,499.6 | ) | (5,666.0 | ) | (4,311.1 | ) | (131.5 | ) | ||||||||||
| Profit for the year | 13,648.3 | 15,870.2 | 22,869.1 | 20,982.1 | 639.9 | |||||||||||||||
| Attributable to | ||||||||||||||||||||
| Owners of the Company | 13,191.6 | 15,404.5 | 22,228.6 | 20,013.5 | 610.4 | |||||||||||||||
| Non-controlling interests | 456.7 | 465.7 | 640.5 | 968.6 | 29.5 | |||||||||||||||
| 13,648.3 | 15,870.2 | 22,869.1 | 20,982.1 | 639.9 | ||||||||||||||||
| Other comprehensive income (loss), net of income tax | (3,830.7 | ) | 3,233.3 | 5,504.4 | (147.6 | ) | (4.5 | ) | ||||||||||||
| Total comprehensive income for the year | 9,817.6 | 19,103.5 | 28,373.5 | 20,834.5 | 635.4 | |||||||||||||||
| Attributable to | ||||||||||||||||||||
| Owners of the Company | 9,420.4 | 18,509.6 | 27,394.3 | 19,940.4 | 608.1 | |||||||||||||||
| Non-controlling interests | 397.2 | 593.9 | 979.2 | 894.1 | 27.3 | |||||||||||||||
| 9,817.6 | 19,103.5 | 28,373.5 | 20,834.5 | 635.4 | ||||||||||||||||
| Earnings per common share(1): | ||||||||||||||||||||
| Basic | 1.77 | 2.05 | 2.89 | 2.62 | 0.08 | |||||||||||||||
| Diluted | 1.73 | 1.99 | 2.79 | 2.51 | 0.08 | |||||||||||||||
| Dividends per common share(2) | 2.05 | 1.05 | 1.29 | 2.00 | 0.06 | |||||||||||||||
| Earnings per equivalent ADS(1): | ||||||||||||||||||||
| Basic | 8.86 | 10.26 | 14.46 | 13.08 | 0.40 | |||||||||||||||
| Diluted | 8.65 | 9.96 | 13.93 | 12.55 | 0.38 | |||||||||||||||
| Number of common shares(3): | ||||||||||||||||||||
| Basic | 7,445.5 | 7,508.5 | 7,687.9 | 7,652.8 | 7,652.8 | |||||||||||||||
| Diluted | 7,568.2 | 7,747.6 | 8,220.7 | 8,250.1 | 8,250.1 | |||||||||||||||
| Number of equivalent ADSs | ||||||||||||||||||||
| Basic | 1,489.1 | 1,501.7 | 1,537.6 | 1,530.6 | 1,530.6 | |||||||||||||||
| Diluted | 1,513.6 | 1,549.5 | 1,644.1 | 1,650.0 | 1,650.0 | |||||||||||||||
| Balance Sheet Data: | ||||||||||||||||||||
| Current assets | 97,495.6 | 132,176.5 | 159,955.2 | 156,732.8 | 4,779.9 | |||||||||||||||
| Investments - non-current(4) | 2,267.8 | 2,345.5 | 2,409.3 | 38,328.0 | 1,168.9 | |||||||||||||||
| Property, plant and equipment, net | 127,197.8 | 131,497.3 | 151,587.1 | 149,997.1 | 4,574.5 | |||||||||||||||
| Intangible assets | 12,361.3 | 11,953.6 | 11,913.3 | 11,888.6 | 362.6 | |||||||||||||||
| Long-term prepayment for lease | 4,164.1 | 4,072.3 | 2,586.0 | 2,556.2 | 77.9 | |||||||||||||||
| Others(5) | 4,236.0 | 4,676.9 | 5,267.9 | 5,765.5 | 175.8 | |||||||||||||||
| Total assets | 247,722.6 | 286,722.1 | 333,718.8 | 365,268.2 | 11,139.6 | |||||||||||||||
| Short-term debts(6) | 36,884.9 | 44,618.2 | 41,176.0 | 36,983.4 | 1,127.9 | |||||||||||||||
| Current portion of long-term debts | 3,213.8 | 6,016.5 | 2,835.5 | 16,843.3 | 513.7 | |||||||||||||||
| Long-term debts(7) | 44,591.7 | 50,166.5 | 55,375.8 | 66,535.1 | 2,029.1 | |||||||||||||||
| Other liabilities(8) | 53,211.8 | 60,176.9 | 78,640.1 | 78,700.1 | 2,400.1 | |||||||||||||||
| Total liabilities | 137,902.2 | 160,978.1 | 178,027.4 | 199,061.9 | 6,070.8 | |||||||||||||||
| Share capital | 76,047.7 | 78,180.3 | 78,715.2 | 79,185.7 | 2,414.9 | |||||||||||||||
| Non-controlling interests | 3,505.7 | 4,128.4 | 8,209.9 | 11,492.5 | 350.5 | |||||||||||||||
| Equity attributable to owners of the Company | 106,314.7 | 121,615.6 | 147,481.5 | 154,713.8 | 4,718.3 | |||||||||||||||
| Cash Flow Data: | ||||||||||||||||||||
| Capital expenditures | (39,029.5 | ) | (29,142.7 | ) | (39,599.0 | ) | (30,280.1 | ) | (923.5 | ) | ||||||||||
| Depreciation and amortization | 23,435.9 | 25,470.9 | 26,350.8 | 29,518.7 | 900.2 | |||||||||||||||
| Net cash inflow from operating activities | 33,038.0 | 41,296.0 | 45,863.5 | 57,548.3 | 1,755.1 | |||||||||||||||
| Net cash outflow from investing activities | (43,817.8 | ) | (29,925.8 | ) | (38,817.9 | ) | (63,351.4 | ) | (1,932.0 | ) | ||||||||||
| Net cash inflow (outflow) from financing activities | 8,455.8 | 12,794.9 | (2,797.0 | ) | 8,636.3 | 263.4 | ||||||||||||||
| As of and for the Year Ended December 31, | ||||||||||||||||||||||||
| IFRS | 2014 (Retrospectively Adjusted)(1) | 2015 (Retrospectively Adjusted)(1) | 2016 (Retrospectively Adjusted)(1) | 2017 (Retrospectively Adjusted)(1) | 2018(2) | |||||||||||||||||||
| NT$ | NT$ | NT$ | NT$ | NT$ | US$ | |||||||||||||||||||
| (in millions, except earnings per share and per ADS data) | ||||||||||||||||||||||||
| Statement of Comprehensive Income Data: | ||||||||||||||||||||||||
| Operating revenues | 256,591.4 | 283,302.5 | 274,884.1 | 290,441.2 | 371,092.4 | 12,123.2 | ||||||||||||||||||
| Operating costs | (203,002.9 | ) | (233,167.3 | ) | (221,696.9 | ) | (237,708.9 | ) | (309,929.4 | ) | (10,125.1 | ) | ||||||||||||
| Gross profit | 53,588.5 | 50,135.2 | 53,187.2 | 52,732.3 | 61,163.0 | 1,998.1 | ||||||||||||||||||
| Operating expenses | (23,942.7 | ) | (25,250.6 | ) | (26,526.8 | ) | (27,513.7 | ) | (34,515.3 | ) | (1,127.5 | ) | ||||||||||||
| Other operating income and expenses, net | 228.7 | (251.5 | ) | (800.3 | ) | 108.6 | 371.6 | 12.1 | ||||||||||||||||
| Profit from operations | 29,874.5 | 24,633.1 | 25,860.1 | 25,327.2 | 27,019.3 | 882.7 | ||||||||||||||||||
| Non-operating income (expense), net | (1,339.4 | ) | 378.7 | 2,108.6 | 5,693.5 | 4,918.4 | 160.7 | |||||||||||||||||
| Profit before income tax | 28,535.1 | 25,011.8 | 27,968.7 | 31,020.7 | 31,937.7 | 1,043.4 | ||||||||||||||||||
| Income tax expense | (5,666.0 | ) | (4,311.1 | ) | (5,390.8 | ) | (6,523.6 | ) | (4,513.4 | ) | (147.5 | ) | ||||||||||||
| Profit for the year | 22,869.1 | 20,700.7 | 22,577.9 | 24,497.1 | 27,424.3 | 895.9 | ||||||||||||||||||
| Attributable to | ||||||||||||||||||||||||
| Owners of the Company | 22,228.6 | 19,732.1 | 21,324.4 | 22,819.1 | 26,220.7 | 856.6 | ||||||||||||||||||
| Non-controlling interests | 640.5 | 968.6 | 1,253.5 | 1,678.0 | 1,203.6 | 39.3 | ||||||||||||||||||
| 22,869.1 | 20,700.7 | 22,577.9 | 24,497.1 | 27,424.3 | 895.9 | |||||||||||||||||||
| Other comprehensive income (loss), net of income tax | 5,504.4 | (147.5 | ) | (7,959.3 | ) | (4,637.9 | ) | (852.6 | ) | (27.8 | ) | |||||||||||||
| Total comprehensive income for the year | 28,373.5 | 20,553.2 | 14,618.6 | 19,859.2 | 26,571.7 | 868.1 | ||||||||||||||||||
| Attributable to | ||||||||||||||||||||||||
| Owners of the Company | 27,394.3 | 19,659.1 | 13,957.0 | 18,524.1 | 25,620.5 | 837.0 | ||||||||||||||||||
| Non-controlling interests | 979.2 | 894.1 | 661.6 | 1,335.1 | 951.2 | 31.1 | ||||||||||||||||||
| 28,373.5 | 20,553.2 | 14,618.6 | 19,859.2 | 26,571.7 | 868.1 | |||||||||||||||||||
| Earnings per common share(3) (4): | ||||||||||||||||||||||||
| Basic | 5.78 | 5.16 | 5.57 | 5.59 | 6.18 | 0.20 | ||||||||||||||||||
| Diluted | 5.57 | 4.95 | 4.66 | 5.19 | 6.07 | 0.20 | ||||||||||||||||||
| Dividends per common share(5) | 1.29 | 2.00 | 1.60 | 1.40 | 2.50 | 0.08 | ||||||||||||||||||
| Earnings per equivalent ADS(3) (4): | ||||||||||||||||||||||||
| Basic | 11.57 | 10.31 | 11.13 | 11.18 | 12.35 | 0.40 | ||||||||||||||||||
| Diluted | 11.14 | 9.90 | 9.31 | 10.38 | 12.14 | 0.40 | ||||||||||||||||||
| Number of common shares(3)(6): | ||||||||||||||||||||||||
| Basic | 3,844.0 | 3,826.4 | 3,831.4 | 4,080.4 | 4,245.2 | 138.7 | ||||||||||||||||||
| Diluted | 4,110.3 | 4,125.0 | 4,142.1 | 4,184.6 | 4,251.1 | 138.9 | ||||||||||||||||||
| Number of equivalent ADSs(3) | ||||||||||||||||||||||||
| Basic | 1,922.0 | 1,913.2 | 1,915.7 | 2,040.2 | 2,122.6 | 69.3 | ||||||||||||||||||
| Diluted | 2,055.2 | 2,062.5 | 2,071.0 | 2,092.3 | 2,125.6 | 69.4 | ||||||||||||||||||
| Balance Sheet Data: | ||||||||||||||||||||||||
| Current assets | 159,955.2 | 156,732.8 | 142,789.7 | 144,938.3 | 201,558.9 | 6,584.7 | ||||||||||||||||||
| Investments - non-current(7) | 2,409.3 | 38,046.6 | 50,853.0 | 49,876.8 | 11,545.9 | 377.2 | ||||||||||||||||||
| Property, plant and equipment | 151,587.1 | 149,997.1 | 143,880.2 | 135,168.4 | 214,592.6 | 7,010.5 | ||||||||||||||||||
| Intangible assets | 11,913.3 | 11,888.6 | 12,107.6 | 11,341.4 | 80,872.1 | 2,642.0 | ||||||||||||||||||
| Long-term prepayments for lease | 2,586.0 | 2,556.2 | 2,237.0 | 8,851.3 | 10,764.8 | 351.7 | ||||||||||||||||||
| Others(8) | 5,267.9 | 5,765.6 | 6,063.1 | 13,746.1 | 14,727.6 | 481.2 | ||||||||||||||||||
| Total assets | 333,718.8 | 364,986.9 | 357,930.6 | 363,922.3 | 534,061.9 | 17,447.3 | ||||||||||||||||||
| Short-term debts(9) | 41,176.0 | 36,983.4 | 20,955.5 | 17,962.5 | 43,263.5 | 1,413.4 | ||||||||||||||||||
| Current portion of long-term debts(10) | 2,835.5 | 16,843.3 | 16,341.1 | 14,441.3 | 10,796.2 | 352.7 | ||||||||||||||||||
| Long-term debts(11) | 55,375.8 | 66,535.1 | 74,354.9 | 44,501.5 | 144,336.9 | 4,715.3 | ||||||||||||||||||
| Other liabilities(12) | 78,640.1 | 78,700.1 | 79,437.9 | 85,706.8 | 116,637.4 | 3,810.5 | ||||||||||||||||||
| Total liabilities | 178,027.4 | 199,061.9 | 191,089.4 | 162,612.1 | 315,034.0 | 10,291.9 | ||||||||||||||||||
| Share capital | 78,715.2 | 79,185.7 | 79,568.0 | 87,380.8 | 43,217.1 | 1,411.9 | ||||||||||||||||||
| Non-controlling interests | 8,209.9 | 11,492.5 | 12,000.6 | 13,190.1 | 17,639.5 | 576.2 | ||||||||||||||||||
7
| As of and for the Year Ended December 31, | ||||||||||||||||||||
| IFRS | 2012 | 2013 | 2014 | 2015 | ||||||||||||||||
| NT$ | NT$ | NT$ | NT$ | US$ | ||||||||||||||||
| (in millions, except earnings per share and per ADS data) | ||||||||||||||||||||
| Segment Data: | ||||||||||||||||||||
| Operating revenues: | ||||||||||||||||||||
| Packaging | 104,298.3 | 112,603.9 | 121,336.5 | 116,607.3 | 3,556.2 | |||||||||||||||
| Testing | 22,657.0 | 24,732.2 | 25,874.7 | 25,191.9 | 768.3 | |||||||||||||||
| Electronic manufacturing services | 62,747.7 | 78,530.6 | 105,784.4 | 138,242.1 | 4,216.0 | |||||||||||||||
| Others | 4,269.4 | 3,995.7 | 3,595.8 | 3,261.2 | 99.4 | |||||||||||||||
| Gross profit: | ||||||||||||||||||||
| Packaging | 19,812.5 | 23,673.7 | 33,040.2 | 30,348.5 | 925.5 | |||||||||||||||
| Testing | 7,601.0 | 9,079.4 | 9,632.0 | 9,025.7 | 275.3 | |||||||||||||||
| Electronic manufacturing services | 7,241.3 | 8,054.3 | 9,118.9 | 9,433.4 | 287.7 | |||||||||||||||
| Others | 1,974.9 | 2,014.6 | 1,797.4 | 1,327.6 | 40.5 | |||||||||||||||
__________________
| As of and for the Year Ended December 31, | ||||||||||||||||||||||||
| IFRS | 2014 (Retrospectively Adjusted)(1) | 2015 (Retrospectively Adjusted)(1) | 2016 (Retrospectively Adjusted)(1) | 2017 (Retrospectively Adjusted)(1) | 2018(2) | |||||||||||||||||||
| NT$ | NT$ | NT$ | NT$ | NT$ | US$ | |||||||||||||||||||
| (in millions, except earnings per share and per ADS data) | ||||||||||||||||||||||||
| Equity attributable to owners of the Company | 147,481.5 | 154,432.4 | 154,840.6 | 188,120.1 | 201,388.4 | 6,579.2 | ||||||||||||||||||
| Cash Flow Data: | ||||||||||||||||||||||||
| Capital expenditures | (39,599.0 | ) | (30,280.1 | ) | (26,714.2 | ) | (24,699.2 | ) | (41,386.4 | ) | (1,352.1 | ) | ||||||||||||
| Depreciation and amortization | 26,350.8 | 29,518.7 | 29,470.4 | 29,205.2 | 42,688.9 | 1,394.6 | ||||||||||||||||||
| Net cash inflow from operating activities | 45,863.5 | 57,548.3 | 52,107.9 | 47,430.8 | 51,074.7 | 1,668.6 | ||||||||||||||||||
| Net cash outflow from investing activities | (38,817.9 | ) | (63,351.4 | ) | (43,159.5 | ) | (16,086.2 | ) | (129,542.3 | ) | (4,232.0 | ) | ||||||||||||
| Net cash inflow (outflow) from financing activities | (2,797.0 | ) | 8,636.3 | (21,087.0 | ) | (19,323.4 | ) | 83,111.4 | 2,715.2 | |||||||||||||||
| Segment Data: | ||||||||||||||||||||||||
| Operating revenues: | ||||||||||||||||||||||||
| Packaging | 121,336.5 | 116,607.3 | 125,282.8 | 126,225.1 | 178,308.2 | 5,825.2 | ||||||||||||||||||
| Testing | 25,874.7 | 25,191.9 | 27,031.8 | 26,157.3 | 35,903.2 | 1,172.9 | ||||||||||||||||||
| Electronic manufacturing services | 105,784.4 | 138,242.1 | 115,395.1 | 133,948.0 | 151,890.4 | 4,962.1 | ||||||||||||||||||
| Others | 3,595.8 | 3,261.2 | 7,174.4 | 4,110.8 | 4,990.6 | 163.0 | ||||||||||||||||||
| Gross profit: | ||||||||||||||||||||||||
| Packaging | 33,040.2 | 30,348.5 | 28,524.6 | 28,785.3 | 33,669.0 | 1,099.9 | ||||||||||||||||||
| Testing | 9,632.0 | 9,025.7 | 9,980.6 | 9,303.6 | 12,289.5 | 401.5 | ||||||||||||||||||
| Electronic manufacturing services | 9,118.9 | 9,433.4 | 11,234.8 | 13,562.5 | 14,278.8 | 466.5 | ||||||||||||||||||
| Others | 1,797.4 | 1,327.6 | 3,447.3 | 1,080.9 | 925.7 | 30.2 | ||||||||||||||||||
| (1) | Financial data for ASE, except for earnings per common share, earnings per equivalent ADS, number of common shares and number of equivalent ADSs which have been retrospectively adjusted to reflect share exchange ratio stated in the Joint Share Exchange Agreement for the years ended December 31, 2014, 2015, 2016 and 2017. For details about the Joint Share Exchange Agreement, see “Item 10. Additional information—Material Contract.” |
| (2) | Financial data for ASEH are derived from the results of: (a) ASE Technology Holding Co., Ltd. and SPIL for the period from April 30, 2018 through December 31, 2018; and (b) ASE, the predecessor entity of ASEH, for the twelve months ended December 31, 2018. |
| (3) | We retrospectively adjusted the earnings per common share, earnings per equivalent ADS, number of common shares and number of equivalent ADSs in accordance with share exchange ratio stated in the Joint Share Exchange Agreement for the years ended December 31, 2014, 2015, 2016 and 2017, which differ from the results included in our annual reports on Form 20-F for the years ended December 31, 2014, 2015, 2016 and 2017. For details about the Joint Share Exchange Agreement, see “Item 10. Additional information—Material Contract.” |
| (4) | The denominators for diluted earnings per common share and diluted earnings per equivalent ADS are calculated to account for the potential diluted factors, such as employees’ compensation, the exercise of options and conversion of our convertible bonds into our common shares. |
| Dividends per common share issued as a cash dividend, a stock dividend and distribution from capital surplus. |
| Represents the weighted average number of shares after retroactive adjustments to give effect to stock |
| Including available-for-sale financial assets — non-current and investments accounted for using the equity method for the years ended December 31, 2014, 2015, 2016 and 2017. Starting from 2018, upon initial application of IFRS 9 “Financial Instruments” (“IFRS 9”), the category includes financial assets at fair value through profit or loss — non-current, financial assets at fair value through other comprehensive income — non-current and investments accounted for using the equity method. See note 3 to our consolidated financial statements included herein for further information regarding the initial application of IFRS 9. |
| Including investment properties, deferred tax assets, other financial assets — non-current and other non-current assets. |
8
| Including short-term bank loans and short-term bills payable. |
| Including current portion of long-term borrowings and current portion of capital lease obligations. |
| (11) | Including bonds payable, long-term borrowings (consisted of bank loans and bills payable) and capital lease obligations. |
| Including (x) current liabilities other than short-term debts and current portion of long-term debts and (y) non-current liabilities other than long-term debts. |
Exchange Rates
Fluctuations in the exchange rate between NT dollars and U.S. dollars will affect the U.S. dollar equivalent of the NT dollar price of our common shares on the Taiwan Stock ExchangeTWSE and, as a result, will likely affect the market price of the ADSs. Fluctuations will also affect the U.S. dollar conversion by the depositary under our ADS deposit agreement referred to below of cash dividends paid in NT dollars on, and the NT dollar proceeds received by the depositary from any sale of, common shares represented by ADSs, in each case, according to the terms of the deposit agreement dated September 29, 2000 and as amended and supplemented from time to time among us, Citibank N.A., as depositary, and the holders and beneficial owners from time to time of the ADSs, which we refer to as the deposit agreement.
The following table sets forth, for the periods indicated, information concerning the number of NT dollars for which one U.S. dollar could be exchanged. The exchange rates reflect the exchange rates set forth in the H.10 statistical release of the Federal Reserve Board.
| Exchange Rate | ||||||||||||||||
Average(1) | High | Low | Period End | |||||||||||||
| 2011 | 29.42 | 30.67 | 28.50 | 30.27 | ||||||||||||
| 2012 | 29.47 | 30.28 | 28.96 | 29.05 | ||||||||||||
| 2013 | 29.73 | 30.20 | 28.93 | 29.83 | ||||||||||||
| 2014 | 30.38 | 31.80 | 29.85 | 31.60 | ||||||||||||
| 2015 | 31.80 | 33.17 | 30.37 | 32.79 | ||||||||||||
| October | 32.44 | 32.81 | 31.92 | 32.46 | ||||||||||||
| November | 32.61 | 32.87 | 32.43 | 32.53 | ||||||||||||
| December | 32.79 | 33.01 | 32.53 | 32.79 | ||||||||||||
| 2016 | ||||||||||||||||
| January | 33.43 | 33.74 | 33.14 | 33.43 | ||||||||||||
| February | 33.24 | 33.51 | 32.95 | 33.22 | ||||||||||||
| March | 32.59 | 33.09 | 32.16 | 32.18 | ||||||||||||
| April (through April 22, 2016) | 32.33 | 32.44 | 32.11 | 32.36 | ||||||||||||
_________________
On April 22, 2016, the exchange rate as set forth in the H.10 weekly statistical release by the Federal Reserve Board was NT$32.36=US$1.00.
8
CAPITALIZATION AND INDEBTEDNESS
Not applicable.
REASON FOR THE OFFER AND USE OF PROCEEDS
Not applicable.
Risks Relating to the SPIL Acquisition
Due to the SPIL Acquisition, our financial and operational results for 2018 may not be comparable with prior periods
ASEH was formed pursuant to the consummation of the Share Exchange on April 30, 2018. ASE is ASEH’s predecessor entity; therefore, the financial and operational results of ASEH for periods before the Share Exchange were prepared under the assumption that ASEH owned 100% shareholdings of ASE. The financial and operational results before April 30, 2018 reflect the business operations of ASE prior to the establishment of ASEH. The financial and operational results for the second quarter of 2018 reflect the business operations of ASE starting from April 1, 2018 and the business operations of ASEH starting from April 30, 2018. The financial and operational results after April 30, 2018, including third quarter and fourth quarter of 2018, reflect the combined operations after the SPIL Acquisition. Therefore, the financial and operational results of these quarters may not be comparable and the consolidated financial information for periods after the SPIL Acquisition may not be comparable with the consolidated financial information for the prior periods. In addition, the audited consolidated financial statements for the year ended December 31, 2018 may not be comparable to that of the prior years.
There may be risks associated with our current holding company structure.
We entered into the Joint Share Exchange Agreement with SPIL in June 2016, pursuant to which ASEH, a holding company in Taiwan, holds 100% of the equity interests in both ASE and SPIL such that ASE and SPIL became wholly owned subsidiaries of ASEH. Other than the aforementioned change in corporate structure, ASE and SPIL maintained independent operations as each did before the consummation of the SPIL Acquisition. The common shares of ASE and SPIL were delisted from the TWSE. The ADSs of ASE and SPIL were delisted from NYSE and NASDAQ, respectively, and became eligible for deregistration under the Exchange Act. Subsequently, the common shares of ASEH were listed on the TWSE, and the ADSs of ASEH were listed on the NYSE. The implementation of such corporate structure restructuring plan may result in contingent risks, including increase in tax liabilities or trading discounts relating to a holding company discount that may become apparent in the future. For details about the Joint Share Exchange Agreement, see “Item 10. Additional Information—Material Contract.”
9
The SAMR Anti-Monopoly Bureau may ultimately take unfavorable actions against us even if we fully comply with the 24 months Hold-Separate conditions.
On November 24, 2017, we received approval from the Ministry of Commerce of the People’s Republic of China (“MOFCOM”) for the Share Exchange under the condition that ASE and SPIL maintain independent operations, among other conditions, for 24 months (“Hold-Separate conditions”). On April 10, 2018, the Anti-Monopoly Bureau under the newly-formed State Administration for Market Regulation (“SAMR”) assumed MOFCOM’s responsibility for antitrust enforcement and continues to monitor our compliance with relevant antitrust laws. While we abide by the Hold-Separate conditions, the Anti-Monopoly Bureau has the authority to and may further impose more restrictive conditions without advance notice.
In the event that the Hold-Separate conditions cannot be satisfied, we may re-evaluate our interest in SPIL and may consider, among other legally permissible alternatives, to dispose our SPIL shares at a loss, which may significantly affect our financial position. If we receive more restrictive antitrust related conditions from the Anti-Monopoly Bureau, we may face greater difficulties in successfully integrating SPIL into our existing organization or in realizing anticipated benefits and cost synergies afterwards. Each of these risks could have a material adverse effect on our business and operations, including our relationship with customers, suppliers, employees and other constituencies, or otherwise adversely affect our financial condition and results of operations.
Risks Relating to Our Business
Since we are dependent on the highly cyclical semiconductor and electronics industries and conditions in the markets for the end-use applications of our products, our revenues and net income may fluctuate significantly.
Our business is affected by market conditions in the highly cyclical semiconductor and electronics industries. Most of our customers operate in this industry, and variations in order levels from our customers and service fee rates may result in volatility in our revenues and net income. From time to time, the semiconductor and electronics industries have experienced significant, and sometimes prolonged, downturns. As our business is, and will continue to be, dependent on the requirements for independent packaging, testing and electronic manufacturing services, any future downturn in the industry would reduce demand for our services. For example, in the fourth quarter of 2008, the global economic crisis resulted in a significant deterioration in demand for our customers’ products, which in turn affected demand for our services and adversely affected our operating results. Although demand has recovered, we expect there to be continued downward pressure on our average selling prices and continued volatility with respect to our sales volumes in the future. If we cannot reduce our costs or adjust our product mix to sufficiently offset any decline in sales volumes, our profitability will suffer, and we may incur losses.
Market conditions in the semiconductor and electronics industries depend to a large degree on conditions in the markets for the end-use applications of various products, such as communications, computing and consumer electronics products. Any deterioration of conditions in the markets for the end-use applications would reduce demand for our services, and would likely have a material adverse effect on our financial condition and results of operations. In 2015,2018, approximately 54.7%49.9%, 11.1%14.0% and 34.2%36.1% of our operating revenues from packaging and testing were attributed to the packaging and testing of semiconductors used in communications, computing and consumer electronics/industrial/automotive/other applications, respectively. In the same year, approximately 53.2%35.7%, 14.3%14.2%, 18.7%34.3%, 8.1%10.0% and 4.9%5.8% of our operating revenues from electronic manufacturing services were attributed to the communications, computing,computers and storage, consumer electronics applications, industrial and automotive applications, respectively. Across end-use applications, our customers face intense competition and significant shifts in demand, which could put pricing pressure on our services and may adversely affect our revenues and net income.
10
A reversal or slowdown in the outsourcing trend for semiconductor packaging and testing services and electronic manufacturing services could adversely affect our growth prospects and profitability.
Semiconductor manufacturers that have their own in-house packaging and testing capabilities, known as integrated device manufacturers and original equipment manufacturers, have increasingly outsourced stages of the production process, including packaging, testing, electronic manufacturing and assembly, to independent companies in order to reduce costs, eliminate product complexity and meet fast-to-market requirements. In addition, the availability of advanced independent semiconductor manufacturing services has also enabled the growth of so-called “fabless” semiconductor companies that focus exclusively on design and marketing and outsource their manufacturing, packaging and testing requirements to independent companies. We cannot assure you that these manufacturers and companies will continue to outsource their packaging, testing and manufacturing requirements to third parties like us. Furthermore, during an economic downturn, these integrated device manufacturers typically rely more on their own in-house packaging and testing capabilities, therefore decreasing their need to outsource. A reversal of, or a slowdown in, this outsourcing trend could result in reduced demand for our services and adversely affect our growth prospects and profitability.
9
Any global economic downturn could adversely affect the demand for our products and services, and a protracted global economic crisis would have a material adverse effect on us.
The global financial markets experienced significant disruptions in 2008 and the United States, Europe and other economies went into recession. The recovery from the lows of 2008 and 2009 was uneven and it is facing new challenges, including a European sovereign debt crisis that began in 2011, a referendum in the United Kingdom in June 2016, in which the majority of voters voted in favor of an exit from the European Union (“Brexit”), and continuing high unemployment rates in much of the world. It is unclear what the long-term impact of the European sovereign debt crisis will be and uncertainty remains over the long-term effects of the expansionary monetary and fiscal policies that have been adopted by the central banks and financial authorities of some of the world’s leading economies. There are also increased uncertainty in the wake of Brexit, which has resulted in downgrade of the credit ratings of the United Kingdom and an increase in volatility in the global financial markets. Any economic downturn or crisis may cause our customers to do the following:
| · | cancel or reduce planned expenditures for our products and services; |
| · | seek to lower their costs by renegotiating their contracts with us; |
| · | consolidate the number of suppliers they use, which may result in our loss of customers; and |
| · | switch to lower-priced products or services provided by our competitors. |
Any uncertainty or significant volatility in global economic conditions may also make it difficult for our customers to accurately forecast and plan future business activities and may have a material adverse effect on us.
If we are unable to compete favorably in the highly competitive markets of semiconductor packaging and testing and electronic manufacturing services, our revenues and net income may decrease.
The markets of semiconductor packaging and testing and electronic manufacturing services are very competitive. We face competition from a number of sources, including other independent semiconductor packaging and testing companies, integrated device manufacturers, and other electronic manufacturing services providers with large-scale manufacturing capabilities who can quickly react to market changes. We believe that the principal competitive factors in our industry are:
| · | technological expertise; |
| · | the ability to provide total solutions to our customers, including integrated design, manufacturing, packaging and testing and electronic manufacturing services; |
| · | ability to offer interconnect technologies at an optimal scale for our businesses; |
11
| · | range of package types and testing platforms available; |
| · | the ability to work closely with our customers at the product development stage; |
| · | responsiveness and flexibility; |
| · | fast-to-market product development; |
| · | capacity; |
| · | diversity in facility locations; |
| · | production yield; and |
10
| · | price. |
We face increasing competition, as most of our customers obtain services from more than one source. Rapid technological advances and aggressive pricing strategies by our competitors may continue to increase competition. Our ability to compete depends on factors both within and outside of our control and may be constrained by the distinct characteristics and production requirements of individual products. We cannot assure you that we will be able to continue to improve production efficiency and maintain reasonable profit for all of our products.
In addition, some of our competitors may have superior financial, marketing, manufacturing, research and development and technological resources than we do. For example, the central government of the PRCP.R.C. as well as provincial and municipal governments have provided various incentives to domestic companies in the semiconductor industry, including major semiconductor testing and packaging providers, such as Jiangsu Changjiang Electronics Technology Co., Ltd. Similarly, our customers may face competition from their competitors in the PRC,P.R.C., and such competitors may also receive significant subsidies from the PRCP.R.C. government. As we are downstream suppliers, the impact of such government policies on competition and price pressure of our customers may negatively impact our own business. Increasing competition may lead to declines in product prices and profitability and could have a material adverse effect on our business, financial condition, results of operations and future prospects.
Our profitability depends on our ability to respond to rapid technological changes in the semiconductor industry.
The semiconductor industry is characterized by rapid increases in the diversity and complexity of semiconductors. As a result, we expect that we will need to constantly offer more sophisticated packaging and testing technologies and processes in order to respond to competitive industry conditions and customer requirements. We have successfully combined our packaging, testing and materials technologies with the expertise of electronic manufacturing services at the systems level to develop our SiP business. SuccessWe also entered into multiple technology license agreements with DECA Technologies Inc. to advance our fan-out technology. There is, however, no assurance that our development efforts for our SiP business or the use of alicensed technology to further advance our fan-out technology will be successful.
Additionally, in August 2018, we resolved to sell our 30.0% equity interest of ASEN to Tsinghua Unigroup Ltd.. We believe the strategic relationship with Tsinghua Unigroup Ltd. will allow us to expand our opportunities in the P.R.C.’s fast-growing semiconductor market. Although we expect this strategic relationship will expand our opportunities in the semiconductor market, we cannot assure you that this relationship will be productive or lead to sustainable commercial success. We continue to develop new product depends on a number of factors such as product acceptance by the market. New products are developed in anticipation of future demand. We cannot assure youHowever, there is no assurance that the launch of any new product will be successful or that whether we will be able to produce sufficient quantities of these products to meet market demand. If we fail to develop, or obtain access to, advances in packaging or testing technologies or processes, we may become less competitive and less profitable. In addition, advances in technology typically lead to declining average selling prices for semiconductors packaged or tested with older technologies or processes. As a result, if we cannot reduce the costs associated with our services, the profitability of a given service and our overall profitability may decrease over time.
12
Our operating results are subject to significant fluctuations, which could adversely affect the market value of your investment.
Our operating results have varied significantly from period to period and may continue to vary in the future. Downward fluctuations in our operating results may result in decreases in the market price of our common shares and the ADSs. Among the more important factors affecting our quarterly and annual operating results are the following:
| · | changes in general economic and business conditions, particularly the cyclical nature of the semiconductor and electronics industries and the markets served by our customers; |
| · | our ability to quickly adjust to unanticipated declines or shortfalls in demand and market prices; |
| · | changes in prices for our products or services; |
| · | volume of orders relative to our packaging, testing and manufacturing capacity; |
| · | changes in costs and availability of raw materials, equipment and labor; |
| · | our ability to obtain or develop substitute raw materials with lower cost; |
| · | our ability to successfully develop or market new products or services; |
11
| · | our ability to successfully manage product mix in response to changes in market demand and differences in margin associated with different products; |
| · | timing of capital expenditures in anticipation of future orders; |
| · | our ability to acquire or design and produce cost-competitive interconnect materials, and provide integrated solutions for electronic manufacturing services; |
| · | fluctuations in the exchange rate between the NT dollar or RMB and foreign currencies, especially the U.S. dollar; and |
| · | typhoons, earthquakes, drought, epidemics, tsunami and other natural disasters, as well as industrial and other incidents such as fires and power outages. |
Due to the factors listed above, our future operating results or growth rates may be below the expectations of research analysts and investors. If so, the market price of our common shares and the ADSs, and thus the market value of your investment, may fall.
Due to our high percentage of fixed costs, we may be unable to maintain our gross margin at past levels if we are unable to achieve relatively high capacity utilization rates.
Our operations, in particular our testing operations, are characterized by relatively high fixed costs. We expect to continue to incur substantial depreciation and other expenses in connection with our acquisitions of equipment and facilities. Our profitability depends not only on the pricing levels for our services or products, but also on utilization rates for our machinery and equipment, commonly referred to as “capacity utilization rates.” In particular, increases or decreases in our capacity utilization rates can significantly affect gross margins since the unit cost generally decreases as fixed costs are allocated over a larger number of units. In periods of low demand, we experience relatively low capacity utilization rates in our operations, which leads to reduced margins. For example, in the fourth quarter of 2008, we experienced lower than anticipated utilization rates in our operations due to a significant decline in worldwide demand for our packaging and testing services, which resulted in reduced margins during that period. Although capacity utilization rates have recovered since 2009, we cannot assure you that we will be able to maintain or surpass our past gross margin levels if we cannot consistently achieve or maintain relatively high capacity utilization rates.
13
If we are unable to manage our expansion or investments effectively, our growth prospects may be limited and our future profitability and core business operations may be adversely affected.
We have significantly expanded our operations through both organic growthacquisitions and acquisitionsjoint ventures in recent years. For example,In 2010, we acquired the controlling interest of Universal Scientific in 2010Industrial to expand our product offering scope to electronic manufacturing services;services. In May 2015, we also entered into a joint venture agreement with TDK Corporation in May 2015 to further expand our business in embedded substrates. WeIn June 2016, we entered into the Joint Share Exchange Agreement with SPIL to take advantage of the synergy effect of business combination between SPIL and ASE. In February 2018, we entered into a joint venture agreement with Qualcomm Incorporated to expand our SiP business. In August 2018, to advance our global supply system and expand our commercial reach in Europe, we entered into an equity transfer agreement with Chung Hong Electronics (Suzhou) Co., Ltd. to acquire its 60.0% equity in its Polish subsidiary Chung Hong Electronics Poland SP.Z.O.O. In August 2018, we also entered into a joint venture framework contract and shareholder agreement with Cancon Information Industry Co., Ltd. to align corporate resources and advance our position in the field of secure and controllable high-performance server products. In October 2018, we entered into a share capital and reserves increase agreement with Jinhua Integrated Circuit Co., Ltd. to jointly invest in Siliconware Electronics (Fujian) Co., Limited to form a strategic alliance to secure stable orders; this agreement however has been paused and will not be continued in the foreseeable future. In January 2019, we entered into a project investment agreement with China Merchants Group of Huizhou Daya Bay Economic and Technological Development Zone of Guangdong Province, to set up a wholly-owned subsidiary in Huizhou Daya Bay Economic and Technological Development Zone to address the growing needs of our capacity expansion and the development of our business in South China.
While we expect that we will continue to expand our operations in the future. The purpose of our expansion is mainlyfuture to provide total solutions to existing customers or to attract new customers and broaden our product range for a variety of end-use applications. However,offerings, rapid expansion may place a strain on our managerial, technical, financial, operational and other resources. As a result of our expansion, we have implemented and will continue to implement additional operational and financial controls and hire and train additional personnel. Any failure to manage our growth effectively could lead to inefficiencies and redundancies and result in reduced growth prospects and profitability.
In addition, we have recently made several investments in the real estate development businesses mostly in China. The PRCP.R.C. property market is volatile and may experience undersupply or oversupply and property price fluctuations. The central and local governments frequently adjust monetary and other fiscal policies to prevent and curtail the overheating of the economy. Such policies may lead to changes in market conditions, including price instability and imbalance of supply and demand in respect of office, residential, retail, entertainment, cultural and intellectual properties. We may continue to make investments in this area in the future and our diversification in this industry may put pressure on our managerial, financial, operational and other resources. Our exposure to risks related to real estate development may also increase over time as a result of our expansion into such a business. There can be no assurance that our investments in such a business will yield the anticipated returns and that our expansion into such a business, including the resulting diversion of management’s attention, will not adversely affect our core business operations.
12
We may not be successful in pursuing mergers and acquisitions. Any mergers or acquisitions we make may lead to a diversion of management resources.
Our future success may depend on acquiring businesses and technologies, making investments or forming joint ventures that complement, enhance or expand our current product offerings or otherwise offer us growth opportunities. In pursuing such acquisitions, we may face competition from other companies in the semiconductor industry. Our ability to acquire or invest in suitable targets may be limited by applicable laws and regulations in Taiwan,the R.O.C., P.R.C., the United States and other jurisdictions where we do business. Even if we are successful in making such acquisitions or investments, we may have to expend substantial amounts of cash, incur debt, assume loss-making divisions and incur other types of expenses. We may also face challenges in successfully integrating any acquired companies into our existing organization or in creating the anticipated cost synergies.synergistic benefits. Each of these risks could have a material adverse effect on our business, financial condition and results of operations.
14
The financial performance of our equity method investments could adversely affect our results of operations.
As part of our business strategy, we have and may continue to pursue acquisitions of businesses and assets, strategic alliances and joint ventures. We currently have equity investments in certain entities and the accounting treatment applied for these investments varies depending on a number of factors, including, but not limited to, our percentage ownership and the level of influence or control we have over the relevant entity. Any losses experienced by these entities could adversely affect our results of operations and the value of our investment. In addition, if these entities were to fail and cease operations, we may lose the entire value of our investment and the stream of any shared profits.
For example, on September 22, 2015, upon the expiration of the Initial SPIL Tender Offer period, we acquired 779,000,000 common shares (including those represented by American depositary shares) of SPIL through the Initial SPIL Tender Offer. We subsequently acquired an additional 258,300,000 common shares of SPIL (including those represented by American depositary shares) through open market purchases in March and April 2016. As of April 28, 2016, we beneficially own 1,037,300,000 common shares of SPIL (calculated as the sum of 935,596,800 common shares of SPIL and 101,703,200 common shares of SPIL underlying 20,340,640 American depositary shares of SPIL), representing 33.29% of the issued and outstanding share capital of SPIL (calculated based on 3,116,361,139 common shares of SPIL (including those represented by American depositary shares) outstanding as of March 31, 2016 as reported in SPIL’s annual report on Form 20-F for the year ended December 31, 2015). See “Item 4. Information on the Company— History and Development of the Company—Acquisition of Common Shares and American Depositary Shares of SPIL.” Although we are currently a 33.29% shareholder of SPIL, we currently do not control SPIL and do not have the power to direct SPIL or its management. As the investment in SPIL is accounted for by the equity method, to the extent that SPIL has net losses, our financial results will be adversely affected to the extent of our pro rata portion of these losses. In addition, as we currently do not control SPIL and do not have the power to direct SPIL or its management, we do not have access to SPIL’s books and records and may not be able to obtain SPIL’s financial information on a timely basis. SPIL’s reporting time for its financial statements may affect our ability to timely report our own financial statements or meet scheduled announcements for earnings releases.
There can be no assurance that we will be able to maintain or enhance the value or performance of our investee companies including SPIL, or that we will achieve the returns or benefits sought from such investments. If our interests differ from those of other investors in our investee companies, we may not be able to enjoy synergies with the investee and it may adversely affect our financial results or financial condition.
We maydid not be successfulrecognize impairment loss in 2016 and 2017 in our acquisitioninvestment using the equity method of 100%accounting. In 2018, we evaluated the recoverable amount of SPIL shares not otherwise ownedour equity method investments, Deca Technologies Inc., by us.
On September 22, 2015, upon the expirationpresent value of the Initial SPIL Tender Offer period,cash flow projection made by equity method investment’s management with a discount rate of 14.1%. The recoverable amount was lower than its carrying amount, therefore, we acquired 779,000,000 common shares (including those represented by American depositary shares)recognized impairment charges of SPIL through the Initial SPIL Tender Offer. In December 2015, following an announcement by SPIL that it plans to issue 1,033NT$521.0 million shares, if approved by SPIL shareholders, to a third party pursuant to a share placement agreement, we submitted a written proposal to SPIL’s Board proposing to acquire all SPIL shares not otherwise owned by ASE, contingent upon the termination of the share purchase agreement, and later launched the Second SPIL Tender Offer on December 29, 2015 to offer to purchase up to 770,000,000 common shares of SPIL (including those represented by American depositary shares). On March 17, 2016, we announced that the Second SPIL Tender Offer was unsuccessful because the Taiwan Fair Trade Commission (the “TFTC”) did not render its decision before the expiration of the Second SPIL Tender Offer. The TFTC subsequently suspended its review on March 23, 2016. Notwithstanding the failure of the Second SPIL Tender Offer, we announced that we will continue to seek to obtain control of SPIL, with the purpose of effecting an acquisition of 100% of the common shares and American depositary shares of SPIL not owned by us (“SPIL Merger”)(US$17.0 million). See “Item 4. Information on the Company— History5. Operating and DevelopmentFinancial Review and Prospects—Operating Results and Trend Information—Critical Accounting Policies and Estimates—Valuation of the Company—Acquisition of Common Shares and American Depositary Shares of SPIL.Investments.”
13
The successful consummation of the SPIL Merger is subject to a number of factors, including, among other things, obtaining all necessary antitrust or other regulatory approvals in Taiwan, the United States and other jurisdictions where we do business. In the event these conditions cannot be satisfied, we may re-evaluate our interest in SPIL and may consider, among other legally permissible alternatives, to dispose our SPIL shares at a loss, which may significantly affect our financial position. In addition, the interest we acquired in SPIL from the Initial SPIL Tender Offer is currently being reviewed by the ROC court. See “Item 8. Financial Information—Consolidated Statements and Other Financial Information—Legal Proceedings” for more information. If a dismissal is not granted or a settlement is not reached, such a lawsuit could result in substantial costs to ASE and divert management’s attention and resources, which may cause a material adverse effect on our results of operations, financial condition and business. We are also unable to quantify the harm to our reputation should any adverse findings be made against us. If our interest in SPIL from the Initial Tender Offer is voided by ROC courts, we may not realize the anticipated synergies, cost savings and benefits and growth opportunities that would otherwise have resulted from our acquisition of 779,000,000 common shares of SPIL.
Notwithstanding the above, even if we are successful in consummating the SPIL Merger, we may face challenges in successfully integrating SPIL into our existing organization or in realizing anticipated benefits and cost synergies. Each of these risks could have a material adverse effect on our business and operations, including our relationship with customers, suppliers, employees and other constituencies, or otherwise adversely affect our financial condition and results of operations.
There may be risks associated with the proposed holding company structure.
We announced in March 2016 that upon the successful completion of the SPIL Merger, we plan to establish a holding company in Taiwan that will hold 100% of the equity interests in both ASE and SPIL such that ASE and SPIL will be wholly owned subsidiaries of such holding company. The proposed holding company will maintain all current operations of ASE and SPIL in Taiwan. The implementation of such corporate structure restructuring plan may require approvals from relevant regulators and may result in unforeseen contingent risks, including increase in tax liabilities or trading discounts relating to a holding company discount that may become apparent in the future.
The packaging and testing businesses are capital intensive. If we cannot obtain additional capital when we need it, our growth prospects and future profitability may be adversely affected.
The packaging and testing business is capital intensive. We will need capital to fund the expansion of our facilities as well as fund our research and development activities in order to remain competitive. We believe that our existing cash, marketable securities, expected cash flow from operations and existing credit lines under our loan facilities will be sufficient to meet our capital expenditures, working capital, cash obligations under our existing debt and lease arrangements, and other requirements for at least the next twelve months.However, future capacity expansions or market or other developments may cause us to require additional funds. Our ability to obtain external financing in the future is subject to a variety of uncertainties, including:
| · | our future financial condition, results of operations and cash flows; |
| · | general market conditions for financing activities by semiconductor or electronics companies; and |
| · | economic, political and other conditions in Taiwan and elsewhere. |
If we are unable to obtain funding in a timely manner or on acceptable terms, our results of operations and financial conditions may be materially and adversely affected.
14
Restrictive covenants and broad default provisions in our existing debt agreements may materially restrict our operations as well as adversely affect our liquidity, financial condition and results of operations.
We are a party to numerous loans and other agreements relating to the incurrence of debt, many of which may include restrictive covenants and broad default provisions. In general, covenants in the agreements governing our existing debt, and debt we may incur in the future, may materially restrict our operations, including our ability to incur debt, pay dividends, make certain investments and payments, other than in connection with restructurings of consolidated entities, and encumber or dispose of assets. In addition, any global economic deterioration or ineffective expansion may cause us to incur significant net losses or force us to assume considerable liabilities. We cannot assure you that we will be able to remain in compliance with our financial covenants, which, as a result, may lead to a default. This may thereby restrict our ability to access unutilized credit facilities or the global capital markets to meet our liquidity needs. Furthermore, a default under oneany agreement by us or one of our subsidiaries may also trigger cross-defaults under our other agreements. In the event of default, we may not be able to cure the default or obtain a waiver on a timely basis. An event of default under any agreement timely governing our existing or future debt, if not cured or waived, could have a material adverse effect on our liquidity, financial condition and results of operations.
15
We have on occasion failed to comply with certain financial covenants in some of our loan agreements. Such non-compliance may also have, through broadly worded cross-default provisions, resulted in default under some of the agreements governing our other existing debt. For example, we failed to comply with certain financial covenants in some of our loan agreements as a result of our acquisition of the controlling interest of Universal Scientific Industrial in February 2010, for which we have timely obtained waivers from our counterparties. If we are unable to timely remedyrectify any of ourpossible non-compliance under such loan agreements or obtain applicable waivers or amendments, we would breach our financial covenants and our financial condition would be adversely affected. As of December 31, 2015,2018, we were not in breach of any of the financial covenants under our existing loan agreements, although we cannot provide any assurance that we will not breach any of such financial covenants in the future.
We depend on select personnel and could be affected by the loss of their services.
We depend on the continued service of our executive officers and skilled technical personnel. Our business could suffer if we lose the services of any of these personnel and cannot adequately replace them. Although some of these management personnel have entered into employment agreements with us, they may nevertheless leave before the expiration of these agreements. We are not insured against the loss of the services of any of our personnel. In addition, these proceedings may divert these and other employees’ attention from our business operations.
In addition, we may be required to increase substantially the number of these employees in connection with our expansion plans, and there is intense competition for their services in this industry. We may not be able to either retain our present personnel or attract additional qualified personnel as and when needed. In addition, we may need to increase employee compensation levels in order to attract and retain our existing officers and employees and the additional personnel that we expect to require. Furthermore, a portion of the workforce at our facilities in Taiwan are foreign workers employed by us under work permits, which are subject to government regulations on renewal and other terms. Consequently, our business could also suffer if the Taiwan regulations relating to the employment of foreign workers were to become significantly more restrictive or if we are otherwise unable to attract or retain these workers at a reasonable cost.
The ongoing proceeding involving Dr. Tien Wu may have an adverse impact on our business and cause our common shares and ADS price to decline.
Dr. Tien Wu, ASEH’s director and chief operating officer, is currently undergoing a criminal proceeding brought by the Kaohsiung Prosecutor’s Office. The indictment alleges that Dr. Tien Wu violated Article 157-1 of the R.O.C. Securities and Exchange Act for insider trading activities involving SPIL common shares conducted during the period when the Initial SPIL Tender Offers, the Second SPIL Tender Offers and negotiations of the memorandum of understanding in relation to SPIL Acquisition took place. Dr. Tien Wu is accused of tipping off a friend about the aforementioned tender offers and negotiation ahead of the public announcements. No judicial conclusion has been reached yet for this proceeding. Further development of this proceeding may result in regulatory scrutiny from the TWSE or other regulators on a discretionary basis. If Dr. Tien Wu is sentenced due to the alleged violations, investor confidence in our company could be impaired and our business capacity to retain or attract clients could be negatively affected. ASEH has reinforced internal control measures after this incident and no ASEH directors are expected to become party to any current or future litigation related to Dr. Tien Wu.
On October 26, 2018, the R.O.C. Securities and Futures Investors Protection Center filed a civil lawsuit against Dr. Tien Wu and ASEH, requesting the court to remove him from ASEH’s board based on Article 10-1 of the Securities Investor and Futures Trader Protection Act. The proceeding is currently stayed by consent of the parties for a period of four months starting from March 28, 2019. There is no assurance that this proceeding or the further scrutiny from regulators will not generate publicity or media attention. Any negative publicity in connection to this legal proceeding may adversely affect ASEH’s brand and reputation and result in a material adverse impact on their business operations and prospects. As ASEH depends on the continued service of its executive officers and is not insured against the loss of service of any of their personnel, ASEH’s business operations could suffer if it loses the service of any executive officers, including Dr. Tien Wu, and cannot adequately replace them.
16
If we are unable to obtain additional packaging and testing equipment or facilities in a timely manner and at a reasonable cost, our competitiveness and future profitability may be adversely affected.
The semiconductor packaging and testing businesses are capital intensive and require significant investment in expensive equipment manufactured by a limited number of suppliers. The market for semiconductor packaging and testing equipment is characterized, from time to time, by intense demand, limited supply and long delivery cycles. Our operations and expansion plans depend on our ability to obtain a significant amount of such equipment from a limited number of suppliers. From time to time we have also leased certain equipment. We have no binding supply agreements with any of our suppliers and acquire our packaging and testing equipment on a purchase order basis, which exposes us to changing market conditions and other substantial risks. For example, shortages of capital equipment could result in an increase in the price of equipment and longer delivery times. Semiconductor packaging and testing also require us to operate sizeable facilities. If we are unable to obtain equipment or facilities in a timely manner, we may be unable to fulfill our customers’ orders, which could adversely affect our growth prospects as well as financial condition and results of operations. See “Item 4. Information on the Company—Business Overview—Equipment.”
15
Fluctuations in exchange rates could result in foreign exchange losses.
Currently, the majority of our revenues are denominated in U.S. dollars, with a portion denominated in NT dollars and Japanese yen. Our operating costs and operating expenses, on the other hand, are incurred in several currencies, primarily NT dollars, U.S. dollars, RMB, Japanese yen, Korean won, as well as, to a lesser extent, Singapore dollars and Malaysian ringgit.In addition, a substantial portion of our capital expenditures, primarily for the purchase of packaging and testing equipment, has been, and is expected to continue to be, denominated in U.S. dollars, with the remainder in Japanese yen. Fluctuations in exchange rates, primarily among the U.S. dollar and Japanese yen against the NT dollar the Japanese yen and RMB, will affect our costs and operating margins. In addition, these fluctuations could result in exchange losses and increased costs in NT dollar and other local currency terms. Despite hedging and mitigating techniques implemented by us, fluctuations in exchange rates have affected, and may continue to affect, our financial condition and results of operations. We recognized net foreign exchange gains of NT$1,928.4 million in 2016, net foreign exchange gains of NT$3,502.6 million in 2017 and net foreign exchange losses of NT$276.21,015.6 million NT$1,222.0 million and NT$713.2 million (US$21.833.2 million) in 2013, 2014 and 2015, respectively.2018. We cannot assure you that we will achieve foreign exchange gains in the future. See “Item 11. Quantitative and Qualitative Disclosures about Market Risk—Market Risk—Foreign Currency Exchange Rate Risk.”
The loss of a large customer or disruption of our strategic alliance or other commercial arrangements with semiconductor foundries and providers of other complementary semiconductor manufacturing services may result in a decline in our revenues and profitability.
Although we have a large customer base, we have derived and expect to continue to derive a large portion of our revenues from a small group of customers during any particular period due in part to the concentration of market share in the semiconductor and electronics industries. Our five largest customers together accounted for approximately 37.2%42.0%, 40.3%46.4% and 48.2%46.2% of our operating revenues in 2013, 20142016, 2017 and 2015,2018, respectively. One customer accounted for more than 10.0% of our operating revenues in 2013, 20142016, 2017 and 2015.2018. The demand for our services from a customer is directly dependent upon that customer’scustomer��s level of business activity, which could vary significantly from year to year. Our key customers typically operate in the cyclical semiconductor and electronic business and, in the past, have varied, and may vary in the future, order levels significantly from period to period. Some of these companies are relatively small, have limited operating histories and financial resources, and are highly exposed to the cyclicality of the industry. We cannot assure you that these customers or any other customers will continue to place orders with us in the future at the same levels as in past periods. The loss of one or more of our significant customers, or reduced orders by any one of them, and our inability to replace these customers or make up for such orders, could adversely affect our revenues and profitability. In addition, we have in the past reduced, and may in the future be requested to reduce, our prices to limit the level of order cancellations. Any price reduction would likely reduce our margins and profitability.
Since 1997, we have maintained a strategic alliance with Taiwan Semiconductor Manufacturing Company Limited, or TSMC, one of the world’s largest dedicated semiconductor foundries. TSMC designates us as their non-exclusive preferred provider of packaging and testing services for semiconductors manufactured by TSMC.In addition,May 2015, we entered into a joint venture agreement with TDK Corporation in May 2015 to further expand our business in embedded substrates. In February 2018, we entered into a joint venture agreement with Qualcomm Incorporated to expand our SiP business. In August 2018, we resolved to sell our 30.0% equity interest in ASEN to TsinghuaUnigroup Ltd. In August 2018, we entered into an equity transfer agreement with Chung Hong Electronics (Suzhou) Co., Ltd. to acquire its 60.0% quity in its subsidiary Chung Hong Electronics Poland SP.Z.O.O. to set up production base and expand our business in Europe to build a much more complete global supply system. In August 2018, we also entered into a joint venture framework contract and shareholder agreement with Cancon Information Industry Co., Ltd. to integrate the industrial resources to cooperate deeply in the field of secure and controllable high-performance server products for customers. In January 2019, we entered into a project investment agreement with China Merchants Group of Huizhou Daya Bay Economic and Technological Development Zone of Guangdong Provinceg to set up a wholly-owned subsidiary in Huizhou Daya Bay Economic and Technological Development Zoneto meet the growing needs of our capacity expansion and the development of our business in South China. Such strategic alliances, as well as our other commercial arrangements with providers of other complementary semiconductor manufacturing services, enable us to offer total semiconductor manufacturing solutions to our customers. These strategic alliances and other commercial arrangements may not achieve their anticipated commercial benefits and may be terminated at any time. Any failure in successfully maintaining such alliances, any termination of such alliances or our failure to enter into substantially similar strategic alliances or commercial arrangements may adversely affect our competitiveness and our revenues and profitability.
17
We rely on a limited number of key customers in certain products for our revenues, and our results of operations may be adversely affected by a reduction of business from our key customers.
Our results of operations also dependsdepend on the performance and business of our key customers. Accordingly, risks that could seriously harm our key customers could harm us as well, including:
16
| · | loss of market share for our key customers’ products; |
| · | recession in our key customers’ markets; |
| · | failure of their products to gain wide-spread commercial acceptance; and |
| · | our key customers’ inability to manage their operations efficiently and effectively. |
The launch and market acceptance of our individual key customers’ products could significantly impact our product and customer mix, resulting in significant volatility in the demand for the solutions we offer and our results of operations. It is also possible that a key customer’s market share with respect to its product may decline as its competitors introduce new products, which could adversely affect our results of operations, particularly if we are unable to sell our solutions to such competitors. Furthermore, sales of our key customers’ products are subject to seasonal fluctuation.
Our revenues and profitability may decline if we are unable to obtain adequate supplies of raw materials in a timely manner and at a reasonable price.
Our operations, such as packaging operations, substrate operations and electronic manufacturing services, require that we obtain adequate supplies of raw materials on a timely basis. Shortages in the supply of raw materials have in the past resulted in occasional price increases and delivery delays. In addition, the operations of some of our suppliers are vulnerable to natural disasters, such as earthquakes and typhoons, the occurrences of which may deteriorate and prolong the shortage or increase the uncertainty of the supply of raw materials. For example, on March 11, 2011, a major earthquake occurred off the coast of Japan resulting in a large tsunami and radiation leak at the Fukushima nuclear power plant. We experienced a disruption to the supply of raw materials from Japan for about three to four weeks due to the fear of radiation contamination and the reduction or postponement in production by some of our Japanese suppliers.Although the purchase of supplies from Japan has been restored to the previous level, we cannot assure you that we will not suffer long-term from the impact of the earthquake and the tsunami. In addition, further earthquakes, aftershocks thereof or other disasters in Japan or other regions in which we operate may cause a decline in our sales. Any of the above events or developments may have a material adverse effect on our business, results of operations and financial condition.
Raw materials such as IC substrates are prone to supply shortages since such materials are produced by a limited number of suppliers, such as Kinsus Interconnect Technology Corporation, Nanya Printed Circuit Board Corporation, LG InnotekSamsung Electro-Mechanics Co., Ltd., Kinsus Interconnect Technology Corporation and Unimicron Technology Corp. Our operations conducted through our wholly owned subsidiaries ASE Electronics and ASE Shanghai have improved our ability to obtain IC substrates on a timely basis and at a reasonable cost. In 2015,2018, our interconnect materials operations supplied approximately 27.2%14.2% of our consolidated substrate requirements by value.We do not expect that our internal interconnect materials operations will be able to meet all of our interconnect materials requirements. Consequently, we will remain dependent on market supply and demand for our raw materials. In addition, recent fluctuations in prices of precious metals, such as gold, have also affected the price at which we have been able to purchase the principal raw materials we use in our packaging processes. We cannot guarantee that we will not experience shortages in the near future or that we will be able to obtain adequate supplies of raw materials in a timely manner or at a reasonable price. Our revenues and net income could decline if we are unable to obtain adequate supplies of high quality raw materials in a timely manner or if there are significant increases in the costs of raw materials that we cannot pass on to our customers.
18
Regulations related to conflict minerals could adversely affect our business, financial condition and results of operations.
The Dodd-Frank Wall Street Reform and Consumer Protection Act contains provisions to improve transparency and accountability concerning the supply of certain minerals, known as conflict minerals, which are defined as cassiterite, columbite-tantalite, gold, wolframite or their derivatives and other minerals determined by the U.S. government to be financing conflict in the Democratic Republic of Congo and adjoining countries. As a result, in August 2012 the SEC adopted annual disclosure and reporting requirements for those companies who use conflict minerals in their products. These rules require companies that manufacture or contract to manufacture products for which conflict minerals are necessary to the functionality or production to begin scrutinizing the origin of conflict minerals in their products starting from January 1, 2013, and file a new form, Form SD, containing the conflict minerals disclosure by May 31 for the prior calendar year, beginning May 31, 2014. We filed a specialized disclosure report on Form SD for the years ended December 31, 2013, 2014, 2015, 2016 and 20142017, on May 30, 2014, and June 1, 2015, May 31, 2016, May 31, 2017 and April 27, 2018 respectively. Pursuant to the SEC rules governing conflict minerals disclosures, we have engaged an independent auditing firm to conduct audits on our due diligence framework to provide a private sector report for our specialized disclosure report on Form SD for the years ended December 31, 2014, 2015, 2016, 2017 and 2015.2018. As a result, there will be costs associated with complying with these disclosure requirements, including costs for diligence to determine the sources of conflict minerals used in our products and other potential changes to products, processes or sources of supply as a consequence of such verification activities. The implementation of these rules could adversely affect the sourcing, supply and pricing of materials used in our products.
As there may be only a limited number of suppliers offering “conflict free” minerals, we cannot be sure that we will be able to obtain necessary “conflict free” minerals from such suppliers in sufficient quantities or at competitive prices. Also, we may face adverse effects to our reputation if we determine that certain of our products contain minerals not determined to be conflict free or if we are unable to sufficiently verify the origins for all conflict minerals used in our products through the procedures we may implement.
17
System security risks, data protection breaches or unexpected system outage or failures could harm our business, financial condition and results of operations.
We rely on the efficient and uninterrupted operation of complex information technology applications, systems and networks to operate our business. Our systems are vulnerable to damage or interruption from earthquakes, terrorist attacks, floods, fires, power loss, telecommunications failures, cyber-attacks, computer viruses, computer denial of service attacks or other attempts to harm our system, and similar events.Inevents. In recent years, the risks that we face from cyber-attacks have increased significantly. Some of these attacks may originate from well-organized, highly skilled organizations. Although there have not been reported major cyber-attacks against our systems in the recent years, any such attack or system or network disruption could result in a loss of our intellectual property, the release of commercially sensitive information, customer or employee personal data. Failures to protect the privacy of customer and employee confidential data against breaches of network security could result in damage to our reputation.
Furthermore, some of our data centers are located in areas with a high risk of major earthquakes. Our data centers are also subject to break-ins, sabotage and intentional acts of vandalism, and to potential disruptions if the operators of these facilities have financial difficulties. Some of our systems are not fully redundant, and our disaster recovery planning cannot account for all eventualities. The occurrence of a natural disaster, a decision to close a facility we are using without adequate notice for financial reasons or other unanticipated problems at our data centers could result in loss of production capabilities and lengthy interruptions in our service. Any damage to or failure of our systems could result in interruptions in our service. Interruptions in our service could materially and adversely affect our business, financial condition and results of operations.
19
A cybersecurity breach could interfere with our business operations, compromise confidential information, adversely impact our reputation and operating results and potentially lead to litigation and other liabilities.
Cybersecurity threats continue to expand and evolve globally. Our cybersecurity response system includes a risk notification and assessment scheme that categorizes and implements different responses to address different levels of cybersecurity risk. In addition, we have implemented enterprise risk management programs at our major manufacturing sites and have included cybersecurity threats as an integral subject in these programs. While we actively take measures to manage information technology security risks, there can be no assurance that these measures will be sufficient to mitigate all potential risks to our system, networks and data.
Although our on-site safety teams conduct periodic meetings to update our cybersecurity protocols and cybersecurity is a key part of our risk management program that our management regularly reviews, a failure or breach in security could expose us and our customers, dealers and suppliers to risks of unauthorized access to information technology systems, misuse and compromise of confidential information, manipulation and destruction of data, which could potentially result in disruption of our business operations and adversely affect our reputation, competitive position, financial condition and results of operations. Security breaches could also result in litigation with third parties, regulatory actions and higher costs of implementing additional data protection measures.
Negative publicity may adversely affect our brand and reputation, which may result in a material adverse impact on our business, results of operations, business prospects and cause fluctuations in the price of our common shares and ADSs.
Any negative publicity may damage our brand and reputation, harm our ability to attract and retain customers and have a material adverse impact on our results of operations as well as cause fluctuations in the trading price of our common shares and ADSs. In addition, any change in policy or the direction in which we carry out our corporate social responsibility or corporate sustainability activities may also have an adverse effect on our business reputation. In recent years, we have experienced and may continue to experience negative publicity in connection with administrative penalties and criminal charges related to alleged violations of environmental regulations and laws. For further details, see “Item 4. Information on the Company—Business Overview—Environmental Matters,” “Item 4. Information on the Company—Property, Plants and Equipment” and “Item 8. Financial Information—Consolidated Statements and Other Financial Information—Legal Proceedings.”
Any environmental claims or failure to comply with any present or future environmental regulations, as well as any fire or other industrial accident, may require us to spend additional funds and may materially and adversely affect our financial condition and results of operations.
We are subject to various laws and regulations relating to the use, storage, discharge and disposal of chemical by-products of, and water used in, our packaging and interconnect materials production processes, and the emission of volatile organic compounds and the discharge and disposal of solid industrial wastes from electronic manufacturing services operations. In the recent years, we have been subject to environmental administrative actions and judicial proceedings related to certain wastewater discharge incidents that occurred at our facilities. As a result of these proceedings, we have been subject to monetary fines as well as sanctions, including orders to suspend or limit our operations and criminal charges against us.
InOn December 20, 2013, the Kaohsiung City Environmental Protection Bureau orderedimposed a fine of NT$102.0 million (the “Administrative Fine”) upon us to suspend the operations at our K7 Plant’s wafer-level process where nickel was used for alleged wastewater discharge violations and imposed a NT$110.1 million fine against us. The NT$110.1 million fineof the Water Pollution Control Act. We filed an administrative appeal to nullify the Administrative Fine, which was later reduced to NT$109.4 million as ordereddismissed by the Kaohsiung City Environmental Protection Bureau.Government. In DecemberAugust 2014, the Kaohsiung City Environmental Protection Bureau lifted the suspension order and approved the full resumption of operations of our K7 Plant after ordering a series of examinations, hearings and trial runs. In September 2015, the fine was further reduced to NT$102.0 million (US$3.1 million) by the Kaohsiung City Environmental Protection Bureau and we received a refund of NT$7.3 million (US$0.2 million) in October 2015. Although our K7 Plant has resumed full operation, we may be subject to other new environmental claims, charges or investigations on our K7 Plant or other facilities that may cause similar or more sever interruptions to our business and operations.
18
With respect to the NT$102.0 million (US$3.1 million) administrative penalty imposed on us by the Kaohsiung City Environmental Protection Bureau, we appealed to the Kaohsiung High Administrative Court in August 2014 seeking to (i) revoke Kaohsiung City Government’s decision, (ii) lift the administrative penalty imposed on us and (iii) demand a refund of the administrative penalty.Administrative Fine. On March 22, 2016, the Kaohsiung High Administrative Court revoked Kaohsiung City Government’s decision and lifted the administrative penalty. Our demand for a refund of the fineAdministrative Fine was dismissed. We appealed to the Supreme Administrative Court on April 14, 2016 against the Kaohsiung High Administrative Court’s unfavorable ruling in dismissing a refund. The outcomeOn June 8, 2017, the Supreme Administrative Court overturned Kaohsiung High Administrative Court’s decision and ordered Kaohsiung Environmental Protection Bureau to refund the Administrative Fine paid by us.
20
In connection with the same alleged violations at our K7 plant, in October 2014, the Kaohsiung District Court ruled that we were in violation of the ROCR.O.C. Waste Disposal Act and imposed on us a criminal penalty of NT$3.0 million. We appealed the case to the Taiwan High Court Kaohsiung District Branch in November 2014. InOn September 29, 2015, the Taiwan High Court Kaohsiung District Branch overturned the decision made by Kaohsiung District Court and found the Companyus not guilty and repealed the criminal penalty imposed on the Company.us. The verdict was final and not appealable. For additional details of these administrative actions and judicial proceedings related to our K7 Plant see “Item 4. Information on the Company—Business Overview—Environmental Matters,” “Item 4. Information on the Company—Property, Plants and Equipment” and “Item 8. Financial Information—Consolidated Statements and Other Financial Information—Legal Proceedings.” Defending against any of these pending or future actions will likely be costly and time-consuming and could significantly divert management’s efforts and resources. Any penalties, fines, damages or settlements made in connection with any criminal, civil, and/or administrative investigations and/or lawsuits may have a material adverse effect on our business, results of operations and future prospects.
We have made, and expect to continue to make, expenditures to maintain strict compliance with such environmental laws and regulations. For example, in order to demonstrate our commitment to environmental protection, in December 2013, our board of directors approved contributions to environmental protection efforts in Taiwan in a total amount of not less than NT$3,000.0 million, to be made in the next 30 years. For the years ended December 31, 20142016, 2017 and 2015,2018, we have made contributions in the amount of NT$100.0 million (US$3.03.3 million) each, respectively, through ASE Cultural and Educational Foundation to fund various environmental projects, and our board of directors have resolved in a resolution in January 2016February 2019 to contribute NT$100.0 million (US$3.03.3 million) through ASE Cultural and Educational Foundation in environmental projects in 2016.2019. The costs of current and future compliance with environmental laws and regulations could require us to acquire costly equipment or to incur other significant expenses that may have a material adverse effect on our financial condition and results of operations.
Negative publicityClimate change, water shortage and other environmental concerns may negatively affect our business.
There is increasing concern that climate change is occurring and may have dramatic effects on human activity without aggressive remediation steps. A modest change in temperature would result in increased coastal flooding, changing precipitation patterns and increasing risk of extinction for the world’s species. Extreme weather conditions, such as droughts and floods, that occur due to climate change can also impact our business operations. For example, since our business operations depend on adequate supplies of water, an extended droughts may affect our ability to obtain sufficient amounts of water and threaten our production capacity.
Public expectations for reductions in greenhouse gas emissions could result in increased energy, transportation and raw material costs. Scientific examination of, political attention to and rules and regulations on issues surrounding the existence and extent of climate change may result in an increase in the cost of production due to increase in the prices of energy and introduction of energy or carbon tax. Various regulatory developments have been introduced that focus on restricting or managing emissions of carbon dioxide, methane and other greenhouse gases. Enterprises may need to purchase at higher costs emission credits, new equipment or raw materials with lower carbon footprints. These developments and further legislation that is likely to be enacted could negatively affect our operations. Changes in environmental regulations, such as those that concern the use of perfluorinated compounds, could increase our production costs, which may adversely affect our brand and reputation, which may result in a material adverse impact on our business, results of operationsoperation and prospects and cause fluctuations in the price of our common shares and ADSs.
Any negative publicity may damage our brand and reputation, harm our ability to attract and retain customers and result in a material adverse impact on our results of operations and prospects as well as cause fluctuations in the trading price of our common shares and ADSs. In addition, any change in policy or directions in which we carry out our corporate social responsibility or corporate sustainability activities may also have an adverse effect on our reputation. Furthermore, in recent years, we have experienced and may continue to experience negative publicity in connection with administrative penalties and criminal charges related to alleged violations of environmental regulations and laws. For further details, see “—Any environmental claims or failure to comply with any present or future environmental regulations, as well as any fire or other industrial accident, may require us to spend additional funds and may materially and adversely affect our financial condition and results of operations,” “Item 4. Information on the Company—Business Overview—Environmental Matters,” “Item 4. Information on the Company—Property, Plants and Equipment” and “Item 8. Financial Information—Consolidated Statements and Other Financial Information—Legal Proceedings.”
19
Climate change, other environmental concerns and green initiatives also presents other commercial challenges, economic risks and physical risks that could harm our results of operations or affect the manner in which we conduct our business.
Increasing climate change and environmental concerns could affect the results of our operations if any of our customers request that we exceed any standards set for environmentally compliant products and services, or if raw materials and/or products are required to meet strict inspection standards with respect to any radioactive contamination as a result of concerns arising from radiation leaking incidents, such as the radiation leak, which occurred in March 2011 in Japan. If we are unable to offer such products or offer products that are compliant, but are not as reliable due to the lack of reasonably available alternative technologies, it may harm our results of operations.
Furthermore, energy costs in general could increase significantly due to climate change regulations. Therefore, our energy costs may increase substantially if utility or power companies pass on their costs, fully or partially, such as those associated with carbon taxes, emission cap and carbon credit trading programs.condition.
We may be subject to intellectual property rights disputes, which could materially adversely affect our business.
Our ability to compete successfully and achieve future growth depends, in part, on our ability to develop and protect our proprietary technologies and to secure on commercially acceptable terms certain technologies that we do not own. We cannot assure you that we will be able to independently develop, obtain patents for, protect or secure from any third party, the technologies required. Our failure to successfully obtain such technology may seriously harm our competitive position.
21
Our ability to compete successfully also depends, in part, on our ability to operate without infringing the proprietary rights of others. We have no means of knowing what patent applications have been filed in the United States or elsewhere until they are granted or published. In particular, the semiconductor and electronics industries are characterized by frequent litigation regarding patent and other intellectual property rights. It is common for patent owners to assert their patents against semiconductor manufacturers. We have received from time to time communication from third parties asserting patents that cover certain of our technologies and alleging infringement of intellectual property rights of others, and we may continue receiving such communication in the future. In the event that any third party makes a valid claim against us or against our customers, we could be required to:
| · | seek to acquire licenses to the infringed technology which may not be available on commercially reasonable terms, if at all; |
| · | discontinue using certain process technologies, which could cause us to stop manufacturing certain semiconductors; |
| · | pay substantial monetary damages; and/or |
| · | seek to develop non-infringing technologies, which may not be feasible. |
Any one of these developments could place substantial financial and administrative burden on us and hinder our business. In February 2006, Tessera filed a suit against us and others alleging patent infringement. In February 2014, ASE Inc. and our U.S. subsidiary, ASE (U.S.) Inc. reached a term sheet agreement with Tessera to fully resolve the remaining legal proceedings between each other, under which we would pay a total of US$30.0 million to Tessera (which was fully recognized by us in the fourth quarter of 2013) and both Tessera and we would dismiss all pending claims against each other. The final settlement agreement was entered into among the parties in October 2014 and the final settlement amount was reduced to US$27.0 million. In October 2014, the United States District Court for the Northern District of California dismissed all claims between Tessera and us. We have fully paid the settlement amount in January 2015 and reversed the settlement amount of US$3.0 million in the fourth quarter of 2014.
Any litigation, whether as plaintiff or defendant and regardless of the outcome, is costly and diverts company resources. Any of the foregoing could harm our competitive position and render us unable to provide some of our services operations.
Our major shareholders may take actions that are not in, or may conflict with, our public shareholders’ best interest.
Members of the Chang family own, directly or indirectly, a significant interest in our outstanding common shares. See “Item 7. Major Shareholders and Related Party Transactions—Major Shareholders.” Accordingly, these shareholders will continue to have the ability to exercise a significant influence over our business, including matters relating to:
| · | our management and policies; |
| · | the timing and distribution of dividends; and |
| · | the election of our directors. |
Members of the Chang family may take actions that you may not agree with or that are not in our or our public shareholders’ best interests.
20
We are an ROCR.O.C. company and, because the rights of shareholders under ROCR.O.C. law differ from those under U.S. law and the laws of certain other countries, you may have difficulty protecting your shareholder rights.
Our corporate affairs are governed by our Articles of Incorporation and by the laws governing corporations incorporated in the ROC.R.O.C. The rights of shareholders and the responsibilities of management and the members of the board of directors under ROCR.O.C. law are different from those applicable to a corporation incorporated in the United States and certain other countries. As a result, public shareholders of ROCR.O.C. companies may have more difficulty in protecting their interests in connection with actions taken by management or members of the board of directors than they would as public shareholders of a corporation in the United States or certain other countries.
22
We have made investments in, and are exploring the possibility of expanding our businesses and operations to, or making additional investments in, the PRC,P.R.C., which may expose us to additional political, regulatory, economic and foreign investment risks.
We currently maintain packaging and testing facilities and electronic manufacturing services sites in the PRC.P.R.C. We also made substantial investments in PRCP.R.C. real estate development through our subsidiaries in the PRC.P.R.C. Under PRCP.R.C. laws and regulations, foreign investment projects, such as our subsidiaries, must obtain certain approvals from the relevant governmental authorities in the provinces or special economic zones in which they are located and, in some circumstances, from the relevant authorities in the PRC’sP.R.C. central government. Foreign investment projects must also comply with certain regulatory requirements. However, PRCP.R.C. laws and regulations are often subject to varying interpretations and means of enforcement, and additional approvals from the relevant governmental authorities may be required for the operations of our PRCP.R.C. subsidiaries. If required, we cannot assure you that we will be able to obtain these approvals in a timely manner, if at all. Because the PRCP.R.C. government holds significant discretion in determining matters relating to foreign investment, we cannot assure you that the relevant governmental authorities will not take action that is materially adverse to our PRCP.R.C. operations.
In addition, the PRCP.R.C. stock market is subject to extreme price and volume fluctuations. We are the controlling shareholder of Universal Scientific Industrial Shanghai, which is an entity currently listed on the Shanghai Stock Exchange. The PRCP.R.C. securities markets have recently experienced, and may experience in the future, significant price declines and volatility. Any volatility may have a significant effect on Universal Scientific Industrial Shanghai’s share price and may indirectly affect the market price of our common shares and ADSs.
Our global manufacturing and sales activities subject us to risks associated with legal, political, economic or other conditions or developments in various jurisdictions, including in particular the ROCR.O.C. and the PRC,P.R.C., which could negatively affect our business and financial status and therefore the market value of your investment.
Our principal executive office and our principal production facilities are located in the ROC,R.O.C., and a substantial majority of our net revenues are derived from our operations in the ROCR.O.C. and the PRC.P.R.C. In addition, we have operations worldwide and a significant percentage of our revenue comes from sales to locations outside the ROCR.O.C. or the PRC.P.R.C. Operating in the ROC, PRCR.O.C., P.R.C. and other overseas locations exposes us to changes in policies and laws, including environmental regulations, as well as the general political and economic conditions, security risks, health conditions and possible disruptions in transportation networks, in the various countries in which we operate, which could result in an adverse effect on our business operations in such countries. If any of our global operations are affected by the legal, political, economic or other conditions in the jurisdiction we operate, our results of operations as well as market price and the liquidity of our ADSs and common shares may be materially and adversely affected.
Any impairment charges may have a material adverse effect on our net income.
Under IFRS, we are required to evaluate our assets, such as property, plant and equipment, intangible assets, including goodwill, and investments in financial instruments, for possible impairment at least annually or whenever there is an indication of impairment. If certain criteria are met, we are required to record an impairment charge.
With respect to assets, we recognized impairment charges of NT$691.9980.1 million, NT$308.1764.9 million and NT$258.1654.1 million (US$7.921.4 million) in 2013, 20142016, 2017 and 2015,2018, respectively, primarily as a result of an impairment chargecharges related to buildingsproperty, plant and improvement,equipment, equity method investments and impaired equipment and investment.goodwill. See “Item 5. Operating and Financial Review and Prospects—Operating Results and Trend Information—Critical Accounting Policies and Estimates—Impairment of Tangible and Intangible Assets Other Than Goodwill,” “Item 5. Operating and Financial Review and Prospects—Operating Results and Trend Information—Critical Accounting Policies and Estimates—Valuation of Investments” and “Item 5. Operating and Financial Review and Prospects—Operating Results and Trend Information—Critical Accounting Policies and Estimates—Goodwill.”
2123
We are unable to estimate the extent and timing of any impairment charges for future years and we cannot give any assurance that impairment charges will not be required in periods subsequent to December 31, 2015.2018. Any impairment charge could have a material adverse effect on our net income. The determination of an impairment charge at any given time is based significantly on our expected results of operations over a number of years in the future. As a result, an impairment charge is more likely to occur during a period in which our operating results and outlook are otherwise already depressed.
Our adoption of new financial reporting standards, effective January 1, 2013, may have material impact on our financial statements thereafter.
We have historically presented our consolidated financial statements for and prior to the year ended December 31, 2012 in accordance with ROC GAAP for purposes of our filings with the Taiwan Stock Exchange, with reconciliation to U.S. GAAP for certain filings with the SEC. According to the announcement of the FSC, on May 14, 2009, effective January 1, 2013, companies listed on the Taiwan Stock Exchange, including us, must report their financial statements in accordance with the Taiwan-IFRS. Accordingly, we have adopted Taiwan-IFRS in the ROC for our interim quarterly earnings releases beginning in the first quarter of 2013 and our annual consolidated financial statements beginning in 2013. While we have adopted Taiwan-IFRS for ROC reporting purposes, we have also adopted and will continue to adopt IFRS, which differs from Taiwan-IFRS, for certain filings with the SEC, including this annual report and future reports on Form 20-F. Following our adoption of IFRS for SEC filing purposes, we will no longer be required to reconcile net income and balance sheet differences under our consolidated financial statements with U.S. GAAP.
Taiwan-IFRS differs from IFRS in certain respects, including, but not limited to the extent that any new or amended standards or interpretations applicable under IFRS may not be timely endorsed by the FSC. Because of the differences in accounting treatments, the adoption of Taiwan-IFRS and IFRS may have material impact on our results of operations and financial condition in our reported financial statements going forward.
Provisions of our outstanding convertible bonds could discourage an acquisition of us by a third party.
In September 2013, we completed an offering of US$400.0 million in aggregate principal amount of convertible bonds due 2018 (“2018 Convertible Bonds”), and in July 2015, we completed an offering of US$200.0 million in aggregate principle amount of NTD-linked convertible bonds due 2018 (“2018 NTD-linked Convertible Bonds”). Certain provisions of our convertible bonds could make it more difficult or more expensive for a third party to acquire us. In the event that (1) our common shares cease to be listed on the Taiwan Stock Exchange; (2) any person or persons acting together acquire control of us if such person or persons do not have, and would not be deemed to have, control of us as of a specified date; (3) we consolidate with or merge into or sell or transfer all or substantially all of our assets to any other person, unless the consolidation, merger, sale or transfer will not result in the other person or persons acquiring control over us or the successor entity; or (4) one or more other persons acquire the legal or beneficial ownership of all or substantially all of our capital stock, holders of these bonds shall have the right to require us to repurchase all or any portion of the principal amount thereof (which is US$200,000 or any integral multiples thereof) of such holder’s bonds. “Control” means the right to appoint and/or remove all or the majority of the members of our board of directors or other governing body, whether obtained directly or indirectly, and whether obtained by ownership of share capital, the possession of voting rights, contract or otherwise. However, a “change of control” will not be deemed to have occurred (i) solely as a result of the issuance or transfer, with the Company’s corporation, of any preferred shares in the Company’s capital or (ii) if the closing price per common share for any five trading days within the period of 10 consecutive trading days ending immediately after the later of the change of control or the public announcement of the change of control equals or exceeds 110% of the conversion price in effect on each of those five trading days.
The accounting treatment for our outstanding convertible bonds, including the treatment for conversion option, redemption option and put option embedded in our outstanding convertible bonds, could have a material effect on our reported financial results.
22
In September 2013, we completed the offering of the 2018 Convertible Bonds. Since the 2018 Convertible Bonds are denominated in U.S. dollars, which is different from our functional currency under IFRS, we separated the conversion option, redemption option and put option embedded in 2018 Convertible Bonds (collectively, the “Bond Options”) and recognized them as a freestanding derivative at fair value through profit or loss. To determine the fair value of the Bond Options of the 2018 Convertible Bonds, we are subject to a mark-to-market accounting on the Bond Options embedded in the 2018 Convertible Bonds. As a result, if the fair value of our common shares rises, mark to market of the Bond Options would lead to losses in our financial statements. For each reporting period over the term of the convertible bonds, a gain (or loss) will be reported in our consolidated statement of comprehensive income to the extent the fair value of the Bond Options changes from the previous period. Changes in fair value of the Bond Options generated a loss for NT$75.0 million, NT$777.6 million and NT$112.0 million (US$3.4 million) in 2013, 2014 and 2015, respectively. See note 18 to our audited consolidated financial statements included in this annual report.
Any failure to achieve and maintain effective internal controls could have a material adverse effect on our business and results of operations.
We are subject to reporting obligations under the U.S. securities laws. The SEC as required by Section 404 of the Sarbanes-Oxley Act of 2002 adopted rules requiring every public company to include a management report on the effectiveness of such company’s internal control over financial reporting in its annual report. In addition, an independent registered public accounting firm must report on such company’s internal control over financial reporting.
Our management concluded that our internal control over financial reporting was effective as of December 31, 20152018 and our independent registered public accounting firm has issued an attestation report concluding that our internal control over financial reporting was effective in all material aspects. As effective internal control over financial reporting is necessary for us to produce reliable financial reports and is important to help prevent fraud, any failure to maintain effective internal control over financial reporting could harm our business and result in a loss of investor confidence in the reliability of our financial statements, which in turn could negatively impact the trading price of our common shares and ADSs. Furthermore, we may need to incur additional costs and use additional management and other resources in an effort to comply with Section 404 of the Sarbanes-Oxley Act and other requirements going forward.
Our insurance coverage may be inadequate to cover all of our business risks.
Although we seek to obtain insurance for some of our main operational risks, the amount of our insurance coverage may not be adequate to cover all potential claims or liabilities, and we may be forced to bear substantial costs resulting from risks and uncertainties of our business. There is also no guarantee that we will be able to obtain insurance coverage when desired or that insurance will be available on commercially attractive terms. Any failure to obtain adequate insurance coverage on terms favorable to us, or at all, could have a material adverse effect on our business, financial condition and results of operations.
We could potentially face tax uncertainties arising from the decisions, activities, and operations undertaken by us.
There are many business activities that may give rise to tax issues in our daily operations, ranging from procurement, research and development activities, manufacturing to product storage and distribution, among other activities. Additional tax liabilities such as double taxation, inapplicability of tax incentives, tax adjustment and related interest and penalties may arise if all these tax issues are not dealt with properly. The development and evolution of tax laws and regulations present considerable uncertainties in interpretation and enforcement, which could call for more onerous compliance measures and tax audits in the jurisdictions in which we operate. Failure to comply with any change in tax laws could result in unfavorable tax consequences to us and have an adverse impact on our business, financial condition and results of operations.
Uncertainty under United States corporate income tax reform legislation could adversely affect our operating results and financial condition.
The United States recently enacted tax reform legislation (the “Tax Reform Legislation”) that, among other things, reduced the U.S. federal corporate income tax rate from 35% to 21% and imposes an alternative “base erosion and anti-abuse tax” (“BEAT”) on U.S. corporations that make deductible payments to foreign related persons in excess of specified amounts. The reduction in the U.S. federal corporate income tax rate is expected to be beneficial to us in future years in which our consolidated U.S. subsidiaries have net income subject to U.S. tax.
There are a number of uncertainties and ambiguities as to the interpretation and application of many of the provisions in the Tax Reform Legislation, including the provisions relating to the BEAT. In the absence of guidance on these issues, we will use what we believe are reasonable interpretations and assumptions in interpreting and applying the Tax Reform Legislation for purposes of determining our income tax payable and results of operations, which may change as we receive additional clarification and implementation guidance. It is also possible that the U.S. Internal Revenue Service could issue subsequent guidance or take positions on audit that differ from the interpretations and assumptions that we previously made, which could have a material adverse effect on our cash tax liabilities, results of operations and financial condition.
24
Risks Relating to Taiwan, ROCR.O.C.
Strained relations between the ROCR.O.C. and the PRCP.R.C. and disruptions in Taiwan’s political environment caused by domestic political events could negatively affect our business and the market value of your investment.
Our principal executive offices and our principal facilities are located in Taiwan and approximately 48.5%48.6%, 52.1%47.6% and 46.9%56.9% of our operating revenues in 2013, 20142016, 2017 and 2015,2018, respectively, were derived from our operations in Taiwan. Accordingly, our business and financial condition may be affected by changes in local governmental policies and political and social instability.
The ROCR.O.C. has a unique international political status. The government of the PRCP.R.C. asserts sovereignty over all of China, including Taiwan, and does not recognize the legitimacy of the ROCR.O.C. government. Although significant economic and cultural relations have been established in recent years between the ROCR.O.C. and the PRC,P.R.C., relations have often been strained. Any major change in the Taiwanese political environment, including the outcome of presidential or municipal elections, or potential shifts in government policy, may affect the direction of economic and political developments and negatively impact the economic and political environment in Taiwan. Past developments related to the interaction between the ROCR.O.C. and the PRC,P.R.C., domestic political events or election results have on occasion depressed the market prices of the securities of Taiwanese or Taiwan-related companies, including our own. Relations between the ROCR.O.C. and the PRCP.R.C. and other factors affecting the political or economic conditions in Taiwan could have a material adverse effect on our financial condition and results of operations, as well as the market price and the liquidity of our common shares and ADSs.
23
Currently, we manufacture interconnect materials in the PRCP.R.C. through our wholly owned subsidiary, ASE Shanghai. We also provide packaging and testing services in the PRCP.R.C. through some of our subsidiaries. In addition, we engage in the PRCP.R.C. in real estate development and the manufacture of computer peripherals and electronic components through our subsidiaries in the PRC.P.R.C. See “Item 4. Information on the Company—Organizational Structure—Our Consolidated Subsidiaries.” In the past, ROCR.O.C. companies, including ourselves, were prohibited from investing in facilities for the packaging and testing of semiconductors in the PRC.P.R.C. Although the prohibitions have been relaxed since February 2010, the ROCR.O.C. government currently still restricts certain types of investments by ROCR.O.C. companies, including ourselves, in the PRC.P.R.C. We do not know when or if such laws and policies governing investment in the PRCP.R.C. will be amended, and we cannot assure you that such ROCR.O.C. investment laws and policies will permit us to make further investments of certain types in the PRCP.R.C. in the future that we consider beneficial to us. Our growth prospects and profitability may be adversely affected if we are restricted from making certain additional investments in the PRCP.R.C. and are not able to fully capitalize on the growth of the semiconductor industry in the PRC.P.R.C.
As a substantial portion of our business and operations is located in Taiwan, we are vulnerable to earthquakes, typhoons, drought and other natural disasters, as well as power outages and other industrial incidents, which could severely disrupt the normal operation of our business and adversely affect our results of operations.
Taiwan is susceptible to earthquakes and has experienced severe earthquakes which caused significant property damage and loss of life, particularly in the central and eastern parts of Taiwan. Earthquakes have damaged production facilities and adversely affected the operations of many companies involved in the semiconductor and other industries. For example, in February 2016, an earthquake measuring 6.4 on the Richter magnitude scale occurred in Kaohsiung caused several death and property damages. However, the earthquake did not have a material impact on our operations. We have never experienced structural damage to our facilities or damage to our machinery and equipment as a result of these earthquakes. In the past, however, we have experienced interruptions to our production schedule primarily as a result of power outages caused by earthquakes.
25
Taiwan is also susceptible to typhoons, which may cause damage and business interruptions to companies with facilities located in Taiwan. For example, on August 8, 2015,September 14, 2016, Taiwan experienced severe damage from typhoon SoudelorMeranti that caused several deaths, severe flooding, extensive property damage and loss of electricity for millionsthousands of households. Taiwan has experienced severe droughts in the past. Although we have not been directly affected by droughts, we are dependent upon water for our packaging and substrates operations and a drought could interrupt such operations. In addition, a drought could interrupt the manufacturing process of the foundries located in Taiwan, in turn disrupting some of our customers’ production, which could result in a decline in the demand for our services. In addition, the supply of electrical power in Taiwan, which is primarily provided by Taiwan Power Company, the state-owned electric utility, is susceptible to disruption that could be prolonged and frequent, caused by overload as a result of high demand or other reasons.
Kaohsiung is one of the major industrial cities in Taiwan. Our testing and packaging businesses have been founded in Kaohsiung and currently our primary testing and packaging operations are located in Kaohsiung. In July 2014, following leaks from underground propene pipes, a series of propene pipeline explosions occurred in the Cian-Jhen and Ling-Ya districts of Kaohsiung. 32 people were killed and 321 others were injured from this incident. Although we have not been directly affected by the explosion, future industrial incidents could negatively affect our operation and result in interruption or delay of our operation or production capacity.
On August 15, 2017, Taiwan suffered a massive power blackout, which left millions of homes, offices and factories without power. Although the power blackout did not have a material impact on our operations, future power blackout may disrupt our business operations and adversely affect our results of operations.
Our production facilities as well as many of our suppliers and customers and providers of complementary semiconductor manufacturing services, including wafer foundries, are located in Taiwan. If our customers are affected by an earthquake, a typhoon, a drought or any other natural disasters, or power outage or other industrial incidents, it could result in a decline in the demand for our services. If our suppliers or providers of complementary semiconductor manufacturing services are affected, our production schedule could be interrupted or delayed. As a result, a major earthquake, typhoon, drought or other natural disaster in Taiwan, or a power outage or other industrial incident could severely disrupt the normal operation of our business and have a material adverse effect on our financial condition and results of operations.
24
We face risks related to health epidemics and outbreaks of contagious diseases, including H5N1 influenza, H7N9 influenza, H9N2 influenza, Severe Acute Respiratory Syndrome, or SARS, Middle East Respiratory Syndrome, or MERS, Ebola virus and Zika virus.
There have been reports of outbreaks of a highly pathogenic influenza caused by the H5N1, H7N9 and H9N2 viruses, in certain regions of Asia and other parts of the world. In recent years, Ebola virus disease broke out in West Africa, with a number of people having died of the disease in countries such as Guinea, Sierra Leone and Liberia. There are also cases of patients diagnosed with Ebola in the United States and Europe. In addition, Zika virus disease broke out in the Americas in 2015 and is currently ongoing, infecting people throughout South America, Central America, Mexico and the Caribbean. The disease is strongly linked to cases of microcephaly and Guillain–Barré syndrome in Brazil. An outbreak of such contagious diseases in the human population could result in a widespread health crisis that could adversely affect the economies and financial markets of many countries. Additionally, a recurrence of SARS, a highly contagious form of atypical pneumonia, similar to the occurrence in 2003, which affected the PRC,P.R.C., Hong Kong, Taiwan, Singapore, Vietnam and certain other countries, and MERS, a viral respiratory infection which affected South Korea in 2015, would also have similar adverse effects. Since most of our operations and customers and suppliers are based in Asia (mainly in Taiwan and the PRC)P.R.C.), an outbreak of H5N1 influenza, H7N9 influenza, H9N2 influenza, SARS, MERS, Ebola, Zika virus or other contagious diseases in Asia or elsewhere, or the perception that such an outbreak could occur, and the measures taken by the governments of countries affected, including the ROCR.O.C. and the PRC,P.R.C., could adversely affect our business, financial condition or results of operations.
Escalation of tensions between South Korea and North Korea could have an adverse effect on our operations in South Korea and the market value of our shares.
Relationship between South Korea and North Korea have been tense throughout Korea’s modern history. The level of tension between the two Koreas has fluctuated and may increase abruptly as a result of current and future events. In recent years, there have been heighted security concerns stemming from North Korea’s nuclear weapons and ballistic missile programs and increased uncertainty regarding North Korea’s actions and possible responses from the international community.
26
Although we do not derive any revenue from, nor sell any products in, North Korea, any further increase in tensions between South Korea and North Korea that may occur, for example, if North Korea experiences a leadership crisis, high-level contacts between South Korea and North Korea break down, or military hostilities occur, could have a material adverse effect on the South Korea economy and on our South Korea subsidiary, our business, financial condition, results of operations and the market value of our common stock.
Any attempt by the U.S. government to withdraw from or materially modify existing international trade agreements or take further actions against certain P.R.C. technology companies could adversely affect our business, financial condition and results of operations.
The U.S. is currently undergoing major political changes, which has created uncertainty regarding future U.S. trade policies. The United States government has made certain comments that suggest the U.S. is not supportive of certain existing international trade agreements, such as the North America Free Trade Agreement. The United States government has also issued executive orders to withdraw the U.S. from the Trans-Pacific Partnership. The United States government has shown inclinations to withdraw the U.S. from the World Trade Organization, which can lead to greater economic instability. In addition, the United States government has also escalated disputes with certain P.R.C. technology companies, some of which are our clients, over issues in cybersecurity. Since mid-2018, political tension has increased between the U.S. and the P.R.C. and has escalated into a tariff war; this may negatively affect our business operations in the U.S and the P.R.C. At this time, it remains unclear what actions, if any, the United States government will take with respect to other existing international trade agreements. If the U.S. were to withdraw from or materially modify certain international trade agreements to which it is a party, or if tariffs continue to be raised on foreign-sourced goods imported to the U.S., our U.S. customers may seek new suppliers in the U.S. or other countries, and our business, financial condition and results of operations could be adversely affected.
Risks Relating to Ownership of Our Common Shares and the ADSs
The market for our common shares and the ADSs may not be liquid.
Active, liquid trading markets generally result in lower price volatility and more efficient execution of buy and sell orders for investors, compared to less active and less liquid markets. Liquidity of a securities market is often a function of the volume of the underlying shares that are publicly held by unrelated parties.
There has been no trading market outside the ROCR.O.C. for our common shares and the only trading market for our common shares is the Taiwan Stock Exchange.TWSE. The outstanding ADSs are listed on the New York Stock Exchange.NYSE. There is no assurance that the market for our common shares or the ADSs will be active or liquid.
Although ADS holders are entitled to withdraw our common shares underlying the ADSs from the depositary at any time, ROCR.O.C. law requires that our common shares be held in an account in the ROCR.O.C. or sold for the benefit of the holder on the Taiwan Stock Exchange.TWSE. In connection with any withdrawal of common shares from our ADS facility, the ADSs evidencing these common shares will be cancelled. Unless additional ADSs are issued, the effect of withdrawals will be to reduce the number of outstanding ADSs. If a significant number of withdrawals are effected, the liquidity of our ADSs will be substantially reduced. We cannot assure you that the ADS depositary will be able to arrange for a sale of deposited shares in a timely manner or at a specified price, particularly during periods of illiquidity or volatility.
If a non-ROCnon-R.O.C. holder of ADSs withdraws and holds common shares, such holder of ADSs will be required to appoint a tax guarantor, local agent and custodian in the ROCR.O.C. and register with the Taiwan Stock ExchangeTWSE or the Taipei Exchange in order to buy and sell securities on the Taiwan Stock Exchange.TWSE.
When a non-ROCnon-R.O.C. holder of ADSs elects to withdraw and hold common shares represented by ADSs, such holder of the ADSs will be required to appoint an agent for filing tax returns and making tax payments in the ROC.R.O.C. Such agent will be required to meet the qualifications set by the ROCR.O.C. Ministry of Finance and, upon appointment, becomes the guarantor of the withdrawing holder’s tax payment obligations. Evidence of the appointment of a tax guarantor, the approval of such appointment by the ROCR.O.C. tax authorities and tax clearance certificates or evidentiary documents issued by such tax guarantor may be required as conditions to such holder repatriating the profits derived from the sale of common shares. We cannot assure you that a withdrawing holder will be able to appoint, and obtain approval for, a tax guarantor in a timely manner.
27
In addition, under current ROCR.O.C. law, such withdrawing holder is required to register with the Taiwan Stock ExchangeTWSE or the Taipei Exchange and appoint a local agent in the ROCR.O.C. to, among other things, open a bank account and open a securities trading account with a local securities brokerage firm, pay taxes, remit funds and exercise such holder’s rights as a shareholder. Furthermore, such withdrawing holder must appoint a local bank or a local securities firm to act as custodian for confirmation and settlement of trades, safekeeping of securities and cash proceeds and reporting and declaration of information. Without satisfying these requirements, non-ROCnon-R.O.C. withdrawing holders of ADSs would not be able to hold or otherwise subsequently sell our common shares on the Taiwan Stock ExchangeTWSE or otherwise.
25
Pursuant to Mainland Investors Regulations, only QDIIs or persons that have otherwise obtained the approval from the MOEAIC and registered with the Taiwan Stock ExchangeTWSE are permitted to withdraw and hold our shares from a depositary receipt facility. In order to hold our shares, such QDIIs are required to appoint an agent and custodian as required by the Mainland Investors Regulations. If the aggregate amount of our shares held by any QDII or shares received by any QDII upon a single withdrawal or in the aggregate accounts for 10.0% of our total issued and outstanding shares, such QDII must obtain the prior approval from the MOEAIC. We cannot assure you that such approval would be granted.
The market value of your investment may fluctuate due to the volatility of the ROCR.O.C. securities market.
The trading price of our ADSs may be affected by the trading price of our common shares on the Taiwan Stock Exchange.TWSE. The ROCR.O.C. securities market is smaller and more volatile than the securities markets in the United States and in many European countries. The Taiwan Stock ExchangeTWSE has experienced substantial fluctuations in the prices and volumes of sales of listed securities and there are currently limits on the range of daily price movements on the Taiwan Stock Exchange.TWSE. The Taiwan Stock ExchangeTWSE Index peaked at 12,495.3 in February 1990, and subsequently fell to a low of 2,560.5 in October 1990. On March 13, 2000, the Taiwan Stock Exchange Index experienced a 617-point drop, which represented the single largest decrease in the Taiwan Stock Exchange Index in its history. During the period from January 1, 20152018 to December 31, 2015,2018, the Taiwan Stock Exchange Index peaked at 9,973.1211,235.11 on April 27, 2015,January 23, 2018, and reached a low of 7,410.349,478.99 on August 24, 2015. OverDecember 26, 2018. During the same period from January 1, 2018 to April 17, 2018, the trading price of ASE’s common shares ranged from NT$46.10 per share to NT$37.50 per share. The last trading day for ASE’s common shares was on April 17, 2018. The common shares of ASEH have begun trading since April 30, 2018. During the period from April 30, 2018 to December 31, 2018, the trading price of our common shares ranged from NT$48.0584.60 per share to NT$29.7556.10 per share. On April 28, 2016,19, 2019, the Taiwan Stock Exchange Index closed at 8,473.87,10,968.50 and the closing value of our common shares was NT$32.2075.50 per share.
The Taiwan Stock ExchangeTWSE is particularly volatile during times of political instability, including when relations between Taiwan and the PRCP.R.C. are strained. Several investment funds affiliated with the ROCR.O.C. government have also from time to time purchased securities from the Taiwan Stock ExchangeTWSE to support the trading level of the Taiwan Stock Exchange.TWSE. Moreover, the Taiwan Stock ExchangeTWSE has experienced problems such as market manipulation, insider trading and settlement defaults. The recurrence of these or similar problems could have an adverse effect on the market price and liquidity of the securities of ROCR.O.C. companies, including our common shares and ADSs, in both the domestic and international markets.
We may not continue to declare cash dividends in any particular amount.
We intend to continue to pay dividends. However, future dividends may be affected by, among other things, the best interests of our company and our shareholders, our results of operations, cash balances and future cash requirements, financial condition, investments and acquisitions, legal risks, and other factors that the board of directors may consider relevant. Our dividend payments may change from time to time, and we cannot assure that we will continue to declare dividends in any particular amounts. A reduction in, a delay of, or elimination of our dividend payments could adversely affect our share price.
Holders of common shares and ADSs may experience dilution if we issue stock bonuses and stock options to employees or sell additional equity or equity-linked securities.
Similar to other ROCR.O.C. technology companies, we issue bonuses from time to time in the form of common shares. Prior to 2009, bonuses issued in the form of our common shares were valued at par. Beginning in 2009, bonuses in the form of our common shares are valued at the closing price of our common shares on the day prior to our shareholders’ meeting. In addition, under the ROCR.O.C. Company Law we may, upon approval from our board of directors and the ROCR.O.C. Securities and Futures Bureau of the FSC, establish employee stock option plans provided that shareholders’ approval is required if the exercise price of an option would be less than the closing price of our common shares on the Taiwan Stock ExchangeTWSE on the grant date of the option. ASE Inc.maintained 2010 and 2015 employee stock option plans before the combination with SPIL.
28
ASEH assumed ASE’s obligations for employee share options that were issued before the execution of the Joint Share Exchange Agreement on April 30, 2018; all terms and conditions of the issued ASE share options remain the same, except that each ASE share option represents the right to purchase 0.5 ordinary share of ASEH.
In August 2018, our board of directors and FSC both approved the ASEH first employee share option plan. As a result, ASEH currently maintains three employee stock option plans pursuant to which our full-time employees, including our domestic and foreign subsidiaries, are eligible to receive stock option grants. As of December 31, 2015, 252,606,9502018, a total of 188,718,350 options assumed and granted by ASEH were outstanding, 56,855,850 of which were assumed from ASE Inc. were outstanding. In December 2014, the boardand 131,862,500 of directors approved the 5th Employee Share Option plans, and in April 2015, the FSC approved the 5th Employee Share Option plans, under which 94,270,000 options were granted in September 2015.by ASEH. See “Item 6. Directors, Senior Management and Employees—Compensation—ASE Inc.ASEH Employee BonusCompensation and Stock Option Plans.” The issuance of our common shares pursuant to stock bonuses or stock options may have a dilutive effect on the holders of outstanding common shares and ADSs.
26
In addition, the sale of additional equity or equity-linked securities may result in additional dilution to our shareholders. In September 2013, weASE issued 2018 Convertible Bonds to fund procurement of raw materials from overseas. The bonds are convertible by holders at any time on or after October 16, 2013 and up to (and including) August 26, 2018. As of December 31, 2015, none of the bonds has been converted into our common shares, and the balance of the outstanding bonds was US$400.0 million. The initial conversion price was NT$33.085 per common share, subject to adjustment upon the occurrence of certain events, such as the 2013 Capital Increase, the 2017 Capital Increase and cash dividend distribution. As of the date of this annual report, the conversion price is NT$30.28 per common share. Upon full conversion, the outstanding bonds will be converted into 395,719,947 common shares if based on the current conversion price, representing 5.0% of our outstanding shares at the end of December 31, 2015. Any conversion of bonds, in full or in part, would dilute the ownership interest of our existing shareholders and our earnings per share and could adversely affect the market price of our ADSs. Moreover,The bondholders have exercised conversion rights to convert 2018 Convertible Bonds of US$399.6 million into 424,258,000 common shares at conversion prices ranging from NT$27.95 to NT$28.96 per common share. The converted common shares represented 5% of our outstanding shares as of December 31, 2017. In the third quarter of 2017, the closing price of our common shares (translated into U.S. dollars at the prevailing rates) for a period of 20 consecutive trading days was higher than 130% of the conversion price in U.S. dollar translated at the fixed exchange rate of US$1 to NT$29.956 determined on pricing date per common share. As a result, ASE redeemed the outstanding 2018 Convertible Bonds of US$0.4 million in September 2017. In July 2015,ASE issued 2018 NTD-linked Convertible Bonds to fund procurement of equipment from overseas. The NTD-linked Convertible Bonds are zero coupon bonds with a maturity of 2.75 years. The initial conversion price was NT$54.5465 per common share, subject to certain adjustments, determined on the basis of a fixed exchange rate of NT$30.928 = US$1.00 (which represents an approximately 27.0% conversion premium over the closing trading price of our common shares on June 25, 2015 of NT$42.95 per common share). The bonds expired in March 2018 and none have been exercised. ASE redeemed the Currency Linked Bonds in cash in an amount by converting the par value into New Taiwan dollar amount using a fixed exchange rate of US$1 to NT$30.928 and then back to U.S. dollar amount using the applicable prevailing rate at the time of redemption on March 27, 2018. As of the date of this annual report, there is no convertible bond held by the Company.
In September 2013, weASE issued 130,000,000 common shares for public subscription, which was effected by way of an increase in our authorized share capital in the amount of NT$1,300.0 million. Moreover, in March 2017, ASE granted rights to the record holders of our existing common shares to subscribe for an aggregate of 240,000,000 of our common shares, par value NT$10.0 per share (the “Rights Offering”). Substantially concurrently with the Rights Offering, ASE also offered 30,000,000 of our common shares to our employees (the “Employee Offering”) and offered 30,000,000 of our common shares to the public in Taiwan (the “Taiwan Public Offering”, together with the Rights Offering and the Employee Offering, the “2017 Capital Increase”). The issuance of the zero coupon convertible bonds due 2018 and the Capital Increaseadditional equity or equity-linked securities could cause dilution to our ADS holders.
29
Restrictions on the ability to deposit our common shares into our ADS facility may adversely affect the liquidity and price of our ADSs.
The ability to deposit common shares into our ADS facility is restricted by ROCR.O.C. law. A significant number of withdrawals of common shares underlying our ADSs would reduce the liquidity of the ADSs by reducing the number of ADSs outstanding. As a result, the prevailing market price of our ADSs may differ from the prevailing market price of our common shares on the Taiwan Stock Exchange.TWSE. Under current ROCR.O.C. law, no person or entity, including you and us, may deposit our common shares in our ADS facility without specific approval of the FSC, unless:
| (1) | we pay stock dividends on our common shares; |
| (2) | we make a free distribution of common shares; |
| (3) | holders of ADSs exercise preemptive rights in the event of capital increases; or |
| (4) | to the extent permitted under the deposit agreement and the relevant custody agreement, investors purchase our common shares, directly or through the depositary, on the |
With respect to item (4) above, the depositary may issue ADSs against the deposit of those common shares only if the total number of ADSs outstanding following the deposit will not exceed the number of ADSs previously approved by the FSC, plus any ADSs issued pursuant to the events described in items (1), (2) and (3) above.
In addition, in the case of a deposit of our common shares requested under item (4) above, the depositary will refuse to accept deposit of our common shares if such deposit is not permitted under any legal, regulatory or other restrictions notified by us to the depositary from time to time, which restrictions may include blackout periods during which deposits may not be made, minimum and maximum amounts and frequency of deposits.
The depositary will not offer holders of ADSs preemptive rights unless the distribution of both the rights and the underlying common shares to our ADS holders are either registered under the Securities Act or exempt from registration under the Securities Act.
Holders of ADSs will not have the same voting rights as our shareholders, which may affect the value of their ADSs.
The voting rights of a holder of ADSs as to our common shares represented by its ADSs are governed by the deposit agreement. Holders of ADSs will not be able to exercise voting rights on an individual basis. If holders representing at least 51% of the ADSs outstanding at the relevant record date instruct the depositary to vote in the same manner regarding a resolution, including the election of directors, the depositary will cause all common shares represented by the ADSs to be voted in that manner. If the depositary does not receive timely instructions representing at least 51% of the ADSs outstanding at the relevant record date to vote in the same manner for any resolution, including the election of directors, holders of ADSs will be deemed to have instructed the depositary or its nominee to authorize all our common shares represented by the ADSs to be voted at the discretion of our chairman or his designee, which may not be in the interest of holders of ADSs. Moreover, while shareholders who own 1% or more of our outstanding shares are entitled to submit one proposal to be considered at our annual general meetings of shareholders, only holders representing at least 51% of our ADSs outstanding at the relevant record date are entitled to submit one proposal to be considered at our annual general meetings of shareholders. Hence, only one proposal may be submitted on behalf of all ADS holders.
27
The right of holders of ADSs to participate in our rights offerings is limited, which could cause dilution to your holdings.
We may from time to time distribute rights to our shareholders, including rights to acquire our securities. Under the deposit agreement, the depositary will not offer holders of ADSs those rights unless both the distribution of the rights and the underlying securities to all our ADS holders are either registered under the Securities Act or exempt from registration under the Securities Act. Although we may be eligible to take advantage of certain exemptions under the Securities Act available to certain foreign issuers for rights offerings, we can give no assurances that we will be able to establish an exemption from registration under the Securities Act, and we are under no obligation to file a registration statement for any of these rights. Accordingly, holders of ADSs may be unable to participate in our rights offerings and may experience dilution of their holdings.
30
If the depositary is unable to sell rights that are not exercised or not distributed or if the sale is not lawful or reasonably practicable, it will allow the rights to lapse, in which case holders of ADSs will receive no value for these rights.
For example, in March 2017, we granted rights to the record holders of our existing common shares to subscribe for an aggregate of 240,000,000 of our common shares (the “New Shares”), while the holders of ADSs were not given rights to subscribe for new ADSs and do not have the right to instruct the depositary to subscribe for the New Shares on their behalf. If a holder of ADSs wants the rights corresponding to the common shares underlying such ADSs to be exercised, such holder needs to surrender the ADSs to the depositary and instruct the depositary to deliver the underlying common shares to a securities brokerage account in Taiwan specified by such holder.
Changes in exchange controls, which restrict your ability to convert proceeds received from your ownership of ADSs, may have an adverse effect on the value of your investment.
Under current ROCR.O.C. law, the depositary, without obtaining approvals from the Central Bank of the Republic of China (Taiwan) or any other governmental authority or agency of the ROC,R.O.C., may convert NT dollars into other currencies, including U.S. dollars, for:
| · | the proceeds of the sale of common shares represented by ADSs or received as stock dividends from our common shares and deposited into the depositary receipt facility; and |
| · | any cash dividends or distributions received from our common shares. |
In addition, the depositary may also convert into NT dollars incoming payments for purchases of common shares for deposit in the ADS facility against the creation of additional ADSs. The depositary may be required to obtain foreign exchange approval from the Central Bank of the Republic of China (Taiwan) on a payment-by-payment basis for conversion from NT dollars into foreign currencies of the proceeds from the sale of subscription rights for new common shares. Although it is expected that the Central Bank of the Republic of China (Taiwan) will grant this approval as a routine matter, we cannot assure you that in the future any approval will be obtained in a timely manner, or at all.
Under the ROCR.O.C. Foreign Exchange Control Law,Act, the Executive Yuan of the ROCR.O.C. government may, without prior notice but subject to subsequent legislative approval, impose foreign exchange controls in the event of, among other things, a material change in international economic conditions. We cannot assure you that foreign exchange controls or other restrictions will not be introduced in the future.
The value of your investment may be reduced by possible future sales of common shares or ADSs by us or our shareholders.
While we are not aware of any plans by any major shareholders to dispose of significant numbers of common shares, we cannot assure you that one or more existing shareholders or owners of securities convertible or exchangeable into or exercisable for our common shares or ADSs will not dispose of significant numbers of common shares or ADSs. In addition, several of our subsidiaries and affiliates hold common shares, depositary shares representing common shares and options to purchase common shares or ADSs. They may decide to sell those securities in the future. See “Item 7. Major Shareholders and Related Party Transactions—Major Shareholders” for a description of our significant shareholders and affiliates that hold our common shares.
We cannot predict the effect, if any, that future sales of common shares or ADSs, or the availability of common shares or ADSs for future sale, will have on the market price of our common shares or the ADSs prevailing from time to time. Sales of substantial numbers of common shares or ADSs in the public market, or the perception that such sales may occur, could depress the prevailing market prices of our common shares or the ADSs.
28
Item 4. Information on the Company
HISTORY AND DEVELOPMENT OF THE COMPANY
Advanced Semiconductor Engineering, Inc.As mentioned in Item 3. Key Information—Selected Financial Data, ASE Technology Holding Co.,Ltd. was incorporatedjointly established on March 23, 1984April 30, 2018 as a company limited by shares under the ROCR.O.C. Company Law, with facilities inby the Nantze Export Processing Zonecombination of Advanced Semiconductor Engineering, Inc., which was incoporated on March 23, 1984 and Siliconware Precision Industries Co., Ltd., which was incoporated on May 17, 1984.
31
As of January 31, 2019, ASEH directly controls ASE, SPIL, and USI Group. ASEH’s manufacturing facilties are located in Kaohsiung, Taiwan.Taiwan, China, South Korea, Japan, Singapore, Malaysia, Mexico, America and Europe. Our principal executive offices are located at 26 Chin Third Road, Nantze Export Processing Zone, Nantze, Kaohsiung, Taiwan, ROCR.O.C. and our telephone number at the above address is (886) 7-361-7131. Our common shares have been listed on the Taiwan Stock ExchangeTWSE under the symbol “2311” since July 1989,“3711” and ADSs representing our common shares have been listed on the New York Stock ExchangeNYSE under the same ticker symbol “ASX” since September 2000.April 2018.
Acquisition of Common Shares and American Depositary Shares of SPIL
In August 2015, weASE announced an offer to purchase 779,000,000 common shares (including those represented by American depositary shares) of SPIL through concurrent tender offers in the ROCR.O.C. and the U.S., at a price of NT$45 per SPIL common share and NT$225 per SPIL American depositary share. The Initial SPIL Tender Offer expired on September 22, 2015, with 1,147,898,165 common shares (including those represented by American depositary shares) validly tendered and not validly withdrawn, exceeding the offer cap, and as a result, after proration, 725,749,060 SPIL common shares and 10,650,188 SPIL American depositary shares were accepted for purchase. On October 1, 2015, weASE became a shareholder holding approximately 24.99% of the issued and outstanding share capital in SPIL.
In December 2015, following an announcement by SPIL that it plans to issue 1,033 million shares, if approved by SPIL shareholders, to a third party pursuant to a share placement agreement, weASE submitted a written proposal to SPIL’s Board proposing to acquire all SPIL shares not otherwise owned by ASE, contingent upon the termination of the share placement agreement. The board of directors of SPIL (“SPIL Board”) did not respond to our acquisition proposal. Subsequently, weASE launched an offer to purchase 770,000,000 common shares (including those represented by American depositary shares) of SPIL through concurrent tender offers in the ROCR.O.C. and the U.S., at a price of NT$55 per SPIL common share and NT$275 per SPIL American depositary share. The Second SPIL Tender Offer expired on March 17, 2016. Because the TFTC did not render a decision before the expiration of the Second SPIL Tender Offer, resulting in the failure to satisfy one of the tender offer conditions, the Second SPIL Tender Offer was not successful. The TFTC subsequently suspended its review on March 23, 2016.
Notwithstanding the failure of the Second SPIL Tender Offer, we announced that we will continueASE continued to seek control of SPIL, with the purpose of effecting the SPIL Merger. In order to implement the SPIL Merger, we announced that we intend to seek to discharge the SPIL Board at one or more shareholders’ meetings, or await the expirationan acquisition of the current SPIL Board’s term, and elect new nominees to the SPIL Board. If after such election one half or more of the SPIL Board is composed of candidates nominated or designated by us, we intend, in accordance with the Enterprise Mergers and Acquisitions Act, to cause the SPIL Board to resolve in favor a SPIL Merger.
We expect to continue to seek the support of SPIL shareholders in order to acquire 100% of the issuedcommon shares and outstanding share capitalAmerican depositary shares of SPIL. Simultaneously with the acquisition of SPIL, not owned by us, by all legally available means, and will continue to seek all necessary antitrust or other regulatory approvals in Taiwan, the United States and other jurisdictions where we do business. In addition, upon the completion of the SPIL Merger, we planASE planned to establish a holding company in Taiwan that willwould hold 100% of the equity interests inof both ASE and SPIL such that ASE and SPIL willwould be wholly owned subsidiaries of such holding company. The proposed new holding company, willwhich would maintain all current operations of ASE and SPIL in Taiwan.SPIL.
In March and April 2016, weASE acquired an additional 258,300,000 common shares of SPIL (including those represented by American depositary shares) through open market purchases. As
In June 2016, ASE entered into the Joint Share Exchange Agreement with SPIL, pursuant to which ASEH was formed by means of April 28, 2016, we beneficially own 1,037,300,000 commona statutory share exchange pursuant to the laws of the Republic of China, and ASEH (i) acquired all issued shares of ASE in exchange for shares of ASEH, and (ii) acquired all issued shares of SPIL (calculated as the sum of 935,596,800 common shares of SPIL and 101,703,200 common shares of SPIL underlying 20,340,640using cash consideration.
On January 16, 2018, ASE converted 9,690,452 American depositary shares of SPIL), representing 33.29%SPIL that it owned into 48,452,260 common shares.
On February 12, 2018, ASE and SPIL respectively held extraordinary general shareholders’ meetings and each approved the proposed Joint Share Exchange, pursuant to which, ASEH acquires 100% of the issuedboth ASE and outstanding share capitalSPIL shares.
The Share Exchange consummated on April 30, 2018, and ASE and SPIL became privately held and wholly owned subsidiaries of SPIL (calculated based on 3,116,361,139ASEH concurrently. The common shares of ASE and SPIL (including those represented by American depositary shares) outstanding as of March 31, 2016 as reported in SPIL’s annual report on Form 20-F forwere delisted from the year ended December 31, 2015).TWSE and their respective ADSs were delisted from NYSE and NASDAQ.
2932
We will otherwise continue to seek opportunities for cooperation with SPIL, subject to applicable law. In addition, we intend to consider other possibilities, including further acquisitions ofThe common shares of SPIL, including those represented by American depositary shares, whetherASEH are now listed on the TWSE and have begun trading in Taiwan under the stock symbol “3711”, and the ADSs of ASEH are now listed on the NYSE and have begun trading in the market, privately negotiated transactions, or through one or more tender offers, or one or more other potential transactions. We will continue to review our investment in SPIL onU.S. under the basis of available information and reserve the right to increase or decrease our ownership stake from time to time.same ticker symbol “ASX”.
There were no public takeover offers by third parties of ASE’s shares which occurred in 2014 and 2015.
2018 NTD-linked Convertible Bonds
In July 2015, we completed an offering of US$200.0 million aggregate principal amount of NTD-linked zero coupon convertible bonds due 2018. The 2018 NTD-linked Convertible Bonds were offered to persons outside of the United States in compliance with Regulation S under the Securities Act. The bonds will mature on March 27, 2018, unless previously repurchased or converted in accordance with their terms prior to such date. The net proceeds from the offering were used to fund procurement of equipment from overseas. Please refer to note 18 of our consolidated financial statements included in this annual report for more information. As of December 31, 2015, the balance of the outstanding convertible bonds was US$200.0 million.
ASEEE
On May 8, 2015, we entered into a joint venture agreement with TDK Corporation, under which both parties would invest in ASE Embedded Electronics Inc. (“ASEEE”), a company limited by shares incorporated under ROC law. ASEEE will engage in the business of manufacture, marketing, distribution and sale of embedded substrates and it plans to leverage TDK Corporation’s expertise, patents and knowledge in the field of SESUB technology. In August 2015, we invested NT$618.1 million (US$18.9 million) for 51% shareholding in ASEEE. The investment in ASEEE is accounted for using the equity method. See “Item 10. Material Contracts—Joint Venture Agreement between ASE and TDK Corporation” for more information.
USI Group Restructuring
In April 2015, our subsidiary Universal Scientific Industrial completed a spin-off of its subsidiaries to USI Inc..Inc. As a result of such spin-off, as of April 1, 2015, ASE Inc. held approximately 99.01% of Universal Scientific Industrial and approximately 99.17% of USI Inc.
Universal Scientific Industrial, USI Inc. and USI Inc.’s directly and indirectly held subsidiaries (collectively, the “USI Group”) primarily engage in electronic manufacturing services in relation to computers,computing and storage, consumer electronics, communications, industrial and automotive, among other services and businesses. As part of our corporate reorganization to align each business function to different legal entity groups, the board of directors of ASE Inc. passed a resolution on September 24, 2015 and approved the sale of all ASE Inc.’sASE’s shareholding in Universal Scientific Industrial to UGTW, an indirectly held subsidiary of USI Inc., which will result in USI Inc. indirectly holding Universal Scientific Industrial (the “Universal Scientific Industrial Share Transfer”). The Universal Scientific Industrial Share Transfer was approved by the Investment Commission of MOEA on February 3, 2016 and the2016. The majority of ASE Inc.’sASE’s shares in Universal Scientific Industrial were transferred to UGTW in March 2016, withand the remaining shares to bewere transferred in May 2016.
For more informationTo increase operational flexibility through organizational restructure, ASE’s board of directors resolved in October 2018 to spin off its investment department, which is responsible for managing the ordinary shares and assets of USI Inc. as well as relevant assets into a newly-established company, USI Global Inc. (“USI Global”). USI Global issued 30,000,000 new ordinary shares to ASEH as consideration for the spin-off. The spin-off consummated in November 2018 and ASEH obtained control over ASE and USI Global. In December 2018, the board of directors of ASEH and USI Global resolved to merge and the merger consummated in January 2019. ASEH became the surviving company from the merger and USI Global was dissolved after the merger. After the merger, ASEH directly held 100.0% of the outstanding shares of USI Inc. The aforementioned USI Global spin off and merger have no material effect on our historyfinancial and development, see “—Organizational Structure.”operational results.
Capital Expenditures
Our principal capital expenditures for the years ended December 31, 2013, 20142016, 2017 and 20152018 have been for machinery and equipment procurements and investments in buildings and improvement in connection with the expansion of our capacity expansion, for which we spent NT$27,044.1 27,680.9 million, NT$43,448.6 23,677.7 million and NT$28,280.839,092.2 million (US$862.51,277.1 million), respectively. We had commitments for capital expenditures of approximately US$246.7NT$17,039.5 million (US$556.7 million), of which US$53.6NT$2,339.3 million (US$76.4 million) had been paid as of December 31, 2015,2018, mainly in connection with the expansion of our packaging and testing services operations primarily in the ROCR.O.C. and the PRC.P.R.C. Any future expansion of our operating activities could result in additional capital expenditures. We anticipate our capital expenditures in 20162019 will be financed through our existing cash, marketable securities, expected cash flow from operations and existing credit lines under our loan facilities and will consist of, among other things, additional machinery and equipment procurements for our capacity expansions. See “Item 5. Operating and Financial Review and Prospects—Liquidity and Capital Resources” for more information. Other than the 100% acquisition of SPIL common shares and American depositary shares of SPILDepositary Shares by way of the Initial SPIL Tender Offer, the Share Exchange pursuant to the Joint Share Exchange Agreement and through open market purchases, there were no significant financial investments or divestitures in 2013, 20142016, 2017 and 2015.2018. See “Item 4. Information on the Company—History and Development of the Company—Acquisition of Common Shares and American Depositary Shares of SPIL” for information.
30
For more information on our history and development, see “—Organizational Structure.”
ASEASEH is among thea leading providersprovider of semiconductor packagingmanufacturing services in assembly and testing services based on 2015 revenues.testing. Our services include semiconductor packaging, production of interconnect materials, front-end engineering testing, wafer probing and final testing services, as well as integrated solutions for electronic manufacturing services in relation to computers and storage, peripherals, communications, industrial, automotive, and storage and server applications.
33
We believe that, as a result of the following strengths, we are able to compete effectively to meet customers’ requirements across a wide range of end-use applications:
| · | our ability to provide a broad range of cost-effective semiconductor packaging and testing services on a large-scale turnkey basis within key centers of semiconductor manufacturing; |
| · | our expertise in developing and providing cost-effective packaging, interconnect materials and testing technologies and solutions; |
| · | our ability to provide proactive original design manufacturing services using innovative solution-based designs; |
| · | our commitment to investing in capacity expansion and research and development, as well as selective acquisitions, that will benefit customers and our business; |
| · | our geographic presence in key centers of outsourced semiconductor and electronics manufacturing; and |
| · | our long-term relationships with providers of complementary semiconductor manufacturing services, including our strategic alliance with TSMC, one of the world’s largest dedicated semiconductor foundries. |
We believe that it is still the trend for semiconductor companies to outsource their packaging, testing and manufacturing requirements as semiconductor companies rely on independent providers of foundry, packaging and testing and electronic manufacturing services.In response to the increased pace of new product development and shortened product life and production cycles, semiconductor companies are increasingly seeking both independent packaging and testing companies that can provide turnkey services in order to reduce time-to-market and electronic manufacturing companies with proactive original design capabilities that can provide large-scale production. We believe that our technological expertise and scale and our ability to integrate our broad range of solutions into turnkey services and electronic manufacturing services allow us to benefit from the accelerated outsourcing trend and better serve our existing and potential customers.
We believe that we have benefited, and will continue to benefit, from our geographic location in Taiwan. Taiwan is currently the largest center for outsourced semiconductor manufacturing in the world and has a high concentration of electronic manufacturing service providers. Our close proximity to foundries and other providers of complementary semiconductor manufacturing services is attractive to our customers who wish to take advantage of the efficiencies of a total semiconductor manufacturing solution by outsourcing several stages of their manufacturing requirements. We believe that, as a result, we are well positioned to meet the advanced semiconductor engineering and manufacturing requirements of our customers.
Industry Background
General
Semiconductors are the basic building blocks used to create an increasing variety of electronic products and systems. Continuous improvements in semiconductor process and design technologies have led to smaller, more complex and more reliable semiconductors at a lower cost per function. These improvements have resulted in significant performance and price benefits to manufacturers of electronic products. As a result, semiconductor demand has grown substantially in our primary end-user markets for communications, computing and consumer electronics, and has experienced increased growth in other markets such as automotive products and industrial automation and control systems.
31
The semiconductor industry is characterized by strong long-term growth, with periodic and sometimes severe cyclical downturns. The Semiconductor Industry Association reported that worldwide sales of semiconductors increased from approximately US$51.0 billion in 1990 to approximately US$335.2468.8 billion in 2015.2018. We believe that overall growth and cyclical fluctuations will continue over the long-term in the semiconductor industry.
34
Electronic Manufacturing Services
Electronic manufacturing service providers typically achieve large economies of scale in manufacturing by pooling together product design techniques and also provide value-added services such as warranties and repairs. Companies who do not need to manufacture a constant supply of products have increasingly outsourced their manufacturing to these service providers so that they can respond quickly and efficiently to sudden spikes in demand without having to maintain large inventories of products.
Electronic manufacturing services are sought by companies in a wide range of industries including, among others, information, communications, computers and storage, consumer electronics, automotive electronics, medical treatment, industrial applications, aviation, navigation, national defense and transportation. Although affected by global economic fluctuations, we expect the electronic manufacturing services industry to continue to grow in the long-term, and we have enhanced our presence in the industry since 2010 through our acquisition of a controlling interest in Universal Scientific.Scientific Industrial and acquisition of all the shares of USI Inc. in September 2018.
Outsourcing Trends in Semiconductor Manufacturing
Historically, semiconductor companies designed, manufactured, packaged and tested semiconductors primarily within their own facilities. However, there is a clear trend in the industry to outsource the manufacturing process. Virtually every significant stage of the manufacturing process can be outsourced. Wafer foundry services, semiconductor packaging and testing services, and electronic manufacturing services are currently the largest segments of the independent semiconductor manufacturing services market.
The availability of technologically advanced independent manufacturing services has also enabled the growth of “fabless” semiconductor companies that focus on semiconductor design and marketing, while outsourcing their wafer fabrication, packaging and testing requirements to independent companies. We believe that the growth in the number and scale of fabless semiconductor companies that rely solely on independent companies to meet their manufacturing requirements will continue to be a driver of growth for us. Similarly, the availability of technologically advanced independent manufacturing services has encouraged integrated device manufacturers, which traditionally have relied on in-house semiconductor manufacturing capacity, to increasingly outsource their manufacturing requirements to independent semiconductor manufacturing companies.
We believe the outsourcing of semiconductor manufacturing services will increase in the future for many reasons, including the following:
| · | Technological Expertise and Significant Capital Expenditure. Semiconductor manufacturing processes have become highly complex, requiring substantial investment in specialized equipment and facilities and sophisticated engineering and manufacturing expertise. In addition, product life cycles have been shortening, magnifying the need to continuously upgrade or replace manufacturing equipment to accommodate new products. As a result, new investments in in-house facilities are becoming less desirable to integrated device manufacturers because of the high investment costs as well as the inability to achieve sufficient economies of scale and utilization rates necessary to be competitive with the independent service providers. Independent packaging, testing, wafer foundry and electronic manufacturing services companies, on the other hand, are able to realize the benefits of specialization and achieve economies of scale by providing services to a large base of customers across a wide range of products. This enables them to reduce costs and shorten production cycles through high capacity utilization and process expertise. In the process, they are also able to focus on discrete stages of semiconductor manufacturing and deliver services of superior quality. |
Some semiconductor companies with in-house operations are under increasing pressure to rationalize these operations by relocating to locations with lower costs or better infrastructure, in order to lower manufacturing costs and shorten production cycle time. We expect semiconductor companies to increasingly outsource their requirements to take advantage of the advanced technology and scale of operations of independent packaging and testing companies and electronic manufacturing services providers.
3235
| · | Focus on Core Competencies. As the semiconductor industry becomes more competitive, semiconductor companies are expected to further outsource their semiconductor manufacturing requirements in order to focus their resources on core competencies, such as semiconductor design and marketing. |
| · | Time-to-Market Pressure. The increasingly short product life cycle has accelerated time-to-market pressure for semiconductor companies, leading them to rely increasingly on outsourced suppliers as a key source for effective manufacturing solutions. |
| · | Capitalize on the High Growth Rates in Emerging Markets. Emerging markets, and China in particular, have become both major manufacturing centers for the technology industry and growing markets for technology-based products. Thus, in order to gain direct access to the Chinese market, many semiconductor companies are seeking to establish manufacturing facilities in China by partnering with local subcontractors. As a result, certain stages of the semiconductor manufacturing process that were previously handled in-house will be increasingly outsourced in order to improve efficiency. |
Trends of Mergers and Acquisitions in the Semiconductor Industry
The global semiconductor industry is highly competitive, and such competitive landscape is changing as a result of a trend toward consolidation within the industry. In particular, packaging and testing service providers in the semiconductor industry have engaged in cross-border mergers and acquisitions in recent years as part of their expansion strategy, which has gradually changed the ecosystem of the semiconductor industry. Examples of mergers and acquisitions in recent years include mergers and acquisitions by and among semiconductor design companies or integrated device manufacturers, including Intel Corporation’s acquisition of Altera Corporation, ON Semiconductor Corporation’s acquisition of Fairchild Semiconductor International, Inc., NXP Semiconductors N.V.’s acquisition of Freescale Semiconductor, Inc., Avago Technologies Ltd.’s acquisition of Broadcom Corporation, and several acquisitions of semiconductor design companies by MediaTek, Inc., Bain Capital’s acquisition of Toshiba Corporation’s memory chip business, Microchip Technology Inc.’s acquisition of Atmel Corporation and Microsemi Corporation, Qualcomm Incorporated’s attempted acquisition of NXP Semiconductors, and Broadcom Limited’s attempted acquisition of Qualcomm Incorporated. Examples of mergers and acquisitions by and among semiconductor packaging and testing companies, including Jiangsu Changjiang Electronics Technology Co., Ltd.’s acquisition of STATS ChipPAC Ltd., Nantong Fujitsu Microelectronics Co., Ltd.’s acquisition of the packaging and testing factory of Advanced Micro Devices, Inc. and, Amkor Technology, Inc.’s acquisition of J-Devices Corporation.
As a result of the aforementioned mergers and acquisitions, our competitors were able to further strengthen their competitive position by expanding their product offerings and combining their financial resources. We expect this consolidation trend to continue in 2016.continue.
Overview of Semiconductor Manufacturing Process
The manufacturing of semiconductors is a complex process that requires increasingly sophisticated engineering and manufacturing expertise. The manufacturing process can be generally divided into the following stages:
3336
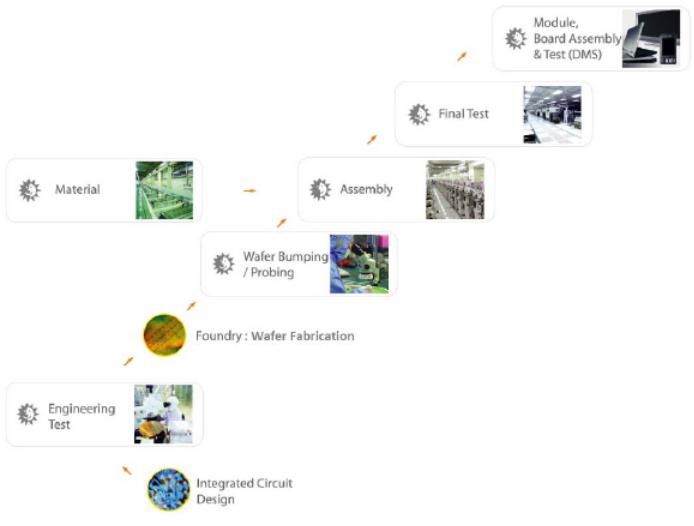
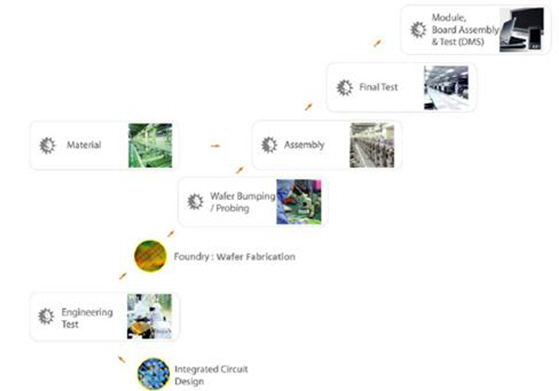
37
We are involved in all stages of the semiconductor manufacturing process except circuit design and wafer fabrication.
Process | Description |
| 1. Circuit Design | The design of a semiconductor is developed by laying out circuit components and interconnections. |
| 2. Engineering Test | Throughout and following the design process, prototype semiconductors undergo engineering testing, which involves software development, electrical design validation and reliability and failure analysis. |
| 3. Wafer Fabrication | Process begins with the generation of a photomask through the definition of the circuit design pattern on a photographic negative, known as a mask, by an electron beam or laser beam writer. These circuit patterns are transferred to the wafers using various advanced processes. |
| 4. Wafer Probe | Each individual die is electrically tested, or probed, for defects. Dies that fail this test are marked to be discarded. |
| 5. Packaging (or Assembly) | Packaging, also called assembly, is the processing of bare semiconductors into finished semiconductors and serves to protect the die and facilitate electrical connections and heat dissipation. The patterned silicon wafers received from our customers are diced by means of diamond saws into separate dies, also called chips. Basically each die is attached to a leadframe or a laminate (plastic or tape) substrate by epoxy resin. A leadframe is a miniature sheet of metal, generally made of copper and silver alloys, on which the pattern of input/output leads has been cut. On a laminate substrate, typically used in ball grid array, or BGA, packages, the leads take the shape of small bumps or balls. Leads on the leadframe or the substrate are connected by extremely fine gold or copper wires or bumps to the input/output terminals on the chips, through the use of automated machines known as “bonders.” Each chip is then encapsulated, generally in a plastic casing molded from a molding compound, with only the leads protruding from the finished casing, either from the edges of the package as in the case of the leadframe-based packages, or in the form of small bumps on a surface of the package as in the case of BGA or other substrate-based packages. |
34
|
|
| 6. Final Test | Final testing is conducted to ensure that the packaged semiconductor meets performance specifications. Final testing involves using sophisticated testing equipment known as testers and customized software to electrically test a number of attributes of packaged semiconductors, including functionality, speed, predicted endurance and power consumption. The final testing of semiconductors is categorized by the functions of the semiconductors tested into logic/mixed-signal/RF/3D IC/discrete final testing and memory final testing. Memory final testing typically requires simpler test software but longer testing time per device tested. |
| 7. Module, Board Assembly and Test | Module, board assembly and test refers to the combination of one or more packaged semiconductors with other components in an integrated module or board to enable increased functionality. |
38
| 8. Material | Material refers to the interconnection of materials which connect the input/output on the semiconductor dies to the printed circuit board, such as substrate, leadframe and flip-chip. |
Strategy
Our objective is to provide integrated solutions that set industry standards, including packaging, testing services, interconnect materials design and production capabilities, and to lead and facilitate the industry trend toward outsourcing semiconductor manufacturing requirements. The principal elements of our strategy are to:
Grow Our Packaging Services and Expand Our Range of Offerings
We believe that an important factor to attract leading semiconductor companies as our customers has been our ability to fulfill demand for a broad range of packaging solutions on a large scale. We intend to continue to develop process and product technologies to meet the packaging requirements of clients. Our expertise in packaging technology has enabled us to develop sophisticated solutions such as flip-chip packaging, bump chip carrier packaging, stacked die packaging and fine-pitch wire bonding. We are continuously investing in research and development in response to and in anticipation of migrations in technology and intend to continue to acquire access to new technologies through strategic alliances and licensing arrangements.
The increasing miniaturization of semiconductors and the growing complexity of interconnect technology have also resulted in the blurringconvergence of the traditional distinctions among assembly processes at different levels of integration: chip, module, board and system. In response to this miniaturization and growing complexity, we have focused on providing module assembly services and, in addition, our subsidiary Universal Scientific Industrial has provided us with access to process and product technologies at the levels of module, board and system assembly and testing, which helps us to better anticipate industry trends and take advantage of potential growth opportunities. We expect to continue to combine our packaging, testing and materials technologies with the expertise of Universal Scientific Industrial at the systems level to develop our SiP business.
35
Strategically Expand and Streamline Production Capacity
To capitalize on the growing demand for packaging and testing services, we intend to strategically expand our production capacity, both through internal growth and selective acquisitions and joint ventures, with a focus on providing cost competitive and innovative packaging and testing services.
We intend to invest in trends that are essential to the development of the industry. We plan to expand our capacity with respect to, but not limited to, 12-inch wafer process, bumping, FC-CSP and SiP products to meet demand for smaller form factors, higher performance and higher packaging density.
In addition, we intend to promote our copper wire solutions to our customers in addition to gold wire. Gold wire is a significant raw material for us. Gold prices, however, are subject to intense fluctuations and have in the past impacted our profitability. We believe that replacing gold wire in some of our packages with copper wire technology will not only improve our profitability but will also enable us to provide more value to our customers by providing lower cost solutions, which could enhance our competitiveness and market share. We are currently the industry leader in terms of copper wire capacity. We thus plan to capitalize on the overall industry trend of copper conversion by maintaining our leadership and focusing on integrating copper wire into a wider range of traditional leadframe-based packages and higher end substrate-based packages.
We expect to focus our packaging and testing on providing cost competitive services through better management of capacity utilization and efficiency improvements and offer our services on a large scale with the intention of driving more integrated device manufacturer outsourcing in the long-run. Before the consummation of the Share Exchange, SPIL entered into an agreement to sell 30.0% of its equity interest in Siliconware Technology (Suzhou) Limited to Tsinghua Unigroup Ltd. In August 2018, we also resolved to sell 30.0% of our equity interest in ASEN to Tsinghau Unigroup Ltd.. We believe our strategic relationships with Tsinghua Unigroup Ltd. will enable us to expand our commercial reach in the P.R.C.’s fast-growing semiconductor market.
39
We evaluate acquisition and joint venture opportunities on the basis of access to new markets and technology, the enhancement of our production capacity, improvement of research and development capabilities, economies of scale and management resources, and closer proximity to existing and potential customers. For example,In 2010, we acquired controlling interests in Universal Scientific in 2010Industrial to broaden our offerings to include integrated solutions for electronic manufacturing services in relation to computers and storage, peripherals, communications, industrial, automotive, and storage and server applications. In addition, in May 2015, we entered into a joint venture agreement with TDK Corporation to invest in ASEEE to further expand our business in embedded substrates. WeIn February 2019, ASE’s board of directors resolved to purchase ordinary shares newly issued by ASEEE at par value through its capital increase by cash. In September 2015, we acquired 779,000,000 common shares (including common shares represented by American depositary shares) of SPIL through the Initial SPIL Tender Offer in September 2015Offer.In March and attempted to acquireApril 2016, we acquired an additional 770,000,000258,300,000 common shares of SPIL (including common sharesthose represented by American depositary shares) ofthrough open market purchases. In June 2016, we entered into the Joint Share Exchange Agreement with SPIL, on December 29, 2015 throughand in April 2018, after the Second SPIL Tender Offer. Notwithstanding the failureconsummation of the SecondShare Exchange, ASE and SPIL Tender Offer,became wholly owned subsidiaries of ASEH concurrently. In February 2018, we announcedentered into a joint venture agreement with Qualcomm Incorporated to expand our SiP business. In August 2018, we entered into an equity transfer agreement with Chung Hong Electronics (Suzhou) Co., Ltd. to acquire its 60.0% equity in March 2016 thatits Polish subsidiary Chung Hong Electronics Poland SP.Z.O.O. to set up production base and to expand our business in Europe to build a much more complete global supply system. In August 2018, we will continuealso entered into a joint venture framework contract and shareholder agreement with Cancon Information Industry Co., Ltd. to seek controlintegrate the industrial resources to cooperate deeply in the field of SPIL,secure and controllable high-performance server products for customers. In September 2018, we acquired whole shares of USI Inc. to consolidate the resources within ASEH and enhance operational efficiency. In January 2019, we entered into a project investment agreement with China Merchants Group of Huizhou Daya Bay Economic and Technological Development Zone of Guangdong Province to set up a wholly-owned subsidiary in Huizhou Daya Bay Economic and Technological Development Zoneto address the purposegrowing needs of effectingour capacity expansion and the SPIL Merger.development of our business in South China.
Continue to Leverage Our Presence in Key Centers of Semiconductor and Electronics Manufacturing
We intend to continue leveraging our presence in key centers of semiconductor and electronics manufacturing to further grow our business. We have significant packaging, testing and electronic manufacturing services operations in Taiwan, currently one of the leading centers for outsourced semiconductor and electronics manufacturing in the world. This presence enables our engineers to work closely with our customers as well as wafer foundries and other providers of complementary semiconductor and electronic manufacturing services early in the design process, enhances our responsiveness to the requirements of our customers and shortens production cycles. In addition, as a turnkey service provider, we are able to offer our products to our customers and complementary service providers within relatively close geographic proximity. Besides our current operations in Taiwan, we intend to expand our operations in our other subsidiaries.
We have primary operations in the following locations besides our locations in Taiwan:
| · |
| · | Korea — an important center for the manufacturing of memory and communications devices; |
| · | Malaysia and Singapore — a center for outsourced semiconductor manufacturing in Southeast Asia; |
| · | Silicon Valley in California — the preeminent center for semiconductor design, with a concentration of fabless customers; |
36
| · | Japan — an emerging market for packaging and testing outsourcing services as Japanese integrated device manufacturers increasingly outsource their semiconductor manufacturing |
| · | Mexico — a development and manufacturing center for electronic products across different industries with an auxiliary service depot to provide technical services. |
Strengthen and Develop Strategic Relationships with Our Customers and Providers of Complementary Semiconductor Manufacturing Services
We intend to strengthen existing and develop new strategic relationships with our customers and providers of other complementary semiconductor manufacturing services, such as wafer foundries, as well as equipment vendors, raw material suppliers and technology research institutes, in order to offer our customers total semiconductor manufacturing solutions covering all stages of the manufacturing of their products from design to shipment. In addition, we are working with our customers to co-develop new packaging technologies and designs.
40
Since 1997, we have maintained a strategic alliance with TSMC, currently one of the world’s largest dedicated semiconductor foundries, which designates us as their non-exclusive preferred provider of packaging and testing services for semiconductors manufactured by TSMC. Through our strategic alliance with and close geographic proximity to TSMC, we are able to offer our customers a total semiconductor manufacturing solution that includes access to foundry services in addition to our packaging, testing and direct shipment services.
Principal Products and Services
We offer a broad range of semiconductor packaging and testing services. In addition, we have provided electronic manufacturing services since our acquisition of a controlling interest in Universal Scientific Industrial in February 2010.2010 and acquisition of all the shares of USI Inc. in September 2018. Our package types generally employ either leadframes or substrates as interconnect materials. The semiconductors we package are used in a wide range of end-use applications, including communications, computing, consumer electronics, industrial, automotive and other applications. Our testing services include front-end engineering testing, which is performed during and following the initial circuit design stage of the semiconductor manufacturing process, wafer probe, final testing and other related semiconductor testing services. We focus on packaging and testing semiconductors. We offer our customers turnkey services, which consist of packaging, testing and direct shipment of semiconductors to end users designated by our customers. Our electronic manufacturing services are used in a wide range of end-use applications, including, but not limited to, computers and storage, peripherals, communications, industrial applications, automotive electronics, and storage and server applications. In 2015,2018, our revenues generated from packaging, testing and electronic manufacturing services accounted for 41.2%48.1%, 8.9%9.7% and 48.8%40.9% of our operating revenues, respectively.
Packaging Services
We offer a broad range of package types to meet the requirements of our customers, including flip-chip BGA, flip-chip CSP, aCSP (advanced chip scale packages), quad flat packages (QFP), thin quad flat packages (TQFP), bump chip carrier (BCC), quad flat no-lead (QFN) packages, aQFN (advanced QFN) and Plastic BGA. In addition, we provide 3D chip packages, such as MAP POP (package on package) and, aMAP POP (advanced, laser ablation type), which enable our customers to mount packages more easily.easily, and HB PoP (High-Band package on Package) for higher performance orientation and marketing requirement. We also offer other forms of stacked die solutions in different package types, e.g., stacked die QFN, hybrid BGAs containing stacked wire bond and FC die. Meanwhile, we are developing the cost-effective solutions to 3D packages, such 2.1D (substrate layer modification) and 2.5D (substrate interposer) to fulfill current low cost and high performance requirement in parallel with 3D packages with TSV (Through Silicon Via) technology. 2.1D and 2.5D are the low-tier package solutions for 3D packages and use substrate technology on top layer to connect to top package. 2.5D technology uses substrate interposer for finer pitch requirement on 3D packages for advanced wafer node in reducing the overall 3D package cost. Our first product has been a CMOS image sensor with TSV to minimize the form factor. In addition, to meet current trends toward low cost solutions, we provide copper wire bonding solutions which can be applied to current gold wire products. Furthermore, weWe also provide with high volume manufacturing experience with silver wire bonding with current focus onfor FCCSP Hybrid packages. Furthermore, we are one of the key providers of IoT (Internet of Things), server and automotive services. We believe we are among the leaders in such packaging processes and technologies and are well positioned to lead the technology migration in the semiconductor packaging industry.
We have also been engaging in the production of module-based solutions, including Wi-Fi modules and RF modules, for a number of years. Building on our experience with module based packaging solutions, weWe provide customized module services with SiP solutions to meet morecustomer needs and complex marketing requirements.
37
We also provide automotive product development and production using copper wire in our services to customers. Having accumulated production experience in using gold wire for automotive devices over several years, we collaborate with certain customers to develop and release copper wire for advanced wafer process (CMOS065) in automotive devices (various QFP packages) based on AEC Q-100 Grade 0 criteria. With our success in CMOS065 automotive products, we are continuously supported by the same customers for 40nm automotive product (copper wire in BGA) development that will fulfill criteria in addition to Grade 0. In addition to wirebonding packaging for automotive products, we have begun early development for the 28nm wafer process with hybrid packaging structure (FC bonding + wirebonding). The copper pillar process will be introduced for flip-chip on wafer form and process wirebonding. In addition, we also offer the FOWLP solution for radar products according to requests from some tier 1 customers.
Our production also supports MEMS sensors by applying substrate LGA package structure. The small form factor is down to 2x2 device outline, and by applying chip to wafer structure (TSV+wirebonding), we can further reduce this to 1.25x1.5 package size. By collaborating with worldwide tier 1 MEMS customers, we can build our capability in motion sensor assembly and develop our knowledge of environment sensors.
Advanced Packages.The semiconductor packaging industry has evolved to meet the requirements of high-performance electronics products. We believe that there will continue to be growing demand for packaging solutions with increased input/output density, smaller size and better heat dissipation characteristic.
We have focused on developing our capabilities in certain packaging solutions, such as aCSP (Wafer level(wafer-level chip scale package), flip-chip BGA, Heat-Spreader FCBGA, flip-chip CSP, Hybrid FCCSP (Flip-Chip + W/B), Flip-Chip PiP (Package in Package), Flip-Chip PoP (Package on Package), aS 3™ (Advanced Single Sided Substrate), HB POP (High-Bandwidth POP), Fan-Out Wafer Level Packaging, SESUB and 2.5D. Flip-chip BGA technology replaces wire bonding with wafer bumping for interconnections within the package. Wafer bumping involves the placing of tiny solder balls, instead of wires, on top of dies for connection to substrates. As compared with more traditional packages, which allow input/output connection only on the boundaries of the dies, flip-chip packagesor wafer-level package solutions significantly enhance the input/output flow by allowing input/output connectionconnections over the entire surface of the dies.
41
Chip scale packages typically have an area no greater than 1.2 times120% of the silicon die. For wafer level package, the electrical connections are plated or printed directly onto the wafer itself, resulting in a package very close to the size of the silicon die. Wafer-level packages do not include an interposer so they are unlike substrate-based packages, where the die is usually mounted on an interposer which contains electrical connections in the form of small bumps or balls.
aEASI (Advance Embedded Assembly Substrate Integration) is a technology which allows the embedding thin chips into substrate build-up layers. aEASI can be used in various technologies tailored to clients’ demand, such as package solution of miniaturization, and has also been proven to have better electrical/thermal performance. It also provides flexibility in design (such as for MicroSiP) and the electrical contacts to the chips are realized by
laser-drilled and metallized micro-vias to replace traditional wire bonding process. aEASI are mainly used in power management applications.
WL MEMs (Wafer-Level MEMs) is advanced assembly for MEMs in wafer-level type instead of current LGA or leadframe types and to use TSV or chip to wafer technology. WL MEMs are mainly used in applications such as pressure, temperature, humidity and gyroscope sensors, among others.
HB POP (High-Bandwidth Package on Package)FOWLP (Fan-Out Wafer-Level Packages) provides an extended solution and package type to integrate different functional chips or packages are new package structure thatand to have the characteristics to extend higher top side ball/lead counts to gaingood reduction in resistance and inductance over FCCSP, better performance.thermal performance and smaller form factors of packages. FOWLP can be applied for different stack and SiP solutions.
We provide numerous technologies to meet various customer demands. The following table sets forth our principal advanced packages.
38
Package Types | Number of Leads | Description | End-Use Applications |
| Wafer Level Chip Scale Package (aCSP) | 6-120 | A wafer level chip scale package that can be directly attached to the circuit board. Provides shortest electrical path from the die pad to the circuit board, thereby enhancing electrical performance. | Cellular phones, personal digital assistants, watches, MP3 players, digital cameras and camcorders. |
| Flip-Chip Chip Scale Package (FC-CSP, a-fcCSP) | A lightweight package with a small, thin profile that provides better protection for chips and better solder joint reliability than other comparable package types. | RFICs and memory ICs such as digital cameras, DVDs, devices that utilize WiMAX technology, cellular phones, GPS devices and personal computer peripherals. | |
| Flip-Chip PiP (Package in Package) (FC-CSP PiP) | 500-980 | Application processor for smartphone & data | |
| Flip-Chip PoP (Package on Package) (FC-CSP PoP) | 500-1100 | High-tier application processor for | |
| Flip-Chip BGA/ HF FCBGA(High Performance / Heat | 16-2916 | Using advanced interconnect technology, the flip-chip BGA packages allow higher density of | High-performance networking, graphics and server and data center processor applications. |
42
Package Types | Number of Leads | Description | End-Use Applications |
| Spreader / FCBGA) | input/output connection over the entire surface of the dies. HF FCBGA is designed for semiconductor high-performance requirement of high density of interconnects. | ||
| Hybrid (Flip-Chip and Wire Bonding) | 49-608 | A package technology that stacks a die on top of a probed good die to integrate ASIC and memory (flash, SRAM and DDR) into one package and interconnects them with wire bonding and molding. This technology suffers from known good die issues (i.e., one bad die will ruin the entire module). Rework is also not an option in hybrid packages. | Digital cameras, smartphones, bluetooth applications and personal digital assistants. |
| aS3 | up to 300 | Ultra-thin profile package which is excellent on middle pin count alternative solution; standard BT material and manufacturing equipment; and lower cost via on pad. | High I/O and short wire length package solution in high performance requirement. |
39
|
|
|
|
| Integrated Passive Device (IPD) | IPD can provide high performance/high Q-factor inductor and single/double layers for lower cost and turnkey solutions and integrate passives into one IPD chip. IPD requires less involvement in the Surface Mount Technology (“SMT”) process, and is considered to be more compatible with current assembly process and suitable for all package solutions. | Cellular phones, Wi-Fi module, TV and personal digital assistants. | |
| HB (High-Bandwidth) | ~ 1000 | High-Bandwidth POP can provide a data rate and good signal integrity for Cellular AP, a integration solution for ASIC and Memory, decoupling function for multiple memory mount applications. | Cellular phones and application processors. |
| POP (Package On Package) | ~ 256L Memory | ||
| FOWLP (Fan-out Wafer-Level Package) | ~ 1,500+ | FOWLP provides an extended solution/package type to integrate most different functional chips or packages and to have good reduction in resistance & inductance over FCCSP, better thermal performance and smaller form factors of packages, and can be applied for different stack or SiP solutions. | Cellular phones, logic devices, power management, RF, Codec, IoT, wearables and networking. |
43
IC Wirebonding. We provide IC wirebonding, including leadframe-based packages and substrate-based packages. Leadframe-based packages are packaged by connecting the die, using wire bonders, to the leadframe with gold wire or copper wire. As packaging technology improves, the number of leads per package increases. In addition, improvements in leadframe-based packages have reduced the footprint of the package on the circuit board and improved the electrical performance of the package. To have higher interconnected density and better electrical performance, semiconductor packages have evolved from leadframe-based packages to substrate-based packages. The key differences of these package types are: the size of the package; the density of electrical connections the package can support; flexibility at lower costs; the thermal and electrical characteristics of the package; and environmentally conscious designs. Substrate-based packages generally employ the BGA design. Whereas traditional leadframe technology places the electrical connection around the perimeter of the package, the BGA package type places the electrical connection at the bottom of the package surface in the form of small bumps or balls. These small bumps or balls are typically distributed evenly across the bottom surface of the package, allowing greater distance between individual leads and higher pin-counts. Our expertise in BGA packages also includes capabilities in stacked-die BGA, which assembles multiple dies into a single package.
3D packaging has recently gained a lot of publicity because of the advent of TSV (Through Silicon Via) based chip stacking. Chip stacking has been implemented for many years, albeit without TSVs. Wire bond die is routinely stacked on leadframes as well as BGA substrates. A more recent implementation is the stacking of packages as package on package (PoP) and the more specialized package in package (PiP). ASE hasWe have advanced PoP by the invention of aMAPPoP which provides the package interconnects by exposing a molded in solder ball with a laser via. Aside from being cost effective due to block molding, this PoP also has much lower warpage, greatly improving the stacking yield.
40
The following table sets forth our principal IC wirebonding packages.
Package Types | Number of Leads | Description | End-Use Applications |
| Advanced Quad Flat No-Lead Package (aQFN) | 104-276 | aQFN allows for leadless, multi-row and fine-pitch leadframe packaging and is characterized by enhanced thermal and electrical performance. aQFN is a cost-effective packaging solution due to its cost-effective materials and simpler packaging process. | Telecommunications products, wireless local access networks, personal digital assistants, digital cameras, low to medium lead count packaging information appliances. |
| Quad Flat Package (QFP)/Thin Quad Flat Package (TQFP) | 44-256 | Designed for advanced processors and controllers, application-specific integrated circuits and digital signal processors. | Multimedia applications, cellular phones, personal computers, automotive and industrial products, hard disk drives, communication boards such as ethernet, integrated services digital networks and notebook computers. |
| Quad Flat No-Lead Package (QFN)/ Dual-Row QFN (DR-QFN)/ Microchip Carrier (MCC) | 12-160 | QFN/DRQFN, also known as types of MCC, uses half-encapsulation technology to expose the rear side of the die pad and the tiny fingers, which are used to connect the chip and bonding wire with printed circuit boards. Dual-Row is to increase the lead counts for product requirement. | Cellular phones, wireless local access networks, personal digital assistant devices and digital cameras. |
| Bump Chip Carrier (BCC) | 16-156 | BCC packages use plating metal pads to connect with printed circuit boards, creating enhanced thermal and electrical performance. | Cellular phones, wireless local access networks, personal digital assistant devices and digital cameras. |
| Small Outline Plastic Package (SOP)/Thin | 8-56 | Designed for memory devices including static random access | Consumer audio/video and entertainment products, cordless |
44
Package Types | Number of Leads | Description | End-Use Applications |
| Small Outline Plastic Package (TSOP) | memory, or SRAM, dynamic random access memory, or DRAM, fast static RAM, also called FSRAM, and flash memory devices. | ||
| Small Outline Plastic J-Bend Package (SOJ) | 20-44 | Designed for memory and low pin-count applications. | DRAM memory devices, microcontrollers, digital analog conversions and audio/video applications. |
| Plastic Leaded Chip Carrier (PLCC) | 28-84 | Designed for applications that do not require low-profile packages with high density of interconnects. | Personal computers, scanners, electronic games and monitors. |
| Plastic Dual In-line Package (PDIP) | 8-64 | Designed for consumer electronic products. | Telephones, televisions, audio/video applications and computer peripherals. |
41
|
|
|
|
| Plastic BGA | 119-1520 | Designed for semiconductors which require the enhanced performance provided by plastic BGA, including personal computer chipsets, graphic controllers and microprocessors, application-specific integrated circuits, digital signal processors and memory devices. | Telecommunications products, global positioning systems, notebook computers, disk drives and video cameras. |
| Stacked-Die BGA | 120-1520 | Combination of multiple dies in a single package enables package to have multiple functions within a small surface area. | Telecommunications products, local area networks, graphics processor applications, digital cameras and pagers. |
| Package-on-Package (POP, aMAP POP) | 136-904 | This technology places one package on top of another to integrate different functionalities while maintaining a compact size. It offers procurement flexibility, low cost of ownership, better total system cost and faster time to market. Designers typically use the topmost package for memory applications and the bottommost package for ASICs. By using this technology, the memory known good die issue can be mitigated and the development cycle time and cost can be reduced. | Cellular phones, personal digital assistants and system boards. |
| Land Grid Array (LGA) | 10-72 | Leadless package which is essentially a BGA package without the solder balls. Based on laminate substrate, land grid array packages allow flexible routing and are capable of multichip module functions. | High frequency integrated circuits such as wireless communications products, computers servers, personal computer peripherals and MEMS sensors. |
45
SiP and ModulesHeterogeneous Integration. We assemble SiP products, which involveHeterogeneous Integration refers to the integration of more than one chipseparately manufactured components into a higher level assembly that, in the same package. As miniaturization requirements for electronic devices increase, smalleraggregate, provides enhanced functionality and lighter SiPs are garnering much attention within the industry. Wafer level integration-passive device technology has become increasingly important. Passive devices such as inductors, capacitors, resistors, filters and diplexers are those components occupying the largest area in printed circuit boards; therefore,improved operating characteristics:
| · | SiP and Modules. |
The drive towards semiconductor miniaturization and integration is keyexpanding the commercial potential of SiP, a package or module containing a functional electronic system or sub-system that is integrated and miniaturized through IC greater assembly technologies. With attributes that deliver higher performance, cost effectiveness, and shorter time to SiPs. This can be achieved through integratingmarket, SiP technology is enabling functionality and creating more commercial opportunities across a broader variety of electronics applications.
ASEH is a market leader in SiP technologies from design to assembly and high volume manufacturing. SiP involves the integration of multiple components from IC chips and components including ASICs, Memory, Analog & mixed signals devices, passives, MEMs, sensors, antennas and other devices into one single package. SiP and Modules products are gaining significant traction within the industry, given growing demand for miniaturized electronic devices that deliver more functions and higher performance, lower power, greater speed, and increased bandwidth. ASEH’s SiP portfolio includes flip chip and wirebond multichip packaging, embedding technologies such as SESUB and aEASI, and wafer level technologies including fan-out and IPD. IPD uses wafer level process to integrate passive components on an individual substrate using a thin film process known as MCM-D orsubstrate. Recent IPD (Integrated Passive Device). The IPD can then be used as a package substrate or interposer for SiP. This manufacturing method will enhance product performance and also reduce overall costs. Theinnovation involves the extension of our currentthe RDL (Redistribution) process can be used to build high quality factor (Q) inductor and RF circuits on top of CMOS (Complementary Metal–Oxide–Semiconductor)silicon wafers. IPD is an enabling technology for SiP. It can be used in the following three approaches to enhance product performance: several solutions to replace discrete components such as Balun and Filter, or to integrate certainother passive components and act as interposer, or to replace PWB and act as a substrate of the module. We have the ability to offer any of the packaging methodologies related to the above technologies. In addition, we also leverage some of our SMT-based technologies, such as compartment shielding, double sided module and antenna integration.
42
We also offer module assembly services, which combine one or more packaged semiconductors with other components in an integrated module to enable increased functionality typically using automated SMT machines and other machinery and equipment for system-level assembly. End-use applications for modules include cellular phones, wireless LAN applications, Bluetooth applications, camera modules, automotive applications, toys, networking, storage, and power management.
| · | Fan-out |
Fan-out packaging continues to gain major prominence within the industry, based on significant technical advantages that have led to its broad commercialization. This advanced packaging platform is evolving to meet application demands for smaller form factors and improved electrical and thermal performance.
With the packaging done on singulated die formed into a reconstituted molded wafer, fan-out packaging enables multi-die packages, through partitioning with different nodes and functionality. Fan-out can be done either chip first or chip last, with both options resulting in much higher density interconnect and improved cost efficiency. Initially fan-out was used primarily for smaller, lower I/O count packages, until we introduced a very high-density fan-out alternative to 2.5D Interposer packages, fan-out on Substrate (FOCoS), a hybrid fan-out/FCBGA package. Today, fan-out is in high volume applications for a wide variety of products, including PMICs, RF packages, Baseband processors, and high-end networking systems. Key attributes include:
· Parallel Manufacturing Process in Wafer Form
· Smallest Package in X,Y and Z
· Excellent Mechanical, Electrical, and Thermal Performance
| · | 2.5D & 3D Packaging |
46
As 5G, AI, and high-performance computing continue to make inroads into our world, we believe there is an increased demand for semiconductor devices that deliver enhanced performance, lower latency, increased bandwidth and greater power efficiency. ASEH strives to meet this demand by innovating 2.5D & 3D technologies that we believe are becoming more central within the semiconductor industry. We have established ourselves as a leader in 2.5D technology through our successful pioneering of 2.5D solutions that helped bring advanced ASIC and HBM products to the market place. In addition, ASEH is also introducing high density fan-out technology for die stacking & multi-die solutions to achieve high bandwidth & high performance across the market landscape, addressing demand from high density data centers to consumer and mobile space.
Automotive Electronics. We assemble automotive electronic products based on our leading technology, good quality systems and automation. We provide a variety of products, such as leadframe base, substrate base, Flip-Chip and Wafer-Level packages. We also provide robust package solutions to customers and end-users, including most types of industrial package solutions together with tailor-made solutions to meet customers’ and end-users’ requirements on automotive specifications.
Having accumulated production experience in using gold wire for automotive devices over several years, we collaborate with certain customers to develop and release copper wire for advanced wafer process (65nm for QFP and 40 nm for BGA) development that will fulfill criteria in AEC-G100 and in the early development of the 28 nm wafer process with hybrid packaging structure (FC bonding + wirebonding). In addition, we offer the FOWLP solution for radar products according to requests from some tier 1 customers.
Interconnect Materials. Interconnect materials connect the input/output on the semiconductor dies to the printed circuit board. Interconnect materials include substrate, which is a multi-layer miniature printed circuit board, and is an important element of the electrical characteristics and overall performance of semiconductors. We produce substrates for use in our packaging operations.
The demand for higher performance semiconductors in smaller packages will continue to spur the development of IC substrates that can support the advancement in circuit design and fabrication. As a result, we believe that the market for substrates will grow and the cost of substrates as a percentage of the total packaging process will increase. In the past, substrates we designed for our customers were produced by independent substrate manufacturers. Since 1997, we have been designing and producing a portion of our interconnect materials in-house. In 2015,2018, our interconnect materials operations supplied approximately 27.2%14.2% of our consolidated substrate requirements by value.
The following table sets forth, for the periods indicated, the percentage of our packaging revenues accounted for by each principal type of packaging products or services.
| Year Ended December 31, | Year Ended December 31, | |||||||||||||||||||||||
| 2013 | 2014 | 2015 | 2016 | 2017 | 2018 | |||||||||||||||||||
| Advanced packaging(1) | 26.7 | % | 25.0 | % | 27.1 | % | ||||||||||||||||||
| Bumping, Flip Chip, WLP and SiP | 28.6 | % | 29.9 | % | 36.1 | % | ||||||||||||||||||
| IC Wirebonding | 62.5 | 64.4 | 61.9 | 61.4 | 59.2 | 54.0 | ||||||||||||||||||
| Discrete and other | 10.8 | 10.6 | 11.0 | 10.0 | 10.9 | 9.9 | ||||||||||||||||||
| Total | 100.0 | % | 100.0 | % | 100.0 | % | 100.0 | % | 100.0 | % | 100.0 | % | ||||||||||||
______________________
| (1) |
| Includes leadframe-based packages such as QFP/TQFP, QFN/MCC and PLCC/PDIP and substrate-based packages, such as various BGA package types and LGA. |
Testing Services
We provide a complete range of semiconductor testing services, including front-end engineering testing, wafer probing, final testing of logic/mixed-signal/RF/(2.5D/3D) module and SiP/MEMS/Discrete and other test-related services.
The testing of semiconductors requires technical expertise and knowledge of the specific applications and functions of the semiconductors tested as well as the testing equipment utilized. We believe that our testing services employ technology and expertise which are among the most sophisticated in the semiconductor industry. In addition to maintaining different types of testing equipment, which enables us to test a variety of semiconductor functions, we work closely with our customers to design effective testing solutions on multiple equipment platforms for particular semiconductors.
In recent years, complex, high-performance logic/mixed-signal/RF/(2.5D/3D) module and SiP/MEMS semiconductors have accounted for an increasing portion of our testing revenues.
47
Front-End Engineering Testing. We provide front-end engineering testing services, including customized software development, electrical design validation, and reliability and failure analysis.
| · | Customized Software Development. Test engineers develop customized software to test the semiconductors using our equipment. Customized software, developed on specific test platforms, is required to test the conformity of each particular semiconductor type to its unique functionality and specification. |
43
| · | Electrical Design Validation. A prototype of the designed semiconductor is subjected to electrical tests using advanced test equipment and customized software. These tests assess whether the prototype semiconductor complies with a variety of different operating specifications, including functionality, frequency, voltage, current, timing and temperature range. |
| · | Reliability Analysis. Reliability analysis is designed to assess the long-term reliability of the semiconductor and its suitability of use for intended applications. Reliability testing can include “burn-in” services, which electrically stress a device, usually at high temperature and voltage, for a period of time long enough to cause the failure of marginal devices. |
| · | Failure Analysis. In the event that the prototype semiconductor does not function to specifications during either the electrical design validation or reliability testing processes, it is typically subjected to failure analysis to determine the cause of the failure to perform as anticipated. As part of this analysis, the prototype semiconductor may be subjected to a variety of analyses, including electron beam probing and electrical testing. |
Wafer Probing. Wafer probing is the step immediately before the packaging of semiconductors and involves visual inspection and electrical testing of the processed wafer for defects to ensure that it meets our customers’ specifications. Wafer probing services require expertise and testing equipment similar to that used in final testing, and most of our testers can also be used for wafer probing.
Logic/Mixed-signal/RF/(2.5D/3D) module and SiP/Discrete Final Testing. We conduct final tests of a wide variety of logic/mixed-signal/RF/(2.5D/3D) module and SiP/ MEMS /discreteMEMS/discrete semiconductors, with the number of leads or bumps ranging from the single digits to over ten thousand and operating frequencies of over 1232 Gbps for digital semiconductors and 12 GHzmmWave for radio frequency semiconductors, which are at the high end of the range for the industry. The products we test include semiconductors used for wired, wireless and mobile communications, automotive, home entertainment, and personal computer, artificial intelligence, and high performance computing applications, as well as a variety of consumer and application-specific integrated circuits for various specialized applications.
Other Test-Related Services. We provide a broad range of additional test-related services, such as:
| · | Electric Interface Board and Mechanical Test Tool Design. Process of designing individualized testing apparatuses such as test load boards, sockets, handler change kits, and probe cards for unique semiconductor devices and packages. |
| · | Program Conversion. Process of converting a program from one test platform to different test platforms to reduce testing costs or optimize testing capacity. |
| · | Program Efficiency Improvement. Process of optimizing the program code or increasing site count of parallel tests to improve testing throughout. |
| · | Burn-in Testing. Burn-in testing is the process of electrically stressing a device, usually at high temperature and voltage, for a period of time to simulate the continuous use of the device to determine whether this use would cause the failure of marginal devices. |
48
| · | Module and SiP Testing. We provide module and SiP testing through integrated bench solution or automatic test equipment to our customers with a complete solution with respect to finger print sensor module, camera module, 3D depth sensing module, wireless connectivity devices, global positioning system devices, personal navigation devices and digital video broadcasting devices. |
| · | Tape and Reel. Process which involves transferring semiconductors from a tray or tube into a tape-like carrier for shipment to customers. |
Drop Shipment Services. We offer drop shipment services for shipment of semiconductors directly to end users designated by our customers. Drop shipment services are provided mostly in conjunction with logic/mixed-signal/RF/3D IC/discrete testing. We provide drop shipment services to a significant percentage of our testing customers. A substantial portion of our customers at each of our facilities have qualified these facilities for drop shipment services. Since drop shipment eliminates the additional step of inspection by the customer before shipment to the end user, quality of service is a key consideration. We believe that our ability to successfully execute our full range of services, including drop shipment services, is an important factor in maintaining existing customers as well as attracting new customers.
44
The following table sets forth, for the periods indicated, the percentage of our testing revenues accounted for by each type of testing service.
| Year Ended December 31, | Year Ended December 31, | |||||||||||||||||||||||
| 2013 | 2014 | 2015 | 2016 | 2017 | 2018 | |||||||||||||||||||
| Testing Services: | ||||||||||||||||||||||||
| Front-end engineering testing | 2.5 | % | 2.9 | % | 4.2 | % | 3.6 | % | 3.4 | % | 2.4 | % | ||||||||||||
| Wafer probing | 19.5 | 20.5 | 20.1 | 19.7 | 16.7 | 24.8 | ||||||||||||||||||
| Final testing | 78.0 | 76.6 | 75.7 | 76.7 | 79.9 | 72.8 | ||||||||||||||||||
| Total | 100.0 | % | 100.0 | % | 100.0 | % | 100.0 | % | 100.0 | % | 100.0 | % | ||||||||||||
Electronic Manufacturing Services. Since our acquisition of a controlling interest in Universal Scientific Industrial in February 2010 and acquisition of all the shares of USI Inc. in September 2018, we also provide integrated solutions for electronic manufacturing services in relation to computers and storage, peripherals, communications, industrial, automotive, and storage and server applications. The key products and services we offer to our customers, for instance, include:
| · | Computers: motherboards for server & desktop PC; peripheral; port replicator; |
| · | Communications: Wi-Fi; SiP; |
| · | Consumer products: control boards for flat panel devices; SiP; |
| · | Automotive electronics: automotive electronic manufacturing services; car LED lighting; regulator/rectifier; |
| · | Industrial products: point-of-sale systems; smart handheld |
| · | Storage: network attach system; network video record; solid state driver; and |
| · | Others: field replacement unit; return material authorization. |
Seasonality
See “Item 5. Operating and Financial Review and Prospects—Operating Results and Trend Information—Quarterly Operating Revenues, Gross Profit and Gross Margin.”
49
Sales and Marketing
Sales and Marketing Presence
We maintain sales and marketing offices in Taiwan, the United States, Belgium, Singapore, the PRC,P.R.C., Korea, Malaysia, Japan and a number of other countries. We also have sales representatives operating in certain other countries in which we do not have offices. Our sales and marketing offices in Taiwan are located in Hsinchu, Taichung and Kaohsiung. We conduct marketing research through our customer service personnel and through our relationships with our customers and suppliers to keep abreast of market trends and developments. We also provide advice in the area of production process technology to our major customers planning the introduction of new products. In placing orders with us, our customers specify which of our facilities these orders will go to. Our customers conduct separate qualification and correlation processes for each of our facilities that they use. See “—Qualification and Correlation by Customers.”
Customers
Our five largest customers together accounted for approximately 37.2%42.0%, 40.3%46.4% and 48.2%46.2% of our operating revenues in 2013, 20142016, 2017 and 2015,2018, respectively. One customer accounted for more than 10.0% of our operating revenues in 2013, 20142016, 2017 and 2015.2018.
45
We package and test for our customers a wide range of products with end-use applications in the communications, computing, and consumer electronics/industrial/automotive sectors. The following table sets forth a breakdown of the percentage of our operating revenues generated from our packaging and testing services, for the periods indicated, by the principal end-use applications of the products that we packaged and tested.
| Year Ended December 31, | Year Ended December 31, | |||||||||||||||||||||||
| 2013 | 2014 | 2015 | 2016 | 2017 | 2018 | |||||||||||||||||||
| Communications | 54.6 | % | 53.3 | % | 54.7 | % | 52.2 | % | 48.9 | % | 49.9 | % | ||||||||||||
| Computing | 11.0 | 11.6 | 11.1 | 11.5 | 11.5 | 14.0 | ||||||||||||||||||
| Consumer electronics/industrial/automotive/other | 34.4 | 35.1 | 34.2 | 36.3 | 39.6 | 36.1 | ||||||||||||||||||
| Total | 100.0 | % | 100.0 | % | 100.0 | % | 100.0 | % | 100.0 | % | 100.0 | % | ||||||||||||
In addition, we have provided electronic manufacturing services since our acquisition of the controlling interest of Universal Scientific Industrial in February 2010.2010 and acquisition of all the shares of USI Inc. in September 2018. Our electronic manufacturing services provide a wide range of products with end-use applications. The following table sets forth a breakdown of the percentage of our operating revenues generated from our electronic manufacturing services for the periods indicated by the principal end-use applications.
| Year Ended December 31, | Year Ended December 31, | |||||||||||||||||||||||
| 2013 | 2014 | 2015 | 2016 | 2017 | 2018 | |||||||||||||||||||
| Communications | 45.4 | % | 55.6 | % | 53.2 | % | 50.6 | % | 45.5 | % | 35.7 | % | ||||||||||||
| Computing | 21.7 | 18.0 | 14.3 | |||||||||||||||||||||
| Computers and storage | 16.9 | 15.0 | 14.2 | |||||||||||||||||||||
| Consumer electronics | 11.7 | 8.9 | 18.7 | 18.4 | 25.9 | 34.3 | ||||||||||||||||||
| Industrial | 12.8 | 10.3 | 8.1 | 7.2 | 7.3 | 10.0 | ||||||||||||||||||
| Automotive | 7.4 | 6.3 | 4.9 | 6.0 | 5.6 | 5.0 | ||||||||||||||||||
| Other | 1.0 | 0.9 | 0.8 | 0.9 | 0.7 | 0.8 | ||||||||||||||||||
| Total | 100.0 | % | 100.0 | % | 100.0 | % | 100.0 | % | 100.0 | % | 100.0 | % | ||||||||||||
We categorize our operating revenues geographically based on the country in which the customer is headquartered. The following table sets forth, for the periods indicated, the percentage breakdown by geographic regions of our operating revenues.
| Year Ended December 31, | ||||||||||||
| 2013 | 2014 | 2015 | ||||||||||
| United States | 65.4 | % | 67.8 | % | 72.6 | % | ||||||
| Taiwan | 14.2 | 14.3 | 11.5 | |||||||||
| Asia | 10.8 | 9.4 | 8.1 | |||||||||
| Europe | 9.3 | 8.1 | 7.3 | |||||||||
| Other | 0.3 | 0.4 | 0.5 | |||||||||
| Total | 100.0 | % | 100.0 | % | 100.0 | % | ||||||
50
| Year Ended December 31, | ||||||||||||
| 2016 | 2017 | 2018 | ||||||||||
| United States | 65.8 | % | 67.6 | % | 62.2 | % | ||||||
| Taiwan | 14.1 | 12.2 | 12.3 | |||||||||
| Asia | 10.9 | 10.4 | 15.1 | |||||||||
| Europe | 8.5 | 9.1 | 9.9 | |||||||||
| Other | 0.7 | 0.7 | 0.5 | |||||||||
| Total | 100.0 | % | 100.0 | % | 100.0 | % | ||||||
Qualification and Correlation by Customers
Customers generally require that our facilities undergo a stringent qualification process during which the customer evaluates our operations and production processes, including engineering, delivery control and testing capabilities. The qualification process typically takes up to several weeks, but can take longer depending on the requirements of the customer. In the case of our testing operations, after we have been qualified by a customer and before the customer delivers semiconductors to us for testing in volume, a process known as correlation is undertaken. During the correlation process, the customer provides us with sample semiconductors to be tested and either provides us with the test program or requests that we develop a conversion program. In some cases, the customer also provides us with a data log of results of any testing of the semiconductors that the customer may have conducted previously. The correlation process typically takes up to two weeks, but can take longer depending on the requirements of the customer. We believe our ability to provide turnkey services reduces the amount of time spent by our customers in the qualification and correlation process. As a result, customers utilizing our turnkey services are able to achieve shorter production cycles.
46
Pricing
We price our packaging services and electronic manufacturing services, taking into account the actual costs, with reference to prevailing market prices. We price our testing services primarily on the basis of the amount of time, measured in central processing unit seconds, taken by the automated testing equipment to execute the test programs specific to the products being tested, as well as the cost of the equipment, with reference to prevailing market prices. Prices for our packaging, testing and electronic manufacturing services are confirmed at the time orders are received from customers, which is typically several weeks before delivery.
Raw Materials and Suppliers
Packaging
The principal raw materials used in our packaging processes are interconnect materials such as leadframes and substrates, gold wire and molding compound. The silicon die, which is the functional unit of the semiconductor to be packaged, is supplied in the form of silicon wafers. Each silicon wafer contains a number of identical dies. We receive the wafers from the customers or the foundries on a consignment basis. Consequently, we generally do not incur inventory costs relating to the silicon wafers used in our packaging process.
We do not maintain large inventories of leadframes, substrates, gold wire or molding compound, but generally maintain sufficient stock of each principal raw material based on blanket orders and rolling forecasts of near-term requirements received from customers. In addition, several of our principal suppliers dedicate portions of their inventories as reserves to meet our production requirements. However, shortages in the supply of materials experienced by the semiconductor industry have in the past resulted in occasional price adjustments and delivery delays. For example, in the first half of 2000, the industry experienced a shortage in the supply of IC substrates used in BGA packages, which, at the time, were only available from a limited number of suppliers located primarily in Japan. In order to reduce the adverse impact caused by the price fluctuations of raw materials, we have developed substitute raw materials, such as copper wire, the cost of which is much cheaper than that of gold.gold wire. However, we cannot guarantee that we will not experience shortages or price increase in the near future or that we will be able to obtain adequate supplies of raw materials in a timely manner and at a reasonable price or to develop any substitute raw materials. In the event of a shortage and/or price increase, we generally inform our customers and work together to accommodate changes in delivery schedules and/or the price increase of raw materials.
51
We produce substrates for use in our packaging operations. In 2015,2018, our interconnect materials operations supplied approximately 27.2%14.2% of our consolidated substrate requirements by value. See “—Principal Products and Services—Interconnect Materials.”
As a result of the “Directive 2002/95/EC on the restriction of the use of certain hazardous substances in electrical and electronic equipment,” or RoHS, which became effective on July 1, 2006, we have adjusted our purchases of raw materials and our production processes in order to use raw materials that comply with this legislation for part of our production. This legislation restricts the use in the European Union, or EU, of certain substances the EU deems harmful to consumers, which includes certain grades of molding compounds, solder and other raw materials that are used in our products. Manufacturers of electrical and electronic equipment must comply with this legislation in order to sell their products in an EU member state. Any failure by us to comply with regulatory environmental standards such as Directive 2002/95/EC may have a material adverse effect on our results of operations.
Testing
For the functional and burn-in testing of semiconductors, no other raw materials are needed. However, we often design and outsource the manufacturing of test interface products such as load boards, probe cards and burn-in boards.
Electronic Manufacturing Services
Our manufacturing processes use many raw materials in our electronic manufacturing services. For 2015,2018, raw materials costs accounted for 78.4%81.1% of our operating revenues from electronic manufacturing services. Our principal raw materials include, among others, printed circuit boards, integrated chips, ink, semiconductor devices, computer peripherals and related accessories and electronic components. Our principal raw materials varied in the past, depending on the end-use products we provided.
47
To ensure quality, on-time delivery and pricing competitiveness, we have established both a standardized supplier assessment system and an evaluation mechanism, continued to maintain close working relationships with our suppliers and jointly created a stable and sustainable supply chain. In addition, we adjusted the procurement strategy in line with industry trends as well as the nature of raw materials and decentralized the sources of raw materials to lower our supply concentration risk. However, we cannot assure you that we will not experience any shortages or price increases in the near future. See “Item 3. Key Information—Risk Factors—Risks Relating to Our Business—Our revenues and profitability may decline if we are unable to obtain adequate supplies of raw materials in a timely manner and at a reasonable price.”
Equipment
Packaging
Wire bonding process is important for routing signal out of die to the system for the IC wire-bonding solutions. Thus, wire bonder is the important equipment used for such process. As products become finer and finer pitch, bumping process will replace wire bonding process for the signal routing purpose. Thus, sputter and plater will be the crucial equipment for this type of process.
Wire bonders connect the input/output terminals on the silicon die using extremely fine gold or copper wire to leads on leadframes or substrates. Typically, a wire bonder may be used, with minor modifications, for the packaging of different products. As of February 29, 2016,January 31, 2019, we operated an aggregate of 15,59225,009 wire bonders, of which 15,47824,954 were fine-pitch wire bonders. As of the same date, 2520 of the wire bonders operated by us were consigned by customers and none were leased under operating leases. For the packaging of certain types of substrate-based packages, die bonders are used in place of wire bonders. The number of bonders at a given facility is commonly used as a measure of the packaging capacity of the facility. In addition to bonders, we maintain a variety of other types of packaging equipment, such as wafer grind, wafer mount, wafer saw, heat sink placement, automated molding machines, laser markers, solder plate, pad printers, dejunkers, trimmers, formers, substrate saws and scanners. We purchase our packaging equipment from major international manufactures, including Allring Tech Co.Orion Systems Integration Pte. Ltd., Ltd, Disco Corporation, BE Semiconductor Industries N.V. and, Kulicke & Soffa Industries, Inc..Pte Ltd., HANMI Semiconductor Co., Ltd. and TOWA Corporation.
52
Testing
Testing equipment is the most capital intensive component of the testing process. We generally seek to purchase testers from different suppliers with similar functionality and the ability to test a variety of different semiconductors. We purchase testers from major international manufacturers, including Teradyne, Inc., Advantest Ltd., LTX-Credence Corporation, Seiko EpsonGAT Asset Taiwan Limited and Tokyo Electron Limited.Hon Technologies, Inc. Upon acquisition of new testers, we install, configure, calibrate, perform burn-in diagnostic tests on and establish parameters for the testers based on the anticipated requirements of existing and potential customers and considerations relating to market trends. As of February 29, 2016,January 31, 2019, we operated an aggregate of 3,4184,824 testers, of which 9451,484 were consigned by customers and 8432 were leased under operating leases. In addition to testers, we maintain a variety of other types of testing equipment, such as automated handlers and probers (special handlers for wafer probing), scanners, reformers and computer workstations for use in software development. Each tester may be attached to a handler or prober. Handlers attach to testers and transport individual packaged semiconductor to the tester interface. Probers similarly attach to the tester and align each individual die on a wafer with the interface to the tester.
For the majority of our testing equipment, we often base our purchases on prior discussions with our customers about their forecast requirements. The balance consists of testing equipment on consignment from customers and which are dedicated exclusively to the testing of these customers’ specific products.
Test programs, which consist of the software that drives the testing of specific semiconductors, are written for a specific testing platform. We sometimes perform test program conversions that enable us to test semiconductors on multiple test platforms. This portability between testers enables us to allocate semiconductors tested across our available test capabilities and thereby improve capacity utilization rates. In cases where a customer requires the testing of a semiconductor product that is not yet fully developed, the customer may provide computer workstations to us to test specific functions. In cases where a customer has specified testing equipment that was not widely applicable to other products that we test, we have required the customer to furnish the equipment on a consignment basis.
48
Electronic Manufacturing Services
The SMT assembly line is the key facility of our electronic manufacturing operations, and generally includes a printer and one or two high-speed mounters and/or a multi-function mounter. The SMT assembly process primarily consists of the following three manufacturing steps: (i) solder paste stencil printing, (ii) component placement and (iii) solder reflow. High-speed SMT assembly systems offer both economicaleconomic and technical advantages that may reduce both production cost and time while meeting quality requirements. Thus, SMT has become the most popular assembly method for sophisticated electronic devices. We had 125137 SMT lines as of February 29, 2016.January 31, 2019.
Intellectual Property
As of February 29, 2016,January 31, 2019, we held 2,0122,415 Taiwan patents, 9151,588 U.S. patents, 915 PRC1,375 P.R.C. patents and 1729 patents in other countries related to various semiconductor packaging technologies and invention, utility and design on our electronic manufacturing services. In addition, as of January 31, 2019, we also had a total of 1,395 pending patent applications in 153 Taiwan, 430 in U.S. patents, 788 in P.R.C. patents and 24 patents in other countries. Moreover, we filed several trademarks applications in Taiwan, the United States, China and the European Union. For example, “ASE”, “aCSP”, “ a-EASI”, “a-fcCSP”, “aQFN”, “a-QFN”, “a-S3”, “a-TiV”, “aWLP”, “a-WLP”, “iSiP”, “iWLP”, “aSiM”, “SiP-id” and “aSiM”“SPIL” have been registered in Taiwan.
We have also entered into various non-exclusive technology license agreements with other companies involved in the semiconductor manufacturing process, including Fujitsu Limited, Flip Chip International, L.L.C., Mitsui High-Tec, Inc., Infineon Technologies AG, SPILTDK Corporation and STATS Chippac Ltd.Deca Technologies Inc. The technology we license from these companies includes solder bumping, redistribution, ultra CSP assembly, advanced QFN assembly, wafer level packaging and other technologies used in the production of package types, such as BCC, flip-chip BGA, film BGA, aQFN Package-in-Package (PiP) and chip embedding. Our license agreements with Flip Chip International, L.L.C. and SPIL will not expire until the expiration of the patents licensed by the agreement. Our one license agreement with Infineon Technologies AG will expire on November 5, 2017, and another license agreement with Infineon Technologies AG will remain in effect until expiration of the Infineon’s patents licensed by the agreement.2019. Our license agreement with Mitsui High-Tec, Inc. renews automatically each year, and our license agreement with Fujitsu Limited renews automatically each year unless the parties to the agreement agree otherwise. Our license agreement with STATS Chippac Ltd.TDK Corporation will remain in effect until expiration of the TDK’s patents licensed by the agreement. Our license agreement with Deca Technologies Inc. will expire on December 31, 2016.
January 13, 2026. Our success depends in part on our ability to obtain, maintain and protect our patents, licenses and other intellectual property rights, including rights under our license agreements with third parties.
53
Quality Control
We believe that our process technology and reputation for high quality and reliable services have been important factors in attracting and retaining leading international semiconductor companies as customers for our services and/or products. We maintain a quality control staff at each of our facilities. Our quality control staff typically includes engineers, technicians and other employees who monitor the processes in order to ensure high quality. Our quality assurance systems impose strict process controls, statistical in-line monitors, supplier control, data review and management, quality controls and corrective action systems. Our quality control employees operate quality control stations along production lines, monitor clean room environments and follow up on quality through outgoing product inspection and interaction with customer service staff. We have established quality control systems that are designed to ensure high quality products/service to customers, high testing reliability and high production yields at our facilities. We also have established an environmental management system in order to ensure that we can comply with the environmental standards of our customers and the countries within which they operate. See “—Raw Materials and Suppliers—Packaging.” In addition, our facilities have been qualified by all of our major customers after satisfying stringent quality standards prescribed by these customers.
Our packaging and testing operations are undertaken in clean rooms where air purity, temperature and humidity are controlled. To ensure stability and integrity of our operations, we maintain clean rooms at our facilities that meet U.S. Federal Standard 209E class 1,000, 10,000 and 100,000 standards.
ISE Labs’ testing facilities in Fremont, California, are considered suitably equipped by the Defense Logistics Agency to perform the MIL-STD-883 tests on monolithic microcircuits in accordance with the requirements of military specification MIL-PRF-38535.
49
We have also obtained many certifications on our packaging, testing and interconnect materials facilities. Some of these certifications are required by some semiconductor manufacturers as a threshold indicator of company’s quality control standards or needed by many countries in connection with sales of industrial products. The table below sets forth the certifications we have for our packaging, testing and interconnect materials.
Location | ISO 14001(3) | ISO 17025(4) | ISO 14064-1(5) | IECQ HSPM QC080000(6) | Sony Green(7) | OHSAS 18001(8) | TOSHMS | ISO 50001(10) | ISO 13485(11) | ISO 28000(12) | ISO 26262(13) | ISO 15408-EAL6(14) | TL 9000(15) | |||||||||||||||||
| | ||||||||||||||||||||||||||||||
| ||||||||||||||||||||||||||||||
| ü | ü | ü | ü | ü | ü | ü | ü | ü | ü | ü | ü | |||||||||||||||||||
| China | ü | ü | ü | ü | ü | ü | ü | ü | ü | ü | ||||||||||||||||||||
| Korea | ü | ü | ü | ü | ü | ü | ü | |||||||||||||||||||||||
| ü | ü | ü | ü | |||||||||||||||||||||||||||
| ü | ü | ü | ü | ü | ||||||||||||||||||||||||||
| Singapore | ü | ü | ü | ü | ü | ü | ||||||||||||||||||||||||
| U.S. | ü | ü | ü |
54
_______________________
| (1) |
| (2) | ISO 9001 quality standards, set by the ISO, are related to quality management systems and designed to help organizations ensure that they meet the needs of customers and other stakeholders while meeting statutory and regulatory requirements related to the product. |
| (3) | ISO 14001 sets out the criteria for an environmental management system. It can be used by any organization that wants to improve resource efficiency, reduce waste and drive down costs. |
| (4) | ISO 17025 is the main ISO standard used by testing and calibration laboratories. |
| (5) | ISO 14064-1 standard is part of the ISO 14000 series of International Standards for environmental management. The ISO 14064 standard provides governments, businesses, regions and other organizations with a complementary set of tools for programs to quantify, monitor, report and verify greenhouse gas emissions. |
| (6) | IECQ HSPM QC080000 is a certification designed to manage, reduce and eliminate hazardous substances. |
| (7) | “Sony Green Partner” indicates our compliance with the “Sony Green Package” standard requirements. |
| (8) | OHSAS 18001 is a set of standards designed upon collaboration with occupational health and safety experts and now offered by many certification organizations as an indication of compliance with certain standards for occupational health and safety. |
| (9) | TOSHMS is the Taiwan Occupational and Health Management System. |
| (10) |
Since our acquisition of a controlling interest in Universal Scientific in February 2010, we began providing electronic manufacturing services, for which we also have strict process controls. The table below sets forth the certifications we have obtained for our electronic manufacturing services facilities.
|
|
|
|
|
|
|
|
|
|
|
__________________
| ISO 13485 quality management system sets forth the quality requirements for organizations that are required to consistently meet customers’ requirements and regulatory requirements in the medical devices and related services industry. |
| (12) | ISO 28000 is an international standard for security management system dealing with security assurance in a supply chain. |
| (13) | ISO 26262 is an international standard for functional safety of electrical and electronic systems in production automobiles defined by ISO. |
| (14) | ISO 15408-EAL6 is a framework that outlines the criteria for globally recognized standards and security inspections for IT products. It is designed for products and applications that are targeted for high security-intensive markets, such as the government, banking or defense sectors. |
| (15) | TL 9000 quality management system sets forth the supply chain quality requirements of the global communications industry. |
Since our acquisition of a controlling interest in Universal Scientific Industrial in February 2010 and acquisition of all the shares of USI Inc. in September 2018, we began providing electronic manufacturing services, for which we also have strict process controls. The table below sets forth the certifications we have obtained for our electronic manufacturing services facilities.
| Location | IATF 16949:2016 | ISO 9001 | ISO 14001 | ISO 14064-1 | IECQ QC 080000 | TL 9000 | OHSAS 18001 | ISO 50001 | ISO 17025 | ISO 26262 | TOSHMS | ISO 13485 | ||||||||||||
| Taiwan | ü | ü | ü | ü | ü | ü | ü | ü | ||||||||||||||||
| China | ü | ü | ü | ü | ü | ü | ü | ü | ü | ü | ü | |||||||||||||
| Mexico | ü | ü | ü | ü | ü | ü | ü |
5055
In addition, we have received various vendor awards from our customers for the quality of our products and services.
Competition
The global market for semiconductor packaging and testing markets is highly competitive. We face competition from a number of sources and integrated device manufacturers with in-house packaging and testing capabilities and fabless semiconductor design companies with their own in-house testing capabilities. Some of these integrated device manufacturers have commenced, or may commence, in-house packaging and testing operations in Asia. Substantially all of packaging and testing companies that compete with us have established operations in Taiwan and across the region.
Integrated device manufacturers that use our services continuously evaluate our performance against their own in-house packaging and testing capabilities. These integrated device manufacturers may have access to more sophisticated technologies and greater financial and other resources than we do. We believe, however, that we can offer greater efficiency at lower cost while maintaining equivalent or higher quality for several reasons. First, as we benefit from specialization and economies of scale by providing services to a large base of customers across a wide range of products, we are better able to reduce costs and shorten production cycles through high capacity utilization and process expertise. Second, as a result of our customer base and product offerings, our equipment generally has a longer useful life. Third, as a result of the continuing reduction of investments in in-house packaging and testing capacity and technology at integrated device manufacturers, we are better positioned to meet their packaging and testing requirements on a large scale.
Our packaging and testing business also faces actual and potential competition from companies at other levels of the supply chain, which have the financial resources and technical capabilities to enter and compete effectively with us. For example, TSMC has launched integrated fan-out (“InFO”) technology, which is scheduled to be put into mass production in 2016. InFO is expected to further intensify the competition in the packaging and testing industry.
In addition, we have providedOur electronic manufacturing services sincebusiness, operated by our acquisition of a controlling interest insubsidiary Universal Scientific in February 2010. As a result of this, we faceIndustrial, faces significant competition from other electronic manufacturing services providers, such as Hon Hai Precision Ind. Co., Ltd., with comprehensive integration, wide geographic coverage and large production capabilities that enable them to achieve economies of scale. We believe, however, that we can still achieve satisfactory performance in the market given that we have been able to provide products with high quality and we are capable of designing new products by cooperating with our customers.
Environmental Matters
Our operations of packaging, interconnect materials and electronic manufacturing services generate environmental wastes, including gaseous chemical, liquid and solid industrial wastes. We have installed various types of anti-pollution equipment for the treatment of liquid and gaseous chemical waste generated at our facilities. We believe that we have adopted adequate anti-pollution measures for the effective maintenance of environmental protection standards that are consistent with industry practice in the countries in which our facilities are located. In addition, we believe we are in compliance in all material respects with present environmental laws and regulations applicable to our operations and facilities.
Furthermore, in order to demonstrate our commitment to environmental protection, in December 2013, our board of directors approved contributions to environmental protection efforts in Taiwan in a total amount of not less than NT$3,000.0 million, to be made in the nextfollowing 30 years. For the years ended December 31, 20142016, 2017 and 2015, we have2018, ASE has made contributions in the amount of NT$100.0 million (US$3.03.3 million) each, respectively, through ASE Cultural and Educational Foundation to fund various environmental projects, and ourASE’s board of directors have resolved in a resolution in January 2016February 2019 to contribute NT$100.0 million (US$3.03.3 million) through ASE Cultural and Educational Foundation in environmental projects in 2016.2019. Our estimated environmental capital expenditures for 2019 will be approximately US$34.2 million, of which 49.1% will be used in climate change adaptation.
56
ASE Inc. Kaohsiung facility
Our operations involving wafer-level process and require wastewater treatment at our K7 Plant have been subject to scrutiny by the Kaohsiung City Environmental Protection Bureau and the Kaohsiung District Prosecutors office as a result of alleged wastewater disposal violations that occurred on October 1, 2013.
51
InOn December 20, 2013, the Kaohsiung City Environmental Protection Bureau orderedimposed a fine of NT$102.0 million (the “Administrative Fine”) upon us to suspend the operations at our K7 Plant’s wafer-level process where nickel was used for alleged wastewater discharge violations and imposed a NT$110.1 million fine against us. The NT$110.1 million fineof the Water Pollution Control Act. We filed an administrative appeal to nullify the Administrative Fine, which was later reduced to NT$109.4 million as ordereddismissed by the Kaohsiung City Environmental Protection Bureau.Government. In DecemberAugust 2014, the Kaohsiung City Environmental Protection Bureau lifted the suspension order and approved the full resumption of operations of our K7 Plant after ordering a series of examinations, hearings and trial runs. In September 2015, the fine was further reduced to NT$102.0 million (US$3.1 million) by the Kaohsiung City Environmental Protection Bureau and we received a refund of NT$7.3 million (US$0.2 million) in October 2015. Although our K7 Plant has resumed full operation, we may be subject to other new environmental claims, charges or investigations of our K7 Plant or other facilities that may cause similar or more severe interruptions to our business and operations.
With respect to the NT$102.0 million (US$3.1 million) administrative penalty imposed on us by the Kaohsiung City Environmental Protection Bureau, we appealed to the Kaohsiung High Administrative Court in August 2014 seeking to (i) revoke Kaohsiung City Government’s decision, (ii) lift the administrative penalty imposed on us and (iii) demand a refund of the administrative penalty.Administrative Fine. On March 22, 2016, the Kaohsiung High Administrative Court revoked Kaohsiung City Government’s decision and lifted the administrative penalty. Our demand for a refund of the fineAdministrative Fine was dismissed. We appealed to the Supreme Administrative Court on April 14, 2016 against the Kaohsiung High Administrative Court’s unfavorable ruling in dismissing a refund. The outcome ofOn June 8, 2017, the proceeding cannot be predicted with certainty.Supreme Administrative Court overturned Kaohsiung High Administrative Court’s decision and ordered Kaohsiung Environmental Protection Bureau to refund the Administrative Fine paid by us.
In connection with the same alleged violations at our K7 plant, in October 2014, the Kaohsiung District Court ruled that we were in violation of the ROCR.O.C. Waste Disposal Act and imposed on us a criminal penalty of NT$3.0 million. We appealed the case to the Taiwan High Court Kaohsiung District Branch in November 2014. InOn September 29, 2015, the Taiwan High Court Kaohsiung District Branch overturned the decision made by Kaohsiung District Court and found the Companyus not guilty and repealed the criminal penalty imposed on the Company.us. The verdict was final and not appealable. For additional details of these administrative actions and judicial proceedings related to our K7 Plant see “Item 4. Information on the Company—Property, Plants and Equipment” and see “Item 8. Financial Information—Consolidated Statements and Other Financial Information—Legal Proceedings.” Defending against any of thesethe pending or future actions will likely be costly and time-consuming and could significantly divert management’s efforts and resources.
Any future suspension of operations at K7 Plant or our other facilities may adversely affect our business, financial condition, results of operations and cash flows. See “Item 3. Key Information—Risk Factors—Risks Relating to Our Business—Any environmental claims or failure to comply with any present or future environmental regulations, as well as any fire or other industrial accident, may require us to spend additional funds and may materially and adversely affect our financial condition and results of operations.”
Our estimated environmental capital expenditures for 2016 will be approximately US$35.0 million. In orderClimate Change Management
Climate change management is key to demonstrateour corporate sustainability. We have established a clear focus on low-carbon development in response to climate change and fluctuating energy supply. We are committed to taking firm actions to mitigate the emission of greenhouse gases throughout our business operations. We aim to address and integrate climate change with our development strategies by (i) establishing an overall carbon management system to implement low-carbon strategies and policies in accordance with our three major guiding principles – “energy saving,” “green energy” and “energy storage”; (ii) investing in renewable energy; (iii) innovating and promoting low-carbon products and services; (iv) identifying our vulnerabilities to climate change and developing adaptation strategies; and (v) cultivating a “green” corporate culture and becoming a leading low-carbon solution provider. We have set up a Corporate Sustainability Committee (CSC) and adopted internal policies in our domestic and oversea subsidiaries to fulfill our commitment to fulfillsustainable development.
We believe that there are opportunities associated with climate change related risks and have implemented the following strategies to evaluate the risks and take advantage of the opportunities:
| · | Management procedures. Since 2013, ASE has been using the Enterprise Risk Management (ERM) to manage climate change related risks. Consequently, potential risks induced by climate change are identified and assessed in a global scale. We have established a specific monitoring and control mechanism to reduce the adverse impacts of climate change on our business operation. The identified risks are managed by a variety of departments or functions (risk functions) across all parts of our organization. |
57
| · | Identification processes for risks and opportunities. The identification process for risks and opportunities is carried out at both company and asset level linked to multidimensional aspects. Natural disaster, sustainability development and low carbon technology are also the major factors to address climate change related risks. To do so, risk management programs are regularly implemented in our major manufacturing sites as well as all group-level functional departments and assets. Risk identification, assessment and response are three important steps in the ERM cycle. Risks and events that might have an influence on our business objectives are identified and evaluated, in order to decide on appropriate responses. |
| · | Prioritize the risks and opportunities identified. In accordance with a matrix analysis, the priority of climate change risks and opportunities are determined by the following criteria: timeframe, likelihood, control effectiveness and magnitude of impact on our sustainable operation. A comprehensive methodology is designed to evaluate the cost of implementation, effectiveness (degree to which a response will reduce impact), feasibility (difficulty) and time needed for implementation. Under a mechanism of prevention, early warning and emergency response to risks of different priorities, we believe that we will be able to effectively keep climate change risks under control. |
Along with an increasing awareness of climate change crisis, energy saving and carbon reduction have become a mainstream concept for products or services, especially required by our corporate social responsibility towardcustomers. To meet the needs of customers and greenhouse gas mitigation, we continuously strive to provide high efficiency products as well as invest in the research and development for eco-friendly design. From the initial product design stage, we conscientiously incorporate the use of green materials and cleaner production as well as the construction of green buildings and the upgrading of existing ones. For instance, we have maintained a multi-site certification for ISO 14001 and ISO 50001, which regularly examines the effectiveness of our environment and energy management systems and helps to improve our resource efficiency and reduce waste.
In 2015, ASE established the Corporate Sustainability Committee (CSC) as the highest level of management for sustainability management. The CSC is chaired by the chief operating officer and comprises of senior management executives, including six directors of ASEH. The CSC is responsible for supervising corporate-wide sustainability affairs and reports directly to the board of directors. The CSC is driven by five sustainability taskforces, among which, the environmental and green innovation taskforce monitor climate change and water-related issues.
Since 2012, we have incorporated green design standards and building concepts into the construction of our facilities. Starting in 2014, we have committed to constructing all new manufacturing facilities and office buildings in Taiwan following the most up-to-date green building standards, such as US LEED (Leadership in Energy and Environmental Design) and Taiwan EEWH (Ecology, Energy Saving, Waste Reduction and Health) standards. We have also adopted the green building concept to improve environmental performance of our existing buildings. In addition, we further promote "Green Factory Label Certification” by implementing the green building concept and cleaner production mechanism.
ASEH is committed to increase resource recycling and reduce greenhouse gas emission, wastewater discharge, waste generation and chemical use. ASE Corporate Social Responsibility Best Practice Principles Article 16 mentions: “to improve water use efficiency, the subsidiaries of the Company shall properly and sustainably use water resources and establish relevant management measures. The subsidiaries of the Company shall construct and improve environmental protection treatment facilities to avoid polluting water, air and land, and use its best efforts to reduce adverse impact on human health and the environment by adopting the best practical pollution prevention and control measures.”
In terms of water resource, effective management diminishes the impact of water shortages on ASEH and the value chain, and strengthens corporate competitiveness. As the world’s leading semiconductor manufacturer, we have established sustainable water recycling system: set up water management objective and strategy based upon integrated circular thinking. To mitigate water-shortage related risks, our water management program is based on three approaches: reduce, reuse and recycle. We also continuously explore opportunities to improve business resilience and competiveness through water use conservation.
In 2015, we joined the Responsible Business Alliance (RBA, previously the Electronic Industry Citizens Coalition or EICC). Every year, all of ASE’s facilities (there are currently 19 including both ASE and USI) complete the RBA’s Self-Assessment Questionnaire (SAQ) to identify the labor, environmental, and ethical risks in December 2013,their operations. In internal management, we adopt the guidelines set out by the United Nations Framework Convention on Climate Change by encouraging all facilities to submit their own self-initiated goals that are set according to their own operation scale and capabilities. The concept of “common but differentiated responsibilities (CBDR)” helps steer our boardoperations to achieve 2020 Environmental Targets through the support from the Environment and Green Innovation Taskforce. We refer to the Aqueduct Water Risk data from the World Resources Institute to calculate the level of directors approved contributions to environmental protection efforts in Taiwan inwater risk at each site based on the product of the three risk factors. The three risk factors are World Resources Institute’s overall water risk, revenue share, and total water withdrawal. The assessment results will be divided into 5 levels, with a total amountweight score of notmore than 60% (Score 76) being extremely high risk; a weight score of more than 40% less than NT$3,000.0 million, at minimum, to be made in the next 30 years.60% (Score 51~75) is a high risk; a weight score of more than 20% is less than 40 % (Score 26~50) is moderate risk; weight score over 10% is less than 20% (Score 13~25) is low risk; weight score below 10% (Score 12) is extremely low risk.
58
Insurance
We have insurance policies covering property damage and damage to our production facilities, buildings and machinery. In addition, we have liability insurance policies, covering our publicincluding but not limited to general liability insurance policies, product liability insurance policies for specified clients and product liabilities. Significant damage to any of our production facilities would have a material adverse effect on our results of operations.products and directors’ and officers’ insurance policies.
We are not insured against the loss of key personnel.
52
The following chart illustrates our corporate structure including our principal manufacturing subsidiaries as of MarchJanuary 31, 2016.2019. The following chart does not include wholly owned intermediate holding companies, internal trading companies and those companies without active operations.
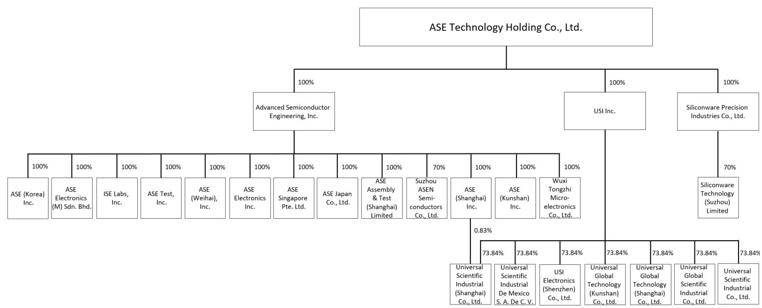
Our Consolidated Subsidiaries
ASE Test Taiwan
ASE Test Taiwan, which was acquired in 1990, is our wholly owned subsidiary. It is incorporated in Taiwan and is engaged in the testing of integrated circuits.
ASE Test Malaysia
ASE Test Malaysia, which was established in 1991, is our wholly owned subsidiary. It is incorporated in Malaysia and is engaged in the packaging and testing of integrated circuits.
59
ISE Labs
ISE Labs is our wholly owned subsidiary. It is a semiconductor company specializing in front-end engineering testing that is incorporated in the United States and has its principal facilities located in Fremont, California. We acquired 70.0% of the outstanding shares of ISE Labs in 1999 through ASE Test, and increased our holding to 100.0% through purchases made in 2000 and 2002.
ASE Singapore Pte. Ltd.
ASE Singapore Pte. Ltd., our wholly owned subsidiary, is incorporated in Singapore and provides packaging and testing services. We acquired ASE Singapore Pte. Ltd., which was wholly owned by ISE Lab, through our acquisition of ISE Lab in 1999. In January 2011, ASE Singapore II Pte. Ltd. (formerly, EEMS Test Singapore) merged into ASE Singapore Pte. Ltd. after we acquired ASE Singapore II Pte. Ltd. in August 2010.
ASE Electronics
ASE Material was established in 1997 as an ROCR.O.C. company for the production of interconnect materials, such as substrates, used in the packaging of semiconductors. We initially held a majority stake in ASE Material, but acquired the remaining equity by means of a merger of ASE Material with and into us in August 2004. In August 2006, we spun off the operations originally conducted through ASE Material into our wholly owned subsidiary ASE Electronics. ASE Electronics currently supplies our packaging operations with a substantial portion of our substrate requirements. The facilities of ASE Electronics are primarily located in the Nantze Export Processing Zone near our packaging and testing facilities in Kaohsiung, Taiwan.
ASE Chung Li and ASE Korea
In July 1999, we purchased Motorola’s Semiconductor Products Sector operations in Chung Li, Taiwan and Paju, South Korea for the packaging and testing of semiconductors, thereby forming ASE Chung Li and ASE Korea.
53
In August 2004, we acquired the remaining outstanding shares of ASE Chung Li that we did not already own and merged ASE Chung Li into us.
ASE Japan
ASE Japan, which we acquired from NEC Electronics Corporation in May 2004, is our wholly owned subsidiary. It is incorporated in Japan and is engaged in the packaging and testing of semiconductors.
ASE Shanghai
ASE Shanghai was established in 2001 as a wholly owned subsidiary of ASE Inc. and began operations in June 2004. ASE Shanghai primarily manufactures and supplies interconnect materials for our packaging operations.
ASESH AT
We acquired 100% ofequity interest in GAPT, now known as ASESH AT, in January 2007 for a purchase price of US$60.0 million. ASESH AT is a PRCP.R.C. company based in Shanghai, China that provides packaging and testing services for a wide range of semiconductors.
ASEN
In September 2007, we acquired 60.0% ofequity interest in ASEN, formerly known as NXP Semiconductors Suzhou Ltd., from NXP Semiconductors for a purchase price of US$21.6 million. NXP Semiconductors holdsIn March 2018, we acquired the remaining 40.0% equity interest in ASEN for a purchase price of ASEN.US$127.1 million. In August 2018, we resolved to sell 30.0% equity interest in ASEN to Tsinghua Unigroup Ltd. at US$95.3 million. ASEN is based in Suzhou, China and is engaged in semiconductor packaging and testing.
ASEWH
In May 2008, we acquired 100.0% of the shares of ASEWH from Aimhigh Global Corp. and TCC Steel. ASEWH is based in Weihai, Shandong, China and is engaged in semiconductor packaging and testing.
60
ASEKS
ASEKS was set up in 2004 and began operating in 2010. ASEKS is based in Kunshan, China and is engaged in semiconductor packaging and testing.
Wuxi Tongzhi
In May 2013, we, through our subsidiary ASESH AT, acquired 100.0% of the shares of Wuxi Tongzhi from Toshiba Semiconductor (Wuxi) Co, Ltd. Wuxi Tongzhi is based in Wuxi, China and is engaged in semiconductor packaging and testing.
USI Group
USI Group engages primarily in electronic manufacturing services in relation to computers and storage , consumer electronics, communications, industrial and automotive, among other services and businesses. We purchased 22.6% of the outstanding shares of Universal Scientific Industrial in 1999. We subsequently increased our holding to 23.3% in 2000. As of December 31, 2009, we held approximately 18.1% of Universal Scientific’sScientific Industrial’s outstanding equity shares, which allowed us to exercise significant influence over Universal Scientific Industrial and therefore accounted for this investment by the equity method. In February 2010, we, along with our two subsidiaries, J&R Holding Limited and ASE Test, through a cash and stock tender offer, acquired 641,669,316 common shares of Universal Scientific Industrial at NT$21 per share, amounting to NT$13,475.1 million in total, resulting in our controlling ownership over Universal Scientific. Scientific Industrial.
As a result, Universal Scientific Industrial became our subsidiary. The shares of Universal Scientific Industrial were delisted from the Taiwan Stock ExchangeTWSE on June 17, 2010, which were previously listed under the symbol “2350.” In August 2010, we acquired additional 222,243,661 shares of Universal Scientific through another tender offer at NT$21 per share, amounting to NT$4,667.1 million in total. In September 2012, as part of our internal business restructuring, our subsidiaries transferred their shareholdings in Universal Scientific Industrial to ASE Inc.
ASE.
54
In February 2012, Universal Scientific Industrial Shanghai completed its IPO on the Shanghai Stock Exchange. The total proceeds from the IPO was approximately RMB811.7 million prior to deducting underwriting discounts and commissions. In November 2014, Universal Scientific Industrial Shanghai completed its capital increase by way of domestic private placements through a bidding process, raising a total of RMB2,063.0 million prior to deducting underwriting discounts and commissions. The issue price per share was RMB27.06. As of MarchJanuary 31, 2016,2019, we indirectly held 77.3%74.7% of the total outstanding shares of Universal Scientific Industrial Shanghai through our subsidiaries USI Inc. and ASE Shanghai.
On February 2, 2015, Universal Scientific’sScientific Industrial’s shareholders passed a resolution at the shareholders’ meeting to spin-off and assign Universal Scientific’sScientific Industrial’s investment businesses with a then-estimated value of NT$35,537.8 million (US$1,083.8 million) to USI Inc. In April 2015, Universal Scientific Industrial completed a spin-off of its subsidiaries to USI Inc., a company incorporated under ROCR.O.C. law. As part of our business realignment effort, we acquired 990.1 million shares in USI Inc. on the spin-off record date, which resulted in us holding 99.2% of the total then outstanding shares of USI Inc. Following Universal Scientific’sScientific Industrial’s spin-off of its investment businesses to USI Inc., Universal Scientific Industrial carried out a capital reduction plan reducing its capital from NT$16,413.0 million (US$500.5 million) to NT$400.0 million (US$12.2 million).million. As a result of such spin-off, as of April 1, 2015, we held approximately 99.0% of the outstanding common shares of Universal Scientific.Scientific Industrial.
Furthermore,On September 24, 2015, as part of our corporate reorganization to align each business function to different legal entity groups, the board of directors of ASE Inc. passed a resolution on September 24, 2015, to announce our intention to carry ourout the Universal Scientific Industrial Share Transfer. The Universal Scientific Industrial Share Transfer was approved by the Investment Commission of MOEA on February 3, 2016 and the2016. The majority of shares were transferred in March 2016, withand the remaining share transfer to be completedshares were transferred in May 2016. As of March 31, 2016, ASE Inc. indirectly held 76.5% of Universal Scientific. Following the completion of the Universal Scientific Industrial Share Transfer, USI Group will operate under the legal entities directly and indirectly held under USI Inc.
In January 2017, Universal Scientific Industrial completed a cash capital increase of NT$1,000 million and ASE’s shareholdings of Universal Scientific Industrial increased to 75.7%.
61
In January 2018, the shareholders’ meeting of the Company’s subsidiary, USI Enterprise Limited, resolved to repurchase its outstanding 3,738,000 ordinary shares at the price of US$17.49 per share and, as a result, ASE’s shareholdings of USI Enterprise Limited increased from 96.9% to 98.6%. In July 2018, the board of directors of ASE and UGTW approved the acquisition of the outstanding ordinary shares of USI Inc. and Universal Scientific Industrial at NT$35 (US$1.1) and NT$18 (US$0.6) per ordinary shares, respectively, as well as the purchase of ordinary shares from dissenting shareholders in August 2018. ASE and UGTW have completed the acquisition of USI Inc. and Universal Scientific Industrial in September 2018 and December 2018, respectively.
In order to advance our global supply system and expand our commercial reach in Europe, our subsidiary, Universal Global Electronics Co., Ltd., entered into an equity transfer agreement with Chung Hong Electronics (Suzhou) Co., Ltd., intending to acquire the entire 60% equity in its Polish subsidiary, Chung Hong Electronics Poland SP.Z.O.O., in Eastern Europe for a consideration of RMB78 million in August 2018. This agreement also stipulated that within six months after the audit of financial statements of the Polish subsidiary for the year ending 2020, Universal Global Electronics Co., Ltd. can acquire the remaining equity in such subsidiary at 10 times the static P/E ratio. As of January 31, 2019, Universal Global Electronics Co., Ltd. has made prepayments for investment of NT$103.6 million (US$3.4 million).
In October 2018, to increase operational flexibility through organizational restructure, ASE’s board of directors resolved to spin off ASE’s investment department, which is responsible for managing the ordinary shares and assets of USI Inc., into USI Global, a newly established company. The spin-off consummated in November 2018 and the Company obtained control over USI Global. In December 2018, the board of directors of the Company and USI Global resolved to merge and the merger consummated in January 2019. The Company became the surviving entity from the merger and USI Global was dissolved after the merger. USI Global’s spin-off from ASE Inc. and USI Global’s merger with the Company have no material effect on the Company’s financial position and financial performance. As of January 31, 2019, the Company indirectly held 73.8% of the outstanding shares of Universal Scientific Industrial and directly held 100.0% of the outstanding shares of USI Inc. See “Item 4. Information on the Company—Information on the Company—History and Development of the Company—USI Group Restructuring” for more information.
SPIL
SPIL is a provider of semiconductor packaging and testing services. SPIL offers a full range of packging and testing solutions, including advanced packages, substrate packages and lead-frame packages, as well as testing for logic and mixed signal devices. SPIL also provides turnkey services, from packaging and testing to shipment service.
SPIL and ASE entered into a Joint Share Exchange Agreement on June 30, 2016, pursuant to which ASE established ASEH through a statutory exchange and ASEH acquired all issued and outstanding shares of both ASE and SPIL. For details about the Joint Share Exchange Agreement, see “Item 10. Additional information—Material Contract.”
The Share Exchange consummated on April 30, 2018, and SPIL’s shares concurrently delisted from TWSE and NASDAQ on April 30, 2018. On April 30, 2018, ASE and SPIL became privately held wholly-owned subsidiaries of ASEH. For details about the SPIL Acquisition, see “Item 4. Information on the Company—Acquisition of Common Shares and American Depositary Shares of SPIL.”
PROPERTY, PLANTS AND EQUIPMENT
We operate a number of packaging, testing and electronic manufacturing facilities in Asia and the United States. Our facilities provide varying types or levels of services with respect to different end-product focus, customers, technologies and geographic locations. With our diverse facilities we are able to tailor our packaging, testing and electronic manufacturing solutions closely to our customers’ needs. The following table sets forth the location, commencement of operation, primary use, approximate floor space and ownership of our principal facilities as of February 29, 2016.January 31, 2019.
62
Facility | Location | Commencement of Operation | Primary Use | Approximate | Owned or Leased |
| ASE Inc. | Kaohsiung, | March 1984 | Our primary packaging facility, which offers complete semiconductor manufacturing solutions in conjunction with ASE Test Taiwan and foundries located in Taiwan. Focuses primarily on packaging services such as flip-chip, wafer bumping and fine-pitch wire bonding. | Land: leased Buildings: owned and leased | |
| Chung Li, | Acquired in July 1999 | An integrated packaging and testing facility that specializes in semiconductors for communications and consumer applications. | Land and buildings: owned | ||
55
|
|
|
|
|
|
| ASE Test Taiwan | Kaohsiung, | Acquired in April 1990 | Our primary testing facilities, which offer complete semiconductor manufacturing solutions in conjunction with ASE Inc.’s facility in Kaohsiung and foundries located in Taiwan. Focuses primarily on advanced logic/mixed-signal/RF/3D IC testing for integrated device manufacturers, fabless design companies and system companies. | Land: leased Buildings: owned and leased | |
| ASE | Penang, Malaysia | February 1991 | An integrated packaging and testing facility that focuses primarily on the requirements of integrated device manufacturers. | Land: leased Buildings: owned | |
| ASE Korea | Paju, Korea | Acquired in July 1999 | An integrated packaging and testing facility that specializes in semiconductors for radio frequency, sensor and automotive applications. | Land and buildings: owned | |
| ISE Labs | California, USA Texas, USA | Acquired in May 1999 | Front-end engineering and final testing facilities located in northern California in close proximity to some of the world’s largest fabless design companies. Testing facilities located in close proximity to integrated device manufacturers and fabless companies in Texas. | Land and buildings: owned and leased | |
| ASE Singapore | Singapore | Acquired in May 1999 | An integrated packaging and testing facility that specializes in semiconductors for communication, computers and consumer applications. | 282,000 | Land: leased Buildings: owned and leased |
63
Facility | Location | Commencement of Operation | Primary Use | Approximate | Owned or Leased |
| ASE Shanghai | Shanghai, China | June 2004 | Design and production of semiconductor packaging materials. | Land: leased Buildings: owned | |
| ASE Japan | Takahata, Japan | Acquired in May 2004 | An integrated packaging and testing facility that specializes in semiconductors for cellular phone, household appliance and automotive applications. | Land and buildings: leased |
56
|
|
|
|
|
|
| ASE Electronics | Kaohsiung, | August 2006 | Facilities for the design and production of interconnect materials such as substrates used in the packaging of semiconductors. | Land: leased Buildings: owned and leased | |
| ASESH AT | Shanghai, China | Acquired in January 2007 | An integrated packaging and testing facility that specializes in semiconductors for communications and consumer applications. | Land: leased Buildings: owned | |
| ASEN | Suzhou, China | Acquired in September 2007 | An integrated packaging and testing facility that specializes in communication applications. | Land: leased Buildings: owned | |
| ASEWH | Shandong, China | Acquired in May 2008 | An integrated packaging and testing facility that specializes in semiconductors for communications, computing and consumer applications. | Land: leased Buildings: owned | |
| ASEKS | Kunshan, China | July 2010 | An integrated packaging and testing facility that specializes in semiconductors for communications and consumer applications. | Land: leased Buildings: owned | |
| Wuxi Tongzhi | Wuxi, China | Acquired in May 2013 | An integrated packaging and testing facility that specializes in semiconductors for MP3, Vehicle, household appliance and communications applications. | 78,000 | Land and buildings: leased |
| Universal Scientific Industrial | Nantou, | Acquired in February 2010 | Manufacture and marketing of electronic components, accessories and related products. | Land: owned Buildings: owned and leased | |
| USI Mexico | Guadalajara, Mexico | Acquired in February 2010 | Manufacturing site, which offer motherboard manufacture and system assembly. |
5764
Facility | Location | Commencement of Operation | Primary Use | Approximate | Owned or Leased |
| USISZ | Shenzhen, China | Acquired in February 2010 | Manufacturing site, design, manufacture and marketing of motherboards, electronic components, accessories and related products in China. | 683,000 | Land: leased Buildings: owned |
| Universal Scientific Industrial Shanghai | Shanghai, China | Acquired in February 2010 | Manufacturing site, design, manufacture and marketing of motherboards, electronic components, accessories and related products in China. | Land: leased Buildings: owned and leased | |
| UGKS | Kunshan, China | August 2011 | Manufacturing site, design, manufacture and marketing of motherboards, electronic components, accessories and related products in China. | ||
| UGTW | Nantou, | February 2010 | Design, manufacture and marketing of electronic components, accessories and related products, and provide related research and development services. | Land: owned Buildings: owned and leased | |
| UGJQ | Shanghai, China | Established in September 2013 | Design, manufacture and marketing of motherboards, electronic components, accessories and related products in China. | Land and buildings: leased | |
| Siliconware Precision Industries Co., Ltd. | Taichung, R.O.C. | Acquired in April 2018 | Packaging facility, which offers semiconductor packaging and testing turnkey services. This facility focuses primarily on packaging services, such as flip-chip, wafer bumping and wire bonding. | 5,724,000 | Land: owned and leased Buildings: owned |
| Changhua, R.O.C. | Acquired in April 2018 | Packaging facility, which focuses primarily on sevices such as SiP, flip-chip, wafer bumping and wire bonding. | 1,442,000 | Land and buildings: owned | |
| Hsinchu, R.O.C. | Acquired in April 2018 | Testing facility, which offers semiconductor testing services on wafer sorting and final testing. This facility focuses primarily on the requirement of wireless communication and consumer applications. | 1,169,000 | Land: leased Buildings: owned | |
| Siliconware Technology (Suzhou) Limited | Suzhou, China | Acquired in April 2018 | An integrated packaging and testing facility. This facility focuses primarily on packaging services, such as flip-chip, wafer bumping and wire bonding. | 1,447,000 | Land: leased Buildings: owned |
Our major
65
ASE Inc. and ASE Test Taiwan have leased property in Kaohsiung consists primarily of leases of land in the Kaohsiung Nantze Export Processing Zone between ASE Inc. and ASE Test Taiwan, as the lessees, andfrom the Export Processing ZonesZone Administration (“the EPZA”(the “EPZA”), under the Ministry of Economic Affairs. The leases have with ten-year or twenty-yearto seventeen-year terms that will expire through June 2035. We have leased land from the Central Taiwan Science Park Administration in Taichung with twenty-year terms that will expire in November 2034. We have leased land from Hsinchu Science Park Administrations in Hsinchu with fourteen-year to forty-year terms that will expire through December 2034. No sublease or lending of the land is allowed. The EPZA, hasthe Central Taiwan Science Park Administration and the Hsinchu Science Park Administrations have the right to adjust the rental price in the event the government revalues the land. The leases are typically renewable with one-month to three-month notice prior to the termination date.
ASE Inc. Kaohsiung Facility
InOn December 20, 2013, the Kaohsiung City Environmental Protection Bureau ordered us to suspend the operations at our K7 Plant’s wafer-level process where nickel was used for alleged wastewater discharge violations and imposed a fine of NT$110.1102.0 million fine against us. The NT$110.1 million fine(the “Administrative Fine”) upon us for the violation of the Water Pollution Control Act. We filed an administrative appeal to nullify the Administrative Fine, which was later reduced to NT$109.4 million as ordereddismissed by the Kaohsiung City Environmental Protection Bureau.Government. In DecemberAugust 2014, the Kaohsiung City Environmental Protection Bureau lifted the suspension order and approved the full resumption of operations of our K7 Plant after ordering a series of examinations, hearings and trial runs. In September 2015, the fine was further reduced to NT$102.0 million (US$3.1 million) by the Kaohsiung City Environmental Protection Bureau and we received a refund of NT$7.3 million (US$0.2 million) in October 2015.
58
With respect to the NT$102.0 million (US$3.1 million) administrative penalty imposed on us by the Kaohsiung City Environmental Protection Bureau, we appealed to the Kaohsiung High Administrative Court in August 2014 seeking to (i) revoke Kaohsiung City Government’s decision, (ii) lift the administrative penalty imposed on us and (iii) demand a refund of the administrative penalty.Administrative Fine. On March 22, 2016, the Kaohsiung High Administrative Court revoked Kaohsiung City Government’s decision and lifted the administrative penalty. Our demand for a refund of the fineAdministrative Fine was dismissed. We appealed to the Supreme Administrative Court on April 14, 2016 against the Kaohsiung High Administrative Court’s unfavorable ruling in dismissing a refund. The outcome ofOn June 8, 2017, the proceeding cannot be predicted with certainty.Supreme Administrative Court overturned Kaohsiung High Administrative Court’s decision and ordered Kaohsiung Environmental Protection Bureau to refund the Administrative Fine paid by us.
In connection with the same alleged violations at our K7 plant, in October 2014, the Kaohsiung District Court ruled that we were in violation of the ROCR.O.C. Waste Disposal Act and imposed on us a criminal penalty of NT$3.0 million. We appealed the case to the Taiwan High Court Kaohsiung District Branch in November 2014. InOn September 29, 2015, the Taiwan High Court Kaohsiung District Branch overturned the decision made by Kaohsiung District Court and found the Companyus not guilty and repealed the criminal penalty imposed on the Company.us. The verdict was final and not appealable. For additional details of these administrative actions and judicial proceedings related to our K7 Plant see “—Environmental Matters” and “Item 8. Financial Information—Consolidated Statements and Other Financial Information—Legal Proceedings.”
Any future suspension of operations at K7 Plant or our other facilities may adversely affect our business, financial condition, results of operations and cash flows. See “Item 3. Key Information—Risk Factors—Risks Relating to Our Business—Any environmental claims or failure to comply with any present or future environmental regulations, as well as any fire or other industrial accident, may require us to spend additional funds and may materially and adversely affect our financial condition and results of operations.”
We currently do not have plans for significant expansion, but will re-evaluate our need for future expansion based on market condition and future demand requirements to meet our expected future growth. For information on the aggregate capacity of our facilities we operate, see “—Business Overview—Equipment.”
Item 4A. Unresolved Staff Comments
None.
66
Item 5. Operating and Financial Review and Prospects
OPERATING RESULTS AND TREND INFORMATION
The following discussion of our business, financial condition and results of operations should be read in conjunction with our consolidated financial statements, which are included elsewhere in this annual report. This discussion contains forward-looking statements that reflect our current views with respect to future events and financial performance. Our actual results may differ materially from those anticipated in these forward-looking statements as a result of any number of factors, such as those set forth under “Item 3. Key Information—Risk Factors” and elsewhere in this annual report. See “Special Note Regarding Forward-Looking Statements.”
Overview
The following sections discuss our business, financial condition and results of operations taking into account the SPIL Acquisition on April 30, 2018. Our finanacial information for 2018 consists operating results of: (a) ASE Technology Holding Co., Ltd. and SPIL for the period from April 30, 2018 through December 31, 2018; and (b) ASE, the predecessor entity of ASEH, for the twelve months ended December 31, 2018.
We offer a broad range of semiconductor packaging and testing services and we also offer electronic manufacturing services since our acquisition of a controlling interest in Universal Scientific Industrial in February 2010.2010 and acquisition of all the shares of USI Inc. in September 2018. In addition to offering each service separately, we also offer turnkey services, which includes integrated packaging, testing and direct shipment of semiconductors to end users designated by our customers and solution-based proactive original design manufacturing, with our customers. In addition, we started generating revenues from our real estate business since 2010. Our operating revenues increased from NT$219,862.4274,884.1 million in 20132016 to NT$256,591.4290,441.2 million in 20142017 and NT$283,302.5371,092.4 million (US$8,639.912,123.2 million) in 2015.2018.
Discussed below are several factors that have had a significant influence on our financial results in recent years.
Pricing and Revenue Mix
We price our services taking into account the actual costs involved in providing these services, with reference to prevailing market prices. The majority of our prices and revenues are denominated in U.S. dollars. Any significant fluctuation in exchange rates, especially between NT dollars and U.S. dollars, will affect our costs and, in turn, our revenues.
59
In the case of semiconductor packaging, the cost of the silicon die, typically the most costly component of the packaged semiconductor, is usually not reflected in our costs (or revenues) since it is generally supplied by our customers on a consignment basis.
The semiconductor industry is characterized by a general trend toward declining prices for products and services of a given technology over time. In addition, during periods of intense competition and adverse conditions in the semiconductor industry, the pace of this decline may be more rapid than in other years. The average selling prices of our packaging and testing services have experienced sharp declines during such periods as a result of intense price competition from other market participants that attempt to maintain high capacity utilization levels in the face of reduced demand.
Declines in average selling prices have been partially offset historically by changes in our revenue mix, and typically the selling price is largely dependable on the complexity of the services. In particular, revenues derived from more advanced package types, such as flip-chip BGA, higher density packages with finer lead-to-lead spacing, or pitch, and testing of more complex, high-performance semiconductors have increased as a percentage of total revenues. We intend to continue to focus on package types such as bumping, flip-chip BGA and SiP, developing and offering new technologies in packaging and testing services and expanding our capacity to achieve economies of scale, as well as improving production efficiencies for older technologies, in order to mitigate the effects of declining average selling prices on our profitability.
Our profitability for a specific package type does not depend linearly on its average selling price. Some of our more traditional package types, which typically have low average selling prices, may well command steadier and sometimes higher margins than more advanced package types with higher average selling prices.
67
High Fixed Costs
Our operations, in particular our testing operations, are characterized by relatively high fixed costs. We expect to continue to incur substantial depreciation and other expenses especially from our acquisitions of packaging and testing equipment and facilities. Our profitability depends in part not only on absolute pricing levels for our products/services, but also on utilization rates on equipment, commonly referred to as “capacity utilization rates.” In particular, increases or decreases in our capacity utilization rates could have a significant effect on gross margins since the unit cost of our products and/or services generally decreases as fixed costs are allocated over a larger number of units. The capacity utilization rates of the machinery and equipment installed at our production facilities typically depend on factors such as the volume and variety of products, the efficiency of our operations in terms of the loading and adjustment of machinery and equipment for different products, the complexity of the different products to be packaged or tested, the amount of time set aside for the maintenance and repair of the machinery and equipment, and the experience and schedule of work shifts of operators.
In 2013, 20142016, 2017 and 2015,2018, our depreciation, amortization and rental expense included in operating costs as a percentage of operating revenues was 11.1%10.3%, 9.9%9.5% and 10.0%,10.9% respectively. The increase in depreciation, amortization and rental expense as a percentage of operating revenues in 20152018 compared to 20142017 was primarily a result of a decreasean increase in our packagingcapital expenditures and testing revenues.PPA effects in 2018. We begin depreciating our equipment when the machinery is placed into service. There may sometimes be a time lag between when our equipment is available for use and when it achieves high levels of utilization. In periods of depressed industry conditions, such as the fourth quarter of 2008, we experienced lower than expected demand from customers, resulting in an increase in depreciation relative to operating revenues. In particular, the capacity utilization rates for our testing equipment are more severely affected during an industry downturn as a result of a decrease in outsourcing demand from integrated device manufacturers, which typically maintain larger in-house testing capacity than in-house packaging capacity.
In addition to purchasing testers, we also lease a portion of our testers, which we believe allows us to better manage our capacity utilization rates and cash flow. Since leased testers can be replaced with more advanced testers upon the expiration of the lease, we believe that these operating leases have enabled us to improve our capacity utilization rates by allowing us to better align our capacity with changes in equipment technology and the needs of our customers. For more information about our testers, including the number of testers under lease, see “Item 4. Information on the Company—Business Overview—Equipment—Testing.”
60
Raw Material Costs
Substantially all of our raw material costs are accounted for by packaging, the production of interconnect materials and electronic manufacturing services. In particular, our electronic manufacturing services acquired in 2010 require more significant quantities of raw materials than our packaging and production of interconnect materials. In 2013, 20142018, raw material costs accounted for 81.1% of our operating revenues from electronic manufacturing services, and 2015,our revenues generated from electronic manufacturing services contributed to 40.9% of our operating revenues. In 2016, 2017 and 2018, raw material cost as a percentage of our operating revenues was 45.6%45.5%, 45.6%49.2% and 50.0%49.1%, respectively.
We have developed copper wire to gradually replace gold wire in the packaging processes in order to benefit from the lower material cost of copper. However, gold wire is still and will continue to be one of the principal raw materials we usefor us in our packaging processes, and the recent volatility in the price of gold has affected our operating costs. In 2015, the spot rate for gold fluctuated from approximately US$1,049 per ounce to approximately US$1,298 per ounce according to the statistics published by The London Bullion Market Association.processes. It may be difficult for us to adjust our average selling prices to account for fluctuations in the price of gold. WeThus we expect that gold wire will continue to be an importantour raw material for us and we therefore expectcosts to continue to be subject to significantaffected by fluctuations in the price of gold.
Recent Accounting Pronouncements
Adopted standards for current period
In the current year, we have applied the following new, revised or amended standards and interpretations that have been issued and effective: Amendments to IFRSsIFRS 2Annual Improvements to IFRSs: 2010-2012 CycleClassification and Measurement of Share-based Payment Transactions, IFRS 9Financial Instruments, Amendments to IFRSsIFRS 9 and IFRS 7Annual ImprovementsMandatory Effective Date of IFRS 9 and Transition Disclosures, IFRS 15Revenue from Contracts with Customers, Amendments to IFRSs: 2011-2013 CycleIFRS 15Clarifications to IFRS15 Revenue from Contracts with Customers and, Amendments to IAS 1940Defined Benefit Plans: Employee ContributionsTransfers of investment property and IFRIC 22Foreign Currency Transactions and Advance Consideration. We believe that Except for the adoptionfollowing, the initial application of the aforementioned new, revised or amended standards orand interpretations willdid not have a significant effect on our accounting policies. Please refer to note 3 to our consolidated financial statements included in this annual report for more information.
68
IFRS 9 “Financial Instruments” and related amendments
IFRS 9 supersedes IAS 39 “Financial Instruments: Recognition and Measurement”, with consequential amendments to IFRS 7 “Financial Instruments: Disclosures” and other standards. IFRS 9 sets out the requirements for classification, measurement and impairment of financial assets and hedge accounting. Please refer to note 4 to our consolidated financial statements included in this annual report for information relating to the relevant accounting policies.
The requirements for classification, measurement and impairment of financial assets have been applied retrospectively from January 1, 2018, and the requirements for hedge accounting have been applied prospectively. IFRS 9 is not applicable to items that have already been derecognized as of December 31, 2017.
The impact of adoption on our consolidated financial statements was not material.
Classification, measurement and impairment of financial assets
On the basis of the facts and circumstances that existed as of January 1, 2018, we have performed an assessment of the classification of recognized financial assets and have elected not to reflect the figures on a retrospective basis.
| a) | Unquoted shares and limited partnership classified as available-for-sale are designated as at fair value through other comprehensive income and the changes in fair value accumulated in other equity are transferred directly to retained earnings instead of being reclassified to profit or loss on disposal. Impairment losses previously recognized and accumulated in retained earnings are adjusted by we to record an increase in retained earnings and a decrease in other equity, unrealized gains or losses on financial assets at fair value through other comprehensive income, since no subsequent impairment assessment is required under IFRS 9; |
| b) | Quoted shares classified as available-for-sale are classified as at fair value through profit or loss under IFRS 9. Open-end mutual funds classified as available-for-sale are classified as at fair value through profit or loss under IFRS 9 because the contractual cash flows are not solely payments of principal and interest on the principal outstanding and they are not equity instruments. We reclassify unrealized gains or losses on available-for-sale financial assets in other equity to retained earnings; |
| c) | Time deposits with original maturity of over three months, pledged time deposits and guarantee deposits are classified as measured at amortized cost under IFRS 9 because, on initial recognition, the contractual cash flows that are solely payments of principal and interest on the principal outstanding and these investments are held within a business model whose objective is to collect the contractual cash flows; and |
| d) | Debt investments with no active market are classified as at fair value through other comprehensive income under IFRS 9, because, on initial recognition, the contractual cash flows that are solely payments of principal and interest on the principal outstanding and these investments are held within a business model whose objective is achieved both by collecting contractual cash flows and selling financial assets. We adjust those debt investments and other equity, unrealized gains or losses on financial assets at fair value through other comprehensive income, based on their fair value. |
IFRS 15 “Revenue from Contracts with Customers” and related amendment
IFRS 15 establishes principles for recognizing revenue that apply to all contracts with customers and supersedes IAS 18 “Revenue”, IAS 11 “Construction Contracts” and a number of revenue- related interpretations. Please refer to note 4 to our consolidated financial statements included in this annual report for information relating to the relevant accounting policies.
Most of the revenues generated from the goods manufactured by our operating segments in packaging and testing are changed to be recognized over time after the application of IFRS 15. Prior to the application of IFRS 15, we recognized revenues when the significant risks and rewards of ownership of inventories have been transferred to customers.
69
Our 2018 financial results may not be comparable to that of 2017 because we elected only to retrospectively apply IFRS 15 to contracts that were not complete as of January 1, 2018 and recognized the cumulative effect of retrospectively applying IFRS 15 in retained earnings on January 1, 2018. The adoption of IFRS 15 did not have a material impact on our consolidated financial statements.
Standards not yet adopted
Among the new, revised or amended standards and interpretations that have been issued but are not yet effective, we believeassessed that the adoptionapplication of the followingnew, revised or amended standards and interpretations will not have a material effectimpact on our accounting policies:financial position and financial performance: Amendments to IFRSsAnnual Improvements to IFRSs: 2012-2014 Cycle, Amendments to IFRS 9 and IFRS 7Mandatory Effective Date of IFRS 9 and Transition Disclosures, Amendments to IFRS 10, IFRS 12 and IAS 28Investment Entities: Applying the Consolidation Exception,Amendments to IFRS 11Accounting for Acquisitions of Interests in Joint Operations,IFRS 14Regulatory Deferral Accounts,Amendments to IAS 1Disclosure Initiative,Amendments to IAS 7Disclosure Initiative,Amendments to IAS 16 and IAS 38Clarification of Acceptable Methods of Depreciation and Amortization and Amendments to IAS 16 and IAS 41Agriculture: Bearer Plants.We are currently evaluating the impact on our financial position and operating results as a result of the initial adoption of the following standards and interpretations: IFRS 9Financial Instruments, IFRS 15Revenue from Contracts with Customers2015-2017 Cycle, Amendments to IFRS 159Clarifications to IFRS 15 “Revenue from ContractsPrepayment Features with Customers”Negative Compensation, Amendments to IFRS 10 and IAS 28Sale or Contribution of Assets between an Investor and its Associate or Joint Venture, IFRS 16Leases,Amendments to IAS 19Plan Amendment, Curtailment or Settlement, Amendments to IAS 28Long-term Interests in Associate and Joint Venture, IFRIC 23Uncertainty over Income Tax Treatments, Amendments to IFRS 3Definition of a Business and Amendments to IAS 121 and IAS 8RecognitionDefinition of Deferred Tax Assets for Unrealized LossesMaterial..
Please refer to note 3 to our consolidated financial statements included in this annual report for more information.the impact on our financial position and operating results as a result of the initial adoption of the following standards and interpretations: IFRS 16Leasesand Amendments to IAS 19Plan Amendment, Curtailment or Settlement.
IFRS 16 “Leases”
IFRS 16 sets out the accounting standards for leases that will supersede IAS 17, IFRIC 4 and a number of related interpretations.
Upon initial application of IFRS 16, we will elect to apply IFRS 16 in determining whether contracts are, or contain, a lease only to contracts entered into (or changed) on or after January 1, 2019. Contracts identified as containing a lease under IAS 17 and IFRIC 4 will not be reassessed and will be accounted for in accordance with the transitional provisions under IFRS 16.
Upon initial application of IFRS 16, if we are a lessee, IFRS 16 will recognize right-of-use assets or investment properties if the right-of-use assets meet the definition of investment properties, and lease liabilities for all leases on the consolidated balance sheets except for those whose payments under low-value asset and short-term leases will be recognized as expenses on a straight-line basis. On the consolidated statements of comprehensive income, we should present the depreciation expense charged on the right-of-use assets separately from the interest expense accrued on the lease liabilities; interest is computed using the effective interest method. On the consolidated statements of cash flows, cash payments for the principal portion of the lease liabilities will be classified within financing activities; cash payments for the interest portion will be classified within operating activities.
The application of IFRS 16 is not expected to have a material impact on the accounting results of us as lessor.
We anticipate applying IFRS 16 retrospectively with the cumulative effect of the initial application of this standard recognized on January 1, 2019. Comparative information will not be adjusted on a retrospective basis.
We expect to apply the following practical expedients:
| · | We will apply a single discount rate to a portfolio of leases with reasonably similar characteristics to measure lease liabilities. |
| · | We will account for those leases for which the lease term ends on or before December 31, 2019 as short-term leases. |
70
| · | We will exclude initial direct costs from the measurement of right-of-use assets on January 1, 2019. |
| · | We will use hindsight, such as in determining lease terms, to measure lease liabilities. |
Critical Accounting Policies and Estimates
Preparation of our consolidated financial statements requires us to make estimates and judgments in applying our critical accounting policies that have a significant impact on the results we report in our consolidated financial statements. Our principal accounting policies and critical accounting judgments and key sources of estimation uncertainty are set forth in detail in note 4 and note 5, respectively, to our consolidated financial statements included in this annual report. We continually evaluate these estimates and assumptions. Actual results may differ from these estimates under different assumptions and conditions. Significant accounting policies are summarized as follows.
61
Revenue RecognitionRecognition..
Prior to 2018
Revenue is measured at the fair value of the consideration received or receivable takeand takes into account of estimated customer returns, rebates and other similar allowances. Revenue from the sale of goods and real estate properties is recognized when the goods and real estate properties are delivered and titles have passed, at the time all the following conditions are satisfied:
| · |
| · |
| · | the amount of revenue can be reliably measured; |
| · | it is probable that the economic benefits associated with the transaction will flow to |
| · | the costs incurred or to be incurred in respect of the transaction can be reliably measured. |
Service income is recognized when services are rendered.
Our customers bear the title and risk of loss for those bare semiconductor wafers that we receive and package into finished semiconductors and/or those packaged semiconductors that we receive and test for performance specifications. Accordingly, the cost of customer-supplied semiconductor materials is not included in our consolidated financial statements.
A sales discount and return allowance is recognized in the period during which the sale is recognized, and is estimated based on historical experience, the management’s judgment and relevant factors.
Impairment of Accounts Receivable. 2018
We periodically record a provision for doubtful accounts based on our evaluation of the collectability of our accounts receivable. We first assess whether objective evidence of impairment exists individually in each customer for account receivable, then includes in a group basisidentify contracts with historical collective experiencecustomers, allocate transaction prices to performance obligations, and similar credit risk characteristics and collectively assess them for impairment. As of December 31, 2013, 2014 and 2015, the allowance we set aside for doubtful accounts was NT$68.1 million, NT$84.1 million and NT$82.9 million (US$2.5 million), respectively. Additional allowances may be requiredwhen performance obligations are satisfied, recognize revenues at fixed amounts as agreed in the future if the financial condition of our customers or general economic conditions further deteriorate, and this additional allowance would reduce our net income.contracts with taking estimated volume discounts into consideration.
Inventories. InventoriesFor contracts where the period between the date on which we transfer a promised good or service to a customer and the date on which the customer pays for that good or service is one year or less, we do not adjust the promised amount of consideration for the effects of a significant financing component. Our operating revenues include revenues from sale of goods and services as well as sale and leasing of real estate properties. Whencustomers control goods as they are recorded at cost when acquiredmanufactured in progress, we measure progress on the basis of input incurred relative to the total input and statedrecognize revenues and contract assets over time. Those contract assets are then reclassified into trade receivables at the lowerpoint at which they are invoiced to customers. The adoption of cost or net realizable values. Inventories are written downIFRS 15 did not result to net realizable value item by item, except for those that may be appropriate to group items of similar or related inventories. Materials received from customers for processing, mainly of semiconductor wafers, are excluded from inventories, as title and risk of loss remains with the customers. Net realizable value is the estimated selling prices of inventories less all estimated costs of completion and estimated costs necessary to make the sale. An allowance for loss on decline in market value and obsolescence is provided based on the difference between the cost of inventory and the estimated market value based upon assumptions about future demand and market conditions. Due to rapid technology advancements, we estimate the net realizable value of inventory for obsolete and unmarketable items at balance sheet date and then write down the cost of inventories to net realizable value. There may be significantany material changes in the net realizable value of inventories due to assumptions of future demand within a specific time period.
Realization of Deferred Tax Assets. Tax benefits arising from deductible temporary differences, unused tax creditsour daily accounting tasks, our internal controls and unused loss carry-forwards are recognized as deferred tax assets to the extent that it is probable that taxable profits will be available against which those deductible temporary differences can be utilized. We have considered future taxable income and ongoing prudent and feasible tax planning strategies in assessing the deferred tax assets. The carrying amounts of deferred tax assets are reviewed at each balance sheet date and reduced to the extent that it is no longer probable that sufficient taxable profits will be available to allow all or part of deferred tax assets to be utilized. A previously unrecognized deferred tax asset is also reviewed at each balance sheet date and recognized to the extent that it has become probable that future taxable profit will allow the deferred tax asset to be utilized. The realizability of deferred tax assets mainly depends on whether sufficient future profits or taxable temporary differences will be available. In cases where the actual future profits generated are less than expected, a material reversal of deferred tax assets may arise, which would be recognized in profit or loss for the period in which such a reversal takes place.our
6271
commercial terms with customers. We continue to deliver goods or render services and invoice to customers based on the same commercial terms as we did before the adoption of IFRS 15. We utilize an input method to determine the amount of revenue to recognize those wafers and chips that we control or take ownership of when we prepare monthly financial statements. The adoption of IFRS 15 did not create a material impact on our financial condition and results of operations because packaging services and testing services generally have short production cycle and the inventory levels of work in process and finished goods are not significant to our consolidated financial statements due to industry characteristics.
For the revenues from electronic manufacturing services and sale of substrates, we recognize revenues and trade receivables when the goods are shipped or the goods are delivered to the customers’ specific locations because it is the time when customers have full discretion over the manner of distribution and price to sell the goods, have the primary responsibility for sales to future customers, and bear the risks of obsolescence.
The revenues from sale of real estate properties are recognized when customers purchase real estate properties and complete the transfer procedures. The revenues from leasing real estate properties are recognized during leasing periods on a straight-line basis.
Impairment of Tangible and Intangible Assets Other than Goodwill. At each balance sheet date, we review the carrying amounts of the tangible and intangible assets, excluding goodwill, to determine whether there is any indication that those assets have suffered an impairment loss. If any such indication exists, the recoverable amount of the asset is estimated in order to determine the extent of the impairment loss. Recoverable amount is the higher of fair value less costs to sell and value in use. If the recoverable amount of an asset or cash-generating unit is estimated to be less than its carrying amount, the carrying amount of the asset or cash-generating unit is reduced to its recoverable amount. The process of evaluating the potential impairment of tangible and intangible assets other than goodwill requires significant judgment. We are required to make subjective judgments in determining the independent cash flows, useful lives, expected future revenue and expenses related to thea specific asset groups with the consideration ofgroup, taking its usage patterns and the nature of the semiconductor industry.industry into consideration. Any changes in theseour estimates based on changedcaused by changing economic conditions or business strategies could result in significant impairment charges in future periods.
In 2013, 20142016, 2017 and 2015,2018, we recognized impairment losses of NT$495.5888.2 million, NT$297.8289.6 million and NT$258.1133.1 million (US$7.94.3 million), respectively, on property, plant and equipment. See notes 13 and 22note 16 to our consolidated financial statements included in this annual report.
Business Combinations and Acquisition of Associate and Subsidiary.. When we acquire businesses, goodwill is measured as the excess of the sum of the consideration transferred, the amount of any non-controlling interests in the acquiree, and the fair value of the acquirer’s previously held equity interest in the acquiree (if any) over the net of the acquisition-date amounts of the identifiable assets acquired and the liabilities assumed. The allocation of the purchase price requires management to make significant estimates in determining the fair values of assets acquired and liabilities assumed, especially with respect to intangible assets. These estimates are based on historical experience, information obtained from the management of the acquired companies and independent external service providers’ reports. These estimates can include, but are not limited to, the cash flows that an asset is expected to generate in the future, the appropriate weighted-average cost of capital, and the synergistic benefits expected to be derived from the acquired business. These estimates are inherently uncertain and unpredictable. In addition, unanticipated events and circumstances may occur, which may affect the accuracy or validity of such estimates.
For example, we acquired Universal Scientific through tender offers in February and August 2010 and EEMS Test Singapore in August 2010; acquired tangible assets and liabilitiesthe associate accounted for using the equity method, goodwill is included within the carrying amount of the investment as wellof each investment date as identified intangible assets were valued at estimates of their current fair values. The valuation of acquired intangible assets was determined based on management’s estimates. In addition, the amortization method of these intangible assets is based on the pattern in which the economic benefits are consumed. In addition, we also recognized goodwill, which represents the excess of the purchase pricecost of investments over the estimatedshare acquired of the net fair value of the netassociate’s identifiable assets acquired. See our consolidated statementsacquired and the liabilities assumed at the respective investment dates. It involves critical accounting judgment and estimates when determining aforementioned fair values. We engaged independent external appraiser to assist us in identifying and evaluating the associate’s identifiable tangible assets, intangible assets and liabilities. The scope of such evaluation includes assumptions as current replacement cost of tangible assets, the categories of intangible assets and their expected economic benefits, growth rates for operating revenue and discount rates used in cash flow as well as notes 13analysis. The amounts of differences between fair value of identified tangible and intangible assets and the carrying amount at each respective investment dates are depreciated or amortized over their remaining useful lives or expected future economic benefit lives and recognized immediately in profit or loss.
72
For example, we acquired shareholdings of a subsidiary and its associates in 2016 and identified the differences between the cost of the investment and our share of the net fair value of a subsidiary and its associates’ identifiable assets and liabilities in 2017. We retrospectively adjusted the comparative financial statement for the year ended December 31, 2016.
For the acquisition of subsidiary, we identify the difference between investment cost and our share of net fair value of the subsidiary’s identifiable assets and liabilities after the acquisition of a subsidiary. It involves critical judgments and estimations when determining aforementioned net fair values. The management engaged independent external appraiser to 15assist them in identifying and 26evaluating the subsidiary’s identifiable tangible assets, intangible assets and liabilities. The scope of such evaluation include the type of intangible assets that may be identified and the related estimated cash flow or relief cost expenses.
The excess of the fair value over the carrying amount of identified tangible assets and intangible assets on the acquisition date will be depreciated or amortized over their remaining useful lives or expected future economic benefit lives. The management believes the related estimation and assumption appropriately reflect the net fair value of identifiable assets acquired and liabilities assumed. The total PPA effect, however, may still fluctuate due to shifts in general economic conditions of the semiconductor manufacturing industry.
As a result of the SPIL Acquisition, we identified the difference between investment cost and our consolidated financial statements includedshare of net fair value of SPIL’s identifiable assets and liabilities, which resulted in this annual report.an increase of NT$3,212.7 million (US$105.0 million) to depreciation, amortization and rental expenses in operating costs and NT$675.2 million (US$22.1 million) to amortization in operating expenses in 2018.
Goodwill. Goodwill is allocated to each cash-generating unit and tested for impairment annually, and we test for impairment more frequently if an event occurs or circumstances change that would indicate that the cash-generating unit may be impaired. GoodwillDetermining whether goodwill is tested for impairment by comparingimpaired requires an estimation of the carrying amountrecoverable amounts of the cash-generating unitunits to which the goodwill has been allocated to its recoverable amount.allocated. Recoverable amount is defined as the higher of a cash-generating unit’s fair value less costs to sell or itsamounts are assessed by value in use which is defined asrequires management to estimate the present value of the expected future cash flows generated byexpected to arise from cash-generating units and suitable discount rates in order to calculate its present value. When the cash-generating unit.actual future cash flows are less than expected, a material impairment loss may arise. In conducting the future cash flow valuation, we make assumptions about future operating cash flows, the discount rate used to determine present value of future cash flows, and capital expenditures. Future operating cash flows assumptions include sales growth assumptions, which are based on our historical trends and industry trends, and gross margin and operating expense growth assumptions, which are based on the historical relationship of those measures compared to sales and certain cost cutting initiatives. An impairment charge is incurred to the extent the carrying amount exceeds the recoverable amount. As of December 31, 2015, we had goodwill of NT$10,506.5 million (US$320.4 million). We did not recognize any impairment loss in 2013, 20142016 and 2015.2018. In 2017, we recognized an impairment loss of NT$425.1 million due to the lower-than-expected actual revenue growth of cash flows from segments other than packaging segment, testing segment and EMS segment, which led to the recoverable amount lower than the carrying amount. As of December 31, 2016, 2017 and 2018, we had goodwill of NT$10,490.3 million, NT$9,934.5 million and NT$49,974.4 million (US$1,632.6 million), respectively. The increase in goodwill from December 31, 2017 to 2018 is primarily as result of the SPIL Acquisition. Our conclusion could, however, change in the future if actual results differ from our estimates and judgments under different assumptions and conditions. See note 18 to our consolidated financial statements included in this annual report.
Valuation of Investments. We hold investments in the shareholdings of public and non-public entities. We evaluate these investments periodically for impairment based on market prices, if available, the financial condition of the investees and economic conditions in the industry.industry and estimate of future cash inflows from disposal (net of transaction cost). These assessments usually require a significant amount of judgment, as a significant decline in the market price may be a short-term drop and may not be the best indicator of impairment. Whenever triggering events or changes in circumstances indicate that an investment may be impaired and carrying amount may not be recoverable, we measure the impairment based on the market prices, if available, or using market approach based on the financial result of the investments.investments and estimate of future cash inflows from disposal (net of transaction cost). Several of the investments held by us are recognized as the equity method investments debt investments with no active market or available-for-sale financial assets. Any significant decline in the estimated future cash flows of the investments or financial assets could affect the value of the investment and indicate that an impairment charge may occur. In 20132016, 2017 and 2014,2018, we recognized impairment losses of NT$196.391.9 million, NT$50.2 million and NT$10.4521.0 million (US$17.0 million), respectively, on our investments. We did not recognize any impairment loss in 2015. See note 2226 to our consolidated financial statements included in this annual report.
6373
Stock-based Compensation. Equity-settled share-based payments to employees are measured at the fair value of the equity instruments at the grant date. The fair value determined at the grant date of the equity-settled share-based payments is expensed on a straight-line basis over the vesting period, based on our best estimate of equity instruments that will eventually vest, with a corresponding increase in capital surplus-employee share options. The fair value is measured using the Hull & White Model (2004) incorporated with Ritchken’s Trinomial Tree Model (1995) or the Black-Scholes Option Pricing Model, depending on the terms and conditions of the plans. The inputs to the models are share price at the grant date, exercise price, expected volatility, life of the share option and dividend yield, and risk free interest rates.
Defined Benefit Plans.Accrued pension liabilities and the resulting pension expenses under defined benefit pension plans are calculated using the projected unit credit method. Actuarial assumptions comprise discount rates and expected rates of salary increase. Due to changing market and economic conditions, the underlying key assumptions may differ from actual developments and may lead to significant changes in our defined benefit plans. We immediately recognize all actuarial gains and losses arising from defined benefit plans in retained earnings.
Fair value of Derivatives and Other Financial Instruments. We use our judgments applying appropriate valuation techniques commonly applied by market practitioners. The assumptions applied are based on observable quoted market prices, foreign exchange rates and interest rates to the extent it is available. The fair value of unquoted equity instruments is estimated based on the assumptions supported by unobservable market prices and interest rates which are disclosed in note 31 to our consolidated financial statements included in this annual report. We believe that the valuation techniques and the assumptions applied are appropriate in determining the fair value of financial instruments.
Results of Operations
ASEH was formed pursuant to the consummation of the Share Exchange on April 30, 2018. The finanacial information for 2018 consists the results of: (a) ASE Technology Holding Co., Ltd. and SPIL for the period from April 30, 2018 through December 31, 2018; and (b) ASE, the predecessor entity of ASEH for the twelve months ended December 31, 2018. The data and results of previous years correspond exclusively to ASE, the predecessor entity of ASEH unless otherwise expressly stated.
The following table sets forth, for the periods indicated, financial data from our consolidated statements of comprehensive income, expressed as a percentage of operating revenues.
| Year Ended December 31, | ||||||||||||||||||||||||
| 2013 | 2014 | 2015 | Year Ended December 31, | |||||||||||||||||||||
| 2016 | 2017 | 2018 | ||||||||||||||||||||||
| Operating revenues | 100.0 | % | 100.0 | % | 100.0 | % | 100.0 | % | 100.0 | % | 100.0 | % | ||||||||||||
| Packaging | 51.2 | 47.3 | 41.2 | 45.6 | 43.5 | 48.1 | ||||||||||||||||||
| Testing | 11.3 | 10.1 | 8.9 | 9.8 | 9.0 | 9.7 | ||||||||||||||||||
| Electronic manufacturing services | 35.7 | 41.2 | 48.8 | 42.0 | 46.1 | 40.9 | ||||||||||||||||||
| Others | 1.8 | 1.4 | 1.1 | 2.6 | 1.4 | 1.3 | ||||||||||||||||||
| Operating costs | (80.5 | ) | (79.1 | ) | (82.3 | ) | (80.7 | ) | (81.8 | ) | (83.5 | ) | ||||||||||||
| Gross profit | 19.5 | 20.9 | 17.7 | 19.3 | 18.2 | 16.5 | ||||||||||||||||||
| Operating expenses | (9.5 | ) | (9.3 | ) | (8.9 | ) | (9.6 | ) | (9.5 | ) | (9.3 | ) | ||||||||||||
| Other operating income and expenses, net | (0.6 | ) | 0.0 | (0.1 | ) | (0.3 | ) | 0.0 | 0.1 | |||||||||||||||
| Profit from operations | 9.4 | 11.6 | 8.7 | 9.4 | 8.7 | 7.3 | ||||||||||||||||||
| Non-operating expense, net | (0.6 | ) | (0.5 | ) | 0.2 | 0.8 | 2.0 | 1.3 | ||||||||||||||||
| Profit before income tax | 8.8 | 11.1 | 8.9 | 10.2 | 10.7 | 8.6 | ||||||||||||||||||
| Income tax expense | (1.6 | ) | (2.2 | ) | (1.5 | ) | (2.0 | ) | (2.3 | ) | (1.2 | ) | ||||||||||||
| Profit for the year | 7.2 | % | 8.9 | % | 7.4 | % | 8.2 | % | 8.4 | % | 7.4 | % | ||||||||||||
| Attributable to | ||||||||||||||||||||||||
| Owners of the Company | 7.0 | % | 8.7 | % | 7.1 | % | 7.8 | % | 7.8 | % | 7.1 | % | ||||||||||||
| Non-controlling interests | 0.2 | 0.2 | 0.3 | 0.4 | 0.6 | 0.3 | ||||||||||||||||||
| 7.2 | % | 8.9 | % | 7.4 | % | 8.2 | % | 8.4 | % | 7.4 | % | |||||||||||||
| Other comprehensive income, net of income tax | 1.5 | 2.2 | 0.0 | (2.9 | ) | (1.6 | ) | (0.2 | ) | |||||||||||||||
| Total comprehensive income for the year | 8.7 | % | 11.1 | % | 7.4 | % | 5.3 | % | 6.8 | % | 7.2 | % | ||||||||||||
| Attributable to | ||||||||||||||||||||||||
| Owners of the Company | 8.4 | % | 10.7 | % | 7.1 | % | 5.1 | % | 6.4 | % | 6.9 | % | ||||||||||||
| Non-controlling interests | 0.3 | 0.4 | 0.3 | 0.2 | 0.4 | 0.3 | ||||||||||||||||||
| 8.7 | % | 11.1 | % | 7.4 | % | 5.3 | % | 6.8 | % | 7.2 | % | |||||||||||||
64
The following table sets forth, for the periods indicated, the gross margins for our packaging, testing services and electronic manufacturing services and our total gross margin. Gross margin is calculated by dividing gross profits by operating revenues.
| Year Ended December 31, | Year Ended December 31, | |||||||||||||||||||||||
| 2013 | 2014 | 2015 | 2016 | 2017 | 2018 | |||||||||||||||||||
| (percentage of operating revenues) | (percentage of operating revenues) | |||||||||||||||||||||||
| Gross profit | ||||||||||||||||||||||||
| Packaging | 21.0 | % | 27.2 | % | 26.0 | % | 22.8 | % | 22.8 | % | 18.9 | % | ||||||||||||
| Testing | 36.7 | 37.2 | 35.8 | 36.9 | 35.6 | 34.2 | ||||||||||||||||||
| Electronic manufacturing services | 10.3 | 8.6 | 6.8 | 9.7 | 10.1 | 9.4 | ||||||||||||||||||
| Overall | 19.5 | % | 20.9 | % | 17.7 | % | 19.3 | % | 18.2 | % | 16.5 | % | ||||||||||||
74
The following table sets forth, for the periods indicated, a breakdown of our total operating costs and operating expenses, expressed as a percentage of operating revenues.
| Year Ended December 31, | Year Ended December 31, | |||||||||||||||||||||||
| 2013 | 2014 | 2015 | 2016 | 2017 | 2018 | |||||||||||||||||||
| (percentage of operating revenues) | (percentage of operating revenues) | |||||||||||||||||||||||
| Operating costs | ||||||||||||||||||||||||
| Raw materials | 45.6 | % | 45.6 | % | 50.0 | % | 45.5 | % | 49.2 | % | 49.1 | % | ||||||||||||
| Labor | 12.8 | 13.0 | 12.3 | 13.0 | 12.4 | 12.6 | ||||||||||||||||||
| Depreciation, amortization and rental expense | 11.1 | 9.9 | 10.0 | 10.3 | 9.5 | 10.9 | ||||||||||||||||||
| Others | 11.0 | 10.6 | 10.0 | 11.9 | 10.7 | 10.9 | ||||||||||||||||||
| Total operating costs | 80.5 | % | 79.1 | % | 82.3 | % | 80.7 | % | 81.8 | % | 83.5 | % | ||||||||||||
| Operating expenses | ||||||||||||||||||||||||
| Selling | 1.4 | % | 1.3 | % | 1.3 | % | 1.3 | % | 1.1 | % | 1.4 | % | ||||||||||||
| General and administrative | 4.0 | 4.0 | 3.8 | 4.2 | 4.3 | 3.9 | ||||||||||||||||||
| Research and development | 4.1 | 4.0 | 3.8 | 4.1 | 4.1 | 4.0 | ||||||||||||||||||
| Total operating expenses | 9.5 | % | 9.3 | % | 8.9 | % | 9.6 | % | 9.5 | % | 9.3 | % | ||||||||||||
Year ended December 31, 20152018 Compared to Year Ended December 31, 20142017
Operating Revenues. Operating revenues increased 10.4%27.8% to NT$283,302.5371,092.4 million (US$8,639.912,123.2 million) in 20152018 from NT$256,591.4290,441.2 million in 2014,2017, primarily due to the SPIL Acquisition and an increase in revenue from our electronic manufacturing services business. Packaging revenues increased 41.3% to NT$178,308.2 million (US$5,825.2 million) in 2018 from NT$126,225.1 million in 2017, primarily due to an increase in demand of Bumping, Flip Chip, WLP & SiP products. Testing revenues from our electronic manufacturing services business.Packaging revenues decreased 3.9%increased 37.3% to NT$116,607.335,903.2 million (US$3,556.21,172.9 million) in 20152018 from NT$121,336.526,157.3 million in 2014. Testing revenues decreased 2.6%2017, primarily due to NT$25,191.9 million (US$768.3 million)an increase in 2015 from NT$25,874.7 million in 2014.sales volume for our testing business. Revenues from our electronic manufacturing services business increased 30.7%13.4% to NT$138,242.1151,890.4 million (US$4,216.04,962.1 million) in 20152018 from NT$105,784.4133,948.0 million in 2014. The decrease in packaging and testing revenues was primarily due to slightly soft demand in the end-application market. The increase in the revenues from our electronic manufacturing services business was2017, primarily due to an increase in the outsourced orders for communications and consumer products.
65
Gross Profit. Gross profit decreased 6.4%increased by 16.0% to NT$50,135.261,163.0 million (US$1,529.01,988.1 million) in 20152018 from NT$53,588.552,732.3 million in 2014.2017. Our gross profit as a percentage of operating revenues, or gross margin, was 17.7%16.5% in 20152018 compared to 20.9%18.2% in 2014.2017. The decrease was primarily due to the growthPPA effects and an increase in our electronic manufacturing services business, withwhich had a lower gross margin. Raw material costs in 20152018 were NT$141,778.8182,062.0 million (US$4,323.85,947.8 million) compared to NT$116,998.6142,934.4 million in 2014.2017. As a percentage of operating revenues, raw material costs decreased to 49.1% in 2018 from 49.2% in 2017. Labor cost in 2018 was NT$46,656.6 million (US$1,524.2 million) compared to NT$35,978.4 million in 2017. As a percentage of operating revenues, labor cost increased to 50.0%12.6% in 20152018 from 45.6%12.4% in 2014 primarily due to an increase in orders in our electronic manufacturing services business, which required relatively higher raw material costs compared to our other businesses.2017. Depreciation, amortization and rental expenses were NT$28,191.840,471.8 million (US$859.81,322.2 million) in 20152018 compared to NT$25,386.7NT27,703.1 million in 2014.2017, primarily due to the SPIL Acquisition and PPA effects. As a percentage of operating revenues, depreciation, amortization and rental expenses increased to 10.0%10.9% in 20152018 from 9.9%9.5% in 2014 due to a decrease in our packaging and testing revenues. Labor cost in 2015 was NT$34,720.4 million (US$1,058.9 million) compared to NT$33,243.2 million in 2014.As a percentage of operating revenues, labor cost decreased to 12.3% in 2015 from 13.0% in 2014 primarily due to the growth of our operating revenues.2017. Our gross margin for our packaging business decreased to 26.0%18.9% in 20152018 from 27.2%22.8% in 20142017 and our gross margin for testing business decreased to 34.2% in 2018 from 35.6% in 2017 primarily due to an increasePPA effects. PPA effects that were included in labor costs and depreciation expenses as a percentage of packaging revenue, partially offset by a decrease in raw material costs as a percentage of packaging revenues.our gross profit were NT$3,212.7 million (US$105.0 million). Our gross margin for our testing business decreased to 35.8% in 2015 from 37.2% in 2014 primarily due to an increase in depreciation expenses as a percentage of testing revenues. Our gross margin for our electronic manufacturing services business decreased to 6.8%9.4% in 20152018 from 8.6%10.1% in 20142017 primarily due to an increase in the sale of products with lower gross margins.
Profit from Operations. Profit from operations increased 6.7% to NT$27,019.3 million (US$882.7 million) in 2018 compared to NT$25,327.2 million in 2017. Our profit from operations as a percentage of operating revenues, or operating margin, decreased to 7.3% in 2018 from 8.7% in 2017 primarily due to a decrease in gross margin. Operating expenses increased 25.4% to NT$34,515.3 million (US$1,127.5 million) in 2018 compared to NT$27,513.7 million in 2017. The increase in operating expenses was primarily due to the SPIL Acquisition and PPA effects. The PPA effects included general and administrative expense and selling expense of NT$8.5 million (US$0.3 million) and NT$666.7 million (US$21.8 million), respectively in 2018. General and administrative expense increased 17.3% to NT$14,618.9 million (US$477.6 million) in 2018 from NT$12,458.1 million in 2017. General and administrative expense as a percentage of our operating revenues was 3.9% in 2018, compared to 4.3% in 2017. Research and development expense increased 27.4% to NT$14,962.8 million (US$488.8 million) in 2018, compared to NT$11,746.6 million in 2017, accounting for 4.0% of operating revenues both in 2018 and 2017. Selling expense increased 49.1% to NT$4,933.6 million (US$161.2 million) in 2018 from NT$3,309.0 million in 2017. Selling expense as a percentage of operating revenues was 1.4% in 2018, compared to 1.1% in 2017. We had a net other operating income of NT$371.6 million (US$12.1 million) in 2018 compared to a net other operating income of NT$108.6 million in 2017. The increase in net other operating income was primarily because impairment loss on property, plant and equipment decreased by NT$581.6 million (US$19.0 million) in 2018, but was partially offset by a loss of NT$14.6 million (US$0.5 million) in 2018 and a gain of NT$367.1 million in 2017 from the disposal of property, plant and equipment and other assets.
75
Non-Operating Income and Expenses. We had a net non-operating income of NT$4,918.4 million (US$160.7 million) in 2018 compared to a net non-operating income of NT$5,693.5 million in 2017. This decrease was primarily due to (i) a decrease in the income earned from equity method investments, from a profit of NT$528.8 million in 2017 to a loss of NT$480.2 million (US$15.7 million) in 2018; (ii) an increase in finance costs from NT$1,799.5 million in 2017 to NT$3,568.2 million (US$116.6 million) in 2018 primarily to address funding needs for the SPIL Acquisition, partially offset by an increase in non-operating income caused by a gain of NT$7,421.4 million (US$242.5 million) from the gain on remeasurement of investments in SPIL using the equity method of accounting in 2018 and a gain of NT$5,589.5 million from the disposal of subsidiaries in 2017.
Net Profit. Net profit, excluding non-controlling interests, increased by 14.9% to NT$26,220.7 million (US$856.6 million) in 2018 compared to NT$22,819.1 million in 2017. Our diluted earnings per ADS increased to NT$12.14 (US$0.4) in 2018 compared to diluted earnings per ADS of NT$10.38 (retrospectively adjusted to reflect the impact from the Joint Share Exchange Agreement) in 2017. Our income tax expense decreased by 30.8% to NT$4,513.4 million (US$147.5 million) in 2018 compared to NT$6,523.6 million in 2017. This decrease is primarily due to the reduction on the rate of surtax imposed on unappropriated earnings and an increase in tax-exempt income primarily caused by the gain on remeasurement of investment in SPIL using the equity method of accounting.
Year ended December 31, 2017 Compared to Year Ended December 31, 2016
Operating Revenues. Operating revenues increased 5.7% to NT$290,441.2 million in 2017 from NT$274,884.1 million in 2016, primarily due to an increase in revenue from our electronic manufacturing services business. Packaging revenues increased 0.8% to NT$126,225.1 million in 2017 from NT$125,282.8 million in 2016, primarily due to an increase in demand of Bumping, Flip Chip, WLP & SiP products. Testing revenues decreased 3.2% to NT$26,157.3 million in 2017 from NT$27,031.8 million in 2016, primarily due to the soft demand in end-application market. Revenues from our electronic manufacturing services business increased 16.1% to NT$133,948.0 million in 2017 from NT$115,395.1 million in 2016, primarily due to an increase in outsourced orders for consumer products and communications products.
Gross Profit. Gross profit decreased 0.9% to NT$52,732.3 million in 2017 from NT$53,187.2 million in 2016. Our gross profit as a percentage of operating revenues, or gross margin, was 18.2% in 2017 compared to 19.3% in 2016. The decrease was primarily due to an increase in our electronic manufacturing services business, which had a lower gross margin. Raw material costs in 2017 were NT$142,934.4 million compared to NT$125,133.8 million in 2016. As a percentage of operating revenues, raw material costs increased to 49.2% in 2017 from 45.5% in 2016 primarily due to an increase in orders in our electronic manufacturing services business, which had relatively higher raw material costs compared to our other businesses. Labor cost in 2017 was NT$35,978.4 million compared to NT$35,588.5 million in 2016. As a percentage of operating revenues, labor cost decreased to 12.4% in 2017 from 13.0% in 2016 primarily due to the growth of our operating revenues. Depreciation, amortization and rental expenses were NT$27,703.1 million in 2017 compared to NT$28,124.6 million in 2016. As a percentage of operating revenues, depreciation, amortization and rental expenses decreased to 9.5% in 2017 from 10.3% in 2016. Our gross margin for our packaging business was 22.8% in both 2017 and 2016. Our gross margin for our testing business decreased to 35.6% in 2017 from 36.9% in 2016 primarily due to the decline of our testing revenues. Our gross margin for our electronic manufacturing services business increased to 10.1% in 2017 from 9.7% in 2016 primarily due to a decrease in the sale of products with lower gross margins.
76
Profit from Operations. Profit from operations decreased 17.5%2.1% to NT$24,633.125,327.2 million (US$751.3 million) in 20152017 compared to NT$29,874.525,860.1 million in 2014.2016. Our profit from operations as a percentage of operating revenues, or operating margin, decreased to 8.7% in 20152017 from 11.6%9.4% in 20142016 primarily due to a decrease in gross margin. Operating expenses increased 5.5%3.7% to NT$25,250.627,513.7 million (US$770.1 million) in 20152017 compared to NT$23,942.726,526.8 million in 2014.2016. The increase in operating expenses was primarily due to an increase in general and administrative expense as well as research and development expense. General and administrative expense increased 5.0%6.8% to NT$10,724.6 million (US$327.1 million) in 2015 from NT$10,214.812,458.1 million in 2014,2017 from NT$11,662.1 million in 2016, primarily due to thean increase in salary expenses in connection with higher employee and directors bonus accrued, which were caused by our higher net profit and an increase in professional service fees incurred from our strategic investments in 2015, including that incurred for the Initial SPIL Tender Offer and Second SPIL Tender Offer.fee. General and administrative expense as a percentage of our operating revenues was 3.8%4.3% in 2015,2017, compared to 4.0%4.2% in 2014.2016. Research and development expense increased 6.3%3.1% to NT$10,937.5 million (US$333.6 million), accounting for 3.8% of operating revenues in 2015, compared to NT$10,289.711,746.6 million, accounting for 4.0% of operating revenues in 2014.2017, compared to NT$11,391.1 million, accounting for 4.1% of operating revenues in 2016. This increase in the research and development expense was primarily due to an increase in salary expenses from increased headcounts.expenses. Selling expense increased 4.4%decreased 4.7% to NT$3,588.53,309.0 million (US$109.4 million) in 20152017 from NT$3,438.2million3,473.6 million in 2014.2016. This increasedecrease was primarily due to an increasea decrease in salary expenses and bonusamortization expenses primarily due to salary raises.in connection with intangible assets fully amortized. Selling expense as a percentage of operating revenues was 1.1% in 2017, compared to 1.3% in both 2015 and 2014.2016. We had a net other operating expenseincome of NT$251.5108.6 million (US$7.6 million) in 20152017 compared to a net other operating incomeexpense of NT$228.7800.3 million in 2014.2016. The increase in net other operating expenseincome was primarily due to (i)a gain of NT$367.1 million from the reversaldisposal of the settlement with Tessera in relation to patent infringement claims in the amount of US$3.0 million in the fourth quarter of 2014 due to the reduction of the final settlement amount from US$30.0 million to US$27.0 millionproperty, plant and (ii) the receipt of direct reimbursement from Citibank, N.A., the depositary bank for our ADR programs, in the amount of US$4.1 million (net of U.S. withholding tax) in 2014.equipment and other assets.
Non-Operating Expense, NetIncome and Expenses.We had a net non-operating income of NT$660.15,693.5 million (US$20.1 million) in 20152017 compared to a net non-operating expenseincome of NT$1,339.42,108.6 million in 2014.2016. This increase was primarily due to (i) an increasea gain of NT$5,589.5 million from the disposal of subsidiaries, partially offset by a decrease in non-operating income due to the change in the net gain/loss on valuation of financial assets and liabilities and net foreign exchange gain/lossgain which resulted in an increasea decrease in net gain from NT$616.92,375.9 million in 20142016 to NT$1,759.6 million (US$53.7 million) in 2015, (ii) an increase in non-operating income due to the increase in the income earned from equity method investments from the loss of NT$121.9718.7 million in 2014 to the profit of NT$407.6 million (US$12.4 million) in 2015 and (iii) an increase in non-operating income due to an increase in dividends income from NT$101.3 million in 2014 to NT$397.0 million (US$12.1 million) in 2015.2017.
Net Profit.Net profit, excluding non-controlling interests, decreased 10.0%increased 7.0% to NT$20,013.522,819.1 million (US$610.4 million) in 20152017 compared to NT$22,228.621,324.4 million in 2014.2016. Our diluted earnings per ADS decreasedincreased to NT$12.55 (US$0.38)10.38 (retrospectively adjusted to reflect the impact from the Joint Share Exchange Agreement) in 20152017 compared to diluted earnings per ADS of NT$13.939.31 (retrospectively adjusted to reflect the impact from the Joint Share Exchange Agreement) in 2014.2016. Our income tax expense decreased 23.9%increased 21.0% to NT$4,311.16,523.6 million (US$131.5 million) in 20152017 compared to NT$5,666.05,390.8 million in 2014, primarily due to a decrease in the income tax on undistributed earnings.
66
Year ended December 31, 2014 Compared to Year Ended December 31, 2013
Operating Revenues. Operating revenues increased 16.7% to NT$256,591.4 million in 2014 from NT$219,862.4 million in 2013,2016, primarily due to an increase in revenues from our electronic manufacturing services business. Packaging revenues increased 7.8% to NT$121,336.5 million in 2014 from NT$112,603.9 million in 2013. Testing revenues increased 4.6% to NT$25,874.7 million in 2014 from NT$24,732.2 million in 2013. Revenues from our electronic manufacturing services business increased 34.7% to NT$105,784.4 million in 2014 from NT$78,530.6 million in 2013. The increase in packaging revenues was primarily due to an increase in the demand for our services and an increase in the revenues generated from our copper wire bonding solutions. The increase in testing revenues was primarily due to an increase in sales volume for our testing business. The increase in the revenues from our electronic manufacturing services business was primarily due to an increase in the outsourced orders for communications products.
Gross Profit. Gross profit increased 25.1% to NT$53,588.5 million in 2014 from NT$42,822.0 million in 2013. Our gross profit as a percentage of operating revenues, or gross margin, was 20.9% in 2014 compared to 19.5% in 2013. The increase was primarily due to a decrease in depreciation expenses as a percentage of our operating revenues. Raw material costs in 2014 were NT$116,998.6 million compared to NT$100,314.5 million in 2013 primarily due to an increase in revenue contribution by our electronic manufacturing services business with higher raw material costs, partially offset by a decrease in the price of gold. As a percentage of operating revenues, raw material costs were 45.6% in both 2014 and 2013. Depreciation, amortization and rental expenses were NT$25,386.7 million in 2014 compared to NT$24,447.0 million in 2013. As a percentage of operating revenues, depreciation, amortization and rental expenses decreased to 9.9% in 2014 from 11.1% in 2013 due to increase in revenue. Labor cost in 2014 was NT$33,243.2 million compared to NT$28,053.5 million in 2013.As a percentage of operating revenues, labor cost increased to 13.0% in 2014 from 12.8% in 2013 primarily due to an increase in salary and bonus payments as a result of increase in headcount. Our gross margin for our packaging business increased to 27.2% in 2014 from 21.0% in 2013 due to a decrease in raw material costs as a percentage of packaging revenues. Our gross margin for our testing business increased to 37.2% in 2014 from 36.7% in 2013 primarily due to a decrease in depreciation as a percentage of testing revenues but partially offset by an increase in labor costs as a percentage of testing revenues. Our gross margin for our electronic manufacturing services business decreased to 8.6% in 2014 from 10.3% in 2013 primarily due to a change in product mix.
Profit from operations. Profit from operations increased 44.2% to NT$29,874.5 million in 2014 compared to NT$20,713.4 million in 2013. Our profit from operations as a percentage of operating revenues, or operating margin, increased to 11.6% in 2014 from 9.4% in 2013 primarily due to an increase in gross margin. Operating expenses increased 15.3% to NT$23,942.7 million in 2014 compared to NT$20,760.4 million in 2013. The increase in operating expenses was primarily due to an increase in general and administrative expense, as well as research and development expense. General and administrative expense increased 17.2% to NT$10,214.8 million in 2014 from NT$8,712.9 million in 2013, primarily due to an increase in salary and bonus payments due to an increase in headcount. General and administrative expense as a percentage of our operating revenues was 4.0% in both 2014 and 2013. Research and development expense increased 13.5% to NT$10,289.7 million, accounting for 4.0% of operating revenues in 2014, compared to NT$9,064.7 million, accounting for 4.1% of operating revenues in 2013. This increase in the research and development expense was primarily due to an increase in salary and bonus payments due to increase in headcount. Selling expense increased 15.3% to NT$3,438.2 million in 2014 from NT$2,982.8 million in 2013. This increase was primarily due to an increase in salary and bonus payments due to increase in headcount and an increase in sampling costs.Selling expense as a percentage of operating revenues was 1.3% in 2014, compared to 1.4% in 2013. We had a net other operating income of NT$228.6 million in 2014 compared to a net other operating expense of NT$1,348.2 million in 2013. The increase in net other operating income was primarily due to the settlement with Tessera in relation to patent infringement claims in 2013. We recognized the settlement in the amount of US$30.0 million in the fourth quarter of 2013, and reversed US$3.0 million in the fourth quarter of 2014 due to the reduction of the final settlement amount from US$30.0 million to US$27.0 million.
67
Non-Operating Expense, Net.We had a net non-operating expense of NT$1,339.4 million in 2014 compared to a net non-operating expense of NT$1,343.6 million in 2013. This decrease was primarily due to (i) a decrease in non-operating expenses as a result of decrease in impairment loss on financial assets from NT$196.3 million in 2013 to NT$10.4 million in 2014 and (ii) an increase in non-operating income due to the change in the net gain/loss on valuation of financial assets and liabilities and net foreign exchange gain/loss which resulted in an increase in net gain from NT$519.2 million in 2013 to NT$616.9 million in 2014, but partially offset by (i) an increase in non-operating expenses due to an increase in finance costs (consisting mainly of interest expenses) from NT$2,307.5 million in 2013 to NT$2,354.1 million in 2014, (ii) a decrease in non-operating income due to the decrease in the income earned from equity investments from the profit of NT$22.0 million in 2013 compared to the loss of NT$121.9 million in 2014, and (iii) a decrease in non-operating income due to the decrease in the net gain on disposal of financial assets from NT$96.2 million in 2013 to NT$0.8 million in 2014.
Net Profit.Net profit, excluding non-controlling interests, increased 44.3% to NT$22,228.6 million in 2014 compared to NT$15,404.5 million in 2013. Our diluted earnings per ADS increased to NT$13.93 in 2014 compared to diluted earnings per ADS of NT$9.96 in 2013. Our income tax expense increased 61.9% to NT$5,666.0 million in 2014 compared to NT$3,499.6 million in 2013, primarily due to an increase in the profit before income tax and an increase in income tax on undistributed earnings, partially offset by an increase in the tax credit.unappropriated earnings.
Quarterly Operating Revenues, Gross Profit and Gross Margin
ASEH was formed pursuant to the consummation of the Share Exchange on April 30, 2018. ASE is the predecessor entity of ASEH. The financial results for each quarter of 2017 and first quarter of 2018 reflect the operations of ASE prior to the establishment of ASEH. The financial results for second quarter of 2018 reflect the operations of ASE starting from April 1, 2018 and the operations of ASEH starting from April 30, 2018. The financial results for third quarter and fourth quarter of 2018 reflect combined operations of the business combination. As a result, the quarterly financial results of ASEH may not be comparable to each other.
The following table sets forth our unaudited consolidated operating revenues, gross profit and gross margin for the quarterly periods indicated. The unaudited quarterly results reflect all adjustments, consisting of normal recurring adjustments that, in the opinion of management, are necessary for a fair presentation of the amounts, on a basis consistent with the audited consolidated financial statements included elsewhere in this annual report. You should read the following table in conjunction with the audited consolidated financial statements and related notes included elsewhere in this annual report. Our operating revenues, gross profit and gross margin for any quarter are not necessarily indicative of the results for any future period. Our quarterly operating revenues, gross profit and gross margin may fluctuate significantly.
Quarter Ended | ||||||||||||||||||||||||||||||||
Mar. 31, | Jun. 30, | Sept. 30, | Dec. 31, | Mar. 31, | Jun. 30, | Sept. 30, | Dec. 31, | |||||||||||||||||||||||||
| NT$ | NT$ | NT$ | NT$ | NT$ | NT$ | NT$ | NT$ | |||||||||||||||||||||||||
| (in millions) | ||||||||||||||||||||||||||||||||
| Consolidated Operating Revenues | ||||||||||||||||||||||||||||||||
| Packaging | 26,721.8 | 30,641.2 | 32,031.1 | 31,942.4 | 29,320.9 | 28,617.8 | 29,575.1 | 29,093.5 | ||||||||||||||||||||||||
| Testing | 5,784.6 | 6,599.8 | 6,827.5 | 6,662.8 | 6,179.5 | 6,230.8 | 6,425.7 | 6,355.9 | ||||||||||||||||||||||||
| Electronic manufacturing services | 21,365.4 | 20,500.6 | 26,740.5 | 37,177.9 | 28,300.1 | 34,534.0 | 36,107.2 | 39,300.8 | ||||||||||||||||||||||||
| Others | 827.8 | 873.6 | 1,032.8 | 861.6 | 861.6 | 839.2 | 762.4 | 798.0 | ||||||||||||||||||||||||
| Total | 54,699.6 | 58,615.2 | 66,631.9 | 76,644.7 | 64,662.1 | 70,221.8 | 72,870.4 | 75,548.2 | ||||||||||||||||||||||||
| Consolidated Gross Profit | ||||||||||||||||||||||||||||||||
| Packaging | 6,101.4 | 7,694.3 | 8,728.9 | 10,515.6 | 7,543.2 | 7,226.2 | 7,809.7 | 7,769.4 | ||||||||||||||||||||||||
| Testing | 1,867.3 | 2,458.2 | 2,716.8 | 2,589.7 | 2,121.7 | 2,190.7 | 2,321.6 | 2,391.7 | ||||||||||||||||||||||||
| Electronic manufacturing services | 2,006.6 | 2,007.1 | 2,239.4 | 2,865.8 | 2,238.3 | 1,779.7 | 2,567.5 | 2,847.9 | ||||||||||||||||||||||||
| Others | 383.9 | 450.8 | 522.9 | 439.8 | 410.2 | 368.7 | 288.8 | 259.9 | ||||||||||||||||||||||||
| Total | 10,359.2 | 12,610.4 | 14,208.0 | 16,410.9 | 12,313.4 | 11,565.3 | 12,987.6 | 13,268.9 | ||||||||||||||||||||||||
| Consolidated Gross Profit (%) | ||||||||||||||||||||||||||||||||
| Packaging | 22.8 | % | 25.1 | % | 27.3 | % | 32.9 | % | 25.7 | % | 25.3 | % | 26.4 | % | 26.7 | % | ||||||||||||||||
| Testing | 32.3 | 37.2 | 39.8 | 38.9 | 34.3 | 35.2 | 36.1 | 37.6 | ||||||||||||||||||||||||
| Electronic manufacturing services | 9.4 | 9.8 | 8.4 | 7.7 | 7.9 | 5.2 | 7.1 | 7.2 | ||||||||||||||||||||||||
| Overall | 18.9 | % | 21.5 | % | 21.3 | % | 21.4 | % | 19.0 | % | 16.5 | % | 17.8 | % | 17.6 | % | ||||||||||||||||
6877
| Quarter Ended | ||||||||||||||||||||||||||||||||
| Mar. 31, 2017 | Jun. 30, 2017 | Sep. 30, 2017 | Dec. 31, 2017 | Mar. 31, 2018 | Jun. 30, 2018 | Sep. 30, 2018 | Dec. 31, 2018 | |||||||||||||||||||||||||
| NT$ | NT$ | NT$ | NT$ | NT$ | NT$ | NT$ | NT$ | |||||||||||||||||||||||||
| (in millions) | ||||||||||||||||||||||||||||||||
| Consolidated Operating Revenues | ||||||||||||||||||||||||||||||||
| Packaging | 29,806.3 | 30,493.4 | 32,880.7 | 33,044.7 | 29,368.0 | 44,318.3 | 53,472.7 | 51,149.2 | ||||||||||||||||||||||||
| Testing | 6,365.0 | 6,349.8 | 6,888.7 | 6,553.8 | 5,678.6 | 8,466.9 | 10,838.4 | 10,919.3 | ||||||||||||||||||||||||
| Electronic manufacturing services | 29,354.5 | 28,210.7 | 33,097.9 | 43,284.9 | 28,686.1 | 30,471.9 | 41,996.4 | 50,736.0 | ||||||||||||||||||||||||
| Others | 1,024.9 | 972.2 | 1,011.1 | 1,102.6 | 1,233.0 | 1,244.0 | 1,289.8 | 1,223.8 | ||||||||||||||||||||||||
| Total | 66,550.7 | 66,026.1 | 73,878.4 | 83,986.0 | 64,965.7 | 84,501.1 | 107,597.3 | 114,028.3 | ||||||||||||||||||||||||
| Consolidated Gross Profit | ||||||||||||||||||||||||||||||||
| Packaging | 6,453.4 | 6,553.6 | 7,586.8 | 8,191.5 | 5,754.4 | 8,070.5 | 10,250.3 | 9,593.8 | ||||||||||||||||||||||||
| Testing | 2,127.4 | 2,173.7 | 2,604.2 | 2,398.3 | 1,743.5 | 2,628.3 | 3,814.7 | 4,103.0 | ||||||||||||||||||||||||
| Electronic manufacturing services | 3,096.4 | 3,075.7 | 3,398.1 | 3,992.3 | 2,689.2 | 2,859.1 | 4,141.8 | 4,588.7 | ||||||||||||||||||||||||
| Others | 298.1 | 312.5 | 258.6 | 211.7 | 200.9 | 151.6 | 174.3 | 398.9 | ||||||||||||||||||||||||
| Total | 11,975.3 | 12,115.5 | 13,847.7 | 14,793.8 | 10,388.0 | 13,709.5 | 18,381.1 | 18,684.4 | ||||||||||||||||||||||||
| Consolidated Gross Profit (%) | ||||||||||||||||||||||||||||||||
| Packaging | 21.7 | % | 21.5 | % | 23.1 | % | 24.8 | % | 19.6 | % | 18.2 | % | 19.2 | % | 18.8 | % | ||||||||||||||||
| Testing | 33.4 | 34.2 | 37.8 | 36.6 | 30.7 | 31.0 | 35.2 | 37.6 | ||||||||||||||||||||||||
| Electronic manufacturing services | 10.5 | 10.9 | 10.3 | 9.2 | 9.4 | 9.4 | 9.9 | 9.0 | ||||||||||||||||||||||||
| Overall | 18.0 | % | 18.3 | % | 18.7 | % | 17.6 | % | 16.0 | % | 16.2 | % | 17.1 | % | 16.4 | % | ||||||||||||||||
Our results of operations are affected by seasonality. In general, our first quarter operating revenues have historically decreased over the preceding fourth quarter, primarily due to the combined effects of holidays in the United States, Taiwan and elsewhere in Asia. Moreover, the increase or decrease in operating revenues of a particular quarter as compared with the immediately preceding quarter varies significantly. See “Item 3. Key Information—Risk Factors—Risks Relating to Our Business—Our operating results are subject to significant fluctuations, which could adversely affect the market value of your investment.”
Exchange Rate Fluctuations
For quantitative and qualitative disclosure of our exposure to foreign currency exchange rate risk, see “Item 11. Quantitative and Qualitative Disclosures about Market Risk—Market Risk—Foreign Currency Exchange Rate Risk.”
Taxation
The corporate income tax rate in the ROCR.O.C. decreased from 25% to 17%, effective since January 1, 2010. The ROCR.O.C. Statute for Upgrading Industries, which provided various tax incentives including investment tax credits, tax exemptions and tax holidays for companies, expired on December 31, 2009. Under this statute, we had been granted tax holidays covering the portion of our income attributable to eligible machinery and equipment that were procured with cash infusions from our shareholders or after the capitalization of retained earnings through the issuance of stock dividends, and tax credits of 7% for the purchase of qualifying manufacturing equipment. We can continue to enjoy the tax holidays that have been granted to us by the ROCR.O.C. tax authority. On April 16, 2010, the Legislative Yuan of ROCR.O.C. passed the Industrial Innovation Act, effective from January 1, 2010 to December 31, 2019. Under the prevailing Industrial Innovation Act, a profit-seeking enterprise may deduct up to (i) 15% of its research and development expenditures from its income tax payable for the fiscal year in which these expenditures are incurred; or (ii) 10% of its research and development expenditures from its income tax payable for the fiscal year in which these expenditures are incurred or the following two years. However, the deduction may not exceed 30% of the income tax payable for that fiscal year. Under the Alternative Minimum Tax Act (the “AMT Act”) which took effect onin January 2006 and was amended in August 2012, when the amount of the regular income tax calculated pursuant to the AMT ActIncome Tax Law of the R.O.C. (the “Income Tax Law”) is below the amount of the alternative minimum tax, or the AMT, a taxpayer is required to pay the difference between the AMT and the said regular income tax, which becomes the AMT payable. Taxable income for calculating the AMT includes most sources of income that are exempted from income tax under various legislations such as tax holidays. However, there are grandfathered treatments for the tax holidays approved by the tax authority before the AMT Act took effect. Under the amended AMT Act, the standard deduction for taxable income that applies to business entities decreased from NT$2.0 million to NT$0.5 million and the tax rate that applies to business entities increased from 10% to 12%. The amendment to the AMT Act became effective on January 1, 2013. Under the amendment to the Income Tax Law, which became effective on January 1, 2018, the corporate income tax rate increased from 17% to 20%.
78
As of February 29, 2016, weDecember 31, 2018, Advanced Semiconductor Engineering Inc. had severaltwo five-year tax holidays on income derived from a portion of our operations in Kaohsiung, Taiwan, which will expire through December 31, 2016 to December 31, 2020.in 2018 and 2020, respectively. In addition, some of our subsidiaries, such as ASE Test Taiwan, and ASE Electronics and Siliconware Precision Industries Co., Ltd., are entitled to certain tax exemptions on income derived from a portion of their respective operations.operations, which will expire in 2018, 2019, 2020 and 2022, respectively. The aggregate tax benefits of such exemptions for the years ended December 31, 2013, 20142016, 2017 and 20152018 were NT$373.1700.3 million, NT$623.7623.6 million and NT$538.01,001.1 million (US$16.432.7 million), respectively. The effect of such tax exemption on basic earnings per share for the year ended December 31, 2016, 2017 and 2018 were NT$0.18 (retrospectively adjusted to reflect the impact from the Joint Share Exchange Agreement), NT$0.15 (retrospectively adjusted to reflect the impact from the Joint Share Exchange Agreement) and NT$0.24 (US$0.01), respectively.
In addition, since we have facilities located in special export zones such as the Nantze Export Processing Zone and Hsinchu Science Park in Taiwan, we enjoy exemptions from various import duties, commodity taxes and business taxes on imported machinery, equipment, raw materials and components which are directly used for manufacturing finished goods. We also enjoy exemptions from commodity and business taxes on finished goods exported or sold to others within the zones.
Under the ROC Income Tax Act,Law, after January 1998, all earnings generated in a year which are not distributed to shareholders as dividends in the following year will be assessed a 10% undistributed earnings tax. As a result, if we do not distribute all of our annual earnings as either cash or stock dividends in the following year, these undistributed earnings will be subject to the 10% undistributed earnings tax. However,Before December 31, 2018, when we declare a dividend out of those undistributed earnings on which the 10% undistributed earnings tax had been paid, up to 5% of such undistributed earnings tax may be credited against the withholding tax imposed on the dividends.dividends paid to foreign shareholders. Under the amended Income Tax Law, which became effective on January 1, 2018, the tax rate on unappropriated earnings is reduced from 10% to 5%.
69
In 2014,2017, our effective income tax rate (including the corporate income tax rate and the 10% undistributed earnings tax) increased to 20%21% from 18%19% in 20132016 primarily due to an increase in undistributed earnings tax.tax and an increase in income tax of our electronic manufacturing services business which generated more profit in 2017. In 2015,2018, our effective income tax rate decreased to 17%14% from 20%21% in 20142017 primarily due to a decreasethe reduction in undistributedthe rate of surtax imposed on unappropriated earnings tax.from 10% to 5% and the increase in tax-exempt income, which primarily comes from the gain on remeasurement of investments in SPIL using the equity method of accounting. We believe that our future estimated taxable income will be sufficient to utilize our deferred tax assets recorded as of December 31, 2015.2018.
Our non-R.O.C. subsidiaries are subject to taxation in their respective jurisdiction.
Inflation
We do not believe that inflation in Taiwan or elsewhere has had a material impact on our results of operations.
LIQUIDITY AND CAPITAL RESOURCES
We have historically been able to satisfy our working capital needs from our cash flow from operations. We have historically funded our capacity expansion from internally generated cash and, to the extent necessary, the issuance of equity securities and borrowings. If adequate funds are not available on satisfactory terms, we may be forced to curtail our expansion plans. Moreover, our ability to meet our working capital needs from cash flow from operations will be affected by the demand for our packaging services, testing services and electronic manufacturing services, which in turn may be affected by several factors. Many of these factors are outside of our control, such as economic downturns and declines in the prices of our services or products caused by a downturn in the industry. See “Item 3. Key Information—Risk Factors—Risks Relating to Our Business—Our operating results are subject to significant fluctuations, which could adversely affect the market value of your investment.” To the extent we do not generate sufficient cash flow from our operations to meet our cash requirements, we will have to rely on external financing.
79
Net cash provided by operating activities amounted to NT$57,548.351,074.7 million (US$1,755.11,668.6 million) in 20152018 primarily as a result of (i) our operation performance with profit before income tax of NT$25,293.231,937.7 million (US$771.41,043.4 million) and (ii) our non-cash depreciation and amortization in the amount of NT$29,518.742,688.9 million (US$900.21,394.6 million). Net cash provided by operating activities amounted to NT$45,863.547,430.8 million in 2014,2017 primarily as a result of (i) our operation performance with profit before income tax of NT$28,535.131,020.7 million and (ii) our non-cash depreciation and amortization in the amount of NT$26,350.829,205.2 million. Net cash provided by operating activities amounted to NT$41,296.052,107.9 million in 2013,2016 primarily as a result of(i) our operation performance with profit before income tax of NT$19,369.827,968.7 million and (ii) our non-cash depreciation and amortization in the amount of NT$25,470.929,470.4 million. The increase in net cash provided by operating activities in 20152018 compared to 20142017 was primarily due to an increase in non-cash items such as depreciation and amortization, partially offset by the gain on remeasurement of investments in SPIL using the equity method of accounting, and cash inflows from an increase in trade payables, partially offset by cash outflows from an increase in inventories and trade receivables. The decrease in net cash provided by operating activities in 2017 compared to 2016 was primarily due to cash inflows from a decrease in trade receivables,inventories, partially offset by cash outflows from a decrease in trade payables. The increase in net cash provided by operating activities in 2014 compared to 2013 was primarily due to an increase in profit before income tax and cash inflows from an increase in trade payables and other payables, partially offset by cash outflows from an increase in trade receivables and inventories.
Net cash used in investing activities amounted to NT$63,351.4129,542.3 million (US$1,932.04,232.0 million) in 20152018 primarily due to our acquisition of associates and joint venturessubsidiaries of NT$35,673.195,241.9 million (US$1,087.93,111.5 million) and our acquisition ofpayment for property, plant and equipment of NT$30,280.1million41,386.4 million (US$923.51,352.1 million). Net cash used in investing activities amounted to NT$38,817.916,086.2 million in 2014,2017 primarily due to our payment for property, plant and equipment of NT$ 24,699.2 million, partially offset by cash inflows from disposal of subsidiaries of NT$ 7,020.9 million. Net cash used in investing activities amounted to NT$ 43,159.5 million in 2016 primarily due to our acquisition of property, plant and equipment of NT$39,599.0 million. Net cash used in investing activities amounted to NT$29,925.826,714.2 million in 2013, primarily due toand our acquisition of property, plantassociates and equipmentjoint ventures of NT$29,142.716,041.5 million.
Net cash provided by financing activities amounted to NT$8,636.383,111.4 million (US$263.42,715.2 million) in 2015.2018. This amount comprises of net proceeds from short-term and long-term bank loans and bills payable in the amount of NT$107,838.8 million (US$3,523.0 million). Net cash inflow was partially offset by (i) a decrease in non-controlling interests in the amount of NT$11,820.2 million (US$386.2 million) primarily due to the repurchase of SPIL shares converted from SPIL’s convertible overseas bonds during May 1, 2018 to June 30, 2018 and the financing cost from our acquisition of 40% shareholding of ASEN from NXP B.V.; (ii) our distributed cash dividends to ASEH shareholders in the amount of NT$10,613.6 million (US$346.7 million) ; and (iii) our net repayment of bonds payable in the amount of NT$6,185.6 million (US$202.1 million). Net cash used in financing activities amounted to NT$19,323.4 million in 2017. This amount reflected primarily (i) our distributed cash dividends to owners of the Company in the amount of NT$11,214.2 million; (ii) our net proceeds fromrepayment of short-term bank loans and bills payable and long-term bank loans and bills payable in the amount of NT$12,776.218,512.4 million (US$389.6 million); (ii) the net proceeds from the 2018 NTD-linked Convertible Bonds of NT$6,136.4 million (US$187.1 million) and (iii) our proceeds from partial disposalnet repayment of interestsbonds payable in subsidiariesthe amount of NT$8,910.31,124.0 million, (US$271.7 million), which was partially offset by (i) our proceeds from issue of ordinary shares in the amount of NT$10,290.0 million and (ii) our proceeds from exercise of employee share options of NT$1,439.8 million. Net cash used in financing activities amounted to NT$21,087.0 million in 2016. This amount reflected primarily (i) our distributed cash dividends to owners of the Company in the amount of NT$15,297.5 million(US$466.5 million) and12,243.8 million; (ii) our payments for repurchases of treasury shares of NT$5,333.4 million(US$162.7 million). Net cash used in financing activities amounted to NT$2,797.0 million in 2014. This amount reflected primarily (i) our net repayment of short-term borrowingsbank loans and bills payable and long-term bank loans and bills payable in the amount of NT$12,389.75,630.3 million; and (ii) our distributed cash dividends to owners of the Company(iii) decrease in non-controlling interests in the amount of NT$9,967.2 million, partially offset by (i) our net proceeds from issue of bonds of NT$8,158.8 million; and (ii) change in non-controlling interests of NT$9,905.73,063.6 million due to Universal Scientific Shanghai’s capital increase. Net cash provided by financing activities amounted to NT$12,794.9 million in 2013. This amount reflected primarily (i) ourIndustrial’s restructuring; and (iv) the net proceeds from short-term borrowings and long-term bank loansrepayment of bonds payable in the amount of NT$4,385.2 million; (ii) net proceeds from issue of convertible bonds in the amount of NT$11,900.1 million; and (iii) proceeds from Capital Increase in the amount of NT$3,393.0 million, partially offset by our distributed cash dividends to owners of the Company in the amount of NT$7,834.91,365.1 million.
70
As of December 31, 2015,2018, our primary source of liquidity was NT$55,251.251,518.4 million (US$1,685.01,683.1 million) of cash and cash equivalents and NT$3,864.07,262.2 million (US$117.8237.3 million) of financial assets—assets—current. Our financial assets—assets—current primarily consisted of structured time depositsquoted ordinary shares and swap contracts. As of December 31, 2015,2018, we had total unused credit lines of NT$159,252.9219,911.7 million (US$4,856.87,184.3 million). As of December 31, 2015,2018, we had working capital of NT$34,094.442,926.8 million (US$1,039.81,402.4 million).
As of December 31, 2015,2018, we had total borrowingsdebts of NT$120,361.8198,396.6 million (US$3,670.76,481.4 million), of which NT$36,983.443,263.5 million (US$1,127.91,413.4 million) were short-term debts and NT$83,378.4155,133.1 million (US$2,542.85,068.0 million) were long-term debts. Our short-term debts consist of bank loans and bills payable. In 2015,2018, the maximum amount of our short-term debts was NT$53,558.169,282.4 million (US$1,633.42,263.4 million) and the average amount of our short-term debts was NT$41,931.643,759.5 million (US$1,278.81,429.6 million). The fluctuation was primarily because our working capital balance fluctuated during 20152018 from time to time. The annual interest rate for borrowings under our short-term bank loans and bills payable ranged from 0.57%0.76% to 5.78%5.10% as of December 31, 2015.2018. Our short-term bank loans are primarily revolving facilities with a term of one year, each of which may be extended on an annual basis with lender consent. Our long-term debts consist of bank loans, bills payable, bonds payable and capital lease obligations.As of December 31, 2015,2018, we had outstanding long-term debts, less current portion, of NT$66,535.1144,336.9 million (US$2,029.14,715.3 million). As of December 31, 2015,2018, the current portion of our long-term debts was NT$16,843.310,796.2 million (US$513.7352.7 million). Our long-term bank loans and bills payable typically carried variable annual interest rates which ranged between 0.90%from 0.75% to 5.39% as of December 31, 2015.2018. For the maturity information and interest rates by currencies, see “Item 11—Quantitative and Qualitative Disclosures about Market Risk—Market Risk—Interest Rate Risk.”
80
We have pledged a portion of our assets, with a carrying value of NT$16,542.118,488.6 million (US$504.5604.0 million) as of December 31, 2015,2018, to secure our obligations under our short-termbank borrowings and long-term facilities.
In September 2011, Anstock Limited, our wholly owned subsidiary incorporated in the Cayman Islands with limited liability, issued RMB150.0 million 3.125% Guaranteed Bonds due September 22, 2014 and RMB500.0 million 4.250% Guaranteed Bonds due September 20, 2016. The 2014 and 2016 Bonds were offered to certain non-U.S. persons in compliance with Regulation S under the Securities Act. The 2014 and 2016 Bonds are irrevocably and unconditionally guaranteed on an unsecured and unsubordinated basis by us. The 2014 Bonds matured and were repaid on September 22, 2014. The 2016 Bonds bear interest from and including September 20, 2011 at the ratetariff guarantees of 4.250% per annum. Interest on the 2016 Bonds is payable semi-annually in arrear on September 20 and March 20 of each year beginning on March 20, 2012. The 2016 Bonds will mature on September 20, 2016 unless previously redeemed or repurchased and cancelled. The net proceeds from the 2014 and 2016 Bonds were advanced by Anstock Limited to ASESH AT in the form of an intercompany RMB loan for working capital and capital expenditure with maturity in September 2016.
In July 2014, Anstock II Limited offered US$300.0 million aggregate principal amount of guaranteed bonds due 2017. The Green Bonds are unconditionally and irrevocably guaranteed by us. The Green Bonds were offered to persons outside of the United States in compliance with Regulation S under the Securities Act. The Green Bonds bear interest from and including July 24, 2014 at the rate of 2.125% per annum. Interest on the Green Bonds is payable semi-annually in arrear on January 24 and July 24 of each year beginning on January 24, 2015. The Green Bonds will mature on July 24, 2017 unless previously redeemed or repurchased and cancelled. The net proceeds from the Green Bonds offering were used to fund projects that promote our transition to low-carbon and climate-resilient growth.imported raw materials.
In August 2011, weASE issued NT$8.0 billion 1.45% secured corporate bonds with five year term, guaranteed by the Bank of Taiwan, Mega International Commercial Bank, Taiwan Cooperative Bank, First Bank and Hua Nan Bank. The Corporate Bonds bear an annual simple interest and payment by coupon rate from the issue date. The Corporate Bonds matured and were repaid in August 2016. The net proceeds from the Corporate Bonds were used to repay our previous debts.
In September 2011, Anstock Limited, our wholly owned subsidiary incorporated in the Cayman Islands with limited liability, issued RMB500.0 million 4.250% Guaranteed Bonds due September 20, 2016. The 2016 Bonds were offered to certain non-U.S. persons in compliance with Regulation S under the Securities Act. The 2016 Bonds are irrevocably and unconditionally guaranteed on an unsecured and unsubordinated basis by us. The 2016 Bonds bear interest from and including September 20, 2011 at the rate of 4.250% per annum. Interest on the 2016 Bonds is payable semi-annually in arrears on September 20 and March 20 of each year beginning on March 20, 2012. The 2016 Bonds matured and were repaid on September 20, 2016. The net proceeds from the 2016 Bonds were advanced by Anstock Limited to ASESH AT in the form of an intercompany RMB loan for working capital and capital expenditure with maturity in September 2016.
In September 2013, weASE issued US$400.0 million aggregate principal amount of zero coupon convertible bonds due 2018. The 2018 Convertible Bonds were offered to persons outside of the United States in compliance with Regulation S under the Securities Act. The initial conversion price was NT$33.085 per common share, subject to certain adjustments, determined on the basis of a fixed exchange rate of NT$29.956 = US$1.00 (which represents an approximately 31.3% conversion premium over the closing trading price of our common shares on August 28, 2013 of NT$25.20 per common share). The conversion price is subject to adjustment upon the occurrence of certain events, such as the 2013 Capital Increase, the 2017 Capital Increase and cash dividend distribution. As of the date of this annual report, the bondholders have exercised conversion price isrights to convert 2018 Convertible Bonds of US$399.6 million into our ordinary shares at conversion prices ranging from NT$30.2827.95 to NT$28.96 per common share. ASE’s board of directors resolved in July 2017 to issue a notice of early redemption to 2018 Convertible Bond holders. In the third quarter of 2017, the closing price of our common shares (translated into U.S. dollars at the prevailing rates) for a period of 20 consecutive trading days was higher than 130% of the conversion price in U.S. dollar translated at the fixed exchange rate of US$1 to NT$29.956 determined on pricing date per common share. As a result, ASE redeemed the outstanding 2018 Convertible Bonds of US$0.4 million in September 2017.
In July 2014, Anstock II Limited offered US$300.0 million aggregate principal amount of guaranteed bonds due 2017. The Green Bonds are unconditionally and irrevocably guaranteed by us. The Green Bonds were offered to persons outside of the United States in compliance with Regulation S under the Securities Act. The Green Bonds bear interest from and including July 24, 2014 at the rate of 2.125% per annum. Interest on the Green Bonds is payable semi-annually in arrears on January 24 and July 24 of each year beginning on January 24, 2015. The net proceeds from the Green Bonds offering were used to fund projects that promote our transition to low-carbon and climate-resilient growth. The Green Bonds matured and were fully repaid by Anstock II Limited in July 2017.
In October 2014, SPIL offered the fourth unsecured convertible overseas bonds in US$400,000,000. The bonds will mature on Septemberare zero coupon bonds with a maturity of 5 years. From May 1, 2018 unless previouslyto June 30, 2018, all outstanding bonds of US$148,000,000 were converted into SPIL ordinary shares. We repurchased or converted in accordancethese ordinary shares for a consideration of NT$5,217.0 million (US$170.4 million) (NT$51.2 (US$1.7) per ordinary share, with their terms priorundeducted 0.3% securities transaction tax) pursuant to such date. We used the net proceeds to fund procurement of raw materials from overseas. Please refer to note 18 of our consolidated financial statements included in this annual report for more information. As of December 31, 2015, the balance of the outstanding convertible bonds was US$400.0 million.supplemental indenture.
7181
In July 2015, weASE issued US$200.0200 million aggregate principal amount of NTD-linked zero coupon convertible bonds due 2018. The 2018 NTD-linked Convertible Bonds were offered to persons outside of the United States in compliance with Regulation S under the Securities Act. The initial conversion price was NT$54.5465 per common share, subject to certain adjustments, determined on the basis of a fixed exchange rate of NT$30.928 = US$1.00 (which represents an approximately 27.0% conversion premium over the closing trading price of our common shares on June 25, 2015 of NT$42.95 per common share). ASE used the net proceeds to fund procurement of equipment. The bonds expired in March 2018 and no conversion price is subjectright was exercised. ASE redeemed the Currency Linked Bonds in cash. The redemption sum was arrived through converting the par value into New Taiwan dollar amount using a fixed exchange rate of US$1 to adjustment uponNT$30.928 and then back to U.S. dollar amount using the occurrenceapplicable prevailing rate at the time of certain events, such as the cash dividend distribution. redemption in March 2018.
As of the date of this annual report, the conversion price is NT$51.73 per common share. The bonds will mature on March 27, 2018, unless previously repurchased or converted in accordance with their terms prior to such date. We used the net proceeds to fund procurement of equipment from overseas. Please refer to note 18 of our consolidated financial statements included in this annual report for more information. As of December 31, 2015, the balance of the outstandingwe do not hold any convertible bonds was US$200.0 million.bonds.
In January 2016, weASE issued NT$7,000.0 million (US$213.5 million) 1.30% unsecured corporate bonds with five year term and NT$2,000.0 million (US$61.0 million) 1.50% unsecured corporate bonds with seven year term. The bonds bear an annual simple interest and payment by coupon rate from the issue date. The net proceeds from the bonds were used to repay our previous debts.
We currently have one syndicated loan agreement outstanding. In January 2017, ASE issued NT$3,700.0 million 1.25% unsecured corporate bonds with five year term and NT$4,300.0 million 1.45% unsecured corporate bonds with seven year term. The bonds bear an annual simple interest and payment by coupon rate from the issue date. The net proceeds from the bonds were used to repay our previous debts.
On April 26, 2019, we issued NT$6,500 million (US$212.3 million) 0.9% unsecured domestic bond with five years term and NT$3,500 million (US$114.3 million) 1.03% unsecured domestic bond with seven years term. The bonds bear an annual simple interest and payment by coupon rate from the issue date. The net proceeds from the bonds will be used to repay our bank borrowings.
In March 2017, ASE granted rights to the record holders of our existing common shares to subscribe for an aggregate of 240,000,000 of our common shares, par value NT$10.0 per share. Substantially concurrently with the Rights Offering, we also offered 30,000,000 of our common shares to employees and offered 30,000,000 of our common shares to the public in Taiwan. A total of 300,000,000 of ASE common shares were offered under the 2017 Capital Increase, which were fully subscribed and raised NT$10,290.0 million. The net proceeds of the 2017 Capital Increase were used to repay ASE’s previous debts. Both the Employee Offering and the Taiwan Public Offering were made pursuant to an offer exempt from registration with the SEC pursuant to Regulation S of the Securities Act.
In July 2013, weASE entered into a US$400.0 million five-year syndicated credit facility, for which the Bank of Taiwan acted as the agent bank, for the purpose of funding the purchase of machinery and equipment at our facility and funding general operations. As of December 31, 2015, NT$11,160.5 million (US$340.4 million) was outstanding under this credit facility. This syndicated loan agreement contains undertakings and restrictive covenants relating to the maintenance of certain financial ratios including: (i) current ratio (current assets to current liabilities) of not less than 100.0%; (ii) leverage ratio (total liabilities to tangible net worth) of not higher than 160.0%; (iii) interest coverage ratio (EBITDA to interest expense) of not less than 280.0%; and (iv) tangible net worth not less than NT$75,000.0 million. This syndicated loan was fully repaid in June 2018.
We currently have one syndicated loan agreement outstanding. In April 2018, we entered into a NT$90,000.0 million (US$2,940.2 million) five-year syndicated credit facility, for which the Bank of Taiwan and Mega International Commercial Bank acted as the agent banks, for the purpose of financing our funding needs for the SPIL Acquisition. This syndicated loan agreement contains undertakings and restrictive covenants relating to the maintenance of certain financial ratios including: (i) current ratio (current assets to current liabilities) of not less than 100.0%; (ii) debt ratio (total liabilities to tangible net worth) of not higher than 180.0% in 2018 and 2019, and not higher than 160.0% after 2020; (iii) interest coverage ratio (EBITDA to interest expense) of not less than 280.0%; and (iv) net worth not less than NT$90,000.0 million. As of December 31, 2018, NT$55,000.0 million (US$1,796.8 million) was outstanding under this credit facility and this syndicated loan agreement is guaranteed by ASE in the amount of NT$55,075.8 million (US$1,799.3 million).
On March 28, 2019, our board of directors resolved to issue ordinary shares for cash capital increase in an amount up to NT$3,000.0 million (US$98.0 million) with par value NT$10.0 per share to meet our operational needs.
82
We have in the past failed to comply with certain financial covenants in some of our loan agreements. Such non-compliance may also have, through broadly worded cross-default provisions, resulted in default under some of the agreements governing our other existing debt. As of December 31, 2015,2018, we were not in breach of any of the financial covenants under our existing loan agreements. If we are unable to timely remedy any of our non-compliance under such loan agreements or obtain applicable waivers or amendments, we would breach our financial covenants and our financial condition would be adversely affected. See “Item 3. Key Information—Risk Factors—Risks Relating to Our Business—Restrictive covenants and broad default provisions in our existing debt agreements may materially restrict our operations as well as adversely affect our liquidity, financial condition and results of operations.”
OurAs of December 31, 2018, we have no contingent obligations, which normally consist of guarantees provided by us to our subsidiaries. As of December 31, 2015, we endorsed and guaranteed the bonds issued by our subsidiaries, Anstock Limited, in the amount of RMB500.0 million (US$77.2 million) and Anstock II Limited, in the amount of US$300.0 million, respectively. Other than such guarantees, we have no other contingent obligations.
We have made, and expect to continue to make, substantial capital expenditures in connection with the expansion of our production capacity. The table below sets forth our principal capital expenditures incurred for the periods indicated.
| Year Ended December 31, | Year Ended December 31, | |||||||||||||||||||||||||||||||
| 2013 | 2014 | 2015 | 2016 | 2017 | 2018 | |||||||||||||||||||||||||||
| NT$ | NT$ | NT$ | US$ | NT$ | NT$ | NT$ | US$ | |||||||||||||||||||||||||
| (in millions) | (in millions) | |||||||||||||||||||||||||||||||
| Machinery and equipment | 19,851.7 | 31,735.5 | 18,318.4 | 558.7 | 21,978.3 | 19,432.9 | 32,575.3 | 1,064.2 | ||||||||||||||||||||||||
| Building and improvements | 7,192.4 | 11,713.1 | 9,962.4 | 303.8 | 5,702.6 | 4,244.8 | 6,516.9 | 212.9 | ||||||||||||||||||||||||
| Total | 27,044.1 | 43,448.6 | 28,280.8 | 862.5 | 27,680.9 | 23,677.7 | 39,092.2 | 1,277.1 | ||||||||||||||||||||||||
72
We had commitments for capital expenditures of approximately US$246.7NT$17,039.5 million (US$556.7 million), of which US$53.6NT$2,339.3 million (US$76.4 million) had been paid as of December 31, 2015,2018, primarily in connection with the expansion of our packaging and testing services operations. We estimate that our environmental capital expenditures for 20162019 will be approximately US$35.0 million.We34.2 million, of which 49.1% will be used in climate change adaptation. We may adjust our capital expenditures based on market conditions, the progress of our expansion plans and cash flow from operations. In addition, due to the rapid changes in technology in the semiconductor industry, we frequently need to invest in new machinery and equipment, which may require us to raise additional capital. We cannot assure you that we will be able to raise additional capital should it become necessary on terms acceptable to us or at all. See “Item 3. Key Information—Risk Factors—Risks Relating to Our Business—The packaging and testing businesses are capital intensive. If we cannot obtain additional capital when we need it, our growth prospects and future profitability may be adversely affected.”
We believe that our existing cash, marketable securities, expected cash flow from operations and existing credit lines under our loan facilities will be sufficient to meet our capital expenditures, working capital, cash obligations under our existing debt and lease arrangements, and other requirements for at least the next 12 months. We currently hold cash primarily in U.S. dollars, RMB, New Taiwan dollars, Korean Won and Japanese yen.As of December 31, 2015,2018, we had contractual obligations of NT$86,260.8119,698.5 million (US$2,630.73,910.4 million) due in the next three years. We currently expect to meet our payment obligations through the expected cash flow from operations, long-term borrowings and the issuance of additional equity or equity-linked securities. We will continue to evaluate our capital structure and may decide from time to time to increase or decrease our financial leverage through equity offerings or borrowings. The issuance of additional equity or equity-linked securities may result in additional dilution to our shareholders.
From time to time, we evaluate possible investments, acquisitions or divestments and may, if a suitable opportunity arises, make an investment, acquisition or divestment.
Our treasury team, under the supervision of our chief financial officer, is responsible for setting our funding and treasury policies and objectives. Our exposure to financial market risks relates primarily to changes in interest rates and foreign currency exchange rates. To mitigate these risks, we utilize derivative financial instruments, the application of which isprimarily to manage these exposures, and not for speculative purposes.
We have, from time to time, entered into interest rate swap transactions to hedge our interest rate exposure. In addition, we have, from time to time, entered into forward exchange contracts, swap contracts, cross currency swap contracts and European foreign currency options contracts to hedge our existing assets and liabilities denominated in foreign currencies. See “Item 11. Quantitative and Qualitative Disclosures about Market Risk” and notes 7, 8 and 3136 to our consolidated financial statements included in this annual report.
83
For 2013, 20142016, 2017 and 2015,2018, our research and development expenditures totaled approximately NT$9,064.711,391.1 million, NT$10,289.711,746.6 million and NT$10,937.514,962.8 million (US$333.6488.8 million), respectively. These expenditures represented approximately 4.1%, 4.0% and 3.8%4.0% of operating revenues in 2013, 20142016, 2017 and 2015,2018, respectively. We have historically expensed allAs of December 31, 2018, we had a research and development costs as incurredteam of 10,283 employees. ASEH cultivates and nonemaintains a research and development engineering team that continuously surveys and adapts to the latest trends in technology. Our research and development activities are primarily directed toward optimizing relevant technologies in key components, manufacturing processes and product development. Our research and development objective is currently capitalized. Asto enhance the performance of February 29, 2016, we employed 7,202our products and drive greater business growth. To incentivize innovation and encourage our employees to engage in research and development.development, we offer cash rewards to employees that contribute significantly to our research efforts.
Packaging
We centralize our research and development efforts in packaging technology in our Kaohsiung Taiwan facilities.and Taichung facilities in Taiwan. After initial phases of development, we conduct pilot runs in one of our facilities before new technologies or processes are implemented commercially at other sites. Facilities with special product expertise, such as ASE Korea, also conduct research and development of these specialized products and technologies at their sites. One of the areas of emphasis for our research and development efforts is improving the efficiency and technology of our packaging processes and these efforts are expected to continue. We are also putting significant research and development efforts into the development and adoption of innovative technology. We work closely with manufacturers of our packaging equipment and materials in designing and developing the equipment and materials used in our production process. We also collaborate with our significant customers to co-develop new product and process technologies.
73
In addition to investing in the development of more advanced packaging technology and improving production efficiency, a significant portion of our research and development efforts is focused on the development of IC substrate production technology for BGA packaging. Substrate is the principal raw material for BGA packages. Development and production of IC substrates involve complex technology. We are currently working closely with certain first-tier substrate suppliers in Asia, primarily including those located in Japan, Taiwan and Korea. We believe that our successful cooperation with substrate suppliers to enhance the overall substrate production capability and to meet future package requirements has enabled us to capture an increasingly important value-added component of the packaging process, helped ensure a stable and cost-effective supply of substrates for our BGA packaging operations and shortened time to market.
Testing
Our research and development efforts in the area of testing have focused primarily on developing testing software and solutions, including logic/mixed-signal/RF/(2.5D/3D)logic, mixed-signal, RF and discrete IC /module /SiP, Optical module, and SiP /discrete semiconductors, characterization of semiconductors, layout design and electrical simulation for high frequency test board and developing software of parametric test data analysis. We work closely with our customers on the leading edge test technologies, such as 3D IC test and advanced probe test technology such as very fine pitch probe card. Our research and development operations also include an equipment development group, which currently designs testing hardware and software for specific semiconductors to offer our customers cost effective test solutions.
Electronic manufacturing services
To further enhance the quality of our services and products, we focus on developing diversified and innovative products to improve our competitiveness. By leveraging our proprietary research and development expertise, we are able to optimize our product design, engineering and manufacturing capabilities to provide our customers with high performance and cost-effective products and services. During the process of designing, as well as developing the technology for, our software and hardware, our research and development team also dedicates itself to discovering new know-how, and then applying such know-how to create new, advanced and improved products, processes, methodology and services. We are currently investing in the development of products used in electronic manufacturing services in relation to computers and peripherals, communications, industrial,consumer products, automotive, andindustrial, storage and server applications.
84
Other than as disclosed elsewhere in this annual report, we are not aware of any trends, uncertainties, demands, commitments or events for the period from January 1, 20152018 to December 31, 20152018 that are reasonably likely to have a material effect on our operating revenues, income, profitability, liquidity or capital resources, or that caused the disclosed financial information to be not necessarily indicative of future operating results or financial conditions.
OFF-BALANCE SHEET ARRANGEMENTS
There are no off-balance sheet arrangements that have or are reasonably likely to have a current or future effect on our financial condition, changes in financial condition, revenues or expenses, results of operations, liquidity, capital expenditures or capital resources that are material to investors.
TABULAR DISCLOSURE OF CONTRACTUAL OBLIGATIONS
The following table sets forth the maturity of our contractual obligations as of December 31, 2015.2018.
| Payments Due by Period | ||||||||||||||||||||
| Total | Under 1 Year | 1 to 3 Years | 3 to 5 Years | After 5 Years | ||||||||||||||||
| NT$ | NT$ | NT$ | NT$ | NT$ | ||||||||||||||||
| (in millions) | ||||||||||||||||||||
| Contractual Obligations: | ||||||||||||||||||||
| Long-term debt(1) | 162,465.8 | 13,694.0 | 98,522.4 | 45,881.8 | 4,367.6 | |||||||||||||||
| Capital lease obligations(2) | 248.8 | 17.1 | 231.7 | - | - | |||||||||||||||
| Operating leases(3) | 2,386.1 | 510.0 | 519.5 | 309.0 | 1,047.6 | |||||||||||||||
| Purchase obligations(4) | 6,203.8 | 6,203.8 | - | - | - | |||||||||||||||
| Total(5)(6)(7)(8) | 171,304.5 | 20,424.9 | 99,273.6 | 46,190.8 | 5,415.2 | |||||||||||||||
74
| Payments Due by Period | ||||||||||||||||||||
| Total | Under 1 Year | 1 to 3 Years | 3 to 5 Years | After 5 Years | ||||||||||||||||
| NT$ | NT$ | NT$ | NT$ | NT$ | ||||||||||||||||
| (in millions) | ||||||||||||||||||||
| Contractual Obligations: | ||||||||||||||||||||
| Long-term debt(1) | 86,687.3 | 28,932.1 | 53,981.6 | 2,998.3 | 775.3 | |||||||||||||||
| Capital lease obligations(2) | 401.8 | 100.3 | 5.9 | 295.6 | - | |||||||||||||||
| Operating leases(3) | 1,027.4 | 211.2 | 241.6 | 111.9 | 462.7 | |||||||||||||||
| Purchase obligations(4) | 2,788.1 | 2,788.1 | - | - | - | |||||||||||||||
| Total(5)(6)(7)(8) | 90,904.6 | 32,031.7 | 54,229.1 | 3,405.8 | 1,238.0 | |||||||||||||||
_____________________________
| (1) | Includes long-term borrowings and bonds payable (before the deduction of unamortized arrangement fees, unamortized issuance cost and discounts on bonds payable) and interest payments. |
| (2) | Represents our commitments under property leases and imputed interest. These obligations are recorded on our consolidated balance sheets under the line item of other non-current liabilities. |
| (3) | Represents our commitments under leases for land, machinery and equipment such as testers, and office buildings and equipment. See note 34 to our consolidated financial statements included in this annual report. |
| (4) | Represents unpaid commitments for construction. These commitments were not recorded on our consolidated balance sheets as of December 31, |
| (5) | Excludes non-binding commitments to purchase machinery and equipment of approximately NT$ |
| (6) | Excludes unpaid amounts that we were contracted for the construction related to our real estate business of approximately NT$ |
| (7) | Excludes our unfunded defined benefit obligation since the schedule of payments is difficult to determine. Under defined benefit pension plans, we made pension contributions of approximately NT$ |
85
| (8) | Excludes uncertain tax liabilities. We recognized additional taxes payable of NT$ |
Please see the section entitled “Special Note Regarding Forward-Looking Statements.Statements.”
Item 6. Directors, Senior Management and Employees
DIRECTORS AND SENIOR MANAGEMENT
Directors
Our board of directors is elected by our shareholders in a generalshareholders’ meeting at which a quorum, consisting of a majority of all issued and outstanding common shares, not including treasury stocks and common shares held by our subsidiaries, is present. The chairman is elected by the board from among the directors. Our eleven-memberthirteen- member board of directors, including three independent directors, is responsible for the management of our business.
We currently have eleventhirteen directors, serving a three-year term. The current board of directors were elected in extraordinary general shareholders’ meeting on June 21, 2018 and began serving on June 24, 2015.22, 2018. Directors may serve any number of consecutive terms and may be removed from office at any time by a resolution adopted at a meeting of shareholders. Normally, all board members are elected at the same meeting of shareholders, except where the posts of one-third or more of the directors are vacant, at which time an extraordinary general shareholders’ meeting shall be convened to elect directors to fill the vacancies. We and our subsidiaries do not have service contracts with our directors that provide for benefits upon termination of employment.
75
Our audit committee currently consists of our independent directors, Shen-Fu Yu, Ta-Lin Hsu and Mei-Yueh Ho, who are independent under Rule 10A-3 and the ROCR.O.C. Securities and Exchange Act and are financially literate with accounting or related financial management expertise. The audit committee has responsibilityis responsible for among other things, overseeing the qualifications, independence and performance of our independent auditors, and the integrity of our financial statements.statements, and our compliance with legal and regulatory requirements. Our audit committee is entrusted with the same duties and responsibilities as set out in Rule 10A-3(b) under the Exchange Act.
Our compensation committee currently consists of Shen-Fu Yu and Ta-Lin Hsu, our independent directors, and Hsiao-Ying Ku. Our board of directors established a compensation committee to satisfy the requirements under the ROCR.O.C. Securities and Exchange Act. Under ROC securities regulations,According to the Taiwan Stock Exchange Corporation Operation Directions for Compliance with the Establishment of Board of Directors by TWSE Listed Companies and the Board's Exercise of Powers, a majority of compensation committee shouldcommittee's members shall be independent directors. In addition, according to the R.O.C Securities and Exchange Act and the Regulations Governing the Appointment and Exercise of Powers by the Remuneration Committee of a Company Whose Stock is Listed on the Stock Exchange or Traded Over the Counter, compensation committee's members shall have at least one independent director who is considered independent under ROC securities regulations.independent. We do not assess the independence of our compensation committee member under the independence requirements of the NYSE listing standards but adopt the independence standard as promulgated under the ROCR.O.C. Regulations Governing the Appointment and Exercise of Powers by the Remuneration Committee of a Company Whose Stock is Listed on the Stock Exchange or Traded Over the Counter. See “Item 16G. Corporate Governance” for more information. Our compensation committee meets at least twice a year. Our board of directors has adopted ana compensation committee charter for our compensation committee. The compensation committee has responsibility for, among other things, setting forth and reviewing policies, systems, standards and structures regarding performance evaluation and compensation of the directors, managerial personnel, and evaluating compensation of the directors and managerial personnel.
The following table sets forth information regarding all of our directors as of MarchJanuary 31, 2016.2019. In accordance with ROCR.O.C. law, each of our directors is elected either in his or her capacity as an individual or as an individual representative of a corporation or government. Persons designated to represent corporate or government shareholders as directors are typically nominated by such shareholders at the annual generalshareholders’ meeting and may be replaced as representatives by such shareholders at will. Of the current directors, sixnine represent ASE Enterprises Limited. The remaining directors serve in their capacity as individuals.
Name | Position | Director | Age | Other Significant |
| Jason C.S. Chang(1)(2) | Director, Chairman and Chief Executive Officer | 1984 | 71 | None |
| Richard H.P. Chang(1) | Director, Vice Chairman and President | 1984 | 69 | Chairman, Sino Horizon Holdings Ltd. |
| Rutherford Chang (3) | Director and General Manager of China Region | 2009 | 36 | None |
| Tien Wu(2) | Director and Chief Operating Officer | 2003 | 58 | None |
| Joseph Tung(2) | Director and Chief Financial Officer | 1997 | 57 | Independent director, Ta Chong Bank Ltd. |
| Raymond Lo(2) | Director and General Manager, Kaohsiung packaging facility | 2006 | 62 | None |
| Tien-Szu Chen (2) | Director and General Manager, ASE Inc. Chung-Li branch | 2015 | 54 | None |
| Jeffrey Chen(2) | Director and General Manager of Corporate Affairs and Strategy of China Region | 2003 | 52 | None |
| Shen-Fu Yu | Independent Director and Member, Audit Committee and Compensation Committee | 2009 | 71 | Independent director, Yulon Motor Co., Ltd.; director, Arima Lasers Corporation; supervisor, Dynapak International Technology Corporation, San Fu Chemical Co., Ltd., and Arima Communications |
| Ta-Lin Hsu | Independent Director and Member, Audit Committee and Compensation Committee | 2009 | 72 | Chairman and founder, H&Q Asia Pacific; Chairman, H&Q Taiwan Co. Ltd. |
| Mei-Yueh Ho | Independent Director and Member, Audit Committee | 2015 | 65 | Independent Director, Bank of Kaohsiung, Ltd., KINPO Electronics Inc., AU Optronics Corp. and Ausnutria Dairy Corporation Ltd. |
____________________86
Name | Position | Director | Age | Other Significant Positions Held Outside of ASEH | |
| Jason C.S. Chang(1)(2) | Director, Chairman and Chief Executive Officer | 2018 | 74 | None | |
| Richard H.P. Chang(1)(2) | Director, Vice Chairman and President | 2018 | 72 | Chairman, Sino Horizon Holdings Ltd. | |
| Bough Lin(2) | Director; Chairman and Executive Vice President, SPIL | 2018 | 67 | None | |
| Chi-Wen Tsai(2) | Director; Vice Chairman and President, SPIL | 2018 | 71 | None | |
| Tien Wu(2) | Director and Chief Operating Officer | 2018 | 61 | None | |
| Joseph Tung(2) | Director and Chief Financial Officer | 2018 | 60 | None | |
| Raymond Lo(2) | Director; General Manager, Kaohsiung packaging facility | 2018 | 64 | None | |
| Tien-Szu Chen(2) | Director; General Manager, ASE Inc. Chung-Li branch | 2018 | 57 | None | |
| Jeffrey Chen(2) | Director; Chairman, Universal Scientific Industrial (Shanghai) Co., Ltd. | 2018 | 54 | Independent Director and a member of the compensation committee, Mercuries & Associates Holding Ltd. | |
| Rutherford Chang(3) | Director; General Manager, China Region | 2018 | 39 | None | |
| Shen-Fu Yu | Independent Director and Member, Audit Committee and Compensation Committee | 2018 | 74 | Director, Arima Lasers Corporation and Arima Communications; supervisor, Dynapack International Technology Corporation and San Fu Chemical Co., Ltd. | |
| Ta-Lin Hsu | Independent Director and Member, Audit Committee and Compensation Committee | 2018 | 75 | Chairman and founder, H&Q Asia Pacific; Chairman, H&Q Taiwan Co. Ltd. | |
| Mei-Yueh Ho | Independent Director and Member, Audit Committee | 2018 | 68 | Independent Director, Bank of Kaohsiung, Ltd., KINPO Electronics Inc. and AU Optronics Corp. |
| (1) | Jason C.S. Chang and Richard H.P. Chang are brothers. |
| (2) | Representative of ASE Enterprises Limited, a company organized under the laws of Hong Kong, which held |
| (3) | Rutherford Chang is the son of Jason C.S. Chang. |
76
Audit Committee
For a discussion of our audit committee, see “—Directors and Senior Management—Directors.”
Executive Officers
The following table sets forth information regarding all of our executive officers as of MarchJanuary 31, 2016.2019.
Name | Position | Years with the Company | Age |
| Jason C.S. Chang | Chairman and Chief Executive Officer | 32 | 71 |
| Richard H.P. Chang | Vice Chairman and President; Chairman, Universal Scientific Shanghai | 32 | 69 |
| Rutherford Chang | General Manager, China Region | 11 | 36 |
| Tien Wu | Chief Operating Officer | 16 | 58 |
| Joseph Tung | Chief Financial Officer | 21 | 57 |
| Raymond Lo | General Manager, ASE Test Taiwan; General Manager, Kaohsiung packaging facility | 29 | 62 |
| Tien-Szu Chen | General Manager, ASE Inc. Chung-Li branch | 27 | 54 |
| Chun-Che Lee | General Manager, ASE Electronics | 31 | 56 |
| Ung Bae | General Manager, ASE Korea | 16 | 59 |
| Chih-Hsiao Chung | General Manager, ASE Japan and Wuxi Tongzhi | 16 | 51 |
| Chiu-Ming Cheng | General Manager, ASESH AT | 25 | 55 |
| Chih-An Hsu | General Manager, ASEKS | 19 | 53 |
| Yen-Chieh Tsao | General Manager, ASEWH | 4 | 58 |
| Shih-Kang Hsu | Chief Executive Officer, ASEN | 15 | 50 |
| Meng-Hui Lin | General Manager, ASE Shanghai | 22 | 49 |
| Kwai Mun Lee | President, ASE South-East Asia operations | 17 | 53 |
| Lid Jian Chiou | General Manager, ASE Singapore Pte. Ltd. | 12 | 59 |
| Kenneth Hsiang | General Manager, ISE Labs | 16 | 46 |
| Chen-Yen Wei | Chairman, Universal Scientific; Chairman, USI Inc.; President, Universal Scientific Shanghai | 36 | 61 |
| Feng-Ta Chen | General Manager, UGJQ | 18 | 53 |
| Jack Hou | General Manager, UGTW | 22 | 59 |
| Ta-I Lin | General Manager, UGKS | 28 | 52 |
| Yueh-Ming Lin | General Manager, USISZ | 20 | 50 |
| Omar Anaya Galván | General Manager, USI Mexico | 13 | 46 |
7787
Name | Position | Years with the Company | Age |
| Jason C.S. Chang | Chairman and Chief Executive Officer | 34 | 74 |
| Richard H.P. Chang | Vice Chairman and President | 34 | 72 |
| Bough Lin | Chairman and Executive Vice President, SPIL | 1 | 67 |
| Chi-Wen Tsai | Vice Chairman and President, SPIL | 1 | 71 |
| Tien Wu | Chief Operating Officer | 18 | 61 |
| Joseph Tung | Chief Financial Officer | 24 | 60 |
| Raymond Lo | General Manager, ASE Test Taiwan and General Manager, Kaohsiung packaging facility | 32 | 64 |
| Tien-Szu Chen | General Manager, ASE Inc. Chung-Li branch | 30 | 57 |
| Rutherford Chang | General Manager, China Region | 13 | 39 |
| Du-Tsuen Uang | Chief Administration Officer | 16 | 59 |
| Chun-Che Lee | General Manager, ASE Electronics | 34 | 59 |
| Chung Lin | General Manager, ASE Shanghai | 14 | 55 |
| Songwoon Kim | General Manager, ASE Korea | 34 | 60 |
| Chih-Hsiao Chung | General Manager, ASE Japan and Wuxi Tongzhi | 19 | 54 |
| Chiu-Ming Cheng | General Manager, ASESH AT | 28 | 58 |
| Yen-Chieh Tsao | General Manager, ASEWH | 7 | 61 |
| Shih-Kang Hsu | Chief Executive Officer, ASEN and General Manager, ASEKS | 18 | 53 |
| Kwai Mun Lee | President, ASE South-East Asia operations | 20 | 56 |
| Yean Peng Chen | General Manager, ASE Singapore Pte. Ltd. | 20 | 47 |
| Lid Jian Chiou(1) | General Manager, ASE Singapore Pte. Ltd. | -(1) | 62 |
| Heng Ee Ooi | General Manager, ASE Malaysia | 24 | 50 |
| Kenneth Hsiang | General Manager, ISE Labs | 19 | 48 |
| Randy Hsiao-Yu Lo | General Manager, Siliconware USA, Inc. | 1 | 62 |
| M.S. Chang | General Manager, Siliconware Technology (Suzhou) Limited | 1 | 58 |
| Jeffrey Chen | Chairman, Universal Scientific Industrial (Shanghai) Co., Ltd. | 24 | 54 |
| Chen-Yen Wei | Chairman, Universal Scientific Industrial Co., Ltd. and President, Universal Scientific Industrial (Shanghai) Co., Ltd. | 39 | 64 |
| Feng-Ta Chen | General Manager, UGJQ | 21 | 56 |
| Jack Hou | General Manager, UGTW | 24 | 62 |
| Ta-I Lin | General Manager, UGKS | 31 | 55 |
| Yueh-Ming Lin | General Manager, USISZ | 23 | 53 |
| Omar Anaya Galván | General Manager, USI Mexico | 15 | 49 |
| (1) | Lid Jian Chiou retired on December 31, 2018. |
Biographies of Directors and Executive Officers
Jason C.S. Chang has served as Chairman and chief executive officer ofASE Inc. ASEH since its founding in March 1984 and as its Chief Executive Officer since May 2003.April 2018. He is also Chairman of ASE Inc. Mr. Chang holds a bachelor’s degree in electrical engineering from National Taiwan University in Taiwan and a master’s degree from the Illinois Institute of Technology. He is the brother of Richard H.P. Chang,our Vice Chairman and President.president.
Richard H.P. Chang has served as Vice Chairman and president ofASE Inc. since November 1999 after having served as President ofASE Inc. ASEH since its founding in March 1984, and served as Chief Executive Officer ofASE Inc. from July 2000 to April 2003. In February 2003, he was again appointed President ofASE Inc. upon the retirement of Mr. Leonard Y. Liu. Mr. Chang has also served as the Chairman of Universal Scientific Industrial (Shanghai) Co., Ltd. since June 2008.2018. Mr. Chang holds a bachelor’s degree in industrial engineering from Chung Yuan Christian University in Taiwan. He is the brother of Jason C.S. Chang, our Chairman and Chief Executive Officer.chief executive officer.
Bough Lin has served as a director of ASEH since its founding in April 2018. Mr. Lin is Chairman and executive vice president of SPIL. Mr. Lin has been SPIL's director since August 1984. Mr. Lin holds a bachelor’s degree in electronic physics from National Chiao Tung University in Taiwan and was awarded an honorary Ph.D. from National Chiao Tung University in 2014.
Chi-Wen Tsaihas served as a director of ASEH since its founding in April 2018. Mr. Tsai is Vice Chairman and president of SPIL. Mr. Tsai has been SPIL's director since August 1984. Mr. Tsai holds a bachelor’s degree in electrical engineering from National Taipei Institute of Technology in Taiwan.
Tien Wu has served as a director and chief operating officer of ASEH since its founding in April 2018, prior to which he served as president of Worldwide Marketing and Strategy of ASE Inc. Before joining ASE Inc. in March 2000, Mr. Wu held various managerial positions with IBM. Mr. Wu holds a bachelor’s degree in civil engineering from National Taiwan University in Taiwan, a master’s degree and a doctorate degree in mechanical engineering and applied mechanics from University of Pennsylvania.
88
Joseph Tung has served as a director and chief financial officer of ASEH since its founding in April 2018. He has also served as a director of ASE Inc. since April 1997 and chief financial officer of ASE Inc. since December 1994. He was an independent director of Ta Chong Bank Ltd. from October 2007 to December 2017. Before joining ASE Inc., Mr. Tung was a vice president at Citibank, N.A. Mr. Tung holds a bachelor’s degree in economics from National Chengchi University in Taiwan and a master’s degree in business administration from the University of Southern California.
Raymond Lo has served as a director of ASEH since its founding in April 2018 and general manager of our packaging facility in Kaohsiung, Taiwan since April 2006. Mr. Lo also served as a supervisor of ASE Inc. between July 2000 and May 2006 and director of ASE Inc. since May 2006. Before joining ASE Inc., Mr. Lo was a director of Quality Assurance at Zeny Electronics Co. Mr. Lo holds a bachelor’s degree in electronic physics from National Chiao Tung University in Taiwan.
Tien-Szu Chen has served as a director of ASEH since its founding in April 2018. Mr. Chen has served as a director of ASE Inc. since June 2015 and general manager of ASE Inc. Chung-Li branch since August 2015. He has also served as a supervisor of ASE Inc. from June 2006 to June 2015 and president of Power ASE Technology Inc. from June 2006 to May 2012. Prior to joining ASE Inc. in June 1988, Mr. Chen worked at TSMC and Philips Semiconductor Kaohsiung. Mr. Chen holds a bachelor’s degree in industrial engineering from Chung Yuan Christian University in Taiwan.
Jeffrey Chen has served as a director of ASEH since its founding in April 2018 and he has also served as a director of ASE Inc. since June 2003. Mr. Chen has served as Chairman of Universal Sceintific Industrial (Shanghai) Co., Ltd. since June 2018. Prior to joining ASE Inc., he worked in the corporate banking department of Citibank, N.A. in Taipei and as a vice president of corporate finance at Bankers Trust in Taipei. Mr. Chen holds a bachelor’s degree in finance and economics from Simon Fraser University in Vancouver Canada and a master’s degree in business administration from University of British Columbia in Canada.
Rutherford Chang has served as a director of ASEH since its fouding in April 2018. He has also served as a director of ASE Inc. since June 2009 and General Managergeneral manager of China Region ofASE Group.Inc. since June 2010. He joinedASE Group in March 2005. Mr. Chang holds a bachelor’s degree in psychology from Wesleyan University in Connecticut. He is the son of Jason C.S. Chang, our Chairman and Chief Executive Officer.chief executive officer.
Tien Wu has served as a director ofASE Inc. since June 2003 and Chief Operating Officer since April 2006, prior to which he served as the President of Worldwide Marketing and Strategy of the ASE Group. Prior to joining ASE Inc. in March 2000, Mr. Wu held various managerial positions with IBM. Mr. Wu holds a bachelor’s degree in civil engineering from National Taiwan University in Taiwan, a master’s degree and a doctorate degree in mechanical engineering and applied mechanics from the University of Pennsylvania.
Joseph Tung has served as a director ofASE Inc. since April 1997 and Chief Financial Officer since December 1994. He is also an independent director of Ta Chong Bank Ltd. since October 2007. Before joining ASE Inc., Mr. Tung was a Vice President at Citibank, N.A. Mr. Tung holds a bachelor’s degree in economics from the National Chengchi University in Taiwan and a master’s degree in business administration from the University of Southern California.
Raymond Lo has served as a director ofASE Inc. since May 2006 and General Manager of our packaging facility in Kaohsiung, Taiwan since April 2006. Mr. Lo also served as a supervisor ofASE Inc. between July 2000 and May 2006. Before joining ASE Group, Mr. Lo was the Director of Quality Assurance at Zeny Electronics Co. Mr. Lo holds a bachelor’s degree in electronic physics from the National Chiao Tung University in Taiwan.
Tien-Szu Chen has served as a director of ASE Inc. since June 2015 and General Manager of ASE Inc. Chung-Li branch since August 2015. Prior to his current position, Mr. Chen served as our supervisor from June 2006 to June 2015 and as President of Power ASE Technology Inc. from June 2006 to May 2012. He also held several key management positions within the ASE Group from June 1988 to June 2006, including President of ASE Inc. Chung-Li branch and Senior Vice President of ASE Inc. Prior to joining ASE Group in June 1988, Mr. Chen worked at TSMC and Philips Semiconductor Kaohsiung. Mr. Chen received his bachelor’s degree in industrial engineering from Chung Yuan Christian University in Taiwan.
78
Jeffrey Chen has served as a director of ASE Inc. since June 2003 and General Manager of Corporate Affairs and Strategy of China Region. Prior to joining ASE Inc., he worked in the corporate banking department of Citibank, N.A. in Taipei and as a Vice President of corporate finance at Bankers Trust in Taipei. Mr. Chen holds a bachelor’s degree in finance and economics from Simon Fraser University in Canada and a master’s degree in business administration from the University of British Columbia in Canada.
Shen-Fu Yu has served as an independent director of ASE Inc.ASEH since June 2009 and as an independent director of Yulon Motor Co., Ltd. He is also a director of Arima Lasers Corporation and a supervisor of Dynapack International Technology Corporation, San Fu Chemical Co., Ltd., and Arima Communications.2018. Mr. Yu is also a member of the audit committee and compensation committee of ASE Inc.. Mr. Yu also serves on the compensation committeeASEH. He is a director of Yulon Motor Co., Ltd., Taiwan AcceptanceArima Lasers Corporation and Elite MaterialArima Communications, and a supervisor of Dynapack International Technology Corporation and San Fu Chemical Co., Ltd. He worked at Deloitte & Touche Accounting Firm as a consultant from June 2003 to November 2006. Mr. Yu holds a bachelor’s degree in accounting from National Taiwan University in Taiwan and a master’s degree in accounting from National Chengchi University in Taiwan.
Ta-Lin Hsu has served as an independent director of ASE Inc.ASEH since June 2009.2018. He is also a member of the audit committee and compensation committee of ASE Inc..ASEH. He is currently the chairman and founder of H&Q Asia Pacific and chairman of H&Q Taiwan Co. Ltd. Mr. Hsu holds a bachelor’s degree in physics from National Taiwan University, a master’s degree in electrophysics from the Polytechnic Institute of Brooklyn and a doctorate degree in electrical engineering from the University of California, Berkeley.
Mei-Yueh Ho has served as an independent director and a member of the audit committee of ASE Inc.ASEH since June 2015.2018. Ms. Ho is also an independent director of the Bank of Kaohsiung, Ltd., KINPO Electronics Inc., AU Optronics Corp. and Ausnutria Diary Corporation Ltd. She is also a member of the audit committee of the Bank of Kaohsiung, Ltd. and AU Optronics Corp., and a member of the compensation committee of the Bank of Kaohsiung, Ltd., KINPO Electronics Inc. and AU Optronics Corp. She is also a member of the compensation committee of the Bank of Kaohsiung, Ltd. and KINPO Electronics Inc. Ms. Ho served as Minister of Ministry of Economic Affairs, ROCR.O.C. from May 2004 to January 2006. She was also Chairperson of the Council for Economic Planning and Development, ROCR.O.C. from May 2007 to May 2008. Ms. Ho holds a bachelor’s degree in agricultural chemistry from National Taiwan University in Taiwan.
Du-Tsuen Uang has served as chief administration officer of ASEH since its founding in April 2018 and chief administration officer of ASE Inc. since August 2017. Mr. Uang is also chief executive officer and director of ASE Cultural & Educational Foundation, and director of ASE Inc., Universal Scientific Industrial Shanghai, Hung Ching and Sino Horizon Holdings Ltd., as well as a professor at Ming Chuan University at law department. Mr. Uang was a senior chief secretary of Taiwan Ministry of Economic Affairs Central Bureau of Standards, commissioner of Taiwan FTC, independent director of First commercial Bank, and legal counsel at Hung Ching. Mr. Uang received Ph. D in law from National Cheng-Chi University in Taiwan.
89
Chun-Che Lee has served as a General Managergeneral manager of ASE Electronics Inc. since August 2011, prior to which he was a vice president, director and manager of research and development atof ASE Inc. since 1984. Mr. Lee holds a bachelor’s degree in aeronautics from Tamkung University in Taiwan.
Ung BaeChung Lin has served as General Managergeneral manager of ASE (Korea) Inc.Shanghai since July 2008,May 2018 and vice president of ASESH AT since May 2012, after serving as Senior Vice Presidentvice president of ASEWH since 2010 and ASE Shanghai since May 2005. Mr. Lin holds a master’s degree in computer science from Columbia University.
Songwoon Kim has served as general manager of ASE (Korea) Inc.Korea since February 2017, after serving as senior vice president of ASE Korea since July 1999. Mr. BaeKim was Vice Presidenta senior manager of Motorola Korea, Limited before joining ASE (Korea) Inc.Korea when we acquired Motorola Korea, Limited. He holds a bachelor’s degree in electronicmechanical engineering from In-HaA-Jou University in Korea.
Chih-Hsiao Chung has served as General Managergeneral manager of ASE Japan Co. Ltd. since March 2011, General Managergeneral manager of Wuxi Tongzhi Microelectronics Co., Ltd. since June 2013, and Chairman and CEOchief executive officer of ASEEE since September 2015. Mr. Chung has also managed the sales and marketing of ASE Japan Co. Ltd. region since April 2007. Before joining ASE Group,Inc., Mr. Chung was the Senior Managera senior manager of Sale and Marketing at Kimberly Clark Co., Taiwan. He holds a master’s degree in business administration from the University of Wisconsin-Madison.
Chiu-Ming Cheng has served as General Managergeneral manager of ASE Assembly & Test (Shanghai) LimitedASESH AT since September 2012, after serving as Vice Presidentvice president of ASE’s Kaohsiung packaging facility since October 2004. He joined ASE GroupInc. in April, 1990. Mr. Cheng holds a master’s degree in public policy from National Sun Yat-Sen University in Taiwan.
Chih-An Hsu has served as General Manager of ASE (KunShan) Inc. since July 2012, after serving as Vice President of ASE's Chung-Li since July 2006. He joined ASE Group in February 1997. Mr. Hsu holds a bachelor’s degree in industrial engineering from National Tsing Hua University in Taiwan.
Yen-Chieh Tsao has served as General Managergeneral manager of ASE (Weihai), Inc.ASEWH since October 2013 after serving as Vice Presidentvice president of ASE’sASE Inc. Chung-Li branch since October 2011. Prior to joining ASE Inc., Mr. Tsao was the Vice Presidenta vice president of Motorola ElectronicsTaiwan Ltd. prior to joining ASE Group. He holds a bachelor’s degree in physics from the Chinese Culture University in Taiwan.
79
Shih-Kang Hsu has served as Chief Executive Officerchief executive officer of Suzhou ASEN Semiconductors Co., Ltd. since August 2010 and general manager of ASEKS since October 2018, after serving as Senior Vice Presidentsenior vice president of ASE (U.S.) Inc. since June 2006. He joined ASE GroupInc. in June 2000. Mr. Hsu holds a master’s degree in mechanical engineering from Case Western Reserve University.
Meng-Hui Lin has served as General Manager of ASE (Shanghai) Inc. since Oct 2014. He joined ASE Group in 1994, and has worked in various fields with ASE Group, e.g., IE, quality engineering, process engineering, research & development and manufacturing management. He holds a master’s degree in industrial engineering from Texas A&M University.
Kwai Mun Lee has served as Presidentpresident of our Southeast Asia operations, with responsibility for the operations of our Penang, Malaysia and Singapore manufacturing facilities, since March 2006. Before joining the ASE Group,Inc., Mr. Lee held senior management positions at Chartered Semiconductor and STATS ChipPAC. He started his career as an engineer at Intel. He holds a degree in engineering from the Swinburne Institute of Technology in Australia.
Yean Peng Chen has served as general manager of ASE Singapore Pte. Ltd. since January 2019. He has also worked in ISE Labs before being appointed as vice president of operations in ASE Singapore in July 2015. He started his career as an equipment engineer at STATSChipPAC Ltd. Mr. Chen holds a diploma in electronic and computer engineering from Ngee Ann Polytechnic in Singapore.
Lid Jian Chiou has served as General Managerwas general manager of ASE Singapore Pte. Ltd. sincefrom September 2010 to December 2018 and retired in December 2018 after serving as Senior Directorsenior director of Operationsoperations since November 2003. Prior to that, he worked several years with Texas Instruments and Chartered Semiconductor. Mr. Chiou holds a master’s degree in business administration from the State University of New York and a bachelor’s degree in engineering from the University of Strathclydein the United Kingdom.Kingdom.
Heng Ee Ooi has served as general manager of ASE Malaysia since July 2016 after serving as vice president of operations since July 2015. He joined ASE Inc. in July 1994. Before joining ASE Inc., he worked as a process engineer at AMD, Penang. Mr. Ooi holds a bachelor’s degree in chemical engineering from Universiti Teknologi Malaysia.
90
Kenneth Hsiang has served as General Managergeneral manager of ISE Labs Inc. since June 2004. Prior to joining ASE GroupInc. in November 1999, Mr. Hsiang worked in management positions within finance and strategic analysis in the healthcare and biotech industries in the San Francisco Bay area in California. He also worked for Price Waterhouse LLP as a Certified Public Accountant. Mr. Hsiang received a bachelor’s degree in economics & rhetoric from the University of California, Berkeley.
Randy Hsiao-Yu Lo has served as general manager of Siliconware U.S.A., Inc. since January 2001. He has served as SPIL’s director since June 2011. He previously served as vice president of SPIL’s Advanced Package R&D division. He received a Ph.D. in chemical engineering from Purdue University.
M.S. Chang has served as general manager of Siliconware Technology (Suzhou) Limited since October 2015. He holds a master’s degree in industrial engineering and systems management from Feng Chia University in Taiwan.
Chen-Yen Wei has served as Chairman of Universal Scientific Industrial Co., Ltd. since July 2014 Chairman of USI Inc. since April 2015, and Presidentpresident of Universal Scientific Industrial (Shanghai) Co., Ltd. since April 2008. He joined Universal Scientific Industrial Co., Ltd. as an engineer in August 1979. He holds a bachelor’s degree in communication engineering from National Chiao Tung University in Taiwan.
Feng-Ta Chen has served as General Managergeneral manager of Universal Global Technology (Shanghai) Co., Ltd.UGJQ since September 2013. He joined Universal Scientific Industrial Co., Ltd.USI as a Wireless Product PLM Department head in July 1997. He holds a bachelor’s degree in literature from the Chinese Culture University in Taiwan.
Jack Hou has served as General Managergeneral manager of Universal Global Scientific Industrial Co., Ltd.UGTW since January 2010 and Vice Presidentvice president of Automotive & Visual Product Devices and Module Turnkey Management Business Unit of Universal Scientific Industrial Co., Ltd.USI since April 2012. He joined Universal Scientific Industrial Co., Ltd.USI as a section manager in February 1994. He holds a master’s degree in biomedical engineering from Ohio State University and a master’s degree in computer science from the University of Dayton in Ohio.
Ta-I Lin has served as General Managergeneral manager of Universal Global Technology (Kunshan) Co. Ltd.UGKS since August 2011. He joined Universal Scientific Industrial Co., Ltd.USI as an engineer in August 1987. He holds a bachelor’s degree in electrical engineering from National Cheng Kung University in Taiwan and an executive master of business administration from Peking University in China.
Yueh-Ming Lin has served as General Managergeneral manager of USI Electronics (Shenzhen) Co. Ltd.USISZ since January 2015 and Senior Directorvice president of Global Operation Management (Shenzhen) Division of USI Electronics (Shenzhen) Co. Ltd.USISZ since March 2014.February 2017. He joined Universal Scientific Industrial Co., Ltd.USI as a section manager in October 1995. He holds a bachelor’s degree in electrical engineering from Feng Chia University in Taiwan.
Omar Anaya Galván has served as General Managergeneral manager of Universal Scientific Industrial DeUSI Mexico S.A. DE C.V. since March 2015. He has worked in the electronics industry for over 2427 years and has experience in various technical, quality and manufacturing management roles. He has been working at Universal Scientific Industrial(Shanghai) Co., Ltd. Shanghai and its directly and indirectly held subsidiaries since March 2003. He holds a bachelor’s degree in electronic systems engineering from the Monterrey Institute of Technology and Higher Education in Mexico.
80
The business address of our directors and executive officers is our registered office.
In 2015,2018, we recorded expenses of approximately NT$833.91,054.2 million (US$25.434.4 million) as remuneration to our directors and executive officers. We did not pay any remuneration in kind to our directors or executive officers in 2015. In 2015,2018, we accrued pension costs of NT$2.311.1 million (US$0.10.4 million) for retirement benefits for our management. In April 2016,According to our boardArticles of directors passed a resolution and increasedIncorporation, the remuneration of our independent directors from NT$2.0 million (US$0.06 million) tois set at NT$3.0 million (US$0.090.1 million) per person per year. This proposal is subjectWe set aside 0.01% to the approval of our annual general shareholders’ meeting in June 2016. In addition, according to our Articles of Incorporation, not more than 1% of our annual net earnings (after recovering any losses incurred in prior years and deducting the legal reserve, special reserve provisions and other items as required under ROC law, if any) may be distributed as bonuses to our directors. 7% to 11% of our annual net earnings (after recovering any losses incurred in prior years and deducting the legal reserve, special reserve provisions and other items as required under ROC law, if any) may be distributed as a bonus to employees, including executive officers. In January 2016, our board of directors proposed to amend our Articles of Incorporation to distribute employees’ compensation, including executive officers, and remuneration to directors at the rates in 5.25%-8.25% and no higher than 0.75%, respectively,1.00% of net profit before income tax, employees’ compensation and remuneration to directors. This proposal is subjectthe directors as employees’ compensation and no more than 0.75% as remuneration to the approvaldirectors. On March 28, 2019, our board of our annual general shareholders’ meetingdirectors approved the remuneration to directors in June 2016.the amount of NT$34.1 million (US$1.1 million) in cash. The difference between the actual amount of remuneration to directors paid and the amount recognized in the consolidated financial statements for the year ended December 31, 2018 was not material.
91
We have not provided any loans to or guarantees for the benefit of any of our directors or executive officers. For information regarding our pension and other retirement plans and those of our subsidiaries, see note 2024 to our consolidated financial statements included in this annual report.
ASE Inc.ASEH Employee BonusCompensation and Stock Option Plans
We award bonuses to employees of ASE Inc.ASEH and its subsidiaries who are located in Taiwan based on overall income and individual performance targets. Prior to 2009, these employees were eligible to receive bonuses in the form of our common shares valued at par. Beginning in 2009, employeesEmployees are eligible to receive bonuses in the form of our common shares valued at the closing price (after adjustment with consideration of the effects on the share price, if any, brought by cash and stock dividends resolved at shareholders’ meetings) of our common shares on the day prior to our shareholders’ meeting. Actual amounts of bonusescompensation to individual employees are determined based upon the employee meeting specified individual performance objectives. We granted aggregate values of NT$1,147.245.4 million NT$1,587.3 million and NT$2,335.6 million (US$71.21.5 million) as cash bonus to our employees for the period from April 30, 2018 through December 31, 2018. On March 28, 2019, our board of directors approved the employees’ compensation in 2013, 2014the amount of NT$45.4 million (US$1.5 million) in cash. The difference between the actual amount of employees’ compensation and the amount recognized in the consolidated financial statements for the year ended December 31, 2018 was not material.
ASE maintained 2010 and 2015 respectively.
Weemployee stock option plans before the SPIL Acquisition. ASEH assumed ASE’s obligations of share options which were granted before entering into and executing the Joint Share Exchange Agreement on April 30, 2018. In August 2018, our board of directors and FSC both approved the first ASEH employee share option plan, under which 131,862,500 options were granted in November 2018. The total number of options registered under this option plan is 150,000,000 options. As a result, ASEH currently maintainmaintains three employee stock option plans, adopted in 2007, 2010, 2015 and 2015.2018. The option plan adopted in 2004 and 2007 expired in May 2015.2015 and December 2017, respectively. Pursuant to these plans, our full-time employees, including domestic and foreign subsidiaries, are eligible to receive stock option grants. Each option entitles the holder to purchase one ASE Inc.ASEH common share at a price equal to (for the 2007 plan), or not less than (for the 2010 and 2015 plans), the closing market price on the date of the option issuance, such exercise price being subject to retroactive adjustment in the event of certain capital transactions in subsequent periods. Each option is valid for ten years from the date of the grant. 40.0% of the options originally granted vest upon the second anniversary of the grant date, and an additional 10.0% of the options originally granted vest every six months thereafter. Each option expires at the end of the tenth year following its grant date. The options are generally not transferable. As of December 31, 2015,2018, a total of 185,806,00020,320,850 options had been assumed under the 2010 plan, 17,504,350 of which had an exercise price of NT$40.8 per share and 2,816,500 of which has an exercise price of NT$45.2 per share. As of December 31, 2018, a total of 36,535,000 options had been assumed with an exercise price of NT$73.0 per share under the 2015 plan. As of December 31, 2018, a total of 131,862,500 options had been granted under the 2007 plan. The original exercise price under the 2007 plan was NT$30.65 per share (currently adjusted to NT$21.1 per share). As of December 31, 2015, a total of 199,999,500 options had been granted under the 2010 plan, 187,719,500 of which hadwith an original exercise price of NT$28.656.4 per share (currently adjusted to NT$20.4 per share) and 12,280,000 of which had an original exercise price of NT$28.75 per share (currently adjusted to NT$22.6 per share). As of December 31, 2015, a total of 94,270,000 options had been granted under the 20152018 plan. The exercise price under the 2015 plan was NT$36.50 per share.
81
ASE Mauritius Inc. Share Option Plan
As of December 31, 2015, ASE Mauritius Inc. maintained one option plan adopted in 2007. Under this plan, certain employees of ASE Mauritius Inc. and the ASE GroupCompany are granted options to purchase ordinary shares of ASE Mauritius Inc. at an exercise price of US$1.7,1.70, which exercise price was determined by taking into account a fairness opinion rendered by an independent appraiser and was reviewed by our accountants. Each option is valid for ten years from the date of the grant. As of December 31, 2015, a total ofAll 30,000,000 options had been granted under this plan with an exercise price of US$1.7.expired in December 2017.
USI Enterprise Limited Share Option Plans
As of December 31, 2018, USI Enterprise Limited maintainsmaintained three option plans adopted in 2007, 2010 and 2011, under which certain employees of Universal Scientific Industrial and our employees were granted options to purchase common shares of USI Enterprise Limited. Each option under these three plans is valid for ten to thirteen years from the date of the grant. As of December 31, 2015,2018, we had 14,028,0008,685,600 options outstanding with an exercise price of US$1.53 per share, 7,651,4202,008,600 options outstanding with an exercise price of US$2.42 per share and 8,015,2006,016,560 options outstanding with an exercise price of US$2.94 per share under these three plans respectively.
Universal Scientific Industrial Shanghai Option Plans
As of December 31, 2015,2018, Universal Scientific Industrial Shanghai maintainsmaintained one option plan adopted in 2015. Under this plan, certain employees of Universal Scientific Industrial Shanghai are granted options to purchase ordinary shares of Universal Scientific Industrial Shanghai at an exercise price of RMB15.5.RMB15.5 per share. Each option is valid for ten years from the date of the grant. As of December 31, 2015, a total of 26,639,5002018, we had 21,536,950 options had been grantedoutstanding under this plan with an exercise price of RMB15.5.RMB15.5 per share.
92
General
For a discussion of the term of office of the board of directors, see “—Directors and Senior Management.” No benefits are payable to members of the board or the executive officers upon termination of their relationship with us.
Compensation Committee
For a discussion of our compensation committee, see “—Directors and Senior Management—Directors.”
The following table sets forth certain information concerning our employees as of the dates indicated.
| As of December 31, | As of December 31, | |||||||||||||||||||||||
| 2013 | 2014 | 2015 | 2016 | 2017 | 2018 | |||||||||||||||||||
| Total | 60,199 | 68,100 | 65,789 | 66,711 | 68,753 | 93,891 | ||||||||||||||||||
| Function | ||||||||||||||||||||||||
| Direct labor | 33,794 | 38,588 | 35,770 | 36,574 | 38,362 | 50,877 | ||||||||||||||||||
| Indirect labor (manufacturing) | 14,518 | 16,620 | 16,910 | 16,724 | 16,971 | 25,002 | ||||||||||||||||||
| Indirect labor (administration) | 5,580 | 5,941 | 5,929 | 5,927 | 5,850 | 7,729 | ||||||||||||||||||
| Research and development | 6,307 | 6,951 | 7,180 | 7,486 | 7,570 | 10,283 | ||||||||||||||||||
| Location | ||||||||||||||||||||||||
| Taiwan | 30,552 | 35,382 | 34,877 | 35,763 | 35,828 | 55,679 | ||||||||||||||||||
| PRC | 21,360 | 24,223 | 22,475 | |||||||||||||||||||||
| P.R.C. | 22,369 | 24,005 | 28,123 | |||||||||||||||||||||
| Korea | 2,964 | 2,900 | 2,701 | 2,662 | 2,558 | 2,429 | ||||||||||||||||||
| Malaysia | 2,672 | 2,752 | 2,982 | 3,230 | 3,680 | 3,867 | ||||||||||||||||||
| Japan | 693 | 588 | 502 | 490 | 429 | 340 | ||||||||||||||||||
| Singapore | 1,068 | 1,059 | 986 | 869 | 852 | 887 | ||||||||||||||||||
| United States | 376 | 383 | 379 | 392 | 384 | 426 | ||||||||||||||||||
| Others | 514 | 813 | 887 | 936 | 1,017 | 2,140 | ||||||||||||||||||
82
Eligible employees may participate in our employee share bonus plan and stock option plans and our subsidiaries’ share option plans, such as the option plans adopted by ASE Mauritius,ASEH, USI Enterprise Limited, and Universal Scientific Industrial Shanghai. See “—Compensation.”
We have never experienced a work stoppage caused by our employees. We believe that our relationship with our employees is good.
The following table sets forth certain information with respect to our common shares and options of ASE Inc.ASEH exercisable for our common shares held by our directors and executive officers as of MarchJanuary 31, 2016.2019. Percentage of beneficial ownership is based on 7,918,272,8964,322,321,982 common shares outstanding as of MarchJanuary 31, 2016.2019.
| Director or Executive Officer | Number of ASE Inc. Common Shares Beneficially Held(1) | Percentage of ASE Inc. Total Common Shares Issued and Outstanding | Number of Options Exercisable(2) | Exercise Price of Options (NT$) | Expiration Date of Options | |||||||||||
| Jason C.S. Chang | 1,743,979,181 | (3) | 22.02 | % | 16,300,000 | 20.40-21.10 | 2017/12/19 - 2020/5/6 | |||||||||
| Richard H. P. Chang | 226,144,287 | 2.86 | % | 9,050,000 | 20.40-21.10 | 2017/12/19 - 2020/5/6 | ||||||||||
| Rutherford Chang | 1,779,708 | * | * | 20.40-21.10 | 2017/12/19 - 2020/5/6 | |||||||||||
| Tien Wu | 4,953,386 | * | * | 20.4 | 5/6/2020 | |||||||||||
| Joseph Tung | 4,226,823 | * | * | 20.40-21.10 | 2017/12/19 - 2020/5/6 | |||||||||||
| Raymond Lo | 2,566,825 | * | * | 20.40-21.10 | 2017/12/19 - 2020/5/6 | |||||||||||
| Tien-Szu Chen | 592,054 | * | * | 20.40-21.10 | 2017/12/19 - 2020/5/6 | |||||||||||
| Jeffrey Chen | 1,044,802 | * | * | 20.40-21.10 | 2017/12/19 - 2020/5/6 | |||||||||||
| Shen-Fu Yu | 4,632 | * | 0 | - | - | |||||||||||
| Ta-Lin Hsu | 0 | 0 | 0 | - | - | |||||||||||
| Mei-Yueh Ho | 0 | 0 | 0 | - | - | |||||||||||
| Chun-Che Lee | 2,944,502 | * | * | 20.40-21.10 | 2017/12/19 - 2020/5/6 | |||||||||||
| Ung Bae | 0 | 0 | * | 20.40-21.10 | 2017/12/19 - 2020/5/6 | |||||||||||
| Chih-Hsiao Chung | 10,647 | * | * | 20.40-21.10 | 2017/12/19 - 2020/5/6 | |||||||||||
| Chiu-Ming Cheng | 387,698 | * | * | 20.40-21.10 | 2017/12/19 - 2020/5/6 | |||||||||||
| Chih-An Hsu | 0 | 0 | * | 20.4 | 5/6/2020 | |||||||||||
| Yen-Chieh Tsao | 0 | 0 | 0 | 36.5 | 9/10/2025 | |||||||||||
| Shih-Kang Hsu | 214,688 | * | * | 20.4 | 2020/5/6 | |||||||||||
| Meng-Hui Lin | 271,523 | * | * | 20.40-21.10 | 2017/12/19 - 2020/5/6 | |||||||||||
| Kwai Mun Lee | 0 | 0 | * | 20.40-21.10 | 2017/12/19 - 2020/5/6 | |||||||||||
| Lid Jian Chiou | 0 | 0 | * | 20.40-21.10 | 2017/12/19 - 2020/5/6 | |||||||||||
| Kenneth Hsiang | 155,000 | * | * | 20.40-21.10 | 2017/12/19 - 2020/5/6 | |||||||||||
| Chen-Yen Wei | 710,053 | * | 0 | - | - | |||||||||||
| Feng-Ta Chen | 0 | 0 | 0 | - | - | |||||||||||
| Jack Hou | 107,558 | * | 0 | - | - | |||||||||||
| Ta-I Lin | 30,000 | * | 0 | - | - | |||||||||||
| Yueh-Ming Lin | 0 | 0 | 0 | - | - | |||||||||||
| Omar Anaya Galvan | 0 | 0 | 0 | - | - | |||||||||||
8393
| Director or Executive Officer | Number of ASEH Common Shares Beneficially Held(1) | Percentage of ASEH Total Common Shares Issued and Outstanding | Number of Options Exercisable(2) | Exercise Price of Options (NT$) | Expiration Date of Options | |
| Jason C.S. Chang | 949,352,706(3) | 21.96% | 0 | - | - | |
| Richard H. P. Chang | 124,175,228 | 2.87% | 0 | - | - | |
| Bough Lin | 6,238,000 | * | 0 | - | - | |
| Chi-Wen Tsai | 12,200,000 | * | 0 | - | - | |
| Tien Wu | 3,877,473 | * | 0 | - | - | |
| Joseph Tung | 2,740,411 | * | 0 | - | - | |
| Raymond Lo | 1,783,430 | * | * | 40.8 | 2020/5/6 | |
| Tien-Szu Chen | 1,181,821 | * | 0 | - | - | |
| Jeffrey Chen | 1,083,000 | * | 0 | - | - | |
| Rutherford Chang | 1,577,647 | * | 0 | - | - | |
| Shen-Fu Yu | 2,388 | * | 0 | - | - | |
| Ta-Lin Hsu | 0 | 0.00% | 0 | - | - | |
| Mei-Yueh Ho | 0 | 0.00% | 0 | - | - | |
| Du-Tsuen Uang | 50,000 | * | 0 | - | - | |
| Chun-Che Lee | 2,072,251 | * | * | 40.8 | 2020/5/6 | |
| Chung Lin | 87,278 | * | 0 | - | - | |
| Songwoon Kim | 0 | 0.00% | 0 | - | - | |
| Chih-Hsiao Chung | 190,489 | * | * | 40.8 | 2020/5/6 | |
| Chiu-Ming Cheng | 514,310 | * | 0 | - | - | |
| Yen-Chieh Tsao | 0 | 0.00% | * | 73 | 2025/9/10 | |
| Shih-Kang Hsu | 165,000 | * | 0 | - | - | |
| Kwai Mun Lee | 0 | 0.00% | 0 | - | - | |
| Yean Peng Chen | 0 | 0.00% | 0 | - | - | |
| Heng Ee Ooi | 0 | 0.00% | 0 | - | - | |
| Kenneth Hsiang | 245,000 | * | * | 40.8 | 2020/5/6 | |
| Randy Hsiao-Yu Lo | 0 | 0.00% | 0 | - | - | |
| M.S. Chang | 15,000 | * | 0 | - | - | |
| Chen-Yen Wei | 366,115 | * | 0 | - | - | |
| Feng-Ta Chen | 0 | 0.00% | 0 | - | - | |
| Jack Hou | 50,458 | * | 0 | - | - | |
| Ta-I Lin | 5,000 | * | 0 | - | - | |
| Yueh-Ming Lin | 25,000 | * | 0 | - | - | |
| Omar Anaya Galvan | 0 | 0.00% | 0 | - | - |
___________________
| (1) | Including shares directly held and shares beneficially owned through spouse and minor children. |
| (2) | Each option may be converted into one of our common shares. The figures referred herein include options convertible into our common shares scheduled to vest within 60 days as of the date hereof. |
| (3) | Including |
* The sum of the number of common shares held and the number of common shares issuable upon exercise of all options held is less than 1.0% of our total outstanding shares.
94
Item 7. Major Shareholders and Related Party Transactions
The following table sets forth information known to us with respect to the beneficial ownership of our common shares, as of MarchJanuary 31, 2016,2019, by each shareholder known by us to beneficially own more than 5.0% of our total outstanding shares.
Beneficial ownership is determined in accordance with the rules and regulations of the SEC. Percentage of beneficial ownership is based on 7,918,272,8964,322,321,982 common shares outstanding as of MarchJanuary 31, 2016.2019. In addition, in computing the number of shares beneficially owned by a person and the percentage ownership of that person, we have included shares that the person has the right to acquire within 60 days, including through the exercise of any option, warrant or other right or the conversion of any other security. These shares, however, are not included in the computation of the percentage ownership of any other person.
| Common Shares Beneficially Owned | Common Shares Beneficially Owned | |||||||||||||||
| Name of Shareholder or Group | Number | Percentage | Number | Percentage | ||||||||||||
| Jason C.S. Chang(1) | 1,760,279,181 | 22.18 | % | 949,352,706 | 21.96 | % | ||||||||||
________________
| (1) | Jason C.S. Chang is our Chairman and |
The following table sets forth information relating to our common shares held directly by our consolidated subsidiaries and our equity method investee as of MarchJanuary 31, 2016.2019.
| Common Shares Beneficially Owned | ||||||||
| Name of Shareholder | Number | Percentage | ||||||
| ASE Test(1) | 88,200,472 | 1.11 | % | |||||
| ASE Test Taiwan(2) | 10,978,776 | 0.14 | % | |||||
| J&R Holding Limited(3) | 46,703,763 | 0.59 | % | |||||
| Hung Ching(4) | 85,588,293 | 1.08 | % | |||||
| Common Shares Beneficially Owned | ||||||||
| Name of Shareholder | Number | Percentage | ||||||
| ASE Test(1) | 44,100,236 | 1.02 | % | |||||
| ASE Test Taiwan(2) | 5,489,388 | 0.13 | % | |||||
| J&R Holding Limited(3) | 23,351,881 | 0.54 | % | |||||
| Hung Ching(4) | 44,130,751 | 1.02 | % | |||||
84
(1) | ASE Test is our wholly owned subsidiary. ASE Test’s ownership of our common shares is the result of the merger of ASE Chung Li with and into us in August 2004, and subsequent dividends upon shares received in connection with this merger. In order to comply with Singapore Companies Act, a trust was established to hold and dispose our common shares issued to ASE Test, a Singaporean Company, upon completion of the merger. The trustee appointed under such trust arrangement is currently |
| (2) | ASE Test Taiwan is our wholly owned subsidiary. ASE Test Taiwan’s ownership of our common shares is mainly the result of the merger of ASE Material with and into us in August 2004, and subsequent dividends upon shares received in connection with this merger. In order to comply with Singapore Companies Act, a trust had been established to hold and dispose our common shares issued to ASE Test Taiwan, which had been a subsidiary of ASE Test, upon completion of the merger. In December 2014, the trust established to hold the common shares issued to ASE Test Taiwan had been terminated because ASE Test Taiwan was no longer a subsidiary owned by ASE Test and therefore no longer subject to Singapore Companies Act requirements. As a result, ASE Test Taiwan directly owned |
95
| (3) | J&R Holding Limited is our wholly owned subsidiary. J&R Holding Limited’s ownership of our common shares is the result of the merger of ASE Chung Li with and into us in August 2004, and subsequent dividends upon shares received in connection with this merger. |
| (4) | Hung Ching is our equity method investee. As of |
As of MarchJanuary 31, 2016,2019, none of our major shareholders had voting rights different from those of our other shareholders. We are not aware of any arrangement that may at a subsequent date result in a change of control of us. Furthermore, other than disclosed above, we are not aware of any significant changes in the percentage of ownership held by our major shareholders in 2013, 20142016, 2017 and 2015.2018.
As of MarchJanuary 31, 2016,2019, a total of 7,918,272,8964,322,321,982 common shares were outstanding. With certain limited exceptions, holders of common shares that are not ROCR.O.C. persons are required to hold their common shares through a brokerage account in the ROC.R.O.C. As of MarchJanuary 31, 2016, 628,336,4852019, 285,024,122 common shares were registered in the name of a nominee of Citibank, N.A., the depositary under our ADS deposit agreement. Citibank, N.A., has advised us that, as of MarchJanuary 31, 2016, 125,667,0062019, 142,511,705 ADSs, representing 628,335,030285,023,410 common shares, were held of record by Cede & Co., and 290354 ADSs, representing 1,450708 common shares, were held by 95 other U.S. persons. The remaining 54 common shares held by Citibank, N.A. for the Company are a result of fractional shares distributed during stock distributions on our common shares underlying the ADSs.
In recent years, we have awarded cash bonuses to the employees of our subsidiaries as part of their compensation, based in part on our consolidated net income and the subsidiaries’ contribution to our consolidated income. We expect to continue this practice in the future.
In order to comply with Singapore law and other applicable laws and regulations, trusts organized under ROCR.O.C. law were established to hold and dispose of our common shares issued to ASE Test and ASE Test Taiwan in connection with the merger of ASE Chung Li and ASE Material into our company in August 2004. Under Section 76(1)(b)(ii) of Singapore’s Companies Act, Chapter 50, ASE Test, a Singapore company, may not purport to acquire, directly or indirectly, shares or units of shares in our company, ASE Test’s parent company. Pursuant to the applicable trust agreements, the trustee under each trust is (1) the registered owner of our common shares, (2) authorized to exercise all of the rights as a shareholder of our common shares, (3) authorized to sell our common shares, subject to market conditions, when such common shares become available for resale under ROCR.O.C. law and in accordance with volume limitations under ROCR.O.C. law, at its sole discretion; provided such common shares are sold (i) in compliance with ROCR.O.C. laws and regulations, (ii) in an orderly manner in order to minimize the impact on the trading price of our common shares, and (iii) in a manner consistent with its fiduciary duties owed to ASE Test and (4) able to transfer and deliver to ASE Test or ASE Test Taiwan the proceeds from the sale of our common shares and any cash dividends distributed, as the case may be. In February 2010, to complete the tender offer to acquire Universal Scientific Industrial, ASE Test transferred 141,808,499 shares to the shareholders of Universal Scientific.Scientific Industrial. Neither ASE Test nor ASE Test Taiwan have any rights with respect to our common shares held in trust pursuant to the applicable trust agreements other than the right to receive the proceeds from the sale of such common shares and cash dividends declared while the shares remain in trust. In December 2014, the trust established to hold the common shares issued to ASE Test Taiwan had been terminated because ASE Test Taiwan was no longer a subsidiary owned by ASE Test and therefore no longer subject to Singapore Companies Act requirements. As a result, ASE Test Taiwan directly owned 10,978,7765,489,388 of our common shares as of MarchJanuary 31, 20162019 and the trust established to hold the common shares issued to ASE Test held 88,200,47244,100,236 of our common shares.
85
We have historically provided promissory notes as guarantees to some of our subsidiaries. As of December 31, 2015, we endorsed and guaranteed the bonds issued by our subsidiaries, Anstock Limited, in the amount of RMB521.1 million (US$80.4 million) and Anstock II Limited, in the amount of US$312.8 million, respectively. Other than such guarantee, we have no other contingent obligations.
In December 2013, we acquired the K21 factory-administration building in Nantze Export Processing Zone, Taiwan, from Hung Ching for a consideration of NT$1,473.9 million.
In July 2014, we acquired factory-administration building in Chung Li, Taiwan, from Hung Ching for a consideration of NT$4,540.1 million.
In 2014, a series of construction projects for which we contracted with Fu Hwa Construction Co., Ltd. for the construction of buildings with green design concept and other projects in Nantze Export Processing Zone, Taiwan, have been completed with a total consideration of NT$350.0 million.
In August 2014, we made the donation of NT$15.0 million to Social Affairs Bureau of Kaohsiung City Government through ASE Cultural and Educational Foundation. In addition, in order to demonstrate our commitment to environmental protection, in December 2013, our board of directors approved contributions to environmental protection efforts in Taiwan in a total amount of not less than NT$3,000.0 million, to be made in the next 30 years. For the years ended December 31, 20142016, 2017 and 2015,2018, we have made contributions in the amount of NT$100.0 million (US$3.03.3 million) each, respectively, through ASE Cultural and Educational Foundation to fund various environmental projects and our board of directors have resolved in a resolution in January 2016February 2019 to contribute NT$100.0 million (US$3.03.3 million) through ASE Cultural and Educational Foundation in environmental projects in 2016.2019.
96
In June 2015, we acquired the K22 and K23 factory-administration building in Nantze Export Processing Zone, Taiwan, from Hung Ching for a consideration of NT$2,466.0 million (US$75.2 million).million.
In 2015 and 2016, we have capitalized NT$504.6 million (US$15.4 million)and NT$875.0 million, respectively, for the construction of foreign workeremployee dormitory for which we contracted with Fu Hwa Construction Co., Ltd. in Kaohsiung, Taiwan.
In 2016, we acquired patents and acquired specific technology from Deca Technologies Inc. for a consideration of NT$403.5 million.
In February 2018, our subsidiary, USI Enterprise Limited, repurchased its own 1,283,270 ordinary shares from our key management personnel for a consideration of approximately NT$653.2 million (US$21.3 million).
INTERESTS OF EXPERTS AND COUNSEL
Not applicable.
CONSOLIDATED STATEMENTS AND OTHER FINANCIAL INFORMATION
Consolidated financial statements are set forth under “Item 18. Financial Statements.”
Export Sales
We categorize our revenues geographically based on the country in which the customer is headquartered. Revenues from our export sales were NT$188,585.3236,015.4 million, NT$219,843.7255,027.6 million and NT$250,671.4325,462.5 million (US$7,644.810,632.6 million) in 2013, 20142016, 2017 and 2015,2018, respectively, which contributed 85.8%85.9%, 85.7%87.8% and 88.5%87.7% of our total sales volume for those periods, respectively. See “Item 4. Information on the Company—Business Overview—Sales and Marketing” for information on our export sales.
Legal Proceedings
K7 Plant Wastewater Discharge
InOn December 20, 2013, the Kaohsiung City Environmental Protection Bureau orderedimposed a fine of NT$102.0 million (the “Administrative Fine”) upon us to suspend the operations at our K7 Plant’s wafer-level process where nickel was used for alleged wastewater discharge violations and imposed a NT$110.1 million fine against us. The NT$110.1 million fineof the Water Pollution Control Act. We filed an administrative appeal to nullify the Administrative Fine, which however, was later reduced to NT$109.4 million as ordereddismissed by the Kaohsiung City Environmental Protection Bureau.Government. In DecemberAugust 2014, the Kaohsiung City Environmental Protection Bureau lifted the suspension order and approved the full resumption of operations of our K7 Plant after ordering a series of examinations, hearings and trial runs. In September 2015, the fine was reduced to NT$102.0 million (US$3.1 million) by the Kaohsiung City Environmental Protection Bureau and we received a refund of NT$7.3 million (US$0.2 million) in October 2015.
86
With respect to the NT$102.0 million (US$3.1 million) administrative penalty imposed on us by the Kaohsiung City Environmental Protection Bureau, we appealed to the Kaohsiung High Administrative Court in August 2014 seeking to (i) revoke Kaohsiung City Government’s decision, (ii) lift the administrative penalty imposed on us and (iii) demand a refund of the administrative penalty.Administrative Fine. On March 22, 2016, the Kaohsiung High Administrative Court revoked Kaohsiung City Government’s decision and lifted the administrative penalty. Our demand for a refund of the fineAdministrative Fine was dismissed. We appealed to the Supreme Administrative Court on April 14, 2016 against the Kaohsiung High Administrative Court’s unfavorable ruling in dismissing a refund. The outcome ofOn June 8, 2017, the proceeding cannot be predicted with certainty.
In connection withSupreme Administrative Court overturned Kaohsiung High Administrative Court’s decision and ordered Kaohsiung Environmental Protection Bureau to refund the same alleged violations at our K7 plant, in October 2014, the Kaohsiung District Court ruled that we were in violation of the ROC Waste Disposal Act and imposed on us a criminal penalty of NT$3.0 million. We appealed the case to the Taiwan High Court Kaohsiung District Branch in November 2014. In September 2015, the Taiwan High Court Kaohsiung District Branch overturned the decision madeAdministrative Fine paid by Kaohsiung District Court and found the Company not guilty and repealed the criminal penalty imposed on the Company. The verdict was final and not appealable.us.
Any penalties, fines, damages or settlements made in connection with these criminal, civil, and/or administrative investigations and/or lawsuits may havedivert management’s attention and resources, which may cause a material adverse effect on our business, results of operations, financial condition and future prospects.business. We are also unable to quantify the harm to our reputation should any adverse findings be made against us. See “Item 3. Key Information—Risk Factors—Risks Relating to Our Business—Any environmental claims or failure to comply with any present or future environmental regulations, as well as any fire or other industrial accident, may require us to spend additional funds and may materially and adversely affect our financial condition and results of operations,” “Item 4. Information on the Company—Business Overview—Environmental Matters” and “Item 4. Information on the Company—Property, Plants and Equipment.”
SPIL Litigation Against ASE97
On October 15, 2015, in connection with the Initial SPIL Tender Offer, SPIL filed a lawsuit in the Kaohsiung District Court against ASE requesting that the court invalidate the Initial SPIL Tender Offer and confirm that ASE does not have the right to be registered as a shareholderTable of SPIL. The lawsuit alleged that the Initial SPIL Tender Offer violate certain provisions of the ROC Securities and Exchange Act and certain provisions of the ROC Fair Trade Act and because of these violations the Initial SPIL Tender Offer should be voided. Following a series of pleadings and arguments on the amount of verdict fee that SPIL has to post before the case could be heard, the Kaohsiung District Court ordered SPIL to post a verdict fee in the amount of NT$219.2 million (US$6.7 million) and scheduled a hearing on April 29, 2016. SPIL appealed the Kaohsiung District Court’s decision on the verdict fee to the Kaohsiung High Court, and, following the Kaohsiung High Court’s decision to sustain the Kaohsiung District Court’s decision on the amount of the verdict fee, SPIL appealed to the Supreme Court of Taiwan on January 18, 2016. As of the date of this annual report, the Supreme Court has not ruled on whether to uphold or dismiss the Kaohsiung High Court’s decision on the verdict fee.Contents
The outcome of these proceedings is uncertain. If a dismissal is not granted or a settlement is not reached, such a lawsuit could result in substantial costs to ASE and divert management’s attention and resources which may cause a material adverse effect on our results of operations, financial condition and business. We are also unable to quantify the harm to our reputation should any adverse findings be made against us. If our interest in SPIL from the Initial Tender Offer is voided by ROC courts, we may not realize the anticipated synergies, cost savings and growth opportunities and the anticipated synergies and cost-saving benefits that would otherwise have resulted from our acquisition of 779,000,000 common shares of SPIL.
Dividends and Dividend Policy
We have historically paid dividends on our common shares with respect to the results of the preceding year following approval by our shareholders at the annual general meeting of shareholders. We have paid annual dividends on our common shares since 1989, except in 2002 and 2006 when we did not pay any dividend due to the losses we incurred in the 2001 and 2005 fiscal years, respectively. On April 1, 2016,March 28, 2019, our board of directors adopted resolutions to pay cash dividends of NT$1.62.50 per share based on 7,797,986,8964,322,581,482 shares, which equal toequals the number of issued shares shown in the shareholders’ roster as of March 23, 201619, 2019 minus the number of shares repurchased by us as treasury stocks. This proposal is subject to shareholders’ approval at the annual general shareholders meeting in June 20162019 and the actual cash dividends per share willmay be adjusted by any fluctuations in the number of our shares due to for example,factors such as the exercise of share options.
87
The following table sets forth the stock dividends paid during each of the years indicated and related information.
| Cash Dividends Per Common Share | Stock Dividends Per Common Share(1) | Total Common Shares Issued as Stock Dividends | Outstanding Common | Percentage of Outstanding Common Shares Represented by Stock Dividends | ||||||||||||||||
| NT$ | NT$ | |||||||||||||||||||
| 2008 | 1.71 | 0.29 | 158,766,146 | 5,484,848,118 | 2.9 | % | ||||||||||||||
| 2009 | 0.50 | – | – | 5,474,320,814 | – | |||||||||||||||
| 2010 | 0.36 | 1.00 | 549,497,078 | 5,500,216,994 | 10.0 | % | ||||||||||||||
| 2011 | 0.65 | 1.15 | 695,735,660 | 6,055,261,112 | 11.5 | % | ||||||||||||||
| 2012 | 0.65 | 1.40 | 931,599,554 | 6,659,893,672 | 14.0 | % | ||||||||||||||
| 2013 | 1.05 | – | – | 7,611,579,786 | – | |||||||||||||||
| 2014 | 1.29 | (3) | – | – | 7,847,817,646 | – | ||||||||||||||
| 2015 | 2.00 | – | – | 7,900,130,996 | – | |||||||||||||||
| Cash Dividends Per Common Share | Stock Dividends Per Common Share(1) | Total Common Shares Issued as Stock Dividends | Outstanding Common Shares on Record Date(2) | Percentage of Outstanding Common Shares Represented by Stock Dividends | ||||||||||||||||||
| NT$ | NT$ | |||||||||||||||||||||
| 2011 | 0.65 | 1.15 | 695,735,660 | 6,055,261,112 | 11.5 | % | ||||||||||||||||
| 2012 | 0.65 | 1.40 | 931,599,554 | 6,659,893,672 | 14.0 | % | ||||||||||||||||
| 2013 | 1.05 | - | - | 7,611,579,786 | - | |||||||||||||||||
| 2014 | 1.29 | (3) | - | - | 7,847,817,646 | - | ||||||||||||||||
| 2015 | 2.00 | - | - | 7,900,130,996 | - | |||||||||||||||||
| 2016 | 1.60 | - | - | 7,931,725,946 | - | |||||||||||||||||
| 2017 | 1.40 | - | - | 8,405,972,044 | - | |||||||||||||||||
| 2018 | 2.50 | (4) | - | - | 4,319,674,282 | - | ||||||||||||||||
___________________
_____________________
| (1) | Stock dividends were paid out from retained earnings and capital surplus. Holders of common shares receive as a stock dividend the number of common shares equal to the NT dollar value per common share of the dividend declared multiplied by the number of common shares owned and divided by the par value of NT$10 per share. Fractional shares are not issued but are paid in cash. |
| (2) | Aggregate number of common shares outstanding on the record date applicable to the dividend payment. Includes common shares issued in the previous year under our employee bonus plan. |
| (3) | On June 26, 2014, our shareholders approved a cash dividend of NT$1.30 per share for 2013 earnings. On July 29, 2014, our board of directors resolved to adjust the cash dividend ratio to NT$1.29411842 because the number of outstanding common shares had changed as a result of the exercise of share options. |
| (4) | Cash dividend from capital surplus. ASEH, the continuing entity of ASE, was established on April 30, 2018 and as such has no retained earnings. In June 2018, to protect shareholder’s interest, we resolved to distribute cash from capital surplus that was assumed from ASE’s retained earnings and generated from the Share Exchange process. |
In order to meet the needs of our present and future capital expenditures, we anticipate paying both stock and cash dividends in the future. The form, frequency and amount of future cash or stock dividends on our common shares will depend upon our net income, cash flow, financial condition, shareholders’ requirement for cash inflow and other factors. According to our Articles of Incorporation, we have a general policy that cash dividend distribution should not be lower than 30% of the total dividend amount and the remainder be distributed as stock dividends. See “Item 10. Additional information––Articles of Incorporation––Dividends and Distributions.”
In general, we are not permitted to distribute dividends or make other distributions to shareholders for any year where we did not record net income or retained earnings (excluding reserves). The ROCR.O.C. Company Law also requires that 10% of annual net income (less outstanding taxes and prior years’ losses, if any) be set aside as a legal reserve until the accumulated legal reserve equals our paid-in capital. In addition, our Articles of Incorporation require that before a dividend is paid pro rata out of our annual net income:
8898
In January 2016, our board of directors proposed
According to amend our Articles of Incorporation, the remuneration of our independent directors is set at NT$3.0 million (US$0.1 million) per person per year. If our annual net income (after recovering any losses incurred in prior years and deducting the legal reserve and special reserve provisions, making the additions or deductions of the portion of retained earnings that belong to distribute employees’ compensationequity investment gains or losses that have been realized through other comprehensive income or losses measured at fair value and remunerationdeducting other items as required under R.O.C. law, if any) remains, a proposal for the distribution of such amount together with a part or all of the accumulated undistributed profits in the previous years shall be prepared by the board of directors and submit to directors at the rates in 5.25%-8.25% and no higher than 0.75%, respectively,shareholders’ meeting for resolution. In addition, we set aside 0.01% to 1.00% of net profit before income tax, employees’ compensation and remuneration to directors. The 5.25% portion isthe directors as employees’ compensation and no more than 0.75% as remuneration to be distributed to all employees in accordance with our employee compensation distribution rules, while any portion exceeding 5.25% is to be distributed in accordance with rules established by our board of directors to individual employees who have been recognized as having made special contributions to our company. Such employees include those of our subsidiaries. This proposal is awaiting shareholders’ approval in their annual general meeting in June 2016.the directors.
Holders of ADSs will be entitled to receive dividends, subject to the terms of the deposit agreement, to the same extent as the holders of our common shares. Cash dividends will be paid to the depositary in NT dollars and, except as otherwise provided in the deposit agreement, will be converted by the depositary into U.S. dollars and paid to holders of ADSs according to the terms of the deposit agreement. Stock dividends will be distributed to the depositary and, except as otherwise provided in the deposit agreement, will be distributed by the depositary, in the form of additional ADSs, to holders of ADSs according to the terms of the deposit agreement.
Holders of outstanding common shares on a dividend record date will be entitled to the full dividend declared without regard to any prior or subsequent transfer of common shares. Holders of outstanding ADSs are entitled to receive dividends, subject to the terms of the deposit agreement, to the same extent as the holders of outstanding common shares.
For information relating to ROCR.O.C. withholding taxes payable on dividends, see “Item 10. Additional Information—Taxation—ROCR.O.C. Taxation—Dividends.”
Other than as disclosed elsewhere in this annual report, we have not experienced any significant changes since the date of the annual financial statements.
Our common shares were first issued in March 1984 and have been listed on the Taiwan Stock ExchangeTWSE under the symbol “3711” since July 1989.April 30, 2018. The Taiwan Stock ExchangeTWSE is an auction market where the securities traded are priced according to supply and demand through announced bid and ask prices. As of MarchJanuary 31, 2016,2019, there were an aggregate of 7,918,272,8964,322,321,982 of our common shares outstanding. The following table sets forth, for the periods indicated, the high and low closing prices and the average daily volume of trading activity on the Taiwan Stock Exchange for our common shares and the high and low of the daily closing values of the Taiwan Stock Exchange Index. The closing price for our common shares on the Taiwan Stock Exchange on April 28, 2016 was NT$32.20 per share.
| Closing Price per Share | Adjusted Closing | Average Daily Trading Volume | Taiwan Stock Exchange Index | |||||||||||||||||||||||||
| High | Low | High | Low | (in thousands of shares) | High | Low | ||||||||||||||||||||||
| NT$ | NT$ | NT$ | NT$ | �� | ||||||||||||||||||||||||
| 2011 | 37.60 | 24.00 | 24.16 | 16.14 | 32,247 | 9,145.4 | 6,633.3 | |||||||||||||||||||||
| 2012 | 31.10 | 20.15 | 22.37 | 14.39 | 24,667 | 8,144.0 | 6,894.7 | |||||||||||||||||||||
| 2013 | 30.65 | 23.60 | 27.36 | 19.26 | 24,598 | 8,623.4 | 7,616.6 | |||||||||||||||||||||
| 2014 | 41.00 | 26.80 | 37.71 | 23.51 | 25,609 | 9,569.2 | 8,264.5 | |||||||||||||||||||||
| First Quarter | 33.80 | 26.80 | 30.51 | 23.51 | 28,492 | 8,849.3 | 8,264.5 | |||||||||||||||||||||
| Second Quarter | 39.00 | 32.90 | 35.71 | 29.61 | 22,238 | 9,393.1 | 8,774.1 | |||||||||||||||||||||
| Third Quarter | 41.00 | 35.40 | 37.71 | 32.16 | 25,959 | 9,569.2 | 8,960.8 | |||||||||||||||||||||
| Fourth Quarter | 39.10 | 34.40 | 37.10 | 32.40 | 25,991 | 9,307.3 | 8,512.9 | |||||||||||||||||||||
| 2015 | 47.75 | 30.00 | 45.75 | 30.00 | 28,467 | 9,973.1 | 7,410.3 | |||||||||||||||||||||
| First Quarter | 47.75 | 36.65 | 45.75 | 34.65 | 31,837 | 9,758.1 | 9,048.3 | |||||||||||||||||||||
| Second Quarter | 46.65 | 39.70 | 44.65 | 37.70 | 29,672 | 9,973.1 | 9,189.8 | |||||||||||||||||||||
| Third Quarter | 42.10 | 30.00 | 40.10 | 30.00 | 33,371 | 9,379.2 | 7,410.3 | |||||||||||||||||||||
| Fourth Quarter | 39.00 | 33.40 | 39.00 | 33.40 | 19,731 | 8,857.0 | 8,040.2 | |||||||||||||||||||||
| October | 39.00 | 34.50 | 39.00 | 34.50 | 23,239 | 8,745.4 | 8,295.9 | |||||||||||||||||||||
| November | 38.40 | 34.35 | 38.40 | 34.35 | 16,591 | 8,857.0 | 8,295.4 | |||||||||||||||||||||
| December | 38.50 | 33.40 | 38.50 | 33.40 | 19,394 | 8,463.3 | 8,040.2 | |||||||||||||||||||||
| 2016 | ||||||||||||||||||||||||||||
| First Quarter | 38.30 | 33.75 | 38.30 | 33.75 | 17,321 | 8,812.7 | 7,664.0 | |||||||||||||||||||||
| January | 36.60 | 33.75 | 36.60 | 33.75 | 16,734 | 8,145.2 | 7,664.0 | |||||||||||||||||||||
| February | 37.95 | 34.20 | 37.95 | 34.20 | 20,129 | 8,411.2 | 8,063.0 | |||||||||||||||||||||
| March | 38.30 | 35.85 | 38.30 | 35.85 | 16,271 | 8,812.7 | 8,485.7 | |||||||||||||||||||||
| Second Quarter | ||||||||||||||||||||||||||||
| April (through April 28, 2016) | 36.35 | 32.20 | 36.35 | 32.20 | 21,189 | 8,700.4 | 8,473.9 | |||||||||||||||||||||
___________________
89
The performance of the Taiwan Stock ExchangeTWSE has in recent years been characterized by extreme price volatility. There are currently limits on the range of daily price movements on the Taiwan Stock Exchange.TWSE. In the case of equity securities traded on the Taiwan Stock Exchange,TWSE, such as our common shares, fluctuations in the price of a particular security may not exceed a 10.0% change either above or below the previous day’s closing price of such security.
Our ADSs have been listed on the New York Stock ExchangeNYSE under the symbol “ASX” since September 26, 2000.April 30, 2018. The outstanding ADSs are identified by the CUSIP number 00756M404.00215W100. As of MarchJanuary 31, 2016,2019, a total of 125,667,296142,511,705 ADSs were outstanding. The following table sets forth, for the periods indicated, the high and low closing prices and the average daily volume of trading activity on the New York Stock Exchange for our ADSs and the highest and lowest of the daily closing values of the New York Stock Exchange Index. The closing price for our ADSs on the New York Stock Exchange on April 28, 2016 was US$4.96 per ADS.
| Closing Price per ADS | Adjusted Closing | Average Daily Trading Volume | New York Stock Exchange Index | |||||||||||||||||||||||||
| High | Low | High | Low | (in thousands of ADSs) | High | Low | ||||||||||||||||||||||
| US$ | US$ | US$ | US$ | |||||||||||||||||||||||||
| 2011 | 6.55 | 4.04 | 5.21 | 3.28 | 1,346 | 8,671.4 | 6,571.5 | |||||||||||||||||||||
| 2012 | 5.27 | 3.54 | 4.27 | 2.94 | 1,065 | 8,516.4 | 7,285.5 | |||||||||||||||||||||
| 2013 | 5.35 | 3.91 | 4.85 | 3.24 | 746 | 10,400.3 | 8,604.4 | |||||||||||||||||||||
| 2014 | 6.87 | 4.45 | 6.22 | 4.03 | 752 | 11,104.7 | 9,741.6 | |||||||||||||||||||||
| First Quarter | 5.55 | 4.45 | 5.03 | 4.03 | 731 | 10,527.8 | 9,741.6 | |||||||||||||||||||||
| Second Quarter | 6.65 | 5.43 | 6.02 | 4.92 | 709 | 11,018.1 | 10,280.9 | |||||||||||||||||||||
| Third Quarter | 6.87 | 5.87 | 6.22 | 5.43 | 728 | 11,104.7 | 10,583.8 | |||||||||||||||||||||
| Fourth Quarter | 6.39 | 5.80 | 6.00 | 5.45 | 839 | 11,047.9 | 10,109.7 | |||||||||||||||||||||
| 2015 | 7.89 | 4.69 | 7.41 | 4.69 | 1,405 | 11,239.7 | 9,601.4 | |||||||||||||||||||||
| First Quarter | 7.89 | 5.96 | 7.41 | 5.60 | 1,485 | 11,122.1 | 10,514.6 | |||||||||||||||||||||
| Second Quarter | 7.51 | 6.39 | 7.05 | 6.00 | 1,412 | 11,239.7 | 10,790.3 | |||||||||||||||||||||
| Third Quarter | 6.67 | 4.69 | 6.27 | 4.69 | 1,700 | 11,024.9 | 9,601.4 | |||||||||||||||||||||
| Fourth Quarter | 6.12 | 5.18 | 6.12 | 5.18 | 1,028 | 10,609.9 | 9,821.0 | |||||||||||||||||||||
| October | 6.12 | 5.24 | 6.12 | 5.24 | 1,378 | 10,538.2 | 9,821.0 | |||||||||||||||||||||
| November | 5.90 | 5.39 | 5.90 | 5.39 | 724 | 10,609.9 | 10,155.1 | |||||||||||||||||||||
| December | 5.83 | 5.18 | 5.83 | 5.18 | 953 | 10,519.6 | 9,967.6 | |||||||||||||||||||||
| 2016 | ||||||||||||||||||||||||||||
| First Quarter | 5.87 | 4.95 | 5.87 | 4.95 | 1,015 | 10,237.0 | 9,029.9 | |||||||||||||||||||||
| January | 5.53 | 5.02 | 5.53 | 5.02 | 902 | 10,028.1 | 9,156.8 | |||||||||||||||||||||
| February | 5.64 | 4.95 | 5.64 | 4.95 | 915 | 9,625.3 | 9,029.9 | |||||||||||||||||||||
| March | 5.87 | 5.60 | 5.87 | 5.60 | 1,204 | 10,237.0 | 9,771.0 | |||||||||||||||||||||
| Second Quarter | ||||||||||||||||||||||||||||
| April (through April 28, 2016) | 5.74 | 4.96 | 5.74 | 4.96 | 1,456 | 10,571.8 | 10,045.2 | |||||||||||||||||||||
____________________
9099
Not applicable.
The principal trading market for our common shares is the Taiwan Stock ExchangeTWSE and the principal trading market for ADSs representing our common shares is the New York Stock Exchange.NYSE.
Not applicable.
Not applicable.
Not applicable.
Item 10. Additional Information
Not applicable.
General
We are a company limited by shares organized under the laws of the ROC.R.O.C. Our organizational document is our Articles of Incorporation. We have no by-laws.
Our Articles of Incorporation provide, in Article 2, that we may engage in the following typesGeneral Investment Business, which includes Investments in various businesses including agriculture, forestry, fishery, animal husbandry, industry, mining and merchandising business, investments in service companies, securities companies, bank insurance companies, trading companies, cultural companies, construction of business:residential buildings, commercial building, recreation businesses and tourist hotels related business.
91
We were incorporated on March 23, 1984April 30, 2018 as a company limited by shares under the ROCR.O.C. Company Law. Our authorized share capital registered with the Kaohsiung Export Processing Zones Administration was NT$9550 billion, divided into 9,500 million5 billion common shares 7,918,272,896with a face value of NT$10.0 per share, 4,322,321,982 of which were outstanding as of MarchJanuary 31, 2016.2019. Our authorized share capital under our Articles of Incorporation is NT$10050 billion, divided into 105 billion common shares. We do not have any equity in the form of preference shares or otherwise outstanding as of the date of this annual report.
Subject to limited exceptions, with the approval of our board of directors and the FSC, we may grant stock options to our employees, provided thatemployees; stock options worth NT$8,000 million of our authorized capital (800 million common shares) is4 billion are reserved for employee stock options.subscription. The total number of shares to be issued under all option plans, together with all restricted shares issued to employees, shall not exceed 15% of our outstanding common shares.Unless otherwise approved by the shareholders’ meeting, the exercise price of an option shall not be less than the closing price of our common shares on the Taiwan Stock ExchangeTWSE on the grant date of the option. As of MarchJanuary 31, 2016,2019, we hadassumed and granted 480,075,500188,718,350 options pursuant to employee stock option plans established on November 22, 2007, April 20, 2010, and April 17, 2015 and August 23, 2018 to our full-time employees, including our domestic and foreign subsidiaries.See “Item 6. Directors, Senior Management and Employees—Compensation—ASE Inc.ASEH Employee BonusCompensation and Stock Option Plans.”
100
Directors
Our Articles of Incorporation provide that, we are to have 11 to 15thirteen directors with tenures of three years who are elected at a shareholders’ meeting. In addition, three of our directors will be required to be independent directors. Our audit committee replaced the function of supervisors in accordance with the ROCR.O.C. Securities and Exchange Act to exercise the powers and duties of supervisors starting from June 2015.supervisors.
There is no minimum amount of shares necessary to stand for election to a directorship. Many of our directors are representatives appointed by corporate shareholders which appoint individual representatives. Re-elections are allowed. The board of directors has certain powers and duties, including devising operations strategy, proposing to distribute dividends or make up losses, proposing to increase or decrease capital, reviewing material internal rules and contracts, hiring and discharging the general manager, establishing and dissolving branch offices, reviewing budgets and financial statements and other duties and powers granted by or in accordance with the ROCR.O.C. Company Law, our Articles of Incorporation or shareholders resolutions.
The board of directors is constituted by the directors, who elect a chairman from among the directors to preside over the meeting of the board. Meetings of the board may be held in the ROCR.O.C. or by videoconference. A director may appoint another director to attend a meeting and vote by proxy, but a director may accept only one proxy.
Dividends and Distributions
In general, we are not permitted to distribute dividends or make other distributions to shareholders in any given year in which we did not record net income or retained earnings (excluding reserves). The ROCR.O.C. Company Law also requires that 10% of annual net income (less prior years’ losses, if any, and applicable income taxes) be set aside as a legal reserve until the accumulated legal reserve equals our paid-in capital. In addition,
According to our Articles of Incorporation, require that before a dividendthe remuneration of our independent directors is paid out ofset at NT$3.0 million (US$0.1 million) per person per year. If our annual net income:
92
In January 2016, our board of directors proposedand submit to amend our Articles of Incorporationthe shareholders’ meeting for resolution. In addition, we set aside 0.01% to distribute employees’ compensation and remuneration to directors at the rates in 5.25%-8.25% and no higher than 0.75%, respectively,1.00% of net profit before income tax, employees’ compensation and remuneration to directors. The 5.25% portion is to be distributed to all employees in accordance with our employeethe directors as employees’ compensation distribution rules, while any portion exceeding 5.25% is to be distributed in accordance with rules established by our board of directors to individual employees who have been recognizedand no more than 0.75% as having made special contributions to our company. Such employees include those of our subsidiaries. This proposal is subjectremuneration to the shareholders’ approval at the annual general meeting in June 2016.directors.
At the annual general meeting of shareholders, our board of directors submits to the shareholders for their approval any proposal for the distribution of dividends or the making of any other distribution to shareholders from our net income for the preceding fiscal year. All common shares outstanding and fully paid as of the relevant record date are entitled to share equally in any dividend or other distribution so approved. Dividends may be distributed in cash, in the form of common shares or a combination of the two, as determined by the shareholders at the meeting. According to our Articles of Incorporation, we have a general policy that cash dividend distribution should not be lower than 30% of the total dividend amount and the remainder be distributed as stock dividends. See “Item 8. Financial Information—Consolidated Statements and Other Financial Information—Dividends and Dividend Policy.”
We are also permitted to make distributions to our shareholders in cash or in the form of common shares from reserves if we have no accumulated loss. However, the distribution payable out of our legal reserve can only come from the amount exceeding 25% of the total paid-in capital.
For information on the dividends we paid in recent years, see “Item 8. Financial Information—Consolidated Statements and Other Financial Information—Dividends and Dividend Policy.” For information as to ROCR.O.C. taxes on dividends and distributions, see “—Taxation—ROCR.O.C. Taxation—Dividends.”
Changes in Share Capital
Under ROC Company Law, any change in the authorized share capital of a company limited by shares requires an amendment to its Articles of Incorporation, which in turn requires approval at the shareholders’ meeting. In the case of a public company such as ourselves, we must also obtain the approval of, or submit a report to, the FSC and the Kaohsiung Export Processing Zone Administration. Authorized but unissued common shares may be issued, subject to applicable ROC law, upon terms as our board of directors may determine. Our authorized share capital registered with the Kaohsiung Export Processing Zones Administration was NT$95 billion, divided into 9,500 million common shares with a face value of NT$10.0 per share as of March 31, 2016. Our authorized share capital under our Articles of Incorporation is NT$100 billion, divided into 10 billion common shares. There were 500 million common shares included in our authorized shares that are currently not registered with the Kaohsiung Export Processing Zones Administration. We will complete the registration with the Kaohsiung Export Processing Zones Administration if and when our total issued share capital equals or exceeds NT$95 billion.
Preemptive Rights
Under the ROCR.O.C. Company Law, when an ROCR.O.C. company issues new shares for cash, existing shareholders who are listed on the shareholders’ register as of the record date have preemptive rights to subscribe for the new issue in proportion to their existing shareholdings, while a company’s employees, whether or not they are shareholders of the company, have rights to subscribe for 10% to 15% of the new issue. Any new shares that remain unsubscribed at the expiration of the subscription period may be freely offered, subject to compliance with applicable ROCR.O.C. law.
93101
In addition, in accordance with the ROCR.O.C. Securities and Exchange Act, a public company that intends to offer new shares for cash must offer to the public at least 10% of the shares to be sold, except under certain circumstances or when exempted by the FSC. This percentage can be increased by a resolution passed at a shareholders’ meeting, which would diminish the number of new shares subject to the preemptive rights of existing shareholders.
These preemptive rights provisions do not apply to offerings of new shares through a private placement approved at a shareholders’ meeting.
Meetings of Shareholders
We are required to hold an annual general meeting of our shareholders within six months following the end of each fiscal year. These meetings are generally held in Kaohsiung, Taiwan. Any shareholder who holds 1% or more of our issued and outstanding shares may submit one written proposal for discussion at our annual general meeting. Extraordinary general shareholders’ meetings may be convened by resolution of the board of directors or by the board of directors upon the written request of any shareholder or shareholders who have held 3% or more of the outstanding common shares for a period of one year or longer or shareholders who have held50% or more of the outstanding common shares forthree months or longer. Shareholders’ meetings may also be convened by member(s) of the audit committee. Notice in writing of meetings of shareholders, stating the place, time and purpose, must be dispatched to each shareholder at least 30 days, in the case of annual general meetings, and 15 days, in the case of extraordinary meetings, before the date set for each meeting. A majority of the holders of all issued and outstanding common shares present at a shareholders’ meeting constitutes a quorum for meetings of shareholders.
Voting Rights
Under the ROCR.O.C. Company Law, except under limited circumstances, shareholders have one vote for each common share held. Under the ROCR.O.C. Company Law, our directors are elected at a shareholders’ meeting through cumulative voting.
In general, a resolution can be adopted by the holders of at least a majority of our common shares represented at a shareholders’ meeting at which the holders of a majority of all issued and outstanding common shares are present. Under ROCR.O.C. Company Law, the approval by at least a majority of our common shares represented at a shareholders’ meeting in which a quorum of at least two-thirds of all issued and outstanding common shares are represented is required for major corporate actions, including:
| · | amendment to the Articles of Incorporation, including increase of authorized share capital and any changes of the rights of different classes of shares; |
| · | execution, amendment or termination of any contract through which the company leases its entire business to others, or the company appoints others to operate its business or the company operates its business with others on a continuous basis; |
| · | transfer of entire business or assets or a substantial part of its business or assets; |
| · | acquisition of the entire business or assets of any other company, which would have a significant impact on the company’s operations; |
| · | distribution of any stock dividend; |
| · | dissolution, merger or spin-off of the company; |
| · | issuance of restricted shares to employees; and |
| · | removal of the directors. |
102
However, in the case of a listed company such as us, the resolution may be adopted by the holders of at least two-thirds of our issued and outstanding common shares represented at a shareholders’ meeting at which the holders of at least a majority of all issued and outstanding common shares are present.
A shareholder may be represented at an annual general or extraordinary meeting by proxy if a valid proxy form is delivered to us five days before the commencement of the annual general or extraordinary general shareholders’ meeting. Shareholders may exercise their voting rights by way of a written ballot or by way of electronic transmission if the voting decision is delivered to us two days before the commencement of the annual general or extraordinary general shareholders’ meeting.
94
Holders of ADSs do not have the right to exercise voting rights with respect to the underlying common shares, except as described in the deposit agreement.
Other Rights of Shareholders
Under the ROCR.O.C. Company Law, dissenting shareholders are entitled to appraisal rights in certain major corporate actions such as a proposed amalgamation by the company. If agreement with the company cannot be reached, dissenting shareholders may seek a court order for the company to redeem all of their shares. Shareholders may exercise their appraisal rights by serving written notice on the company prior to or at the related shareholders’ meeting and/or by raising and registering an objection at the shareholders’ meeting. In addition to appraisal rights, shareholders have the right to sue for the annulment of any resolution adopted at a shareholders’ meeting where the procedures were legally defective within 30 days after the date of the shareholders’ meeting. One or more shareholders who have held 3%1% or more of the issued and outstanding shares of a company for a period of one yearsix months or longer may require an independent director to bring a derivative action on behalf of the company against a director as a result of the director’s unlawful actions or failure to act.
Rights of Holders of Deposited Securities
Except as described below, holders of ADSs generally have no right under the deposit agreement to instruct the depositary to exercise the voting rights for our common shares represented by the ADSs. Instead, by accepting ADSs or any beneficial interest in ADSs, holders of ADSs are deemed to have authorized and directed the depositary to appoint our chairman or his designee to represent them at our shareholders’ meetings and to vote our common shares deposited with the custodian according to the terms of the deposit agreement.
The depositary will mail to holders of ADSs any notice of shareholders’ meeting received from us together with information explaining how to instruct the depositary to exercise the voting rights of the securities represented by ADSs.
If we fail to timely provide the depositary with an English language translation of our notice of meeting or other materials related to any meeting of owners of common shares, the depositary will endeavor to cause all the deposited securities represented by ADSs to be present at the applicable meeting, insofar as practicable and permitted under applicable law, but will not cause those securities to be voted.
If the depositary timely receives voting instructions from owners of at least 51.0% of the outstanding ADSs to vote in the same direction regarding one or more resolutions to be proposed at the meeting, including election of directors, the depositary will notify our chairman or his designee to attend the meeting and vote all the securities represented by the holders’ ADSs in accordance with the direction received from owners of at least 51.0% of the outstanding ADSs.
If we have timely provided the depositary with the materials described in the deposit agreement and the depositary has not timely received instructions from holders of at least 51.0% of the outstanding ADSs to vote in the same direction regarding any resolution to be considered at the meeting, then, holders of ADSs will be deemed to have authorized and directed the depositary bank to give a discretionary proxy to our chairman or his designee to attend and vote at the meeting our common shares represented by the ADSs in any manner, our chairman or his designee may wish, which may not be in the interests of holders.
The ability of the depositary to carry out voting instructions may be limited by practical and legal limitations and the terms of the securities on deposit. We cannot assure ADS holders that they will receive voting materials in time to enable them to return voting instructions to the depositary in a timely manner.
103
While shareholders who own 1% or more of our outstanding shares are entitled to submit one proposal to be considered at our annual general meetings, only holders representing at least 51% of our ADSs outstanding at the relevant record date are entitled to submit one proposal to be considered at our annual general meetings. Hence, only one proposal may be submitted on behalf of all ADS holders.
95
Register of Shareholders and Record Dates
Our share registrar, President Securities Corp., maintains our register of shareholders at its offices in Taipei, Taiwan. Under the ROCR.O.C. Company Law and our Articles of Incorporation, we may, by giving advance public notice, set a record date and close the register of shareholders for a specified period in order for us to determine the shareholders or pledgees that are entitled to rights pertaining to our common share. The specified period required is as follows:
| · | annual general meeting—60 days; |
| · | extraordinary general shareholders’ meeting—30 days; and |
| · | relevant record date for distribution of dividends, bonuses or other interests—5 days. |
Annual Financial Statements
At least ten days before the annual general meeting, our annual financial statements, which are prepared in conformity with Taiwan IFRS, must be available at our principal executive office in Kaohsiung, Taiwan for inspection by the shareholders.
Transfer of Common Shares
The transfer of common shares in registered form is effected by endorsement and delivery of the related share certificates but, in order to assert shareholders’ rights against us, the transferee must have his name and address registered on our register of shareholders. Shareholders are required to file their respective specimen seals, also known as chops, with us. Chops are official stamps widely used in Taiwan by individuals and other entities to authenticate the execution of official and commercial documents. The settlement of trading in our common shares is normally carried out on the book-entry system maintained by the Taiwan Depository & Clearing Corporation.
Acquisition of Common Shares by ASE Inc.ASEH
Under the ROCR.O.C. Securities and Exchange Act, we may purchase our own common shares for treasury stock under limited circumstances, including:
| · | to transfer shares to our employees; |
| · | to deliver shares upon the conversion or exercise of bonds with warrants, preferred shares with warrants, convertible bonds, convertible preferred shares or warrants issued by us; and |
| · | to maintain our credit and our shareholders’ equity, provided that the shares so purchased shall be canceled. |
We may purchase our common shares on the Taiwan Stock ExchangeTWSE or by means of a public tender offer. These transactions require the approval of a majority of our board of directors at a meeting in which at least two-thirds of the directors are in attendance. The total amount of common shares purchased for treasury stock may not exceed 10.0% of the total issued shares. In addition, the total cost of the purchased shares shall not exceed the aggregate amount of our retained earnings, any premium from share issuances and the realized portion of our capital reserve.
We may not pledge or hypothecate any of our shares purchased by us. In addition, we may not exercise any shareholders’ right attaching to such shares. In the event that we purchase our shares on the Taiwan Stock Exchange,TWSE, our affiliates, directors, managers, shareholders who hold 10% or more of our total issued shares and their respective spouses and minor children and/or nominees are prohibited from selling any of our shares during the period in which we are purchasing our shares.
104
Pursuant to the ROCR.O.C. Company Law, an entity in which our company directly or indirectly owns more than 50.0% of the voting shares or paid-in capital, which is referred to as a controlled entity, may not purchase our shares. Also, if our company and a controlled entity jointly own, directly or indirectly, more than 50.0% of the voting shares or paid-in capital of another entity, which is referred to as a third entity, the third entity may not purchase shares in either our company or a controlled entity.
96
Liquidation Rights
In the event of our liquidation, the assets remaining after payment of all debts, liquidation expenses and taxes will be distributed pro rata to the shareholders in accordance with the relevant provisions of the ROCR.O.C. Company Law.
Transfer Restrictions
Substantial Shareholders
The ROCR.O.C. Securities and Exchange Act currently requires:
| · | each director, manager, or substantial shareholder (that is, a shareholder who holds more than 10.0% shares of a company), and their respective spouses, minor children or nominees, to report any change in that person’s shareholding to the issuer of the shares and the FSC; and |
| · | each director, manager, or substantial shareholder, and their respective spouses, minor children or nominees, after acquiring the status of director, manager, or substantial shareholder for a period of six months, to report his or her intent to transfer any shares on the |
In addition, the number of shares that can be sold or transferred on the Taiwan Stock ExchangeTWSE by any person subject to the restrictions described above on any given day may not exceed:exceed the greater of:
| · | 0.2% of the outstanding shares of the company in the case of a company with no more than 30 million outstanding shares; or |
| · | 0.2% of 30 million shares plus 0.1% of the outstanding shares exceeding 30 million shares in the case of a company with more than 30 million outstanding shares; |
| · |
These restrictions do not apply to sales or transfers of our ADSs.
Syndicated Loan Agreement between ASEH and banking syndicates led by Bank of Taiwan, Mega International Commercial Bank, and Citibank, N.A., Taipei Branch
On April 30, 2018 we entered into a NT$90,000.0 million (US$2,940.2 million) five-year syndicated credit facility, for which the Bank of Taiwan, Mega International Commercial Bank and Citibank, N.A., Taipei Branch acted as the agent banks, for the purpose of financing our funding needs for the SPIL Acquisition.
Joint VentureShare Exchange Agreement between ASE and TDK CorporationSPIL
On May 8, 2015, weASE and SPIL entered into the Joint Share Exchange Agreement pursuant to which a joint venture agreement with TDK Corporation, under which both parties would investholding company, ASEH, was formed by means of a statutory share exchange, and ASEH (i) acquired all issued shares of ASE in ASEEE, a company limited byexchange for shares incorporated under ROC law. ASEEE will engage inof ASEH using the businessExchange Ratio as described below, and (ii) acquired all issued shares of manufacture, marketing, distributionSPIL using the Cash Consideration as described below. Upon the consummation of the Share Exchange, ASE and saleSPIL became wholly owned subsidiaries of embedded substrates, and it plans to leverage TDK Corporation’s expertise, patents and knowledge in the field of SESUB technology. ASEH concurrently.
Pursuant to the joint venture agreement, TDK Corporation would provide ASEEE with certain materials requiredterms and subject to the conditions set forth in the manufacturingJoint Share Exchange Agreement, at the effective time of embedded substrates based on SESUB technology as well as necessary equipment. In August 2015, we invested NT$618.1 million (US$18.9 million) to subscribe for 651,809,660 shares of ASEEE, representing 51% shareholding in ASEEE. The investment in ASEEE is accounted for using the equity method.Share Exchange (the “Effective Time”):
| i. | for SPIL shareholders: |
Under the terms of the joint venture agreement, we are entitled to designate the chairman of the board of directors of ASEEE, as well as three out of the five directors who constitute the board of directors. However, according to the joint venture arrangement, certain corporate actions require the affirmative vote of at least two-thirds of directors. As a result, we and TDK jointly direct the operating activities of ASEEE.
| · | each SPIL common share, par value NT$10 per share, was issued immediately prior to the Effective Time (including SPIL’s treasury shares and the common shares of SPIL beneficially owned by ASE), and was transferred to ASEH in consideration for the right to receive NT$51.2, which represented NT$55, minus a cash dividend and a return of capital reserve of NT$3.8 per common share of SPIL distributed by SPIL on July 1, 2016, payable in cash in NT dollars, without interest and net of any applicable withholding taxes (“SPIL Common Shares Cash Consideration”); and |
97105
| · | each SPIL American depositary share, representing five common shares of SPIL was cancelled in exchange for the right to receive through JPMorgan Chase Bank, N.A., as depositary for the SPIL American depositary shares (“SPIL Depositary”), the US dollar equivalent of NT$256 (representing five times of the SPIL Common Shares Cash Consideration) minus (i) all processing fees and expenses per SPIL American depositary shares in relation to the conversion from NT dollars into US dollars, and (ii) US$0.05 per SPIL American depositary shares cancellation fees pursuant to the terms of the deposit agreement dated January 6, 2015 by and among SPIL, SPIL Depositary and the holders and beneficial owners from time to time of the SPIL American depositary shares issued thereunder, payable in cash in US dollars, without interest and net of any applicable withholding taxes (“SPIL ADS Cash Consideration,” together with the SPIL Common Shares Cash Consideration, “Cash Consideration”). |
| ii. | for ASE shareholders: |
| · | each common share of ASE, par value NT$10 per share, issued immediately prior to the Effective Time (including ASE’s treasury shares), was transferred to ASE Technology Holding in consideration for the right to receive 0.5 ASE Technology Holding common shares, par value NT$10 per share; and |
| · | each ASE ADS, representing five common shares of ASE, represented the right to receive 1.25 ASEH ADS. Each ASEH ADS represents two ASEH common shares upon surrender for cancellation to Citibank, N.A., as depositary for the ASE ADSs, after the Effective Time. The ratio at which the common shares of ASE was exchanged for the common shares of ASEH and ASE ADSs was exchanged for ASEH American depositary shares is hereinafter referred to as the “Exchange Ratio”. |
Under Republic of China law, if any fractional ASEH common shares that represented less than one common share was otherwise allotted to former holders of ASE common shares in connection with the Share Exchange, those fractional shares would not be issued to those shareholders. Pursuant to the Joint Share Exchange Agreement, ASE aggregated the fractional entitlements and sold the aggregated ASE common shares using the closing price of ASE common shares on the TWSE on the ninth R.O.C. Trading Day prior to the Effective Time, to an appointee of the Chairman of ASEH. The cash proceeds from the sale was distributed to the former holders of ASE common shares by ASEH on a proportionate basis in accordance with their respective fractions at the Effective Time.
On February 12, 2018, ASE held an extraordinary general shareholders’ meeting and approved the Joint Share Exchange Agreement and approved ASEH’s share capital to be NT$50,000,000,000.
On March 26, 2018, TWSE approved the delisting of common shares of ASE and SPIL on April 30, 2018 and the listing of common shares of ASEH on the same day. On April 30, 2018, the Share Exchange consummated, ASE and SPIL became wholly owned subsidiaries of ASEH, and ASEH begun trading on TWSE under the stock symbol “3711” and on NYSE under the same ticker symbol “ASX”.
FOREIGN INVESTMENT IN THE ROCR.O.C.
Historically, foreign investment in the ROCR.O.C. securities market has been restricted. Since 1983, the ROCR.O.C. government has from time to time enacted legislation and adopted regulations to permit foreign investment in the ROCR.O.C. securities market.
On September 30, 2003, the Executive Yuan approved an amendment to the Regulations Governing Investment in Securities by Overseas Chinese and Foreign National, or the Regulations, which took effect on October 2, 2003. Pursuant to the Regulations, the FSC abolished the mechanism of the “qualified foreign institutional investors” and “general foreign investors” as stipulated in the Regulations before the amendment.
106
Under the Regulations, foreign investors (other than PRCP.R.C. persons) are classified as either “onshore foreign investors” or “offshore foreign investors” according to their respective geographical location. Both onshore and offshore foreign investors are allowed to invest in ROCR.O.C. securities after they register with the Taiwan Stock ExchangeTWSE or the Taiwan Futures Exchange. The Regulations further classify foreign investors into foreign institutional investors and foreign individual investors. “Foreign institutional investors” refer to those investors incorporated and registered in accordance with foreign laws outside of the ROCR.O.C. (i.e., offshore foreign institutional investors) or their branches set up and recognized within the ROCR.O.C. (i.e., onshore foreign institutional investors). Offshore overseas Chinese and foreign individual investors may be subject to a maximum investment ceiling that will be separately determined by the FSC, after consultation with the Central Bank of the Republic of China (Taiwan). Currently, there is no maximum investment ceiling for offshore overseas Chinese and foreign individual investors. On the other hand, foreign institutional investors are not subject to any ceiling for investment in the ROCR.O.C. securities market.
Except for certain specified industries, such as telecommunications, investments in ROC-listedR.O.C.-listed companies by foreign investors are not subject to individual or aggregate foreign ownership limits. Custodians for foreign investors are required to submit to the Central Bank of the Republic of China (Taiwan) and the Taiwan Stock ExchangeTWSE a monthly report of trading activities and status of assets under custody and other matters. Capital remitted to the ROCR.O.C. under these guidelines may be remitted out of the ROCR.O.C. at any time after the date the capital is remitted to the ROC.R.O.C. Capital gains and income on investments may be remitted out of the ROCR.O.C. at any time.
Foreign investors (other than PRCP.R.C. persons) who wish to make (i) direct investments in the shares of ROCR.O.C. private companies or (ii) investment in 10.0% or more of the equity interest of a ROCR.O.C. company listed on the Taiwan Stock ExchangeTWSE or the Taipei Exchange in any single transaction, are required to submit a foreign investment approval application to the MOEAIC or other applicable government authority. The MOEAIC or such other government authority reviews each foreign investment approval application and approves or disapproves each application after consultation with other governmental agencies (such as the Central Bank of the Republic of China (Taiwan) and the FSC).
Under current ROCR.O.C. law, any non-ROCnon-R.O.C. person possessing a foreign investment approval may remit capital for the approved investment and is entitled to repatriate annual net profits, interest and cash dividends attributable to the approved investment. Dividends attributable to such investment may be repatriated upon submitting certain required documents to the remitting bank, and investment capital and capital gains attributable to such investment may be repatriated after approvals of the MOEAIC or other government authorities have been obtained.
In addition to the general restriction against direct investment by foreign investors in securities of ROCR.O.C. companies, foreign investors (except in certain limited cases) are currently prohibited from investing in certain industries in the ROCR.O.C. pursuant to a “negative list,” as amended by the Executive Yuan. The prohibition on foreign investment in the prohibited industries specified in the negative list is absolute in the absence of a specific exemption from the application of the negative list. Pursuant to the negative list, certain other industries are restricted so that foreign investors (except in limited cases) may invest in these industries only up to a specified level and with the special approval of the relevant competent authority that is responsible for enforcing the relevant legislation that the negative list is intended to implement.
98
The FSC announced the PRCP.R.C. Regulations on April 30, 2009. According to the PRCP.R.C. Regulations, a PRCP.R.C. QDII is allowed to invest in ROCR.O.C. securities (including less than 10.0% shareholding of a ROCR.O.C. company listed on the Taiwan Stock ExchangeTWSE or the Taipei Exchange) provided that the total investment amount of any QDII does not exceed US$500 million. The custodians of QDIIs must apply with the Taiwan Stock ExchangeTWSE for the remittance amount for each QDII, which cannot exceed US$100 million, and QDII can only invest in ROCR.O.C. securities at an amount approved by the Taiwan Stock Exchange.TWSE. In addition, QDIIs are currently prohibited from investing in certain industries, and their investment in any company of certain other industries is restricted to a certain percentage pursuant to a list promulgated by the FSC and amended from time to time. PRCP.R.C. investors other than QDII are prohibited from making investments in a ROCR.O.C. company listed on the Taiwan Stock ExchangeTWSE or the Taipei Exchange if the investment is less than 10.0% of the equity interest of such ROCR.O.C. company.
In addition to investments permitted under the PRCP.R.C. Regulations, PRCP.R.C. investors who wish to make (i) direct investment in the shares of ROCR.O.C. private companies or (ii) investments, individually or in the aggregate, in 10.0% or more of the equity interest of a ROCR.O.C. company listed on the Taiwan Stock ExchangeTWSE or the Taipei Exchange, are required to submit an investment approval application to the MOEAIC or other government authority. The MOEAIC or such other government authority reviews each investment approval application and approves or disapproves each application after consultation with other governmental agencies.
107
In addition to the general restriction against direct investment by PRCP.R.C. investors in securities of ROCR.O.C. companies, PRCP.R.C. investors may only invest in certain industries on the “positive list” promulgated by the Executive Yuan. Furthermore, a PRCP.R.C. investor who wishes to be elected as a ROCR.O.C. company’s director or supervisor shall submit an investment approval application to the MOEAIC or other government authority for approval.
ROCR.O.C. Exchange Controls
The ROCR.O.C. Foreign Exchange Control LawAct and regulations provide that all foreign exchange transactions must be executed by banks designated by the FSC and by the Central Bank of the Republic of China (Taiwan) to engage in such transactions. Current regulations favor trade-related or service-related foreign exchange transactions. Consequently, foreign currency earned from exports of merchandise and services may now be retained and used freely by exporters, and all foreign currency needed for the importation of merchandise and services may be purchased freely from the designated foreign exchange banks.
Apart from trade-related or service-related foreign exchange transactions, ROCR.O.C. companies and individual residents of the ROCR.O.C. reaching the age of 20 years old may, without foreign exchange approval, remit foreign currency of up to US$50 million (or its equivalent) and US$5 million (or its equivalent) to and from the ROC,R.O.C., respectively, in each calendar year. The above limits apply to remittances involving either a conversion of NT dollars into a foreign currency or a conversion of foreign currency into NT dollars. In addition, a requirement is also imposed on all enterprises to register medium- and long-term foreign debt with the Central Bank of the Republic of China (Taiwan).
In addition, foreign persons may, subject to specified requirements but without foreign exchange approval of the Central Bank of the Republic of China (Taiwan), remit to and from the ROCR.O.C. foreign currencies of up to US$100,000 (or its equivalent) per remittance if the required documentation is provided to the ROCR.O.C. authorities. The above limit applies to remittances involving either a conversion of NT dollars into a foreign currency or a conversion of foreign currency into NT dollars. The above limit does not, however, apply to the conversion of NT dollars into other currencies, including U.S. dollars, from the proceeds of a sale of any underlying shares withdrawn from a depositary receipt facility.
ROCR.O.C. Taxation
The following discussion describes the material ROCR.O.C. tax consequences of the ownership and disposition of our common shares or ADSs to a non-resident individual or non-resident entity that owns our common shares or ADSs (referred to here as a “non-ROC“non-R.O.C. holder”). As used in the preceding sentence, a “non-resident individual” is a non-ROCnon-R.O.C. national who owns our common shares or ADSs and is not physically present in the ROCR.O.C. for 183 days or more during any calendar year, and a “non-resident entity” is a corporation or a non-corporate body that owns our common shares or ADSs, is organized under the laws of a jurisdiction other than the ROCR.O.C. and has no fixed place of business or business agent in the ROC.R.O.C.
99
Dividends
Dividends (whether in cash or common shares) declared by us out of retained earnings and distributed to a non-ROCnon-R.O.C. holder are subject to ROCR.O.C. withholding tax currently at the rate of 20%21% (unless a preferable tax rate is provided under a tax treaty between the ROCR.O.C. and the jurisdiction where the non-ROCnon-R.O.C. holder is a resident) on the amount of the distribution (in the case of cash dividends) or on the par value of the distributed common shares (in the case of stock dividends). A 10% undistributed earnings tax is imposed on a ROC company for its after-tax earnings generated after January 1, 1998 which are not distributed in the following year. The undistributed earnings tax so paid will further reduce the retained earnings available for future distribution. When we declare a dividend out of those retained earnings, an amount in respect of the undistributed earnings tax, up to a maximum amount of 5% of the dividend to be distributed, will be credited against the withholding tax imposed on the non-ROC holders.
Distributions of common shares or cash out of capital reserves will not be subject to withholding tax, except under limited circumstances.
108
Capital Gains
Starting from January 1, 2016, capital gains realized upon the sale or other disposition of common shares are exempt from ROCR.O.C. income tax.
Sales of ADSs are not regarded as sales of ROCR.O.C. securities and thus any gains derived from transfers of ADSs by non-ROCnon-R.O.C. holders are not currently subject to ROCR.O.C. income tax.
Securities Transaction Tax
Securities transaction tax will be imposed on the seller at the rate of 0.3% of the transaction price upon a sale of common shares. Transfers of ADSs are not subject to ROCR.O.C. securities transaction tax. During the one-year period from April 28, 2017 to April 27, 2018, the tax rate for day trading of shares meeting certain criteria is reduced to 0.15%. The Legislative Yuan approved on April 13, 2018 an extension of the aforesaid reduction in tax rate. Under the amended Securities Transaction Tax Act, which became effective on April 27, 2018, the aforesaid reduction in tax rate was applies until December 31, 2021.
Subscription Rights
Distributions of statutory subscription rights for our common shares in compliance with the ROCR.O.C. Company Law are currently not subject to ROCR.O.C. tax. Sales of statutory subscription rights evidenced by securities are subject to securities transaction tax, currently at the rate of 0.3% of the gross amount received. Holders are exempt from income tax on capital gains from the sale of statutory subscription rights evidenced by securities. Proceeds derived from sales of statutory subscription rights which are not evidenced by securities are not subject to securities transaction tax but are subject to income tax at a fixed rate of 20% of the income if the seller is a non-ROCnon-R.O.C. holder. Subject to compliance with ROCR.O.C. law, we, in our sole discretion, may determine whether statutory subscription rights are evidenced by securities.
Estate and Gift Tax
ROCR.O.C. estate tax is payable on any property within the ROCR.O.C. left by a deceased non-resident individual, and ROCR.O.C. gift tax is payable on any property within the ROCR.O.C. donated by a non-resident individual. Estate tax and gift tax are currently imposed at the rateprogressive rates of 10%, 15% and 20%. Under the ROCR.O.C. Estate and Gift Tax Act, common shares issued by ROCR.O.C. companies are deemed property located in the ROCR.O.C. without regard to the location of the owner. It is unclear whether a holder of ADSs will be considered to own common shares for this purpose.
Tax Treaty
At present, the ROCR.O.C. has income tax treaties with Indonesia, Singapore, New Zealand, Australia, the United Kingdom, South Africa, Gambia, Swaziland,eSwatini (Swaziland), Malaysia, Macedonia, the Netherlands, Senegal, Sweden, Belgium, Denmark, Israel, Vietnam, Paraguay, Hungary, France, India, Slovakia, Switzerland, Germany, Thailand, Kiribati, Luxembourg, Austria, Italy, Japan, Canada and Italy.Poland. These tax treaties may limit the rate of ROCR.O.C. withholding tax on dividends paid with respect to common shares issued by ROCR.O.C. companies. A non-ROCnon-R.O.C. holder of ADSs may or may not be considered as the beneficial owner of common shares for the purposes of such treaties. Accordingly, holders of ADSs who wish to apply a reduced withholding tax rate that is provided under a tax treaty should consult their own tax advisers concerning such application. The United States does not have an income tax treaty with the ROC.R.O.C.
100
United States Federal Income Taxation
The following discussion describes the material U.S. federal income tax consequences of the ownership and disposition of our common shares or ADSs to those U.S. Holders described below who hold such common shares or ADSs as capital assets for U.S. federal income tax purposes. As used herein, a “U.S. Holder” is a beneficial owner of our common shares or ADSs that is for U.S. federal income tax purposes:
| · | a citizen or individual resident of the United States; |
| · | a corporation, or other entity taxable as a corporation, created or organized under the laws of the United States or of any political subdivision of the United States; or |
109
| · | an estate or trust the income of which is subject to U.S. federal income taxation regardless of its source. |
This discussion assumes that we are not a passive foreign investment company, as discussed below.
| · | This discussion assumes that we are not a passive foreign investment company, as discussed below. |
This discussion does not address all of the tax consequences that may be relevant in light of a U.S. Holder’s particular circumstances. In particular, it does not address all of the tax consequences that may be relevant to holders subject to special rules, including:
| · | This discussion does not address all of the tax consequences that may be relevant in light of a U.S. Holder’s particular circumstances. In particular, it does not address all of the tax consequences that may be relevant to holders subject to special rules, including: |
| · | persons subject to the alternative minimum tax; |
| · | persons subject to taxation under the provisions of the Internal Revenue Code of 1986, as amended (the “Code”), known as the Medicare contribution tax; |
| · | insurance companies; |
| · | tax-exempt entities, including “individual retirement accounts” or “Roth IRAs”; |
| · | dealers or traders in securities who use a mark-to-market method of accounting for U.S. federal income tax purposes; |
| · | certain financial institutions; |
| · | partnerships or other entities classified as partnerships for U.S. federal income tax purposes; |
| · | persons holding common shares or ADSs in connection with a trade or business conducted outside of the U.S.; |
| · | persons who hold or will hold common shares or ADSs as part of a straddle, hedge, conversion transaction, integrated transaction or similar transaction; |
| · | persons whose functional currency for U.S. federal income tax purposes is not the U.S. dollar; |
| · | persons who own or are deemed to own 10% or more of the voting power or value of our |
| · | persons who acquired our common shares or ADSs pursuant to the exercise of any employee stock option or otherwise as compensation. |
If an entity that is classified as a partnership for U.S. federal income tax purposes holds our common shares or ADSs, the U.S. federal income tax treatment of a partner will generally depend on the status of the partner and the activities of the partnership. Partnerships holding our common shares or ADSs and partners in such partnerships should consult their tax advisers as to the particular U.S. federal income tax consequences of holding and disposing of our common shares or ADSs.
This discussion is based on the Code, final, temporary and proposed Treasury regulations, administrative pronouncements and judicial decisions, all as of the date hereof. These laws and regulations are subject to change, possibly with retroactive effect. This discussion is also based in part on representations by the depositary bank and assumes that each obligation under the deposit agreementDeposit Agreement and any related agreement will be performed in accordance with its terms.
101
In general, for U.S. federal income tax purposes, a U.S. Holder who owns ADSs should be treated as the owner of the common shares represented by the ADSs. Accordingly, no gain or loss should be recognized if a U.S. holderHolder exchanges ADSs for the common shares represented by those ADSs.
110
The U.S. Treasury has expressed concerns that parties to whom American depositary shares are released before delivery of shares to the depositary bank (“pre-release”), or intermediaries in the chain of ownership between holders and the issuer of the security underlying the American depositary shares, may be taking actions that are inconsistent with the claiming of foreign tax credits by the holders of American depositary shares. Such actions would also be inconsistent with the claiming of the preferential rates of tax applicable to dividends received by certain non-corporate U.S. holders.Holders. Accordingly, the creditability of ROCR.O.C. taxes and the availability of the preferential tax rates for dividends received by certain non-corporate U.S. Holders, both described below, could be affected by actions that may be taken by such parties or intermediaries.
U.S. Holders should consult their tax advisers with regard to the application of the U.S. federal income tax laws to their common shares or ADSs as well as any tax consequences arising under the laws of any state, local or non-U.S. taxing jurisdiction.
Dividends
Distributions paid on our common shares or ADSs (other than certainpro rata distributions of our common shares to all shareholders, including holders of ADSs), including the amount of any ROCR.O.C. taxes withheld thereon, reduced by any credit against the withholding tax on account of the 10% retained earnings tax imposed on us, generally will constitute foreign-source dividend income to the extent paid out of our current or accumulated earnings and profits as determined in accordance with U.S. federal income tax principles. Because we do not maintain calculations of our earnings and profits under U.S. federal income tax principles, we expect that distributions generally will be reported to U.S. Holders as dividends. The amount a U.S. Holder will be required to include in income for any dividend paid in NT dollars will be equal to the U.S. dollar value of the NT dollars paid, calculated by reference to the exchange rate in effect on the date the payment is received by the depositary (in the case of ADSs) or by a U.S. Holder (in the case of common shares), regardless of whether the payment is in fact converted into U.S. dollars on the date of receipt. If a U.S. Holder does not convert the NT dollars so received into U.S. dollars on the date of receipt, any gain or loss recognized on a subsequent sale or other disposition of the NT dollars generally will be U.S.-source ordinary income or loss. The amount of any taxable distribution of property other than cash will be the fair market value of such property on the date of distribution. Dividends will not be eligible for the dividends-received deduction generally available to U.S. corporations under the Code.
Subject to applicable limitations and the discussion above regarding concerns expressed by the U.S. Treasury, under current law, certain dividends paid by qualified foreign corporations to certain non-corporate U.S. Holders are taxable at the preferential rates applicable to long-term capital gain. A foreign corporation is treated as a qualified foreign corporation with respect to dividends paid by that corporation on shares (or ADSs representing such shares) that are readily tradable on a securities market in the United States, such as the New York Stock Exchange,NYSE, where our ADSs are traded. U.S. Holders should consult their tax advisers to determine whether these preferential rates may apply to dividends they receive and whether they are subject to any special rules that limit their ability to be taxed at these preferential rates.
Subject to applicable limitations and restrictions, some of which vary depending upon the U.S. Holder’s circumstances, and the discussion above regarding concerns expressed by the U.S. Treasury, the ROCR.O.C. taxes withheld from dividend distributions, reduced by any credit against the withholding tax which is paid by us on account of the 10% retained earnings tax, will be eligible for credit against the U.S. Holder’s U.S. federal income tax liability. The limitation on foreign taxes eligible for credit is calculated separately with respect to specific classes of income. The rules governing foreign tax credits are complex and, therefore, U.S. Holders should consult their tax advisers regarding the availability of foreign tax credits in their particular circumstances. Instead of claiming a credit, U.S. Holders may, at their election, deduct otherwise creditable ROCR.O.C. taxes in computing their taxable income, subject to generally applicable limitations under U.S. law. An election to deduct foreign taxes instead of claiming foreign tax credits applies to all taxes paid or accrued in the taxable year to foreign countries and possessions of the United States.
102
Certainpro rata distributions of common shares by a company to its shareholders, including holdersHolders of ADSs, will not be subject to U.S. federal income tax. Accordingly, these distributions will not give rise to U.S. federal income against which the ROCR.O.C. tax imposed on these distributions may be credited. U.S. Holders should consult their tax advisers as to whether any ROCR.O.C. tax imposed on such distributions may be creditable against their U.S. federal income tax on foreign-source income from other sources.
Capital Gains
A U.S. Holder generally will recognize U.S.-source capital gain or loss for U.S. federal income tax purposes on the sale or exchange of our common shares or ADSs, which will be long-term capital gain or loss if our common shares or ADSs were held by the U.S. Holder for more than one year. The amount of gain or loss will be equal to the difference between the U.S. Holder’s tax basis in our common shares or ADSs disposed of and the amount realized on disposition, in each case as determined in U.S. dollars. A U.S. Holder’s basis in our common shares or ADSs will generally equal the U.S. Holder’s cost of such common shares or ADSs. If a U.S. Holder receives our common shares or ADSs in a non-taxablepro rata distribution with respect to its ADSs or common shares (the “new securities”), the basis of such new securities must be determined by allocating the basis of the common shares or ADSs with respect to which the new securities were issued (the “old securities”) between the old securities and new securities in proportion to their fair market values on the date of distribution. U.S. Holders should consult their tax advisers about the treatment of capital gains, which may be taxed at lower rates than ordinary income for non-corporate taxpayers, and capital losses, the deductibility of which may be limited.
111
Passive Foreign Investment Company Rules
We believe that we were not a passive foreign investment company, or PFIC,“PFIC”, for U.S. federal income tax purposes for our 20152018 taxable year. However, since PFIC status depends upon the composition of a company’s income and assets and the market value of its assets (including, among others, less than 25 percent owned equity investments) from time to time, there can be no assurance that we will not be considered a PFIC for any taxable year.
If we were treated as a PFIC for any taxable year during which a U.S. Holder held a common share or an ADS, certain adverse consequences could apply to that U.S. Holder. If we are a PFIC for any taxable year during which a U.S. Holder ownedowns a common share or an ADS, such U.S. Holder will generally be required to file Internal Revenue Service Form 8621 with their annual U.S. federal income tax returns, subject to certain exceptions.
Information Reporting and Backup Withholding
Payments of dividends and sales proceeds that are made within the United States or through certain U.S.-related financial intermediaries generally are subject to information reporting, and may be subject to backup withholding, unless (i) the U.S. Holder is an exempt recipient or (ii) in the case of backup withholding, the U.S. Holder provides a correct taxpayer identification number and certifies that it is not subject to backup withholding.
The amount of any backup withholding from a payment to a U.S. Holder will be allowed as a credit against the U.S. Holder’s U.S. federal income tax liability and may entitle it to a refund, provided that the required information is timely furnished to the Internal Revenue Service.
Not applicable.applicable
Not applicable.
We file annual reports on Form 20-F and periodic reports on Form 6-K with the SEC. You can read and copy these reports and other information at the SEC’s Public Reference Room at 450 Fifth Street, N.W., Washington, D.C. 20549. You can also request copies of the documents, upon payment of a duplicating fee, by writing to the Public Reference Section of the SEC. Please call the SEC at 1-800-SEC-0330 for further information on the operation of the Public Reference Room. The reports and other information we file electronically with the SEC are also available to the public from the SEC’s website athttp://www.sec.gov.www.sec.gov. Information about ASEH is also available to the public on our website athttp://www.aseglobal.com.
103
Not applicable.
112
Item 11. Quantitative and Qualitative Disclosures about Market Risk
Market Risk
Our exposure to financial market risks relates primarily to changes in interest rates and foreign currency exchange rates.
Interest Rate Risk. Our exposure to interest rate risks relates primarily to our long-term floating rate loans, which is normally incurred to support our corporate activities and capital expenditures. See note 3136 to our consolidated financial statements included in this annual report for details on interest rate sensitivity analysis.
We entered into several interest rate swap contracts to mitigate the interest rate risk onrisks in relation to our long-term loans. In April 2013, J&R Holding Limited entered into an interest rate swap contract in the amount of RMB240.0 million, which matured in April 2014, with interest receipt based on a floating rate of 1.05% to 2.80% and payment based on a fixed rate of 2.0%. In February 2014, J&R Holding Limited entered into another interest rate swap contract in the amount of RMB240.0 million, which had the maturity schedulewas scheduled to mature in February 2015 but was early settled in May 2014, with interest receipt based on a floating rate of 1.20% to 1.40% and payment based on a fixed rate of 1.35%. We recognized these contracts as hedging derivative liabilities-current with an adjustment to shareholders’ equity.
In October 2015, we entered into an interest rate swap contract in the amount of NT$1,000.0 million, (US$30.5 million), which will maturematured in October 2016, with interest receipt based on a floating rate of 0.00% to 5.00% and payment based on a fixed rate of 4.60%. See note 7 to our consolidated financial statements included in this annual report for details of the contract. The fair value of the contract as of December 31, 2015 was negative NT$0.1 million (US$0.003 million) and weWe recognized it as financial liabilities held for trading with an adjustment to profit or loss.
The tables below set forth information relating to our significant obligations, including short-term borrowings and long-term borrowings, including bank loans, bills payable, capital lease obligations and bonds payable, that are sensitive to interest rate fluctuations as of December 31, 2015.2018.
| Expected Maturity Date | ||||||||||||||||||||||||||||||||
| 2016 | 2017 | 2018 | 2019 | 2020 | Thereafter | Total | Fair Value | |||||||||||||||||||||||||
| (in millions, except percentages) | ||||||||||||||||||||||||||||||||
| Short-term borrowings: | ||||||||||||||||||||||||||||||||
| Variable rate (NT$) | 100.0 | – | – | – | – | – | 100.0 | 100.0 | ||||||||||||||||||||||||
| Average interest rate | 0.99% | – | – | – | – | – | 0.99% | |||||||||||||||||||||||||
| Fixed rate (NT$) | 11,780.0 | – | – | – | – | – | 11,780.0 | 11,780.0 | ||||||||||||||||||||||||
| Average interest rate | 0.79% | – | – | – | – | – | 0.79% | |||||||||||||||||||||||||
| Variable rate (US$) | 125.1 | – | – | – | – | – | 125.1 | 125.1 | ||||||||||||||||||||||||
| Average interest rate | 1.25% | – | – | – | – | – | 1.25% | |||||||||||||||||||||||||
| Fixed rate (US$) | 163.4 | – | – | – | – | – | 163.4 | 163.4 | ||||||||||||||||||||||||
| Average interest rate | 1.10% | – | – | – | – | – | 1.10% | |||||||||||||||||||||||||
| Variable rate (RMB) | 2,688.3 | – | – | – | – | – | 2,688.3 | 2,688.3 | ||||||||||||||||||||||||
| Average interest rate | 3.79% | – | – | – | – | – | 3.79% | |||||||||||||||||||||||||
| Fixed rate (RMB) | 5.0 | – | – | – | – | – | 5.0 | 5.0 | ||||||||||||||||||||||||
| Average interest rate | 5.08% | – | – | – | – | – | 5.08% | |||||||||||||||||||||||||
| Fixed rate (EUR) | 56.3 | – | – | – | – | – | 56.3 | 56.3 | ||||||||||||||||||||||||
| Average interest rate | 0.71% | – | – | – | – | – | 0.71% | |||||||||||||||||||||||||
| Long-term borrowings: | ||||||||||||||||||||||||||||||||
| Variable rate (NT$) | 683.3 | 11,642.2 | 4,211.1 | 833.4 | – | – | 17,370.0 | 17,370.0 | ||||||||||||||||||||||||
| Average interest rate | 1.13% | 0.89% | 1.08% | 1.16% | – | – | 0.96% | |||||||||||||||||||||||||
| Fixed rate (NT$) | 8,000.0 | – | 1,500.0 | – | – | – | 9,500.0 | 9,500.0 | ||||||||||||||||||||||||
| Average interest rate | 1.45% | – | 1.17% | – | – | – | 1.41% | |||||||||||||||||||||||||
| Variable rate (US$) | 104.3 | 369.6 | 210.0 | – | – | – | 683.9 | 683.9 | ||||||||||||||||||||||||
| Average interest rate | 1.96% | 1.91% | 2.07% | – | – | – | 1.96% | |||||||||||||||||||||||||
| Fixed rate (US$) | 0.0 | 300.1 | 0.1 | – | – | – | 300.2 | 300.2 | ||||||||||||||||||||||||
| Average interest rate | 5.72% | 2.13% | 5.71% | – | – | – | 2.13% | |||||||||||||||||||||||||
| Variable rate (RMB) | 11.3 | 23.7 | 88.0 | 187.0 | 198.0 | 135.2 | 643.2 | 643.2 | ||||||||||||||||||||||||
| Average interest rate | 4.64% | 6.34% | 9.20% | 6.52% | 7.63% | 7.46% | 7.39% | |||||||||||||||||||||||||
| Fixed rate (RMB) | 500.5 | 0.0 | – | – | – | – | 500.5 | 500.5 | ||||||||||||||||||||||||
| Average interest rate | 4.25% | 2.29% | – | – | – | – | 4.25% | |||||||||||||||||||||||||
| Expected Maturity Date | ||||||||||||||||||||||||||||||||
| 2019 | 2020 | 2021 | 2022 | 2023 | Thereafter | Total | Fair Value | |||||||||||||||||||||||||
| (in millions, except percentages) | ||||||||||||||||||||||||||||||||
| Short-term borrowings: | ||||||||||||||||||||||||||||||||
| Variable rate (NT$) | 16,485.0 | - | - | - | - | - | 16,485.0 | 16,485.0 | ||||||||||||||||||||||||
| Average interest rate | 0.99 | % | - | - | - | - | - | 0.99 | % | - | ||||||||||||||||||||||
| Fixed rate (NT$) | 5,900.0 | - | - | - | - | - | 5,900.0 | 5,900.0 | ||||||||||||||||||||||||
| Average interest rate | 1.15 | % | - | - | - | - | - | 1.15 | % | - | ||||||||||||||||||||||
| Variable rate (US$) | 278.5 | - | - | - | - | - | 278.5 | 278.5 | ||||||||||||||||||||||||
| Average interest rate | 3.12 | % | - | - | - | - | - | 3.12 | % | - | ||||||||||||||||||||||
| Fixed rate (US$) | 210.9 | - | - | - | - | - | 210.9 | 210.9 | ||||||||||||||||||||||||
| Average interest rate | 3.21 | % | - | - | - | - | - | 3.21 | % | - | ||||||||||||||||||||||
| Variable rate (RMB) | 1,289.3 | - | - | - | - | - | 1,289.3 | 1,289.3 | ||||||||||||||||||||||||
| Average interest rate | 3.88 | % | - | - | - | - | - | 3.88 | % | - | ||||||||||||||||||||||
| Fixed rate (RMB) | 14.8 | - | - | - | - | - | 14.8 | 14.8 | ||||||||||||||||||||||||
| Average interest rate | 4.20 | % | - | - | - | - | - | 4.20 | % | - | ||||||||||||||||||||||
| Fixed rate (EUR) | 0.3 | - | - | - | - | - | 0.3 | 0.3 | ||||||||||||||||||||||||
| Average interest rate | 0.95 | % | - | - | - | - | - | 0.95 | % | - | ||||||||||||||||||||||
| Long-term borrowings: | ||||||||||||||||||||||||||||||||
| Variable rate (NT$) | 6,996.3 | 46,701.9 | 13,316.7 | 11,000.0 | 22,000.0 | - | 100,014.9 | 100,014.9 | ||||||||||||||||||||||||
| Average interest rate | 1.67 | % | 1.21 | % | 1.75 | % | 2.24 | % | 2.39 | % | - | 1.68 | % | - | ||||||||||||||||||
| Fixed rate (NT$) | - | - | 7,000.0 | 3,700.0 | 2,000.0 | 4,300.0 | 17,000.0 | 17,000.0 | ||||||||||||||||||||||||
| Average interest rate | - | - | 1.30 | % | 1.25 | % | 1.50 | % | 1.45 | % | 1.35 | % | - | |||||||||||||||||||
| Variable rate (US$) | 100.0 | 609.8 | 143.8 | 83.3 | 56.7 | - | 993.6 | 993.6 | ||||||||||||||||||||||||
| Average interest rate | 3.05 | % | 2.80 | % | 2.93 | % | 3.10 | % | 3.28 | % | - | 2.90 | % | - | ||||||||||||||||||
| Fixed rate (US$) | 0.0 | 0.0 | 0.1 | - | - | - | 0.1 | 0.1 | ||||||||||||||||||||||||
| Average interest rate | 7.79 | % | 7.79 | % | 7.79 | % | - | - | - | 7.79 | % | - | ||||||||||||||||||||
| Variable rate (RMB) | 187.5 | 198.6 | 198.6 | 198.6 | 198.6 | - | 981.9 | 981.9 | ||||||||||||||||||||||||
| Average interest rate | 5.20 | % | 5.40 | % | 5.56 | % | 5.66 | % | 5.60 | % | - | 5.49 | % | - | ||||||||||||||||||
104113
Foreign Currency Exchange Rate Risk. Our foreign currency exposure gives rise to market risk associated with exchange rate movements against the NT dollar, our functional currency. Currently, the majority of our revenues are denominated in U.S. dollars, with a portion denominated in NT dollars and Japanese yen. Our costs of revenues and operating expenses are incurred in several currencies, primarily in NT dollars, U.S. dollars, RMB, Japanese yen, Korean won, as well as, to a lesser extent, Singapore dollars and Malaysian ringgit. In addition, a substantial portion of our capital expenditures, primarily for the purchase of packaging and testing equipment, has been, and is expected to continue to be, denominated primarily in U.S. dollars with the remainder in Japanese yen. The majority of our borrowings are denominated in NT dollars, U.S. dollars and RMB. Fluctuations in exchange rates, primarily among the U.S. dollar against the NT dollar, RMB and the Japanese yen, will affect our costs and operating margins and could result in exchange losses and increased costs in NT dollar and other local currency terms. See note 3136 to our consolidated financial statements included in this annual report for details on foreign currency exchange rate sensitivity analysis.
Despite hedging and mitigating techniques implemented by us, fluctuations in exchange rates have affected, and may continue to affect, our financial condition and results of operations. We recorded net foreign exchange gains of NT$1,928.4 million in 2016, net foreign exchange gains of NT$3,502.6 million in 2017 and losses of NT$276.21,015.6 million NT$1,222.0 million and NT$713.2 million (US$21.833.2 million) in 2013, 2014 and 2015, respectively. In 2013, 2014 and 2015, the average exchange rate of the NT dollar to the U.S. dollar was 29.73, 30.38 and 31.80, respectively, calculated based on the statistical release by the Federal Reserve Board.2018. To protect against reductions in value and the volatility of future cash flows caused by changes in foreign currency exchange rates, we utilizehold a variety of derivative financial instruments, including currency forward exchange contracts and swap contracts, from time to time to reduce the impact of foreign currency fluctuations on our results of operations.
Our policyhedging strategy is to account forlift foreign currency borrowings to avoid 100% exchange rate exposure of its foreign currency equity instruments, which is designated as fair value hedges. When the foreign currency equity instruments were evaluated based on the exchange rates on each balance sheet date, the foreign exchange gains (losses) will be completely offset when hedge adjustments are made. The source of hedge ineffectiveness in these contracts on a mark-to-market rate basis.hedging relationships is the material difference between the notional amounts of foreign currency borrowings and foreign currency equity instruments. No other sources of ineffectiveness is expected to emerge from these hedging relationships.
The table below sets forth our outstanding forward exchange contracts and swap contracts, for which the expected maturity dates are in 2016,2019, in aggregate terms by type of contract as of December 31, 2015.2018.
114
Forward Exchange Contracts and Swap Contracts
Forward Exchange Contracts | Swap Contracts | |||
| Buy US$ against NT$ | ||||
| Notional Amount | US$80.0 million | US$ | ||
| Weighted Average Strike Price | US$/NT$30.669 | US$/NT$ | ||
| Fair Value | Negative US$0.248 million | US$ | ||
| Sell US$ against NT$ | ||||
| Notional Amount | - | US$ | ||
| Weighted Average Strike Price | - | US$/NT$ | ||
| Fair Value | - | |||
| Sell US$ against RMB | ||||
| Notional Amount | US$29.0 million | US$ | ||
| Weighted Average Strike Price | US$/RMB6.900 | US$/ | ||
| Fair Value | ||||
| Sell US$ against JP¥ | ||||
| Notional Amount | US$37.7 million | US$ | ||
| Weighted Average Strike Price | US$/JP¥112.149 | US$/JP¥ | ||
| Fair Value | US$0.646 million | US$ | ||
| Sell US$ against MYR | ||||
| Notional Amount | US$ | |||
| Weighted Average Strike Price | US$/MYR4.174 | |||
| Fair Value | ||||
| Sell US$ against SGD | ||||
| Notional Amount | US$ | |||
| Weighted Average Strike Price | US$/SGD1.372 | |||
| Fair Value | ||||
| Sell US$ against | ||||
| Notional Amount | US$ | |||
| Weighted Average Strike Price | US$/EUR0.877 | |||
| Fair Value | US$ |
105
Other Market Risk. Our exposure to other market risk relates primarily to our investments in publicly-traded stock, private-placement bonds,quoted ordinary shares, open-end mutual funds, unquoted preferred shares, private-placement funds, private-placement convertible bonds and limited partnership interests.financial assets at fair value through other comprehensive income for the year ended December 31, 2018. The value of these investments may fluctuate based on various factors including prevailing market conditions. Moreover, the fair value of investments in unlisted securities may be significantly different from their carrying value. As of December 31, 2015,2018, our investments in publicly traded stock,quoted ordinary shares, open-end mutual funds, unquoted preferred shares, private-placement funds and private-placement convertible bonds classified as financial assets at fair value through profit or loss were NT$710.86,308.7 million (US$21.7206.1 million). As of December 31, 2015,2018, our investments classified as available-for-sale financial assets at fair value through other comprehensive income were NT$954.71,597.3 million (US$29.152.2 million), primarily consisting of publicly-traded stock, open-end mutual fundsunquoted ordinary shares, unsecured subordinate corporate bonds, unquoted preferred shares and limited partnership interests.If the fair values of these investments fluctuate byequity and bond prices were 1.0%, our higher or lower, profit before income tax will increasewould have increased or decreasedecreased approximately by approximately NT$7.164.0 million (US$0.22.1 million) for the same period and our other comprehensive income before income tax will increasewould have increased or decreasedecreased approximately by approximately NT$10.016.0 million (US$0.30.5 million) for the same period. In addition, we are also exposed to our share price risk through conversion option, redemption option and put option of convertible bonds recognized as financial liabilities held for trading. If our share price increases or decreases by 7.0%, our profit before income tax for the year ended December 31, 2015 will decrease by NT$605.0 million (US$18.5 million) or increase by NT$638.0 million (US19.5 million), respectively. Furthermore, fluctuations in gold prices may also affect the price at which we have been able to purchase gold wire. How this will impact the results of our operations depends on whether such costs can be transferred onto our customers.
115
Item 12. Description of Securities Other Than Equity Securities
Not applicable.
Not applicable.
Not applicable.
Depositary Fees and Charges
Under the terms of the amended and restated deposit agreement dated September 29, 2000 among Citibank, N.A., as depositary, holders and beneficial owners of ADSs and us, which was filed as an exhibit to our registration statement on Form F-6 on September 16, 2003, and its two amendments, which were filed as an exhibit to our registration statement on post-effective amendment No. 1 to Form F-6 on April 3, 2006 and our registration statement on post-effective amendment No. 2 to Form F-6 on October 25, 2006, respectively, for our ADSs, an ADS holder may have to pay the following service fees to the depositary bank:
106
Service | Fees |
| Issuance of ADSs | Up to US$5.00 per 100 ADSs (or fraction thereof) issued |
| Delivery of deposited securities against surrender of ADSs | Up to US$5.00 per 100 ADSs (or fraction thereof) surrendered |
| Distribution of cash dividends or other cash distributions | Up to US$5.00 per 100 ADSs (or fraction thereof) held, unless prohibited by the exchange upon which the ADSs are listed |
| Distribution of ADSs pursuant to (i) stock dividends or other free stock distributions, or (ii) exercises of rights to purchase additional ADSs | Up to US$5.00 per 100 ADSs (or fraction thereof) held, unless prohibited by the exchange upon which the ADSs are listed |
| Distribution of securities other than ADSs or rights to purchase additional ADSs | Up to US$5.00 per 100 ADSs (or fraction thereof) held |
| Depositary Services | Up to US$5.00 per 100 ADSs (or fraction thereof) held, unless prohibited by the exchange upon which the ADSs are listed |
| Transfer of ADRs | US$1.50 per certificate presented for transfer |
An ADS holder will also be responsible to pay certain fees and expenses incurred by the depositary bank and certain taxes and governmental charges such as:
| · | taxes (including applicable interest and penalties) and other governmental charges; |
| · | such registration fees as may from time to time be in effect for the registration of shares or other deposited securities on the share register and applicable to transfers of shares or other deposited securities to or from the name of the custodian, the depositary or any nominees upon the making of deposits and withdrawals, respectively; |
| · | such cable, telex and facsimile transmission and delivery expenses as are expressly provided in the Deposit Agreement to be at the expense of the person depositing or withdrawing shares or holders and beneficial owners of ADSs; |
116
| · | the expenses and charges incurred by the depositary in the conversion of foreign currency; |
| · | such fees and expenses as are incurred by the depositary in connection with compliance with exchange control regulations and other regulatory requirements applicable to shares, deposited securities, ADSs and ADRs; and |
| · | the fees and expenses incurred by the depositary, the custodian or any nominee in connection with the servicing or delivery of deposited securities. |
Depositary fees payable upon the issuance and cancellation of ADSs are typically paid to the depositary bank by the brokers (on behalf of their clients) receiving the newly-issued ADSs from the depositary bank and by the brokers (on behalf of their clients) delivering the ADSs to the depositary bank for cancellation. The brokers in turn charge these transaction fees to their clients.
Depositary fees payable in connection with distributions of cash or securities to ADS holders and the depositary services fee are charged by the depositary bank to the holders of record of ADSs as of the applicable ADS record date. Depositary fees payable for cash distributions are generally deducted from the cash being distributed. In case of distributions other than cash (i.e.(i.e., stock dividends, rights offerings), the depositary bank charges the applicable fee to the ADS record date holders concurrent with the distribution. In the case of ADSs registered in the name of the investor (whether certificated or un-certificated in direct registration), the depositary bank sends invoices to the applicable record date ADS holders. In case of ADSs held in brokerage and custodian accounts via the central clearing and settlement system, The Depository Trust Company (DTC), the depositary bank generally collects its fees through the systems provided by DTC (whose nominee is the registered holder of the ADSs held in DTC) from the brokers and custodians holding ADSs in their DTC accounts. The brokers and custodians who hold their clients’ ADSs in DTC accounts in turn charge their clients’ accounts the amount of the fees paid to the depositary banks.
107
In the event of refusal to pay depositary fees, the depositary bank may, under the terms of the Deposit Agreement, refuse the requested service until payment is received or may set-off the amount of the depositary fees from any distribution to be made to the ADS holder. Note that the fees and charges you may be required to pay may vary over time and may be changed by us and by the depositary bank. You will receive prior notice of such changes.
Depositary Payments
In 2015,2018, we received US$103,528.82,214,264.51 from Citibank, N.A., the depositary bank for our ADR programs. The table below sets forth details of the amount we received from Citibank, N.A.
| Depositary Payments | ||||||||
| Reimbursement of settlement infrastructure fees | US$ | 178.00 | ||||||
| Reimbursement of proxy process expenses | US$ | 28,652.97 | ||||||
| Reimbursement of ADR holders identification expenses | US$ | 214,345.81 | ||||||
| Reimbursement of legal fees | US$ | 21,546.31 | ||||||
| Direct reimbursement | US$ | 1,949,541.42 | ||||||
| Net payment received by us(1) | 2,214,264.51 | |||||||
____________________________________
| (1) | Net of U.S. withholding tax. |
117
Item 13. Defaults, Dividend Arrearages and Delinquencies
Not applicable.
Item 14. Material Modifications to the Rights of Security Holders and Use of Proceeds
Not applicable.
Item 15. Controls and Procedures
Disclosure Controls and Procedures
As of December 31, 2015, we, under the supervision and2018, our management, with the participation of our management, including our Chief Executive Officerchief executive officer and Chief Financial Officer, performed an evaluation ofchief financial officer, evaluated the effectiveness of our disclosure controls and procedures as defined in Rules 13a-15(e) and 15(d)-15(e) under the Exchange Act. Our management necessarily applied its judgment in assessing the costs and benefits of such controls and procedures, which by their nature can provide only reasonable assurance regarding management’s control objectives. Based on this evaluation, our Chief Executive Officerchief executive officer and Chief Financial Officerchief financial officer concluded that our disclosure controls and procedures are effective for recording, processing, summarizing and reporting, within the time periods specified in the SEC’s rules and forms, information required to be disclosed in the reports we file or submit under the Exchange Act, and for accumulating and communicating such information to our management, including our Chief Executive Officerchief executive officer and Chief Financial Officer,chief financial officer, as appropriate to allow timely decisions regarding required disclosure.
Management’s Annual Report on Internal Control Over Financial Reporting
Our management is responsible for establishing and maintaining adequate internal control over financial reporting, as defined in Rule 13a-15(f) and 15d-15(f) promulgated under the Securities Exchange Act of 1934.
Because of its inherent limitations, internal control over financial reporting may not prevent or detect misstatements. Projections of any evaluation of effectiveness to future periods are subject to the risk that controls may become inadequate because of changes in conditions, or that the degree of compliance with the policies or procedures may deteriorate.
Our management assessed the effectiveness of our internal control over financial reporting as of December 31, 2015.2018. In making this assessment, our management used the criteria set forth by the Committee of Sponsoring Organizations of the Treadway Commission (COSO) in Internal Control-Integrated Framework (2013).
108
Based on this assessment, management concluded that, as of December 31, 2015,2018, our internal control over financial reporting is effective based on those criteria.
Our independent registered public accounting firm, Deloitte & Touche, independently assessed the effectiveness of our internal control over financial reporting. Deloitte & Touche has issued an attestation report, which is included below. SPIL’s independent registered public accounting firm, PricewaterhouseCoopers, independently assessed the effectiveness of SPIL’s internal control over financial reporting. PricewaterhouseCoopers has issued an attestation report, which is included below.
Report of the Independent Registered Public Accounting Firm
To: the shareholders and Board of Directors and Shareholders of Advanced Semiconductor Engineering, Inc.ASE Technology Holding Co., Ltd.
Opinion on Internal Control over Financial Reporting
We have audited the internal control over financial reporting of Advanced Semiconductor Engineering, Inc.ASE Technology Holding Co., Ltd. (a corporation incorporated under the laws of the Republic of China) and its subsidiaries (the “Company”(collectively, the “Group”) as of December 31, 2015,2018, based on the criteria established inInternal Control-IntegratedControl - Integrated Framework (2013) issued by the Committee of Sponsoring Organizations of the Treadway Commission.Commission (COSO). In our opinion, based on our audit and the report of other auditors, the Group maintained, in all material respects, effective internal control over financial reporting as of December 31, 2018, based on criteria established inInternal Control - Integrated Framework (2013) issued by COSO.
118
We did not audit the effectiveness of internal control over financial reporting of Siliconware Precision Industries Co., Ltd. and its subsidiaries (collectively, “SPIL”), a wholly owned subsidiary, whose consolidated financial statements reflect total assets and revenues constituting 22% and 17%, respectively, of the related consolidated financial statement amounts as of and for the year ended December 31, 2018. The Company'seffectiveness of SPIL’s internal control over financial reporting was audited by other auditors whose report has been furnished to us, and our opinion, insofar as it relates to the effectiveness of SPIL’s internal control over financial reporting, is based solely on the report of other auditors.
We have also audited, in accordance with the standards of the Public Company Accounting Oversight Board (United States) (PCAOB), the consolidated financial statements as of and for the year ended December 31, 2018 of the Group and our report dated April 26, 2019, expressed an unqualified opinion on those financial statements based on our audit and the report of other auditors.
Basis for Opinion
The Group’s management is responsible for maintaining effective internal control over financial reporting and for its assessment of the effectiveness of internal control over financial reporting, included in the accompanying Management’s Annual Report on Internal Control over Financial Reporting. Our responsibility is to express an opinion on the Company'sGroup’s internal control over financial reporting based on our audit. We are a public accounting firm registered with the PCAOB and are required to be independent with respect to the Group in accordance with the U.S. federal securities laws and the applicable rules and regulations of the Securities and Exchange Commission and the PCAOB.
We conducted our audit in accordance with the standards of the Public Company Accounting Oversight Board (United States).PCAOB. Those standards require that we plan and perform the audit to obtain reasonable assurance about whether effective internal control over financial reporting was maintained in all material respects. Our audit included obtaining an understanding of internal control over financial reporting, assessing the risk that a material weakness exists, testing and evaluating the design and operating effectiveness of internal control based on the assessed risk, and performing such other procedures as we considered necessary in the circumstances. We believe that our audit providesand the audit of other auditors provide a reasonable basis for our opinion.
Definition and Limitations of Internal Control over Financial Reporting
A company’s internal control over financial reporting is a process designed by, or under the supervision of, the company’s principal executive and principal financial officers, or persons performing similar functions, and effected by the company’s board of directors, management, and other personnel to provide reasonable assurance regarding the reliability of financial reporting and the preparation of financial statements for external purposes in accordance with generally accepted accounting principles. A company’s internal control over financial reporting includes those policies and procedures that (1) pertain to the maintenance of records that, in reasonable detail, accurately and fairly reflect the transactions and dispositions of the assets of the company; (2) provide reasonable assurance that transactions are recorded as necessary to permit preparation of financial statements in accordance with generally accepted accounting principles, and that receipts and expenditures of the company are being made only in accordance with authorizations of management and directors of the company; and (3) provide reasonable assurance regarding prevention or timely detection of unauthorized acquisition, use, or disposition of the company’s assets that could have a material effect on the financial statements.
Because of its inherent limitations, internal control over financial reporting may not prevent or detect misstatements. Also, projections of any evaluation of effectiveness to future periods are subject to the risk that controls may become inadequate because of changes in conditions, or that the degree of compliance with the policies or procedures may deteriorate.
/s/ Deloitte & Touche
Taipei, Taiwan
Republic of China
April 26, 2019
119
Report of the Independent Registered Public Accounting Firm
To the Board of Directors and the Shareholder of Siliconware Precision Industries Co., Ltd.
Opinions on the Financial Statements and Internal Control over Financial Reporting
We have audited the accompanying consolidated balance sheets of Siliconware Precision Industries Co., Ltd. and its subsidiaries (the “Company”) as of December 31, 2018 and 2017, and the related consolidated statements of comprehensive income, of changes in equity and of cash flows for each of the three years in the period ended December 31, 2018, including the related notes (collectively referred to as the “consolidated financial statements”) (not presented herein). We also have audited the Company's internal control over financial reporting as of December 31, 2018, based on criteria established inInternal Control - Integrated Framework (2013) issued by the Committee of Sponsoring Organizations of the Treadway Commission (COSO).
In our opinion, the consolidated financial statements referred to above present fairly, in all material respects, the financial position of the Company as of December 31, 2018 and 2017, and the results of its operations and its cash flows for each of the three years in the period ended December 31, 2018 in conformity with International Financial Reporting Standards as issued by the International Accounting Standards Board. Also in our opinion, the Company maintained, in all material respects, effective internal control over financial reporting as of December 31 ,2018, based on criteria established inInternal Control - Integrated Framework (2013) issued by the COSO.
Change in Accounting Principles
As discussed in Note 3 to the consolidated financial statements, the Company changed the manner in which it accounts for revenues from contracts with customers and the manner in which it accounts for financial instruments in 2018.
Basis for Opinions
The Company's management is responsible for these consolidated financial statements, for maintaining effective internal control over financial reporting, and for its assessment of the effectiveness of internal control over financial reporting, included in Management’s Annual Report on Internal Control over Financial Reporting (not presented herein). Our responsibility is to express opinions on the Company’s consolidated financial statements and on the Company's internal control over financial reporting based on our audits. We are a public accounting firm registered with the Public Company Accounting Oversight Board (United States) (PCAOB) and are required to be independent with respect to the Company in accordance with the U.S. federal securities laws and the applicable rules and regulations of the Securities and Exchange Commission and the PCAOB.
We conducted our audits in accordance with the standards of the PCAOB. Those standards require that we plan and perform the audits to obtain reasonable assurance about whether the consolidated financial statements are free of material misstatement, whether due to error or fraud, and whether effective internal control over financial reporting was maintained in all material respects.
Our audits of the consolidated financial statements included performing procedures to assess the risks of material misstatement of the consolidated financial statements, whether due to error or fraud, and performing procedures that respond to those risks. Such procedures included examining, on a test basis, evidence regarding the amounts and disclosures in the consolidated financial statements. Our audits also included evaluating the accounting principles used and significant estimates made by management, as well as evaluating the overall presentation of the consolidated financial statements. Our audit of internal control over financial reporting included obtaining an understanding of internal control over financial reporting, assessing the risk that a material weakness exists, and testing and evaluating the design and operating effectiveness of internal control based on the assessed risk. Our audits also included performing such other procedures as we considered necessary in the circumstances. We believe that our audits provide a reasonable basis for our opinions.
120
Definition and Limitations of Internal Control over Financial Reporting
A company’s internal control over financial reporting is a process designed to provide reasonable assurance regarding the reliability of financial reporting and the preparation of financial statements for external purposes in accordance with generally accepted accounting principles. A company’s internal control over financial reporting includes those policies and procedures that (i) pertain to the maintenance of records that, in reasonable detail, accurately and fairly reflect the transactions and dispositions of the assets of the company; (ii) provide reasonable assurance that transactions are recorded as necessary to permit preparation of financial statements in accordance with International Financial Reporting Standards as issued by the International Accounting Standards Board,generally accepted accounting principles, and that receipts and expenditures of the company are being made only in accordance with authorizations of management and directors of the company; and (iii) provide reasonable assurance regarding prevention or timely detection of unauthorized acquisition, use, or disposition of the company’s assets that could have a material effect on the financial statements.
Because of theits inherent limitations, of internal control over financial reporting including the possibility of collusion or improper management override of controls, material misstatements due to error or fraud may not be preventedprevent or detected on a timely basis.detect misstatements. Also, projections of any evaluation of the effectiveness of the internal control over financial reporting to future periods are subject to the risk that the controls may become inadequate because of changes in conditions, or that the degree of compliance with the policies or procedures may deteriorate.
In our opinion, the Company maintained, in all material respects, effective internal control over financial reporting as of December 31, 2015, based on the criteria established in Internal Control-Integrated Framework (2013) issued by the Committee of Sponsoring Organizations of the Treadway Commission.
/s/PricewaterhouseCoopers, Taiwan
Taipei, Taiwan
March 21, 2019
We have also audited, in accordance withserved as the standards of the Public Company Accounting Oversight Board (United States), the consolidated financial statements of the Company as of and for the year ended December 31, 2015 and our report dated April 28, 2016 expressed an unqualified opinion on those financial statements and included an explanatory paragraph regarding the convenience translation of New Taiwan dollar amounts into U.S. dollar amounts.Company’s auditor since 1994.
/s/ Deloitte & Touche
Taipei, Taiwan
The Republic of China
April 28, 2016
109
Changes in Internal Control Over Financial Reporting
There has been no change in our internal control over financial reporting that occurred during the period covered by this annual report that has materially affected, or is reasonably likely to materially affect, our internal control over financial reporting.
Item 16A. Audit Committee Financial Expert
Our boardRepublic of directors determined that Shen-Fu Yu, Ta-Lin Hsu and Mei-Yueh Ho are audit committee financial experts as defined under the applicable rules of the SEC issued pursuant to Section 407 of the Sarbanes-Oxley Act of 2002 and are independent for the purposes of Rule 10A-3 of the Exchange Act.
China
We have adopted a code of ethics that satisfies the requirements of Item 16B of Form 20-F and applies to all employees, officers, supervisors and directors of our Company and subsidiaries, including our Chief Executive Officer, Chief Financial Officer and principal accounting officer. Our board of directors has approved and adopted the amended Code of Business Conduct and Ethics (“the Amended Code”) which came into force with effect from April 28, 2016. The amendments aim to build more robust and effective policies and procedures to enable high ethical standards of business conduct that can be persistently maintained, and mainly addressed revised policies with respect to anti-corruption, fair competition, avoidance of conflict of interest, prohibition against insider trading, anti-money laundering, protection to labor as well as whistleblowing policy and regulatory compliance. The Amended Code continues to apply to all employees, officers, supervisors and directors of our Company and subsidiaries, including our Chief Executive Officer, Chief Financial Officer and principal accounting officer. We have posted our code of ethics on our website athttp://www.aseglobal.com.
Item 16C. Principal Accountant Fees and Services
Policy on Pre-Approval of Audit and Non-Audit Services of Independent Registered Public Accounting Firm
Our audit committee, which was established on July 22, 2005, pre-approves all audit and non-audit services provided by our independent registered public accounting firm, including audit services, audit-related services, tax services and other services, on a case-by-case basis.
Independent Registered Public Accounting Firm’s Fees
The following table sets forth the aggregate fees by categories specified below in connection with certain professional services rendered by Deloitte & Touche. We did not pay any other fees to our independent registered public accounting firm during the periods indicated below.
| For the Year Ended December 31, | ||||||||||||||||
| 2013 | 2014 | 2015 | ||||||||||||||
| NT$ | NT$ | NT$ | US$ | |||||||||||||
| Audit fees(1) | 140,876.7 | 158,962.4 | 161,476.9 | 4,924.6 | ||||||||||||
| Audit-related fees(2) | 8,049.4 | 5,000.0 | 4,000.0 | 122.0 | ||||||||||||
| Tax fees(3) | 13,409.8 | 20,160.6 | 13,020.0 | 397.0 | ||||||||||||
| All other fees(4) | 5,077.0 | 5,592.2 | 10,541.6 | 321.5 | ||||||||||||
| Total | 167,412.9 | 189,715.2 | 189,038.5 | 5,765.1 | ||||||||||||
________________
110
Item 16D. Exemptions from the Listing Standards for Audit Committees
Not applicable.
Item 16E. Purchases of Equity Securities by the Issuer and Affiliated Purchasers
Share Repurchase
On November 29, 2010, we announced a share repurchase program, or Third Share Repurchase, to repurchase up to 37.0 million of our common shares at prices between NT$25.0 to NT$41.0 per share during the period from November 30, 2010 to January 28, 2011. This share repurchase program concluded on December 6, 2010, when a total of 37.0 million of our common shares had been repurchased pursuant to this program. As of January 19, 2011, all of these common shares we repurchased had been cancelled. On August 15, 2011, we announced a share repurchase program, or Fourth Share Repurchase, to repurchase up to 34.0 million of our common shares at prices between NT$20.0 to NT$45.0 per share during the period from August 16, 2011 to October 15, 2011. This share repurchase program concluded on August 29, 2011, when a total of 34.0 million of our common shares had been repurchased pursuant to this program. On September 1, 2011, we announced a share repurchase program, or Fifth Share Repurchase, to repurchase up to 50.0 million of our common shares at prices between NT$20.0 to NT$42.0 per share during the period from September 2, 2011 to November 1, 2011. This share repurchase program concluded on September 16, 2011, when a total of 50.0 million of our common shares had been repurchased pursuant to this program. On September 20, 2011, we announced a share repurchase program, or Sixth Share Repurchase, to repurchase up to 30.0 million of our common shares at prices between NT$22.0 to NT$40.0 per share during the period from September 21, 2011 to November 20, 2011. This share repurchase program concluded on November 20, 2011, when a total of 21.475 million of our common shares had been repurchased pursuant to this program. As of January 19, 2012, all of these common shares we repurchased had been cancelled. On February 26, 2015, we announced a share repurchase program, or Seventh Share Repurchase, approved by our board of directors, to repurchase up to 120.0 million of our common shares, which accounts for 1.53% of our total issued shares, at prices between NT$32.0 to NT$55.0 per share during the period from March 2, 2015 to April 30, 2015. The program authorized us to repurchase up to NT$6,600 million worth of our issued common shares in open market transactions. This share repurchase program concluded on March 27, 2015. A total of 120.0 million of our common shares had been repurchased pursuant to this program.
111
The table below sets forth certain information about the repurchase of our common shares under these share repurchase programs.
| Period | Total Number of Common Shares Purchased | Average Price Paid Per Common Share | Total Number of Common Shares Purchased as Part of Publicly Announced Programs | Maximum Number (or Approximate Dollar Value) of Common Shares that May Yet Be Purchased Under the Programs | ||||||||||||
| Third Share Repurchase | ||||||||||||||||
| November 2010 (November 30, 2010) | 7,300,000 | 31.48 | 7,300,000 | 29,700,000 | ||||||||||||
| December 2010 (December 1, 2010 – December 6, 2010) | 29,700,000 | 32.17 | 29,700,000 | – | ||||||||||||
| Total | 37,000,000 | 32.03 | 37,000,000 | – | ||||||||||||
| Fourth Share Repurchase | ||||||||||||||||
| August 2011 (August 16, 2011 – August 29, 2011) | 34,000,000 | 25.72 | 34,000,000 | – | ||||||||||||
| Fifth Share Repurchase | ||||||||||||||||
| September 2011 (September 2, 2011 – September 16, 2011) | 50,000,000 | 26.68 | 50,000,000 | – | ||||||||||||
| Sixth Share Repurchase | ||||||||||||||||
| September 2011 (September 21, 2011 – September 30, 2011) | 6,488,000 | 27.15 | 6,488,000 | 23,512,000 | ||||||||||||
| October 2011 (October 1, 2011 – October 31, 2011) | 14,316,000 | 25.85 | 20,804,000 | 9,196,000 | ||||||||||||
| November 2011 (November 1, 2011 – November 20, 2011) | 671,000 | 26.72 | 21,475,000 | 8,525,000 | ||||||||||||
| Total | 21,475,000 | 26.27 | 21,475,000 | 8,525,000 | ||||||||||||
| Seventh Share Repurchase | ||||||||||||||||
| March 2015 (March 2, 2015 – March 27, 2015) | 120,000,000 | 44.45 | 120,000,000 | – | ||||||||||||
Item 16F. Change In Registrant’s Certifying Accountant
Not applicable.
Item 16G. Corporate Governance
As a company listed on the New York Stock Exchange, or the NYSE, we are subject to certain corporate governance rules of the NYSE. The application of the NYSE’s corporate governance rules is limited for foreign private issuers, recognizing that they have to comply with domestic requirements. As a foreign private issuer, we must comply with the following NYSE corporate governance rules: 1) satisfy the audit committee requirements of the SEC; 2) chief executive officer must promptly notify the NYSE in writing upon becoming aware of any material non-compliance with applicable NYSE corporate governance rules; 3) submit annual and interim affirmations to the NYSE regarding compliance with applicable NYSE corporate governance requirements; and 4) provide a brief description of any significant differences between our corporate governance practices and those required of U.S. companies under the NYSE listing standards. The table below sets forth the significant differences between our corporate governance practices and those required of U.S. companies under the NYSE listing standards.
|
|
| |
112
|
|
| |
113
|
|
| |
114
|
|
115
|
|
Item 16H. Mine Safety Disclosure
Not applicable.
116
The Company has elected to provide financial statements for fiscal year 2015 and the related information pursuant to Item 18.
Reference is made to pages F-1 to F-94 of this annual report.
The consolidated financial statements of the Company and the report thereon by its independent registered public accounting firm listed below are attached hereto as follows:
117
118
___________________
The Company agrees to furnish to the SEC upon request a copy of any instrument which defines the rights of holders of long-term debt of the Company and its consolidated subsidiaries.2019
119
Signatures
The registrant hereby certifies that it meets allReport of the requirements for filing on Form 20-F and that it has duly caused and authorized the undersigned to sign this annual report on its behalf.
Date: April 29, 2016
120
INDEX TO CONSOLIDATED FINANCIAL STATEMENTS
| |
Advanced Semiconductor Engineering,Inc. and SubsidiariesConsolidated Financial Statements as ofDecember 31, 2014 and 2015 and for theYears Ended December 31, 2013, 2014 and 2015 andReport of Independent Registered Public Accounting Firm
REPORT OF INDEPENDENT REGISTERED PUBLIC ACCOUNTING FIRM
To the Board of Directors and Shareholdersthe Shareholder of Siliconware Precision Industries Co., Ltd.
Advanced Semiconductor Engineering, Inc.Opinions on the Financial Statements and Internal Control over Financial Reporting
We have audited the accompanying consolidated balance sheets of Advanced Semiconductor Engineering, Inc. (a corporation incorporated under the laws of the Republic of China)Siliconware Precision Industries Co., Ltd. and its subsidiaries (collectively, the “Group”(the “Company”) as of December 31, 20142018 and 2015,2017, and the related consolidated statements of comprehensive income, of changes in equity and of cash flows for each of the three years in the period ended December 31, 2015, all expressed2018, including the related notes (collectively referred to as the “consolidated financial statements”) (not presented herein). We also have audited the Company's internal control over financial reporting as of December 31, 2018, based on criteria established in New Taiwan dollars. TheseInternal Control - Integrated Framework (2013) issued by the Committee of Sponsoring Organizations of the Treadway Commission (COSO).
In our opinion, the consolidated financial statements arereferred to above present fairly, in all material respects, the responsibilityfinancial position of the Group’s management.Company as of December 31, 2018 and 2017, and the results of its operations and its cash flows for each of the three years in the period ended December 31, 2018 in conformity with International Financial Reporting Standards as issued by the International Accounting Standards Board. Also in our opinion, the Company maintained, in all material respects, effective internal control over financial reporting as of December 31 ,2018, based on criteria established inInternal Control - Integrated Framework (2013) issued by the COSO.
Change in Accounting Principles
As discussed in Note 3 to the consolidated financial statements, the Company changed the manner in which it accounts for revenues from contracts with customers and the manner in which it accounts for financial instruments in 2018.
Basis for Opinions
The Company's management is responsible for these consolidated financial statements, for maintaining effective internal control over financial reporting, and for its assessment of the effectiveness of internal control over financial reporting, included in Management’s Annual Report on Internal Control over Financial Reporting (not presented herein). Our responsibility is to express an opinionopinions on thesethe Company’s consolidated financial statements and on the Company's internal control over financial reporting based on our audits. We are a public accounting firm registered with the Public Company Accounting Oversight Board (United States) (PCAOB) and are required to be independent with respect to the Company in accordance with the U.S. federal securities laws and the applicable rules and regulations of the Securities and Exchange Commission and the PCAOB.
We conducted our audits in accordance with the standards of the Public Company Accounting Oversight Board (United States).PCAOB. Those standards require that we plan and perform the auditaudits to obtain reasonable assurance about whether the consolidated financial statements are free of material misstatement. An audit includesmisstatement, whether due to error or fraud, and whether effective internal control over financial reporting was maintained in all material respects.
Our audits of the consolidated financial statements included performing procedures to assess the risks of material misstatement of the consolidated financial statements, whether due to error or fraud, and performing procedures that respond to those risks. Such procedures included examining, on a test basis, evidence supportingregarding the amounts and disclosures in the consolidated financial statements. An auditOur audits also includes assessingincluded evaluating the accounting principles used and significant estimates made by management, as well as evaluating the overall presentation of the consolidated financial statement presentation.statements. Our audit of internal control over financial reporting included obtaining an understanding of internal control over financial reporting, assessing the risk that a material weakness exists, and testing and evaluating the design and operating effectiveness of internal control based on the assessed risk. Our audits also included performing such other procedures as we considered necessary in the circumstances. We believe that our audits provide a reasonable basis for our opinion.opinions.
120
Definition and Limitations of Internal Control over Financial Reporting
In our opinion, such consolidated financial statements present fairly, in all material respects, the financial position of the Group as of December 31, 2014 and 2015, and the results of their operations and their cash flows for each of the three years in the period ended December 31, 2015, in conformity with International Financial Reporting Standards as issued by the International Accounting Standards Board.
Our audits also comprehended the translation of New Taiwan dollar amounts into U.S. dollar amounts and, in our opinion, such translation has been made in conformity with the basis stated in Note 4 to the consolidated financial statements. Such U.S. dollar amounts are presented solely for the convenience of the readers.
We have also audited, in accordance with the standards of the Public Company Accounting Oversight Board (United States), the Group’sA company’s internal control over financial reporting asis a process designed to provide reasonable assurance regarding the reliability of December 31, 2015, based onfinancial reporting and the criteria establishedpreparation of financial statements for external purposes in Internal Control - Integrated Framework (2013) issued by the Committee of Sponsoring Organizations of the Treadway Commission and our report dated April 28, 2016 expressed an unqualified opinion on the Group’saccordance with generally accepted accounting principles. A company’s internal control over financial reporting.reporting includes those policies and procedures that (i) pertain to the maintenance of records that, in reasonable detail, accurately and fairly reflect the transactions and dispositions of the assets of the company; (ii) provide reasonable assurance that transactions are recorded as necessary to permit preparation of financial statements in accordance with generally accepted accounting principles, and that receipts and expenditures of the company are being made only in accordance with authorizations of management and directors of the company; and (iii) provide reasonable assurance regarding prevention or timely detection of unauthorized acquisition, use, or disposition of the company’s assets that could have a material effect on the financial statements.
Because of its inherent limitations, internal control over financial reporting may not prevent or detect misstatements. Also, projections of any evaluation of effectiveness to future periods are subject to the risk that controls may become inadequate because of changes in conditions, or that the degree of compliance with the policies or procedures may deteriorate.
/s/Deloitte & TouchePricewaterhouseCoopers, Taiwan
Taipei, Taiwan
March 21, 2019
We have served as the Company’s auditor since 1994.
Republic of China
April 26, 2019
119
Report of the Independent Registered Public Accounting Firm
To the Board of Directors and the Shareholder of Siliconware Precision Industries Co., Ltd.
Opinions on the Financial Statements and Internal Control over Financial Reporting
We have audited the accompanying consolidated balance sheets of Siliconware Precision Industries Co., Ltd. and its subsidiaries (the “Company”) as of December 31, 2018 and 2017, and the related consolidated statements of comprehensive income, of changes in equity and of cash flows for each of the three years in the period ended December 31, 2018, including the related notes (collectively referred to as the “consolidated financial statements”) (not presented herein). We also have audited the Company's internal control over financial reporting as of December 31, 2018, based on criteria established inInternal Control - Integrated Framework (2013) issued by the Committee of Sponsoring Organizations of the Treadway Commission (COSO).
In our opinion, the consolidated financial statements referred to above present fairly, in all material respects, the financial position of the Company as of December 31, 2018 and 2017, and the results of its operations and its cash flows for each of the three years in the period ended December 31, 2018 in conformity with International Financial Reporting Standards as issued by the International Accounting Standards Board. Also in our opinion, the Company maintained, in all material respects, effective internal control over financial reporting as of December 31 ,2018, based on criteria established inInternal Control - Integrated Framework (2013) issued by the COSO.
Change in Accounting Principles
As discussed in Note 3 to the consolidated financial statements, the Company changed the manner in which it accounts for revenues from contracts with customers and the manner in which it accounts for financial instruments in 2018.
Basis for Opinions
The Company's management is responsible for these consolidated financial statements, for maintaining effective internal control over financial reporting, and for its assessment of the effectiveness of internal control over financial reporting, included in Management’s Annual Report on Internal Control over Financial Reporting (not presented herein). Our responsibility is to express opinions on the Company’s consolidated financial statements and on the Company's internal control over financial reporting based on our audits. We are a public accounting firm registered with the Public Company Accounting Oversight Board (United States) (PCAOB) and are required to be independent with respect to the Company in accordance with the U.S. federal securities laws and the applicable rules and regulations of the Securities and Exchange Commission and the PCAOB.
We conducted our audits in accordance with the standards of the PCAOB. Those standards require that we plan and perform the audits to obtain reasonable assurance about whether the consolidated financial statements are free of material misstatement, whether due to error or fraud, and whether effective internal control over financial reporting was maintained in all material respects.
Our audits of the consolidated financial statements included performing procedures to assess the risks of material misstatement of the consolidated financial statements, whether due to error or fraud, and performing procedures that respond to those risks. Such procedures included examining, on a test basis, evidence regarding the amounts and disclosures in the consolidated financial statements. Our audits also included evaluating the accounting principles used and significant estimates made by management, as well as evaluating the overall presentation of the consolidated financial statements. Our audit of internal control over financial reporting included obtaining an understanding of internal control over financial reporting, assessing the risk that a material weakness exists, and testing and evaluating the design and operating effectiveness of internal control based on the assessed risk. Our audits also included performing such other procedures as we considered necessary in the circumstances. We believe that our audits provide a reasonable basis for our opinions.
120
Definition and Limitations of Internal Control over Financial Reporting
A company’s internal control over financial reporting is a process designed to provide reasonable assurance regarding the reliability of financial reporting and the preparation of financial statements for external purposes in accordance with generally accepted accounting principles. A company’s internal control over financial reporting includes those policies and procedures that (i) pertain to the maintenance of records that, in reasonable detail, accurately and fairly reflect the transactions and dispositions of the assets of the company; (ii) provide reasonable assurance that transactions are recorded as necessary to permit preparation of financial statements in accordance with generally accepted accounting principles, and that receipts and expenditures of the company are being made only in accordance with authorizations of management and directors of the company; and (iii) provide reasonable assurance regarding prevention or timely detection of unauthorized acquisition, use, or disposition of the company’s assets that could have a material effect on the financial statements.
Because of its inherent limitations, internal control over financial reporting may not prevent or detect misstatements. Also, projections of any evaluation of effectiveness to future periods are subject to the risk that controls may become inadequate because of changes in conditions, or that the degree of compliance with the policies or procedures may deteriorate.
/s/PricewaterhouseCoopers, Taiwan
Taipei, Taiwan
March 21, 2019
We have served as the Company’s auditor since 1994.
Changes in Internal Control Over Financial Reporting
There has been no change in our internal control over financial reporting that occurred during the period covered by this annual report that has materially affected, or is reasonably likely to materially affect, our internal control over financial reporting.
Item 16A. Audit Committee Financial Expert
Our board of directors determined that Shen-Fu Yu, Ta-Lin Hsu and Mei-Yueh Ho are audit committee financial experts as defined under the applicable rules of the SEC issued pursuant to Section 407 of the Sarbanes-Oxley Act of 2002 and are independent for the purposes of Rule 10A-3 of the Exchange Act.
We have adopted a Code of Business Conduct and Ethics (the "Code of Ethics") which satisfies the requirements of Item 16B of Form 20-F and applies to all employees, officers, supervisors and directors of our Company and subsidiaries, including our chief executive officer, chief financial officer and principal accounting officer. The Code of Ethics contains the policies with respect to anti-corruption, fair competition, anti-money laundering and whistleblowing policy and regulatory compliance. The Code of Ethics has built robust and effective policies and procedures to enable high ethical standards of business conduct that can be persistently maintained. We have continued to implement the Code of Ethics through promoting awareness and educational activities among our employees, officers, supervisors and directors of our Company and subsidiaries in daily operation. The Code of Ethics is available on our website at:http://ir.aseglobal.com/html/ir_doc.php
Item 16C. Principal Accountant Fees and Services
Policy on Pre-Approval of Audit and Non-Audit Services of Independent Registered Public Accounting Firm
Our audit committee pre-approves all audit and non-audit services provided by our independent registered public accounting firm, including audit services, audit-related services, tax services and other services, on a case-by-case basis.
121
Independent Registered Public Accounting Firm’s Fees
The following table sets forth the aggregate fees by categories specified below in connection with certain professional services rendered by Deloitte & Touche. We did not pay any other fees to our independent registered public accounting firm during the periods indicated below.
| For the Year Ended December 31, | ||||||||||||||||
| 2016 | 2017 | 2018 | ||||||||||||||
| NT$ | NT$ | NT$ | US$ | |||||||||||||
| Audit fees(1) | 165,172.5 | 158,872.5 | 157,244.5 | 5,137.0 | ||||||||||||
| Audit-related fees(2) | 7,450.0 | 1,032.6 | 9,319.9 | 304.5 | ||||||||||||
| Tax fees(3) | 15,264.7 | 16,087.7 | 31,394.8 | 1,025.6 | ||||||||||||
| All other fees(4) | 7,375.0 | 19,024.7 | 19,776.7 | 646.1 | ||||||||||||
| Total | 195,262.2 | 195,017.5 | 217,735.9 | 7,113.2 | ||||||||||||
| (1) | Audit fees are defined as the standard audit and review work that needs to be performed each year in order to issue an opinion on our consolidated financial statements and to issue reports on the local statutory financial statements. It also includes services that can only be provided by our auditor such as statutory audits required by the Tax Bureau of the R.O.C. and the Customs Bureau of the R.O.C., consents and comfort letters and any other audit services required for SEC or other regulatory filings. |
| (2) | Audit-related fees consist of assurance and related services by Deloitte & Touche that are reasonably related to the performance of the audit or review of our financial statements and are not reported above under Audit Fees. The service for the fees disclosed under this category relate to cash capital increase and bonds offering. |
| (3) | Tax fees consist of professional services rendered by Deloitte & Touche for tax compliance and tax advice. The services for the fees disclosed under this category include tax return preparation and technical tax advice. |
| (4) | Other fees primarily consist of risk management advisory fee and business operation and process advisory fee, among others. |
Item 16D. Exemptions from the Listing Standards for Audit Committees
Not applicable.
Item 16E. Purchases of Equity Securities by the Issuer and Affiliated Purchasers
Share Repurchase
On November 29, 2010, we announced a share repurchase program, or Third Share Repurchase, to repurchase up to 37.0 million of our common shares at prices between NT$25.0 to NT$41.0 per share during the period from November 30, 2010 to January 28, 2011. This share repurchase program concluded on December 6, 2010, when a total of 37.0 million of our common shares had been repurchased pursuant to this program. As of January 19, 2011, all of these common shares we repurchased had been cancelled. On August 15, 2011, we announced a share repurchase program, or Fourth Share Repurchase, to repurchase up to 34.0 million of our common shares at prices between NT$20.0 to NT$45.0 per share during the period from August 16, 2011 to October 15, 2011. This share repurchase program concluded on August 29, 2011, when a total of 34.0 million of our common shares had been repurchased pursuant to this program. On September 1, 2011, we announced a share repurchase program, or Fifth Share Repurchase, to repurchase up to 50.0 million of our common shares at prices between NT$20.0 to NT$42.0 per share during the period from September 2, 2011 to November 1, 2011. This share repurchase program concluded on September 16, 2011, when a total of 50.0 million of our common shares had been repurchased pursuant to this program. On September 20, 2011, we announced a share repurchase program, or Sixth Share Repurchase, to repurchase up to 30.0 million of our common shares at prices between NT$22.0 to NT$40.0 per share during the period from September 21, 2011 to November 20, 2011. This share repurchase program concluded on November 20, 2011, when a total of 21.475 million of our common shares had been repurchased pursuant to this program. As of January 19, 2012, all of these common shares we repurchased had been cancelled. On February 26, 2015, we announced a share repurchase program, or Seventh Share Repurchase, approved by our board of directors, to repurchase up to 120.0 million of our common shares, which accounts for 1.53% of our total issued shares, at prices between NT$32.0 to NT$55.0 per share during the period from March 2, 2015 to April 28,30, 2015. The program authorized us to repurchase up to NT$6,600 million worth of our issued common shares in open market transactions. This share repurchase program concluded on March 27, 2015. A total of 120.0 million of our common shares had been repurchased pursuant to this program. In March 2018, pursuant to the R.O.C. Business Mergers and Acquisitions Act, ASE’s board of directors resolved to repurchase its 1,852,000 common shares at the price of NT$38.5 (US$1.3) per share from dissenting shareholders of the Share Exchange; all of the repurchased common shares from dissenting shareholders of the Share Exchange were canceled in April, 2018.
122
The table below sets forth certain information about the repurchase of our common shares under these share repurchase programs.
| Period | Total Number of Common Shares Purchased | Average Price Paid Per Common Share | Total Number of Common Shares Purchased as Part of Publicly Announced Programs | Maximum Number (or Approximate Dollar Value) of Common Shares that May Yet Be Purchased Under the Programs |
| Seventh Share Repurchase | ||||
| March 2015 (March 2, 2015 – March 27, 2015) | 120,000,000 | 44.45 | 120,000,000 | - |
Item 16F. Change In Registrant’s Certifying Accountant
Not applicable.
Item 16G. Corporate Governance
As a company listed on the NYSE, we are subject to certain corporate governance rules of the NYSE. The application of the NYSE’s corporate governance rules is limited for foreign private issuers, recognizing that they have to comply with domestic requirements. As a foreign private issuer, we must comply with the following NYSE corporate governance rules: 1) satisfy the audit committee requirements of the SEC; 2) chief executive officer must promptly notify the NYSE in writing upon becoming aware of any material non-compliance with applicable NYSE corporate governance rules; 3) submit annual and interim affirmations to the NYSE regarding compliance with applicable NYSE corporate governance requirements; and 4) provide a brief description of any significant differences between our corporate governance practices and those required of U.S. companies under the NYSE listing standards. The table below sets forth the significant differences between our corporate governance practices and those required of U.S. companies under the NYSE listing standards.
New York Stock Exchange Corporate | Description of Significant Differences between Our |
| Director independence | |
| Listed companies must have a majority of independent directors, as defined under the NYSE listing standards. | Three members of our board of directors are independent as defined in Rule 10A-3 under the Exchange Act. We do not assess the independence of our directors under the independence requirements of the NYSE listing standards. Pursuant to relevant laws and regulations of the R.O.C., we have three independent directors on our board of directors that were elected through the candidate nomination system at our extraordinary general shareholders’ meeting on June 21, 2018. |
| To empower non-management directors to serve as a more effective check on management, the non-management directors of each company must meet at regularly scheduled executive sessions without management. | All of our directors attend the meetings of the board of directors. Our non-management directors do not meet at regularly scheduled executive sessions without management. The R.O.C. Company Law does not require companies incorporated in the R.O.C. to have their non-management directors meet at regularly scheduled executive sessions without management. |
123
| Nominating/Corporate governance committee | |
| Listed companies must have a nominating/corporate governance committee composed entirely of independent directors and governed by a written charter that provides for certain responsibilities of the committee set out in the NYSE listing standards. | We do not have a nominating/corporate governance committee. The R.O.C. Company Law does not require companies incorporated in the R.O.C. to have a nominating/corporate governance committee. Currently, our board of directors performs the duties of a corporate governance committee and regularly reviews our corporate governance principles and practices. The R.O.C. Company Law requires that directors be elected by shareholders. Under R.O.C. law and regulations, companies that have independent directors are required to adopt a candidate nomination system for the election of independent directors. Our three independent directors were elected through the candidate nomination system provided in our Articles of Incorporation. All of our non-independent directors were elected directly by our shareholders at our shareholders’ meetings without a nomination process. |
124
| Compensation committee | |
| Listed companies must have a compensation committee composed entirely of independent directors and governed by a written charter that provides for certain responsibilities of the committee set out in the NYSE listing standards. | We have a compensation committee as required by the regulations promulgated by the FSC. The charter of such committee contains similar responsibilities as those provided under NYSE listing standards. |
| In addition to any requirement of Rule 10A-3(b)(1), all compensation committee members must satisfy the independence requirements for independent directors set out in the NYSE listing standards. | We do not assess the independence of our compensation committee member under the independence requirements of the NYSE listing standards but adopt the independence standard as promulgated under the R.O.C. Regulations Governing the Appointment and Exercise of Powers by the Remuneration Committee of a Company Whose Stock is Listed on the Stock Exchange or Traded Over the Counter. |
| Audit committee | |
| Listed companies must have an audit committee that satisfies the requirements of Rule 10A-3 under the Exchange Act. | We have an audit committee that satisfies the requirements of Rule 10A-3 under the Exchange Act and the requirements under R.O.C. Securities and Exchange Act. |
| The audit committee must have a minimum of three members. In addition to any requirement of Rule 10A-3(b)(1), all audit committee members must satisfy the independence requirements for independent directors set out in the NYSE listing standards. | We currently have three members on our audit committee. Our audit committee members satisfy the independence requirements of Rule 10A-3 under the Exchange Act. We do not assess the independence of our audit committee member under the independence requirements of the NYSE listing standards. |
| The audit committee must have a written charter that provides for the duties and responsibilities set out in Rule 10A-3 and addresses certain other matters required by the NYSE listing standards. | Our audit committee charter provides for the audit committee to assist our board of directors in its oversight of (i) the integrity of our financial statements, (ii) the qualifications, independence and performance of our independent auditor and (iii) our compliance with legal and regulatory requirements and provides for the duties and responsibilities set out in Rule 10A-3. Our audit committee charter does not address all the matters required by the NYSE listing standards beyond the requirements of Rule 10A-3. Because the appointment and retention of our independent auditor are the responsibility of our entire board of directors under R.O.C. law and regulations, our audit committee charter provides that the audit committee shall make recommendations to the board of directors with respect to these matters. |
| Each listed company must have an internal audit function. | We have an internal audit function. Under the R.O.C. Regulations for the Establishment of Internal Control Systems by Public Companies, a public company is required to set out its internal control systems in writing, including internal audit implementation rules, which must be approved by the board of directors. Our entire board of directors and the chief executive officer are responsible for the establishment of the internal audit functions, compliance with the internal audit implementation rules and oversight of our internal control systems, including the appointment and retention of our independent auditor. |
| Equity compensation plans | |
| Shareholders must be given the opportunity to vote on all equity compensation plans and material revisions thereto, except for employment inducement awards, certain grants, plans and amendments in the context of mergers and | The board of directors has authority under R.O.C. laws and regulations to approve (i) the distribution of employee compensation and (ii) employee stock option plans by a majority vote of the board of directors at a meeting where at least two-thirds of all directors are present and to grant options to |
125
| acquisitions, and certain specific types of plans. | employees pursuant to such plans provided that shareholders’ approval is required if the exercise price of an option would be less than the closing price of the common shares on the TWSE on the grant date of the option, subject to the approval of the Securities and Futures Bureau of the FSC, and to approve treasury stock programs and the transfer of shares to employees under such programs by a majority vote of the board of directors in a meeting where at least two-thirds of all directors are present. |
| Corporate governance guidelines | |
| Listed companies must adopt and disclose corporate governance guidelines. | We currently comply with the domestic non-binding Corporate Governance Best-Practice Principles for TWSE and Taipei Exchange Listed Companies promulgated by the TWSE and the Taipei Exchange, and we provide an explanation of the differences between our practice and the principles, if any, in our R.O.C. annual report. |
| Code of ethics for directors, officers and employees | |
| Listed companies must adopt and disclose a code of business conduct and ethics for directors, officers and employees, and promptly disclose any waivers of the code for directors or executive officers. | We have adopted a code of ethics that satisfies the requirements of Item 16B of Form 20-F and applies to all employees, officers, supervisors and directors of our company and our subsidiaries and will disclose any waivers of the code as required by Item 16B of Form 20-F. We have posted our code of ethics on our website. |
| Description of significant differences | |
| Listed foreign private issuers must disclose any significant ways in which their corporate governance practices differ from those followed by domestic companies under NYSE listing standards. | This table contains the significant differences between our corporate governance practices and those required of U.S. companies under the NYSE listing standards. |
| CEO certification | |
| Each listed company CEO must certify to the NYSE each year that he or she is not aware of any violation by the company of NYSE corporate governance listing standards, qualifying the certification to the extent necessary. | As a foreign private issuer, we are not required to comply with this rule; however, our chief executive officer provides certifications under Sections 302 and 906 of the Sarbanes-Oxley Act. |
| Each listed company CEO must promptly notify the NYSE in writing after any executive officer of the listed company becomes aware of any material non-compliance with any applicable provisions of Section 303A. | We intend to comply with this requirement. |
| Each listed company must submit an executed Written Affirmation annually to the NYSE. In addition, each listed company must submit an interim Written Affirmation each time a change occurs to the board or any of the committees subject to Section 303A. The annual and interim Written Affirmations must be in the form specified by the NYSE. | We have complied with this requirement to date and intend to continue to comply going forward. |
| Website | |
| Listed companies must have and maintain a publicly accessible website. | We have and maintain a publicly accessible website. |
126
Item 16H. Mine Safety Disclosure
Not applicable.
127
The Company has elected to provide financial statements for fiscal year 2018 and the related information pursuant to Item 18.
Reference is made to pages F-1 to F-112 of this annual report.
The consolidated financial statements of the Company and the report thereon by its independent registered public accounting firm listed below are attached hereto as follows:
| (a) | Report of Independent Registered Public Accounting Firm of the Company dated April 26, 2019 (pages F-1 to F-2). |
| (b) | Report of Independent Registered Public Accounting Firm of SPIL dated March 21, 2019 (page F-3). |
| (c) | Consolidated Balance Sheets of the Company and subsidiaries as of December 31, 2017 and 2018 (page F-4 to F-5). |
| (d) | Consolidated Statements of Comprehensive Income of the Company and subsidiaries for the years ended December 31, 2016, 2017 and 2018 (page F-6 to F-7). |
| (e) | Consolidated Statements of Changes in Equity of the Company and subsidiaries for the years ended December 31, 2016, 2017 and 2018 (page F-8 to F-9). |
| (f) | Consolidated Statements of Cash Flows of the Company and subsidiaries for the years ended December 31, 2016, 2017 and 2018 (pages F-10 to F-12). |
| (g) | Notes to Consolidated Financial Statements of the Company and subsidiaries (pages F-13 to F-112). |
| 1. | *Articles of Incorporation of the Registrant (English translation of Chinese version) (incorporating all amendments as of June 21, 2018). |
| 2. |
128
| 4. |
| (a) | ^Asset Purchase Agreement dated as of July 3, 1999 among ASE (Chung Li) Inc., ASE Inc., Motorola Electronics Taiwan, Ltd. and Motorola, Inc. (incorporated by reference to Exhibit 10.2 to ASE Test’s registration statement on Form F-3 (File No. 333-10892) filed on September 27, 1999 (the “ASE Test 1999 Form-3”)). |
| (c) | ^Stock Purchase Agreement dated as of July 3, 1999 among ASE Investment (Labuan) Inc., ASE Inc., Motorola Asia Ltd. and Motorola, Inc. relating to the purchase and sale of 100.0% of the common stock of Motorola Korea Ltd. (incorporated by reference to Exhibit 10.3 to the ASE Test 1999 Form F-3). |
| (d) | † BGA Immunity Agreement dated as of January 25, 1994 between ASE Inc. and Motorola, Inc. (incorporated by reference to Exhibit 10.6 to the Form F-1). |
129
130
| 8. | *List of Subsidiaries |
| 12. |
| (a) | *Certification of Jason C.S. Chang, required by Rule 13a-14(a) of the Exchange Act. |
| (b) | *Certification of Joseph Tung, required by Rule 13a-14(a) of the Exchange Act. |
| 15. |
| (a) | *Consent of Deloitte & Touche. |
| (b) | *Consent of PricewaterhouseCoopers. |
___________________
| † | Does not contain portions for which confidential treatment has been granted. |
| ^ | Filed in paper. |
| * | Filed herewith. |
The Company agrees to furnish to the SEC upon request a copy of any instrument which defines the rights of holders of long-term debt of the Company and its consolidated subsidiaries.
131
SIGNATURES
The registrant hereby certifies that it meets all of the requirements for filing on Form 20-F and that it has duly caused and authorized the undersigned to sign this annual report on its behalf.
| ASE TECHNOLOGY HOLDING CO., LTD. | ||
| By: | /s/ Joseph Tung | |
| Name: Joseph Tung | ||
| Title: Chief Financial Officer | ||
Date: April 26, 2019
ASE Technology Holding Co., Ltd. and Subsidiaries
Consolidated Financial Statements as of December 31,
2017 and 2018 and for the Years Ended December 31,
2016, 2017 and 2018 and
Reports of Independent Registered Public Accounting Firms
REPORT OF INDEPENDENT REGISTERED PUBLIC ACCOUNTING FIRM
To the shareholders and the Board of Directors of
ASE Technology Holding Co., Ltd.
Opinion on the Financial Statements
We have audited the accompanying consolidated balance sheets of ASE Technology Holding Co., Ltd. (a corporation incorporated under the laws of the Republic of China) and its subsidiaries (collectively, the “Group”) as of December 31, 2017 and 2018, the related consolidated statements of comprehensive income, changes in equity and cash flows for each of the three years in the period ended December 31, 2018, and the related notes (collectively referred to as the “Consolidated Financial Statements”) (all expressed in New Taiwan Dollars). In our opinion, based on our audits and the report of other auditors, the Consolidated Financial Statements present fairly, in all material respects, the financial position of the Group as of December 31, 2017 and 2018, and the results of its operations and its cash flows for each of the three years in the period ended December 31, 2018, in conformity with International Financial Reporting Standards as issued by the International Accounting Standards Board.
We did not audit the consolidated financial statements of Siliconware Precision Industries Co., Ltd. and its subsidiaries (collectively, “SPIL”), in which the Group’s investment was accounted for (1) as an investment accounted for using the equity method as of December 31, 2017 and for each of the two years in the period ended December 31, 2017 and the period from January 1, 2018 through April 29, 2018 and (2) as a consolidated subsidiary as of December 31, 2018 and for the period from April 30, 2018 through December 31, 2018. The accompanying Consolidated Financial Statements included its equity investment in SPIL of NT$45,210,317 thousand as of December 31, 2017, and its share of profit in SPIL of NT$1,725,053 thousand, NT$915,253 thousand and NT$127,266 thousand (US$4,158 thousand) for each of the two years in the period ended December 31, 2017 and the period from January 1, 2018 through April 29, 2018. The total assets of SPIL constituted 22% of the Group’s total assets as of December 31, 2018 and the revenues of SPIL for the period from April 30, 2018 through December 31, 2018 constituted 17% of the Group’s revenues for the year ended December 31, 2018. The consolidated financial statements of SPIL were audited by other auditors whose report has been furnished to us, and our opinion, insofar as it relates to the amounts included for SPIL, is based solely on the report of other auditors.
Our audits also comprehended the translation of New Taiwan dollar amounts into U.S. dollar amounts and, in our opinion, such translation has been made in conformity with the basis stated in Note 4 to the Consolidated Financial Statements. Such U.S. dollar amounts are presented solely for the convenience of the readers outside the Republic of China.
We have also audited, in accordance with the standards of the Public Company Accounting Oversight Board (United States) (PCAOB), the Group’s internal control over financial reporting as of December 31, 2018, based on criteria established inInternal Control - Integrated Framework (2013) issued by the Committee of Sponsoring Organizations of the Treadway Commission and our report dated April 26, 2019, expressed an unqualified opinion on the Group’s internal control over financial reporting based on our audit and the report of other auditors.
F-1
ADVANCED SEMICONDUCTOR ENGINEERING, INC. AND SUBSIDIARIESBasis for Opinion
(AmountsThese Consolidated Financial Statements are the responsibility of the Group’s management. Our responsibility is to express an opinion on the Group’s Consolidated Financial Statements based on our audits. We are a public accounting firm registered with the PCAOB and are required to be independent with respect to the Group in Thousands)accordance with the U.S. federal securities laws and the applicable rules and regulations of the Securities and Exchange Commission and the PCAOB.
| December 31, | December 31, | |||||||||||
| 2014 | 2015 | |||||||||||
| ASSETS | NT$ | NT$ | US$ (Note 4) | |||||||||
| CURRENT ASSETS | ||||||||||||
| Cash and cash equivalents (Notes 4 and 6) | $ | 51,694,410 | $ | 55,251,181 | $ | 1,685,001 | ||||||
| Financial assets at fair value through profit or loss - | ||||||||||||
| current (Notes 4, 5 and 7) | 4,988,843 | 3,833,701 | 116,917 | |||||||||
| Available-for-sale financial assets - current (Notes 4 | ||||||||||||
| and 8) | 1,533,265 | 30,344 | 925 | |||||||||
| Trade receivables, net (Notes 4 and 9) | 52,920,810 | 44,931,487 | 1,370,280 | |||||||||
| Other receivables (Note 4) | 537,122 | 429,541 | 13,100 | |||||||||
| Current tax assets (Notes 4 and 23) | 65,312 | 168,717 | 5,145 | |||||||||
| Inventories (Notes 4, 5 and 10) | 20,163,093 | 23,258,279 | 709,310 | |||||||||
| Inventories related to real estate business (Notes 4, 5, | ||||||||||||
| 11, 22 and 33) | 23,986,478 | 25,713,538 | 784,188 | |||||||||
| Other financial assets - current (Notes 4 and 33) | 638,592 | 301,999 | 9,210 | |||||||||
| Other current assets | 3,427,265 | 2,814,053 | 85,821 | |||||||||
| Total current assets | 159,955,190 | 156,732,840 | 4,779,897 | |||||||||
| NON-CURRENT ASSETS | ||||||||||||
| Available-for-sale financial assets - non-current | ||||||||||||
| (Notes 4 and 8) | 941,105 | 924,362 | 28,190 | |||||||||
| Investments accounted for using the equity | ||||||||||||
| method (Notes 4 and 12) | 1,468,242 | 37,403,601 | 1,140,701 | |||||||||
| Property, plant and equipment (Notes 4, 5, 13, 22, | ||||||||||||
| 32 and 34) | 151,587,115 | 149,997,075 | 4,574,476 | |||||||||
| Goodwill (Notes 4, 5 and 14) | 10,445,415 | 10,506,519 | 320,418 | |||||||||
| Other intangible assets (Notes 4, 5, 15 and 22) | 1,467,871 | 1,382,093 | 42,150 | |||||||||
| Deferred tax assets (Notes 4, 5 and 23) | 4,265,220 | 5,156,515 | 157,259 | |||||||||
| Other financial assets - non-current (Notes 4 and 33) | 367,345 | 345,672 | 10,542 | |||||||||
| Long-term prepayments for lease (Note 16) | 2,585,964 | 2,556,156 | 77,956 | |||||||||
| Other non-current assets | 635,350 | 263,416 | 8,034 | |||||||||
| Total non-current assets | 173,763,627 | 208,535,409 | 6,359,726 | |||||||||
| TOTAL | $ | 333,718,817 | $ | 365,268,249 | $ | 11,139,623 | ||||||
We conducted our audits in accordance with the standards of the PCAOB. Those standards require that we plan and perform the audit to obtain reasonable assurance about whether the Consolidated Financial Statements are free of material misstatement, whether due to error or fraud. Our audits included performing procedures to assess the risks of material misstatement of the Consolidated Financial Statements, whether due to error or fraud, and performing procedures that respond to those risks. Such procedures included examining, on a test basis, evidence regarding the amounts and disclosures in the Consolidated Financial Statements. Our audits also included evaluating the accounting principles used and significant estimates made by management, as well as evaluating the overall presentation of the Consolidated Financial Statements. We believe that our audits and the report of other auditors provide a reasonable basis for our opinion.
(Continued)
/s/ Deloitte & Touche
Taipei, Taiwan
Republic of China
April 26, 2019
We have served as the Group’s auditor since 1984.
F-2
ADVANCED SEMICONDUCTOR ENGINEERING, INC. AND SUBSIDIARIES
REPORT OF INDEPENDENT REGISTERED PUBLIC ACCOUNTING FIRM
CONSOLIDATED BALANCE SHEETSTo the Board of Directors and Shareholder of
Siliconware Precision Industries Co., Ltd.
Opinions on the Financial Statements and Internal Control over Financial Reporting
We have audited the accompanying consolidated balance sheets of Siliconware Precision Industries Co., Ltd. and its subsidiaries (the “Company”) as of December 31, 2018 and 2017, and the related consolidated statements of comprehensive income, of changes in equity and of cash flows for each of the three years in the period ended December 31, 2018, including the related notes (collectively referred to as the “consolidated financial statements”) (not presented herein). We also have audited the Company's internal control over financial reporting as of December 31, 2018, based on criteria established inInternal Control - Integrated Framework(2013) issued by the Committee of Sponsoring Organizations of the Treadway Commission (COSO).
In our opinion, the consolidated financial statements referred to above present fairly, in all material respects, the financial position of the Company as of December 31, 2018 and 2017, and the results of its operations and its cash flows for each of the three years in the period ended December 31, 2018 in conformity with International Financial Reporting Standards as issued by the International Accounting Standards Board. Also in our opinion, the Company maintained, in all material respects, effective internal control over financial reporting as of December 31 ,2018, based on criteria established inInternal Control - Integrated Framework(2013) issued by the COSO.
Change in Accounting Principles
As discussed in Note 3 to the consolidated financial statements, the Company changed the manner in which it accounts for revenues from contracts with customers and the manner in which it accounts for financial instruments in 2018.
Basis for Opinions
The Company's management is responsible for these consolidated financial statements, for maintaining effective internal control over financial reporting, and for its assessment of the effectiveness of internal control over financial reporting, included in Management’s Annual Report on Internal Control over Financial Reporting (not presented herein). Our responsibility is to express opinions on the Company’s consolidated financial statements and on the Company's internal control over financial reporting based on our audits. We are a public accounting firm registered with the Public Company Accounting Oversight Board (United States) (PCAOB) and are required to be independent with respect to the Company in accordance with the U.S. federal securities laws and the applicable rules and regulations of the Securities and Exchange Commission and the PCAOB.
We conducted our audits in accordance with the standards of the PCAOB. Those standards require that we plan and perform the audits to obtain reasonable assurance about whether the consolidated financial statements are free of material misstatement, whether due to error or fraud, and whether effective internal control over financial reporting was maintained in all material respects.
Our audits of the consolidated financial statements included performing procedures to assess the risks of material misstatement of the consolidated financial statements, whether due to error or fraud, and performing procedures that respond to those risks. Such procedures included examining, on a test basis, evidence regarding the amounts and disclosures in the consolidated financial statements. Our audits also included evaluating the accounting principles used and significant estimates made by management, as well as evaluating the overall presentation of the consolidated financial statements. Our audit of internal control over financial reporting included obtaining an understanding of internal control over financial reporting, assessing the risk that a material weakness exists, and testing and evaluating the design and operating effectiveness of internal control based on the assessed risk. Our audits also included performing such other procedures as we considered necessary in the circumstances. We believe that our audits provide a reasonable basis for our opinions.
Definition and Limitations of Internal Control over Financial Reporting
A company’s internal control over financial reporting is a process designed to provide reasonable assurance regarding the reliability of financial reporting and the preparation of financial statements for external purposes in accordance with generally accepted accounting principles. A company’s internal control over financial reporting includes those policies and procedures that (i) pertain to the maintenance of records that, in reasonable detail, accurately and fairly reflect the transactions and dispositions of the assets of the company; (ii) provide reasonable assurance that transactions are recorded as necessary to permit preparation of financial statements in accordance with generally accepted accounting principles, and that receipts and expenditures of the company are being made only in accordance with authorizations of management and directors of the company; and (iii) provide reasonable assurance regarding prevention or timely detection of unauthorized acquisition, use, or disposition of the company’s assets that could have a material effect on the financial statements.
Because of its inherent limitations, internal control over financial reporting may not prevent or detect misstatements. Also, projections of any evaluation of effectiveness to future periods are subject to the risk that controls may become inadequate because of changes in conditions, or that the degree of compliance with the policies or procedures may deteriorate.
/s/PricewaterhouseCoopers, Taiwan
(Amounts in Thousands)Taipei, Taiwan
March 21, 2019
We have served as the Company’s auditor since 1994.
F-3
| December 31, | December 31, | |||||||||||
| 2014 | 2015 | |||||||||||
| LIABILITIES AND EQUITY | NT$ | NT$ | US$ (Note 4) | |||||||||
| CURRENT LIABILITIES | ||||||||||||
| Short-term borrowings (Note 17) | $ | 41,176,033 | $ | 32,635,321 | $ | 995,283 | ||||||
| Short-term bills payable (Note 17) | - | 4,348,054 | 132,603 | |||||||||
| Financial liabilities at fair value through profit or | ||||||||||||
| loss - current (Notes 4, 5 and 7) | 2,651,352 | 3,005,726 | 91,666 | |||||||||
| Trade payables | 35,411,281 | 34,138,564 | 1,041,128 | |||||||||
| Other payables (Note 19) | 22,364,516 | 19,194,818 | 585,386 | |||||||||
| Current tax liabilities (Notes 4 and 23) | 6,630,696 | 6,746,022 | 205,734 | |||||||||
| Advance real estate receipts (Note 4) | 480,325 | 2,703,706 | 82,455 | |||||||||
| Current portion of bonds payable (Notes 4 and 18) | - | 14,685,866 | 447,876 | |||||||||
| Current portion of long-term borrowings (Notes 17 | ||||||||||||
| and 33) | 2,831,007 | 2,057,465 | 62,747 | |||||||||
| Other current liabilities | 2,134,917 | 3,180,767 | 97,004 | |||||||||
| Total current liabilities | 113,680,127 | 122,696,309 | 3,741,882 | |||||||||
| NON-CURRENT LIABILITIES | ||||||||||||
| Bonds payable (Notes 4 and 18) | 31,270,131 | 23,740,384 | 724,013 | |||||||||
| Long-term borrowings (Notes 17 and 33) | 24,104,424 | 42,493,668 | 1,295,934 | |||||||||
| Deferred tax liabilities (Notes 4, 5 and 23) | 3,932,819 | 4,987,549 | 152,106 | |||||||||
| Net defined benefit liabilities (Notes 4, 5 and 20) | 4,382,530 | 4,072,493 | 124,199 | |||||||||
| Other non-current liabilities | 657,392 | 1,071,509 | 32,677 | |||||||||
| Total non-current liabilities | 64,347,296 | 76,365,603 | 2,328,929 | |||||||||
| Total liabilities | 178,027,423 | 199,061,912 | 6,070,811 | |||||||||
| EQUITY ATTRIBUTABLE TO OWNERS OF THE | ||||||||||||
| COMPANY (Notes 4 and 21) | ||||||||||||
| Share capital | 78,715,179 | 79,185,660 | 2,414,934 | |||||||||
| Capital surplus | 16,013,980 | 23,758,550 | 724,567 | |||||||||
| Retained earnings | ||||||||||||
| Legal reserve | 10,289,878 | 12,649,145 | 385,762 | |||||||||
| Special reserve | 3,353,938 | 3,353,938 | 102,285 | |||||||||
| Unappropriated earnings | 36,000,026 | 37,978,222 | 1,158,226 | |||||||||
| Total retained earnings | 49,643,842 | 53,981,305 | 1,646,273 | |||||||||
| Other equity | 5,067,640 | 5,080,790 | 154,949 | |||||||||
| Treasury shares | (1,959,107 | ) | (7,292,513 | ) | (222,401 | ) | ||||||
| Equity attributable to owners of the Company | 147,481,534 | 154,713,792 | 4,718,322 | |||||||||
| NON-CONTROLLING INTERESTS (Notes 4 and 21) | 8,209,860 | 11,492,545 | 350,490 | |||||||||
| Total equity | 155,691,394 | 166,206,337 | 5,068,812 | |||||||||
| TOTAL | $ | 333,718,817 | $ | 365,268,249 | $ | 11,139,623 | ||||||
ASE Technology Holding Co., Ltd. (formERly known as ADVanced semiconductor engineering, inc.)AND SUBSIDIARIES
CONSOLIDATED BALANCE SHEETS
(Amounts in Thousands)
| December 31, 2017 | December 31, 2018 | |||||||||||
| ASSETS | NT$ | NT$ | US$ (Note 4) | |||||||||
| CURRENT ASSETS | ||||||||||||
| Cash and cash equivalents (Note 6) | $ | 46,078,066 | $ | 51,518,436 | $ | 1,683,059 | ||||||
| Financial assets at fair value through profit or loss - | ||||||||||||
| current (Note 7) | 5,223,067 | 7,262,227 | 237,250 | |||||||||
| Available-for-sale financial assets - current (Note 10) | 89,159 | - | - | |||||||||
| Contract assets - current (Notes 3 and 42) | - | 4,488,500 | 146,635 | |||||||||
| Trade receivables, net (Note 11) | 55,200,706 | 79,481,359 | 2,596,581 | |||||||||
| Other receivables | 1,051,955 | 1,283,180 | 41,920 | |||||||||
| Current tax assets (Note 27) | 260,542 | 524,263 | 17,127 | |||||||||
| Inventories (Note 12) | 24,260,911 | 36,627,451 | 1,196,584 | |||||||||
| Inventories related to real estate business (Notes 13, | ||||||||||||
| 26 and 38) | 9,819,516 | 10,060,608 | 328,671 | |||||||||
| Other financial assets - current (Notes 14 and 38) | 472,340 | 6,539,467 | 213,638 | |||||||||
| Other current assets | 2,482,010 | 3,773,384 | 123,273 | |||||||||
| Total current assets | 144,938,272 | 201,558,875 | 6,584,738 | |||||||||
| NON-CURRENT ASSETS | ||||||||||||
| Financial assets at fair value through profit | ||||||||||||
| or loss - non-current (Note 7) | - | 636,231 | 20,785 | |||||||||
| Financial assets at fair value through other | ||||||||||||
| comprehensive income - non-current (Note 8) | - | 1,597,323 | 52,183 | |||||||||
| Available-for-sale financial assets - non- | ||||||||||||
| current (Note 10) | 1,123,006 | - | - | |||||||||
| Investments accounted for using the equity | ||||||||||||
| method (Note 15) | 48,753,751 | 9,312,308 | 304,224 | |||||||||
| Property, plant and equipment (Notes 16, 26 and 39) | 135,168,406 | 214,592,588 | 7,010,539 | |||||||||
| Investment properties (Notes 17, 26 and 38) | 8,119,436 | 7,738,379 | 252,806 | |||||||||
| Goodwill (Notes 18 and 30) | 9,934,494 | 49,974,446 | 1,632,618 | |||||||||
| Other intangible assets (Notes 19, 26, 30 and 37) | 1,406,865 | 30,897,700 | 1,009,399 | |||||||||
| Deferred tax assets (Note 27) | 4,001,821 | 5,108,357 | 166,885 | |||||||||
| Other financial assets - non-current (Notes 14 and 38) | 1,170,500 | 1,044,294 | 34,116 | |||||||||
| Long-term prepayments for lease (Notes 20 and 38) | 8,851,330 | 10,764,835 | 351,677 | |||||||||
| Other non-current assets | 454,391 | 836,591 | 27,331 | |||||||||
| Total non-current assets | 218,984,000 | 332,503,052 | 10,862,563 | |||||||||
| TOTAL | $ | 363,922,272 | $ | 534,061,927 | $ | 17,447,301 | ||||||
(Continued)
F-4
ASE Technology Holding Co., Ltd. (formERly known as ADVanced semiconductor engineering, inc.)AND SUBSIDIARIES
CONSOLIDATED BALANCE SHEETS
(Amounts in Thousands)
| December 31, 2017 | December 31, 2018 | |||||||||||
| LIABILITIES AND EQUITY | NT$ | NT$ | US$ (Note 4) | |||||||||
| CURRENT LIABILITIES | ||||||||||||
| Short-term borrowings (Note 21) | $ | 17,962,471 | $ | 43,263,469 | $ | 1,413,377 | ||||||
| Financial liabilities at fair value through profit or | ||||||||||||
| loss - current (Note 7) | 677,430 | 36,655 | 1,197 | |||||||||
| Financial liabilities for hedging - current (Note 36) | - | 3,899,634 | 127,397 | |||||||||
| Trade payables | 41,672,233 | 56,884,116 | 1,858,351 | |||||||||
| Other payables (Note 23) | 21,377,887 | 31,003,882 | 1,012,868 | |||||||||
| Current tax liabilities (Note 27) | 7,619,328 | 6,781,136 | 221,533 | |||||||||
| Current portion of bonds payable (Note 22) | 6,161,197 | - | - | |||||||||
| Current portion of long-term borrowings (Notes 21 | ||||||||||||
| and 38) | 8,261,625 | 10,779,034 | 352,141 | |||||||||
| Other current liabilities | 4,644,566 | 5,984,156 | 195,497 | |||||||||
| Total current liabilities | 108,376,737 | 158,632,082 | 5,182,361 | |||||||||
| NON-CURRENT LIABILITIES | ||||||||||||
| Bonds payable (Note 22) | 16,981,583 | 16,985,936 | 554,915 | |||||||||
| Long-term borrowings (Notes 21 and 38) | 27,145,003 | 127,119,295 | 4,152,868 | |||||||||
| Deferred tax liabilities (Note 27) | 4,961,487 | 5,806,713 | 189,700 | |||||||||
| Net defined benefit liabilities (Note 24) | 3,936,685 | 5,118,677 | 167,222 | |||||||||
| Other non-current liabilities | 1,210,590 | 1,371,302 | 44,799 | |||||||||
| Total non-current liabilities | 54,235,348 | 156,401,923 | 5,109,504 | |||||||||
| Total liabilities | 162,612,085 | 315,034,005 | 10,291,865 | |||||||||
| EQUITY ATTRIBUTABLE TO OWNERS OF THE | ||||||||||||
| COMPANY (Note 25) | ||||||||||||
| Share capital | ||||||||||||
| Ordinary shares | 87,246,194 | 43,201,486 | 1,411,352 | |||||||||
| Shares subscribed in advance | 134,593 | 15,658 | 512 | |||||||||
| Total share capital | 87,380,787 | 43,217,144 | 1,411,864 | |||||||||
| Capital surplus (Note 32) | 40,624,328 | 143,276,664 | 4,680,714 | |||||||||
| Retained earnings | ||||||||||||
| Legal reserve | 16,765,066 | - | - | |||||||||
| Special reserve | 3,353,938 | 3,353,938 | 109,570 | |||||||||
| Unappropriated earnings | 53,599,541 | 20,403,477 | 666,562 | |||||||||
| Total retained earnings | 73,718,545 | 23,757,415 | 776,132 | |||||||||
| Other equity | (6,311,089 | ) | (6,903,681 | ) | (225,537 | ) | ||||||
| Treasury shares | (7,292,513 | ) | (1,959,107 | ) | (64,002 | ) | ||||||
| Equity attributable to owners of the Company | 188,120,058 | 201,388,435 | 6,579,171 | |||||||||
| NON-CONTROLLING INTERESTS (Note 25) | 13,190,129 | 17,639,487 | 576,265 | |||||||||
| Total equity | 201,310,187 | 219,027,922 | 7,155,436 | |||||||||
| TOTAL | $ | 363,922,272 | $ | 534,061,927 | $ | 17,447,301 | ||||||
| The accompanying notes are an integral part of the consolidated financial statements. | (Concluded) |
F-3F-5
ADVANCED SEMICONDUCTOR ENGINEERING, INC. ASE Technology Holding Co., Ltd. (formERly known as ADVanced semiconductor engineering, inc.)AND SUBSIDIARIES
CONSOLIDATED STATEMENTS OF COMPREHENSIVE INCOME
(Amounts in Thousands Except Earnings Per Share)
| For the Years Ended December 31 | ||||||||||||||||
| 2013 | 2014 | 2015 | ||||||||||||||
| NT$ | NT$ | NT$ | US$ (Note 4) | |||||||||||||
| OPERATING REVENUES (Note 4) | $ | 219,862,446 | $ | 256,591,447 | $ | 283,302,536 | $ | 8,639,906 | ||||||||
| OPERATING COSTS (Notes 10, 20 | ||||||||||||||||
| and 22) | 177,040,435 | 203,002,918 | 233,167,308 | 7,110,927 | ||||||||||||
| GROSS PROFIT | 42,822,011 | 53,588,529 | 50,135,228 | 1,528,979 | ||||||||||||
| OPERATING EXPENSES (Notes 20 | ||||||||||||||||
| and 22) | ||||||||||||||||
| Selling and marketing expenses | 2,982,789 | 3,438,166 | 3,588,472 | 109,438 | ||||||||||||
| General and administrative expenses | 8,712,862 | 10,214,810 | 10,724,568 | 327,068 | ||||||||||||
| Research and development expenses | 9,064,712 | 10,289,684 | 10,937,566 | 333,564 | ||||||||||||
| Total operating expenses | 20,760,363 | 23,942,660 | 25,250,606 | 770,070 | ||||||||||||
| OTHER OPERATING INCOME AND | ||||||||||||||||
| EXPENSES, NET (Note 22) | (1,348,246 | ) | 228,615 | (251,529 | ) | (7,671 | ) | |||||||||
| PROFIT FROM OPERATIONS | 20,713,402 | 29,874,484 | 24,633,093 | 751,238 | ||||||||||||
| NON-OPERATING INCOME AND | ||||||||||||||||
| EXPENSES | ||||||||||||||||
| Other income (Note 22) | 493,884 | 529,251 | 815,778 | 24,879 | ||||||||||||
| Other gains and losses (Note 22) | 447,886 | 607,299 | 1,748,795 | 53,333 | ||||||||||||
| Finance costs (Note 22) | (2,307,455 | ) | (2,354,097 | ) | (2,312,143 | ) | (70,514 | ) | ||||||||
| Share of the profit or loss | ||||||||||||||||
| of associates (Note 4) | 22,039 | (121,882 | ) | 407,622 | 12,431 | |||||||||||
| Total non-operating income and | ||||||||||||||||
| expenses | (1,343,646 | ) | (1,339,429 | ) | 660,052 | 20,129 | ||||||||||
| PROFIT BEFORE INCOME TAX | 19,369,756 | 28,535,055 | 25,293,145 | 771,367 | ||||||||||||
| INCOME TAX EXPENSE (Notes 4, 5 | ||||||||||||||||
| and 23) | 3,499,595 | 5,665,954 | 4,311,073 | 131,475 | ||||||||||||
| PROFIT FOR THE YEAR | 15,870,161 | 22,869,101 | 20,982,072 | 639,892 | ||||||||||||
| OTHER COMPREHENSIVE INCOME | ||||||||||||||||
| (LOSS) | ||||||||||||||||
| Items that will not be reclassified | ||||||||||||||||
| subsequently to profit or loss: | ||||||||||||||||
| Remeasurement of defined benefit | ||||||||||||||||
| obligation | 412,225 | (28,145 | ) | (62,911 | ) | (1,919 | ) | |||||||||
| Share of other comprehensive | ||||||||||||||||
| loss of associates | - | (1,031 | ) | (37,748 | ) | (1,151 | ) | |||||||||
| For the Year Ended December 31 | ||||||||||||||||
| 2016 | 2017 | |||||||||||||||
| (Retrospectively Adjusted) | (Retrospectively Adjusted) | 2018 | ||||||||||||||
| NT$ | NT$ | NT$ | US$ (Note 4) | |||||||||||||
| OPERATING REVENUES (Notes 3 and 42) | $ | 274,884,107 | $ | 290,441,208 | $ | 371,092,421 | $ | 12,123,242 | ||||||||
| OPERATING COSTS (Notes 12 and 26) | 221,696,922 | 237,708,937 | 309,929,371 | 10,125,102 | ||||||||||||
| GROSS PROFIT | 53,187,185 | 52,732,271 | 61,163,050 | 1,998,140 | ||||||||||||
| OPERATING EXPENSES (Note 26) | ||||||||||||||||
| Selling and marketing expenses | 3,473,586 | 3,308,992 | 4,933,602 | 161,176 | ||||||||||||
| General and administrative expenses | 11,662,082 | 12,458,054 | 14,618,900 | 477,586 | ||||||||||||
| Research and development expenses | 11,391,147 | 11,746,613 | 14,962,799 | 488,821 | ||||||||||||
| Total operating expenses | 26,526,815 | 27,513,659 | 34,515,301 | 1,127,583 | ||||||||||||
| OTHER OPERATING INCOME AND | ||||||||||||||||
| EXPENSES, NET (Note 26) | (800,280 | ) | 108,556 | 371,583 | 12,139 | |||||||||||
| PROFIT FROM OPERATIONS | 25,860,090 | 25,327,168 | 27,019,332 | 882,696 | ||||||||||||
| NON-OPERATING INCOME AND | ||||||||||||||||
| EXPENSES | ||||||||||||||||
| Other income (Note 26) | 589,236 | 707,754 | 1,092,558 | 35,693 | ||||||||||||
| Other gains, net (Note 26) | 2,276,544 | 6,259,453 | 7,874,273 | 257,245 | ||||||||||||
| Finance costs (Note 26) | (2,261,075 | ) | (1,799,494 | ) | (3,568,241 | ) | (116,571 | ) | ||||||||
| Share of the profit or loss of associates and joint ventures | 1,503,910 | 525,782 | (480,244 | ) | (15,689 | ) | ||||||||||
| Total non-operating income and expenses | 2,108,615 | 5,693,495 | 4,918,346 | 160,678 | ||||||||||||
| PROFIT BEFORE INCOME TAX | 27,968,705 | 31,020,663 | 31,937,678 | 1,043,374 | ||||||||||||
| INCOME TAX EXPENSE (Note 27) | 5,390,844 | 6,523,603 | 4,513,369 | 147,448 | ||||||||||||
| PROFIT FOR THE YEAR | 22,577,861 | 24,497,060 | 27,424,309 | 895,926 | ||||||||||||
| �� | ||||||||||||||||
| OTHER COMPREHENSIVE INCOME (LOSS) | ||||||||||||||||
| Items that will not be reclassified | ||||||||||||||||
| subsequently to profit or loss: | ||||||||||||||||
| Remeasurement of defined benefit obligation | (417,181 | ) | 205,344 | (308,180 | ) | (10,068 | ) | |||||||||
| Unrealized loss on equity instruments at fair value | ||||||||||||||||
| through other comprehensive income | - | - | (422,441 | ) | (13,801 | ) | ||||||||||
| Share of other comprehensive income (loss) | ||||||||||||||||
| of associates and joint ventures | (49,794 | ) | 7,249 | (558,217 | ) | (18,237 | ) | |||||||||
(Continued)
F-4F-6
ADVANCED SEMICONDUCTOR ENGINEERING, INC. ASE Technology Holding Co., Ltd. (formERly known as ADVanced semiconductor engineering, inc.)AND SUBSIDIARIES
CONSOLIDATED STATEMENTS OF COMPREHENSIVE INCOME
(Amounts in Thousands Except Earnings Per Share)
| For the Years Ended December 31 | ||||||||||||||||
| 2013 | 2014 | 2015 | ||||||||||||||
| NT$ | NT$ | NT$ | US$ (Note 4) | |||||||||||||
| Income tax relating to items that will | ||||||||||||||||
| not be reclassified subsequently | $ | (66,706 | ) | $ | 23,885 | $ | 11,002 | $ | 336 | |||||||
| 345,519 | (5,291 | ) | (89,657 | ) | (2,734 | ) | ||||||||||
| Items that may be reclassified | ||||||||||||||||
| subsequently to profit or loss: | ||||||||||||||||
| Exchange differences on translating | ||||||||||||||||
| foreign operations | 2,817,268 | 5,405,008 | (63,509 | ) | (1,937 | ) | ||||||||||
| Unrealized gain (loss) on available- | ||||||||||||||||
| for-sale financial assets | 14,839 | (133,714 | ) | 10,451 | 319 | |||||||||||
| Cash flow hedges | 1,245 | 3,279 | - | - | ||||||||||||
| Share of other comprehensive | ||||||||||||||||
| income (loss) of associates | 55,183 | 235,156 | (4,832 | ) | (147 | ) | ||||||||||
| Income tax relating to items that may | ||||||||||||||||
| be reclassified subsequently | (769 | ) | - | - | - | |||||||||||
| 2,887,766 | 5,509,729 | (57,890 | ) | (1,765 | ) | |||||||||||
| Other comprehensive income (loss) | ||||||||||||||||
| for the year, net of income tax | 3,233,285 | 5,504,438 | (147,547 | ) | (4,499 | ) | ||||||||||
| TOTAL COMPREHENSIVE INCOME | ||||||||||||||||
| FOR THE YEAR | $ | 19,103,446 | $ | 28,373,539 | $ | 20,834,525 | $ | 635,393 | ||||||||
| PROFIT FOR THE YEAR | ||||||||||||||||
| ATTRIBUTABLE TO: | ||||||||||||||||
| Owners of the Company | $ | 15,404,505 | $ | 22,228,602 | $ | 20,013,505 | $ | 610,354 | ||||||||
| Non-controlling interests | 465,656 | 640,499 | 968,567 | 29,538 | ||||||||||||
| $ | 15,870,161 | $ | 22,869,101 | $ | 20,982,072 | $ | 639,892 | |||||||||
| TOTAL COMPREHENSIVE INCOME | ||||||||||||||||
| FOR THE YEAR ATTRIBUTABLE TO: | ||||||||||||||||
| Owners of the Company | $ | 18,509,604 | $ | 27,394,362 | $ | 19,940,438 | $ | 608,127 | ||||||||
| Non-controlling interests | 593,842 | 979,177 | 894,087 | 27,267 | ||||||||||||
| $ | 19,103,446 | $ | 28,373,539 | $ | 20,834,525 | $ | 635,394 | |||||||||
| EARNINGS PER SHARE (Note 24) | ||||||||||||||||
| Basic | $ | 2.05 | $ | 2.89 | $ | 2.62 | $ | 0.08 | ||||||||
| Diluted | $ | 1.99 | $ | 2.79 | $ | 2.51 | $ | 0.08 | ||||||||
| EARNINGS PER AMERICAN | ||||||||||||||||
| DEPOSITARY SHARE (“ADS”) | ||||||||||||||||
| Basic | $ | 10.26 | $ | 14.46 | $ | 13.08 | $ | 0.40 | ||||||||
| Diluted | $ | 9.96 | $ | 13.93 | $ | 12.55 | $ | 0.38 | ||||||||
| For the Year Ended December 31 | ||||||||||||||||
| 2016 | 2017 | |||||||||||||||
| (Retrospectively Adjusted) | (Retrospectively Adjusted) | 2018 | ||||||||||||||
| NT$ | NT$ | NT$ | US$ (Note 4) | |||||||||||||
| Income tax relating to items that will | ||||||||||||||||
| not be reclassified subsequently | $ | 73,637 | $ | (51,217 | ) | $ | 134,853 | $ | 4,406 | |||||||
| (393,338 | ) | 161,376 | (1,153,985 | ) | (37,700 | ) | ||||||||||
| Items that may be reclassified | ||||||||||||||||
| subsequently to profit or loss: | ||||||||||||||||
| Exchange differences on translating | ||||||||||||||||
| foreign operations | (6,445,643 | ) | (5,287,734 | ) | 227,821 | 7,443 | ||||||||||
| Unrealized gain (loss) on available- | ||||||||||||||||
| for-sale financial assets | (248,599 | ) | 224,036 | - | - | |||||||||||
| Unrealized loss on investments in | ||||||||||||||||
| debt instruments at fair value | ||||||||||||||||
| through other comprehensive income | - | - | (63,076 | ) | (2,061 | ) | ||||||||||
| Share of other comprehensive | ||||||||||||||||
| income (loss) of associates | ||||||||||||||||
| and joint ventures | (871,679 | ) | 264,389 | 136,608 | 4,463 | |||||||||||
| (7,565,921 | ) | (4,799,309 | ) | 301,353 | 9,845 | |||||||||||
| Other comprehensive loss for the | ||||||||||||||||
| year, net of income tax | (7,959,259 | ) | (4,637,933 | ) | (852,632 | ) | (27,855 | ) | ||||||||
| TOTAL COMPREHENSIVE INCOME | ||||||||||||||||
| FOR THE YEAR | $ | 14,618,602 | $ | 19,859,127 | $ | 26,571,677 | $ | 868,071 | ||||||||
| PROFIT FOR THE YEAR | ||||||||||||||||
| ATTRIBUTABLE TO: | ||||||||||||||||
| Owners of the Company | $ | 21,324,423 | $ | 22,819,119 | $ | 26,220,721 | $ | 856,606 | ||||||||
| Non-controlling interests | 1,253,438 | 1,677,941 | 1,203,588 | 39,320 | ||||||||||||
| $ | 22,577,861 | $ | 24,497,060 | $ | 27,424,309 | $ | 895,926 | |||||||||
| TOTAL COMPREHENSIVE INCOME | ||||||||||||||||
| FOR THE YEAR ATTRIBUTABLE | ||||||||||||||||
| TO: | ||||||||||||||||
| Owners of the Company | $ | 13,956,976 | $ | 18,524,067 | $ | 25,620,461 | $ | 836,996 | ||||||||
| Non-controlling interests | 661,626 | 1,335,060 | 951,216 | 31,075 | ||||||||||||
| $ | 14,618,602 | $ | 19,859,127 | $ | 26,571,677 | $ | 868,071 | |||||||||
| EARNINGS PER SHARE (Note 28) | ||||||||||||||||
| Basic | $ | 5.57 | $ | 5.59 | $ | 6.18 | $ | 0.20 | ||||||||
| Diluted | $ | 4.66 | $ | 5.19 | $ | 6.07 | $ | 0.20 | ||||||||
| EARNINGS PER AMERICAN | ||||||||||||||||
| DEPOSITARY SHARE (“ADS”) | ||||||||||||||||
| (Note 28) | ||||||||||||||||
| Basic | $ | 11.13 | $ | 11.18 | $ | 12.35 | $ | 0.40 | ||||||||
| Diluted | $ | 9.31 | $ | 10.38 | $ | 12.14 | $ | 0.40 | ||||||||
| The accompanying notes are an integral part of the consolidated financial statements. | (Concluded) |
F-7
ASE Technology Holding Co., Ltd. (formERly known as ADVanced semiconductor engineering, inc.)AND SUBSIDIARIES
CONSOLIDATED STATEMENTS OF CHANGES IN EQUITY
(Amounts in Thousands)
| Equity Attributable to Owners of the Company | ||||||||||||||||||||||||||||||||||||||||||||||||||||||||||||
| Other Equity | ||||||||||||||||||||||||||||||||||||||||||||||||||||||||||||
| Share Capital | Retained Earnings | Exchange Differences on Translating | Unrealized Gain (Loss) on Available-for- | Unrealized Gain (Loss) on Financial Assets at Fair Value Through Other | ||||||||||||||||||||||||||||||||||||||||||||||||||||||||
| Shares (In Thousands) | Amounts | Capital Surplus | Legal Reserve | Special Reserve | Unappropriated Earnings | Total | Foreign Operations | sale Financial Assets | Comprehensive Income | Total | Treasury Shares | Total | Non-controlling Interests | Total Equity | ||||||||||||||||||||||||||||||||||||||||||||||
| BALANCE AT JANUARY 1, 2016 | 7,910,428 | $ | 79,185,660 | $ | 23,758,550 | $ | 12,649,145 | $ | 3,353,938 | $ | 37,696,865 | $ | 53,699,948 | $ | 4,492,671 | $ | 588,119 | $ | - | $ | 5,080,790 | $ | (7,292,513 | ) | $ | 154,432,435 | $ | 11,492,545 | $ | 165,924,980 | ||||||||||||||||||||||||||||||
| Change from investments in associates and joint ventures | ||||||||||||||||||||||||||||||||||||||||||||||||||||||||||||
| accounted for using the equity method | - | - | 51,959 | - | - | - | - | - | 43,536 | - | 43,536 | - | 95,495 | - | 95,495 | |||||||||||||||||||||||||||||||||||||||||||||
| Net profit for the year ended December 31, 2016 | - | - | - | - | - | 21,324,423 | 21,324,423 | - | - | - | - | - | 21,324,423 | 1,253,438 | 22,577,861 | |||||||||||||||||||||||||||||||||||||||||||||
| Other comprehensive income (loss) for the year ended | ||||||||||||||||||||||||||||||||||||||||||||||||||||||||||||
| December 31, 2016, net of income tax | - | - | - | - | - | (402,184 | ) | (402,184 | ) | (6,136,294 | ) | (828,969 | ) | - | (6,965,263 | ) | - | (7,367,447 | ) | (591,812 | ) | (7,959,259 | ) | |||||||||||||||||||||||||||||||||||||
| Total comprehensive income (loss) for the year | ||||||||||||||||||||||||||||||||||||||||||||||||||||||||||||
| ended December 31, 2016 | - | - | - | - | - | 20,922,239 | 20,922,239 | (6,136,294 | ) | (828,969 | ) | - | (6,965,263 | ) | - | 13,956,976 | 661,626 | 14,618,602 | ||||||||||||||||||||||||||||||||||||||||||
| Appropriation of 2015 earnings | ||||||||||||||||||||||||||||||||||||||||||||||||||||||||||||
| Legal reserve | - | - | - | 1,947,887 | - | (1,947,887 | ) | - | - | - | - | - | - | - | - | - | ||||||||||||||||||||||||||||||||||||||||||||
| Cash dividends distributed by the Company | - | - | - | - | - | (12,476,779 | ) | (12,476,779 | ) | - | - | - | - | - | (12,476,779 | ) | - | (12,476,779 | ) | |||||||||||||||||||||||||||||||||||||||||
| - | - | - | 1,947,887 | - | (14,424,666 | ) | (12,476,779 | ) | - | - | - | - | - | (12,476,779 | ) | - | (12,476,779 | ) | ||||||||||||||||||||||||||||||||||||||||||
| Issue of dividends received by subsidiaries from the Company | - | - | 233,013 | - | - | - | - | - | - | - | - | - | 233,013 | - | 233,013 | |||||||||||||||||||||||||||||||||||||||||||||
| Partial disposal of interests in subsidiaries and additional | ||||||||||||||||||||||||||||||||||||||||||||||||||||||||||||
| acquisition of majority-owned subsidiaries (Note 32) | - | - | (20,552 | ) | - | - | (5,884 | ) | (5,884 | ) | - | - | - | - | - | (26,436 | ) | 26,436 | - | |||||||||||||||||||||||||||||||||||||||||
| Changes in percentage of ownership interest in subsidiaries | - | - | (1,912,887 | ) | - | - | - | - | - | - | - | - | - | (1,912,887 | ) | (912,886 | ) | (2,825,773 | ) | |||||||||||||||||||||||||||||||||||||||||
| Issue of ordinary shares under employee share | ||||||||||||||||||||||||||||||||||||||||||||||||||||||||||||
| options (Note 29) | 35,756 | 382,380 | 600,737 | - | - | - | - | - | - | - | - | - | 983,117 | - | 983,117 | |||||||||||||||||||||||||||||||||||||||||||||
| Non-controlling interests arising from | ||||||||||||||||||||||||||||||||||||||||||||||||||||||||||||
| acquisition of subsidiaries | - | - | - | - | - | - | - | - | - | - | - | - | - | 42,857 | 42,857 | |||||||||||||||||||||||||||||||||||||||||||||
| Cash dividends distributed by subsidiaries | - | - | - | - | - | - | - | - | - | - | - | - | - | (237,850 | ) | (237,850 | ) | |||||||||||||||||||||||||||||||||||||||||||
| Additional non-controlling interest arising on issue | ||||||||||||||||||||||||||||||||||||||||||||||||||||||||||||
| of employee share options by subsidiaries (Note 29) | - | - | (444,320 | ) | - | - | - | - | - | - | - | - | - | (444,320 | ) | 927,823 | 483,503 | |||||||||||||||||||||||||||||||||||||||||||
| BALANCE AT DECEMBER 31, 2016 | 7,946,184 | 79,568,040 | 22,266,500 | 14,597,032 | 3,353,938 | 44,188,554 | 62,139,524 | (1,643,623 | ) | (197,314 | ) | - | (1,840,937 | ) | (7,292,513 | ) | 154,840,614 | 12,000,551 | 166,841,165 | |||||||||||||||||||||||||||||||||||||||||
| Change from investments in associates and joint ventures | ||||||||||||||||||||||||||||||||||||||||||||||||||||||||||||
| accounted for using the equity method | - | - | 1,490 | - | - | - | - | - | - | - | - | - | 1,490 | - | 1,490 | |||||||||||||||||||||||||||||||||||||||||||||
| Net profit for the year ended December 31,2017 | - | - | - | - | - | 22,819,119 | 22,819,119 | - | - | - | - | - | 22,819,119 | 1,677,941 | 24,497,060 | |||||||||||||||||||||||||||||||||||||||||||||
| Other comprehensive income (loss) for the year ended | ||||||||||||||||||||||||||||||||||||||||||||||||||||||||||||
| December 31, 2017, net of income tax | - | - | - | - | - | 175,100 | 175,100 | (5,090,036 | ) | 619,884 | - | (4,470,152 | ) | - | (4,295,052 | ) | (342,881 | ) | (4,637,933 | ) | ||||||||||||||||||||||||||||||||||||||||
| Total comprehensive income (loss) for the year | ||||||||||||||||||||||||||||||||||||||||||||||||||||||||||||
| ended December 31, 2017 | - | - | �� | - | - | - | 22,994,219 | 22,994,219 | (5,090,036 | ) | 619,884 | - | (4,470,152 | ) | - | 18,524,067 | 1,335,060 | 19,859,127 | ||||||||||||||||||||||||||||||||||||||||||
| Appropriation of 2016 earnings | ||||||||||||||||||||||||||||||||||||||||||||||||||||||||||||
| Legal reserve | - | - | - | 2,168,034 | - | (2,168,034 | ) | - | - | - | - | - | - | - | - | - | ||||||||||||||||||||||||||||||||||||||||||||
| Cash dividends distributed by the Company | - | - | - | - | - | (11,415,198 | ) | (11,415,198 | ) | - | - | - | - | - | (11,415,198 | ) | - | (11,415,198 | ) | |||||||||||||||||||||||||||||||||||||||||
| - | - | - | 2,168,034 | - | (13,583,232 | ) | (11,415,198 | ) | - | - | - | - | - | (11,415,198 | ) | - | (11,415,198 | ) | ||||||||||||||||||||||||||||||||||||||||||
| Issue of ordinary shares for capital increase by cash (Note 29) | 300,000 | 3,000,000 | 7,290,000 | - | - | - | - | - | - | - | - | - | 10,290,000 | - | 10,290,000 | |||||||||||||||||||||||||||||||||||||||||||||
| Issue of ordinary shares under conversion of bonds | ||||||||||||||||||||||||||||||||||||||||||||||||||||||||||||
| Notes 22 and 25) | 424,258 | 4,242,577 | 9,657,905 | - | - | - | - | - | - | - | - | - | 13,900,482 | - | 13,900,482 | |||||||||||||||||||||||||||||||||||||||||||||
(Continued)
F-8
ASE Technology Holding Co., Ltd. (formERly known as ADVanced semiconductor engineering, inc.)AND SUBSIDIARIES
CONSOLIDATED STATEMENTS OF CHANGES IN EQUITY
(Amounts in Thousands)
| Equity Attributable to Owners of the Company | ||||||||||||||||||||||||||||||||||||||||||||||||||||||||||||
| Other Equity | ||||||||||||||||||||||||||||||||||||||||||||||||||||||||||||
| Share Capital | Retained Earnings | Exchange Differences on Translating | Unrealized Gain (Loss) on Available-for- | Unrealized Gain (Loss) on Financial Assets at Fair Value Through Other | ||||||||||||||||||||||||||||||||||||||||||||||||||||||||
| Shares (In Thousands) | Amounts | Capital Surplus | Legal Reserve | Special Reserve | Unappropriated Earnings | Total | Foreign Operations | sale Financial Assets | Comprehensive Income | Total | Treasury Shares | Total | Non-controlling Interests | Total Equity | ||||||||||||||||||||||||||||||||||||||||||||||
| Issue of dividends received by subsidiaries from the Company | - | $ | - | $ | 200,977 | $ | - | $ | - | $ | - | $ | - | $ | - | $ | - | $ | - | $ | - | $ | - | $ | 200,977 | $ | - | $ | 200,977 | |||||||||||||||||||||||||||||||
| Changes in percentage of ownership interest in subsidiaries | - | - | 3,055 | - | - | - | - | - | - | - | - | - | 3,055 | (3,055 | ) | - | ||||||||||||||||||||||||||||||||||||||||||||
| Issue of ordinary shares under employee share | ||||||||||||||||||||||||||||||||||||||||||||||||||||||||||||
| options (Note 29) | 67,637 | 570,170 | 1,256,789 | - | - | - | - | - | - | - | - | - | 1,826,959 | (159,200 | ) | 1,667,759 | ||||||||||||||||||||||||||||||||||||||||||||
| Cash dividends distributed by subsidiaries | - | - | - | - | - | - | - | - | - | - | - | - | - | (246,440 | ) | (246,440 | ) | |||||||||||||||||||||||||||||||||||||||||||
| Additional non-controlling interest arising on issue of | ||||||||||||||||||||||||||||||||||||||||||||||||||||||||||||
| employee share options by subsidiaries (Note 29) | - | - | (52,388 | ) | - | - | - | - | - | - | - | - | - | (52,388 | ) | 263,213 | 210,825 | |||||||||||||||||||||||||||||||||||||||||||
| BALANCE AT DECEMBER 31, 2017 | 8,738,079 | 87,380,787 | 40,624,328 | 16,765,066 | 3,353,938 | 53,599,541 | 73,718,545 | (6,733,659 | ) | 422,570 | - | (6,311,089 | ) | (7,292,513 | ) | 188,120,058 | 13,190,129 | 201,310,187 | ||||||||||||||||||||||||||||||||||||||||||
| Effect of retrospective applications (Note 3) | - | - | - | - | - | 886,316 | 886,316 | - | (422,570 | ) | 135,517 | (287,053 | ) | - | 599,263 | 5,183 | 604,446 | |||||||||||||||||||||||||||||||||||||||||||
| ADJUSTED BALANCE AT JANUARY 1, 2018 | 8,738,079 | 87,380,787 | 40,624,328 | 16,765,066 | 3,353,938 | 54,485,857 | 74,604,861 | (6,733,659 | ) | - | 135,517 | (6,598,142 | ) | (7,292,513 | ) | 188,719,321 | 13,195,312 | 201,914,633 | ||||||||||||||||||||||||||||||||||||||||||
| Change from investments in associates and joint ventures | ||||||||||||||||||||||||||||||||||||||||||||||||||||||||||||
| accounted for using the equity method | - | - | 1,411,899 | - | - | 88,201 | 88,201 | - | - | - | - | - | 1,500,100 | - | 1,500,100 | |||||||||||||||||||||||||||||||||||||||||||||
| Cash dividends paid from the capital surplus (Note 25) | - | - | (10,795,980 | ) | - | - | - | - | - | - | - | - | - | (10,795,980 | ) | - | (10,795,980 | ) | ||||||||||||||||||||||||||||||||||||||||||
| Other changes in the capital surplus | - | - | 872 | - | - | - | - | - | - | - | - | - | 872 | - | 872 | |||||||||||||||||||||||||||||||||||||||||||||
| Net profit for the year ended December 31,2018 | - | - | - | - | - | 26,220,721 | 26,220,721 | - | - | - | - | - | 26,220,721 | 1,203,588 | 27,424,309 | |||||||||||||||||||||||||||||||||||||||||||||
| Other comprehensive income (loss) for the year ended | ||||||||||||||||||||||||||||||||||||||||||||||||||||||||||||
| December 31, 2018, net of income tax | - | - | - | - | - | (146,194 | ) | (146,194 | ) | 562,794 | - | (1,016,860 | ) | (454,066 | ) | - | (600,260 | ) | (252,372 | ) | (852,632 | ) | ||||||||||||||||||||||||||||||||||||||
| Total comprehensive income (loss) for the year | ||||||||||||||||||||||||||||||||||||||||||||||||||||||||||||
| ended December 31, 2018 | - | - | - | - | - | 26,074,527 | 26,074,527 | 562,794 | - | (1,016,860 | ) | (454,066 | ) | - | 25,620,461 | 951,216 | 26,571,677 | |||||||||||||||||||||||||||||||||||||||||||
| Effect of the joint share exchange (Note 25) | (4,318,392 | ) | (43,183,919 | ) | 117,693,658 | (16,765,066 | ) | - | (57,744,673 | ) | (74,509,739 | ) | - | - | - | - | - | - | - | - | ||||||||||||||||||||||||||||||||||||||||
| Buy-back of ordinary shares | - | - | - | - | - | - | - | - | - | - | - | (71,302 | ) | (71,302 | ) | - | (71,302 | ) | ||||||||||||||||||||||||||||||||||||||||||
| Cancellation of treasury shares | (121,852 | ) | (1,218,520 | ) | (1,480,903 | ) | - | - | (2,705,285 | ) | (2,705,285 | ) | - | - | - | - | 5,404,708 | - | - | - | ||||||||||||||||||||||||||||||||||||||||
| Issue of dividends received by subsidiaries from the Company | - | - | 182,354 | - | - | - | - | - | - | - | - | - | 182,354 | - | 182,354 | |||||||||||||||||||||||||||||||||||||||||||||
| Disposal of interest in associates and joint ventures | ||||||||||||||||||||||||||||||||||||||||||||||||||||||||||||
| accounted for using the equity method | - | - | (1,408,495 | ) | - | - | 204,450 | 204,450 | 282,291 | - | (133,364 | ) | 148,927 | - | (1,055,118 | ) | - | (1,055,118 | ) | |||||||||||||||||||||||||||||||||||||||||
| Differences between consideration and carrying amount | ||||||||||||||||||||||||||||||||||||||||||||||||||||||||||||
| arising from acquisition or disposal of subsidiaries (Note 32) | - | - | (1,142,856 | ) | - | - | - | - | - | - | - | - | - | (1,142,856 | ) | 2,783,015 | 1,640,159 | |||||||||||||||||||||||||||||||||||||||||||
| Changes in percentage of ownership interest in | ||||||||||||||||||||||||||||||||||||||||||||||||||||||||||||
| subsidiaries (Note 32) | - | - | (1,118,102 | ) | - | - | - | - | - | - | - | - | - | (1,118,102 | ) | (801,884 | ) | (1,919,986 | ) | |||||||||||||||||||||||||||||||||||||||||
| Issue of ordinary shares under employee share | ||||||||||||||||||||||||||||||||||||||||||||||||||||||||||||
| options (Note 29) | 23,879 | 238,796 | 549,345 | - | - | - | - | - | - | - | - | - | 788,141 | - | 788,141 | |||||||||||||||||||||||||||||||||||||||||||||
| Cash dividends distributed by subsidiaries | - | - | - | - | - | - | - | - | - | - | - | - | - | (424,815 | ) | (424,815 | ) | |||||||||||||||||||||||||||||||||||||||||||
| Additional non-controlling interest arising on issue of | ||||||||||||||||||||||||||||||||||||||||||||||||||||||||||||
| employee share options by subsidiaries (Note 29) | - | - | (1,239,456 | ) | - | - | - | - | - | - | - | - | - | (1,239,456 | ) | 1,936,643 | 697,187 | |||||||||||||||||||||||||||||||||||||||||||
| Fair value through other comprehensive income | ||||||||||||||||||||||||||||||||||||||||||||||||||||||||||||
| - equity instruments | - | - | - | - | - | 400 | 400 | - | - | (400 | ) | (400 | ) | - | - | - | �� | - | ||||||||||||||||||||||||||||||||||||||||||
| BALANCE AT DECEMBER 31, 2018 | 4,321,714 | $ | 43,217,144 | $ | 143,276,664 | $ | - | $ | 3,353,938 | $ | 20,403,477 | $ | 23,757,415 | $ | (5,888,574 | ) | $ | - | $ | (1,015,107 | ) | $ | (6,903,681 | ) | $ | (1,959,107 | ) | $ | 201,388,435 | $ | 17,639,487 | $ | 219,027,922 | |||||||||||||||||||||||||||
| US DOLLARS (Note 4) | ||||||||||||||||||||||||||||||||||||||||||||||||||||||||||||
| BALANCE AT DECEMBER 31, 2018 | 4,321,714 | $ | 1,411,864 | $ | 4,680,714 | $ | - | $ | 109,570 | $ | 666,562 | $ | 776,132 | $ | (192,374 | ) | $ | - | $ | (33,163 | ) | $ | (225,537 | ) | $ | (64,002 | ) | $ | 6,579,171 | $ | 576,265 | $ | 7,155,436 | |||||||||||||||||||||||||||
| The accompanying notes are an integral part of the consolidated financial statements. | (Concluded) |
F-5F-9
ADVANCED SEMICONDUCTOR ENGINEERING, INC. ASE Technology Holding Co., Ltd. (formERly known as ADVanced semiconductor engineering, inc.)AND SUBSIDIARIES
CONSOLIDATED STATEMENTS OF CHANGES IN EQUITYCASH FLOWS
(Amounts in Thousands)
| Equity Attributable to Owners of the Company | |||||||||||||||||||||||||||||||||||||||||||||
| Accumulated Other Comprehensive Income | |||||||||||||||||||||||||||||||||||||||||||||
| Share Capital | Retained Earnings | Exchange Differences on | Unrealized Gain on Available- | ||||||||||||||||||||||||||||||||||||||||||
Shares (In Thousands) | Amounts | Capital Surplus | Legal Reserve | Special Reserve | Unappro- priated | Total | Translating | -for-sale Financial Assets | Cash Flow Hedges | Total | Treasury Shares | Total | Non-- controlling Interests | Total Equity | |||||||||||||||||||||||||||||||
| BALANCE AT JANUARY 1, 2013 | 7,602,292 | $ | 76,047,667 | $ | 5,274,634 | $ | 7,411,835 | $ | - | $ | 22,398,409 | $ | 29,810,244 | $ | (3,210,248 | ) | $ | 355,254 | $ | (3,755 | ) | $ | (2,858,749 | ) | $ | (1,959,107 | ) | $ | 106,314,689 | $ | 3,505,743 | $ | 109,820,432 | ||||||||||||
| Special reserve under Rule No. 1010012865 issued by the Financial Supervisory Commission (Note 21) | - | - | - | - | 3,353,938 | (3,353,938 | ) | - | - | - | - | - | - | - | - | - | |||||||||||||||||||||||||||||
| Profit for the year ended December 31, 2013 | - | - | - | - | - | 15,404,505 | 15,404,505 | - | - | - | - | - | 15,404,505 | 465,656 | 15,870,161 | ||||||||||||||||||||||||||||||
| Other comprehensive income for the year ended December 31, 2013, net of income tax | - | - | - | - | - | 348,904 | 348,904 | 2,684,727 | 70,992 | 476 | 2,756,195 | - | 3,105,099 | 128,186 | 3,233,285 | ||||||||||||||||||||||||||||||
| Total comprehensive income for the year ended December 31, 2013 | - | - | - | - | - | 15,753,409 | 15,753,409 | 2,684,727 | 70,992 | 476 | 2,756,195 | - | 18,509,604 | 593,842 | 19,103,446 | ||||||||||||||||||||||||||||||
| Issue of ordinary shares for cash (Note 21) | 130,000 | 1,300,000 | 2,093,000 | - | - | - | - | - | - | - | - | - | 3,393,000 | - | 3,393,000 | ||||||||||||||||||||||||||||||
| Appropriation of 2012 earnings | |||||||||||||||||||||||||||||||||||||||||||||
| Legal reserve | - | - | - | 1,309,136 | - | (1,309,136 | ) | - | - | - | - | - | - | - | - | - | |||||||||||||||||||||||||||||
| Special reserve | - | - | - | - | 309,992 | (309,992 | ) | - | - | - | - | - | - | - | - | - | |||||||||||||||||||||||||||||
| Cash dividends distributed by the Company | - | - | - | - | - | (7,987,974 | ) | (7,987,974 | ) | - | - | - | - | - | (7,987,974 | ) | - | (7,987,974 | ) | ||||||||||||||||||||||||||
| - | - | - | 1,309,136 | 309,992 | (9,607,102 | ) | (7,987,974 | ) | - | - | - | - | - | (7,987,974 | ) | - | (7,987,974 | ) | |||||||||||||||||||||||||||
| Cash dividends distributed by subsidiaries | - | - | - | - | - | - | - | - | - | - | - | - | - | (99,597 | ) | (99,597 | ) | ||||||||||||||||||||||||||||
| Issue of dividends received by subsidiaries from the Company | - | - | 153,097 | - | - | - | - | - | - | - | - | - | 153,097 | - | 153,097 | ||||||||||||||||||||||||||||||
| Partial disposal of interests in subsidiaries and additional acquisition of partially-owned subsidiaries (Notes 21 and 27) | - | - | (330 | ) | - | - | - | - | - | - | - | - | - | (330 | ) | 27,826 | 27,496 | ||||||||||||||||||||||||||||
| Changes in capital surplus from investments in associates accounted for using the equity method | - | - | 1,457 | - | - | - | - | - | - | - | - | - | 1,457 | - | 1,457 | ||||||||||||||||||||||||||||||
| Issue of ordinary shares under employee share options | 55,535 | 832,591 | 399,517 | - | - | - | - | - | - | - | - | - | 1,232,108 | 100,547 | 1,332,655 | ||||||||||||||||||||||||||||||
| BALANCE AT DECEMBER 31, 2013 | 7,787,827 | 78,180,258 | 7,921,375 | 8,720,971 | 3,663,930 | 25,190,778 | 37,575,679 | (525,521 | ) | 426,246 | (3,279 | ) | (102,554 | ) | (1,959,107 | ) | 121,615,651 | 4,128,361 | 125,744,012 | ||||||||||||||||||||||||||
| Change in capital surplus from investments in associates accounted for using the equity method | - | - | 26,884 | - | - | - | - | - | - | - | - | - | 26,884 | - | 26,884 | ||||||||||||||||||||||||||||||
| Profit for the year ended December 31,2014 | - | - | - | - | - | 22,228,602 | 22,228,602 | - | - | - | - | - | 22,228,602 | 640,499 | 22,869,101 | ||||||||||||||||||||||||||||||
| Other comprehensive income (loss) for the year ended December 31, 2014, net of income tax | - | - | - | - | - | (4,434 | ) | (4,434 | ) | 5,066,383 | 100,532 | 3,279 | 5,170,194 | - | 5,165,760 | 338,678 | 5,504,438 | ||||||||||||||||||||||||||||
| Total comprehensive income for the year ended December 31, 2014 | - | - | - | - | - | 22,224,168 | 22,224,168 | 5,066,383 | 100,532 | 3,279 | 5,170,194 | - | 27,394,362 | 979,177 | 28,373,539 | ||||||||||||||||||||||||||||||
| Appropriation of 2013 earnings | |||||||||||||||||||||||||||||||||||||||||||||
| Legal reserve | - | - | - | 1,568,907 | - | (1,568,907 | ) | - | - | - | - | - | - | - | - | - | |||||||||||||||||||||||||||||
| Special reserve | - | - | - | - | (309,992 | ) | 309,992 | - | - | - | - | - | - | - | - | - | |||||||||||||||||||||||||||||
| Cash dividends distributed by the Company | - | - | - | - | - | (10,156,005 | ) | (10,156,005 | ) | - | - | - | - | - | (10,156,005 | ) | - | (10,156,005 | ) | ||||||||||||||||||||||||||
| - | - | - | 1,568,907 | (309,992 | ) | (11,414,920 | ) | (10,156,005 | ) | - | - | - | - | - | (10,156,005 | ) | - | (10,156,005 | ) | ||||||||||||||||||||||||||
| Issue of dividends received by subsidiaries from the Company | - | - | 188,790 | - | - | - | - | - | - | - | - | - | 188,790 | - | 188,790 | ||||||||||||||||||||||||||||||
| Partial disposal of interests in subsidiaries and additional acquisition of partially-owned subsidiaries (Notes 21 and 27) | - | - | 6,876,866 | - | - | - | - | - | - | - | - | - | 6,876,866 | 3,067,712 | 9,944,578 | ||||||||||||||||||||||||||||||
| For the Year Ended December 31 | ||||||||||||||||
| 2016 | 2017 | 2018 | ||||||||||||||
| NT$ | NT$ | NT$ | US$ (Note 4) | |||||||||||||
| CASH FLOWS FROM OPERATING | ||||||||||||||||
| ACTIVITIES | ||||||||||||||||
| Profit before income tax | $ | 27,968,705 | $ | 31,020,663 | $ | 31,937,678 | $ | 1,043,374 | ||||||||
| Adjustments for: | ||||||||||||||||
| Depreciation expense | 28,961,614 | 28,747,518 | 40,286,453 | 1,316,121 | ||||||||||||
| Amortization expense | 508,823 | 457,666 | 2,402,450 | 78,486 | ||||||||||||
| Net loss (gain) on fair value change of | ||||||||||||||||
| financial assets and liabilities at fair value | ||||||||||||||||
| through profit or loss | (447,559 | ) | 2,783,902 | (1,989,490 | ) | (64,995 | ) | |||||||||
| Finance costs | 2,261,075 | 1,799,494 | 3,568,241 | 116,571 | ||||||||||||
| Interest income | (230,067 | ) | (306,871 | ) | (466,211 | ) | (15,231 | ) | ||||||||
| Dividend income | (26,411 | ) | (59,039 | ) | (190,397 | ) | (6,220 | ) | ||||||||
| Compensation cost of employee share options | 470,788 | 438,765 | 215,648 | 7,045 | ||||||||||||
| Share of loss (profit) of associates and | ||||||||||||||||
| joint ventures | (1,503,910 | ) | (525,782 | ) | 480,244 | 15,689 | ||||||||||
| Loss (gain) on disposal of property, | ||||||||||||||||
| plant and equipment | 131,044 | (348,070 | ) | 56,902 | 1,859 | |||||||||||
| Impairment loss recognized on financial assets | 91,886 | 77,101 | 675,624 | 22,072 | ||||||||||||
| Reversal of impairment loss recognized on | ||||||||||||||||
| financial assets | (28,022 | ) | - | - | - | |||||||||||
| Impairment loss recognized on non- | ||||||||||||||||
| financial assets | 1,340,011 | 1,113,499 | 1,113,998 | 36,393 | ||||||||||||
| Reversal of impairment loss recognized | ||||||||||||||||
| on non-financial assets | - | - | (100,000 | ) | (3,267 | ) | ||||||||||
| Gain on disposal of subsidiaries | - | (5,589,457 | ) | - | - | |||||||||||
| Gain on remeasurement of investments accounted | ||||||||||||||||
| for using the equity method | - | - | (7,421,408 | ) | (242,451 | ) | ||||||||||
| Net loss (gain) on foreign currency exchange | (407,160 | ) | (2,356,480 | ) | 1,360,380 | 44,442 | ||||||||||
| Others | 900,378 | 1,172,005 | 1,142,735 | 37,332 | ||||||||||||
| Changes in operating assets and liabilities | ||||||||||||||||
| Financial assets held for trading | 1,052,111 | (226,049 | ) | - | - | |||||||||||
| Financial assets mandatorily at fair value | ||||||||||||||||
| through profit or loss | - | - | 345,540 | 11,288 | ||||||||||||
| Contract assets | - | - | (508,166 | ) | (16,601 | ) | ||||||||||
| Trade receivables | (6,184,873 | ) | (4,066,374 | ) | (9,313,539 | ) | (304,265 | ) | ||||||||
| Other receivables | (211,755 | ) | (330,491 | ) | 443,517 | 14,489 | ||||||||||
| Inventories | 3,156,759 | (2,907,848 | ) | (9,249,714 | ) | (302,179 | ) | |||||||||
| Other current assets | (24,517 | ) | (781,477 | ) | (385,172 | ) | (12,583 | ) | ||||||||
| Financial liabilities held for trading | (2,952,116 | ) | (3,874,662 | ) | (2,039,771 | ) | (66,637 | ) | ||||||||
| Trade payables | 1,665,420 | 4,753,270 | 6,989,198 | 228,331 | ||||||||||||
| Other payables | 1,380,205 | 685,398 | 1,016,338 | 33,203 | ||||||||||||
| Other current liabilities | (2,347,599 | ) | 211,145 | 228,190 | 7,455 | |||||||||||
| Other operating activities items | (407,143 | ) | 27,538 | (281,736 | ) | (9,204 | ) | |||||||||
| Cash generated from operations | 55,117,687 | 51,915,364 | 60,317,532 | 1,970,517 | ||||||||||||
| Interest received | 228,509 | 236,746 | 523,679 | 17,108 | ||||||||||||
| Dividend received | 4,043,644 | 1,929,218 | 297,882 | 9,731 | ||||||||||||
| Interest paid | (2,043,870 | ) | (1,666,759 | ) | (3,239,159 | ) | (105,820 | ) | ||||||||
| Income tax paid | (5,238,103 | ) | (4,983,769 | ) | (6,825,243 | ) | (222,974 | ) | ||||||||
| Net cash generated from operating | ||||||||||||||||
| activities | 52,107,867 | 47,430,800 | 51,074,691 | 1,668,562 | ||||||||||||
(Continued)
F-6F-10
ADVANCED SEMICONDUCTOR ENGINEERING, INC. ASE Technology Holding Co., Ltd. (formERly known as ADVanced semiconductor engineering, inc.)AND SUBSIDIARIES
CONSOLIDATED STATEMENTS OF CHANGES IN EQUITYCASH FLOWS
(Amounts in Thousands)
| For the Year Ended December 31 | ||||||||||||||||
| 2016 | 2017 | 2018 | ||||||||||||||
| NT$ | NT$ | NT$ | US$ (Note 4) | |||||||||||||
| CASH FLOWS FROM INVESTING | ||||||||||||||||
| ACTIVITIES | ||||||||||||||||
| Purchase of financial assets at fair value through other | ||||||||||||||||
| comprehensive income | $ | - | $ | - | $ | (105,000 | ) | $ | (3,430 | ) | ||||||
| Proceeds on sale of financial assets at fair value through | ||||||||||||||||
| other comprehensive income | - | - | 94,217 | 3,078 | ||||||||||||
| Return of capital from financial assets at fair value through | ||||||||||||||||
| other comprehensive income | - | - | 116,278 | 3,799 | ||||||||||||
| Purchase of financial assets designated | ||||||||||||||||
| as at fair value through profit or loss | (64,853,336 | ) | (61,308,095 | ) | - | - | ||||||||||
| Proceeds on sale of financial assets | ||||||||||||||||
| designated as at fair value through | ||||||||||||||||
| profit or loss | 66,472,870 | 61,601,865 | - | - | ||||||||||||
| Purchase of available-for-sale financial | ||||||||||||||||
| assets | (1,590,928 | ) | (902,648 | ) | - | - | ||||||||||
| Proceeds on sale of available-for-sale | ||||||||||||||||
| financial assets | 867,336 | 1,121,517 | - | - | ||||||||||||
| Cash received from return of capital by | ||||||||||||||||
| available-for-sale financial assets | 28,927 | 16,175 | - | - | ||||||||||||
| Acquisition of associates and joint ventures | (16,041,463 | ) | - | (451,563 | ) | (14,752 | ) | |||||||||
| Net cash outflow on acquisition of subsidiaries | (73,437 | ) | - | (95,241,855 | ) | (3,111,462 | ) | |||||||||
| Cash received from return of capital by investee | ||||||||||||||||
| accounted for using the equity method | - | - | 262,941 | 8,590 | ||||||||||||
| Net cash inflow from disposal of subsidiaries | - | 7,020,883 | - | - | ||||||||||||
| Payments for property, plant and equipment | (26,714,163 | ) | (24,699,240 | ) | (41,386,443 | ) | (1,352,057 | ) | ||||||||
| Proceeds from disposal of property, plant | ||||||||||||||||
| and equipment | 670,200 | 1,488,210 | 1,127,644 | 36,839 | ||||||||||||
| Payments for intangible assets | (513,893 | ) | (337,984 | ) | (577,765 | ) | (18,875 | ) | ||||||||
| Proceeds from disposal of intangible assets | 25,646 | 34,690 | - | - | ||||||||||||
| Payments for investment properties | - | (186,522 | ) | (125,764 | ) | (4,109 | ) | |||||||||
| Decrease (increase) in other financial assets | (1,231,186 | ) | 236,227 | 6,208,527 | 202,827 | |||||||||||
| Increase in other non-current assets | (206,031 | ) | (171,320 | ) | (1,970,772 | ) | (64,383 | ) | ||||||||
| Proceeds from financial liabilities for hedging | - | - | 2,507,233 | 81,909 | ||||||||||||
| Net cash used in investing activities | (43,159,458 | ) | (16,086,242 | ) | (129,542,322 | ) | (4,232,026 | ) | ||||||||
| CASH FLOWS FROM FINANCING | ||||||||||||||||
| ACTIVITIES | ||||||||||||||||
| Net proceeds from (repayment of) short-term borrowings | ||||||||||||||||
| borrowings | (10,640,229 | ) | (2,038,993 | ) | 22,327,813 | 729,429 | ||||||||||
| Net repayment of short-term bills payable | (4,348,054 | ) | - | - | - | |||||||||||
| Proceeds from issue of bonds | 9,000,000 | 8,000,000 | - | - | ||||||||||||
| Repayment of bonds payable | (10,365,135 | ) | (9,123,972 | ) | (6,185,600 | ) | (202,078 | ) | ||||||||
| Proceeds from long-term borrowings | 62,282,917 | 35,394,158 | 199,743,582 | 6,525,436 | ||||||||||||
| Repayment of long-term borrowings | (52,924,902 | ) | (51,867,539 | ) | (114,232,623 | ) | (3,731,873 | ) | ||||||||
| Dividends paid | (12,243,766 | ) | (11,214,221 | ) | (10,613,626 | ) | (346,737 | ) | ||||||||
| Proceeds from issue of ordinary shares | - | 10,290,000 | - | - | ||||||||||||
| Proceeds from exercise of employee | ||||||||||||||||
| share options | 995,832 | 1,439,819 | 1,269,680 | 41,479 | ||||||||||||
| Payments for buy-back of ordinary shares | - | - | (71,302 | ) | (2,329 | ) | ||||||||||
| Proceeds from disposal of interests in subsidiaries | - | - | 2,807,568 | 91,721 | ||||||||||||
(Continued)
F-11
ASE Technology Holding Co., Ltd. (formERly known as ADVanced semiconductor engineering, inc.)AND SUBSIDIARIES
CONSOLIDATED STATEMENTS OF CASH FLOWS
(Amounts in Thousands)
| For the Year Ended December 31 | ||||||||||||||||
| 2016 | 2017 | 2018 | ||||||||||||||
| NT$ | NT$ | NT$ | US$ (Note 4) | |||||||||||||
| Decrease in non-controlling interests | $ | (3,063,623 | ) | $ | (246,440 | ) | $ | (11,820,227 | ) | $ | (386,156 | ) | ||||
| Other financing activities items | 219,940 | 43,761 | (113,859 | ) | (3,720 | ) | ||||||||||
| Net cash generated from (used in) | ||||||||||||||||
| financing activities | (21,087,020 | ) | (19,323,427 | ) | 83,111,406 | 2,715,172 | ||||||||||
| EFFECTS OF EXCHANGE RATE | ||||||||||||||||
| CHANGES ON THE BALANCE OF | ||||||||||||||||
| CASH AND CASH EQUIVALENTS | ||||||||||||||||
| HELD IN FOREIGN CURRENCY | (4,720,046 | ) | (4,335,589 | ) | 796,595 | 26,024 | ||||||||||
| NET INCREASE (DECREASE) IN CASH AND | ||||||||||||||||
| CASH EQUIVALENTS | (16,858,657 | ) | 7,685,542 | 5,440,370 | 177,732 | |||||||||||
| CASH AND CASH EQUIVALENTS AT | ||||||||||||||||
| THE BEGINNING OF THE YEAR | 55,251,181 | 38,392,524 | 46,078,066 | 1,505,327 | ||||||||||||
| CASH AND CASH EQUIVALENTS AT | ||||||||||||||||
| THE END OF THE YEAR | $ | 38,392,524 | $ | 46,078,066 | $ | 51,518,436 | $ | 1,683,059 | ||||||||
| Equity Attributable to Owners of the Company | |||||||||||||||||||||||||||||||||||||||||||||
| Accumulated Other Comprehensive Income | |||||||||||||||||||||||||||||||||||||||||||||
| Share Capital | Retained Earnings | Exchange Differences on | Unrealized Gain on Available- | ||||||||||||||||||||||||||||||||||||||||||
Shares Thousands) | Amounts | Capital Surplus | Legal Reserve | Special Reserve | Unappro- priated Earnings | Total | Translating Foreign Operations | for-sale Financial Assets | Cash Flow Hedges | Total | Treasury Shares | Total | Non- controlling Interests | Total Equity | |||||||||||||||||||||||||||||||
| Issue of ordinary shares under employee share options | 73,898 | $ | 534,921 | $ | 1,000,065 | $ | - | $ | - | $ | - | $ | - | $ | - | $ | - | $ | - | $ | - | $ | - | $ | 1,534,986 | $ | 120,376 | $ | 1,655,362 | ||||||||||||||||
| Cash dividends distributed by subsidiaries | - | - | - | - | - | - | - | - | - | - | - | - | - | (85,766 | ) | (85,766 | ) | ||||||||||||||||||||||||||||
| BALANCE AT DECEMBER 31, 2014 | 7,861,725 | 78,715,179 | 16,013,980 | 10,289,878 | 3,353,938 | 36,000,026 | 49,643,842 | 4,540,862 | 526,778 | - | 5,067,640 | (1,959,107 | ) | 147,481,534 | 8,209,860 | 155,691,394 | |||||||||||||||||||||||||||||
| Equity component of convertible bonds issued by the Company | - | - | 214,022 | - | - | - | - | - | - | - | - | - | 214,022 | - | 214,022 | ||||||||||||||||||||||||||||||
| Change in capital surplus from investments in associates and joint ventures accounted for using the equity method | - | - | 150 | - | - | - | - | - | - | - | - | - | 150 | - | 150 | ||||||||||||||||||||||||||||||
| Profit for the year ended December 31,2015 | - | - | - | - | - | 20,013,505 | 20,013,505 | - | - | - | - | - | 20,013,505 | 968,567 | 20,982,072 | ||||||||||||||||||||||||||||||
| Other comprehensive income (loss) for the year ended December 31, 2015, net of income tax | - | - | - | - | - | (86,217 | ) | (86,217 | ) | (48,191 | ) | 61,341 | - | 13,150 | - | (73,067 | ) | (74,480 | ) | (147,547 | ) | ||||||||||||||||||||||||
| Total comprehensive income (loss) for the year ended December 31, 2015 | - | - | - | - | - | 19,927,288 | 19,927,288 | (48,191 | ) | 61,341 | - | 13,150 | - | 19,940,438 | 894,087 | 20,834,525 | |||||||||||||||||||||||||||||
| Appropriation of 2014 earnings | |||||||||||||||||||||||||||||||||||||||||||||
| Legal reserve | - | - | - | 2,359,267 | - | (2,359,267 | ) | - | - | - | - | - | - | - | - | - | |||||||||||||||||||||||||||||
| Cash dividends declared by the Company | - | - | - | - | - | (15,589,825 | ) | (15,589,825 | ) | - | - | - | - | - | (15,589,825 | ) | - | (15,589,825 | ) | ||||||||||||||||||||||||||
| - | - | - | 2,359,267 | - | (17,949,092 | ) | (15,589,825 | ) | - | - | - | - | - | (15,589,825 | ) | - | (15,589,825 | ) | |||||||||||||||||||||||||||
| Acquisition of treasury shares | - | - | - | - | - | - | - | - | - | - | - | (5,333,406 | ) | (5,333,406 | ) | - | (5,333,406 | ) | |||||||||||||||||||||||||||
| Issue of dividends received by subsidiaries from the Company | - | - | 292,351 | - | - | - | - | - | - | - | - | - | 292,351 | - | 292,351 | ||||||||||||||||||||||||||||||
| Partial disposal of interests in subsidiaries and additional acquisition of majority-owned subsidiaries (Notes 21 and 27) | - | - | 7,197,510 | - | - | - | - | - | - | - | - | - | 7,197,510 | 1,712,836 | 8,910,346 | ||||||||||||||||||||||||||||||
| Changes in percentage of ownership interest in subsidiaries | - | - | (563,815 | ) | - | - | - | - | - | - | - | - | - | (563,815 | ) | 563,815 | - | ||||||||||||||||||||||||||||
| Issue of ordinary shares under employee share options | 48,703 | 470,481 | 604,352 | - | - | - | - | - | - | - | - | - | 1,074,833 | - | 1,074,833 | ||||||||||||||||||||||||||||||
| Cash dividends distributed by subsidiaries | - | - | - | - | - | - | - | - | - | - | - | - | - | (232,148 | ) | (232,148 | ) | ||||||||||||||||||||||||||||
| Additional non-controlling interest arising on issue of employee share options by subsidiaries | - | - | - | - | - | - | - | - | - | - | - | - | - | 344,095 | 344,095 | ||||||||||||||||||||||||||||||
| BALANCE AT DECEMBER 31, 2015 | 7,910,428 | $ | 79,185,660 | $ | 23,758,550 | $ | 12,649,145 | $ | 3,353,938 | $ | 37,978,222 | $ | 53,981,305 | $ | 4,492,671 | $ | 588,119 | $ | - | $ | 5,080,790 | $ | (7,292,513 | ) | $ | 154,713,792 | $ | 11,492,545 | $ | 166,206,337 | |||||||||||||||
| US DOLLARS (Note 4) | |||||||||||||||||||||||||||||||||||||||||||||
| BALANCE AT DECEMBER 31, 2015 | 7,910,428 | $ | 2,414,934 | $ | 724,567 | $ | 385,762 | $ | 102,285 | $ | 1,158,226 | $ | 1,646,273 | $ | 137,013 | $ | 17,936 | $ | - | $ | 154,949 | $ | (222,401 | ) | $ | 4,718,322 | $ | 350,490 | $ | 5,068,812 | |||||||||||||||
| The accompanying notes are an integral part of the consolidated financial statements. | (Concluded) |
F-7F-12
ADVANCED SEMICONDUCTOR ENGINEERING, INC. ASE Technology Holding Co., Ltd. (formERly known as ADVanced semiconductor engineering, inc.)AND SUBSIDIARIES
CONSOLIDATED STATEMENTS OF CASH FLOWS
(Amounts in Thousands)
| For the Years Ended December 31 | ||||||||||||||||
| 2013 | 2014 | 2015 | ||||||||||||||
| NT$ | NT$ | NT$ | US$ (Note 4) | |||||||||||||
| CASH FLOWS FROM OPERATING | ||||||||||||||||
| ACTIVITIES | ||||||||||||||||
| Profit before income tax | $ | 19,369,756 | $ | 28,535,055 | $ | 25,293,145 | $ | 771,367 | ||||||||
| Adjustments for: | ||||||||||||||||
| Depreciation expense | 24,696,607 | 25,805,042 | 28,938,770 | 882,549 | ||||||||||||
| Amortization expense | 774,304 | 545,734 | 579,894 | 17,685 | ||||||||||||
| Net gains on fair value change of | ||||||||||||||||
| financial assets and liabilities at fair | ||||||||||||||||
| value through profit or loss | (795,359 | ) | (1,838,840 | ) | (2,472,835 | ) | (75,414 | ) | ||||||||
| Interest expense | 2,257,144 | 2,324,426 | 2,268,786 | 69,192 | ||||||||||||
| Interest income | (212,801 | ) | (243,474 | ) | (242,084 | ) | (7,383 | ) | ||||||||
| Dividend income | (131,449 | ) | (101,252 | ) | (396,973 | ) | (12,107 | ) | ||||||||
| Compensation cost of employee share | ||||||||||||||||
| options | 260,801 | 110,157 | 133,496 | 4,071 | ||||||||||||
| Share of loss (profit) of associates and | ||||||||||||||||
| joint ventures | (22,039 | ) | 121,882 | (407,622 | ) | (12,431 | ) | |||||||||
| Impairment loss recognized on | ||||||||||||||||
| financial assets | 196,325 | 28,421 | 8,232 | 251 | ||||||||||||
| Impairment loss recognized on non- | ||||||||||||||||
| financial assets | 949,015 | 899,480 | 610,140 | 18,608 | ||||||||||||
| (Reversal of) compensation cost for | ||||||||||||||||
| the settlement of legal claims | 894,150 | (91,305 | ) | - | - | |||||||||||
| Net loss on foreign currency exchange | 300,175 | 1,404,234 | 1,358,777 | 41,439 | ||||||||||||
| Others | 151,065 | 404,443 | 1,411,599 | 43,050 | ||||||||||||
| Changes in operating assets and | ||||||||||||||||
| liabilities | ||||||||||||||||
| Financial assets held for trading | 1,122,280 | 823,313 | 4,162,522 | 126,945 | ||||||||||||
| Trade receivables | (5,767,254 | ) | (9,703,070 | ) | 7,982,736 | 243,450 | ||||||||||
| Other receivables | (6,540 | ) | (8,625 | ) | 55,112 | 1,681 | ||||||||||
| Inventories | (3,241,115 | ) | (8,208,824 | ) | (5,128,726 | ) | (156,411 | ) | ||||||||
| Other current assets | (108,425 | ) | 102,353 | 407,017 | 12,413 | |||||||||||
| Financial liabilities held for trading | (1,011,975 | ) | (835,779 | ) | (1,725,606 | ) | (52,626 | ) | ||||||||
| Trade payables | 4,722,462 | 6,422,305 | (1,272,717 | ) | (38,814 | ) | ||||||||||
| Other payables | 1,068,223 | 3,045,452 | (814,809 | ) | (24,849 | ) | ||||||||||
| Other current liabilities | 2,796 | 703,764 | 2,545,312 | 77,625 | ||||||||||||
| Other operating activities items | (191,631 | ) | (187,727 | ) | (247,024 | ) | (7,534 | ) | ||||||||
| 45,276,515 | 50,057,165 | 63,047,142 | 1,922,757 | |||||||||||||
| Interest received | 182,164 | 233,457 | 253,289 | 7,725 | ||||||||||||
| Dividend received | 176,058 | 101,252 | 499,918 | 15,246 | ||||||||||||
| Interest paid | (2,200,143 | ) | (2,065,244 | ) | (2,067,955 | ) | (63,067 | ) | ||||||||
| Income tax paid | (2,138,639 | ) | (2,463,153 | ) | (4,184,089 | ) | (127,603 | ) | ||||||||
| Net cash generated from operating | ||||||||||||||||
| activities | 41,295,955 | 45,863,477 | 57,548,305 | 1,755,058 | ||||||||||||
| CASH FLOWS FROM INVESTING | ||||||||||||||||
| ACTIVITIES | ||||||||||||||||
| Purchase of financial assets designated | ||||||||||||||||
| as at fair value through profit or loss | (53,135,894 | ) | (108,958,658 | ) | (100,842,813 | ) | (3,075,414 | ) | ||||||||
| Proceeds on sale of financial assets | ||||||||||||||||
| designated as at fair value through | ||||||||||||||||
| profit or loss | 55,032,536 | 109,825,159 | 102,139,161 | 3,114,948 | ||||||||||||
| Purchase of available-for-sale financial | ||||||||||||||||
| assets | (3,474,152 | ) | (3,565,428 | ) | (1,273,510 | ) | (38,838 | ) | ||||||||
| Proceeds on sale of available-for-sale | ||||||||||||||||
| financial assets | 1,093,408 | 4,388,130 | 2,761,145 | 84,207 | ||||||||||||
(Continued)
F-8
ADVANCED SEMICONDUCTOR ENGINEERING, INC. AND SUBSIDIARIES
CONSOLIDATED STATEMENTS OF CASH FLOWS
(Amounts in Thousands)
| For the Years Ended December 31 | ||||||||||||||||
| 2013 | 2014 | 2015 | ||||||||||||||
| NT$ | NT$ | NT$ | US$ (Note 4) | |||||||||||||
| Cash received from return of capital by | ||||||||||||||||
| available-for-sale financial assets | $ | 27,368 | $ | 20,411 | $ | 44,511 | $ | 1,357 | ||||||||
| Purchase of held-to-maturity financial | ||||||||||||||||
| assets | (88,169 | ) | - | - | - | |||||||||||
| Proceeds on sale of held-to-maturity financial | ||||||||||||||||
| assets | 73,716 | - | - | - | ||||||||||||
| Acquisition of associates and joint | ||||||||||||||||
| ventures | - | (100,000 | ) | (35,673,097 | ) | (1,087,926 | ) | |||||||||
| Net cash outflow on acquisition of | ||||||||||||||||
| subsidiaries | (250,387 | ) | - | - | - | |||||||||||
| Payments for property, plant and | ||||||||||||||||
| equipment | (29,142,719 | ) | (39,598,964 | ) | (30,280,124 | ) | (923,456 | ) | ||||||||
| Proceeds from disposal of property, | ||||||||||||||||
| plant and equipment | 351,546 | 421,207 | 243,031 | 7,412 | ||||||||||||
| Payments for intangible assets | (313,110 | ) | (396,466 | ) | (491,135 | ) | (14,978 | ) | ||||||||
| Decrease (increase) in other financial assets | 4,513 | (372,569 | ) | 358,266 | 10,926 | |||||||||||
| Increase in other non-current assets | (104,499 | ) | (480,711 | ) | (336,864 | ) | (10,273 | ) | ||||||||
| Net cash used in investing activities | (29,925,843 | ) | (38,817,889 | ) | (63,351,429 | ) | (1,932,035 | ) | ||||||||
| CASH FLOWS FROM FINANCING | ||||||||||||||||
| ACTIVITIES | ||||||||||||||||
| Net proceeds from (repayment of) short- | ||||||||||||||||
| term borrowings | 7,051,874 | (3,442,162 | ) | (8,532,792 | ) | (260,225 | ) | |||||||||
| Net proceeds from short-term bills payable | - | - | 4,348,054 | 132,603 | ||||||||||||
| Proceeds from issue of bonds | 11,900,051 | 8,888,562 | 6,136,425 | 187,143 | ||||||||||||
| Repayment of bonds payable | - | (729,790 | ) | - | - | |||||||||||
| Proceeds from long-term borrowings | 28,715,694 | 32,030,868 | 39,887,570 | 1,216,455 | ||||||||||||
| Repayment of long-term borrowings | (31,382,333 | ) | (40,978,403 | ) | (22,926,660 | ) | (699,197 | ) | ||||||||
| Dividends paid | (7,834,877 | ) | (9,967,215 | ) | (15,297,474 | ) | (466,529 | ) | ||||||||
| Proceeds from issue of ordinary shares | 3,393,000 | - | - | - | ||||||||||||
| Proceeds from exercise of employee | ||||||||||||||||
| share options | 1,071,854 | 1,498,343 | 1,285,102 | 39,192 | ||||||||||||
| Payments for acquisition of treasury | ||||||||||||||||
| shares | - | - | (5,333,406 | ) | (162,653 | ) | ||||||||||
| Proceeds from partial disposal of | ||||||||||||||||
| interests in subsidiaries | - | 9,991,439 | 8,910,346 | 271,740 | ||||||||||||
| Decrease in non-controlling interests | (72,101 | ) | (85,766 | ) | (232,148 | ) | (7,080 | ) | ||||||||
| Other financing activities items | (48,291 | ) | (2,879 | ) | 391,322 | 11,934 | ||||||||||
| Net cash generated from (used in) | ||||||||||||||||
| financing activities | 12,794,871 | (2,797,003 | ) | 8,636,339 | 263,383 | |||||||||||
| EFFECTS OF EXCHANGE RATE | ||||||||||||||||
| CHANGES ON THE BALANCE OF | ||||||||||||||||
| CASH AND CASH EQUIVALENTS | ||||||||||||||||
| HELD IN FOREIGN CURRENCY | 867,872 | 2,419,454 | 723,556 | 22,065 | ||||||||||||
| NET INCREASE IN CASH AND CASH | ||||||||||||||||
| EQUIVALENTS | 25,032,855 | 6,668,039 | 3,556,771 | 108,471 | ||||||||||||
| CASH AND CASH EQUIVALENTS AT | ||||||||||||||||
| THE BEGINNING OF THE YEAR | 19,993,516 | 45,026,371 | 51,694,410 | 1,576,530 | ||||||||||||
| CASH AND CASH EQUIVALENTS AT | ||||||||||||||||
| THE END OF THE YEAR | $ | 45,026,371 | $ | 51,694,410 | $ | 55,251,181 | $ | 1,685,001 | ||||||||
F-9
ADVANCED SEMICONDUCTOR ENGINEERING, INC. AND SUBSIDIARIES
NOTES TO CONSOLIDATED FINANCIAL STATEMENTS
(Amounts in Thousands, Unless Stated Otherwise)
| 1. | GENERAL INFORMATION |
Advanced Semiconductor Engineering, Inc.ASE Technology Holding Co.,Ltd. (the “Company”), is a corporation incorporated in Nantze Export Processing Zone under the laws of Republic of China (the “ROC”(“R.O.C.”), starting from April 30, 2018 (date of incorporation). The Company and its subsidiaries (collectively referred to as the “Group”) offer a comprehensive range of semiconductors packaging, testing, and electronic manufacturing services (“EMS”).
The board of directors of the Company’s subsidiaries, Advanced Semiconductor Engineering, Inc. (symbol “2311”, “ASE”) and Siliconware Precision Industries Co., Ltd. (symbol “2325”, “SPIL”), approved in June 2016 to enter into and execute a joint share exchange agreement to establish the Company and the Company acquired all issued and outstanding ordinary shares are listedof ASE and SPIL in the way of share exchange. The share exchange was conducted at an exchange ratio of 1 ordinary share of ASE for 0.5 ordinary share of the Company, and at NT$51.2 in cash per SPIL’s ordinary share. The share exchange transaction has been approved both at ASE’s and SPIL’s special shareholders’ meeting on February 12, 2018 and has been completed on April 30, 2018. As a result, ASE and SPIL became wholly-owned subsidiaries of the Taiwan Stock Exchange (the “TSE”) under the symbol “2311”. Since September 2000,Company on April 30, 2018, and both of ASE’s and SPIL’s ordinary shares have been delisted while the ordinary shares of the Company were listed starting from the same date under the symbol “3711”. In addition, ASE’s ordinary shares that have been traded on the New York Stock Exchange (the “NYSE”) under the symbol “ASX” in the form of American Depositary Shares (“ADS”) starting from September 2000 were exchanged as the Company’s ADSs under the same symbol “ASX” starting from April 30, 2018.
For enhancing operational flexibility through organization restructure, the board of directors of ASE resolved in October 2018 to spin off its investment department which was responsible for managing the ordinary shares and assets of USI Inc. (“USIINC”) as well as relevant assets into a newly established company, USI Global Inc. (“USI Global”). USI Global then issued new ordinary shares to the Company as a consideration. In November 2018, the spin-off has been completed and the Company has obtained control over ASE and USI Global. In December 2018, the board of directors of the Company and USI Global further resolved to proceed with the merger which was completed in January 2019. After the merger, the Company is the surviving company while USI Global is the dissolving company. The aforementioned spin-off and merger have no material effect on the Group’s financial position and financial performance.
The ordinary shares of itsthe Company’s subsidiary, Universal Scientific Industrial (Shanghai) Co., Ltd (the “USISH”Ltd. (“USISH”), arehave been listed on the Shanghai Stock Exchange (the “SSE”) under the symbol “601231”. since February 2012.
The consolidated financial statements are presented in the Company’s functional currency, New Taiwan dollar (NT$).
| 2. | APPROVAL OF FINANCIAL STATEMENTS |
The consolidated financial statements were authorizedapproved for issue by the management on April 28, 2016.22, 2019.
F-13
| 3. | APPLICATION OF NEW AND REVISED INTERNATIONAL FINANCIAL REPORTING STANDARDS AS ISSUED BY THE INTERNATIONAL ACCOUNTING STANDARDS BOARD (“IASB”) (collectively, “IFRSs”) |
Starting from 2013, the consolidated financial statements were prepared in accordance with International Financial Reporting Standards (IFRS), International Accounting Standards (IAS), Interpretations of IFRS (IFRIC), and Interpretations of IAS (SIC) issued by International Accounting Standards Board (“IASB”) (collectively referred to as the “IFRSs”). The date of transition to IFRSs is January 1, 2012.
| a. | Amendments to IFRSs that are mandatorily effective for the current year |
In the current year, the Group has applied the following new, revised or amended standards and interpretations that have been issued and effective:
| New, Revised or Amended Standards and Interpretations | Effective Date Issued by IASB | |||
| Amendments to | ||||
| IFRS 9 | Financial Instruments | January 1, 2018 | ||
| Amendments to | ||||
| IFRS 15 | Revenue from Contracts with Customers | January 1, 2018 | ||
| Amendments to IFRS 15 | Clarifications to IFRS15 Revenue from Contracts with Customers | January 1, 2018 | ||
| Amendments to IAS | ||||
| IFRIC 22 | Foreign Currency Transactions and Advance Consideration | January 1, 2018 | ||
| The aforementioned new, revised or amended standards and interpretations are effective for annual period beginning on or after the effective dates, unless specified otherwise. |
Except for the following, the initial application of the aforementioned new, revised or amended standards and interpretations did not have effect on the Group’s accounting policies..
| 1) | IFRS 9 “Financial Instruments” and related amendments |
IFRS 9 supersedes IAS 39 “Financial Instruments: Recognition and Measurement”, with consequential amendments to IFRS 7 “Financial Instruments: Disclosures” and other standards. IFRS 9 sets out the requirements for classification, measurement and impairment of financial assets and hedge accounting. Refer to Note 4 for information relating to the relevant accounting policies.
The requirements for classification, measurement and impairment of financial assets have been applied retrospectively from January 1, 2018, and the requirements for hedge accounting have been applied prospectively. IFRS 9 is not applicable to items that have already been derecognized as of December 31, 2017.
The impact of adoption on the consolidated financial statements was not material.
Classification, measurement and impairment of financial assets
On the basis of the facts and circumstances that existed as of January 1, 2018, the Group has performed an assessment of the classification of recognized financial assets and has elected not to reflect the figures on a retrospective basis.
The following table shows the original measurement categories and carrying amount under IAS 39 and the new measurement categories and carrying amount under IFRS 9 for each class of the Group’s financial assets and financial liabilities as of January 1, 2018.
F-10F-14
| Measurement Category | Carrying Amount | |||||||||||||||||||||||
| Financial Assets | IAS 39 | IFRS 9 | IAS 39 | IAS 39 | IFRS 9 | IFRS 9 | Remark | |||||||||||||||||
| NT$ | US$ (Note 4) | NT$ | US$ (Note 4) | |||||||||||||||||||||
| Cash and cash equivalents | Loans and receivables | Amortized cost | $ | 46,078,066 | $ | 1,505,327 | $ | 46,078,066 | $ | 1,505,327 | ||||||||||||||
| Derivatives | Held for trading | Mandatorily at fair value through profit or loss (“FVTPL”) | 121,863 | 3,981 | 121,863 | 3,981 | ||||||||||||||||||
| Equity instruments | Held for trading | Mandatorily at FVTPL | 4,410,732 | 144,094 | 4,410,732 | 144,094 | ||||||||||||||||||
| Available-for-sale | Mandatorily at FVTPL | 279,791 | 9,141 | 279,791 | 9,141 | b) | ||||||||||||||||||
| Available-for-sale | Fair value through other comprehensive income (“FVTOCI”) - equity instruments | 908,549 | 29,681 | 908,549 | 29,681 | a) | ||||||||||||||||||
| Open-end mutual funds | Held for trading | Mandatorily at FVTPL | 589,976 | 19,274 | 589,976 | 19,274 | ||||||||||||||||||
| Available-for-sale | Mandatorily at FVTPL | 23,825 | 778 | 23,825 | 778 | b) | ||||||||||||||||||
| Debt instruments | Designated as at FVTPL | Mandatorily at FVTPL | 100,496 | 3,283 | 100,496 | 3,283 | ||||||||||||||||||
| Other financial assets | FVTOCI - debt instruments | 1,000,000 | 32,669 | 1,080,000 | 35,283 | d) | ||||||||||||||||||
| Time deposits with original maturity of over three months, pledged time deposits and guarantee deposits | Loans and receivables | Amortized cost | 405,520 | 13,248 | 405,520 | 13,248 | c) | |||||||||||||||||
| Trade receivables and other receivables | Loans and receivables | Amortized cost | 56,252,661 | 1,837,722 | 56,252,661 | 1,837,722 | ||||||||||||||||||
| Financial Assets | IAS 39 Carrying Amount as of January 1, 2018 | Reclassifi- cations | Remea- surements | IFRS 9 Carrying Amount as of January 1, 2018 | Retained Earnings Effect on January 1, 2018 | Other Equity Effect on 2018 | Remark | |||||||||||||||||||
| NT$ | NT$ | NT$ | NT$ | NT$ | NT$ | |||||||||||||||||||||
| FVTPL | $ | 5,223,067 | ||||||||||||||||||||||||
| Add: Reclassification from available-for-sale (IAS 39) - required reclassification | - | $ | 303,616 | $ | - | $ | 110,648 | $ | (110,648 | ) | b) | |||||||||||||||
| 5,223,067 | 303,616 | - | $ | 5,526,683 | 110,648 | (110,648 | ) | |||||||||||||||||||
| FVTOCI | ||||||||||||||||||||||||||
| Debt instruments | ||||||||||||||||||||||||||
| Add: Reclassification from other financial assets | - | 1,000,000 | 80,000 | - | 80,000 | d) | ||||||||||||||||||||
| Equity instruments Add: Reclassification from available-for-sale (IAS 39) | - | 908,549 | - | 417,398 | (417,398 | ) | a) | |||||||||||||||||||
| - | 1,908,549 | 80,000 | 1,988,549 | 417,398 | (337,398 | ) | ||||||||||||||||||||
| Investments accounted for using the equity method | 48,753,751 | - | (2,586 | ) | 48,751,165 | (163,579 | ) | 160,993 | ||||||||||||||||||
| $ | 53,976,818 | $ | 2,212,165 | $ | 77,414 | $ | 56,266,397 | $ | 364,467 | $ | (287,053 | ) | ||||||||||||||
(Continued)
F-15
| Financial Assets | IAS 39 Carrying Amount as of January 1, 2018 | Reclassifi- cations | Remea- surements | IFRS 9 Carrying Amount as of January 1, 2018 | Retained Earnings Effect on January 1, 2018 | Other Equity Effect on 2018 | Remark | |||||||||||||||||||
| US$ (Note 4) | US$ (Note 4) | US$ (Note 4) | US$ (Note 4) | US$ (Note 4) | US$ (Note 4) | |||||||||||||||||||||
| FVTPL | $ | 170,633 | ||||||||||||||||||||||||
| Add: Reclassification from available-for-sale (IAS 39) - required reclassification | - | $ | 9,919 | $ | - | $ | 3,615 | $ | (3,615 | ) | b) | |||||||||||||||
| 170,633 | 9,919 | - | $ | 180,551 | 3,615 | (3,615 | ) | |||||||||||||||||||
| FVTOCI | ||||||||||||||||||||||||||
| Debt instruments | ||||||||||||||||||||||||||
| Add: Reclassification from other financial assets | - | 32,669 | 2,614 | - | 2,614 | d) | ||||||||||||||||||||
| Equity instruments Add: Reclassification from available-for-sale (IAS 39) | - | 29,682 | - | 13,636 | (13,636 | ) | a) | |||||||||||||||||||
| - | 62,351 | 2,614 | 64,964 | 13,636 | (11,022 | ) | ||||||||||||||||||||
| Investments accounted for using the equity method | 1,592,739 | - | (85 | ) | 1,592,655 | (5,344 | ) | 5,259 | ||||||||||||||||||
| $ | 1,763,372 | $ | 72,270 | $ | 2,529 | $ | 1,838,170 | $ | 11,907 | $ | (9,378 | ) | ||||||||||||||
(Concluded)
| a) | Unquoted shares and limited partnership classified as available-for-sale are designated as at FVTOCI and the changes in fair value accumulated in other equity are transferred directly to retained earnings instead of being reclassified to profit or loss on disposal. Impairment losses previously recognized and accumulated in retained earnings are adjusted by the Group to record an increase in retained earnings and a decrease in other equity, unrealized gains or losses on financial assets at fair value through other comprehensive income, since no subsequent impairment assessment is required under IFRS 9; |
| b) | Quoted shares classified as available-for-sale are classified as at fair value through profit or loss under IFRS 9. Open-end mutual funds classified as available-for-sale are classified as at fair value through profit or loss under IFRS 9 because the contractual cash flows are not solely payments of principal and interest on the principal outstanding and they are not equity instruments. The Group reclassifies unrealized gains or losses on available-for-sale financial assets in other equity to retained earnings; |
| c) | Time deposits with original maturity of over three months, pledged time deposits and guarantee deposits are classified as measured at amortized cost under IFRS 9 because, on initial recognition, the contractual cash flows that are solely payments of principal and interest on the principal outstanding and these investments are held within a business model whose objective is to collect the contractual cash flows; and |
| d) | Debt investments with no active market are classified as at fair value through other comprehensive income under IFRS 9, because, on initial recognition, the contractual cash flows that are solely payments of principal and interest on the principal outstanding and these investments are held within a business model whose objective is achieved both by collecting contractual cash flows and selling financial assets. The Group adjusts those debt investments and other equity, unrealized gains or losses on financial assets at fair value through other comprehensive income, based on their fair value. |
F-16
| 2) | IFRS 15 “Revenue from Contracts with Customers” and related amendment |
IFRS 15 establishes principles for recognizing revenue that apply to all contracts with customers, and supersedes IAS 18 “Revenue”, IAS 11 “Construction Contracts” and a number of revenue-related interpretations. Refer to Note 4 for related accounting policies.
Most of revenues generated from the goods manufactured by the Group’s operating segments in packaging and testing are changed to be recognized over time after the application of IFRS 15. Prior to the application of IFRS 15, the Group recognized revenues when the significant risks and rewards of ownership of inventories have been transferred to customers.
The Group believeselected only to retrospectively apply IFRS 15 to contracts that were not complete as of January 1, 2018 and recognized the adoptioncumulative effect of aforementioned standards or interpretations will not have a significant effectretrospectively applying IFRS 15 in retained earnings on January 1, 2018.
The impact of adoption on the Group’s accounting policies.consolidated financial statements was not material.
The impact on assets, liabilities and equity as of January 1, 2018 from the initial application of IFRS 15 is set out below:
IAS 18 Carrying Amount as of January 1, 2018 | Adjustments Arising from Initial Application | IFRS 15 Carrying Amount as of January 1, 2018 | ||||||||||
| NT$ | NT$ | NT$ | ||||||||||
| Inventories | $ | 24,260,911 | $ | (1,381,778 | ) | $ | 22,879,133 | |||||
| Contract assets - current | - | 1,971,107 | 1,971,107 | |||||||||
Investments accounted for using the equity method | 48,753,751 | 40,139 | 48,793,890 | |||||||||
| Deferred tax assets | 4,001,821 | (7,287 | ) | 3,994,534 | ||||||||
| Total effect on assets | $ | 77,016,483 | $ | 622,181 | $ | 77,638,664 | ||||||
| Current tax liabilities | $ | 7,619,328 | $ | 5,078 | $ | 7,624,406 | ||||||
| Deferred tax liabilities | 4,961,487 | 90,071 | 5,051,558 | |||||||||
| Total effect on liabilities | $ | 12,580,815 | $ | 95,149 | $ | 12,675,964 | ||||||
| Retained earnings | $ | 73,718,545 | $ | 521,849 | $ | 74,240,394 | ||||||
| Non-controlling interests | 13,190,129 | 5,183 | 13,195,312 | |||||||||
| Total effect on equity | $ | 86,908,674 | $ | 527,032 | $ | 87,435,706 | ||||||
IAS 18 Carrying Amount as of January 1, 2018 | Adjustments Arising from Initial Application | IFRS 15 Carrying Amount as of January 1, 2018 | ||||||||||
| US$ (Note 4) | US$ (Note 4) | US$ (Note 4) | ||||||||||
| Inventories | $ | 792,581 | $ | (45,141 | ) | $ | 747,440 | |||||
| Contract assets - current | - | 64,394 | 64,394 | |||||||||
Investments accounted for using the equity method | 1,592,739 | 1,311 | 1,594,050 | |||||||||
(Continued)
F-17
IAS 18 Carrying Amount as of January 1, 2018 | Adjustments Arising from Initial Application | IFRS 15 Carrying Amount as of January 1, 2018 | ||||||||||
US$ (Note 4) | US$ (Note 4) | US$ (Note 4) | ||||||||||
| Deferred tax assets | $ | 130,736 | $ | (238 | ) | $ | 130,498 | |||||
| Total effect on assets | $ | 2,516,056 | $ | 20,326 | $ | 2,536,382 | ||||||
| Current tax liabilities | $ | 248,916 | $ | 166 | $ | 249,082 | ||||||
| Deferred tax liabilities | 162,087 | 2,943 | 165,030 | |||||||||
| Total effect on liabilities | $ | 411,003 | $ | 3,109 | $ | 414,112 | ||||||
| Retained earnings | $ | 2,408,316 | $ | 17,048 | $ | 2,425,364 | ||||||
| Non-controlling interests | 430,909 | 169 | 431,078 | |||||||||
| Total effect on equity | $ | 2,839,225 | $ | 17,217 | $ | 2,856,442 | ||||||
(Concluded)
Had the Group applied IAS 18 in the current year, the following adjustments should have been made to reflect the line items and balances under IFRS 15.
Impact on assets, liabilities and equity as of December 31, 2018
| NT$ | US$ (Note 4) | |||||||
| Increase in inventories | $ | 2,313,269 | $ | 75,572 | ||||
| Decrease in contract assets - current | (4,498,500 | ) | (146,961 | ) | ||||
| Increase in trade receivables | 1,073,368 | 35,066 | ||||||
Decrease in investments accounted for using the equity method | (37,312 | ) | (1,219 | ) | ||||
| Increase in deferred tax assets | 26,389 | 862 | ||||||
| Decrease in assets | $ | (1,122,786 | ) | $ | (36,680 | ) | ||
| Decrease in current tax liabilities | $ | (47,028 | ) | $ | (1,536 | ) | ||
| Decrease in deferred tax liabilities | (141,934 | ) | (4,637 | ) | ||||
| Decrease in liabilities | $ | (188,962 | ) | $ | (6,173 | ) | ||
| Decrease in retained earnings | $ | (933,310 | ) | $ | (30,490 | ) | ||
| Decrease in non-controlling interests | (514 | ) | (17 | ) | ||||
| Decrease in equity | $ | (933,824 | ) | $ | (30,507 | ) | ||
F-18
Impact on total comprehensive income for the year ended December 31, 2018
| NT$ | US$ (Note 4) | |||||||
| Decrease in operating revenues | $ | (475,155 | ) | $ | (15,523 | ) | ||
| Decrease in operating costs | $ | (101,964 | ) | $ | (3,331 | ) | ||
| Increase in share of profit of associates and joint ventures | $ | 2,828 | $ | 92 | ||||
| Decrease in income tax expense | $ | (81,908 | ) | $ | (2,676 | ) | ||
| Decrease in net profit and total comprehensive income for the year | $ | (406,792 | ) | $ | (13,290 | ) | ||
| Increase (decrease) in net profit and total comprehensive income attributable to: | ||||||||
| Owners of the Company | $ | (411,461 | ) | $ | (13,442 | ) | ||
| Non-controlling interests | 4,669 | 152 | ||||||
| $ | (406,792 | ) | $ | (13,290 | ) | |||
| Impact on earnings per share: | ||||||||
| Decrease in basic earnings per share | $ | (0.10 | ) | $ | (0.00 | ) | ||
| Decrease in diluted earnings per share | $ | (0.10 | ) | $ | (0.00 | ) | ||
| b. | New, revised or amended standards and interpretations in issue but not yet effective |
The Group has not applied the following new, revised or amended standards and interpretations that have been issued but are not yet effective:
| New, Revised or Amended Standards and Interpretations | Effective Date Issued by IASB (Note 1) | |||
| Amendments to IFRSs | Annual Improvements to 2015-2017 Cycle | January 1, | ||
| Amendments to IFRS 9 | January 1, | |||
Amendments to IFRS 10 and IAS 28 | Sale or Contribution of Assets between an Investor and its Associate or Joint Venture | To be determined by IASB | ||
| IFRS 16 | Leases | January 1, 2019 | ||
| Amendments to IAS | January 1, | |||
| Amendments to IAS | January 1, | |||
| January 1, | ||||
| Amendments to | January 1, | |||
Amendments to IAS and IAS | January 1, | |||
Note 1: The aforementioned new, revised or amended standards and interpretations are effective for annual period beginning on or after the effective dates, unless specified otherwise.
Note 2: The Group shall apply these amendments to plan amendments, curtailments or settlements occurring on or after January 1, 2019.
F-19
Note 3: The Group shall apply these amendments to business combinations for which the acquisition date is on or after the beginning of the first annual period beginning on or after January 1, 2020 and to asset acquisitions that occur on or after the beginning of that period.
Note 4: The Group shall apply these amendments prospectively for annual periods beginning on or after January 1, 2020.
| c. | Significant changes in accounting policy resulted from new, revised and amended standards and interpretations in issue but not yet effective |
ExceptAs of the date the consolidated financial statements were authorized for the following,issue, the Group believesassessed that the adoptionapplication of the aforementioned new, revised or amended standards and interpretations will not have a material effectimpact on the Group’s accounting policies. As of the date that the accompanying consolidated financial statements were authorized for issue, the Group continues in evaluating the impact on its financial position and operating results as a result of the initial adoption of the below standards and interpretations. The related impact will be disclosed when the Group completes the evaluation.
F-11
IFRS 9 “Financial Instruments”
Recognition and measurement of financial assets
With regards to financial assets, all recognized financial assets that are within the scope of IAS 39 “Financial Instruments: Recognition and Measurement” are subsequently measured at amortized cost or fair value. Under IFRS 9, the requirement for the classification of financial assets is stated below.
For the Group’s debt instruments that have contractual cash flows that are solely payments of principal and interest on the principal amount outstanding, their classification and measurement are as follows:performance.
| 1) |
Except for above, all other financial assets are measured at fair value through profit or loss. However, the Group may make an irrevocable election to present subsequent changes in the fair value of an equity investment (that is not held for trading) in other comprehensive income, with only dividend income generally recognized in profit or loss. No subsequent impairment assessment is required, and the cumulative gains or losses previously recognized in other comprehensive income cannot be reclassified from equity to profit or loss.
The impairment of financial assets
IFRS 9 requires that impairment loss on financial assets is recognized by using the “Expected Credit Losses Model”. The credit loss allowance is required for financial assets measured at amortized cost, financial assets mandatorily measured at FVTOCI, lease receivables, contract assets arising from IFRS 15 “Revenue from Contracts with Customers”, certain written loan commitments and financial guarantee contracts. A loss allowance for the 12-month expected credit losses is required for a financial asset if its credit risk has not increased significantly since initial recognition. A loss allowance for full lifetime expected credit losses is required for a financial asset if its credit risk has increased significantly since initial recognition and is not low. However, a loss allowance for full lifetime expected credit losses is required for trade receivables that do not constitute a financing transaction.
For purchased or originated credit-impaired financial assets, the Group takes into account the expected credit losses on initial recognition in calculating the credit-adjusted effective interest rate. Subsequently, any changes in expected losses are recognized as a loss allowance with a corresponding gain or loss recognized in profit or loss.
Hedge accounting
The main changes in hedge accounting amended the application requirements for hedge accounting to better reflect the entity’s risk management activities. Compared with IAS 39, the main changes include: (1) enhancing types of transactions eligible for hedge accounting, specifically broadening the risk eligible for hedge accounting of non-financial items; (2) changing the way hedging derivative instruments are accounted for to reduce profit or loss volatility; and (3) replacing retrospective effectiveness assessment with the principle of economic relationship between the hedging instrument and the hedged item.
F-12
IFRS 15 “Revenue from Contracts with Customers” and amendments
IFRS 15 establishes principles for recognizing revenue that apply to all contracts with customers, and will supersedes IAS 18 “Revenue”, IAS 11 “Construction Contracts” and a number of revenue-related interpretations from January 1, 2018.
When applying IFRS 15, an entity shall recognize revenue by applying the following steps:
The amendments to IFRS 15 clarify how to (1) identify performance obligation; (2) determine whether a company is a principal or an agent; and (3) determine whether the revenue from granting a license should be recognized at a point in time or over time.
IFRS 15 requires an entity to identify performance obligations on the basis of distinct promised goods or services. To clarify the concept of “distinct”, the IASB has added the clarification that the objective of the assessment of a promise to transfer goods or services to a customer is to determine whether the nature of the promise, within the context of the contract, is to transfer each of those goods or services individually or, instead, to transfer a combined item or items to which the promised goods or services are inputs.
When IFRS 15 and amendments are effective, an entity may elect to apply this Standard either retrospectively to each prior reporting period presented or retrospectively with the cumulative effect of initially applying this Standard recognized at the date of initial application.
Amendments to IFRS 10 and IAS 28 “Sale or Contribution of Assets between an Investor and its Associate or Joint Venture”
The amendments stipulated that, when an entity sells or contributes assets that constitute a business (as defined in IFRS 3) to an associate or joint venture, the gain or loss resulting from the transaction is recognized in full. Also, when an entity loses control over a subsidiary that contains a business but retains significant influence or joint control, the gain or loss resulting from the transaction is recognized in full.
Conversely, when an entity sells or contributes assets that do not constitute a business to an associate or joint venture, the gain or loss resulting from the transaction is recognized only to the extent of the unrelated investors’ interest in the associate or joint venture, i.e. the entity’s share of the gains or losses is eliminated. Also, when an entity loses control over a subsidiary that does not contain a business but retains significant influence or joint control in an associate or a joint venture, the gain or loss resulting from the transaction is recognized only to the extent of the unrelated investors’ interest in the associate or joint venture, i.e. the entity’s share of the gain or loss is eliminated.
F-13
IFRS 16 “Leases”
IFRS 16 sets out the accounting standards for leases that will supersede IAS 17, IFRIC 4 and a number of related interpretations.
UnderDefinition of a lease
Upon initial application of IFRS 16, the Group will elect to apply IFRS 16 in determining whether contracts are, or contain, a lease only to contracts entered into (or changed) on or after January 1, 2019. Contracts identified as containing a lease under IAS 17 and IFRIC 4 will not be reassessed and will be accounted for in accordance with the transitional provisions under IFRS 16.
Upon initial application of IFRS 16, if the Group is a lessee, it shallwill recognize right-of-use assets, or investment properties if the right-of-use assets meet the definition of investment properties, and lease liabilities for all leases on the consolidated balance sheets except for those whose payments under low-value asset and short-term leases. The Group may elect to apply the accounting method similar to the accounting for operating lease under IAS 17 to the low-value and short-term leases.leases will be recognized as expenses on a straight-line basis. On the consolidated statements of comprehensive income, the Group should present the depreciation expense charged on the right-of-use assetassets separately from the interest expense accrued on the lease liability;liabilities; interest is computed by using the effective interest method. On the consolidated statements of cash flows, cash payments for the principal portion of the lease liability areliabilities will be classified within financing activities; cash payments for the interest portion arewill be classified within operating activities.
The application of IFRS 16 is not expected to have a material impact on the accounting of the Group as lessor.
WhenThe Group anticipates applying IFRS 16 becomes effective, the Group may elect to apply this Standard either retrospectively to each prior reporting period presented or retrospectively with the cumulative effect of the initial application of this Standardstandard recognized at the date of initial application.
Amendments to IAS 12 “Recognition of Deferred Tax Assets for Unrealized Losses”on January 1, 2019. Comparative information will not be adjusted on a retrospective basis.
The amendment clarifies thatGroup expects to apply the difference betweenfollowing practical expedients:
| a) | The Group will apply a single discount rate to a portfolio of leases with reasonably similar characteristics to measure lease liabilities. |
| b) | The Group will account for those leases for which the lease term ends on or before December 31, 2019 as short-term leases. |
F-20
| c) | The Group will exclude initial direct costs from the measurement of right-of-use assets on January 1, 2019. |
| d) | The Group will use hindsight, such as in determining lease terms, to measure lease liabilities. |
For leases currently classified as finance leases under IAS 17, the carrying amount of right-of-use assets and lease liabilities on January 1, 2019 will be determined as the carrying amount of the debt instrument measured at fair valueleased assets and its tax base gives risefinance lease payables as of December 31, 2018.
Anticipated impact on assets, liabilities and equity as of January 1, 2019
IAS 17 Carrying Amount as of December 31, 2018 | Adjustments Arising from Initial Application of IFRS 16 | IFRS 16 Carrying Amount as of January 1, 2019 | ||||||||||
| NT$ | NT$ | NT$ | ||||||||||
| Other financial assets - current | $ | 6,539,467 | $ | (31 | ) | $ | 6,539,436 | |||||
| Other current assets | 3,773,384 | (385,014 | ) | 3,388,370 | ||||||||
| Long-term prepayments for lease | 10,764,835 | (10,764,835 | ) | - | ||||||||
| Property, plant and equipment | 214,592,588 | (277,079 | ) | 214,315,509 | ||||||||
| Right-of-use assets | - | 10,724,198 | 10,724,198 | |||||||||
| Investment properties | 7,738,379 | 6,599,225 | 14,337,604 | |||||||||
| Other financial assets - non-current | 1,044,294 | (2,747 | ) | 1,041,547 | ||||||||
| Other intangible assets | 30,897,700 | (59,667 | ) | 30,838,033 | ||||||||
| Total effect on assets | $ | 275,350,647 | $ | 5,834,050 | $ | 281,184,697 | ||||||
| Obligation under leases - current | $ | - | $ | 490,085 | $ | 490,085 | ||||||
| Other current liabilities | 5,984,156 | (17,144 | ) | 5,967,012 | ||||||||
| Obligation under leases - non-current | - | 5,598,071 | 5,598,071 | |||||||||
| Other current liabilities - non-current | 1,371,302 | (236,962 | ) | 1,134,340 | ||||||||
| Total effect on liabilities | $ | 7,355,458 | $ | 5,834,050 | $ | 13,189,508 | ||||||
IAS 17 Carrying Amount as of December 31, 2018 | Adjustments Arising from Initial Application of IFRS 16 | IFRS 16 Carrying Amount as of January 1, 2019 | ||||||||||
| US$ (Note 4) | US$ (Note 4) | US$ (Note 4) | ||||||||||
| Other financial assets - current | $ | 213,638 | $ | (1 | ) | $ | 213,637 | |||||
| Other current assets | 123,273 | (12,578 | ) | 110,695 | ||||||||
| Long-term prepayments for lease | 351,677 | (351,677 | ) | - | ||||||||
| Property, plant and equipment | 7,010,539 | (9,052 | ) | 7,001,487 | ||||||||
| Right-of-use assets | - | 350,349 | 350,349 | |||||||||
| Investment properties | 252,806 | 215,591 | 468,397 | |||||||||
| Other financial assets - non-current | 34,116 | (90 | ) | 34,026 | ||||||||
| Other intangible assets | 1,009,399 | (1,949 | ) | 1,007,450 | ||||||||
| Total effect on assets | $ | 8,995,448 | $ | 190,593 | $ | 9,168,041 | ||||||
| Obligation under leases - current | $ | - | $ | 16,010 | $ | 16,010 | ||||||
| Other current liabilities | 195,497 | (560 | ) | 194,937 | ||||||||
| Obligation under leases - non-current | - | 182,884 | 182,884 | |||||||||
| Other current liabilities - non-current | 44,799 | (7,741 | ) | 37,058 | ||||||||
| Total effect on liabilities | $ | 240,296 | $ | 190,593 | $ | 430,889 | ||||||
F-21
| 2) | Amendments to IAS 19 “Plan Amendment, Curtailment or Settlement” |
The amendments stipulate that, if a temporary difference, even though there are unrealized losses on that asset, irrespective of whetherplan amendment, curtailment or settlement occurs, the Group expects to recovercurrent service cost and the carrying amountnet interest for the remainder of the debt instrument by sale or by holding it and collecting contractual cash flows.
annual reporting period are determined using the actuarial assumptions used for the remeasurement of the net defined benefit liabilities (assets). In addition, in determining whether to recognize a deferred tax asset, the Group should assess a deductible temporary difference in combination with all of its other deductible temporary differences, unlessamendments clarify the tax law restricts the utilization of losses to deduction against incomeeffect of a specific type, in which case, a deductible temporary difference is assessed in combination only with other deductible temporary differences ofplan amendment, curtailment or settlement on the appropriate type.requirements regarding the asset ceiling. The amendment also stipulates that, when determining whether to recognize a deferred tax asset, the estimate of probable future taxable profit may include some of the Group’s assets for more than their carrying amount if there is sufficient evidence that it is probable that the Group will achieve this, and thatapply the estimate for future taxable profit should exclude tax deductions resulting from the reversal of deductible temporary differences.above amendments prospectively.
| 4. | SUMMARY OF SIGNIFICANT ACCOUNTING POLICIES |
| a. | Statement of |
The consolidated financial statements have been prepared in accordance with IFRSs as issued by the IASB.
| b. | Basis of |
As disclosed in Note 1, the share exchange between the Company and ASE was an organization restructure under common control that the Company was essentially the continuation of ASE. The related assets and liabilities in the Company’s consolidated financial statements, before the date of incorporation, were recognized based on the carrying amounts of those in ASE’s consolidated financial statements. The consolidated financial statements of the Company for prior periods are prepared under the assumption that the Company owned 100% shareholdings of ASE at the very beginning.
The consolidated financial statements have been prepared on the historical cost basis except for certain financial instruments thatwhich are measured at fair value.value and net defined benefit liabilities which are measured at the present value of the defined benefit obligation less the fair value of plan assets.
The fair value measurements, which are grouped into Levels 1 to 3 based on the degree to which the fair value measurement inputs are observable and based on the significance of the inputs to the fair value measurement in its entirety, which are described as follows:
F-14
| 1) | Level 1 inputs are quoted prices (unadjusted) in active markets for identical assets or liabilities; |
| 2) | Level 2 inputs are inputs other than quoted prices included within Level 1 that are observable for |
| 3) | Level 3 inputs are unobservable inputs for |
| c. | Classification of |
Current assets include cash and cash equivalents and those assets held primarily for trading purposes or expected to be realized within twelve months after the balance sheet date, unless the asset is to be used for an exchange or to settle a liability, or otherwise remains restricted, at more than twelve months after the balance sheet date. Current liabilities are obligations incurred for trading purposes or to be settled within twelve months after the balance sheet date (even if an agreement to refinance, or to reschedule payments, on a long-term basis is completed after the balance sheet date and before the consolidated financial statements are authorized for issue) and liabilities that do not have an unconditional right to defer settlement for at least twelve12 months after the balance sheet date.date (terms of a liability that could, at the option of the counterparty, result in its settlement by the issue of equity instruments do not affect its classification). Assets and liabilities that are not classified as current are classified as non-current.
F-22
The Group engages in the construction business which has an operating cycle of over one year. The normal operating cycle applies when considering the classification of the Group’s construction-related assets and liabilities.
| d. | Basis of |
| 1) | Principles for preparing consolidated financial statements |
The Company became the ultimate parent company of the Group after completing the share exchange with ASE on April 30, 2018. In addition, the Company obtained control over SPIL on April 30, 2018 and, therefore, included SPIL’s subsidiaries in the Group’s consolidated financial statements from the same date.
The consolidated financial statements incorporate the financial statements of the Company and the entities controlled by the Company (i.e. its subsidiaries)subsidiaries, including structured entities). Control is achieved when the Group:
The Group reassesses whether or not it controls an investee if facts and circumstances indicate that there are changes to one or more of the three elements of control listed above.
When the Group has less than a majority of the voting rights of an investee, it has power over the investee when the voting rights are sufficient to give it the practical ability to direct the relevant activities of the investee unilaterally. The Group considers all relevant facts and circumstances in assessing whether or not the Group's voting rights in an investee are sufficient to give it power, including:
Consolidation of a subsidiary begins when the Group obtains control over the subsidiary and ceases when the Group loses control over the subsidiary. Specifically, incomeIncome and expenses ofsubsidiaries acquired or disposed of during the period are included in the consolidated statement of profit or loss and other comprehensive income from the effective datedates of acquisition oracquisitions up to the effective datedates of disposal,disposals, as appropriate.
F-15
When necessary, adjustments are made to the financial statements of subsidiaries to bring their accounting policies ininto line with those used by the Company.
All intra-group transactions, balances, income and expenses are eliminated in full upon consolidation.
Attribution of total comprehensive income to non-controlling interests
Total comprehensive income of subsidiaries is attributed to the owners of the Company and to the non-controlling interests even if this results in the non-controlling interests having a deficit balance.
Changes in the Group’s ownership interests in existing subsidiaries
Changes in the Group’s ownership interests in subsidiaries that do not result in the Group losing control over the subsidiaries are accounted for as equity transactions. The carrying amounts of the Group’s interests of the Group and the non-controlling interests are adjusted to reflect the changes in their relative interests in the subsidiaries. Any difference between the amount by which the non-controlling interests are adjusted and the fair value of the consideration paid or received is recognized directly in equity and attributed to the owners of the Company.
When the Group loses control overof a subsidiary, a gain or loss is recognized in profit or loss and is calculated as the difference between (i) the aggregate of the fair value of the consideration received and any investment retained in the former subsidiary at its fair value at the date when control is lost and (ii) the assets (including any goodwill) and liabilities and any non-controlling interests of the former subsidiary at their carrying amounts at the date when control is lost. The Group accounts for all amounts recognized in other comprehensive income in relation to that subsidiary on the same basis as would be required ifhad the Group had directly disposed of the related assets or liabilities.
F-23
| 2) | Subsidiaries included in consolidated financial statements were as follows: |
| Establishment and | Percentage of Ownership (%) December 31 | |||||||
| Name of Investee | Main Businesses | Operating Location | 2014 | 2015 | ||||
| A.S.E. Holding Limited | Holding company | Bermuda | 100.0 | 100.0 | ||||
| J & R Holding Limited (“J&R Holding”) | Holding company | Bermuda | 100.0 | 100.0 | ||||
| Innosource Limited | Holding company | British Virgin Islands | 100.0 | 100.0 | ||||
| Omniquest Industrial Limited | Holding company | British Virgin Islands | 100.0 | 100.0 | ||||
| ASE Marketing & Service Japan Co., Ltd. | Engaged in marketing and sales services | Japan | 100.0 | 100.0 | ||||
| ASE Test, Inc. | Engaged in the testing of semiconductors | Kaohsiung, ROC | 100.0 | 100.0 | ||||
| Universal Scientific Industrial Co., Ltd. (“USI”) | Engaged in the manufacturing, processing and sale of computers, computer peripherals and related accessories | Nantou, ROC | 99.2 | 99.0 | ||||
| USI Inc. (“USIINC”) | Engaged in investing activity and established in April 2015 | Nantou, ROC | - | 99.2 | ||||
| Establishment and | Percentage of Ownership (%) December 31 | |||||||||||
| Name of Investee | Main Businesses | Operating Location | 2017 | 2018 | ||||||||
| ASE | Engaged in the packaging and testing of semiconductors | Kaohsiung, R.O.C. | 100.0 | 100.0 | ||||||||
| A.S.E. Holding Limited | Holding company | Bermuda | 100.0 | 100.0 | ||||||||
| J & R Holding Limited (“J&R Holding”) | Holding company | Bermuda | 100.0 | 100.0 | ||||||||
| Innosource Limited | Holding company | British Virgin Islands | 100.0 | 100.0 | ||||||||
| Omniquest Industrial Limited | Holding company | British Virgin Islands | 100.0 | 100.0 | ||||||||
| ASE Marketing & Service Japan Co., Ltd. | Engaged in marketing and sales services | Japan | 100.0 | 100.0 | ||||||||
| ASE Test, Inc. | Engaged in the testing of semiconductors | Kaohsiung, R.O.C. | 100.0 | 100.0 | ||||||||
| Luchu Development Corporation | Engaged in the development of real estate properties | Taipei, R.O.C. | 86.1 | 86.1 | ||||||||
| TLJ Intertech Inc. (“TLJ”) | Engaged in information software services | Taipei, R.O.C. | 60.0 | 60.0 | ||||||||
| MingFung Information Service Corp., Ltd. | Engaged in information software services, and was established in May 2018. | Taipei, R.O.C. | - | 100.0 | ||||||||
| Alto Enterprises Limited | Holding company | British Virgin Islands | 100.0 | 100.0 | ||||||||
| Super Zone Holdings Limited | Holding company | Hong Kong | 100.0 | 100.0 | ||||||||
| ASE (Kun Shan) Inc. | Engaged in the packaging and testing of semiconductors | Kun Shan, China | 100.0 | 100.0 | ||||||||
| ASE Investment (Kun Shan) Limited | Holding company | Kun Shan, China | 100.0 | 100.0 | ||||||||
| Advanced Semiconductor Engineering (China) Ltd. | Will engage in the packaging and testing of semiconductors | Shanghai, China | 100.0 | 100.0 | ||||||||
| ASE Investment (Labuan) Inc. | Holding company | Malaysia | 100.0 | 100.0 | ||||||||
| ASE Test Limited (“ASE Test”) | Holding company | Singapore | 100.0 | 100.0 | ||||||||
| ASE (Korea) Inc. (“ASE Korea”) | Engaged in the packaging and testing of semiconductors | Korea | 100.0 | 100.0 | ||||||||
| J&R Industrial Inc. | Engaged in leasing equipment and investing activity | Kaohsiung, R.O.C. | 100.0 | 100.0 | ||||||||
| ASE Japan Co., Ltd. (“ASE Japan”) | Engaged in the packaging and testing of semiconductors | Japan | 100.0 | 100.0 | ||||||||
| ASE (U.S.) Inc. | After-sales service and sales support | U.S.A. | 100.0 | 100.0 | ||||||||
| Global Advanced Packaging Technology Limited | Holding company | British Cayman Islands | 100.0 | 100.0 | ||||||||
| ASE WeiHai Inc. | Engaged in the packaging and testing of semiconductors | Shandong, China | 100.0 | 100.0 | ||||||||
(Continued)
F-16F-24
| Establishment and | Percentage of Ownership (%) December 31 | |||||||
| Name of Investee | Main Businesses | Operating Location | 2014 | 2015 | ||||
| Luchu Development Corporation (“Luchu”) | Engaged in the development of real estate properties | Taipei, ROC | 86.1 | 86.1 | ||||
| Alto Enterprises Limited | Holding company | British Virgin Islands | 100.0 | 100.0 | ||||
| Super Zone Holdings Limited | Holding company | Hong Kong | 100.0 | 100.0 | ||||
| ASE (Kun Shan) Inc. | Engaged in the packaging and testing of semiconductors | Kun Shan, China | 100.0 | 100.0 | ||||
| ASE Investment (Kun Shan) Limited | Holding company | Kun Shan, China | 100.0 | 100.0 | ||||
| Advanced Semiconductor Engineering (China) Ltd. | Will engage in the packaging and testing of semiconductors | Shanghai, China | 100.0 | 100.0 | ||||
| ASE Investment (Labuan) Inc. | Holding company | Malaysia | 100.0 | 100.0 | ||||
| ASE Test Limited (“ASE Test”) | Holding company | Singapore | 100.0 | 100.0 | ||||
| ASE (Korea) Inc. (“ASE Korea”) | Engaged in the packaging and testing of semiconductors | Korea | 100.0 | 100.0 | ||||
| J&R Industrial Inc. | Engaged in leasing equipment and investing activity | Kaohsiung, ROC | 100.0 | 100.0 | ||||
| ASE Japan Co., Ltd. (“ASE Japan”) | Engaged in the packaging and testing of semiconductors | Japan | 100.0 | 100.0 | ||||
| ASE (U.S.) Inc. (“ASE US”) | After-sales service and sales support | U.S.A. | 100.0 | 100.0 | ||||
| Global Advanced Packaging Technology Limited, Cayman Islands | Holding company | British Cayman Islands | 100.0 | 100.0 | ||||
| ASE WeiHai Inc. | Engaged in the packaging and testing of semiconductors | Shandong, China | 100.0 | 100.0 | ||||
| Suzhou ASEN Semiconductors Co., Ltd. | Engaged in the packaging and testing of semiconductors | Suzhou, China | 60.0 | 60.0 | ||||
| Anstock Limited | Engaged in financing activity | British Cayman Islands | 100.0 | 100.0 | ||||
| Anstock II Limited | Engaged in financing activity | British Cayman Islands | 100.0 | 100.0 | ||||
| ASE Module (Shanghai) Inc. | Will engage in the production and sale of electronic components and printed circuit boards | Shanghai, China | 100.0 | 100.0 | ||||
| ASE (Shanghai) Inc. | Engaged in the production of substrates | Shanghai, China | 100.0 | 100.0 | ||||
| ASE Corporation | Holding company | British Cayman Islands | 100.0 | 100.0 | ||||
| ASE Mauritius Inc. | Holding company | Mauritius | 100.0 | 100.0 | ||||
| ASE Labuan Inc. | Holding company | Malaysia | 100.0 | 100.0 | ||||
| Shanghai Ding Hui Real Estate Development Co., Ltd. | Engaged in the development, construction and sale of real estate properties | Shanghai, China | 100.0 | 100.0 | ||||
| Establishment and | Percentage of Ownership (%) December 31 | |||||||||||
| Name of Investee | Main Businesses | Operating Location | 2017 | 2018 | ||||||||
| Suzhou ASEN Semiconductors Co., Ltd. (“ASEN”) | Engaged in the packaging and testing of semiconductors | Suzhou, China | 60.0 | 70.0 | ||||||||
| Anstock Limited | Engaged in financing activity | British Cayman Islands | 100.0 | 100.0 | ||||||||
| Anstock II Limited | Engaged in financing activity | British Cayman Islands | 100.0 | 100.0 | ||||||||
| ASE (Shanghai) Inc. | Engaged in the production of substrates | Shanghai, China | 100.0 | 100.0 | ||||||||
| ASE Corporation | Holding company | British Cayman Islands | 100.0 | 100.0 | ||||||||
| ASE Mauritius Inc. | Holding company | Mauritius | 100.0 | 100.0 | ||||||||
| ASE Labuan Inc. | Holding company | Malaysia | 100.0 | 100.0 | ||||||||
| Shanghai Ding Hui Real Estate Development Co., Ltd. | Engaged in the development, construction and sale of real estate properties | Shanghai, China | 100.0 | 100.0 | ||||||||
| Shanghai Ding Qi Property Management Co., Ltd. | Engaged in the management of real estate properties | Shanghai, China | 100.0 | 100.0 | ||||||||
| Advanced Semiconductor Engineering (HK) Limited | Engaged in the trading of substrates | Hong Kong | 100.0 | 100.0 | ||||||||
| Shanghai Ding Wei Real Estate Development Co., Ltd. | Engaged in the development, construction and leasing of real estate properties | Shanghai, China | 100.0 | 100.0 | ||||||||
| Shanghai Ding Yu Real Estate Development Co., Ltd. | Engaged in the development, construction and leasing of real estate properties | Shanghai, China | 100.0 | 100.0 | ||||||||
| Shanghai Ding Fan Department Store Co., Ltd. | Engaged in department store business | Shanghai, China | 100.0 | 100.0 | ||||||||
| Kun Shan Ding Hong Real Estate Development Co., Ltd. | Engaged in the development, construction and leasing of real estate properties | Kun Shan, China | 100.0 | 100.0 | ||||||||
| Shanghai Ding Xu Property Management Co., Ltd. | Engaged in the management of real estate properties | Shanghai, China | 100.0 | 100.0 | ||||||||
| ASE Electronics Inc. | Engaged in the production of substrates | Kaohsiung, R.O.C. | 100.0 | 100.0 | ||||||||
| ASE Test Holdings, Ltd. | Holding company | British Cayman Islands | 100.0 | 100.0 | ||||||||
| ASE Holdings (Singapore) Pte. Ltd. | Holding company | Singapore | 100.0 | 100.0 | ||||||||
| ASE Singapore Pte. Ltd. | Engaged in the packaging and testing of semiconductors | Singapore | 100.0 | 100.0 | ||||||||
| ISE Labs, Inc. | Engaged in the testing of semiconductors | U.S.A. | 100.0 | 100.0 | ||||||||
| ASE Electronics (M) Sdn. Bhd. | Engaged in the packaging and testing of semiconductors | Malaysia | 100.0 | 100.0 | ||||||||
| ASE Assembly & Test (Shanghai) Limited | Engaged in the packaging and testing of semiconductors | Shanghai, China | 100.0 | 100.0 | ||||||||
(Continued)
F-17F-25
| Establishment and | Percentage of Ownership (%) December 31 | |||||||
| Name of Investee | Main Businesses | Operating Location | 2014 | 2015 | ||||
| Shanghai Ding Qi Property Management Co., Ltd. | Engaged in the management of real estate properties and established in January 2015 | Shanghai, China | - | 100.0 | ||||
| Advanced Semiconductor Engineering (HK) Limited | Engaged in the trading of substrates | Hong Kong | 100.0 | 100.0 | ||||
| Shanghai Ding Wei Real Estate Development Co., Ltd. | Engaged in the development, construction and leasing of real estate properties | Shanghai, China | 100.0 | 100.0 | ||||
| Shanghai Ding Yu Real Estate Development Co., Ltd. | Engaged in the development, construction and leasing of real estate properties | Shanghai, China | 100.0 | 100.0 | ||||
| Kun Shan Ding Yue Real Estate Development Co., Ltd. | Engaged in the development, construction and leasing of real estate properties | Kun Shan, China | 100.0 | 100.0 | ||||
| Kun Shan Ding Hong Real Estate Development Co., Ltd. | Engaged in the development, construction and leasing of real estate properties | Kun Shan, China | 100.0 | 100.0 | ||||
| ASE Electronics Inc. | Engaged in the production of substrates | Kaohsiung, ROC | 100.0 | 100.0 | ||||
| ASE Test Holdings, Ltd. | Holding company | British Cayman Islands | 100.0 | 100.0 | ||||
| ASE Holdings (Singapore) Pte. Ltd. | Holding company | Singapore | 100.0 | 100.0 | ||||
| ASE Test Finance Limited | Liquidated in July 2015 | Mauritius | 100.0 | - | ||||
| ASE Singapore Pte. Ltd. | Engaged in the packaging and testing of semiconductors | Singapore | 100.0 | 100.0 | ||||
| ISE Labs, Inc. | Engaged in the testing of semiconductors | U.S.A. | 100.0 | 100.0 | ||||
| ASE Electronics (M) Sdn. Bhd. | Engaged in the packaging and testing of semiconductors | Malaysia | 100.0 | 100.0 | ||||
| ASE Assembly & Test (Shanghai) Limited | Engaged in the packaging and testing of semiconductors | Shanghai, China | 100.0 | 100.0 | ||||
| ASE Trading (Shanghai) Ltd. | Engaged in trading activity and was invested by ASE Assembly & Test (Shanghai) Limited in January 2015 | Shanghai, China | - | 100.0 | ||||
| Wuxi Tongzhi Microelectronics Co., Ltd. (“Wuxi Tongzhi”) | Engaged in the packaging and testing of semiconductors | Wuxi, China | 100.0 | 100.0 | ||||
| Huntington Holdings International Co., Ltd. | Holding company | British Virgin Islands | 99.2 | 99.2 | ||||
| Senetex Investment Co., Ltd. | Liquidated in December 2015 | Nantou, ROC | 99.2 | - | ||||
| Unitech Holdings International Co., Ltd. | Holding company | British Virgin Islands | 99.2 | 99.2 | ||||
| Establishment and | Percentage of Ownership (%) December 31 | |||||||||||
| Name of Investee | Main Businesses | Operating Location | 2017 | 2018 | ||||||||
| ASE Trading (Shanghai) Ltd. | Liquidated in December 2018 | Shanghai, China | 100.0 | - | ||||||||
| ISE Labs, China, Ltd. | Engaged in the testing of semiconductors, and was established in October 2018 | Shanghai, China | - | 100.0 | ||||||||
| Wuxi Tongzhi Microelectronics Co., Ltd. | Engaged in the packaging and testing of semiconductors | Wuxi, China | 100.0 | 100.0 | ||||||||
| USI Global | Engaged in investing activities, and was established in November 2018 and then dissolved in January 2019 | Nantou, R.O.C. | - | 100.0 | ||||||||
| USIINC | Engaged in investing activity | Nantou, R.O.C. | 99.2 | 100.0 | ||||||||
| Huntington Holdings International Co., Ltd. | Holding company | British Virgin Islands | 99.2 | 100.0 | ||||||||
| Unitech Holdings International Co., Ltd. (“UHI”) | Holding company | British Virgin Islands | 99.2 | 100.0 | ||||||||
| Real Tech Holdings Limited | Holding company | British Virgin Islands | 99.2 | 100.0 | ||||||||
| Universal ABIT Holding Co., Ltd. | In the process of liquidation | British Cayman Islands | 99.2 | 100.0 | ||||||||
| Rising Capital Investment Limited | Holding company | British Virgin Islands | 99.2 | 100.0 | ||||||||
| Rise Accord Limited | Holding company | British Virgin Islands | 99.2 | 100.0 | ||||||||
| Universal Scientific Industrial (Kunshan) Co., Ltd. | Engaged in the manufacturing and sale of computer assistance system and related peripherals | Kun Shan, China | 99.2 | 100.0 | ||||||||
| USI Enterprise Limited (“USIE”) | Engaged in the services of investment advisory and warehousing management | Hong Kong | 96.9 | 95.4 | ||||||||
| Universal Scientific Industrial (Shanghai) Co., Ltd. (“USISH”) | Engaged in the designing, manufacturing and sale of electronic components | Shanghai, China | 75.8 | 74.6 | ||||||||
| Universal Global Technology Co., Limited | Holding company | Hong Kong | 75.8 | 74.6 | ||||||||
| Universal Global Technology (Kunshan) Co., Ltd. | Engaged in the designing and manufacturing of electronic components | Kun Shan, China | 75.8 | 74.6 | ||||||||
| Universal Global Technology (Shanghai) Co., Ltd. | Engaged in the processing and sales of computer and communication peripherals as well as business in import and export of goods and technology | Shanghai, China | 75.8 | 74.6 | ||||||||
| Universal Global Electronics (Shanghai) Co., Ltd. | Engaged in the sale of electronic components and telecommunications equipment | Shanghai, China | 75.8 | 74.6 | ||||||||
(Continued)
F-18F-26
| Establishment and | Percentage of Ownership (%) December 31 | |||||||
| Name of Investee | Main Businesses | Operating Location | 2014 | 2015 | ||||
| Real Tech Holdings Limited | Holding company | British Virgin Islands | 99.2 | 99.2 | ||||
| Universal ABIT Holding Co., Ltd. | In the process of liquidation | British Cayman Islands | 99.2 | 99.2 | ||||
| Rising Capital Investment Limited | Holding company | British Virgin Islands | 99.2 | 99.2 | ||||
| Rise Accord Limited | Holding company | British Virgin Islands | 99.2 | 99.2 | ||||
| Cubuy Corporation | Liquidated in July 2015 | Shanghai, China | 99.2 | - | ||||
| Universal Scientific Industrial (Kunshan) Co., Ltd. | Engaged in the manufacturing and sale of computer assistance system and related peripherals | Kun Shan, China | 99.2 | 99.2 | ||||
| USI Enterprise Limited (“USIE”) | Engaged in the services of investment advisory and warehousing management | Hong Kong | 98.7 | 96.7 | ||||
| Universal Scientific Industrial (Shanghai) Co., Ltd. (“USISH”) | Engaged in the designing, manufacturing and sale of electronic components | Shanghai, China | 82.1 | 75.7 | ||||
| Universal Global Technology Co., Limited | Holding company | Hong Kong | 82.1 | 75.7 | ||||
| Universal Global Technology (Kunshan) Co., Ltd. | Engaged in the designing and manufacturing of electronic components | Kun Shan, China | 82.1 | 75.7 | ||||
| Universal Global Technology (Shanghai) Co., Ltd. | Engaged in the processing and sales of computer and communication peripherals as well as business in import and export of goods and technology | Shanghai, China | 82.1 | 75.7 | ||||
| Universal Global Electronics (Shanghai) Co., Ltd. | Engaged in the sale of electronic components and telecommunications equipment | Shanghai, China | 82.1 | 75.7 | ||||
| Universal Global Industrial Co., Limited | Engaged in manufacturing, trading and investing activity | Hong Kong | 82.1 | 75.7 | ||||
| Universal Global Scientific Industrial Co., Ltd. (“UGTW”) | Engaged in the manufacturing of components of telecomm and cars and provision of related R&D services | Nantou, ROC | 82.1 | 75.7 | ||||
| Establishment and | Percentage of Ownership (%) December 31 | |||||||||||
| Name of Investee | Main Businesses | Operating Location | 2017 | 2018 | ||||||||
| USI America Inc. | Engaged in the manufacturing and processing of motherboards and wireless network communication and provision of related technical service | U.S.A. | 75.8 | 74.6 | ||||||||
| Universal Global Industrial Co., Limited | Engaged in manufacturing, trading and investing activity | Hong Kong | 75.8 | 74.6 | ||||||||
| Universal Global Scientific Industrial Co., Ltd. (“UGTW”) | Engaged in the manufacturing of components of telecomm and cars and provision of related R&D services | Nantou, R.O.C. | 75.8 | 74.6 | ||||||||
| Universal Scientific Industrial De Mexico S.A. De C.V. | Engaged in the assembling of motherboards and computer components | Mexico | 75.8 | 74.6 | ||||||||
| USI Japan Co., Ltd. | Engaged in the manufacturing and sale of computer peripherals, integrated chip and other related accessories | Japan | 75.8 | 74.6 | ||||||||
| USI Electronics (Shenzhen) Co., Ltd. | Engaged in the design, manufacturing and sale of motherboards and computer peripherals | Shenzhen, China | 75.8 | 74.6 | ||||||||
| Universal Global Electronics Co., Ltd. | Engaged in accepting and outsourcing orders as well as sales of electronic components and service of technical advisory, and was established in February 2018 | Hong Kong | - | 74.6 | ||||||||
| Universal Scientific Industrial Co., Ltd. (“USI”) | Engaged in the manufacturing, processing and sale of computers, computer peripherals and related accessories | Nantou, R.O.C. | 75.5 | 74.4 | ||||||||
| SPIL | Engaged in the assembly, testing and turnkey services of integrated circuits | Taichung, R.O.C. | - | 100.0 | ||||||||
| SPIL (B.V.I.) Holding Limited | Engaged in investing activities | British Virgin Islands | - | 100.0 | ||||||||
| Siliconware Investment Co., Ltd. | Engaged in investing activities | Taipei, R.O.C. | - | 100.0 | ||||||||
| Siliconware USA, Inc. | Engaged in marketing activities | U.S.A. | - | 100.0 | ||||||||
(Continued)
F-19F-27
| Establishment and | Percentage of Ownership (%) December 31 | |||||||
| Name of Investee | Main Businesses | Operating Location | 2014 | 2015 | ||||
| USI America Inc. | Engaged in the manufacturing and processing of motherboards and wireless network communication and provision of related technical service. The name was changed from USI Manufacturing Service Inc. to USI America Inc. in May 2015 | U.S.A. | 82.1 | 75.7 | ||||
| Universal Scientific Industrial De Mexico S.A. De C.V. | Engaged in the assembling of motherboards and computer components | Mexico | 82.1 | 75.7 | ||||
| USI Japan Co., Ltd. | Engaged in the manufacturing and sale of computer peripherals, integrated chip and other related accessories | Japan | 82.1 | 75.7 | ||||
| USI@Work, Inc. | Merged into USI America Inc. in August 2015 | U.S.A. | 82.1 | - | ||||
| USI Electronics (Shenzhen) Co., Ltd. | Engaged in the design, manufacturing and sale of motherboards and computer peripherals | Shenzhen, China | 82.1 | 75.7 | ||||
| Establishment and | Percentage of Ownership (%) December 31 | |||||||||||
| Name of Investee | Main Businesses | Operating Location | 2017 | 2018 | ||||||||
| SPIL (Cayman) Holding Limited | Engaged in investing activities | British Cayman Islands | - | 100.0 | ||||||||
| Siliconware Technology (Suzhou) Limited | Engaged in the packaging and testing of semiconductors | Suzhou, China | - | 70.0 | ||||||||
| Siliconware Electronics (Fujian) Co., Limited | Engaged in the packaging and testing of semiconductors | Fujian, China | - | 100.0 | ||||||||
(Concluded)
| e. | Business |
Acquisitions of businesses are accounted for using the acquisition method. The consideration transferred in a business combination is measured at fair value, which is calculated as the sum of the acquisition-date fair values of the assets transferred by the Group, liabilities incurred by the Group to the former owners of the acquiree and the equity interests issued by the Group in exchange for control of the acquiree. Acquisition-related costs are generally recognized in profit or loss as they are incurred.
F-20
Goodwill is measured as the excess of the sum of the consideration transferred, the amount of any non-controlling interests in the acquiree, and the fair value of the acquirer'sacquirer’s previously held equity interest in the acquiree (if any) over the net of the acquisition-date amounts of the identifiable assets acquired and the liabilities assumed. If, after re-assessment, the net of the acquisition-date amounts of the identifiable assets acquired and liabilities assumed exceeds the sum of the consideration transferred, the amount of any non-controlling interests in the acquiree and the fair value of the acquirer’s previously held interest in the acquiree (if any), the excess is recognized immediately in profit or loss as a bargain purchase gain.
When a business combination is achieved in stages, the Group'sGroup’s previously held equity interest in the acquiree is remeasured to its acquisition-date fair value and the resulting gain or loss, if any, is recognized in profit or loss.loss or other comprehensive income. Amounts arising from interests in the acquiree prior to the acquisition date that have previously been recognized in other comprehensive income are recognized on the same basis as would be required if that interest were directly disposed of by the Group.
If the initial accounting for a business combination is incomplete by the end of the reporting period in which the combination occurs, the Group reports provisional amounts for the items for which the accounting is incomplete. Those provisional amounts are adjusted retrospectively during the measurement period, or additional assets or liabilities are recognized, to reflect new information obtained about facts and circumstances that existed at the acquisition date that, if known, would have affected the amounts recognized at that date.
Business combination involving entities under common control is not accounted for by acquisition method but accounted for at the carrying amounts of the entities. Prior period comparative information in the financial statements is restated as if a business combination involving entities under common control had already occurred in that period.
| f. | Foreign |
In preparing the financial statements of each individual group entity, transactions in currencies other than the entity’s functional currency (foreign(i.e. foreign currencies) are recognized at the rates of exchange prevailing at the dates of the transactions.
At each balance sheet date, monetary items denominated in foreign currencies are retranslated at the rates prevailing at that date. Exchange differences on monetary items arising from settlement or translation are recognized in profit or loss in the period in which they arise except for exchange differences on transactions entered into in order to hedge certain foreign currency risks.
F-28
Non-monetary items carriedmeasured at fair value that are denominated in foreign currencies are retranslated at the rates prevailing at the date when the fair value was determined. Non-monetary items that are measured in terms of historical cost in a foreign currency are not retranslated.
Exchange differences on monetary items arising from settlement or translation are recognized in profit or loss in the period in which they arise.
Exchange differences arising onfrom the retranslation of non-monetary assets (such as equity instruments) or liabilities measured at fair valueitems are included in profit or loss for the period at the rates prevailing at the balance sheet date except for exchange differences arising onfrom the retranslation of non-monetary items in respect of which gains and losses are recognized directly in other comprehensive income, in which case,cases, the exchange differences are also recognized directly in other comprehensive income.
Non-monetary items that are measured at historical cost in a foreign currency are translated using the exchange rate at the date of the transaction, and are not retranslated.
For the purposes of presenting the consolidated financial statements, the assets and liabilities of the Group’s foreign operations (including subsidiaries, associates and joint ventures in other countries that use currencies which are different from the currency of the Company) are translated into the New Taiwan dollars using exchange rates prevailing at each balance sheet date. Income and expense items are translated at the average exchange rates for the period. ExchangeThe resulting currency translation differences arising are recognized in other comprehensive income and accumulated in equity attributed to the owners of the Company and non-controlling interests as appropriate.
F-21
On the disposal of the Group’s entire interest in a foreign operation, or a disposal involving the loss of control over a subsidiary that includes a foreign operation, or a partial disposal of an interest in a joint arrangement or an associate that includes a foreign operation of which the retained interest becomes a financial asset, all of the exchange differences accumulated in equity in respect of that operation attributable to the owners of the Company are reclassified to profit or loss.
In relation to a partial disposal of a subsidiary that does not result in the Group losing control over the subsidiary, the proportionate share of accumulated exchange differences is re-attributed to the non-controlling interests of the subsidiary and is not recognized in profit or loss. For all other partial disposals, of associates or joint arrangements that do not result in the Group losing significant influence or joint control, the proportionate share of the accumulated exchange differences recognized in other comprehensive income is reclassified to profit or loss.
| g. | Inventories and |
Inventories, including raw materials (materials received from customers for processing, mainly semiconductor wafers, are excluded from inventories as title and risk of loss remain with the customers), supplies, work in process, finished goods, and materials and supplies in transit are stated at the lower of cost or net realizable value. Inventory write-downs are made by item, except for those that may be appropriate to group items of similar or related inventories. Net realizable value is the estimated selling prices of inventories less all estimated costs of completion and estimated costs necessary to make the sale. Raw materials and supplies are recorded at moving average cost while work in process and finished goods are recorded at standard cost.
Inventories related to real estate business include land and buildings held for sale, land held for construction and construction in progress. Land held for development is recorded as land held for construction upon obtaining the title of ownership. Prior to the completion, the borrowing costs directly attributable to construction in progress are capitalized as part of the cost of the asset. Construction in progress is transferred to land and buildings held for sale upon completion. Land and buildings held for sale, construction in progress and land held for construction are stated at the lower of cost or net realizable value and related write-downs are made by item. The amounts received in advance for real estate properties are first recorded as advance receipts and then recognized as revenue when the construction is completed and the title and significant risk of the real estate properties are transferred to customers. Cost of sales of land and buildings held for sale are recognized based on the ratio of property sold to the total property developed.
F-29
| h. | Investments in associates and joint ventures |
An associate is an entity over which the Group has significant influence and that is neither a subsidiary nor an interest in a joint venture. Joint venture is a joint arrangement whereby the Group and other parties that have joint control of the arrangement have rights to the net assets of the arrangement.
The Group uses the equity method to account for its investments in associates and joint ventures.
Under the equity method, investments in an associate and a joint venture are initially recognized at cost and adjusted thereafter to recognize the Group’s share of the profit or loss and other comprehensive income of the associate and joint venture. The Group also recognizes the changes in the Group’s share of equity of associates and joint venture.
Any excess of the cost of acquisition over the Group’s share of the net fair value of the net identifiable assets and liabilities of an associate or a joint venture at the date of acquisition is recognized as goodwill, which is included within the carrying amount of the investment and is not amortized. Any excess of the Group’s share of the net fair value of the identifiable assets and liabilities over the cost of acquisition after reassessment is recognized immediately in profit or loss.
GainsWhen the Group subscribes for additional new shares of an associate and joint venture at a percentage different from its existing ownership percentage, the resulting carrying amount of the investment differs from the amount of the Group’s proportionate interest in the associate and joint venture. The Group records such a difference as an adjustment to investments with the corresponding amount charged or credited to capital surplus - changes in capital surplus from investments in associates and joint ventures accounted for using the equity method. If the Group’s ownership interest is reduced due to its additional subscription of the new shares of the associate and joint venture, the proportionate amount of the gains or losses previously recognized in other comprehensive income in relation to that associate and joint venture is reclassified to profit or loss on the same basis as would be required had the investee directly disposed of the related assets or liabilities. When the adjustment should be debited to capital surplus, but the capital surplus recognized from investments accounted for using the equity method is insufficient, the shortage is debited to retained earnings.
When the Group’s share of losses of an associate and a joint venture equals or exceeds its interest in that associate and joint venture (which includes any carrying amount of the investment accounted for using the equity method and long-term interests that, in substance, form part of the Group’s net investment in the associate and joint venture), the Group discontinues recognizing its share of further losses. Additional losses and liabilities are recognized only to the extent that the Group has incurred legal obligations or constructive obligations, or made payments on behalf of that associate and joint venture.
The entire carrying amount of an investment (including goodwill) is tested for impairment as a single asset by comparing its recoverable amount with its carrying amount. Any impairment loss recognized is not allocated to any asset, including goodwill, that forms part of the carrying amount of the investment. Any reversal of that impairment loss is recognized to the extent that the recoverable amount of the investment subsequently increases.
The Group discontinues the use of the equity method from the date on which its investment ceases to be an associate and a joint venture. Any retained investment is measured at fair value at that date, and the fair value is regarded as the investment’s fair value on initial recognition as a financial asset. The difference between the previous carrying amount of the associate and the joint venture attributable to the retained interest and its fair value is included in the determination of the gain or loss on disposal of the associate and the joint venture. The Group accounts for all amounts previously recognized in other comprehensive income in relation to that associate and joint venture on the same basis as would be required had that associate directly disposed of the related assets or liabilities. If an investment in an associate becomes an investment in a joint venture or an investment in a joint venture becomes an investment in an associate, the Group continues to apply the equity method and does not remeasure the retained interest.
F-30
When a group entity transacts with its associate and joint venture, profits and losses resulting from upstream, downstreamthe transactions with the associate and sidestream transactions between the Group (including its subsidiaries) and its associates or joint venturesventure are recognized in the Group’sGroup’ consolidated financial statements only to the extent ofthat interests in the associates orassociate and the joint ventures thatventure are not related to the Group.
F-22
| i. | Property, |
Except for land which is stated at cost, property, plant and equipment (including assets held under finance leases) are stated at cost less accumulated depreciation and accumulated impairment.
Properties in the course of construction for production, supply or administrative purposes are carried at cost, less any recognized impairment loss. Cost includes professional fees and borrowing costs eligible for capitalization. Such propertiesassets are depreciated and classified to the appropriate categories of property, plant and equipment when completed and ready for intended use. Depreciation of these assets, on the same basis as other property assets, commences when the assets are ready for their intended use.
Freehold land is not depreciated.
Depreciation onof property, plant and equipment is recognized using the straight-line method. Each significant part is depreciated separately. If the lease term is shorter than the assets’ useful lives, such assets are depreciated over the lease term. The estimated useful lives, residual values and depreciation method are reviewed at each balance sheet date, with the effect of any changes in estimate accounted for on a prospective basis.
On derecognition of an item of property, plant and equipment, the difference between the sales proceeds and the carrying amount of the asset is recognized in profit or loss.
| j. | Investment properties |
Investment properties are properties held to earn rentals and/or for capital appreciation (including property under construction for such purposes). Investment properties also include land held for a currently undetermined future use.
Investment properties are measured initially at cost, including transaction costs. Subsequent to initial recognition, investment properties are measured at cost less accumulated depreciation and accumulated impairment loss. Depreciation is recognized using the straight-line method.
Investment properties under construction are stated at cost less accumulated depreciation and accumulated impairment loss. Cost includes professional fees and borrowing costs eligible for capitalization. Depreciation of these assets commences when the assets are ready for their intended use.
For a transfer from property, plant and equipment to investment properties, the property’s deemed cost for subsequent accounting is its carrying amount at the end of owner-occupation.
For a transfer from inventories to investment properties, the property’s deemed cost for subsequent accounting is its carrying amount at inception of an operating lease.
On derecognition of an investment property, the difference between the net disposal proceeds and the carrying amount of the asset is included in profit or loss.
| k. | Goodwill |
Goodwill arising from an acquisition of a business is carried at cost as established at the date of acquisition of the business less accumulated impairment loss.
For the purposes of impairment testing, goodwill is allocated to each of the Group’s cash-generating units or groups of cash-generating units (referred to as cash-generating units)“cash-generating units”) that is expected tobenefit from the synergies of the combination.
A cash-generating unit to which goodwill has been allocated is tested for impairment annually, or more frequently when there is an indication that the unit may be impaired, by comparing its carrying amount, including the attributed goodwill, with its recoverable amount. However, if the goodwill allocated to a cash-generating unit was acquired in a business combination during the current annual period, that unit shall be tested for impairment before the end of the current annual period. If the recoverable amount of the cash-generating unit is less than its carrying amount, the impairment loss is allocated first to reduce the carrying amount of any goodwill allocated to the unit and then pro rata to the other assets of the unit pro rata based on the carrying amount of each asset in the unit. Any impairment loss is recognized directly in profit or loss. An impairment loss recognized for goodwill is not reversed in subsequent periods.
F-31
| Other |
Other intangible assets with finite useful lives acquired separately are initially measured at cost and subsequently measured at cost less accumulated amortization and accumulated impairment.impairment loss. Other intangible assets are amortized based on the pattern in which the economic benefits are consumed or using the straight-line method over their estimated useful lives. The estimated useful lives, residual valuevalues, and amortization methods are reviewed at each balance sheet date, with the effect of any changes in estimate being accounted for on a prospective basis. Intangible assets with indefinite useful lives that are acquired separately are measured at cost less accumulated impairment loss.
Other intangible assets acquired in a business combination and recognized separately from goodwill are initially recognized at their fair value at the acquisition date which is regarded as their cost.
F-23
Subsequent to initial recognition, they are measured on the same basis as intangible assets that are acquired separately.
On derecognition of an intangible asset, the difference between the net disposal proceeds and the carrying amount of the asset are recognized in profit or loss.
| Impairment of |
At each balance sheet date, the Group reviews the carrying amounts of its tangible and intangible assets, excluding goodwill, (see above), to determine whether there is any indication that those assets have suffered an impairment loss. If any such indication exists, the recoverable amount of the asset is estimated in order to determine the extent of the impairment loss. When it is not possible to estimate the recoverable amount of an individual asset, the Group estimates the recoverable amount of the cash-generating unit to which the asset belongs. Corporate assets are allocated to the individual cash-generating units on a reasonable and consistent basis of allocation. RecoverableThe recoverable amount is the higher of fair value less costs to sell and value in use. If the recoverable amount of an asset or cash-generating unit is estimated to be less than its carrying amount, the carrying amount of the asset or cash-generating unit is reduced to its recoverable amount, with the resulting impairment loss recognized in profit or loss.
When an impairment loss is subsequently reversed, the carrying amount of the asset or cash-generating unit is increased to the revised estimate of its recoverable amount, but only to the extent of the carrying amount that would have been determined had no impairment loss been recognized for the asset or cash-generating unit in prior years. A reversal of an impairment loss is recognized immediately in profit or loss.
| Financial |
Financial assets and financial liabilities are recognized when a group entity becomes a party to the contractual provisions of the instruments.
Financial assets and financial liabilities are initially measured at fair value. Transaction costs that are directly attributable to the acquisition or issue of financial assets and financial liabilities (other than financial assets and financial liabilities at fair value through profit or loss)FVTPL) are added to or deducted from the fair value of the financial assets or financial liabilities, as appropriate, on initial recognition. Transaction costs directlyattributable to the acquisition of financial assets or financial liabilities at fair value through profit or loss are recognized immediately in profit or loss.
F-32
| 1) | Financial assets |
All regular way purchases or sales of financial assets are recognized orand derecognized on a settlement date basis.
| a) | Measurement category |
2018
Financial assets held by the Group are classified into the following categories: financial assets at FVTPL, financial assets at amortized cost, and investments in debt instruments and equity instruments at FVTOCI.
| i. | Financial asset at FVTPL |
Financial asset is classified as at FVTPL when the financial asset is mandatorily classified or it is designated as at FVTPL. The Group’s financial assets mandatorily classified as at FVTPL include investments in equity instruments which are not designated as at FVTOCI and debt instruments that do not meet the amortized cost criteria or the FVTOCI criteria.
A financial asset may be designated as at FVTPL upon initial recognition if such designation eliminates or significantly reduces a measurement or recognition inconsistency that would otherwise arise.
Financial assets at FVTPL are subsequently measured at fair value, with any gains or losses arising on remeasurement recognized in profit or loss. The net gain or loss recognized in profit or loss incorporates any dividend or interest earned on the financial asset.
Fair value is determined in the manner described in Note 36.
| ii. | Financial assets at amortized cost |
Financial assets that meet the following conditions are subsequently measured at amortized cost:
i) The financial asset is held within a business model whose objective is to hold financial assets in order to collect contractual cash flows; and
ii) The contractual terms of the financial asset give rise on specified dates to cash flows that are solely payments of principal and interest on the principal amount outstanding.
Subsequent to initial recognition, financial assets at amortized cost, including cash and cash equivalents, trade receivables at amortized cost, other receivables and other financial assets, are measured at amortized cost, which equals to gross carrying amount determined using the effective interest method less any impairment loss. Exchange differences are recognized in profit or loss.
Interest income is calculated by applying the effective interest rate to the gross carrying amount of a financial asset, except for:
i) Purchased or originated credit-impaired financial assets, for which interest income is calculated by applying the credit-adjusted effective interest rate to the amortized cost of the financial asset; and
F-33
ii) Financial assets that are not credit-impaired on purchase or origination but have subsequently become credit-impaired, for which interest income is calculated by applying the effective interest rate to the amortized cost of such financial assets in subsequent reporting periods.
Cash equivalents include time deposits with original maturities within 3 months from the date of acquisition, which are highly liquid, readily convertible to a known amount of cash and are subject to an insignificant risk of changes in value. These cash equivalents are held for the purpose of meeting short-term cash commitments.
| iii. | Investments in debt instruments at FVTOCI |
For the Group’s debt instruments that meet the following conditions are subsequently measured at FVTOCI:
| i) | the debt instrument is held within a business model whose objective is achieved by both the collecting of contractual cash flows and the selling of the financial assets; and |
| ii) | the contractual terms of the debt instrument give rise on specified dates to cash flows that are solely payments of principal and interest on the principal amount outstanding. |
Investments in debt instruments at FVTOCI are subsequently measured at fair value. Changes in the carrying amounts of these debt instruments relating to changes in foreign currency exchange rates, interest income calculated using the effective interest method and impairment losses or reversals are recognized in profit or loss. Other changes in the carrying amount of these debt instruments are recognized in other comprehensive income and will be reclassified to profit or loss when the investment is disposed of.
| iv. | Investments in equity instruments at FVTOCI |
On initial recognition, the Group make an irrevocable election to designate investments in equity instruments as at FVTOCI. Designation at FVTOCI is not permitted if the equity investment is held for trading or if it is contingent consideration recognized by an acquirer in a business combination.
Investments in equity instruments at FVTOCI are subsequently measured at fair value with gains and losses arising from changes in fair value recognized in other comprehensive income and accumulated in other equity. The cumulative gain or loss will not be reclassified to profit or loss on disposal of the equity investments, instead, they will be transferred to retained earnings.
Dividends on these investments in equity instruments are recognized in profit or loss when the Group’s right to receive the dividends is established, unless the dividends clearly represent a recovery of part of the cost of the investment.
Prior to 2018
The classification of financial assets held by the Group depends on the natureASE and purpose of theits subsidiaries includes financial assets at FVTPL, available-for-sale financial assets, and is determined at the time of initial recognition.loans and receivables.
| i. | Financial assets at |
Financial assets are classified as at FVTPL when the financial assets are either held for trading or they are designated as at FVTPL.
F-34
A financial asset other than a financial asset held for trading may be designated as at FVTPL upon initial recognition if:
F-24
| i) | Such designation eliminates or significantly reduces a measurement or recognition inconsistency that would otherwise arise; or |
| ii) | The financial asset forms part of a group of financial assets or financial liabilities or both, which is managed and has performance evaluated on a fair value basis in accordance with ASE and its subsidiaries’ documented risk management or investment strategy, and information about the grouping is provided internally on that basis; or |
| iii) | The contract contains one or more embedded derivatives so that the entire hybrid (combined) contract can be designated as at FVTPL. |
Financial assets at FVTPL are stated at fair value with any gains or losses arising on remeasurement recognized in profit or loss. The net gain or loss recognized in profit or loss incorporates any dividend or interest earned on the financial asset.
Fair value is determined in the manner described in Note 31.36.
| ii. | Available-for-sale financial assets |
Available-for-sale financial assets are non-derivatives that are either designated as available-for-sale or are not classified as (a)(1) loans and receivables, (b)(2) held-to-maturity investments or (c)(3) financial assets at fair value through profit or loss.
Available-for-sale financial assets are stated at fair value at each balance sheet date. Changes in the carrying amount of available-for-sale monetary financial assets relating to changes in foreign currency rates, interest income calculated using the effective interest method and dividends on available-for-sale equity investments are recognized in profit or loss. Other changes in the carrying amount of available-for-sale financial assets are recognized in other comprehensive income and accumulated under the heading of unrealized gain (loss) on available-for-sale financial assets. When the investment is disposed of or is determined to be impaired, the cumulative gain or loss previously accumulated in the unrealized gain (loss) on available-for-sale financial assets is reclassified to profit or loss.
Dividends on available-for-sale equity instruments are recognized in profit or loss when the Group'sASE and its subsidiaries’s right to receive the dividends is established.
| iii. | Loans and receivables |
Loans and receivables including cash and cash equivalents, trade receivables, other receivables and other financial assets and debt investments with no active market are measured at amortized cost using the effective interest method, less any impairment. Interest income is recognized by applying the effective interest rate, except for short-term receivables when the effect of discounting is immaterial.
Cash equivalents are short-term, highly liquid investments that are readily convertible to known amounts of cash and which are subject to an insignificant risk of change in value.
| b) | Impairment of financial assets and contract assets |
2018
F-35
At each balance sheet date, the Group recognizes a loss allowance for expected credit losses on financial assets at amortized cost (including trade receivables), investments in debt instruments that are measured at FVTOCI as well as contract assets.
The Group always recognizes lifetime Expected Credit Loss (“ECL”) for trade receivables and contract assets. For all other financial instruments, the Group recognizes lifetime ECL when there has been a significant increase in credit risk since initial recognition. If, on the other hand, the credit risk on the financial instrument has not increased significantly since initial recognition, the Group measures the loss allowance for that financial instrument at an amount equal to 12-month ECL.
Expected credit losses reflect the weighted average of credit losses with the respective risks of a default occurring as the weights. Lifetime ECL represents the expected credit losses that will result from all possible default events over the expected life of a financial instrument. In contrast, 12-month ECL represents the portion of lifetime ECL that is expected to result from default events on a financial instrument that are possible within 12 months after the reporting date.
The Group recognizes an impairment gain or loss in profit or loss for all financial instruments with a corresponding adjustment to their carrying amount through a loss allowance account, except for investments in debt instruments that are measured at FVTOCI, for which the loss allowance is recognized in other comprehensive income and does not reduce the carrying amount of the financial asset.
Prior to 2018
Financial assets, other than those at FVTPL, are assessed for indicators of impairment at each balance sheet date. Financial assets are considered to be impaired when there is objective evidence that, as a result of one or more events that occurred after the initial recognition of the financial assets, the estimated future cash flows of the investments have been affected.
F-25
For financial assets carried at amortized cost, such as trade receivables and other receivables, assets that are assessed not to be impaired individually are, further, assessed for impairment on a collective basis. The Group assessesASE and its subsidiaries assess the collectability of receivables based on the Group’stheir past experience of collecting payments and observable changes that correlate with default on receivables.
For financial assets carried at amortized cost, the amount of the impairment loss recognized is the difference between the assets’ carrying amounts and the present value of estimated future cash flows, discounted at the financial assets’ original effective interest rates. If, in a subsequent period, the amount of the impairment loss decreases and the decreases can be objectively related to an event occurring after the impairment loss recognized, the previously recognized impairment loss is reversed either directly or by adjusting an allowance account through profit or loss. The reversal shall not result in carrying amounts of financial assets that exceed what the amortized cost would have been at the date the impairment is reversed.
For any available-for-sale equity investments, a significant or prolonged decline in the fair value of the security below its cost is considered to be objective evidence of impairment. When an available-for-sale financial asset is considered to be impaired, cumulative gains or losses previously recognized in other comprehensive income are reclassified to profit or loss in the period.
In respect of available-for-sale equity securities, impairment loss previously recognized in profit or loss areis not reversed through profit or loss. Any increase in fair value subsequent to an impairment loss is recognized in other comprehensive income and accumulated underincome. In respect of available-for-sale debt securities, impairment loss is subsequently reversed through profit or loss if an increase in the headingfair value of unrealized gain (loss) on available-for-sale financial assets.the investment can be objectively related to an event occurring after the recognition of the impairment loss.
F-36
The carrying amount of the financial asset is reduced by the impairment loss directly for all financial assets with the exception of trade and other receivables where the carrying amount is reduced through the use of an allowance account. When a trade receivable isand other receivables are considered uncollectible, it isthey are written off against the allowance account. Subsequent recoveries of amounts previously written off are credited against the allowance account. Changes in the carrying amount of the allowance account are recognized in profit or loss except for uncollectible trade receivables and other receivables that are written off against the allowance account.
| c) | Derecognition of financial assets |
The Group derecognizes a financial asset only when the contractual rights to the cash flows from the asset expire or when it transfers the financial asset and substantially all the risks and rewards of ownership of the asset to another entity. On
Before 2018, on derecognition of a financial asset in its entirety, the difference between the asset’s carrying amount and the sum of the consideration received and receivable and the cumulative gain or loss thatwhich had been recognized in other comprehensive income and accumulated in equity is recognized in profit or loss. Starting from 2018, on derecognition of a financial asset at amortized cost in its entirety, the difference between the asset’s carrying amount and the sum of the consideration received and receivable is recognized in profit or loss. On derecognition of an investment in a debt instrument at FVTOCI, the difference between the asset’s carrying amount and the sum of the consideration received and receivable and the cumulative gain or loss which had been recognized in other comprehensive income is recognized in profit or loss. However, on derecognition of an investment in an equity instrument at FVTOCI, the difference between the asset’s carrying amount and the sum of the consideration received and receivable is recognized in profit or loss, and the cumulative gain or loss which had been recognized in other comprehensive income is transferred directly to retained earnings, without recycling through profit or loss.
| 2) | Equity instruments |
Debt and equity instruments issued by a group entity are classified as either financial liabilities or as equity in accordance with the substance of the contractual arrangements and the definitions of a financial liability and an equity instrument.
Equity instruments issued by a group entity are recognized at the proceeds received, net of direct issue costs.
Repurchase of the Company’s own equity instruments is recognized in and deducted directly from equity. No gain or loss is recognized in profit or loss on the purchase, sale, issue or cancellation of the Company’s own equity instruments.
| 3) | Financial liabilities |
Financial liabilities are measured either at amortized cost using the effective interest method or at FVTPL. Financial liabilities measured at FVTPL are held for trading.
F-26
Financial liabilities at FVTPLheld for trading are stated at fair value, with any gain or loss arising on remeasurement recognized in profit or loss. The net gain or loss recognized in profit or loss incorporates any interest or dividend paid on the financial liability. Fair value is determined in the manner described in Note 31.36.
F-37
The Group derecognizes financial liabilities when, and only when the Group’s obligations are discharged, cancelled or they expire.expired. The difference between the carrying amount of the financial liability derecognized and the consideration paid and payable, including any non-cash assets transferred or liabilities assumed, is recognized in profit or loss.
| 4) | Derivative financial instruments |
The Group enters into a variety of derivative financial instruments to manage its exposure to interest rate and foreign exchange rate risks, including forward exchange contracts, swap contracts, interest rate swap contracts and foreign currency option contracts.
Derivatives are initially recognized at fair value at the date on which the derivative contracts are entered into and are subsequently remeasured to their fair value at the end of each balance sheet date.reporting period. The resulting gain or loss is recognized in profit or loss immediately unless the derivative is designated and effective as a hedging instrument ,instrument; in which event, the timing of the recognition in profit or loss depends on the nature of the hedgehedging relationship. When the fair value of a derivative financial instrumentsinstrument is positive, the derivative is recognized as a financial asset; when the fair value of a derivative financial instrumentsinstrument is negative, the derivative is recognized as a financial liabilities.liability.
Before 2018, derivatives embedded in non-derivative host contracts were treated as separate derivatives when they met the definition of a derivative; their risks and characteristics were not closely related to those of the host contracts; and the contracts were not measured at FVTPL. Starting from 2018, derivatives embedded in hybrid contracts that contain financial asset hosts that is within the scope of IFRS 9 are not separated; instead, the classification is determined in accordance with the entire hybrid contract. Derivatives embedded in non-derivative host contracts that are not financial assets that is within the scope of IFRS 9 (e.g. financial liabilities) are treated as separate derivatives when they meet the definition of a derivative, their risks and characteristics are not closely related to those of the host contracts and the host contracts are not measured at FVTPL.
| 5) | Convertible bonds |
| a) | Convertible bonds contain conversion option classified as an equity |
The component parts of compound instruments (convertible bonds) issued by the Group are classified separately as financial liabilities and equity in accordance with the substance of the contractual arrangements and the definitions of a financial liability and an equity instrument.
On initial recognition, the fair value of the liability component is estimated using the prevailing market interest rate for similar non-convertible instruments. This amount is recorded as a liability on an amortized cost basis using the effective interest method until extinguished upon conversion or the instrument’s maturity date. Any embedded derivative liability is measured at fair value.
The conversion option classified as equity is determined by deducting the amount of the liability component from the fair value of the compound instrument as a whole. This is recognized and included in equity, net of income tax effects, and is not subsequently remeasured. In addition, the conversion option classified as equity will remain in equity until the conversion option is exercised, in which case, the balance recognized in equity will be transferred to capital surplus - share premium. When the conversion option remains unexercised at maturity, the balance recognized in equity will be transferred to capital surplus - share premium.
Transaction costs that relate to the issueissuance of the convertible bonds are allocated to the liability and equity components in proportion to the allocation of the gross proceeds. Transaction costs relating to the equity component are recognized directly in equity. Transaction costs relating to the liability component are included in the carrying amount of the liability component.
F-38
| b) | Convertible bonds contain conversion option classified as a liability |
The conversion options component of the convertible bonds issued by the Group that will be settled other than by the exchange of a fixed amount of cash or other financial asset for a fixed number of the Group’s own equity instruments is classified as derivative financial liabilities.
F-27
On initial recognition, the derivative financial liabilities component of the convertible bonds is recognized at fair value, and the initial carrying amount of the component of non-derivative financial liabilities is determined by deducting the amount of derivative financial liabilities from the fair value of the hybrid instrument as a whole. In subsequent periods, the non-derivative financial liabilities component of the convertible bonds is measured at amortized cost using the effective interest method. The derivative financial liabilities component is measured at fair value and the changes in fair value are recognized in profit or loss.
Transaction costs that relate to the issue of the convertible bonds are allocated to the derivative financial liabilities component and the non-derivative financial liabilities component in proportion to their relative fair values. Transaction costs relating to the derivative financial liabilities component are recognized immediately in profit or loss. Transaction costs relating to the non-derivative financial liabilities component are included in the carrying amount of the liability component.
| Hedge Accounting |
The Group designates certain hedging instruments, which include derivatives, embedded derivatives and non-derivatives in respect of foreign currency risk, as either fair value hedges or cash flow hedges. At
| 1) | Fair value hedges |
Changes in the inceptionfair value of derivatives that are designated and qualify as fair value hedges are recognized in profit or loss immediately, together with any changes in the fair value of the hedge relationship,hedged asset or liability that are attributable to the Group documentshedged risk. The change in the relationship betweenfair value of the hedging instrument and the hedged item, along with its risk management objectives and its strategy for undertaking various hedge transactions. Furthermore, at the inception of the hedge and on an ongoing basis, the Group documents whether the hedging instrument is highly effectivechange in offsetting changes in fair values or cash flows of the hedged item attributable to the hedged risk.risk are recognized in profit or loss in the line item relating to the hedged item.
Before 2018, hedge accounting was discontinued prospectively when ASE and its subsidiaries revoked the designated hedging relationship; when the hedging instrument expired or was sold, terminated, or exercised; or when the hedging instrument no longer met the criteria for hedge accounting. From 2018, the Group discontinues hedge accounting only when the hedging relationship cease to meet the qualifying criteria; for instance, when the hedging instrument expires or is sold, terminated, or exercised.
| 2) | Cash flow hedges |
The effective portion of changes in the fair value of derivatives that are designated and qualify as cash flow hedges is recognized in other comprehensive income and accumulated under the heading of cash flow hedges.income. The gain or loss relating to the ineffective portion isare recognized immediately in profit or loss.
Amounts previouslyThe associated gains or losses that were recognized in other comprehensive income and accumulated in equity are reclassified from equity to profit or loss as a reclassification adjustment in the periodsline item relating to the hedged item in the same period when the hedged item affects profit or loss, in the same line as the recognized hedged item.loss. If a hedge of a forecastforecasted transaction subsequently results in the recognition of a non-financial asset or a non-financial liability, the associated gains and losses that were recognized in other comprehensive income are removed from equity and are included in the initial cost of the non-financial asset or non-financial liability.
HedgeBefore 2018, hedge accounting iswas discontinued prospectively when the Group revokesASE and its subsidiaries revoked the designated hedging relationship; when the hedging instrument expired or was sold, terminated, or exercised; or when the hedging instrument no longer met the criteria for hedge accounting. From 2018, the Group discontinues hedge accounting only when the hedging relationship orcease to meet the qualifying criteria; for instance, when the hedging instrument expires or is sold, terminated, or exercised, or when it no longer meets the criteria for hedge accounting.exercised. The cumulative gain or loss on the hedging instrumentsinstrument that has been previously recognized in other comprehensive income from the period when the hedge was effective remains separately in equity until the forecast transaction occurs. When a forecast transaction is no longer expected to occur, the gain or loss accumulated in equity is recognized immediately in profit or loss.
F-39
| Revenue |
2018
The Group identifies the contracts with customers, allocates transaction prices to performance obligations and, when performance obligations are satisfied, recognizes revenues at fixed amounts as agreed in the contracts with taking estimated volume discounts into consideration.
For contracts where the period between the date on which the Group transfers a promised good or service to a customer and the date on which the customer pays for that good or service is one year or less, the Group does not adjust the promised amount of consideration for the effects of a significant financing component.
Operating revenues
The Group’s operating revenues include revenues from sale of goods and services as well as sale and leasing of real estate properties.
When customers control goods as they are manufactured in progress, the Group measures progress on the basis of input incurred relative to the total input and recognizes revenues and contract assets over time. Those contract assets are then reclassified to trade receivables at the point at which they are invoiced to customers.
The Group recognizes revenues and trade receivables when the goods are shipped or the goods are delivered to the customers’ specific locations because it is the time when customers have full discretion over the manner of distribution and price to sell the goods, has the primary responsibility for sales to future customers, and bears the risks of obsolescence.
The revenues from sale of real estate properties are recognized when customers purchase real estate properties and complete the transfer procedures. The revenues from leasing real estate properties are recognized during leasing periods on the straight-line basis.
Prior to 2018
Revenueis measured at the fair value of the consideration received or receivable take into account of estimated customer returns, rebates and other similar allowances.
| 1) |
Revenue from the sale of goods and real estate properties is recognized when the goods and real estate properties are delivered and titles have passed, at the time all the following conditions are satisfied:
F-28
F-40
| The amount of revenue can be |
| It is probable that the economic benefits associated with the transaction will flow to |
| Thecosts incurred or to be incurred in respect of the transaction can be |
| 2) |
Service income is recognized when services are rendered.
| 3) |
Dividend income from investments and interest income from financial assets are recognized when they are probable that the economic benefits will flow to the GroupASE and its subsidiaries and the amount of income can be reliably measured. Interest income is accrued on a time basis, by reference to the principal outstanding and at the effective interest rate applicable.
| Leasing |
Leases are classified as finance leases whenever the terms of the lease transfer substantially all the risks and rewards of ownership to the lessee. All other leases are classified as operating leases.
The Group as lessor
Rental income from operating leases is recognized on a straight-line basis over the term of the relevant lease.
The Group as lessee
Assets held under finance leases are initially recognized as assets of the Group at their fair value at the inception of the lease or, if lower, at the present value of the minimum lease payments. The corresponding liability to the lessor is included in the consolidated balance sheets as a finance lease obligation.
Operating lease payments are recognized as expenses on a straight-line basis over the lease term.
| Borrowing |
Borrowing costs directly attributable to the acquisition, construction or production of qualifying assets are added to the cost of those assets, until such time as the assets are substantially ready for their intended use or sale.
Investment income earned on the temporary investment of specific borrowings pending their expenditure on qualifying assets is deducted from the borrowing costs eligible for capitalization.
Other than stated above, all other borrowing costs are recognized in profit or loss in the period in which they are incurred.
F-29
| Government grants |
Government grants are not recognized until there is reasonable assurance that the Group will comply with the conditions attaching to them and that the grants will be received.
F-41
Government grants are recognized in profit or loss on a systematic basis over the periods in which the Group recognizes as expenses the related costs for which the grants are intended to compensate. Specifically, government grants whose primary condition is that the Group should purchase, construct or otherwise acquire non-current assets are recognized as deferred revenue in the consolidated financial statements and transferred to profit or loss on a systematic and rational basis over the useful lives of the related assets.
Government grants that are receivable as compensation for expenses or losses already incurred or for the purpose of giving immediate financial support to the Group with no future related costs are recognized in profit or loss in the period in which they become receivable.
| Employee benefits |
| a) | Short-term employee benefits |
Liabilities recognized in respect of short-term employee benefits are measured at the undiscounted amount of the benefits expected to be paid in exchange for the related services.
| b) | Retirement |
Payments to defined contribution retirement benefit plans are recognized as expenses when employees have rendered services entitling them to the contributions.
Defined benefit costs (including service cost, net interest and remeasurement) under the defined benefit retirement benefit plans are determined using the projected unit credit method. Service cost (including current service cost and past service cost) and net interest on the net defined benefit liability (asset) are recognized as employee benefits expense in the period they occur. Remeasurement, comprising actuarial gains and losses and the return on plan assets (excluding interest), is recognized in other comprehensive income in the period in which they occur. Remeasurement recognized in other comprehensive income is reflected immediately in retained earnings and will not be reclassified to profit or loss.
Net defined benefit liability (asset) represents the actual deficit (surplus) in the Group’s defined benefit plan. Any surplus resulting from this calculation is limited to the present value of any refunds from the plans or reductions in future contributions to the plans.
| Employee share options |
Employee share options granted to employees are measured at theThe fair value at the grant date. The fair value determined atdate of the grant dateemployee share options is expensed on a straight-line basis over the vesting period, based on the Group'sGroup’s best estimate of the number of options that are expected to ultimately vest, with a corresponding increase in capital surplus - employee share options and non-controlling interests. It is recognized as an expense in full at the grant date if vesting immediately. The grant date of issued ordinary shares for cash which are reserved for employees is the date on which the number of shares that the employees purchase is confirmed.
At each balance sheet date, the Group reviews its estimate of the number of employee share options expected to vest. The impact of the revision of the original estimates is recognized in profit or loss such that the cumulative expense reflects the revised estimate, with a corresponding adjustment to the capital surplus - employee share options and non-controlling interests.
The grant by the Company of its equity instruments to the employees of a subsidiary under options is treated as a capital contribution. The fair value of employee services received under the arrangement is measured by reference to the grant-date fair value and is recognized over the vesting period as an addition to the investment in the subsidiary, with a corresponding credit to capital surplus - employee share options.
F-42
| Taxation |
Income tax expense represents the sum of the tax currently payable and deferred tax.
| 1) | Current tax |
According to the Income Tax Law of the R.O.C., an additional tax onof unappropriated earnings (excluding earnings from foreign consolidated subsidiaries) at a rate of 10% is expensedprovided for as income tax in the year the earnings arise and adjustedshareholders approve to the extent that distributions are approved by the shareholders in the following year.retain earnings.
F-30
Adjustments of prior years’ tax liabilities are added to or deducted from the current year’s tax provision.
| 2) | Deferred tax |
Deferred tax is recognized on temporary differences between the carrying amounts of assets and liabilities in the consolidated financial statements and the corresponding tax bases used in the computation of taxable profit. If a temporary difference arises from the initial recognition (other than in a business combination) of assets and liabilities in a transaction that affects neither the taxable profit nor the accounting profit, the resulting deferred tax asset or liability is not recognized. In addition, a deferred tax liability is not recognized on taxable temporary differences arising from the initial recognition of goodwill.
Deferred tax liabilities are generally recognized for all taxable temporary differences. Deferred tax assets are generally recognized for all deductible temporary differences, unused loss carry-forwardcarryforwards and unused tax credits for purchases of machinery and equipment to the extent that it is probable that taxable profits will be available against which those deductible temporary differences can be utilized.
Deferred tax liabilities are recognized for taxable temporary differences associated with investments in subsidiaries and associates, except where the Group is able to control the reversal of the temporary differences and it is probable that the temporary differencesdifference will not reverse in the foreseeable future. Deferred tax assets arising from deductible temporary difference associated with such investments and interests are only recognized to the extent that it is probable that there will be sufficient taxable profits against which to utilize the benefits of the temporary differences and they are expected to reverse in the foreseeable future.
The carrying amountsamount of deferred tax assets is reviewed at each balance sheet date and reduced to the extent that it is no longer probable that sufficient taxable profits will be available to allow all or part of deferred taxthe assets to be utilized.recovered. A previously unrecognized deferred tax asset is also reviewed at each balance sheet date and recognized to the extent that it has become probable that future taxable profit will allow the deferred tax asset to be recovered.
Deferred tax assetsliabilities and liabilitiesassets are measured at the tax rates that are expected to apply in the period in which the liabilities are settled or assets are realized, based on tax rates (and tax laws) that have been enacted or substantively enacted by the liabilities are settled.balance sheet date. The measurement of deferred tax assetsliabilities and liabilitiesassets reflects the tax consequences that would follow from the manner in which the Group expects, at the balance sheet date, to recover or settle the carrying amountsamount of its assets and liabilities.
| 3) | Current and deferred tax for the year |
Current and deferred tax are recognized in profit or loss, except when they relate to items that are recognized in other comprehensive income or directly in equity, in which case, the current and deferred tax are also recognized in other comprehensive income or directly in equity, respectively.
Where current tax or deferred tax arises from the initial accounting for a business combination, the tax effect is included in the accounting for the business combination.
F-43
| U.S. Dollar Amounts |
A translation of the consolidated financial statements into U.S. dollars is included solely for the convenience of the readers, and has been translated from New Taiwan dollar (NT$) at the exchange rate as set forth in the statistical release by the U.S. Federal Reserve Board of the United States, which was NT$32.7930.61 to US$1.00 as of December 31, 2015.2018. The translation should not be construed as a representation that the NT$ amounts have been, could have been, or could in the future be, converted into U.S. dollars at this or any other rate of exchange.
| 5. | CRITICAL ACCOUNTING JUDGMENTS AND KEY SOURCES OF ESTIMATION UNCERTAINTY |
In the application of the Group’s accounting policies, which are described in Note 4, management is required to make judgments, estimates and assumptions about the carrying amounts of assets and liabilities that are not readily apparent from other sources. The estimates and underlying assumptions are based on historical experience and other factors that are considered to be relevant. Actual results may differ from these estimates.
F-31
The estimates and underlying assumptions are reviewed on an ongoing basis. Revisions to accounting estimates are recognized in the period in which the estimate is revised if the revision affects only that period, or in the period of the revision and future periods if the revision affects both current and future periods.
ImpairmentAcquisition of Goodwillsubsidiaries
Determining whether goodwill is impaired requires an estimationAfter the acquisition of a subsidiary, the Group should identify the difference between the investment cost and the Group’ share of the net fair value in use of the cash-generating unitssubsidiary’s identifiable assets acquired and liabilities assumed. It involves critical judgments and estimations when determining the aforementioned net fair values. The management engaged independent external appraiser to which goodwill has been allocated. The valueassist them in use calculation requires management to estimateidentifying and evaluating the futuresubsidiary’s identifiable tangible assets, intangible assets and liabilities, including the type of intangible assets that may be identified and the related estimated cash flows expected to ariseor the relief from cash-generating units and suitable discount rates in order to calculate its present value. Whenexpenses. The excess of the actual future cash flows are less than expected, a material impairment loss may arise.
Impairmentfair value over the carrying amount of Tangible and Intangible Assets Other than Goodwill
In evaluating the impairment ofthose identified tangible and intangible assets other than goodwill,on the Group is required to make subjective judgments in determining the independent cash flows,acquisition date will be depreciated or amortized over their remaining useful lives or expected future revenueeconomic benefit lives. The management considered that the related estimation and expensesassumption has appropriately reflected the net fair value of those identifiable assets acquired and liabilities assumed. However, there may be of high uncertainty related to the specific asset groups with the consideration of its usage patterns and the nature of semiconductor industry. Any changes in these estimates based on changedindustry varied by economic conditions or business strategies could result in significant impairment charges in future periods.trends.
Valuation of Inventory
| 6. | CASH AND CASH EQUIVALENTS |
Inventories are stated at the lower of cost or net realizable value and the net realizable value of inventory at balance sheet date is determined based on Group’s judgments and estimates.
Due to the rapid technology changes, the Group estimates the net realizable value of inventory for obsolescent and unmarketable items at balance sheet date and then writes down the cost of inventories to net realizable value. There may be significant changes in the net realizable value of inventories due to assumptions of future demand within a specific time period.
Income Taxes
The realizability of deferred tax assets mainly depends on whether sufficient future profits or taxable temporary differences will be available. In cases where the actual future profits generated are less than expected, a material reversal of deferred tax assets may arise, which would be recognized in profit or loss for the period in which such a reversal takes place.
Recognition and Measurement of Defined Benefit Plans
Accrued pension liabilities and the resulting pension expenses under defined benefit pension plans are calculated using the Projected Unit Credit Method. Actuarial assumptions comprise discount rates and expected rates of salary increase. Changes in economic circumstances and market conditions will affect these assumptions and may have a material impact on the amount of the expense and the liability.
Fair value measurements and valuation processes
As disclosed in Note 31, the Group’s management uses its judgments applying appropriate valuation techniques commonly applied by market practitioners. The assumptions applied are based on observable quoted market prices, foreign exchange rates and interest rates to the extent it is available. The fair value of unquoted equity instruments is estimated based on the assumptions supported by unobservable market prices and interest rates which are disclosed in Note 31. The Group’s management believes that the valuation techniques and the assumptions applied are appropriate in determining the fair value of financial instruments.
| December 31 | ||||||||||||
| 2017 | 2018 | |||||||||||
| NT$ | NT$ | US$ (Note 4) | ||||||||||
| Cash on hand | $ | 8,404 | $ | 7,940 | $ | 259 | ||||||
| Checking accounts and demand deposits | 39,697,319 | 32,329,820 | 1,056,185 | |||||||||
| Cash equivalents | 6,372,343 | 19,180,676 | 626,615 | |||||||||
| $ | 46,078,066 | $ | 51,518,436 | $ | 1,683,059 | |||||||
F-32F-44
| December 31 | ||||||||||||
| 2014 | 2015 | |||||||||||
| NT$ | NT$ | US$ (Note 4) | ||||||||||
| Cash on hand | $ | 9,953 | $ | 8,806 | $ | 269 | ||||||
| Checking accounts and demand deposits | 43,059,911 | 50,291,823 | 1,533,755 | |||||||||
| Cash equivalent | 8,624,546 | 4,950,552 | 150,977 | |||||||||
| $ | 51,694,410 | $ | 55,251,181 | $ | 1,685,001 | |||||||
Cash equivalents include time deposits that are of a short maturity of three months or less from the date of acquisitions, and are highly liquid, readily convertible to known amounts in cash and the risk of changes in values is insignificant. Cash equivalents are held for the purpose of meeting short-term cash commitments rather than for investments or other purposes.
| FINANCIAL INSTRUMENTS AT FAIR VALUE THROUGH PROFIT OR LOSS |
| December 31 | December 31 | |||||||||||||||||||||||
| 2014 | 2015 | 2017 | 2018 | |||||||||||||||||||||
| NT$ | NT$ | US$ (Note 4) | NT$ | NT$ | US$ (Note 4) | |||||||||||||||||||
| Financial assets designated as at FVTPL | ||||||||||||||||||||||||
| Structured time deposits | $ | 2,376,050 | $ | 1,646,357 | $ | 50,209 | ||||||||||||||||||
| Private-placement convertible bonds | $ | 100,496 | $ | - | $ | - | ||||||||||||||||||
| Financial assets held for trading | ||||||||||||||||||||||||
| Quoted ordinary shares | $ | 4,410,732 | $ | - | $ | - | ||||||||||||||||||
| Open-end mutual funds | 589,976 | - | - | |||||||||||||||||||||
| Forward exchange contracts | 61,325 | - | - | |||||||||||||||||||||
| Swap contracts | 60,538 | - | - | |||||||||||||||||||||
| 5,122,571 | - | - | ||||||||||||||||||||||
Financial assets mandatorily classified as at FVTPL | ||||||||||||||||||||||||
| Derivative instruments (non-designated hedges) | ||||||||||||||||||||||||
| Swap contracts | - | 1,557,714 | 50,889 | |||||||||||||||||||||
| Forward exchange contracts | - | 32,070 | 1,048 | |||||||||||||||||||||
| Non-derivative financial assets | ||||||||||||||||||||||||
| Quoted ordinary shares | - | 5,151,255 | 168,287 | |||||||||||||||||||||
| Open-end mutual funds | - | 581,800 | 19,007 | |||||||||||||||||||||
| Unquoted preferred shares | - | 275,000 | 8,984 | |||||||||||||||||||||
| Private-placement funds | - | 200,123 | 6,537 | |||||||||||||||||||||
| Hybrid financial assets | ||||||||||||||||||||||||
| Private-placement convertible bonds | 100,500 | 100,500 | 3,065 | - | 100,496 | 3,283 | ||||||||||||||||||
| - | 7,898,458 | 258,035 | ||||||||||||||||||||||
| 2,476,550 | 1,746,857 | 53,274 | 5,223,067 | 7,898,458 | 258,035 | |||||||||||||||||||
| Current | 5,223,067 | 7,262,227 | 237,250 | |||||||||||||||||||||
| �� | ||||||||||||||||||||||||
| Financial assets held for trading | ||||||||||||||||||||||||
| Swap contracts | 1,907,705 | 1,452,611 | 44,301 | |||||||||||||||||||||
| Open-end mutual funds | 533,425 | 573,242 | 17,482 | |||||||||||||||||||||
| Quoted shares | 43,352 | 37,058 | 1,130 | |||||||||||||||||||||
| Forward exchange contracts | 27,811 | 18,913 | 577 | |||||||||||||||||||||
| Foreign currency option contracts | - | 5,020 | 153 | |||||||||||||||||||||
| 2,512,293 | 2,086,844 | 63,643 | ||||||||||||||||||||||
| $ | 4,988,843 | $ | 3,833,701 | $ | 116,917 | |||||||||||||||||||
| Financial liabilities held for trading | ||||||||||||||||||||||||
| Conversion option, redemption option and put option of convertible bonds (Note 18) | $ | 2,520,606 | $ | 2,632,565 | $ | 80,286 | ||||||||||||||||||
| Swap contracts | 99,165 | 290,176 | 8,849 | |||||||||||||||||||||
| Forward exchange contracts | 31,581 | 69,207 | 2,111 | |||||||||||||||||||||
| Foreign currency option contracts | - | 13,659 | 416 | |||||||||||||||||||||
| Interest rate swap contracts | - | 119 | 4 | |||||||||||||||||||||
| $ | 2,651,352 | $ | 3,005,726 | $ | 91,666 | |||||||||||||||||||
| Non-current | $ | - | $ | 636,231 | $ | 20,785 | ||||||||||||||||||
F-33
| December 31 | ||||||||||||
| 2017 | 2018 | |||||||||||
| NT$ | NT$ | US$ (Note 4) | ||||||||||
| Financial liabilities held for trading | ||||||||||||
| Derivative instruments (non-designated hedging) | ||||||||||||
| Swap contracts | $ | 652,107 | $ | 29,058 | $ | 949 | ||||||
| Forward exchange contracts | 25,323 | 7,597 | 248 | |||||||||
| $ | 677,430 | $ | 36,655 | $ | 1,197 | |||||||
(Concluded)
The Group invested in structured time deposits and inGroup’s private-placement convertible bonds and all included embedded derivative instruments which arewere not closely related to the host contracts. The Groupcontracts and the contracts were designated the entire contracts as financial assets at FVTPL on initial recognition.recognition under IAS 39. After application of IFRS 9, the entire contracts are assessed and classified mandatorily as at FVTPL since they contain host contracts that are assets within the scope of IFRS 9.
At each balance sheet date, the outstanding swap contracts not accounted for hedge accounting were as follows:
F-45
| Notional Amount | ||||
| Currency | Maturity Period | (In Thousands) | ||
| December 31, | ||||
| Sell NT$/Buy US$ | NT$ | |||
| Sell US$/Buy CNY | 2018.01 | US$52,948/CNY349,800 | ||
| Sell US$/Buy JPY | 2018.02-2018.03 | US$70,324/JPY7,870,000 | ||
| Sell US$/Buy NT$ | US$ | |||
| December 31, | ||||
| Sell NT$/Buy US$ | NT$ | |||
| Sell US$/Buy CNY | US$ | |||
| Sell US$/Buy JPY | US$ | |||
| Sell US$/Buy NT$ | US$ |
At each balance sheet date, the outstanding forward exchange contracts not accounted for hedge accounting were as follow:follows:
| Notional Amount | ||||
| Currency | Maturity Period | (In Thousands) | ||
| December 31, | ||||
| Sell NT$/Buy US$ | NT$ | |||
| Sell US$/Buy CNY | US$ | |||
| Sell US$/Buy EUR | 2018.01 | US$10,674/EUR9,000 | ||
| Sell US$/Buy JPY | US$ | |||
| Sell US$/Buy MYR | US$ | |||
| Sell US$/Buy NT$ | US$ | |||
| Sell US$/Buy SGD | US$ |
F-34
At each balance sheet date, the outstanding foreign currency option contracts not accounted for hedge accounting were as follows:
At each balance sheet date, the outstanding interest rate swap contracts not accounted for hedge accounting were as follows:
| ||||||
| Notional Amount | ||||||
| December 31, 2018 | Maturity Period | (In Thousands) | ||||
| 2019.01-2019.02 | NT$ | |||||
| Sell US$/Buy CNY | ||||||
| Sell US$/Buy EUR | 2019.01 | US$4,103/EUR3,600 | ||||
| Sell US$/Buy JPY | 2019.01-2019.02 | US$37,733/JPY4,231,754 | ||||
| Sell US$/Buy MYR | 2019.01-2019.02 | US$14,000/MYR58,430 | ||||
| Sell US$/Buy SGD | 2019.01-2019.02 | US$13,400/SGD18,391 |
(Concluded)
| 8. |
| December 31 | ||||||||||||
| 2014 | 2015 | |||||||||||
| NT$ | NT$ | US$ (Note 4) | ||||||||||
| Limited partnership | $ | 555,361 | $ | 476,612 | $ | 14,535 | ||||||
| Unquoted ordinary shares | 211,726 | 249,217 | 7,600 | |||||||||
| Quoted ordinary shares | 195,070 | 197,580 | 6,026 | |||||||||
| Open-end mutual funds | 1,500,434 | 16,037 | 489 | |||||||||
| Unquoted preferred shares | 11,779 | 15,260 | 465 | |||||||||
| 2,474,370 | 954,706 | 29,115 | ||||||||||
| Current | 1,533,265 | 30,344 | 925 | |||||||||
| Non-current | $ | 941,105 | $ | 924,362 | $ | 28,190 | ||||||
| December 31 | ||||||||||||
| 2014 | 2015 | |||||||||||
| NT$ | NT$ | US$ (Note 4) | ||||||||||
| Trade receivables | $ | 53,004,955 | $ | 45,014,393 | $ | 1,372,808 | ||||||
| Less: Allowance for doubtful debts | 84,145 | 82,906 | 2,528 | |||||||||
| Trade receivables, net | $ | 52,920,810 | $ | 44,931,487 | $ | 1,370,280 | ||||||
| December 31, 2018 | ||||||||
| NT$ | US$ (Note 4) | |||||||
| Investments in equity instruments at FVTOCI | $ | 580,399 | $ | 18,961 | ||||
| Investments in debt instruments at FVTOCI | 1,016,924 | 33,222 | ||||||
| $ | 1,597,323 | $ | 52,183 | |||||
F-35F-46
| a. | Investments in equity instruments at FVTOCI |
| December 31, 2018 | ||||||||
| NT$ | US$ (Note 4) | |||||||
| Unquoted ordinary shares | $ | 532,047 | $ | 17,381 | ||||
| Limited partnership | 39,669 | 1,296 | ||||||
| Unquoted preferred shares | 8,683 | 284 | ||||||
| $ | 580,399 | $ | 18,961 | |||||
Investments in equity instruments were classified as available-for-sale under IAS 39. Refer to Notes 3 and 10 for information relating to their reclassification and comparative information for prior periods.
| b. | Investments in debt instruments at FVTOCI |
| December 31, 2018 | ||||||||
| NT$ | US$ (Note 4) | |||||||
| Unsecured subordinate corporate bonds | $ | 1,016,924 | $ | 33,222 | ||||
In June 2016, the Group acquired 1,000 units of perpetual unsecured subordinate corporate bonds in the amount of NT$1,000,000 thousand. The corporate bonds are all in denomination of NT$1,000 thousand with annual interest rate at 3.5% and with effective interest rate at 3.2% as of December 31, 2017 and 2018. The bonds were classified as other financial assets-non-current under IAS 39. Refer to Notes 3 and 14 for information relating to its reclassification and comparative information for prior periods.
| 9. | CREDIT RISK MANAGEMENT FOR INVESTMENTS IN DEBT INSTRUMENTS- 2018 |
The Group’s investment in unsecured subordinate corporate bonds is rated the equivalent of investment grade or higher and has low credit risk for the purpose of impairment assessment.
There was no significant increase in credit risk of such debt instrument since initial recognition leading to changes in interest rates and terms, and there was also no significant change in bond issuer’s operation affecting the ability performing debt obligation. We evaluated that no expected credit losses existed. The Group reviews changes in bond yields and other public information periodically and makes an assessment whether there has been a significant increase in lifetime ECL since initial recognition.
| 10. | AVAILABLE-FOR-SALE FINANCIAL ASSETS - 2017 |
| December 31, 2017 | ||||
| NT$ | ||||
| Unquoted ordinary shares | $ | 605,110 | ||
| Quoted ordinary shares | 279,791 | |||
| Limited partnership | 246,072 | |||
| Unquoted preferred shares | 57,367 | |||
| Open-end mutual funds | 23,825 | |||
| 1,212,165 | ||||
| Current | 89,159 | |||
| Non-current | $ | 1,123,006 | ||
F-47
| 11. | TRADE RECEIVABLES, NET |
| December 31 | ||||||||||||
| 2017 | 2018 | |||||||||||
| NT$ | NT$ | US$ (Note 4) | ||||||||||
| At amortized cost | ||||||||||||
| Gross carrying amount | $ | 55,265,607 | $ | 79,636,748 | $ | 2,601,658 | ||||||
| Less: Allowance for impairment loss | 64,901 | 155,389 | 5,077 | |||||||||
| $ | 55,200,706 | $ | 79,481,359 | $ | 2,596,581 | |||||||
| a. |
The Group’s average credit terms were 30 to 90 days. The Group evaluates the risk and probability of credit loss by reference to the Group’s past experiences, financial condition of each customer, as well as general economic conditions, competitive advantage and future development of the industry in which the customer operates. The Group then reviews the recoverable amount of each individual trade receivable at each balance sheet date to ensure that adequate allowance is made for possible irrecoverable amounts. In this regard, management believes the Group’s credit risk was significantly reduced. In addition, the Group applies the simplified approach to providing for expected credit losses prescribed by IFRS 9, which permits the use of lifetime expected loss provision for all trade receivables. The expected credit losses on trade receivables are estimated using a provision matrix by reference to past default experience of the debtor and an analysis of the debtor’s current financial position, adjusted for general economic conditions of the industry in which the debtors operate and an assessment of both the current as well as the forecast direction of economic conditions at each balance sheet date.
The Group writes off a trade receivable when there is information indicating that the debtor is in severe financial difficulty and there is no realistic prospect of recovery. For trade receivables that have been written off, the Group continues to engage in enforcement activity to attempt to recover the receivables due. Where recoveries are made, these are recognized in profit or loss.
The following table details the loss allowance of trade receivables based on the Group’s provision matrix.
December 31, 2018
| Not Past Due | Overdue 1 to 30 days | Overdue 31 to 90 Days | Overdue Over 91 Days | Individually Impaired | Total | |||||||||||||||||||
| NT$ | NT$ | NT$ | NT$ | NT$ | NT$ | |||||||||||||||||||
| Expected credit loss rate | 0 | % | 0~10% | 0~50% | 1~100% | 0~100% | - | |||||||||||||||||
| Gross carrying amount | $ | 71,819,583 | $ | 6,537,819 | $ | 778,799 | $ | 405,707 | $ | 94,840 | $ | 79,636,748 | ||||||||||||
| Loss allowance (Lifetime ECL) | (7,119 | ) | (4,463 | ) | (14,949 | ) | (40,080 | ) | (88,778 | ) | (155,389 | ) | ||||||||||||
| Amortized cost | $ | 71,812,464 | $ | 6,533,356 | $ | 763,850 | $ | 365,627 | $ | 6,062 | $ | 79,481,359 | ||||||||||||
| Not Past Due | Overdue 1 to 30 days | Overdue 31 to 90 Days | Overdue Over 91 Days | Individually Impaired | Total | |||||||||||||||||||
| US$ (Note 4) | US$ (Note 4) | US$ (Note 4) | US$ (Note 4) | �� | US$ (Note 4) | US$ (Note 4) | ||||||||||||||||||
| Expected credit loss rate | 0 | % | 0~10% | 0~50% | 1~100% | 0~100% | - | |||||||||||||||||
| Gross carrying amount | $ | 2,346,278 | $ | 213,585 | $ | 25,443 | $ | 13,254 | $ | 3,098 | $ | 2,601,658 | ||||||||||||
| Loss allowance (Lifetime ECL) | (233 | ) | (147 | ) | (488 | ) | (1,309 | ) | (2,900 | ) | (5,077 | ) | ||||||||||||
| Amortized cost | $ | 2,346,045 | $ | 213,438 | $ | 24,955 | $ | 11,945 | $ | 198 | $ | 2,596,581 | ||||||||||||
F-48
The movements of the loss allowance of trade receivables were as follows:
For the Year Ended December 31, 2018 | ||||||||
| NT$ | US$ (Note 4) | |||||||
| Balance at January 1, 2018 | $ | 64,901 | $ | 2,120 | ||||
| Net remeasurement of loss allowance | 150,128 | 4,905 | ||||||
| Acquisition through business combinations | 3,482 | 114 | ||||||
| Amounts written off | (60,109 | ) | (1,964 | ) | ||||
| Effects of foreign currency exchange differences | (3,013 | ) | (98 | ) | ||||
| Balance at December 31, 2018 | $ | 155,389 | $ | 5,077 | ||||
| b. | For the year ended December 31, 2017 |
The credit term that ASE and its subsidiaries applied in 2017 was identical with that applied by the Group in 2018. Allowance for doubtful debts is assessed by reference to the collectability of receivables by evaluating the account aging, historical experience and current financial condition of customers.
As of December 31, 2014 and 2015, except that the Group’s five largest customers accounted for 30% and 26% of accounts receivable, respectively, the concentration of credit risk is insignificant for the remaining accounts receivable.
Aging of receivables
| December 31 | ||||||||||||
| 2014 | 2015 | |||||||||||
| NT$ | NT$ | US$ (Note 4) | ||||||||||
| Not past due | $ | 47,387,888 | $ | 40,409,227 | $ | 1,232,364 | ||||||
| 1 to 30 days | 5,222,943 | 3,901,300 | 118,978 | |||||||||
| 31 to 90 days | 306,052 | 495,664 | 15,116 | |||||||||
| More than 91 days | 88,072 | 208,202 | 6,350 | |||||||||
| Total | $ | 53,004,955 | $ | 45,014,393 | $ | 1,372,808 | ||||||
The above aging schedule was based on the past due date.date
| December 31, 2017 | ||||
| NT$ | ||||
| Not past due | $ | 49,599,512 | ||
| 1 to 30 days | 4,986,491 | |||
| 31 to 90 days | 562,200 | |||
| More than 91 days | 117,404 | |||
| $ | 55,265,607 | |||
AgeAging of receivables that arewere past due but not impaired
| December 31 | ||||||||||||
| 2014 | 2015 | |||||||||||
| NT$ | NT$ | US$ (Note 4) | ||||||||||
| Less than 30 days | $ | 5,191,521 | $ | 3,086,796 | $ | 94,138 | ||||||
| 31 to 90 days | 131,247 | 344,265 | 10,499 | |||||||||
| More than 91 days | 1,407 | - | - | |||||||||
| Total | $ | 5,324,175 | $ | 3,431,061 | $ | 104,637 | ||||||
The above aging schedule was based on the past due date.
| December 31, 2017 | ||||
| NT$ | ||||
| 1 to 30 days | $ | 4,942,677 | ||
| 31 to 90 days | 378,526 | |||
| $ | 5,321,203 | |||
Except for those impaired, the GroupASE and its subsidiaries had not provided an allowance for doubtful debts on trade receivables at each balance sheet date since there has not been a significant change in credit quality and the amounts were still considered collectible. The GroupASE and its subsidiaries did not hold any collateral or other credit enhancements over these balances nor did it have a legal right to offset against any amounts owed by the GroupASE and its subsidiaries to counterparties.
Movement of the allowance for doubtful trade receivables
Impaired Individually | Impaired Collectively | Total | ||||||||||
| NT$ | NT$ | NT$ | ||||||||||
| Balance at January 1, 2013 | $ | 34,225 | $ | 45,912 | $ | 80,137 | ||||||
| Impairment losses reversed | (5,860 | ) | (4,033 | ) | (9,893 | ) | ||||||
| Amount written off during the period as uncollectible | - | (757 | ) | (757 | ) | |||||||
(Continued)
F-36F-49
Impaired Individually | Impaired Collectively | Total | ||||||||||
| NT$ | NT$ | NT$ | ||||||||||
| Effect of foreign currency exchange | $ | (1,480 | ) | $ | 113 | $ | (1,367 | ) | ||||
| Balance at December 31, 2013 | $ | 26,885 | $ | 41,235 | $ | 68,120 | ||||||
| Balance at January 1, 2014 | $ | 26,885 | $ | 41,235 | $ | 68,120 | ||||||
| Impairment losses recognized | 2,875 | 15,156 | 18,031 | |||||||||
| Amount written off during the period as uncollectible | (891 | ) | (917 | ) | (1,808 | ) | ||||||
| Effect of foreign currency exchange | (564 | ) | 366 | (198 | ) | |||||||
| Balance at December 31, 2014 | $ | 28,305 | $ | 55,840 | $ | 84,145 | ||||||
| Balance at January 1, 2015 | $ | 28,305 | $ | 55,840 | $ | 84,145 | ||||||
| Impairment losses recognized (reversed) | 18,816 | (10,584 | ) | 8,232 | ||||||||
| Amount written off during the period as uncollectible | (7,617 | ) | (209 | ) | (7,826 | ) | ||||||
| Effect of foreign currency exchange | (458 | ) | (1,187 | ) | (1,645 | ) | ||||||
| Balance at December 31, 2015 | $ | 39,046 | $ | 43,860 | $ | 82,906 | ||||||
(Concluded)
Impaired Individually | Impaired Collectively | Total | ||||||||||
| US$ (Note 4) | US$ (Note 4) | US$ (Note 4) | ||||||||||
| Balance at January 1, 2015 | $ | 863 | $ | 1,703 | $ | 2,566 | ||||||
| Impairment losses recognized (reversed) | 574 | (323 | ) | 251 | ||||||||
| Amount written off during the period as uncollectible | (232 | ) | (7 | ) | (239 | ) | ||||||
| Effect of foreign currency exchange | (14 | ) | (36 | ) | (50 | ) | ||||||
| Balance at December 31, 2015 | $ | 1,191 | $ | 1,337 | $ | 2,528 | ||||||
Impaired Individually | Impaired Collectively | Total | ||||||||||
| NT$ | NT$ | NT$ | ||||||||||
| Balance at January 1, 2016 | $ | 39,046 | $ | 43,860 | $ | 82,906 | ||||||
| Impairment losses reversed | (21,501 | ) | (6,521 | ) | (28,022 | ) | ||||||
| Effect of foreign currency exchange differences | (1,092 | ) | (83 | ) | (1,175 | ) | ||||||
| Balance at December 31, 2016 | 16,453 | 37,256 | 53,709 | |||||||||
| Impairment losses recognized | 9,527 | 4,102 | 13,629 | |||||||||
| Amounts written off | - | (34 | ) | (34 | ) | |||||||
| Effect of foreign currency exchange differences | (850 | ) | (1,553 | ) | (2,403 | ) | ||||||
| Balance at December 31, 2017 | $ | 25,130 | $ | 39,771 | $ | 64,901 | ||||||
Factored trade receivables of the Company were as follows:
| Counterparties | Receivables Sold (In Thousands) | Amounts Collected (In Thousands) | Advances Received At Year-end (In Thousands) | Interest Rates on Advances Received (%) | Credit Line (In Thousands) | |||||||||||||||
| Year ended December 31, 2014 | ||||||||||||||||||||
| Citi bank | US$ | 103,744 | US$ | 103,744 | — | — | US$ | 92,000 | ||||||||||||
| Year ended December 31, 2015 | ||||||||||||||||||||
| Citi bank | US$ | 78,804 | US$ | 36,955 | US$ | 41,849 | 1.30 | % | US$ | 92,000 | ||||||||||
Pursuant to the factoring agreement, losses from commercial disputes (such as sales returns and discounts) should be borne by the Company, while losses from credit risk should be borne by the banks. The Company also issued promissory notes to the banks for commercial disputes which remained undrawn since. The promissory notes both amounted to US$5,000 thousand as of December 31, 2014 and 2015, respectively. As of December 31, 2015, there was no significant loss from commercial disputes in the past and the Company does not expect any significant commercial dispute loss in the foreseeable future.
F-37
| INVENTORIES |
| December 31 | December 31 | |||||||||||||||||||||||
| 2014 | 2015 | 2017 | 2018 | |||||||||||||||||||||
| NT$ | NT$ | US$ (Note 4) | NT$ | NT$ | US$ (Note 4) | |||||||||||||||||||
| Finished goods | $ | 6,568,459 | $ | 10,012,182 | $ | 305,343 | $ | 6,740,816 | $ | 7,680,083 | $ | 250,901 | ||||||||||||
| Work in process | 2,064,377 | 1,692,346 | 51,612 | 3,452,332 | 3,195,478 | 104,393 | ||||||||||||||||||
| Raw materials | 10,155,006 | 9,672,894 | 294,995 | 12,625,502 | 23,250,801 | 759,582 | ||||||||||||||||||
| Supplies | 797,353 | 852,251 | 25,991 | 894,196 | 1,892,194 | 61,816 | ||||||||||||||||||
| Raw materials and supplies in transit | 577,898 | 1,028,606 | 31,369 | 548,065 | 608,895 | 19,892 | ||||||||||||||||||
| $ | 24,260,911 | $ | 36,627,451 | $ | 1,196,584 | |||||||||||||||||||
| $ | 20,163,093 | $ | 23,258,279 | $ | 709,310 | |||||||||||||||||||
The cost of inventories recognized as operating costs for the years ended December 31, 2013, 20142016, 2017 and 20152018 were NT$176,637,295219,630,270 thousand, NT$202,960,428237,193,286 thousand and NT$233,165,722309,020,850 thousand (US$7,110,87910,095,421 thousand), respectively, which included write-downs of inventories at NT$453,468451,780 thousand, NT$601,726398,824 thousand and NT$352,011980,927 thousand (US$10,73532,046 thousand), respectively.
| INVENTORIES RELATED TO REAL ESTATE BUSINESS |
| December 31 | December 31 | |||||||||||||||||||||||
| 2014 | 2015 | 2017 | 2018 | |||||||||||||||||||||
| NT$ | NT$ | US$ (Note 4) | NT$ | NT$ | US$ (Note 4) | |||||||||||||||||||
| Land and buildings held for sale | $ | 5,558 | $ | 5,431 | $ | 166 | $ | 25,825 | $ | 20,734 | $ | 677 | ||||||||||||
| Construction in progress (Note 16) | 22,242,065 | 23,956,678 | 730,609 | |||||||||||||||||||||
| Construction in progress | 8,106,166 | 8,252,348 | 269,597 | |||||||||||||||||||||
| Land held for construction | 1,738,855 | 1,751,429 | 53,413 | 1,687,525 | 1,787,526 | 58,397 | ||||||||||||||||||
| $ | 9,819,516 | $ | 10,060,608 | $ | 328,671 | |||||||||||||||||||
| $ | 23,986,478 | $ | 25,713,538 | $ | 784,188 | |||||||||||||||||||
Land and buildings held for sale located in Shanghai Zhangjiang was completed and successively sold. Construction in progress is mainly located on Caobao Road and Hutai Road in Shanghai, China and Lidu Road and Xinhong Road in Kun Shan, China. The capitalized borrowing costs for the years ended December 31, 2013, 20142016, 2017 and 2015 is2018 are disclosed in Note 22.26.
Construction in progress located on Caobao Road in Shanghai, China was completed in the third quarter of 2017 and immediately leased out for the lease business. As a result, the Group reclassified those buildings and land use right under the line item of inventories related to real estate business to investment properties of NT$6,971,372 thousand and long-term prepayments for lease of NT$5,798,449 thousand, respectively.
F-50
As of December 31, 20142017 and 2015,2018, inventories related to real estate business of NT$23,697,3399,818,869 thousand and NT$24,837,046 thousand(US$757,45810,060,608 thousand (US$328,671 thousand), respectively, are expected to be recovered longer than twelve months.
Refer to Note 3338 for the carrying amount of inventories related to real estate business that had been pledged by the Group to secure bank borrowings.
F-38
| OTHER FINANCIAL ASSETS |
| December 31 | ||||||||||||
| 2017 | 2018 | |||||||||||
| NT$ | NT$ | US$ (Note 4) | ||||||||||
Time deposits with original maturity of over three months | $ | 405,520 | $ | 6,320,669 | $ | 206,490 | ||||||
| Guarantee deposits | 170,594 | 766,190 | 25,031 | |||||||||
| Pledged time deposits (Note 38) | 59,456 | 496,847 | 16,231 | |||||||||
Unsecured subordinate corporate bonds (Notes 8 and 9) | 1,000,000 | - | - | |||||||||
| Others (Note 38) | 7,270 | 55 | 2 | |||||||||
| 1,642,840 | 7,583,761 | 247,754 | ||||||||||
| Current | 472,340 | 6,539,467 | 213,638 | |||||||||
| Non-current | $ | 1,170,500 | $ | 1,044,294 | $ | 34,116 | ||||||
| 15. | INVESTMENTS ACCOUNTED FOR USING THE EQUITY METHOD |
| December 31 | December 31 | |||||||||||||||||||||||
| 2014 | 2015 | 2017 | 2018 | |||||||||||||||||||||
| NT$ | NT$ | US$ (Note 4) | NT$ | NT$ | US$ (Note 4) | |||||||||||||||||||
| Investments in associates | $ | 1,468,242 | $ | 36,789,760 | $ | 1,121,981 | $ | 48,267,237 | $ | 9,131,814 | $ | 298,328 | ||||||||||||
| Investments in joint ventures | - | 613,841 | 18,720 | |||||||||||||||||||||
| Investments in joint venture | 486,514 | 180,494 | 5,896 | |||||||||||||||||||||
| $ | 1,468,242 | $ | 37,403,601 | $ | 1,140,701 | $ | 48,753,751 | $ | 9,312,308 | $ | 304,224 | |||||||||||||
| a. | Investments in associates |
| 1) | Investments in associates accounted for using the equity method consisted of the following: |
| Carrying Amount as of December 31 | Carrying Amount as of December 31 | |||||||||||||||||||||||||||||||
| 2014 | 2015 | 2017 | 2018 | |||||||||||||||||||||||||||||
| NT$ | NT$ | US$ | Operating | NT$ | NT$ | US$ (Note 4) | ||||||||||||||||||||||||||
| Name of Associate | Main Business | Operating Location | (Note 4) | Main Business | Location | |||||||||||||||||||||||||||
| Material associate | ||||||||||||||||||||||||||||||||
| Siliconware Precision Industries Co., Ltd. (“SPIL”) | Engaged in assembly, testing and turnkey services of integrated circuits | ROC | $ | - | $ | 35,423,058 | $ | 1,080,301 | ||||||||||||||||||||||||
| SPIL | Engaged in the assembly, testing and turnkey services of integrated circuits | R.O.C. | $ | 45,210,371 | $ | - | $ | - | ||||||||||||||||||||||||
| Associates that are not individually material | ||||||||||||||||||||||||||||||||
| Deca Technologies Inc. (”DECA”) | Holding company and the group engaged in manufacturing, development and marketing of wafer level packaging and interconnect technology | British Cayman Islands | 1,583,124 | 866,312 | 28,302 | |||||||||||||||||||||||||||
| Hung Ching Development & Construction Co. (“HC”) | Engaged in the development, construction and leasing of real estate properties | ROC | 1,327,201 | 1,294,191 | 39,469 | Engaged in the development, construction and leasing of real estate properties | R.O.C. | 1,248,711 | 1,095,233 | 35,780 | ||||||||||||||||||||||
| Hung Ching Kwan Co. (“HCK”) | Engaged in the leasing of real estate properties | ROC | 342,138 | 332,444 | 10,139 | |||||||||||||||||||||||||||
| Advanced Microelectronic Products Inc. (“AMPI”) | Engaged in integrated circuit | ROC | 99,052 | 40,216 | 1,226 | |||||||||||||||||||||||||||
| 1,768,391 | 37,089,909 | 1,131,135 | ||||||||||||||||||||||||||||||
| Less: Deferred gain on transfer of land | 300,149 | 300,149 | 9,154 | |||||||||||||||||||||||||||||
| $ | 1,468,242 | $ | 36,789,760 | $ | 1,121,981 | |||||||||||||||||||||||||||
F-51
| Carrying Amount as of December 31 | ||||||||||||||||
| 2017 | 2018 | |||||||||||||||
| Operating | NT$ | NT$ | US$ (Note 4) | |||||||||||||
| Name of Associate | Main Business | Location | ||||||||||||||
| Hung Ching Kwan Co. (“HCK”) | Engaged in the leasing of real estate properties | R.O.C. | $ | 309,630 | $ | 295,772 | $ | 9,663 | ||||||||
| Advanced Microelectronic Products Inc. (“AMPI”) | Engaged in integrated circuit | R.O.C. | 215,550 | 184,134 | 6,015 | |||||||||||
| ChipMOS Technologies Inc. (“ChipMOS”) | Engaged in the packaging and testing of semiconductors | R.O.C. | - | 4,237,982 | 138,451 | |||||||||||
| Yann Yuan Investment Co., Ltd. (“Yann Yuan”) | Engaged in investing activities | R.O.C. | - | 2,752,530 | 89,923 | |||||||||||
| 48,567,386 | 9,431,963 | 308,134 | ||||||||||||||
| Less: Deferred gain on transfer of land | 300,149 | 300,149 | 9,806 | |||||||||||||
| $ | 48,267,237 | $ | 9,131,814 | $ | 298,328 | |||||||||||
| 2) | At each balance sheet date, the percentages of ownership held by the Group were as follows: |
| December 31 | ||||||||
| 2014 | 2015 | |||||||
| SPIL | - | 24.99 | % | |||||
| HC | 26.22 | % | 26.22 | % | ||||
| AMPI | 18.24 | % | 18.24 | % | ||||
| HCK | 27.31 | % | 27.31 | % | ||||
| December 31 | ||||||||
| 2017 | 2018 | |||||||
| SPIL | 33.29 | % | - | |||||
| DECA | 22.04 | % | 22.04 | % | ||||
| HC | 26.22 | % | 26.22 | % | ||||
| HCK | 27.31 | % | 27.31 | % | ||||
| AMPI | 38.76 | % | 38.76 | % | ||||
| ChipMOS | - | 20.47 | % | |||||
| Yann Yuan | - | 32.21 | % | |||||
In December 2015,As disclosed in Note 1, the Company’s board of directors resolved to purchase additional ordinary shares (including ordinary shares represented by ADS) of SPIL up to 770,000 thousand shares, accounting for approximately 24.71% of theCompany acquired all issued and outstanding ordinary shares of SPIL on April 30, 2018 (the acquisition date) in accordance with the joint share exchange agreement and had the control over SPIL. The investment in SPIL originally accounted for using the equity method was remeasured to the fair value at the acquisition date. The gain arising on remeasurement of NT$7,421,408 thousand (US$ 242,451 thousand) was recognized under the line item of other gains, net (Note 26) in the consolidated statements of comprehensive income for the year ended December 31, 2018.
Following the acquisition of 100% shareholdings of SPIL on April 30, 2018, the Company indirectly held ordinary shares of ChipMOS and Yann Yuan through a tender offer for aSPIL. In June 2018, SPIL, acquired additional 19,159 thousand ordinary shares of ChipMOS from open market with total cash consideration of NT$55451,563 thousand (US$1.68) per ordinary share14,752 thousand). As a result, the percentage of ownership in ChipMOS was increased from 18.23% to 20.47% and NT$275 (US$8.39) per ADS from December 29, 2015 to February 16, 2016, which was then extended to March 17, 2016.the SPIL had significant influence over ChipMOS. As of March 17, 2016, asDecember 31, 2018, the Fair Trade CommissionGroup has completed the identification of the ROC had not yet approved the combinationdifference between the Companycost of the investment and SPIL, the condition to completeGroup’ share of the tender offer was not satisfied. The second offer to purchase SPIL’s ordinary shares from whom had participated in thetender offer was withdrawn.net fair value of ChipMOS’ identifiable assets and liabilities.
F-39
In Marchits investment in DECA by the present value of cash flow projection made by DECA’s management with discount rate of 14.1%. The recoverable amount was lower than its carrying amount and, April 2016,therefore, the Company acquired additional 209,848Group recognized an impairment loss of NT$521,010 thousand ordinary shares and additional 9,690 thousand units(US$17,021 thousand) under the line item of ADSother gains, net in the consolidated statements of SPIL with a total consideration of NT$13,735,498 thousand (US$418,893 thousands). As of April 28, 2016,comprehensive income for the Company owns 33.29% of the outstanding ordinary shares of SPIL.year ended December 31, 2018 (Note 26).
| Fair values (Level 1 inputs in terms of IFRS 13) of investments in associates with available published price quotation are summarized as follows: |
| December 31 | ||||||||||||
| 2014 | 2015 | |||||||||||
| NT$ | NT$ | US$ (Note 4) | ||||||||||
| SPIL | $ | - | $ | 40,741,700 | $ | 1,242,504 | ||||||
| HC | $ | 1,427,499 | $ | 1,149,549 | $ | 35,058 | ||||||
| AMPI | $ | 184,862 | $ | 104,255 | $ | 3,179 | ||||||
F-52
| December 31 | ||||||||||||
| 2017 | 2018 | |||||||||||
| NT$ | NT$ | US$ (Note 4) | ||||||||||
| SPIL | $ | 52,176,190 | $ | - | $ | - | ||||||
| HC | $ | 1,695,156 | $ | 1,537,307 | $ | 50,222 | ||||||
| AMPI | $ | 468,572 | $ | 369,925 | $ | 12,085 | ||||||
| ChipMOS | $ | - | $ | 3,886,561 | $ | 126,970 | ||||||
| Summarized financial information in respect of the Group’s material associate |
| December 31, 2015 | ||||||||
| NT$ | US$ (Note 4) | |||||||
| Current assets | $ | 48,785,212 | $ | 1,487,808 | ||||
| Non-current assets | 74,424,040 | 2,269,717 | ||||||
| Current liabilities | (30,677,239 | ) | (935,567 | ) | ||||
| Non-current liabilities | (23,002,788 | ) | (701,518 | ) | ||||
| Equity | $ | 69,529,225 | $ | 2,120,440 | ||||
| Proportion of the Group’s ownership interest in SPIL | 24.99 | % | 24.99 | % | ||||
| Net assets attributable to the Group | $ | 17,375,353 | $ | 529,898 | ||||
| The difference between investment cost and net assets | 18,047,705 | 550,403 | ||||||
| Carrying amount of the Group’s ownership interest in SPIL | $ | 35,423,058 | $ | 1,080,301 | ||||
The summarized financial information below represents amounts shown in SPIL’s consolidated financial statements prepared in accordance with IFRSs and adjusted by the Group for equity method accounting purposes.
For the Year Ended December 31, 2015 | ||||||||
| NT$ | US$ (Note 4) | |||||||
| Operating revenue | $ | 82,839,922 | $ | 2,526,378 | ||||
| Gross profit | $ | 21,609,300 | $ | 659,021 | ||||
| Profit before income tax | $ | 10,377,522 | $ | 316,484 | ||||
| Net profit for the year | $ | 9,011,463 | $ | 274,824 | ||||
| Other comprehensive loss for the year | (906,776 | ) | (27,655 | ) | ||||
| Total comprehensive income for the year | $ | 8,104,687 | $ | 247,169 | ||||
| December 31, 2017 | ||||
| NT$ | ||||
| Current assets | $ | 49,065,912 | ||
| Non-current assets | 101,693,417 | |||
| Current liabilities | (26,194,615 | ) | ||
| Non-current liabilities | (27,213,266 | ) | ||
| Equity | $ | 97,351,448 | ||
| Proportion of the Group’s ownership interest in SPIL | 33.29 | % | ||
| Net assets attributable to the Group | $ | 32,408,297 | ||
| Goodwill | 12,802,074 | |||
| Carrying amount | $ | 45,210,371 | ||
For the Year Ended December 31, 2016 | For the Year Ended December 31, 2017 | For the Period from January 1, 2018 through April 29, 2018 | ||||||||||||||
| NT$ | NT$ | NT$ | US$ (Note 4) | |||||||||||||
| Operating revenue | $ | 85,111,913 | $ | 83,554,385 | $ | 26,169,040 | $ | 854,918 | ||||||||
| Gross profit | $ | 15,027,247 | $ | 12,464,792 | $ | 4,421,493 | $ | 144,446 | ||||||||
| Profit before income tax | $ | 7,351,661 | $ | 4,347,810 | $ | 848,072 | $ | 27,706 | ||||||||
| Net profit | $ | 5,484,462 | $ | 2,822,231 | $ | 413,317 | $ | 13,503 | ||||||||
| Other comprehensive income (loss) | (2,373,532 | ) | 579,057 | 633,879 | 20,708 | |||||||||||
| Total comprehensive income | $ | 3,110,930 | $ | 3,401,288 | $ | 1,047,196 | $ | 34,211 | ||||||||
| Cash dividends received from SPIL | $ | 3,941,740 | $ | 1,815,275 | $ | - | $ | - | ||||||||
F-40F-53
| Aggregate information of associates that are not individually material |
| For the Years Ended December 31 | ||||||||||||||||
| 2013 | 2014 | 2015 | ||||||||||||||
| NT$ | NT$ | NT$ | US$ | |||||||||||||
| (Note 4) | ||||||||||||||||
| The Group’s share of: | ||||||||||||||||
| Net profit for the year | $ | 76,783 | $ | 133,929 | $ | 120,749 | $ | 3,683 | ||||||||
| Other comprehensive income (loss) for the year | 56,485 | 234,125 | (2,916 | ) | (89 | ) | ||||||||||
| Total comprehensive income for the year | $ | 133,268 | $ | 368,054 | $ | 117,833 | $ | 3,594 | ||||||||
| For the Year Ended December 31 | ||||||||||||||||
| 2016 | 2017 | 2018 | ||||||||||||||
| NT$ | NT$ | NT$ | US$ (Note 4) | |||||||||||||
| The Group’s share of: | ||||||||||||||||
| Net profit (loss) | $ | (139,366 | ) | $ | (190,532 | ) | $ | 147,535 | $ | 4,820 | ||||||
| Other comprehensive income (loss) | (115,650 | ) | 59,676 | (613,471 | ) | (20,042 | ) | |||||||||
| Total comprehensive loss | $ | (255,016 | ) | $ | (130,856 | ) | $ | (465,936 | ) | $ | (15,222 | ) | ||||
| b. | Investments in joint |
| 1) |
| December 31, 2015 | ||||||||||||||||
| Name of Joint Venture | Main Business | Operating Location | Percentages of Ownership | Carrying Amount | ||||||||||||
| NT$ | US$ | |||||||||||||||
| (Note 4) | ||||||||||||||||
| ASE Embedded Electronics Inc. (“ASEEE”) | Engaged in the production of embedded substrate | ROC | 51.00 | % | $ | 613,841 | $ | 18,720 | ||||||||
In May 2015, the Group and TDK Corporation (“TDK”) entered into an agreement to establish a joint venture to invest in ASEEE. In August 2015, the Croup invested NT$618,097 thousand (US$18,850 thousand) for 51.00% shareholding in ASEEE. According to the joint arrangement, the Group and TDK must act together to direct the relevant operating activities and, as a result, the Group does not control ASEEE. The investment in ASEEE is accounted for using the equity method.
| 2) | ASE’s board of directors resolved in February 2019 to purchase ordinary shares newly issued by ASEEE at par value through its capital increase by cash. The total consideration will not be more than NT$1,500,000 thousand (US$49,004 thousand), representing 150,000 thousand ordinary shares. |
| 3) | Aggregate information of the Group’s joint venture that is not individually material |
For the Year Ended December 31, 2015 | ||||||||
| NT$ | US$ (Note 4) | |||||||
| The Group’s share of: | ||||||||
| Net loss for the year | $ | (4,274 | ) | $ | (130 | ) | ||
| Other comprehensive income for the year | - | - | ||||||
| Total comprehensive loss for the year | $ | (4,274 | ) | $ | (130 | ) | ||
| For the Year Ended December 31 | ||||||||||||||||
| 2016 | 2017 | 2018 | ||||||||||||||
| NT$ | NT$ | NT$ | US$ (Note 4) | |||||||||||||
| The Group’s share of net loss and total comprehensive loss | $ | (90,478 | ) | $ | (184,366 | ) | $ | (306,156 | ) | $ | (10,002 | ) | ||||
Investments accounted for using the equity method and the share of loss and other comprehensive income of those investments were calculated based on the audited financial statements prepared in accordance with IFRSs as issued by the IASB.
| PROPERTY, PLANT AND EQUIPMENT |
The carrying amounts of each class of property, plant and equipment were as follows:
| December 31 | ||||||||||||
| 2017 | 2018 | |||||||||||
| NT$ | NT$ | US$ (Note 4) | ||||||||||
| Land | $ | 3,258,518 | $ | 10,165,969 | $ | 332,113 | ||||||
| Buildings and improvements | 58,272,864 | 78,963,937 | 2,579,678 | |||||||||
| Machinery and equipment | 66,185,198 | 108,087,970 | 3,531,133 | |||||||||
| Other equipment | 1,588,113 | 6,463,160 | 211,145 | |||||||||
| Construction in progress and machinery in transit | 5,863,713 | 10,911,552 | 356,470 | |||||||||
| $ | 135,168,406 | $ | 214,592,588 | $ | 7,010,539 | |||||||
F-41F-54
| December 31 | ||||||||||||
| 2014 | 2015 | |||||||||||
| NT$ | NT$ | US$ (Note 4) | ||||||||||
| Land | $ | 3,348,018 | $ | 3,381,300 | $ | 103,120 | ||||||
| Buildings and improvements | 56,395,710 | 59,801,054 | 1,823,758 | |||||||||
| Machinery and equipment | 84,171,647 | 78,715,309 | 2,400,589 | |||||||||
| Other equipment | 1,816,687 | 1,814,994 | 55,352 | |||||||||
| Construction in progress and machinery in transit | 5,855,053 | 6,284,418 | 191,657 | |||||||||
| $ | 151,587,115 | $ | 149,997,075 | $ | 4,574,476 | |||||||
For the year ended December 31, 20132016
| Land | Buildings and improvements | Machinery and equipment | Other equipment | Construction in progress and machinery in transit | Total | Land | Buildings and improvements | Machinery and equipment | Other equipment | Construction in progress and machinery in transit | Total | |||||||||||||||||||||||||||||||||||||
| NT$ | NT$ | NT$ | NT$ | NT$ | NT$ | NT$ | NT$ | NT$ | NT$ | NT$ | NT$ | |||||||||||||||||||||||||||||||||||||
| Cost | ||||||||||||||||||||||||||||||||||||||||||||||||
| Balance at January 1, 2013 | $ | 3,274,086 | $ | 63,482,739 | $ | 193,973,968 | $ | 5,941,567 | $ | 8,178,827 | $ | 274,851,187 | ||||||||||||||||||||||||||||||||||||
| Balance at January 1, 2016 | $ | 3,381,300 | $ | 94,447,932 | $ | 243,283,607 | $ | 7,722,408 | $ | 6,397,760 | $ | 355,233,007 | ||||||||||||||||||||||||||||||||||||
| Additions | - | 5,447,913 | 14,484,611 | 318,841 | 6,792,707 | 27,044,072 | - | 22,341 | 94,480 | 470,901 | 27,093,140 | 27,680,862 | ||||||||||||||||||||||||||||||||||||
| Disposals | - | (412,648 | ) | (9,479,630 | ) | (197,203 | ) | (38,565 | ) | (10,128,046 | ) | - | (684,698 | ) | (5,956,179 | ) | (159,822 | ) | (268,782 | ) | (7,069,481 | ) | ||||||||||||||||||||||||||
| Reclassification | - | 758,850 | 7,661,570 | 142,791 | (8,638,840 | ) | (75,629 | ) | - | 5,110,102 | 19,661,732 | 691,276 | (25,463,285 | ) | (175 | ) | ||||||||||||||||||||||||||||||||
| Acquisitions through business combinations | - | 5,106 | 278,862 | 122,108 | - | 406,076 | - | - | - | 1,159 | - | 1,159 | ||||||||||||||||||||||||||||||||||||
| Effect of foreign currency exchange differences | 21,672 | 1,311,577 | 1,432,524 | 56,485 | 715,573 | 3,537,831 | (16,287 | ) | (2,637,502 | ) | (8,882,884 | ) | (251,261 | ) | (45,291 | ) | (11,833,225 | ) | ||||||||||||||||||||||||||||||
| Balance at December 31, 2013 | $ | 3,295,758 | $ | 70,593,537 | $ | 208,351,905 | $ | 6,384,589 | $ | 7,009,702 | $ | 295,635,491 | ||||||||||||||||||||||||||||||||||||
| Balance at December 31, 2016 | $ | 3,365,013 | $ | 96,258,175 | $ | 248,200,756 | $ | 8,474,661 | $ | 7,713,542 | $ | 364,012,147 | ||||||||||||||||||||||||||||||||||||
| Accumulated depreciation and impairment | ||||||||||||||||||||||||||||||||||||||||||||||||
| Balance at January 1, 2013 | $ | - | $ | 22,307,146 | $ | 120,775,451 | $ | 4,570,816 | $ | - | $ | 147,653,413 | ||||||||||||||||||||||||||||||||||||
| Depreciation expense | - | 3,555,865 | 20,486,896 | 653,846 | - | 24,696,607 | ||||||||||||||||||||||||||||||||||||||||||
| Impairment losses recognized (reversed) | - | (15,754 | ) | 508,894 | 2,407 | - | 495,547 | |||||||||||||||||||||||||||||||||||||||||
| Balance at January 1, 2016 | $ | - | $ | 34,646,878 | $ | 164,568,298 | $ | 5,907,414 | $ | 113,342 | $ | 205,235,932 | ||||||||||||||||||||||||||||||||||||
| Depreciation expenses | - | 5,114,263 | 22,983,290 | 864,061 | - | 28,961,614 | ||||||||||||||||||||||||||||||||||||||||||
| Impairment losses recognized | - | 620 | 876,123 | 5,564 | 5,924 | 888,231 | ||||||||||||||||||||||||||||||||||||||||||
| Disposals | - | (368,707 | ) | (9,285,927 | ) | (166,371 | ) | - | (9,821,005 | ) | - | (449,198 | ) | (5,544,489 | ) | (151,875 | ) | (100,049 | ) | (6,245,611 | ) | |||||||||||||||||||||||||||
| Reclassification | - | (24,797 | ) | 58,448 | (45,735 | ) | - | (12,084 | ) | - | (5,123 | ) | 9,660 | (4,537 | ) | - | - | |||||||||||||||||||||||||||||||
| Acquisitions through business combinations | - | 2,473 | 108,365 | 36,818 | - | 147,656 | - | - | - | 824 | - | 824 | ||||||||||||||||||||||||||||||||||||
| Effect of foreign currency exchange differences | - | 370,710 | 614,596 | (7,280 | ) | - | 978,026 | - | (1,077,896 | ) | (7,392,888 | ) | (236,371 | ) | (1,929 | ) | (8,709,084 | ) | ||||||||||||||||||||||||||||||
| Balance at December 31, 2013 | $ | - | $ | 25,826,936 | $ | 133,266,723 | $ | 5,044,501 | $ | - | $ | 164,138,160 | ||||||||||||||||||||||||||||||||||||
| Balance at December 31, 2016 | $ | - | $ | 38,229,544 | $ | 175,499,994 | $ | 6,385,080 | $ | 17,288 | $ | 220,131,906 | ||||||||||||||||||||||||||||||||||||
For the year ended December 31, 20142017
| Land | Buildings and improvements | Machinery and equipment | Other equipment | Construction in progress and machinery in transit | Total | Land | Buildings and improvements | Machinery and equipment | Other equipment | Construction in progress and machinery in transit | Total | |||||||||||||||||||||||||||||||||||||
| NT$ | NT$ | NT$ | NT$ | NT$ | NT$ | NT$ | NT$ | NT$ | NT$ | NT$ | NT$ | |||||||||||||||||||||||||||||||||||||
| Cost | ||||||||||||||||||||||||||||||||||||||||||||||||
| Balance at January 1, 2014 | $ | 3,295,758 | $ | 70,593,537 | $ | 208,351,905 | $ | 6,384,589 | $ | 7,009,702 | $ | 295,635,491 | ||||||||||||||||||||||||||||||||||||
| Balance at January 1, 2017 | $ | 3,365,013 | $ | 96,258,175 | $ | 248,200,756 | $ | 8,474,661 | $ | 7,713,542 | $ | 364,012,147 | ||||||||||||||||||||||||||||||||||||
| Additions | - | 1,246,123 | 1,140,822 | 572,766 | 40,488,876 | 43,448,587 | - | 350,434 | 102,301 | 130,659 | 23,094,288 | 23,677,682 | ||||||||||||||||||||||||||||||||||||
| Disposals | - | (299,515 | ) | (8,188,532 | ) | (447,047 | ) | (56,209 | ) | (8,991,303 | ) | - | (609,294 | ) | (8,449,949 | ) | (763,937 | ) | (73,248 | ) | (9,896,428 | ) | ||||||||||||||||||||||||||
| Reclassification | - | 12,683,476 | 27,935,525 | 395,115 | (41,044,364 | ) | (30,248 | ) | (35,965 | ) | 6,483,392 | 18,331,738 | 174,947 | (25,428,464 | ) | (474,352 | ) | |||||||||||||||||||||||||||||||
| Effect of foreign currency exchange differences | 52,260 | 2,501,633 | 4,429,907 | 277,151 | (535,788 | ) | 6,725,163 | (70,530 | ) | (2,294,779 | ) | (4,986,843 | ) | (204,250 | ) | 557,595 | (6,998,807 | ) | ||||||||||||||||||||||||||||||
| Balance at December 31, 2014 | $ | 3,348,018 | $ | 86,725,254 | $ | 233,669,627 | $ | 7,182,574 | $ | 5,862,217 | $ | 336,787,690 | ||||||||||||||||||||||||||||||||||||
| Balance at December 31, 2017 | $ | 3,258,518 | $ | 100,187,928 | $ | 253,198,003 | $ | 7,812,080 | $ | 5,863,713 | $ | 370,320,242 | ||||||||||||||||||||||||||||||||||||
| Accumulated depreciation and impairment | ||||||||||||||||||||||||||||||||||||||||||||||||
| Balance at January 1, 2014 | $ | - | $ | 25,826,936 | $ | 133,266,723 | $ | 5,044,501 | $ | - | $ | 164,138,160 | ||||||||||||||||||||||||||||||||||||
| Depreciation expense | - | 3,980,337 | 21,180,214 | 644,491 | - | 25,805,042 | ||||||||||||||||||||||||||||||||||||||||||
| Balance at January 1, 2017 | $ | - | $ | 38,229,544 | $ | 175,499,994 | $ | 6,385,080 | $ | 17,288 | $ | 220,131,906 | ||||||||||||||||||||||||||||||||||||
| Depreciation expenses | - | 5,156,558 | 22,722,307 | 746,422 | - | 28,625,287 | ||||||||||||||||||||||||||||||||||||||||||
| Impairment losses recognized | - | 79,124 | 211,466 | - | 7,164 | 297,754 | - | 2,310 | 286,880 | 368 | - | 289,558 | ||||||||||||||||||||||||||||||||||||
| Disposals | - | (248,477 | ) | (7,786,216 | ) | (433,863 | ) | - | (8,468,556 | ) | - | (478,903 | ) | (7,540,654 | ) | (720,319 | ) | (17,288 | ) | (8,757,164 | ) | |||||||||||||||||||||||||||
| Reclassification | - | 7,459 | (7,122 | ) | (7,907 | ) | - | (7,570 | ) | - | (210,080 | ) | 34,452 | (24,117 | ) | - | (199,745 | ) | ||||||||||||||||||||||||||||||
| Effect of foreign currency exchange differences | - | 684,165 | 2,632,915 | 118,665 | - | 3,435,745 | - | (784,365 | ) | (3,990,174 | ) | (163,467 | ) | - | (4,938,006 | ) | ||||||||||||||||||||||||||||||||
| Balance at December 31, 2014 | $ | - | $ | 30,329,544 | $ | 149,497,980 | $ | 5,365,887 | $ | 7,164 | $ | 185,200,575 | ||||||||||||||||||||||||||||||||||||
| Balance at December 31, 2017 | $ | - | $ | 41,915,064 | $ | 187,012,805 | $ | 6,223,967 | $ | - | $ | 235,151,836 | ||||||||||||||||||||||||||||||||||||
F-42
For the year ended December 31, 20152018
| Land | Buildings and improvements | Machinery and equipment | Other equipment | Construction in progress and machinery in transit | Total | Land | Buildings and improvements | Machinery and equipment | Other equipment | Construction in progress and machinery in transit | Total | |||||||||||||||||||||||||||||||||||||
| NT$ | NT$ | NT$ | NT$ | NT$ | NT$ | NT$ | NT$ | NT$ | NT$ | NT$ | NT$ | |||||||||||||||||||||||||||||||||||||
| Cost | ||||||||||||||||||||||||||||||||||||||||||||||||
| Balance at January 1, 2015 | $ | 3,348,018 | $ | 86,725,254 | $ | 233,669,627 | $ | 7,182,574 | $ | 5,862,217 | $ | 336,787,690 | ||||||||||||||||||||||||||||||||||||
| Balance at January 1, 2018 | $ | 3,258,518 | $ | 100,187,928 | $ | 253,198,003 | $ | 7,812,080 | $ | 5,863,713 | $ | 370,320,242 | ||||||||||||||||||||||||||||||||||||
| Additions | - | 132,584 | 553,496 | 401,417 | 27,193,324 | 28,280,821 | - | 144,898 | 192,673 | 84,860 | 38,669,807 | 39,092,238 | ||||||||||||||||||||||||||||||||||||
| Disposals | - | (405,040 | ) | (8,041,933 | ) | (232,555 | ) | (20,711 | ) | (8,700,239 | ) | - | (677,206 | ) | (26,493,282 | ) | (2,251,060 | ) | (34,902 | ) | (29,456,450 | ) | ||||||||||||||||||||||||||
| Reclassification | - | 8,579,472 | 18,054,712 | 389,783 | (26,893,158 | ) | 130,809 | - | 5,388,709 | 32,060,513 | 2,148,211 | (39,612,324 | ) | (14,891 | ) | |||||||||||||||||||||||||||||||||
| Acquisition through business combinations (Note 30) | 6,880,400 | 37,127,957 | 95,810,062 | 11,122,171 | 5,781,189 | 156,721,779 | ||||||||||||||||||||||||||||||||||||||||||
| Effect of foreign currency exchange differences | 33,282 | (584,338 | ) | (952,295 | ) | (18,811 | ) | 256,088 | (1,266,074 | ) | 27,051 | (464,275 | ) | (929,579 | ) | (78,095 | ) | 244,069 | (1,200,829 | ) | ||||||||||||||||||||||||||||
| Balance at December 31, 2015 | $ | 3,381,300 | $ | 94,447,932 | $ | 243,283,607 | $ | 7,722,408 | $ | 6,397,760 | $ | 355,233,007 | ||||||||||||||||||||||||||||||||||||
| Accumulated depreciation and impairment | ||||||||||||||||||||||||||||||||||||||||||||||||
| Balance at January 1, 2015 | $ | - | $ | 30,329,544 | $ | 149,497,980 | $ | 5,365,887 | $ | 7,164 | $ | 185,200,575 | ||||||||||||||||||||||||||||||||||||
| Depreciation expense | - | 4,790,646 | 23,372,408 | 775,716 | - | 28,938,770 | ||||||||||||||||||||||||||||||||||||||||||
| Impairment losses recognized | - | 120,424 | 31,116 | - | 106,589 | 258,129 | ||||||||||||||||||||||||||||||||||||||||||
| Disposals | - | (308,895 | ) | (7,838,937 | ) | (224,509 | ) | - | (8,372,341 | ) | ||||||||||||||||||||||||||||||||||||||
| Reclassification | - | 5,704 | (11,920 | ) | 3,008 | - | (3,208 | ) | ||||||||||||||||||||||||||||||||||||||||
| Effect of foreign currency exchange differences | - | (290,545 | ) | (482,349 | ) | (12,688 | ) | (411 | ) | (785,993 | ) | |||||||||||||||||||||||||||||||||||||
| Balance at December 31, 2015 | $ | - | $ | 34,646,878 | $ | 164,568,298 | $ | 5,907,414 | $ | 113,342 | $ | 205,235,932 | ||||||||||||||||||||||||||||||||||||
| Balance at December 31, 2018 | $ | 10,165,969 | $ | 141,708,011 | $ | 353,838,390 | $ | 18,838,167 | $ | 10,911,552 | $ | 535,462,089 | ||||||||||||||||||||||||||||||||||||
| Land | Buildings and improvements | Machinery and equipment | Other equipment | Construction in progress and machinery in transit | Total | |||||||||||||||||||
| US$ (Note 4) | US$ (Note 4) | US$ (Note 4) | US$ (Note 4) | US$ (Note 4) | US$ (Note 4) | |||||||||||||||||||
| Cost | ||||||||||||||||||||||||
| Balance at January 1,2015 | $ | 102,105 | $ | 2,644,869 | $ | 7,126,247 | $ | 219,048 | $ | 178,781 | $ | 10,271,050 | ||||||||||||
| Additions | - | 4,043 | 16,880 | 12,242 | 829,318 | 862,483 | ||||||||||||||||||
| Disposals | - | (12,353 | ) | (245,256 | ) | (7,092 | ) | (632 | ) | (265,333 | ) | |||||||||||||
| Reclassification | - | 261,649 | 550,616 | 11,887 | (820,163 | ) | 3,989 | |||||||||||||||||
| Effect of foreign currency exchange differences | 1,015 | (17,821 | ) | (29,042 | ) | (574 | ) | 7,810 | (38,612 | ) | ||||||||||||||
| Balance at December 31, 2015 | $ | 103,120 | $ | 2,880,387 | $ | 7,419,445 | $ | 235,511 | $ | 195,114 | $ | 10,833,577 | ||||||||||||
| Accumulated depreciation and impairment | ||||||||||||||||||||||||
| Balance at January 1, 2015 | $ | - | $ | 924,963 | $ | 4,559,255 | $ | 163,644 | $ | 218 | $ | 5,648,080 | ||||||||||||
| Depreciation expense | - | 146,101 | 712,791 | 23,657 | - | 882,549 | ||||||||||||||||||
| Impairment losses recognized | - | 3,673 | 949 | - | 3,251 | 7,873 | ||||||||||||||||||
| Disposals | - | (9,420 | ) | (239,065 | ) | (6,847 | ) | - | (255,332 | ) | ||||||||||||||
| Reclassification | - | 174 | (364 | ) | 92 | - | (98 | ) | ||||||||||||||||
| Effect of foreign currency exchange differences | - | (8,862 | ) | (14,710 | ) | (387 | ) | (12 | ) | (23,971 | ) | |||||||||||||
| Balance at December 31,2015 | $ | - | $ | 1,056,629 | $ | 5,018,856 | $ | 180,159 | $ | 3,457 | $ | 6,259,101 | ||||||||||||
(Continued)
F-55
| Land | Buildings and improvements | Machinery and equipment | Other equipment | Construction in progress and machinery in transit | Total | |||||||||||||||||||
| NT$ | NT$ | NT$ | NT$ | NT$ | NT$ | |||||||||||||||||||
| Accumulated depreciation and impairment | ||||||||||||||||||||||||
| Balance at January 1, 2018 | $ | - | $ | 41,915,064 | $ | 187,012,805 | $ | 6,223,967 | $ | - | $ | 235,151,836 | ||||||||||||
| Depreciation expenses | - | 6,325,948 | 31,751,251 | 1,816,587 | - | 39,893,786 | ||||||||||||||||||
| Impairment losses recognized | - | 29,531 | 97,680 | 5,860 | - | 133,071 | ||||||||||||||||||
| Disposals | - | (491,033 | ) | (25,704,778 | ) | (2,070,302 | ) | - | (28,266,113 | ) | ||||||||||||||
| Reclassification | - | (265 | ) | - | - | - | (265 | ) | ||||||||||||||||
| Acquisition through business combinations (Note 30) | - | 15,097,920 | 53,210,063 | 6,428,174 | - | 74,736,157 | ||||||||||||||||||
| Effect of foreign currency exchange differences | - | (133,091 | ) | (616,601 | ) | (29,279 | ) | - | (778,971 | ) | ||||||||||||||
| Balance at December 31, 2018 | $ | - | $ | 62,744,074 | $ | 245,750,420 | $ | 12,375,007 | $ | - | $ | 320,869,501 | ||||||||||||
(Concluded)
| Land | Buildings and improvements | Machinery and equipment | Other equipment | Construction in progress and machinery in transit | Total | |||||||||||||||||||
| US$ (Note 4) | US$ (Note 4) | US$ (Note 4) | US$ (Note 4) | US$ (Note 4) | US$ (Note 4) | |||||||||||||||||||
| Cost | ||||||||||||||||||||||||
| Balance at January 1, 2018 | $ | 106,453 | $ | 3,273,046 | $ | 8,271,741 | $ | 255,213 | $ | 191,562 | $ | 12,098,015 | ||||||||||||
| Additions | - | 4,734 | 6,294 | 2,772 | 1,263,306 | 1,277,106 | ||||||||||||||||||
| Disposals | - | (22,124 | ) | (865,511 | ) | (73,540 | ) | (1,140 | ) | (962,315 | ) | |||||||||||||
| Reclassification | - | 176,044 | 1,047,387 | 70,180 | (1,294,097 | ) | (486 | ) | ||||||||||||||||
| Acquisition through business combinations (Note 30) | 224,776 | 1,212,936 | 3,130,025 | 363,351 | 188,866 | 5,119,954 | ||||||||||||||||||
| Effect of foreign currency exchange differences | 884 | (15,168 | ) | (30,368 | ) | (2,551 | ) | 7,973 | (39,230 | ) | ||||||||||||||
| Balance at December 31, 2018 | $ | 332,113 | $ | 4,629,468 | $ | 11,559,568 | $ | 615,425 | $ | 356,470 | $ | 17,493,044 | ||||||||||||
| Accumulated depreciation and impairment | ||||||||||||||||||||||||
| Balance at January 1, 2018 | $ | $ | 1,369,326 | $ | 6,109,533 | $ | 203,331 | $ | - | $ | 7,682,190 | |||||||||||||
| Depreciation expense | - | 206,663 | 1,037,283 | 59,346 | - | 1,303,292 | ||||||||||||||||||
| Impairment losses recognized | - | 965 | 3,191 | 192 | - | 4,348 | ||||||||||||||||||
| Disposals | - | (16,042 | ) | (839,751 | ) | (67,635 | ) | - | (923,428 | ) | ||||||||||||||
| Reclassification | - | (9 | ) | - | - | - | (9 | ) | ||||||||||||||||
| Acquisition through business combinations (Note 30) | - | 493,235 | 1,738,323 | 210,003 | - | 2,441,561 | ||||||||||||||||||
| Effect of foreign currency exchange differences | - | (4,348 | ) | (20,144 | ) | (957 | ) | - | (25,449 | ) | ||||||||||||||
| Balance at December 31, 2018 | $ | - | $ | 2,049,790 | $ | 8,028,435 | $ | 404,280 | $ | - | $ | 10,482,505 | ||||||||||||
Due to the Group’s future operation plans and capacity evaluation or production demands in segment of packaging and testing, the Group believed that a portion of property, plant and equipment used in packaging segment, testing segment, EMS segmentdoes not qualify for the production needs and, other segment was not used andtherefore, recognized an impairment loss of NT$495,547888,231 thousand, NT$297,754289,558 thousand and NT$258,129133,071 thousand (US$7,8734,348 thousand) under the line item of other operating income and expenses in the consolidated statements of comprehensive income (Note 26) for the years ended December 31, 2013, 20142016, 2017 and 2015,2018, respectively. The recoverable amount of a portion of the impaired property, plant and equipment is determined by its fair value less costs of disposal, of which the fair value is based on the recent quoted prices of assets with similar age and obsolescence that provided by the vendors in secondary market. The recent quoted prices of assets aremarket which represent a Level 3 input in terms of IFRS 13 because the secondary market is not very active. The recoverable amount of the other portion of the impaired property, plant and equipment for the years ended December 31, 2013, 2014 and 2015 is determined on the basis of its value in use which was zero due toand the Group’s expectationGroup expects to derive nozero future cash flows from these assets.
Each class of property, plant and equipment was depreciated on a straight-line basis over the following useful lives:
F-43
| Buildings and improvements | ||||
| Main plant buildings | 10-55 years | |||
| Cleanrooms | 10-20 years | |||
| Others | 3-20 years | |||
| Machinery and equipment | 2-10 years | |||
| Other equipment | 2-20 years |
F-56
The capitalized borrowing costs for the years ended December 31, 2013, 20142016, 2017 and 20152018 are disclosed in Note 22.26.
��
| Cost | Accumulated impairment | Carrying amount | ||||||||||
| NT$ | NT$ | NT$ | ||||||||||
| Balance at January 1, 2013 | $ | 12,295,819 | $ | 1,988,996 | $ | 10,306,823 | ||||||
| Effect of foreign currency exchange differences | 40,997 | - | 40,997 | |||||||||
| Balance at December 31, 2013 | 12,336,816 | 1,988,996 | 10,347,820 | |||||||||
| Effect of foreign currency exchange differences | 97,595 | - | 97,595 | |||||||||
| Balance at December 31, 2014 | 12,434,411 | 1,988,996 | 10,445,415 | |||||||||
| Effect of foreign currency exchange differences | 61,104 | - | 61,104 | |||||||||
| Balance at December 31, 2015 | $ | 12,495,515 | $ | 1,988,996 | $ | 10,506,519 | ||||||
| Land | Buildings and improvements | Total | ||||||||||
| NT$ | NT$ | NT$ | ||||||||||
| Cost | ||||||||||||
| Balance at January 1, 2017 | $ | - | $ | - | $ | - | ||||||
| Additions | - | 186,535 | 186,535 | |||||||||
| Disposals | - | (342 | ) | (342 | ) | |||||||
| Transferred from inventories related to real estate business and property, plant and equipment | 35,965 | 8,114,110 | 8,150,075 | |||||||||
| Effects of foreign currency exchange differences | - | 106,482 | 106,482 | |||||||||
| Balance at December 31, 2017 | $ | 35,965 | $ | 8,406,785 | $ | 8,442,750 | ||||||
| Accumulated depreciation and impairment | ||||||||||||
| Balance at January 1, 2017 | $ | - | $ | - | $ | - | ||||||
| Depreciation expenses | - | 122,231 | 122,231 | |||||||||
| Disposals | - | (161 | ) | (161 | ) | |||||||
| Transferred from property, plant and equipment | - | 199,745 | 199,745 | |||||||||
| Effects of foreign currency exchange differences | - | 1,499 | 1,499 | |||||||||
| Balance at December 31, 2017 | $ | - | $ | 323,314 | $ | 323,314 | ||||||
| Carrying amount at December 31, 2017 | $ | 35,965 | $ | 8,083,471 | $ | 8,119,436 | ||||||
| Cost | Accumulated impairment | Carrying amount | ||||||||||
| US$ (Note 4) | US$ (Note 4) | US$ (Note 4) | ||||||||||
| Balance at January 1, 2015 | $ | 379,214 | $ | 60,659 | $ | 318,555 | ||||||
| Effect of foreign currency exchange differences | 1,863 | - | 1,863 | |||||||||
| Balance at December 31, 2015 | $ | 381,077 | $ | 60,659 | $ | 320,418 | ||||||
| Land | Buildings and improvements | Total | ||||||||||
| NT$ | NT$ | NT$ | ||||||||||
| Cost | ||||||||||||
| Balance at January 1, 2018 | $ | 35,965 | $ | 8,406,785 | $ | 8,442,750 | ||||||
| Additions | - | 125,853 | 125,853 | |||||||||
| Transferred from property, plant and equipment | - | 14,891 | 14,891 | |||||||||
| Effects of foreign currency exchange differences | - | (137,739 | ) | (137,739 | ) | |||||||
| Balance at December 31, 2018 | $ | 35,965 | $ | 8,409,790 | $ | 8,445,755 | ||||||
| Accumulated depreciation and impairment | ||||||||||||
| Balance at January 1, 2018 | $ | - | $ | 323,314 | $ | 323,314 | ||||||
| Depreciation expenses | - | 392,667 | 392,667 | |||||||||
| Transferred from property, plant and equipment | - | 265 | 265 | |||||||||
| Effects of foreign currency exchange differences | - | (8,870 | ) | (8,870 | ) | |||||||
| Balance at December 31, 2018 | $ | - | $ | 707,376 | $ | 707,376 | ||||||
| Carrying amount at December 31, 2018 | $ | 35,965 | $ | 7,702,414 | $ | 7,738,379 | ||||||
F-57
| Land | Buildings and improvements | Total | ||||||||||
| US$ (Note 4) | US$ (Note 4) | US$ (Note 4) | ||||||||||
| Cost | ||||||||||||
| Balance at January 1, 2018 | $ | 1,175 | $ | 274,642 | $ | 275,817 | ||||||
| Additions | - | 4,111 | 4,111 | |||||||||
| Transferred from property, plant and equipment | - | 487 | 487 | |||||||||
| Effects of foreign currency exchange differences | - | (4,500 | ) | (4,500 | ) | |||||||
| Balance at December 31, 2018 | $ | 1,175 | $ | 274,740 | $ | 275,915 | ||||||
| Accumulated depreciation and impairment | ||||||||||||
| Balance at January 1, 2018 | $ | - | $ | 10,562 | $ | 10,562 | ||||||
| Depreciation expenses | - | 12,828 | 12,828 | |||||||||
| Transferred from property, plant and equipment | - | 9 | 9 | |||||||||
| Effects of foreign currency exchange differences | - | (290 | ) | (290 | ) | |||||||
| Balance at December 31, 2018 | $ | - | $ | 23,109 | $ | 23,109 | ||||||
| Carrying amount at December 31, 2018 | $ | 1,175 | $ | 251,631 | $ | 252,806 | ||||||
The investment properties were depreciated on a straight-line basis over the following useful lives:
| Main buildings | 10-40 years | |
| Others | 3-20 years |
The fair value of the investment properties was approximately NT$11,560,440 thousand and NT$11,764,829 thousand (US$384,346 thousand) as of December 31, 2017 and 2018, respectively, which was measured using the market approach and the income approach based on level 3 inputs by independent professional appraisers. The significant unobservable inputs were discounted rates.
Investment properties are held under freehold interests. Refer to Note 38 for the carrying amount of the investment properties that had been pledged by the Group to secure borrowings.
| 18. | GOODWILL |
| Cost | Accumulated impairment | Carrying amount | ||||||||||
| NT$ | NT$ | NT$ | ||||||||||
| Balance at January 1, 2016 | $ | 12,495,515 | $ | 1,988,996 | $ | 10,506,519 | ||||||
| Acquisitions through business combinations (Note 30) | 15,323 | - | 15,323 | |||||||||
| Effect of foreign currency exchange differences | (31,533 | ) | - | (31,533 | ) | |||||||
| Balance at December 31, 2016 | 12,479,305 | 1,988,996 | 10,490,309 | |||||||||
| Impairment losses recognized | - | 425,117 | (425,117 | ) | ||||||||
| Effect of foreign currency exchange differences | (130,698 | ) | - | (130,698 | ) | |||||||
| Balance at December 31, 2017 | 12,348,607 | 2,414,113 | 9,934,494 | |||||||||
F-58
| Cost | Accumulated impairment | Carrying amount | ||||||||||
| NT$ | NT$ | NT$ | ||||||||||
| Acquisition through business combinations (Note 30) | $ | 39,990,231 | $ | - | $ | 39,990,231 | ||||||
| Effect of foreign currency exchange differences | 49,721 | - | 49,721 | |||||||||
| Balance at December 31, 2018 | $ | 52,388,559 | $ | 2,414,113 | $ | 49,974,446 | ||||||
| Cost | Accumulated impairment | Carrying amount | ||||||||||
| US$ (Note 4) | US$ (Note 4) | US$ (Note 4) | ||||||||||
| Balance at January 1, 2018 | $ | 403,418 | $ | 78,867 | $ | 324,551 | ||||||
| Acquisition through business combinations (Note 30) | 1,306,443 | - | 1,306,443 | |||||||||
| Effect of foreign currency exchange differences | 1,624 | - | 1,624 | |||||||||
| Balance at December 31, 2018 | $ | 1,711,485 | $ | 78,867 | $ | 1,632,618 | ||||||
| a. | Allocating goodwill to cash-generating units |
Goodwill had been allocated to the following cash-generating units for impairment testing purposes: packaging segment, testing segment, EMS segment and other segment. The carrying amountamounts of goodwill allocated to cash-generating units waswere as follows:
| December 31 | December 31 | |||||||||||||||||||||||
| 2014 | 2015 | 2017 | 2018 | |||||||||||||||||||||
| Cash-generating units | NT$ | NT$ | US$ (Note 4) | NT$ | NT$ | US$ (Note 4) | ||||||||||||||||||
| Packaging segment | $ | 1,362,724 | $ | 35,729,371 | $ | 1,167,245 | ||||||||||||||||||
| Testing segment | $ | 7,846,460 | $ | 7,890,525 | $ | 240,638 | 7,775,581 | 13,448,886 | 439,362 | |||||||||||||||
| Others | 2,598,955 | 2,615,994 | 79,780 | 796,189 | 796,189 | 26,011 | ||||||||||||||||||
| $ | 10,445,415 | $ | 10,506,519 | $ | 320,418 | $ | 9,934,494 | $ | 49,974,446 | $ | 1, 632,618 | |||||||||||||
F-44
| b. | Impairment assessment |
At the end of each year, the Group performs impairment assessment by reviewing the recoverable amounts based on value in use which incorporates cash flow projections estimated by management covering a five-year period. The cash flows beyond that five-year period have been extrapolated using a steady 2% per annum growth rate. In assessing value in use, the estimated future cash flows are discounted to their present value using annual discount rates. For the years endedrates which were 9.09%-10.49%, 8.97%-11.29% and 8.01%- 8.57% as of December 31, 2013, 20142016, 2017 and 2015, the Group did not recognize impairment loss on goodwill.
2018, respectively. The key assumptionsassumption used in the value in use calculations arewas the growth rates for operating revenue, and discount rates. Growth rates for operating revenue arewhich were based on the revenue forecast for the Group and the marketindustry as well as ourthe Group’s historical experience. The discount rates were 9.56%-11.80%, 9.70%-11.50% and 8.67%- 10.71% as
As of December 31, 2013, 20142017, the recoverable amount of other segment was lower than its carrying amount since its actual growth in revenue did not meet its forecast previously made by management. The review led to the recognition of an impairment loss of NT$425,117 thousand under the line item of other operating income and 2015, respectivelyexpenses, net (Note 26) in the consolidated statements of comprehensive income for the year ended December 31, 2017.
F-59
Management believed that any reasonably possible change in the key assumptions on which recoverable amount was based would not cause the aggregate carrying amount of the cash-generating unit to exceed its aggregate recoverable amount significantly.
| OTHER INTANGIBLE ASSETS |
The carrying amounts of each class of other intangible assets were as follows:
| December 31 | December 31 | |||||||||||||||||||||||
| 2014 | 2015 | 2017 | 2018 | |||||||||||||||||||||
| NT$ | NT$ | US$ (Note 4) | NT$ | NT$ | US$ (Note 4) | |||||||||||||||||||
| Customer relationships | $ | 501,501 | $ | 274,402 | $ | 8,368 | $ | 113,776 | $ | 10,366,797 | $ | 338,673 | ||||||||||||
| Computer software | 798,127 | 953,322 | 29,074 | 864,331 | 1,159,682 | 37,886 | ||||||||||||||||||
| Patents and acquired specific technology | 319,402 | 19,255,669 | 629,065 | |||||||||||||||||||||
| Others | 168,243 | 154,369 | 4,708 | 109,356 | 115,552 | 3,775 | ||||||||||||||||||
| $ | 1,467,871 | $ | 1,382,093 | $ | 42,150 | $ | 1,406,865 | $ | 30,897,700 | $ | 1,009,399 | |||||||||||||
For the year ended December 31, 20132016
| Customer relationships | Computer software | Others | Total | |||||||||||||
| NT$ | NT$ | NT$ | NT$ | |||||||||||||
| Cost | ||||||||||||||||
| Balance at January 1, 2013 | $ | 1,579,015 | $ | 3,354,834 | $ | 2,299,958 | $ | 7,233,807 | ||||||||
| Additions | - | 306,795 | 6,315 | 313,110 | ||||||||||||
| Disposals or derecognization | - | (6,022 | ) | (5,272 | ) | (11,294 | ) | |||||||||
| Reclassification | - | (8,684 | ) | - | (8,684 | ) | ||||||||||
| Acquisitions through business combinations | - | 3,508 | - | 3,508 | ||||||||||||
| Effect of foreign currency exchange differences | - | 29,404 | 3,654 | 33,058 | ||||||||||||
| Balance at December 31, 2013 | $ | 1,579,015 | $ | 3,679,835 | $ | 2,304,655 | $ | 7,563,505 | ||||||||
(Continued)
| Customer relationships | Computer software | Patents and acquired specific technology | Others | Total | ||||||||||||||||
| NT$ | NT$ | NT$ | NT$ | NT$ | ||||||||||||||||
| Cost | ||||||||||||||||||||
| Balance at January 1, 2016 | $ | 915,636 | $ | 3,338,360 | $ | 154,082 | $ | 193,338 | $ | 4,601,416 | ||||||||||
| Additions (Note 37) | - | 372,188 | 301,351 | 1,605 | 675,144 | |||||||||||||||
| Disposals or derecognization | (41,099 | ) | (80,537 | ) | (1,310 | ) | - | (122,946 | ) | |||||||||||
| Reclassification | - | - | 786 | - | 786 | |||||||||||||||
| Acquisitions through business combinations | 41,099 | - | 64,380 | 30 | 105,509 | |||||||||||||||
| Effect of foreign currency exchange differences | - | (77,782 | ) | (4,846 | ) | (2,581 | ) | (85,209 | ) | |||||||||||
| Balance at December 31, 2016 | $ | 915,636 | $ | 3,552,229 | $ | 514,443 | $ | 192,392 | $ | 5,174,700 | ||||||||||
| Accumulated amortization | ||||||||||||||||||||
| Balance at January 1, 2016 | $ | 641,234 | $ | 2,385,038 | $ | 138,386 | $ | 54,665 | $ | 3,219,323 | ||||||||||
| Amortization expense | 121,412 | 345,836 | 24,154 | 17,421 | 508,823 | |||||||||||||||
| Disposals or derecognization | (41,099 | ) | (58,765 | ) | (1,310 | ) | - | (101,174 | ) | |||||||||||
| Reclassification | - | - | 786 | - | 786 | |||||||||||||||
| Acquisitions through business combinations | - | - | 483 | 23 | 506 | |||||||||||||||
| Effect of foreign currency exchange differences | - | (63,407 | ) | (7,283 | ) | (135 | ) | (70,825 | ) | |||||||||||
| Balance at December 31, 2016 | $ | 721,547 | $ | 2,608,702 | $ | 155,216 | $ | 71,974 | $ | 3,557,439 | ||||||||||
F-45F-60
| Customer relationships | Computer software | Others | Total | |||||||||||||
| NT$ | NT$ | NT$ | NT$ | |||||||||||||
| Accumulated amortization | ||||||||||||||||
| Balance at January 1, 2013 | $ | 776,600 | $ | 2,738,397 | $ | 1,664,364 | $ | 5,179,361 | ||||||||
| Amortization expense | 147,594 | 256,147 | 370,563 | 774,304 | ||||||||||||
| Disposals or derecognization | - | (6,022 | ) | (5,272 | ) | (11,294 | ) | |||||||||
| Reclassification | - | 25 | - | 25 | ||||||||||||
| Acquisitions through business combinations | - | 688 | - | 688 | ||||||||||||
| Effect of foreign currency exchange differences | - | 13,593 | 1,004 | 14,597 | ||||||||||||
| Balance at December 31, 2013 | $ | 924,194 | $ | 3,002,828 | $ | 2,030,659 | $ | 5,957,681 | ||||||||
(Concluded)
For the year ended December 31, 20142017
| Customer relationships | Computer software | Others | Total | |||||||||||||
| NT$ | NT$ | NT$ | NT$ | |||||||||||||
| Cost | ||||||||||||||||
| Balance at January 1, 2014 | $ | 1,579,015 | $ | 3,679,835 | $ | 2,304,655 | $ | 7,563,505 | ||||||||
| Additions | - | 375,623 | 20,843 | 396,466 | ||||||||||||
| Disposals or derecognization | - | (1,232,757 | ) | (6,406 | ) | (1,239,163 | ) | |||||||||
| Reclassification | - | 6,228 | - | 6,228 | ||||||||||||
| Effect of foreign currency exchange differences | - | 54,002 | 4,456 | 58,458 | ||||||||||||
| Balance at December 31, 2014 | $ | 1,579,015 | $ | 2,882,931 | $ | 2,323,548 | $ | 6,785,494 | ||||||||
| Accumulated amortization | ||||||||||||||||
| Balance at January 1, 2014 | $ | 924,194 | $ | 3,002,828 | $ | 2,030,659 | $ | 5,957,681 | ||||||||
| Amortization expense | 153,320 | 269,375 | 123,039 | 545,734 | ||||||||||||
| Disposals or derecognization | - | (1,227,346 | ) | - | (1,227,346 | ) | ||||||||||
| Reclassification | - | 2,516 | - | 2,516 | ||||||||||||
| Effect of foreign currency exchange differences | - | 37,431 | 1,607 | 39,038 | ||||||||||||
| Balance at December 31, 2014 | $ | 1,077,514 | $ | 2,084,804 | $ | 2,155,305 | $ | 5,317,623 | ||||||||
| Customer relationships | Computer software | Patents and acquired specific technology | Others | Total | ||||||||||||||||
| NT$ | NT$ | NT$ | NT$ | NT$ | ||||||||||||||||
| Cost | ||||||||||||||||||||
| Balance at January 1, 2017 | $ | 915,636 | $ | 3,552,229 | $ | 514,443 | $ | 192,392 | $ | 5,174,700 | ||||||||||
| Additions | - | 265,497 | - | 12,328 | 277,825 | |||||||||||||||
| Disposals | - | (83,595 | ) | (123,744 | ) | (4,978 | ) | (212,317 | ) | |||||||||||
| Effect of foreign currency exchange differences | - | (47,679 | ) | (1,213 | ) | (988 | ) | (49,880 | ) | |||||||||||
| Balance at December 31, 2017 | $ | 915,636 | $ | 3,686,452 | $ | 389,486 | $ | 198,754 | $ | 5,190,328 | ||||||||||
| Accumulated amortization | ||||||||||||||||||||
| Balance at January 1, 2017 | $ | 721,547 | $ | 2,608,702 | $ | 155,216 | $ | 71,974 | $ | 3,557,439 | ||||||||||
| Amortization expense | 80,313 | 316,580 | 43,493 | 17,280 | 457,666 | |||||||||||||||
| Disposals | - | (72,481 | ) | (123,743 | ) | - | (196,224 | ) | ||||||||||||
| Effect of foreign currency exchange differences | - | (30,680 | ) | (4,882 | ) | 144 | (35,418 | ) | ||||||||||||
| Balance at December 31, 2017 | $ | 801,860 | $ | 2,822,121 | $ | 70,084 | $ | 89,398 | $ | 3,783,463 | ||||||||||
For the year ended December 31, 20152018
| Customer relationships | Computer software | Others | Total | |||||||||||||
| NT$ | NT$ | NT$ | NT$ | |||||||||||||
| Cost | ||||||||||||||||
| Balance at January 1, 2015 | $ | 1,579,015 | $ | 2,882,932 | $ | 2,323,547 | $ | 6,785,494 | ||||||||
| Additions | - | 481,412 | 9,723 | 491,135 | ||||||||||||
| Disposals or derecognization | (663,379 | ) | (8,426 | ) | (1,984,118 | ) | (2,655,923 | ) | ||||||||
| Reclassification | - | 12,360 | - | 12,360 | ||||||||||||
| Customer relationships | Computer software | Patents and acquired specific technology | Others | Total | ||||||||||||||||
| NT$ | NT$ | NT$ | NT$ | NT$ | ||||||||||||||||
| Cost | ||||||||||||||||||||
| Balance at January 1, 2018 | $ | 915,636 | $ | 3,686,452 | $ | 389,486 | $ | 198,754 | $ | 5,190,328 | ||||||||||
| Additions | - | 528,883 | - | 8,776 | 537,659 | |||||||||||||||
| Disposals | - | (95,358 | ) | (231 | ) | (4,000 | ) | (99,589 | ) | |||||||||||
| Acquisition through business combinations (Note 30) | 11,000,000 | 274,868 | 20,200,000 | 32,800 | 31,507,668 | |||||||||||||||
| Effect of foreign currency exchange differences | - | 6,200 | (899 | ) | (332 | ) | 4,969 | |||||||||||||
| Balance at December 31, 2018 | $ | 11,915,636 | $ | 4,401,045 | $ | 20,588,356 | $ | 235,998 | $ | 37,141,035 | ||||||||||
(Continued)
F-46F-61
| Customer relationships | Computer software | Others | Total | |||||||||||||
| NT$ | NT$ | NT$ | NT$ | |||||||||||||
| Effect of foreign currency exchange differences | $ | - | $ | (29,918 | ) | $ | (1,732 | ) | $ | (31,650 | ) | |||||
| Balance at December 31, 2015 | $ | 915,636 | $ | 3,338,360 | $ | 347,420 | $ | 4,601,416 | ||||||||
| Accumulated amortization | ||||||||||||||||
| Balance at January 1, 2015 | $ | 1,077,514 | $ | 2,084,804 | $ | 2,155,305 | $ | 5,317,623 | ||||||||
| Amortization expense | 227,099 | 325,856 | 26,939 | 579,894 | ||||||||||||
| Disposals or derecognization | (663,379 | ) | (7,402 | ) | (1,983,914 | ) | (2,654,695 | ) | ||||||||
| Reclassification | - | 3,190 | - | 3,190 | ||||||||||||
| Effect of foreign currency exchange differences | - | (21,410 | ) | (5,279 | ) | (26,689 | ) | |||||||||
| Balance at December 31, 2015 | $ | 641,234 | $ | 2,385,038 | $ | 193,051 | $ | 3,219,323 | ||||||||
| Customer relationships | Computer software | Patents and acquired specific technology | Others | Total | ||||||||||||||||
| NT$ | NT$ | NT$ | NT$ | NT$ | ||||||||||||||||
| Accumulated amortization | ||||||||||||||||||||
| Balance at January 1, 2018 | $ | 801,860 | $ | 2,822,121 | $ | 70,084 | $ | 89,398 | $ | 3,783,463 | ||||||||||
| Amortization expense | 746,979 | 373,536 | 1,263,309 | 18,626 | 2,402,450 | |||||||||||||||
| Disposals | - | (95,202 | ) | (231 | ) | (4,000 | ) | (99,433 | ) | |||||||||||
| Acquisition through business combinations (Note 30) | - | 137,799 | - | 15,483 | 153,282 | |||||||||||||||
| Effect of foreign currency exchange differences | - | 3,109 | (475 | ) | 939 | 3,573 | ||||||||||||||
| Balance at December 31, 2018 | $ | 1,548,839 | $ | 3,241,363 | $ | 1,332,687 | $ | 120,446 | $ | 6,243,335 | ||||||||||
(Concluded)
| Customer relationships | Computer software | Others | Total | |||||||||||||
| US$ (Note 4) | US$ (Note 4) | US$ (Note 4) | US$ (Note 4) | |||||||||||||
| Cost | ||||||||||||||||
| Balance at January 1, 2015 | $ | 48,155 | $ | 87,921 | $ | 70,861 | $ | 206,937 | ||||||||
| Additions | - | 14,682 | 297 | 14,979 | ||||||||||||
| Disposals or derecognization | (20,231 | ) | (257 | ) | (60,510 | ) | (80,998 | ) | ||||||||
| Reclassification | - | 377 | - | 377 | ||||||||||||
| Effect of foreign currency exchange differences | - | (912 | ) | (53 | ) | (965 | ) | |||||||||
| Balance at December 31, 2015 | $ | 27,924 | $ | 101,811 | $ | 10,595 | $ | 140,330 | ||||||||
| Accumulated amortization | ||||||||||||||||
| Balance at January 1, 2015 | $ | 32,861 | $ | 63,580 | $ | 65,731 | $ | 162,172 | ||||||||
| Amortization expense | 6,926 | 9,938 | 821 | 17,685 | ||||||||||||
| Disposals or derecognization | (20,231 | ) | (226 | ) | (60,503 | ) | (80,960 | ) | ||||||||
| Reclassification | - | 97 | - | 97 | ||||||||||||
| Effect of foreign currency exchange differences | - | (652 | ) | (162 | ) | (814 | ) | |||||||||
| Balance at December 31, 2015 | $ | 19,556 | $ | 72,737 | $ | 5,887 | $ | 98,180 | ||||||||
| Customer relationships | Computer software | Patents and acquired specific technology | Others | Total | ||||||||||||||||
| US$ (Note 4) | US$ (Note 4) | US$ (Note 4) | US$ (Note 4) | US$ (Note 4) | ||||||||||||||||
| Cost | ||||||||||||||||||||
| Balance at January 1, 2018 | $ | 29,913 | $ | 120,433 | $ | 12,724 | $ | 6,493 | $ | 169,563 | ||||||||||
| Additions | - | 17,278 | - | 287 | 17,565 | |||||||||||||||
| Disposals | - | (3,115 | ) | (8 | ) | (131 | ) | (3,254 | ) | |||||||||||
| Acquisition through business combinations | 359,359 | 8,980 | 659,915 | 1,072 | 1,029,326 | |||||||||||||||
| Effect of foreign currency exchange differences | - | 202 | (29 | ) | (11 | ) | 162 | |||||||||||||
| Balance at December 31, 2018 | $ | 389,272 | $ | 143,778 | $ | 672,602 | $ | 7,710 | $ | 1,213,362 | ||||||||||
| Accumulated amortization | ||||||||||||||||||||
| Balance at January 1, 2018 | $ | 26,196 | $ | 92,196 | $ | 2,290 | $ | 2,921 | $ | 123,603 | ||||||||||
| Amortization expense | 24,403 | 12,203 | 41,271 | 608 | 78,485 | |||||||||||||||
| Disposals | - | (3,110 | ) | (8 | ) | (131 | ) | (3,249 | ) | |||||||||||
| Acquisition through business combinations | - | 4,502 | - | 506 | 5,008 | |||||||||||||||
| Effect of foreign currency exchange differences | - | 101 | (16 | ) | 31 | 116 | ||||||||||||||
| Balance at December 31, 2018 | $ | 50,599 | $ | 105,892 | $ | 43,537 | $ | 3,935 | $ | 203,963 | ||||||||||
F-62
Each class of other intangible assets except a portion of customer relationships amortized based on the pattern in which the economic benefits are consumed, werewas amortized on the straight-line basis over the following useful lives:
Customer relationships | 11 years | ||||
| Computer software | 2-10 years | ||||
| Patents and acquired specific technology | 5-15 years | ||||
| Others | 5-32 years |
F-47
| LONG-TERM PREPAYMENTS FOR LEASE |
Long-term prepayments for lease mainly representrepresented land use rightrights located in China with periods for use from 5030 to 70 years. As of December 31, 2014years and 2015, the carrying amount of the land use right which the Group was in the process of obtaining the certificates was NT$17,594 thousand and nil, respectively. During 2014, the land use right located in China which the Group obtained the certificates was reclassified from long-term prepayments for leasewill expire through 2048 to construction in progress under inventories related to real estate business.2089.
| BORROWINGS |
| a. | Short-term borrowings |
Bank loans
Short-term borrowings mainly represented unsecured revolving bank loans with annual interest rates at 0.81%-6.00%0.80%-4.79% and 0.57%-5.78%0.76%-5.10% as of December 31, 20142017 and 2015,2018, respectively.
| b. |
Short-term bills payable outstanding as of December 31, 2015 represented commercial papers NT$4,350,000 thousand (US$132,662 thousand) less unamortized discounts of NT$1,946 thousand (US$59 thousand) with annual interest rate at 0.78%. The commercial papers were secured by China Bills Finance Corporation and Mega Bills Finance Corporation.
| Long-term borrowings |
| 1) | Bank loans |
As of December 31, 2014 and 2015, the long-term bank loans with fixed interest rates were NT$1,192,975 thousand and NT$1,500,000 thousand (US$45,746 thousand), respectively, with annual interest rates at 1.10%-6.15% and 1.17%, respectively. The long-term bank loans with fixed interest rate will be repayable in December 2018. As of December 31, 2014 and 2015, the current portion of long-term bank loans with fixed interest rates were NT$116,876 thousand and nil, respectively. The others were long-term bank loans with floating interest rate and consisted of the followings:
| December 31 | ||||||||||||
| 2014 | 2015 | |||||||||||
| NT$ | NT$ | US$ (Note 4) | ||||||||||
| Working capital bank loans | ||||||||||||
| Syndicated bank loans - repayable through April 2016 to July 2018, annual interest rates were 0.90%-1.83% and 1.56%-1.92% as of December 31, 2014 and 2015, respectively | $ | 10,760,548 | $ | 12,159,037 | $ | 370,816 | ||||||
| Others - repayable through June 2016 to August 2019, annual interest rates were 1.03%-3.74% and 0.90%-3.98% as of December 31, 2014 and 2015, respectively | 12,479,650 | 25,660,638 | 782,575 | |||||||||
(Continued)
| December 31 | ||||||||||||
| 2017 | 2018 | |||||||||||
| NT$ | NT$ | US$ (Note 4) | ||||||||||
| Working capital bank loans | ||||||||||||
| Syndicated bank loans - repayable through May 2019 to May 2023, annual interest rates were 2.61% -2.70% and 1.80% as of December 31, 2017 and 2018, respectively | $ | 4,761,600 | $ | 55,000,000 | $ | 1,796,798 | ||||||
| Others - repayable through February 2019 to October 2023, annual interest rates were 0.93%-2.10% and 0.75%-3.77% as of December 31, 2017 and 2018, respectively | 23,941,947 | 75,533,354 | 2,467,604 | |||||||||
| Mortgage loans | ||||||||||||
| Repayable through July 2019 to June 2023, annual interest rates were 4.95%-5.39% and 5.39% as of December 31, 2017 and 2018 | 4,705,149 | 4,393,826 | 143,542 | |||||||||
| 33,408,696 | 134,927,180 | 4,407,944 | ||||||||||
| Less: unamortized arrangement fee | 1,200 | 128,083 | 4,184 | |||||||||
| 33,407,496 | 134,799,097 | 4,403,760 | ||||||||||
| Less: current portion | 8,261,625 | 10,779,034 | 352,141 | |||||||||
| $ | 25,145,871 | $ | 124,020,063 | $ | 4,051,619 | |||||||
F-48F-63
| December 31 | ||||||||||||
| 2014 | 2015 | |||||||||||
| NT$ | NT$ | US$ (Note 4) | ||||||||||
| Mortgage loans | ||||||||||||
| Repayable through July 2016 to June 2023, annual interest rates were 6.77% and 4.95%-5.39% as of December 31, 2014 and 2015, respectively | $ | 2,534,483 | $ | 3,251,139 | $ | 99,150 | ||||||
| 25,774,681 | 41,070,814 | 1,252,541 | ||||||||||
| Less: unamortized arrangement fee | 32,225 | 18,670 | 569 | |||||||||
| 25,742,456 | 41,052,144 | 1,251,972 | ||||||||||
| Less: current portion | 2,714,131 | 2,057,465 | 62,747 | |||||||||
| $ | 23,028,325 | $ | 38,994,679 | $ | 1,189,225 | |||||||
(Concluded)
Pursuant to some of the above syndicatedworking capital bank loans agreements, the Company and some of its subsidiaries should maintain certain financial covenants including current ratio, leverage ratio, tangible net assets and interest coverage ratio. Such financial ratios are calculated based on the Group’seach of their annual audited consolidated financial statements or semi-annual reviewed consolidated financial statements or subsidiaries’ annual audited financial statements under local GAAP.statements. The Company and its subsidiaries were in compliance with all of the loanfinancial covenants as of December 31, 20142017 and 2015.
The Group had sufficient long term credit facility obtained before December 31, 2015 to refinance a portion of loans on a long-term basis. Therefore, NT$2,105,883 thousand (US$64,223 thousand) was not classified as current portion of long-term borrowings as of December 31, 2015.2018.
| 2) |
Long-term bills payable represented unsecured commercial paper NT$2,000,000 thousand (US$60,994 thousand) less unamortized discounts of NT$1,011 thousand (US$31 thousand) with annual interest rate at 1.03% as of December 31, 2015. The commercial paper contract was entered into with Ta Ching Bills Finance Corporation and the duration is 3 years.
| December 31 | ||||||||||||
| 2017 | 2018 | |||||||||||
| NT$ | NT$ | US$ (Note 4) | ||||||||||
| China Bills Finance Corporation, repayable in February 2020, annual interest rate were 0.96% and 0.99% as of December 31, 2017 and 2018, respectively | $ | 1,000,000 | $ | 1,000,000 | $ | 32,669 | ||||||
| International Bills Finance Corporation, repayable in March 2020, annual interest rate were 0.96% and %1.00% as of December 31, 2017 and 2018, respectively | 1,000,000 | 1,000,000 | 32,669 | |||||||||
| Ta Ching Bills Finance Corporation, repayable in January 2020, annual interest rates was 0.98% as of December 31, 2018 | - | 1,100,000 | 35,936 | |||||||||
| 2,000,000 | 3,100,000 | 101,274 | ||||||||||
| Less: unamortized discounts | 868 | 768 | 25 | |||||||||
| $ | 1,999,132 | $ | 3,099,232 | $ | 101,249 | |||||||
| BONDS PAYABLE |
| December 31 | ||||||||||||
| 2014 | 2015 | |||||||||||
| NT$ | NT$ | US$ (Note 4) | ||||||||||
| Secured domestic bonds - secured by banks | ||||||||||||
| Repayable at maturity in August 2016 and interest due annually with annual interest rate 1.45% | $ | 8,000,000 | $ | 8,000,000 | $ | 243,977 | ||||||
| Unsecured convertible overseas bonds | ||||||||||||
| US$400,000 thousand | 12,660,000 | 13,130,000 | 400,427 | |||||||||
| US$200,000 thousand (linked to New Taiwan dollar) | - | 6,185,600 | 188,643 | |||||||||
| December 31 | ||||||||||||
| 2017 | 2018 | |||||||||||
| NT$ | NT$ | US$ (Note 4) | ||||||||||
| Unsecured domestic bonds | ||||||||||||
| Repayable at maturity in January 2021 and interest due annually with annual interest rate at 1.30% | $ | 7,000,000 | $ | 7,000,000 | $ | 228,683 | ||||||
| Repayable at maturity in January 2023 and interest due annually with annual interest rate at 1.50% | 2,000,000 | 2,000,000 | 65,338 | |||||||||
| Repayable at maturity in January 2022 and interest due annually with annual interest rate at 1.25% | 3,700,000 | 3,700,000 | 120,876 | |||||||||
| Repayable at maturity in January 2024 and interest due annually with annual interest rate at 1.45% | 4,300,000 | 4,300,000 | 140,477 | |||||||||
(Continued)
F-49F-64
| December 31 | ||||||||||||
| 2014 | 2015 | |||||||||||
| NT$ | NT$ | US$ (Note 4) | ||||||||||
| Secured overseas bonds - secured by the Company | ||||||||||||
| US$300,000 thousand, repayable at maturity in July 2017; interest due semi-annually with annual interest rate 2.125% | $ | 9,495,000 | $ | 9,847,500 | $ | 300,320 | ||||||
| CNY500,000 thousand, repayable at maturity in September 2016 and interest due semi-annually with annual interest rate 4.25% | 2,586,207 | 2,527,489 | 77,081 | |||||||||
| 32,741,207 | 39,690,589 | 1,210,448 | ||||||||||
| Less: discounts on bonds payable | 1,471,076 | 1,264,339 | 38,559 | |||||||||
| 31,270,131 | 38,426,250 | 1,171,889 | ||||||||||
| Less: current portion | - | 14,685,866 | 447,876 | |||||||||
| $ | 31,270,131 | $ | 23,740,384 | $ | 724,013 | |||||||
(Concluded)
| December 31 | ||||||||||||
| 2017 | 2018 | |||||||||||
| NT$ | NT$ | US$ (Note 4) | ||||||||||
| Unsecured convertible overseas bonds | ||||||||||||
| US$200,000 thousand (linked to New Taiwan dollar) | $ | 6,185,600 | $ | - | $ | - | ||||||
| 23,185,600 | 17,000,000 | 555,374 | ||||||||||
| Less: discounts on bonds payable | 42,820 | 14,064 | 459 | |||||||||
| 23,142,780 | 16,985,936 | 554,915 | ||||||||||
| Less: current portion | 6,161,197 | - | - | |||||||||
| $ | 16,981,583 | $ | 16,985,936 | $ | 554,915 | |||||||
The Group had sufficient long term credit facility obtained before December 31, 2015 to refinance a portion of the bonds payable on a long-term basis. Therefore, NT$8,000,000 thousand (US$243,977 thousand) was not classified as current portion of bonds payable as of December 31, 2015.
| a. | In September 2013, |
The Bonds may be redeemed at the option of the Company, in whole or in part, at any time on or after the third anniversary of the offering date provided that (1) the closing price, translated into U.S. dollars, of the common shares for a period of 20 consecutive trading days is at least 130% of the conversion price, (2) at least 90% in aggregate principal amount of the Bonds originally outstanding has been redeemed, repurchased and canceled or converted, or (3) the Company is required to pay additional taxes on the Bonds as a result of certain changes in tax laws in the ROC.
Each holder shall have the right to request the Company repurchase all or any portion of the principal amount thereof of a holder’s Bonds (1) on the third anniversary of the offering date, (2) in the event of a change of control, or (3) in the event of delisting.
The Bonds contained a debt host contract, recognized as bonds payable, and the conversion option, redemption option and put option (collectively the “Bonds Options”) aggregately recognized as financial liabilities at FVTPL. The effective interest rate of the debt host contract was 3.16% and the aggregate fair value of the Bonds Options was NT$1,667,950 thousand on initial recognition.
| b. | In July 2015, |
F-50
converted back to U.S. dollar amount using the applicable prevailing rate at the time of repayment, redemption or put. Each holder of the Currency Linked Bonds has the right at any time on or after August 11, 2015 and up to (and including) March 17, 2018, except during legal lock-up period, to convert the Currency Linked Bonds into common shares at the conversion price NT$54.55, determined on the basis of the Fixed Exchange Rate. The Company’s treasury shares will be available for delivery upon conversion of the Currency Linked Bonds. The conversion price will be adjusted in accordance with the conversion provisions due to anti-dilution clause. As of December 31, 2015, the conversion price was NT$51.73 (US$1.58).
The Currency Linked Bonds may be redeemed at the option of the Company, in whole or in part, at any time on or after March 19, 2018 provided that (1) the closing price, translated into U.S. dollars, of the common shares for a period of 20 out of 30 consecutive trading days is at least 130% of the conversion price, (2) at least 90% in aggregate principal amount of the Currency Linked Bonds originally outstanding has been redeemed, repurchased and canceled or converted, or (3) the Company is required to pay additional taxes on the Currency Linked Bonds as a result of certain changes in tax laws in the ROC.
Each holder shall have the right to request the Company repurchase all or any portion of the principal amount thereof of a holder’s Currency Linked Bonds (1) in the event of a change of control, or (2) in the event of delisting.
The Currency Linked Bonds contained a debt host contract, recognized as bonds payable, and the conversion option, recognized as capital surplus. The effective interest rate of the debt host contract was 1.58% and the fair value of the conversion option was NT$214,022 thousand (US$6,527 thousand) on initial recognition.
| c. | To focus on corporate sustainability and to carry out the commitment to environmental protection and energy conservation, Anstock II Limited, a subsidiary the Company 100% owned, offered overseas bonds in US$300,000 thousand with the maturity of 3 years and annual interest rate of 2.125% (the “Green Bonds”) in July 2014. The Green Bonds are unconditionally and irrevocably guaranteed by |
| d. | In October 2014, SPIL offered the fourth unsecured convertible overseas bonds (the “SPIL Bonds”) in US$400,000 thousand. The SPIL Bonds are zero coupon bonds with a maturity of 5 years. During May 1, 2018 to June 30, 2018, all outstanding SPIL Bonds of US$148,000 thousand were converted into SPIL’s ordinary shares and then such ordinary shares were repurchased by the Company with a total consideration of NT$5,216,985 thousand (US$170,434 thousand) (NT$51.2 (US$1.67) per ordinary share, 0.3% securities transactions tax not yet deducted) pursuant to the supplemental indenture. In addition, capital surplus arising from the difference between consideration received and the carrying amount of the subsidiaries’ net assets during actual disposal or acquisition was decreased by NT$388,491 thousand (US$12,692 thousand). |
F-65
| OTHER PAYABLES |
| December 31 | ||||||||||||
| 2014 | 2015 | |||||||||||
| NT$ | NT$ | US$ (Note 4) | ||||||||||
| Payables for property, plant and equipment | $ | 7,097,129 | $ | 4,782,357 | $ | 145,848 | ||||||
| Accrued salary and bonus | 5,550,040 | 5,826,982 | 177,706 | |||||||||
| Accrued bonus to employees or employees’ compensation and remuneration to directors and supervisors | 2,602,796 | 2,270,608 | 69,247 | |||||||||
| Accrued employee insurance | 572,259 | 599,218 | 18,274 | |||||||||
| Accrued utilities | 495,404 | 466,956 | 14,241 | |||||||||
| Accrued legal settlement fee | 814,185 | - | - | |||||||||
| Others | 5,232,703 | 5,248,697 | 160,070 | |||||||||
| $ | 22,364,516 | $ | 19,194,818 | $ | 585,386 | |||||||
| December 31 | ||||||||||||
| 2017 | 2018 | |||||||||||
| NT$ | NT$ | US$ (Note 4) | ||||||||||
| Accrued salary and bonus | $ | 7,292,254 | $ | 10,591,202 | $ | 346,005 | ||||||
| Payables for property, plant and equipment | 4,623,268 | 7,995,634 | 261,210 | |||||||||
| Accrued employees’ compensation and remuneration to directors | 2,568,880 | 3,038,417 | 99,262 | |||||||||
| Accrued employee insurance | 657,176 | 875,638 | 28,606 | |||||||||
| Accrued utilities | 417,257 | 427,106 | 13,953 | |||||||||
| Payables for patents and acquired specific technology (Note 37) | 93,000 | 57,590 | 1,882 | |||||||||
| Others | 5,726,052 | 8,018,295 | 261,950 | |||||||||
| $ | 21,377,887 | $ | 31,003,882 | $ | 1,012,868 | |||||||
The Company and its subsidiary, ASE US, reached the final settlement agreement with Tessera Inc. (“Tessera”) in October 2014 to resolve the patent infringement lawsuit, and Tessera has dismissed all claims against the Company and ASE US. The final settlement amount was NT$814,185 thousand (US$27,000 thousand as resolved in the final settlement agreement in October 2014) and paid in January 2015.
F-51
| RETIREMENT BENEFIT PLANS |
| a. | Defined contribution plans |
| 1) | The pension plan under the |
| 2) | The subsidiaries located in China, U.S.A., Malaysia, Singapore and Mexico also make contributions at various ranges according to relevant local regulations. |
| b. | Defined benefit plans |
| 1) | The Company and its subsidiaries in Taiwan joined the defined benefit pension plan under the |
| 2) | ASE Japan has a pension plan under which eligible employees with more than ten years of service are entitled to receive pension benefits based on their length of service and salaries at the time of termination of employment. ASE Japan makes contributions based on a certain amount of pension cost to employees. |
ASE Korea also has a pension plan under which eligible employees and directors with more than one year of service are entitled to receive a lump-sum payment upon termination of their service with ASE Korea, based on their length of service and salaries at the time of termination. ASE Korea makes contributions based on a certain percentage of pension cost to an external financial institutionadministered by the management and in the names of employees.
F-66
| 3) | ASE, |
| 4) |
Except the pension plans for executive managers, the key assumptions used for the actuarial valuations were as follow:
F-52
| December 31 | ||||||||
| 2014 | 2015 | |||||||
| Discount rates | 0.12%-4.03% | 0.15%-3.48% | ||||||
| Expected rates of salary increase | 2.00%-4.70% | 2.00%-4.57% | ||||||
| For the Years Ended December 31 | ||||||||||||||||
| 2013 | 2014 | 2015 | ||||||||||||||
| NT$ | NT$ | NT$ | US$ (Note 4) | |||||||||||||
| Operating cost | $ | 337,069 | $ | 345,309 | $ | 319,151 | $ | 9,733 | ||||||||
| Selling and marketing expenses | 10,181 | 11,448 | 10,160 | 310 | ||||||||||||
| General and administrative expenses | 43,381 | 35,867 | 43,753 | 1,334 | ||||||||||||
| Research and development expenses | 34,797 | 36,526 | 38,124 | 1,163 | ||||||||||||
| $ | 425,428 | $ | 429,150 | $ | 411,188 | $ | 12,540 | |||||||||
| The amounts included in the consolidated balance sheets arising from the Group’s obligation in respect of its defined benefit plans excluding those for executive managers were as follows: |
| December 31 | ||||||||||||
| 2014 | 2015 | |||||||||||
| NT$ | NT$ | US$ (Note 4) | ||||||||||
| Present value of funded defined benefit obligation | $ | 7,674,293 | $ | 7,973,676 | $ | 243,174 | ||||||
| Fair value of plan assets | (3,502,487 | ) | (3,973,729 | ) | (121,187 | ) | ||||||
| Present value of unfunded defined benefit obligation | 4,171,806 | 3,999,947 | 121,987 | |||||||||
| Recorded under others payables | (1,028 | ) | (138,959 | ) | (4,238 | ) | ||||||
| Recorded under prepaid pension cost | 11,910 | 11,910 | 363 | |||||||||
| Net defined benefit liability | $ | 4,182,688 | $ | 3,872,898 | $ | 118,112 | ||||||
| December 31 | ||||||||||||
| 2017 | 2018 | |||||||||||
| NT$ | NT$ | US$ (Note 4) | ||||||||||
| Present value of the defined benefit obligation | $ | 7,910,638 | $ | 10,297,139 | $ | 336,398 | ||||||
| Fair value of the plan assets | (4,341,373 | ) | (5,492,123 | ) | (179,423 | ) | ||||||
| Present value of unfunded defined benefit obligation | 3,569,265 | 4,805,016 | 156,975 | |||||||||
| Recorded under other payables | (24,638 | ) | (18,791 | ) | (614 | ) | ||||||
| Recorded under other current assets | 182,421 | 11,910 | 389 | |||||||||
| Net defined benefit liability | $ | 3,727,048 | $ | 4,798,135 | $ | 156,750 | ||||||
F-53
Movements in net defined benefit liability (asset) were as follows:
| Present value of the defined benefit obligation | Fair value of the plan assets | Net defined benefit liability (asset) | ||||||||||
| NT$ | NT$ | NT$ | ||||||||||
| Balance at January 1, 2013 | $ | 7,751,862 | $ | (2,682,803 | ) | $ | 5,069,059 | |||||
| Service cost | ||||||||||||
| Current service cost | 347,629 | - | 347,629 | |||||||||
| Net interest expense (income) | 156,157 | (78,358 | ) | 77,799 | ||||||||
| Recognized in profit or loss | 503,786 | (78,358 | ) | 425,428 | ||||||||
| Remeasurement | ||||||||||||
| Return on plan assets (excluding amounts included in net interest) | - | 16,983 | 16,983 | |||||||||
| Actuarial gain arising from changes in financial assumptions | (465,360 | ) | - | (465,360 | ) | |||||||
| Actuarial loss arising from experience adjustments | 35,839 | - | 35,839 | |||||||||
| Actuarial loss arising from changes in demographic assumptions | 313 | - | 313 | |||||||||
| Recognized in other comprehensive income | (429,208 | ) | 16,983 | (412,225 | ) | |||||||
| Contributions from the employer | - | (470,592 | ) | (470,592 | ) | |||||||
| Benefits paid from the pension fund | (154,608 | ) | 154,608 | - | ||||||||
| Benefits paid from the Group | (99,025 | ) | - | (99,025 | ) | |||||||
| Exchange differences on foreign plans | (100,662 | ) | (58,642 | ) | (159,304 | ) | ||||||
| Balance at December 31, 2013 | 7,472,145 | (3,118,804 | ) | 4,353,341 | ||||||||
| Service cost | ||||||||||||
| Current service cost | 327,707 | - | 327,707 | |||||||||
| Past service cost | 22,036 | - | 22,036 | |||||||||
| Net interest expense (income) | 189,043 | (109,636 | ) | 79,407 | ||||||||
| Recognized in profit or loss | 538,786 | (109,636 | ) | 429,150 | ||||||||
| Remeasurement | ||||||||||||
| Return on plan assets (excluding amounts included in net interest) | - | 29,338 | 29,338 | |||||||||
| Actuarial gain arising from changes in financial assumptions | (46,913 | ) | - | (46,913 | ) | |||||||
| Actuarial loss arising from experience adjustments | 38,516 | - | 38,516 | |||||||||
| Actuarial loss arising from changes in demographic assumptions | 7,204 | - | 7,204 | |||||||||
Present Value of the Defined Benefit Obligation | Fair Value of the Plan Assets | Net Defined Benefit Liability (Asset) | ||||||||||
| NT$ | NT$ | NT$ | ||||||||||
| Balance at January 1, 2016 | $ | 7,973,676 | $ | (3,973,729 | ) | $ | 3,999,947 | |||||
| Service cost | ||||||||||||
| Current service cost | 329,838 | - | 329,838 | |||||||||
| Net interest expense (income) | 167,111 | (109,080 | ) | 58,031 | ||||||||
| Recognized in profit or loss | 496,949 | (109,080 | ) | 387,869 | ||||||||
| Remeasurement | ||||||||||||
| Return on plan assets (excluding amounts included in net interest) | - | 54,549 | 54,549 | |||||||||
| Actuarial loss arising from changes in financial assumptions | 156,193 | - | 156,193 | |||||||||
| Actuarial loss arising from experience adjustments | 200,723 | - | 200,723 | |||||||||
| Actuarial loss arising from changes in demographic assumptions | 5,716 | - | 5,716 | |||||||||
| Recognized in other comprehensive income | 362,632 | 54,549 | 417,181 | |||||||||
| Contributions from the employer | - | (807,232 | ) | (807,232 | ) | |||||||
| Benefits paid from the pension fund | (308,471 | ) | 308,471 | - | ||||||||
| Benefits paid from the Group | (36,033 | ) | - | (36,033 | ) | |||||||
(Continued)
F-54F-67
| Present value of the defined benefit obligation | Fair value of the plan assets | Net defined benefit liability (asset) | ||||||||||
| NT$ | NT$ | NT$ | ||||||||||
| Recognized in other comprehensive income | $ | (1,193 | ) | $ | 29,338 | $ | 28,145 | |||||
| Contributions from the employer | - | (556,555 | ) | (556,555 | ) | |||||||
| Benefits paid from the pension fund | (292,996 | ) | 292,996 | - | ||||||||
| Benefits paid from the Group | (16,237 | ) | - | (16,237 | ) | |||||||
| Exchange differences on foreign plans | (26,212 | ) | (39,826 | ) | (66,038 | ) | ||||||
| Balance at December 31, 2014 | 7,674,293 | (3,502,487 | ) | 4,171,806 | ||||||||
| Service cost | ||||||||||||
| Current service cost | 335,655 | - | 335,655 | |||||||||
| Net interest expense (income) | 183,889 | (108,356 | ) | 75,533 | ||||||||
| Recognized in profit or loss | 519,544 | (108,356 | ) | 411,188 | ||||||||
| Remeasurement | ||||||||||||
| Return on plan assets (excluding amounts included in net interest) | - | 12,426 | 12,426 | |||||||||
| Actuarial loss arising from changes in financial assumptions | 309,695 | - | 309,695 | |||||||||
| Actuarial gain arising from experience adjustments | (243,363 | ) | - | (243,363 | ) | |||||||
| Actuarial gain arising from changes in demographic assumptions | (15,847 | ) | - | (15,847 | ) | |||||||
| Recognized in other comprehensive income | 50,485 | 12,426 | 62,911 | |||||||||
| Contributions from the employer | - | (611,581 | ) | (611,581 | ) | |||||||
| Benefits paid from the pension fund | (192,928 | ) | 192,928 | - | ||||||||
| Benefits paid from the Group | (43,088 | ) | - | (43,088 | ) | |||||||
| Exchange differences on foreign plans | (34,630 | ) | 43,341 | 8,711 | ||||||||
| Balance at December 31, 2015 | $ | 7,973,676 | $ | (3,973,729 | ) | $ | 3,999,947 | |||||
(Concluded)
Present Value of the Defined Benefit Obligation | Fair Value of the Plan Assets | Net Defined Benefit Liability (Asset) | ||||||||||
| NT$ | NT$ | NT$ | ||||||||||
| Liabilities assumed in a business combination | $ | 535 | $ | (535 | ) | $ | - | |||||
| Exchange differences on foreign plans | (99,404 | ) | 110,189 | 10,785 | ||||||||
| Balance at December 31, 2016 | 8,389,884 | (4,417,367 | ) | 3,972,517 | ||||||||
| Service cost | ||||||||||||
| Current service cost | 278,412 | - | 278,412 | |||||||||
| Past service cost and gain on settlements | (68,979 | ) | - | (68,979 | ) | |||||||
| Net interest expense (income) | 157,404 | (103,741 | ) | 53,663 | ||||||||
| Recognized in profit or loss | 366,837 | (103,741 | ) | 263,096 | ||||||||
| Remeasurement | ||||||||||||
| Return on plan assets (excluding amounts included in net interest) | - | 52,124 | 52,124 | |||||||||
| Actuarial loss arising from changes in financial assumptions | 56,860 | - | 56,860 | |||||||||
| Actuarial gain arising from experience adjustments | (315,090 | ) | - | (315,090 | ) | |||||||
| Actuarial loss arising from changes in demographic assumptions | 762 | - | 762 | |||||||||
| Recognized in other comprehensive income | (257,468 | ) | 52,124 | (205,344 | ) | |||||||
| Contributions from the employer | - | (484,790 | ) | (484,790 | ) | |||||||
| Benefits paid from the pension fund | (690,830 | ) | 690,830 | - | ||||||||
| Benefits paid from the Group | (96,575 | ) | - | (96,575 | ) | |||||||
| Exchange differences on foreign plans | 198,790 | (78,429 | ) | 120,361 | ||||||||
| Balance at December 31, 2017 | 7,910,638 | (4,341,373 | ) | 3,569,265 | ||||||||
| Service cost | ||||||||||||
| Current service cost | 224,126 | - | 224,126 | |||||||||
| Net interest expense (income) | 178,779 | (122,709 | ) | 56,070 | ||||||||
| Recognized in profit or loss | 402,905 | (122,709 | ) | 280,196 | ||||||||
| Remeasurement | ||||||||||||
| Return on plan assets (excluding amounts included in net interest) | - | (16,589 | ) | (16,589 | ) | |||||||
| Actuarial gain arising from changes in financial assumptions | (8,643 | ) | - | (8,643 | ) | |||||||
| Actuarial loss arising from experience adjustments | 302,499 | - | 302,499 | |||||||||
| Actuarial loss arising from changes in demographic assumptions | 8,190 | - | 8,190 | |||||||||
| Actuarial loss arising from changes in other assumptions | 22,723 | - | 22,723 | |||||||||
| Present value of the defined benefit obligation | Fair value of the plan assets | Net defined benefit liability (asset) | ||||||||||
| US$ (Note 4) | US$ (Note 4) | US$ (Note 4) | ||||||||||
| Balance at January 1, 2015 | $ | 234,044 | $ | (106,816 | ) | $ | 127,228 | |||||
(Continued)
F-55F-68
| Present value of the defined benefit obligation | Fair value of the plan assets | Net defined benefit liability (asset) | ||||||||||
| US$ (Note 4) | US$ (Note 4) | US$ (Note 4) | ||||||||||
| Service cost | ||||||||||||
| Current service cost | $ | 10,237 | $ | - | $ | 10,237 | ||||||
| Net interest expense (income) | 5,608 | (3,305 | ) | 2,303 | ||||||||
| Recognized in profit or loss | 15,845 | (3,305 | ) | 12,540 | ||||||||
| Remeasurement | ||||||||||||
| Return on plan assets (excluding amounts included in net interest) | - | 379 | 379 | |||||||||
| Actuarial loss arising from changes in financial assumptions | 9,445 | - | 9,445 | |||||||||
| Actuarial gain arising from experience adjustments | (7,422 | ) | - | (7,422 | ) | |||||||
| Actuarial gain arising from changes in demographic assumptions | (484 | ) | - | (484 | ) | |||||||
| Recognized in other comprehensive income | 1,539 | 379 | 1,918 | |||||||||
| Contributions from the employer | - | (18,651 | ) | (18,651 | ) | |||||||
| Benefits paid from the pension fund | (5,884 | ) | 5,884 | - | ||||||||
| Benefits paid from the Group | (1,314 | ) | - | (1,314 | ) | |||||||
| Exchange differences on foreign plans | (1,056 | ) | 1,322 | 266 | ||||||||
| Balance at December 31, 2015 | $ | 243,174 | $ | (121,187 | ) | $ | 121,987 | |||||
| (Concluded) | ||||||||||||
Present Value of the Defined Benefit Obligation | Fair Value of the Plan Assets | Net Defined Benefit Liability (Asset) | ||||||||||
| NT$ | NT$ | NT$ | ||||||||||
| Recognized in other comprehensive income | $ | 324,769 | $ | (16,589 | ) | $ | 308,180 | |||||
| Contributions from the employer | - | (364,237 | ) | (364,237 | ) | |||||||
| Benefits paid from the pension fund | (541,989 | ) | 541,989 | - | ||||||||
| Benefits paid from the Group | (295,953 | ) | - | (295,953 | ) | |||||||
| Business combinations | 2,522,805 | (1,210,524 | ) | 1,312,281 | ||||||||
| Exchange differences on foreign plans | (26,036 | ) | 21,320 | (4,716 | ) | |||||||
| Balance at December 31, 2018 | $ | 10,297,139 | $ | (5,492,123 | ) | $ | 4,805,016 | |||||
(Concluded)
Present Value of the Defined Benefit Obligation | Fair Value of the Plan Assets | Net Defined Benefit Liability (Asset) | ||||||||||
| US$ (Note 4) | US$ (Note 4) | US$ (Note 4) | ||||||||||
| Balance at January 1, 2018 | $ | 258,433 | $ | (141,829 | ) | $ | 116,604 | |||||
| Service cost | ||||||||||||
| Current service cost | 7,322 | - | 7,322 | |||||||||
| Net interest expense (income) | 5,841 | (4,009 | ) | 1,832 | ||||||||
| Recognized in profit or loss | 13,163 | (4,009 | ) | 9,154 | ||||||||
| Remeasurement | ||||||||||||
| Return on plan assets (excluding amounts included in net interest) | - | (542 | ) | (542 | ) | |||||||
| Actuarial gain arising from changes in financial assumptions | (282 | ) | - | (282 | ) | |||||||
| Actuarial loss arising from experience adjustments | 9,882 | - | 9,882 | |||||||||
| Actuarial loss arising from changes in demographic assumptions | 268 | - | 268 | |||||||||
| Actuarial loss arising from changes in other assumptions | 742 | - | 742 | |||||||||
| Recognized in other comprehensive income | 10,610 | (542 | ) | 10,068 | ||||||||
| Contributions from the employer | - | (11,899 | ) | (11,899 | ) | |||||||
| Benefits paid from the pension fund | (17,706 | ) | 17,706 | - | ||||||||
| Benefits paid from the Group | (9,669 | ) | - | (9,669 | ) | |||||||
| Business combinations | 82,418 | (39,547 | ) | 42,871 | ||||||||
| Exchange differences on foreign plans | (851 | ) | 697 | (154 | ) | |||||||
| Balance at December 31, 2018 | $ | 336,398 | $ | (179,423 | ) | $ | 156,975 | |||||
F-69
| The fair value of the plan assets by major categories at each balance sheet date was as follows: |
| December 31 | ||||||||||||
| 2014 | 2015 | |||||||||||
| NT$ | NT$ | US$ (Note 4) | ||||||||||
| Cash and cash equivalents | $ | 1,854,926 | $ | 2,090,399 | $ | 63,751 | ||||||
| Debt instruments | 691,720 | 1,020,532 | 31,123 | |||||||||
| Equity instruments | 869,752 | 823,496 | 25,114 | |||||||||
| Others | 86,089 | 39,302 | 1,199 | |||||||||
| Total | $ | 3,502,487 | $ | 3,973,729 | $ | 121,187 | ||||||
| December 31 | ||||||||||||
| 2017 | 2018 | |||||||||||
| NT$ | NT$ | US$ (Note 4) | ||||||||||
| Cash | $ | 2,317,764 | $ | 2,340,903 | $ | 76,475 | ||||||
| Debt instruments | 691,619 | 902,886 | 29,497 | |||||||||
| Equity instruments | 1,254,109 | 2,164,895 | 70,725 | |||||||||
| Others | 77,881 | 83,439 | 2,726 | |||||||||
| Total | $ | 4,341,373 | $ | 5,492,123 | $ | 179,423 | ||||||
| Through the defined benefit plans under the Labor Standards Law of the |
| a) | Investment risk |
The plan assets are invested in equity and debt securities, bank deposits, etc. The investment is conducted at the discretion of the Bureau or under the mandated management. However, inaccordance with relevant regulations, the return generated by plan assets should not be below the interest rate for a 2-year time deposit with local banks.
F-56
| b) | Interest risk |
A decrease in the government bond interest rate will increase the present value of the defined benefit obligation; however, this will be partially offset by an increase in the return on the plan’s debt investments.
| c) | Salary risk |
The present value of the defined benefit obligation is calculated by reference to the future salaries of plan participants. As such, an increase in the salary of the plan participants will increase the present value of the defined benefit obligation.
| The management of ASE Korea is responsible for the administration of the fund and determination of the investment strategies according to related local regulations. ASE Korea is responsible for the shortfall between the fund and the defined benefit obligation. |
| December 31 | ||||||||||||
| 2014 | 2015 | |||||||||||
| NT$ | NT$ | US$ (Note 4) | ||||||||||
| Discount Rate | ||||||||||||
| 0.5% higher | $ | (440,350 | ) | $ | (444,132 | ) | $ | (13,545 | ) | |||
| 0.5% lower | $ | 503,593 | $ | 497,046 | $ | 15,158 | ||||||
| Expected rates of salary increase | ||||||||||||
| 0.5% higher | $ | 493,722 | $ | 476,378 | $ | 14,528 | ||||||
| 0.5% lower | $ | (430,706 | ) | $ | (426,130 | ) | $ | (12,996 | ) | |||
| December 31 | ||||||
| 2017 | 2018 | |||||
| Discount rates (%) | 0.06-3.85 | 0.05-3.02 | ||||
| Expected rates of salary increase (%) | 2.00-4.42 | 1.75-4.06 | ||||
The sensitivity analysis below has been determined based on reasonably possible changes of the respective assumptions occurring at each balance sheet date, while holding all other assumptions constant.
F-70
| December 31 | ||||||||||||
| 2017 | 2018 | |||||||||||
| NT$ | NT$ | US$ (Note 4) | ||||||||||
| Discount Rate | ||||||||||||
| 0.5% higher | $ | (455,158 | ) | $ | (555,181 | ) | $ | (18,137 | ) | |||
| 0.5% lower | $ | 461,891 | $ | 603,089 | $ | 19,702 | ||||||
| Expected rates of salary increase | ||||||||||||
| 0.5% higher | $ | 453,792 | $ | 591,712 | $ | 19,331 | ||||||
| 0.5% lower | $ | (444,493 | ) | $ | (547,522 | ) | $ | (17,887 | ) | |||
The sensitivity analysis presented above may not be representative of the actual change in the defined benefit obligation as it is unlikely that the change in assumptions would occur in isolation of one another as some of the assumptions may be correlated.
| Maturity analysis of undiscounted pension benefit |
| December 31 | ||||||||||||
| 2014 | 2015 | |||||||||||
| NT$ | NT$ | US$ (Note 4) | ||||||||||
| No later than 1 year | $ | 249,000 | $ | 247,030 | $ | 7,534 | ||||||
| Later than 1 year and not later than 5 years | 1,462,070 | 1,616,804 | 49,308 | |||||||||
| Later than 5 years | 14,468,022 | 17,674,518 | 539,021 | |||||||||
| $ | 16,179,092 | $ | 19,538,352 | $ | 595,863 | |||||||
| December 31 | ||||||||||||
| 2017 | 2018 | |||||||||||
| NT$ | NT$ | US$ (Note 4) | ||||||||||
| No later than 1 year | $ | 291,152 | $ | 368,592 | $ | 12,042 | ||||||
| Later than 1 year but not later than 5 years | 1,551,496 | 1,886,738 | 61,638 | |||||||||
| Later than 5 years | 16,507,747 | 13,322,695 | 435,240 | |||||||||
| $ | 18,350,395 | $ | 15,578,025 | $ | 508,920 | |||||||
The Group expectsexpected to make contributions of NT$705,384272,911 thousand and NT$484,247 thousand (US$21,51215,820 thousand) to the defined benefit plans excluding those for executive managers in the next year starting from January 1, 2016.2018 and 2019, respectively.
F-57
As of December 31, 20142017 and 2015,2018, the average duration of the defined benefit obligation excluding those for executive managers of the Group was 8 to 14 years and 9 to 18 years and 8 to 1615 years, respectively.
| EQUITY |
| a. | Share capital |
Ordinary shares
December 31, 2014 | December 31, 2015 | |||||||
| Numbers of shares authorized (in thousands) | 10,000,000 | 10,000,000 | ||||||
| Numbers of shares reserved (in thousands) | ||||||||
| Employee share options | 800,000 | 800,000 | ||||||
| Numbers of shares registered (in thousands) | 7,852,538 | 7,902,929 | ||||||
| Numbers of shares subscribed in advance (in thousands) | 9,187 | 7,499 | ||||||
| Number of shares issued and fully paid (in thousands) | 7,861,725 | 7,910,428 | ||||||
| December 31 | ||||||||
| 2017 | 2018 | |||||||
| Numbers of shares authorized (in thousands) | 10,000,000 | 5,000,000 | ||||||
| Numbers of shares reserved (in thousands) | ||||||||
| Employee share options | 800,000 | 400,000 | ||||||
| Number of shares issued and fully paid (in thousands) | 8,738,079 | 4,321,714 | ||||||
December 31, 2014 | December 31, 2015 | |||||||||||
| NT$ | NT$ | US$ (Note 4) | ||||||||||
| Share capital authorized | $ | 100,000,000 | $ | 100,000,000 | $ | 3,049,710 | ||||||
| Share capital reserved | ||||||||||||
| Employee share options | $ | 8,000,000 | $ | 8,000,000 | $ | 243,977 | ||||||
| Share capital registered | $ | 78,525,378 | $ | 79,029,290 | $ | 2,410,165 | ||||||
| Share capital subscribed in advance | 189,801 | 156,370 | 4,769 | |||||||||
| Share capital issued | $ | 78,715,179 | $ | 79,185,660 | $ | 2,414,934 | ||||||
F-71
| December 31 | ||||||||||||
| 2017 | 2018 | |||||||||||
| NT$ | NT$ | US$ (Note 4) | ||||||||||
| Share capital authorized | $ | 100,000,000 | $ | 50,000,000 | $ | 1,633,453 | ||||||
| Share capital reserved | ||||||||||||
| Employee share options | $ | 8,000,000 | $ | 4,000,000 | $ | 130,676 | ||||||
| Share capital issued and fully paid | $ | 87,380,787 | $ | 43,217,144 | $ | 1,411,864 | ||||||
As disclosed in Note 1, the Company acquired 100% shareholdings of ASE through share exchange at an exchange ratio of 1 ordinary share of ASE for 0.5 ordinary share of the Company. The holders of issued ordinary shares with a par value at $10NT$10 per share are entitled the right to vote and receive dividends, except the shares held by the Group’s subsidiaries which are not entitled the right to vote. As of December 31, 2014 and 2015, there wereBefore the share exchange, 500,000 thousand ordinary shares included in theASE’s authorized shares thatas of December 31, 2017 were not yet required to complete the share registration process.
In July 2013, theDecember 2016, ASE’s board of directors approved the issueissuance of 130,000300,000 thousand ordinary shares for cash capital increase at NT$26.134.3 per share. The aforementioned cash capital increaseASE has been approved bycompleted the Financial Supervisory Commission of the ROC (the “FSC”) and effectively registered on August 15, 2013. The record date ofregistration formalities for the cash capital increase wasincrease.
As disclosed in Note 22, there were 424,258 thousand ordinary shares issued under the conversion of Bonds in 2017. The record dates of 101,164 thousand and 323,094 thousand ordinary shares were July 13, 2017 and October 2, 2013 and the Company13, 2017, respectively. ASE has completed the registration formalities.
American Depositary Receipts
The CompanyASE issued ADSs and each ADS represents five5 ordinary shares.shares of ASE. On April 30, 2018, ASE’s ADSs were fully exchanged to the Company’s ADSs and each of the Company’s ADS represents 2 ordinary shares of the Company. As of December 31, 20142017 and 2015, 125,7312018, 115,261 thousand and 115,240140,042 thousand ADSs were outstanding and represented approximately 628,657576,305 thousand ordinary shares of ASE and 576,198280,085 thousand ordinary shares of the Company, respectively.
F-58
| b. | Capital surplus |
| December 31 | ||||||||||||
| 2014 | 2015 | |||||||||||
| NT$ | NT$ | US$ (Note 4) | ||||||||||
May be used to offset a deficit, distributed as cash dividends, or transferred to share capital (1) | ||||||||||||
| Arising from issuance of ordinary shares | $ | 4,946,308 | $ | 5,479,616 | $ | 167,112 | ||||||
| Arising from the difference between consideration received and the carrying amount of the subsidiaries’ net assets during actual disposal or acquisition (Note 27) | - | 7,197,510 | 219,503 | |||||||||
| May be used to offset a deficit only | ||||||||||||
| Arising from changes in percentage of ownership interest in subsidiaries (2) | 9,055,250 | 8,491,435 | 258,964 | |||||||||
| Arising from treasury share transactions | 425,004 | 717,355 | 21,877 | |||||||||
| Arising from exercised employee share options | 375,448 | 544,112 | 16,594 | |||||||||
| Arising from expired employee share options | 3,626 | 3,626 | 111 | |||||||||
| May not be used for any purpose | ||||||||||||
| Arising from employee share options | 1,178,210 | 1,080,590 | 32,955 | |||||||||
| Arising from equity component of convertible bonds | - | 214,022 | 6,527 | |||||||||
| Arising from share of changes in capital surplus of associates | 30,134 | 30,284 | 924 | |||||||||
| $ | 16,013,980 | $ | 23,758,550 | $ | 724,567 | |||||||
| December 31 | ||||||||||||
| 2017 | 2018 | |||||||||||
| NT$ | NT$ | US$ (Note 4) | ||||||||||
May be used to offset a deficit, distributed as cash dividends, or transferred to share capital (1) | ||||||||||||
| Issuance of ordinary shares | $ | 21,553,853 | $ | 12,906,401 | $ | 421,640 | ||||||
| Merger by share exchange | - | 117,693,658 | 3,844,942 | |||||||||
| Conversion of bonds payable | 1,930,066 | - | - | |||||||||
| Difference between consideration and the carrying amount of the subsidiaries’ net assets during actual disposal or acquisition | 7,176,958 | 6,034,102 | 197,128 | |||||||||
| 30,660,877 | 136,634,161 | 4,463,710 | ||||||||||
(Continued)
F-72
| December 31 | ||||||||||||
| 2017 | 2018 | |||||||||||
| NT$ | NT$ | US$ (Note 4) | ||||||||||
| May be used to offset a deficit only | ||||||||||||
| Changes in percentage of ownership interest in subsidiaries (2) | $ | 6,084,895 | $ | 3,727,336 | $ | 121,768 | ||||||
| Treasury share transactions | 1,151,345 | 182,354 | 5,957 | |||||||||
| Exercised employee share options | 1,089,178 | 1,366,480 | 44,642 | |||||||||
| Expired share options (Notes 22 and 29) | 223,454 | 645,978 | 21,103 | |||||||||
| Share of changes in capital surplus of associates | 83,733 | 87,136 | 2,847 | |||||||||
| Dividends that the claim period has elapsed and unclaimed by shareholders | - | 872 | 29 | |||||||||
| 8,632,605 | 6,010,156 | 196,346 | ||||||||||
| May not be used for any purpose | ||||||||||||
| Employee share options | 960,888 | 583,542 | 19,064 | |||||||||
| Equity component of convertible bonds | 214,022 | - | - | |||||||||
| Others (3) | 155,936 | 48,805 | 1,594 | |||||||||
| 1,330,846 | 632,347 | 20,658 | ||||||||||
| $ | 40,624,328 | $ | 143,276,664 | $ | 4,680,714 | |||||||
(Concluded)
| 1) | Such capital surplus may be used to offset a deficit; in addition, when the Company has no deficit, such capital surplus may be distributed as cash dividends or transferred to share capital (limited to a certain percentage of the Company’s capital surplus and once a year). |
| 2) | Such capital surplus arises from the effect of changes in ownership interest in a subsidiary resulted from equity transactions other than actual disposal or acquisition, or from changes in capital surplus of subsidiaries accounted for |
| 3) | Such capital surplus represents the excess of the carrying amount of related accounts over the par value due to employee share options exercised and the Company has not completed registration formalities. |
As disclosed in Note 1, share exchange between the Company and ASE was deemed as an organization restructure under common control and the Company recorded the same amounts of equity which were related to ASE’s assets and liabilities (the “continued equity”) and then recognized capital surplus arising from merger by share exchange in the amount of the excess of ASE’s total equity over the Company’s share capital and the continued equity.
In addition, the Company’s special shareholders’ meeting held in June 2018 resolved to distribute cash in NT$10,795,980 thousand (US$352,695 thousand) from capital surplus arising from issuance of ordinary shares.
F-73
| c. | Retained earnings and dividend policy |
The Articles of Incorporation of ASE Inc.the Company (the “Articles”) provides that annual net income shall be distributed in the following order:
| 1) | Replenishment of deficits; |
| 2) | 10.0% as legal reserve; |
| 3) | Special reserve appropriated or reversed in accordance with laws or regulations set forth by the authorities concerned; |
F-59
| 4) |
| Addition or deduction of realized gains or losses on equity instruments at fair value through other comprehensive |
EmployeesThe Articles also provides the policy of the employees’ compensation and remuneration of directors, refer to whom referredemployees’ compensation and the remuneration of directors in 7) above include employees of subsidiaries that meet certain conditions, which are to be determined by the board of directors.Note 26(g).
The Company is currently in the mature growth stage. To meet the capital needs for business development now and in the future and satisfy the shareholders’ demand for cash inflows, the Company shall use residual dividend policy to distribute dividends, of which the cash dividend is not lower than 30% of the total dividend distribution, with the remainder to be distributed in stock.shares. A distribution plan is also to be made by the board of directors and passed for resolution in the shareholders’ meeting.
In accordance with the amendments to the Company Act of the ROC in May 2015, the recipients of dividends and bonuses are limited to shareholders and do not include employees. Accordingly, the Company expects to make amendments to the Company’s Articles of Incorporation to be approved during the 2016 annual shareholders’ meeting. For information about the accrual basis of the employee compensation and remuneration to directors and supervisors and the actual appropriations, please refer to employee benefits expense under profit before income tax in Note 22 (f).
Under Rule No. 1010012865 and Rule No. 1010047490 issued by the FSC and the directive titled “Questions and Answers for Special Reserves Appropriated Following Adoption of IFRSs”, the Company should appropriate or reverse to a special reserve. Any special reserve appropriated may be reversed to the extent that the net debit balance reverses and thereafter distributed.
Appropriation of earnings to legal reserve shall be made until the legal reserve equals the Company’s capital surplus.share capital. Legal reserve may be used to offset deficits. If the Company has no deficit and the legal reserve has exceeded 25% of the Company’s share capital, surplus, the excess may be transferred to capital or distributed in cash.
The appropriationsItems referred to under Rule No. 1010012865 and Rule No. 1010047490 issued by the FSC and in the directive titled “Questions and Answers for Special Reserves Appropriated Following Adoption of earnings for 2013 and 2014 resolved at the Company’s annual shareholders’ meetings in June 2014 and June 2015, respectively, were as follows:
| Appropriation of Earnings | Dividends Per Share | |||||||||||||||
| For Year 2013 | For Year 2014 | For Year 2013 | For Year 2014 | |||||||||||||
| NT$ | NT$ | NT$ | NT$ | |||||||||||||
| (in dollars) | (in dollars) | |||||||||||||||
| Legal reserve | $ | 1,568,907 | $ | 2,359,267 | ||||||||||||
| Special reserve | (309,992 | ) | - | |||||||||||||
| Cash dividends | 10,156,005 | 15,589,825 | $ | 1.30 | $ | 2.00 | ||||||||||
| $ | 11,414,920 | $ | 17,949,092 | |||||||||||||
F-60
On January 1, 2013, the CompanyIFRSs” should be appropriated to theor reversed from a special reserve of NT$3,353,938 thousand relating toby the exchange differences on translating foreign operations transferred to retained earnings in accordance with the local regulations.Company.
| 1) | Exchange differences on translating foreign operations |
| For the Years Ended December 31 | ||||||||||||||||
| 2013 | 2014 | 2015 | ||||||||||||||
| NT$ | NT$ | NT$ | US$ (Note 4) | |||||||||||||
| Balance at January 1 | $ | (3,210,248 | ) | $ | (525,521 | ) | $ | 4,540,862 | $ | 138,483 | ||||||
| Exchange differences arising on translating foreign operations | 2,685,647 | 5,064,616 | 11,459 | 349 | ||||||||||||
| Share of exchange difference of associates accounted for using the equity method | (920 | ) | 1,767 | (59,650 | ) | (1,819 | ) | |||||||||
| Balance at December 31 | $ | (525,521 | ) | $ | 4,540,862 | $ | 4,492,671 | $ | 137,013 | |||||||
| For the Year Ended December 31 | ||||||||||||||||
| 2016 | 2017 | 2018 | ||||||||||||||
| NT$ | NT$ | NT$ | US$ (Note 4) | |||||||||||||
| Balance at January 1 | $ | 4,492,671 | $ | (1,643,623 | ) | $ | (6,733,659 | ) | $ | (219,982 | ) | |||||
| Exchange differences on translating foreign operations | (5,843,856 | ) | (4,952,815 | ) | 426,186 | 13,923 | ||||||||||
| Share from associates and joint venture accounted for using the equity method | (292,438 | ) | (137,221 | ) | 136,608 | 4,463 | ||||||||||
| Disposal of associates and joint venture accounted for using the equity method | - | - | 282,291 | 9,222 | ||||||||||||
| Balance at December 31 | $ | (1,643,623 | ) | $ | (6,733,659 | ) | $ | (5,888,574 | ) | $ | (192,374 | ) | ||||
F-74
| 2) | Unrealized gain (loss) on available-for-sale financial assets |
| For the Years Ended December 31 | ||||||||||||||||
| 2013 | 2014 | 2015 | ||||||||||||||
| NT$ | NT$ | NT$ | US$ (Note 4) | |||||||||||||
| Balance at January 1 | $ | 355,254 | $ | 426,246 | $ | 526,778 | $ | 16,065 | ||||||||
| Unrealized gain (loss) arising on revaluation of available-for-sale financial assets | 14,985 | (142,418 | ) | (4,304 | ) | (131 | ) | |||||||||
| Cumulative loss (gain) reclassified to profit or loss on disposal of available-for-sale financial assets | (96 | ) | 9,561 | 10,827 | 330 | |||||||||||
| Share of unrealized gain on available-for-sale financial assets of associates accounted for using the equity method | 56,103 | 233,389 | 54,818 | 1,672 | ||||||||||||
| Balance at December 31 | $ | 426,246 | $ | 526,778 | $ | 588,119 | $ | 17,936 | ||||||||
For the Year Ended December 31, 2016 | For the Year Ended December 31, 2017 | |||||||
| NT$ | NT$ | |||||||
| Balance at January 1 | $ | 588,119 | $ | (197,314 | ) | |||
| Unrealized gain (loss) arising on revaluation of available-for-sale financial assets | (257,240 | ) | 169,585 | |||||
| Cumulative loss reclassified to profit or loss on impairment of available-for-sale financial assets | - | 50,206 | ||||||
Cumulative loss (gain) reclassified to profit or loss on disposal of available-for-sale financial assets | 7,512 | (1,517 | ) | |||||
| Share from associates and joint venture accounted for using the equity method | (535,705 | ) | 401,610 | |||||
| Balance at December 31 | $ | (197,314 | ) | $ | 422,570 | |||
F-61
| 3) |
| For the Years Ended December 31 | ||||||||
| 2013 | 2014 | |||||||
| NT$ | NT$ | |||||||
| Balance at January 1 | $ | (3,755 | ) | $ | (3,279 | ) | ||
| Gain (loss) arising on changes in the fair value of hedging instruments - Interest rate swap contracts | (2,597 | ) | 795 | |||||
| Cumulative loss arising on changes in fair value of hedging instruments reclassified to profit or loss – Interest rate swap contracts | 3,842 | 2,484 | ||||||
| Income tax related to cash flow hedges | (769 | ) | - | |||||
| Balance at December 31 | $ | (3,279 | ) | $ | - | |||
For the Year Ended December 31, 2018 | ||||||||
| NT$ | US$ (Note 4) | |||||||
| Balance at January 1 per IAS 39 | $ | 422,570 | $ | 13,805 | ||||
| Adjustment on initial application of IFRS 9 (Note 3) | (287,053 | ) | (9,377 | ) | ||||
| Balance at January 1 per IFRS 9 | 135,517 | 4,428 | ||||||
| Unrealized gain (loss) recognized during the year | ||||||||
| Debt instruments | (63,076 | ) | (2,061 | ) | ||||
| Equity instruments | (398,513 | ) | (13,019 | ) | ||||
Share from associates and joint venture accounted for using the equity method | (555,271 | ) | (18,140 | ) | ||||
| Realized loss (gain) recognized during the year | ||||||||
| Disposal of equity instruments and transferred cumulative gain to retained earnings | (1,518 | ) | (50 | ) | ||||
Disposal of associates and joint venture accounted for using the equity method | (133,364 | ) | (4,357 | ) | ||||
Share from associates and joint venture accounted for using the equity method | 1,118 | 36 | ||||||
| Balance at December 31 | $ | (1,015,107 | ) | $ | (33,163 | ) | ||
As of December 31, 2013, the outstanding interest rate swap contracts of the Group were as follows:
| Maturity Period | Notional Amount (In Thousands) | Interest Rates Paid (%) | Interest Rates Received (%) | Expected Period for Future Cash Flow | Expected Period for the Recognition of Gains or Losses from Hedging | |||||
| December 31, 2013 | ||||||||||
| 2014.04 | CNY 240,000 | 2.00 | 1.05-2.80 | 2014 | 2014 |
| Treasury shares (in thousand shares) |
| Balance at | Balance at | |||||||
| January 1 | Addition | Decrease | December 31 | |||||
| 2013 | ||||||||
| Shares held by subsidiaries | 145,883 | - | - | 145,883 | ||||
| 2014 | ||||||||
| Shares held by subsidiaries | 145,883 | - | - | 145,883 | ||||
| 2015 | ||||||||
| Shares held by subsidiaries | 145,883 | - | - | 145,883 | ||||
| Shares reserved for bonds conversion | - | 120,000 | - | 120,000 | ||||
| 145,883 | 120,000 | - | 265,883 | |||||
| Balance at | Balance at | |||||||||||||||
| January 1 | Addition | Decrease | December 31 | |||||||||||||
| 2016 | ||||||||||||||||
| Shares held by subsidiaries | 145,883 | - | - | 145,883 | ||||||||||||
| Shares reserved for bonds conversion | 120,000 | - | - | 120,000 | ||||||||||||
| 265,883 | - | - | 265,883 | |||||||||||||
In February 2015, the board of directors approved to repurchase up to 120,000 thousand of the Company’s ordinary shares which will be used for equity conversion of convertible overseas bonds to be issued in the future. The Company has completed the repurchase during March 2015 and the shares repurchased accounted for 1.53% of the Company’s total issued shares. The average repurchase price was NT$44.45 (US$1.36) per share.(Continued)
F-62F-75
| Balance at | Balance at | |||||||||||||||
| January 1 | Addition | Decrease | December 31 | |||||||||||||
| 2017 | ||||||||||||||||
| Shares held by subsidiaries | 145,883 | - | - | 145,883 | ||||||||||||
| Shares reserved for bonds conversion | 120,000 | - | - | 120,000 | ||||||||||||
| 265,883 | - | - | 265,883 | |||||||||||||
| 2018 | ||||||||||||||||
| Shares held by subsidiaries | 145,883 | - | (72,942 | ) | 72,941 | |||||||||||
| Shares reserved for bonds conversion | 120,000 | - | (120,000 | ) | - | |||||||||||
| Shares repurchased from dissenting shareholders in accordance with Business Mergers And Acquisitions Act | - | 1,852 | (1,852 | ) | - | |||||||||||
| 265,883 | 1,852 | (194,794 | ) | 72,941 | ||||||||||||
(Concluded)
The Company’s shares held by its subsidiaries at each balance sheet date were as follows:
Shares Held By | Carrying amount | Carrying amount | Fair Value | Fair Value | ||||||||||||||||
| (in thousand shares) | NT$ | US$ (Note 4) | NT$ | US$ (Note 4) | ||||||||||||||||
| December 31, 2014 | ||||||||||||||||||||
| ASE Test | 88,200 | $ | 1,380,721 | $ | 3,360,438 | |||||||||||||||
| J&R Holding | 46,704 | 381,709 | 1,779,413 | |||||||||||||||||
| ASE Test, Inc. | 10,979 | 196,677 | 418,291 | |||||||||||||||||
| 145,883 | $ | 1,959,107 | $ | 5,558,142 | ||||||||||||||||
| December 31, 2015 | ||||||||||||||||||||
| ASE Test | 88,200 | $ | 1,380,721 | $ | 42,108 | $ | 3,351,618 | $ | 102,215 | |||||||||||
| J&R Holding | 46,704 | 381,709 | 11,641 | 1,774,743 | 54,124 | |||||||||||||||
| ASE Test, Inc. | 10,979 | 196,677 | 5,998 | 417,193 | 12,723 | |||||||||||||||
| 145,883 | $ | 1,959,107 | $ | 59,747 | $ | 5,543,554 | $ | 169,062 | ||||||||||||
Shares Held By Subsidiaries | Carrying Amount | Carrying Amount | Fair Value | Fair Value | ||||||||||||||||
| (in thousand shares) | NT$ | US$ (Note 4) | NT$ | US$ (Note 4) | ||||||||||||||||
| December 31, 2017 | ||||||||||||||||||||
| ASE Test | 88,200 | $ | 1,380,721 | $ | 3,364,848 | |||||||||||||||
| J&R Holding | 46,704 | 381,709 | 1,781,749 | |||||||||||||||||
| ASE Test, Inc. | 10,979 | 196,677 | 418,840 | |||||||||||||||||
| 145,883 | $ | 1,959,107 | $ | 5,565,437 | ||||||||||||||||
| December 31, 2018 | ||||||||||||||||||||
| ASE Test | 44,100 | $ | 1,380,721 | $ | 45,107 | $ | 2,571,044 | $ | 83,994 | |||||||||||
| J&R Holding | 23,352 | 381,709 | 12,470 | 1,361,415 | 44,476 | |||||||||||||||
| ASE Test, Inc. | 5,489 | 196,677 | 6,425 | 320,031 | 10,455 | |||||||||||||||
| 72,941 | $ | 1,959,107 | $ | 64,002 | $ | 4,252,490 | $ | 138,925 | ||||||||||||
Fair values of the Company’s shares held by subsidiaries are based on the closing price from an available published price quotation, which is a Level 1 input in terms of IFRS 13, at the balance sheet dates.
The CompanyIn March 2018, ASE’s board of directors approved, in accordance with Business Mergers and Acquisitions Act, to repurchase ASE’s 1,852 thousand ordinary shares at $38.5 per share held by the shareholders dissenting on the share exchange transaction which has been approved by both of ASE and SPIL’s special shareholders’ meetings on February 12, 2018. In addition, ASE’s board of directors approved a capital reduction in April 2018 to cancel ASE’s 121,852 thousand treasury shares and the record date was April 9, 2018. ASE has completed the registration formalities before April 30, 2018.
F-76
ASE issued ordinary shares in connection with its merger with its subsidiaries. The shares held by its subsidiaries were reclassified from investments accounted for using the equity method to treasury shares on the proportion owned by ASE. As disclosed in Note 1, ASE’s ordinary shares held by subsidiaries were exchanged to the Company.Company’s ordinary shares on April 30, 2018 in accordance with the joint share exchange agreement.
Under the Securities and Exchange Act in the ROC, the Company shall neither pledge treasury shares nor exercise shareholders’ rights on these shares, such as rights to dividends and voting. The subsidiaries holding the aforementioned treasury shares however, retain shareholders’ rights except the rights to participate in any share issuance forcapital increase by cash and voting.
| Non-controlling interests |
| For the Years Ended December 31 | ||||||||||||||||
| 2013 | 2014 | 2015 | ||||||||||||||
| NT$ | NT$ | NT$ | US$ (Note 4) | |||||||||||||
| Balance at January 1 | $ | 3,505,743 | $ | 4,128,361 | $ | 8,209,860 | $ | 250,377 | ||||||||
| Attributable to non-controlling interests: | ||||||||||||||||
| Share of profit for the year | 465,656 | 640,499 | 968,567 | 29,538 | ||||||||||||
| Exchange difference on translating foreign operations | 131,621 | 340,392 | (74,968 | ) | (2,286 | ) | ||||||||||
| Unrealized gain (loss) on available-for-sale financial assets | (50 | ) | (857 | ) | 3,928 | 120 | ||||||||||
| Defined benefit plan actuarial losses | (3,385 | ) | (857 | ) | (3,440 | ) | (105 | ) | ||||||||
| For the Year Ended December 31 | ||||||||||||||||
| 2016 | 2017 | 2018 | ||||||||||||||
| NT$ | NT$ | NT$ | US$ (Note 4) | |||||||||||||
| Balance at January 1 | $ | 11,492,545 | $ | 12,000,551 | $ | 13,190,129 | $ | 430,909 | ||||||||
| Adjustment on initial application of IFRS 15 (Note 3) | - | - | 5,183 | 169 | ||||||||||||
| Balance at January 1 per IFRS 15 | 11,492,545 | 12,000,551 | 13,195,312 | 431,078 | ||||||||||||
| Share of profit for the year | 1,253,438 | 1,677,941 | 1,204,217 | 39,341 | ||||||||||||
| Other comprehensive income (loss) | ||||||||||||||||
| Exchange difference on translating foreign operations | (601,787 | ) | (334,920 | ) | (198,365 | ) | (6,480 | ) | ||||||||
| Unrealized gain on available-for-sale financial assets | 1,129 | 5,763 | - | - | ||||||||||||
| Unrealized loss on equity instruments at FVTOCI | - | - | (23,928 | ) | (782 | ) | ||||||||||
| Remeasurement on defined benefit plans | 8,846 | (13,724 | ) | (30,079 | ) | (983 | ) | |||||||||
| Non-controlling interests arising from acquisition of subsidiaries (Note 30) | - | - | 3,582,866 | 117,049 | ||||||||||||
| Acquisition of non-controlling interests in subsidiaries | 42,857 | - | (2,492,915 | ) | (81,441 | ) | ||||||||||
| Partial disposal of subsidiaries (Note 32) | 26,436 | (3,055 | ) | 1,693,064 | 55,311 | |||||||||||
| Subsidiaries’ buy back of their own outstanding ordinary shares (Note 32) | (912,886 | ) | - | (801,884 | ) | (26,197 | ) | |||||||||
(Continued)
F-63F-77
| For the Years Ended December 31 | ||||||||||||||||
| 2013 | 2014 | 2015 | ||||||||||||||
| NT$ | NT$ | NT$ | US$ (Note 4) | |||||||||||||
| Cash capital increase of subsidiary (Note 27) | $ | 27,826 | $ | 3,067,712 | $ | - | $ | - | ||||||||
| Additional non-controlling interests arising from partial disposal of subsidiaries (Note 27) | - | - | 1,712,836 | 52,236 | ||||||||||||
| Spin-off of subsidiaries | - | - | 3,006 | 92 | ||||||||||||
| Non-controlling interest relating to outstanding vested share options held by the employees of subsidiaries | 100,547 | 120,376 | 904,904 | 27,597 | ||||||||||||
| Cash dividends to non-controlling interests | (99,597 | ) | (85,766 | ) | (232,148 | ) | (7,079 | ) | ||||||||
| Balance at December 31 | $ | 4,128,361 | $ | 8,209,860 | $ | 11,492,545 | $ | 350,490 | ||||||||
| For the Year Ended December 31 | ||||||||||||||||
| 2016 | 2017 | 2018 | ||||||||||||||
| NT$ | NT$ | NT$ | US$ (Note 4) | |||||||||||||
| Non-controlling interest relating to outstanding vested employee share options granted by subsidiaries | $ | 927,823 | $ | 263,213 | $ | 1,936,643 | $ | 63,268 | ||||||||
| Non-controlling interest relating to outstanding expired employee share options granted by subsidiaries | - | (159,200 | ) | - | - | |||||||||||
| Cash dividends to non-controlling interests | (237,850 | ) | (246,440 | ) | (424,815 | ) | (13,878 | ) | ||||||||
| Balance at December 31 | $ | 12,000,551 | $ | 13,190,129 | $ | 17,639,487 | $ | 576,265 | ||||||||
(Concluded)
| PROFIT BEFORE INCOME TAX |
| a. | Other operating income and expenses, net |
| For the Years Ended December 31 | ||||||||||||||||
| 2013 | 2014 | 2015 | ||||||||||||||
| NT$ | NT$ | NT$ | US$ (Note 4) | |||||||||||||
| Rental income | $ | 63,130 | $ | 59,624 | $ | 60,230 | $ | 1,837 | ||||||||
| Gain (loss) on disposal of property, plant and equipment and other assets | 127,375 | (45,509 | ) | (127,111 | ) | (3,877 | ) | |||||||||
| Impairment loss on property, plant and equipment | (495,547 | ) | (297,754 | ) | (258,129 | ) | (7,872 | ) | ||||||||
| Loss on damages and claims | (1,058,810 | ) | (102,101 | ) | (116,445 | ) | (3,551 | ) | ||||||||
| Others | 15,606 | 614,355 | 189,926 | 5,792 | ||||||||||||
| $ | (1,348,246 | ) | $ | 228,615 | $ | (251,529 | ) | $ | (7,671 | ) | ||||||
| For the Year Ended December 31 | ||||||||||||||||
| 2016 | 2017 | 2018 | ||||||||||||||
| NT$ | NT$ | NT$ | US$ (Note 4) | |||||||||||||
| Rental income | $ | 51,607 | $ | 131,570 | $ | 182,411 | $ | 5,959 | ||||||||
| Gains (losses) on disposal of property, plant and equipment and other assets | (127,159 | ) | 367,110 | (14,644 | ) | (479 | ) | |||||||||
| Impairment losses on property, plant and equipment and goodwill | (888,231 | ) | (714,675 | ) | (133,071 | ) | (4,347 | ) | ||||||||
| Loss on damages and claims | (12,778 | ) | (85,585 | ) | (24,114 | ) | (788 | ) | ||||||||
| Others | 176,281 | 410,136 | 361,001 | 11,794 | ||||||||||||
| $ | (800,280 | ) | $ | 108,556 | $ | 371,583 | $ | 12,139 | ||||||||
| b. | Other income |
| For the Years Ended December 31 | ||||||||||||||||
| 2013 | 2014 | 2015 | ||||||||||||||
| NT$ | NT$ | NT$ | US$ (Note 4) | |||||||||||||
| Dividends income | $ | 131,449 | $ | 101,252 | $ | 396,973 | $ | 12,107 | ||||||||
| Interest income | 212,801 | 243,474 | 242,084 | 7,383 | ||||||||||||
| Government subsidy | 149,634 | 184,525 | 176,721 | 5,389 | ||||||||||||
| $ | 493,884 | $ | 529,251 | $ | 815,778 | $ | 24,879 | |||||||||
| For the Year Ended December 31 | ||||||||||||||||
| 2016 | 2017 | 2018 | ||||||||||||||
| NT$ | NT$ | NT$ | US$ (Note 4) | |||||||||||||
| Government subsidy | $ | 332,758 | $ | 341,844 | $ | 435,950 | $ | 14,242 | ||||||||
| Interest income | 230,067 | 306,871 | 466,211 | 15,231 | ||||||||||||
| Dividends income | 26,411 | 59,039 | 190,397 | 6,220 | ||||||||||||
| $ | 589,236 | $ | 707,754 | $ | 1,092,558 | $ | 35,693 | |||||||||
F-64F-78
| c. | Other gains, |
| For the Years Ended December 31 | ||||||||||||||||
| 2013 | 2014 | 2015 | ||||||||||||||
| NT$ | NT$ | NT$ | US$ (Note 4) | |||||||||||||
| Net gain arising on financial instruments held for trading | $ | 615,207 | $ | 1,266,653 | $ | 1,657,093 | $ | 50,536 | ||||||||
| Net gain on financial assets designated as at FVTPL | 180,152 | 572,187 | 815,742 | 24,878 | ||||||||||||
| Foreign exchange gain or loss, net | (276,201 | ) | (1,221,979 | ) | (713,213 | ) | (21,751 | ) | ||||||||
| Impairment loss on financial assets | (196,325 | ) | (10,390 | ) | - | - | ||||||||||
| Bargain purchase gain | 28,860 | - | - | - | ||||||||||||
| Others | 96,193 | 828 | (10,827 | ) | (330 | ) | ||||||||||
| $ | 447,886 | $ | 607,299 | $ | 1,748,795 | $ | 53,333 | |||||||||
In 2013 and 2014, the Group assessed the financial condition as well as future operating performance of its debt investments with no active market - current and available-for-sale investments, and then charged an impairment loss of NT$196,325 thousand and NT$10,390 thousand, respectively.
| For the Year Ended December 31 | ||||||||||||||||
| 2016 | 2017 | 2018 | ||||||||||||||
| NT$ | NT$ | NT$ | US$ (Note 4) | |||||||||||||
| Gain on remeasurement of investments accounted for using the equity method (Note 15) | $ | - | $ | - | $ | 7,421,408 | $ | 242,451 | ||||||||
| Net gains on financial assets mandatorily at FVTPL | - | - | 3,388,485 | 110,699 | ||||||||||||
| Gain on disposal of subsidiaries (Note 31) | - | 5,589,457 | - | - | ||||||||||||
| Net gains (losses) arising on financial instruments held for trading | 224,446 | (3,111,253 | ) | (1,398,995 | ) | (45,704 | ) | |||||||||
| Net gains on financial assets designated as at FVTPL | 223,113 | 327,351 | - | - | ||||||||||||
| Foreign exchange gains (losses), net | 1,928,384 | 3,502,586 | (1,015,615 | ) | (33,180 | ) | ||||||||||
| Impairment losses on financial assets | (91,886 | ) | (50,206 | ) | (521,010 | ) | (17,021 | ) | ||||||||
| Others | (7,513 | ) | 1,518 | - | - | |||||||||||
| $ | 2,276,544 | $ | 6,259,453 | $ | 7,874,273 | $ | 257,245 | |||||||||
| d. | Finance costs |
| For the Years Ended December 31 | ||||||||||||||||
| 2013 | 2014 | 2015 | ||||||||||||||
| NT$ | NT$ | NT$ | US$ (Note 4) | |||||||||||||
| Total interest expense for financial liabilities measured at amortized cost | $ | 2,433,868 | $ | 2,548,850 | $ | 2,514,208 | $ | 76,676 | ||||||||
| Less: Amounts included in the cost of qualifying assets | ||||||||||||||||
| Inventories related to real estate business | (42,999 | ) | (100,705 | ) | (197,287 | ) | (6,016 | ) | ||||||||
| Property, plant and equipment | (137,567 | ) | (126,203 | ) | (48,135 | ) | (1,468 | ) | ||||||||
| 2,253,302 | 2,321,942 | 2,268,786 | 69,192 | |||||||||||||
| Loss arising on derivatives as designated hedging instruments in cash flow hedge accounting relationship reclassified from equity to profit or loss | 3,842 | 2,484 | - | - | ||||||||||||
| Other finance costs | 50,311 | 29,671 | 43,357 | 1,322 | ||||||||||||
| $ | 2,307,455 | $ | 2,354,097 | $ | 2,312,143 | $ | 70,514 | |||||||||
| For the Year Ended December 31 | ||||||||||||||||
| 2016 | 2017 | 2018 | ||||||||||||||
| NT$ | NT$ | NT$ | US$ (Note 4) | |||||||||||||
| Total interest expense for financial liabilities measured at amortized cost | $ | 2,510,197 | $ | 2,016,298 | $ | 3,597,932 | $ | 117,541 | ||||||||
| Less: Amounts included in the cost of qualifying assets | ||||||||||||||||
| Inventories related to real estate business | (238,469 | ) | (190,137 | ) | (11,648 | ) | (381 | ) | ||||||||
| Property, plant and equipment | (54,191 | ) | (51,262 | ) | (50,309 | ) | (1,643 | ) | ||||||||
| Investment properties | - | (13 | ) | (89 | ) | (3 | ) | |||||||||
| 2,217,537 | 1,774,886 | 3,535,886 | 115,514 | |||||||||||||
| Other finance costs | 43,538 | 24,608 | 32,355 | 1,057 | ||||||||||||
| $ | 2,261,075 | $ | 1,799,494 | $ | 3,568,241 | $ | 116,571 | |||||||||
F-65
Information relating to the capitalized borrowing costs was as follows:
| For the Years Ended December 31 | ||||||||||||
| 2013 | 2014 | 2015 | ||||||||||
| Annual interest capitalization rates | ||||||||||||
| Inventories related to real estate business | 5.90%-7.21% | 6.00%-7.21% | 4.35%-6.77% | |||||||||
| Property, plant and equipment | 1.54%-6.15% | 0.88%-6.15% | 0.75%-6.15% | |||||||||
| For the Year Ended December 31 | ||||||
| 2016 | 2017 | 2018 | ||||
| Annual interest capitalization rates | ||||||
| Inventories related to real estate business (%) | 4.35-6.00 | 4.35-5.39 | 4.35 | |||
| Property, plant and equipment (%) | 1.15-4.42 | 1.26-5.49 | 1.84-4.52 | |||
| Investment properties (%) | - | 1.26-1.97 | 1.84-2.23 | |||
F-79
| e. | Depreciation and amortization |
| For the Years Ended December 31 | ||||||||||||||||
| 2013 | 2014 | 2015 | ||||||||||||||
| NT$ | NT$ | NT$ | US$ (Note 4) | |||||||||||||
| Property, plant and equipment | $ | 24,696,607 | $ | 25,805,042 | $ | 28,938,770 | $ | 882,549 | ||||||||
| Intangible assets | 774,304 | 545,734 | 579,894 | 17,685 | ||||||||||||
| Total | $ | 25,470,911 | $ | 26,350,776 | $ | 29,518,664 | $ | 900,234 | ||||||||
| Summary of depreciation by function | ||||||||||||||||
| Operating costs | $ | 23,025,115 | $ | 24,050,546 | $ | 27,023,957 | $ | 824,153 | ||||||||
| Operating expenses | 1,671,492 | 1,754,496 | 1,914,813 | 58,396 | ||||||||||||
| $ | 24,696,607 | $ | 25,805,042 | $ | 28,938,770 | $ | 882,549 | |||||||||
| Summary of amortization by function | ||||||||||||||||
| Operating costs | $ | 397,976 | $ | 180,719 | $ | 124,235 | $ | 3,789 | ||||||||
| Operating expenses | 376,328 | 365,015 | 455,659 | 13,896 | ||||||||||||
| $ | 774,304 | $ | 545,734 | $ | 579,894 | $ | 17,685 | |||||||||
| For the Year Ended December 31 | ||||||||||||||||
| 2016 | 2017 | 2018 | ||||||||||||||
| NT$ | NT$ | NT$ | US$ (Note 4) | |||||||||||||
| Property, plant and equipment | $ | 28,961,614 | $ | 28,625,287 | $ | 39,893,786 | $ | 1,303,293 | ||||||||
| Investment properties | - | 122,231 | 392,667 | 12,828 | ||||||||||||
| Intangible assets | 508,823 | 457,666 | 2,402,450 | 78,486 | ||||||||||||
| Total | $ | 29,470,437 | $ | 29,205,184 | $ | 42,688,903 | $ | 1,394,607 | ||||||||
| Summary of depreciation by function | ||||||||||||||||
| Operating costs | $ | 26,948,106 | $ | 26,731,714 | $ | 37,903,050 | $ | 1,238,257 | ||||||||
| Operating expenses | 2,013,508 | 2,015,804 | 2,383,403 | 77,864 | ||||||||||||
| $ | 28,961,614 | $ | 28,747,518 | $ | 40,286,453 | $ | 1,316,121 | |||||||||
| Summary of amortization by function | ||||||||||||||||
| Operating costs | $ | 152,987 | $ | 140,175 | $ | 1,394,664 | $ | 45,562 | ||||||||
| Operating expenses | 355,836 | 317,491 | 1,007,786 | 32,924 | ||||||||||||
| $ | 508,823 | $ | 457,666 | $ | 2,402,450 | $ | 78,486 | |||||||||
| f. | Operating expenses directly related to investment properties |
| For the Year Ended December 31 | ||||||||||||||||
| 2016 | 2017 | 2018 | ||||||||||||||
| NT$ | NT$ | NT$ | US$ (Note 4) | |||||||||||||
| Direct operating expenses of investment properties that generated rental income | $ | - | $ | 465,458 | $ | 1,276,751 | $ | 41,710 | ||||||||
| g. | Employee benefits expense |
| For the Years Ended December 31 | ||||||||||||||||
| 2013 | 2014 | 2015 | ||||||||||||||
| NT$ | NT$ | NT$ | US$ (Note 4) | |||||||||||||
| Post-employment benefits (Note 20) | ||||||||||||||||
| Defined contribution plans | $ | 1,324,178 | $ | 1,589,505 | $ | 1,693,060 | $ | 51,634 | ||||||||
| Defined benefit plans | 430,378 | 445,795 | 413,490 | 12,610 | ||||||||||||
| 1,754,556 | 2,035,300 | 2,106,550 | 64,244 | |||||||||||||
| Equity-settled share-based payments | 260,801 | 110,157 | 133,496 | 4,071 | ||||||||||||
| Salary, incentives and bonus | 34,032,023 | 40,475,594 | 41,985,329 | 1,280,431 | ||||||||||||
| Other employee benefits | 5,211,948 | 5,984,074 | 6,529,812 | 199,140 | ||||||||||||
| $ | 41,259,328 | $ | 48,605,125 | $ | 50,755,187 | $ | 1,547,886 | |||||||||
| (Continued) | ||||||||||||||||
| For the Year Ended December 31 | ||||||||||||||||
| 2016 | 2017 | 2018 | ||||||||||||||
| NT$ | NT$ | NT$ | US$ (Note 4) | |||||||||||||
| Post-employment benefits | ||||||||||||||||
| Defined contribution plans | $ | 2,356,416 | $ | 2,340,826 | $ | 2,965,054 | $ | 96,865 | ||||||||
| Defined benefit plans | 394,741 | 266,267 | 291,333 | 9,518 | ||||||||||||
| 2,751,157 | 2,607,093 | 3,256,387 | 106,383 | |||||||||||||
| Equity-settled share-based payments | 470,788 | 438,765 | 215,648 | 7,045 | ||||||||||||
| Other employee benefits | 49,525,940 | 51,043,198 | 63,940,430 | 2,088,874 | ||||||||||||
| $ | 52,747,885 | $ | 54,089,056 | $ | 67,412,465 | $ | 2,202,302 | |||||||||
| Summary of employee benefits expense by function | ||||||||||||||||
| Operating costs | $ | 35,588,529 | $ | 35,978,403 | $ | 45,363,170 | $ | 1,481,972 | ||||||||
| Operating expenses | 17,159,356 | 18,110,653 | 22,049,295 | 720,330 | ||||||||||||
| $ | 52,747,885 | $ | 54,089,056 | $ | 67,412,465 | $ | 2,202,302 | |||||||||
F-66F-80
| For the Years Ended December 31 | ||||||||||||||||
| 2013 | 2014 | 2015 | ||||||||||||||
| NT$ | NT$ | NT$ | US$ (Note 4) | |||||||||||||
| Summary of employee benefits expense by function | ||||||||||||||||
| Operating costs | $ | 28,053,492 | $ | 33,243,224 | $ | 34,720,359 | $ | 1,058,870 | ||||||||
| Operating expenses | 13,205,836 | 15,361,901 | 16,034,828 | 489,016 | ||||||||||||
| $ | 41,259,328 | $ | 48,605,125 | $ | 50,755,187 | $ | 1,547,886 | |||||||||
(Concluded)
| h. | Employees’ compensation and the remuneration to directors |
The existing Articles of Incorporation of the Company stipulate to distribute bonus to employees and remuneration to directors and supervisors at the rates in 7%-11% and no higher than 1% from net income (net of the bonus and remuneration), respectively, (retained earnings and dividend policy in Note 21c). For the year ended December 31, 2014, the bonus to employees and the remuneration to directors and supervisors were NT$2,335,786 thousand and NT$212,344 thousand, respectively, representing 11% and 1%, respectively, of the net income (net of the bonus and remuneration).
To be in compliance with the Company Act of the ROC as amended in May 2015, the amended Articles of Incorporation of the Company, as proposed by the board of directors in January 2016, stipulatestipulates to distribute employees’ compensation and remuneration toof directors at the rates in 5.25%-8.25%0.01%-1.00% and no higher than 0.75%, respectively, of net profit before income tax, employees’ compensation and remuneration toof directors. For the year endedperiod from April 30, 2018 to December 31, 2015,2018, the employees’ compensation and the remuneration toof directors were NT$2,033,50045,430 thousand (US$62,0161,484 thousand) and NT$184,50034,073 thousand (US$5,6271,113 thousand), respectively, which were accrued based on 8.25%0.20% and 0.75%0.15%, respectively, of net profit before income tax, employees’ compensation and remuneration to directors, respectively. The employees’ compensation and remuneration to directors for the year ended December 31, 2015 were 2,033,800 thousand (US$62,065 thousand) and 140,000 thousand (US$4,270 thousand), respectively, all distributed in cash, and have been approved by the Company’s board of directors on April 1, 2016 and are subject to the resolution of the amendments to the Company’s Articles of Incorporation for adoption by the shareholders in their meeting to be held on June 28, 2016, and in addition thereto a report of such distribution shall be submitted to the shareholders' meeting.directors.
Material differences between such estimated amounts and the amounts proposed by the board of directors on or before the annual consolidated financial statements authorized for issue are adjusted in the year the compensation and remuneration were recognized. If there is a change in the proposed amounts after the consolidated financial statementsstatement authorized for issue, the differences are recorded as a change in accounting estimate.estimate and will be adjusted in the following year.
The bonus to employees and the remuneration to directors and supervisors for 2013 and 2014 distributed in cash resolved at the Company’s annual shareholders’ meetings in June 2014 and June 2015, respectively, were as follows:
| For Year 2013 | For Year 2014 | |||||||
| NT$ | NT$ | |||||||
| Bonus to employees | $ | 1,587,300 | $ | 2,335,600 | ||||
| Remuneration to directors and supervisors | 144,000 | 211,200 | ||||||
The differences between the resolved amounts of the bonus to employees and remuneration to directors and supervisors and the accrued amounts reflected in the consolidated financial statements for the years ended December 31, 2013 and 2014 was deemed changes in estimates. The difference was NT$385 thousand and NT$1,330 thousand (US$41 thousand) and had been adjusted in earnings for the years ended December 31, 2014 and 2015, respectively.
F-67
| INCOME TAX |
| a. | Income tax recognized in profit or loss |
The major components of income tax expense were as follows:
| For the Years Ended December 31 | ||||||||||||||||
| 2013 | 2014 | 2015 | ||||||||||||||
| NT$ | NT$ | NT$ | US$ (Note 4) | |||||||||||||
| Current income tax | ||||||||||||||||
| In respect of the current year | $ | 2,594,114 | $ | 3,524,456 | $ | 4,029,076 | $ | 122,875 | ||||||||
| Income tax on unappropriated earnings | 209,616 | 1,281,877 | 187,654 | 5,723 | ||||||||||||
| Adjustments for prior years | (91,633 | ) | 72,380 | (20,719 | ) | (632 | ) | |||||||||
| 2,712,097 | 4,878,713 | 4,196,011 | 127,966 | |||||||||||||
| Deferred income tax | ||||||||||||||||
| In respect of the current year | 821,592 | 714,850 | 194,623 | 5,935 | ||||||||||||
| Effect of foreign currency exchange differences | (62,285 | ) | 75,305 | (58,671 | ) | (1,789 | ) | |||||||||
| Others | 28,191 | (2,914 | ) | (20,890 | ) | (637 | ) | |||||||||
| 787,498 | 787,241 | 115,062 | 3,509 | |||||||||||||
| Income tax expense recognized in profit or loss | $ | 3,499,595 | $ | 5,665,954 | $ | 4,311,073 | $ | 131,475 | ||||||||
| For the Year Ended December 31 | ||||||||||||||||
| 2016 | 2017 | 2018 | ||||||||||||||
| NT$ | NT$ | NT$ | US$ (Note 4) | |||||||||||||
| Current income tax | ||||||||||||||||
| In respect of the current year | $ | 4,177,900 | $ | 4,979,766 | $ | 5,207,309 | $ | 170,118 | ||||||||
| Income tax on unappropriated earnings | 829,345 | 1,076,353 | (1,022,560 | ) | (33,406 | ) | ||||||||||
| Changes in estimate for prior years | 28,160 | (88,162 | ) | (103,822 | ) | (3,392 | ) | |||||||||
| 5,035,405 | 5,967,957 | 4,080,927 | 133,320 | |||||||||||||
| Deferred income tax | ||||||||||||||||
| In respect of the current year | 574,541 | 534,472 | (227,327 | ) | (7,426 | ) | ||||||||||
| Effect of tax rate changes | 14,184 | - | 657,346 | 21,475 | ||||||||||||
| Changes in estimate for prior years | (206,788 | ) | 52,872 | 5,696 | 186 | |||||||||||
| Effect of foreign currency exchange differences | (26,498 | ) | (31,698 | ) | (3,273 | ) | (107 | ) | ||||||||
| 355,439 | 555,646 | 432,442 | 14,128 | |||||||||||||
| Income tax expense recognized in profit or loss | $ | 5,390,844 | $ | 6,523,603 | $ | 4,513,369 | $ | 147,448 | ||||||||
A reconciliation of income tax expense calculated at the statutory raterates and income tax expense recognized in profit or loss was as follows:
| For the Years Ended December 31 | ||||||||||||||||
| 2013 | 2014 | 2015 | ||||||||||||||
| NT$ | NT$ | NT$ | US$ (Note 4) | |||||||||||||
| Profit before income tax | $ | 19,369,756 | $ | 28,535,055 | $ | 25,293,145 | $ | 771,367 | ||||||||
| Income tax expense calculated at the statutory rate | $ | 3,684,109 | $ | 5,101,984 | $ | 6,307,148 | $ | 192,350 | ||||||||
| Nontaxable expense (income) in determining taxable income | (172,322 | ) | 128,644 | 160,530 | 4,896 | |||||||||||
| Tax-exempt income | (373,113 | ) | (623,652 | ) | (537,987 | ) | (16,407 | ) | ||||||||
| Additional income tax on unappropriated earnings | 558,042 | 1,887,845 | 338,142 | 10,312 | ||||||||||||
| Loss carry-forward and income tax credits currently used | (684,309 | ) | (1,329,753 | ) | (1,286,705 | ) | (39,241 | ) | ||||||||
| Remeasurement of deferred income tax assets, net | 341,863 | 435,143 | (649,336 | ) | (19,803 | ) | ||||||||||
| Adjustments for prior years’ tax | (91,633 | ) | 72,380 | (20,719 | ) | (632 | ) | |||||||||
| Land value increment tax | 236,958 | (6,637 | ) | - | - | |||||||||||
| (Continued) | ||||||||||||||||
| For the Year Ended December 31 | ||||||||||||||||
| 2016 | 2017 | 2018 | ||||||||||||||
| NT$ | NT$ | NT$ | US$ (Note 4) | |||||||||||||
| Profit before income tax | $ | 27,968,705 | $ | 31,020,663 | $ | 31,937,678 | $ | 1,043,374 | ||||||||
| Income tax expense calculated at the statutory rates | $ | 8,634,187 | $ | 10,890,498 | $ | 13,540,599 | $ | 442,359 | ||||||||
| Nontaxable expense (income) in determining taxable income | (34,954 | ) | 483,715 | 353,019 | 11,533 | |||||||||||
| Tax-exempt income | (700,274 | ) | (623,566 | ) | (2,515,453 | ) | (82,177 | ) | ||||||||
| Additional income tax on unappropriated earnings | 829,345 | 1,076,353 | (1,022,560 | ) | (33,406 | ) | ||||||||||
(Continued)
F-68F-81
| For the Years Ended December 31 | ||||||||||||||||
| 2013 | 2014 | 2015 | ||||||||||||||
| NT$ | NT$ | NT$ | US$ (Note 4) | |||||||||||||
| Income tax expense recognized in profit or loss | $ | 3,499,595 | $ | 5,665,954 | $ | 4,311,073 | $ | 131,475 | ||||||||
| For the Year Ended December 31 | ||||||||||||||||
| 2016 | 2017 | 2018 | ||||||||||||||
| NT$ | NT$ | NT$ | US$ (Note 4) | |||||||||||||
| �� | ||||||||||||||||
| Loss carry-forward and income tax credits currently used | $ | (898,700 | ) | $ | (1,124,043 | ) | $ | (971,124 | ) | $ | (31,726 | ) | ||||
| Remeasurement of deferred income tax assets, net | (2,797,673 | ) | (4,131,473 | ) | (4,776,271 | ) | (156,036 | ) | ||||||||
| Changes in estimate for prior periods | 28,160 | (88,162 | ) | (103,822 | ) | (3,392 | ) | |||||||||
| Withholding tax | 81,543 | 40,281 | 8,981 | 293 | ||||||||||||
| Land value increment tax | 249,210 | - | - | - | ||||||||||||
| Income tax expense recognized in profit or loss | $ | 5,390,844 | $ | 6,523,603 | $ | 4,513,369 | $ | 147,448 | ||||||||
(Concluded)
For the years ended December 31, 2013, 20142016 and 2015,2017, the Group applied a tax rate of 17% for resident entities subject to the Income Tax Law of the ROC; forR.O.C. In February 2018, the Income Tax Law of the R.O.C. was amended and the corporate income tax rate was adjusted from 17% to 20% effective in 2018. In addition, the rate of the corporate surtax applicable to 2018 unappropriated earnings is reduced from 10% to 5%. The subsidiaries located in China the applied tax rate wasof 25%; and for. For other jurisdictions, the Group measures taxes by using the applicable tax rate for each individual jurisdiction.
| b. | Income tax recognized directly in equity |
| For the Years Ended December 31 | ||||||||||||||||
| 2013 | 2014 | 2015 | ||||||||||||||
| NT$ | NT$ | NT$ | US$ (Note 4) | |||||||||||||
| Deferred income tax | ||||||||||||||||
| Employee share options | $ | — | $ | 4,481 | $ | (33 | ) | $ | (1 | ) | ||||||
| For the Year Ended December 31 | ||||||||||||||||
| 2016 | 2017 | 2018 | ||||||||||||||
| NT$ | NT$ | NT$ | US$ (Note 4) | |||||||||||||
| Deferred income tax | ||||||||||||||||
| Related to employee share options | $ | (204 | ) | $ | 262 | $ | (1,099 | ) | $ | (36 | ) | |||||
| c. | Income tax recognized in other comprehensive income |
| For the Years Ended December 31 | ||||||||||||||||
| 2013 | 2014 | 2015 | ||||||||||||||
| NT$ | NT$ | NT$ | US$ (Note 4) | |||||||||||||
| Deferred income tax | ||||||||||||||||
| Actuarial gain or loss on defined benefit plan | $ | (66,706 | ) | $ | 23,885 | $ | 11,002 | $ | 336 | |||||||
| Fair value changes of hedging instruments for cash flow hedges | (769 | ) | - | - | - | |||||||||||
| $ | (67,475 | ) | $ | 23,885 | $ | 11,002 | $ | 336 | ||||||||
| For the Year Ended December 31 | ||||||||||||||||
| 2016 | 2017 | 2018 | ||||||||||||||
| NT$ | NT$ | NT$ | US$ (Note 4) | |||||||||||||
| Deferred income tax | ||||||||||||||||
| Related to remeasurement of defined benefit plans | $ | 73,637 | $ | (51,217 | ) | $ | 55,346 | $ | 1,808 | |||||||
| Effect of tax rate changes | - | - | 70,755 | 2,312 | ||||||||||||
| Income tax recognized in other comprehensive income | $ | 73,637 | $ | (51,217 | ) | $ | 126,101 | $ | 4,120 | |||||||
F-82
| d. | Current tax assets and liabilities |
| December 31 | ||||||||||||
| 2014 | 2015 | |||||||||||
| NT$ | NT$ | US$ (Note 4) | ||||||||||
| Current tax assets | ||||||||||||
| Tax refund receivable | $ | 23,616 | $ | 10,984 | $ | 335 | ||||||
| Prepaid income tax | 41,696 | 157,733 | 4,810 | |||||||||
| $ | 65,312 | $ | 168,717 | $ | 5,145 | |||||||
| Current tax liabilities | ||||||||||||
| Income tax payable | $ | 6,630,696 | $ | 6,746,022 | $ | 205,734 | ||||||
| December 31 | ||||||||||||
| 2017 | 2018 | |||||||||||
| NT$ | NT$ | US$ (Note 4) | ||||||||||
| Current tax assets | ||||||||||||
| Tax refund receivable | $ | 28,458 | $ | 50,456 | $ | 1,648 | ||||||
| Prepaid income tax | 232,084 | 473,807 | 15,479 | |||||||||
| $ | 260,542 | $ | 524,263 | $ | 17,127 | |||||||
| Current tax liabilities | ||||||||||||
| Income tax payable | $ | 7,619,328 | $ | 6,781,136 | $ | 221,553 | ||||||
| e. | Deferred tax assets and liabilities |
The Group offset certain deferred tax assets and deferred tax liabilities which met the offset criteria.
F-69
The movements of deferred tax assets and deferred tax liabilities were as follows:
| Balance at January 1 | Recognized in Profit or Loss | Recognized in Other Comprehensive Income | Recognized in Equity | Exchange Differences | Balance at December 31 | |||||||||||||||||||
| NT$ | NT$ | NT$ | NT$ | NT$ | NT$ | |||||||||||||||||||
| Year ended December 31, 2013 | ||||||||||||||||||||||||
| Temporary differences | ||||||||||||||||||||||||
| Property, plant and equipment | $ | (977,288 | ) | $ | (730,743 | ) | $ | - | $ | - | $ | 23,415 | $ | (1,684,616 | ) | |||||||||
| Defined benefit obligation | 997,518 | (16,526 | ) | (66,706 | ) | - | (59,746 | ) | 854,540 | |||||||||||||||
| Cash flow hedges | 769 | - | (769 | ) | - | - | - | |||||||||||||||||
| FVTPL financial instruments | 61,499 | (73,832 | ) | - | - | 4 | (12,329 | ) | ||||||||||||||||
| Others | 445,904 | 336,473 | - | - | (14,633 | ) | 767,744 | |||||||||||||||||
| 528,402 | (484,628 | ) | (67,475 | ) | - | (50,960 | ) | (74,661 | ) | |||||||||||||||
| Loss carry-forward | 380,694 | (117,007 | ) | - | - | 6,344 | 270,031 | |||||||||||||||||
| Investment credits | 1,029,097 | (185,863 | ) | - | - | (17,669 | ) | 825,565 | ||||||||||||||||
| $ | 1,938,193 | $ | (787,498 | ) | $ | (67,475 | ) | $ | - | $ | (62,285 | ) | $ | 1,020,935 | ||||||||||
| Year ended December 31, 2014 | ||||||||||||||||||||||||
| Temporary differences | ||||||||||||||||||||||||
| Property, plant and equipment | $ | (1,684,616 | ) | $ | (804,082 | ) | $ | - | $ | - | $ | 56,843 | $ | (2,431,855 | ) | |||||||||
| Defined benefit obligation | 854,540 | (59,807 | ) | 23,885 | - | (21,976 | ) | 796,642 | ||||||||||||||||
| FVTPL financial instruments | (12,329 | ) | (170,722 | ) | - | - | 12,992 | (170,059 | ) | |||||||||||||||
| Others | 767,744 | 372,563 | - | 4,481 | 21,509 | 1,166,297 | ||||||||||||||||||
| (74,661 | ) | (662,048 | ) | 23,885 | 4,481 | 69,368 | (638,975 | ) | ||||||||||||||||
| Loss carry-forward | 270,031 | 246,334 | - | - | 3,533 | 519,898 | ||||||||||||||||||
| Investment credits | 825,565 | (370,674 | ) | - | - | (2,560 | ) | 452,331 | ||||||||||||||||
| Others | - | (853 | ) | - | - | - | (853 | ) | ||||||||||||||||
| $ | 1,020,935 | $ | (787,241 | ) | $ | 23,885 | $ | 4,481 | $ | 70,341 | $ | 332,401 | ||||||||||||
| Year ended December 31, 2015 | ||||||||||||||||||||||||
| Temporary differences | ||||||||||||||||||||||||
| Property, plant and equipment | $ | (2,431,855 | ) | $ | (1,083,273 | ) | $ | - | $ | - | $ | 10,670 | $ | (3,504,458 | ) | |||||||||
| Defined benefit obligation | 796,642 | 20,398 | 11,002 | - | 17,897 | 845,939 | ||||||||||||||||||
| FVTPL financial instruments | (170,059 | ) | (62,152 | ) | - | - | 13 | (232,198 | ) | |||||||||||||||
| Others | 1,166,297 | 229,799 | - | (33 | ) | (11,076 | ) | 1,384,987 | ||||||||||||||||
| (638,975 | ) | (895,228 | ) | 11,002 | (33 | ) | 17,504 | (1,505,730 | ) | |||||||||||||||
| Loss carry-forward | 519,898 | 812,217 | - | - | (8,538 | ) | 1,323,577 | |||||||||||||||||
| Investment credits | 452,331 | (32,904 | ) | - | - | (68,308 | ) | 351,119 | ||||||||||||||||
| Others | (853 | ) | 853 | - | - | - | - | |||||||||||||||||
| $ | 332,401 | $ | (115,062 | ) | $ | 11,002 | $ | (33 | ) | $ | (59,342 | ) | $ | 168,966 | ||||||||||
For the year ended December 31, 2016
| Balance at January 1 | Recognized in Profit or Loss | Recognized in Other Comprehensive Income | Recognized in Equity | Exchange Differences | Balance at December 31 | |||||||||||||||||||
| US$ (Note 4) | US$ (Note 4) | US$ (Note 4) | US$ (Note 4) | US$ (Note 4) | US$ (Note 4) | |||||||||||||||||||
| Year ended December 31, 2015 | ||||||||||||||||||||||||
| Temporary differences | ||||||||||||||||||||||||
| Property, plant and equipment | $ | (74,165 | ) | $ | (33,037 | ) | $ | - | $ | - | $ | 325 | $ | (106,877 | ) | |||||||||
| Defined benefit obligation | 24,295 | 622 | 336 | - | 546 | 25,799 | ||||||||||||||||||
| FVTPL financial instruments | (5,186 | ) | (1,895 | ) | - | - | - | (7,081 | ) | |||||||||||||||
| Others | 35,569 | 7,008 | - | (1 | ) | (338 | ) | 42,238 | ||||||||||||||||
| (19,487 | ) | (27,302 | ) | 336 | (1 | ) | 533 | (45,921 | ) | |||||||||||||||
| Loss carry-forward | 15,855 | 24,770 | - | - | (260 | ) | 40,365 | |||||||||||||||||
| Investment credits | 13,795 | (1,003 | ) | - | - | (2,083 | ) | 10,709 | ||||||||||||||||
| Other | (26 | ) | 26 | - | - | - | - | |||||||||||||||||
| $ | 10,137 | $ | (3,509 | ) | $ | 336 | $ | (1 | ) | $ | (1,810 | ) | $ | 5,153 | ||||||||||
| Balance at January 1 | Recognized in Profit or Loss | Recognized in Other Comprehensive Income | Recognized in Equity | Exchange Differences | Acquisitions Through Business Combinations | Balance at December 31 | ||||||||||||||||||||||
| NT$ | NT$ | NT$ | NT$ | NT$ | NT$ | NT$ | ||||||||||||||||||||||
| Deferred tax assets (liabilities) | ||||||||||||||||||||||||||||
| Temporary differences | ||||||||||||||||||||||||||||
| Property, plant and equipment | $ | (3,504,458 | ) | $ | (182,291 | ) | $ | - | $ | - | $ | (72,098 | ) | $ | - | $ | (3,758,847 | ) | ||||||||||
| Defined benefit obligation | 845,939 | �� | (48,601 | ) | 73,637 | - | 2,509 | - | 873,484 | |||||||||||||||||||
| FVTPL financial instruments | (232,198 | ) | 212,737 | - | - | (1,902 | ) | - | (21,363 | ) | ||||||||||||||||||
| Others | 1,384,987 | (283,179 | ) | - | (204 | ) | (21,780 | ) | - | 1,079,824 | ||||||||||||||||||
| (1,505,730 | ) | (301,334 | ) | 73,637 | (204 | ) | (93,271 | ) | - | (1,826,902 | ) | |||||||||||||||||
| Loss carry-forward | 1,323,577 | (110,967 | ) | - | - | (91,008 | ) | 2,939 | 1,124,541 | |||||||||||||||||||
| Investment credits | 351,119 | 56,862 | - | - | (25,245 | ) | - | 382,736 | ||||||||||||||||||||
| $ | 168,966 | $ | (355,439 | ) | $ | 73,637 | $ | (204 | ) | $ | (209,524 | ) | $ | 2,939 | $ | (319,625 | ) | |||||||||||
For the year ended December 31, 2017
| Balance at January 1 | Recognized in Profit or Loss | Recognized in Other Comprehensive Income | Recognized in Equity | Exchange Differences | Acquisitions Through Business Combinations | Balance at December 31 | ||||||||||||||||||||||
| NT$ | NT$ | NT$ | NT$ | NT$ | NT$ | NT$ | ||||||||||||||||||||||
| Deferred tax assets (liabilities) | ||||||||||||||||||||||||||||
| Temporary differences | ||||||||||||||||||||||||||||
| Property, plant and equipment | $ | (3,758,847 | ) | $ | (101,576 | ) | $ | - | $ | - | $ | (18,643 | ) | $ | - | $ | (3,879,066 | ) | ||||||||||
| Defined benefit obligation | 873,484 | (26,736 | ) | (51,217 | ) | - | (15,291 | ) | - | 780,240 | ||||||||||||||||||
| FVTPL financial instruments | (21,363 | ) | (86,342 | ) | - | - | 2,802 | - | (104,903 | ) | ||||||||||||||||||
| Others | 1,079,824 | (22,748 | ) | - | 262 | (28,929 | ) | - | 1,028,409 | |||||||||||||||||||
| (1,826,902 | ) | (237,402 | ) | (51,217 | ) | 262 | (60,061 | ) | - | (2,175,320 | ) | |||||||||||||||||
| Loss carry-forward | 1,124,541 | (456,246 | ) | - | - | 13,146 | - | 681,441 | ||||||||||||||||||||
| Investment credits | 382,736 | 138,002 | - | - | 13,475 | - | 534,213 | |||||||||||||||||||||
| $ | (319,625 | ) | $ | (555,646 | ) | $ | (51,217 | ) | $ | 262 | $ | (33,440 | ) | $ | - | $ | (959,666 | ) | ||||||||||
F-83
For the year ended December 31, 2018
| Balance at January 1 | Adjustment on initial Application of IFRS 15 | Recognized in Profit or Loss | Recognized in Other Comprehensive Income | Recognized in Equity | Exchange Differences | Acquisitions Through Business Combinations | Balance at December 31 | |||||||||||||||||||||||||
| NT$ | NT$ | NT$ | NT$ | NT$ | NT$ | NT$ | NT$ | |||||||||||||||||||||||||
| Deferred tax assets (liabilities) | ||||||||||||||||||||||||||||||||
| Temporary differences | ||||||||||||||||||||||||||||||||
| Property, plant and equipment | $ | (3,879,066 | ) | $ | - | $ | (600,229 | ) | $ | - | $ | - | $ | (21,146 | ) | $ | (45,873 | ) | $ | (4,546,314 | ) | |||||||||||
| Defined benefit obligation | 780,240 | - | (131,687 | ) | 126,101 | - | 27,884 | 262,286 | 1,064,824 | |||||||||||||||||||||||
| FVTPL financial instruments | (104,903 | ) | - | 284,659 | - | - | (137 | ) | 27,402 | 207,021 | ||||||||||||||||||||||
| Others | 1,028,409 | (97,358 | ) | (26,147 | ) | - | (1,099 | ) | 74,327 | 294,540 | 1,272,672 | |||||||||||||||||||||
| (2,175,320 | ) | (97,358 | ) | (473,404 | ) | 126,101 | (1,099 | ) | 80,928 | 538,355 | (2,001,797 | ) | ||||||||||||||||||||
| Loss carry-forward | 681,441 | - | (50,059 | ) | - | - | 28,293 | 12,600 | 672,275 | |||||||||||||||||||||||
| Investment credits | 534,213 | - | 91,021 | - | - | 5,932 | - | 631,166 | ||||||||||||||||||||||||
| $ | (959,666 | ) | $ | (97,358 | ) | $ | (432,442 | ) | $ | 126,101 | $ | (1,099 | ) | $ | 115,153 | $ | 550,955 | $ | (698,356 | ) | ||||||||||||
| Balance at January 1 | Adjustment on initial Application of IFRS 15 | Recognized in Profit or Loss | Recognized in Other Comprehensive Income | Recognized in Equity | Exchange Differences | Acquisitions Through Business Combinations | Balance at December 31 | |||||||||||||||||||||||||
| US$ (Note 4) | US$ (Note 4) | US$ (Note 4) | US$ (Note 4) | US$ (Note 4) | US$ (Note 4) | US$ (Note 4) | US$ (Note 4) | |||||||||||||||||||||||||
| Deferred tax assets (liabilities) | ||||||||||||||||||||||||||||||||
| Temporary differences | ||||||||||||||||||||||||||||||||
| Property, plant and equipment | $ | (126,726 | ) | $ | - | $ | (19,609 | ) | $ | - | $ | - | $ | (691 | ) | $ | (1,499 | ) | $ | (148,525 | ) | |||||||||||
| Defined benefit obligation | 25,490 | - | (4,302 | ) | 4,120 | - | 911 | 8,569 | 34,788 | |||||||||||||||||||||||
| FVTPL financial instruments | (3,427 | ) | - | 9,300 | - | - | (4 | ) | 895 | 6,764 | ||||||||||||||||||||||
| Others | 33,597 | (3,181 | ) | (854 | ) | - | (36 | ) | 2,428 | 9,622 | 41,576 | |||||||||||||||||||||
| (71,066 | ) | (3,181 | ) | (15,465 | ) | 4,120 | (36 | ) | 2,644 | 17,587 | (65,397 | ) | ||||||||||||||||||||
| Loss carry-forward | 22,262 | - | (1,635 | ) | - | - | 924 | 412 | 21,963 | |||||||||||||||||||||||
| Investment credits | 17,452 | - | 2,973 | - | - | 194 | - | 20,619 | ||||||||||||||||||||||||
| $ | (31,352 | ) | $ | (3,181 | ) | $ | (14,127 | ) | $ | 4,120 | $ | (36 | ) | $ | 3,762 | $ | 17,999 | $ | (22,815 | ) | ||||||||||||
| f. | Items for which no deferred tax assets have been recognized for loss carry-forward, investment credits and deductible temporary differences |
Unrecognized deferred tax assets related to loss carry-forward, investment credits and deductible temporary differences were summarized as follows:
F-70
| December 31 | ||||||||||||
| 2014 | 2015 | |||||||||||
| NT$ | NT$ | US$ (Note 4) | ||||||||||
| Loss carry-forward | $ | 694,960 | $ | 666,373 | $ | 20,322 | ||||||
| Investment credits | 629,231 | 387,480 | 11,817 | |||||||||
| Deductible temporary differences | 957,183 | 1,007,105 | 30,714 | |||||||||
| $ | 2,281,374 | $ | 2,060,958 | $ | 62,853 | |||||||
| December 31 | ||||||||||||
| 2017 | 2018 | |||||||||||
| NT$ | NT$ | US$ (Note 4) | ||||||||||
| Loss carry-forward | $ | 542,054 | $ | 666,043 | $ | 21,759 | ||||||
| Deductible temporary differences | 712,141 | 332,255 | 10,854 | |||||||||
| $ | 1,254,195 | $ | 998,298 | $ | 32,613 | |||||||
The unrecognized loss carry-forward will expire through 2030 and the unrecognized investment credits will expire through 2018.2030.
| g. | Information about unused loss carry-forward, unused investment credits, tax-exemption and other tax relief |
As of December 31, 2015,2018, the unused loss carry-forward comprised of:
| Year of Expiry | NT$ | US$ | ||||||
| (Note 4) | ||||||||
| 2016 | $ | 124,478 | $ | 3,796 | ||||
| 2017 | 318,985 | 9,728 | ||||||
| 2018 | 268,332 | 8,183 | ||||||
| 2019 | 333,284 | 10,164 | ||||||
| 2020 and thereafter | 944,871 | 28,816 | ||||||
| $ | 1,989,950 | $ | 60,687 | |||||
| Expiry Year | NT$ | US$ | ||||||
| (Note 4) | ||||||||
| 2019 | $ | 163,916 | $ | 5,355 | ||||
| 2020 | 290,460 | 9,489 | ||||||
(Continued)
F-84
| Expiry Year | NT$ | US$ | ||||||
| (Note 4) | ||||||||
| 2021 | $ | 159,641 | $ | 5,215 | ||||
| 2022 | 94,287 | 3,080 | ||||||
| 2023 and thereafter | 630,015 | 20,582 | ||||||
| $ | 1,338,319 | $ | 43,721 | |||||
(Concluded)
As of December 31, 2015,2018, unused investment credits comprised of:
| Remaining Creditable Amount | ||||||||||
| Laws and Statutes | Tax Credit Source | NT$ | US$ | Expiry Year | ||||||
| (Note 4) | ||||||||||
| Statute for Upgrading Industries | Purchase of machinery and equipment | $ | 710,863 | $ | 21,679 | 2018 | ||||
| Others | 27,736 | 847 | 2017 | |||||||
| $ | 738,599 | $ | 22,526 | |||||||
| Remaining Creditable Amount | ||||||||||
| Tax Credit Source | NT$ | US$ | Expiry Year | |||||||
| (Note 4) | ||||||||||
| Purchase of machinery and equipment | $ | 590,694 | $ | 19,297 | 2022 | |||||
| Others | 40,472 | 1,322 | 2023 and thereafter | |||||||
| $ | 631,166 | $ | 20,619 | |||||||
As of December 31, 2015,2018, profits attributable to the following expansion projects were exempted from income tax for a 3-year or 5-year period:
| Tax-exemption Period | ||
| Construction and expansion of | ||
| 2016.01-2020.12 | ||
| Construction and expansion of 2008 by | 2014.01-2018.12 | |
(Continued)
F-71
| Construction and expansion of 2008 by ASE Test Inc. | 2014.01-2018.12 | |
| Construction and expansion of 2009 by ASE Test Inc. | 2018.01-2022.12 | |
| Construction | ||
| 2016.01-2020.12 | ||
| Construction and expansion of 2007 by SPIL | 2015.01-2019.12 |
(Concluded)
Some China subsidiaries qualifyqualified as high technology enterprises which entitle themwere entitled to a reduced income tax rate of 15% and also make themwere eligible to deduct certain times of research and development expenses from their taxable income.
| h. | Unrecognized deferred tax liabilities associated with investments |
As of December 31, 20142017 and 2015,2018, the taxable temporary differences associated with the investments in subsidiaries for which no deferred tax liabilities have been recognized were NT$11,400,82616,401,422 thousand and NT$12,676,34728,810,874 thousand (US$386,592941,224 thousand), respectively.
| i. |
As of December 31, 2014 and 2015, unappropriated earnings were all generated on and after January 1, 1998. As of December 31, 2014 and 2015, the balance of the Imputation Credit Account (“ICA”) was NT$934,038 thousand and NT$1,913,243 thousand (US$58,348 thousand), respectively.
The creditable ratio for the distribution of earnings of 2014 and 2015 was 6.88% (actual) and 8.66% (estimated), respectively.
| Income tax assessments |
IncomeThe tax returns of ASE Inc. and its ROCthe Company’s R.O.C. subsidiaries through 2014 to 2016 have been examined by authorities through 2012 and through 2010, 2011, 2012 or 2013, respectively. ASE Inc. and some of its ROC subsidiaries disagreed with the result of examinations relating to its income tax returns for 2004 through 2008 and 2010 through 2012 and appealed to the tax authorities. A settlement with the tax authorities was reached in June 2015. The related income tax expenses in the years resulting from the examinations have been accrued in respective tax years or in the year of the settlement.
| EARNINGS PER SHARE |
The earnings and weighted average number of ordinary shares outstanding in the computation of earnings per share were as follows:
Net profit for the year
| For the Years Ended December 31 | ||||||||||||||||
| 2013 | 2014 | 2015 | ||||||||||||||
| NT$ | NT$ | NT$ | US$ (Note 4) | |||||||||||||
| Profit for the year attributable to owners of the Company | $ | 15,404,505 | $ | 22,228,602 | $ | 20,013,505 | $ | 610,354 | ||||||||
| Effect of potentially dilutive ordinary shares: | ||||||||||||||||
| Employee share options issued by subsidiaries | (131,756 | ) | (260,925 | ) | (210,126 | ) | (6,408 | ) | ||||||||
(Continued)
F-72F-85
| For the Years Ended December 31 | ||||||||||||||||
| 2013 | 2014 | 2015 | ||||||||||||||
| NT$ | NT$ | NT$ | US$ (Note 4) | |||||||||||||
| Convertible bonds | $ | 156,193 | $ | 931,344 | $ | 901,187 | $ | 27,483 | ||||||||
| Earnings used in the computation of diluted earnings per share | $ | 15,428,942 | $ | 22,899,021 | $ | 20,704,566 | $ | 631,429 | ||||||||
(Concluded)
| For the Year Ended December 31 | ||||||||||||||||
| 2016 | 2017 | 2018 | ||||||||||||||
| NT$ | NT$ | NT$ | US$ (Note 4) | |||||||||||||
| Profit for the year attributable to owners of the Company | $ | 21,324,423 | $ | 22,819,119 | $ | 26,220,721 | $ | 856,606 | ||||||||
| Effect of potentially dilutive ordinary shares: | ||||||||||||||||
| From subsidiaries | (374,359 | ) | (813,627 | ) | (418,295 | ) | (13,665 | ) | ||||||||
| From the investments in associates | (494,388 | ) | (367,687 | ) | - | - | ||||||||||
| From convertible bonds | (1,165,506 | ) | 93,781 | - | - | |||||||||||
| Earnings used in the computation of diluted earnings per share | $ | 19,290,170 | $ | 21,731,586 | $ | 25,802,426 | $ | 842,941 | ||||||||
Weighted average number of ordinary shares outstanding (in thousand shares):
| For the Years Ended December 31 | ||||||||||||
| 2013 | 2014 | 2015 | ||||||||||
| Weighted average number of ordinary shares in computation of basic earnings per share | 7,508,539 | 7,687,930 | 7,652,773 | |||||||||
| Effect of potentially dilutive ordinary shares: | ||||||||||||
| Convertible bonds | 117,085 | 375,271 | 455,671 | |||||||||
| Employee share options | 67,081 | 101,850 | 86,994 | |||||||||
| Bonus to employees or employees’ compensation | 54,926 | 55,643 | 54,626 | |||||||||
| Weighted average number of ordinary shares in computation of diluted earnings per share | 7,747,631 | 8,220,694 | 8,250,064 | |||||||||
| For the Year Ended December 31 | ||||||||||||||||||||
| 2016 | 2017 | |||||||||||||||||||
| Before | After | Before | After | |||||||||||||||||
| Retrospectively | Retrospectively | Retrospectively | Retrospectively | |||||||||||||||||
| Adjusted | Adjusted | Adjusted | Adjusted | 2018 | ||||||||||||||||
| Weighted average number of ordinary shares in the computation of basic earnings per share | 7,662,870 | 3,831,435 | 8,160,887 | 4,080,443 | 4,245,247 | |||||||||||||||
| Effect of potentially dilutive ordinary shares: | ||||||||||||||||||||
| From convertible bonds | 515,295 | 257,648 | 124,911 | 62,456 | - | |||||||||||||||
| From employee share options | 59,218 | 29,609 | 39,868 | 19,934 | 5,103 | |||||||||||||||
| From employees’ compensation | 46,746 | 23,373 | 43,574 | 21,787 | 779 | |||||||||||||||
| Weighted average number of ordinary shares in computation of diluted earnings per share | 8,284,129 | 4,142,065 | 8,369,240 | 4,184,620 | 4,251,129 | |||||||||||||||
For purposes of the ADS calculation, the denominator represents the above-mentionedaforementioned weighted average outstanding shares divided by five5 (one ADS represents five5 ordinary shares). for each of the two years in the period ended December 31, 2017 before retrospectively adjusted and by 2 (one ADS represents 2 ordinary shares) for each of the two years in the period ended December 31, 2017 after retrospectively adjusted and the year ended December 31, 2018, respectively. The numerator was the same.
The share exchange between the Company and ASE was deemed as an organization restructure under common control, and the earnings per share of prior periods were calculated based on weighted average number of ordinary shares outstanding retrospectively adjusted in accordance with share exchange ratio stated in the joint share exchange agreement.
The share exchange between the Company and ASE was deemed as an organization restructure under common control, and the earnings per share of prior periods were calculated based on weighted average number of ordinary shares outstanding retrospectively adjusted in accordance with share exchange ratio stated in the joint share exchange agreement.
The Group is able to settle the employees’ compensation or bonuses paid to employees inby cash or shares. The Group assumed that the entire amount of the compensation or bonus would be settled in shares and the resulting potential shares were included in the weighted average number of ordinary shares outstanding used in the computation of diluted earnings per share if the effect is dilutive. Such dilutive effect of the potential shares was included in the computation of diluted earnings per share until the shareholders approve the number of shares to be distributed to employees at their meeting in the following year.
The third unsecured convertible overseas bonds issued by ASE were anti-dilutive for the year ended December 31, 2017 and were excluded from the computation of diluted earnings per share for the respective year.
F-86
| SHARE-BASED PAYMENT ARRANGEMENTS |
| a. | Employee share option plans of the Company |
Employee share option plans of the Company and its subsidiariesThe Company’s Option Plan
In order to attract, retain and reward employees, ASE Inc.the Company has fiveits employee share option plansplan for full-time employees of the Group including 100,000and registered 150,000 thousand share options approved to be granted in April 2015.2018. Each share option represents the right to purchase one ordinary share of the Company when exercised. Under the terms of the plan, share options are granted at an exercise price equal to or not less than the closing price of the ordinary shares listed on the Taiwan Stock Exchange (the “TSE”) at the issue date. The right of those share options granted under the plan is valid for 10 years, non-transferable and exercisable at certain percentages subsequent to the second anniversary of the grant date. For any subsequent changes in the Company’s capital structure or when cash dividend per ordinary share exceeds 1.5% of the market price per ordinary share, the exercise price is accordingly adjusted.
ASE’s Option Plans
ASE Inc.had five employee share option plans for the Group’s full-time employees. Each share option represents the right to purchase one ordinary share of ASE when exercised. Under the terms of the plans, share options are granted at an exercise price equal to or not less than the closing price of the ordinary shares listed on the TSE at the grantissue date. The option rights of these plans are valid for 10 years, non-transferable and exercisable at certain percentages subsequent to the second anniversary of the grant date. For any subsequent changes in the Company’sASE’s capital structure, the exercise price iswas accordingly adjusted.
F-73
Table As disclosed in Note 1, the Company assumed ASE’s obligations of Contentsoutstanding employee share option plans starting from April 30, 2018 and each share option represents the right to purchase 0.5 ordinary share of the Company with all other terms and conditions held constant.
Information about share options for the years ended December 31, 2016 and 2017 and for the period from January 1, 2018 to April 29, 2018 was as follows:
| For the Years Ended December 31 | ||||||||||||||||||||||||
| 2013 | 2014 | 2015 | ||||||||||||||||||||||
| Weighted | Weighted | Weighted | ||||||||||||||||||||||
| Average | Average | Average | ||||||||||||||||||||||
| Number of | Exercise | Number of | Exercise | Number of | Exercise | |||||||||||||||||||
| Options | Price | Options | Price | Options | Price | |||||||||||||||||||
| (In | Per Share | (In | Per Share | (In | Per Share | |||||||||||||||||||
| Thousands) | (NT$) | Thousands) | (NT$) | Thousands) | (NT$) | |||||||||||||||||||
| Balance at January 1 | 344,332 | $ | 20.3 | 285,480 | $ | 20.5 | 209,745 | $ | 20.7 | |||||||||||||||
| Options granted | - | - | - | - | 94,270 | 36.5 | ||||||||||||||||||
| Options forfeited | (3,307 | ) | 20.7 | (1,515 | ) | 20.5 | (1,975 | ) | 30.3 | |||||||||||||||
| Options expired | (10 | ) | 7.4 | (322 | ) | 13.5 | (730 | ) | 11.1 | |||||||||||||||
| Options exercised | (55,535 | ) | 19.3 | (73,898 | ) | 19.7 | (48,703 | ) | 20.6 | |||||||||||||||
| Balance at December 31 | 285,480 | 20.5 | 209,745 | 20.7 | 252,607 | 26.6 | ||||||||||||||||||
| Options exercisable, end of year | 228,685 | 20.4 | 189,240 | 20.7 | 158,103 | 20.8 | ||||||||||||||||||
| Weighted-average fair value of options granted (NT$) | $ | - | $ | - | $ | 7.18~7.39 | ||||||||||||||||||
| For the Year Ended December 31 | For the Period from January 1, 2018 | |||||||||||||||||||||||
| 2016 | 2017 | to April 29, 2018 | ||||||||||||||||||||||
| Weighted | Weighted | Weighted | ||||||||||||||||||||||
| Average | Average | Average | ||||||||||||||||||||||
| Number of | Exercise | Number of | Exercise | Number of | Exercise | |||||||||||||||||||
| Options | Price | Options | Price | Options | Price | |||||||||||||||||||
| (In | Per Share | (In | Per Share | (In | Per Share | |||||||||||||||||||
| Thousands) | (NT$) | Thousands) | (NT$) | Thousands) | (NT$) | |||||||||||||||||||
| Balance, beginning of period | 252,607 | $ | 26.6 | 210,795 | $ | 27.3 | 135,961 | $ | 30.2 | |||||||||||||||
| Options forfeited | (6,056 | ) | 34.6 | (5,407 | ) | 36.3 | (1,692 | ) | 36.3 | |||||||||||||||
| Options expired | - | - | (1,790 | ) | 21.1 | - | - | |||||||||||||||||
| Options exercised | (35,756 | ) | 20.9 | (67,637 | ) | 21.0 | (20,557 | ) | 26.0 | |||||||||||||||
| Options transferred to the Company in accordance with the joint share exchange agreement | - | - | - | - | (113,712 | ) | 30.9 | |||||||||||||||||
| Balance, end of period | 210,795 | 27.3 | 135,961 | 30.2 | - | - | ||||||||||||||||||
| Options exercisable, end of period | 123,007 | 20.8 | 85,642 | 26.5 | - | - | ||||||||||||||||||
Starting from April 30, 2018, information about the share option plans that the Company granted and assumed was as follows:
F-87
For the Period from April 30, 2018 to December 31, 2018 | ||||||||
| Weighted Average | ||||||||
| Number of | Exercise Price | |||||||
| Options | Per Share | |||||||
| (In Thousands) | (NT$) | |||||||
| Balance, beginning of period | - | $ | - | |||||
| Transferred from ASE | 56,856 | 61.7 | ||||||
| Options granted | 131,863 | 56.4 | ||||||
| Options forfeited | (1,582 | ) | 71.5 | |||||
| Options exercised | (3,323 | ) | 43.6 | |||||
| Balance, end of period | 183,814 | 58.1 | ||||||
| Options exercisable, end of period | 36,354 | 58.1 | ||||||
| Fair value of options granted (NT$) | $ | 16.28-19.12 | ||||||
The weighted average share price at exercise dates of share options for each of the two years in the period ended December 31, 2013, 20142017, the period from January 1, 2018 to April 29, 2018 and 2015the period from April 30, 2018 to December 31, 2018 was NT$26.2,36.2, NT$35.137.6, NT$41.0 (US$1.3) and NT$38.868.5 (US$1.18)2.2), respectively. The options granted in 2007 were expired in December 2017 and, therefore, NT$47,087 thousand was reclassified from capital surplus arising from employee share options to capital surplus arising from expired share options.
Information about the Company’s outstanding share options that the Company granted and assumed at each balance sheet date was as follows:
| Range of Exercise Price Per Share (NT$) | Weighted Average Remaining Contractual Life (Years) | |||||||
| December 31, 2014 | $ | 11.1-13.5 | 0.4 | |||||
| 20.4-22.6 | 4.4 | |||||||
| December 31, 2015 | 20.4-22.6 | 3.5 | ||||||
| 36.5 | 9.7 | |||||||
Range of Exercise Price Per Share (NT$) | Weighted Average Remaining Contractual Life (Years) | |||||||
| December 31, 2017 | ||||||||
| ASE 4th share options | $ 20.4-22.6 | 2.5 | ||||||
| ASE 5th share options | 36.5 | 7.7 | ||||||
| December 31, 2018 | ||||||||
| ASE 4thshare options | 40.8-45.2 | 1.5 | ||||||
| ASE 5th share options | 73.0 | 6.7 | ||||||
| The Company 1st share options | 56.4 | 9.9 | ||||||
| b. |
ASE Mauritius Inc.’s Option Plan
ASE Mauritius Inc. has an employee share option plan for full-time employees of the Group which granted 30,000 thousand units in December 2007. Under the terms of the plan, each unit represents the right to purchase one ordinary share of ASE Mauritius Inc. when exercised. The option rights of the plan are valid for 10 years, non-transferable and exercisable at certain percentages subsequent to the second anniversary of the grant date.
The option rights of the plan was expired in December 2017, of which shares had not been exercised and, therefore, NT$159,200 thousand was reclassified from non-controlling interest to capital surplus arising from expired employee share options.
F-74F-88
Information about share options was as follows:
| For the Years Ended December 31 | ||||||||||||||||||||||||
| 2013 | 2014 | 2015 | ||||||||||||||||||||||
| Number of | Exercise | Number of | Exercise | Number of | Exercise | |||||||||||||||||||
| Options | Price | Options | Price | Options | Price | |||||||||||||||||||
| (In | Per Share | (In | Per Share | (In | Per Share | |||||||||||||||||||
| Thousands) | (US$) | Thousands) | (US$) | Thousands) | (US$) | |||||||||||||||||||
| Balance at January 1 | 28,595 | $ | 1.7 | 28,545 | $ | 1.7 | 28,545 | $ | 1.7 | |||||||||||||||
| Options forfeited | (50 | ) | 1.7 | - | - | (75 | ) | 1.7 | ||||||||||||||||
| Balance at December 31 | 28,545 | 1.7 | 28,545 | 1.7 | 28,470 | 1.7 | ||||||||||||||||||
| Options exercisable, end of year | 28,545 | 1.7 | 28,545 | 1.7 | 28,470 | 1.7 | ||||||||||||||||||
As of December 31, 2014 and 2015, the share options were all vested and the remaining contractual life was 3 years and 2 years, respectively.
| For the Year Ended December 31 | ||||||||||||||||
| 2016 | 2017 | |||||||||||||||
| Number of | Exercise | Number of | Exercise | |||||||||||||
| Options | Price | Options | Price | |||||||||||||
| (In | Per Share | (In | Per Share | |||||||||||||
| Thousands) | (US$) | Thousands) | (US$) | |||||||||||||
| Balance at January 1 | 28,470 | $ | 1.7 | 28,470 | $ | 1.7 | ||||||||||
| Options forfeited | - | - | (250 | ) | 1.7 | |||||||||||
| Options expired | - | - | (28,220 | ) | 1.7 | |||||||||||
| Balance at December 31 | 28,470 | 1.7 | - | - | ||||||||||||
| Options exercisable, end of year | 28,470 | 1.7 | - | - | ||||||||||||
USIE’s Option Plan
The terms of the plans issued by USIE were the same with those of the Company’s option plans.plans previously granted by ASE.
Information about share options was as follows:
| For the Years Ended December 31 | ||||||||||||||||||||||||
| 2013 | 2014 | 2015 | ||||||||||||||||||||||
| Weighted | Weighted | Weighted | ||||||||||||||||||||||
| Average | Average | Average | ||||||||||||||||||||||
| Number of | Exercise | Number of | Exercise | Number of | Exercise | |||||||||||||||||||
| Options | Price | Options | Price | Options | Price | |||||||||||||||||||
| (In | Per Share | (In | Per Share | (In | Per Share | |||||||||||||||||||
| Thousands) | (US$) | Thousands) | (US$) | Thousands) | (US$) | |||||||||||||||||||
| Balance at January 1 | 34,966 | $ | 2.1 | 34,939 | $ | 2.1 | 34,159 | $ | 2.1 | |||||||||||||||
| Options forfeited | (27 | ) | 2.9 | - | - | (84 | ) | 2.8 | ||||||||||||||||
| Options exercised | - | - | (780 | ) | 1.5 | (4,380 | ) | 1.9 | ||||||||||||||||
| Balance at December 31 | 34,939 | 2.1 | 34,159 | 2.1 | 29,695 | 2.1 | ||||||||||||||||||
| Options exercisable, end of year | 28,281 | 2.0 | 30,874 | 2.0 | 28,106 | 2.1 | ||||||||||||||||||
| For the Year Ended December 31 | ||||||||||||||||||||||||
| 2016 | 2017 | 2018 | ||||||||||||||||||||||
| Number of | Weighted Exercise | Number of | Weighted Exercise | Number of | Weighted Exercise | |||||||||||||||||||
| Options | Price | Options | Price | Options | Price | |||||||||||||||||||
| (In | Per Share | (In | Per Share | (In | Per Share | |||||||||||||||||||
| Thousands) | (US$) | Thousands) | (US$) | Thousands) | (US$) | |||||||||||||||||||
| Balance at January 1 | 29,695 | $ | 2.1 | 25,933 | $ | 2.2 | 25,556 | $ | 2.2 | |||||||||||||||
| Options exercised | (3,762 | ) | 2.0 | (377 | ) | 1.9 | (8,845 | ) | 2.2 | |||||||||||||||
| Balance at December 31 | 25,933 | 2.2 | 25,556 | 2.2 | 16,711 | 2.1 | ||||||||||||||||||
| Options exercisable, end of year | 25,933 | 2.2 | 25,556 | 2.2 | 16,711 | 2.1 | ||||||||||||||||||
Information about USIE’s outstanding share options at each balance sheet date was as follows:
Range of Exercise Price Per Share (US$) | Weighted Average Remaining Contractual Life (Years) | |||||||
| December 31, 2014 | $ | 1.5 | 5.0 | |||||
| 2.4-2.9 | 5.8 | |||||||
| December 31, 2015 | 1.5 | 5.0 | ||||||
| 2.4-2.9 | 4.9 | |||||||
Range of Exercise Price Per Share (US$) | Weighted Average Remaining Contractual Life (Years) | |||||||
| December 31, 2017 | ||||||||
| 1st share options | $ | 1.5 | 3.0 | |||||
| 2nd and 3rd share options | 2.4-2.9 | 2.9 | ||||||
| December 31, 2018 | ||||||||
| 1st share options | 1.5 | 2.0 | ||||||
| 2nd and 3rd share options | 2.4-2.9 | 2.1 | ||||||
In November 2015,2017 and 2018, the shareholdersGroup’s shareholdings of USISH approvedUSIE decreased because USIE’s share options had been exercised. The transaction was accounted for as an equity transaction since the Group did not cease to have control over USIE and, as a share option plan for the employeesresult, capital surplus was decreased by NT$52,388 thousand and NT$1,239,456 thousand (US$40,492 thousand) in 2017 and 2018, respectively.
F-89
USISH’s Option Plans
Each unit represents the right to purchase one ordinary share of USISH when exercised. The options are valid for 10 years, non-transferable and exercisable at certain percentages subsequent to the second anniversary of the grant date incorporated with certain performance conditions. For anysubsequent changes in USISH’s capital structure, the exercise price is accordingly adjusted.
F-75
Information about share options was as follows:
For the Year Ended December 31, 2015 | ||||||||
Number of Options (In Thousand) | Exercise Price Per Share (CNY) | |||||||
| Balance at January 1 | - | $ | - | |||||
| Options granted | 26,640 | 15.5 | ||||||
| Options forfeited | (13 | ) | 15.5 | |||||
| Balance at December 31 | 26,627 | 15.5 | ||||||
| Options exercisable, end of year | - | - | ||||||
| Weighted-average fair value of options granted (CNY) | $ | 5.95~7.14 | ||||||
| For the Year Ended December 31 | ||||||||||||||||||||||||
| 2016 | 2017 | 2018 | ||||||||||||||||||||||
| Number of | Exercise | Number of | Exercise | Number of | Exercise | |||||||||||||||||||
| Options | Price | Options | Price | Options | Price | |||||||||||||||||||
| (In | Per Share | (In | Per Share | (In | Per Share | |||||||||||||||||||
| Thousands) | (CNY) | Thousands) | (CNY) | Thousands) | (CNY) | |||||||||||||||||||
| Balance at January 1 | 26,627 | $ | 15.5 | 24,997 | $ | 15.5 | 22,341 | $ | 15.5 | |||||||||||||||
| Options forfeited | (1,630 | ) | 15.5 | (2,656 | ) | 15.5 | (804 | ) | 15.5 | |||||||||||||||
| Balance at December 31 | 24,997 | 15.5 | 22,341 | 15.5 | 21,537 | 15.5 | ||||||||||||||||||
| Options exercisable, end of year | - | - | 8,896 | 15.5 | 12,884 | 15.5 | ||||||||||||||||||
As of December 31, 2015,2017 and 2018, the remaining contractual life of the share options was 9.9 years.were 7.9 years and 6.9 years, respectively.
Fair value of share options
Share options granted by the Company and USISH in 2015 were measured using the Hull & White Model (2004) incorporated with Ritchken’s Trinomial Tree Model (1995) and the Black-Scholes Option Pricing Model, respectively, and the inputs to the models were as follows:
| ASE Inc. | USISH | ||||
| Share price at the grant date | NT$36.5 | CNY15.2 | |||
| Exercise prices | NT$36.5 | CNY15.5 | |||
| Expected volatility | 27.02% | 40.33%-45.00% | |||
| Expected lives | 10 years | 10 years | |||
| Expected dividend yield | 4.00% | 0.87% | |||
| Risk free interest rates | 1.34% | 3.06%-3.13% | |||
Expected volatility was based on the historical share price volatility over the past 10 years of ASE Inc. and the comparable companies of USISH, respectively. Under the Hull & White Model (2004) incorporated with Ritchken’s Trinomial Tree Model (1995), the Company assumed that employees would exercise the options after vesting date when the share price was 1.88 times the exercise price to allow for the effects of early exercise.
In December 2013, 2014 and 2015, USIE had modified the terms of its option plan granted in 2007 to extend the valid period from 10 years to 11 years, from 11 years to 12 years and from 12 years to 13 years, respectively. The incremental fair value of NT$15,497 thousand, NT$10,378 thousand and NT$13,721 thousand (US$418 thousand) were all recognized as employee benefits expense in 2013, 2014 and 2015, respectively, since the options were all vested.
Employee benefits expense recognized on employee share options was NT$234,093 thousand, NT$110,157 thousand and NT$133,496 thousand (US$4,071 thousand) forFor the years ended December 31, 2013, 20142016, 2017 and 2015,2018, employee benefits expense recognized on the aforementioned employee share option plans were NT$470,788 thousand, NT$354,765 thousand and NT$215,648 thousand (US$7,045 thousand), respectively.
F-76
New shares issued under cash capital increase reserved for subscription by employees
| c. | New shares reserved for subscription by employees under cash capital increase |
In July 2013,As disclosed in Note 25, the board of directors of ASE approved the cash capital increase in December 2016 and, as required under the Company Act ofin the ROC,R.O.C., simultaneously granted options to employees to purchase 15%10% of such newly issued shares with such options exercisable within 3 days and vested when granted.shares. The grant of the options was treatedaccounted for as employee options, accordingly a share-based compensation, and was measured at fair value in accordance with IFRS 2. The GroupASE recognized employee benefits expense and capital surplus arising from exercised employee share options of NT$26,70884,000 thousand in full at the grant date (also the vested date)., of which 4,836 thousand shares has not been exercised and, therefore, NT$13,541 thousand was reclassified from capital surplus arising from exercised employee share options to capital surplus arising from expired share options.
Information about the Company’sASE’s employee share options related to the aforementioned newly issued shares was as follows:
Number of Options (In Thousand) | Fair Value (NT$) | |||||||
| Balance at January 1, 2013 | - | $ | - | |||||
| Options granted | 14,437 | 1.85 | ||||||
| Options exercised | (12,477 | ) | 1.85 | |||||
| Options forfeited | (1,960 | ) | - | |||||
| Balance at December 31, 2013 | - | - | ||||||
Number of Options (In Thousand) | ||||
| Options granted for the year ended 2017 | 30,000 | |||
| Options exercised for the year ended 2017 | 25,164 | |||
| Fair value of options granted (NT$ per share) | $ | 2.80 | ||
Fair value was measured using the Black-Scholes Option Pricing Model and the inputs to the model were as follows:
F-90
| Share price at the grant date | NT$ | |
| Exercise price | NT$ | |
| Expected volatility | ||
| Expected lives | ||
| Expected dividend yield | - | |
| Risk free interest rate |
Expected volatility was based on ASE’s historical share prices volatility.
| d. | Fair value of share options granted by the Company in 2018 were measured at the grant date by using the trinomial tree model, and the inputs to the model were as follows: |
| Share price at the grant date | NT$58.80 per share | |
| Exercise price | NT$56.40 per share | |
| Expected volatility | 27.77%-28.86% | |
| Expected lives | 4.8 years-7.0 years | |
| Expected dividend yield | - | |
| Risk free interest rate | 0.73%-0.80% |
Expected volatility was based on the Company’s and ASE’s historical share prices volatility.
| BUSINESS COMBINATIONS |
Acquisition of TLJ
| a. | Subsidiary acquired |
| Principal Activity | Date of Acquisition | Proportion of Voting Equity Interests Acquired | Cash Consideration | ||||||
| NT$ | |||||||||
| Wuxi Tongzhi | Packaging and testing of semiconductors | May 27, 2013 | 100% | $ | 338,021 | ||||
| Principal Activity | Date of Acquisition | Proportion of Voting Equity Interests Acquired | Cash Consideration | |||||||||
| NT$ | ||||||||||||
| TLJ | Engaged in information software services | May 3, 2016 | 60 | % | $ | 89,998 | ||||||
In May 2016, the ASE’s subsidiary, ASE Test, Inc., acquired 60% shareholdings of TLJ with a total consideration determined primarily based on independent professional appraisal reports. NT$41,739 thousand out of the total consideration was paid to key management personnel and related parties.
| b. |
| NT$ | ||||
| Current assets | $ | 16,645 | ||
| Non-current assets | 108,486 | |||
| Current liabilities | (7,599 | ) | ||
| Fair value of identifiable net assets acquired | $ | 117,532 | ||
F-91
| c. | Goodwill recognized on acquisition |
| NT$ | ||||
| Consideration transferred (paid in cash) | $ | 89,998 | ||
| Add: Non-controlling interests | 42,857 | |||
| Less: Fair value of identifiable net assets acquired | (117,532 | ) | ||
| Goodwill recognized on acquisition | $ | 15,323 | ||
The non-controlling interest recognized at the acquisition date was measured at its fair value.
The goodwill recognized mainly represents the control premium. In addition, the consideration paid for the acquisition effectively included amounts attributed to the benefits of expected revenue growth and future market development of TLJ. These benefits are not recognized separately from goodwill because they do not meet the recognition criteria for identifiable intangible assets.
The goodwill recognized on acquisition is not expected to be deductible for tax purpose.
| d. | Net cash outflow on acquisition of |
| NT$ | ||||
| Consideration paid in cash | $ | 89,998 | ||
| Less: Cash acquired | (16,561 | ) | ||
| $ | 73,437 | |||
Acquisition of SPIL
| a. | ||||
| Subsidiary | Principal Activity | Date of Acquisition | Proportion of Voting Equity Interests Acquired (%) | Consideration Transferred | ||||||||||||
| NT$ | US$ (Note 4) | |||||||||||||||
| SPIL | Engaged in the assembly, testing and turnkey services of integrated circuits. | April 30, 2018 | 100 | % | $ | 168,440,585 | $ | 5,502,796 | ||||||||
As disclosed in Note 1, the Company acquired 100% shareholdings of SPIL at NT$51.2 (US$1.7) in cash per SPIL’s ordinary share in accordance with the joint share exchange agreements between ASE and SPIL.
| b. | Assets acquired and liabilities assumed at the date of acquisition |
| NT$ | US$ (Note 4) | |||||||
| Assets | ||||||||
| Cash and cash equivalents | $ | 20,088,970 | $ | 656,288 | ||||
| Trade and other receivables | 15,840,649 | 517,499 | ||||||
| Inventories | 5,693,644 | 186,006 | ||||||
(Continued)
F-77F-92
| NT$ | ||||
| Current liabilities | $ | (85,295 | ) | |
| 366,881 | ||||
| Bargain purchase gain - recognized in other gains and losses | (28,860 | ) | ||
| Total consideration | 338,021 | |||
| Less: Cash and cash equivalent acquired | (87,634 | ) | ||
| Net cash outflow on acquisition of Wuxi Tongzhi | $ | 250,387 | ||
| NT$ | US$ (Note 4) | |||||||
| Property, plant and equipment | $ | 81,985,622 | $ | 2,678,393 | ||||
| Intangible assets | 31,354,386 | 1,024,318 | ||||||
| Others | 24,945,922 | 814,960 | ||||||
| Liabilities | ||||||||
| Trade and other payables | (19,755,598 | ) | (645,396 | ) | ||||
| Borrowings and bonds payables | (24,157,174 | ) | (789,192 | ) | ||||
| Others | (3,963,201 | ) | (129,474 | ) | ||||
| Fair value of identifiable net assets acquired | $ | 132,033,220 | $ | 4,313,402 | ||||
(Concluded)
| c. | Goodwill recognized on acquisitions |
| NT$ | US$ (Note 4) | |||||||
| Total consideration | $ | 168,440,585 | $ | 5,502,796 | ||||
| Add: Non-controlling interests | 3,582,866 | 117,049 | ||||||
| Less: Fair value of identifiable net assets acquired | (132,033,220 | ) | (4,313,402 | ) | ||||
| Goodwill recognized on acquisition | $ | 39,990,231 | $ | 1,306,443 | ||||
The fair value of non-controlling interests were determined using market approach based on thevaluation multiples ofcomparable companies and the discount rate for lack of marketability. The significant unobservable inputs is the discount rate for lack of marketability of 25%.
The goodwill recognized in the acquisition of SPIL mainly represents the control premium included in the cost of the combination. In addition, the consideration paid for the combination effectively included amounts attributed to the benefits of expected synergies, revenue growth and future market development of SPIL. These benefits are not recognized separately from goodwill because they do not meet the recognition criteria for identifiable intangible assets.
The goodwill recognized on acquisition is not expected to be deductible for tax purpose.
| d. | Net cash outflow on acquisition of subsidiaries |
| NT$ | US$ (Note 4) | |||||||
| Total consideration | $ | 168,440,585 | $ | 5,502,796 | ||||
| Less: Payable for consideration representing the ordinary shares originally held by ASE | (53,109,760 | ) | (1,735,046 | ) | ||||
| Less: Cash and cash equivalent acquired | (20,088,970 | ) | (656,288 | ) | ||||
| $ | 95,241,855 | $ | 3,111,462 | |||||
| e. | Impact of |
The operatingAs of December 31, 2018, the results of Wuxi Tongzhi,operations from SPIL since the acquisition date to December 31, 2013,were included in the consolidated statements of comprehensive income and were operating revenue NT$316,380 thousand and profit for the period NT$15,762 thousand.as follows:
| NT$ | US$ (Note 4) | |||||||
| Operating revenue | $ | 61,247,727 | $ | 2,000,906 | ||||
| Profit | $ | 7,627,382 | $ | 249,179 | ||||
F-93
Had thethese business combinationcombinations been in effect at the beginning of the year,annual reporting period and the investments in SPIL originally accounted for using the equity method, as disclosed in Note 15, been remeasured to their fair value on January 1, 2018, the Group’s operating revenuesrevenue for the year ended December 31, 2018 would have been NT$397,261,461 thousand (US$12,978,159 thousand), and profit for the year ended December 31, 20132018 would have been NT$220,093,73625,674,641 thousand and NT$15,873,615 thousand,(US$838,766 thousand), respectively.
This pro-formapro forma information is for illustrative purposes only and is not necessarily an indication of the operating revenuesrevenue and results of operations of the Group that actually would have been achieved had the acquisition been completed at the beginning of the year,on January 1, 2018, nor is it intended to be a projection of future results.
In determining the pro forma operating revenue and profit of the Company had SPIL been acquired at the beginning of the current reporting period, the management:
| 1) | Calculated the depreciation of property, plant and equipment and the amortization of intangible assets acquired on the basis of the fair values at the initial accounting for the business combination rather than the carrying amounts recognized in the respective pre-acquisition financial statements; and |
| 2) | Calculated borrowing costs based on the funding status, credit ratings and debt/equity ratios of the Group after the business combination. |
| DISPOSAL OF SUBSIDIARIES |
The Group disposed of its subsidiary Kun Shan Ding Yue Real Estate Development Co., Ltd. (“KSDY”), in June 2017 and, as a result, the Group lost its control over KSDY.
| a. | Gain on disposal of subsidiaries |
| NT$ | ||||
| Total consideration | $ | 7,046,464 | ||
| Net assets disposed of | (1,457,007 | ) | ||
| Gain on disposal of KSDY | $ | 5,589,457 | ||
| b. | Analysis of assets and liabilities on the date control was lost |
| NT$ | ||||
| Current assets | ||||
| Cash and cash equivalents | $ | 29,133 | ||
| Inventories related to real estate business | 1,427,874 | |||
| Net assets disposed of | $ | 1,457,007 | ||
| 32. | EQUITY TRANSACTION WITH NON-CONTROLLING INTERESTS |
The Group’s subsidiary, Luchu, issued newIn February 2016, USIE repurchased its own 4,501 thousand outstanding ordinary shares for cash capital increase of NT$400,000 thousand in August 2013. The Group subscribed for additional new shares at a percentage different from its existing ownership percentage and accordingly the Group’s shareholdings of Luchu increased from 84.3% to 86.1%.
In November 2014, USISH completed its cash capital increase of CNY2,017,690 thousand and the Group’s shareholdings of USISH decreased from 88.6% to 82.1% since the Group did not subscribe for additional new shares.
In April 2015, USIE sold its shareholdings of 54,000 thousand ordinary shares of USISH amounting to CNY1,992,060 thousand (US$307,521 thousand) and, as a result, the Group’s shareholdings of USISH decreasedUSIE increased from 82.1%96.7% to 77.2%98.8%.
The aforementioned transactions were alltransaction was accounted for as an equity transactionstransaction since the Group did not cease to have control over those subsidiariesUSIE and capital surplus was decreased by NT$1,912,887 thousand in 2016.
F-94
In February 2016, the Company disposed 39,603 thousand shares in USI to the Company’s subsidiary, UGTW, at NT$20 per share with a total consideration of NT$792,064 thousand and, as a result, the Group’s shareholdings of USI decreased from 99.0% to 76.5%. The transaction was accounted for as an equity transaction since the Group did not cease to have control over USI and capital surplus was charged a deduction ofdecreased by NT$33020,552 thousand an addition of NT$6,871,062 thousand and an addition of NT$7,197,510 thousand (US$219,503 thousand) in 2013, 2014 and 2015, respectively.2016.
Furthermore,In January 2017, USI completed its cash capital increase of NT$1,000,000 thousand and the shareholdersGroup’s shareholdings of USI increased from 75.2% to 75.7% since the Group did not proportionally subscribe for additional new shares. The transaction was accounted for as an equity transaction since the transaction did not change the Company’s control over USI and capital surplus was increased by NT$3,055 thousand in 2017.
In January 2018, the shareholders’ meeting of USIE approved in December 2015resolved to repurchase 4,500,820 shares of USIE’sits own outstanding 3,738 thousand ordinary shares at US$18.8217.49 per share.share and, as a result, the Group’s shareholdings of USIE increased from 96.9% to 98.6%. The transaction was accounted for as an equity transaction since the transaction did not change the Company’s control over USIE and capital surplus was decreased by NT$1,127,632 thousand (US$36,839 thousand) in the first quarter of 2018. In February 2018, the board of directors of USIE resolved in February 2016 to cancel26, 2018 was the record date for capital reduction and then the repurchased ordinary shares on February 17, 2016, the record date for the capital reduction.were subsequently cancelled.
F-78
TableIn March 2018, ASE’s board of Contentsdirectors resolved to sign the shares transfer agreement by its subsidiary, J&R Holding, for acquiring shares of ASEN from NXP B.V. at US$127,113 thousand (NT$3,871,862 thousand). As a result, the percentage of ownership in ASEN was increased from 60% to 100%. The transaction was accounted for as an equity transaction since the transaction did not change the Company’s control over ASEN and capital surplus was decreased by NT$1,737,315 thousand (US$56,756 thousand) in the third quarter of 2018.
In August 2018, J&R Holding’s board of directors further resolved to sell 30% shareholdings of ASEN to Tsinghua Unigroup Ltd. at US$95,335 thousand. As a result, the Group’s shareholdings of ASEN was decreased from 100% to 70%. The transaction was accounted for as an equity transaction since the Group also did not cease to have control over ASEN and capital surplus was increased by NT$1,114,504 thousand (US$36,410 thousand) in the fourth quarter of 2018.
In July 2018, ASE and UGTW’s board of directors have approved to acquire the outstanding ordinary shares of USIINC and USI at NT$35 (US$1.1) and NT$18 (US$0.6) per ordinary shares, respectively. ASE and UGTW also purchased the ordinary shares from dissenting shareholders in August 2018 and recognized an increase in capital surplus by NT$9,530 thousand (US$311 thousand). ASE has completed the acquisition of USIINC’s remaining outstanding ordinary shares and recognized a decrease in capital surplus by NT$28,152 thousand (US$920 thousand).
| a. | Non-cash investing activities |
For the years ended December 31, 2013, 2014
In addition to Notes 22, 25 and 2015,30, the Group entered into the following non-cash investing activities which were not reflected in the consolidated statements of cash flows:flows for the years ended December 31, 2016, 2017 and 2018:
| For the Years Ended December 31 | ||||||||||||||||
| 2013 | 2014 | 2015 | ||||||||||||||
| NT$ | NT$ | NT$ | US$ (Note 4) | |||||||||||||
| Payments for property, plant and equipment | ||||||||||||||||
| Purchase of property, plant and equipment | $ | 27,044,072 | $ | 43,448,587 | $ | 28,280,821 | $ | 862,483 | ||||||||
| Increase (decrease) in prepayments for property, plant and equipment (recorded under the line item of other non-current assets) | 327,810 | (34,894 | ) | (267,334 | ) | (8,153 | ) | |||||||||
| Decrease (increase) in payables for property, plant and equipment | 1,908,404 | (3,688,526 | ) | 2,314,772 | 70,594 | |||||||||||
| Capitalized borrowing costs | (137,567 | ) | (126,203 | ) | (48,135 | ) | (1,468 | ) | ||||||||
| $ | 29,142,719 | $ | 39,598,964 | $ | 30,280,124 | $ | 923,456 | |||||||||
| Proceeds from disposal of property, plant and equipment | ||||||||||||||||
| Consideration from disposal of property, plant and equipment | $ | 350,873 | $ | 462,438 | $ | 201,766 | $ | 6,153 | ||||||||
| Decrease (increase) in other receivables | 673 | (41,231 | ) | 41,265 | 1,259 | |||||||||||
| $ | 351,546 | $ | 421,207 | $ | 243,031 | $ | 7,412 | |||||||||
| For the Year Ended December 31 | ||||||||||||||||
| 2016 | 2017 | 2018 | ||||||||||||||
| NT$ | NT$ | NT$ | US$ (Note 4) | |||||||||||||
| Payments for property, plant and equipment | ||||||||||||||||
| Purchase of property, plant and equipment | $ | 27,680,862 | $ | 23,677,682 | $ | 39,092,238 | $ | 1,277,107 | ||||||||
(Continued)
F-95
| For the Year Ended December 31 | ||||||||||||||||
| 2016 | 2017 | 2018 | ||||||||||||||
| NT$ | NT$ | NT$ | US$ (Note 4) | |||||||||||||
| Increase (decrease) in prepayments for property, plant and equipment | $ | (89,337 | ) | $ | 90,560 | $ | 402,255 | $ | 13,141 | |||||||
| Decrease (increase) in payables for property, plant and equipment | (823,171 | ) | 982,260 | 1,942,259 | 63,452 | |||||||||||
| Capitalized borrowing costs | (54,191 | ) | (51,262 | ) | (50,309 | ) | (1,643 | ) | ||||||||
| $ | 26,714,163 | $ | 24,699,240 | $ | 41,386,443 | $ | 1,352,057 | |||||||||
| Proceeds from disposal of property, plant and equipment | ||||||||||||||||
| Consideration from disposal of property, plant and equipment | $ | 692,826 | $ | 1,487,334 | $ | 1,133,435 | $ | 37,028 | ||||||||
| Decrease (increase) in other receivables | (22,626 | ) | 876 | (5,791 | ) | (189 | ) | |||||||||
| $ | 670,200 | $ | 1,488,210 | $ | 1,127,644 | $ | 36,839 | |||||||||
| Payments for investment properties | ||||||||||||||||
| Purchase of investment properties | $ | - | $ | 186,535 | $ | 125,853 | $ | 4,112 | ||||||||
| Capitalized borrowing costs | - | (13 | ) | (89 | ) | (3 | ) | |||||||||
| $ | - | $ | 186,522 | $ | 125,764 | $ | 4,109 | |||||||||
| Payments for other intangible assets | ||||||||||||||||
| Purchase of other intangible assets | $ | 675,144 | $ | 277,825 | $ | 537,659 | $ | 17,565 | ||||||||
| Decrease (increase) in other payables | (120,938 | ) | 60,159 | 40,106 | 1,310 | |||||||||||
| Increase in other non-current liabilities | (40,313 | ) | - | - | - | |||||||||||
| $ | 513,893 | $ | 337,984 | $ | 577,765 | $ | 18,875 | |||||||||
| Net cash inflow from disposal of subsidiaries | ||||||||||||||||
| Consideration from disposal of subsidiaries | $ | - | $ | 7,046,464 | $ | - | $ | - | ||||||||
| Increase in other payables | - | 3,552 | - | - | ||||||||||||
| Cash and cash equivalents disposed of | - | (29,133 | ) | - | - | |||||||||||
| $ | - | $ | 7,020,883 | $ | - | $ | - | |||||||||
(Concluded)
F-96
| b. | Changes in liabilities arising from financing activities |
For the year ended December 31, 2017
| Short-term borrowings | Bonds payable | Long-term borrowings | Total | |||||||||||||
| NT$ | NT$ | NT$ | NT$ | |||||||||||||
| Balance at January 1, 2017 | $ | 20,955,522 | $ | 36,999,903 | $ | 53,115,563 | $ | 111,070,988 | ||||||||
| Financing cash flows | (2,038,993 | ) | (1,123,972 | ) | (16,473,381 | ) | (19,636,346 | ) | ||||||||
| Non-cash changes | ||||||||||||||||
| Bonds conversion | - | (11,650,369 | ) | - | (11,650,369 | ) | ||||||||||
| Amortization of issuance cost | - | 319,463 | 5,790 | 325,253 | ||||||||||||
| Effects of exchange rate change | (954,058 | ) | (1,402,245 | ) | (1,241,344 | ) | (3,597,647 | ) | ||||||||
| Balance at December 31, 2017 | $ | 17,962,471 | $ | 23,142,780 | $ | 35,406,628 | $ | 76,511,879 | ||||||||
For the year ended December 31, 2018
| Short-term borrowings | Bonds payable | Long-term borrowings | Total | |||||||||||||
| NT$ | NT$ | NT$ | NT$ | |||||||||||||
| Balance at January 1, 2018 | $ | 17,962,471 | $ | 23,142,780 | $ | 35,406,628 | $ | 76,511,879 | ||||||||
| Financing cash flows | 22,327,813 | (6,185,600 | ) | 85,510,959 | 101,653,172 | |||||||||||
| Non-cash changes | ||||||||||||||||
| Acquisition through business combinations (Note 30) | 3,619,858 | 4,457,191 | 16,080,125 | 24,157,174 | ||||||||||||
| Bonds conversion | - | (4,457,191 | ) | - | (4,457,191 | ) | ||||||||||
| Reclassification for applying IFRS 9 | (1,301,994 | ) | - | - | (1,301,994 | ) | ||||||||||
| Amortization of issuance cost | - | 28,756 | 188,217 | 216,973 | ||||||||||||
| Effects of foreign currency exchange | 655,321 | - | 712,400 | 1,367,721 | ||||||||||||
| Balance at December 31, 2018 | $ | 43,263,469 | $ | 16,985,936 | $ | 137,898,329 | $ | 198,147,734 | ||||||||
| Short-term borrowings | Bonds payable | Long-term borrowings | Total | |||||||||||||
| US$ (Note 4) | US$ (Note 4) | US$ (Note 4) | US$ (Note 4) | |||||||||||||
| Balance at January 1, 2018 | $ | 586,817 | $ | 756,053 | $ | 1,156,701 | $ | 2,499,571 | ||||||||
| Financing cash flows | 729,429 | (202,078 | ) | 2,793,563 | 3,320,914 | |||||||||||
| Non-cash changes | ||||||||||||||||
| Acquisition through business combinations (Note 30) | 118,257 | 145,612 | 525,323 | 789,192 | ||||||||||||
| Bonds conversion | - | (145,612 | ) | - | (145,612 | ) | ||||||||||
| Reclassification for applying IFRS 9 | (42,535 | ) | - | - | (42,535 | ) | ||||||||||
| Amortization of issuance cost | - | 940 | 6,149 | 7,089 | ||||||||||||
| Effects of foreign currency exchange | 21,409 | - | 23,273 | 44,682 | ||||||||||||
| Balance at December 31, 2018 | $ | 1,413,377 | $ | 554,915 | $ | 4,505,009 | $ | 6,473,301 | ||||||||
| OPERATING LEASE ARRANGEMENTS |
| a. | The Group as lessee |
Except
In addition to those discusseddisclosed in Note 16,20, the Company and some of its subsidiary ASE Test, Inc.,located in R.O.C. lease the land on which their buildings are located under various operating lease agreements with the ROCR.O.C. government expiring through June 2035.January 2037. The agreements grant these entities the option to renew the leases and reserve the right for the lessor to adjust the lease payments upon an increase in the assessed value of the land and to terminate the leases under certain conditions. In addition, the Group leases buildings, machinery and equipment under operating leases.
F-97
The subsidiaries’ offices located in U.S.A. and Japan, etc. are leased from otherthird parties and the lease termterms will expire through 20162019 to 20232028 with the option to renew the leases upon expiration.
The Group recognized rental expense of NT$1,301,5501,411,533 thousand, NT$1,459,8351,193,477 thousand and NT$ 1,390,8211,593,315 thousand (US$42,41652,052 thousand) for the years ended December 31, 2013, 20142016, 2017 and 2015, respectively.
2018, respectively, from the aforementioned operating lease arrangements and the land use rights disclosed in Note 20.
F-79
TableThe future minimum lease payments of Contentsnon-cancellable operating lease agreements were as follows:
| December 31 | ||||||||||||
| 2017 | 2018 | |||||||||||
| NT$ | NT$ | US$ (Note 4) | ||||||||||
| Less than 1 year | $ | 246,026 | $ | 509,994 | $ | 16,661 | ||||||
| 1-5 years | 439,408 | 828,482 | 27,066 | |||||||||
| More than 5 years | 419,232 | 1,047,626 | 34,225 | |||||||||
| $ | 1,104,666 | $ | 2,386,102 | $ | 77,952 | |||||||
| b. | The Group as lessor |
The Group leased out the investment properties under operating lease with leasing periods from 1 to 15 years. The Group granted lessees the option to renew the lease upon expiration and without bargain purchase.
The future minimum lease payments of non-cancellable operating lease agreements were as follows:
| December 31, 2018 | ||||||||
| NT$ | US$ (Note 4) | |||||||
| Less than 1 year | $ | 916,891 | $ | 29,954 | ||||
| 1-5 years | 2,391,843 | 78,139 | ||||||
| More than 5 years | 1,157,093 | 37,801 | ||||||
| $ | 4,465,827 | $ | 145,894 | |||||
| CAPITAL MANAGEMENT |
The capital structure of the Group consists of debt and equity. The Group manages its capital to ensure that entities in the Group will be able to continue as going concerns while maximizing the return to shareholders through the optimization of the debt and equity balance. Key management personnel of the Group periodically reviews the cost of capital and the risks associated with each class of capital. In order to balance the overall capital structure, the Group may adjust the amount of dividends paid to shareholders, the number of new shares issued or repurchased, and the amount of new debt issued or existing debt redeemed.
The Group is not subject to any externally imposed capital requirements except those discussed in Note 17.21.
F-98
| FINANCIAL INSTRUMENTS |
| a. | Fair value of financial instruments that are not measured at fair value |
| 1) | Fair value of financial instruments not measured at fair value but for which fair value is disclosed |
Except bonds payable measured at amortized cost, the management considersconsidered that the carrying amounts of financial assets and financial liabilities not measured at fair value approximate their fair values.
The carrying amounts and fair value of bonds payable as of December 31, 20142017 and 2015,2018, respectively, were as follows:
| Carrying Amount | Fair Value | |||||||||||||||
| NT$ | US$ (Note 4) | NT$ | US$ (Note 4) | |||||||||||||
| December 31, 2014 | $ | 31,270,131 | $ | 31,702,988 | ||||||||||||
| December 31, 2015 | 38,426,250 | $ | 1,171,889 | 38,465,355 | $ | 1,173,082 | ||||||||||
| Carrying Amount | Fair Value | |||||||||||||||
| NT$ | US$ (Note 4) | NT$ | US$ (Note 4) | |||||||||||||
| December 31, 2017 | $ | 23,142,780 | $ | 23,247,085 | ||||||||||||
| December 31, 2018 | 16,985,936 | $ | 554,915 | 17,126,752 | $ | 559,515 | ||||||||||
| 2) | Fair value hierarchy |
The aforementioned fair value hierarchy of bonds payable was Level 3 which was determined based on discounted cash flow analysis with the applicable yield curve for the duration or the lastlatest trading prices. The significant unobservable inputs is discount rates that reflected the credit risk of various counterparties and the latest trading prices.
| b. | Fair value of financial instruments that are measured at fair value on a recurring basis |
| 1) | Fair value hierarchy |
| Level 1 | Level 2 | Level 3 | Total | |||||||||||||
| NT$ | NT$ | NT$ | NT$ | |||||||||||||
| December 31, 2014 | ||||||||||||||||
| Financial assets at FVTPL | ||||||||||||||||
| Financial assets designated as at FVTPL | ||||||||||||||||
| Structured time deposits | $ | - | $ | 2,376,050 | $ | - | $ | 2,376,050 | ||||||||
| Private-placement convertible bonds | - | 100,500 | - | 100,500 | ||||||||||||
| Derivative financial assets | ||||||||||||||||
| Swap contracts | - | 1,907,705 | - | 1,907,705 | ||||||||||||
| Forward exchange contracts | - | 27,811 | - | 27,811 | ||||||||||||
| Non-derivative financial assets held for trading | ||||||||||||||||
| Open-end mutual funds | 533,425 | - | - | 533,425 | ||||||||||||
| Level 1 | Level 2 | Level 3 | Total | |||||||||||||
| NT$ | NT$ | NT$ | NT$ | |||||||||||||
| December 31, 2017 | ||||||||||||||||
| Financial assets at FVTPL | ||||||||||||||||
| Financial assets designated as at FVTPL | ||||||||||||||||
| Private-placement convertible bonds | $ | - | $ | 100,496 | $ | - | $ | 100,496 | ||||||||
| Derivative financial assets | ||||||||||||||||
| Forward exchange contracts | - | 61,325 | - | 61,325 | ||||||||||||
| Swap contracts | - | 60,538 | - | 60,538 | ||||||||||||
| Non-derivative financial assets held for trading | ||||||||||||||||
| Quoted ordinary shares | 4,410,732 | - | - | 4,410,732 | ||||||||||||
| Open-end mutual funds | 589,976 | - | - | 589,976 | ||||||||||||
| $ | 5,000,708 | $ | 222,359 | $ | - | $ | 5,223,067 | |||||||||
| Available-for-sale financial assets | ||||||||||||||||
| Unquoted ordinary shares | $ | - | $ | - | $ | 662,477 | $ | 662,477 | ||||||||
| Limited Partnership | - | - | 246,072 | 246,072 | ||||||||||||
| Quoted ordinary shares | 279,791 | - | - | 279,791 | ||||||||||||
| Open-end mutual funds | 23,825 | - | - | 23,825 | ||||||||||||
| $ | 303,616 | $ | - | $ | 908,549 | $ | 1,212,165 | |||||||||
(Continued)
F-80F-99
| Level 1 | Level 2 | Level 3 | Total | |||||||||||||
| NT$ | NT$ | NT$ | NT$ | |||||||||||||
| Quoted shares | $ | 43,352 | $ | - | $ | - | $ | 43,352 | ||||||||
| $ | 576,777 | $ | 4,412,066 | $ | - | $ | 4,988,843 | |||||||||
| Available-for-sale financial assets | ||||||||||||||||
| Open-end mutual funds | $ | 1,500,434 | $ | - | $ | - | $ | 1,500,434 | ||||||||
| Limited Partnership | - | - | 555,361 | 555,361 | ||||||||||||
| Unquoted shares | - | - | 223,505 | 223,505 | ||||||||||||
| Quoted shares | 195,070 | - | - | 195,070 | ||||||||||||
| $ | 1,695,504 | $ | - | $ | 778,866 | $ | 2,474,370 | |||||||||
| Financial liabilities at FVTPL | ||||||||||||||||
| Derivative financial liabilities | ||||||||||||||||
| Conversion option, redemption option and put option of convertible bonds | $ | - | $ | 2,520,606 | $ | - | $ | 2,520,606 | ||||||||
| Swap contracts | - | 99,165 | - | 99,165 | ||||||||||||
| Forward exchange contracts | - | 31,581 | - | 31,581 | ||||||||||||
| $ | - | $ | 2,651,352 | $ | - | $ | 2,651,352 | |||||||||
| Level 1 | Level 2 | Level 3 | Total | |||||||||||||
| NT$ | NT$ | NT$ | NT$ | |||||||||||||
| Financial liabilities at FVTPL | ||||||||||||||||
| Derivative financial liabilities | ||||||||||||||||
| Swap contracts | $ | - | $ | 652,107 | $ | - | $ | 652,107 | ||||||||
| Forward exchange contracts | - | 25,323 | - | 25,323 | ||||||||||||
| $ | - | $ | 677,430 | $ | - | $ | 677,430 | |||||||||
(Concluded)
| Level 1 | Level 2 | Level 3 | Total | |||||||||||||||||||||||||||||
| NT$ | US$ (Note 4) | NT$ | US$ (Note 4) | NT$ | US$ (Note 4) | NT$ | US$ (Note 4) | |||||||||||||||||||||||||
| December 31, 2015 | ||||||||||||||||||||||||||||||||
| Financial assets at FVTPL | ||||||||||||||||||||||||||||||||
| Financial assets designated as at FVTPL | ||||||||||||||||||||||||||||||||
| Structured time deposits | $ | - | $ | - | $ | 1,646,357 | $ | 50,209 | $ | - | $ | - | $ | 1,646,357 | $ | 50,209 | ||||||||||||||||
| Private-placement convertible bonds | - | - | 100,500 | 3,065 | - | - | 100,500 | 3,065 | ||||||||||||||||||||||||
| Derivative financial assets | ||||||||||||||||||||||||||||||||
| Swap contracts | - | - | 1,452,611 | 44,301 | - | - | 1,452,611 | 44,301 | ||||||||||||||||||||||||
| Forward exchange contracts | - | - | 18,913 | 577 | - | - | 18,913 | 577 | ||||||||||||||||||||||||
| Foreign currency options | - | - | 5,020 | 153 | - | - | 5,020 | 153 | ||||||||||||||||||||||||
| Non-derivative financial assets held for trading | ||||||||||||||||||||||||||||||||
| Open-end mutual funds | 573,242 | 17,482 | - | - | - | - | 573,242 | 17,482 | ||||||||||||||||||||||||
| Quoted shares | 37,058 | 1,130 | - | - | - | - | 37,058 | 1,130 | ||||||||||||||||||||||||
| $ | 610,300 | $ | 18,612 | $ | 3,223,401 | $ | 98,305 | $ | - | $ | - | $ | 3,833,701 | $ | 116,917 | |||||||||||||||||
| Available-for-sale financial assets | ||||||||||||||||||||||||||||||||
| Limited partnership | $ | - | $ | - | $ | - | $ | - | $ | 476,612 | $ | 14,535 | $ | 476,612 | $ | 14,535 | ||||||||||||||||
| Unquoted shares | - | - | - | - | 264,477 | 8,065 | 264,477 | 8,065 | ||||||||||||||||||||||||
| Quoted shares | 197,580 | 6,026 | - | - | - | - | 197,580 | 6,026 | ||||||||||||||||||||||||
| Open-end mutual funds | 16,037 | 489 | - | - | - | - | 16,037 | 489 | ||||||||||||||||||||||||
| $ | 213,617 | $ | 6,515 | $ | - | $ | - | $ | 741,089 | $ | 22,600 | $ | 954,706 | $ | 29,115 | |||||||||||||||||
| Financial liabilities at FVTPL | ||||||||||||||||||||||||||||||||
| Derivative financial liabilities | ||||||||||||||||||||||||||||||||
| Conversion option, redemption option and put option of convertible bonds | $ | - | $ | - | $ | 2,632,565 | $ | 80,286 | $ | - | $ | - | $ | 2,632,565 | $ | 80,286 | ||||||||||||||||
| Swap contracts | - | - | 290,176 | 8,849 | - | - | 290,176 | 8,849 | ||||||||||||||||||||||||
| Forward exchange contracts | - | - | 69,207 | 2,111 | - | - | 69,207 | 2,111 | ||||||||||||||||||||||||
| Foreign currency option contracts | - | - | 13,659 | 416 | - | - | 13,659 | 416 | ||||||||||||||||||||||||
| Interest rate swap contracts | - | - | 119 | 4 | - | - | 119 | 4 | ||||||||||||||||||||||||
| $ | - | $ | - | $ | 3,005,726 | $ | 91,666 | $ | - | $ | - | $ | 3,005,726 | $ | 91,666 | |||||||||||||||||
| Level 1 | Level 2 | Level 3 | Total | |||||||||||||||||||||||||||||
| NT$ | US$ (Note 4) | NT$ | US$ (Note 4) | NT$ | US$ (Note 4) | NT$ | US$ (Note 4) | |||||||||||||||||||||||||
| December 31, 2018 | ||||||||||||||||||||||||||||||||
| Financial assets at FVTPL | ||||||||||||||||||||||||||||||||
| Derivative financial assets | ||||||||||||||||||||||||||||||||
| Swap contracts | $ | - | $ | - | $ | 1,557,714 | $ | 50,889 | $ | - | $ | - | $ | 1,557,714 | $ | 50,889 | ||||||||||||||||
| Forward exchange contracts | - | - | 32,070 | 1,048 | - | - | 32,070 | 1,048 | ||||||||||||||||||||||||
| Non-derivative financial assets | ||||||||||||||||||||||||||||||||
| Quoted ordinary shares | 5,151,255 | 168,287 | - | - | - | - | 5,151,255 | 168,287 | ||||||||||||||||||||||||
| Open-end mutual funds | 581,800 | 19,007 | - | - | - | - | 581,800 | 19,007 | ||||||||||||||||||||||||
| Unquoted preferred shares | - | - | - | - | 275,000 | 8,984 | 275,000 | 8,984 | ||||||||||||||||||||||||
| Private-placement funds | - | - | - | - | 200,123 | 6,537 | 200,123 | 6,537 | ||||||||||||||||||||||||
| Hybrid financial assets | ||||||||||||||||||||||||||||||||
| Private-placement convertible bonds | - | - | 100,496 | 3,283 | - | - | 100,496 | 3,283 | ||||||||||||||||||||||||
| $ | 5,733,055 | $ | 187,294 | $ | 1,690,280 | $ | 55,220 | $ | 475,123 | $ | 15,521 | $ | 7,898,458 | $ | 258,035 | |||||||||||||||||
| Financial assets at FVTOCI | ||||||||||||||||||||||||||||||||
| Investments in equity instruments | ||||||||||||||||||||||||||||||||
| Unquoted shares | $ | - | $ | - | $ | - | $ | - | $ | 540,730 | $ | 17,665 | $ | 540,730 | $ | 17,665 | ||||||||||||||||
| Limited partnership | - | - | - | - | 39,669 | 1,296 | 39,669 | 1,296 | ||||||||||||||||||||||||
| Investments in debt instruments | ||||||||||||||||||||||||||||||||
| Unsecured subordinate corporate bonds | - | - | - | - | 1,016,924 | 33,222 | 1,016,924 | 33,222 | ||||||||||||||||||||||||
| $ | - | $ | - | $ | - | $ | - | $ | 1,597,323 | $ | 52,183 | $ | 1,597,323 | $ | 52,183 | |||||||||||||||||
| Financial liabilities at FVTPL | ||||||||||||||||||||||||||||||||
| Derivative financial liabilities | ||||||||||||||||||||||||||||||||
| Swap contracts | $ | - | $ | - | $ | 29,058 | $ | 949 | $ | - | $ | - | $ | 29,058 | $ | 949 | ||||||||||||||||
| Forward exchange contracts | - | - | 7,597 | 248 | - | - | 7,597 | 248 | ||||||||||||||||||||||||
| $ | - | $ | - | $ | 36,655 | $ | 1,197 | $ | - | $ | - | $ | 36,655 | $ | 1,197 | |||||||||||||||||
For the financial assets and liabilities held as of December 31, 2014 and 2015 that were measured at fair value on a recurring basis held for the years ended December 31, 2017 and 2018, there were no transfers between Level 1 and Level 2 of the fair value hierarchy.
F-81
| 2) | Reconciliation of Level 3 fair value measurements of financial assets |
The financial assets measured at Level 3 fair value were equity investments with no quoted prices classified as available-for-sale financial assets - non-current. Reconciliations forFor the years ended December 31, 2013, 20142016 and 2015 were as follows:
| For the Years Ended December 31 | ||||||||||||||||
| 2013 | 2014 | 2015 | ||||||||||||||
| NT$ | NT$ | NT$ | US$ (Note 4) | |||||||||||||
| Balance at January 1 | $ | 776,683 | $ | 797,162 | $ | 778,866 | $ | 23,753 | ||||||||
| Purchases | 73,358 | 38,793 | 2,010 | 61 | ||||||||||||
| Disposals | (27,368 | ) | (21,012 | ) | (45,091 | ) | (1,375 | ) | ||||||||
| Total gain or loss | ||||||||||||||||
| In profit or loss | (106,916 | ) | (10,390 | ) | (15,891 | ) | (485 | ) | ||||||||
| In other comprehensive income | 81,405 | (25,687 | ) | 21,195 | 646 | |||||||||||
| Balance at December 31 | $ | 797,162 | $ | 778,866 | $ | 741,089 | $ | 22,600 | ||||||||
2017
As
| For the Year Ended December 31 | ||||||||
| 2016 | 2017 | |||||||
| NT$ | NT$ | |||||||
| Balance at January 1 | $ | 741,089 | $ | 904,790 | ||||
| Purchases | 495,928 | 2,649 | ||||||
| Total gain or loss | ||||||||
| In profit or loss | (100,734 | ) | 28 | |||||
| In other comprehensive income | (202,565 | ) | 17,284 | |||||
| Disposals | (28,928 | ) | (16,202 | ) | ||||
| Balance at December 31 | $ | 904,790 | $ | 908,549 | ||||
F-100
For the year ended December 31, 2014 and 2015, unrealized loss of NT$21,519 thousand and NT$8,611 thousand (US$263 thousand), recorded in other comprehensive income under the heading of unrealized gain (loss) on available-for-sale financial assets, were included in the carrying amount of the financial assets at fair value on Level 3 fair value measurement.2018
| FVTPL | FVTOCI | |||||||||||||||||||||||||||||||
| Financial Assets | Equity Instruments | Equity Instruments | Debt Instruments | Total | ||||||||||||||||||||||||||||
| NT$ | US$ (Note 4) | NT$ | US$ (Note 4) | NT$ | US$ (Note 4) | NT$ | US$ (Note 4) | |||||||||||||||||||||||||
| Balance at January 1 (Note 3) | $ | - | $ | - | $ | 908,549 | $ | 29,681 | $ | 1,080,000 | $ | 35,283 | $ | 1,988,549 | $ | 64,964 | ||||||||||||||||
| Recognized in profit or loss | (2,313 | ) | (76 | ) | - | - | - | - | (2,313 | ) | (76 | ) | ||||||||||||||||||||
| Recognized in other comprehensive income (included in unrealized losses on financial assets at FVTOCI) | - | - | (224,172 | ) | (7,323 | ) | (63,076 | ) | (2,061 | ) | (287,248 | ) | (9,384 | ) | ||||||||||||||||||
| Purchases | 477,436 | 15,597 | 105,000 | 3,430 | - | - | 582,436 | 19,027 | ||||||||||||||||||||||||
| Disposals | - | - | (208,978 | ) | (6,827 | ) | - | - | (208,978 | ) | (6,827 | ) | ||||||||||||||||||||
| Balance at December 31 | $ | 475,123 | $ | 15,521 | $ | 580,399 | $ | 18,961 | $ | 1,016,924 | $ | 33,222 | $ | 2,072,446 | $ | 67,704 | ||||||||||||||||
| 3) | Valuation techniques and assumptions applied for the purpose of measuring fair value |
| a) | Valuation techniques and inputs applied for the purpose of measuring Level 2 fair value measurement |
| Financial Instruments | Valuation Techniques and Inputs | |
| Derivatives - swap contracts and forward exchange | Discounted cash flows - Future cash flows are estimated based on observable forward exchange rates | |
Discounted cash flows - Future cash flows are estimated based on observable |
| b) | Valuation techniques and inputs applied for the purpose of measuring Level 3 fair value measurement |
The fair value of the Group’s investments in unquoted ordinary shares on Level 3 fair value measurementand private-placement funds were measureddetermined using market approach based on investees’ recent financing activities, technical development,and asset-based approach. The significant unobservable inputs is the discount for lack of marketability of 20% to 30%. If the discount for lack of marketability to the valuation model were increased by 1% to reflect reasonably possible alternative assumptions while all the other variables were held constant, the fair value of investees comparable companies, market conditions and other economic indicators.unquoted shares would have decreased approximately by NT$7,700 thousand (US$252 thousand).
F-82
The fair values of investments in limited partnership are measured by estimating future cash inflows from disposal (net of transaction cost).
The fair values of the unsecured subordinate corporate bonds were determined using income approach based on a discounted cash flow technique and a comparable multiple technique.analysis. The significant unobservable inputs used ininput is the discounted cash flow techniquediscount rate that reflects the credit risk of the counterparty. If the discountrate was increased by 0.1% while all the other variables were discount rates of 12.34% and the terminal growth rates of 2.50%. Any significant increase in discount rates or any significant decrease in terminal growth rates would result in a decrease inheld constant, the fair value of the investments in limited partnership. The significant unobservable input used in the comparable multiple technique was EBITDA multiples of 9.73. Any significant decrease in multiplesbonds would result in a decrease in the fair value of the investments in limited partnership.have decreased approximately by NT$7,000 thousand (US$229 thousand).
F-101
| c. | Categories of financial instruments |
| December 31 | ||||||||||||
| 2014 | 2015 | |||||||||||
| NT$ | NT$ | US$ (Note 4) | ||||||||||
| Financial assets | ||||||||||||
| FVTPL | ||||||||||||
| Designated as at FVTPL | $ | 2,476,550 | $ | 1,746,857 | $ | 53,274 | ||||||
| Held for trading | 2,512,293 | 2,086,844 | 63,643 | |||||||||
| Available-for-sale financial assets | 2,474,370 | 954,706 | 29,115 | |||||||||
| Loans and receivables (Note 1) | 106,158,279 | 101,259,880 | 3,088,133 | |||||||||
| Financial liabilities | ||||||||||||
| FVTPL | ||||||||||||
| Held for trading | 2,651,352 | 3,005,726 | 91,666 | |||||||||
| Measured at amortized cost (Note 2) | 157,157,392 | 173,294,140 | 5,284,969 | |||||||||
| December 31 | ||||||||||||
| 2017 | 2018 | |||||||||||
| NT$ | NT$ | US$ (Note 4) | ||||||||||
| Financial assets | ||||||||||||
| FVTPL | ||||||||||||
| Designated as at FVTPL | $ | 100,496 | $ | - | $ | - | ||||||
| Held for trading | 5,122,571 | - | - | |||||||||
| Mandatorily at FVTPL | - | 7,898,458 | 258,035 | |||||||||
| Available-for-sale financial assets | 1,212,165 | - | - | |||||||||
| Loans and receivables (Note 1) | 103,973,567 | - | - | |||||||||
| Measured at amortized cost (Note 1) | - | 139,866,736 | 4,569,314 | |||||||||
| FVTOCI | ||||||||||||
| Equity instruments | - | 580,399 | 18,961 | |||||||||
| Debt instruments | - | 1,016,924 | 33,222 | |||||||||
| Financial liabilities | ||||||||||||
| FVTPL | ||||||||||||
| Held for trading | 677,430 | 36,655 | 1,197 | |||||||||
| Financial liabilities for hedging | - | 3,899,634 | 127,397 | |||||||||
| Measured at amortized cost (Note 2) | 139,561,999 | 286,035,732 | 9,344,520 | |||||||||
Note 1: The balances included loans and receivablesfinancial assets measured at amortized cost which comprise cash and cash equivalents, trade and other receivables and other financial assets.
Note 2: The balances included financial liabilities measured at amortized cost which comprise short-term borrowings, short-term bills payable, trade and other payables, bonds payable and long-term borrowings.
| d. | Financial risk management objectives and policies |
The derivative instruments used by the Group are to mitigate risks arising from ordinary business operations. All derivative transactions entered into by the Group are designated as either hedging or trading. Derivative transactions entered into for hedging purposes must hedge risk against fluctuations in foreign exchange rates and interest rates arising from operating activities. The currencies and the amount of derivative instruments held by the Group must match its hedged assets and liabilities denominated in foreign currencies.
The Group'sGroup’s risk management department monitors risks to mitigate risk exposures, reports unsettled position, transaction balances and related gains or losses to the Group’s chief financial officer on monthly basis.
| 1) | Market risk |
The Group’s activities exposed it primarily to the financial risks of changes in foreign currency exchange rates and interest rates. Gains or losses arising from fluctuations in foreign currency exchange rates of a variety of derivative financial instruments were approximately offset by those of hedged items. Interest rate risk was not significant due to the cost of capital was expected to be fixed.
F-83
There had been no change to the Group'sGroup’s exposure to market risks or the manner in which these risks were managed and measured.
F-102
| a) | Foreign currency exchange rate risk |
The Group had sales and purchases as well as financing activities denominated in foreign currency which exposed the Group to foreign currency exchange rate risk. The Group entered into a variety of derivative financial instruments to hedge foreign currency exchange rate risk to minimize the fluctuations of assets and liabilities denominated in foreign currencies.
The carrying amounts of the Group'sGroup’s foreign currency denominated monetary assets and liabilities (including those eliminated upon consolidation) as well as derivative instruments which exposed the Group to foreign currency exchange rate risk at each balance sheet date are presented in Note 36.40.
The Group was principally subject to the impact to exchange rate fluctuation in U.S. dollarsUS$ and Japanese yenJPY against NT$ or CNY. 1% is the sensitivity rate used when reporting foreign currency exchange rate risk internally to key management personnel and represents management’s assessment of the reasonably possible change in foreign currency exchange rates. The sensitivity analysis included financial assets and liabilities and inter-company receivables and payables within the Group. The changes in profit before income tax due to a 1% change in U.S. dollars and Japanese yen both against NT$ and CNY would be NT$15,00069,000 thousand, NT$41,000101,000 thousand and NT$18,000129,000 thousand (US$5494,214 thousand) for the years ended December 31, 2013, 20142016, 2017 and 2015,2018, respectively. Hedging contracts and hedged items have been taken into account while measuring the changes in profit before income tax. The abovementioned sensitivity analysis mainly focused on the foreign currency monetary items at the end of the year. As the year-end exposure did not reflect the exposure for the years ended December 31, 2013, 20142016, 2017 and 2015,2018, the abovementioned sensitivity analysis was unrepresentative of those years.
Hedge accounting-2018
The Group’s hedging strategy is to lift foreign currency borrowings to avoid 100% exchange rate exposure of its foreign currency equity instruments, which is designated as fair value hedges. Hedge adjustments are made when the foreign currency equity instruments were evaluated based on the exchange rates on each balance sheet date, the foreign exchange gains (losses) will be totally offset.
The source of hedge ineffectiveness in these hedging relationships is the material difference between the notional amounts of foreign currency borrowings and foreign currency equity instruments. No other sources of ineffectiveness is expected to emerge from these hedging relationships.
| b) | Interest rate risk |
Except a portion of long-term borrowings and bonds payable at fixed interest rates, the Group was exposed to interest rate risk because group entities borrowed funds at floating interest rates. Changes in market interest rates will lead to variances in effective interest rates of borrowings from which the future cash flow fluctuations arise. The Group uses financing tool with low interest rate and favorable term so as to maintain low financing cost, adequate banking facilities, as well as to hedge interest rate risk.
The carrying amounts of the Group'sGroup’s financial assets and financial liabilities with exposure to interest rates at each balance sheet date were as follows:
| December 31 | ||||||||||||
| 2014 | 2015 | |||||||||||
| NT$ | NT$ | US$ (Note 4) | ||||||||||
| Fair value interest rate risk | ||||||||||||
| Financial liabilities | $ | 34,003,038 | $ | 18,030,482 | $ | 549,877 | ||||||
| Cash flow interest rate risk | ||||||||||||
| Financial assets | 51,603,455 | 53,475,994 | 1,630,863 | |||||||||
| Financial liabilities | 65,149,698 | 65,213,083 | 1,988,810 | |||||||||
F-103
| December 31 | ||||||||||||
| 2017 | 2018 | |||||||||||
| NT$ | NT$ | US$ (Note 4) | ||||||||||
| Fair value interest rate risk | ||||||||||||
| Financial liabilities | $ | 17,552,955 | $ | 17,485,561 | $ | 571,237 | ||||||
| Cash flow interest rate risk | ||||||||||||
| Financial assets | 39,880,736 | 32,942,747 | 1,076,209 | |||||||||
| Financial liabilities | 42,270,321 | 172,737,393 | 5,643,169 | |||||||||
For assets and liabilities with floating interest rates, a 100 basis point increase or decrease was used when reporting interest rate risk internally to key management personnel. If interest rates had been 100 basis points (1%) higher or lower and all other variables held constant, the Group’s profit before income tax for the years ended December 31, 2013, 20142016, 2017 and 20152018 would have decreased or increased approximately by NT$323,000358,000 thousand, NT$135,00024,000 thousandand NT$117,0001,398,000 thousand (US$3,56845,671 thousand), respectively. Hedging contracts and hedged items have been taken into account while measuring the changes in profit before income tax. The abovementioned sensitivity analysis mainly focused on the interest rate items at the end of the reporting period. As the year-end exposure did not reflect the exposure for the years ended December 31, 2016, 2017 and 2018, the abovementioned sensitivity analysis was unrepresentative of those periods.
F-84
| c) | Other price risk |
The Group was exposed to equity or bond price risk through its investments in financial assets at FVTPL (included quoted ordinary shares, open-end mutual funds, unquoted preferred shares, private-placement funds and private-placement convertible bonds) and financial assets at FVTOCI for the year ended December 31, 2018. If equity and bond prices were 1% higher or lower, profit before income tax for the year ended December 31, 2018 would have increased or decreased approximately by NT$64,000 thousand (US$2,091 thousand) and other comprehensive income before income tax for the year ended December 31, 2018 would have increased or decreased approximately by NT$16,000 thousand (US$523 thousand).
ASE and its subsidiaries were exposed to equity or debt price risk through its investments in financial assets at FVTPL including(including private-placement convertible bonds, quoted shares and open-end mutual funds,funds) and available-for-sale financial assets.assets for the years ended December 31, 2016 and 2017. If equity or debt prices were 1% higher or lower, profit before income tax for the years ended December 31, 2013, 20142016 and 20152017 would have increased or decreased approximately by NT$3,100 thousand, NT$6,80026,000 thousand and NT$7,10052,000 thousand, (US$217 thousand), respectively, and other comprehensive income before income tax for the years ended December 31, 2013, 20142016 and 20152017 would have both increased or decreased approximately by NT$35,000 thousand, NT$25,000 thousand and NT$10,000 thousand (US$305 thousand), respectively.13,000 thousand.
In addition, the GroupASE was also exposed to the Company’sits ordinary share price risk through conversion option, redemption option and put option of Bonds Optionswhich was recognized as financial liabilities held for trading.trading as of December 31, 2016. 7% is the sensitivity rate used when reporting price risk internally to key management personnel. If the Company’sASE’s ordinary share price increased or decreased by 7%, profit before income tax for the yearsyear ended December 31, 2013, 2014 and 20152016 would have decreased approximately by NT$353,000510,000 thousand NT$651,000 thousand and NT$605,000 thousand (US$18,451 thousand), respectively, or increased approximately by NT$319,000 thousand, NT$608,000 thousand and NT$638,000 thousand (US$19,457 thousand), respectively.445,000 thousand.
| 2) | Credit risk |
Credit risk refers to the risk that counterparty will default on its contractual obligations resulting in financial loss to the Group. The Group’s credit risk arises from cash and cash equivalents, trade and other receivables and other financial assets. The Group’s maximum exposure to credit risk was the carrying amounts of financial assets in the consolidated balance sheets.
F-104
As of December 31, 2017 and 2018, the Group’s five largest customers accounted for 33% and 36% of trade receivables, respectively. The Group dealttransacts with counterparties creditworthy and has a credit policy and trade receivable management procedures to ensure recovery and evaluation of trade receivables. The Group’s counterparties consisted of a large number of unrelated customers and, banks and there wasthus, no significant concentration of credit risk exposure.was observed.
| 3) | Liquidity risk |
The Group manages liquidity risk by maintaining adequate working capital and banking facilities to fulfill the demand for cash flow used in the Group’s operation and capital expenditure. The Group also monitors its compliance with all the loan covenants. Liquidity risk is not considered to be significant.
In the table below, financial liabilities with a repayment on demand clause were included in the earliest time band regardless of the probability of counter-parties choosing to exercise their rights. The maturity dates for other non-derivative financial liabilities were based on the agreed repayment dates.
To the extent that interest flows are floating rate, the undiscounted amounts were derived from the interest rates at each balance sheet date.
On Demand or Less than 1 Month | 1 to 3 Months | 3 Months to 1 Year | 1 to 5 Years | More than 5 Years | ||||||||||||||||
| NT$ | NT$ | NT$ | NT$ | NT$ | ||||||||||||||||
| December 31, 2017 | ||||||||||||||||||||
| Non-derivative financial liabilities | ||||||||||||||||||||
| Non-interest bearing | $ | 30,695,797 | $ | 18,387,296 | $ | 4,549,468 | $ | 2,807 | $ | 176,199 | ||||||||||
| Floating interest rate liabilities | 6,641,541 | 4,153,830 | 5,101,178 | 27,196,245 | 900,310 | |||||||||||||||
| Fixed interest rate liabilities | 8,522,765 | 7,526,270 | 1,526,449 | 11,902,335 | 6,462,396 | |||||||||||||||
| $ | 45,860,103 | $ | 30,067,396 | $ | 11,177,095 | $ | 39,101,387 | $ | 7,538,905 | |||||||||||
| December 31, 2018 | ||||||||||||||||||||
| Non-derivative financial liabilities | ||||||||||||||||||||
| Non-interest bearing | $ | 33,156,044 | $ | 34,493,000 | $ | 6,899,093 | $ | 57,375 | $ | 196,523 | ||||||||||
| Floating interest rate liabilities | 15,762,004 | 7,127,606 | 25,510,718 | 131,014,040 | - | |||||||||||||||
| Fixed interest rate liabilities | 7,677,097 | 4,811,536 | 242,461 | 13,621,814 | 4,367,546 | |||||||||||||||
| $ | 56,595,145 | $ | 46,432,142 | $ | 32,652,272 | $ | 144,693,229 | $ | 4,564,069 | |||||||||||
F-85
On Demand or Less than 1 Month | 1 to 3 Months | 3 Months to 1 Year | 1 to 5 Years | More than 5 Years | ||||||||||||||||
| NT$ | NT$ | NT$ | NT$ | NT$ | ||||||||||||||||
| December 31, 2014 | ||||||||||||||||||||
| Non-derivative financial liabilities | ||||||||||||||||||||
| Non-interest bearing | $ | 23,660,711 | $ | 21,370,876 | $ | 4,606,064 | $ | 155,599 | $ | 29,139 | ||||||||||
| Floating interest rate liabilities | 21,534,220 | 9,003,403 | 12,364,453 | 23,870,629 | 175,302 | |||||||||||||||
| Fixed interest rate liabilities | 684,039 | 838,234 | 846,899 | 34,458,859 | - | |||||||||||||||
| $ | 45,878,970 | $ | 31,212,513 | $ | 17,817,416 | $ | 58,485,087 | $ | 204,441 | |||||||||||
| December 31, 2015 | ||||||||||||||||||||
| Non-derivative financial liabilities | ||||||||||||||||||||
| Non-interest bearing | $ | 19,393,406 | $ | 19,626,026 | $ | 6,493,504 | $ | 1,926 | $ | 194,346 | ||||||||||
| Floating interest rate liabilities | 6,617,050 | 5,677,129 | 10,582,324 | 39,202,454 | 775,273 | |||||||||||||||
| Fixed interest rate liabilities | 16,168,484 | 2,463,617 | 24,787,238 | 18,078,920 | - | |||||||||||||||
| $ | 42,178,940 | $ | 27,766,772 | $ | 41,863,066 | $ | 57,283,300 | $ | 969,619 | |||||||||||
On Demand or Less than 1 Month | 1 to 3 Months | 3 Months to 1 Year | 1 to 5 Years | More than 5 Years | ||||||||||||||||
| US$ (Note 4) | US$ (Note 4) | US$ (Note 4) | US$ (Note 4) | US$ (Note 4) | ||||||||||||||||
| December 31, 2015 | ||||||||||||||||||||
| Non-derivative financial liabilities | ||||||||||||||||||||
| Non-interest bearing | $ | 591,442 | $ | 598,537 | $ | 198,033 | $ | 59 | $ | 5,927 | ||||||||||
| Floating interest rate liabilities | 201,801 | 173,136 | 322,730 | 1,195,561 | 23,644 | |||||||||||||||
| Fixed interest rate liabilities | 493,092 | 75,133 | 755,939 | 551,355 | - | |||||||||||||||
| $ | 1,286,335 | $ | 846,806 | $ | 1,276,702 | $ | 1,746,975 | $ | 29,571 | |||||||||||
On Demand or Less than 1 Month | 1 to 3 Months | 3 Months to 1 Year | 1 to 5 Years | More than 5 Years | ||||||||||||||||
| US$ (Note 4) | US$ (Note 4) | US$ (Note 4) | US$ (Note 4) | US$ (Note 4) | ||||||||||||||||
| December 31, 2018 | ||||||||||||||||||||
| Non-derivative financial liabilities | ||||||||||||||||||||
| Non-interest bearing | $ | 1,083,177 | $ | 1,126,854 | $ | 225,387 | $ | 1,874 | $ | 6,420 | ||||||||||
| Floating interest rate liabilities | 514,930 | 232,852 | 833,411 | 4,280,106 | - | |||||||||||||||
| Fixed interest rate liabilities | 250,804 | 157,188 | 7,921 | 445,012 | 142,684 | |||||||||||||||
| $ | 1,848,911 | $ | 1,516,894 | $ | 1,066,719 | $ | 4,726,992 | $ | 149,104 | |||||||||||
The amounts included above for floating interest rate instruments for non-derivative financial liabilities was subject to change if changes in floating interest rates differ from those estimates of interest rates determined at each balance sheet date.
The following table detailed the Group'sGroup’s liquidity analysis for its derivative financial instruments. The table was based on the undiscounted contractual net cash inflows and outflows on derivative instruments that settle on a net basis, and the undiscounted gross cash inflows and outflows on those derivatives that require gross settlement. When the amounts payable or receivable are not fixed, the amounts disclosed have been determined by reference to the projected interest rates as illustrated by the yield curves at each balance sheet date.
On Demand or Less than 1 Month | 1 to 3 Months | 3 Months to 1 Year | ||||||||||
| NT$ | NT$ | NT$ | ||||||||||
| December 31, 2014 | ||||||||||||
| Gross settled | ||||||||||||
| Forward exchange contracts | ||||||||||||
| Inflows | $ | 3,662,813 | $ | 1,959,573 | $ | 9,241 | ||||||
| Outflows | (3,655,279 | ) | (1,940,145 | ) | (9,331 | ) | ||||||
| 7,534 | 19,428 | (90 | ) | |||||||||
(Continued)
F-86F-105
On Demand or Less than 1 Month | 1 to 3 Months | 3 Months to 1 Year | ||||||||||
| NT$ | NT$ | NT$ | ||||||||||
| Swap contracts | ||||||||||||
| Inflows | $ | 10,342,259 | $ | 4,621,200 | $ | 33,399,031 | ||||||
| Outflows | (10,215,834 | ) | (4,461,118 | ) | (31,646,310 | ) | ||||||
| 126,425 | 160,082 | 1,752,721 | ||||||||||
| $ | 133,959 | $ | 179,510 | $ | 1,752,631 | |||||||
| December 31, 2015 | ||||||||||||
| Net settled | ||||||||||||
| Forward exchange contracts | $ | (230 | ) | $ | 3,435 | $ | - | |||||
| Foreign currency options | $ | 2,054 | $ | 8,735 | $ | - | ||||||
| Gross settled | ||||||||||||
| Forward exchange contracts | ||||||||||||
| Inflows | $ | 2,822,265 | $ | 2,421,602 | $ | - | ||||||
| Outflows | (2,836,080 | ) | (2,429,050 | ) | - | |||||||
| (13,815 | ) | (7,448 | ) | - | ||||||||
| Swap contracts | ||||||||||||
| Inflows | 16,561,521 | 22,476,799 | 36,796,825 | |||||||||
| Outflows | (16,564,549 | ) | (22,007,274 | ) | (35,813,527 | ) | ||||||
| (3,028 | ) | 469,525 | 983,298 | |||||||||
| Interest rate swap | ||||||||||||
| Inflows | 12,603 | 12,466 | 25,069 | |||||||||
| Outflows | (11,595 | ) | (11,469 | ) | (23,063 | ) | ||||||
| 1,008 | 997 | 2,006 | ||||||||||
| $ | (15,835 | ) | $ | 463,074 | $ | 985,304 | ||||||
On Demand or Less than 1 Month | 1 to 3 Months | 3 Months to 1 Year | ||||||||||
| NT$ | NT$ | NT$ | ||||||||||
| December 31, 2017 | ||||||||||||
| Net settled | ||||||||||||
| Forward exchange contracts | $ | (8,820 | ) | $ | - | $ | - | |||||
| Gross settled | ||||||||||||
| Forward exchange contracts | ||||||||||||
| Inflows | $ | 3,711,302 | $ | 2,169,093 | $ | 390,379 | ||||||
| Outflows | (3,679,154 | ) | (2,138,635 | ) | (386,880 | ) | ||||||
| 32,148 | 30,458 | 3,499 | ||||||||||
| Swap contracts | ||||||||||||
| Inflows | 12,116,531 | 14,434,880 | 36,676,224 | |||||||||
| Outflows | (12,189,576 | ) | (14,629,738 | ) | (36,452,398 | ) | ||||||
| (73,045 | ) | (194,858 | ) | 223,826 | ||||||||
| $ | (40,897 | ) | $ | (164,400 | ) | $ | 227,325 | |||||
| December 31, 2018 | ||||||||||||
| Net settled | ||||||||||||
| Forward exchange contracts | $ | 2,040 | $ | 1,620 | $ | - | ||||||
| Gross settled | ||||||||||||
| Forward exchange contracts | ||||||||||||
| Inflows | $ | 2,580,194 | $ | 466,489 | $ | - | ||||||
| Outflows | (2,556,607 | ) | (460,725 | ) | - | |||||||
| 23,587 | 5,764 | - | ||||||||||
| Swap contracts | ||||||||||||
| Inflows | ||||||||||||
| Outflows | 14,136,620 | 9,214,500 | 38,160,316 | |||||||||
| (13,946,583 | ) | (8,650,320 | ) | (36,596,419 | ) | |||||||
| 190,037 | 564,180 | 1,563,897 | ||||||||||
| $ | 213,624 | $ | 569,944 | $ | 1,563,897 | |||||||
(Concluded)
On Demand or Less than 1 Month | 1 to 3 Months | 3 Months to 1 Year | ||||||||||
| US$ (Note 4) | US$ (Note 4) | US$ (Note 4) | ||||||||||
| December 31, 2015 | ||||||||||||
| Net settled | ||||||||||||
| Forward exchange contracts | $ | (7 | ) | $ | 105 | $ | - | |||||
| Foreign currency options | $ | 63 | $ | 266 | $ | - | ||||||
On Demand or Less than 1 Month | 1 to 3 Months | 3 Months to 1 Year | ||||||||||
| US$ (Note 4) | US$ (Note 4) | US$ (Note 4) | ||||||||||
| December 31, 2018 | ||||||||||||
| Net settled | ||||||||||||
| Forward exchange contracts | $ | 67 | $ | 53 | $ | - | ||||||
(Continued)
F-87F-106
On Demand or Less than 1 Month | 1 to 3 Months | 3 Months to 1 Year | ||||||||||
| US$ (Note 4) | US$ (Note 4) | US$ (Note 4) | ||||||||||
| Gross settled | ||||||||||||
| Forward exchange contracts | ||||||||||||
| Inflows | $ | 86,071 | $ | 73,852 | $ | - | ||||||
| Outflows | (86,492 | ) | (74,079 | ) | - | |||||||
| (421 | ) | (227 | ) | - | ||||||||
| Swap contracts | ||||||||||||
| Inflows | 505,079 | 685,477 | 1,122,197 | |||||||||
| Outflows | (505,171 | ) | (671,158 | ) | (1,092,209 | ) | ||||||
| (92 | ) | 14,319 | 29,988 | |||||||||
| Interest rate swap | ||||||||||||
| Inflows | 384 | 380 | 764 | |||||||||
| Outflows | (354 | ) | (350 | ) | (703 | ) | ||||||
| 30 | 30 | 61 | ||||||||||
| $ | (483 | ) | $ | 14,122 | $ | 30,049 | ||||||
On Demand or Less than 1 Month | 1 to 3 Months | 3 Months to 1 Year | ||||||||||
| US$ (Note 4) | US$ (Note 4) | US$ (Note 4) | ||||||||||
| Gross settled | ||||||||||||
| Forward exchange contracts | ||||||||||||
| Inflows | $ | 84,293 | $ | 15,240 | $ | - | ||||||
| Outflows | (83,522 | ) | (15,052 | ) | - | |||||||
| 771 | 188 | - | ||||||||||
| Swap contracts | ||||||||||||
| Inflows | 461,830 | 301,029 | 1,246,662 | |||||||||
| Outflows | (455,622 | ) | (282,598 | ) | (1,195,571 | ) | ||||||
| 6,208 | 18,431 | 51,091 | ||||||||||
| $ | 6,979 | $ | 18,619 | $ | 51,091 | |||||||
(Concluded)
37. RELATED PARTY TRANSACTIONS
Balances and transactions within the Group had been eliminated upon consolidation. Details of transactions between the Group and other related parties were disclosed as follows:
| a. | Related parties |
In addition to those disclosed in Note 15, the related parties were as follows:
| Related Parties | Relationship with the Company | |
| ASE Cultural and Educational Foundation | Substantial related party | |
| Fu Hwa Construction Co., Ltd. | Associate’s subsidiary |
| b. | The |
| c. |
| d. | The Group contracted with Fu Hwa Construction Co., Ltd. to construct a female employee dormitory on current leased land. Total consideration was primarily based on independent professional appraisal reports. During |
| e. | In February 2016, USIE repurchased 1,801 thousand shares of USIE’s outstanding ordinary shares from the |
| f. | As disclosed in Note 32, the |
F-88F-107
| Compensation to key management personnel |
| For the Years Ended December 31 | ||||||||||||||||
| 2013 | 2014 | 2015 | ||||||||||||||
| NT$ | NT$ | NT$ | US$ (Note 4) | |||||||||||||
| Short-term employee benefits | $ | 741,232 | $ | 989,720 | $ | 812,002 | $ | 24,764 | ||||||||
| Post-employment benefits | 4,766 | 4,049 | 3,944 | 120 | ||||||||||||
| Share-based payments | 78,701 | 50,327 | 17,937 | 547 | ||||||||||||
| $ | 824,699 | $ | 1,044,096 | $ | 833,883 | $ | 25,431 | |||||||||
| For the Year Ended December 31 | ||||||||||||||||
| 2016 | 2017 | 2018 | ||||||||||||||
| NT$ | NT$ | NT$ | US$ (Note 4) | |||||||||||||
| Short-term employee benefits | $ | 790,460 | $ | 860,631 | $ | 1,041,216 | $ | 34,015 | ||||||||
| Post-employment benefits | 4,790 | 2,858 | 3,884 | 127 | ||||||||||||
| Share-based payments | 11,547 | - | 9,145 | 299 | ||||||||||||
| $ | 806,797 | $ | 863,489 | $ | 1,054,245 | $ | 34,441 | |||||||||
The compensation to the Company’sGroup’s key management personnel is determined according to personal performance and market trends.
38. ASSETS PLEDGED AS COLLATERAL OR FOR SECURITY
In addition to Note 9, theThe following assets were provided as collateral for bank borrowings and the tariff guarantees of imported raw materials:
| December 31 | ||||||||||||
| 2014 | 2015 | |||||||||||
| NT$ | NT$ | US$ (Note 4) | ||||||||||
| Inventories related to real estate business | $ | 15,164,858 | $ | 16,312,519 | $ | 497,485 | ||||||
| Other financial assets (including current and non-current) | 268,562 | 229,613 | 7,002 | |||||||||
| $ | 15,433,420 | $ | 16,542,132 | $ | 504,487 | |||||||
| December 31 | ||||||||||||
| 2017 | 2018 | |||||||||||
| NT$ | NT$ | US$ (Note 4) | ||||||||||
| Inventories related to real estate business | $ | 4,822,043 | $ | 4,796,126 | $ | 156,685 | ||||||
| Investment properties | 7,151,382 | 6,680,017 | 218,230 | |||||||||
| Land use rights (long-term prepayments for lease) | 6,813,751 | 6,515,576 | 212,858 | |||||||||
| Other financial assets (including current and non-current) | 66,726 | 496,902 | 16,233 | |||||||||
| $ | 18,853,902 | $ | 18,488,621 | $ | 604,006 | |||||||
39. SIGNIFICANT CONTINGENT LIABILITIES AND UNRECOGNIZED COMMITMENTS
In addition to those disclosed in other notes, significant commitments and contingencies of the Group as of each balance sheet date were as follows:
| a. |
| As of December 31, |
| As of December 31, |
| As of December 31, |
| In consideration of corporate social responsibility for environmental protection, the |
In February 2019, the Group’s board of directors approved to contribute NT$100,000 thousand (US$3,267 thousand) to ASE Cultural & Educational Foundation for environmental charity in promoting the related domestic environmental protection and public service activities continuously.
F-89F-108
| December 31, 2015 | ||||||||
| NT$ | US$ (Note 4) | |||||||
| Less than 1 year | $ | 211,225 | $ | 6,442 | ||||
| 1-5 years | 353,470 | 10,780 | ||||||
| More than 5 years | 462,733 | 14,112 | ||||||
| $ | 1,027,428 | $ | 31,334 | |||||
| SIGNIFICANT SUBSEQUENT EVENTS |
In January 2016,
On March 28, 2019, the Company issuedCompany’s board of directors resolved to issue ordinary shares in the way of cash capital increase in an amount up to NT$3,000,000 thousand (US$98,007 thousand) with par value NT$10 (US$0.3) per share. The Company’s board of directors also resolved to issue unsecured domestic bonds that were approved by the Taipei Exchange. These bonds will be issued in the amounts of NT$7,000,0006,500,000 thousand (US$213,480212,349 thousand) and NT$3,500,000 thousand (US$114,342 thousand) with aannual interest rates of 0.9% and 1.03%, respectively, and with maturity of 5 years and interest due annually with annual interest rate 1.30%, and in NT$2,000,000 thousand (US$60,994 thousand) with a maturity of 7 years, and interest due annually with annual interest rate 1.50%.respectively.
| SIGNIFICANT ASSETS AND LIABILITIES DENOMINATED IN FOREIGN CURRENCIES |
The following information was aggregated by the foreign currencies other than functional currencies of the group entities and the exchange rates between foreign currencies and respective functional currencies were disclosed. The significant financial assets and liabilities denominated in foreign currencies were as follows:
Foreign Currencies (In Thousand) | Exchange Rate | Carrying Amount (In Thousand) | ||||||||||
| December 31, 2014 | ||||||||||||
| Monetary financial assets | ||||||||||||
| US$ | $ | 3,086,749 | US$1=NT$31.65 | $ | 97,695,606 | |||||||
| US$ | 649,271 | US$1=CNY6.119 | 20,549,427 | |||||||||
| JPY | 3,354,008 | JPY1=NT$0.2646 | 887,471 | |||||||||
| JPY | 8,787,236 | JPY1=US$0.0084 | 2,325,103 | |||||||||
| Monetary financial liabilities | ||||||||||||
| US$ | 2,896,001 | US$1=NT$31.65 | 91,658,432 | |||||||||
| US$ | 976,913 | US$1=CNY6.119 | 30,919,296 | |||||||||
| JPY | 3,159,712 | JPY1=NT$0.2646 | 836,060 | |||||||||
| JPY | 8,903,753 | JPY1=US$0.0084 | 2,355,933 | |||||||||
(Continued)
F-90
Foreign Currencies (In Thousand) | Exchange Rate | Carrying Amount (In Thousand) | ||||||||||
| December 31, 2015 | ||||||||||||
| Monetary financial assets | ||||||||||||
| US$ | $ | 2,926,597 | US$1=NT$32.825 | $ | 96,065,552 | |||||||
| US$ | 1,008,097 | US$1=CNY6.4936 | 33,090,795 | |||||||||
| JPY | 3,380,683 | JPY1=NT$0.2727 | 921,912 | |||||||||
| JPY | 8,467,689 | JPY1=US$0.0083 | 2,309,139 | |||||||||
| Monetary financial liabilities | ||||||||||||
| US$ | 2,988,953 | US$1=NT$32.825 | 98,112,393 | |||||||||
| US$ | 995,195 | US$1=CNY6.4936 | 32,667,265 | |||||||||
| JPY | 3,747,333 | JPY1=NT$0.2727 | 1,021,898 | |||||||||
| JPY | 8,775,382 | JPY1=US$0.0083 | 2,393,047 | |||||||||
Foreign Currencies (In Thousand) | Exchange Rate | Carrying Amount (In Thousand) | ||||||||||
| December 31, 2017 | ||||||||||||
| Monetary financial assets | ||||||||||||
| US$ | $ | 3,065,296 | US$1=NT$29.76 | $ | 91,223,195 | |||||||
| US$ | 1,193,369 | US$1=CNY6.5342 | 35,514,653 | |||||||||
| JPY | 5,005,435 | JPY1=NT$0.2642 | 1,322,436 | |||||||||
| JPY | 8,113,284 | JPY1=US$0.0089 | 2,143,530 | |||||||||
| Monetary financial liabilities | ||||||||||||
| US$ | 2,902,995 | US$1=NT$29.76 | 86,393,137 | |||||||||
| US$ | 1,007,629 | US$1=CNY6.5342 | 29,987,042 | |||||||||
| JPY | 5,415,677 | JPY1=NT$0.2642 | 1,430,822 | |||||||||
| JPY | 8,598,832 | JPY1=US$0.0089 | 2,271,811 | |||||||||
(Concluded)
| December 31, 2018 | ||||||||||||
| Monetary financial assets | ||||||||||||
| US$ | 3,730,484 | US$1=NT$30.715 | 114,581,814 | |||||||||
| US$ | 1,299,391 | US$1=CNY6.8632 | 39,910,801 | |||||||||
| JPY | 4,412,591 | JPY1=NT$0.2782 | 1,227,583 | |||||||||
| JPY | 6,568,657 | JPY1=US$0.0091 | 1,827,400 | |||||||||
| Monetary financial liabilities | ||||||||||||
| US$ | 3,361,523 | US$1=NT$30.715 | 103,249,185 | |||||||||
| US$ | 1,216,654 | US$1=CNY6.8632 | 37,369,521 | |||||||||
| JPY | 7,401,621 | JPY1=NT$0.2782 | 2,059,131 | |||||||||
| JPY | 7,035,704 | JPY1=US$0.0091 | 1,957,333 | |||||||||
The significant realized and unrealized foreign exchange gain (loss) were as follows:
| For the Years Ended December 31 | ||||||||||||||||||||||||||||
| 2013 | 2014 | 2015 | ||||||||||||||||||||||||||
| Functional Currencies | Exchange Rate | Net Foreign Exchange Gain (Loss) | Exchange Rate | Net Foreign Exchange Gain (Loss) | Exchange Rate | Net Foreign Exchange Gain (Loss) | ||||||||||||||||||||||
| NT$ | NT$ | NT$ | US$ (Note 4) | |||||||||||||||||||||||||
| NT$ | $ | (455,820 | ) | $ | (1,591,124 | ) | $ | (695,510 | ) | $ | (21,211 | ) | ||||||||||||||||
| US$ | US$1 =NT$29.805 | 1,203 | US$1 =NT$31.65 | 298,225 | US$1 =NT$32.825 | 136,795 | 4,172 | |||||||||||||||||||||
| CNY | CNY1 =NT$4.8885 | 157,671 | CNY1 =NT$5.1724 | 42,049 | CNY1 =NT$5.0550 | (271,358 | ) | (8,276 | ) | |||||||||||||||||||
| $ | (296,946 | ) | $ | (1,250,850 | ) | $ | (830,073 | ) | $ | (25,315 | ) | |||||||||||||||||
| For the Year Ended December 31 | ||||||||||||||||||||||||||||
| 2016 | 2017 | 2018 | ||||||||||||||||||||||||||
| Functional Currencies | Exchange Rate | Net Foreign Exchange Gain | Exchange Rate | Net Foreign Exchange Gain (Loss) | Exchange Rate | Net Foreign Exchange Loss | ||||||||||||||||||||||
| NT$ | NT$ | NT$ | US$ (Note 4) | |||||||||||||||||||||||||
| NT$ | $ | 1,494,044 | $ | 4,130,243 | $ | (849,234 | ) | $ | (27,744 | ) | ||||||||||||||||||
| US$ | US$1=NT$32.25 | 203,258 | US$1=NT$29.76 | (244,802 | ) | US$1=NT$30.715 | (67,476 | ) | (2,204 | ) | ||||||||||||||||||
| CNY | CNY1=NT$4.649 | 224,393 | CNY1=NT$4.5545 | (337,630 | ) | CNY1=NT$4.4753 | (120,005 | ) | (3,920 | ) | ||||||||||||||||||
| $ | 1,921,695 | $ | 3,547,811 | $ | (1,036,715 | ) | $ | ($33,868) | ||||||||||||||||||||
| OTHERS |
On December 20, 2013, the Kaohsiung Environmental Protection Bureau (“KEPB”) imposed a fine of NT$102,014 thousand (“the Administrative Fine”) upon the Company for the violation of the Water Pollution Control Act. The Company filed an administrative appeal to nullify the Administrative Fine, which, however, was dismissed by the Kaohsiung City Government. The Company then filed a lawsuitwith the Kaohsiung High Administrative Court seeking to revoke the dismissal decision made by the Kaohsiung City Government (the “Administrative Appeal Decision”) and the Administrative Fine, and to demand a refund of the fine paid by the Company. The judgment of the Kaohsiung High Administrative Court was rendered on March 22, 2016, ruling to revoke the Administrative Appeal Decision and the Administrative Fine, and to dismiss the other complaint filed by the Company (i.e., to demand a refund of the fine paid by the Company). The Company appealed against the unfavorable ruling on April 14, 2016. On June 8, 2017, the Supreme Administrative Court handed down a final and unappealable judgment which is in favor of the Company and ordered KEPB to return to the Company the fine already paid by the Company.
F-91F-109
| OPERATING SEGMENTS INFORMATION |
The Group has the following reportable segments: Packaging, Testing and EMS. The Group provides services in packagingpackages bare semiconductors into finished semiconductors with enhanced electrical and thermal characteristics, as well ascharacteristics; provides testing services, including front-end engineering testing, wafer probing and final testing services; engages in the Group also sells goods from electronicsdesigning, assembling, manufacturing services (“EMS”).and sale of electronic components and telecommunications equipment motherboards. Information about other business activities and operating segments that are not reportable are combined and disclosed in “Others.” The Group engages in other activities such as substrate production as well as sale and leasing of real estate business.properties.
The accounting policies for segments are the same as those described in Note 4. The measurement basis for resources allocation and performance evaluation is based on profit before income tax.
Segment information for the years ended December 31, 2013, 20142016, 2017 and 20152018 was as follows:
| a. | Segment revenues and operation results |
| Packaging | Testing | EMS | Others | Total | ||||||||||||||||
| NT$ | NT$ | NT$ | NT$ | NT$ | ||||||||||||||||
| For the year ended December 31, 2013 | ||||||||||||||||||||
| Revenue from external customers | $ | 112,603,927 | $ | 24,732,197 | $ | 78,530,594 | $ | 3,995,728 | $ | 219,862,446 | ||||||||||
| Inter-segment revenues (Note) | 3,337,074 | 246,223 | 42,960,432 | 8,048,827 | 54,592,556 | |||||||||||||||
| Segment revenues | 115,941,001 | 24,978,420 | 121,491,026 | 12,044,555 | 274,455,002 | |||||||||||||||
| Interest income | 74,171 | 11,958 | 85,491 | 41,181 | 212,801 | |||||||||||||||
| Interest expense | (1,542,047 | ) | (44,167 | ) | (96,620 | ) | (574,310 | ) | (2,257,144 | ) | ||||||||||
| Depreciation and amortization | (16,412,763 | ) | (6,293,170 | ) | (1,658,743 | ) | (1,106,235 | ) | (25,470,911 | ) | ||||||||||
| Share of the profit of associates | 22,039 | - | - | - | 22,039 | |||||||||||||||
| Impairment loss | (344,150 | ) | (115,966 | ) | (99,843 | ) | (131,913 | ) | (691,872 | ) | ||||||||||
| Segment profit before income tax | 9,975,902 | 6,321,022 | 2,928,223 | 144,609 | 19,369,756 | |||||||||||||||
| Expenditures for segment assets | 18,648,304 | 6,068,085 | 1,224,698 | 1,102,985 | 27,044,072 | |||||||||||||||
| December 31, 2013 | ||||||||||||||||||||
| Investments accounted for using the equity method | 1,205,158 | - | - | - | 1,205,158 | |||||||||||||||
| Segment assets | 146,160,484 | 44,100,564 | 55,112,632 | 41,348,403 | 286,722,083 | |||||||||||||||
| For the year ended December 31, 2014 | ||||||||||||||||||||
| Revenue from external customers | 121,336,453 | 25,874,694 | 105,784,427 | 3,595,873 | 256,591,447 | |||||||||||||||
| Inter-segment revenues (Note) | 9,418,359 | 177,793 | 48,596,814 | 8,437,439 | 66,630,405 | |||||||||||||||
| Segment revenues | 130,754,812 | 26,052,487 | 154,381,241 | 12,033,312 | 323,221,852 | |||||||||||||||
| Interest income | 96,737 | 10,245 | 116,451 | 20,041 | 243,474 | |||||||||||||||
| Interest expense | (1,566,595 | ) | (15,663 | ) | (155,702 | ) | (586,466 | ) | (2,324,426 | ) | ||||||||||
| Depreciation and amortization | (17,533,267 | ) | (6,160,378 | ) | (1,435,509 | ) | (1,221,622 | ) | (26,350,776 | ) | ||||||||||
| Share of the profit of associates | (121,882 | ) | - | - | - | (121,882 | ) | |||||||||||||
| Impairment loss | (231,936 | ) | (4,701 | ) | (10,390 | ) | (61,117 | ) | (308,144 | ) | ||||||||||
| Segment profit before income tax | 17,279,239 | 6,800,894 | 3,818,393 | 636,529 | 28,535,055 | |||||||||||||||
| Expenditures for segment assets | 29,863,337 | 6,157,154 | 6,562,513 | 865,583 | 43,448,587 | |||||||||||||||
(Continued)
| Adjustments | ||||||||||||||||||||||||
| Packaging | Testing | EMS | Others | and Eliminations | Total | |||||||||||||||||||
| NT$ | NT$ | NT$ | NT$ | NT$ | NT$ | |||||||||||||||||||
| For the year ended December 31, 2016 | ||||||||||||||||||||||||
| Revenue from external customers | $ | 125,282,829 | $ | 27,031,750 | $ | 115,395,130 | $ | 7,174,398 | $ | - | $ | 274,884,107 | ||||||||||||
| Inter-segment revenue (Note 1) | 4,929,897 | 243,980 | 47,721,424 | 9,186,359 | (62,081,660 | ) | - | |||||||||||||||||
| Segment revenue | 130,212,726 | 27,275,730 | 163,116,554 | 16,360,757 | - | 336,965,767 | ||||||||||||||||||
| Interest income | 32,499 | 41,405 | 130,659 | 37,297 | (11,793 | ) | 230,067 | |||||||||||||||||
| Interest expense | (1,727,127 | ) | (5,980 | ) | (44,433 | ) | (451,790 | ) | 11,793 | (2,217,537 | ) | |||||||||||||
| Depreciation and amortization | (18,706,891 | ) | (6,566,936 | ) | (2,759,298 | ) | (1,437,312 | ) | - | (29,470,437 | ) | |||||||||||||
| Share of the profit of associates and joint ventures | 1,513,394 | (9,484 | ) | - | - | - | 1,503,910 | |||||||||||||||||
| Impairment loss | (974,095 | ) | (4,136 | ) | (1,886 | ) | - | - | (980,117 | ) | ||||||||||||||
| Segment profit before income tax | 13,921,640 | 7,226,531 | 4,626,263 | 2,194,271 | - | 27,968,705 | ||||||||||||||||||
| Expenditures for segment assets | 17,561,135 | 8,247,003 | 906,042 | 966,682 | - | 27,680,862 | ||||||||||||||||||
| December 31, 2016 | ||||||||||||||||||||||||
| Investments accounted for using the equity method | 49,597,195 | 227,495 | - | - | - | 49,824,690 | ||||||||||||||||||
| For the year ended December 31, 2017 | ||||||||||||||||||||||||
| Revenue from external customers | 126,225,119 | 26,157,277 | 133,948,016 | 4,110,796 | - | 290,441,208 | ||||||||||||||||||
| Inter-segment revenue (Note 1) | 4,911,026 | 184,707 | 47,119,404 | 8,383,640 | (60,598,777 | ) | - | |||||||||||||||||
| Segment revenue | 131,136,145 | 26,341,984 | 181,067,420 | 12,494,436 | - | 351,039,985 | ||||||||||||||||||
| Interest income | 43,744 | 48,532 | 269,640 | 214,265 | (269,310 | ) | 306,871 | |||||||||||||||||
| Interest expense | (1,969,562 | ) | (11,920 | ) | - | (62,714 | ) | 269,310 | (1,774,886 | ) | ||||||||||||||
| Depreciation and amortization | (19,105,457 | ) | (6,476,743 | ) | (2,133,253 | ) | (1,489,731 | ) | - | (29,205,184 | ) | |||||||||||||
| Share of the profit or loss of associates and joint ventures | 568,291 | (42,509 | ) | - | - | - | 525,782 | |||||||||||||||||
| Impairment loss | (218,214 | ) | (72,798 | ) | - | (473,869 | ) | - | (764,881 | ) | ||||||||||||||
| Segment profit before income tax | 12,065,304 | 6,904,067 | 6,883,327 | 5,167,965 | - | 31,020,663 | ||||||||||||||||||
| Expenditures for segment assets | 17,769,612 | 4,507,097 | 850,235 | 550,738 | - | 23,677,682 | ||||||||||||||||||
| December 31, 2017 | ||||||||||||||||||||||||
| Investments accounted for using the equity method | 48,566,333 | 187,418 | - | - | - | 48,753,751 | ||||||||||||||||||
F-92F-110
| Packaging | Testing | EMS | Others | Total | ||||||||||||||||
| NT$ | NT$ | NT$ | NT$ | NT$ | ||||||||||||||||
| December 31, 2014 | ||||||||||||||||||||
| Investments accounted for using the equity method | $ | 1,468,242 | $ | - | $ | - | $ | - | $ | 1,468,242 | ||||||||||
| Segment assets | 166,359,949 | 44,147,813 | 78,865,897 | 44,345,158 | 333,718,817 | |||||||||||||||
| For the year ended December 31, 2015 | ||||||||||||||||||||
| Revenue from external customers | 116,607,314 | 25,191,916 | 138,242,100 | 3,261,206 | 283,302,536 | |||||||||||||||
| Inter-segment revenues (Note) | 9,454,671 | 191,608 | 58,451,996 | 7,659,282 | 75,757,557 | |||||||||||||||
| Segment revenues | 126,061,985 | 25,383,524 | 196,694,096 | 10,920,488 | 359,060,093 | |||||||||||||||
| Interest income | 53,235 | 12,536 | 149,385 | 26,928 | 242,084 | |||||||||||||||
| Interest expense | (1,520,118 | ) | (5,821 | ) | (147,792 | ) | (595,055 | ) | (2,268,786 | ) | ||||||||||
| Depreciation and amortization | (18,946,460 | ) | (6,516,912 | ) | (2,738,722 | ) | (1,316,570 | ) | (29,518,664 | ) | ||||||||||
| Share of the profit of associates and joint ventures | 407,622 | - | - | - | 407,622 | |||||||||||||||
| Impairment loss | (139,397 | ) | - | (102,389 | ) | (16,343 | ) | (258,129 | ) | |||||||||||
| Segment profit before income tax | 15,761,225 | 6,354,140 | 2,874,944 | 302,836 | 25,293,145 | |||||||||||||||
| Expenditures for segment assets | 19,691,068 | 4,754,481 | 2,917,939 | 917,333 | 28,280,821 | |||||||||||||||
| December 31, 2015 | ||||||||||||||||||||
| Investments accounted for using the equity method | 37,403,601 | - | - | - | 37,403,601 | |||||||||||||||
| Segment assets | 193,604,661 | 42,652,569 | 79,997,341 | 49,013,678 | 365,268,249 | |||||||||||||||
| Adjustments | ||||||||||||||||||||||||
| Packaging | Testing | EMS | Others | and Eliminations | Total | |||||||||||||||||||
| NT$ | NT$ | NT$ | NT$ | NT$ | NT$ | |||||||||||||||||||
| For the year ended December 31, 2018 | ||||||||||||||||||||||||
| Revenue from external customers | $ | 178,308,222 | $ | 35,903,202 | $ | 151,890,384 | $ | 4,990,613 | $ | - | $ | 371,092,421 | ||||||||||||
| Inter-segment revenues (Note 1) | 3,531,431 | 212,310 | 58,836,465 | 7,637,053 | (70,217,259 | ) | - | |||||||||||||||||
| Segment revenues | 181,839,653 | 36,115,512 | 210,726,849 | 12,627,666 | - | 441,309,680 | ||||||||||||||||||
| Interest income | 166,761 | 55,108 | 354,343 | 352,232 | (462,233 | ) | 466,211 | |||||||||||||||||
| Interest expense | (3,647,601 | ) | (101,338 | ) | - | (249,180 | ) | 462,233 | (3,535,886 | ) | ||||||||||||||
| Depreciation and amortization | (29,491,977 | ) | (9,560,610 | ) | (2,065,590 | ) | (1,570,726 | ) | - | (42,688,903 | ) | |||||||||||||
| Share of the profit or loss of associates and joint ventures | (456,846 | ) | (23,398 | ) | - | - | - | (480,244 | ) | |||||||||||||||
| Impairment loss | (654,081 | ) | - | - | - | - | (654,081 | ) | ||||||||||||||||
| Segment profit before income tax | 17,866,431 | 7,952,484 | 6,225,984 | (107,221 | ) | - | 31,937,678 | |||||||||||||||||
| Expenditures for segment assets | 22,787,190 | 12,991,023 | 2,529,771 | 784,254 | - | 39,092,238 | ||||||||||||||||||
| December 31, 2018 | ||||||||||||||||||||||||
| Investments accounted for using the equity method | 9,152,290 | 160,018 | - | - | - | 9,312,308 | ||||||||||||||||||
| Contract assets | 3,488,372 | 1,000,128 | - | - | - | 4,488,500 | ||||||||||||||||||
| Adjustments | ||||||||||||||||||||||||
| Packaging | Testing | EMS | Others | and Eliminations | Total | |||||||||||||||||||
| US$ (Note 4) | US$ (Note 4) | US$ (Note 4) | US$ (Note 4) | US$ (Note 4) | US$ (Note 4) | |||||||||||||||||||
| For the year ended December 31, 2018 | ||||||||||||||||||||||||
| Revenue from external customers | $ | 5,825,163 | $ | 1,172,924 | $ | 4,962,116 | $ | 163,039 | $ | - | $ | 12,123,242 | ||||||||||||
| Inter-segment revenues (Note 1) | 115,369 | 6,936 | 1,922,132 | 249,495 | (2,293,932 | ) | - | |||||||||||||||||
| Segment revenues | 5,940,532 | 1,179,860 | 6,884,248 | 412,534 | - | 14,417,174 | ||||||||||||||||||
| Interest income | 5,448 | 1,801 | 11,576 | 11,507 | (15,101 | ) | 15,231 | |||||||||||||||||
| Interest expense | (119,164 | ) | (3,311 | ) | - | (8,140 | ) | 15,101 | (115,514 | ) | ||||||||||||||
| Depreciation and amortization | (963,475 | ) | (312,336 | ) | (67,481 | ) | (51,315 | ) | - | (1,394,607 | ) | |||||||||||||
| Share of the profit or loss of associates and joint ventures | (14,925 | ) | (764 | ) | - | - | - | (15,689 | ) | |||||||||||||||
| Impairment loss | (21,368 | ) | - | - | - | - | (21,368 | ) | ||||||||||||||||
| Segment profit before income tax | 583,680 | 259,800 | 203,397 | (3,503 | ) | - | 1,043,374 | |||||||||||||||||
| Expenditures for segment assets | 744,436 | 424,404 | 82,645 | 25,621 | - | 1,277,106 | ||||||||||||||||||
| December 31, 2018 | ||||||||||||||||||||||||
| Investments accounted for using the equity method | 298,996 | 5,228 | - | - | - | 304,224 | ||||||||||||||||||
| Contract assets | 113,962 | 32,673 | - | - | - | 146,635 | ||||||||||||||||||
(Concluded)
| Packaging | Testing | EMS | Others | Total | ||||||||||||||||
| US$ (Note 4) | US$ (Note 4) | US$ (Note 4) | US$ (Note 4) | US$ (Note 4) | ||||||||||||||||
| For the year ended December 31, 2015 | ||||||||||||||||||||
| Revenue from external customers | $ | 3,556,185 | $ | 768,280 | $ | 4,215,984 | $ | 99,457 | $ | 8,639,906 | ||||||||||
| Inter-segment revenues (Note) | 288,340 | 5,843 | 1,782,617 | 233,586 | 2,310,386 | |||||||||||||||
| Segment revenues | 3,844,525 | 774,123 | 5,998,601 | 333,043 | 10,950,292 | |||||||||||||||
| Interest income | 1,624 | 382 | 4,556 | 821 | 7,383 | |||||||||||||||
| Interest expense | (46,359 | ) | (178 | ) | (4,507 | ) | (18,148 | ) | (69,192 | ) | ||||||||||
| Depreciation and amortization | (577,812 | ) | (198,747 | ) | (83,523 | ) | (40,152 | ) | (900,234 | ) | ||||||||||
| Share of the profit of associates and joint ventures | 12,431 | - | - | - | 12,431 | |||||||||||||||
| Impairment loss | (4,251 | ) | - | (3,123 | ) | (498 | ) | (7,872 | ) | |||||||||||
| Segment profit before income tax | 480,672 | 193,783 | 87,677 | 9,235 | 771,367 | |||||||||||||||
| Expenditures for segment assets | 600,521 | 144,998 | 88,989 | 27,975 | 862,483 | |||||||||||||||
| December 31, 2015 | ||||||||||||||||||||
| Investments accounted for using the equity method | 1,140,701 | - | - | - | 1,140,701 | |||||||||||||||
| Segment assets | 5,904,381 | 1,300,780 | 2,439,687 | 1,494,775 | 11,139,623 | |||||||||||||||
Note 1: Inter-segment revenues were eliminated upon consolidation.
Note 2: Refer to the table above for information about disaggregation of revenue.
| b. | Revenue from major products and services |
| For the Years Ended December 31 | ||||||||||||||||
| 2013 | 2014 | 2015 | ||||||||||||||
| NT$ | NT$ | NT$ | US$ (Note 4) | |||||||||||||
| Advanced packaging and IC wirebonding service | $ | 100,457,184 | $ | 108,384,405 | $ | 103,735,586 | $ | 3,163,635 | ||||||||
| Wafer probing and final testing service | 24,120,370 | 25,116,026 | 24,136,399 | 736,090 | ||||||||||||
| Electronic components manufacturing service | 77,731,347 | 104,904,455 | 137,347,359 | 4,188,696 | ||||||||||||
| Others | 17,553,545 | 18,186,561 | 18,083,192 | 551,485 | ||||||||||||
| $ | 219,862,446 | $ | 256,591,447 | $ | 283,302,536 | $ | 8,639,906 | |||||||||
F-93
| For the Year Ended December 31 | ||||||||||||||||
| 2016 | 2017 | 2018 | ||||||||||||||
| NT$ | NT$ | NT$ | US$ (Note 4) | |||||||||||||
| Packaging service | $ | 125,282,829 | $ | 126,225,119 | $ | 178,308,222 | $ | 5,825,163 | ||||||||
| Testing service | 27,031,750 | 26,157,277 | 35,903,202 | 1,172,924 | ||||||||||||
| Electronic components manufacturing service | 115,395,130 | 133,948,016 | 151,890,384 | 4,962,116 | ||||||||||||
| Others | 7,174,398 | 4,110,796 | 4,990,613 | 163,039 | ||||||||||||
| $ | 274,884,107 | $ | 290,441,208 | $ | 371,092,421 | $ | 12,123,242 | |||||||||
| c. | Geographical information |
Geographical information about revenue from external customers and noncurrent assets are reported based on the country where the external customers are headquartered and noncurrent assets are located.located, respectively.
F-111
| 1) | Net revenues from external customers |
| For the Years Ended December 31 | ||||||||||||||||
| 2013 | 2014 | 2015 | ||||||||||||||
| NT$ | NT$ | NT$ | US$ (Note 4) | |||||||||||||
| United States | $ | 143,753,891 | $ | 173,912,974 | $ | 205,730,670 | $ | 6,274,189 | ||||||||
| Taiwan | 31,277,147 | 36,747,699 | 32,631,149 | 995,155 | ||||||||||||
| Asia | 23,779,212 | 24,042,586 | 22,885,128 | 697,930 | ||||||||||||
| Europe | 20,392,268 | 20,826,125 | 20,577,069 | 627,541 | ||||||||||||
| Others | 659,928 | 1,062,063 | 1,478,520 | 45,091 | ||||||||||||
| $ | 219,862,446 | $ | 256,591,447 | $ | 283,302,536 | $ | 8,639,906 | |||||||||
| For the Year Ended December 31 | ||||||||||||||||
| 2016 | 2017 | 2018 | ||||||||||||||
| NT$ | NT$ | NT$ | US$ (Note 4) | |||||||||||||
| United States | $ | 180,745,837 | $ | 196,462,345 | $ | 230,791,164 | $ | 7,539,731 | ||||||||
| Taiwan | 38,868,679 | 35,413,647 | 45,630,792 | 1,490,715 | ||||||||||||
| Asia | 29,896,304 | 30,201,332 | 56,031,108 | 1,830,484 | ||||||||||||
| Europe | 23,275,732 | 26,445,240 | 36,844,258 | 1,203,668 | ||||||||||||
| Others | 2,097,555 | 1,918,644 | 1,795,099 | 58,644 | ||||||||||||
| $ | 274,884,107 | $ | 290,441,208 | $ | 371,092,421 | $ | 12,123,242 | |||||||||
| 2) |
| December 31 | ||||||||||||
| 2014 | 2015 | |||||||||||
| NT$ | NT$ | US$ (Note 4) | ||||||||||
| Taiwan | $ | 97,159,564 | $ | 98,849,362 | $ | 3,014,619 | ||||||
| China | 43,384,186 | 40,385,484 | 1,231,640 | |||||||||
| Others | 26,177,965 | 25,458,503 | 776,412 | |||||||||
| $ | 166,721,715 | $ | 164,693,349 | $ | 5,022,671 | |||||||
| December 31 | ||||||||||||
| 2017 | 2018 | |||||||||||
| NT$ | NT$ | US$ (Note 4) | ||||||||||
| Taiwan | $ | 93,350,839 | $ | 229,944,505 | $ | 7,512,071 | ||||||
| China | 45,376,164 | 59,058,239 | 1,929,377 | |||||||||
| Others | 25,025,498 | 25,686,256 | 839,146 | |||||||||
| $ | 163,752,501 | $ | 314,689,000 | $ | 10,280,594 | |||||||
| d. | Major customers |
Except one customer from which the operating revenues generated from packaging and EMS segments was NT$32,588,46466,554,659 thousand, NT$54,431,22283,873,393 thousand and NT$88,311,69792,117,839 thousand (US$2,693,2513,009,403 thousand) in 2013, 20142016, 2017 and 2015,2018, respectively, the Group did not have other single customer to which the operating revenues exceeded 10% of operating revenues for the years ended December 31, 2013, 20142016, 2017 and 2015.2018.
F-112